Factors affecting the use of computerised information systems ...
356
University of Wollongong University of Wollongong Research Online Research Online University of Wollongong Thesis Collection 1954-2016 University of Wollongong Thesis Collections 1997 Factors affecting the use of computerised information systems in Factors affecting the use of computerised information systems in community health community health Farideh Yaghmaie University of Wollongong Follow this and additional works at: https://ro.uow.edu.au/theses University of Wollongong University of Wollongong Copyright Warning Copyright Warning You may print or download ONE copy of this document for the purpose of your own research or study. The University does not authorise you to copy, communicate or otherwise make available electronically to any other person any copyright material contained on this site. You are reminded of the following: This work is copyright. Apart from any use permitted under the Copyright Act 1968, no part of this work may be reproduced by any process, nor may any other exclusive right be exercised, without the permission of the author. Copyright owners are entitled to take legal action against persons who infringe their copyright. A reproduction of material that is protected by copyright may be a copyright infringement. A court may impose penalties and award damages in relation to offences and infringements relating to copyright material. Higher penalties may apply, and higher damages may be awarded, for offences and infringements involving the conversion of material into digital or electronic form. Unless otherwise indicated, the views expressed in this thesis are those of the author and do not necessarily Unless otherwise indicated, the views expressed in this thesis are those of the author and do not necessarily represent the views of the University of Wollongong. represent the views of the University of Wollongong. Recommended Citation Recommended Citation Yaghmaie, Farideh, Factors affecting the use of computerised information systems in community health, Doctor of Philosophy thesis, Department of Public Health and Nutrition, University of Wollongong, 1997. https://ro.uow.edu.au/theses/1703 Research Online is the open access institutional repository for the University of Wollongong. For further information contact the UOW Library: [email protected]
-
Upload
khangminh22 -
Category
Documents
-
view
1 -
download
0
Transcript of Factors affecting the use of computerised information systems ...

University of Wollongong University of Wollongong
Research Online Research Online
University of Wollongong Thesis Collection 1954-2016 University of Wollongong Thesis Collections
1997
Factors affecting the use of computerised information systems in Factors affecting the use of computerised information systems in
community health community health
Farideh Yaghmaie University of Wollongong
Follow this and additional works at: https://ro.uow.edu.au/theses
University of Wollongong University of Wollongong
Copyright Warning Copyright Warning
You may print or download ONE copy of this document for the purpose of your own research or study. The University
does not authorise you to copy, communicate or otherwise make available electronically to any other person any
copyright material contained on this site.
You are reminded of the following: This work is copyright. Apart from any use permitted under the Copyright Act
1968, no part of this work may be reproduced by any process, nor may any other exclusive right be exercised,
without the permission of the author. Copyright owners are entitled to take legal action against persons who infringe
their copyright. A reproduction of material that is protected by copyright may be a copyright infringement. A court
may impose penalties and award damages in relation to offences and infringements relating to copyright material.
Higher penalties may apply, and higher damages may be awarded, for offences and infringements involving the
conversion of material into digital or electronic form.
Unless otherwise indicated, the views expressed in this thesis are those of the author and do not necessarily Unless otherwise indicated, the views expressed in this thesis are those of the author and do not necessarily
represent the views of the University of Wollongong. represent the views of the University of Wollongong.
Recommended Citation Recommended Citation Yaghmaie, Farideh, Factors affecting the use of computerised information systems in community health, Doctor of Philosophy thesis, Department of Public Health and Nutrition, University of Wollongong, 1997. https://ro.uow.edu.au/theses/1703
Research Online is the open access institutional repository for the University of Wollongong. For further information contact the UOW Library: [email protected]

NOTE
This online version of the thesis may have different page formatting and pagination from the paper copy held in the University of Wollongong Library.
UNIVERSITY OF W O LLO NG ONG
CO PYRIGHT W ARNING
You may print or download ONE copy of this document for the purpose of your own research or study. The University does not authorise you to copy, communicate or otherwise make available electronically to any other person any copyright material contained on this site. You are reminded of the following:
Copyright owners are entitled to take legal action against persons who infringe their copyright. A reproduction of material that is protected by copyright may be a copyright infringement. A court may impose penalties and award damages in relation to offences and infringements relating to copyright material. Higher penalties may apply, and higher damages may be awarded, for offences and infringements involving the conversion of material into digital or electronic form.

Factors Affecting the Use of Computerised Information Systems in Community Health
A theses submitted in partial fulfilment of the requirement of the
award of the degree
Doctorate of Public Health
from
The University of Wollongong
By
Farideh Yaghmaie
Department of Public Health and Nutrition,
Faculty of Health and Behavioural Sciences
1997

DECLARATION
I declare that the thesis titled "Factors affecting the use of computerised information
systems in community health" is entirely my work. References to the work of others are
indicated in the text. This study has not been submitted for any degree to any other
university.
Farideh Yaghmaie
1997
i

Acknowledgements
I wish to thank the following persons who helped and support me and have been
involved in the preparation of this research.
First of all God who helped me throughout this study.
I would like to gratefully thank Ministry of Health of Iran that provide this
opportunity for me and their co-operative manner.
Special thanks to Dr Rohan Jayasuriya for his guidance and encouragement as
supervisor of this research. To him I am most grateful.
I also wish to thank Patrick Rawstone, Anne Porter and Vicki Blanch for their
comments and consultation with the computerised data analysis.
I would like thank Dr Peter Caputi for his generosity of time and guidance.
Thanks also to Dr Margaret Jamieson for her assistance and comments in qualitative
part of this study.
I also wish to thank Joan Phillip, Gillian and Stephen Spooner for their assistance
and comments when editing the study.
Special thanks to the lectures and staff of the Department of Public Health and
Nutrition, Department of Psychology, Department of Nursing, Departments of
Computer Science, Department of Business, Information Technology Services,
Information and Communication Technology and Educational Media Services
who shared their experiences in this study which enabled the completion of this
work.
Thanks also to Kim Moran the manager of the Community Health Information
Development (CHID) in the Illawarra Area Health Service for her assistance to
arrange interview and the data collection.
ii

Specific thanks must be given to my research participants, students of the
Department of the Computer Science and Business at the university of Wollongong
and all the staff of the Illawarra Area Health services in the community health
centres who gave their time for conducting this study.
Specific thanks to my parents, my husband parents, and all family that support me
during this time.
A special thanks goes to my family, those most dear to me, my husband and
children, Bijan, Pegah and Pouria for their support and understanding throughout
this research.
Without these persons named above, I would not have been able to complete this
study. I am deeply grateful and I wish them all the best.
m

Abstract
Discussions of computer systems effectiveness or system success frequently focus on
questions of which factors provide better system usage. As there are many factors that
affect computer system usage, measuring the influence of the factors is necessary. The
purpose of the current study was to gain a further understanding of some factors that
affect the use of computerised information systems. Most studies have been in business
and few studies have been conducted in the health sector and specifically in Community
Health. The study measured the role of external variables on computer attitude, subjective
norms and intention to use computers based on the Theory of Reasoned Action (TRA)
(Fishbein and Ajzen, 1975). These external factors included: demographic characteristics,
users' characteristics (computer experience), organisational support, and involvement.
After a thorough search of the literature the researcher found valid and reliable scales for
measuring the above variables, except for measuring computer experience. Thus, the first
objective of the study was to develop a valid and reliable scale for measuring computer
experience.
Items for 'Scale Of Computer Experience' (SOCE) were selected from the literature
review, focus groups and interviews. The SOCE included items for a Subjective
Computer Experience Scale (SCES) and to measure Objective Computer Experience
(OCE). The psychometric properties of the SCES, such as; content validity, face validity,
constructs validity, concurrent validity, test-retest reliability, and internal consistency
were measured. The data was collected from the second and third year business and
computer science students at the University of Wollongong. The results showed that the
SCES contain two subscales identified as; 1) positive computer experience, and 2)
negative computer experience. On the basis of on extensive testing, the SCES with 12
items, appears to be reasonably valid and reliable.
IV

The main study followed the development of the SCES. A questionnaire that included the
SCES consisting of 78 questions that covered demographic characteristics (age, gender,
level of education, organisational position, work tenure, organisational tenure, computer
training), users' characteristics (subjective and objective computer experience),
management support, (general support and information centre support) users'
involvement (importance and personal relevance), computer attitude, subjective norms
and intention to use computers was developed. The main study was conducted in the
Community Health Services of one Area Health Service in New South Wales, Australia.
Based on the feedback, some words of the questionnaire for health workers were
modified. The questionnaires were mailed to 430 staff (nurses and health workers) in 51
Community Health Centres in the Illawarra Area Health Service. A response rate of 70%
(302) was achieved. The data was analysed using a statistical computer program (SAS
and SPSS).
Structural equation modelling was used to test the measurement model and the structural
model. In this study, this approach was implemented using the SAS CALIS programs.
To test the measurement model, confirmatory factor analysis, internal consistency and
discriminant validity were assessed. In general, the measurement model was satisfactory.
Overall, high support was found for the structural model in this study.
The main study confirmed that the SCES is reliable and was found to have characteristics
of an external variable in the TRA model. The results showed the influence of positive
computer experience on computer attitude, the effect of negative computer experience *
negatively on subjective norms. The results also showed that negative experience had
positive and direct affect on subjective norms. The other new finding of this study was,
the direct effect of importance and personal relevance on intention to use computers. The
results also supported other studies on the importance of organisational support regarding
intention to use systems. Moreover, computer attitude and subjective norms were also
found to mediate relationships between external validity and intention to use computers.
v
In general, the study was able to explain the variables that affected the intention to use
computers directly and indirectly.
This study was an important step in finding the relationship between external variables
and variables in the TRA in a different and new setting such as; community health
centres. This study indicates that beliefs about system usage may not be sufficient to
affect behaviours if individuals have not abilities to use computer technology.
Based on the results, the study suggest that the SCES is a valid and reliable scale that
could be used in future studies. The addition of other personal and organisational
variables to the TRA provides a greater understanding of intention to use the system. This
study identified factors that could predict system usage.
vi
Table of Contents
Contents Page No
Declaration i
Acknowledgements ii
Abstract iv
Table of Contents vii
List of Tables xiv
List of Figures xvi
List of Abbreviations xvii
List of Appendices xix
Chapter 1
1.1 Introduction 1
1.2 Foreword 1
1.3 The Purpose of the Study 2
1.4 Significance of the Study 3
1.5 Background of Community Health Services and Community Health Information
Systems in Australia 4
1.5.1 Issues of Community Health Services in NSW 5
1.5.2 Strategy of Implementing Community Health Information Systems
(CHIS) 6 .
1.6 Overview of the Chapters 7
vn

Chapter 2 Theoretical Model
2.1 Introduction 9
2.2 Theory of Reasoned Action (TRA) 9
2.3 Theory of Planned Behaviour (TPB) 17
2.4 Technology Acceptance Model (TAM) 20
2.5 Extension of the Above Models 23
2.6 Comparison among TRA, TPB and TAM 30
2.7 Advantages of TRA 32
Chapter 3 Research Model
3.1 Introduction 35
3.2 Research Model 3 5
3.3 Hypotheses 38
3.4 Related Studies about Hypotheses 39
3.4.1 A Demographic Characteristics 39
3.4.2 B User Characteristics 46
3.4.3 C Organisational Support 48
3.4.4 D Involvement 50
3.4.5 E Computer Attitude 51
3.4.6 F Subjective Norms 53
3.4.7 G Intention to Use Computers 54
Chapter 4 Literature Review
4. 1 Introduction 56
4.2 Part 1 56
4.2.1 Health Information Systems 56
4.2.2 Computer System Usage Resistance to use Information Systems 63
viii
4.2.3 Computer Users/End-Users 66
4.2.4 Attitude 67
4.2.4.1 Definition 67
4.2.4.2 Computer Attitude 68
4.2.4.3 Content of Attitude 70
4.2.4.4 Functions of Attitude 70
4.2.4.5 Computer Attitude and Age 70
4.2.4.6 Computer Attitude and Gender 7 2
4.2.4.7 Computer Attitude and Level of Computer Education 74
4.2.5 Computer Training 75
4.2.5.1 Computer Attitude and Computer Training 85
4.2.6 Management Support 86
4.2.7 User Involvement 88
4.2.8 Computer Attitude and Involvement 89
4.2.9 Computer Attitude and Computer Usage 92
4.2.10 Computer Usage and Satisfaction 95
4.2.11 Computer Anxiety 97
4.3 Part 2 101
4.3.1 Computer Experience and Age 101
4.3.2 Computer Experience and Gender 101
4.3.3 Computer Experience and Computer Training 103*
4.3.4 Computer Experience and Computer Learning 104
4.3.5 Computer Experience and Computer Attitude 105
4.3.6 Computer Experience and Confidence 108
4.3.7 Computer Experience and Satisfaction 109
4.3.8 Computer Experience and Computer Anxiety 109
IX
4.3.9 Computer Experience and Self-Efficacy 111
4.3.10 Computer Experience and Intention to Use Computers 113
4.3.11 Computer Experience and Computer Usage 113
4.4 Part 3 Critical Review of Instruments 116
4.4.1 Instruments for Measuring Computer Training 116
4.4.2 Instruments for Measuring Computer Experience 117
4.4.3 Instruments for Measuring Management Support 123
4.4.4 Instruments for Measuring User Involvement 124
4.4.5 Instruments for Measuring Computer Attitude 125
4.4.6 Instruments for Measuring Subjective Norms to Use Computers 131
4.4.7 Instruments for Measuring Intention to Use Computers 133
4.4.8 Conclusion 134
Chapter 5 Development of a Scale for Measuring Computer Experience
5.1 Introduction 135
5.2 Significant of Computer Experience Scale 135
5.3 Concept of Experience 137
5.4 Definition of Experience and Computer Experience 138
5.5 Measure of Computer Experience 139
5.6 Method of Development the 'Scale Of Computer Experience' 'SOCE': Phase 1.
Development 142
5.6.1 Qualitative Methods 142 *
5.6.2 The Purpose and Rational of the Focus Group 143
5.6.3 Interviews 149
5.6.3.1 Aims of Interviews 153
5.6.3.2 Method 153
5.6.3.3 Analysing the Interviews 155
x

5.6.3.4 Findings of The Interviews and Discussion 157
5.6.4 Results of the Qualitative Method 173
5.7 Testing the Psychometric Properties of the Subjective Computer Experience
Scale (SCES) 174
5.7.1 Validity 175
5.7.1.1 Content Validity 176
5.7.1.2. Face Validity 178
5.7.1.3 Construct Validity 179
5.7.1.4 Criterion-Related Validity 183
5.7.2 Reliability 185
5.7.2.1 Stability Reliability 186
5.7.2.2 Internal Consistency/Homogeneity 187
5.7.3 Conclusion 189
Chapter 6 Study Methodology
6.1 Introduction 192
6.2 Method of the Study 192
6.3 Variables of the Study 193
6.4 Instruments for Measuring Variables 193
6.4.1 Computer Training 193
6.4.2 Computer Experience 193
6.4.2.1 Subjective Computer Experience Scale (SCES) 193 *
6.4.2.2 Objective Computer Experience (OCE) 194
6.4.3 Management Support 194
6.4.4 User Involvement 194
6.4.5 Computer Attitude 194
6.4.6 Subjective Norms 195
xi

6 .4 .7 Intention to U se Computers 195
6.5 Pilot Study 196
6.6 Sample 196
6.7 Data Collection 197
6.8 Data Entering 197
6.9 Data analysis 198
Chapter 7 Results of Participants Characteristics, Computer Training and
Objective Computer Experience
7.1 Introduction 199
7.2 Demographic Characteristics of Participants 199
7.3 Computer Training 204
7.4 Objective Computer Experience 205
7.4.1 Length of Computer Experience 205
7.4.2 Access to Home Computers 206
7.4.3 Using Home computers 206
7.4.4 Using Home Computers by Others 207
7.5 Discussion 209
7.5.1 Computer Training 209
7.5.2 Objective Computer Experience 210
Chapter 8 Measurement Model Results
8.1 Introduction 212 *
8.2 Model Estimation 212
8.3 Measurement Model 212
8.3.1 Confirmatory Factor Analysis (CFA) 213
8.3.2 Reliability Coefficient (Cronbach alpha) of the Scales 216
8.3.3 Discriminant Validity 218
xii

Chapter 9 Structural Model Results
9.1 Introduction 222
9.2 Structural Model 222
9.3 Structural Model Fit (Test of the Path Model) 223
9.4 Overall Goodness of Fit 224
9.5 Model Respecifications 229
9.5.1 Lagrange Multiplier Test and Wald Test 229
9.5.2 Results of Model Respecification 230
9.5.3 New Findings 234
9.6 Discussion of Results of Structural Model 234
9.7 Discussion of the Study 236
Chapter 10 Conclusion and Suggestions
10.1 Introduction 241
10.2 Conclusion 241
10.3 Strengths of the Study 246
10.3.1 Method and the Research Model 246
10.3.2 Development a Valid and Reliable Scale 247
10.4 Limitations 249
10.4.1 Research Model 249
10.4.2 Method 250
10.4.3 Data Collection 250
10.5 Suggestions for Future Study 251
10.5.1 Computer Experience Scale 251
10.5.2 User Involvement 252
10.5.3 Other Variables in the Research Model 253
10.5.4 Extend the Research Model 254
Xlll
R eferences 255
List of Tables
Table Page
5.1 Discussion of Focus Groups 146
5.2 Factor Loading of the 20-Item Subjective Computer
Experience Scale (SCES) on Expolatory Factor Analysis 182
5.3 Range of Factor Loading for Positive and Negative
Computer Experience 183
5.4 Person's Correlations for Factors of the SCES and the
CATT 185
5.5 Test-Retest Analysis and Internal Consistency
(Cronbach's Alpha) for Factors of SCES 189
5.6 Subjective Computer Experience Scale (SCES): Varimax-
Rotated Factor Pattern for Principal Component Analysis 191
7.1 Frequency Distribution of Participants by Gender 199
7.2 Frequency Distribution of Participants by Age and
Gender 200
7.3 Frequency Distribution of Participants by Level of
Education 200
7.4 Frequency Distribution of Nurses and Health Workers
by Age 201
7.5 Frequency Distribution of Nurses and Health Workers by
Level of Education 201
xiv
202
202
203
204
206
206
207
208
215
215
216
218
221
224
Frequency Distribution of Participants' Age by
Level of Education
Frequency Distribution of Nurses' Age by Level of
Education
Frequency Distribution of Health Workers' Age by
Level of Education
Frequency of Computer Training Courses Undertaken
by Participants
Frequency of Home Computers Among Participants
Frequency of Using Computers by Participants
Frequency of Using Home Computer by Others
Summary of Computer Training and
Objective Computer Experience Results
Generalised Least Squares Factoring for the NCATT
Generalised Least Squares Factoring for the SCES
Assessment Scales and Subscales
Internal Consistency (Cronbach Alpha) of
Scales for Nurses and Health Workers
Intercorrelations among the Study Variables
(Scales and Subscales)
Maximum Likelihood Estimation (MLE) by the Proposed
Model
xv

9.2 Prediction of Computer Attitude by the Proposed Model 225
9.3 Prediction of Subjective Norms by the Proposed Model 226
9.4 Prediction of Intention to Use Computers by the
Proposed Model 226
9.5 Maximum Likelihood Estimation (MLE) by the Proposed
Model after Modification 230
9.6 Prediction of Computer Attitude by the Proposed Model after
Modification 231
9.7 Prediction of Subjective Norms by the Proposed
Model after Modification 231
9.8 Prediction of Intention to Use Computers by the
Proposed Model after Modification 232
9.9 Summary of the Hypotheses 235
xvi
List of Figures
Figure Page
2.1 The Theory of Reasoned Action 14
2.2 The Theory of Planned Behaviour 18
2.3 The Technology Acceptance Model 21
3.1 The Research Model: Computer Usage Model 37
9.1 Hypothesised Model for Predicting Intention to Use Computers 228
9.2 Final Model for Predicting Intention to Use Computers 233
xvi
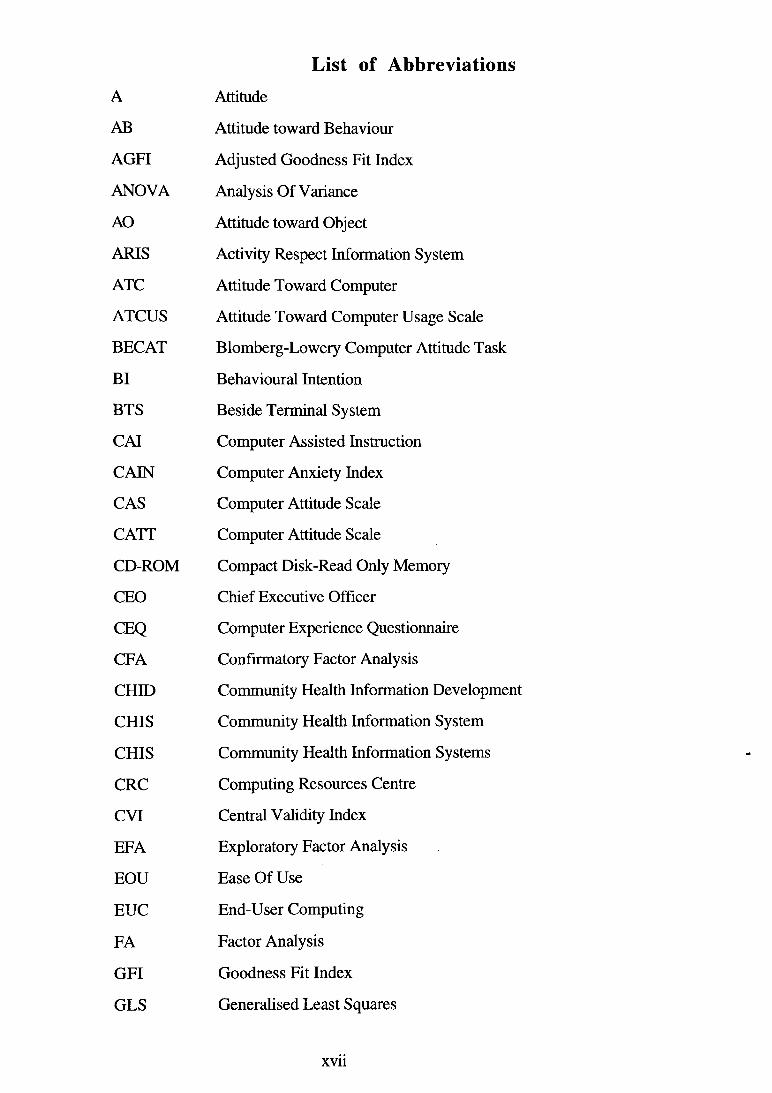
List of AbbreviationsA Attitude
AB Attitude toward Behaviour
AGFI Adjusted Goodness Fit Index
ANOVA Analysis Of Variance
AO Attitude toward Object
ARIS Activity Respect Information System
ATC Attitude Toward Computer
ATCUS Attitude Toward Computer Usage Scale
BECAT Blomberg-Lowery Computer Attitude Task
BI Behavioural Intention
BTS Beside Terminal System
CAI Computer Assisted Instruction
CAIN Computer Anxiety Index
CAS Computer Attitude Scale
CATT Computer Attitude Scale
CD-ROM Compact Disk-Read Only Memory
CEO Chief Executive Officer
CEQ Computer Experience Questionnaire
CFA Confirmatory Factor Analysis
CHID Community Health Information Development
CHIS Community Health Information System
CHIS Community Health Information Systems
CRC Computing Resources Centre
CVI Central Validity Index
EFA Exploratory Factor Analysis .
EOU Ease Of Use
EUC End-User Computing
FA Factor Analysis
GFI Goodness Fit Index
GLS Generalised Least Squares
XVII
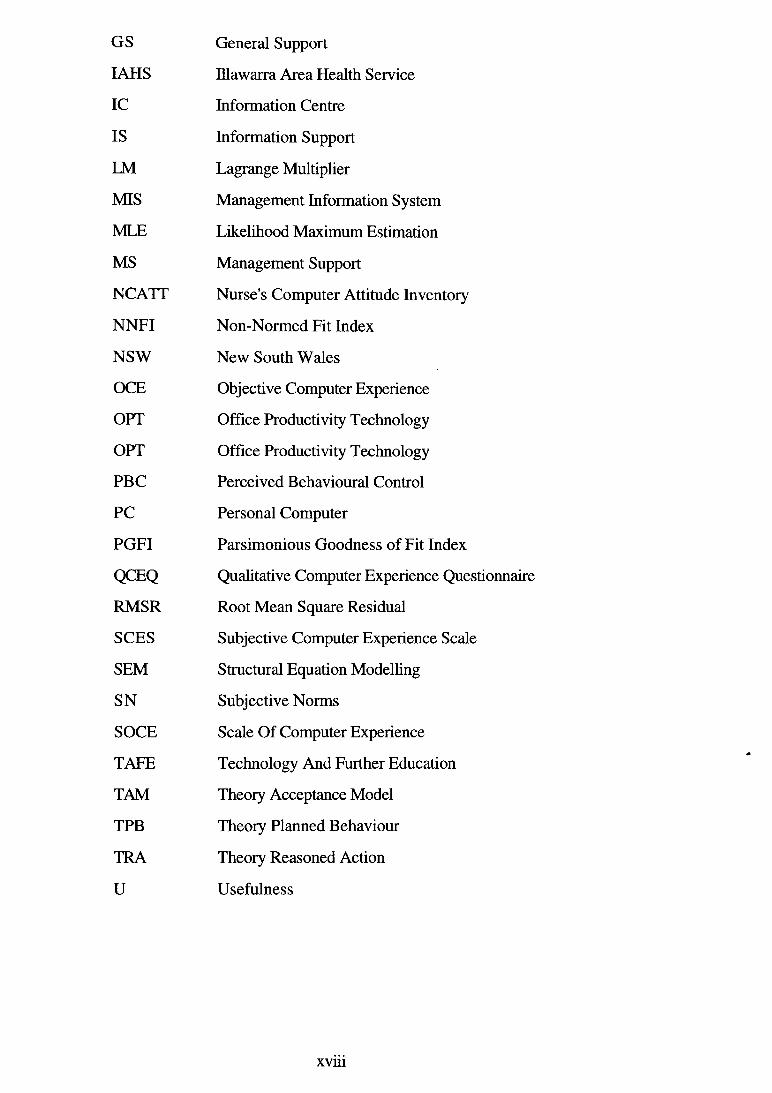
GS General Support
IAHS Illawarra Area Health Service
IC Information Centre
IS Information Support
LM Lagrange Multiplier
MIS Management Information System
MLE Likelihood Maximum Estimation
MS Management Support
NCATT Nurse's Computer Attitude Inventory
NNFI Non-Normed Fit Index
NSW New South Wales
OCE Objective Computer Experience
OPT Office Productivity Technology
OPT Office Productivity Technology
PBC Perceived Behavioural Control
PC Personal Computer
PGFI Parsimonious Goodness of Fit Index
QCEQ Qualitative Computer Experience Questionnaire
RMSR Root Mean Square Residual
SCES Subjective Computer Experience Scale
SEM Structural Equation Modelling
SN Subjective Norms
SOCE Scale Of Computer Experience
TAPE Technology And Further Education
TAM Theory Acceptance Model
TPB Theory Planned Behaviour
TRA Theory Reasoned Action
U Usefulness
XV111

List of Appendices
Appendix
3.1 List of Studies that Used for Variables in the Research Model
5.1 Permission from the Illawarra Area Health Service for Conducting Focus Groups
and Interview with Health Staff
5.2 Discussion Topics for Focus Group 1
5.3 Discussion Topics for Focus Group 2
5.4 Probing of Focus Group
5.5 Interview Schedule
5.6 Criteria for Measuring Content Validity of the Subjective Computer Experience
Scale (SCES)
5.7 Permission from the Human Research Ethics Committee, University of
Wollongong to Collect Data from the Students at the University of Wollongong
6.1 The Participants' Position in Community Health Centres in this Study
6.2 The Main Questionnaire
6.3 Site Champion Instruction Sheet
6.4 Consent Form of the Main Questionnaire.
6.5 Permission of the Human Research Ethics Committee at the University of
Wollongong to Conduct the Field Study
6.6 Permission of the Illawarra Area Health Service for Conducting Field Study
7.1 Length of Computer Experience of Participants at School, High school, College
and University
xix
Chapter 1
1.1 Introduction
In this chapter the purpose and significance of the study is explained. Since the study was
conducted in the community health sector, the background of community health services
and its involvement with computerised information systems is also discussed. Finally, an
overview of the presentation of this research is given.
1.2 Foreword
The rapid development of global communications in the twentieth century has been
largely as a result of computerised technology. Computers have become progressively
more important for providing information systems over the past three decades. Currently,
it is expected that most staff have their own computers on which to perform their tasks.
Computerised information systems offer advantages such as; increased speed, greater
productivity, tighter control, better decision making and better customer service.
The computer system plays an important role in the success of an organisation. Szajna
(1993) argues that one commonly used measure for determining the success of
information systems, is system usage. How effectively information systems are used is
an indicator of the success or failure of the systems.
Computerised information systems are costly. This is seen in the billions of US dollars
per year spent on computers and information systems (Lawlor, 1994). Keen and
Woodman (1984) argue that a typical company may have a huge budget for personal
computers. They also argue that the hidden costs of software and connectivity may
increase the cost per unit to as high as US$ 6,000 to US$10,000. Thus, if the
organisational performance is negative, their cost will be increased (Sethi et al., 1993).
Consequently, organisations should be careful to evaluate how the information systems
can be applied cost effectively to solve organisations' problems. If users reject computer
1
usage, much of the investment must be written off. To predict, explain and increase
system usage, it is necessary to determine the reasons for acceptance/rejection. Studies
have shown that different factors influence systems usage, such as; users' involvement
(Swanson, 1974; Baroudi et al., 1986; Hartwick and Barki, 1994); users' satisfaction
(Baroudi et al., 1986); demographic characteristics (Zeffane and Cheek, 1993);
management support (Igbaria, 1992); users' experience (Igbaria, 1992); users' training
(Igbaria, 1992); users' attitudes (Igbaria, 1992); users' participation (Hartwick and Barki,
1994); ease of use, and usefulness of computerised systems (Davis et al., 1989).
There are many studies on these issues in business and other areas. However, there are
fewer in the health area and even less related to community health services with a focus
on factors that affect computer system usage. The results of this study should, therefore,
be useful to fill this gap.
1.3 The Purpose of the Study
The purpose of the current study is to understand the factors that contribute to better
system usage. Thus, measuring the factors that influence system usage (intention to use
computerised information systems) is necessary. In the current study, the effect of factors
such as; demographic characteristics (age, gender, level of education, organisational
position, length of organisational position held, task characteristics, work tenure,
organisational tenure, computer training); users' characteristics (subjective computer
experience and objective computer experience); organisational support (general support
and information centre support); users' beliefs concerning objects (involvement); beliefs
of users about computer (attitude of users and subjective norms) and intention to use
computerised information systems were measured. This study empirically assesses how
the proposed model predicts and explains the use of computerised information systems in
the health sector.
2

1.4 Significance of the Study
End-user computing (EUC) has rapidly involved into a dynamic role in information
technology in recent years and has gained a great deal of attention in the management
information system (MIS) literature. Over the last decade, the EUC has accounted for up
to 50%-70% of the computer resource budgets in many organisations (Nord and Nord,
1994). The literature also explains that information technology has a high level of hidden
costs that is growing rapidly (Staggers, 1991).
Computerised systems cannot improve organisational performance if staff reject system
usage. Resistance to systems usage is a widespread problem (Davis et al., 1989). Due to
the importance of system usage some organisations have attempted to control the use of
microcomputer systems through a security system (Nord and Nord, 1994). Since
computer usage is a criterion for successful management information system (MIS)
(Lees, 1987), a better understanding of those factors that influence system usage can
increase their use and thereby organisational performance.
Recognition of the relationships among variables such as; demographic characteristics;
users' characteristics (computer experience); organisational support; users' involvement;
users' attitude toward using computers; subjective norms to use computers and intent to
use computerised information systems, can guide organisations to design proper policies
for systems usage. If an organisation fails to use information systems, effectively and
cost-effectively, its improvement and success is limited. The need of a study for
determining factors that affect system usage has been a recurring theme in many studies.
For example, Igbaria and Chakrabarti (1990) suggested that further studies for finding
more information about relationships among computer experience; computer training;
computer anxiety; management support; system quality; demographic characteristics, and
attitudes toward use of computers in different organisations would be useful. Moreover,
in another study, Igbaria (1993) suggested that further research for determining the
relationship between variables such as; users' age; gender; education; training; computer
experience; information centre support; management support, and attitude is needed.
3

Davis (1993) argues that examining some variables such as; the users' experience with
systems; management support; user involvement, and task characteristics would give
valuable information regarding system usage. Therefore, determining the factors that
influence the use of computer systems requires closer study, especial in those areas such
as; health, which has been largely neglected. The current empirical study is an attempt to
uncover some of those factors that can affect computer system usage in the community
health sector. The results could assist community health services, hospitals and
organisations to function more efficiently, offer better service as well as suggest ways
computerised information systems can be used generally.
1.5 Background of Community Health Services and
Community Health Systems in Australia
Community health services in Australia have been defined by Fry and Baum (1992, P:
298) as "A public sector organisation or agency that provides co-ordinated community
based health services and programs to a defined community. A community health centre
is usually located in one set of premises. Community health centres conduct their services
and programs in peoples' homes and other community venues, as well as within the
centre's premises. In South Australia and Victoria they are managed by boards or
committees which include local residents". Thus, community health services are part of
the public sector and usually consist of multidisciplinary teams from different levels of
health professionals. As a result, the size of the team, types of services offered and
management structures vary.
The community health service has played a leading role in developing promotion
strategies which have often reflected the expressed needs and concerns of a local
community. Its role are to shape promotion programs, develop research programs into
current health issues and evaluate the multi-level programs. In Australia, community
health continues to provide a focus for critical comment about aspects of Australia's
health care systems. Sindall (1992) argues that the community health sector in Australia
4

needs to be recognised as a full and legitimate part of the health service to protect and
promote the health of communities.
Since community health services cover many areas in the community, they need to be
organised for greater productivity and fast response in delivery of services. To enable this
to happen an efficient information system is required. An example of this was the
computerised statistical data collection system which was designed in South Australia in
1978. The development of the system was undertaken by the Information Branch of the
South Australian Health Commission. Subsequently, this was adopted in other states
(Jayasuriya et al., 1993).
1.5.1 Issues of Community Health Services in NSW
By increasing the demand for care, community health services were faced with two
problems:
1) Increasing numbers of clients being transferred from hospitals to community
services.
2) The need for continuity of care within community health services.
At present, as there is no centralised case management, clients suffering from the same
problem but living in different geographic locations may not receive the same standard of
care. There is also unnecessary duplication of work because of the lack of communication
between centres. A computerised system is able to alleviate these problems by providing
information about standard practice for a particular condition. It would also assist
managers in better planning and researching.
The NSW Government made the decision, in 1995, to include a community health
information system within the Health Department to support the delivery, planning and
co-ordination of services. Implementing information technology, with special emphasis
on particular areas, would support continuity of care and achieve better assessment of
outcomes. The establishment of a new strategy, one that contains programs for primary
5

and community based services, was an issue that was considered to address the above
aims. For implementing this program, information needs to be client centred and available
in the clinical setting to manage episodes of illness and care. The programs must be
accurate, relevant, structured and presented in such a way as to be easy to administer and
effective in outcomes.
1.5.2 Strategy of Implementing Community Health
Information Systems (CHIS)
A strategy to implement a CHIS for all community health services in four States of
Australia (NSW, Queensland, South Australia and Victoria), and the Australian Capital
Territory from 1995-1998 was developed in 1994.
The community health services in NSW were responsible for creating a program and to
implement this strategy in all regions. The community health services of the Illawarra
Area Health Service (IAHS) were used for this research because the researcher was
studying at the university in this area. The CHIS is due for completion in 1998 at which
time all staff will be given access to client data held in a computerised system. To enable
this to take place the initial strategy was for all community health services to be
progressively linked to Office Productivity Technology (OPT) over the period of 1995
1998.
The implementation of the CHIS needs to progress in an organised manner which reflects
the needs of both the community and the NSW health care system. Part of the health
system needs was the installation of the OPT and the distribution of Personal Computer
(PC) to all staff. For implementing the OPT, some level of skills and training are crucial
because lack of skill and knowledge can produce resistance to a new system.
To understand the level of skills and computer training needs information was needed
from a study into community health. A study was carried out to determine the users level
of needs for computer training courses. This empirical study was commenced at the same
time as the above study.
6
1.6 Overview of the Chapters
It is predicted that the demand for computer use in health sectors during the next decade
will increase the quality of patient care. Patient education will become a major outcome of
health care, and hospitals will be looking for professionals who can use computerised
systems effectively. Discussions of information systems' effectiveness or system success
frequently focus on the questions of what factors provide the best performance. There are
many factors that affect computerised system usage and the measuring of these factors
that influence system usage is necessary.
The purpose of the current study is to test a model that contributes to system usage and to
gain complete understanding of some factors that affect the use of computerised
information systems. Thus, the current study explains the role of external variables on
computer attitude and subjective norms to use computers. Since the study was conducted
in community health, the background of the community health services in Australia is
discussed (chapter 1).
The Theory of Reasoned Action (TRA) (Fishbein and Ajzen, 1975) was chosen as a
foundation for the research model. Using a behavioural model can be an important tool
for explaining and interpreting behaviour in using information technology through
understanding of factors and process that influence it (chapter 2). In this study the effect
of factors such as; demographic characteristics, users' characteristics (computer
experience), organisational support, and users' involvement as external variable in the
TRA were measured. Considering individuals and organisational differences would offer
a potentially valuable finding for determining factors that affect system usage. The
research model, hypotheses and related studies are discussed in chapter 3.
Related literature in the management information system (MIS) and human factors
affecting MIS were reviewed to demonstrate that empirical support exists for various
elements of the proposed model. However, some of the variables were examined for the
first time (chapter 4).
7

The researcher found valid and reliable instruments for measuring variables of the study,
except for the measuring of computer experience. In this study the researcher developed
Subjective Computer Experience Scale (SCES) as a valid and reliable scale for measuring
computer experience. The process and results are presented in chapter 5.
After developing a new scale for measuring computer experience scale, the main study
was conducted. Method, samples and instruments for measuring variables are explained
in chapter 6. Data collection using a questionnaire with 78 items allowed the researcher to
test both the measurement and structural model. The results of the main study are
discussed in chapter 7, chapter 8 and chapter 9. Finally, conclusions, strengths of the
study and limitation are explained in chapter 10.
8
Chapter 2
Theoretical Model
2.1 Introduction
In this chapter, the Theory of Reasoned Action (TRA), the Theory of Planned Behaviour
(TPB) and the Technology Acceptance Model (TAM) are explained. Then comparisons
among these three models are considered. Finally, the advantages of TRA, especially for
this study, are discussed.
2.2 Theory of Reasoned Action (TRA)
The Theory of Reasoned Action (TRA) was developed by Fishbein and Ajzen (1975)
(Figure 2.1). The foundation of this theory rests on the distinctions between beliefs,
attitudes, intentions and behaviour. The theory shows the relationship between beliefs
and behaviour through attitudes, subjective norms and behavioural intentions.
Beliefs: Beliefs are formed by direct observation, outside information, or the way a
person learns about an object. For example, new information from any source (such as;
environment) may influence a person's beliefs. These beliefs influence attitudes and
subjective norms and ultimately behavioural intentions. Beliefs can be changed for
different reasons.
Fishbein and Ajzen (1975) explained that there are two types of beliefs; descriptive and
inferential. Descriptive beliefs are formed on the basis of direct observation while
inferential beliefs are beyond direct observable events. Personal factors play an important
role in the formation of the type of belief. There is little evidence that personal factors
such as; beliefs or attitudes affect the formation of descriptive beliefs. Therefore,
descriptive beliefs are formed on the basis of observations that can produce the
information about the objects of the environment for the individual. Inferential beliefs are
formed by personal factors.
9

Each individual holds many beliefs about all the aspects of their world. An individual's
beliefs about an object can affect attitude. Attitudes, therefore, can be formed by the
function of beliefs. Thus, a negative or positive attitude is dependent on a person's belief
and this can influence attitudes and vice versa. In the course of a life time, a person's
beliefs may be strengthened or weakened or replaced by new ones (Fishbein and Ajzen,
1975).
Attitude: An individual's attitude towards any object is a response to beliefs about the
object so beliefs are important in determining attitude. It can be stated that attitudes are
based on a person's beliefs. Attitudes may influence the formation of new beliefs about
objects. Thus, beliefs and attitudes are in a dynamic relationship. The degree to which a
person reacts positively or negatively to any aspect of the environment can be determined
by attitude. It is possible to understand the reasons for different attitudes by measuring
and assessing the beliefs of a number of people.
When Fishbein and Ajzen (1975) considered types of attitude, they reported that there is a
distinction between two attitude variables; attitude toward the object (AO) and attitude
toward the behaviour (AB). Attitude toward an object refers to a person's affective
evaluation of an object and attitude toward behaviour refers to the evaluation of a
behaviour about the object.
Attitude can predict the intention of an individual to perform a behaviour about an object.
Fishbein and Ajzen (1975) state that attitude can determine a person's overall intentions.
Attitude influences the general level of a person's intentions and the relationship between
attitude and intention can be determined if the intention is measured. High correlation
between attitude and intentions are expected when attitude and intentions are measured at
the same time and on the same target. Thus, the measuring of intention can predict
positive or negative behaviour.
10
Subjective norms: Fishbein and Ajzen (1975) proposed that the formation of intention
depends on the previous formation of attitude and normative beliefs. The authors also
explained the influence of the social environment on intentions and behaviour. Normative
belief is relevant to a behavioural intention that may be termed subjective norms.
Subjective norms are a function of normative beliefs and the motivation to comply. Thus,
by knowing the subjective norms it is possible to predict the person's behaviour.
Subjective norms are based on the information that persons have about their relevant
referents and refers to the acceptance or rejection of specific behaviour. Subjective norms,
therefore, refer to the expectations of others. Ajzen and Fishbein (1980) argue that the
high influence of subjective norms in a person can provide a greater intention to perform
behaviour. A person may believe that specific referents dictate behaviour. Assessment
and measurement of subjective norms for predicting and understanding intentions are
necessary.
Normative beliefs influence behavioural intention and behaviour directly through
subjective norms or indirectly through subjective norms through attitude to intention.
Similarly, attitude can influence intentions and behaviour directly or indirectly from the
subjective norms to intention.
In some situations, both the attitude and subjective norms are not equally weighted for the
behavioural intention. A person may have a positive attitude towards performing a
specific behaviour but his/her subjective norms suggest that he/she should not perform it
or vice versa. In this situation, the person’s intention will depend on the relative
importance of the two components. Each component is given a weight reflecting its
relative importance as a determinant of the intention under consideration and it may have a
very high, low or no weight at all. These relationships may change from one behaviour to
another, from one person to another, or from one period of time to another.
Ajzen and Fishbein (1980) argue that variations in weight for some behaviour on
normative behaviour are more important than attitudinal considerations. The relative
importance of the attitude and subjective norms may be affected by variations in action,
11 3 0 0 0 9 0 3 2 0 3 2 1 3 3
context, time and target. The relative importance of the two components can also be
influenced by demographic variables, personality traits, and other differences. For
example, a person may give more weight to attitude or to subjective norms at a specific
time or in a specific situation. It is assumed that these components are affected by
personal differences. Ajzen and Fishbein (1980) argued that at present, information about
the factors that determine the weights of attitudes and subjective norms, is insufficient.
Accurate prediction of a specific intention can be expected when attitude and subjective
norms of the model are measured. Thus, thie comparative weights of attitude and
subjective norms would be available for each individual concerning each behaviour.
Knowing a person's attitude toward the behaviour may give little information about the
intention if the intention is affected more by normative considerations. So, knowing the
subjective norms of a person permits the prediction of intention only if the intention is not
under attitudinal control. Moreover, two individuals with identical attitudes and subjective
norms may have different intentions if they give different weight to these two
components. Therefore, prediction intention from attitudes and subjective norms is
possible and the weight of attitudes and subjective norms are different if time, target and
the situation changes.
Intention: The effects of attitude (A) and subjective norms (SN) on behaviour are
mediated by the behavioural intention (BI). According to the TRA, intention is the
immediate determinant of behaviour and can lead to actual behaviour. Intention involves
four different elements; the behaviour, the target, the situation, and the time. A person
intends to perform a specific behaviour in respect to a given object, in a specific time, in a
specific situation. Fishbein and Ajzen (1975) argue that it is possible to distinguish
between general and specific behaviour intentions. The relationship between the different
types of behavioural intentions may vary from situation to situation. Consequently,
intention can change in different situations.
Intention is viewed as being related to the corresponding behaviour. Intention behaviour
in individuals is a subjective probability that they will perform some behaviour and this is
12
viewed as a function of attitude and the subjective norms. The best predictor for
behaviour is the intention to perform the behaviour, thus, the measure of intention will
lead to accurate prediction of behaviour. Furthermore, accurate prediction of behaviour
depends on the strength of the intention-behaviour relation.
However, the measuring of intentions will not always be a good predictor of behaviour
because many factors can influence the formation of intention to perform a behaviour.
When intention and behaviour are closely related, factors that influence intentions can also
be used to understand behaviour. Fishbein and Ajzen (1975) argue that a strong
relationship between certain behavioural intentions and behaviour can be provided when
certain conditions are present. The magnitude of this relationship depends on the stability
of the behaviour intention.
Intention can change over time (change in life conditions) and measurement of intention
and behaviour should be done simultaneously. Thus, the longer the length of time, the
greater the changes in intention. A long period of time between measuring intention and
performance behaviour produces greater changes in intentions. When intention is not
stable for the accurate predicting of behaviour, it should be measured immediately
previous to the behaviour. Thus, measuring behavioural intention should be close to the
behavioural performance. A low intention-behaviour relationship also may cause changes
in intention. Therefore, to maximise behavioural prediction the intention should be
assessed immediately prior to the behaviour.
Measuring conditional intention can provide an accurate prediction of behaviour because
this measure of intention would have already been influenced by events. Moreover,
intention and behaviour can have a strong relationship without any occurring events.
Sometimes it is possible to improve prediction by measuring conditional intention. The
measure of intention corresponds to the behavioural criteria in action, target, context and
time. Moreover, prediction of behaviour from measuring intention is accurate when
intention does not change before the behaviour is performed.
13

Figure 2.1 The Theory of Reasoned Action
(Source: Ajzen and Fishbein, 1980, P: 100)
External Variables
According to the TRA (Fishbein and Ajzen, 1975), intentions can be determined by the
attitude towards performing the behaviour and subjective norms. The authors argued that
other external variables of the model can influence the intentions. Ajzen and Fishbein
(1980: 82), argued that "external variables will be related to behaviour only if they are
related to one or more of the variables specified by our theory".
The external variables can influence in three ways; 1) influence on attitudes and
significant amount of weight on intention, 2) influence on the subjective norms and
significant amount of weight on intention and 3) influence on the relative weights of the
two components (attitudes and subjective norms). The authors argue that the relative
weight of attitude and the subjective norms are different for behaviour, over time,
situations and for the individual.
14

External variables such as; demographic characteristics, education and socio-economic
status in the TRA can affect beliefs, attitudes, subjective norms and behavioural
intentions. Thus, the influence of external variables on behaviour is due to their effects on
intentions. Since the intentions are indicated by attitudes and subjective norms, the effects
of external variables on intentions should be due to their effects on one or both of these
components. External variables may influence the beliefs that are attached to attitudes and
normative behaviour. When the external variable is related to attitude, it will not be related
to the intention, if the intention is under the control of subjective norms. An external
variable may influence behaviour, if the relationship between intention and behaviour is
close. However, it is not necessary for a relationship between any external variable and a
behaviour to exist. Behaviour can differ according to actions, targets, context and time
but if the variables are related to a given behaviour at a given time, it may no longer be
related to the behaviour at another time. Because some external variables are related to one
behaviour, it does not follow that it has to be related to another behaviour. A change in
one or more external variable can cause different beliefs that affect the performance of
behaviours. Consideration of external variables may help explain the origin of certain
beliefs. Therefore, the effects of external variables on behaviour are mediated through
behaviour intention when behaviour intention and behaviour are highly correlated.
There are many explanations for the effect of external variables on behaviour. Some
explanations posit direct causal effect of the external variable on a behaviour, while other
explanations assume one or more intervening steps. If the relationship between external
variables and behaviour is inconsistent, additional explanation is required. Ajzen and
Fishbein (1980) argue that more investigation is needed to explain the effects of external
variables.
Experience as an external variable is considered in the TRA. Ajzen and Fishbein (1980)
argue that the strength of attitude-relationship is moderated by some variables such as;
direct experience. Direct experience may produce stable intention and a strong intention-
behaviour relation. An intention, that is formed without direct experience, may change
15
greatly towards a new behaviour. In contrast, a person who has interacted with the
behaviour about an object can develop a more realistic and stable behaviour intention.
However, direct experience does not always influence the stability of intention and the
intention-behaviour relationship.
In summary, external variables affect behaviour, however, these external variables are not
necessarily related to any particular behaviour. Some external variables may have a
relationship with the behaviour and some may not. The relationship between external
variables and behaviour may change over time. Further study in this regard is needed.
Behavioural Change
According to the TRA, determination of any behaviour is possible by considering
behavioural and normative beliefs. Behavioural change can be provided by the changes in
primary beliefs. This is the key to the changing of attitudes. Therefore, by producing
sufficient changes in beliefs, attitudes toward behaviour or subjective norms and
ultimately behaviour, can be influenced and changed.
The changing of a belief will not always cause a change in behaviour. Ajzen and Fishbein
(1980: 81) argue that change in beliefs will produce changes in attitude or subjective
norms. However, change of one or more beliefs may not change the overall attitude and
change of one or two normative beliefs may have little effect on the subjective norms.
By changing attitudes toward behaviour it is expected that change will appear in the
behaviour and if the attitudinal component carries little or no weight in determining the
intention, a change in behaviour cannot be expected. Similarly, if the subjective norms
carry little or no effect on intention, change in subjective norms cannot provide change in
the behaviour. If neither the attitude of the person, nor the subjective norms, change the
behaviour will not change either.
16
Summary
Explanation of behaviour is considered in the TRA. This theory provides a
comprehensive framework that have been used to explain many of the findings in
behavioural change. Ajzen and Fishbein (1980) state that measurement of the variables of
the TRA for understanding the relationship among variables is necessary. These
measurements include: 1) behavioural and normative beliefs, outcomes and motivations
to comply 2) attitude toward behaviour and subjective norms 3) intention to perform
behaviour 4) behaviour.
2.3 Theory of Planned Behaviour (TPB)
The Theory of Planned Behaviour (TPB) is an extension of the TRA by adding Perceived
Behavioural Control (PBC) to predict behaviour. Thus, the TPB can predict behaviour by
three factors; attitude toward the behaviour (A), subjective norms (SN) and perceived
behavioural control (PBC). The perceived behavioural control reflects perception of
internal and external constraints of behaviour (Ajzen, 1985). Thus, a person's perception
of control over behaviour or belief that the person is able to control their behavioural
performance is define as perceived behavioural control. TPB is modelled in Figure 2.2.
17
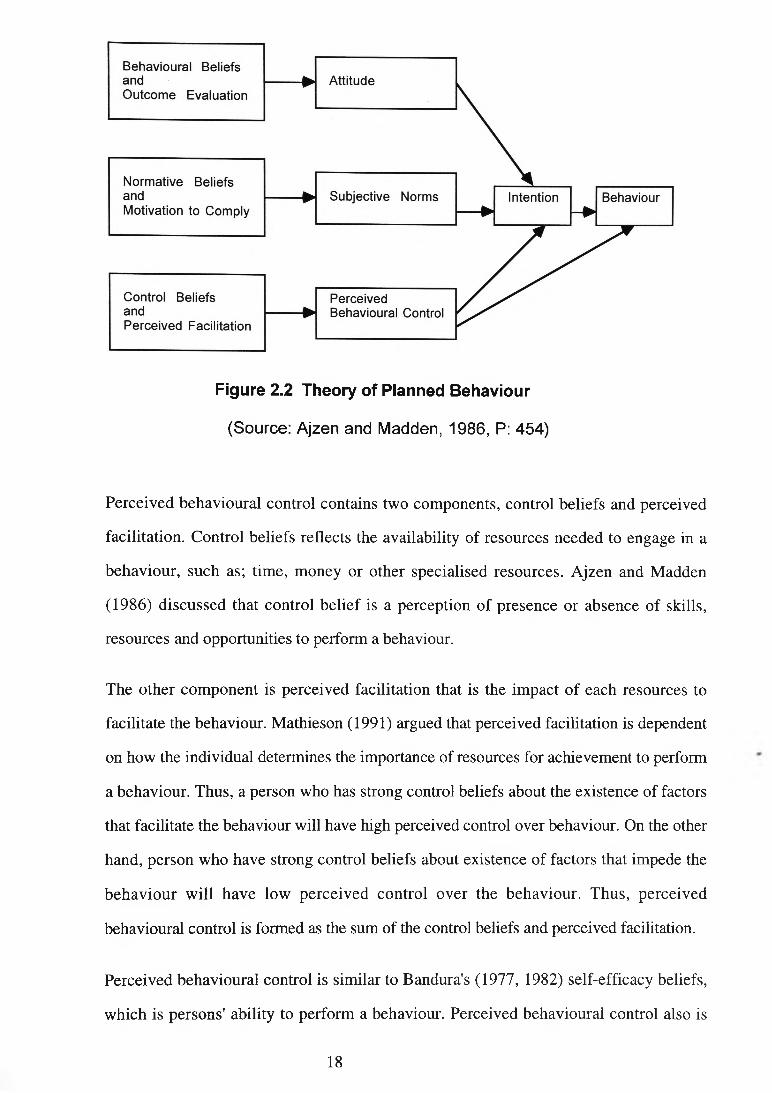
Figure 2.2 Theory of Planned Behaviour
(Source: Ajzen and Madden, 1986, P: 454)
Perceived behavioural control contains two components, control beliefs and perceived
facilitation. Control beliefs reflects the availability of resources needed to engage in a
behaviour, such as; time, money or other specialised resources. Ajzen and Madden
(1986) discussed that control belief is a perception of presence or absence of skills,
resources and opportunities to perform a behaviour.
The other component is perceived facilitation that is the impact of each resources to
facilitate the behaviour. Mathieson (1991) argued that perceived facilitation is dependent
on how the individual determines the importance of resources for achievement to perform
a behaviour. Thus, a person who has strong control beliefs about the existence of factors
that facilitate the behaviour will have high perceived control over behaviour. On the other
hand, person who have strong control beliefs about existence of factors that impede the
behaviour will have low perceived control over the behaviour. Thus, perceived
behavioural control is formed as the sum of the control beliefs and perceived facilitation.
Perceived behavioural control is similar to Bandura's (1977, 1982) self-efficacy beliefs,
which is persons' ability to perform a behaviour. Perceived behavioural control also is
18

very similar to concept of facilitating conditions (Triandis, 1980) which is concerned with
the characteristics of an individual or the environment that make performing a behaviour
easier or more difficult.
Bandura (1977, 1982) reported that people's behaviour is strongly influenced by
confidence in their ability to perform the behaviour. The author distinguished outcomes
beliefs and self-efficacy beliefs. Outcome expectancy is defined as a person's estimate
that a given behaviour will lead to certain outcomes. An efficacy expectation is the belief
that one can successfully to perform a behaviour to produce the outcomes.
Triandis (1971) argued that behaviour is determined by what people would like
(attitudes), what they think they should do (social norms), what they usually have done
(habits), and by the expected consequences of their behaviour. Triandis (1980) presented
a more comprehensive model of behaviour. The model consists of variables such as;
social factors, affect and perceived consequences influence on behaviour intentions.
Furthermore, habit hierarchies have direct and indirect effect on behaviour. The other
factor in the model that can effect directly on behaviour is facilitating conditions. The
author discuses that facilitating conditions are 'objective factors' in the environment that
can make performing possible. Thus, for performing an behaviour, both intentions and
facilitating conditions can influence behaviour.
For accurate prediction of behaviour, identifying the resources, opportunities and
perception of person to perform particular behaviour is important. Therefore, prediction
of people behaviour requires assessment of perceived behavioural control. In other
words, people are different in the accuracy of their self-perceptions to perform a
behaviour. Individuals differences in general may affect perceived behavioural control,
intentions and ultimately behaviour.
However, it is very difficult to measure accurately the behaviour of people because ability
to identify internal factors, skills or other factors that lead them to perform the particular
behaviour, is impossible.
19
Control beliefs can be situational, such as; access to a computer, or the ability to use a
system. Consequently, the difference in personal characteristics (knowledge, experience),
task (complexity, ease of use), and situation and time can influence perceived behavioural
control. Fishbein and Ajzen (1980) argued that the TPB provides specific information
about a person's opinion and can identify barriers of behaviour. By using TPB, the
information would be the details and reasons for particular behaviour.
Summary
TPB is an extension of TRA by adding PBC in the model. This variable contains two
components, control beliefs and perceived facilitation. This model provides valuable
information about attitudes, subjective norms, perceived behavioural control and the
reasons for different behaviours.
2.4 Technology Acceptance Model (TAM)
The Technology Acceptance Model (TAM) is based on principles that were adopted from
Fishbein and Ajzen (1975) and introduced by Davis (1985) (Figure 2.3). Davis (1985)
argued that TAM explains the users' behaviour about acceptance or rejection of computer-
based information systems and how their reaction is affected by the systems' attributes.
Thus, this model is useful for prediction and an explanation of technological use in
organisational settings. Davis (1993) argues that identifying a particular belief about
computer user behaviour will give information about the system characteristics that can
influence user attitudes and usage.
Davis (1993) maintained that this model enables the researcher to: 1) specify the
components of attitude, 2) determine the beliefs and attitudes, 3) specify how external
variables connect to beliefs, attitudes and behaviour.
Davis et al. (1989) discusses that the purpose of this model is to find the effect of external
factors on internal beliefs, attitudes and intentions. In this model, attitude toward using
technology is a function of two beliefs; perceived usefulness (U) and ease of use (EOU).
20
These variables are identified as important criteria for users to accept computer systems.
Perceived usefulness refers to the capability of using a system that can increase user
performance and the degree to which that person believes that using a system would
increase their performance. Ease of use is defined as the degree of required effort for the
systems or the degree to which that person believes that use of the system is free of
mental and physical effort. These two factors can determine a person's attitude towards
systems usage. By measuring attitude toward using systems, the degree that a person
uses the system can be predicted. TAM also states that perceived usefulness has a direct
effect on a individual’s intention to use a system.
Therefore, TAM assumed that EOU has a direct effect on perceived usefulness but not
vice versa. These two factors can also affect the user's attitude and acceptance of the
system. Thus, designers of systems should be aware of the influence of beliefs toward
using a system and should give value to these factors in their task.
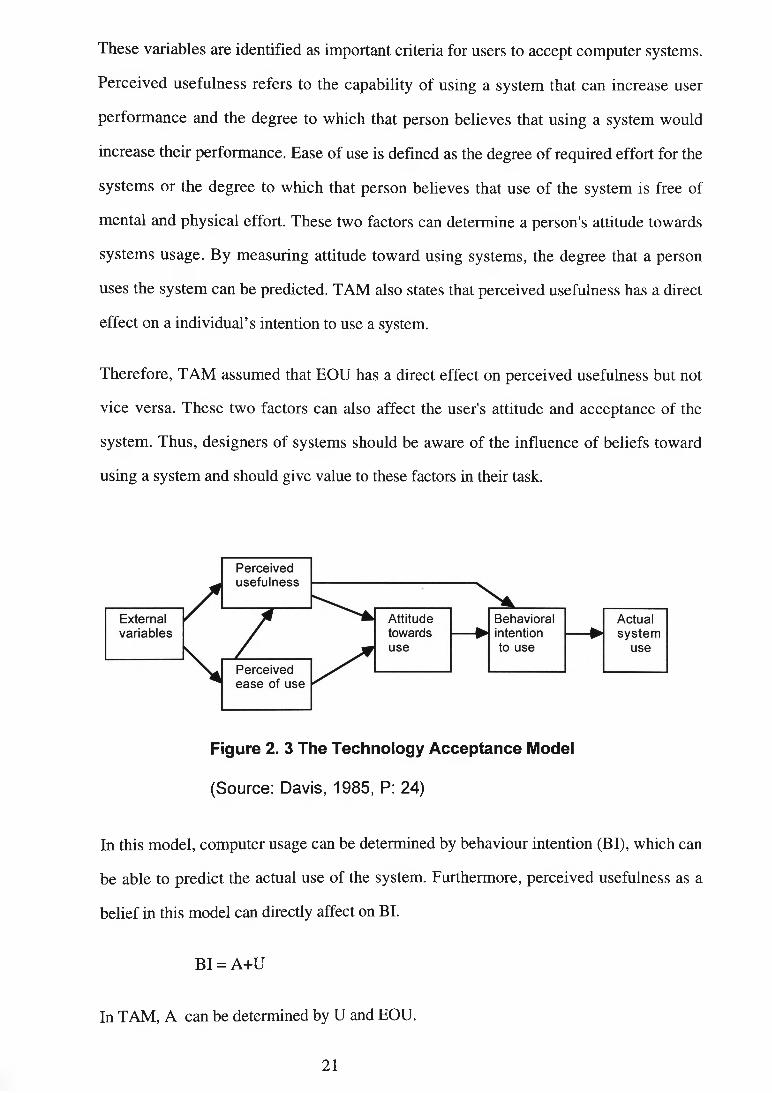
Figure 2. 3 The Technology Acceptance Model
(Source: Davis, 1985, P: 24)
In this model, computer usage can be determined by behaviour intention (BI), which can
be able to predict the actual use of the system. Furthermore, perceived usefulness as a
belief in this model can directly affect on BI.
BI = A+U
In TAM, A can be determined by U and EOU.
21
A = U+ EOU
In this model U has a direct effect on BI over and above A, while U affects A.
EOU in the model has effect on A. Moreover, U can be affected by different external
variables.
U = EOU + External Variables
In this model it is assumed that EOU can be determined by external variables.
EOU = External Variables
Actual use of the system is predicted by behaviour intention. In TAM the subjective
norms (SN), is not included. Davis et al. (1989) argued that it is difficult to measure the
direct effect of the subjective norms on behaviour intentions from indirect effects via
attitudes. In addition, it is assumed that professionals voluntarily use computers. The
authors also argued that subjective norms is not in the TAM "because of its uncertain
theoretical and psychometric status" (p: 986). Therefore, TAM in compulsory system
cannot explain the influence of managers and policies of organisation regarding to use
computers.
External Variables
External variables can connect 'internal beliefs' to 'behavioural intention to use'. These
variables can affect user behaviour indirectly through internal beliefs, attitudes and
behaviour intention. External variables have a direct effect on perceived usefulness and
perceived ease of use and indirect influence on attitude toward use and actual system
usage. In this model external variables provide the bridge between beliefs, attitudes and
behavioural intentions. Furthermore, various individual characteristics, task
characteristics and situational constraints on behaviour are considered. Therefore, the
TAM could provide insights into the effect of system characteristics on user attitudes and
usage.
22
Summary
TAM introduces two new constructs, perceived usefulness and ease of use. These two
factors can determine the attitude of the individual towards the use of systems. This
means that U and EOU determine the acceptance of technology in users. However, TAM
does not include subjective norms as a factor to determine the behavioural intention.
2.5 Extension of The Above Models
Davis's (1989) study on acceptance of information technology was based on the TAM.
The purpose of the study was to develop and validate new measurement scales for
perceived usefulness and perceived ease of use. The author reported that perceived
usefulness was significantly correlated with both current usage and future usage.
Perceived ease of use was also significantly correlated with current usage and future
usage. The results showed that usefulness had a significantly greater correlation with
usage behaviour than ease of use. The study found some new insights about the nature of
perceived usefulness and ease of use and their roles for computer user acceptance.
Davis et al. (1989) compared user acceptance of computer technology based on the TRA
and TAM. The measured variables of the study in two models consisted of computer
attitude, perceived usefulness, ease of use, subjective norms, behavioural intention and
computer usage. The data was gathered from students that had used word processing as a
voluntarily package. The results of the study revealed that perceived usefulness strongly
influenced user intentions. Perceived ease of use had a positive, small but significant
effect on intentions and subjective norms had no effect on intentions. The results
suggested the possibility of simple but powerful model to determine user acceptance.
Igbaria et al. (1989) studied factors that affect computer usage. The study investigated
computer usage among professionals and managers. The authors measured the effects of
some variables such as; demographic, computer experience, computer training and quality
of system on system usage. The results showed that computer usage was related to
computer experience and computer anxiety. The results also indicated a strong, significant
23
and positive relationship between participants in computer training programs and MIS
success.
Igbaria and Parasuraman (1989) studied a model that measured relationships among
demographic, psychological variables (personality and cognitive style), computer anxiety
and attitude toward microcomputers among managers. The model demonstrates that
demographic and psychological variables (personality and cognitive style) have direct
effect on computer anxiety and computer attitude. Moreover, computer anxiety has direct
effect on computer attitude. The research model represents a synthesis of variables of
model of MIS success (Zmud, 1979), concerning roots of computer anxiety (Howard,
1986) and other related empirical findings (Fishbein and Ajzen, 1975; Mason and
Mitroff, 1973). The study investigated computer attitude and computer anxiety among
managers. Results also showed while education was negatively related to computer
anxiety, age and education were directly related to computer attitude. The authors
concluded that the study provided interesting insights into the patterns of relationships
among individuals, computer anxiety and attitude toward computers.
Thompson et al. (1991) used a model from the work of Triandis (1971, 1980). The
model consisted long-term consequences of PC use, job fit with PC use, complexity of
PC use, affect toward PC use, social factors influencing PC use, facilitating conditions
for PC use and utilisation of PC use. The results of the study showed that social norms
and three components of expected consequences (complexity of use, fit between the job
and PC capabilities, and long term consequences had strong influence on utilisation.
These findings confirm the importance of the expected consequences of using PC
technology.
Davis et al. (1992) studied relationship among perceived usefulness, ease of use, task
importance, enjoyment, output quality, intention to use system and system usage. The
model was based on the previous studies such as; Davis, 1989, Deci, 1971, 1972; Calder
and Staw, 1975; Malone, 1981; Carroll and Thomas, 1988; Fishbein and Ajzen, 1975.
The model demonstrates that both usefulness and enjoyment have significant effects on
24

intention to use computers, and also usage intention mediate the effect of usefulness and
enjoyment on usage behaviour. Moreover, usefulness and enjoyment mediate the effects
of ease of use and output quality on usage intentions, while task importance moderate the
effects of ease of use and output quality on usefulness (not mediate the effects of ease of
use and output quality on enjoyment). The results showed a positive interaction between
usefulness and enjoyment. Moreover, usefulness and enjoyment were found to mediate
fully the effects on usage intention of perceived output quality and perceived ease of use.
In addition, measure of task importance moderated the effects of ease of use and output
quality on usefulness, but not on enjoyment. The author concluded that computer
programs should be both more useful and more enjoyable in order to increase their
acceptability among users.
Bagozzi et al. (1992) developed and tested the Theory of Trying (TT) on computer usage.
The new model was compared with both TRA and TAM. The TT model consists attitude
with three dimensions (attitude toward success, attitude toward failing, and attitude
toward process), intention to try and trying and usage behaviour. The results of the study
indicated that attitude formation process in the TT is found to hold for the adoption of
computer technology. In terms of predictions under each of models, it was found that
intentions to try and trying were the best predictors by attitude toward success, attitude
toward failure and attitude toward process. The authors argued that TT can increase
ability to predict and explain usage behaviour compared to the TRA and TAM. Since
intention to try to learn a system usage was a function of attitude, this study enhanced the
important role of attitude in regard to computer acceptance.
Igbaria (1993) studied user acceptance among managers. The research model was based
on the TAM, implementation model and user acceptance of technology (Cheney, 1986;
Ein-Dor and Segev, 1978; Franz and Robey, 1986; Igbaria, 1990; Lucas, 1986; Wold,
1985). The model consists of external variables (demographic variable, user training,
computer experience, information centre support and management support), computer
anxiety, perceived usefulness, attitude toward computer and behavioural intention to use
25
computers. The model shows that external variables have direct effect on computer
anxiety and perceived usefulness and indirectly on attitude and behaviour intention
through computer anxiety and perceived usefulness. In addition, attitude has effect on
behaviour intentions and user acceptance of computers as well as behaviour intention on
acceptance of computers. Moreover, computer anxiety has effect on attitude through
perceived usefulness
The results of study Igbaria (1993) indicated that computer experience had a strong direct
and indirect effects on computer anxiety, perceived usefulness, attitude toward using the
system, behavioural intentions and user acceptance. User training and information centre
support had strong negative effect on computer anxiety and had positive effect on
perceived usefulness, attitude, behavioural intentions and user acceptance of computer
technology. Small but significant effect were also found for management support, age,
education and gender on most of the endogenous variables. Computer anxiety was found
to have a strong negative effect on perceived usefulness and behavioural intentions, had
indirect effects on attitudes and user acceptance via perceived usefulness, and both direct
and indirect effects on behavioural intentions. Perceived usefulness had positive effects
on attitudes, behavioural intentions, and user acceptance, and attitudes had a moderate
effect on behavioural intentions. Finally, behavioural intentions were found to be the
predictor of user acceptance of microcomputer technology.
Igbaria et al. (1994) studied the relationships among perceived usefulness, perceive fun,
satisfaction, system usage and computer anxiety. The authors examined the effects of two
main factors, perceived usefulness and perceived fun, on satisfaction and computer
acceptance (usage). The research model was based on the work of Davis et al. (1989,
1992); Fishbein and Ajzen (1975) and Vroom (1964). The model demonstrates that while
perceived usefulness and perceived fun have positive relation with both satisfaction and
system usage, computer anxiety have negative effect on both perceived fun and perceived
usefulness. Moreover, satisfaction have a direct effect on usage. The results of the study
showed that perceived usefulness is more influential than perceived fun in determining
26

whether to accept or reject computers. The results also revealed that computer anxiety had
both direct and indirect effects on system acceptance through perceived usefulness.
Moreover, attitude (satisfaction) had less influence on system usage than perceived
usefulness and fun. The research model showed its power in determining factors that
affect system usage.
Igbaria (1994) examined factors affecting to computer system usage among professionals
and managers. The research model was from the work of Davis et al. (1989); Fishbein
and Ajzen (1975); and Vroom (1964). The research model consisted of skills, support,
policies, organisational usage (peer usage, management usage, subordinate usage),
computer anxiety, perceived usefulness, normative beliefs and motivation to comply,
attitudes, subjective norms and computer acceptance. The model proposed that perceived
usefulness have positively related to attitude and user acceptance of computers while
computer anxiety have negative effect on usefulness. The model also shows attitude and
subjective norms have direct effect on system usage. Moreover, skills and support have
direct effects on computer anxiety and perceived usefulness. Support, policies and
organisational usage have direct effects on normative beliefs and motivation to comply.
The study found that individuals use computers if they believe that the system will
increase performance and productivity and also if they feel social pressure will motivate
them to use system. It also found that perceived usefulness and computer anxiety had
strong direct effects on attitudes and that both computer anxiety and perceived usefulness
mediated the effects of the externals factors (computer skills and organisational support)
on computer usage. Subjective norms also had a direct effect on computer usage and
mediated the effect of normative beliefs on computer usage. Finally, results also showed
that organisational usage (peer usage, management usage, and subordinate usage) and
organisational support (management and information centre support) had direct effects on
normative beliefs. Therefore, this study mentioned the effect of both individual (attitudes)
and situation variables (subjective norms) on system usage.
27

Henry and Stone (1995) studied job performance of health staff by using computer
system. The research model was a combination of TAM (Davis et al., 1989) and SCT
(Bandura, 1977). The variables of the study consisted management support, ease of use,
previous computer experience, self-efficacy, outcome expectancy and job performance.
The result provided empirical support for positive impact of computer self-efficacy and
outcome expectancy on job performance. Moreover, antecedents were found to have the
expected positive impacts on computer self-efficacy and outcome expectancy.
Pare and Elam (1995) tested a social and psychological model in their study. They
measured influence of social factors, beliefs, affect, perceived consequences, facilitating
conditions and habits on behaviour. The model of study was developed from the SCT
(Triandis, 1971, 1980). The results obtained from the study confirm that SCT should be
applied for understanding and explaining computer usage behaviour in voluntary
environment. The study also showed that personal factors had a more important influence
on behaviour than social or environment factors.
Igbaria and Iivari (1995) studied the effect of self-efficacy and computer usage among
users The research model was developed by integrating the Social Cognitive Theory
(SCT), Theory of Reasoned Action (TRA), Theory of Planned Behaviour (TPB), and
Technology Acceptance Model (TAM). The study found that perceived usefulness had a
strong direct effect on usage, while perceived ease of use had indirect effect on usage
through usefulness. Self-efficacy had both direct and indirect effect on usage. It also had
a strong direct effect on perceived ease of use, but only an indirect effect on perceived
usefulness through perceived ease of use. Computer experience had a strong positive
direct effect on self-efficacy, perceived ease of use, perceived usefulness and usage.
Organisational support and computer anxiety had only indirect effects on usage, through
usefulness. The authors concluded that the results of the study showed factors that affect
computer usage. This study demonstrated the important role of self-efficacy to use
computers.
28
Taylor and Todd (1995) studied computer system usage among managers. The research
model was based on TPB and TAM. The 13 constructs of the model included: computer
attitude, perceived usefulness, ease of use, compatibility, subjective norms, peer
influence, supervisor's influence, perceived behavioural control, self efficacy, resources
facilitating conditions, technology facilitating conditions, behavioural intention and usage
behaviour. The results of study showed that the research model provided a fuller
understanding of behaviour intention by focusing on the factors that are likely to influence
system usage.
Igbaria et al. (1996) studied on a model for computer usage. The model was based on
TRA, TAM and study of Deci (1975). The model consisted perceived usefulness,
perceived fun/enjoyment, social pressure, perceived complexity, skills, organisational
support, organisational usage and system usage. The purpose of the study was to
investigate computer usage among professionals and managers. The model demonstrates
that perceived usefulness, perceived fun/enjoyment and social pressure have positive and
direct effects on system usage. While skills, organisational support and organisational
usage have positive and direct effects on system usage, perceived usefulness, perceived
enjoyment and social pressure, have negative effect on and perceived complexity. In
addition, perceived complexity has negative effect on system usage, perceived
usefulness, perceived enjoyment and social pressure.
The result support the role of perceived usefulness (rather than perceived fun or social
pressure) as a predictor for system usage. The results also demonstrated that perceived
complexity had a important role for linking the antecedent variables (skills, organisational
support, and organisational usage) with the three motivational variables (perceived
usefulness, perceived fun/enjoyment and social pressure). Moreover, skills directly
promote computer usage through their effects on perceived usefulness, perceived
enjoyment, and social pressure.
29
2.6 Comparison among TRA, TPB and TAM
These have some similarities and some differences among TRA, TPB and TAM models.
• The three models assume that attitude can be determined by a person's beliefs. In
TRA and TPB all beliefs are multiplied by corresponding evaluative weight into a
single construct, while in TAM, U and EOU are two distinct constructs.
• In TAM, external variables, provide the bridge between the internal beliefs, attitudes
and intentions on behaviour. Similarly, in TRA the external variables influence
behaviour only indirectly through attitude, subjective norms or their relative weights
and behavioural intention.
• All three models can predict intention to use an information system. TAM does not
include subjective norms (social variables/social pressure) and this is a major
difference between these three models. Mathieson (1991) argues that social variables
are important if other variables in TAM cannot explain systems usage. Thus,
subjective norms is a necessary and important construct that is considered in TRA and
TPB.
• The main difference between TRA and TPB is that TRA does not consider perceived
behaviour control. TRA can predict the behaviour of individuals from their attitudes
and subjective norms. Many studies have been based on the TRA. Sheppard et al.
(1988) reviewed 86 studies and reported that there was a strong support for TRA.
• TAM is useful for voluntary systems. In those situations where system usage is based
on the policies of organisations (mandatory system), this model should be extended
for other variables. Adams et al. (1992) reported that one of the problems in studying
the relationship between ease of use, usefulness and system usage is finding a system
where usage is voluntary so that motivation for use of a system can be provided by
the subjective norms in TRA (Davis, 1993) as well as TPB.
30
• When a system is designed to serve a large number of people, the development team
should ensure that the particular information system is acceptable to all team members
before its implementation. Users' acceptance may change as they become more
familiar with the information system (Davis et al., 1989). Adams et al. (1992: 245)
argue that "there is no absolute measure of ease of use or usefulness, and user
perception of these constructs may vary with time and experience, for any given
application".
• TPB goes beyond TAM, because control beliefs (situational or personal) can identify
other barriers of system usage (Mathieson, 1991). TPB gives more information about
system usage.
• Mathieson (1991) argues that the information in TPB is useful during development
and post-development. TAM can explain a system that is not easy to use, but it cannot
determine other factors that prevent the use of systems.
• TAM is easier to apply than TPB because usually the constructs of TAM are measured
in the same way for any situation. Use of TPB for different users is different and
instruments should be suitable for each group of users.
Since measuring constructs of the TPB are more difficult than the TRA, few studies
have used this model, especial in management information system (MIS).
• Mathieson (1991) argues that the information in TPB is useful during development
and post-development. TAM can explain a system that is not easy to use, but it cannot
determine other factors that prevent the use of systems.
• TPB provides more specific information that can guide better system development
(Mathieson, 1991) as well as TRA. The TRA and TPB give different information
based on different actions, targets, contexts and time (Ajzen and Fishbein, 1980).
Whereas, TAM gives only very general information about systems (Mathieson,
1991).
31
• TAM assumes that U and EOU are factors that always affect the use of systems,
however, in some situations other variables besides U and EOU can influence system
usage, such as; access of user to systems. TRA and TPB determine usage from
beliefs in each situation.
• While TRA and TPB can explain a behavioural alternative, TAM cannot provide a
comparison of behaviour. The advantages of TRA and TPB are that all subjects are in
the same situation for comparison.
2.7 Selection of TRA
The determining of a person's intention to perform a behaviour and the actual behaviour
has been studied for many years. Since the use of organisational information system is an
important behaviour, researchers have used different theories to find attitude-behaviour
relationships. The TRA has been used for many studies in different fields (Miller and
Grush, 1986; Schifter and Ajzen, 1985; Ajzen and Madden, 1986; Blue, 1995) and
showed its power in predicting behavior (Sheppard et al., 1988). For example, in Miller
and Grush (1986) study, the relationship between attitude and behaviour was measured
based on the TRA. The results showed clear support for the prediction of personality
differences in attitude-behaviour and norm-behaviour correspondence. The authors
concluded that the TRA predicted how people behave in a particular domain. Triandis
(1977) reported that TRA has provided a very clear analysis of beliefs, attitude and
behavioural intention. In the TRA, behavioural intentions are predictable from attitude
toward behaviour and subjective norms. The TRA provides a very precise rationale for
identifying and measuring behavioural and normative beliefs and for testing their
association with intention and behaviour. For modifying behavioural intention TRA can
be useful in identifying and producing change in intention (Brinberg, 1979).
Based on the findings of studies and the comparison among the models, TRA appears
well-suited to the present study's objectives. The following points illustrate the
advantages of using TRA for the present study.
32

The separation of attitudes and subjective norms in the TRA allows the researcher testing
the influence of external variables, such as; system characteristics, users' characteristics
and other variables on 'intend to use' and actual system usage thorough attitude and
subjective norms. Davis (1985) argues that TRA provides a well-founded theory of the
motivational linkages between external variables and resulting behaviour. Since emphasis
on the information system is on systems usage, this model enables an investigator to
better formulate strategies for influencing user acceptance through controllable external
interventions that have influences on attitude and subjective norms.
A person may feel that a system could be helpful to improve tasks, but it may not be used
due to lack of knowledge, skills, or for some other reason. In this regard, the above
variables as external factors in the TRA can influence user behaviour through attitude and
subjective norms and behavioural intention. Therefore, measuring attitude and subjective
norms can predict behavioural intention and behaviour. Moreover, knowing the user's
attitude and subjective norms would be useful for understanding the importance of these
two variables for making future policies in respect to information systems.
TRA is applicable in either voluntary or mandatory systems and can predict user
behaviour (Hartwick and Barki, 1994). In TRA the subjective norms can have a
motivational role for a user in mandatory systems. Therefore, the subjective norms in this
model has a positive role. On the other hand, TRA can be used in mandatory systems. In
mandatory system the weight of the subjective norms in greater than the weight of attitude
of the user. In a voluntary system the weight of the attitudinal components are greater
than the weight of the subjective norms. Thus, the role of the subjective norms in this
model is important because it can determine the effect of organisational policies and the
relationship of peers to other users.
At the time of study, the staff of community health were to be trained on using computers
for office applications and the computerised system for community health was not yet
developed. Thus, the staff did not have sufficient knowledge about the system and
33

whether it was mandatory or voluntary. In this situation, as argued above, the use of
TRA was appropriate.
34
Chapter 3
Research Model
3.1 Introduction
In this chapter the research model and hypotheses of the present study are presented.
Related studies to hypotheses are also discussed.
3.2 Research Model
The current study is based on the Theory of Reasoned Action (TRA) (Fishbein and
Ajzen, 1975). The authors stated that it is possible to measure the relationship between
the variables in the TRA. This theory provides a comprehensive framework to explain
many of findings in social research.
The authors of the TRA explained that a person's behaviour, could be determined by
measuring his/her attitude and subjective norms, consequently, prediction of behaviour is
possible. Belief about normative pressure is called the 'subjective norms'. The subjective
norms is based on the information that people have about their relevant referents and refer
to significant others to accept or reject a specific idea or policy. Therefore, a person's
behavioural intention is a function of two factors; attitude (personal factor) and subjective
norms (person's perception of the social pressure).
The TRA postulates that behavioural intention can be determined by measuring attitude
and subjective norms as well as the effect of external variables. Behavioural intentions
could be affected by one or both of these components. External variables can also affect
behaviour of the individual. The external variables used in the current study have been
identified from previous studies. The TRA is a useful framework for examining the effect
of external variables on users' attitudes, subjective norms and behaviour.
35
The research model for this study includes the following factors: users' age, gender,
level of education, organisational position, work tenure, organisational tenure, computer
training, subjective computer experience (positive and negative computer experience),
objective computer experience, management support (general and information centre
support) and users' involvement (importance and personal relevance), as external
variables in the TRA. These factors have been taken from other studies (Appendix 3.1).
Computer attitude, subjective norms, and intent to use computers are the other variables
in the research model.
The relationships between variables are shown in Figure 3.1 (overleaf). The directions of
arrows indicate the direction of influence.
36
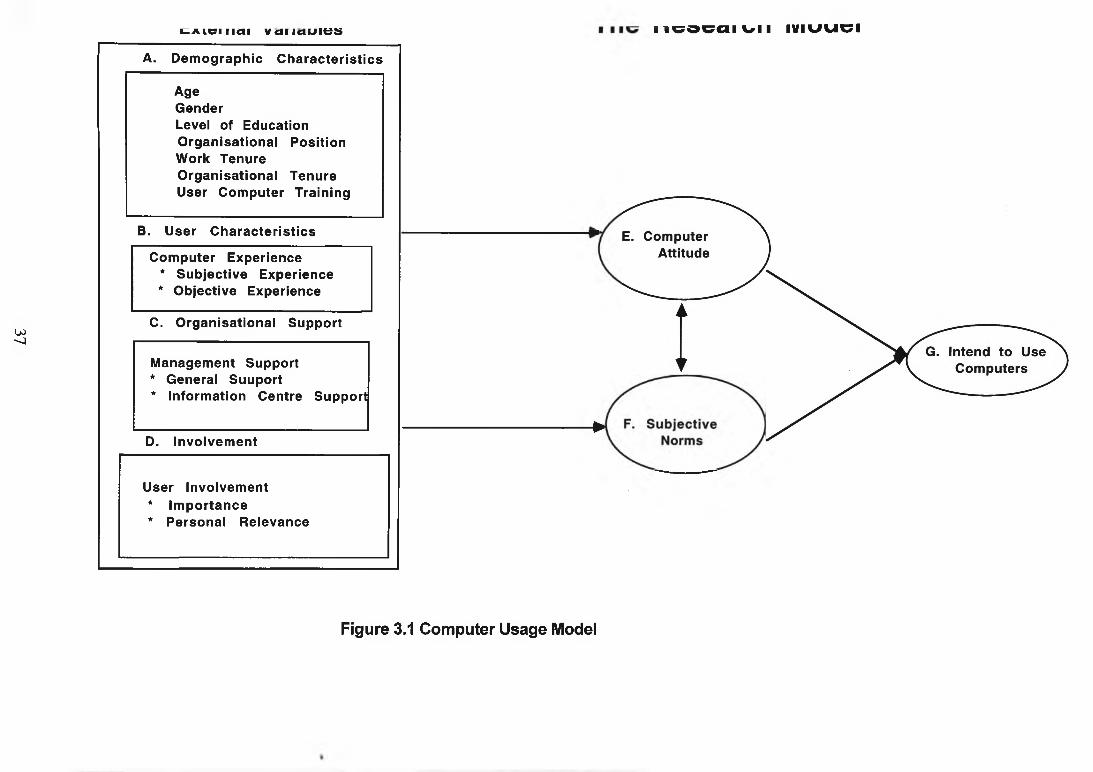
t A i c i i m i v c i i i c iu ie s
u><1
A. Demographic Characteristics
AgeGenderLevel of Education Organisational Position Work Tenure Organisational Tenure User Computer Training
B. User Characteristics
Computer Experience* Subjective Experience* Objective Experience
C. Organisational Support
Management Support* General Suuport* Information Centre Support
D. Involvement
User Involvement* Importance* Personal Relevance
*
Figure 3.1 Computer Usage Model
n c o c a i u u m v iu c i
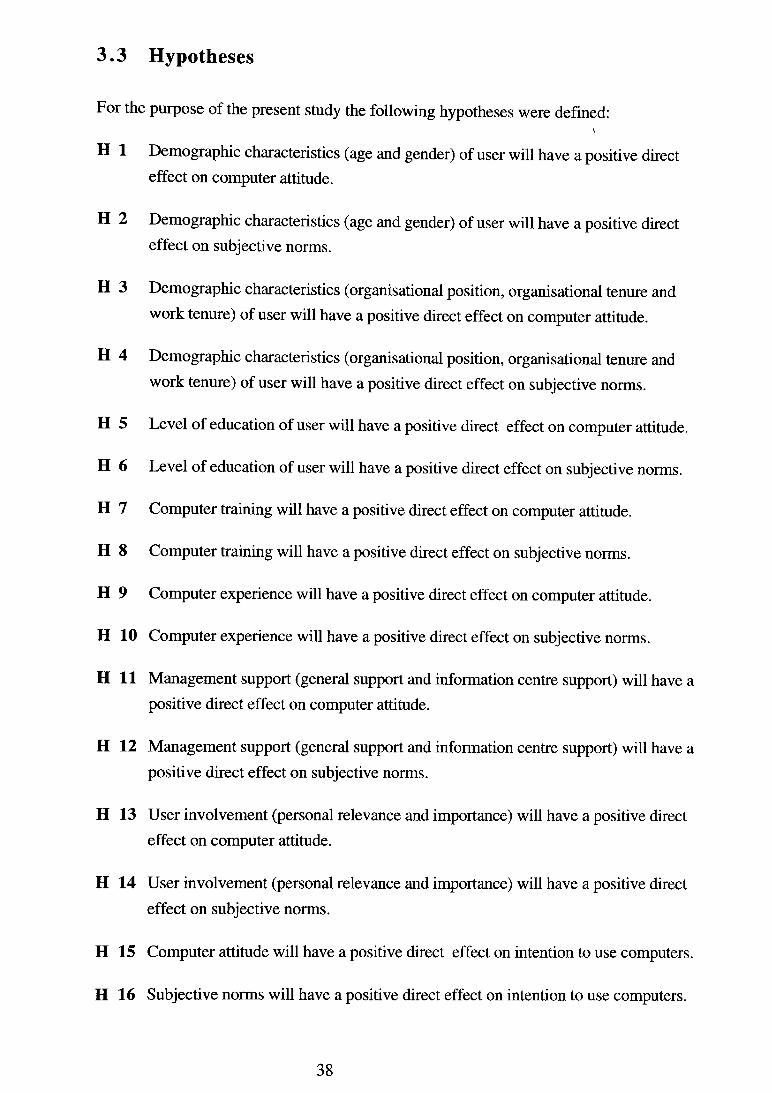
3.3 Hypotheses
For the purpose of the present study the following hypotheses were defined:v
H 1 Demographic characteristics (age and gender) of user will have a positive direct effect on computer attitude.
H 2 Demographic characteristics (age and gender) of user will have a positive direct effect on subjective norms.
H 3 Demographic characteristics (organisational position, organisational tenure and work tenure) of user will have a positive direct effect on computer attitude.
H 4 Demographic characteristics (organisational position, organisational tenure and work tenure) of user will have a positive direct effect on subjective norms.
H 5 Level of education of user will have a positive direct effect on computer attitude.
H 6 Level of education of user will have a positive direct effect on subjective norms.
H 7 Computer training will have a positive direct effect on computer attitude.
H 8 Computer training will have a positive direct effect on subjective norms.
H 9 Computer experience will have a positive direct effect on computer attitude.
H 10 Computer experience will have a positive direct effect on subjective norms.
H 11 Management support (general support and information centre support) will have a positive direct effect on computer attitude.
H 12 Management support (general support and information centre support) will have a positive direct effect on subjective norms.
H 13 User involvement (personal relevance and importance) will have a positive direct effect on computer attitude.
H 14 User involvement (personal relevance and importance) will have a positive direct effect on subjective norms.
H 15 Computer attitude will have a positive direct effect on intention to use computers.
H 16 Subjective norms will have a positive direct effect on intention to use computers.
38
3.4 Related Studies about Hypotheses
3.4.1 A Demographic Characteristics
• Age is negatively related to computer attitude
Age of the user is a factor that can affect computer attitude. The age of managers and its
effect on their computer attitude was studied by Igbaria and Parasurman (1989); Igbaria
(1993). The results of the survey showed that age had negative relationship with
computer attitude. The older managers expressed more unfavourable beliefs towards
computers than younger. Other studies, in relation to computer attitude of health staff,
showed that younger personnel in hospitals had more positive computer attitudes than
older personnel (Grann, 1984; Zoltan-Ford, 1984). A favourable computer attitude can
lead to effective system usage. In this regard, Grann (1984) reported that the older users
with positive computer attitudes were more productive than the younger users. Dyck and
Smither (1994) from their study, found that older users had more positive attitudes
toward computerised systems and they also liked using computers more than younger
users.
However, Scarpa et al. (1992) in their study on the attitude of nurses toward
computerised information systems reported that there was no significant relationship
between age and computer attitude. In addition, Massoud (1991) argues that there was no
relationship between users' computer attitude and their age. Schiffman et al. (1992)
suggested that the effect of users' age on their attitude and system usage requires more
investigation due to conflicting findings, users' age should be considered as an important
factor in the study of management information system (MIS) for predicting its effects on
computer attitude and system usage.
39

Age is positively related to subjective norms
Age, as an external variable in TRA, can affect the subjective norms. Ajzen and Fishbein
(1980) stated that external variables such as; demographic characteristics (age) may
influence the beliefs of a person which will in turn influence their behaviour. Study on the
relationship between the affect of users' age on subjective norms is useful. The current
study will find this relationship and its affect on computer usage.
• Gender is positively related to computer attitude
There are many studies in relation to gender difference and its effect on computer attitude.
For example, Dambrot et al. (1985) from the results of their study, found a significant
gender difference on computer attitude. They reported that the males had completed more
computer courses and had more knowledge about computer languages than the females.
Compared to the males, the females had more negative attitudes and more fearful
perspectives toward computers. The researchers concluded that negative attitude could
possibly lead women to avoid computers, which would limit their future involvement
with computers. Massoud (1991) studied computer attitudes of students. The results of
the study indicated that there was a significant difference between attitude and gender.
The males had more positive attitudes toward computers than the females. The difference
in gender was found in all subscales of attitudes, such as; computer anxiety and computer
confidence. Moreover, situations and factors relating to computers can affect males and
females differently. For example, Torkzadeh and Koufteros (1993), from their study on
computer training and user attitude, found that after training courses the males showed
more improvement in their attitude than the females. The need for finding relationships
between gender, computer attitudes and system usage were mentioned by studies by
Massoud (1991); and Schiffman et al. (1992). Therefore, testing the effect of gender
differences on computer attitudes in the current study could give a better understanding of
this relationship.
40

Gender is positively related to subjective norms
Gender as an external variable in the TRA can affect attitude and subjective norms. Since
the effect of gender on the subjective norms is important, the current study could provide
valuable information regarding the effect of gender on the subjective norms and ultimately
its effect on computer usage.
• Level of education is positively related to computer attitude
Since without effective knowledge, users cannot complete their tasks, many organisations
are attempting to increase the educational level of their users for better performance.
Studies have shown that the level of education can affect the attitude of users differently.
For example, Brodt and Stronge (1986) point out that the user's level of education
influences the understanding of the systems. The authors stated that nurses with high
educational qualification had favourable attitudes toward computers, and that
consequently, their resistance to computer systems was reduced. Rapko and Adaskin
(1993) reported that nurses with high levels of education had positive attitudes toward
computerised systems. Thus, acceptance of technology can be related to the level of a
user's education. In a parallel perspective, Lucas (1978) argues that users with a high
level of education can accept computer systems, but users with low education may resist.
Furthermore, Igbaria and Parasurman (1989) in their study on managers computer
anxiety and education found that education had a positive direct effect on computer
attitude. The study of Sligo (1995) on the use of information systems, showed that the
higher educated users acquired more information than the less educated. This held for all
types of information. In a different study, Abdul-Gader and Kozar (1995) reported that
education level was closely associated with attitude toward computer technology.
Therefore, by providing education, understanding, acceptance and ultimately attitude
toward computers would be changed positively.
However, a study of Fishbein et al. (1980 b) showed that the subjects' level of education
was not a predictor for their behaviour. Besides, Igbaria and Chakrabarti (1990) study
41
reported a non-significant relationship between users' level of education and attitude
toward computers. The authors pointed out that demographic factors such as; the level of
users' education can influence their attitude toward computers indirectly. Gamble (1988)
studied the attitude of managers in hospitals. The researcher reported that the computer
attitude of managers was not dependant on their educational level but highly educated
managers had a different perspective towards computerised systems. Grann (1984) from
a study on computerised information systems in the health area, found that hospital
personnel with higher levels of education had the least favourable attitude toward
computerised systems. In addition, Scarpa et al. (1992) from a study on the attitude of
nurses towards computerised systems, reported that the nurses' attitudes were generally
positive towards computers, however, there was no significant difference between their
computer attitude and level of education.
Sligo (1995) suggested that future research should identify the characteristics of the
highly educated and less educated users. In other studies, the researchers concluded that
the level of education, its effect on users' attitudes and system usage, required more
research (Yaverbaum and Nosek, 1992; Schiffman et al., 1992).
• Level of education is positively related to subjective norms
Fishbein et al. (1980a) from their study, reported that the educational level of the subjects
was correlated significantly with their subjective norms. Consequently, educational level
can influence behaviour. In a different survey, Horn and Hulin (1981) reported that
educational level of the subjects was correlated significantly with their behaviour. The
relationship between users' level of education, subjective norms, and ultimately system
usage, is very important and the few studies in this area did not show this relationship
explicitly. The current study will provide this valuable information.
42

• Organisational position is positively related to computer attitude
On the basis of the previous study, the organisational position of users can affect their
attitude toward computers. Pare and Elam (1995) studied computer usage of personnel in
universities. The researcher reported that the organisational position of the users had more
influence on their system usage than social factors. The study did not mention how the
organisational position affected the users' behaviour. Thus, future study in this area
would be able to find the effect of organisational position on users' attitude toward using
computers. This relationship would give useful information for determining the different
perspectives of users based on their organisational position. The recent study of Thong
and Yap (1995) showed that characteristics of chief executive officers (CEOs) were
important factors that affected their adoption of information technology and using
systems. The study showed a positive association between higher organisational levels
and successful use of computers. Since there are only a few studies that have considered
the effect of organisational position on users' computer attitude, it is a priority for
research. Schiffman et al. (1992) suggested that effect of organisational position on users
attitude and system usage requires more study.
• Organisational position is positively related to subjective norms
Organisational position as an external variable can affect behaviour through attitude and
subjective norms and based on the TRA weight of attitude and subjective norms may be
affected by variation in action, time and targets. Since there are only a few studies in this
area, more research is needed to find the relationship between users' organisational
position and their subjective norms to use computers. Finding this association could
show how organisational position are affected by organisational position.
43
• Task characteristic is positively related to computer attitude
Zviran (1992) studied users' satisfaction among personnel of hospitals. The participants
in the study were grouped into physicians, ancillary and administrative staff. The result
showed that the ancillary personnel had the lowest level of satisfaction while the
administrative group had the highest level of satisfaction. The researcher concluded that
satisfaction of the administrative group was due to their work characteristics, because this
group used computerised systems without any pressure due to limited time. Since
satisfaction enhances attitude, more research in this area would give more information
about the effect of task on users' attitude toward using computers.
• Task characteristic is positively related to subjective norms
According to the TRA, behavioural intention can be determined by computer attitude and
subjective norms. Task characteristics, as an external variables, can affect behaviour
through subjective norms based on different targets, time and action. More research is
required to find the relationship between users' task characteristics and their subjective
norms to use computers. The result of the current study would be useful for organisations
to understand that subjective norms may affect tasks differently in different situations and
time. This information would help information systems managers to reduce barriers to
system usage.
• Work tenure is positively related to computer attitude
Work experience is a factor that can provide different perspective in users toward
computers. For instance, Brodt and Stronge (1986) studied nurses' attitudes and their
experience in nursing. The researchers reported that nurses, who had work experience of
more than 21 years, had more favourable attitudes toward computers than nurses with 10
years work experience. However, Bongartz (1988); Scarpa et al. (1992); Kim and
Peterson (1994) reported that there was no significant correlation between the users'
attitude toward computers and their number of years in the workforce. Due to the
44
important effect of work tenure on computer attitude and computerised system usage,
more research is needed (Schiffman et al., 1992).
• Work tenure is positively related to subjective norms
According to the TRA, behavioural intention can be determined by attitude and subjective
norms. Work experience as an external variable can affect behaviour through subjective
norms differently, based on the target, time and action. More research is necessary in this
area to find the relationship between users' work experience and the effect of social
pressure to use computers. The results would be useful for understanding experience of
users and their perspectives to the policies of organisations and the opinion of their peers
on using computers.
• Computer training is positively related to computer attitude
Computer knowledge is an important issue for computer users as well as managers
(Gamble, 1988). Lack of computer training programs and its impact on users' beliefs are
important and should be considered. In this regard, Schiffman et al. (1992); Kappelman
and Guynes (1995) from their studies, found that users' computer training positively
affected their attitude toward computers. The importance of computer training on users'
attitude has been established by several studies. For example, Igbaria and Chakrabarti
(1990); Igbaria (1993) in their study, argued that computer training had a positive effect
on the attitude of the users towards computers. *
Furthermore, computer training courses can change users’ attitude differently. For
example, Torkzadeh and Koufteros (1993) studied computer training and attitude. The
result of the study showed that attitude of the subjects changed after the computer training
courses. However, change of attitude for males was more than for females and also many
of the users' attitudes did not change significantly after attending the training courses.
This may be due to the content or the format of the courses. Therefore, identifying the
influence of computer training on attitude and system usage is an important factor that
should be considered in future studies (Schiffman et al., 1992).
45

Computer training is positively related to subjective norms
The role of computer training on organisational policies and peers as subjective norms is
not clear. Therefore, the current study in finding relationships between these variables is
necessary and useful.
3.4.2 B. User Characteristics
• Computer experience (subjective and objective) is positively related to
computer attitude
Studies have shown that users with computer experience have different perspectives
towards computers. For instance, Zoltan-Ford (1984) from the result of the study found
that expert users were happier when working with computers than novice users. The
experts also believed that using computers is easy, effective, desirable, stimulating and
that understanding computer languages is simple. On the other hand, inexperienced users
argued that computers are complicated. From this findings highly experienced users
would have a more positive perspective to computers and perform better than low-
experienced users. Therefore, computing skills are a necessary experience for employees
(Szajna and Mackay, 1995) because they can influence acceptance and usage of
computerised systems.
The study of Fishbein and Ajzen (1980) showed that direct experience can produce stable
intentions and a strong intention-behaviour relations. In a parallel perspective, Nederhof
(1989) argues that there is a positive correlation between direct experience and
behavioural intention. Thus, direct computer experience is a variable that can influence
users' attitudes toward system usage (Manstead et al., 1983). In a different study, Leach
and Caputi (1995) measured computer experience of students. The researchers found the
scores on computer experience were significantly correlated with the scores on the attitude
of the users toward computers. It means that computer attitudes were influenced directly
by the amount of experience with computers. The data also demonstrated that subjective
computer experience was a predictor of computer attitude due to the positive relationship
46
between computer experience and computer attitude. Dyck and Smither (1994) in their
study reported similar results, where participants with more computer experience had
more positive attitudes towards computers. The researchers concluded that computer
experience (positive experience) for the participants provided favourable computer
attitude. The researchers suggested that future research would be useful for examining
computer experience and computer attitude.
The current study makes it possible to predict the association between users' computer
experience (subjective and objective computer experience) on their attitude towards
computers. Understanding this relationship is an important issue for improvement of
system usage.
• Computer experience (subjective and objective) is positively related to
subjective norms
Experience as an external variable in the TRA can influence the subjective norms and the
attitude to perform behaviour. Manstead et al. (1983) from their study found that direct
experience influenced computer attitude and subjective norms toward behaviour,
however, the weight of the attitudinal components was larger than the normative
behaviour. There has been little research on the relationship between users' computer
experience and their subjective norms to use computers. The current study is, therefore,
important and necessary to find the effect of computer experience on subjective norms
and intention to use systems.
47
3.4.3 C Organisational Support
• M anagement support (General support and information centre support)
is positively related to computer attitude
Management support (MS) can improve communication between users and the
management system. Exploration communication and channels for supporting users are
one of the important factors that should be considered in management information
systems. To build a number of potential users and increase the effective use of
computerised systems, an information centre and management support are crucial factors
because these factors can positively affect users' beliefs, attitudes, acceptance and use of
computerised systems. Therefore, management support plays an important role in
establishing positive attitudes among computer users in organisations.
Schiffman et al. (1992) from their study, found that management support was positively
related to users' attitudes toward computers. Lucas (1978) in his study, reported that
management support created favourable attitudes towards system usage among users.
Favourable attitudes due to management support can increase system usage, and studies
in this area showed positive correlation between these two variables (Robey, 1979;
Igbaria, 1992; Schiffman et al., 1992; Igbaria, 1990). The study of Schiffman et
al.(1992) found that the frequency and the time of system usage were positively
correlated with the management support of the organisations. In different studies, Pare
and Elam (1995); Compeau and Higgins (1995b) reported that management and
organisational support can increase computer usage by providing a supportive
environment for users. However, Kleintop et al. (1996) in their study, noted that
management support did not affect the pre-implementation of users' attitudes.
Igbaria (1993) reported that information centre (IC) support, had both positive direct and
indirect effects on users' attitudes. Thus, there is a positive relationship between
management support and users' computer attitude (Igbaria and Chakrabarti, 1990). In a
different survey, Igbaria (1990) found that users' attitudes were significantly affected by
48
IC support and that users with IC support had more favourable attitudes toward
computers than those without it.
In addition, behavioural intention can be affected by IC support. In a parallel perspective,
Igbaria (1993) from the result of his study found that IC support had positive direct and
indirect effects on behavioural intention and users' acceptance of computers. A similar
study also has shown that the system usage was strongly affected by the IC support of
the organisations (Igbaria, 1990). Therefore, IC support would help and encourage users
to use computerised systems effectively.
The need for research on management support and information centre support was
emphasised by a number of studies. For example, Davis (1993); Igbaria et al. (1996);
Schiffman et al. (1992) in their studies, suggested that an important variable such as;
management support and its effect on users' attitude and system usage should be
considered in future studies.
• Management support (General support and information centre support)
is positively related to subjective norms
Management support can provide co-operation and favourable communication in
organisations. Studies have shown that co-operative situations and persuasive
communications among people can modify intention toward behaviour (Triandis, 1977).
Songer-Nocks (1976) in the study reported that normative beliefs had a significant weight
under co-operative conditions. Therefore, management support can influence subjective
norms and consequently, system usage would be improved (Robey, 1979). Since there
are few studies about general support (GS), information centre (IC) support, the current
study could provide valuable and necessary information.
49

3.4.4 D Involvement
• Users’ involvement is positively related to computer attitude
Users' involvement in information systems can provide favourable attitudes toward
computerised systems (Baroudi et al., 1986). Studies reported that involvement had a
significant effect on the users' attitude and those who were more involved had more
favourable attitudes towards the computerised systems than who were not (Nederhof,
1989; Lucas, 1981). The role of managers in this regard, is very important because they
could provide positive attitude of users by providing involvement of them in the process
of computerised information systems (Amoako-Gyampah and White, 1993).
When users are involved in a computerised system, they would have greater intention to
use them. A study of Nederhof (1989) showed that strong intentions to perform
behaviours were formed when the users were involved in the system. In a different
survey, Horn and Hulin (1981) found that the users' involvement was positively
significant with their behaviour. Furthermore, other studies have shown that the users'
involvement and their attitudes were important factors for system usage (Swanson, 1974;
Baroudi et al., 1986). Igbaria (1993) in his study concluded that users' involvement may
affect their perception about computers and system usage.
Involvement of users in voluntary and mandatory systems have different effects on their
systems usage. For example, Hartwick and Barki (1994) argue that in the voluntary
system, involvement is a good predictor of the system usage and in mandatory systems
involvement cannot influence attitude and subjective norms concerning system usage.
Thus, testing users' involvement in different organisations would give more information
about system usage.
50

• Users' involvement is positively related to subjective norms
The level of involvement has different effects on the beliefs about others' expectation to
use computers. A study of Nederhof (1989) about users' involvement and their attitudes,
showed that involvement had a significant effect upon the subjective norms. When
involvement was not high, subjective norms was perceived as against performing the
behaviour. The author concluded that increased users' involvement was associated with
the decreased influences of subjective norms on intention. In a different survey, Hartwick
and Barki (1994) studied the effect of subjective norms on compulsory and voluntary
systems. The authors reported that in the voluntary systems subjective norms had little
effect on the intention to use, but in mandatory systems the weight of the opinion of
others was high. Therefore, in the voluntary situation users paid less attention to the
subjective norms while in the mandatory systems attention to others as subjective norms
was greater. The result of the study also revealed that voluntary users developed positive
attitudes toward the computerised systems and they perceived computers as important and
personally relevant. Therefore, users' involvement in voluntary systems and subjective
norms in mandatory systems are important factors that can affect system usage. Hartwick
and Barki (1994) concluded that the level of users' involvement and its effects should be
considered in future studies.
3.4.5 E Computer Attitude
Computer usage can be influenced by users' attitude and, based on previous research,
attitude can affect intention to use systems and actual system usage.
• Computer attitude is positively related to intention to use computers
Nederhof (1989) from the result of the study found that there was a strong positive
correlation between users' attitude and their behavioural intention. In a different survey,
Hebert (1994) reported the behavioural intention of users was predicted by their attitude
towards the information systems. In a parallel perspective, Lucas (1978) points out that
attitude was a good predictor of behaviour and a high level of system usage was related to
51

the users' positive attitudes and their perception. It can be argued that users' favourable
attitudes were associated with high levels of system usage and actual usage of information
systems was influenced by users' computer attitude (Igbaria, 1992). In a different study,
Swanson (1982) points out that users' attitude was related to systems usage and
developing positive attitudes toward information systems was provided by system usage.
Therefore, a positive attitude toward computers is an important factor that can increase the
intention to use computerised systems. Burton et al. (1992) suggested that relationship
between attitude, behavioural intentions and computer usage should be studied in future
research. Similarly, Melone (1990); Massoud (1991) suggested that information system
studies should consider the role of attitude as an important factor for predicting behaviour
in future studies.
• Computer attitude is positively related to subjective norms
Ajzen and Fishbein (1980) argue that the relative importance of the attitude and subjective
norms may be affected by the variations in action, context, time and target. The relative
importance of the two components can be influenced by demographic variables,
personality traits and other differences. For example, an individual may give more weight
to his/her attitude on subjective norms. It was assumed that these components are affected
by personal differences. Thus, the weights of the attitudinal and normative components
would be different for each individual concerning each behaviour. Ajzen and Fishbein
(1980) argued that at present, information about the factors that can determine the weights
of attitudes and subjective norms is insufficient.
The role of subjective norms is also different in prior and post implementation of
information systems. Hartwick and Barki (1994) from their study, found that the
influence of attitude and subjective norms on the behavioural intention was different in
prior and post information system development. Previous development, the users'
knowledge and beliefs about the new system were insufficient and the subjective norms
had greater effects on the intention. After establishment of the systems and identifying the
strengths and the weakness, the users' attitude had greater influence on the intentions. It
52
seems that the role of the subjective norms in information system studies is crucial for
making policies in organisations and the findings in the current study would be helpful in
this regard.
3.4.6 F Subjective Norms
• Subjective norms is positively related to intent to use computers
Subjective norms are defined as a person's belief that specific individuals or groups think
that person should/should not perform the behaviour (Ajzen and Fishbein, 1980).
Therefore, by focusing on subjective norms, the effects of peers, superiors,
subordinates, and organisational climate on systems usage could be studied (Moore,
1987).
The effects of the subjective norms in voluntary and mandatory system are different. In a
parallel perspective, Hartwick and Barki (1994) reported that the subjective norms were
an important factor for determining the 'intention to use' in the mandatory systems. Many
factors also were related to behaviour through the subjective norms. In another study,
Hebert (1994) studied the computer attitude of nurses at hospitals. The result of the study
revealed that the users' subjective norms influenced their intention to use computers and
consequently, their system usage. Thus, the participants used the technology according to
the policies of their organisations. The author concluded that communication of the
subjects with their peers influenced the technology usage. In a different study, Nederhof
(1989) reported similar results namely: that there was a strong relationship between the
participants' subjective norms and their intentions. Therefore, in some situations the
behaviour of persons may be influenced by their subjective norms, rather than attitude.
In addition, in another survey, Bentler and Speckart (1981) indicated that the participants'
intention was highly correlated with their subjective norms and their behaviour was
influenced by the effects of the subjective norms. Recent studies of Thompson et al.
(1991); Taylor and Todd (1995a); Igbaria et al. (1996) showed that social pressure
(subjective norms) was positively related to the computer usage. However, Davis et al.
53
(1989); Mathieson (1991) reported that there was no relationship between the subjective
norms of users and their behavioural intention.
Igbaria et al. (1995a) concluded that social pressure may affect user beliefs and system
usage and this should be considered in future research. Further research for a better
understanding of the nature of social influence is necessary (Davis et al., 1989; Hartwick
andBarki, 1994).
3.4.7 G Intention to Use Computers
In many situations development of computerised systems may fail, due to lack of use or
low quality of system usage. Nickerson (1981) argues that some systems failed to be
used because the systems did not address the users' real needs and designers developed
the systems according to their own ideas. Usage in voluntary and mandatory systems is
different. Lucas (1978) argues that system usage is an important variable for measuring
successful information systems when use is voluntary. On the other hand, in mandatory
systems, the users have no choice so they use computerised system based on the policies
of the organisation. Culpan (1995) reported that the respondents used computers because
it was a job requirement.
Fishbein and Ajzen (1975) argued that attitude and subjective norms are factors that could
affect formation of intention to perform behaviour. The effects of attitude and subjective
norms on behaviour are through the behavioural intention. When there is a strong
relationship between intention and behaviour, changes in intention can produce changes
in behaviour. Igbaria (1993) in his study reported that behavioural intention determined
the users' acceptance of computerised systems. Moreover, Davis et al. (1989) argue that
behavioural intention is a major determinant of system usage. The systems usage could be
predicted from measuring behavioural intention of users. Burton et al. (1992) in their
study, argued that attitude and other variables did not directly affect actual use, but
influenced the strength of intention to provide actual behaviour. Moreover, another study
conducted by Hartwick and Barki (1994), showed that the voluntary users formed their
54
intentions to use the computerised system because they felt that system usage would be
valuable. A study of Davis et al. (1989) indicated that the behaviour intention was
significantly correlated with the system usage, thus, intention to use, can predict system
usage.
The studies and literature of management information system (MIS) have shown that
measuring behaviour intention to use computers can determine and predict computerised
system usage.
55

Chapter 4
Literature Review
4.1 Introduction
This chapter, which contains a review of the literature, is divided into three parts. The
first reviews health information systems and factors that can affect system usage. The
second includes: studies and literature regarding computer experience and its relationship
to other factors. The third reviews instruments for measuring the key factors used in this
research.
4.2 Part 1
4.2 .1 Health Information Systems
Organisations, over the past three decades, have increasingly used computers in their
activities, particularly for fast processing, storage and retrieval of information. A fast
computer information system is a key factor for organisations and its use has altered the
shape and nature of jobs. Rakich et al. (1985) defined an information system as a
communication system where data is gathered, stored, analysed, formulated and reported.
The objective of an information system is to provide information that is required in the
organisation and to foster better decision making for increased profits (Lawlor, 1994).
Information systems can provide efficiency for the organisation (Yasin and Quigley,
1995), and effectiveness and efficiency are prime goals for managers (Klouwenberg et
al., 1995). Thus, the computer information system plays an important role in any
organisation and its ever growing use is an indicator of its success, effectiveness and
acceptance (Szajna, 1993). If an organisation does not use a computer information system
the success of an organisation may be limited in a competitive market.
56
The success of a system, however, depends on users' performance (Kim and Peterson,
1994) and users' performance is related to their task problems. Guimaraes and Igbaria
(1996) reported that users' computer problems were negatively related to the success of
information systems. Thus, for better system usage, users' problems associated with
them should be seriously considered.
Computer information systems are useful for their ability to locate and solve problems.
Sayeed and Brightman (1994) argued that an information system department within the
organisation should encourage problem solving by use of information technology.
Computerised information systems or information technologies are important tools that
can be used for a variety of purposes such as;
• Solving problems (Lawlor, 1994).
• Providing secure data (Goss et al., 1995).
• Providing accurate, fast and better decision making (Sheingold et al., 1987; Anderson
et al., 1992; Lawlor, 1994).
• Providing organised, accurate and fast information (Goss et al., 1995; Robey and
Azevedo, 1994). •
• Contributing to increased speed of learning (McAteer, 1994; Shute and Gawlick-
Grendell, 1994; Lawlor, 1994; Sheingold et al., 1987).
• Delivering educational material and enhancing learning experience (Kasper, 1996).
• Providing assessment of users' educational needs (Kasper, 1996).
• Facilitating widely easy available communication (Brown, 1984; McAteer, 1994;
Bentley, 1995).
• Providing connection between organisations (Pett and Scott, 1994).
• Reducing paperwork (Goss et al., 1995, Lawlor, 1994).
57
• Reducing costs of organisations (Tan and Hanna, 1994; Atkins, 1994; Griffith et al.,
1994), due to repetition of tasks (Davidson, 1980).
• Reducing time consuming (Robey and Azevedo, 1994).
In addition, information systems can provide competitiveness for organisations (Atkins,
1994 and Segars et al., 1994; Yasin and Quigley, 1995). A low level of emphasis,
therefore, on information systems, may result in a low level of competitiveness (Hagman
and McCahon, 1993). Long term competition creates new and improved productivity
(Atkins, 1994; Segars et al., 1994) and, as well, creates or modifies the structure of
organisations (Lucas and Baroudi, 1994). Information systems also depend on accurate,
reliable and valid data, otherwise the organisation will be faced with failure. Lawlor
(1994) argues that computer errors are really human errors, so by using information
systems properly, errors can be reduced and accurate data will be available.
Computerised information systems are an essential tool in the health sector. Most
hospitals and health centres include a wide variety of activities, and use of computers in
their activities is already a reality. Advancements in technology have changed health care
delivery systems that affect all areas of patient care. Andrew (1993) states that
information technology has affected the quality of delivery for patient care and it also
impacts on the effectiveness and the efficiency of clinical care. Studies have also shown
that information technology can also increase the effectiveness of health care delivery for
the elderly. For example, Czaja et al. (1993) studied older people and computerised
communication. The result of the study indicated that these older patients liked
computerised systems and had only a minimum amount of difficulty in using them.
Furthermore, computerised communication systems provided a valuable means for social
interaction for these patients. Thus, computer and communication technologies improved
the social situation for older patients.
Computerised information systems are implemented in many areas such as; management,
patient care, home care and other functions. They can also assist health personnel and
58
professionals to access the required information immediately (Zviran, 1992). Lawlor
(1994) argues that health information systems could assist hospitals and health centres to
improve their productivity, through a process of informed decision making, based on the
continuing measurement of performance. Moreover, information systems can be used as
automation tools in health centres to improve the productivity and satisfaction for the
nursing staff (Chae et al., 1994), without any change to the nurse's time at the bedside
(Korth and Morris, 1993). Tan and Hanna (1994) believe that computer technology,
specially for a health sector, will provide better performance and assist strategic planning.
In a different study, Bendel (1987) reported that computer systems for the health sector
could provide better information for planning and policy making. Wastell and Newman
(1996), from their study, found that a successful computerised system was helpful for
users because it increased their degree of control over computers. Consequently, users
coped better with their work situation than before.
The presence of computers in health sectors influences patient care. By using health
information systems, professional personnel can be better informed about the health of
their patients and clients. Health managers can determine their in-puts from implementing
computerised information systems. Decision making is improved. Moreover, health
information systems assist education and training facilities as part of the patient's therapy.
It is predicted that demand for teaching patients and clients about their health needs by
computer will increase, because health education plays an important role for patients to
gain a high level of self-care. In this regard, computerised systems provide facilities to
assist the patient's teaching and learning process. Weaver (1995) studied patient
education by computer in hospitals. The researcher reported that a computerised system in
the hospital was a useful method for the patient's education and it was cost-effective for
achieving the goals of education. In a different survey, Vargo (1991) reported that
patients, who used Computer Assisted Instruction (CAI), believed that computers were
an interesting tool for learning. The patients also reported that they gained some
knowledge when they worked with the computer. In addition, education through
computers can be useful for long-term home care. Continuing education through
59

computers can decrease the risk of disease for patients and can maintain their
independence from health personnel and increase their knowledge and skills to achieve
the desired outcomes (Hekelman et al., 1994). Patients with access to information
technology can access rehabilitation programs while they are in hospital or at home. This
could decrease the patient's and client's dependence on hospitals and heath centres
(Jones, 1993). Smith (1992) studied a specific program in hospitals regarding the
benefits of health computerised systems. The researcher reported that the use of
computerised systems increased patient care, patients' safety and cost effectiveness.
By providing links between patients/clients and hospitals or health centres, delivery of
services will be easier and faster. Alexandre (1994) reported that computer technology
improved the quality of care delivered by health services. Providing networks is an
important way to increase communication between health sectors. Computerised
information systems in health areas affect health personnel differently. For example,
Chapman et al. (1994) studied the nursing network systems in hospitals. The result of the
study revealed that the network system improved access to information and
communication, increased accuracy and efficiency of data, and also improved computer
literacy. In a parallel perspective, Doorley et al. (1994) studied the effects of hospital
information systems on nursing education. The researchers state that an information
system linked between the hospital and nursing school provided motivation for the
nursing students to use the system, increased their ability to understand the real clinical
picture, and improved their decision-making as well as decreased their computer phobia
they experienced. Furthermore, linking the systems enhanced the computer experience of
the students, provided more time to concentrate on solving patients' problems, increased
the amount of time for system usage and also increased the level of nursing knowledge.
Computerised systems also can increase the knowledge of health personnel and provide
their learning needs (Parry Bush, 1993). Rapko and Adaskin (1993) in their study,
reported that the majority of the nurses had positive attitudes towards computers because
their computer knowledge increased by using information systems. The use of computers
60

at the workplace also can provide positive attitudes for users toward their jobs so the
users believe that computers make their job easier than before (Ngin et al., 1993). In
another study, the nursing educators reported that computers are useful tools in nursing
tasks (Bryson, 1991).
Computerised systems also offer communication technology that can assist patient
diagnosis (Bucholz et al., 1996), support decision making in the delivery of health
services to improve patient care (Brown, 1984), will improve medical records (Atkins,
1995), facilitate high quality of care (Tan and Hanna, 1994) and a higher quality of life
for patients/clients particularly the elederly. In addition, health information systems could
address the problems of patients/clients and consequently, assist patient diagnosis
(Lawlor, 1994; Bucholz et al., 1996). Assessing patients' needs by computer before
treatment is, therefore, possible (Atkins, 1995). Austin (1992) believes that health
information systems support many areas, such as; analysis, demand estimation and
clinical research. Brazile and Hettinger (1995) studied clinical information systems and
their benefits. The researchers reported that the clinical system had many benefits such as;
finding patient identification easily and quickly, one-time entering data, and providing
flexible files.
The information system as a communication system, both inside and outside an
organisation, has a crucial role for managers. Effective planning, problem solving,
decision making and control can be provided only when managers have accurate and
valuable information. Igbaria et al. (1995b) in their study, reported that the managers
used computerised technology because they believed that computers can improve their
performance and productivity.
In their survey, Bradesly and Coles (1989) argued that successful health care managers
are able to efficiently manage resources to achieve greatest benefits, and information
systems are the main source of their success. By using information systems, managers
could use their time more efficiently and solve problems more effectively than others
(Nickerson, 1981). Rakich et al. (1985) in respect to computers and their effect on
61
managers' tasks, mentioned that information systems can also support managers in areas
such as;
• Cost control and productivity enhancement
• Utilisation analysis and demand estimation
• Program planning and evaluation
Therefore, health information systems provide better communication in all sectors, save
time, improve the quality of health care (Griffith et al., 1994), and allow more time for
patient care and professional tasks (Adaskin et al., 1994). By implementing information
systems, staff are able to identify high-risk groups, provide specific services for specific
patients as well as high levels of quality and effectiveness of service. Furthermore,
information technology can produce more accurate data for studies.
Conversely, Chapman (1996) found that more than 60 percent of U.K organisations in
the past two years had problems with computer systems. The problems included:
inadequate information regarding business risks and a lack of information on systems
projects. Kweku (1997) reported that the failure of the computer system is a wide spread
problem despite the progress made in information system development. The author
mentioned that lack of familiarity with information technology is one of the causes of
failure. Obtaining knowledge and skills for the development of a new system would be
worthwhile. Therefore, failure of a system could provide inability to service customers
(Robbins, 1993).
It takes time to learn the necessary technological skills that are required for computer
technology use. Users may need to spend many hours with computers to master new
software programs and to be come up-to-date (Staggers, 1991). Brown et al. (1995)
studied the impact of the Bedside Terminal System (BTS) in a hospital. The researchers
studied the amount of time for direct patient care, nurses attitudes toward the system and
medication error before and after the implementation of the system. The result indicated
62

that registered nurses spent less time in direct patient care and also their attitude toward
the BTS changed negatively after the implementation of the computerised systems.
However, medication errors remained unchanged. Ramsay et al. (1997) studied
information systems for intensive care in hospitals. The results revealed that the computer
system provided a new method to document data that was less efficient than the written
system. The system also had some problems in the prescribing and recording of
medication dosage. In another study, Goss et al. (1995) studied the effect of a computer
system on nurses as computer users. The results showed that the computer system
increased the nursing documentation time, did not support nursing productivity and did
not reduce nursing costs. Furthermore, another study reported that information systems
had problems: such as; waste of time; duplication of paper work, and difficulty in
assessing a terminal (Murphy et al., 1994). In a parallel perspective, Andrew (1993)
argues that information systems may be costly for the organisation. The health care
organisation should attend to the value of systems and their cost effectiveness in solving
clinical problems. Staggers (1991) argues that computerised technologies have overt and
hidden costs. The overt costs come with a price tag. Hidden costs may include the costs
of training users and time delays in situations where users forget how to perform options.
In addition, some researchers reported that computerised information systems are both
expensive and luxury tools. Thus, use of health information program should be used
based on efficacy, safety, acceptability, accessibility and cost (Kirkby and Lambert,
1996). In such an environment of quickly changing technology, control of computerised
systems will be more difficult than at the current time (Pett and Scott, 1994).
4.2 .2 Computer System Usage and Resistance to Use
Information Systems
The use of computerised information systems has been one of the biggest factors that has
impacted on organisations during the past three decades. The success of organisations
depends on many factors, and one of the most important is the effectiveness of the
computerised information system (Igbaria, 1990). This can be measured by the efficient
63

utilisation by the user, and their attitude toward computerised information technology
(Lucas, 1978; Rivard and Huff, 1988). In the management information system (MIS)
literature, the relationship between the user and the information system is typically seen as
an important factor for the success of system development. Thornton et al. (1993), found
that the lack of proficiency by users retards the computerised information systems
performance. Thus, integrating computer facilities and their accessibility for users' can
enhance the achievements of the organisation.
Computerised information systems are useful for the development of an organisation,
however, in many situations, failure due to the improper implementation of information
systems, results in a waste of time and money. Failure of implementation in some
situations is due to the resistance of users to computers. Different reasons for resistance
to use computer has been found. Pellman (1991) for example, reported that resistance to
technology change is one of the factors that caused limit use of computers in accounting
firms. In another study, Safford et al. (1989) argued that uncertainty about technology
change and unfamiliarity with computers could cause computer resistance.
Lacey (1993) argues that the introduction of computer information systems, as with any
innovation, may face resistance from users. Changes to information systems, as with
other types of change, may produce change in the workplace environment. Users, who
evaluate change as an unfavourable event, are likely to be distressed by change and resist
it (Joshi, 1991). Resistance to change is inevitable and is either emotional or objective
(Ely, 1985). Computer resistance could endanger the entire project (Sanders, 1970), and
could also result in failure to perform an agreed task. In this situation the user's behaviour
is different and would be aggressive or silent (Gardner et al., 1988). Sometimes
resistance can be demonstrated by employees' complaints, errors in functions and
sabotage (Cheney and Dickson, 1982). Nickerson (1981) reported that the users'
behaviour toward technology resistance can be due to the negative feelings of the user to
some factors in the computerised systems. Their response is to ignore the system.
Resistance to change by users may also appear in other forms such as; 1) withholding
64
data and information 2) providing inaccurate data 3) disturbing computer output and 4)
showing lower morale (Sanders, 1970). Resistance to computerised systems will also
increase the level of stress and limit the possibilities for using the technology. Therefore,
use of information systems can be influenced by the user's resistance toward
technological change.
Factors leading to rejection are not necessarily from the same sources. For example,
reliability of documents is important for some users, while the response time of the
computerised system is important for others. Reducing computer resistance can assist
users to use computers (Waldrop, 1987). Moreover, a favourable attitude toward
computers is an important issue to combat user's resistance to technology. Lacey (1993)
argues that use of computer information systems can be greatly facilitated if nurses'
attitudes and responses are positive. Computer resistance can be reduced by the positive
attitude of users toward computers. Thus, users' resistance to change is frequently
associated with their attitudes (Boot et al., 1979) and resistance to computerised
technology could be reduced by favourable attitudes toward computerised systems.
Users' computer resistance can also be reduced by computer training (Emrich, 1989).
The successful implementation of a new information technology can be achieved by
providing computer training for the users. In order to overcome computer resistance,
Fochtman and Kavanaugh (1991) argue that lack of familiarity and understanding about
the operation and practice with computers is one of the important factors for resistance.
Therefore, computer training leads to reduction in resistance and acceptance of the
system. In addition, providing positive attitudes during the education process can lead
users to willingly continue the development of their computer skills. The manager's
experience in fostering positive attitudes of staff toward computerised technology is an
important factor for users to accept innovation (Baran et al., 1986). It is necessary to
consider the organisation as a learning environment during periods of change, and
managers, by providing continuous education in organisations, can support the
65
development of computerised systems (Cowley, 1995). Thus, learning new skills about
the new systems would reduce the resistance of users (Fochtman and Kavanaugh, 1991).
Resistance to use computers may, therefore, cause different behaviour that could cause
failure of the system. Reducing resistance to use computers should be considered
carefully as an important issue for improvement of successful computer system usage.
Training and practice with computers would reduce resistance and ultimately provide
positive attitudes toward computers usage.
4.2 .3 Computer Users/End-Users
Users, Lawlor (1994) states, are those who receive information from computerised
systems to use in their job or those who use the output from information systems. End-
users, Capron (1990: 22-23) argues, are "people who purchase and use computer
software". In business, most users are called end-users because they are at the end of the
'computer line', actually interfacing with the computer to make use of the computer's
information". Bullen (1986: 73) maintains that "end-user computing is the use of
computer-based information systems by anyone outside the formal data processing or
information systems areas". An alternative definition describes users, in a broad sense, as
those directly affected by the information processed and are in charge of the process
(Morgan, 1995).
Rockart and Flattery (1983) classified end-user into six types that include:
1) non-programmers who access data through a set of procedures.
2) command-level users who are able to perform some of the specific functions of an
application independently.
3) end-user programmers who are capable of developing their own applications and
are able to use more advanced languages.
66

4) functional support people who are programmers and support others in their
functional area.
5) end-user support personnel who aid in support and application development,
providing central support similar to an information centre.
6) data processing programmers, who are familiar with contract programming type
of environment.
End-users have the responsibility for entering information, preparing output, and making
decisions based on these outputs (Igbaria and Nachman, 1990). They interact with a
computer as part of their job, but they are not programmers (Yaverbaum, 1988). Senn
(1990) explains that end-users should know how to operate the terminals, work stations,
and personal computers, store data and use peripheral equipment such as; printers.
Therefore, end-user computing is the key to the success of information systems and
according to (Koohang et al., 1992), their role has changed dramatically in recent years.
4.2 .4 Attitude
4.2 .4 .1 Definition
There are many general definitions of attitude. Fishbein and Ajzen (1975) described
attitude as being a learned predisposition to respond in a consistent, favourable or
unfavourable manner concerning an object.
Knowles (1990: 68) explain that "attitude refers to what people feel about events, objects,
other people or situations. They are formed as a consequence of what they experience.
Attitude refers to a psychological state resulting from this experience that provides the
clay out of which attitudes are shaped, modified, retained or discarded".
Another definition given by Rokeach (1970: 112) is "an attitude is a relatively enduring
organisation of beliefs around an object or situation predisposing one to respond in some
preferential manner".
67
A review of the MIS literature gives many definitions concerning attitudes. However,
most investigators would agree that attitude can be a favourable or an unfavourable
manner concerning a given object (Fishbein and Ajzen, 1975: 6). Many theories agree
that an attitude is not a basic, unrelated element within the personality, it is a cluster of
many related elements. When comparing the difference between attitude and motivation,
Shaw and Wright (1967) argued that attitudes are similar to motives and both terms refer
to the directionality of behaviour but not to the behaviour itself. Attitudes are closely
related to values and have a number of important implications in relation to behaviour.
Attitudes are particularly important for understanding the behaviour of an individual
because it affects the way people behave and the way they perceive communication.
Thus, an understanding of attitudes produces a framework for understanding how people
feel about their life, jobs and other factors that are related to their world. In organisational
settings, attitudes tend to be centred around the job, facilities, co-workers, supervisors
and management.
4 .2 .4 .2 Computer Attitude
People who use different kinds of technologies in their workplace exhibit different
attitudes towards their work. The role of user attitude to information systems should be
considered as an important factor because it could be changed by many variables
(Melone, 1990). It is possible to understand users' attitudes by focusing on assessing
their perceptions of information systems. Cuplan (1995) in her study, reported that
computer users in different organisations had different attitudes and intentions towards
using the computerised information systems. Thus, no matter how sophisticated and
capable the technology, its effective implementation depends on users having positive
attitudes towards it. Murphy et al. (1994) studied nurses' attitudes toward a computerised
information system. The result of the study showed that the nurses had positive attitudes
toward the computerised information system. The researchers emphasised that assessing
users' attitudes is a worthwhile method for evaluating their opinions.
68

Studies have shown that there is consistent agreement on the development of positive
attitudes toward computerised technology (Burkes, 1991), because positive attitudes
promote the willingness of users to continue to further develop and use these skills in
their tasks. In a parallel perspective, Martin et al. (1994) argues that users' positive
attitudes toward information systems affected their willingness to work with them.
Therefore, their feelings regarding the system, affected their job performance. Users'
favourable attitudes can also enhance their involvement in the development of information
systems. Nabali (1991) reported that the users of computerised information system had
more favourable attitudes towards involvement than non-users.
In addition, Robey (1979); Burton et al. (1992) argued that users' positive attitudes
toward an information system lead to goal satisfaction. Consequently, users' satisfaction
produces favourable attitudes of users (Igbaria and Nachman, 1990). Other studies have
shown that there is a positive relationship between users' attitudes and their satisfaction.
For example, Igbaria (1990) found that the computer users' satisfaction was strongly
affected by their computer attitudes, thus, favourable attitudes enhanced users'
satisfaction.
Positive attitudes by users will reduce barriers to using computers effectively and provide
better conditions for the success of users and the information system. Igbaria (1990)
reported that users' attitudes had a significant effect on their success. Positive attitudes of
the user increased their level of success, and their job effectiveness. In another study,
Krampf and Robinson (1984) identified enthusiasm of the staff before actual start-up as a
key factor in the successful introduction of a computer information system. Therefore,
favourable attitudes of users improves the success of computer systems and unfavourable
users' attitudes can cause problems for the success and effectiveness of computer systems
(Grann, 1984).
69
4.2.4.3 Content of Attitude
Knowles (1990) argued that attitudes are composed of three major components: a
thinking or cognition, a feeling or affective and an action or conative.
1- Thinking parts involve the person’s knowledge about the object or event that is based
on information.
2- Affective part that the object or event increases the level of emotion, for example, like
or dislike.
3- An action part refers to the person’s reaction to an object or events.
Ajzen (1989) explained that these three component of attitude could be verbal or/and non
verbal.
4 .2 .4 .4 Functions of Attitude
Knowles (1990) states that function of attitudes contains two determinants, internal and
external.
Internal determinants of attitudes can affect formation of knowledge, the expression of
emotion, and preparation of the individual. External determinants include: gaining social
acceptance from other people and a mechanism for evaluation in an instrumental way.
4.2 .4 .5 Computer Attitude and Age
Users' age, its effect on attitude and system usage, are variables that have been
considered by many researchers. For example, Robertson et al. (1995) studied the
attitudes of teachers and students towards computers. The results of the study indicated
that the students had more favourable attitudes toward computers than the teachers. Thus,
younger users had more positive attitudes toward computers and used more systems than
older users. In a different survey, Ettema (1985) reported that younger users used the
system more than older users. In a parallel perspective, Schiffman et al. (1992), from the
70
result of their study, reported that dependency on computers and computer usage had a
negative effect with the age of the users. Thus, the younger users used computers more
than older users. Clayton and Pulver (1993) studied the relationship between the age of
physicians and their usage of computerised systems. The authors found from the data that
younger physicians used computers more than older physicians. The researchers
concluded that users' age is a predictor for using computerised information systems. In
another survey, Igbaria (1993) reported that the users' age was a factor that directly
affected behavioural intention, and it also influenced the system usage through the
behavioural intention.
A recent study of Henderson and Deane (1996), however, showed that there was no
significant different between users' age and use of computer at home. Igbaria (1992) in a
different survey, reported that the age of the user was negatively correlated with the
amount of time used and younger users spent more time using computers than older
users. In a different study, Igbaria et al. (1989) reported that age was negatively related to
diversity of applications, duration of use, frequency of use, system quality, information
inclusion, and level of sophistication of usage. Therefore, computerised system usage can
be affected by the age of the user.
Studies have furthermore, shown that the requirement in computer training for younger
and older users is different. A study by Kelley and Chamess (1995), about the training of
middle-aged and older adults, reported that computer training for older users required
more time than for the younger and that older users also made more errors than younger
users. A recent study by Westerman et al. (1995) also showed that older users were
slower in information retrieval. Therefore, the age of users is a factor that can influence
the user's learning and consequently, the system's usage. In relation to the psychological
factors of users, Igbaria et al. (1989) reported a positive relationship between computer
anxiety and age, so older users showed higher levels of computer anxiety than youngers.
On the basis of the above and other studies, it seems that users' age can be considered as
an important factor in predicting attitude toward computers and computer usage.
71
4.2.6. Computer Attitude and Gender
There are many studies regarding the effect of gender differences on users' attitudes
towards computers. For example, Igbaria (1990); Igbaria (1993), found from the results
that gender had a significant direct effect on users' attitudes and females expressed more
unfavourable attitudes toward computers than males. In another study, males showed
more enthusiastic perspectives about computers than females (Kirkman, 1993). In a
parallel perspective, Princeton (1991) from a study on gender and computers found that
males were more likely to identify themselves with computers than females.
Studies of Shashaani (1993); Todman and Dick (1993); Shashaani (1994); Yelland
(1995); Robertson et al. (1995), in relation to computer attitudes, indicated that male
students had more favourable attitudes towards computers and computer games than
female students. However, Dambrot et al. (1988) reported that there was no significant
difference between females and males in computer attitudes.
When computer learning in schools was examined, girls showed less interest in learning
about computers than boys. In another study, the differences in attitudes toward
computers between girls and boys were significant, and reflected gender-role
socialisation. The girls reported fear of using computers and feelings of helplessness
around them (Shashaani, 1993). Gender socialisation affected computerised information
systems usage and the results of many studies have also shown that gender has a definite
effect on system usage. For example, Igbaria et al. (1995b) reported that males used the
computer system for their tasks more than females. In other words, system usage was
affected by the user's gender. In a different study, Igbaria (1993) reported the effect of
gender on system usage and explained that gender was a factor that influenced directly
and indirectly the behavioural intention of the users. Thus, the users' gender was an
influence on system usage through behavioural intention. Furthermore, the study of
Krendl et al. (1989) on computers revealed that girls had less interest in using computers
than boys. The results of other studies in this area, showed that females used computer
systems less frequently, for less time and for a fewer number of applications than males
72
(Schiffman et al., 1992; Igbaria, 1992). In addition, females showed less ability in using
computers than males (Koohang et al., 1992). Moreover, studies that were conducted by
Yelland (1995); Kirkman (1993) showed that boys thought that they were better at using
computers than girls.
Males and females have different views towards using home computers. For example,
studies on home computers showed that male students spent more time on home
computers, they were more confident using computers and rated themselves better in
using computers, than girls (Kirkman, 1993). The study of Robertson et al. (1995)
showed that boys were more likely to continue using computers than girls. Males also
had more involvement with computers, greater access and use of computers than females
(Vasil et al., 1987). Therefore, males use computers more than females and also consider
themselves better at using computers than females.
However, there are many studies that have shown that there is no difference between
males and females in regard to computer use. Robertson et al. (1995) reported that there
was no difference between male and female attitudes toward computers. In a different
study on computer usage among professionals and managers, Igbaria et al. (1989)
reported no gender differences among users. Moreover, Francis (1994) points out that
there was a slight tendency for both male and female users to believe that their sex is
better at using computers than the opposite sex. The researcher concluded that there was
no significant gender differences found in the scores recorded on attitudes toward
computers. In relation to the psychological factors of computers on users, a study by
Hudiburg et al. (1993) reported that there was no significant differences between males
and females in stress caused by computers.
In a different survey, regarding users' attitudes, confidence of using computers and the
user's gender were considered. The results showed that female students had equal
confidence in their ability as males in using computers (Todman and Dick, 1993), and
equal awareness of the value and benefits of computers in daily life (Shashaani, 1993).
Other studies showed that females with prior computer experience competed equally with
73

males in computer science (Taylor and Mounfield, 1994) and spent more hours using
computers than males (Igbaria, 1992). Therefore, the user's gender is not a good
predictor for using computerised information systems (Brown and Coney, 1994).
The extensive studies on computers and gender differences, indicated that this factor is a
complex and deeply rooted problem that appears to be related to many factors such; the
impact of family and social life and the expectation of different life styles and job goals
for males and females.
4.2 .4 .7 Computer Attitude and Level of Computer
Education
The level of the user's education and its effect on attitude toward computers and computer
usage has been studied by researchers. For example, Ettema (1985) reported that better
educated users tended to use system more than others. Schiffman et al. (1992) from their
study, found that the user's level of education was positively related to attitude toward
computers. The researcher also reported that the level of education was positively related
to frequency of use and the amount of time spent in system usage. The researcher
concluded that the more knowledgeable the user, the more favourable the attitude toward
computers. In a different survey, Igbaria (1993) studied the acceptance of technology by
computer users. The study showed that the users' level of education had a positive direct
effect on the system usage through the behaviour intention. In another study, Igbaria et
al. (1995b) assessed information systems usage and reported that user educational level
was positively related to frequency of the computerised system usage, amount of time it
was used and the number of tasks performed.
Igbaria (1993) considered, in another study, the user's education and its effect on the
psychological factors. The level of the user's education had a effect on computer anxiety.
Those users with a high level of education had low levels of computer anxiety. The
author concluded that the level of education is a predictor of computer anxiety. However,
a study by Hudiburg et al. (1993) on the psychological effects of computers on users
74

showed that the users with higher levels of education had greater computer stress than
those with less education.
4.2 .5 Computer Training
There have been many changes to information systems in the last decade. Changes in
information systems requires users to constantly up-date their computer knowledge and
skills. Computer training is a critical issue for any user because computers offer great
capabilities for the users. Computer related concepts need to be taught before users learn
by making errors. User training in order to be effective requires effort from the trainers
and learners.
Users' levels of education about information systems is a crucial factor for the success of
systems. Studies have shown that computer training programs have been identified as one
of the factors that influence the success of users (Davis and Bostrom, 1993; Lieberg,
1995) and success of a computerised system (Bronsema and Keen, 1983; Lieberg,
1995). Thus, users should have a balance of knowledge and skills about information
systems in their workplace. Davis and Bostrom (1993) state that the responsibility given
to users is an important issue in organisations, and user training is a key factor for the
success of organisations. In a different study, Grann (1984) argues that for successful
implementation of a system, users' training is an important factor that should be
considered for the successful implementation of information systems (Martin et al.,
1994). Furthermore, computer training courses can provide opportunities for users to
participate in the process of information system development and successful
implementation (Bronsema and Keen, 1983; Kappelman and Guynes, 1995). Since
computer training is an important issue in any organisation, it should be arranged as a
continuing education (Borovits, 1984).
Computer training can, moreover, assist users to understand the system better and allows
them to increase their knowledge of it. Consequently, their knowledge and skills will
assist them to work effectively with computer information systems, thereby protecting
75

themselves and their organisations from pitfalls in relation to computing, such as; loss of
data and errors (Stohr and Turner, 1986). Studies have shown that computer training can
provide facilities for the learning process and is useful for increasing the users'
knowledge about computers (Schiffman et al., 1992; Lieberg, 1995; Abbott, 1993). In
another study, Torkzadeh and Koufteros (1993) reported that training courses affected the
users' understanding of computers. In a parallel perspective, Nickerson (1981) reported
that computer training gave an opportunity for increasing the ability and skills of the
users in their organisation. Computer training can also improve task-related skills. In a
parallel perspective, Ngin et al. (1993) studied nurses as computers users. The result of
the study showed that providing situations for computer education helped users to learn
new skills about their tasks. Another study reported that nursing students learned how to
use computers while they trained and this increased their nursing skills progressively
(Strength and Keen-Payne, 1991). Santhanam and Sein (1994) argued that increasing the
knowledge and skills of users is one way of improving their proficiency. Computer
training and acquiring technical skills can provide system usage, consequently,
achievement of the organisation's goals is possible. However, Jayasuriya et al. (1994)
reported that the computer training by the nurses did not change their computer
knowledge.
In addition, studies have also shown that computer training leads to user satisfaction. For
example, Joshi (1990); Yaverbaum and Nosek, (1992); Chapman (1995); reported that
computer training for developing user skills and knowledge is an important factor that can
increase user satisfaction. Moreover, Igbaria (1990) points out that users' satisfaction
was strongly affected by their experience and users with more computer training had
greater satisfaction. In another study, users' satisfaction enhanced the ability of the
managers to achieve better system usage (Lieberg, 1995). Thus, computer training and
education can affect users' satisfaction and consequently, the computer system usage
(Yaverbaum and Nosek, 1992). On the other hand, lack of knowledge and understanding
of the computerised system caused dissatisfaction to the users (Zviran, 1992).
76

Computer training can modify behaviour (Triandis, 1977). The results of studies have
shown that computer training was positively correlated with behavioural intentions,
acceptance of computers (Igbaria, 1993) and computer usage (Igbaria, 1992). It was
found that trained users improved organisational productivity and performance (Calvert et
al., 1994). Mawhinney and Lederer (1990) found from their study that computer training
was positively associated with computer usage and the system usage in the survey was
significantly related to the numbers of the computer courses and the users' satisfaction
with training. The authors concluded that computer training played an important role in
system usage. Schiffman et al. (1992) in their survey reported that the frequency and
amount of time of system usage were positively related to the number of courses and the
support given to the training course. The researcher also claimed that the number of tasks
and applications that users used were affected by the training. In another study, Igbaria et
al. (1989) reported that users with more training courses tended to use more varied and
sophisticated applications more often and for a greater number of hours per day. In
addition, Kleintop et al. (1996) reported that the length of practice time was positively
related to actual use and increased system usage.
It was also found that computer training improves the user's skills in using computers,
specially for new or inexperienced users, and this would help them to increase the amount
of their computer usage (Igbaria, 1993). In a study conducted by Igbaria (1990) it was
found that computer training increased system usage both directly and indirectly through
the effects on users' attitudes. The results of other studies showed that system usage was
strongly affected by the amount and quality of users' computer training; those with more
computer training used the computerised systems more than untrained users (Igbaria,
1990; Igbaria, 1992; Schiffman et al., 1992; Zeffane and Cheek, 1993). Computer
training, therefore, was positively and strongly related to computer usage. Furthermore,
computer training and computer introduction courses have been found to be useful
regarding system usage. Brummelhuis and Plomp (1994), from the results of their
survey, reported that the training course and computer introduction for students provided
a positive effect on computer usage. Brodt and Stronge (1986) suggested that new users
77
should have an orientation course to computers because this computer training would give
them time to establish their role and assist with favourable interaction with computers.
Computer training, before implementing a new system, would be more useful than post
implementation. Krampf and Robinson (1984) identified that orientation to computerised
systems before actual start-up was a key factor for successful implementation of a new
system. Kleintop et al. (1996) noted that post-implementation training did not contribute
to the new computerised system usage. Therefore, it is accepted that the ability of users to
understand computer systems affects the acceptance and utilisation of computers in
organisations. Users can become capable if they have sufficient training in using a
system, specially prior to the implementation of a new one. On the other hand, inadequate
or improper training can lead to rejection of and resistance to implementing new systems
(Coe, 1996).
Thus, high levels of computer education for users could provide a positive influence on
system usage (Pare and Elam, 1995). Trained users can provide a high quality of system
usage and acceptance of the change process.
The adequate training of users is a key factor in the effectiveness and efficiency of a
system (Brown, 1984). Computer training is recognised as an essential contributor to the
productive use of the computer in organisations. Furthermore, computer training
increases the user's productivity from the systems (Gerlach and Kuo, 1991), and can
increase the use of the latest technology.
Lack of knowledge and skills about computerised information systems are considered in
studies with different perspectives. For example, Rupnik-Miklic and Zupancic (1995)
reported that lack of knowledge and skills in relation to information technology was the
major reason for the slow adoption and limitation of system usage. The recent study of
Thong and Yap (1995) showed that the manager's knowledge about information
technology was related to its adoption. Kleintop et al. (1996) from the result of their
study found that lack of user knowledge was one of the important problems that was
78

inversely related to computer success. Furthermore, lack of knowledge caused a low
degree of user satisfaction (Zviran, 1992). Low level of user knowledge is also a major
problem that leads to waste of time and money for organisations. Guimaraes and Igbaria
(1996) point out that users' learning by trial and error on their own, led to unnecessary
high costs to organisations. Igbaria (1992) in his study, emphasised that lack of trained
computer users leads to a waste of time, resources and money.
In addition, a low level of user knowledge can provide resistance to computers and if
users believe that an information system is a threat, it will be particularly difficult to
guarantee the accuracy of the information system. Torkzadeh and Angulo (1992) found
that computer users' resistance can be viewed from three perspectives; psychological,
sociological and operational. All perspectives relate to 'lack of knowledge'.
Consequently, users with a low level of computer knowledge may resist using computer
systems in their work, so the organisations will lose its investment in the information
system. Moreover, lack of knowledge may develop when changes are made to the
organisation's technology.
In this situation, the training of users to adapt to the new information systems should be
considered, because new information systems may increase the complexity of the task
and this may lead to users' resistance. Introduction of new systems, training and
encourage can reduce users' resistance to information systems (Waldrop, 1987; Krovi,
1993). A crucial role of the manager is to identify the causes of resistance and combat
them. Therefore, by training users, resistance of users toward computer systems could
possibly be overcome.
Inadequate computer training can produce anxiety for users toward computers. Robertson
et al. (1995) studied the computer attitudes of teachers and students. The study showed
that teachers had a greater anxiety level than students. The researchers reported that one of
the reasons for this was that the teachers were not adequately prepared and trained to use
computers. At the beginning of computer training, users may be anxious and computing
skills gained from the training course can help them to overcome their anxiety by working
79

or studying harder and practising more (Szajna and Mackay, 1995). In another survey,
Igbaria (1993) reported that computer training had strong effects on negating computer
anxiety. Howard and Smith (1986) argued that computer training is a quick and
inexpensive way to decrease computer anxiety. Moreover, Igbaria (1990) pointed out that
the computer anxiety of the user was significantly affected by the user's computer training
and those users with more computer training had less computer anxiety. In a parallel
perspective, Torkzadeh and Angulo (1992) reported that computer anxiety is a real
problem for new computer users but they can be successful in their tasks if they are able
to accept computers. This would be possible by computer training programs.
Computer training programs will increase users' familiarly with computer applications,
thus, training should be based on their needs to solve their task problems in relation to the
information technology (Joshi, 1991; Nord and Nord, 1994). Dover and Boblin (1991)
studied nursing students and their computer learning. The result of the study showed that
the students believed that they needed training based on their level of experience and they
were eager to learn more about applications. In a different survey, Carter and Axford
(1993) studied the computer training needs of registered nurses. The result of this study
showed that the nurses needed to know how to use computers in their practice. The
researchers concluded that computer training courses should focus on users' needs and
their responsibilities at work. In a parallel perspective, Damodaran (1996) argues that
computer users have different roles in their organisations and at different stages need a
different amount of knowledge and skills and these needs should be the basis of their
training. Bryson (1991) studied different kinds of computer training for nursing students.
The results of the study indicated that there was a need for programming skills for
nursing students. The data also showed that nursing educators believed that programming
enables users to be in control of the computer. Other studies have shown that computer
users need a large amount of information about information technology. For example,
Nelson and Hall (1991) studied the educational needs of computer users. The findings of
the study reported that among six different areas of knowledge and skills, users had little
knowledge in the areas of "general information.knowledge", "organisational knowledge"
80
and information related skills". The user also required more skills about data access, use
of software packages and general information about computerised systems. However, to
understand the relationships between different levels of learning and organisational
outcomes required more study (Stein and Vandenbosch, 1996).
Computer training programs should be arranged, based on the user's task needs. Suitable
training programs should help users achieve maximum proficiency (Harrington et al.,
1990; Abbott, 1993). In addition, Omar (1991) reported that those respondents who had
some computer knowledge needed more education about the concepts of information
systems.
The growing number of possible applications of the computer means that the user's role
is becoming increasing important. Thus, all organisations should design training
programs for increasing computer knowledge and the skills of their users (Igbaria et al.,
1995a). In a different study, Igbaria (1993) suggested that organisations should establish
training programs for their users to learn to work with computers.
Computer training programs for any computerised system would facilitate the
advancement of the user from novice to expert status. Improving training programs for
users is an important issue. System designers should incorporate training courses based
on users' needs (Lee et al., 1995). Since the need of computer programs is different for
novices and experts, the design of the training course should be matched to individual
differences (Bostrom et al., 1990). In this regard, training programs for inexperienced
users should be given a higher priority (Igbaria, 1990). By providing appropriate
computer training for experienced users as well as new users, computer knowledge and
skills will be generally improved. In this regard, trainers also should provide positive
attitudes for users toward computer courses (Abbott, 1993). Moreover, trainers should
know the task domain knowledge of users and their relevance experience for designing
training programs (Mackay and Lamb. Jr, 1991). Appropriately designed computer
training can increase users' knowledge about computers and this enhances users' skills
and systems usage (Igbaria et al., 1996). For effective training programs, the designer
81

should provide an opportunity for users to be convinced that computers will improve their
work function. Mackay and Lamb, Jr (1991) suggested furthermore, that computer
training should be based on the user's current computer knowledge and skills. Godfrey
(1995) confirmed that the design of the educational approach according to the learner's
educational resources was important. The researcher maintains that users' participation in
the course design will increase their responsibilities for further learning and teaching.
Implementation of new information systems also required knowledge and skills of users
(Garland, 1986; Henderson et al., 1995a). Therefore, computer training for new users is
as important and useful as for experienced users.
In order to determine the needs of computer users and to help educators in providing
computer training, an assessment of the levels of knowledge and skills is important.
Patrikas (1995), from the result of the study on computer literacy in health information
management programs, pointed out that the continuing assessment of computer literacy
can help curriculum planning. The author concluded that greater amounts of knowledge
and skills of users, will provide a better professional climate. Furthermore, assessment
of the knowledge and skills helps increase the quality of the training course which is an
important factor in the training process. The assessment also allows trainers to design
programs based on the users' knowledge and abilities to meet the expected level that is
required in their tasks (Cuplan, 1995).
In addition, the study of Cheney et al. (1990) on knowledge, skills and the abilities of the
information system personnel, indicated that information system managers believed that
their knowledge, skills and abilities should continue to increase.
If computer training is insufficient, the full advantages and benefits of the system cannot
be realised. Brown (1984) from the study found that the staff in hospitals believed that
their training was not adequate to solve their problems regarding the computerised
system. Nord and Nord (1994), in their recent study, argued that while 75 percent of all
the respondents received computer training by their company, 37 percent of them thought
that their computer training was insufficient. The result of other studies indicated that the
82
computer education received was not sufficient for task improvement (Ng Tye et al.,
1995). In another survey, the respondents reported that poor computer training provided
only a minimum amount of attention for training and educating of the users about the
access of information, value of a database in the organisation, and computer technology
(Howard and Weinroth, 1987). Therefore, insufficient computer training causes a lack of
system usage.
Computer training courses should be of a high quality because these can increase user
satisfaction (Martin et al., 1994). On the other hand, users' perception of the inadequacy
of computer training can cause lower levels of satisfaction. Regarding the method of
training, Coe (1996) argues that hands-on training is clearly more effective than straight
lecture based instruction. However, access to computers cannot grantee the learning of
computers (Gardner et al., 1993b).
Studies have shown that computer training is crucial for the manager's tasks. McDonald
and Siegall (1996) emphasised the importance of managers' training and reported that
trained managers increased their computer system usage and their confidence and success
also improved. Regarding the computer training of managers, Yasin and Quigley (1995)
argued that the training and education of managers can help to implement appropriate
information systems successfully and will in future eliminate their fears about computers.
In a different survey, Lieberg (1995) argues that trained managers can achieve their goals
through their association with system usage.
Users need support to use computerised information systems and the best support is
guidance and training (Bentley, 1995). Conducting user computer training is an important
responsibility of organisations (Garland, 1986). Thus, organisations need to give high
priority to the training programs of their users. Appropriate training and education about
computerised information technology will reduce task problems and could facilitate the
achievement of users to use computerised systems. Computer training should be
accessible and voluntary for users, consequently, the demand for training levels and the
interest should be high. In respect to computer training and its benefits, Compeau and
83
Higgins (1995a) argued that organisations should review computer training as an
important factor because it can increase self-efficacy of users.
The role of managers for providing computer training and supporting users is very
important. Cuplan (1995) maintains that computerised information systems require
knowledgeable computer users and managers should support users' training efforts
specially for the slow learner (Waldrop, 1987). Lee et al. (1995) studied computer
training of managers and staff. The subjects expressed the opinion that the critical factor
for the successful implementation of users' education and training programs was top
management support. The results also revealed that the training process had some
problems when the managers did not give their support.
From the above studies, it is apparent that information systems users must have a good
understanding of systems. An appropriate computer training program can emphasise how
an information systems should be used, and how it helps to complete tasks quickly and
accurately. Moreover, computer training programs can reduce users' problems and costs
to organisations (Guimaraes and Igbaria, 1996). Therefore, based on the finding of the
studies, organisations should spend more time and money on increasing user knowledge
and skills. Not all users need identical training, some need more computer knowledge,
while others need more skills, regarding information systems. Moreover, user support
staff should always be available to help every one to become confident in using
information systems.
In spite of the emphases of the studies and research into computer training, Nabali (1991)
reported that only a small number of hospital personnel had computer training. The
researcher concluded that more effort needs to be focused on training programs. It seems
that the role of management support is an important factor for a successful training
process and for understanding information technology. Thus, organisations need to give
high priority to training programs for their users. Yaverbaum and Nosek (1992) in their
study, concluded that users' computer training programs require more research.
84

4.2 .5 .1 Computer Attitude and Computer Training
Computer training is necessary to assist users in developing a positive perception of their
ability to use systems and foster positive attitudes about computers. Training is an
important factor that can change users' perceptions toward computers (Joshi, 1991). In
this regard, Igbaria (1990), from a study on effectiveness of user computing, agreed that
users' attitudes toward computers was significantly affected by their computer training
and computer training provided users with favourable attitudes. Users with computer
training had more favourable attitudes toward computers and they tended to learn how to
use computer system easily, but users with negative attitudes, had difficulties in the
learning process. Therefore, providing opportunities to train computer users would be
useful for improving their computer attitude.
Computer training also increases the knowledge and skills of users, consequently, it can
provide positive attitude for users. Studies have shown that there is a positive relationship
between users' computer knowledge and their attitudes toward computers (Dumdell et
al., 1987). Rapko and Adaskin (1993) in their study, concluded that nurses with some
knowledge about computers had positive attitudes toward them. In addition, Massoud
(1991) from the study on computer attitudes and computer knowledge, found that
computer knowledge was significantly related to the attitudes and confidence of users
toward computers. Users' computer knowledge also can affect their attitude toward
computers. Siguardsson (1991) found that users' computer attitude was correlated most
significantly with their knowledge about computer languages, programming and word
processing. Moreover, providing training opportunities for users to receive training about
computer systems is useful for improving their work-related attitudes.
In a parallel perspective, Igbaria (1990) concluded that unfavourable and negative
attitudes towards computers can be reduced by carefully designed training which should
be according to the users' level of knowledge and work activities. On the other hand,
Jayasuriya et al. (1994) in their study found that computer training of nurses did not
change their computer attitudes.
85
Computer training also can affect system usage so lack of improper or system usage may
be provided by inadequate training strategy (Henderson and Deane, 1996). The authors
reported that users felt they had not enough training for using the system.
4.2 .6 Management Support
The level of user computing activity, in most organisations, continues to grow, and
clearly an investment of a budget for proper support for computer users is required. The
literature review related to MIS, shows that effective support of users can affect their
system usage. Bentley (1995) argues that people need support from others for improving
their performance. Support from the managers of the information system is the best way
to assist them to be successful in their tasks. Senn (1990) argues that computer users will
be successful if they are managed and supported. Users in organisations need support
from management to use information systems. The importance of management support
and its effect on management information systems has been emphasised by many studies
(Lucas, 1978; Lucas, 1981; Davis et al. (1989); Igbaria and Chakrabarti, 1990; Igbaria
1990; Saarina and Saaksjarvi, 1992; Igbaria, 1992; Igbaria, 1993; Culpan, 1995;
Guimaraes and Igbaria, 1996).
Regarding the effect of management support on users, Guimaraes and Igbaria (1996) in
their study, argue that users' collaboration can be ensured by 1) management and control
through support, 2) information system/ information centre control from a corporate
perspective and 3) support of information centre (IC)/information system (IS) personnel
action within other departments.
Igbaria (1990); Igbaria and Chakrabarti (1990); Igbaria (1993) noted that management
support consists two broad categories.
1) Application development support, which includes: the presence of an information
centre, availability of assistance and instruction and guidance in using computer
applications.
86

2) General support, which includes: encouragement from management, provides
resources and MIS staff support. Therefore, support for the computer user
includes a wide range of services such as; consulting, technical support and
training.
Management support is an important factor that could affect many areas of computers.
Guimaraes and Igbaria (1996) in their study argue that managers of information centres
should consider user support as an important factor. The authors, in relation to user
support, point out that the information centre should be responsible for assisting users
regarding information systems. Moreover, information centres should provide facilities
such as; various standard software packages, developing systems for users, helping users
with their problems, providing appropriate education and training. Information managers
should know the dimensions of performance in their centres and identify the deficient
areas for improvement (Ishman, 1996).
In any organisation, management support can be helpful for providing a useful training
program for users (Culpan, 1995). Guimaraes (1996) reported that the users required a
great deal of support and IC support would give this. The author argues that IC groups
are valuable and can save money for organisations. A lack of this centre and neglect to
provide such a group will be costly. Thus, management systems should support users'
training efforts. Influence of management support on training programs can enhance
computer usage and the acceptance of technology.
IC support also can affect user computer anxiety and studies have shown that there is a
negative relationship between user computer anxiety and management support. In this
regard, Igbaria (1993) studied user acceptance of technology (computers). The result of
the study showed that IC support had both negative direct and indirect effects on
computer anxiety. Consequently, the user with IC support had less computer anxiety than
those without support. The author concluded that the information centre and management
supports are predictors for computer anxiety of users. In another study, it was found that
computer anxiety was significantly reduced by IC support (Igbaria, 1990). Therefore,
87
users with IC support would have less computer anxiety, consequently, their attitude
would be improved.
4 .2.7 User Involvement
User involvement has been considered in recent studies as an important factor that can
assist in the successful development and implementation of computerised systems.
Hartwick and Barki (1994: 444) define it as "user involvement is not a behavioural belief;
rather, it refers to a belief concerning the attributes of an object, the system". User
involvement, therefore, is a subjective psychological concept and refers to the users'
beliefs that a system is both important and personally relevant. In a parallel perspective,
Kappelman (1995a: 65) argues that "user involvement is a need-based motivational
attitude toward information systems and their development". In another study, Ishman
(1996) discusses that involvement of users is a subjective perspective of users about the
importance and personal relevance of a system. By reviewing the definition, it seems that
involvement gives users a sense of contribution and control, feelings of ownership and
better understanding of a computerised system.
Damodaran (1996) argues that managers should support users' involvement because it
leads to positive outcomes from information technology and success. On the other hand,
lack of involvement can provide failure of information systems (Kweku, 1997). The
effect of users' involvement has been studied by many researchers with different
perspectives. For example, Torkzadeh and Doll (1994) describing involvement and its
impact, point out that involvement of the users provided better understanding of the
system and improved their skills for system utilisation. Understanding computers can
help users have a better understanding of the process of designing and developing
information technology. Consequently, it could be useful for users to reduce their
conflicts and problems (Yaverbaum, 1988). Moreover, users' involvement can influence
better acceptance of computerised systems (Saleem, 1996). In a different study, Davis et
al. (1989) emphased the importance of user involvement in acceptance computer
technology.
88
However, involvement should be considered carefully because sometimes personal ideas
are brought to the workplace that can be unnecessary or harmful for the objective of
organisations (Nisenbaum, 1994). On the other hand, if staff understand that their
opinions are not considered they may resist systems differently. Therefore, managing
involvement is an important task of managers.
4.2 .8 Computer Attitude and Involvement
Since some studies used participation as involvement or vice versa, in this section both
concepts of participation and involvement are discussed. Involvement is also an important
factor for providing a positive attitude of users towards computers. A study by Kleintop
et al. (1996) showed that the users' pre-implementation attitude was related to their
participation. Therefore, involvement of users is an important factor for the development
systems that can lead to favourable attitude of users toward computers.
Users' involvement can also affect their satisfaction. In this regard, Mckeen et al. (1994)
studied the relationship between users' participation and their satisfaction. The result of
the study showed that there was a strong relationship between the users' satisfaction and
their involvement in the workplace. In a different study, Zviran (1992) studied users'
satisfaction in hospitals. The result showed that the physicians who used health
information systems had a low degree of satisfaction. Lack of active participation and
involvement of the users in the development of the system were some of their reasons for
dissatisfaction. Furthermore, Olaniran (1996) studied group satisfaction through
computers and face to face meetings. The result showed that participation of members
was a good predictor for their satisfaction. Therefore, involvement and participation for
implementing computerised systems are an important factor that can influence users'
satisfaction.
In addition, involvement of managers in computerised systems can influence their
satisfaction. Swanson (1974) studied their involvement in management information
systems. The result indicated that the involved managers were appreciated for their
89

involvement in the system, while the uninvolved managers were unappreciated. Further
research in manager involvement by Saarinen and Saaksjarvi (1992), from the study on
information systems development, reported that managers' involvement in the process of
projects increased their performance. Thus, the performance of managers was enhanced
by their involvement in systems development. Involvement of managers also provided
satisfaction and their satisfaction led to successful performance of the information system
in the organisation. Jarvenpaa and Ives (1991) studied chief executive officer (CEO)
involvement in management information technology. The result of the study showed that
CEO involvement was strongly associated with the use of information technology.
As a result of involvement, users may be committed to continue using a computerised
system as part of their daily work. It can been seen that the users' involvement improves
their system usage. A study by Kleintop et al. (1996) showed that the sense of
participation of employees was strongly related to actual use of the new system. In a
parallel perspective, Baroudi et al. (1986) studied users' involvement, system usage and
their satisfaction. The result of this study showed that the users' involvement was
correlated positively with both system usage and users' satisfaction. However, a study by
Nickerson (1981) showed that involvement of the users did not guarantee system usage.
When considering the process of successful implementation of systems, Swanson (1974)
argues that there are serious problems in implementing information systems. For
providing successful implementation and development of computerised information
systems, the users' involvement is an important variable. Studies of McDoniel et al.
(1993); Bubshait (1994); Kappelman and Guynes (1995) reported that factors such as;
users' involvement affected the development of the information systems. In relation to the
importance of the involvement of users, Alavi (1986) argues that one of the important
factors in failure of information systems is lack of users' involvement and participation in
systems design. By providing user involvement in computerised systems, success and
improvement of systems would be possible (Ishman, 1996). Barki and Hartwick (1994)
in their study reported that users' involvement was important in understanding
90

information system implementation. Users' involvement also fosters a sense of
ownership among users and this is a necessary condition for successful development of
information systems (Kim and Michelman, 1990). Users' involvement also ensures that
the final product allows users to meet their overall goals and provides appropriate
situations for users (Nisenbaum, 1994). Therefore, successful development and
information system usage could be achieved by users' involvement.
For the best results for involvement, users should have an effective role, because efficient
involvement can improve the quality of task output (Bubshait, 1994), and lead to users'
satisfaction (Amoako-Gyampah, and White, 1993). Another important point that should
be considered, is the level of users' involvement. A study by Joshi (1990) on users'
satisfaction and their involvement indicated that the level of users' involvement played an
important role in their satisfaction. Therefore, for improved user satisfaction and system
usage, involvement of users should be considered as a crucial factor in implementing
computerised systems. Users' involvement helps them to understand, accept and use
information systems and managers should contribute to use computerised information
systems as well as users.
The results of the above studies confirm that users should be fully informed about the
process of developing information systems and their involvement is an important factor
that can improve computerised system usage. Despite a heavy emphasis on user
involvement, users are given a relatively passive role during development (Beath and
Orlikowski, 1994). By reviewing the literature in MIS, it seems that users' involvement
is an important issue in management information system that should be considered. Thus,
study concerning user involvement should be considered in future research (Davis,
1993).
91

4.2 .9 Computer Attitude and Computer Usage
Intention to use technology can be defined as a behavioural intention. Fishbein and Ajzen
(1975: 12) state that "behavioural intention can be measured by a procedure which places
the subjects along a subjective-probability dimension involving a relation between himself
and some action". Ajzen and Fishbein (1980: 41) maintain that "intention is the immediate
determinant of behaviour".
The use of computer technology has developed rapidly in recent years and the use of
computers in organisations is widespread. Organisations use computers in different ways
for different purposes. The use of an information system is a way to measure
effectiveness and success of computerised systems (Hamilton and Chervany, 1981a). It
is important to determine the level of use and factors that affect use or disuse of
information systems.
The relationship between attitude and behaviour gives useful information regarding
users' behaviour based on their attitude. Attitude is the evaluation of a set of beliefs
(Schewe, 1976), and it is important to understanding the link between attitude and
behaviour. Determining the strength of an attitude and behaviour can help to predict
certain behaviour from measuring attitudes. Thus, information technology usage may be
successful or unsuccessful due to psychological reactions and consequently, the
behaviour of users. Studies have also shown the positive relationship between users'
attitudes and system usage. For example, Igbaria (1990); Igbaria (1992) from the results
of their studies found that there was a positive relationship between users' attitude and
system usage. System usage was affected by users' attitudes. Moreover, Miller and
Varma (1994) reported that computer usage at home was a significant factor in
determining users' attitudes. The study demonstrated that sufficient opportunity to use
computers provided positive attitudes. In a parallel perspective, Brock and Sulsky (1994)
reported that users' beliefs and attitudes to computers are useful tools for predicting
computer usage. Thus, computer training leads to system usage when users have
favourable attitudes toward computers. Study of Zoltan-Ford (1984) showed that users,
92

who had learned how to use computers, had more positive attitudes than those who had
not.
Positive attitudes can also enhance technology's adoption and the recent study of Thong
and Yap (1995) showed that a positive attitude of managers increased the adoption of
information technology and system usage. In a different study, Hebert (1994) studied the
impact of technology on the personnel in hospitals. The result of the study demonstrated
that three dimensions of attitude (compatibility, relative advantage, and results
demonstrability) were the strongest predictors for the technology usage. Therefore,
attitudes towards information systems can determine system usage (Pare and Elam,
1995).
In another survey, Robey (1979) studied users' attitudes and use of information systems.
The result indicated that there was a strong relationship between the users' attitudes and
the actual use of computerised systems. The researcher argued that this does not mean
that attitude always affects system usage, however, use of the system was a variable for
attitude formation. A recent study of Compeau and Higgins (1995b) showed a similar
result, that attitude had positive and direct effect on system usage. In a different survey,
Igbaria et al. (1996) from a study on microcomputer usage, reported that if users believe
that systems usage can enhance their performance they will consequently, have positive
attitudes and positive attitude leads to effective computer usage. Igbaria (1993) in the
same perspective, also reported that the users' attitude affected system usage through the
behavioural intention, so positive attitudes enhanced effective system usage.
Conversely, Burton et al. (1992) reported that behavioural intention was as a mediating
variable between attitude and system usage. Thus, attitude affected actual usage through
behavioural intention. Another study showed that users' pre-implementation attitude was
not directly related to the actual use (Kleintop et al., 1996). The authors, in their study,
noted that pre-implementation attitude affected system usage indirectly through practice
and training. Although in different researches, Thompson et al. (1991) found that there
was no relationship between the users' attitude and the computer system utilisation. The
93
author argued that this could be due to the research model that had a direct link between
attitude toward system use, not thorough intention to use.
Other studies reported no relationship between computer attitude and computer usage
(Cheney and Dickson (1982); and computer attitude and intention to use computers
(Taylor and Todd, 1995a).
Schewe (1976) also tested the behavioural model that relates to attitude and use of
systems and attempted to predict the system usage. The researcher found that there was
no significant relationship between the users' attitudes and system usage. It could be said
that system usage is not, therefore, affected by users' attitudes. Alexander and Siegel
(1984) studied computer attitudes among health personnel. It showed similar results.
There was no relationship between users' attitudes in respect to computerised systems
and their performance. Thus, the relationships between user attitudes and use of
information systems has not been established (Szajna, 1993) and more study is
necessary. It can be stated, however, that various factors in different situations can
influence system usage.
However, a study of Srinivasan (1985) about measuring system effectiveness showed
that users who spend more time each session with the system tended to see that their
system was not of high quality compared to that identified by users who spend a shorter
time with the system. In this study the relationships between the users' perspective and
their behaviour showed that these two factors were not always positively related to each
other. The researcher explained that because the systems were not used on a production
basis.
System usage can also be used differently based on the task characteristics. Igbaria
(1992) in his study on task characteristics and computer system usage, reported that task
characteristics included two separate components: task complexity and structure. The
author reported that business non-managers and managers used computers for complex
decisions and task, while task structure promoted use of wide variety of software. The
94

results also showed a negative correlation between the task complexity and computer
usage, so complex tasks cause a reduction of system usage. Therefore, the system usage
can be influenced by the characteristics of task.
Home computer use is one of the factors that can affect system usage at work. A study
conducted by Igbaria (1992) showed that users with home computers had more
opportunity to use their computers for more hours voluntarily than those who did not use
home computers at work. Recent study of Henderson and Deane (1996) reported that
users that spent more time to use computers had greater amount of computer use at work.
Home computers also increased the users' computer usage. In a parallel perspective,
Kirkman (1993) reported that the users who had a computer at home had more time to use
a computer and were more confident in using them. Furthermore, the users in the study
considered themselves better equipped and more useful than the non-owner.
4.2.10 Computer Usage and Satisfaction
Users' satisfaction is an issue that has been discussed in recent years because it is one of
the factors that can determine effectiveness and success of MIS. Two measurements
commonly used for determining information systems success are systems usage (Szajna,
1993) and users' satisfaction (Hamilton and Chervany, 1981b). To evaluate success or
failure of computerised information systems, criteria such as; system usage and users'
satisfaction are required. How information systems are used is an indicator for the
evaluation of information and it cannot be effectively utilised unless the users are satisfied
(Joshi, 1990). Baroudi et al. (1986: 233) argue that user information satisfaction can
affect their system usage.
Satisfaction of individuals can provide better performance in organisations. There are
different opinions regarding users' satisfaction. Rue and Byars (1980) explained three
views for the relationship between satisfaction and system usage. The first view of
satisfaction is that "satisfaction" causes performance and the second view is that
"satisfaction" can affect the performance. Another view considers that both satisfaction
95

and performance are the function of rewards. Consequently, users' satisfaction makes the
work situation more pleasant for better performance and also it provides a suitable work
situation for other users to increase productivity. Thus, insufficient users' satisfaction
may cause problems in organisation production (Davis et al., 1992).
Quality of information systems also should be considered in organisations because this
factor can affect users' satisfaction. Many information systems have incomplete or
insufficient output and this affects users' satisfaction. If a computerised information
system has a low degree of user satisfaction, users cannot be persuaded to use it. Studies
have shown that system usage and users' satisfaction are related to each other (Lucas,
1978), and there is a significant relationship between users' satisfaction and utilisation of
systems (Igbaria and Nachman, 1990; Igbaria, 1992). Consequently, users would be
satisfied when they use computer information systems (Brown, 1984), and their
satisfaction would enhance system usage (Baroudi et al., 1986). Igbaria et al. (1994) in
their study on computer usage found that satisfaction had direct effect on users to accept
or reject computers.
Users' satisfaction using voluntary or compulsory systems are different. Use of a
computer system is an appropriate indicator of success of a voluntary system (Ives et al.,
1983). In voluntary situations high levels of system usage means that users perceive
some degree of benefits from the systems and their satisfaction is an appropriate
measurement for an information systems' success in voluntary situations. When system
usage is compulsory, a measure of user satisfaction is more important than in voluntary
situations (Lucas, 1978), because by determining the level of users' satisfaction, and
consequently, enhancing the level of satisfaction, better out-comes for users and
organisations would be provided. Hebert (1994) in her study about compulsory use of
technology argues that users should recognise that technology usage is an individual
choice. On the other hand, lack of control can provide problems for prediction of the
actual use of technology. In addition, the researcher reported that the respondents used
the technology based on the polices of the organisation.
96

By reviewing the literature regarding MIS, it seems that users' satisfaction is an important
variable in effectiveness of computerised information systems that should be considered.
Lalomia and Sidowski (1990) argued that user satisfaction assessment is important
because the information can indicate individual or group preferences or their problems in
their task.
4.2.11 Computer Anxiety
The growth of end-users computing has raised concerns about how individuals react to
computers in their life and the workplace. Many individuals have little difficulty in using
computers, however, a large number of users have difficulties in regard to computer
systems and this may cause psychological problems such as; computer anxiety.
Computer anxiety is a widely occurring phenomenon among users, whose job
performance and success may depend on their interaction with computers. Causes of
computer anxiety differ and Igbaria and Nachman (1990) in their study reported that
computer anxiety was negatively related to the information systems products, the users'
low level of knowledge and degree of involvement. When users had insufficient
computer skills and knowledge or low level of involvement in the system, they would
have a high level of anxiety. Rapko and Adaskin (1993) from their study, reported that all
nurses had some level of stress when they were working with computers. The degree of
stress was related to their computer literacy and users with a high level of literacy had
lower level of stress connected with computer usage. Thus, measuring anxiety regarding
the use of computer systems, determining the cause of anxiety can be possible.
In a different study regarding the effect of computer anxiety, Igbaria (1990); Igbaria
(1993), mentioned that the computer anxiety of users negatively affected their
satisfaction. The findings of the studies also demonstrated that reduction of computer
anxiety was associated with increasing favourable attitudes toward computers. In respect
to computer anxiety and the behaviour of users, the above author reported that the
negative attitude of the users was exhibited by behaviours such as; avoiding contact with
97
computers and minimising the amount of time used operating them. The study of Igbaria
et al. (1994) showed that users' satisfaction mediated the effect of computer anxiety.
Thus, users with satisfaction had less anxiety toward computers.
Computer anxiety can also affect management levels of users. In a parallel perspective,
computer anxiety and its effect on attitude of managers were studied by Howard and
Smith (1986). The result of the study showed that the managers who had negative
computers' attitude reported higher level of computer anxiety and computer anxiety was
increased by negative attitude of the users toward computers. Computer anxiety also can
affect males and females differently, and Igbaria (1990) from his study, reported that
gender had direct effect on computer anxiety and the female users expressed more
computer anxiety than male users.
Computer anxiety and its influence on system usage have been studied by many
researchers. For example, Igbaria and Parasuraman (1989); Igbaria (1990); Compeau and
Higgins (1995b), from the results of their studies, reported that the computer anxiety of
the users affected the systems' utilisation and users with high level of anxiety used the
computer system less than others. In a different study, Mawhinney and Sarawat (1991)
studied students' performance and computer anxiety. The results revealed that computer
anxiety negatively affected the students' computer performance; less computer anxiety
caused more system usage. Moreover, Igbaria (1993) in another study, found that
computer anxiety had a negative and indirect effect on the users' acceptance of computers.
The result showed that computer anxiety was a factor that affected computer usage
through behavioural intention. Computer anxiety had also a strong, negative direct and
indirect effect on behavioural intention. By acceptance of the systems usage, users'
computer anxiety can be reduced. Thus, computer anxiety is a factor for predicting
computer usage (Pare and Elam, 1995) and users with a high level of anxiety, will use
computerised systems less than others who do not suffer from computer anxiety.
Therefore, if computer anxiety is reduced, attitudes and consequently, the use of
computers will be improved.
98
The literature and studies for MIS outlined different ways to overcome computer anxiety.
For example, Torkzadeh and Angulo (1992), in their study, reported that computer
training is a mechanism for reducing the impact of stress due to computers. For those
persons who have fears about using computers, training courses would be helpful
(Gardner et al., 1989). In a parallel perspective, Massoud (1991), from the study on
computer knowledge of users and computer anxiety found that lack of computer
knowledge was positively significant with high level of user anxiety. On the other hand,
users with a high level of computer knowledge had a low level of computer anxiety.
Igbaria and Parasuraman (1989) in study on managers computer attitude and anxiety
reported that computer training reduced anxiety toward using computers. Thus, the level
of the user's education and knowledge about computers were positively related to their
computer anxiety. Therefore, by increasing users' computer knowledge and skills, their
computer anxiety will be reduced. In another study, Howard and Smith (1986) reported
that users' level of computer education was one of the factors that reduced their computer
anxiety. In addition, Marcoulides and Bo Wong (1990); Pare and Elam (1995) in their
studies reported that the computer anxiety of students was reduced by their computer
training and education. Computer training of students enhanced their achievement and
utilisation from the systems. Therefore, arranging opportunities to gain computer
knowledge is a way that can help users alleviating anxiety. In a different study, Ngin et
al. (1993), studying the computer usage of nurses, concluded that providing
opportunities for nurses to increase their computers skills and knowledge, will reduce the
level of anxiety in their workplace. Moreover, Igbaria and Chakrabarti (1990); Igbaria
(1993) from their studies on computer anxiety found similar results, that is, computer
training programs decreased computer anxiety because the training course increased the
users' knowledge. Since many computer users expressed mixed feelings, including
anxiety, fear and apprehension about computers, training would give users the ability to
control their fears. Consequently, their levels of anxiety, stress and fear due to work with
computers, will be reduced.
99

Computer-friendly systems and ease of use is another method for alleviating computer
anxiety. Therefore, system developers and designers who have control over the quality of
the systems should have a clear understanding of users' requirements and users' needs.
In addition, support of management systems is a factor that can reduce computer anxiety.
The study of Igbaria and Chakrabarti (1990) showed that management support positively
affected users' attitude toward computers and negatively influenced their computer
anxiety. Therefore, if users become more comfortable with computers in their
environment, the need for assessing and providing programs for computer anxiety should
be reduced. In contrast, high level of computer anxiety requires precise measuring for
alleviating computer anxiety (Lalomia and Sidowski, 1993).
100

4.3 Part 2
4.3 .1 Computer Experience and Age
Studies have shown that there is relationship between computer experience and users'
age. Dyck and Smither (1994) reported that older users had less computer experience than
younger users. Moreover, the result of the study revealed that there was a negative
relationship between computer experience and age of the user. Thus, younger users had
more computer experience than older users. Findings of a recent study (Czaja and Sharit,
1993) indicated that computer experience and the user's age were two important
predictors for the user's performance. The data clearly showed that the age of the user
had an impact on response time and the older user's responses was slower. Since the
user's age is an important factor for system usage, more research is needed to give more
detailed information.
4.3 .2 Computer Experience and Gender
There are many studies that have investigated the relationship between gender and
computer experience. For example, Sancho et al. (1993) in their study, reported that
males had more computer experience than females, and that this was not related to age,
task, or computer courses under-taken. However, a study by Dambrot et al. (1988)
reported that women did not differ significantly from men, in computer experience.
The relationship between gender and computer knowledge was studied by Dambrot et al.
(1985). The result of this study showed that males had more computer knowledge and
had taken more computer courses than females. In a parallel perspective, other studies
also reported that the females had less computer experience and less computer knowledge
than males (Durndell et al, 1987; Heinssen et al., 1987; Vasil et al., 1987; Badagliacco,
1990). Gender is also a factor that can affect users' perspectives toward computers. Hall
and Cooper (1991) in their study, pointed out that females with computer experience
101

reported that a computer is a tool for working but males expressed the opinion that they
have an intimate behaviour towards computers.
The home computer is used differently by males and females. For example, Kirkman
(1993) from the results of the study found that males spent more time with their
computers at home than did females. The researcher concluded that home computers
affected male computer experience more than females. Using computers at home also
influenced males and females in different ways. A recent survey conducted by Colley et
al. (1994), showed that the length of experience with home computers increased the
confidence of the males toward computers. Therefore, the confidence of users can be
enhanced by using home computers.
It seems that gender is a predictor for determining computer experience. There are many
studies that explain how to increase computer experience for females. For example,
Yelland (1995) discusses the need for providing early and positive experience with
computers for females. This can be helpful for them to perceive themselves as effective
computer users.
On the other hand, some studies reported that there is no difference between the level of
computer experience of males and females. For example, Dambrot et al. (1988) reported
that the females did not differ significantly from the males in computer experience. In
addition, Taylor and Mounfield (1994: 304) argued that "females with prior computing
experience competed equally with males in computer courses in college". Further research
into this area would give more information that could help organisations provide better
guidelines for using computerised systems.
102
4.3.3 Computer Experience and Computer Training
Computer experience will be increased by computer training courses. The study of Mellar
and Jackson (1994) revealed that users' experience about information technology rapidly
increased after computer training courses. Howard and Smith (1986) in their study,
concluded that increasing computer experience would be possible by providing computer
training. In addition, providing a situation to gain computer experience would be useful
for improving users' attitudes towards computers (Igbaria and Chakrabarti, 1990;
Kirkman, 1993; Henderson et al., 1995a). In a different study, Zoltan-Ford (1984)
concluded that by providing computer training for users, the number of professionals
with positive computer attitudes and computer experience would be increased.
Furthermore, users' confidence in their ability is an important factor that can be improved
by computer training. Users need experience to gain confidence and the best way is by
training and practising the new technology (McDonald and Siegall, 1996). Thus, by
educating computer users they can gain computer experience, favourable computer
attitude and a high rate of confidence in using computers. Consequently, computer
anxiety can be reduced (Henderson et al., 1995a).
Dover and Boblin (1991) studied the computer experience of nurses. The result of the
study indicated that there was a difference between the subject's actual computer
experience and the preferred computer experience. Their computer experience and
expectations were different. Assessment of the level of computer experience is necessary
for providing an appropriate training course for users (Born and Cummings, 1994).
Rivard and Huff (1988) agreed that knowing the level of the user's computer experience
can assist and direct managers to select proper tools for teaching users according to the
level of the user's computer experience.
103

4.3.4 Computer Experience and Computer Learning
Bantock (1967) argued that the learning process can form a person's experience and
computer users with computer learning can improve their computer experience.
Moreover, computer experience can provide real conditions for users to learn about
computing (Richards and Pelley, 1994). In other words, computer learning provides
computer experience for users. Studies have shown that previous computer experience
can increase the ability of users to learn more about computers. For example, Ertmer et al.
(1994) found that students with computer experience tended to learn more about
computers than other students with little or no computer experience. Furthermore, users'
computer training programs can help them to gain new experiences. Kagan and Pietron
(1987) reported that the previous computer experience of students helped them to learn
and use the new software. The results of the study also showed that knowledge of the
students, gained through using computers and their direct experience with computers,
was effective in learning new computer skills. In addition, Ayers et al. (1988) reported
that computer experience assisted students with new learning experiences.
In addition, Taylor and Mounfield (1994) state that previous computing experience was
an important factor in the success of students in college programs. The result also showed
that computer experience affected the speed and quality of learning. Novices needed more
time, were less successful, and were less efficient in solving their problems about
computers than expert users.
Users can be effective if they understand information systems (Bentley, 1995) and
computer experience can provide a situation for users to understand the systems
documents. In this regard, Holt et al. (1989) argued that the participants in the study with
a high level of computer experience believed that they learned more from the documents
and understood them better than the inexperienced users. The expert users also believed
that word processing with a computer was easier and clearer than other methods. In
addition, the level of computer experience affected the perception of learning from the
documentation and its evaluation. Users required less time to read the documents,
104
respond and solved problems. In the results it was reported that users' computer
experience affected understanding of the program and the ease of using it. Consequently,
by increasing the level of computer experience, users had fewer difficulties in using
computers. The results also indicated that the level of experience affected the ease of
remembering information in the documentation. Therefore, computer experience can
influence the computer ability of users to improve their understanding.
4.3 .5 Computer Experience and Computer Attitude
Previous computer experience is an essential variable in human-computer interactions and
individuals with low or high levels of computer experience interact with computers
differently. There are many studies about computer experience and its effects on users.
For example, Ertmer et al. (1994) reported that computer experience can directly affect the
attitude of users. More computer experience leads to more positive computer attitudes.
Igbaria (1993) studied user acceptance of computers. The results of the study showed that
computer experience had both direct and indirect positive effects on users' attitudes.
Thus, computer experience provided favourable attitudes for users. In a parallel
perspective, results of other studies showed that there was a positive relationship between
the users' computer experience and their attitudes towards computers, so computer
experience enhanced positive attitudes of users towards computers (Robinson-Staveley
and Cooper, 1990; Igbaria and Chakrabarti, 1990; Igbaria, 1992; Dambrot et al., 1985).
A study conducted by Igbaria (1990), showed that the computer attitude of users was
significantly affected by computer experience and computer experience enhanced
favourable computer attitude of the users. Caputi et al. (1995) studied the computer
attitude of nursing students and nursing staff. The result of the study revealed that
nursing students had more positive attitudes toward computers than the staff. The authors
concluded that this may be due to greater computer experience of the students than the
nurses. The result also showed that positive computer attitude of professional nurses was
associated with their degree of computer experience. Thus, the finding showed the
computer experience importance for predicting computer attitude of users. In addition,
105
Dumdell et al. (1987); Williams et al. (1993); Colly et al. (1994); Dyck and Smither
(1994) from their studies, reported that there was a positive correlation between attitudes
to computing and computer experience. In a different survey, users with computer
experience reported more positive attitudes toward computers than inexperienced users
(Williams et al., 1993). In a parallel perspective, Jay and Willis (1992) studied the
influence of computer experience on user attitude. The result indicated that direct
computer experience was an effective factor on computer attitude. Thus, computer
experience was dependant on users' attitudes (Kim and Peterson, 1994).
In addition, other studies have shown that there is a consistent relationship between
computer experience, computer knowledge and attitudes toward computers (Dumdell et
al., 1987; Ertmer et al., 1994; Abdul-Gader and Kozar (1995). Ertmer et al. (1994)
studied classroom computer experience. The results showed that the users' computer
experience was positively related to their attitudes toward computers. The students who
had more knowledge and experience with computerised technology such as; word
processing and electronic-mail/e-mail tended to have more favourable attitudes toward
computers. The computer attitude of nurses toward computerisation was studied by
Scarpa et al. (1992). The result indicated that nurses who had previous computer
experience had more favourable attitudes toward computers than those who reported no
previous computer experience. Jayasuriya et al. (1994) studied nurses' attitude toward
computers and reported that there was a positive relationship between users' computer
experience and their attitudes toward computers.
Computer users often have different perspective towards computers. In this regard,
Zoltan-Ford (1984) studied professionals' attitudes towards computers. The
professionals in the study included: lawyers, physicians, pharmacists and accountants.
The results showed that the computer attitude of the inexperienced professional was
different from the experienced professionals. The experienced professionals agreed that
work with computers is easy and would be helpful in their work and that computer
language is simple to understand. On the other hand, inexperienced persons point out that
106
computers are complicated and costly. Users with a high degree of computer experience
had more positive perspectives to computers than low-experience users.
Providing opportunities for users to gain more computer experience can improve their
favourable attitudes toward computers. Culpan (1995) argues that attitude toward
information systems can be formed by past computer experience. Other studies have
shown that the users' previous direct computer experiences produced a stable computer
attitude (Regan and Fazio, 1977). Manstead et al. (1983) from the results of this study,
found that the behaviour of subjects was affected by their direct computer experience and
the weight of the attitudinal components was larger than the normative components. The
authors discussed that direct computer experience provided more stable attitudes than
attitude based on indirect experience. Direct computer experience by the users enhanced
the weight of the attitudinal components in predicting the behaviour. The relationship of
psychological factors and attitudes was studied by Miller and Varma (1994). The analysis
of data showed that past computer experience and computer usage were factors that
predicted computer attitudes. In addition, the work of Fazio et al. (1983) has shown that
direct computer experience influenced users' computer attitudes and consequently,
increased the attitude-behavioural correlation. Songer-Nocks (1976) reported that the
direct experience enhanced the weight of the attitudinal components in predicting the
behavioural intention. Therefore, computer experience can create positive attitudes
(Lucas, 1978) and subsequently positive computer attitudes can promote system usage.
Igbaria (1993) from the result of his study, concluded that positive computer experience
might help users to increase their effort to use computers effectively.
Shashaani (1994) from the study reported that there was a stronger association between
computer attitudes and computer experience of the males than the females. Thus, gender
can determine the link between attitudes toward computers and computer experience.
Robinson-Staveley and Cooper (1990) studied the effects of gender on the levels of
computer experience. The result showed that the women, with little computer experience,
in the presence of others, expressed more negative attitudes toward computers than when
107

they were alone. Therefore, the study showed that novices expressed more negative
attitudes toward computers than the experts, especially when they work with others.
However, a study by Koslowsky et al. (1990) indicates that previous computer
experience cannot determine the user's computer attitudes. Moreover, Henderson et al.
(1995a) reported that nurses with computer experience had negative attitudes toward
them. In addition, another study showed that users who spend less time in front of the
display terminals had a positive attitude (Bradley, 1989). Therefore, users with computer
experience spend less time with computers and had positive attitudes toward computers.
4.3 .6 Computer Experience and Confidence
Studies have shown that people need job experience and confidence. For example,
Bentley (1995) argues that users' performance can be determined by some factors such
as; their experience and confidence. There is also a positive relationship between
computer experience and the user's confidence. In this regard, Ertmer et al. (1994)
reported that subjects with more computer experience were more confident working with
computers. Dyck and Smither (1994) in their study, reported that subjects with less
computer experience had less computer confidence. Levels of confidence, due to
computer experience, can vary according to gender. For example, Krendl et al. (1989)
reported that girls had less confidence in their computer skills even when they had the
same level of computer experience as boys. Therefore, confidence may be one factor that
could be formed through computer experience.
Moreover, Fazio and Zanna (1978) point out that attitude, which was formed on the basis
of direct experience, was more confident than attitudes formed via indirect experience.
The increased confidence was due to having more information about the object and a
strong attitude toward the object. Therefore, individuals with direct experience would
have favourable attitudes and high confidence rates that are consistent with their
behaviour. Direct experience also can provide a consistent relationship between
confidence and attitude which can provide a better prediction of behaviour and system
108

usage. Direct experience leads to greater attitude-behaviour consistency (Fazio and
Zanna, 1978), but conversely, Robertson et al. (1995) reported that there was no
relationship between previous use of computers and users' confidence.
4.3 .7 Computer Experience and Satisfaction
The user s satisfaction could be affected by the user's experience and studies have shown
that user satisfaction was directly affected by computer experience (Igbaria, 1990). In two
other studies, the results showed that there was a positive and significant relationship
between computer experience and the overall users' satisfaction (Igbaria and Nachman,
1990; Rivard and Huff, 1988). Ray and Minch (1990) in their study indicated that those
who were alienated from computers had less computer experience and the level of
students' satisfaction had a positive relationship with their computer experience.
However, a study of Remenyi and Money (1991) about user satisfaction showed that
previous personal computer (PC) and PC network experience did not impact significantly
on the overall satisfaction of the users. In a different survey, Burkes (1991) states that the
length of computer experience of the nurses was negatively related to their satisfaction.
4.3 .8 Computer Experience and Computer Anxiety
Computer anxiety is a crucial factor for users whose job performance and success
depends on their interaction with computers. Experience with computers can influence
users' computer anxiety. Level of computer experience affects users' computer anxiety
differently. Dyck and Smither (1994) studied the effect of computer experience on users
computer anxiety. The findings indicated that those subjects with the higher level of
computer experience had less computer anxiety. In other words, the computer anxiety of
the users was reduced by their computer experience so the computer experience had a
negative relationship with computer anxiety. The study conducted by Igbaria (1993) also
showed that computer experience had strong direct and indirect effects on computer
anxiety and users with computer experience had less computer anxiety than novice users.
In a different survey, Igbaria (1990) mentioned that computer anxiety of the users was
109
significantly affected by computer experience and computer anxiety was reduced by the
user's computer experience. Another study showed that there was a negative correlation
between the user's computer anxiety and their computer experience and that users with
computer experience expressed less computer anxiety (Heinssen et al., 1987). Moreover,
Ngin et al. (1993) from the result of this study, reported that the computer expert nurses
had less anxiety in their work than novice users. In a different study, a high level of
anxiety was reported by subjects who had less computer experience (Glass and Knight,
1988). By increasing the computer experience of users, their computer anxiety decreased.
The researchers concluded that the high computer anxiety experienced by the subjects
resulted in a long time to complete their task. Therefore, improving users' computer
experience and skills can reduce psychological distress, and subsequently productivity
will be increased.
Studies about home computers have also shown that the subjects with greater computer
experience at home had lower level of anxiety (Colly et al., 1994; Mcinemey et al.,
1994). Moreover, Igbaria (1993) in his study points out that computer experience is one
of the best predictor for determining computer anxiety of users. Thus, measuring
computer experience can predict user computer anxiety, subsequently predicting usage
would be possible.
The level of computer anxiety of users are different in voluntary and compulsory use of
computer systems. Compulsory use of computers is required by the policies of an
organisation and this may cause more anxiety than voluntary use of computers.
Mcinerney et al. (1994) reported that the anxiety of the subjects in relation to computer
usage may be a function of prior computer experiences (engaged voluntary or
compulsory).
Computer anxiety can affect males and females differently. A study by Colly et al. (1994)
showed that males with computer experience had less computer anxiety than females.
Robinson-Staveley and Cooper (1990) reported that females with little computer
experience, in the presence of others, had higher anxiety than the women who worked
110

alone. Therefore, novices experienced computer anxiety especially when they worked
with others.
However, Ballance and Ballance (1993) in their study, reported that subjects with low,
moderate and high computer experience had the same unpleasant reaction. In another
study, however, computer experience of the users caused higher computer anxiety
(Henderson et al., 1995b). The researcher concluded that the relationship between
computer experience and computer anxiety is not a simple one. It seems that research in
this area will reveal more information about reducing computer anxiety of users.
4.3 .9 Computer Experience and Self-Efficacy
The amount of experience is a significant factor in an individual's self-efficacy beliefs.
Bandura (1977) separated expectation into two parts: self-efficiency and outcomes
expectancy. Self-efficacy refers to an individual's beliefs about skills and ability to
perform a specific task. In another words, self-efficacy refers to perceived capabilities for
attainment of specific goals or tasks (Kanfer, 1994). Outcomes expectancy refers to the
belief that an individual's task accomplishment will lead to desired intrinsic and extrinsic
rewards. Bandura (1977) argues that performance accomplishment is the most reliable
source of efficacy information for two reasons: 1) it is based on direct and personal
experience 2) mastery is often attributed to one's own skills. The author also reported
that direct experience increased the sense of efficacy, decreased anxiety and provided
behavioural change.
Previous studies have shown that computer experience has a significant and positive
effect on self-efficacy. Henry and Stone (1995) studied computer experience, computer
self-efficacy and outcomes expectancy. The result of the data showed that previous
computer experience had a significant and positive influence on users' sense of computer
self-efficacy and outcome expectancy. In addition, the result of Ertmer et al.’s (1994)
research revealed that subjects familiar with word processing and e-mail technology felt
more self-efficacy than the other subjects without or less computer experience. Compeau
111

and Higgins (1995a) studied the impact of self-efficacy on users' performance. The result
of the study indicated that individuals who accepted themselves as capable of using some
software, achieved higher performance levels than those who had not this perception.
Therefore, users' perceptions of their ability in using computerised systems, helps them
to improve their abilities. As a result of the study on occupational differences in computer
use, Henderson et al. (1995a) reported that clerical staff in hospitals with prior computer
experience had high self-efficacy. The researchers also argued that self-efficacy would be
a significant predictor of determining computer anxiety.
Self-efficacy has been identified as a significant determinant of performance with
computers. In a parallel perspective, Hill et al. (1987) from their study on self-efficacy,
previous experience and behavioural intentions, reported that efficacy beliefs make a
significant contribution to the prediction of behavioural intentions. They also
demonstrated that prior computer experience per se does not uniquely affect the
behavioural intentions. The computer experience, through changes in perceived efficacy,
leads to a higher technology acceptance. If experience with computers provides positive
feedback to an individual, then it can increase self-efficacy beliefs. Through the changes
in perceived self-efficacy, behaviour, intention and actions can be altered (Hill et al.,
1987).
Self-efficacy also can affect other area of users such as; attitude and anxiety. Study of
Compeau and Higgins (1995b) showed that users with high level of self-efficacy had
more favourable attitude, less anxiety and used computer systems more than others.
As can be seen from the findings of the previous literature on computers and self
efficacy, computer experience could provide self-efficacy in users with respect to
computers. However, Henderson et al. (1995a) reported that nurses with computer
experience had low self-efficacy.
112
4.3.10 Computer Experience and Intention to Use
Computers
Intention to use technology can be defined as a behaviour intention. Ajzen and Fishbein
(1980) argue that the strength of attitude-behaviour relationship is moderated by some
variables such as; direct experience. Direct experience may produce stable intention and a
strong intention-behaviour relation. An intention that is formed without direct experience
may change greatly when a person is actually faced with the behaviour. In contrast, a
person who has interacted with the behaviour of the target can develop more realistic and
stable behaviour intention and the best way to predict behaviour is measuring behavioural
intention (Triandis, 1977). Nederhof (1989) argues that there is positive correlation
between direct experience and behavioural intention. Furthermore, Songer-Nockers
(1976) reported that direct experience can provide prediction of intention through attitude.
Igbaria (1993) from his study found that the users' computer experience had strong direct
and indirect effects on the behavioural intentions.
However, Hill et al. (1987) reported that initial experience for users is often frustrating
and not likely to strengthen the beliefs that computers can be controlled. The authors
argued that previous experience with computers did not directly contribute to the
prediction of behavioural intentions. Ajzen and Fishbein (1980) also discussed that direct
experience does not always influence the stability of intentions and intention-behaviour
relations. Davis et al. (1989) studied user acceptance of computer technology. The results
of the study showed that users with limited experience with the system, would not
develop well formed and stable intention to use computers.
4.3.11 Computer Experience and Computer Usage
It is important to note that computer usage is a key factor and without it no meaningful
results can be obtained. System experience would increase system acceptance (Abdul-
Gader, 1996), so the use of computerised systems requires expert users to understand
and use them. Lai (1994) from his study on success factors on computer use, reported
113
that computer experience increased successful computer usage and reduced the operating
issues. Moreover, Igbaria (1990), reported about users' computing, that system usage
was strongly affected by the users' computer experience and users with high levels of
computer experience used computers more than inexperienced users. In a parallel
perspective, Igbaria et al. (1989); Igbaria (1992); Igbaria et al. (1995a) reported from
their studies that computer experience is strongly and positively related to the amount of
use of computers. Thus, the greater experience with computers, the more use of
computers. Furthermore, computer experience had direct and indirect effect on the users'
acceptance of computers and system usage (Igbaria, 1993). In a different study, results
showed that inexperienced users limited their computer usage and they used computers
less than the experts (Robinson-Staveley and Cooper, 1990). Study of Rivard and Huff
(1988) also reported that computer experience affected the users' perception of the
friendliness of the software tools and this factor enhanced their job performance. Other
studies have also shown that users with previous computer experience and skills used
computers effectively. Thus, computer experience had a significant correlation with
computer usage (Clayton and Pulver, 1993; Zoltan-Ford, 1984; Lees, 1987; Mellar and
Jackson, 1994; Igbaria et al., 1996). Providing the means to gain computer experience
would be useful for increasing computer usage (Kirkman, 1993; Henderson et al.,
1995a).
Regan and Fazio (1977); Fazio and Zanna (1978) in their studies demonstrated that
previous direct experience provided consistency between a person's attitude and their
behaviour. It seems that experience and consequently, computer experience, can predict
computer system usage. Another study that was conducted by Lee (1986) showed that
computer experience significantly affected the performance of users on the computer test
and the persons with different computer experience performed differently. Lazonder and
Van der Meij (1993) reported that expert users performed better in their tasks than those
with little or no computer experience. The study of Kleintop et al. (1996) also showed
that previous experience of the user with the system was positively and strongly related to
actual use of the system. Characteristics of the information system are important for
114
system usage. Bentley (1995) argues that if information systems are reliable, adaptable
and current, expert users are willing to use them.
Koslowsky et al. (1990), however, indicated that computer experience was correlated
negatively with intention to use and use of computers. Since intention to use and system
usage is an important fact in MIS literature, more detailed study in this area will give more
information about the barriers of using of computer information systems.
115
4.4 Part 3 Critical Review of Instruments
4.4.1 Instruments for Measuring Computer Training
Researchers in MIS used different questions to measure the level of computer training for
their studies. For example, Yaverbaum (1988) measured computer training according to
the courses of programming, introduction to information systems or data processing. The
instrument is only used here measuring the level of computer training.
In another study, Schiffman et al. (1992) measured users' computer training by the
number of classes that the respondents had completed, the training materials (computer
aided instruction and software documentation) and the number of material sources that
they used. The instrument was used to assess the quantity of computer training but did
not measure the quality and other dimensions of computer training.
Igbaria (1990) asked their respondents to indicate the amount of computer training they
received from college or university courses, hardware or software vendors, consultants,
company training programs or tutorials. In addition, Igbaria et al. (1989); Igbaria and
Chakrabarti (1990); Igbaria (1992); Igbaria, (1993); Igbaria et al. (1995a); Vandenbosch
and Higgins (1995); Igbaria et al. (1996) measured computer training by asking their
subjects whether they had computer training in any of the following sources; college
courses, vendor training, in-house training, and self-training. The items are a 5-point
Likert type scale. These items can determine only the type of training so other dimensions
of computer training are not included.
Mawhinney and Lederer (1990) measured users computer training by asking 4 questions.
The researcher designed the items that cover two dimensions of computer training,
quantity and quality of computer training.
The dimension of training is an important factor and the review of literature shows that
computer training instruments were measured differently based on the purpose of the
study.
116
4.4.2 Instruments for Measuring Computer Experience
There are many studies in which researchers used different criteria, items or questions,
different numbers of question or items, to identify the computer experience of users. In
this section some instruments that have been used in these studies are discussed.
Abdul-Gader (1996) measured computer experience of their users by one item. The item
measured the level of users' computer experience and the level of typing skills.
Harrington et al. (1990) also measured computer experience by one item scale. The
subjects were asked to describe which of six statements most closely applied to them.
Examples of the choices were 1)1 have no experience in using a computer 2) I have
used a computer printout produced by someone else.
In another study, Yaverbaum (1988); Jayasuriya et al. (1994) measured their subjects
computer experience by asking one question such as ; 'In your work experience, have
you used a computer?' Furthermore, Scarpa et al. (1992) measured computer experience
of their subjects by asking one dichotomous question regarding their previous computer
experience. In a further study, Morrow et al. (1986) measured computer experience by
one item, developed by Raub (1981), with six statements which most closely summarised
their level of computer experience.
In a qualitative study, Hall and Cooper (1991) measured the computer experience
differently. The subjects in the study wrote an essay about their computer experience and
their feelings and action about computer experience.
The number of years of computer experience was the measurement used for determining
users computer experience by many researchers. For instance, Badagliacco (1990);
Yaverbaum and Nosek (1992); Hudiburg et al. (1993); Czaja and Sharit (1993); Kim and
Peterson (1994); Miller and Varma (1994); Ryker and Nath (1995), measured the
computer experience of their subjects by the number of years of computer experience. In
another study, Montazemi et al. (1996) measured the computer experience of their users
by the number of years of computer experience and the level of computer literacy.
117
Howard and Smith (1986) also measured the computer experience of their subjects by the
length and depth of the respondent's computer experience. Robinson-Staveley and
Cooper (1990) measured the computer experience of their subjects by a series of
questions regarding computer use and the hours of use of computers.
Home computers and the use of computers is another factor that was considered for
determining computer experience of users. For instance, Yelland (1995) measured the
computer experience of their subjects by some dichotomous questions regarding their
level in using computers, ownership of a home computer and playing computer games.
Computer-related courses, variety and experience in software are factors in the majority
of studies used for determining computer experience of users. For instance, Bratton and
Newsted (1995) measured computer experience by years of computer experience, variety
of software that they used and the number of courses that they had completed. Moreover,
Ertmer et al. (1994) measured the computer experience of their subjects by some
questions such as; Do you own a computer? Have you ever operated a computer? Have
you ever used computer-based instruction? In another study, Dambrot et al. (1985)
measured computer experience of participants by previous computer-related courses and
whether they were familiar with a computer language.
Henry and Stone (1995) measured the computer experience of their participants using
four questions on the years of experience, the amount of time spent with computers, and
computer training completed. In another study, Sancho et al. (1993) measured computer
experience of their subjects by the numbers of times they used computers for games, e
mail, spreadsheet, etc.
Some of the researchers asked questions about the level of computer experience to
measure computer experience in their study. For example, Lazonder and Van Der Meij
(1993) measured the subject's computer experience on three levels, novice, beginner and
intermediate. Moreover, Ballance and Ballance (1993) measured the computer experience
of the subjects by their response to the question about computer experience that described
118

it as 'none', 'a little', 'some', 'a lot'. In another study, Meller and Jackson (1994)
measured computer experience by levels of using of information technology as high,
moderate, none. Furthermore, Ngin et al. (1993) measured computer experience by their
subjects' response to varying levels of skill such as; novice; intermediate; or expert. In
another study, Holt et al. (1989) measured the computer experience of users by level of
users experience such as; low; medium; and high. Bom and Cummings (1994) measured
computer experience of users by measuring different level of their skills in the software
that they use. Harp et al. (1997) measured computer experience of the subjects by the
number and types of software packages that they had used including wordprocessing,
database, graphics, and spreadsheets. Users equal to or below the group median were
classified as 'less experienced' and those above the median were classified as 'more
experienced'.
Levels of user's participation and using computer programs are other variables have been
used to assess computer experience. Szajna and Mackay (1995) measured computer
experience using 4 items. For example, 1) the subject's level of participation in
computer-related activities 2) the extent to which the subject has used certain types of
computer programs. Another factor that has been considered in studies is computer
experience in school and college. Taylor and Mounfield (1994) measured the type of
computer experience of the subjects by their previous computer experience at school,
college, work or by home computer ownership.
Colley et al. (1994) in their study examined the subjects' computer experience by asking
which computer courses they had attended before coming to university. The authors also
measured home computer experience by questions such as; the length of time that the
subjects had access to it: the use of computers: their experience with playing computer
games, and who else used a computer in their home.
Igbaria et al. (1989); Igbaria and Chakrabarti (1990); Igbaria (1990); Igbaria (1992);
Igbaria (1993); Igbaria (1994); Igbaria and Iivari (1995); Igbaria et al. (1995a) measured
computer experience by asking respondents to indicate the extent of their experience in
119

using 5 different generic types of computer software, and computer languages and in the
developing computer information systems. The response options ranged from (1) none to
(4) extensive. Lee (1986) in his study measured the computer experience of subjects by 5
items associated with computer courses, playing with computers, and the number of
items of documentation that they typed using a computer. An example of these questions
is, 'How many computer course have you completed?'.
Shashaani (1994) measured the computer experience of subjects by 7 questions
associated with the number of computer classes that they had attended, access to a home
computer, the amount of computer usage, and the activities for which they like to use
computers.
In another study, computer experience was measured by the frequency of pre-university
use, home use for university related work, home use for games, university course related
work, use in employment, and completion of computer related university subjects before
practice (Downers, 1993).
Some researchers examined the computer experience of their users by some dichotomous
questions. For example, Koslowsky (1990) measured the previous computer experience
of their subjects by the 10 dichotomous questions that Sherman et al. (1982) used in their
study. The questions were connected with working and playing with computers. For
example, 'Do you play computer games'? This instrument also was used by Henderson et
al. (1995a); Henderson et al. (1995b).
In another study, Williams et al. (1993) measured the computer experience of their
subjects by 12 questions regarding their previous experience with computers. Dumdell et
al. (1987) measured the computer experience of their subjects by 19 items which covered
computing at home, school, college and at work.
Glass and Knight (1988) measured computer experience by a Computer Experience
Questionnaire (CEQ) that had been developed by Heinssen et al. (1987). The CEQ is a
checklist of 27 possible experiences a person may have with computers or word
120
processor. Dyck and Smith (1994) used a modified version of this questionnaire. This
consisted of 14 statements such as; 'I have played a computer game'.
Computer experience was also measured by 30-items that were developed by Poplin,
Drew, and Gable (1984). The items assess previous computer knowledge or experience
(Kagan and Pietron, 1987).
To measure computer experience, a Qualitative Computer Experience Questionnaire
(QCEQ) was developed by Leach and Caputi (1995). This instrument contains three
sections. Section A: measures the amount of computer experience and the average number
of years in relation to the use of applications. Section B: determines the quality of
computer experience. Section C: identifies how individuals solve their computer
problems. This scale is more precise and more complete than those discussed above. This
multi-dimensional experience scale can provide a wide range of computer experience
information from respondents. However, the authors did not mention validity and
reliability of the scale.
MIS studies have used different criteria using different numbers of questions to measure
computer experience. Some studies measured computer experience by only one or two
questions. Questions in these studies cannot give detailed information concerning
computer experience of users, because other dimensions related to experience were not
considered.
The majority of studies measured the subject's computer experience by the number of
years of computer experience. This item cannot provide detailed information about the
quality of computer experience. In some instances, a person with only a few years
computer experience may have achieved a high quality experience and vice versa. The
number of years can influence computer experience but it is not the only factor.
Some of the studies measured experience of playing computer games. These scales could
not give any information about computer experience at work. Computer experience at
work is different from experience with computer games. It is possible to be an expert
121

with computer games but a computer novice in a work situation because computerised
games cannot provide the same experience as a work situation. In addition, this type of
question gives general information about computer experience rather than specific
experience in relation to work situations.
Access to computers is another type of question that was used for determining the
computer experience of the user. Some persons always have access to computers but this
does not mean that they have computer experience. However, access to computers may
influence the user's computer experience.
Many scales measured computer experience by the levels of different applications used.
These instruments give specific information about user's experience regarding different
applications for different situations. These scales are useful for organisations that use
specific applications but not to measure computer experience in general.
Computer usage and frequency of use were used for measuring computer experience of
users in some studies. The purpose of the computer experience scale is to assess the
user's computer experience rather than their computer usage. It may be that access to
computers is difficult or system usage is voluntary, therefore, these questions, per se,
cannot give details of computer experience.
Some scales used the availability of home computers as a criterion to measure computer
experience but access to a home computer cannot give information about computer
experience at work. However, home computer can affect users' experience with
computers.
Computer courses were also used for measuring computer experience. They can influence
computer experience but this factor can be limited because the majority of users learn
about computer by self-training.
Some instruments determined the computer experience of user by their self-assessment as
a novice or an expert. These scales give limited information about a subject's computer
122
experience and also self-reporting is different from an actual situation. Moreover, using
dichotomous questions for determining computer experience of users cannot give detailed
information about users' computer experience.
It can be seen that experience is an important issue for using computer information
systems but the lack of a valid and reliable scale to evaluate the computer experience is
evident. In order to foster high quality research and to increase the understanding of
users' experience, development of a reliable and valid instrument for measuring a user's
computer experience is becoming increasingly important to researchers and is a critical
research priority.
4.4.3 Instruments for Measuring Management Support
Management support for using computers is an important factor in any organisation, thus,
its assessment should be carefully designed. Schiffman et al. (1992) measured
management support in their study by asking the participants to indicate their agreement
or disagreement using (5-point Likert scale) with items such as; 'My manager encourages
me to use computers'. The scale was reliable.
In a different survey, Thompson et al. (1991) measured organisational support as
facilitating conditions (technical support). The researchers used four questions that were
used in a previous study (Amoroso, 1986). This scale was a five-point Likert-type scale,
ranging from strongly disagree to strongly agree. The respondents were asked to indicate
the extent to which assistance was available in terms of equipment selection, hardware
difficulties, software difficulties and specialised instruction. The internal consistency
reliability of the scale was 0.86. In a recent study, this scale was used by Compeau and
Higgins (1995b) with six items. The researchers added two questions; the extent to which
their co-workers were a source of assistance in overcoming difficulties and their
perception of the organisation's overall support for computer users. The internal
consistency reliability of the scale was 0.91.
123

In another study, Henry and Stone (1995) measured management support using 5 items
that focused on management encouragement, training to use the system and any aid in
using the system provided by the management. The scale showed internal consistency
reliability of 0.87.
Igbaria (1990) developed a scale for measuring management support and organisational
support. This measurement contains two broad categories of support: 1) the presence of
an information centre and the availability of development assistance, 2) general support
(management support) which includes: top management encouragement, allocation of
resources, and MIS staff support. The scale contains eight items, four items for
measuring specific support (information centre support) and four items for measuring
general support (management support). This valid and reliable scale is a 5-point Likert-
type scale and was used by Igbaria and Chakrabarti (1990); Igbaria (1992); Igbaria
(1993); Igbaria, (1994); Igbaria et al. (1995a); Igbaria and Iivari (1995); Igbaria et al.
(1996).
Review of MIS literature shows there are few valid and reliable scales that are applicable
for measuring management support. The instrument that was developed by Igbaria (1990)
and used in many studies is a valid and reliable scale.
4.4 .4 Instruments for Measuring User Involvement
Several researchers determined user involvement using different indications for
measurement. Hawk (1993) developed a 4-item scale for measuring user involvement.
The items were 1) determining the input requirements of the system, 2) determining the
content of system output 3) defining the functions to be performed by the system and 4)
designing the layout of computer generated reports and/ or visual display screens. This
scale was used by other researchers such as; Hawk and Aldage (1990); Amoako-
Gyampah and White (1993).
Doll and Torkzadeh (1990) developed an 8-item 5-point Likert scale to measure user
involvement. The authors argued that the instrument appears to have acceptable reliability
124

and criterion validity. Torkzadeh and Doll (1994) used the above scale and reported the
high Cronbach's alpha criterion validity for the scale. However, the researchers stated
that test-retest stability of the instrument was not assessed.
In another study, Swanson (1974) measured previous involvement of managers. The
instrument contains 10 items to test an 'Activity Respect Information System' 'ARIS'
using such questions as; 'How frequently (on the average) do you complete an Activity
Reporting Card for yourself?' This instrument measured users' prior involvement.
Another instrument was developed by Zaichowsky (1985) with 20 items. The instrument
was used to operationalise both process involvement and user system involvement. A 20
bipolar adjective scale with 7 points was used in the scale. This scale was used by
Kappelman (1995b). Hartwick and Barki (1994) used this as a valid and reliable
instrument with 9 items. Factor analyses revealed two factors as involvement dimensions;
importance and personal relevance. The factor analysis provides evidence for the
construct validity (factorial and convergent/discriminate).
In another study, Baroudi et al. (1986) developed 30 items for measuring prior user
involvement. The example is; have you (or your subordinates developed the cost
justification for a new information system? 1) No 2) Sometimes 3) Usually 4) Don't
know.
The above instrument used by Hartwick and Barki, (1994) is valid, reliable and
applicable for the health area.
4 .4 .5 . Instruments for Measuring Computer Attitude
There are numerous instruments for measuring computer attitude that have different
contents, subscale, numbers, degree of validity and reliability. Selection of a particular
one depends on the purpose of the study and what areas of computer attitudes are of
interest to the researcher. For instance, Gardner et al. (1993a) compared three computer
attitude measures; Attitude Towards Computers (ATC) was developed by Raub (1981),
125
Computer Attitude Scale (CAS) was developed by Loyd and Gressard (1984), Computer
and Blomberg-Lowery Computer Attitude Task (BECAT) was developed by Eriskson
(1987). These three instruments measure computer attitude and other factors that are
related to attitudes. ATC includes two dimensions of the 'autonomous entity' and
'beneficial tool' (Brock and Sulsky, 1994). CAS with 30 items is composed three
subscales: 'computer liking', 'computer confidence' and 'computer anxiety'. BELCAT
has a subscale for 'computer as a male domain', 'Liking computer', 'computer anxiety',
'attitude toward success with computers' and 'computer as useful'. Other instruments
contain subscales such as; 'computer confidence', 'computer appreciation' and 'impact of
computers on society'. Moreover, Gardner et al. (1993a) argue that three measures were
equal in validity and reliability and measured attitudes that focused more on anxiety.
Thus, these instruments are more useful for studies that measure general attitude,
especially variables that are related to computer anxiety. Lalomia and Sidowski (1991) in
this regard, discussed that CAS has been used extensively to examines computer attitude
on college students populations.
Zoltan and Chapanis (1982) developed an attitude questionnaire to measure the
acceptability of computers by professionals (lawyers, medical doctors and pharmacists).
No reliability and validity measures were reported. Lalomia and Sidowski (1991) argued
that this scale indicated six components that some of them are not important components
of computer attitudes. Gamble (1988) measured computer attitude of the subjects by
Zoltan and Chapanis's instrument.
Moreover, Mathieson (1991) measured computer attitude in their study by 3-items. In
another study, Koslowsky et al. (1990) measured computer attitude based on the
previous study (Peace and Easterby, 1973 and Morrison, 1983). In another study,
Thompson et al. (1991) measured computer attitude by three items such as; 1) PCs made
work more interesting 2) working with PCs was fun and 3) PCs were all right for some
jobs but not the kind of job wanted. This scale was a five-point Likert-type scale from
strongly disagree to strongly agree.
126

Hartwick and Barki (1994) measured the computer attitude of the subjects using 4-items
that were developed by the authors. The reliability of the scale was 0.99. Kleintop et al.
(1996) in their study, measured computer attitudes of users by a set of 4 items that was
developed for the study to measure attitudes toward new information technology. This
instrument consists of two positive and two negative items toward the e-mail system.
Cronbach's alpha of the instrument was 0.89. Davis et al. (1989) measured computer
attitude with 4 items. The reliabilities of 0.85 and 0.82 at time 1 and 2 was obtained. In
addition, Dumdell et al.'s (1987) in their study measured computer attitude of the subjects
by 5 items using a 5-point Likert scale for each item. In recent study of Compeau and
Higgins (1995b), computer attitude was measured by five items, drawn from the
Computer Attitude Scale (CAS) that was developed by Loyd and Gressard (1984).
Response was given on a five-point Likert-type scale that ranged from agree to disagree.
Example of such items are 'I like working with computers' and 'Once I get working with
computers, I find it hard to stop'.
Igbaria (1993); Igbaria (1994) measured computer attitude of users based on the work of
Ajzen and Fishbein (1980). The authors used a 6-item semantic scale to determine how
they felt about using microcomputers. In the first study, reliability of the scale was 0.80
and in the second study ranged between 0.80 to 0.88. Later, Igbaria and Nachman (1990)
for measuring attitudes toward end-user computing used the items from a previous study
(Goodhue, 1986) with appropriate modifications. The subjects were asked to indicate the
extent of agreement or disagreement with 6 items concerning end-user computing (EUC).
The computer attitudes of the users was measured by Schiffman et al. (1992) with a 8-
item Likert scale that was developed by Sanders (1983). The internal consistency
reliability of the scale was 0.82.
Another scale of attitudes was developed by Reece and Gable (1982). The 10-item scale
measures three attitude components: 'cognitive', 'affective', and 'behavioural'. The scale
is reliable for high school populations.
127

Igbaria and Chakrabarti (1990) for measuring computer attitude used a 10 item 5-point
Likert-type questionnaire. The items included: 'cognitive', 'affective' and 'behavioural
elements'. The internal consistency reliability of the scale was 0.80. This scale also was
used by Igbaria (1990); Igbaria (1992). Moreover, Henderson et al. (1995a); Henderson
et al. (1995b) measured the subject's computer attitude using a Computer Attitudes Scale
(CAS) that was developed by Loyd and Gressard (1984). This scale contains 10 items of
a 5-point Likert type scale with three subscales, 'computer anxiety', 'computer
confidence' and 'computer liking'. Intercorrerlation among the three subscales in the first
study was typically 0.67 to 0.84 and for the second study the coefficient was 0.91. This
scale was used by Heinssen et al. (1987) and Francis (1994) in their studies. Schewe
(1976) measured attitudes of their subjects using 10 items about decision making, job
productivity etc.
In addition, Culpan (1995) measured attitudes of end-user toward information systems by
12 items that were developed by the author. The items measured computer attitude and
computer usage. The reliability of the instrument for questions regarding user attitude was
0.89. In another study, Murphy et al. (1994) measured their subjects' computer attitudes
by 12 positive items that measured general attitudes toward patient care by information
systems. The internal consistency was 0.92.
Computer attitude in Taylor and Todd's (1995b) study, was measured by 16 questions
that cover three areas such as; 'perceived usefulness', 'compatibility' and 'ease of use'.
The reliability of the scale was above 0.70. In a different study, Ellsworth and Bowman
(1982) developed an instruments to measure beliefs about computers. The scale contains
17 items displayed in a 5-point format. The reliability of the scale was measured.
However, validation studies were nor conducted.
Ertmer et al. (1994) measured computer attitudes of the subjects by 19 Likert scale from
Computer Technologies Survey (CTS) that was developed by Kinzie and Delcourt
(1992). The internal consistency reliability of the scale was 0.91.
128
A 20-item Likert-type scale instrument was developed by Stronge and Brodt (1985). This
questionnaire measures nurses' attitudes towards job security, legal ramifications, quality
of patient care, capabilities of the computer, employees willingness to use computers and
computer benefits to the institution. The instruments were used by many researchers for
assessing the attitude of nurses toward computerisation (Scarpa et al., 1992; Burkes,
1991). In another study, Brown et al. (1991) used an Attitude Toward Computer Usage
Scale (ATCUS) that was developed by Popovich et al. (1987) with 20 items. This
instrument had internal consistency equal to 0.84. In addition, Dambrot et al. (1985)
measured the attitude of their subjects by a Computer Attitude Scale (CATT) that
consisted of 20 items, 9 positive and 11 negative items. This was a 5-point Likert scale
and the internal consistency (Coefficient alpha) was 0.79. In another study, Dambrot et
al. (1988) used the same scale in their study and the Coefficient alpha was 0.81. Williams
and Ogletree (1993) in their study, used a 20-item Computer Attitude Scale that was
developed by Dambrot et al. (1985). Omar (1991) measured computer attitude of the
users by a Computer Attitude Scale (CAS) that was tested and validated by Nickell and
Pinto (1986). CAS consists of 20 five-point Likert scale (eight expressing positive
computer attitudes and 12 items expressing negative attitudes). In a different study,
Igbaria and Parasuraman (1989) developed a 20-item scale for measuring computer
attitude. The items include: cognitive, affective, and behavioural elements. Individual
asked to indicate the extend of agreement or disagreement with a series of statements
about microcomputers. The internal consistency reliability of the scale was 0.91. Another
instrument for measuring General Attitude toward Computers (ACG) was developed by
Kjeruliff and Counte (1984). The ACG contains 20 bipolar semantic differentiate rating
scales. The scale is reliable but validity is not evaluated.
Jayasuriya et al. (1994) developed a Nurse's Computer Attitudes Inventory (NCATT)
with 22 items. A later study of Jayasuriya and Caputi (1996) showed that the NCATT
contains three factors; 1) patient care 2) computer anxiety 3) patient confidentiality. The
NCATT was measured for concurrent validity. The result of the study showed a high
129
correlation with the total score and evidence of concurrent validity. This reliable and valid
instrument could be useful for measuring computer attitude of users in health areas.
Collis (1985) developed a scale to measure attitudes of high school students toward
computers with 24 items. The scale appears reliable, but reliability was not examined.
Hebert (1994) in her study used the Moore and Benbasat (1991) questionnaire as a valid
and reliable instrument. Minor alterations were made for it to be related for a hospital
study. The questionnaire with 25 items Likert scale focused on factors that influence the
use of the information system and its intent was to find a relationship between attitudes
and behaviours of users. Attitude toward information technology was composed of
beliefs about: image, compatibility, ease of use, result demonstrability and computer
avoidance. Understanding the relationship between attitude and usage of technology is
important and finding reasons to use or misuse the technology could give guidance to
provide a better understanding for information system implementation.
In another study, Robertson et al. (1995) used 30 items with subscales such as; computer
anxiety, computer confidence, behaviour, enjoyment, computer use, computer
competence and cognitive attitude. Moreover, Shashaani (1994) used a Computer Attitude
Scale with 39 items for measuring computer attitudes of the subjects. This scale contains
four subscales: 1) computer interest; 2) computer confidence; 3) computer stereotype,
and 4) perceived computer utility. The alpha coefficient reliability indicated high internal
consistency between subscale from 0.68-0.91. Furthermore, computer attitudes of users
in the study of Jones and Clarke (1994) was measured by 40 items that composed of 15
items assessing the cognitive component, and 15 items for assessing the affective
component, and 10 items assessing the behavioural component. The Cronbach's alpha of
this five-point Likert scale was 0.95.
Robey (1979) used a reliable measure of user attitudes that was developed by Schultz and
Slevin (1975). The questionnaire contained 7 factors; performance, interpersonal,
changes, goals, support/resistance, client/researcher and urgency. It contains 57 items on
130
a 5-point Likert scale. The author discussed whether the three attitudinal factors
(performance, goals and urgency) could be changed in further studies.
In reviewing the above studies and the literature of MIS, it seems that most of the
instruments cited were used for different purposes. Moreover, reliability of the majority
of the instruments was measured but not their validity. Kelley and Chamess (1995)
regarded this as important in their study and argued one that of the problems in
interpreting results of a study is that many scales used have unknown psychometric
properties and have not been formally validated. Interpretation of the results is only
possible if the accuracy can be guaranteed and the instmments are valid and reliable.
4.4 .6 Instruments for Measuring Subjective Norms to Use
Computers
Nederhof (1989) assessed subjective norms by asking Most people who are important to
me on this point think I should do....'. Scoring was from 1 (very unlikely) to 5 (very
likely). In another study, Igbaria (1994); Igbaria et al. (1996) in their study, measured
social pressure (subjective norms) that were operationalised according to Ajzen and
Fishbein (1980). The statement includes: 'Most people who are important to me in my job
think I should be using the microcomputer regularly in my job'. The subject answered to
this statement by 7-point Likert type scale.
Taylor and Todd (1995b) assessed subjective norms with 2 items such as; 'people who
influence my behaviour would think that I should use Computing Resource Centre
(CRC)'. The researcher emphasises the influence of peer (friends and classmate) on
users. Moreover, Koslowsky et al. (1990) measured subjective norms by 2 reference
points: friends and parents. Such as; 'My friend (or parents) think it is important for me
to work in my computer courses'. Moreover, Brinberg (1979) measured the subjective
norms by asking the subjects what significant others think he/she should or should not do
with respect to the particular behaviour. In a different study, Davis et al. (1989) measured
131
subjective norms with 2 items. The reliabilities of 0.84 and 0.90 at time 1 and 2 was
obtained.
In a different study, Mathieson (1991) measured the subjective norms with 3 items. The
respondents answered to items such as; 'Those people who are important to me would
(Strongly support/Strongly oppose) my using'.
Another measurement of subjective norms or normative beliefs was used by Holm and
Hulin (1981). The researchers asked their respondents to indicate the 4 groups that
influenced them such as; family, friends. In another study, Pare and Elam (1995)
developed a valid and reliable scale based on previous studies. The researchers measured
social norms of their subjects in university by 4 questions. The researchers emphasised
the head of department and college administration. An example of the items is: 'The head
of my department has been very supportive of PC use'. Schifter and Ajzen (1985) also
measured subjective norms by averaging responses to 4 scales. In each case, respondents
indicated on a 7-point Likert scale. 'Most people who are important to me...' (the scale
ranged from 'should' to 'should not'). The scale also asked; 'Whether these people
would support such..' (the scale ranged from 'support' to 'oppose').
Thompson et al. (1991) measured social factors/subjective norms by asking 4 questions
such as; 1) the proportion of their co-workers who regularly used a PC 2) the extent to
which senior management of the business unit support PC use 3) the extent to which the
individual's boss supported the use of PCs for their job, and 4) the extent to which the
organisation supported the use of PCs. The researchers used these from a previous study
(Pavri, 1988).
Hartwick and Barki (1994) measured the subjective norms in their study by 6 items on 7-
point scales with end-points of 'should' and 'should not'. The questions were: (i) 'My
a) superiors b) peers c) subordinates think that I should/should not be a heavy user of
the new system' and (ii) 'My a) superiors b) peers c) subordinates think that I
should/should not frequently use the new system'.
132

For measuring subjective norms in hospitals, Hebert (1994) developed an instrument
with 10 items about peers, nursing managers, directors of nursing, professional
associations and union memberships. A score for the subjective norms was calculated by
multiplying the response normative beliefs and the degree of compliance. The instrument
showed its validity and reliability. Examples from this instrument are: 'My co-workers
think that I should use the Point Of Care system in my job' and 'With respect to the
Nursing Unit, I want to do what my co-workers think I should do'.
Some of the above instruments measured subjective norms based on the purpose of the
particular study, however, others measured the subjective norms by the formulation of a
few questions. Moreover, most of these items are used for measuring subjective norms in
business or management areas rather than health areas.
4.4 .7 Instruments for Measuring Intention to Use
Computers
'Intention to use system' was measured in different studies by different questions and
items. For example, Koslowsky et al. (1990) measured the subject's intention by 1 Likert
scale. Moreover, Igbaria (1993) measured behavioural intention with 1 item such as; 'I
intend to begin using microcomputers' on a 5-point Likert scale. In a different study,
Hartwick and Barki (1994) measured 'intention to use' with 2 items. Such as; 1) 'Do
you intend to be a heavy or light user of the new system?' 2) 'I intend to use the new
system'. The subjects were to select the answer from items with 'heavy/light' and
'infrequently/frequently' on 7-point Likert scale. Davis et al. (1989) measured
behavioural intention with 2 items. Cronbach alpha of 0.84 at time 1 and 0.94 at time two
was obtained.
Taylor and Todd (1995b) measured behavioural intention with 3 items. An example is; 'I
intend to use the Computing Resource Centre (CRC) frequently this term'. In another
study, Mathieson (1991) measured 'intend to use' by 3 items. 'I would use' (Strongly
agree/Strongly disagree). For measuring behavioural intent, Hebert (1994) measured 4
133

items for intent to use technology in hospital. Some examples are; 'I intend to use the
Point Of Care' or 'I intend to be a heavy user of the Point Of Care’.
The majority of the above studies measured 'intent to use computers' by a few items that
could not provide detailed information about the intention to use computers. Hebert's
(1994) scale, in comparison with other scales, is more complete and appropriate for
measuring 'intend to use computers' in the health sector.
4.4.8 Conclusion
As a result of reviewing the MIS literature the following instruments were chosen for the
study.
1) a 4-item Likert scale for measuring computer training designed for the present
study.
2) a 12-item Likert scale of Subjective Computer Experience Scale (SCES) that was
developed by the researcher for this study.
3) an 8-item Likert scale for measuring management support that was developed by
Igbaria and Chakrabarti (1990).
4) a 9-bipolar semantic scale with 7 point for measuring involvement that was
developed by Hartwick and Barki (1994).
5) a 20-item Likert scale of Nurse's Computer Attitude Inventory (NCATT) that was
developed by Jayasuriya et al. (1994).
6) a 6-item Likert scale for measuring subjective norms that was developed by
Hebert (1994).
7) a 4-item Likert scale for measuring intent to use computers that was developed by
Hebert (1994).
134
Chapter 5
Development of a Scale for Measuring ComputerExperience
5.1 Introduction
The purpose of this part of the study was to develop a scale for measuring subjective
computer experience and test its reliability and validity. Item construction was undertaken
following a thorough search of the literature, focus groups, interview with computer
experts and users. Following these processes the Subjective Computer Experience Scale
(SCES) was tested for validity and reliability. The first section includes: significance of
developing a scale, definition and measures of computer experience in the literature. In
the latter section, the method of the development of the SCES and testing the
psychometric are explained.
5.2 Significance of a Computer Experience Scale
The proliferation of computer applications available to organisations gives rise to
concerns about staff computer experience to utilise their application effectively. Lack of
computer experience may become a significant barrier to success for the organisation. As
Nickerson (1981) argues, some degree of experience for staff to use a computer system is
necessary and this requires investment of time and energy by both management and staff.
Experience is one of the factors that can affect a person's judgement because it provides
situations for seeing and performing others' ideas and judgement depends on the degree
of meaning and the intensity of experience to the individual (Sprin and Benfer, 1982). In
a parallel perspective, Rakich et al. (1992) argue that experience is one factor that can
influence the judgement of problem solvers. Experience is a crucial and useful factor for
judgement, problem solving, and decision making. Therefore, a high level and a high
quality of experience is required.
135
Since organisations use computers for different purposes, it is important to determine the
factors that affect their use or disuse for information systems. The use of information
technology is a criterion for determining the success and effectiveness of systems
(Szajna, 1993). Computer experience is also a predictor of the success and effectiveness
of computing programs (Tyalor and Mounfield, 1994). Constant exposure to computer
technology can provide opportunities for a user to obtain skills through practice. The lack
of computer skills may become a significant barrier to success for the users and the
effectiveness of the programs. Thus, successful computerised programs are dependent on
the computer experience of the user and his/her ability to use systems.
Moreover, users' experience with information systems is a factor that can facilitate the
further development of computer acceptance (King and Teo, 1994) and the degree of
experience is closely related to the productivity of the organisation (Kim and Peterson,
1994).
Computer experience influences the acceptance of computers (Holt et al., 1989) and as a
consequence, information systems will increase in number and complexity. Computer
experience also provides a sense of control over the computer (Hall and Cooper, 1991)
and this can also influence the user's ability to work with the systems software. Hartwick
and Barki (1994) state that computer experience is one of the factors that can influence a
user's involvement in computerised systems. Consequently, the greater experience with
the computerised information systems the greater the level of the user's involvement in
systems (Nabali, 1991). In addition, computer experience will increase the user's interest
and willingness in his/her job. Ngin et al. (1993), reported that computer experts had a
higher level of interest in their jobs than novice users. The computer skills and experience
of users can positively increase their work interest and involvement with systems. These
factors, in turn, assist them to be successful in system usage.
By reviewing the related literature, it seems that computer experience is an important
variable in the management of information systems and future study in this area is needed
to provide more insight. Davis (1993) points out that future research should investigate
136
user computer experience as an important variable in the design of information systems.
Measuring computer experience requires a reliable and valid instrument and by
developing such an instrument, measuring this important variable would be possible.
5.3 Concept of Experience
The human body may be thought of as a system which interacts and responds to external
stimuli. Individuals obtain experiences through their senses; eyes; ears; other sensory
channels and from many external sources. The immediate environment influences and
shapes personal experience as does the wider environments of community and work
status. Peele (1983) argues that experience is influenced by genetic, physiological,
psychological, cultural, social and experiential variables. Therefore, individuals are
influenced by many factors such as; stimuli characteristics (intensity, frequency, type) the
environment characteristics (co-operative) and the reaction of individuals according to
their inner qualities. Reichenbach (1976) argues that if other factors such as; task factors
and psychological factors of persons are added, the relationship between the individual
and external stimuli become complicated.
Oakeshott (1966) discusses the notion that experience is divided into experiencing (the
process of experience) and what is experienced. These two parts are separate and one
cannot determine the other. The author also states that experience is always an internal
world of ideas and with every new experience the person develops different ideas.
Oakeshott (1966) maintains that 'truth' is the reality of experience and says that truth and
experience are inseparable, without truth there is no experience. In addition, the author
continues to argue that experience is always a homogenous world of ideas. So every
individual's experience is homogenous and every experience has a specific content and a
significant form.
Individuals gain experiences throughout their life time and some of these experiences
provide situations for individuals to increase their skills in a particular area. Experience,
therefore, is added to constantly throughout a person's life time, and the reality of the
137
experience of tomorrow is not necessarily the same as of the experience of today
(Reichenbach, 1976). The experiences of today are means of gaining further experience.
It seems that experience is the best teacher to enhance skills and knowledge of people
(Weihrich and Koontz, 1993). Furthermore, Dewey (1939) points out that every
experience exists in further experience and the current quality of experience can influence
the quality of further experience. Thus, any prior experience improves future experience.
Experience and behaviour are highly dependent on each other, therefore, experience will
influence behaviour. Laing et al. (1976) state that the behaviour of people towards each
other is partly a function of their experience and since experience can be perceived and
interpreted before it leads to behaviour, measuring experience can predict function and
behaviour of individuals.
5.4 Definition of Experience and Computer Experience
There is no explicit definition in the literature of computer experience. There are,
however, many definitions of experience. For example, McKellar (1968: 13) argues that
"by experience is meant the internal aspects of mental life that we learn about through
man's ability to reflect upon his thoughts, perceptions, emotions and motives, and to
communicate these introspection". Another definition explains that "experience, it is said,
begins with disconnected, simple, immediate sensations, the product of a particular
physical activity. And thought, interpreting these data, replace sensation by judgement"
(Oakeshott, 1966: 18).
Experience may be produced by seeing an idea, translating the idea into a practical
concept and proving it by use, so that experience is gained by observing others (Sprin
and Benfer, 1982). Thus, a person's experience depends on observation and practice.
Another definition explains that experience, including instruction and practice, provides
both specific knowledge and specific skill (Campbell, 1990). In relation to experience,
Dewey (1939: 13) explains that "all genuine education comes about through experience.
This does not mean that all experiences are genuinely or equally educative". Furthermore,
138

Steinaker and Bell (1979) reported that experience has a broad base of involving all
human senses and activities and it will integrate the mind, physical being and the previous
experience of the individual. Consequently, experience can involve the individual
physically and mentally. Finally, the Oxford Advanced Learner's Dictionary (1992: 312)
defines experience as "process of gaining knowledge or skill acquired from seeing and
doing things". Therefore, gaining experience requires all of an individual's senses and
physical activities.
By reviewing the literature and examining the different perspective of researchers,
subjective computer experience is define by the researcher as "perception and judgement
of users regarding the processes of gaining computer knowledge and skills through the
involvement of all senses and activities of users".
5.5 Measure of Computer Experience
The literature has considered many dimensions of experience such as; level (high/low);
degree of intensity (mild/intense); cognitive; affective; psychomotor; quality of
experiences (degree of satisfactory/unsatisfactory, good/bad); direct and indirect
experience; subjective, and objective experience.
For example, Maslow (1970) argues that some experiences can occur in a low degree of
intensity. Mystic experience on a quantitative continuum can occur from mild to intense
and each person may have mild mystic experiences daily. Moreover, Steinaker and Bell
(1979) state that an experience involves different cognitive, affective and psychomotor
taxonomies. The cognition domain recognises the knowledge, intellectual abilities and
skills, the affective domain is associated with feelings and perspectives and the
psychomotor (behavioural) domain is associated with physical skills and general practices
(Bedworth and Bedworth, 1978).
Quality of experience is related to the degree of experience in any particular field. The
quality of specific experience in individuals may differ because of their different degrees
of experience. Oakeshott (1966) argues that the need for satisfaction may differ between
139

individuals, not all individuals requires or want the same degree of experience. Dewey
(1939) argues that learning depends on the quality of the experience. It has two aspects;
immediate aspect of agreeableness or disagreeableness and its influence upon later
experience. In a parallel perspective, Ertmer et al. (1994) in their study concluded that,
'quality' rather than quantity of computer experience, may be more important.
Experience can also be direct or indirect. If experience is obtained by doing things, the
individual has direct experience but if experience is gained by seeing or using any other
sense, then this is called indirect experience. Nash (1993) argues that hands-on
experience is a practical and direct experience. The original hands-on experience for the
computer user is the first touching of the computer's keyboard.
Steinaker and Bell (1979) believe that any experience contains five basic categories;
exposure, participation, identification, internalisation, and dissemination. These steps are
linked together and persons can move from exposure to dissemination level. One can
reject or terminate an experience at any level of the taxonomy, from exposure to
internalisation. If the experience provides anxiety or fear, dissemination may not occur at
all.
Some experiences are also subjective and available only as the ideas of an individual and
is called the world of subjective feelings (Pribram, 1970). Reichenbach (1976) argues
that some of our experiences cannot be communicated to others. The inner most thoughts
of an individual are known only to that person and are not accessible to others. Another
view of experience is the reality or objective experience. Oakeshott (1966: 60) argues that
objectivity is a characteristic of reality that is unavoidable. The author also discusses that
"the objective is what cannot be denied, what is absolute and consequently what is real".
An alternative definition is that "objective means having existence outside the mind; real"
it also means "not influenced by personal feelings or opinions; unbiased; fair" (Oxford
Advanced Learner's Dictionary, 1992: 618). The objective of scientific thought is to
discover an 'objective' world, a 'material' world, an 'external word' or the world of
experience that is 'common to all normal people' (Oakeshott, 1966: 172). Thus, objective
140
computer experience refers to computer experience that is real and separate from the
feelings and ideas of the users. Computer experience, as with any other type of
experience, can be objective or subjective. Perception of computer users about computer
experience can be called subjective, and this can be positive or negative. Whereas, the real
experience of the user is called objective computer experience.
Subjective computer experience is the perception of users in relation to their computer
experience that only they can explain. The subjective experience of individuals differs
according to whether the experience is successful or not. Thus, users' computer
experience may be affected by a number of factors that are related to experience. Some of
these, such as; positive computer experiences, may cause computer users to be more
successful in their tasks and may make them more enthusiastic about interacting with
computers. Whereas some others, such as; negative computer experience, may cause
users to avoid learning about and working with computers. A person who is able to
achieve success may be able to follow with further success (McClelland et al., 1953).
Thus, the experiences of success and failure have different effects on people. A
successful experience can bring power to individuals. This type of power normally
develops through achievement and performance. Umstot (1984: 284) argues that "when
you build a reputation as an expert, people dependent upon you for advice within your
area of expertise: you have expert power". Mahrer (1978) argues that 'good' feelings of
experiencing occur when the individual is dominant and can control the situation. Leach
and Caupti (1995) in their study, reported that subjective computer experience was more
important than the amount of the user's experience (objective experience) in forming their
attitudes.
Measuring computer experience can provide useful information about the success or
failure of computerised systems. Since computer experience is an important issue that can
affect system usage, the need of an adequate instrument to evaluate computer experience
is evident. In order to increase the understanding of users' computer experience, a reliable
and valid scale is also required. As noted earlier, computer experience could have
141
different dimensions such as; subjective computer experience and objective computer
experience. Therefore, development of a reliable and valid multi-item instrument for
measuring user computer experience is becoming increasingly important to researchers
and is a critical research priority.
5.6 Method of Development the ’Scale Of Computer
Experience’ (SOCE): Phase 1 Development
In the current study, in order to generate a representative sample of items associated with
computer experience, a variety of procedures were employed. The first was to review the
literature that was related to experience, computer experience and its measurement. A
pool of items were identified from previous surveys and relevant literature. The literature
included: articles and books that addressed the topic of experience and computer
experience of users. The items chosen from the literature had as their key words
'experience' or 'computer experience' in the title, key word list or as a user's
characteristics.
The second was the conduct of focus groups and the third, was interviews with persons
who were expert computer users. Munhall and Oiler (1986) argue that the qualitative
method (focus group and interview) can be used for many purposes including instrument
development. In this study, a qualitative method was used for the development of a
structured instrument for measuring computer experience. This qualitative study is part of
the study to develop a scale.
5.6 .1 Qualitative Methods
Qualitative research is often used to capture the totality of some aspects of human
experience and is more appropriate for understanding the insight of participants. Polit and
Hungler (1991) argue that qualitative method emphasises the subject's realities. This
method, therefore, attempts to understand human behaviour (Minichiello et al., 1991).
The qualitative findings contain rich and detailed data which give an understanding of the
142

participants' subjective experience. This method is used here to understand the experience
of the participants in the study.
However, Polit and Hungler (1991) argue that this method is less suitable for establishing
cause-and-effect relationships, testing research hypotheses and determining the opinion of
a large population. It has also been criticised because of the difficulty of analysing the
data. Furthermore, it is very time consuming and there are difficulties in summarising the
results. This is in contrast to the clear cut results obtained from other methods.
Nevertheless, it has great potential for uncovering data (Polit and Hungler, 1991).
5 .6 .2 The Purpose and Rationale of the Focus Group
A focus group is a research technique that is useful for an exploratory study. This method
can be used in the early stages of research and is often followed by other types of
research methods because the group of respondents can provide further useful data. A
focus group can also be used following the analyses of a quantitative survey. In that
situation, the researcher could use the results from the focus group to facilitate the
interpretation of the quantitative study (Stewart and Shamdasani, 1990). Carey (1994)
argues that the impact of the focus group enhances the quality of data and it is also a
useful method for complex issues in health research. Focus groups are used for different
purposes, one is the "development or refinement of the instrument: especially to identify
domains, to obtain natural vocabulary for item generation for questionnaires, and assess
cultural appropriateness" (Carey, 1994: 227).
The use of computerised information systems has increased enormously in recent years.
Studies about computers have shown that the successful and effective use of
computerised systems requires computing knowledge and skills (Szajna, 1993; Szajna
and Mackay, 1995). Thus, the development of a valid and reliable scale for measuring
computer experience is a crucial issue. In the current study, as a means of developing an
instrument, focus groups and discussions with computer experts assisted the researcher
to determine the dimensions of computer experience. Moreover, gaining qualitative
143

information from users at different levels of computer experience provided an appropriate
guide for designing the scale. The findings from the focus groups confirmed the
complexity of the experience concept and the measuring of computer experience.
Aims of the Focus Group
The purpose of the focus group consultation was to elicit the dimensions of computer
experience from computer experts from the University of Wollongong, NSW and staff
within the Illawarra Area Health Service.
The information was used to:
1. Develop a scale for measuring computer experience.
2. Measure computer experience of staff in the health sector for the main study.
M ethod
Two focus groups were conducted. The criteria for inclusion of participants to the focus
groups were:
1. Persons who were knowledgeable about computers; had extensive experience,
and used computers in their job.
2. Computer experts from the staff of the University of Wollongong and the
Illawarra Area Health Service.
The focus groups consisted of eleven expert computer staff from the University of
Wollongong (6) and from hospitals and community health sectors in the Illawarra Area
Health Service (5). All used computers in their tasks.
In the first focus group (University of Wollongong) the six computer experts selected as
participants were from different departments. These included: the Department of Public
Health and Nutrition; Department of Psychology; Department of Nursing; Department of
144

Information and Communication Technology, and the Educational Media Service. The
focus group meeting was conducted on the 3rd of April 1996.
In the second focus group there were five participants. These were selected by a manager
of the community health centre, from hospitals and community health centres, of these
five computer experts, two work in community health and three in hospitals. The focus
groups were conducted 16th of May 1996.
Initial contact with participants was made about 2 days to one week prior to the meeting.
The researcher explained the aims, details of the focus group and the planned discussion
to the participants. The date, time and location of the planned discussion were arranged
by the mutual acceptance of the participants. All subsequent arrangements were made by
the researcher. The discussions were approximately one hour and were audio-taped.
Refreshments were provided for the groups. The permission to conduct focus groups is
presented in Appendix 5.1.
Discussion was based on the outline presented in Appendix 5.2 and Appendix 5.3. The
participants were asked about the dimensions of their computer experience and to give
some thought to a series of questions (Appendix 5.4).
In the first focus group (University of Wollongong), it seems that two questions for an
hour session was sufficient. The term of ’face validity' was unfamiliar for most persons
in the first focus group. Therefore, the third and the fourth questions were deleted for the
second focus group.
Analysing and Interpretation
Carey (1994: 233) regarding the interpretation of the focus group, argues that, "these
methods range from a broad range approach with the purpose of identification of general
concepts to a very detailed analysis of transcripts". Therefore, depending on the basic
purpose of the survey, a researcher is able to select different methods of analysis and
interpretation. Data are analysed differently according to the data required. Carey (1994)
145

states that for the development of a questionnaire, identification of the general content of
the focus is appropriate. In the current study, the researcher transcribed and analysed the
content of the focus groups to find general concepts. The result are arranged in Table 5.1.
Table 5.1 Discussion of focus groups
T opic D escription
Computerperform ance
• Each level of performance should have definition.• Definition of performance should be precise and
specifically related to task.• Professional competency should be measured by user's
performance.• Level of expectation regarding computer usage is an
important factor that should be considered.• Expectation of employees are different in
organisations.• Computer performance of staff should be measured
based on the criteria of their organisations.
Training course andcom puterexperience
• Training courses can be an indicator to measure computer experience.
• Training courses both theoretical and practical should be arranged.
• Training courses should be related to tasks otherwise the content will be forgotten.
• Computer training courses are necessary for all computer users.
• Providing computer education is an important issue because trained staff can use computers in their organisations effectively.
Computer experience and computer usage
• Frequency of computer usage is an important factor for obtaining experience, thus, usage should be consistent.
• Ability for operating computers may become slow due to lack of usage.
• Learning curve can be increased by computer practice, experience and usage.
Computer experience and length of com puter usage
• Length of using computer (hours) is an indicator for measuring computer experience. Persons that use a computer seven hours per week are more exposure to computers than persons who use computer one hour per week so the first group would have more computer experience.
C la ss ify in g com puter experience o f user
• Level of computer experience could be classified as; beginner, intermediate and advanced.
146

D im ensions o fcom puterexperien ce
• Com puter experience has different dimension so measuring is difficult.
• Dimensions of computer experience should have clear definition for measuring.
• How much the staff know about application is a huge dimension.
Su bjectivecom puterexperien ce
• Measuring subjective computer experience is difficult.• Subjective experience should be documented.• Some subjective experience such as; fear of computers
can be solved by sending users to training courses.
O bjectivecom puterexperience
• Measuring the competency of users could be achieved through observation or asking questions.
• Computer experience of users can be measured by their objective performance.
Exposure to com puters and computer experience
• The computer competency depends on the degree that users are exposure (access) to computers.
• Exposure of staff to computers is a good opportunity for them to obtain experience.
Encouragem ent and the com puter experience
• Encouragement is an important factor for enhancing computer experience.
Home com puters andcom puterexperience
• Home com puters can influence the com puter experience of users.
• Home computer use is an indicator for measuring computer experience of users.
M easuringcom puterexperien ce
• Computer experience of users should be measured based on the goal of organisations. In other words, users' computer experience should be goal-based.
• Users should be able to;Manage security system.Demonstrate the skills and ability of admitting and
transferring patients in health sectors.Use specific application.Use spreadsheet or other packages.Draw graphs.Type a letter.
• The other variables that are important and should be considered include:
Performance of computers.Level of users' competency.Level of users' confidence and attitudes toward
computers.Lack of stress and anxiety during using computer.
• If users be comfortable in using computers, they can learn different types of packages easier and faster than others.
147
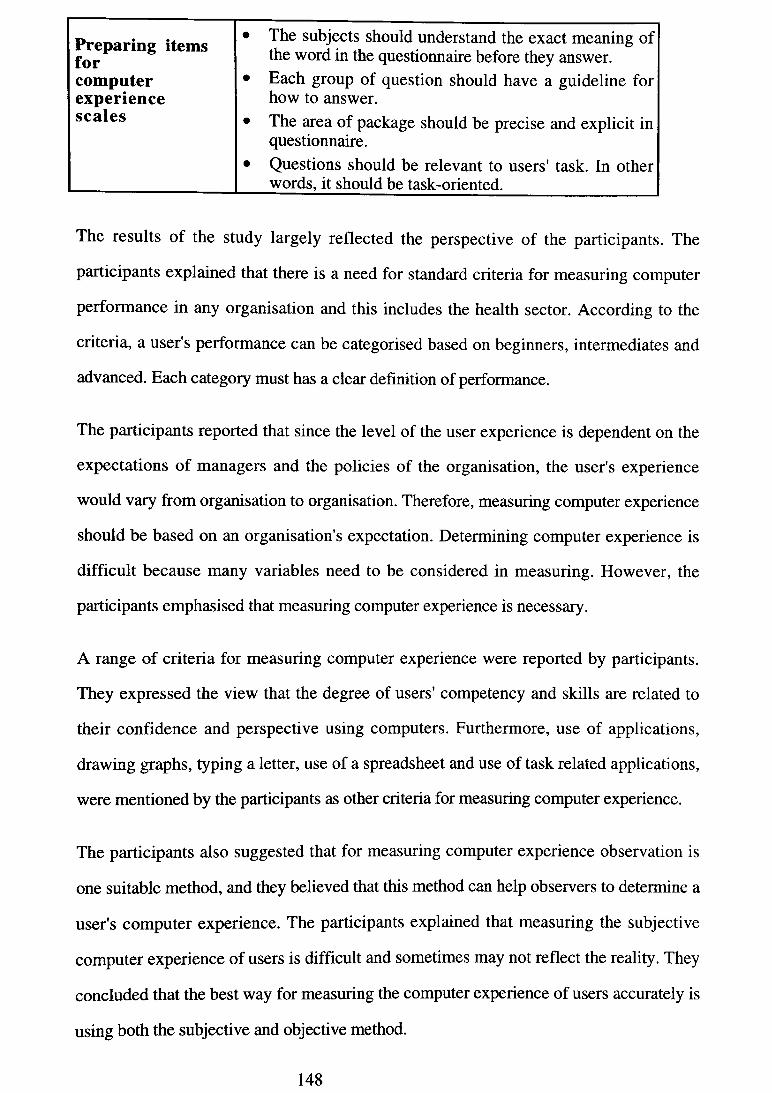
Preparing item s for
• The subjects should understand the exact meaning ofthe word in the questionnaire before they answer.
com puter • Each group of question should have a guideline forexperien ce how to answer.sc a le s • The area of package should be precise and explicit in
questionnaire.• Questions should be relevant to users' task. In other
words, it should be task-oriented.
The results of the study largely reflected the perspective of the participants. The
participants explained that there is a need for standard criteria for measuring computer
performance in any organisation and this includes the health sector. According to the
criteria, a user's performance can be categorised based on beginners, intermediates and
advanced. Each category must has a clear definition of performance.
The participants reported that since the level of the user experience is dependent on the
expectations of managers and the policies of the organisation, the user's experience
would vary from organisation to organisation. Therefore, measuring computer experience
should be based on an organisation's expectation. Determining computer experience is
difficult because many variables need to be considered in measuring. However, the
participants emphasised that measuring computer experience is necessary.
A range of criteria for measuring computer experience were reported by participants.
They expressed the view that the degree of users' competency and skills are related to
their confidence and perspective using computers. Furthermore, use of applications,
drawing graphs, typing a letter, use of a spreadsheet and use of task related applications,
were mentioned by the participants as other criteria for measuring computer experience.
The participants also suggested that for measuring computer experience observation is
one suitable method, and they believed that this method can help observers to determine a
user's computer experience. The participants explained that measuring the subjective
computer experience of users is difficult and sometimes may not reflect the reality. They
concluded that the best way for measuring the computer experience of users accurately is
using both the subjective and objective method.
148

The participants also agreed that computer training courses and the education of users are
factors that can improve computer experience and should be considered as a measurement
variable. However, items in the questions should be consistent and task-related.
Additionally, the frequency and length of time using computers at the work place, access
to computers at work and home are other indicators of measuring computer experience.
The important point in designing a questionnaire is that all words should be understood
by respondents and questions should be relevant to the respondent's task. Furthermore,
each group of questions should have a guide on how the participants should review the
questions.
5 .6 .3 Interviews
The interview is a method that is most commonly used for collecting data in the social
sciences. An interview is a dynamic process and also a verbal communication between
interviewer and interviewee for the interviewer to gain information. The type of questions
are designed to suit the purpose of the study. Bums and Grove (1993) state that this
strategy is mostly used for qualitative and descriptive studies.
Roberts (1985) states that the interview is not only an objective event, but also it is a
subjective judgem ent process. Thus, the interview can uncover both objective and
subjective information from the participants. Objective information such as; a smile or
body gestures can be gathered from observation. Donaghy (1984) argues that it is usually
difficult to gather subjective information, but an interview is a good method for this. This
approach can help researchers gain subjective information from others' ideas and
opinions.
An interview consists of three interacting variables: the interviewee (respondents), the
interviewer (researcher), and the interview schedule (Oppenheim, 1982).
An interview schedule or interview guide is a list of questions that should be asked by the
researcher (Sapsford and Abbott, 1992). A predetermined schedule of questions can
149

provide maximum consistency and control by the interviewer on the topic, so it can
usually produce related information about the topic. Thus, information can be obtained
from all respondents by the same questions even if the range of questions is limited
(Macfarlane Smith, 1972).
Tape recording is usually used for collecting data in the interview. This approach helps
the researcher to analysis the data accurately and allows the researcher to concentrate on
the questions and answers carefully later, because both are recorded and available.
Deatrick and Faux (1991) mentioned that the tape-recorded interview can provide a
complete and accurate transcript of the subject's response and can also increase the
reliability of the data. However, there are some problems about tape recording. Tape
recording may inhibit both the interviewer and the interviewee in explaining their real
ideas and opinions or may provide very limited conversation. Minichiello et al. (1991)
argue that some subjects may fear tape recording because they do not wish their views to
be recognised by others. Moreover, this method cannot record the body-language of the
subjects and also the transcription of data from the audio tapes is time consuming.
Oppenheim (1982) states that the greatest advantage of the interview is its flexibility. The
interviewer can be sure that the subjects have understood the purpose of the research and
the questions. The researcher also may feel a sense of security due to the collecting of
data face to face. On the other hand, loss of information is a problem of the interview.
Non-verbal behaviour such as; facial expression, hesitations or tone of voice will not be
recorded on the transcription (Oppenheim, 1982). Bums and Grove (1993) point out that
this strategy requires more time and costs more than questionnaires, thus, the sample size
is usually limited.
Types o f Interview
There are a variety of styles for conducting interviews such as; unstructured, semi
structured and structured. In the unstructured interview the content of the conversation is
directed and controlled by the participants. In this method, the researcher has a general
150
question framework to elicit information from the respondent's answers (Dempsey and
Dempsey, 1986). In the semi or focused interview, a list of areas that should be covered
is prepared by the interviewer. In the structured interview the researcher or interviewer
can usually control the content of the interview.
The structured interview is frequently used for testing theory and survey research (May,
1991). In this type of interview, a great deal of data can be collected relatively quickly.
Since interviewers have the power in the interview process, they are able to change or
maintain the content of the interview. The structured interview is more formal than the
unstructured, subsequently the researcher can collect more information from the
participants than in the unstructured interview.
The interview is a method that allows for the capture of the depth of meaning and the rich
data of the subject's experience. In the current study, the interview was used to ascertain
the subject's feelings toward computer experience. Furthermore, the structured interview
technique was selected because this type of interview allows the researcher to collect more
information in a shorter time than other methods and analysis of the data is easier than the
unstructured interview technique.
O rganising and Analysis of Interview Data
The researcher using qualitative studies should check that all the data available are of good
quality. All the interviews should be transcribed verbatim and all the field notes should be
included. The data should be typed, double-spaced with margins and printed. The
researcher should have a backup copy of all the data.
Polit and Hungler (1991) argue that the main task in organising qualitative data is to
develop a method to access the data without having to read and re-read the whole set of
data. The traditional method is to develop different types of files. Thus, the researcher can
arrange the data in different ways, such as; chronologically, or by the subject’s
identification number. Another set of files is constructed on a conceptual/analytic basis.
To develop such a file, the researcher must develop a coding scheme that relates to the
151
major topics under investigation. There are many computer programs that can greatly
facilitate the encoding and retrieval of qualitative data (Bumard, 1994).
Content analysis is usually used for written and oral communications, thus, it can used
for diaries, letters, speeches, articles and books. Bums and Grove (1993: 597) explained
"content analysis is designed to classify the words in a text into a few categories chosen
because of their theoretical importance".
Polit and Hungler (1991) state that researchers who perform a content analysis should
select the variables or concepts that are recorded and the unit of content that will be used.
Thus, first the researcher should select the specific traits or characteristics of the text that
must be defined and then the units of analysis (Bums and Grove, 1993). There are a
variety of units for analysing verbal expressions such as; letters, themes, individual
words or items (combination of words). The smallest unit that can be useful in this regard
is a letter. A theme may be a phrase, sentences or paragraph that makes a topic. Another
unit of analysis is the item. This refers to an entire message, document or other
production. The whole item can be categorised in terms of one or more characteristics.
Therefore, the text should be divided into units of meaning.
The next step in performing a content analysis is the development of a category system
for classifying units of content. Use of the category system enhances the scientific
validity of a content analysis study by making the data more objective and systematic
(Polit and Hungler, 1991). There are a number of systems that have been developed and
it is more efficient for researchers to use an existing method rather than create a new one.
Content analyses often applies a sampling plan in selecting material to be analysed and
this depends on a number of considerations and the units of analysing. If the unit of
analysis is a word or theme, the researcher may use a systematic or random sampling
procedure in which the sampling unit may be pages or paragraphs in a document.
By using content analysis, a wide range of social and psychological concepts, such as;
attitudes, emotional stability, motives, needs, perceptions value and personality traits can
152
be measured. However, content analysis has some disadvantages, such as; the risk of
subjectivity (Polit and Hungler, 1991).
5.6 .3 .1 Aim of Interviews
In the current study, the aim of the interviews was to ascertain and measure the
psychological effects of computer experience on the participants' feelings. The purpose of
the interview questions were to;
1. Obtain the staffs perception in relation to the effects of computer experience.
2. Obtain the staffs perception of how their work changed after they became
experienced users.
3. To determine the changes the staff felt after gaining computer experience.
4. To obtain the staffs perception of how specific aspects of their work had or had
not changed. These aspects were:
a) relationship with computers
b) contact with colleagues
5. To give evidence about the advantages of computer experience.
The interview schedule is provided in Appendix 5.5.
5 .6 .3 .2 Method
The face-to-face interviews were conducted with the participants. This method was
helpful for the researcher and the participants could hear each other's opinions and views.
The main value of conducting interviews is that the interviewer can gain information by
observing the behaviour and hearing the conversations (Donaghy, 1984).
The sampling method in a qualitative study is often the non probability or convenience
method (Munhall and Oiler, 1986). Morse (1994) recommended that about six
153
participants for in-depth conversation to express their experiences and feelings is
sufficient. In the current study, six participants were selected; these were not from within
the focus groups. One of the managers of the community health centre co-ordinated the
selection of these participants, all of whom had computer experience. She also arranged
interview times. These were conducted over two days.
The data was collected by interviewing the above staff of the community health centre
who had computer experience in their particular area of work. Before each interview, the
researcher explained to the participants the aim of the interview, the recording procedure
of the interview and confidentiality of their personal details. The data was recorded on
tape after gaining permission from the participants.
Since interviewing is a process of human interaction, violation of privacy and conflicts of
opinions as well as embarrassment should be considered in the process. Minichiello et al.
(1991) mentioned that researchers should respect the privacy of information but should
also provide accurate information. Thus, the role of the interviewer in relation to the
confidentiality of the participants is very important and should always be considered.
Since the subjects of the interviews were employed in the health services, the researcher
received permission from the Illawarra Area Health Service to conduct the interviews
(Appendix 5.1). The interviews were recorded on tape with the participants' permission.
Furthermore, the researcher provided confidentiality even for content analysis and the
possible publication of the study's results.
Probing is a strategy that is used by the interviewer for obtaining more information from
subjects and can be used as necessary (Oppenheim, 1982). This technique enables asking
questions in a different way or repeating the questions (Macfarlane Smith, 1972). The
researcher also can use probing when respondents give incomplete responses or need
more explanation about the questions (Polit and Hungler, 1991). In the current study, the
researcher used the probing technique whenever necessary.
154
5.6.3.3 Analysing the Interviews
The aim of data analysis is to uncover the meaning of the data (Minichiello et al., 1991).
There are different methods for analysing qualitative methods. One method, which was
used in the current study, focused on cont sis and consequently, 'meaning units'.
system for analysis of interview. In other words, the text is broken into meaning units for
developing a category system and the gathering of ideas together with a similar meaning.
The use of a word processing program W ordPerfect was used for this method.
In the current study, the researcher transcribed all the interviews exactly. In preparing the
interviews' transcriptions, a wide margin was left around the text. All the transcriptions
were kept on an original disc and analysing was undertaken from a copy of the
transcriptions.
After transcription, the researcher cleaned the text. Thus, only that part of the text that
was helpful and useful for analysis was left on the disc. Each part of meanings was
separated by double spacing for ease of reading the results. Therefore, the parts with
different meaning were separated.
All the text was carefully worked over to uncover the exact meaning. The meaning unit
can be one word or one or two sentences. Therefore, all the transcription were divided
into meaning units. This stage requires time and an experienced analyser.
After dividing the text into meaning units, the data were categorised based on the same
meaning so the researcher looked for similarities and differences. The use of the category
system allowed the researcher to gather all of the text with a similar meaning in to the
same category. On the basis of this method, the researcher categorised, all the units in to
different categories, according to their meaning.
This method is described by Bumard (1994) as a systematic method of analysing data
from an interview. This method focuses on 'meaning units' as the basis of the category
155

For categorising the transcriptions on the computer screen the following steps were taken
by the researcher:
• Determined the names of categories.
• Determined one letter for describing each category.
• Selected and placed the appropriate letter next to each of the units at the left side of the
meaning units.
Units that were not relevant to the aim of the interview were classified as 'other
categories'.
By determining all the text and sorting from the tools menu of W ordP erfect , the
researcher provided sorting for all the text based on the meaning units. Thus,
automatically the alphabetical sorting ability of W ordP erfect, arranged all the 'A', all the
'B' and so on through the other categories. Therefore, all the meaning units that have
been identified with a particular category were arranged alphabetically, for example:
A. It (computer) has the ability to create pictures
A. It (computer) has the ability to create a filing system because it is normal to file a
document in the computer.
B . Would probably lack training.
B . Few number of computers.
C . I get very frustrated.
The examples are under these headings:
A Advantages of computers.
B Disadvantages of computers.
156

C Negative feelings toward computers.
All the meaning units were stored in the way described above. The researcher checked all
the categories to make sure all the meaning units really fitted their categories. The original
was available to help clarify any problems the researcher had.
It is important that the category system, developed by the researcher, remained true to the
text that was being analysed. For the validity of this method, the researcher asked a
researcher with experience in this method, to check the developed categories with the
original transcription.
5.6 .3 .4 Findings of the Interviews and Discussion
The following discussions are the main themes that occurred in interviews and were
identified by the process mentioned previously.
Advantages of Computers
All the respondents explained their perspective toward the advantages of computers and
claimed that computers make work easier and quicker. For example, one of the
interviewees explained that:
"the use of computers makes work a lot easier, makes the recall and access of the
information a lot quicker and easier than paper file" (Nursing manager).
"Certainly much easier than using an electric type writer or manual typewriter"
(Secretary of hospital).
The literature related to computerised technology explained that over the past three
decades, computers have become progressively more used in industry and organisations,
because they have many advantages in different areas such as;
• Providing organised and fast information (Lawlor, 1994).
• Providing fast access to data (Pett and Scott, 1994).
157
One of the interviewees as financial officer explained the advantages of computers based
on her own perspective and discusses th a t:
"using statistics in computers is absolutely marvellous".
Health information systems can provide the connection between patients and the health
sectors. By providing links between patients, hospitals and health centres, delivery of
services will be easier and faster. The nursing manager participant also confirmed this
point and claimed that computerised information systems are:
"able to deliberately contact with patients for helping them".
Another participant state that the flexibility of computers is an advantage. The participants
in this regard, said that:
"it (computer) gives you a lot more flexibility in the way that you want present a
document".
Flexibility means anything that can be changed, adopted or adjusted, thus, computers can
be adjust according to needs of users. Another advantage of computers is reducing the
cost of work (Segars et al., 1994). However, the nursing manager as participant thought
that the cost of updated software and hardware is a disadvantage of computers and
explained that:
"keeping up dated software and even hardware which changes so fast that by the
time you buy you can't fully use the software. The big disadvantage is the cost in
trying to keep up".
The participants also reported that the advantages of computers include: filing systems,
saving time, easy and fast manipulating and analysing of documents, easy typing and data
entering, accessing the networks, drawing pictures and tables, easy printing, deleting or
adding to documents and reducing costs. Therefore, results of the interview and related
158
studies reported advantages of computerised systems in different areas and with different
perspectives.
Disadvantages o f Computers
Most of the respondents in this regard, expressed that lack of computer training is a
disadvantage and they need more computer training. Typically comments included:
"I don't utilise the programs to full capacity because of my lack of knowledge".
"I think there is no education or support for users to use computers".
"I don't know very clearly (disadvantages) so education is very important".
"I think the education and support is really needed".
Familiarity, understanding the operation and practice with computers are important factors
for successful implementation of information technology. Computer training courses are
also necessary for users to learn more about computerised information systems (Senn,
1990). Only trained users can provide the organisation with successful system usage.
All the interviewees expressed that the break down or the failure of computers is their
biggest disadvantage. They explained that:
"disadvantage is that when it (computer) breaks down or where there's a failure in
the machines and you can't operate them".
"break down. I don't know how to fix it and this is a disadvantage".
One of the participants in interview discussed the disadvantage of computers based on
her position as manager and explained that:
"trying to introduce computers and the programs to staff who are computer
illiterate" (Nursing manager).
159

The disadvantages may be due to lack of efficient peripherals, e.g printers or situations in
which participants were involved. For instance, one of the participants explained that:
"I am experiencing here at the moment we only have two printers and people need
to print out it is not really, you know, a major disadvantage but it is something
that I am experiencing at the moment" (Staff at hospital).
Other disadvantages that the participants explained included: various programs in different
computers, limitation in the number of computers, problems that may happen in
programs, updating software and hardware, insufficiency of some programs and setting
up computers and printers which sometimes cause time consuming delays.
The participants reported a number of problems regarding computers. One major
problem was the lack of computer training. This is needed to solve task-related
problems.
Positive Feeling toward Computers
Regarding their positive feeling toward computers, one of the participants who was a
computer trainer expressed her feelings by saying that:
"I feel fine about using computers I feel confident to sit down and to use
computers and access different areas" (Manager of computerised information
systems).
Therefore, trained and expert users can bring comfortable usage and better understanding
of computing potential (Calvert et al., 1994). Furthermore, information system training
can increase confidence of users for system usage (Brown, 1984). Rapko and Adaskin
(1993) in their study reported that the subjects with greater knowledge about computers
had a positive attitude toward them.
Another participant in the interview also explained her feelings when she learned how to
use specific computer programs as;
160

I feel positive".
Furthermore, feeling after teaching others about use of computers was explained such as;
"I also feel really excited about if you say someone who really can't do it (use
computers) and after training started to do it".
"I really enjoy to teach computers".
Therefore, the literature and the interviews conducted showed the similarity of results
namely; that people with computer experience have positive feelings and perspectives
toward computers.
Negative Feelings toward Computers
The participants in the interviews explained their feelings in regard to computer problems
in different ways such as;
"when I am doing something new I feel really inadequate. When I don't have
enough knowledge about the computers to able to do everything you know...it is
sometimes very sad I feel inadequacy".
"if you don't know something about the program, it can cause a bit of frustration
to find out".
"when I can't get a software program to run it is really frustrating".
"first feelings that I got was absolutely frustration because I didn't have a good
understanding on computers how to use it".
"when it (computer) crashed and had been some part of my thesis on there and
still on there which was a big worry".
One of the participants explained that:
161
"when you are busy is really hard you know just really angry because you can't
fix it".
In problem situations, users have different feelings arid anger is one of these. Anger as a
subjective experience is a complex situation and is considered as an emotional element.
Heller (1979: 127) maintained that "anger is an emotion because the quality of the feeling
of anger contains the reason for our anger and the situation in which we feel anger". In
this situation, similar to other aggressive behaviour, a person's judgement is affected
adversely (Lazarus et al., 1970). Dunlop (1984) in this regard, argues that in a complex
situation, one's anger may provide other feelings, or new feelings, and so on, through a
range of feelings.
The participants also expressed negative feelings and perceptions toward the computer.
These negative perspectives can cause negative behaviour. As mentioned by the
participants, the majority of negative feelings are caused by lack of knowledge and skills
in using computers. By providing appropriate training, staff can solve many problems for
themselves.
Computer Training
Regarding computer training, the subjects in the interviews explained that:
"some sort of education you might not learn for a half of day...I think some
people might have the time to do if ...some staff haven't time to sit and play and
try to work on it".
One of the participants as a staff of hospital explained her problem relation to training as;
"I guess one of the problems is lack of time for someone to come and show me
about how to use the software because still I don't know how to use a lot of
software that we have".
162
"the people need to be re-educated because it is not a hard thing to do. I think if
you want and you feel a little bit confident you can easily pick up the skill".
Another participant in relation to lack of appropriate training course and support explained
that:
"I think there is no education or support for the people to using computers......I
think the education and support is really need".
In a parallel perspective, Cuplan (1995) argues that computerised information systems
should be programmed to take into account the computer user's knowledge and managers
should support individual training efforts. Management should provide training programs
for users to increase their knowledge and skills. Therefore, based on the related literature
and the interviews, management support for arranging computer training courses, and
consequently, providing computer experience for users, has an important role in
organisations.
Since the technology is changing so quickly, learning opportunities should be
consistently and frequently given for effective usage. In this regard, one of the
participants discusses that information systems are changing rapidly and these changes
require users to be professional in their use. She explained that:
"the technologies move so quickly that is very difficult to keep up with that so you
always feel...you should consistently learn. You always should learn because
many things happening so quickly and consistently".
"it is consistent learning process".
Computer users need both formal and informal training through their organisations.
Regarding to the sort of training, the participants had different perspective. For example,
the nursing manager in her interview stated that:
163

"if I have hadn't any formal training I am able to sit down and trained myself with
the manuals and often I got my tutorial".
Moreover, about which type of education is better one of the respondents' reported that:
"I think formal because informal in the same situation that you are busy you don't
do it. I think that formal and set up and you can book and get away from your
workplace".
"you don't have really time at work during working hours to be training yourself
and reading the manual so formal is better".
Since users' computer training is an important issue in any organisation billions of dollars
are spent on formal training each year (Nelson and Hall, 1991). Therefore, users should
have formal or informal computer training courses and it can be provided within the
information centres, or can be self-study (Perry, 1987).
The participants in relation to initial learning had different perspectives and explained that:
"initial learning I think is difficult".
"most people are afraid initially".
In the literature of management information system (MIS), there are many methods to
overcome computer fear; one is training. The nursing manager in the interview also
explained training as a method for overcoming computer fear and explained that:
"if there is someone who is really scared of computers I provide the opportunity
for them to learn how to use it and I sit down with them and I work with them".
Therefore, based on the literature review and the participants' idea, training is necessary
for gaining experience so training should be arrange by the management systems.
164
Solving Computer Problems
The participants of the interviews explained that they solve their own computer problems
in the following ways:
"I usually go to the manuals and if it doesn’t help me to solve the problem then I
go to the computer department of the hospital".
"usually what I do is look through the manual, you know the book, I fix it by
myself other wise I phone the computer department".
"the other way is trial and error".
Guimaraes and Igbaria (1996) point out that users' learning by their own trials and errors;
leads to unnecessary high costs to the organisations. When users have computer
problems that they cannot solve, they don't know where to turn to for training which can
help them. Peter (1972) points out that the common problem in educational situations is
that individuals do not know where they stand and what they must know. Computer
training should help users to find their abilities and strengths for improving their
performance. Therefore, computer training should focus on the ability of users to solve
their task problems (Nelson and Hall, 1991).
Views of the participants
In the first interview, the manager participant explained that most people are scared
initially, and her own initial learning was difficult and hard. Fear of computers may cause
difficulties for some to learn computer skills because the user feels inadequate. If these
fears can be overcome, they would feel happy, confident and 'feel good'. Before training
users usually have negative feelings but after learning they have positive perspectives and
feelings toward computers. She also raised the point that most of the time jargon frightens
new computer users. She also emphasised that she trained herself with manuals and it
was easy to learn. "If I cannot get a software program to run" she said, "it would be very
frustrating".
165
Since people's feelings are an important factor of their behaviour, psychologists usually
study feelings and subjective experience and their effects on people. Feelings are the
emotional colouring of conscious contents (Ewert, 1970) and emotions do not always
arise out of subjective states of mind, they can stimulate by objectives or situations from
the external world (Bantock, 1967). Individuals have different subjective feelings and
perspectives toward others, their social environment and experience anger, fear, joy, etc.
differently. Due to the importance of the relationship between subjective feelings and
behaviour, some feelings about computer jargon expressed by participants such as; fear,
confidence, happiness were considered here.
Fear is recognised as an emotional state that is aroused by sudden loss of support or a
dangerous situation. Sources of fear are different and Heller (1979) points out that
pervious experience can be a source of fear. Types of fear-emotions are as follow:
• fear as danger in the future
• fear as a feeling
• fear of don't want (Heller, 1979)
Dunlop (1984) argues that fear is a subjective experience allowing the person to explain
their feeling to others. Janet (1973) argues that the 'fear of action' as a feeling can often
be observed during a depression crisis or when a person is sad. These feelings express
the nature of sadness and its dangers.
People exhibit different behaviour in a frightening situation. For example, Woodworth
(1973) argues that the overt response in fear is avoidance and people with this feeling
may be unable to do their work. Janet (1973) argues that fear of an object can cause a
more serious reaction. The person may seek to escape from the object, situation or place.
However, people who are afraid are able to perform, even during a period of fear, but the
behaviour is slow and imperfect. In relation to fear and behaviour, Plutchick (1970)
discusses that withdrawing or escaping are trends of behaviour that people show when
166

they are in a unfavourable situation. The fear is not a learned but inherent response
(Cannon, 1973). On the basis of the finding of the interviews and of the literature, fear of
computers can cause some to avoid using them. Computer fear, therefore, as an important
factor in system usage, should be considered.
One feeling that people develop after learning is confidence. Adler (1973) reported that
there is a positive relationship between social feelings, self-confidence and courage.
Therefore, people who have learnt to use computers have self confidence which is useful
for them to be comfortable about learning more about computers and consequently, gain
more experience. Self-confidence is a product of successful learning. In this regard,
praise and other reinforcement play an important role (Becker et al., 1975). Confidence
helps users gain new knowledge and learn new skills, however, lack of confidence may
affect the computer learning process negatively. Improving confidence is due to having
more information about the object and a strong attitude toward the object (Fazio and
Zanna, 1978). In a parallel perspective, a study of Ertmer et al. (1994) showed that
subjects with more computer experience had more confidence with computers. Therefore,
if computer users have sufficient information about using computer through successful
learning processes and reinforcement: they would consequently, feel confident, they will
increase their experience and system usage.
Moreover, the participants point out that the feelings of staff changed after the learning
process. Gaining new knowledge and skills may give a feeling of happiness to the
learner. Davitz (1970: 254) points out that happiness is defined as "there is an inner warm
glow, a radiant sensation: I feel like smiling; there is essence of well being, a sense of
harmony and peace within, everything is going right for m e ,...". Both the literature and
the participant described the same sensation that the happiness feeling experienced after
mastering about a computerised system can motivate people to learn more and enjoy the
learning process.
Some factors can cause fear for the learner. One factor that does this is jargon terms or
jargon language. Some words and phrases are in regular occupational use by computer
167
staff to describe their work. Nash (1993: 8) argues that "there is a middle ground of
jargoning usage, lying between the narrow domain of technical terminology and the
general territory of accepted idiom". Jargoning is talking about things without using their
simplest name form and hence each jargon term has its distinctive phraseology. Some
people talk in clear language and others use jargon as a habit. Therefore, based on the
opinion of the subject in the interview and literature, using simple computer language for
teaching users would be helpful to decrease their fear about computer jargon.
In the second interview, the participants discussed that the operating of computers and
using new programs should be a challenge and should also be rewarded. Challenging and
rewarding in this regard can help users but for someone who cannot work with
computers, it would have the reverse feeling, such as; a feeling of failure.
The participant also emphasised that she did not utilise the programs to their full capability
due to lack of knowledge. Normally, she had no time during work hours to train herself
by reading manuals.
The participants mentioned that operating computers requires the motivation of a
challenge factor. This is a strongly felt factor for many people to achieve at work. Peter
(1972) expressed the view that group performance can be a criterion to measure the
individual's performance and challenges at work can provide a high level of achievement.
For better results of a challenge, assessment of the level of capability of individuals is
important and should be considered as a criteria. Kindsvatter et al. (1992) point out that
knowing the capabilities which can be expected from learners and others in a learning
process is necessary because it could give realistic guidelines for the expectations of
others. Therefore, both the literature and the respondent in the interview confirm that
challenge is a motivation factor for learning, achievement and ultimately using
computerised systems. However, challenging should be based on the capability of
computer users otherwise it can provide feelings of failure and incompetence in computer
users.
168
Concerning rewards, Whitaker (1994) argues that it means 'pay for performance' and it is
a common concept in organisations that the paying of rewards should be based on a
person's performance. In a parallel perspective, Peter (1972) explained that reward
should be well recognised and should be used appropriately because it can be effective as
a motivation for increasing competency. According to the reward system, users should
understand and accept that there is a positive relationship between reward and
performance. When a behavior produces a reward, that behavior will tend to increase in
the future. Thus, reinforced the behavior tends to improve. Moreover, appropriate and
effective use of reinforcement would provide positive attitudes and feelings (Becker et al.,
1975). Therefore, the finding of the interview and literature in this regard, confirm the
role of rewarding a user's performance can be a useful way for improving computer
usage.
The participant also mentioned the learning process and achievement feelings after
learning. One of the important positive feeling of people after learning, is achievement.
McClelland et al. (1953) described that as "the broad definition of achievement imagery in
the scoring manual in terms of competition with a standard of excellence emphasised our
view that affective changes early in life accompanying doing well or failing to do well in
various learning situations provide the basis for motivation to succeed and to avoid
failure". Therefore, the feeling of success is a positive subjective experience that should
be considered as an important factor for computer training and computer experience.
Lack of computer knowledge was another issue mentioned by one participant in the
interview. She explained that lack of knowledge could provide negative attitudes toward
computers and computer usage can be avoided. On the other hand, increasing experience
through learning knowledge and skills will establish a deep positive attitude (Bedworth
and Bedworth, 1978) and subsequently, computer usage. Therefore, increasing computer
knowledge can enhance positive attitudes and effective use of computerised information
systems.
169

A nursing manager, in her interview, maintained that providing computer education for
someone who is really scared of computers, is an appropriate opportunity for
encouraging his/her to start using computers. A computer user needs to know how to use
computers well and it is really exciting to see that someone who could not use a
computer, start to use one. This process can improve an individual's experience toward
computers.
She also emphasised that initial experience was hard and the first time the computer users
introduced it to her it was really difficult but by gaining experience and system usage,
working with computers became easy. By providing opportunities for training scared
users would really be encouraged because they really needed to learn how to use them.
Educating and encouraging users can stimulate an environment that is useful for them to
share their ideas and interest with others.
Another respondent in her interview explained that when she has time, she teaches herself
through using computers. The respondent also said that by using computers, she really
enjoys it.
'Enjoy' is a feeling that people can find in different ways. Hoisington (1973: 241)
argues that "we don't enjoy or laugh at the concrete; we enjoy and laugh at the
enjoyable". The expression joy is not learned so human have inherited this
reaction (Cannon, 1973). Heller (1979) point out different types of joy as
follows;
• joy as the achievement of goal
• joy as fulfilment of desire
• joy with regard to chosen values
Therefore, computer users that have had the experience of teaching themselves can find
enjoyment from other sources than those mentioned in the literature.
170

The participant also enhanced the role of self training and explained that it is a quick way
to doing and learning. However, lack of knowledge in some area would be really time
consuming.
Self-teaching is a method of learning and learners use this method for different reasons
such as; lack of a teacher, lack of time to participate in class etc. This method as a learner-
centred method includes: problem-solving, creative activities, research, independent
study, debates, and fieldwork experiences (Bedworth and Bedworth, 1978). Hills (1976)
point out that by this method the learner is the centre of the teaching process and is
responsible for his/her own learning. In other words, this method of learning is for the
self-directed individual. Thus, in the self-training method, learners have the responsibility
of both teaching and learning. Gosling (1994) described the aims of this method as been
to foster:
• the ability to take responsibility for organisation learning activities.
• ways of improvement information technology.
• confidence of learner.
As explained by some of the participants in the interviews and related literature, self
training is a good way for learning about computers and this method can increase the
knowledge and experience of computer users. Moreover, managers in organisations, can
develop self-training systems for improving the confidence of the learner and
consequently, their technology usage.
The other respondent in the interview reported that computers are an important tool for
nurses and health staff to obtain client information quickly. This is vital for hospitals and
health sectors. Those staff who have not had any computer experience and need to be re
educated should begin learning how to use computers. This is not difficult and if people
feel at least a little confident, they can learn new skills easily and quickly.
171

The participant emphasised that some computerised programs in hospitals are not really
capable enough of storing all the information needed about patients and clients.
Therefore, a more detailed database for clients' records is required. Providing appropriate
database for information technology can assist health staff to plan and implement better
services for their clients. Detailed and proper information systems can also provide an
effective reminder system to improve follow-up care, maintain longitudinal client records
and provide useful data for research (Pulliam, 1992).
The financial officer, in the interview mentioned that computers have changed the work
situation but there is no education or support for the people who are using them. She
explained that education and support is really needed. The computer department did
provide some education but this was not sufficient. Some staff had time off to learn in
work hours but others had not. This was unfair. All training is useful but the formal type
is better because training should take place away from the work place. After an initial
training course they have some idea how to use and start utilising the systems.
Both the related literature and the participants accepted that there is no doubt that training
about information systems is a crucial factor for the successful implementation of
systems. Providing technical knowledge and skills about information systems are
necessary for users (Richards and Pelley, 1994). Thus, users should have a balance of
knowledge and skills about the information systems use in their tasks (Senn, 1990). The
participant in the interview enhanced the vital role of training in using computerised
information systems.
The participants confirmed the literature that training should be supported by
management. Management support in organisations is essential in providing useful
training programs for users (Cuplan, 1995). Furthermore, management should support
users' efforts at computer training because they have an important role in the systems
usage. A study of Schiffman et al. (1992) demonstrated that frequency and time of use
were positively related to the number of training courses and facilities for the training the
users.
172
C on clu sion
In general, all the participants in the interviews reported that the use of computers have
many advantages. The participants explained their positive and negative feelings toward
computers. They had positive experiences and feelings toward computers. The
participants also expressed their views that the disadvantage of the computer is when it
breaks down or fails then the computers cannot be operated. They agreed that computer
training would help to solve some computer problems.
Therefore, based on the related literature and findings of the interviews, organisations
should spend more time and money to increase the knowledge and skills of the computer
users. Not all users need the same training, some need more technical knowledge and
skills, than others. Furthermore, management support should always assist staff to
become confident of their own knowledge and skills in using computerised information
systems.
5.6.4 Results of the Qualitative Method
• From all approaches such as; the literature review, focus groups and interviews, the
Scale Of Computer Experience (SOCE) was developed with a thirty eight five-point
Likert scale for Subjective Computer Experience Scale (SCES), one bipolar adjective
scale and seven questions regarding the Objective Computer Experience Scale.
Therefore, the SOCE contains two parts: SCES and items that measure Objective
Computer Experience.
1 Objective Computer Experience items give information about the objective
experience of users. These items covered areas such as; computer experience at
different locations, access to home computer, usage home computer, home
computer usage by others.
2 Subjective Computer Experience Scale (SCES) provides information about users'
computer experience according to their opinions, feelings and ideas. Therefore,
173

subjective computer experience is the sum of those experiences that users provide
by their own perceptions. Only the computer user can explain this personal kind
of information. The SCES covers positive computer experience and negative
computer experience. In this study the validity and reliability of the SCES was
measured.
5.7 Testing the Psychometric Properties of the Subjective
Computer Experience Scale
Newly developed instruments should be tested, revised and retested several times to
improve their psychometric properties. Researchers need to be confident in using an
instrument that has psychometric properties and is valid and reliable. The reliability and
the validity of an instruments are closely associated and both should be considered when
a scale is selected. Reliability is a necessary condition for validity, thus, an instrument
firstly should be reliable, then it must be valid. However, reliability of scale cannot
determine the degree of the validity of scale, and an instrument can be reliable but not
necessarily valid. Wilson (1989) states that for an instrument to be considered valid at
least one type of criterion validity or construct validity is required. Based on the study of
Norbeck (1985), minimal psychometric standards for publishing an instrument include:
• at least one type of content validity
• test-retest reliability
• internal consistency reliability
• at least one type of criterion-related or construct validity
In the current study, the researcher tested the following psychometric properties for the
SCES;
174

A . Validity estim ates
1. Content validity
2. Face validity
3. Construct validity (Factorial validity)
4. Criterion-related validity (Concurrent validity coefficient)
B . Reliability estimates
1. Stability (test-retest reliability)
2. Internal consistency/homogeneity
5.7 .1 Validity
There are many different definitions of validity. Rossi et al. (1983: 97) explained validity
as "the degree to which an instrument measures the structure under investigation". The
validity of a questionnaire according to Baroudi and Orlikowski (1988) is the extent to
which the questionnaire actually measures the supposed concepts it is designed to
measure. Therefore, an instrument with high validity is able to achieve its purpose. The
greater the validity of an instrument the greater the confidence in the data obtained. The
validity of a scale can be changed according to different subjects and environments.
Validation always needs empirical investigation.
There are different types of validity. For the SCES four kinds of validity such as; content,
face, construct and concurrent validity were measured.
175

5 .7 .1 .1 Content Validity
This type of validity is also known as: content related validity; intrinsic validity; circular
validity; relevance validity; representatives validity, and logical or sampling validity.
Validity is used to measure the variables of interest and range of items. It is used to
measure the appropriate sampling of the content domain of items in a questionnaire.
Kerlinger (1986) argues that content validity is the representativeness or sampling
adequacy of the content. It depends on the adequacy of a specified domain of content that
is sampled (Nunnally, 1978). Bush (1985) points out that content validity refers to the
degree that the instrument covers the content that it is supposed to measure. It also refers
to the adequacy of the sampling of the content that should be measured (Polit and
Hungler, 1991).
Nunnally (1978) argues that there are two standards for ensuring content validity: firstly,
the sampling of the items and secondly, the method of constructing the test. Thus, for
content validity two judgements are necessary; the extent of each item for defining the
traits and the set of items that represent all aspects of the trait. Therefore, content validity
measures the comprehensiveness and representativeness of the content of a scale. Usually
this type of validity is considered by researchers because it can help to ensure construct
validity.
Bums and Grove (1993: 343) state that content validity "is obtained from three sources:
literature, representatives of the relevant populations, and experts". Content validity is
also could be established in two stages; developmental and judgement stage.
Bums and Grove (1993) also maintained that content-related validity should begin with
instrument development. The first step of instrument development is to identify 'what
domain of construct' should be measured. This can be determined through literature
reviews, interviews and focus groups. By determining a precise definition of interested
traits, the researcher can have some idea of its areas, limits, dimensions, and knowledge
176

of its parts. Therefore, the qualitative method can be helpful for determining the domain
and concepts of construct that are of interest here.
To examine the content validity judgement stage, professional subjective judgement is
required to determine the extent that the scale was designed to measure an interested trait
(Nunnally, 1978). In this regard, Ghiselli (1964) points out that content validity depends
on subjective or professional judgement. Content validity is a subjective judgement of
experts about the degree of relevant construct in an instrument. Polit and Hungler (1991)
state that there is no complete objective methods for determining content validity of an
instrument nor is there any statistical procedural approach for determining content validity
of a measuring scale (Dempsey and Dempsey, 1986). However, selection of at least five
experts in that field (Bums and Grove, 1993) or according to Wilson (1989) five to ten
experts would be useful to judge the content domains of scale through use of rating
scales.
In this current study, content validity of the SCES was measured in two stages, the
development and judgement stages.
Content Validity in Development Stage
To generate a representative sample of items of computer experience, as mentioned
earlier, the researcher implements a variety of procedures such as; a literature review,
focus groups and interviews. At this stage the SCES was developed with thirty eight five-
point Likert scale and one bipolar adjective scale.
Content Validity in the Judgement Stage
This stage contains content related validity and face validity of the SCES that was based
on computer experts' judgement.
To test the content validity of the SCES, the researcher selected ten experts from the
Department of Computer Science, the Department of Nursing at the University of
Wollongong and the Elawarra Community Health Centres. The participants had computer
177
experience in their work situation for using or/and teaching. The researcher gave a copy
of the SCES and explained the purpose and objectives of the study to them individually.
The experts were then asked to rate each item based on relevance, clarity, simplicity and
ambiguity on a four-point scale. These criteria are presented in Appendix 5.6.
The researcher analysed the result of the content related validity of the scale. The Index of
content validity (CVI) developed by Waltz and Bausell (1983) was used. According to
CVI, the relevance of each item on the instrument to a particular objective was rated by
the 10 experts by using the four-point scale. The items that had CVI over 0.75 remained
and the next were discarded.
To determine the clarity, simplicity and ambiguity of each item, the total score in each
category (clarity, simplicity and ambiguity) that was marked by the experts, was the best
available measure to add, modify or delete some words from each items. Therefore, the
remaining items were modified, based on the experts' opinions. By discarding those
items of the scale that were not related to the domain of computer experience, the number
of items decreased from 38 to 25.
5 .7 .1 .2 Face Validity
Face validity refers to the subjective judgement of respondents which can determine the
formation of the tool that has been designed (Bush, 1985). This is measured by asking
the participants if they understand the questions. Another definition explained that "face
validity refers to the appearance of the instrument to the layman, that is, if upon cursory
inspection the instrument appears to measure what the test constructor claims" (Waltz and
Bausell, 1983: 71). Streiner and Norman (1991) argue that face validity of an instrument
can increase the acceptance level of the instrument by the subjects who ultimately use it.
To test the face validity of the SCES, the researcher distributed copies of the
questionnaire to 15 students of computer science, public health and nutrition at the
University of Wollongong and asked them to check the punctuation, mark ambiguous
items, give comments about the questions and add any suggestions that could improve the
178
instrument. On the basis of the feedback, the researcher modified the formation of some
items.
5 .7 .1 .3 Construct Validity
There are different definitions of construct validity. For example, Nieswiadomy (1987:
202) argues that "construct validity is concerned with the degree to which an instrument
measures the construct that it is supposed to measure". It refers to the degree that
instrument measures the theoretical construct it was designed to measure (Wilson, 1985).
Thus, construct validity unites psychometric notions with the theoretical notions
(Kerlinger, 1964). Construct validity of an instrument can be assessed in several ways
such as; known-groups (group differences), multitrait-multimethod and factorial validity.
In the current study, factorial validity was used.
Factor analysis is a powerful and essential method for identifying clusters of related
variables and each cluster that is called a factor, represents a relatively unity attribute.
Factor analysis examines interrelationships among large numbers of variables to identify
clusters of variables that are closely linked together. This method can reduce a large
number of variables to a small number called 'factor'. Polit and Hungler (1991: 473)
argue that "the purpose of factor analysis is to reduce a large set of variables into a
smaller, more manageable set of measures". Factor analysis can identify the variables that
have a similar mathematical structure. Items which appear to be in the same concept and
interpreted as having some common area in the dimension. Therefore, factor analysis aids
in the identification of theoretical constructs and the researcher is able to explain why the
variables are grouped in a particular way.
Most factor analysis consists of two different phases, the first phase refers to factor
extraction. The general goal of this phase is to cluster variables that are highly correlated
within the matrix. There are many methods in this regard. The 'principal components' is
one method that is used by many researchers.
179
The result of the first step of the factor analysis is a factor matrix that contains a weight
for each variable in the original data matrix on each extracted factor. There are several
criteria available for researchers to choose from to specify when factoring should be
stopped. Eigen value is one. The second phase is factor rotation. Researchers normally
work with rotated factor matrix for interpreting the factor analysis.
M ethod
To measure construct validity in the present study, the SCES was distributed to second
and third year computer science and business students at the University of Wollongong.
Based on Nunnally's (1967) guideline, the number of subjects for testing the SCES was
selected. The author argues that the larger the sample, the more representative is the
population. Thus, small samples would tend to produce less accurate estimates than larger
samples. It is better that the initial sample size be larger than the calculated number
because some questionnaires may not be completed or useful for the researcher. In the
current study, the SCES was distributed to 209 second and third year computer science
and business students of the university. The response rate of 202 (97%) was obtained.
Student participation in the study was voluntary. The questionnaires were administered to
the students by the researcher before the class began and they were requested to fill out
their responses during a class break or after class. The participants were also requested to
complete all the questions. After the class the researcher collected the questionnaires and
thanked the participants and the lectures for their co-operation. The researcher also
reminded the students that their results would be confidential. Permission of the Human
Research Ethics Committee of the University of Wollongong was obtained for the data
collection (Appendix 5.7).
To determine the total score for the scale, scoring for each statement on the Likert scale
was selected. A score of 1 was given to 'strongly agree', 2 to 'agree', 3 to 'uncertain', 4
to 'disagree', and 5 for 'strongly disagree'. For negative items these scores were
reversed. Total score for all items was computed taking the sum of scores over items.
180
The factor structure matrix for this revised scale was based on Principal Component
Analysis with varimax orthogonal rotation. A two factor solution was selected based on a
Scree test. For determining the minimum loading required for the inclusion of an item
within a scale, the guidelines that were recommended by Hair et al. (1987) were used. It
was suggested that a factor loading greater than 0.3 is considered significant, a loading
0.4 is considered more important and a loading 0.5 or greater 0.5 considered to be very
significant.
A cut off of 0.5 for factor loading was identified to be used. On application of this cut off
five items were deleted. Thus, on the basis of factor analysis the initial 25-item SCES
was reduced to 20 items. The two factors dealt with (1) positive computer experience and
(2) negative computer experience. An eigen value of 1 was employed in determining the
number of factors. Factor 1 contains 12 items (1, 3, 7, 9, 12, 13, 15, 17, 19, 20, 21, 25)
and factor 2, includes 8 items (8, 10, 11, 14, 16, 18, 22, 24). The SECS with 20 items
are presented in Table 5.2.
181

Table 5.2 Factor loading of the 20-item Subjective Computer Experience
Scale (SCES) on expolatory factor analysis
Item No Item stem Factor 1 Factor 2
9 'I really enjoy using computers'. 0.785
15 'I enjoy using a computer now that I have learned how to use computers'.
0.771
12 'Access to different areas of information through computers makes me confident'.
0.752
13 'I like to use computers at my level of experience'. 0.73825 'In general, my feeling towards computers is
positive'.0.735
17 'I felt positive after I leamt how to use computers'. 0.7063 'I have skills to use Electronic-mail (E-mail)'. 0.64619 'Computer training gives me confidence to use
computers'.0.635
1 'I have knowledge about one or more computer programming languages'.
0.614
7 'I feel confident about using computers'. 0.60521 'Having self-confidence helps me to learn
computer skills easily'.0.579
20 'After learning how to use computers felt that I achieved my goal'.
0.554
22 'I feel inadequate when I cannot solve computers problems'.
0.753
8 'I feel inadequate when I don't know enough about using computers'.
0.704
16 'Initial computer training experience was hard for m e'.
0.687
11 'I feel that I have failed if I can't use computers'. 0.662
18 'Computer jargon makes me afraid to learn about computers'.
0.662
14 'I become frustrated when I don't have skills to use certain programs'
0.633
10 'When I don't know how to use computers I become frustrated'.
0.627
24 'When computers have problems that I cannot solve I become frustrated'.
0.541
182
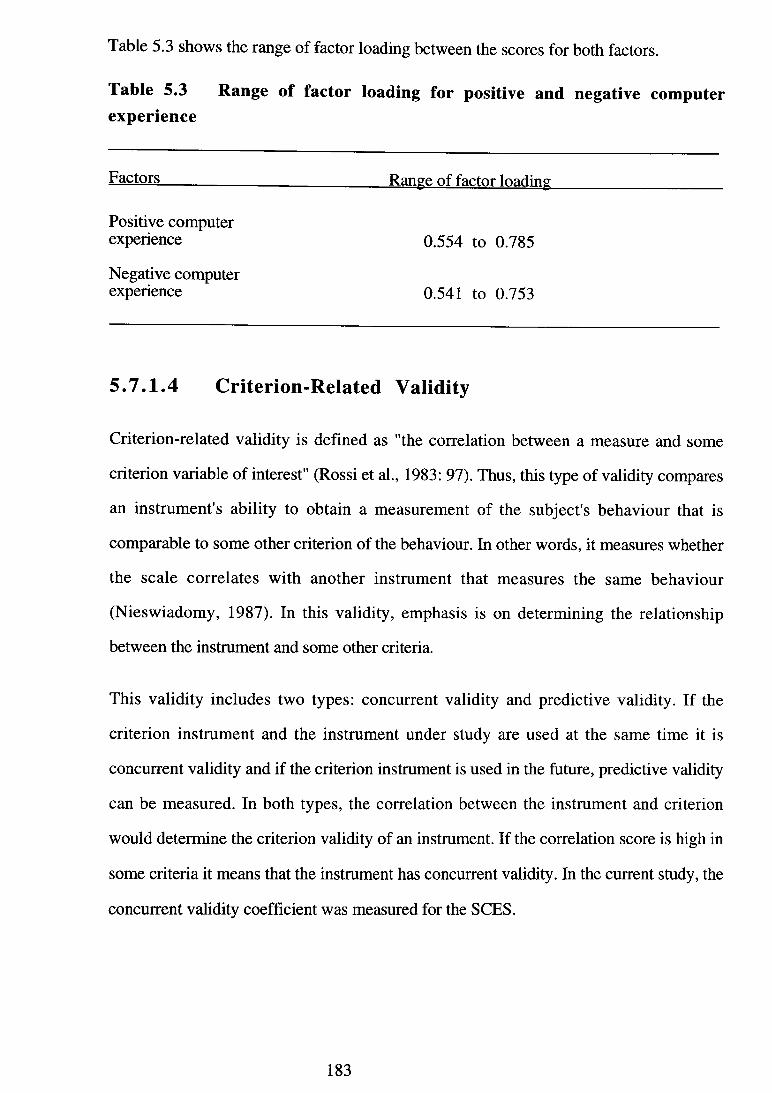
Table 5.3 shows the range of factor loading between the scores for both factors.
Table 5.3 Range of factor loading for positive and negative computer experience
Factors Ranee of factor loading
Positive computerexperience 0.554 to 0.785
Negative computerexperience 0.541 to 0.753
5 .7 .1 .4 Criterion-Related Validity
Criterion-related validity is defined as "the correlation between a measure and some
criterion variable of interest" (Rossi et al., 1983: 97). Thus, this type of validity compares
an instrument's ability to obtain a measurement of the subject's behaviour that is
comparable to some other criterion of the behaviour. In other words, it measures whether
the scale correlates with another instrument that measures the same behaviour
(Nieswiadomy, 1987). In this validity, emphasis is on determining the relationship
between the instrument and some other criteria.
This validity includes two types: concurrent validity and predictive validity. If the
criterion instrument and the instrument under study are used at the same time it is
concurrent validity and if the criterion instrument is used in the future, predictive validity
can be measured. In both types, the correlation between the instrument and criterion
would determine the criterion validity of an instrument. If the correlation score is high in
some criteria it means that the instrument has concurrent validity. In the current study, the
concurrent validity coefficient was measured for the SCES.
183

Concurrent Validity
This validity refers to "the ability of an instrument to distinguish individuals who differ in
their present status on some criterion" (Polit and Hungler, 1991: 377).
This validity determines the ability of a scale to measure interest behaviour with another
scale that measures the same behaviour. If the results of both scales give information
about high correlation coefficient it means that the new scale has concurrent validity.
Waltz and Bausell (1983) argue that this validity depends on the quality of the criterion
measure that is selected by the researcher.
There are many factors that can affect computer experience. One factor that positively
affects computer experience is the attitude of users toward computers. Experience can
promote the formation of attitudes and these attitudes then operate to modify the quality of
subsequent experiences. Previous computer experience is an essential variable in human-
computer interactions, because individuals with low or high levels of experience interact
with computers in different ways. Studies have shown that there is a consistent
relationship between computer experience, knowledge and attitudes (Dumdell et al.,
1987; Ertmer et al., 1994). Computer experience also can directly affect the attitudes of
users (Dambrot et al., 1985; Robinson-Staveley and Cooper, 1990; Igbaria and
Chakrabarti, 1990; Igbaria, 1992). Culpan (1995), argues that attitudes toward
information systems can be formed by past experience. Moreover, Regan and Fazio,
(1977) reported that the user's previous direct experiences can produce a stable attitude.
Thus, there is a positive relationship between computer experience and computer attitude.
In the current study, concurrent validity of the SCES was tested using an attitude scale.
To measure concurrent validity, Computer Attitude Scale (CATT) that has developed by
Dambrot et al. (1985) was used. CATT consists 20 items, 9 positive and 11 negative
items a 5-point Likert scale. The internal consistency (Coefficient alpha) was 0.79. In
another study, Dambrot et al. (1988) used the same scale in their study and the
Coefficient alpha was 0.81. Therefore, CATT as a reliable scale with SCES was
184
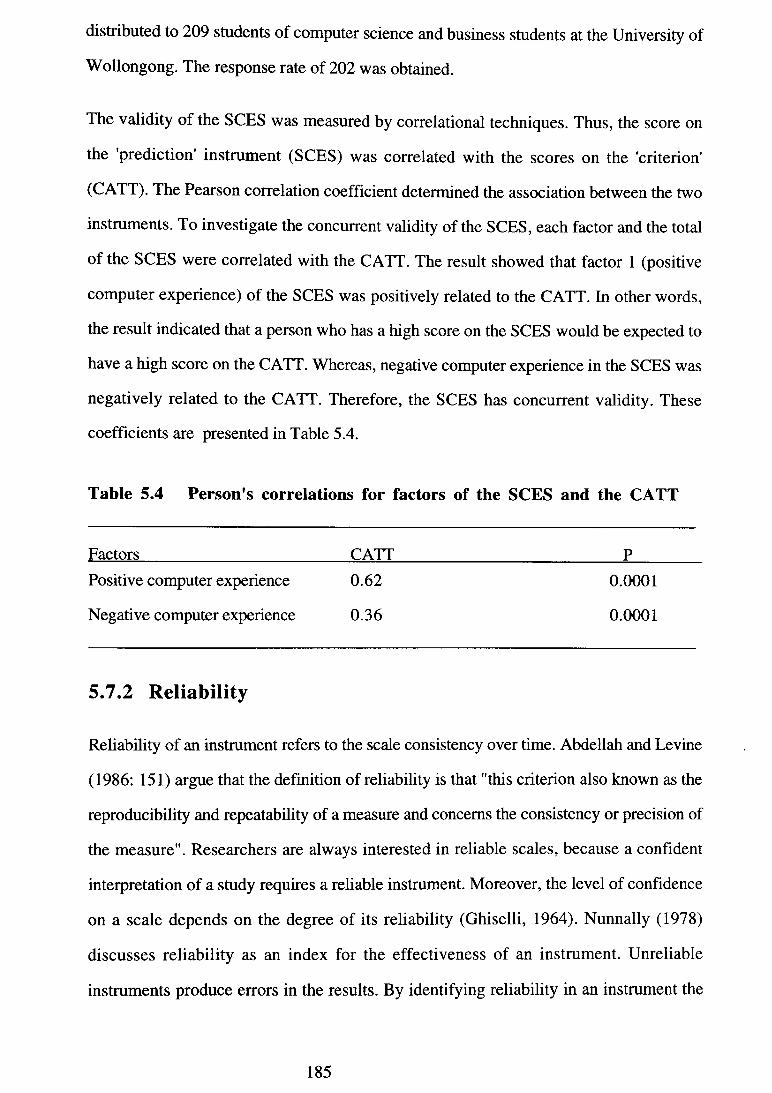
distributed to 209 students of computer science and business students at the University of
Wollongong. The response rate of 202 was obtained.
The validity of the SCES was measured by correlational techniques. Thus, the score on
the 'prediction' instrument (SCES) was correlated with the scores on the 'criterion'
(CATT). The Pearson correlation coefficient determined the association between the two
instruments. To investigate the concurrent validity of the SCES, each factor and the total
of the SCES were correlated with the CATT. The result showed that factor 1 (positive
computer experience) of the SCES was positively related to the CATT. In other words,
the result indicated that a person who has a high score on the SCES would be expected to
have a high score on the CATT. Whereas, negative computer experience in the SCES was
negatively related to the CATT. Therefore, the SCES has concurrent validity. These
coefficients are presented in Table 5.4.
Table 5.4 Person's correlations for factors of the SCES and the CATT
Factors CATT PPositive computer experience 0.62 0.0001
Negative computer experience 0.36 0.0001
5.7.2 Reliability
Reliability of an instrument refers to the scale consistency over time. Abdellah and Levine
(1986: 151) argue that the definition of reliability is that "this criterion also known as the
reproducibility and repeatability of a measure and concerns the consistency or precision of
the measure". Researchers are always interested in reliable scales, because a confident
interpretation of a study requires a reliable instrument. Moreover, the level of confidence
on a scale depends on the degree of its reliability (Ghiselli, 1964). Nunnally (1978)
discusses reliability as an index for the effectiveness of an instrument. Unreliable
instruments produce errors in the results. By identifying reliability in an instrument the
185
degree of error measurement can be found. Therefore, the less the error the greater the
reliability of measurement.
Kerlinger (1986: 404) argues that "synonyms for reliability are: dependability, stability,
consistency, predictability and accuracy". Measuring reliability of an instrument is based
on three aspects; stability, internal consistency/homogeneity and equivalence (parallel-
forms) (Bums and Grove, 1993).
Wilson (1985); Bums and Grove (1993) states that each scale should be checked for its
reliability before the study commences and the reliability of an instrument should be
assessed when the scale is used for different subjects in different situations.
The degree of reliability is usually determined by the use of correlation procedures. For a
newly developed instrument, a reliability of 0.70 is considered acceptable (Bums and
Grove, 1993). Polit and Hungler (1991) who also argue that for most purposes, a
reliability coefficient above 0.70 is acceptable. Nunnally (1978) points out that working
with instruments that have a modest degree of reliability is sufficient and increasing the
effort to achieve reliability beyond 0.80 is wasteful. However, the higher the coefficient
the more stable the measure.
5 .7 .2 .1 Stability Reliability
The stability reliability of an instrument refers to the scale consistency over time. If the
instrument measures the same set of objects many times with the same instrument and
gets the same results, the instmment is stable, dependable and predictable (Kerlinger,
1986). This view is supported by Polit and Hungler (1991) who argue that stability refers
to obtaining the same results from repeated administrations of the same instmment.
Measuring the stability of an instmment is possible using test-retest reliability.
The time between the two tests is important and should be considered. The period should
be sufficient for the subjects to forget the original questionnaire. Bums and Grove (1993)
recommended that the time between the two tests could be between 2-4 weeks. Torkzadeh
186
and Doll (1991) also argue that this length of duration between test-retest is necessary to
reduce the affects of memory. They farther state that another reason for longer periods of
time between testing is because when users respond to an item at the first test, often they
may have not thought of a certain aspect to the question. A long interval between test-
retest can provide an opportunity for them to think about aspects of which they were not
aware. After a gap of two weeks, it is less likely that the subjects will recall their earlier
response to a particular question. However, the ability of full recall would be improved
with the second test. In the interval between tests the subjects can provide some changes
that can influence the results of the study. Wilson (1989) argues that there is no standard
time between test-retest, but it should be long enough for subjects not to be able to recall
the questions and their responses. Thus, discrepancy in scores during lengthening
periods could more closely be associated with lack of stability of an instrument.
The stability of the SCES was measured by the test-retest method. For determining
stability, the SCES were administrated to 162 students of computer science and business
students (the same group) at the University of Wollongong. After three weeks, the scale
was administrated again to the same students. The responses of the students in the test
and retest were matched after testing the correctional analysis performed on the scores for
each time. Thus, the reliability of the scale was measured items with items in time (1) and
time (2). Test-retest reliability for factors after removing some unreliable items (12, 13,
16, 17, 8, 20, 22, 24), for factor (1) was 0.80 and for factor (2) was 0.65. The results
are presented in Table 5.5.
5 .7 .2 .2 Internal Consistency/Homogeneity
This reliability refers to "the extent to which all items on an instrument measure the same
variable" (Nieswiadomy, 1987: 199). Another definition states that "internal consistency
is a measure of how well all the items in the instrument relate to each other and to the total
instrument" (Wilson, 1989: 358). Therefore, when the instrument is internally consistent
and homogenous, all of its subparts are measuring the same traits (Polit and Hungler,
1991).
187
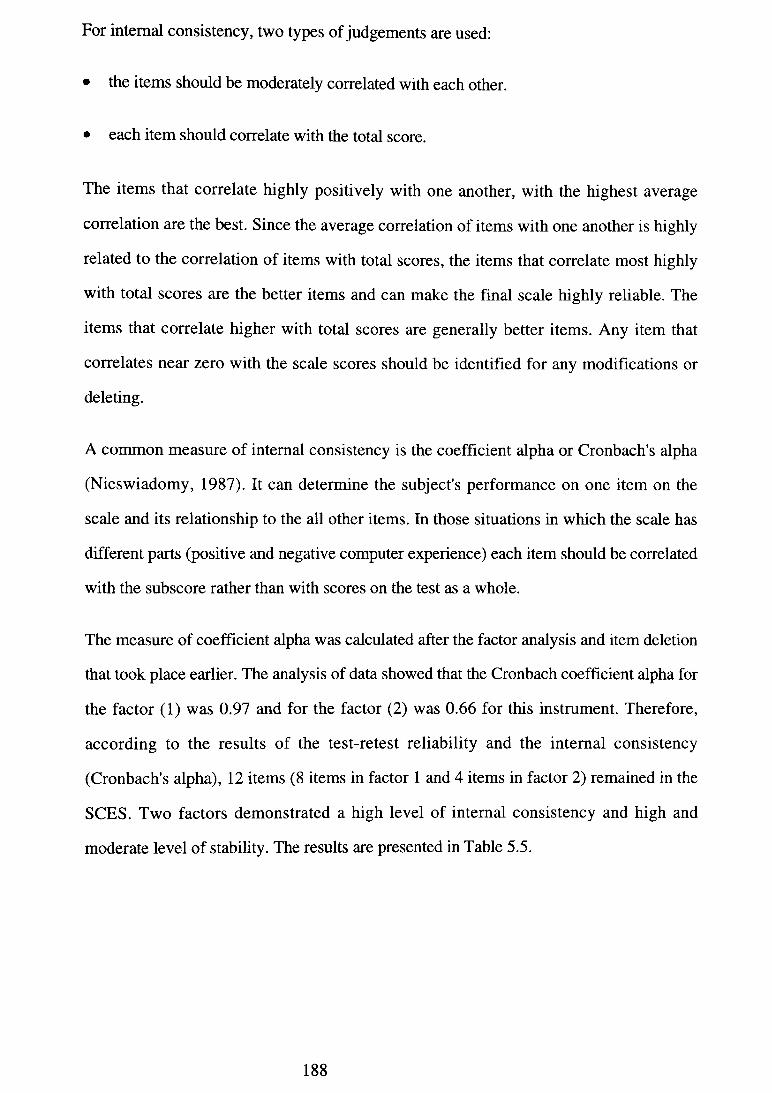
For internal consistency, two types of judgements are used:
• the items should be moderately correlated with each other.
• each item should correlate with the total score.
The items that correlate highly positively with one another, with the highest average
correlation are the best. Since the average correlation of items with one another is highly
related to the correlation of items with total scores, the items that correlate most highly
with total scores are the better items and can make the final scale highly reliable. The
items that correlate higher with total scores are generally better items. Any item that
correlates near zero with the scale scores should be identified for any modifications or
deleting.
A common measure of internal consistency is the coefficient alpha or Cronbach's alpha
(Nieswiadomy, 1987). It can determine the subject's performance on one item on the
scale and its relationship to the all other items. In those situations in which the scale has
different parts (positive and negative computer experience) each item should be correlated
with the subscore rather than with scores on the test as a whole.
The measure of coefficient alpha was calculated after the factor analysis and item deletion
that took place earlier. The analysis of data showed that the Cronbach coefficient alpha for
the factor (1) was 0.97 and for the factor (2) was 0.66 for this instrument. Therefore,
according to the results of the test-retest reliability and the internal consistency
(Cronbach's alpha), 12 items (8 items in factor 1 and 4 items in factor 2) remained in the
SCES. Two factors demonstrated a high level of internal consistency and high and
moderate level of stability. The results are presented in Table 5.5.
188
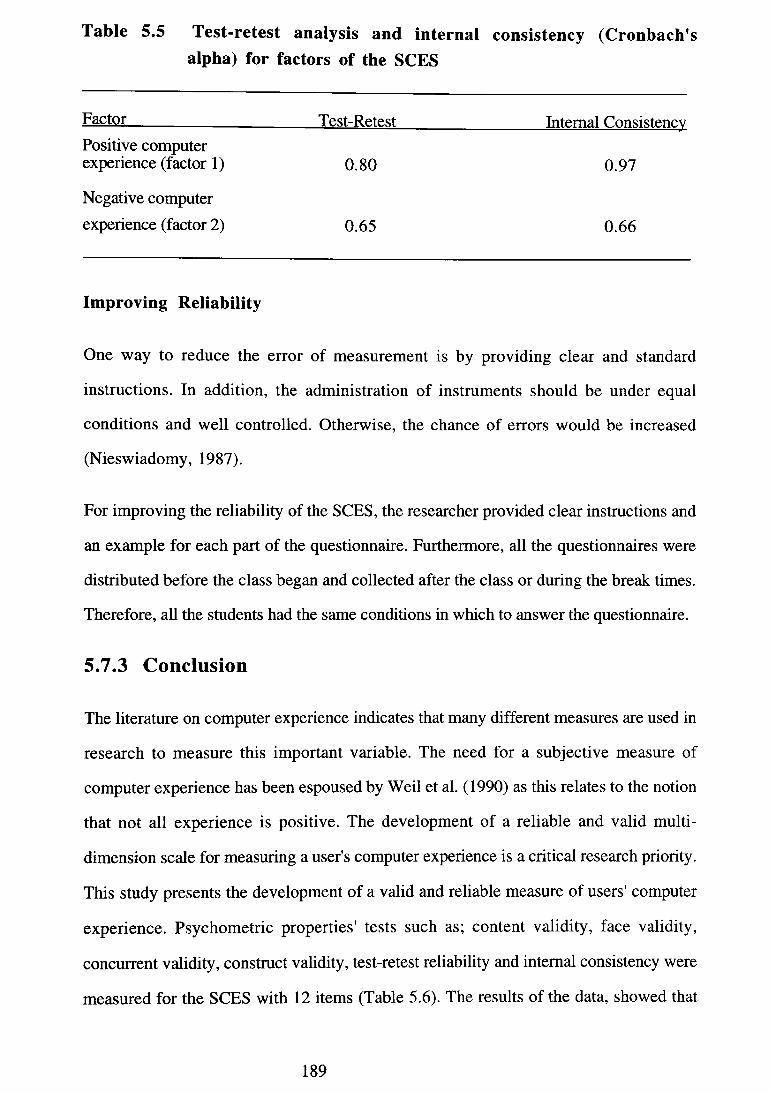
Table 5.5 T est-retest analysis and internal consistency (C ronbach’s alpha) for factors of the SCES
Factor Test-Retest Internal ConsistencvPositive computerexperience (factor 1) 0.80 0.97
Negative computer
experience (factor 2) 0.65 0.66
Im proving Reliability
One way to reduce the error of measurement is by providing clear and standard
instructions. In addition, the administration of instruments should be under equal
conditions and well controlled. Otherwise, the chance of errors would be increased
(Nieswiadomy, 1987).
For improving the reliability of the SCES, the researcher provided clear instructions and
an example for each part of the questionnaire. Furthermore, all the questionnaires were
distributed before the class began and collected after the class or during the break times.
Therefore, all the students had the same conditions in which to answer the questionnaire.
5.7.3 Conclusion
The literature on computer experience indicates that many different measures are used in
research to measure this important variable. The need for a subjective measure of
computer experience has been espoused by Weil et al. (1990) as this relates to the notion
that not all experience is positive. The development of a reliable and valid multi
dimension scale for measuring a user's computer experience is a critical research priority.
This study presents the development of a valid and reliable measure of users' computer
experience. Psychometric properties' tests such as; content validity, face validity,
concurrent validity, construct validity, test-retest reliability and internal consistency were
measured for the SCES with 12 items (Table 5.6). The results of the data, showed that
189

this scale contains two subscales; subscale 1) positive computer experience, with 8 items
and subscale 2) negative computer experience, with 4 items. The internal consistency of
the factors was 0.97 (8 items) and 0.65 (4 items). The items in factor 1 revealed
subjective computer experience to relate to 'confidence-skills-enjoyment' while factor 2
seems to tap 'failure-fear-frustration'. It seems that internal consistency and test-retest
reliability of factor two are not as good as factor one and it needs further validation. The
scale was compared with the Dambrot's computer attitude scale (CATT) to test concurrent
validity. While factor one shows that it relates to computer attitude, factor 2 is not highly
correlated. This may indicate that negative subjective computer experience is different to
computer attitudes.
The large investment in information technology and the degree of organisational
dependence on information resources reinforces the value of this study.
However, the measurement instrument developed in this study will undergo further
testing in the main study. Further research, especially aimed at further clarification of the
underlying constructs and assuring the reliability and validity of the instrument, would
lead to reinforce and increase generalisabilty. Validation of measures is an ongoing
process, which requires the assessment of psychometric properties over a variety of
studies in similar and different contexts. Thus, in this process, other organisations could
be targeted for in-depth analysis of the SCES.
190

Table 5.6 Subjective Com puter Experience Scale (SCES): Varimax-
rotated factor pattern for Principal Component Analysis
Item No Item stem Factor 1 Factor 2
9 'I really enjoy using computers'. 0.785
15 'I enjoy using a computer now that I have learned how to use computers'.
0.771
25 'In general, my feeling towards computers is positive'.
0.735
3 'I have skills to use Electronic-mail (E-mail)'. 0.646
19 'Computer training gives me confidence to use computers'.
0.635
1 'I have knowledge about one or more computer programming languages'.
0.614
7 'I feel confident about using computers'. 0.605
21 'Having self-confidence helps me to learn computer skills easily'.
0.579
11 'I feel that I have failed if I can't use computers'. 0.662
18 'Computer jargon makes me afraid to learn about computers'.
0.662
14 'I become frustrated when I don't have skills to use certain programs'.
0.633
10 'When I don't know how to use computers I become frustrated'.
0.627
Eigen Values 4.27 2.51
% of Total Variance explained 35.6 20.9
% of Common variance explained 63.0 37.0
191

Chapter 6
Study Methodology
6.1 Introduction
The present section deals with the methodology of the study, the variables, sampling
procedure, and instruments for measuring the research variables. The pilot study, data
collection and the techniques for statistical are discussed.
6.2 Method of the Study
The current research uses an ex post facto research model. There was no manipulation of
the independent variables, as they have been shaped previously (Wasserbauer and
Abrham, 1995). This research is exploratory to identify relationships between variables.
The goal is to discover, explain and predict the relationships between the variables in the
research model from an analysis of the data. Therefore, prediction of computerised
systems usage is possible by estimating the scores of independent variables on dependent
variables in the research model.
Furthermore, the present study uses an analytic path study. Which is a technique that can
obtain relationships among hypotheses in a non experimental study and requires the use
of sophisticated statistical producers (Polit and Hungler, 1991). Researchers can test
many situations which exist on the basis of a theory or conceptual model. This allows
researchers to test whether the data supports the model (Wasserbauer and Abrham,
1995). This method can also determine the main effects and how interaction affects two
or more variables on other variables.
192
6.3 Variables of the Study
Numerous variables have been suggested and employed as independent and dependent
variables in the literature of management information system (MIS). The research model
of the present study includes many specific independent variables that have either been
used in previous empirical research or suggested by other authors in the past. In the
present study the independent variables include: demographic characteristics, user
characteristics, organisational support and users involvement. Furthermore, the users'
attitude toward using computers, the subjective norms to use computers as intermediate
variables and the intention to use computerised systems as a dependent variables were
considered. These variables were measured by means of a questionnaire.
6.4 Instruments for Measuring Variables
6.4 .1 Computer Training
The review of the literature related to management information systems showed that
computer instrument measured computer training differently based on the purpose of the
study. In the current study, the researcher used a 5-point Likert scale ranging from
'strongly agree' to 'strongly disagree'. The scale measured three dimensions of training:
quantity, intensity and quality. The reliability of the scale was 0.85.
6.4.2 Computer Experience
6.4.2.1 Subjective Computer Experience Scale (SCES)
To measure computer experience, the researcher used the Subjective Computer
Experience Scale (SCES) that was developed for this study (chapter 4). The results of the
study, showed that the SCES contains two factors: factor 1) positive computer experience
(with 8 items) and factor 2) negative computer experience (with 4 items). The
respondents were asked to indicate on a 5-point scale ranging from 'strongly agree' to
'strongly disagree'. Therefore, the SCES with 12 items was used for measuring
subjective computer experience. The reliability of the scale was 0.82.
193
6 .4 .2 .2 Objective Computer Experience (OCE)
Objective Computer Experience (OCE) consists of seven questions such as; computer
experience at work, access to home computer, using home computer etc.
6.4.3 Management Support
To measure management support 8-item scale, that was developed by Igbaria and
Chakrabarti (1990), was used. This scale contains two broad categories of support: 1)
information centre support and 2) general support. The respondent were asked to indicate
on a 5-point Likert scale ranging from 'strongly agree' to 'strongly disagree'. The
reliability of the scale was 0.81.
6.4.4 User Involvement
In the current study, user involvement was measured by 9 items that was developed by
Barki and Hartwick (1994). This scale contains two dimensions of importance and
personal relevance. This instrument is a 7-point semantic differential scale. The reliability
of the scale was 0.92.
6 .4 .5 Computer Attitude
Jayasuriya et al. (1994) developed Nurse's Computer attitudes Inventory (NCATT) with
22 items. The scale is a 5-point Likert scale, ranging from 'strongly agree' to 'strongly
disagree'. The NCATT has three factors: 1) patient care 2) computer anxiety 3) patient
confidentiality (Jayasuriya and Caputi, 1996). The NCATT was used for measuring
computer attitude in this study. In this study, the NCATT was used as one scale. The
reliability of the scale was 0.90.
194

6.4.6 Subjective Norms
To measure the subjective norms, Hebert (1994) developed a scale with 6 items regarding
peers, nursing managers, directors of nursing, professional associations and union
memberships. The scale is a 5-point Likert scale, ranging from 'strongly agree' to
'strongly disagree'. In the current study, this scale was used to assess subjective norms.
The reliability of the scale was 0.82.
6.4.7 Intention to Use Computers
For measuring behavioural intention, Hebert (1994) developed 4 items. The scale is a 5-
point Likert scale, ranging from 'strongly agree' to 'strongly disagree'. The reliability of
the scale was 0.83.
Therefore, the research questionnaire (Appendix 6.1) that was administered to the
participants consisted of:
1) Computer attitude toward using computers (NCATT)
2) Subjective Computer Experience Scale (SCES)
3) Management support
4) Subjective norms
5) Intent to use computers
6) Computer training
7) User involvement
8) Questions regarding to objective computer experience, and
9) Demographic questions.
195

6.5 Pilot Study
Identifying any defects in questionnaires is important, especially for mailed
questionnaires, because it may be difficult for the researcher to identify all the defects in
the questionnaire, and the researcher cannot identify respondents' difficulties in
answering questions. For finding any problems related to the questionnaire, a pilot study
can be helpful because it can be used for determining the clarity of questions and
instructions, effectiveness of instrument, time for answering, unfamiliar words, etc. Polit
and Hungler (1991) argue that a pilot study is a small version or trial of the main study.
Prescott and Soeken (1989: 60) point out that a pilot study can assess the "a) feasibility
of the planned study b) adequacy of the instruction and c) problems in data collection
strategies and proposed methods". Therefore, if the subjects and techniques of the pilot
study are similar to the major study it will give information regarding any problems that
may arise in the main study.
For testing the questionnaire on subjects, Dillman (1978) argues that a pilot study can be
submitted to three groups of people for testing; colleagues, users of the data, and
populations that should be surveyed.
In the current study, the main questionnaire with 78 questions was given to a group of
subjects (nurses and health workers) to determine any problems in the questionnaire and
the instructions before the main study. On the basis of the feedback, the researcher
modified some words of the questionnaire to be appropriate for the field study and
appropriate for nurses and health workers. However, the modification did not affect the
meaning of the scales.
6.6 Sample
The population of a study is sometimes referred to as the target population. In the current
study, the target population consisted of all health workers employed in the Community
Health Centres in the Illawarra Area Health Service. There are 51 centres and all
functional areas are represented including the dental clinic health education office,
196
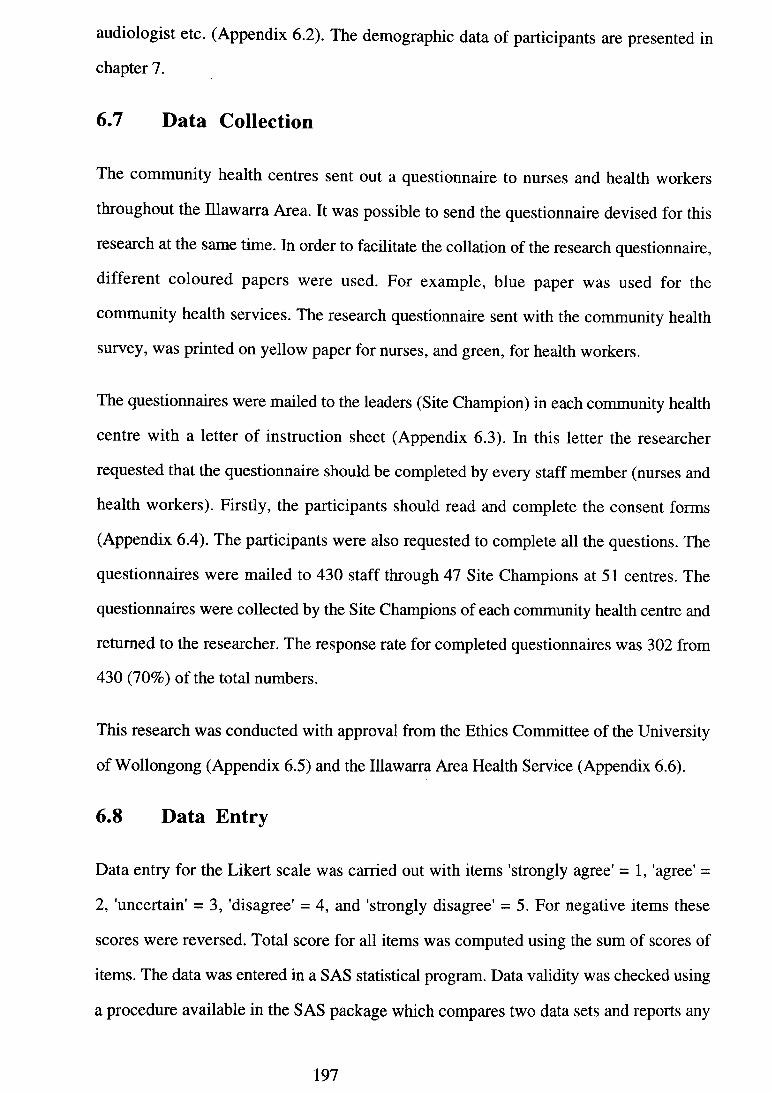
audiologist etc. (Appendix 6.2). The demographic data of participants are presented in
chapter 7.
6.7 Data Collection
The community health centres sent out a questionnaire to nurses and health workers
throughout the Illawarra Area. It was possible to send the questionnaire devised for this
research at the same time. In order to facilitate the collation of the research questionnaire,
different coloured papers were used. For example, blue paper was used for the
community health services. The research questionnaire sent with the community health
survey, was printed on yellow paper for nurses, and green, for health workers.
The questionnaires were mailed to the leaders (Site Champion) in each community health
centre with a letter of instruction sheet (Appendix 6.3). In this letter the researcher
requested that the questionnaire should be completed by every staff member (nurses and
health workers). Firstly, the participants should read and complete the consent forms
(Appendix 6.4). The participants were also requested to complete all the questions. The
questionnaires were mailed to 430 staff through 47 Site Champions at 51 centres. The
questionnaires were collected by the Site Champions of each community health centre and
returned to the researcher. The response rate for completed questionnaires was 302 from
430 (70%) of the total numbers.
This research was conducted with approval from the Ethics Committee of the University
of Wollongong (Appendix 6.5) and the Illawarra Area Health Service (Appendix 6.6).
6.8 Data Entry
Data entry for the Likert scale was carried out with items 'strongly agree' = 1, 'agree' =
2, 'uncertain' = 3, 'disagree' = 4, and 'strongly disagree' = 5. For negative items these
scores were reversed. Total score for all items was computed using the sum of scores of
items. The data was entered in a SAS statistical program. Data validity was checked using
a procedure available in the SAS package which compares two data sets and reports any
197
inconsistencies. For checking the validity of data entry, a sample of 50 questionnaires
were entered by one of the statisticians into a second data set. The comparison with the
original, showed no inconsistencies.
6.9 Data Analysis
The results of the study are discussed in chapter 7, chapter 8, and chapter 9.
198

Chapter 7
Results of Participants Characteristics. Computer Training and Objective Computer Experience
7.1 Introduction
In this chapter the results of the survey that pertain to participants characteristics,
computer training and the Objective Computer Experience are discussed. Computer
training is a variable in the research model. The total number of the participants was 302,
but of these (191) had not attended any computer courses, and consequently, they were
excluded for the research model. Initially, the Scale Of Computer Experience (SOCE) that
was developed for this study, (see chapter 5), contains two parts: Subjective Computer
Experience Scale (SCES) and Objective Computer Experience (OCE). The results of the
OCE in this chapter and the SCES in chapter 9 are presented.
7.2 Demographic Characteristics of Participants
Table 7.1 Frequency distribution of participants by gender
G ender Frequency Percent
Male 35 11.6%Female 262 86.8%No response 5 1.6%
Total 302 100.0%
Table 7.1 shows the frequency of gender in the study. Of the respondents, most of them,
86.8 %, were women and 11.6 % were men.
199
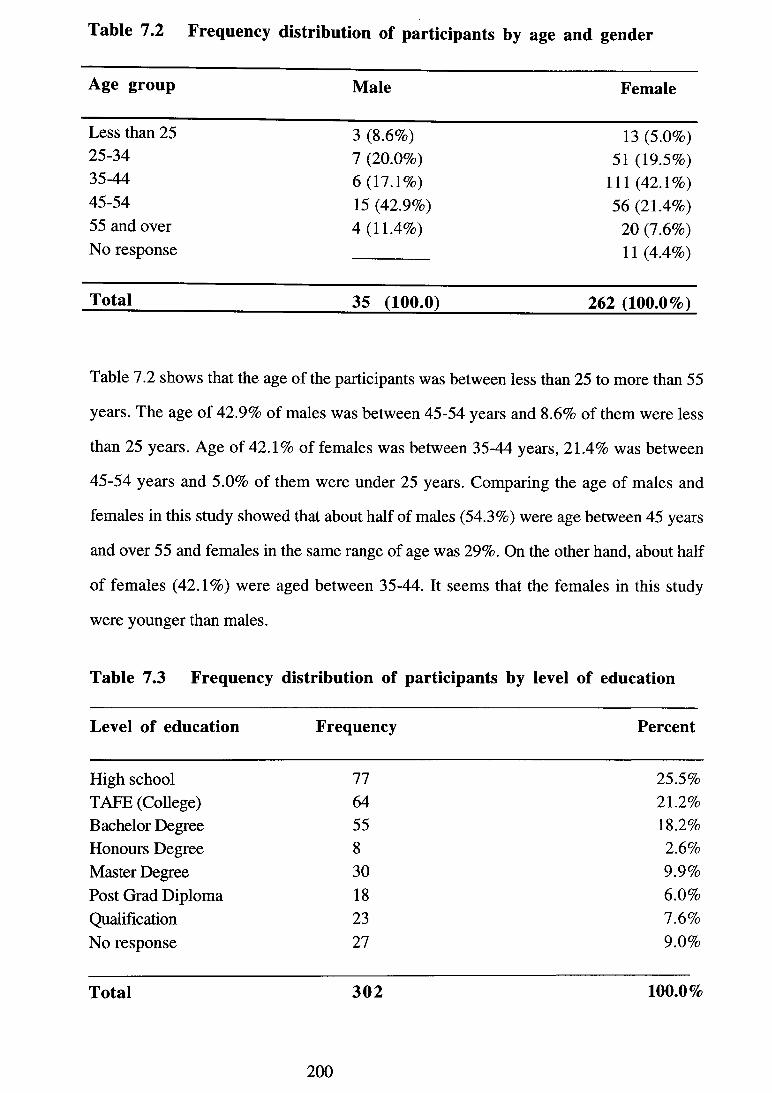
Table 7.2 Frequency distribution of participants by age and gender
Age group Male Female
Less than 25 3 (8.6%) 13 (5.0%)25-34 7 (20.0%) 51 (19.5%)35-44 6(17.1% ) 111 (42.1%)45-54 15 (42.9%) 56 (21.4%)55 and over 4(11.4% ) 20 (7.6%)No response 11 (4.4%)
Total 35 (100.0) 262 (100.0%)
Table 7.2 shows that the age of the participants was between less than 25 to more than 55
years. The age of 42.9% of males was between 45-54 years and 8.6% of them were less
than 25 years. Age of 42.1% of females was between 35-44 years, 21.4% was between
45-54 years and 5.0% of them were under 25 years. Comparing the age of males and
females in this study showed that about half of males (54.3%) were age between 45 years
and over 55 and females in the same range of age was 29%. On the other hand, about half
of females (42.1%) were aged between 35-44. It seems that the females in this study
were younger than males.
Table 7.3 Frequency distribution of participants by level of education
Level o f education Frequency Percent
High school 77 25.5%TAPE (College) 64 21.2%Bachelor Degree 55 18.2%Honours Degree 8 2.6%Master Degree 30 9.9%Post Grad Diploma 18 6.0%Qualification 23 7.6%No response 27 9.0%
Total 302 100.0%
2 0 0

The results also showed that 25.5% of the participants had education in level of high
school, 21.2% college and 18.2% bachelor of degree. The rest of participants had other
level of degree (Table 7.3).
Table 7.4 Frequency distribution of nurses and health workers by age
Age Less than
2525-34 35-44 45-54
Morethan55
Total %GroupsNurses
—
13 45 34 9 101 34.7Healthworker 16 45 75 39 15 190 65.3Total
16 58 120 73 24 291 100.0Percent 5.5 19.9 41.2 25.1 8.3 100.0 _
In this study, about two-third of participants (65.3 %) were health workers and one-third
34.7 % were nurses. The results also showed that 41.2% of participants had age between
35-44 years and 25.1% had 45-54 years (Table 7.4).
Table 7.5 Frequency distribution of nurses and health workers by level of education
EducationHigh
SchoolTAFE Bachelor
DegreeHonour Master Diploma RN Total %
Groups
Nurse 26 18 10 1 5 10 22 92 33.5HealthWorker 51 46 45 7 25 8 1 183 66.5
Total 77 64 55 8 30 18 23 275 100.0
Percent 28.0 23.3 20.0 2.9 10.9 6.5 8.4 100.0 -
Of 92 nurses, 26 of them had high school education level, 22 registered nurse and 18
were educated at TAPE (college). There were 183 health workers in the study, 51 of their
had finished high school, 46 had a TAFE (college) qualification and 45 university
bachelor degree, 7 had an honour degree (Table 7.5).
2 0 1
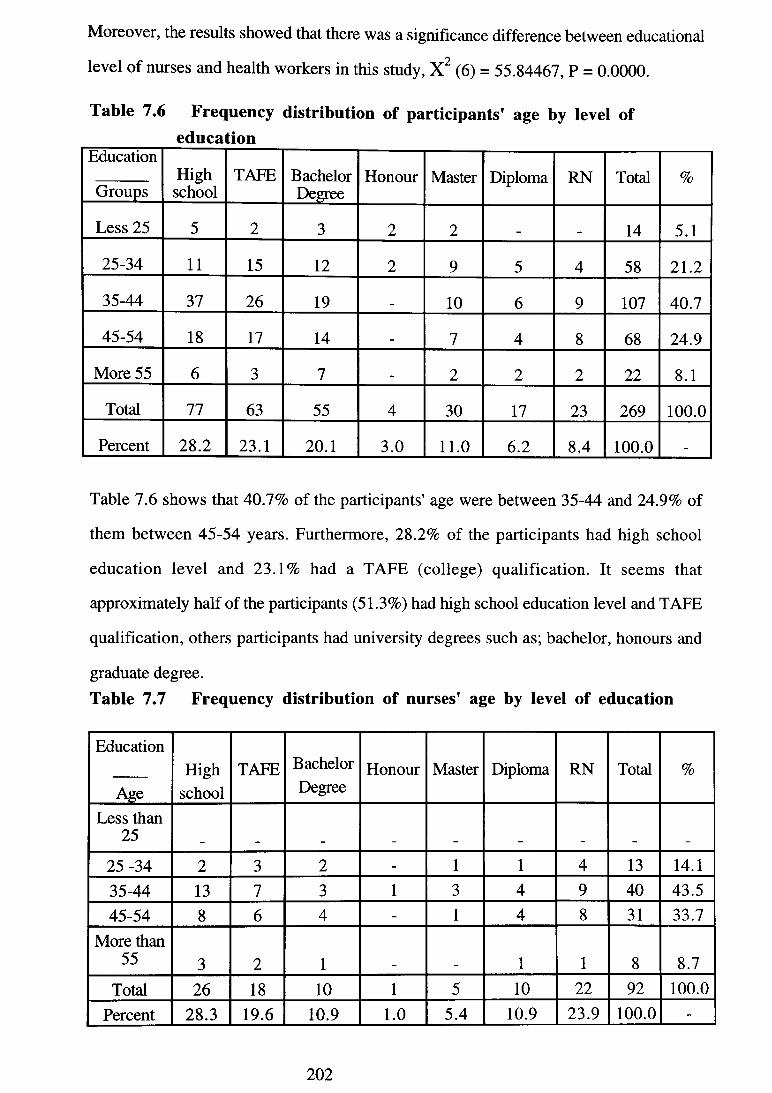
Moreover, the results showed that there was a significance difference between educational
level of nurses and health workers in this study, X 2 (6) = 55.84467, P = 0.0000.
Table 7.6 Frequency distribution of education
participants' age by level of
EducationHighschool
TAFE BachelorDegree
Honour Master Diploma RN Total %Groups
Less 25 5 2 3 2 2 14 5.1
25-34 11 15 12 2 9 5 4 58 21.2
35-44 37 26 19 10 6 9 107 40.7
45-54 18 17 14 7 4 8 68 24.9
More 55 6 3 7 . 2 2 2 22 8.1
Total 77 63 55 4 30 17 23 269 100.0
Percent 28.2 23.1 20.1 3.0 11.0 6.2 8.4 100.0 _
Table 7.6 shows that 40.7% of the participants' age were between 35-44 and 24.9% of
them between 45-54 years. Furthermore, 28.2% of the participants had high school
education level and 23.1% had a TAFE (college) qualification. It seems that
approximately half of the participants (51.3%) had high school education level and TAFE
qualification, others participants had university degrees such as; bachelor, honours and
graduate degree.Table 7.7 Frequency distribution of nurses' age by level of education
Education
AgeHigh
schoolTAFE Bachelor
DegreeHonour Master Diploma RN Total %
Less than 25
25 -34 2 3 2 - 1 1 4 13 14.135-44 13 7 3 1 3 4 9 40 43.545-54 8 6 4 - 1 4 8 31 33.7
More than 55 3 2 1 1 1 8 8.7
Total 26 18 10 1 5 10 22 92 100.0
Percent 28.3 19.6 10.9 1.0 5.4 10.9 23.9 100.0 -
2 0 2

Table 7.7 illustrated that about half of nurses (47.9%) had high school and TAFE
qualification and others had university degrees. The results also showed that none of the
nurses was under 25 years. Furthermore, 43.5% of the nurses in this study were
between 35-44 years and 33.7% were aged 45-54 years.
Table 7.8 Frequency distribution of health w orkers’ age by level of education
Education
AgeHighschool
TAFE BachelorDegree
Honour Master Diploma RN Total %
Less than 25 5 2 3 2 2 14 7.7
25-34 9 12 10 2 8 4 - 45 24.935-44 24 19 16 3 7 2 - 71 39.245-54 10 11 10 - 6 - - 37 20.5More
than 55 3 1 6 2 1 1 14 7.7Total 51 45 45 7 25 7 1 181 100.0
Percent 28.2 24.9 24.9 3.9 13.8 3.9 0.4 100.0 -
Table 7.8 shows that 28.2% of the health workers had high school education, 24.9% of
them had TAFE (college) qualification and 24.9% university degree. Moreover, the age
of most health workers was between 35- 44 years (39.2%) and 25-34 years (24.9%).
The results also showed that there is a significant difference between age of nurses and
health workers in the study, X 2 (4) = 17.40584, P = 0.00161. Table 7.7 and Table 7.8
shows that the age of most nurses and health workers ranged between 35-44 years
(nurses = 43.5% and health workers = 39.2%). In addition, 33.7% of nurses age were
between 45-54, and health workers in this category were 20.5%. Thus, more nurses
were in category 3 (35-44). On the other hand, 24.9% of the health workers were
between 25-34, and nurses in this category were 14.1%. Therefore, in this study, the
health workers were younger than the nurses.
203
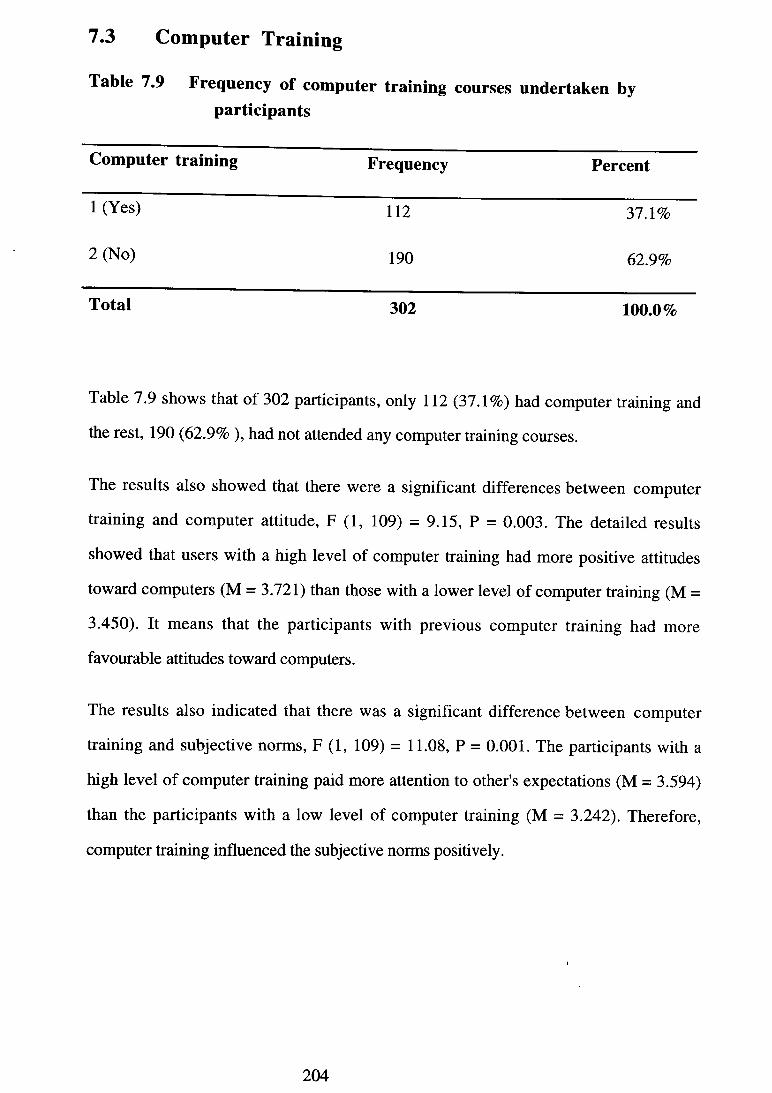
Table 7.9 Frequency of computer training courses undertaken by participants
7.3 Computer Training
Computer training Frequency Percent
1 (Yes) 112 37.1%
2 (No) 190 62.9%
Total 302 100.0%
Table 7.9 shows that of 302 participants, only 112 (37.1%) had computer training and
the rest, 190 (62.9% ), had not attended any computer training courses.
The results also showed that there were a significant differences between computer
training and computer attitude, F (1, 109) = 9.15, P = 0.003. The detailed results
showed that users with a high level of computer training had more positive attitudes
toward computers (M = 3.721) than those with a lower level of computer training (M =
3.450). It means that the participants with previous computer training had more
favourable attitudes toward computers.
The results also indicated that there was a significant difference between computer
training and subjective norms, F (1, 109) = 11.08, P = 0.001. The participants with a
high level of computer training paid more attention to other's expectations (M = 3.594)
than the participants with a low level of computer training (M = 3.242). Therefore,
computer training influenced the subjective norms positively.
204
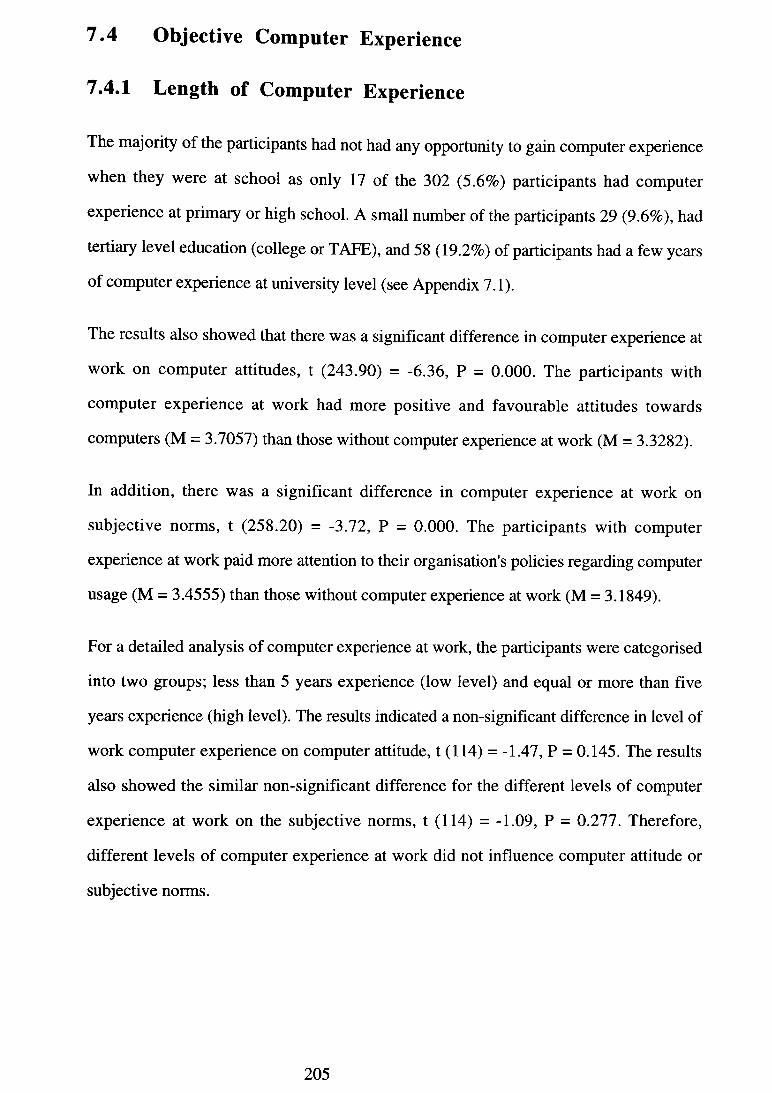
7.4.1 Length of Computer Experience
The majority of the participants had not had any opportunity to gain computer experience
when they were at school as only 17 of the 302 (5.6%) participants had computer
experience at primary or high school. A small number of the participants 29 (9.6%), had
tertiary level education (college or TAFE), and 58 (19.2%) of participants had a few years
of computer experience at university level (see Appendix 7.1).
The results also showed that there was a significant difference in computer experience at
work on computer attitudes, t (243.90) = -6.36, P = 0.000. The participants with
computer experience at work had more positive and favourable attitudes towards
computers (M = 3.7057) than those without computer experience at work (M = 3.3282).
In addition, there was a significant difference in computer experience at work on
subjective norms, t (258.20) = -3.72, P = 0.000. The participants with computer
experience at work paid more attention to their organisation's policies regarding computer
usage (M = 3.4555) than those without computer experience at work (M = 3.1849).
For a detailed analysis of computer experience at work, the participants were categorised
into two groups; less than 5 years experience (low level) and equal or more than five
years experience (high level). The results indicated a non-significant difference in level of
work computer experience on computer attitude, t (114) = -1.47, P = 0.145. The results
also showed the similar non-significant difference for the different levels of computer
experience at work on the subjective norms, t (114) = -1.09, P = 0.277. Therefore,
different levels of computer experience at work did not influence computer attitude or
subjective norms.
7.4 Objective Computer Experience
205

Table 7.10 Frequency of home computers among participants
7.4.2 Access to Home Computers
Home computer Frequency Percent
1 (Yes) 172 57.0%
2 (No) 124 41.1%
No response 6 2.0%Total 302 100.0%
Table 7.10 illustrates that of 302 participants, 172 (57%) had computer at home and 124
(41.1%) had not.
The participants with home computers had more favourable computer attitudes (M =
3.5790) than the participants without home computers (M = 3.3251). The results
indicated that this difference was significant, t (265.00) = 4.11, P = 0.000. However,
access to a home computer had no significant effect on the subjective norms, t (292) =
-1.49, P = 0.075.
7.4.3 Using Home Computers
Table 7.11 Frequency of using home computer by participants
Variables Frequency Percent
Never 36 12.3%Less than three hours per week 88 29.1%More than three hours per week 56 18.5%No response 122 40.1%
Total 3 0 2 100.0%
206
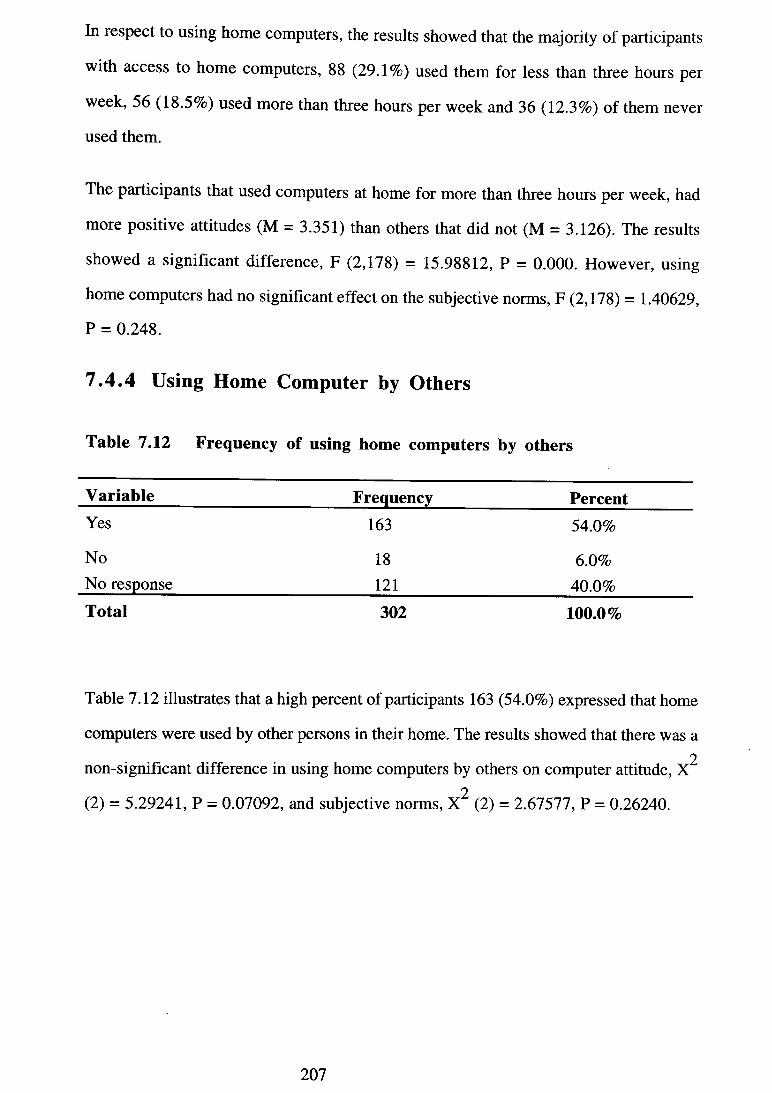
In respect to using home computers, the results showed that the majority of participants
with access to home computers, 88 (29.1%) used them for less than three hours per
week, 56 (18.5%) used more than three hours per week and 36 (12.3%) of them never
used them.
The participants that used computers at home for more than three hours per week, had
more positive attitudes (M = 3.351) than others that did not (M = 3.126). The results
showed a significant difference, F (2,178) = 15.98812, P = 0.000. However, using
home computers had no significant effect on the subjective norms, F (2,178) = 1.40629,
P = 0.248.
7 .4 .4 Using Home Computer by Others
Table 7.12 Frequency of using home computers by others
Variable Frequency PercentYes 163 54.0%
No 18 6.0%No response 121 40.0%Total 302 100.0%
Table 7.12 illustrates that a high percent of participants 163 (54.0%) expressed that home
computers were used by other persons in their home. The results showed that there was a2
non-significant difference in using home computers by others on computer attitude, X
(2) = 5.29241, P = 0.07092, and subjective norms, (2) = 2.67577, P = 0.26240.
207
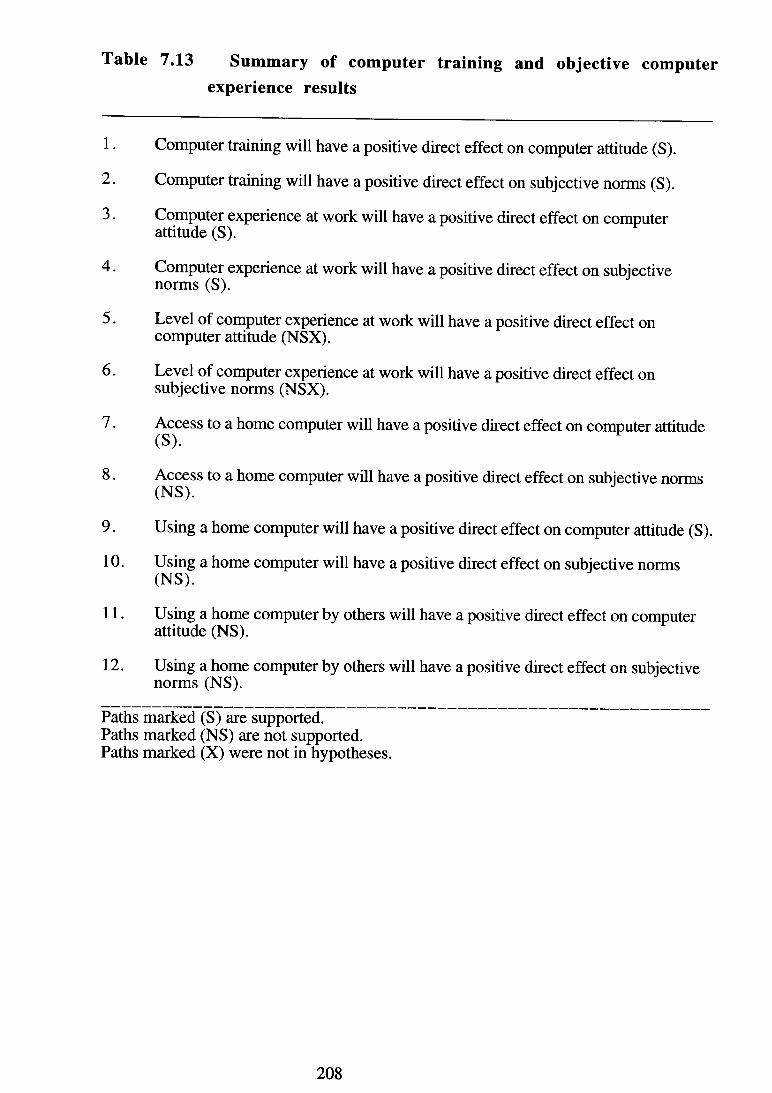
Table 7.13 Sum m ary o f com puter training and objective computer experience results
1. Computer training will have a positive direct effect on computer attitude (S).
2. Computer training will have a positive direct effect on subjective norms (S).
3. Computer experience at work will have a positive direct effect on computer attitude (S).
4. Computer experience at work will have a positive direct effect on subjective norms (S).
5. Level of computer experience at work will have a positive direct effect on computer attitude (NSX).
6. Level of computer experience at work will have a positive direct effect on subjective norms (NSX).
7. Access to a home computer will have a positive direct effect on computer attitude(S). F
8. Access to a home computer will have a positive direct effect on subjective norms (NS).
9. Using a home computer will have a positive direct effect on computer attitude (S).
10. Using a home computer will have a positive direct effect on subjective norms (NS).
11. Using a home computer by others will have a positive direct effect on computer attitude (NS).
12. Using a home computer by others will have a positive direct effect on subjective norms (NS).
Paths marked (S) are supported.Paths marked (NS) are not supported. Paths marked (X) were not in hypotheses.
208
7.5 Discussion
7.5.1 Computer Training
The effect of user training on computer attitude emphasises the need for training
programs, newsletter or/and workshops to improve the user's knowledge with computer
systems. This study confirms the important role of computer training that can influence
the user's perceptions and beliefs. Computer training should be taken into account by
those attempting to design or implement successful systems. Offering computer training
with a carefully selected content can lead to positive feelings for the participants and they
can control their computer interactions. Users should be trained, especially for new
computer systems and software, until they feel comfortable using them. The increasing
levels of computer literacy among users means that computer usage will increase in the
future.
The result also showed a significant difference between computer training and subjective
norms to use computers. The participants with more computer training paid more
attention to the organisational policies and their peers to use computers. This result
supports the importance of computer training as part of the information system (IS)
managers' task and improves the relationship among users, managers and other staff.
In general, the findings emphasise the importance of computer training and its effect on
users' attitude and subjective norms to use computers. By providing computer training,
which is tailored to the demands of the user's workplace, effective computer usage will
be provided. The finding that computer training affected computer attitude, suggests that
more effective training programs may increase their positive beliefs and attitudes.
209

7.5.2 Objective Computer Experience
Objective computer experience is an important component of computer experience and
could answer many questions that managers are currently facing about inefficient system
usage in their organisations. In this study only a low percentage of the participants had
computer experience in school because introducing and using computers at school is an
recent development. Introducing computers in both primary and secondary education is
important strategy to increase computer usage (Brummelhuis and Plomp, 1994).
Furthermore, working with computers at secondary school can provide equal opportunity
for all for computer practice. Additionally, early computer experiences may be a basic
way to increase experience and skills and consequently, positive computer attitude
(Taylor and Mounfield, 1994).
Only a small number of the participants in the present study had computer experience at
college or university. A partial explanation for this is many of the participants had not any
formal tertiary education. Torkzadeh and Koufteros (1993) reported that computer
experience of their participants at college changed their computer attitude positively.
Computer experience at work has an important role in effective performance. The users
should also know how to integrate their previous computer experience into their present
work. Consequently, the knowledge and skills they possess will produce positive
attitudes toward computer technology and usage. The results of this study also confirm
that the participants with computer experience at work had more favourable computer
attitudes than others. This result is consistent with findings of other studies (Robinson-
Staveley and Cooper, 1990; Dambrot et al., 1985).
As computer accessibility can improve attitude behaviour-consistency (Kallgren and
Wood, 1986), having a computer at home can reduce negative feelings toward
computers. Thus, home computers can be useful for providing favourable feelings and
consequently, computer usage. In addition, home computer ownership is a factor that
could enhance success of users to effective computer usage (Taylor and Mounfield,
210

1994). However, in this study, home computer ownership had no significant difference
on subjective norms to use computers because ownership of a computer is a personal
choice and is not based on other's opinion.
While a large number of the participants in this study reported that they had home
computers, only a small proportion of them considered themselves as users at home.
Therefore, buying home computers cannot guarantee that owners use them (Shashaani,
1994). Based on the analysis of the data, using a home computer had a significant
difference on computer attitudes of the owner. This result is consistent with the studies of
Kirkman (1993); Miller and Varma (1994) who reported that home computer usage had a
strong effect on attitude formation.
211

Chapter 8
Measurement Model Results
8.1 Introduction
In this chapter, the term model estimation is explained. For the measurement model,
confirmatory factor analysis for the Nurse's Computer Attitude Inventory (NCATT) scale
and the Subjective Computer Experience Scale (SCES) were tested and discussed.
Moreover, internal consistency and discriminant validity of all the scales in this study
were assessed.
8.2 Model Estimation
The research model (Figure 3.1) describes the relationships or paths among theoretical
constructs so it provides a set of variables that could affect computer system usage. That
part of the model that relates to the measurement variables of the factors is called a
measurement model and the relationship among the constructs and their indicators is
called the structural model.
Estimations of the research model in this study contains both measurement and structural
model. The measurement model and its estimation are discussed in this chapter and
structural models and estimation process are explained in chapter 9.
8.3 Measurement Model
Hair et al. (1992) argued that the measurement model can specify the indicators for each
construct and also assesses the reliability of each constmct for use in estimating the causal
relationships. In other words, it allows the researcher to use several indicators for a single
independent or dependent variable. Thus, measurement model consists of the relationship
between items and the constructs that they measure.
212
Testing of the measurement model includes an estimation of the indicators for each
construct and determining the reliability of each construct for determining the causal
relationship (Hair et al., 1995). Thus, the measurement model specifies which variables
define which factors. In this study, to test the measurement model, Confirmatory Factor
Analysis (CFA) for both the new scales (computer attitude and subjective computer
experience), reliability coefficient (Cronbach's alpha) of the measures as well as
discriminant validity of the research scales were measured.
8.3 .1 Confirmatory Factor Analysis (CFA)
Factor analysis is an analytic technique that permits the reduction of a large number of
correlated variables to a smaller number of hidden dimensions (Tinsley and Tinsley,
1987). There are two types of factor analysis (FA): Exploratory Factor Analysis (EFA)
and Confirmatory Factor Analysis (CFA). EFA can summarise data by grouping that is
usually performed in early stage of development a scale so this method are used to
discover factors (Nunnally, 1978). EFA was used for development of the SCES (see
chapter 5).
The other is CFA which is useful for testing theories regarding to the existence of factors
(Nunnally, 1978). Thus, CFA confirms a set of variable that define a construct
(Schumacker and Lomax, 1996). CFA is a complex technique and usually used in the
advanced stages of the research to test a theory and hypotheses about grouping of
variables (Tabachnick and Fidell, 1989). Structural equation modelling (SEM) can
determine a statistical test of the goodness-of-fit for the proposed confirmatory factor
solution (Hair et al., 1995). Steenkamp and van Trijp (1991) argued that CFA is also
useful for validation of scales to measurement of constructs because it provides indices of
fit and tests of hypotheses about constmct.
213
In this study four criteria were used to determining acceptable CFA.
1) The Goodness of Fit Index (GFT) that the level is from zero to 1.0 where 1.0 is
perfect fit (Hair et al., 1995).
2) Adjusted Goodness of Fit Index (AGFI) that is the ratio of degrees of freedom for
the proposed model to the degrees of freedom for the null model. The level of
acceptance is equal or greater than 0.9 (Hair et al., 1995).
3) The Root Mean Square Residual (RMSR) that no level for reasonable significance
is accepted (Hair et al., 1995).
4) Chi-square is an index that significant value indicates a poor model fit, while non
significant values indicate a good fit. In large samples, the chi-square statistics
will be almost significant, because it is direct function of sample size (Hartwick
and Barki, 1994).
While there are various estimation methods for determining the CFA, in the present
study, Generalised Least Squares (GLS) was used. Tabachnick and Fidell (1989) argue
that Generalised Least Squares Factoring is a method for minimising difference between
observed and reproduced correlation.
For estimation and evaluation the research model, CFA was estimated using the SAS
CALIS program. The object was to determine whether the instruments of the model fit the
data of computer usage in the health area.
The results are demonstrated in Table 8.1 and Table 8.2.
214

Table 8.1 Generalised Least Squares Factoring for the NCATT
Goodness of Fit Index (GFI) = 0.8853
GFI Adjusted for Freedom (AGFI) = 0.8598
Root Mean Square Residual (RMSR) = 0.1651
X 2 (207) = 379.7817** Prob > 0.0001
** P < 0.001
The results of CFA for NCATT showed a reasonable fit of the data, as evidence by
goodness of fit (GFI = 0.8853), the root mean square residual (RMSR = 0.1651), GFI
adjusted for degree of freedom (AGFI = 0.8598), and the chi-square statistics, X 2 (207,
N = 302) = 379.7817, P = 0.0001.
Table 8.2 Generalised Least Squares Factoring for the SCES
Goodness of Fit Index (GFI) = 0.9093
GFI Adjusted for Freedom (AGFI) = 0.8665
Root Mean Square Residual (RMSR) = 0.1096
X 2 (53) = 163.8299** Prob > 0.0001
** P < 0.001
The results also showed a reasonable fit of the data for the SCES (GFI = 0.9093, RMSR
= 0.1096, AGFI = 0.8665), and chi-square statistics, X 2 (53, N = 302) = 163.8299, P =
0 .0001.
As has been shown in the factor analysis in previous studies (Jayasuriya et al., 1994;
Jayasuriya and Caputi, 1996), results of CFA, confirmed the existence of the three
constructs/factors for the NCATT; computer and patient care, computer anxiety and
patient confidentiality. Moreover, as was expected and has been shown in previous study
(see chapter 5), CFA showed that the SCES includes two construes/factors: positive and
215

negative computer experience. In general, the results of CFA showed that the two new
scales, NCATT and SCES, in this study were fit to data.
8 .3 .2 Reliability Coefficient (Cronbach alpha) of the
Scales
The internal consistency of the measurement model was assessed by computing
Cronbach's alpha. These reliability coefficient are displayed for each of the construct in
Table 8.3. The results of the internal consistency of the scales showed the composite
reliability of the constructs which exceeded the recommended values in Nunnally's
(1978) guidelines. Among the alpha coefficient, only one coefficient fell below 0.70.
Table 8.3 Assessment scales and subscales
Scales Mean S.D The composite reliability alpha coefficient
1 Computer training 3.72 0.76 0.85
2 Subjective computer experience 3.22 0.57 0.82Positive computer experience 3.30 0.66 0.84Negative computer experience 2.91 0.76 0.75
3 Management support 2.91 0.60 0.81General support 2.98 0.70 0.73Information centre support 2.84 0.64 0.68
4 User involvement 5.58 1.09 0.92Personal relevance 5.33 1.29 0.89Importance 5.78 1.06 0.89
5 Computer attitude 3.47 0.53 0.90Computers and patient care 3.45 0.57 0.88Computer anxiety 2.38 0.76 0.87Patient confidentiality 3.19 0.80 0.78
6 Subjective norms 3.28 0.63 0.82
7 Intend to use computers 3.63 0.85 0.83
216
The results showed that the computer training scale, that was developed for the present
study, had high internal consistency. Furthermore, the SCES with two subscales,
positive computer experience with 8 items and negative computer experience with 4 items
had high and acceptable internal consistency.
In addition, the management support instrument and the two subscales, general support
and information centre support had acceptable internal consistency coefficient. However,
information centre support scale showed a lower internal consistency than other scales.
The lower reliability's for the scales can be affected by a small number of items in the
management support scale because the calculation for Cronbach's alpha is affected by
scale length (Thompson et al., 1991).
The involvement scale contains two involvement dimensions: importance with 5 items
and personal relevance with 4 items. The results indicated high Cronbach's alpha for 9
items scale and the two subscales. Additionally, the computer attitude scale and the three
subscales: computer and patient care; patient confidentiality, and computer anxiety had
high internal consistency reliability similar to the previous studies (Jayasuriya et al.,
1994; Caputi et al., 1995). Moreover, subjective norms and intention to use computers
scale had high internal consistency.
In general, the results revealed that all the scales had acceptable reliability. Therefore, the
results will permit conclusions that these reliable scales can be applicable in the context of
end-user computing (EUC).
Table 8.4 compares internal consistency of the scales in the study for two groups, nurses
and health workers.
217

Table 8.4 Internal consistency (Cronbach alpha) of scales for nurses and health workers
Constructs Number of items Nurses (N = 103)
Health workers (N = 198)
1 Computer training 5 0.71* 0.87**
2 Subjective computer experience 12 0.77 0.83Positive computer experience 8 0.85 0.82Negative computer experience 4 0.71 0.77
3 Management support 8 0.82 0.80General support 4 0.73 0.72Information centre support 4 0.71 0.66
4 User involvement 9 0.93 0.92Personal relevance 4 0.91 0.87Importance 5 0.91 0.87
5 Computer attitude 22 0.91 0.89Patient care 12 0.91 0.86Computer anxiety 7 0.85 0.87Patient confidentiality 3 0.75 0.80
6 Subjective norms 6 0.78 0.83
7 Intention to use computers 3 0.86 0.81
* Numbers of nurses = 27 ** Numbers of health workers = 84
A comparison of the internal consistency of the scales and their subscales for two groups
of the study (nurses and health workers), indicated that there was no major difference
between the scales for nurses and health workers (Table 8.4).
8.3 .3 Discriminant Validity
Discriminant validity of a measure is the ability to differentiate the constructs that
measured with other similar constructs (Polit and Hungler, 1995) and it express the
degree of a concept that differ from the other concepts (Campbell and Fiske, 1959).
Thus, this validity can determine the degree that items differentiate their constructs with
other similar constructs. To assess discriminant validity in this study, the correlations
between the scales were measured. If the items of an instrument that measures a constmct
correlates more highly with each other than with items measuring an other construct it
218
means that the measure has discriminant validity. Therefore, items of constructs should
be correlated more highly with their own constructs rather than with measures of other
constructs in the model.
Table 8.5 (overleaf) presents the intercorrelations among the study variables. With five
exceptions, adequate discriminant validity was demonstrated that the internal consistency
reliabilities were much higher in all factors and the subscales. As expected, computer
attitude had positive correlation with the majority of the scales, except with computer
anxiety and negative computer experience scales that had negative correlations. On the
other hand, as was expected, computer anxiety was correlated negatively with the
majority of the scales, except with negative computer experience scale that had positive
correlations. Moreover, positive computer experience had positive and significant
correlation with the majority of the scales and negative correlation with the computer
anxiety and negative computer experience scales. In general, as expected, the majority of
the scales had positive correlation with other scales. Furthermore, computer anxiety and
negative computer experience scales were correlated negatively with the other scales.
These results confirm that the scales and sub-scales in the current study had a strong
power to measure the assumed construct and also demonstrated satisfactory discriminant
validity.
The exception occurred between subjective computer experience and positive computer
experience, management support and general support, management support and
information centre support, involvement and personal relevance, involvement and
importance. The explanation is that positive computer experience with 8 positive items in
the SCES (12 items) highly influenced these relationships. Moreover, Igbaria (1990);
Igbaria and Chakrabarti (1990); Igbaria (1993) noted that management support contains
two broad categories; 1) the presence of an information centre, availability of assistance
and guidance in using computer applications 2) general support, which includes
encouragement from management, providing resources and management information
system (MIS) staff support. In fact management support should be provided for the users
219
by the organisation. Clearly, if the organisation does not have these facilities and support,
it would be difficult to understand and differentiate between these two types of support by
the participants. In this study, it appears that, management support is a new concept and
also information centres have not yet been established in the health area specially in
community health centres. Thus, the respondents answered these items as one concept.
Similarly, the respondents did not differentiate between items of involvement, as
importance of the computer for the organisation and the computer as personal relevance.
In general, the result of discriminant validity was satisfied.
220
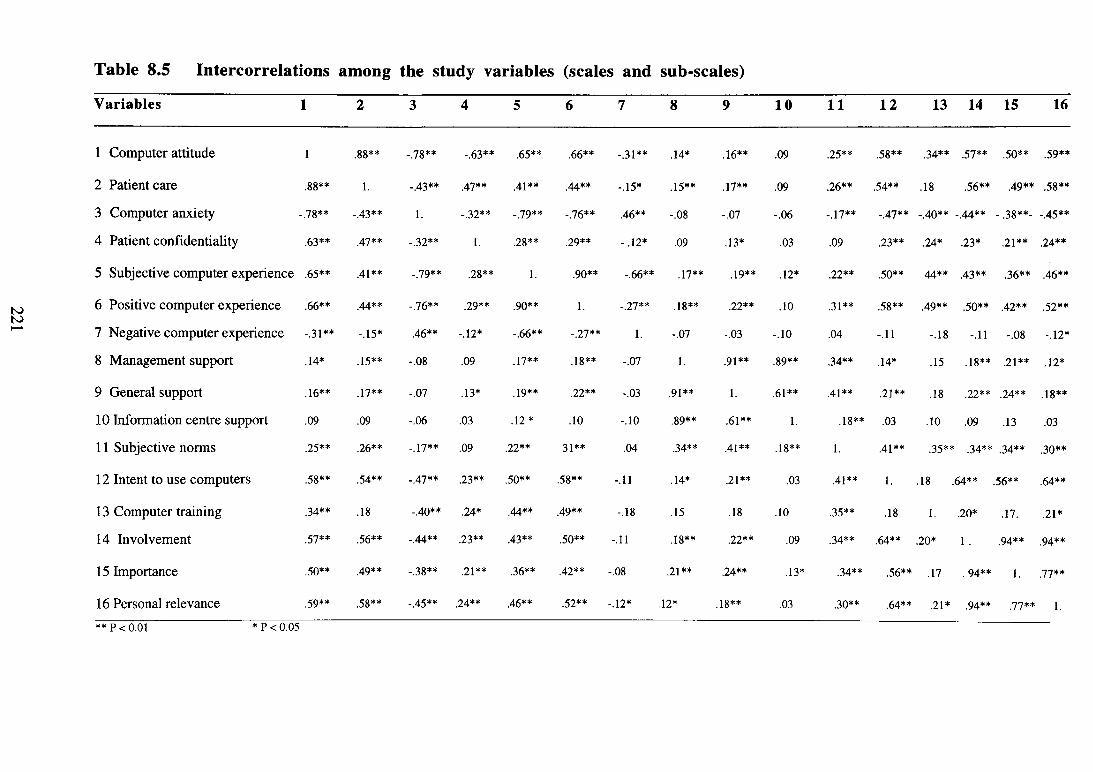
Table 8.5 Intercorrelations among the study variables (scales and sub-scales)
V a r i a b l e s 1 2 3 4 5 6 7 8 9 1 0 1 1 1 2 1 3 1 4 1 5 1 6
1 Computer attitude 1 88** -.78** -.63** .65** .66** -3 1 * * .14* .16** .09 .25** .58** .34** .57** .50** .59**
2 Patient care .88** 1. -.43** .47** 42** 44** -.15* .15** 27** .09 .26** .54** .18 .56** 49** .58**
3 Computer anxiety -.78** -.43** 1. -.32** . 79** -.76** .46** -.08 -.07 -.06 . 27** _ 47** - 40** _ 44** - .38**- -.45**
4 Patient confidentiality .63** .47** -.32** 1. .28** 29** -.12* .09 .13* .03 .09 23** .24* .23* .21** .24**
5 Subjective computer experience .65** _42** . 79** .28** 1. .90** -.66** 17** .19** .12* .22** .50** 44** .43** .36** .46**
t o 6 Positive computer experience .66** 44** -.76** .29** 90** 1. - 27** .18** .22** .10 .31** .58** 49** .50** 42** .52**t o
7 Negative computer experience -.31** -.15* .46** -.12* -.66** -.27** 1. -.07 -.03 -.10 .04 -.11 -.18 -.11 -.08 -.12*
8 M anagement support .14* .15** -.08 .09 27** .18** -.07 1. 92** 89** .34** .14* .15 .18** .21** .12*
9 General support .16** 17** -.07 .13* 19** .22** -.03 91** 1. .61** 42 ** .21** .18 .22** .24** .18**
10 Information centre support .09 .09 -.06 .03 .12* .10 -.10 89** .61** 1. .18** .03 .10 .09 .13 .03
11 Subjective norms .25** .26** . 27** .09 .22** 31** .04 .34** .41** .18** 1. .41** .35** .34** 34** .30**
12 Intent to use computers .58** .54** . .47** .23** .50** .58** -.11 .14* .21** .03 42** 1. .18 .64** .56** .64**
13 Computer training .34** .18 _ 40** .24* 44** 49** -.18 .15 .18 .10 .35** .18 1. .20* .17. .21*
14 Involvement .57** .56** _ 44** .23** .43** .50** -.11 .18** 22** .09 .34** 64** .20* 1 . 94** 94**
15 Importance .50** 49** -38** .21** .36** .42** -.08 .21** .24** .13* .34** .56** .17 94** 1. 77**
16 Personal relevance .59** .58** -.45** 24** .46** .52** -.12* .12* .18** .03 .30** .64** .21* 94** 77** 1.
** P<0.01 * P < 0.05

Chapter 9
Structural Model Results
9.1 Introduction
In this chapter, the structural model and its measuring process by using path analysis are
explained, and the process of respecifications of the research model and its results are
presented. Finally, the findings are discussed.
9.2 Structural Model
When the results of the measurement model are satisfied, the correlations among
constructs and path coefficient (hypotheses) can be tested for statistical significance. In
this study, after the analysis of measurement model (see chapter 8), the structural model
for the research model was evaluated. Hair et al. (1995: 621) explained the structural
model is a "set of one or more dependence relationships linking the model constructs". In
other words, independent variables are connected to dependent variables by 'path' model.
For measuring structural model, Structural Equation Modelling (SEM) method was used .
SEM is a statistical technique that allows examination of a series of dependence
relationships simultaneously (Hair et al., 1992). SEM is a relatively new approach to
testing multivariate models with empirical data which can examine a wide range of
models, such as; univariate or multivariate regression models, confirmatory factor
analysis and path analysis models (Schumacker and Lomax, 1996).
In this study, path analysis for computing structural coefficients was used. Path analysis
is based on the relationship between variables and is a method for studying the direct and
indirect effects of variables (Schumacker and Lomax, 1996). It means that this method
can measure the strength of the causal relationships from the correlations or covariances
among the constructs and can, therefore, specify all possible effects that are contained in a
correlation and then estimate the amount of correlation (Hair et al., 1992). By using
222
SEM, the explanatory power of the model and the significance of paths in the structural
model can be determined.
In the structural model the effects among the variables could be either direct effects or
indirect effects which are assumed between the exogenous variables and the endogenous
variables. The path coefficient of an exogenous variable represents the direct effect of
variables on the endogenous variables so it is a path route from cause to effect. An
indirect effect represents those effects interpreted by the intervening variables. The total
effect is calculated by the sum of the variables of all paths (direct and indirect) from the
exogenous variables to the endogenous variables. When more than one indirect path
exists, the total effect is the sum of direct and indirect effects of the variable on the
endogenous variable. The estimated path coefficients indicate the strength and the sign of
the theoretical relationships (Hair et al., 1995). Therefore, path analysis can estimate the
relationships of structural model and can be used to determine whether the observed
pattern of relationships was consistent with the hypotheses.
9.3 Structural Model Fit (Test of the Path Model)
There are many methods for estimating path coefficients. In this study, Maximum
Likelihood Estimation (MLE) through SAS CALIS programs was used to evaluate the
entire proposed model. This evaluation consisted of an assessment of the size, sign and
significance of the path coefficient that was hypothesised. A relatively complete
understanding of the endogenous constructs was found by simultaneously examining the
standardised path coefficient of the exogenous constmcts and the variables. MLE method
assessed the path coefficient of direct and indirect effects of exogenous variables on the
endogenous variable and it determines an appropriate index of model fit to the research
data.
223
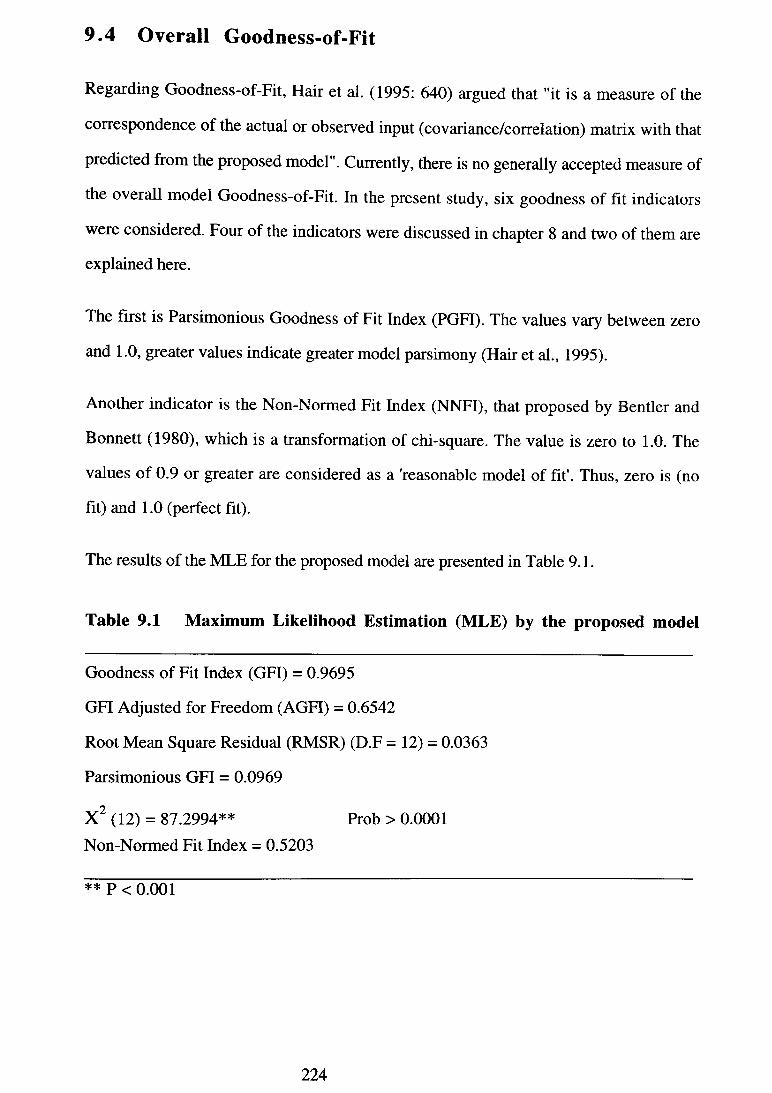
9.4 Overall Goodness-of-Fit
Regarding Goodness-of-Fit, Hair et al. (1995: 640) argued that "it is a measure of the
correspondence of the actual or observed input (covariance/correlation) matrix with that
predicted from the proposed model". Currently, there is no generally accepted measure of
the overall model Goodness-of-Fit. In the present study, six goodness of fit indicators
were considered. Four of the indicators were discussed in chapter 8 and two of them are
explained here.
The first is Parsimonious Goodness of Fit Index (PGFI). The values vary between zero
and 1.0, greater values indicate greater model parsimony (Hair et al., 1995).
Another indicator is the Non-Normed Fit Index (NNFI), that proposed by Bentler and
Bonnett (1980), which is a transformation of chi-square. The value is zero to 1.0. The
values of 0.9 or greater are considered as a 'reasonable model of fit'. Thus, zero is (no
fit) and 1.0 (perfect fit).
The results of the MLE for the proposed model are presented in Table 9.1.
Table 9.1 Maximum Likelihood Estimation (MLE) by the proposed model
Goodness of Fit Index (GFI) = 0.9695
GFI Adjusted for Freedom (AGFI) = 0.6542
Root Mean Square Residual (RMSR) (D.F = 12) = 0.0363
Parsimonious GFI = 0.0969
X 2 (12) = 87.2994** Prob > 0.0001
Non-Normed Fit Index = 0.5203
** P < 0.001
224

The results of the proposed model showed a reasonable fit of the data, as evidence by
Goodness-of-Fit (GFI = 0.9695), and the root mean square residual (RMSR = 0.0363).
However, GFI adjusted for degree of freedom (AGFI = 0.6542) is lower than acceptable
standards (Hair et al., 1995; Schumaker and Lomax, 1996), and the Likelihood-ratio chi-
square statistic, X (12, N = 302) = 87.2994, P = 0.0001, is significant. While a
significant chi-square statistic is often an indication of a poor fit, a number of authors
have noted that with a large sample size (> 200) the chi-square statistics becomes
extremely sensitive to differences between expected and actual matrices (Hair et al., 1995;
Schumaker and Lomax, 1996; Tabachnick and Fidell, 1996). The results of testing the
structural model for the proposed model are presented in Table 9.2, Table 9.3, and Table
9.4.
Table 9.2 Prediction of computer attitude by the proposed model
Variables Comnuter attitude Direct Indirect Total
Age -0.1620** -0.00589 -0.15612Gender -0.0314 +0.00244 -0.02899Level of education +0.0674 -0.00122 +0.06617Organisational position -0.0051 +0.00016 -0.00496Work tenure +0.0726 -0.00581 +0.06682Organisational tenure -0.0486 +0.00359 -0.04499Positive computer experience +0.4205** +0.00300 +0.42354Negative computer experience -0.1526** -0.00811 +0.14445General computer experience -0.0208 -0.01488 -0.03572General support -0.0169 +0.02446 +0.00755Information centre support +0.0267 -0.00689 +0.01981Personal relevance +0.2628** -0.00338 +0.25942Importance +0.0703 +0.01841 +0.08875Subjective norms +0.0744* -0.00047 +0.07391R 0.56
* * P < 0 .0 1
* P < 0.05
225

Table 9.3 Prediction of subjective norms by the proposed model
Variables Subjective norms to use computersDirect Indirect Total
Age +0.0659 +0.01325 +0.07917Gender +0.0304 +0.00246 +0.03284Level of education -0.0108* -0.00561 -0.01641Organisational position +0.0018 +0.00042 +0.00221Work tenure -0.0725 -0.00567 -0.07812Organisational tenure +0.0445 +0.00382 +0.04829Positive computer experience +0.0762 -0.03593 +0.04030Negative computer experience -0.0967 -0.01226 -0.10897General computer experience +0.2030** +0.00303 -0.19999General support +0.3295** -0.00064 +0.32887Information centre support -0.0910 +0.00168 -0 .09267Personal relevance -0.0235 -0.02201 -0.04548Importance +0.2550** -0.00753 +0.24744Computer attitude -0.0848** +0.00053 -0.08431R 0.26
** P < 0.01 * P < 0.05
Table 9.4 Prediction of intention to use computers by the proposed m odel
Variables Intend to use computers Direct Indirect Total
Age 0 -0.05754 -0.05754Gender 0 -0.00583 -0.00583Level of education 0 +0.02898 +0.02898Organisational position 0 -0.00191 -0.00191Work tenure 0 +0.01279 +0.01279Organisational tenure 0 -0.00976 -0.00976Positive computer experience 0 +0.24436 +0.22436Negative computer experience 0 +0.04368 +0.04368General computer experience 0 -0.07153 -0.07153General support 0 +0.09181 +0.09181Information centre support 0 +0.01481 -0 .01481Personal relevance 0 +0.11865 +0.11865Importance 0 +0.11097 +0.11097Computer attitude +0.5043** -0.02572 +0.47854Subjective norms +0.2676** +0.03559 +0.30318R 0.39
** P < 0.01 * P < 0.05
226

Examination of the t values associated with each of the loading indicates that for each
variable they exceed the critical for the 0.05 significance level (critical value = 1.96) and
the 0.01 significance level as well (critical value = 2.576) (Hair et al., 1995). The results
showed the direct, indirect and total effect of variables in the proposed model. From 30
direct paths in the proposed mode, 12 paths were found statistically significant. Thus,
based on the MLE results, respecification of the model is required (Figure 9.1 overleaf).
227

K>to00
* P < 0.05
Figure 9.1 Hypothesised Model for Predicting Intention to Use Computers
9.5 Model Respecifications
In order to improve parsimony and fit of the data, two post hoc respecifications were
made to the proposed model. The modification was made on both statistical grounds
(Lagrange multiplier test and Wald test) and consistency with the underlying research
theory.
9.5 .1 Lagrange Multiplier Test and Wald Test
The Lagrange Multiplier (LM) examines whether the model can be improved by changing
one or more parameters in the model. In other words, the LM test can determine what
parameters should be added to the model to improve it. Thus, by adding some parameters
improving parsimony is possible without damaging an overall fit model. On the other
hand, the Wald test may indicate what parameters could be deleted for the improvement of
the model. Thus, if any parameters are not critical to the research model, they can be
omitted.
Since deleting and adding parameters in the same time may cause problems in interpreting
the modified model, MacCallum (1986) suggests that the addition of all necessary
parameters should be consider prior to deleting any unnecessary parameters. Thus, first
the LM and second the Wald test should be done on the model because a single change in
the model affects the other part. The SAS CALIS program can present the LM test in a
series of matrices such as; PHI, GAMMA, BETAF. For each matrix, CALIS determines
the X value, the probability associated with the X and the approximate parameters
value for each potential parameter as well as after each matrix, the GAMMA ranks order
of 6 largest LM.
By adding items, the model would be changed and it is clear that the search should be
stopped when a non-significant chi-square is obtained. However, MacCallum (1986)
argues that this criterion for stopping the search may reduce the success rate and it is
recommended that when a model with a non-significant chi-square is obtained the
investigator should still examine the modification until the model improves the Goodness-
229
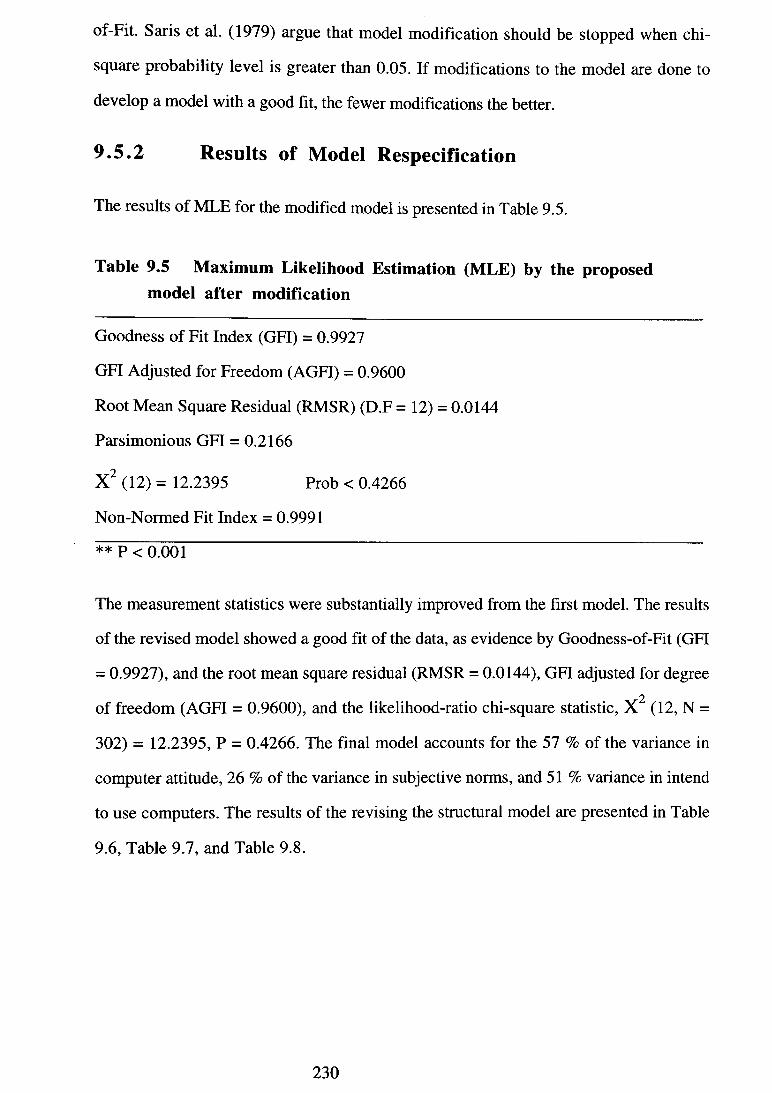
of-Fit. Saris et al. (1979) argue that model modification should be stopped when chi-
square probability level is greater than 0.05. If modifications to the model are done to
develop a model with a good fit, the fewer modifications the better.
9 .5 .2 Results of Model Respecification
The results of MLE for the modified model is presented in Table 9.5.
Table 9.5 M aximum Likelihood Estimation (MLE) by the proposed model after modification
Goodness of Fit Index (GFI) = 0.9927
GFI Adjusted for Freedom (AGFT) = 0.9600
Root Mean Square Residual (RMSR) (D.F = 12) = 0.0144
Parsimonious GFI = 0.2166
X 2 (12) = 12.2395 Prob < 0.4266
Non-Normed Fit Index = 0.9991 **
** P < 0.001
The measurement statistics were substantially improved from the first model. The results
of the revised model showed a good fit of the data, as evidence by Goodness-of-Fit (GFI
= 0.9927), and the root mean square residual (RMSR = 0.0144), GFI adjusted for degree
of freedom (AGFI = 0.9600), and the likelihood-ratio chi-square statistic, X 2 (12, N =
302) = 12.2395, P = 0.4266. The final model accounts for the 57 % of the variance in
computer attitude, 26 % of the variance in subjective norms, and 51 % variance in intend
to use computers. The results of the revising the structural model are presented in Table
9.6, Table 9.7, and Table 9.8.
230

Table 9.6 Prediction of computer attitude by the proposed model afterm odification
Variables Computer attitude Direct Indirect Total
Age -0.1458** 0 -0.14585Gender 0 0 0Level of education +0.0801* 0 +0.08010Work tenure 0 0 0Organisational tenure 0 0 0Positive computer experience +0.4497** 0 +0.44972Negative computer experience -0.1543** 0 -0.15428General computer experience 0 0 0General support 0 0 0Information centre support 0 0 0Personal relevance +0.2580** 0 +0.25797Importance +0.0880 0 +0.08801Subjective norms 0 0 0R 0.57
** P < 0 . 0 1 * P < 0.05
Table 9.7 Prediction of subjective norms by the proposed model after m odification
Variables Subiective norms to use comoutersDirect Indirect Total
Age +0.0547 0 +0.05471Gender 0 0 0Level of education 0 0 0Work tenure 0 0 0Organisational tenure 0 0 0Positive computer experience 0 0 0Negative computer experience +0.1279* 0 +0.12792General computer experience -0.2275** 0 -0.22747Management support 0 0 0General support +0.2980** 0 +0.29798Information centre support 0 0 0Personal relevance 0 0 0Importance +0.2241** 0 +0.22414Computer attitude 0 0 0
R 0.26
** P < 0.01 * P < 0.05
231

Table 9.8 Prediction of intention to use computers by the proposedmodel after modification
Variables Intend to use computers Direct Indirect Total
Age 0 -0.03125 -0.03125Level of education 0 +0.02261 +0.02261Positive computer experience 0 +0.12692 +0.12692Negative computer experience 0 -0.02037 -0.02037General support 0 +0.05399 +0.05393General computer experience 0 -0.04121 -0.04121Computer attitude +0.2822** 0 -0.28222Subjective norms +0.1812** 0 +0.18117Personal relevance +0.3115** +0.07280 +0.38433Importance +0.1426* * +0.06545 +0.20806R 0.51
** P < 0.01* P < 0.05
The results of the multivariate test of the structural model are presented in Table 9.6,
Table 9.7 and Table 9.8. The results showed a significant direct and positive effect of
level of education (6 = 0.0801, P < 0.05), positive computer experience (B = 0.4497, P <
0.01), and personal relevance (B = 0.2580, P < 0.01) on computer attitude. As expected,
age (B = -0.1458, P < 0.01) and negative computer experience (B = -0.1543, P < 0.01)
had significant negative and direct effect on computer attitude.
Moreover, the results showed that negative computer experience (B = 0.1279, P < 0.05),
general support (B = 0.2980, P < 0.01) and importance (B = 0.2241, P < 0.01) had
significant positive and direct effect on subjective norms to use computers. On the other
hand, general computer experience had significant negative and direct effect on subjective
norms to use computers (B = -0.2275, P < 0.01). In addition, age had a non-significant
positive and direct effect on subjective norms to use computers (B = 0.0547). The results
also indicated a significant positive and direct effect of computer attitude (B = 0.2822, P <
0.01) and subjective norms (B = 0.1812, P < 0.01) on intention to use computers (Figure
9.2 overleaf).
232

233
+ . 0 5 5
* * P < 0.01 * P < 0.5
Figure 9.2 Final Model for Predicting Intention to Use Computers
9.5 .3 New Findings
This study showed additional factors that predicted the intention to use computers. The
results of the modified model showed that dimensions of user involvement (personal
relevance and importance) affected the intention to use directly and indirectly through
computer attitude and subjective norms. While other external variables had an indirect
effect on intention to use through attitude and subjective norms, personal relevance (B =
0.3115, P < 0.01), and importance (6 = 0.1426, P < 0.01), had an significant positive
and direct effect on intention to use computers. The direct effect of personal relevance
was found to be stronger than importance on behavioural intention to use computers.
In total, the model explained 57 percent of the variance in computer attitude, 26 percent of
the variance in subjective norms to use computers, and 51 percent of the variance in
intention to use computers. Since the objective of this study was the understanding of
behavioural intention, the model was acceptable in terms of explanatory power.
9.6 Discussion of Results of Structural Model
The research model was found to fit the data from a sample of 300 observations. The
present study investigated the specification search based on the initial model. This result
provided a parsimonious model with its relationships. In general, the results showed that
of the 30 direct paths tested in the structural model for the hypothesised model, 13 were
found to be statistically significant in the revised model (Figure 9.2). The strongest
effects on computer attitude were positive computer experience and weakest (but
significant) was the level of education on computer attitude. Among the demographic
variables, age was negatively related to computer attitude. The results also showed that
the strongest significant effects on subjective norms was general support and weakest and
significant was negative computer experience. Moreover, the effect of computer attitude
on intent to use was stronger than subjective norms toward intention on it.
The results of the structural model and its pattern in relation to the hypotheses of the study
are presented in Table 9.9.
234

Table 9.9 Summary of the hypotheses
H la Age will have a positive direct effect on computer attitude (SV).
H lb Gender will have a positive direct effect on computer attitude (NS).
H 2a Age will have a positive direct effect on subjective norms (NS).
H 2b Gender will have a positive direct effect on subjective norms (NS).
H 3 Demographic characteristics (organisational position, organisational tenure and work tenure) of user will have a positive direct effect on computer attitude (NS).
H 4 Demographic characteristics (organisational position, organisational tenure and work tenure) of user will have a positive direct effect on subjective norms (NS).
H 5 Level of education will have a positive direct effect on computer attitude (S).
H 6 Level of education will have a positive direct effect on subjective norms (NS).
H 7 and H8 See chapter 7.
H 9a Positive computer experience will have a positive direct effect on computer attitude (S).
H 9b Negative computer experience will have a negative direct effect on computer attitude (S).
H 9c General computer experience will have a positive direct effect on computer attitude (NS).
H 10a Positive computer experience will have a positive direct effect on subjective norms (NS).
H 10b Negative computer experience will have a positive direct effect on subjective norms (S).
H 10c General computer experience will have a positive direct effect on subjective norms (SV).
H 11a General support will have a positive direct effect on computer attitude (NS)
H l i b Information centre support will have a positive direct effect on computer attitude (NS).
H 12a General support will have a positive direct effect on subjective norms (S).
H 12b Information centre support will have a positive direct effect on subjective norms (NS).
H 13a Personal relevance will have a positive direct effect on computer attitude (S).
H 13b Importance will have a positive direct effect on computer attitude (NS).
H 14a Personal relevance will have a positive direct effect on subjective norms (NS).
H 14b Importance will have a positive direct effect on subjective norms (S).
H 14c Personal relevance will have a positive direct effect on intention to use computers (SX).
H 14d Importance will have a positive direct effect on intention to use computers (SX).
H 15 Computer attitude will have a positive direct effect on intention to use computers (S)
H 16 Subjective norms will have a positive direct effect on intention to use computers (S)
Paths marked (S) are supported.
Paths marked (NS) are not supported.
Paths marked with (SV) are supported, but in the opposite direction.
Paths marked (SX) are supported, but were not in the hypotheses.
235

The most important results of this study was the finding of the strong direct and
significant effect of positive computer experience on computer attitude. It seems that in
the formation of computer attitude, positive computer experience has an important role.
This study showed the effect of positive computer experience on computer attitude. On
the other hand, as expected, negative computer experience had a negative effect on
computer attitude. Thus, computer attitude can be changed by positive or negative
experiences of the users with computer systems. An interesting result was that negative
computer experience had positive direct effect on subjective norms to use computers.
These results confirm the important role of both organisational policies and a climate to
use computers, specially for users with negative experience.
A new finding of this study was that involvement not only affected intention to use
indirectly but also directly. Thus, the importance of the role of involvement was
confirmed in this study. It seems that user involvement is an important factor in system
usage and there is a need to expand the theory in order to better understand factors that
potentially influence system usage.
Future research is needed to refine the latter model (Figure 9.2) and improve it by
removing non-significant relationships. Moreover, a study is needed into the use of some
parameters that were deleted in this study, due to the insufficient sample (such as;
computer training and task characteristics). In sum, it is important that research continues
in this area.
9.7 Discussion of the Study
There are various views toward acceptance and use of computer technology in different
fields. For example, health information systems offer automated systems to assist
personnel to administer patient care by increasing access to large volumes of information,
improving delivery of care and decision making.
One of the interesting results of the present study, was the negative effect of age on
computer attitude. The result was similar that of Igbaria (1993) when he reported that
236
older managers expressed more unfavourable attitudes towards computers than younger.
Other studies also showed that younger personnel in hospitals had more positive
computer attitudes than older personnel (Grann, 1984; Zoltan-Ford, 1984). The results
reinforce the notion that age is a factor that can influence computer attitude. In addition,
the examination of age on subjective norms indicated that there was a positive effect of
age on subjective norms to use computers. It means that older users pay more attention to
the policies of organisations and their peers' perspectives for using computers than
younger users.
The result also showed direct positive and significant effect of the level of education on
computer attitude. It seems that level of education is a factor that can affect computer
attitude. This result is consistent with the study by Rapko and Adaskin (1993) who
reported that nurses with high levels of educational qualification had positive attitudes
toward computer systems because the level of education influenced their understanding of
the systems. Moreover, Lucas (1978) argues that users' with a high level of education
accept computer systems, but users with a low level of education may resist them.
Therefore, the level of education influences the understanding of computer systems
(Brodt and Stronge, 1986).
An important hypotheses of this study was to test whether positive computer experience
affects computer attitude. The results showed a strong positive and significant effect of
positive computer experience on computer attitude. This indicates that the provision of
opportunities to gain positive experience, especially for new or inexperienced users,
would be useful for effective system usage. Furthermore, positive computer experience
may help users in increasing favourable perceptions about the impact of computers on
their life (Yelland, 1995). The importance of prior computer experience in promoting
computer attitude and usage was highlighted by the finding of other studies. For example,
Igbaria (1990) reported a strong correlations between computer experience and computer
attitude. The results confirm that increasing computer experience is vital for providing
favourable attitude and ultimately system usage (Igbaria, 1990; Kleintop et al., 1996).
237
The results also indicated a direct negative and significant effect of negative computer
experience on computer attitude. This finding emphasises the importance of negative
computer experience as a real problem and its effects on computer attitude. Negative
computer experience may cause negative perception about using computers and it can
cause difficulties is being able to use computer systems. Thus, attempting to provide
positive experience will help users to accept and use computer systems.
In contrast, negative computer experience had a direct, positive and significant effect on
subjective norms. In those situations in which users have negative experience with
computers, the role of organisational policies about information systems and their usage
could assist users to accept computers in their workplaces. However, computer system
usage with users who have negative computer experience is not guaranteed because usage
may be ineffective or insufficient. Therefore, the needs of participants with negative
computer experience should be takes into account, specially when system usage is
compulsory. In this regard, managers should assess users with negative feelings about
computer and help them to change their negative feelings to positive. From the results it
can be concluded that the role of information system (IS) managers is crucial in providing
positive computer experience or changing negative experience. Moreover, managers
should be aware that psychological and subjective feelings can influence physical and
mental ability. Very little experimental research has been conducted in this area and future
studies are needed.
The results also showed that general support had direct, positive and significant effect on
subjective norms. The participants with support from the management system paid more
attention to others' expectations (managers or friends to use computer system) than those
without support. The organisation with a supportive management will have a co-operative
climate (Songer-Nocks, 1976). This study confirms the importance of the need for users
support regarding acceptance and performance of computers.
The understanding involvement factor and its role in systems usage requires examination
as a factor on users' perceptions. This study examined the influence of users'
238
involvement (importance and personal relevance) on computer attitude and subjective
norms. The results showed that personal relevance and importance had directly positive
effect on computer attitude, however, the effect of the importance on computer attitude
was not significant. The results also indicated that importance had direct positive and
significant effect on subjective norms to use computers. The participants also believed
that the importance of the system can influence their attention to organisational policies
and others expectations to use systems. If the users' involvement is considered they
would be satisfied with the information systems policies, consequently, the organisation
would have a high quality of performance.
The results of the present study showed additional factors that influenced intention to use.
Importance and personal relevance (dimensions of involvement), directly and indirectly,
(through attitude and subjective norms), affected intention to use computers. In the
Theory Acceptance Model (TAM), the role of perceived usefulness is similar to important
and personal relevance in this study. However, these two constructs, usefulness and
involvement, are different. A system may be useful but not necessary importance or
personally relevant (Barki and Hartwick, 1994). Thus, this study found a different
connection between importance and personal relevance to intention to use. It seems that
user involvement is an important factor in system usage. Therefore, user involvement as a
psychological belief (Barki and Hartwick, 1994), can increase the system's value and
consequently, system usage. The study suggests that involvement of health staff can be
useful for developing and implementing a new computer system. During system
development, users should have a sense of perceived involvement that leads to system
acceptance and usage. As mentioned earlier, involvement is a perceptual issue so if users
believe that they are actively involved in system development and their inputs are valuable
and worthwhile, they will be more satisfied. From the results of this study, it is indicated
that an appropriate level of a user's involvement will result in a better management
information system (MIS).
239

It seems that users' involvement is an important responsibility for managers to provide
positive and open communication between users and other key groups to support the
important role of users in processes of development and usage. In addition, managers
should be aware of the nature of users' involvement because from these results it can be
concluded that users need to have a sense of active psychological involvement.
The finding showed that computer attitude had a strong direct positive and significant
effect on intention to use computers. The participants, with favourable computer attitudes,
were willing to manage difficulties related to systems and were capable of improving their
performance. This study confirms the results of another study in health area (Hebert,
1994). Therefore, computer attitude may affect the actual success or failure of system
implementation.
By focusing on subjective norms in this study, the effects of peers, superiors,
subordinates, and organisational climate on systems usage was studied (Moore, 1987).
The result also showed that the users' subjective norms influenced directly and positively
the intention to use computers. Hebert (1994) reported that the users' subjective norms
influenced their intention to use computers and use of technology was based on the policy
of the organisation. In a different study, Nederhof (1989) reported similar results: that
there was a strong relationship between the participants' subjective norms and their
intentions. In addition, other studies, Bender and Speckart (1981); Igbaria et al. (1996)
had similar findings. Therefore, the role of the subjective norms in information system
studies is crucial for making policies in organisations. Information system (IS) managers
should convey to users the purpose and the policies of computerised technology because
if users accept the IS policies the organisations will have a co-operative condition
(Songer-Nocks, 1976). Communication of users with their peers and also understanding
the information policies can enhance computer systems usage. Therefore, in some
situations behaviour of persons may be influenced by subjective norms, rather than
attitude. The important findings related to subjective norms in this study suggest that
more research, focusing on system usage is necessary and would be useful.
240

Chapter 10
Conclusion and Suggestions
10.1 Introduction
In this chapter the conclusions of the present study are given. Strengths, limitations and
suggestions for further studies are also considered.
10.2 Conclusion
Computer technology is an expensive resource, with many hidden costs that are growing
rapidly so computer system usage is an important issue. It is important to examine the
reasons of acceptance/resistance of computer systems. This study empirically investigated
issues that can be associated with the successful system usage and the impact of some
variables, classified into four groups, have been examined on computer attitude,
subjective norms and behavioural intention. In general, this study supports the findings
of previous studies and provides additional insights into some factors that were
measured, as well as addressed areas and issues of importance.
The lack of adequate instruments to measure computer experience as one of the variables
in the research model, was apparent. Thus, the first part of this study was to develop a
valid and reliable scale for measuring computer experience. This study, presents
significant progress toward development of a scale for measuring subjective computer
experience.
In the main study, findings of other studies (much in business studies and a few in the
health sectors), were utilised as an extended computerised usage model and applied to
observations in a community health service. This study provides an important step
forward in evaluation of health staffs attitude and subjective norms that can determine
their personal and organisational needs regarding computer systems. Subjective norms in
the Theory Reasoned Action (TRA) provided useful results, because by focusing on
241
others' expectations, as important variables in system usage, the organisational climate
was studied (Moore, 1987; Mathieson, 1991). Thus, this study, by including different
factors, extends past research efforts and attempts to gain a more comprehensive
information base. An understanding of the influence of these factors could help to explain
why some organisations are able to use computerised systems effectively whereas others
can not. This approach enabled some reassessment of factors that were previously
identified in other studies, as well as addressing new factors.
The structural model evaluation of the revised model showed a strong fit of the data. The
results generally suggest that an individual's positive perspective toward computers and
subjective norms may be an effective way to improve the intention to use the system and
consequently, system usage.
The findings reported that the use of computer systems depends on many factors such as;
positive and negative experience regarding computers. Intention to use is a function of
computer attitude, therefore, positive computer experience may lead to the intention to use
computer systems through computer attitude. Thus, if the process of getting experience is
successful, positive computer attitude and consequently, usage will be improved. On the
other hand, if the process of computer experience per se is unpleasant, the overall attitude
and behavioural intention may be suppressed. The study also showed that negative
computer experience is a problem. The reasons for negative experience toward computers
and the duration of this negative feelings is dependent on many factors, such as; lack of
sufficient computer training. Furthermore, negative feelings and unfavourable reactions
toward computers usage may inhibit some from learning about computers.
One way for reducing such negative feelings is through desirable education. Computer
education is needed for system usage and better realisation of computing potential. In this
regard, organisations need to give high priority for educating computer users. This
approach will assist in facilitating effective system usage. Since control over the flow of
computer systems is vital for the success of health care organisations, appropriate
educational strategies would provide this opportunity for users. In addition, decreasing
242
negative feelings toward computer systems leads to global satisfaction and willingness in
working with computers. The findings of the study recommends that, in order to reach a
high level of system usage, health and other organisation, should provide an opportunity
for users and beginners to enhance computer experience from a large variety of programs.
The study also supports the findings that relate to the role of users' involvement on
computer attitude and subjective norms. Active involvement of users can help them to
solve their real problems related to the workplace. The results suggest that to remain
abreast of computer systems, there is a need for considering psychological factors such
as; human to computer involvement. The strong influence of dimensions of involvement
directly on intention to use computer system in this study, enhanced the importance of the
role of users' involvement on behavioural intention and ultimately, system usage. The
conclusion of this study is that user involvement should be considered as an important
factor in system usage.
The finding reported that, although technology is advanced, many health staff still have
not met the basic needs regarding computer systems training. Moreover, according to the
findings of the interviews that have been conducted in this study, many of the health staff
had not had any training courses, for others, the extent of course training was considered
not to be was not sufficient. Consequently, the health staff expressed that they need
computer training courses based on their task requirement.
Computer knowledge and skills are essential for health staff and lack of them during any
development process may cause resistance and consequently, impact on systems usage.
The results of the study indicated that health organisations did not put enough emphasis
on computer training, although a large portion of the budget may be spent on
computerised information systems. Providing appropriate training for increasing
knowledge and skills of health staff will improve professional practice and quality of
patient care. Additionally, opportunities for computer training will provide a greater role
for health staff in development of health information systems. Improving knowledge
regarding both hardware and software to match the demands of a clinical workplace
243
would provide a favourable workplace with reduced frustration opportunities for health
workers and nurses. This study, therefore, recommends providing computer training
courses for health users in order to maximise their abilities.
The complexity of technical and professional environment in health information systems
suggests that the organisations' policies and plan for system usage should be considered
carefully. Establishment of information system (IS) policies may not be an easy task
because of potential conflict between different user groups, with implications for change
in the balance of responsibility among health workers and nurses. It may be necessary to
involve the top management to deal with some of these issues because often some
problems can be solved only when management shows clear support for the overall
information systems usage. Providing appropriate policies with careful consideration of
users' views in health organisations could provide more successful system usage. The
staff should understand that policies regarding the computer system is for better using
computers and it is not doing something different from their task. Thus, explanation of
the relevant organisational information policies and communication channels for
supporting users regarding to system usage can provide a better situation for competition
of health information systems with other organisations.
In addition, implementing problems related to information systems policies may easily
occur when two diverse groups of professionals such as; nurses and health workers
interact. Due to the lack of a strong technological background, nurses often function as
consultants of the information system (IS) and may not have a sufficient input as system
designers (Hendrickson, 1993).
On the other hand, computer system programmers and designers may be thought to create
systems without considering the human aspect in the design. Borovits (1984) argues that
computer systems need to be designed based on the user's mind. Thus, knowledge of
human-computer interaction is necessary during system design (Gerlach and Kuo, 1991),
and health staff could be key personnel because they have knowledge on health users
needs. Therefore, health staff should consider computer knowledge and skills as an
244

essential part of their task. Collaboration among health team members and engineering of
information technology areas requires attention because this will create additional
professional task for nurses and health workers that should be considered. Therefore,
nurses or health staff with technical knowledge as a member of the system development
team can enhance computer system usage (Hendrickson, 1993).
It is clear that information centre (IC) support in organisations can lead to better system
usage (Igbaria, 1990; Igbaria, 1993). The community health centres should continue to
support users' activities regarding system usage. If the community health services in this
study are an accurate representation of other community health centres, it means that they
also need improvement. Suggestion for improvement of intention to use and system
usage is that health organisations should consider IC as a useful way for helping and
supporting users. When implemented the IC could determine users' need regarding their
tasks as well as computer training and other resources. Moreover, IS managers should
consider any deficiencies for improvement of services
Therefore, co-operation of managers, IC and users could establish better implemented
and developed computerised systems. Neglecting to develop IC will be expensive and
cost would increase.
The important message from this research about system usage is that managers and
designers should consider factors that can affect system usage from the beginning of the
design process for successful implementation of system usage. Hopefully, the research
model and results of the study that were discussed would be applied to increase the
success of management information systems (MIS) and system usage. The suggestions
that were presented in this study will encourage other researchers to continue efforts in
this direction.
245
10.3 Strengths of the Study
10.3 1 Method and the Research Model
This study with its multi-method approach, contributes to the body of knowledge on
management information system (MIS) and established a foundation for further studies.
It serves a number of purposes. It provides a tested theoretical framework for increasing
and understanding factors related to use of computerised systems. Integration of the
different personal and work factors in this study, could be helpful for different
organisations in more effective implementation of MIS.
The present findings provide evidence of the utility of the Theory of Reasoned Action
(TRA), its application for understanding and predicting computerised information system
usage. To the researcher's knowledge, there are only a few published studies
demonstrating the applicability of the TRA (Fishbein and Ajzen, 1975) for system usage
in the health area, specially in community health centres.
The model presented in this study holds important implications for practising information
system managers in organisations attempting to manage system usage. It will provide
guidance concerning those factors that need to be managed well in terms of system usage.
Understanding how the differences in personal and organisational characteristics impacts
on system usage in the model and it provides a basis for further research in this area. The
framework of analysis presented in the model, will be useful for practitioners as well as
researchers. Therefore, the search for other relevant factors can be facilitated in future
studies. The result of this study showed factors that are important in a global
environment, however, the result cannot be extended to all fields.
Furthermore, subjective norms play an important role in development process of
information systems. In the early stage of implementing a new system subjective norms
are important for determining acceptance of a computerised system and in later process
attitude is the crucial determinant. Therefore, it is critical important for users to
246

understand that organisational policies are in place to ensure that the computerised
systems are used effectively and efficiently. Many of the findings and arguments
regarding social pressure or others' expectation that developed in this study are
appropriate for organisations in general.
The other strong point of this study is the number of factors as external variables in the
research model that can provide more and more precise results specially in health area. In
general, the findings of the current study revealed the strength of the external validity of
the TRA.
From a practical stand point, the research model, as a general model of computer usage
and the scales that were introduced in this study could be useful for system development
and system usage.
10.3.2 Development of a Valid and Reliable Scale
In particular, this study developed a scale to operationalise "computer experience' as a
construct. The dimensions of computer experience were developed based on the previous
literature on the topic of 'experience'. Results of the study clearly indicated that 'computer
experience' is multi-dimensional concept and that the nature is complex.
Development of the Subjective Computer Experience Scale (SCES) provides a step in
providing a valid and reliable scale for measuring computer experience. For developing
the SCES various methods were used. Results from multi-methods enhanced the
confidence of the results that was obtained. The SCES appears to be useful for
discovering users' subjective computer experience (positive and negative). By using the
SCES, this study makes a contribution to understand more factors that can affect system
usage.
The SCES can also serve as a diagnostic tool for measuring computer experience within
organisations as a guide for arranging courses and curriculum development by educators.
Assessing users' computer experience can facilitate planning and developing training
247
courses to better meet the users' needs. Moreover, valid and reliable scales would provide
a better empirical estimate of information system (IS) usage so it provides a potential
vehicle to accomplish further studies. This study argues that the instruments that were
previously used were unreliable and invalid.
The most significant strength of the study is that earlier research had not addressed
empirically the linkage between the subjective computer experience and intention to use
systems, and this study provides some evidence in this regard. Thus, the current study is
an initial step toward testing positive and negative computer experience as an external
factor in TRA. This study explored some of the first empirical evidence that subjective
computer experience could influence system usage. The results supported the effect of
subjective computer experience on computer attitude and negative computer experience on
subjective norms and ultimately the effect on system performance. To understand
information systems' success the psychological factors are important (Kappelman and
Guynes, 1995), and measuring subjective computer experience can provide this
opportunity for managers. Therefore, IS managers can utilise the SCES to assess the
current level of computer experience of users to take action that would predict the level of
system usage in organisations. By correctly utilising the SCES in studies, researchers can
refine their understanding of the critical factors leading to MIS effectiveness and make
future improvements.
Moreover, this research extended previous work on objective computer experience
(Objective Computer Experience) to find more information about computer experience as
well as a foundation for the further empirical studies on system usage.
248

10.4 Limitations
There are some limitations in this study that should be considered in the interpretation of
the results.
10.4.1 Research Model
The research model in the study, was sufficient for demonstrating the factors that explain
system usage. However, it is not a comprehensive model containing all possible factors.
Therefore, the effects of other potential factors such as; system characteristics, remain
open.
Consistent with the TRA, user computer attitude and subjective norms can determine
behavioural intention and consequently, computer systems usage. In this study,
behavioural intention was hypothesised to determine computer usage so intention to use
computers was measured as a predictor of system usage. However, this is not a serious
problem. There are many empirical studies that support the intention-behaviour link. In
the Technology Acceptance Model (TAM), Davis (1985), and in the Theory of Planned
Behaviour (TPB), Ajzen and Madden (1986) reported that intention is related to
behaviour. Since the TAM and the TPB are based on the TRA, it can be concluded that
there is an intention-behaviour link in the TRA. Furthermore, Schifter and Ajzen (1985);
Taylor and Todd (1995a) from the results of their study, reported that intention was
correlated with behaviour. Moreover, Sheppard et al. (1988) in a meta-analysis study on
the TRA reported a correlation of 0.53 between intention and behaviour. Davis et al.
(1989) compared TRA and TAM. The intention to use to usage correlation was 0.53 and
0.63 at time 1 and 2. The authors argued that behaviour is predictable from measure of
behavioural intention. Given the alone, the fact that the behaviour was not directly
measured is not a serious limitation.
However, intention can change over time, thus, measurement of intention and actual
system usage should be assessed the same time because the length of time between
measuring intention to use computer systems and actual use may affect behavioural
249
performance. Based on the above studies of strong relationship between intention to use
and system usage, in this study, the measuring of system usage was not necessary to
predict the use of computerised information systems in Community Health.
The other limitation of the current study is that the population of this study were nurses
and health workers of community health centres. Therefore, the results cannot be
generalised to other populations. Moreover, the population of the study may not have
been very aware of the object of the attitude and the attitude behaviour.
10.4.2 Method
Since survey data represent ex-post participants' perception, responses may have been
influenced by the ultimate success or failure of the system. The participants may
unconsciously upgrade their perceptions if they like the system and downgrade their
perception if they dislike the system. Moreover, as additional information becomes
available, users may change their assessment. Users may also have mixed feelings about
a given change. However, once a system is installed, it should be possible for users to
make a better assessment. Therefore, the lack of longitudinal measurement of system
usage is a limitation in this study.
10.4.3 Data Collection
In this study, the data was based on participants' self-reports. Hartley et al. (1977)
reported that accuracy of the self-report activity data decreased when more qualitative
information was requested. In a parallel perspective, another study suggested self-report
as a relatively appropriate measures (Blair and Burton, 1987). However, this is not a
problem in this study, because the best method for user thought, subjective feelings and
intention to use system is the user's own explanation (Ettema, 1985) rather than other
methods such as; observing or system (electronic) monitoring.
250

The researcher could not control the effect of the environment, including the social and
psychological conditions of users during the period of responding to questionnaires, that
may have influenced their responses to questions.
10.5 Suggestions for Future Study
10.5.1 Computer Experience Scale
Additional research is needed on a number of fronts. The Subjective Computer
Experience Scale (SCES) that was developed for measuring computer experience, should
undergo further testing. Multiple studies, would lead to refinement and increased
generaliability of this scale. The researchers might add more items (perhaps including
some omitted from the original instrument), measure the reliability of those items and
discard the unreliable ones. In this process any organisation could be targeted for in-depth
analysis of the scale.
Due to the importance of subjective computer experience, the SCES could be used in a
longitudinal study to determine; 1) how and to what extent initial computer experience
influences judgement of people about their positive or negative experience? 2) how,
under what conditions, what kinds of computer experience could be provided? 3) how
subjective computer experience changes over time? 4 ) what is the characteristic of users
who have positive or negative computer experience? and 5 ) what is the similarity and
differences in their characteristics? Longitudinal studies can determine result more
explicitly. This information will give new knowledge about computer experience because
by more attention to human factors, usage of computer systems would be enhanced
(Staggers, 1991).
Based on the previous study of Songer-Nocks (1976), some factors such as; previous
experience may affect behaviour directly. It would be interesting to determine in future
studies, whether factors such as; high levels of positive computer experience, lessens the
moderating influence of computer attitude that found in this study.
251
Moreover, research could move toward clarifying under what conditions subjective
norms can be effective and useful in reducing users' negative experience. This will
answer many questions regarding organisational policies that most managers face today
with regard to user resistance to computer systems.
As result of the training-related findings, this study suggests that computer training can
reduce negative computer experience. Type of training in this regard, is an important
factor (Harrington et al., 1990). Therefore, additional research on negative computer
experience is needed to find how training can reduce the duration (temporary and
permanent) or intensity of negative computer experience.
10.5.2 User Involvement
These findings suggest that future studies in this area should be careful in assessing user
involvement because the perception of involvement may influence the subsequent system
success or failure after implementation. One approach to minimising the impact of bias
may be to use longitudinal designs.
This study measured the effects of user involvement on participants' attitude and
subjective norms. Based on the involvement-related results in this study, it is suggested
that the effect of involvement on computer attitude and subjective norms may be due to
some user characteristics. It would be interesting to examine whether the relationship of
perceived users' involvement to system success is moderated by variables such as;
demographic and personality characteristics. The findings will have important
implications. Organisations that follow general recommendations to obtain high levels of
users' involvement may not obtain the anticipated benefits due to individuals' differences
among users.
In addition, the difference of nurses' and health workers' task characteristic highlights the
question of: when and who should be involved? In the process of information systems
whose judgement and under what condition should it be accepted? These are important
issues and require further exploration.
252
10.5.3 Other Variables in the Research Model
Since computer systems use depends on the many factors related to task environment and
system characteristics, it is important to expand the model in future research to explore
other potential factors which influence system usage. These factors include:
organisational size, organisational age, length of computerisation of organisation, work
environment variables, quality of systems, availability and accessibility of system, user
participation, career opportunities, salary, job autonomy and task uncertainty.
Furthermore, a number of specific variables and their roles were discussed in the current
research study (see chapter 4), such as; user self-efficacy, confidence and satisfaction.
Studies regarding to satisfaction, computer experience and computer usage have shown
that there are positive relationship among these variables (Rivard and Huff, 1988; Igbaria,
1990; Igbaria and Nachman, 1990). Thus, these can be examined as external variables on
computer attitude and subjective norms in future study.
Moreover, based on the studies of Hill et al., (1987); Compeau and Higgins (1995a),
self-efficacy can influence computing skills of users and system usage. Studies in the
health sector, emphasised the effect of computer experience on computer self-efficacy,
outcome expectancy and consequently, job performance (Henry and Stone, 1995). Mills
and McQueen (1997) studied effects of self-efficacy on computer use in the health sector.
The findings suggested that self-efficacy and confidence affected computer usage. The
authors point out that confidence of users could assist them to use computer systems
effectively and successfully. These finding indicate that to assist users in developing
performance with respect to computer systems, developing positive perception and
confidence for their ability are useful. The relationship between self-efficacy, computer
experience and system usage requires more investigation to give more information for
management of computer systems.
253
10.5.4 Extend the Research Model
This study provides a model of computer usage which further research may modify. In
order to explain usage and the value of the information systems more broadly, future
research is needed to explore additional issues. For instance, a research model that
integrates the TRA and the TAM will provide greater insights of both the theoretical
model and better understandings of the factors that influence systems usage. The ultimate
model will be able to broadly predict system usage and acceptance of technology in
organisations. Continued research will greatly enhance our understanding of the
determinants of system usage.
254

References
Abbott, K. (1993), Students nurses' conceptions of computer use in hospitals.
Computers in Nursing 11 (2), 78-87.
Abdellah, F. G. and Levine, E. (1986), Better Patient Care Through Nursing Research.
Third Edition. Macmillan Publishing Company, United States of American.
Abdul-Gader, A. (1996), The impact of user satisfaction on Computer-Mediated
Communication Acceptance: A causal path model. Information Resources Management
Journal 9 (1), 17-26.
Abdul-Gader, A. H. and Kozar, K. A. (1995), The impact of computer alienation on
information technology investment decisions: an exploratory cross-national analysis. MIS
Quarterly 19 (4), 535-559.
Adams, D. A., Nelson, R. R. and Todd, P. A. (1992), Perceived usefulness, ease of
use, and usage of information technology: A replication. MIS Quarterly 16 (2), 227-247.
Adaskin, E. J., Hughes, L. McMullan, P., McLean, M. and McMorris, D. (1994), The
Impact of computerisation on nursing: An interview study of users and facilities.
Computers in Nursing 12 (3), 141-148.
Adler, A. (1973), Feelings and emotions from the standard point of individual
psychology, in M. L. Reymert (ed), Classics in Psychology. Amo Press, New York,
PP. 316-321.
Ajzen, I. (1989), Attitude stmcture and behaviour in A. R. Pratkamis, S. J. Breckler, and
A. G. Greenwald. (eds), Attitude. Structure, and Functions. Hillsdale, Lawrence
Erlbaum, PP. U S A , 241-274.
Ajzen, I. and Fishbein, M. (1980), Understanding Attitudes and Predicting Social
Behaviour. Prentice-Hall, Inc., Englewood Cliffs, U.S.A.
255
Ajzen, I. and Madden, T. J. (1986), Prediction of goal-directed behaviour: Attitude,
intentions, and perceived behavioural control. Journal of Experimental Social Psychology
22 (4), 453-474.
Alavi, M. (1986), User-developed DSS: Steps toward quality control, in M. Jark (ed),
Managers, Micros and Mainframes Integrating System for End-Users. John Wiley and
Sons, New York, PP. 119-131.
Alexander, M. J. and Siegel, C. (1984), Opinions and feelings: The validity of attitudes
toward computers. IEEE 540-542.
Alexandre, L. M. (1994), Information technology as an enabler of health system reform.
Journal of AHIMA 65 (7), 36- 41.
Amoako-Gyampah, K. and White, K. B. (1993), User involvement and user
satisfaction. Information and Management 25 (1), 1-10.
Anderson, R. A., Dobal, M. T. and Blessing, B. B. (1992), Theory-based approach to
computer skill development in nursing administration. Computers in Nursing 10 (4),
152-157.
Andrew, W. F. (1993), Beside/point of care technology: The 'window' into the
integrated clinical database. Computers in Nursing 11 (1), 17-19.
Atkins, M. H. (1994), Information technology and Information systems perspectives on
business strategies. Journal of Strategic Information System 3 (2), 123-135.
Atkins, R. M. (1995), A computer-based model for analysing staffing needs of
psychiatric treatment programs. Psychiatric Services 46 (12), 1272-1278.
Austin, C. J. (1992), Information Systems for Health Services Administration. Fourth
edition, AUPHA press/Health Administration press, Ann Arbor Michigan.
256

Ayers, T., Davis, G., Dubinsky, E. D. and Lewin, P. (1988), Composition of function.
Journal of Research in Mathematics 19 (3), 246-259.
Badagliacco, J. M. (1990), Gender and race differences in computing attitudes and
experience. Social Science Computer Review 8(1), 42-63.
Bagozzi, R. Davis. F. D. and Warshaw, P. R. (1992), development and test of a theory
of technological learning and usage. Human Relations 45 (7), 659-686.
Ballance, C. T. and Ballance, V. V. (1993), Psychology of computer use: XXVII.
Relating self-rated computer experience to computers stress. Psychological Reports 72
(2), 680-682.
Bandura, A. (1977), Self-efficacy: Toward a unifying Theory of Behavioural Change.
Psychological Review 84 (2), 191-215.
Bandura, A. (1982), Self-efficacy mechanism in human agency. American Psychologist
37, 122-147.
Bantock, G. H. (1967), Education. Culture and the Emotions. Faber and Faber,
London.
Baran, S., Zandan, P. and Vanston, J. H. (1986), How effectively are we managing
innovation?. Research Management 29 (1), 23-25.
Barki, H. and Hartwick, J. (1994), Measuring user participation, user involvement, and
user attitude. MIS Quarterly 18(1), 59-77.
Baroudi, J. J. and Orlikowski, W. J. (1988), A short-form measure of user information
satisfaction: A psychometric evaluation and notes on use. Journal of Management
Information Systems 4 (4), 44-59.
257
Baroudi, J. J., Olson, M. H. and Ives, B. (1986), An empirical study of the impact of
user involvement on system usage and satisfaction. Communication of the ACM 29 (3),
232-238.
Beath, C. M. and Orlikowski, W. J. (1994), The contradictory structure of systems
development methodologies: Reconstructing the IS-user relationship in information
engineering. Information Systems Research 5 (4), 350-377.
Becker, W. C., Engelmann, S., and Thomas, D. R. (1975), Teaching 1: Classroom
Management. Science Research Associates, Inc, U.S.A.
Bedworth, D. A. and Bedworth, A. E. (1978), Health Education: A Process for Human
Effectiveness. Harper and Row, New York.
Bendel, P. J. (1987), Review of computerised information systems in the health area and
their implication for long-term care, in D. Schwefel (ed), Indicators and Trends in Health
and Health Care. Springer-verlag, New York.
Bentler, P. M. and Speckart, G. (1981), Attitudes 'Cause' Behaviour: A Structural
Equation Analysis. Journal of Personality and Social Psychology 40 (2), 226-238.
Bentley, T. (1995), Humane information management. Management Accounting 73 (3),
65-65.
Blair, E. and Burton, S. (1987), Cognitive processes used by survey respondents to
answer behavioural frequency questions. Journal of Consumer Research 14 (2), 280
288.
Blue, C. L. (1995), The predictive capacity of the Theory of Reasoned Action and the
Theory of Planned Behaviour in exercise research: An integrated literature review.
Research in Nursing and Health 18 (2), 105-121.
Bongartz, C. (1988), Computer-oriented patient care. Computer in Nursing 6 (5), 404
210.
258
Boot, R. L., Cowling, A. G. and Stanworth, M. J. K. (1979), Behavioural Science for
Managers. Edward Arnold, Melbourne.
Born, R. G. and Cummings, C. W. (1994), An assessment model for computer
experience, skills and attitudes of undergraduate business students. Journal of Computer
Information Systems 35 (1), 41-53.
Borovits, I. (1984), Management of Computer Operations. Prentice-hall, Inc, New
Jersy.
Bostrom, R. P, Olfman, L. and Sein, M. K. (1990), The importance of learning style in
end-user training. MIS Quarterly 14 (1), 101- 119.
Bradesly, M and Coles, J. (1989), Casemix and management issues. DRG and Health
Care 101-132.
Bradley, G. (1989), Computer and Psychological Work Environment. Taylor and
Francis, London.
Bratton, G. R. and Newsted, P. R. (1995), Response effects and computer-administered
questionnaires: the role of the entry task and previous computer experience. Behaviour
and Information Technology 14 (5), 300-312.
Brazile, R. P. and Hettinger, B. J. (1995), A Clinical Information System for
Ambulatory Care. Computers in Nursing 13 (4), 151-158.
Brinberg, D. (1979), An examination of the determinants of intention and behaviour: A
comparison of two models. Journal of Applied Social Psychology 9 (6), 560-575.
Brock, D. B. and Sulsky, L. M. (1994), Attitudes toward computers: Construct
validation and relations to computer use. Journal of Organisational Behaviour 15 (1), 17
35.
259

Brodt, A. and Stronge, J. H. (1986), Nurses' attitude toward computerisation in a
Midwestern community hospital. Computer in Nursing 4 (2), 82-86.
Bronsema, G. S. and Keen, P. G. W. (1983), Education Intervention and
implementation in MIS. Sloan Management Review 24 (4), 35-43.
Brown, S. H. and Coney, R. D. (1994), Changes in physician's computer anxiety and
attitudes related to clinical information system use. J Am-Med Tnform-Assoc 1 (5), 381
94.
Brown, S. J., Cioffi, M. A., Schinella, P. and Shaw, A. (1995), Evaluation of the
Impact of a Beside Terminal System in a Rapidly Changing Community Hospital.
Computers in Nursing 13 (6), 280-284.
Brown, T. S., Brown, J. T. and Baack, S. A. (1991), Attitudes of the elderly toward
computers. The Journal of Computer Information Systems 31 (2), 28-33.
Brown, V. T. (1984), Survey of user satisfaction: Nursing's attitude toward MIS. IEEE
601-604.
Brummelhuis, A. T. and Plomp, T. (1994), Computers in primary and secondary
education: The interest of an individual teacher or a school policy. Computers Education
22 (4), 291- 299.
Bryson, D. M. (1991), The computer-literate nurse. Computers in Nursing 9 (3), 100
107.
Bubshait, A. A. (1994), Owner involvement in project quality. International Journal of
Project Management 12 (2), 115-117.
Bucholz, K. K., Marion, S. L., Shayka, J. J., Marcus, S. C. and Robins, L. N. (1996),
A short computer interview for obtaining psychiatric diagnosis. Psychiatric Services 47
(3), 293-297.
260
Bullen, C. V. (1986), Company experience with end-user computing, in M. Jark (ed),
Managers. Micros and Mainframes Integrating System for End-Users. John Wiley and
Sons, New York, PP. 73-85.
Burkes, M. (1991), Identifying and relating nurses' attitudes toward computer use.
Computer in Nursing 9 (5), 190-201.
Bumard, P. (1994), Searching for meaning: A method of analysing interview transcripts
with a personal computer. Nursing Education Today 14, 111-117.
Bums, N. and Grove, K. (1993), The Practice of Nursing Research Conduct.
Critique, and Utilisation. Second Edition, W. B. Saunders Company, Philadelphia.
Burton, F. G., Chen, Y. N., Grover, V. and Stewart, K. A.(1992), An application of
Expectancy Theory for assessing user motivation to utilise an expert system. Journal of
Management Information Systems 9 (3), 183-198.
Bush, C. T. (1985), Nursing Research. Reston Publishing Company, Virginia.
Calvert, G., Mobley, S. and Marshall, L. (1994), Grasping the learning organisation.
Training and Development 48 (6), 40-42.
Campbell, D. T. and Fiske, D. W. (1959), Convergent and discriminatnt validity by the
multitrait-multimethod matrix. Psychological Bulletin 56, 81-105.\
Campbell, J. P. (1990), Modelling the performance prediction in problem in industrial
and organisational psychology, in M. D. Dunnette and L. M. Hough (eds), Handbook of
Industrial and Organisational Psychology. Second edition, Palo Alto Calif: Counselling
Psychologist, Press, Inc, California, PP. 687-734.
Cannon, W. B. (1973), Neural organisation for emotional experience, in M. L. Reymert
(ed), Classics in Psychology. Amo Press, New York, PP. 257-269.
261

Capron, H. L. (1990), Computers Tools for An Information Age. Second edition, The
Benjamin Cummings Publishing Company, Inc, California.
Caputi, P., Jayasuriya, R. and Fares, J. (1995), The development of a measure of
attitudes toward computers in nursing. University of Wollongong.
Carey, M. A. (1994), The group effect in focus groups: Planning, implementing, and
interpreting focus group research, in J. M. Morse (ed), Qualitative Research Methods.
SAGE Publications, International Educational and Professional Publishers, London, PP.
225-241.
Carter, B. E. and Axford, R. L. (1993), Assessment of computer learning needs and
priorities of registered nurses practicing in hospitals. Computers in Nursing 11 (3), 122
126.
Chae, Y. M., Kim, S. I., Lee, B. H., Choi, S. H. and Kim, I. S. (1994), Implementing
health management information systems: Measuring success in Korea's health centres.
International Journal of Health Planning and Management 9 (4), 341-348.
Chapman, C. (1996), Control of computer systems a "major business problem". The
Internal Auditor 53 (1), 9.
Chapman, R. (1995), Raising service levels. Information Week 194.
Chapman, R. H., Reiley, P., McKinnery, J., Welch, K , Toomey, B. and McCausland,
M. (1994), Implementing a local area network for nursing in a large teaching hospital.
Computers in Nursing 12 (2), 82-88.
Cheney, P. H., Hale, D. P. and Kasper. G. M. (1990), Knowledge, skills and abilities if
information system professionals past, present and future. Information and Management
19 (4), 237-247.
262

Cheney, p. H. and Dickson, G. W. (1982), Organisational characteristics and
information systems: An exploratory investigation. Academy of Management Journal 25
(1), 170-184.
Clayton, P. D. and Pulver, G. E. (1993), Physician use of computer: Is age or value the
predominate? Proc-Annu-Svmp-Comput-Appl-Med-Care 301-305.
Coe, L. R. (1996), Five small secrets to system success. Information Resources
Management Journal 9 (4), 29- 38.
Colley, A. M., Gale, M. T. and Harris, T. A. (1994), Effects of gender role identify and
experience on computer attitude components. Journal of Educational Computing Research
10 (2), 129-137.
Collis, B. A. (1985), Psychological implications of sex differences in attitude toward
computers: Results of a survey. International Journal of Women's Studies 8, 207-213.
Compeau, D. R. and Higgins, C. A. (1995a), Application of Social Cognitive Theory to
Training for Computer Skills. Information Systems Research 6 (2), 118-143.
Compeau, D. R. and Higgins, C. A. (1995b), Computer self-efficacy: Development of a
measure and initial test. MIS Quarterly 19 (2), 189- 211.
Cowley, S. (1995), professional development and change in a learning organisation.
Journal of Advanced Nursing 21 (5), 965-974.
Culpan, O. (1995), Attitudes of end-users towards information technology in
manufacturing and service industries. Information and Management 28 (3), 167-176.
Czaja, S. and Sharit, J. (1993), Age differences in the performance of computer-Based
work. Psychology and Aging 8 (1), 59- 67.
263
Czaja, S. J. Guerrier, J. H. Nair, S. N. and Landauer, T. K. (1993), Computer
communication as an aid to independence for older adults. Behaviour and Information
Technology 12 (4), 197-207.
Dambrot, F. H., Silling, S. M. and Zook, A. (1988), Psychology of computer use: II.
Sex differences in prediction of course grades in a computer language course. Perceptual
and Motor Skills 66 (2), 627-636.
Dambrot, F. H., Watkins-Malek, M. A., Silling, S. M., Marshall, R. S. and Garver, J.
A. (1985), Correlates of sex differences in attitudes towards and involvement with
computers. Journal of Vocational Behaviour 27 (1), 71-86.
Damodaran, L. (1996), User involvement in the systems design process-a practical guide
for users. Behaviour and Information Technology 15 (6), 363-377.
Davidson, W. H. (1980), Experience Effects in International Investment and Technology
Transfer. UMI Research Press, Michigan.
Davis, F. D. (1989), Perceived usefulness, perceived ease of use, and user acceptance of
information technology. MIS Quarterly 13 (3), 319-340.
Davis, F. D. (1993), User acceptance of information technology: System characteristics,
user perceptions and behavioural impacts. International Journal of Man-Machine Studies
38 (3), 475-487.
Davis, F. D., Bagozzi, R. P. and Warshaw, P. R. (1989), User acceptance of computer
technology: A comparison of two theoretical models. Management Science 35 (8), 982
1003.
Davis, F. D., Bagozzi, R. P. and Warshaw, P. R. (1992), Extrinsic and intrinsic
motivation to use computers in the workplace. Journal of Applied Social Psychology 22
(14), 1111-1132.
264

Davis, Jr, F.D. A Technology Acceptance Model For Empirically Testing New End-User
Information Systems: Theory and Results. Published thesis, Massachusetts Institute of
Technology, 1985.
Davis, S. A. and Bostrom, R. P. (1993), Training end-users: An experimental
investigation of the roles of the computer interface and training methods. MIS Quarterly
17 (1), 61-81.
Davitz, J. R. (1970), A dictionary and Grammer of Emotion, in M. B. Arnold. Feelings
and Emotions. Academic Press, New York, 251- 258.
Deatrick, J. A. and Faux, S. A. (1991), Conducting qualitative studies with children and
adolescents, in J. M. Morse (ed), Qualitative Nursing Research. Sage publications, the
International Publishers, London, PP. 203-223.
Dempsey, P. A. and Dempsey, A. D. (1986), The Research Process in Nursing. Second
edition, Jones and Bartlett Publishers, Boston.
Dewey, J. (1939), Experience and Education. The Macmillan Company, New York.
Dillman, D. A. (1978), Mail and Telephone Surveys: The Total Design Method. A
Wiley-interscience Publication, New York.
Doll, W. J. and Torkzadeh, G. (1990), The measurement of End-user software
involvement. OMEGA 18 (4), 399-406.
Donaghy, W. C. (1984), Interview: Skills and Applications. Scott, Foresman and
Company, U. S. A.
Doorley, J. E., Renner, A. L. and Corron, J. (1994), Creating care plans via modems:
Using information systems in nursing education. Computers in Nursing 12 (3), 160
163.
265
Dover, L. V. and Boblin, S. (1991), Students nurse computer experience and preferences
for learning. Computers in Nursing 9 (2), 75-79.
Downers, T. (1993), Student-teachers' experience in using computers during teaching
practice. Journal of Computer Assisted Learning 9 (1), 17-33.
Dunlop, F. (1984), The Education of Feeling and Emotion. George Allen & Unwin,
London.
Durndell, A. Macleod, H. and Siann, G. (1987), A survey of attitudes to, knowledge
about and experience of computer. Computer Education 11 (3), 167-175.
Dyck, J. L. and Smither J. A. A. (1994), Age differences in computer anxiety: The role
of computer experience, gender and education. Journal of Educational Computing
Research 10 (30), 239-248.
Ellsworth, R. and Bowman, B. E. (1982), A "belief about computers" scale based on
Ahl's questionnaire items. The computing Research 10, 32-34.
Ely, E. S. (1985), Don't be afraid of computer phobia. Computer Decisions 17 (18): 98
101.
Emrich, M. (1989), An interview with Dr, Alan Pritsker- Pioneer in computer simulation.
Manufacturing Systems 7 (5), 38-42.
Ertmer, P. A., Evenbeck, E., Cennamo, K. S. and Lehman, J. D. (1994), Enhancing
self-efficacy for computer technologies through the use of positive classroom
experiences. ETR and D 42 (3), 45-62.
Ettema, J. S. (1985), Explaining information system use with system-monitored Vs self
reported use measures. Public Opinion Quarterly 49 (2), 381-387.
Ewert, O. (1970), The attitudinal character of emotion, in M. B. Arnold (ed), Feelings
and Emotions. Academic Press, New York, PP. 233- 240.
266
Fazio, R. H. and Zanna, M. (1978), On the predictive validity of attitudes: The roles of
direct experience and confidences. Journal of Personality 46, 228-243.
Fazio, R. H., Powell, M. C. and Herr, P. M. (1983), Toward a process Model of the
Attitude-Behaviour Relation: Assessing one's attitude upon mere observation of the
attitude object. Journal of Personality and Social Psychology 44 (4), 723-735.
Fishbein, M. Ajzen, I. and Hinkle, R. (1980a), Predicting and understanding voting in
American elections: Effects of external variables, in I. Ajzen and M. Fishbein (eds),
Understanding Attitudes and Predicting Social Behaviour. Prentice-Hall, Inc.,
Englewood Cliffs, U.S.A. PP. 173-195.
Fishbein, M. and Ajzen, I. (1975), Beliefs. Attitude. Intention and Behaviour: An
Introduction to Theory and Research. Addison-Wesley Publishing Company,
Philippines.
Fishbein, M., Bowman, C. H., Thomas, K., Jaccard, J . J. and Ajzen, J. (1980b),
Predicting and understanding voting in British elections and American referenda:
Illustrations of the theory's generality, in I. Ajzen, and M. Fishbein (eds), Understanding
Attitudes and Predicting Social Behaviour. Prentice-Hall, Inc., Englewood Cliffs,
U.S.A. PP. 196-216.
Fochtman, M. M. and Kavanaugh, S. B. (1991), A Nursing Service-Education Model
for introducing baccalaureate nursing students to research and computer concepts.
Computers in Nursing 9 (4), 152-158.
Francis, L. J. (1994), The relationship between computer related attitudes and gender
stereotyping of computer use. Computer Education 22 (4), 283-289.
Fry, D. and Baum, F. (1992), Keywords in community health, in F. Baum, D. Fry and
I. Lennie (eds), Community Health Policy and Practice in Australia. PP. 296-309.
267
Gamble, P. R. (1988), Attitudes to computers of managers in the hospitality industry.
Behaviour and Information Technology 7 (3), 305-321.
Gardner, D. G., Discenza, R. and Dukes, R. R. (1993a), The measurement of computer
attitudes: An empirical comparison of available scales. Journal of Educational Computing
Research 9 (4), 487-507.
Gardner, E. P., Young, P. and Ruth, R. (1989), Evaluation of attitudes toward
computers: A retrospective view. Behaviour and Information Technology 8 (2), 89-98.
Gardner, J., Chapmen, M., Donaldson, G. and Jacobson, S. (1988), Toward Supported
Employment: A Process Guide for Planned Change. Paul H. Brooks Publishing
Company, Baltimore.
Gardner, J., Morrison, H. and Jarman, R. (1993b), The impact of high access to
computers on learning. Journal of Computer Assisted Learning 9 (1), 2-16.
Garland, J. L. (1986), How to Develop Business Information System for End-Users.
Johan Wiley and Sons, New York.
Gerlach, J. H. and Kuo. F. Y. (1991), Understudying human-computer interaction for
information systems design. MIS Quarterly 15 (4), 527-549.
Ghiselli, E. E. (1964), Theory of Psychological Measurement. McGraw-Hill Book
Company, New York.
Glass, C. R. and Knight, L. A. (1988), Cognitive factors in computer anxiety. Cognitive
Therapy and Research 12 (4), 351-366.
Godfrey, R. M. (1995), Students as end-users: participate design of the IS learning
experience. Journal of Computer Information Systems 36 (1), 17- 22.
268

Gosling, D. (1994), Informal learning contracts for skills development in seminars, in M.
Laycock and J. Stephenson (eds), Using Learning Contracts in Higher Education.
Kogan page, London, PP. 57-66.
Goss, E. P. Buelow, V. and Ramchandani, H. (1995), The Real Impact of a Point-Of-
Care Computer System on ICU nurses. Journal of Systems Management 43-47.
Grann, R. P. (1984), Attitude and affective use of computers among hospital personnel.
IEEE 543-545.
Griffith, J. R., Smith, D. G. and Wheeler, J. R. C. (1994), Continuos improvement of
strategic information systems: Concepts and issues. Health Care Management Review 19
(2), 43-52.
Guimaraes, T. (1996), Assessing the impact of information centres on end-used
computing and company performance. Information Resources Management Journal 6
15.
Guimaraes, T. and Igbaria, M. (1996), Exploring the relationship between EUC
problems and success. Information Resources Management Journal 9 (2), 5-15.
Hagmann, C. and McCahon, C. S. (1993), Strategic information systems and
competitiveness. Information and Management 25 (4), 183-192.
Hair, Jr, J. F., Anderson, R. E. and Tatham, R. L (1987), Multivariate Data Analysis
With Readings. Second Edition, Macmillan Publishing Company. London.
Hair, Jr, J. F., Anderson, R. E., Tatham, R. L. and Black. W. C. (1992), Multivariate
Data Analysis With Readings. Third Edition, Macmillan Publishing Company. London.
Hair, Jr, J. F., Anderson, R. E., Tatham, R. L. and Black. W. C. (1995), Multivariate
Data Analysis With Readings. Fourth Edition, Prentice Hall, Englewood Cliffs, New
Jersey.
269

Hall, J. and Cooper, J. (1991), Gender, experience and attribution to the computer.
Journal of Educational Computing Research 7 (1), 51-60.
Hamilton, S. and Chervany, N. L. (1981a), Evaluating information system effectiveness-
part I: Comparing evaluation approaches. MIS Quarterly 55- 69.
Hamilton, S. and Chervany, N. L. (1981b), Evaluating information system
effectiveness- part II: Comparing Evaluator viewpoints. MIS Quarterly 79- 87.
Harp, C., Stazinger, J., and Taylor, S. (1997), many paths to learning software.
Training and development 51 (5), 81-84.
Harrington, K. V., Me Elroy, J. C. and Morrow, P. C. (1990), Computer anxiety and
computer-based training: A laboratory experiment. Journal of Educational Computing
Research 6 (3), 343-358.
Hartely, C., Brecht, M., Pagerey, P., Weeks, G., Chapanis, A., and Hoecker, D.
(1977), Subjective time estimates of work tasks by office workers. Journal of
Occupational Psychology 50(1), 23-36.
Hartwick, J. and Barki, H. (1994), Explaining the role of user participation in
information system use. Management Science 40 (4), 440-465.
Hawk, S. R. (1993), The effects of user involvement: Some personality determinants.
International Journal of Man-Machine Studies 38 (5), 839-855.
Hawk, S. R. and Aldag, R. J. (1990), Measurement biases in user involvement research.
OMEGA 18 (6), 605-613.
Hebert, M. (1994), Adopting information technology in hospitals: The relationship
between attitudes/Expectations and behaviour. Hospital and Health Services
Administration 39 (3), 369-383.
270
Heinssen, Jr, R. K., Glass, C. R. and Knight, L. A. (1987), Assessing computer
anxiety: Development and validation of the computer anxiety rating scale. Computers in
Human Behavior 3,49-59.
Hekelman, F. P., Niles, S. A. and Brennan, P. F. (1994), Gerontology home care: A
prescription for distance continuing education. Computers in Nursing 12 (2), 106-109.
Heller, A. (1979), A Theory of Feelings. Van Gorcum Assen, The Netherlands,
Canada.
Henderson, R. D. and Dean, F. P. (1996), user expectations and perceptions of a patient
management information system. Computers in Nursing 14 (3), 188-193.
Henderson, R. D., Dean, F. P. and Ward, M. J. (1995a), Occupational differences in
computer-related anxiety: Implications for the implementation of a computerised patient
management information system. Behaviour and Information Technology 14 (1), 23-31.
Henderson, R., Deane, F., Barrelle, K. and Mahar, D. (1995b), Computer anxiety:
Correlates, norms and problem definition in health care and banking employees using the
computer attitude scale. Interacting with Computers 7 (2), 181-193.
Hendrickson, M. F. (1993), The nurse engineer: A way to better nursing information
systems. Computers in Nursing 11 (2), 67-71.
Henry, J. W. and Stone, R. W. (1995), A structural equation model of job performance
using a computer-based order entry system. Behaviour and Information Technology 14
(3), 163-173.
Hill, T., Smith, N. D. and Mann, M. F. (1987), Role of efficacy expectations in
predicting the decision to use advanced technologies: The case of computers. Journal of
Applied Psychology 72 (2), 307-313.
Hills, P. J. (1976), The Self-Teaching Process in Higher Education. Croom Helm,
London.
271
Hoisington, L. B. (1973), Pleasantness and unpleasantness as modes of bodily
experience, in M, L. Reymert (ed), Classics in Psychology. Amo Press, New York,
236- 246.
Holt, R. W., Boehm-Davis, D. A. and Schultz, A. C. (1989), Multilevel structured
documentation. Human Factors 31 (2), 215-228.
Horn, P. W. and Hulin, C. L. (1981), A competitive test of the prediction of reenlistment
by several models. Journal of Applied Psychology 66 (1), 23-39.
Howard, G. S. and Smith, R. D. (1986), Computer anxiety in management: Myth or
reality. Communications of the ACM 29 (7), 611-615.
Howard, G. S. and Weinroth, G. J. (1987), User's complaints: Information system
problems from the user's perspective. Journal of Systems Management 38 (5), 30-35.
Hudiburg, R. A., Brown, S. R. and Jones, T. M. (1993), Psychology of computer use:
XXIX. Measuring computer users' stress: The computer hassles scale. Psychological
Reports 73 (3), 923-929.
Igbaria, M. (1990), End-user computing effectiveness: A structural Equation Model.
OMEGA 18 (6), 637-652.
Igbaria, M. (1992), An examination of microcomputer usage in Taiwan. Information and
Management 22 (1), 19-28.
Igbaria, M. (1993), User acceptance of microcomputer technology: An empirical test.
OMEGA 21 (1), 73-90.
Igbaria, M. (1994), A examination of the factors contributing to microcomputer
technology acceptance. Accounting. Management and Information Technologies 4 (4),
205-224.
272
Igbaria, M. and Chakrabarti, A. (1990), Computer anxiety and attitudes towards
microcomputer use. Behaviour and Information Technology 9 (3), 229-241.
Igbaria, M. and Iivari, J. (1995), The effects of self-efficacy on computer usage.
OMEGA 23 (6), 587-605.
Igbaria, M. and Nachman, S. A. (1990), Correlates of user satisfaction with end user
computing. Information and Management 19 (2), 73-82.
Igbaria, M. and Parasuraman, S. (1989), A path analytic study of individual
characteristics, computer anxiety and attitude microcomputers. Journal of Management
15 (3), 373-388.
Igbaria, M., Guimaraes, T. and Davis, G. B. (1995a), Testing the determinate of
microcomputer usage via a structural Equation Model. Journal of Management
Information System 11 (4), 87-114.
Igbaria, M., Pavri, F. N. and Huff, S. L. (1989), Microcomputer applications: An
empirical look at usage. Information and Management 16, 187-196.
Igbaria, M., Schiffman, S. T. and Wieckowski, T. J. (1994), The respective roles of
perceived usefulness and perceived fun in the acceptance of microcomputer technology.
Behaviour and Information Technology 13 (6), 349-361.
Igbaria, M., Iivari, J. and Maragahh, H. (1995b), Why do individual use computer
technology? A Finnish case study. Information and Management 29 (5), 227-238.
Igbaria, M., Parasuraman, S. and Baroudi, J. (1996), A motivational model of
microcomputer usage. Journal of Management Information Systems 13 (1), 127-143.
Ishman, M. D. (1996), Measuring information success at the individual level in cross
cultural environments. Information Resources Management Journal 16-28.
273

Ives, B. Olson, M. H. and Baroudi, J. J. (1983), The measurement of user information
satisfaction. Communications of the ACM 26 (10), 785-793.
Janet, P. (1973), Fear of action as an essential element in the sentiment of melancholia, in
M, L. Reymert (ed), Classics in Psychology. Amo Press, New York, PP. 297-309.
Jarvenpaa, S. L., and Ives, B. (1991), Executive involvement and participation in the
management of information technology. MIS Quarterly 15 (2), 205-227.
Jay, G. M. and Willis, S. L. (1992), Influence of direct computer experience on older
adults' attitudes toward computers. The Journal of Gerontology 47 (4), 250-257.
Jayasuriya, R. and Caputi, P. (1996), Computer attitude and computer anxiety in
nursing; validation of an instrument using an Australian sample. Computers in Nursing
14 (5), 1-6.
Jayasuriya, R., Milboume, K. and Tooth, B. (1994), Measuring the attitude of nurses
towards use of computers: Relationship with computer experience and training.
University of Wollongong.
Jayasuriya, R., Foulstone, J. and Little, S. (1993), Report of Evaluation of Information
Systems in Community Health in the Illawarra.
Jones, N. S. (1993), It for care, efficiency and cultural change. Health Service
Management 22-23.
Jones, T. and Clarke, V. A. (1994), A computer attitude scale for secondary students.
Computers Education 22 (4), 315-318.
Joshi, K. (1990), An investigation of equity as a determination of user information
satisfaction. Decision Science 21 (4), 786-807.
Joshi, K. (1991), A model of users' perspective on change: The case of information
systems technology implementation. MIS Quarterly 15 (2), 229-242.
274
Kagan, D. and Pietron, L. R. (1987), Cognitive level and achievement in computer
literacy. The Journal of Psychology 121 (4), 317-327.
Kallgren, C. and Wood, W. (1986), Access to attitude-relevant information in memory as
a determinant of attitude-behaviour consistency. Journal of Experimental Social
Psychology 22, 328-338.
Kanfer, R. (1994), Motivation theory and industrial and organisational psychology, in
M. D. Dunnette and L. M. Hough (eds), Handbook of Industrial and Organisational
Psychology. Second edition, Palo Alto calif: Counselling Psychologist, Press, Inc,
California, PP. 75-170.
Kappelman, L. A. (1995a), measuring user involvement: A diffusion of innovation
perspective. Data Base Advances 26 (2&3), 65-83.
Kappelman, L. A. (1995b), Measuring user involvement with information systems and
with their development. Journal of Computer Information Systems 35 (4), 66- 76.
Kappelman, L. A. and Guynes, C. S. (1995), End-user training and Empowerment.
Journal of Systems Management 36-41.
Kasper, G. (1996), Information technology and individualised mass higher education.
Information Resources Management Journal 9 (1), 3-4.
Keen, P. G. W. and Woodman, L. A. (1984), What to do with all those micros. Harvard
Business Review 62 (5), 142-150.
Kelley, C. L. and Chamess, N. (1995), Issues in training older adults to use computers.
Behaviour and Information Technology 14 (2), 107-120.
Kerlinger, F. N. (1964), Foundations of Behavioural Research. Second Edition. Holt,
Rinehart and Winston, London.
275
Kerlinger, F. N. (1986), Foundations of Behavioural Research. Third Edition. Holt,
Rinehart and Winston, New York.
Kim, C. S. and Peterson, D. (1994), Comparison of novice and expert end-users on the
utilisation and utility of computers. Journal of Computer Information Systems 34 (4),
88-91.
Kim, K. K. and Michelman, J. E. (1990), An examination of factors for the strategic use
of information systems in the health care industry. MIS Quarterly 14 (2), 201-215.
Kindsvatter, R., Wilen, W., and Isbler, M. (1992), Dynamics of Effective Teaching.
Second Edition, Longman Publishing Group, London.
King, W. R. and Teo, T. S. H. (1994), Facilitators and inhibitors for the strategic use of
information technology. Information Management 27 (2), 71-87.
Kirkby, K. C. and Lambert, T. J. (1996), Computers aids to treatment in psychiatry.
Australian and New Zealand Journal of Psychiatry 30(1), 142-145.
Kirkman, C. (1993), Computer experience and attitudes of 12 year old students:
Implications For the UK National Curriculum. Journal of Computer Assisted Learning 9
(1), 51-62.
Kjeruliff, LK. H., and Counte, M. A. (1984), Measuring attitudes toward computers:
Two approaches, in SCAMC, Silver Spring, IEEE Computer Society Press, pp. 529
535.
Kleintop, W. A., Blau, G. and Currall, S. C. (1996), Migration to a new Electronic mail
system: User's attitudes and management support for achieving use. Information
Resources Management Journal 9 (2), 25-34.
Klouwenberg, M. K., Koot, W. J. D. and Schaik, A. M. V. (1995), Establishing
business strategy with information technology. Information Management and Computer
Security 3 (5), 8-20.
276

Knowles, M. C. (1990), Organisational Behaviour: Changing Concepts and
Applications. Harper and Row Publisher, Sydney.
Koohang, A., Avramovich, M., and Mogharreban, N. (1992), A study of end user
computing abilities among non-management personnel. Journal of Computer Information
Sciences 32 (3), 20-23.
Korth, S. K. and Morris, M. (1993), Selecting an information system. N ursing
Management 24 (4), 62-66.
Koslowsky, M., Hoffman, M. and Lazar, A. (1990), Predicting behaviour on a
computer from intentions, attitudes and experience. Current Psychological: Research and
Reviews 9 (1), 75-83.
Krampf, S. and Robinson, S. (1984), Managing nurses attitudes toward computer.
Nursing Management 15(7), 31-34.
Krendl, K. A., Broihier, M. C. and Fleetwood, C. (1989), Children and computers: Do
sex-related differences persist?. Journal of Communication 39 (3), 85-93.
Krovi, R. (1993), Identifying the causes of resistance to IS implementation. Information
and Management 25 (6), 327-335.
Kweku, E. M. (1997), Critical issues in abandoned information systems development
projects. Communications of the ACM 40 (9), 47-80.
Lacey, D. G. (1993), Nurses attitudes toward computerisation: A review of literature.
Journal of Nursing Management 1 (5), 239-43.
Lai, V. S. (1994), A survey of rural small business computer use; Success factors and
decision support. Information and Management 26 (6), 297-304.
277
Laing, R. D., Phillipson, H. and Lee, A. R. (1976), Interpersonal perception, in J.
Wolfson, Personality and Learning 2. Hodder and Stoughton, The Open University
press, London, PP. 19-33.
Lalomia, M. J. and Sidowski, J. B. (1990), Measurement of computer satisfaction,
literacy, and aptitude: A review. International Journal of Human-Computer Interaction 2
(3), 231-253.
Lalomia, M. J. and Sidowski, J. B. (1991), Measurement of computer attitudes: A
review. International Journal of Human-Computer Interaction 3 (2), 171-197.
Lalomia, M. J. and Sidowski, J. B. (1993), Measurement of computer anxiety: A
review. International Journal of Human-Computer Interaction 5 (3), 239-266.
Lawlor, S. C. (1994), Computer Information Systems. Third edition, The Dry den press,
Harcourt Brace College Publishers, Philadelphia.
Lazarus, R. S., Averill, J. R. and Opton, Jr. E. M. (1970), Towards a cognitive theory
of emotion, in M. B. Arnold (ed), Feelings and Emotions. Academic Press, New York,
PP. 207-232.
Lazonder, A. W. and Van-der-Meij, H. (1993), The minimal manual: Is less really
more?. Int. J. Man-Machine Studies 39 (5), 729-752.
Leach, K. and Caputi, P. (1995), Students Attitudes to Computers: Personality Type,
Gender, Cognitive Ability, and Computer Experience. Swinburne University of
Technology.
Lee, J. A. (1986), The effects of past computer experience on computerised aptitude test
performance. Educational and Psychological Measurement 46 (3), 727-733.
Lee, S. M., Kim, Y. R. and Lee, J. (1995), An empirical study of the relationships
among end-user information systems acceptance, training, and effectiveness. Journal of
Management Information Systems 12 (2), 189-202.
278
Lees, J. D. (1987), Successful development of small business information systems.
Journal of Systems Management 38 (9), 32-39.
Lieberg, S. (1995), Computerised nursing management systems. Nursing Management
26 (3), 29-36.
Lucas, Jr, H. C. (1978), Empirical evidence for a descriptive model of implementation.
MIS Quarterly 2 (1), 27-41.
Lucas, Jr, H. C. (1981), The Analysis. Design, and Implementation of Information
System. Second Edition, McGrow-Hill Book Company, New York.
Lucas, Jr, H. C. and Baroudi, J. (1994), The role of information technology in
organisation design. Journal of Management Information System 10 (4), 9-23.
MacCallum, R. (1986), Specification searches in covariance structure modelling.
Psychological Bulletin 100 (1), 107-120.
Macfarlane Smith, J. (1972), Interviewing in Market and Social Research. Routledge
and Kegan Paul, London.
Mackay, J. M. and Lamb, Jr. C. W. (1991), Training needs of novices and experts with
referent experience and task domain knowledge. Information and Management 20 (3),
183-189.
Mahrer, A. R. (1978), Experiencing: A Humanistic Theory of Psychology and
Psychiatry. Brunner/Mazel, Publisher, New York.
Manstead, A. S. R., Profitt, C. and Smart, J. L. (1983), Predicting and understanding
mothers' infant-feeding intentions and behaviour: Testing the Theory of Reasoned
Action. Journal of Personality and Social Psychology 44 (4), 657-671.
Marcoulides, G. and Bo Wong, X. (1990), A cross sectional comparison of computer
anxiety in college students. Journal Educational Computing Research 6 (3), 251-263.
279
Martin, E. W., Dehayes, D. W., Hoffer, J. A. and Perkins, W. C. (1994), Managing
Information Technology What Managers Need to Know. Macmillan Publishing
Company, U.S.A.
Maslow, A. H. (1970), Motivation and Personality. Second Edition. Harper and Row,
Publishers, New York.
Massoud, S. L. (1991), Computers attitudes and computer knowledge of adult student.
Journal of Educational Computing Research. 7 (3), 269-291.
Mathieson, K. (1991), Predicting user intentions: Comparing the Technology Acceptance
Model with the Theory of Planned Behaviour. Information Systems Research 2 (3), 173
191.
Mawhinney, C. H. and Lederer, A. L. (1990), A study of personal computer utilisation
by managers. Information and Management 18 (5), 243-253.
Mawhinney, C. H. and Saraswat, S, P. (1991), Personality type, computer anxiety and
student performance: an empirical investigation. The Journal of computer Information
Systems 32 (3), 101-103.
May. K. A. (1991), Interview techniques in qualitative research: Concerns and
challenges, in J. M. Morse (ed), Qualitative Nursing Research. Sage publications, the
International Publishers, London, PP. 188-201.
McAteer, P. F. (1994), Harnessing the power of technology. Training and Development
48 (8), 64-68.
McClelland, D. C., Atkinson, J. W., Clark, R. A., and Lowell, E. L. (1953), The
Achievement Motive. Appleton-Century-Crofts, Inc. New York.
McDonald, T. and Siegall, M. (1996), Enhancing workers self-efficacy: an approach for
reducing negative reactions to technological change. Journal of Managerial Psychology
11 (2), 41-44.
280
McDoniel, P. L., Palko, J. and Cronan, T. P. (1993), Information systems development:
Issues affecting success. Journal of Computer Information Systems 36 (1), 50-61.
Mcinerney, V., Mcinerney, D. M. and Sinclair, K. E. (1994), Student teachers,
computer anxiety and computer experience. J, Educational Computing Research 11 (1),
27-50.
McKeen, J. D., Guimaraes, T. and Wetherbe, J. C. (1994), The relationship between
user participation and user satisfaction: An investigation of four contingency factors. MIS
Quarterly 18 (2), 427-45.
McKeller, P. (1968), Experience and Behaviour. Penguin Books, Australia.
Mellar, H. and Jackson, A. (1994), The changing picture of IT experience in past-
graduate teacher training. Journal of Computer Assisted Learning 10 (1), 14-22.
Melone, N. P. (1990), A theoretical assessment of the user-satisfaction construct in
information system research. Management Science 36(1),76-91.
Miller, F. and Varma, N. (1994), The effects of psychological factors on Indian
children's attitudes toward computers. Journal of Educational Computing Research 10
(3), 223-238.
Miller, L. E. and Grush, J. E. (1986), Individual differences in individual versus
normative determination of behaviour. Journal of Experimental Psychology 22 (3), 109
202.
Mills, A. M. and McQueen, R. J. Developing user sophistication in the organisation: An
empirical investigation, proceedings, The Pacific Asia Conference on Information
Systems, PACIS'97, 1997, Brisbane, Queensland, Australia, 1-5 April, 561-572.
Minichiello, V., Aroni, R., Timewell, E. and Alexander, L. (1991), In-Depth Interview.
Longman Cheshire Pty Limited, Longman House, Melbourne.
281

Montazemi, A. R., Cameron, D. A. and Gupta, K. M. (1996), An empirical study of
factors affecting software package selection. Journal of Management Information
Systems 13 (1), 89-105.
Moore, G. C. (1987), End-user computing and office automation: A diffusion of
innovations perspectives. INFOR 25 (3), 214- 235.
Morgan, G. G. (1995), ITEM: A strategic approach to information systems in voluntary
organisations. Journal of Strategic Systems 4 (3), 225-237.
Morrow, P. C., Prell, E. R. and Mcelroy, J. C. (1986), Attitudinal and behavioural
correlates of computer anxiety. Psychological Reports 59, 1199-1204.
Morse, J. M. (1994), Designing funded qualitative research, in N. K. Denzin and Y. S.
Lincoln (Eds), Handbook of Qualitative Research. Thousand Oaks, Sage Publications,
London, PP. 220-235.
Munhall, P. L. and Oiler, C. J. (1986), Nursing Research: A Qualitative Perspective.
Appleton-Century-Crofts, U.S.A.
Murphy, C. A., Maynard, M. and Morgan, G. (1994), Pertest and postest attitudes of
nursing personnel toward a patient care information system. Computers in Nursing 12
(5), 239-244.
Nabali, H. M. (1991), Hospital information systems in Arab Gulf countries. Information
and Management 20 (5), 323-332.
Nash, W. (1993), Jargon. Blackwell Publishers, Oxford, Cambridg Massachusetts.
Nederhof, A. J. (1989), Self-involvement, intention certainty and attitude-intention
consistency. British Journal of Social Psychology 28, 123-133.
282
Nelson, R. R. and Hall, M. (1991), Educational needs as perceived by IS and end-user
personnel: A survey of knowledge and skill requirements. MIS Quarterly 15 (4), 503
525.
Ng Tye, E. M. W., Poon, R. S. K. and Bum, J. M. (1995), Information systems skills:
achieving alignment between the curriculum and the needs of the needs of the IS
professionals in the future. Data Base Advances 26 (4), 47-61.
Ngin, P., Simms, L. M. and Erbin-Roesemann, M. (1993), Work excitement among
computer users in nursing. Computers in Nursing 11 (3), 127-133.
Nickerson, R. S. (1981), Why interactive computer systems are sometimes not used by
people who might benefit from them. International Journal of Man-Machine Studies 15,
469-483.
Nieswiadomy, R. M. (1987), Foundations of Nursing Research. Appleton, and Lange,
U .S.A.
Nisenbaum, P. (1994), Building flexible user interfaces: Design must conform to user
goals. Information System Management 11 (1), 62-67.
Norbeck, J. S. (1985), What constitutes a publishable report of instmment development?
Nursing Research 34 (6), 380-382.
Nord, G. D. and Nord, J. H. (1994), Perception and attitudes of end-user on technology
issues. Journal of System Management 12-15.
Nunnally, J. C. (1967), Psychometric Theory. McGraw-Hill Book Company, New
York.
Nunnally, J. C. (1978), Psychometric Theory. Second Edition, McGraw-Hill Book
Company, New York.
Oakeshott, M. (1966), Experience and It's Modes. Cambridge University Press, U.S.A.
283

Olaniran, B. A. (1996), A model of group satisfaction in computer-mediated
communication and face-to-face meetings. Behaviour and Information Technology. 15
(1), 24-36.
Omar, M. H. (1991), Impact of the MIS course on Business students' attitudes to
computers and on their understanding of information systems concepts. The Journal of
Computer Information Systems 32 (1), 36-39.
Oppenheim, A. N. (1982), Questionnaire Design and Attitude Measurement. Heinemann
Educational Books Ltd, London.
Oxford Advanced Learner's Dictionary, (1992), Oxford University Press.
Pare, G. and Elam, J. J. (1995), Discretionary use of personal computers by knowledge
workers: testing of a social psychology theoretical model. Behaviour and Information
Technology 14 (4), 215-228.
Parry Bush, A. M. (1993), Computer-Based training approach of choice. Computers in
Nursing 11 (4), 163-164.
Patrikas, E. O. (1995), Computer literacy among students entering the health information
management programs. Journal of AHIMA. 66 (1), 29-33.
Peele, S. (1983), The Science of Experience: A Direction for Psychology. Lexington
Books, Toronto.
Pellman, T. G. (1991), Accounting and Computers: The prefect union. National Public
Accountant 36 (5), 16-20.
Perry, W. E. (1987), The Information Centre. Englewood cliffs, N. J: Prentice-Hall,
U.S.A.
Peter, L. J. (1972), The Peter Prescription: How to Be Creative, Confident, &
Competent. Bantam Book, U.S.A.
284
Pett, K. and Scott, T. (1994), Information management: A board issue?. Health Service
Management 90 (6), 18-20.
Plutchik, R. (1970), Emotions, evaluation, and adaptive process, in M. B. Arnold,
Feelings and Emotions. Academic Press, New York, PP. 3-24.
Polit, D. F. and Hungler, B. P. (1991), Nursing Research Principles and Methods.
Fourth Edition. J. B. Lippincott Company, Philadelphia.
Polit, D. F. and Hungler, B. P. (1995), Nursing Research Principles and Methods. Fifth
Edition. J. B. Lippincott Company, Philadelphia.
Prescott, P. A. and Soeken, K. (1989), The potential uses of pilot study. Nursing
Research 38 (1), 60-62.
Pribram, K. H. (1970), Feelings as monitors, in M. B. Arnold, Feelings and Emotions.
Academic Press, New York, PP. 41-53.
Princeton, U, N. J. U. S. (1991), Gender, experience and attribution to the computer.
Journal of Educational Computing Research 7 (1), 51-60.
Pulliam, L. (1992), A microcomputer-based information management for a nurse-
managed clinic. Computer Nursing 10 (3), 121-9.
Rakich, J. S., Longest, B. B. and Darr, K. (1985), Managing Health Services
Organisations Second edition, W. B. Saunders, Company, Philadelphia.
Rakich, J. S., Longest, B. B. and Darr, K. (1992), Managing Health Services
Organisations Third edition, Health Profession Press. Inc, Baltimore.
Ramsay, J., Popp, H. J., Thull, B., and Rau, G. (1997), The evaluation of an
information system for intensive care. Behaviour and Information Technology 16 (1),
17-24.
285
Rapko, H. and Adaskin, E. (1993), Computerised hospitals: An attractive or deterrent to
recruitment in nursing? Canadian Journal of Nursing Administration 6 (2), 19-21.
Ray, N. M. and Minch, R. P. (1990), Computer anxiety and alienation: Toward a
definitive and parsimonious measure. Human Factors 32 (4), 477-491.
Reece, M. J. and Gable, R. K. (1982), The development and validation of a measure of
general attitudes toward computers. Educational and Psychological Measurement 42,
913-916.
Regan, D. T. and Fazio, R. (1977), On the consistency between attitudes and behaviour:
Look to the method of attitude formation. Journal of Experimental Social Psychology 13
(1), 28-45.
Reichenbach, H. (1976), Experience and Prediction: An Analysis of the Foundations and
the Structure of Knowledge. The University of Chicago Press, Chicago.
Remenyi, D. and Money, A. (1991), A user-satisfaction approach to IS effectiveness
measurement. Journal of Information Technology 6(3/4), 162-175.
Richards, M. Pelley, L. (1994), The ten most valuable components of an information
systems education. Information and Management 27 (1), 59- 68.
Rivard, S. and Huff, S. (1988), Factors of success for end-user computing.
Communication of the ACM 31 (5), 552-561.
Robbins, K. A. (1993), The benefits of downswing. Global Trade and Transportation
11 (6), 28-29.
Roberts, C. (1985), The Interview Game: and How It's Play. Published by BBC
Books. London.
Robertson, S. I., Calder, J., Fung, P., Jones, A. and O'Shea, T. (1995), Computer
attitudes in an English secondary school. Computers Education 24 (2), 73-81.
286

Robey, D. (1979), Use attitudes and management information system use. Academy of
Management Journal 22 (3), 527-538.
Robey, D. and Azevedo, A. (1994), Cultural analysis of the organisational consequences
of information technology. Accounting Management and Information Technology 4(1),
23-37.
Robinson-Staveley, K. and Cooper, J. (1990), Mere presence, gender and reactions to
computers: Studying human computer: computer interaction in the social context. Journal
of Experimental Social Psychology 26 (2), 168-183.
Rockart, J. F., and Flannery, L. S. (1983), The management of end-user computing.
Communications of the ACM 12 (10), 776-784.
Rokeach, M. (1970), Beliefs. Attitudes and Values: A Theory of Organisation and
Change Jossey-Bass Inc, Publishers, San Francisco.
Rossi, P. H., Wright, J, D., and Anderson, A. B. (1983), Handbook of Survey
Research. Academic Press, Inc, London.
Rue, L. W. and Byars, L. L. (1980), Management Theory and Application. Richard D.
Irwin, Inc U.S.A.
Rupnik-Miklic, E. and Zupancic, J. (1995), Experiences and expectations with CASE
technology-an example from Slovenia. Information and Management 28 (6), 377-391.
Ryker, R. and Nath, R. (1995), An empirical examination of the impact of computer
information systems on users. Information and Management 29 (4), 207-214.
Saarinen, T. and Saaksjarvi, M. (1992), Process and product success in information
systems development. Journal of Strategic Information Systems 1 (5), 266-277.
Safford, R. R., Olson, E. D., Fisher, J. A., Baker, M. K. (1989), Handheld computers
do the job for logging and bucking operations. Industrial Engineering 21 (12), 25-29.
287
Saleem, N. (1996), An empirical test of the contingency approach to user participation in
information systems development. Journal of Management Information Systems 13(1),
145-166.
Sancho, J. J., Gonzalez, J. C., Patak, A., Sanz, F. and Sitges-Serrat, A. (1993),
Introducing medical students to medical informatics. Medical Education 27 (6), 479-483.
Sanders, D. H. (1970), Computers and Management. McGraw-Hill Book Company,
New York.
Santhanam, R. and Sein, M. K. (1994), Improving end-user proficiency: Effects of
conceptual training and nature of interaction. Information Systems Research 5 (4), 78
399.
Sapsford, R. and Abbott, P. (1992), Research Methods For Nurses and The Caring
Professions. Open University press, Philadelphia.
Saris, W. E., dePijper, W. M., and Zegwaart, P. (1979). Detection of specification
errors on liner structural equation models, in K. F. Schuessler (ed), Sociology Metrology
Jossey-Bass, San Francisco PP. 151-171.
Sayeed, L. and Brightman, H. J. (1994), Can information technology improve
managerial problem finding? Information and Management 27 (6), 377-390.
Scarpa, R., Smeltzer, S. C. and Jasion, B. (1992), Attitudes of nurse toward
computerisation: A replication. Computer in Nursing 10 (2), 72- 80.
Schewe, C. D. (1976), The management information user: An exploratory behavioural
analysis. Academy of Management Journal 19 (4), 577-590.
Schiffman, S. J. and Meile, L. C. and Igbaria, M. (1992), An examination of end-user
types. Information and Management 22 (4), 207-215.
288

Schifter, D. E. and Ajzen, I. (1985), Intention, Perceived control, and weight loss: An
application of the theory of planned behaviour. Journal of Personality and Social
Psychology 49 (3), 843-851.
Schumacker, R. E. and Lomax, R. G. (1996), A Beginner's Guide To Structural
Equation Modelling. Lawrence Erlbaum Associates, Publishers, New Jersey.
Segars, A. H., Grover, V. and Kettinger, W. J. (1994), Strategic users of IT. Journal of
Strategic Information Systems 3 (4), 261-283.
Senn, J. A. (1990), Information System in Management. Fourth Edition, Wadsworth
Publishing Co, California.
Sethi, V., Hwang, K. T. and Pegels, C. (1993), Information technology and
organisational performance. Information and Management 25 (4), 193-205.
Shashaani, L. (1993), Gender-based differences in attitudes toward computers.
Computers Education 20(2), 169-181.
Shashaani, L. (1994), Gender-differences in computer experience and its influence on
computer attitudes. Journal of Educational Computing Research 11 (4), 347-367.
Shaw, M. E. and Wright, J. M. (1967), Scales for the Measurement of Attitudes.
McGraw-Hill Book Company, New York.
Sheingold, k., Martin, L. M. W. and Endreweit, M. E. (1987), Preparing urban teachers
for the technological future, in R. D. Pea and K. Sheingold (eds), Mirrors of Minds:
Patterns of Experience in Educational Computing, Ablex Publishing Corporation, U. S.
A. PP. 67-85.
Sheppard, B. H., Hartwick, J. and Warshaw. P. R. (1988), The Theory of Reasoned
Action: A meta-analysis of past research with recommendations for modifications and
future research. Journal of Consumer Research 15 (3), 325-343.
289

Shute, V. J. and Gawlick-Grendell, L. A. (1994), What does the computer contribute to
learning? Computers Education 23 (3). 177-186
Siguardsson, J. F. (1991), Computer experience, attitudes towards computers and
personality characteristics in psychology undergraduates. Personality and Individual
Differences 12 (6), 617-624.
Sindall, C. (1992), Health promotion and community health in Australia, in F. Baum and
D. Fry and I. Lennie (eds), Community Health Policy and Practice in Australia. PP.
277-295.
Sligo, F. (1995), Increasing staff education: Effects on the use of information sources.
Information and Management 28 (4), 243-250.
Smith, V. J. (1992), Monitor-based software application program meet the need for fast,
accurate information at the beside. Computers in Nursing 10 (2), 51-59.
Songer-Nocks, E. (1976), Situational factors affecting the weighting of predictor
components in the Fishbein Model. Journal of Experimental Social Psychology 12 (1),
56-69.
Sprin, S. and Benfer, D. W. (1982), Issues in Health Care Management. Aspen
Publication, U.S.A.
Srinivasan, A. (1985), Alternative measures of system effectiveness: Associations and
implications. MIS Quarterly 243-253.
Staggers, LTC. N. (1991), Human factors, the missing element in computer technology.
Computers in Nursing 9 (2), 47-49.
Steenkamp, J-B. E. M. and van Trijp, H. C. M. (1991), The use of LISREL in
validating marketing constructs. International Journal of Research in Marketing 8 (4),
283-299.
290

Stein, E. W. and Vandenbosch, B. (1996), Organisational learning during advanced
system development: Opportunities and obstacles. Journal of Management Information
Systems 13 (2), 115-136.
Steinaker, N. W. and Bell, M. R. (1979), The Experiential Taxonomy. Academic Press,
New York.
Stewart, D. M. and Shamdasani, P. M. (1990), Focus Groups: Theory and Practice.
SAGE Publications, International Professional Publishers, London.
Stohr, E. A. and Turner, J. A. (1986), End-user computing: Impact on education and
organisational development, in M. Jark (ed), Managers. Micros and Mainframes
Integrating System for End-users. John Weiley and Sons, New York, 269-283.
Streiner, D. L. and Norman, G. R. (1991), Health Measurement Scales. Oxford
University Press, Oxford.
Strength, D. E. and Keen-Payne, R. (1991), Computerised patient care documentation,
educational applications in the baccalaureate curriculum. Computers in Nursing 9(1),
22-26.
Swanson, E. B. (1974), Management information systems: Appreciation and
involvement. Management Science 21 (2), 178-188.
Swanson, E. B. (1982), Measuring user attitudes in MIS research: A review. OMEGA
10 (2), 157-165.
Szajna, B. (1993), Determine information system usage: Some issue and examples.
Information and Management 25 (3), 147-154.
Szajna, B. and Mackay, J. M. (1995), Predictors of Learning performance in a computer-
user training environment: A path-Analytic study. International Journal of Human-
Computer Interaction 7 (2), 167-185.
291

Tabachnick, B. G. and Fidell, L. S. (1989), Using Multivariate Statistics. Second
Edition, Harper Collins College Publishers, New York.
Tabachnick, B. G. and Fidell, L. S. (1996), Using Multivariate Statistics. Third Edition,
Harper Collins College Publishers, New York.
Tan, J. K. H. and Hanna, J. (1994), Integrating health care with information technology:
Knitting patient information though networking. Health Care Management Review 19
(2), 72-80.
Taylor, H. G. and Mounfield, L. C. (1994), Exploration of the relationship between
prior computing experience and gender on success in college computer science. Journal
of Educational Computing Research 11 (4), 291-306.
Taylor, S. and Todd, P. A. (1995a), Assessing IT usage: The role of prior experience.
MIS Quarterly 19 (4), 561-570.
Taylor, S. and Todd, P. A. (1995b), Understanding information technology usage: A test
of competing models. Information Systems Research 6 (2), 144-176.
Thompson, R. L., Higgins, C. A., and Howell, J. M. (1991), Personal computing:
Toward a conceptual model of utilisation. MIS Quarterly 15 (1), 125-143.
Thong, J. and Yap, C. (1995), CEO characteristics, organisational characteristics and
information technology adoption in small business. OMEGA 23 (4), 429-442.
Thornton, B. S., Newnam, P. and Locksley, G. (1993), Computer systems usage and
competitive profitability. Journal of Computer Information Systems 67- 72.
Tinsley, H. E. and Tinsley, D. J. (1987), Uses of factor analysis in counselling
psychological research. Journal of Counselling psychology 34 (4), 414-424.
Todman, J. and Dick, G. (1993), Primary children and teacher's attitudes to computers.
Computer Education 20 (2), 199-203.
292

Torkzadeh, G. and Angulo, I. E. (1992), The concept and correlates of computer
anxiety. Behaviour and Information Technology 11 (2), 99-108.
Torkzadeh, G. and Doll, W. J. (1991), Test-Retest reliability of the end-user computing
satisfaction instrument. Decision Sciences 26-37.
Torkzadeh, G. and Doll, W. J. (1994), The test-retest reliability of user involvement
instruments. Information and Management 26 (1), 21-31.
Torkzadeh, G. and Koufteros, X. (1993), Computer user training and attitudes: A study
of business undergraduates. Behaviour and Information Technology 12 (5), 284-292.
Triandis, H. C. (1971), Attitude and Attitude Change. John Wiley and Sons, Inc., New
York.
Triandis, H. C. (1977), Interpersonal Behaviour. Brooks/Cole Publishing Company
Monterey, California.
Triandis, H. C. (1980), Beliefs. Attitude and Values. University of Nebraska Press,
Lincoln, NE.
Umstot, D. D. (1984), Understanding Organisation Behaviour: Concepts and
Applications. St. Paul: Hest Pub Company, U.S.A.
Vandenbosch, B. and Higgins, C. A. (1995), Executive support systems and learning: A
model and empirical test. Journal of Management Information Systems 12 (2), 99-130.
Vargo, G. (1991), Computer assisted patient education in the ambulatory care setting.
Computers in Nursing 9 (5), 168-169.
Vasil, L., Hesketh, B. and Podd, J. (1987), Sex differences in computing behaviour
among secondary school pupils. New Zealand Journal of Educational Studies 22 (2),
201- 214.
293
Waldrop, H. (1987), Planners and their computers: Love at first byte? Successful
Meetings 36 (0, 42-45.
Waltz, C. F. and Bausell, R. B. (1983), Nursing Research: Design. Statistics and
Computer Analysis. Second edition, F. A. Davis Company, Philadelphia.
Wasserbauer, L. I. and Abrham, I. L. (1995), Research design purpose, major concepts,
and selection, in L. A. Talbot, Principles and Practice of Nursing Research. Mosbey-
Year Book, Inc, St. Louis, PP. 197-263.
Wastell, D. G. and Newman, M. (1996), Stress, control and computer system design: A
psychological field study. Behaviour and Information Technology 15 (3), 183-192.
Weaver, J. (1995), Patient education: An innovative computer approach. Nursing
Management 26 (7), 78-83.
Weihrich, H. and Koontz, H. (1993), Management: A Global Perspective. Tenth
edition, McGrow-Hill, Inc, New York.
Weil, M. M., Rosen, L. D. and Wuglter, S. E. (1990), The aetiology of computer
phobia, Computers in Human Behaviour 6, 361-379.
Westerman, S. J., Davies, D. R., Glendon, A. I., Stammers, R. B. and Matthews, G,
(1995), Age and cognitive ability as predictors of computerised information retrieval.
Behaviour and Information Technology 14 (5), 313-326.
Whitaker, K. (1994), Managing Software Maniacs: Finding. Managing and Rewarding a
Wining Development Team. John Wiley & Sons, Inc. New York.
Williams, S. W., Ogletrees, S. M., Woodburn, W. and Raffeld, P. (1993), Gender
roles, computer attitudes and dyadic computer interaction performance in college
students. Sex Roles 29 (7/8), 515-525.
294
Wilson, H. S. (1985), Research in Nursing. Addison-Wesley Publishing Company,
California.
Wilson, H. S. (1989), Research in Nursing. Second edition, Addison-Wesley
Publishing Company, California.
Woodworth, R. S. (1973), How emotions are identified and classified, in M, Reymert
(ed), Classics in Psychology. Amo Press, New York, PP. 222-227.
Yasin, M. M. and Quigley, J. V. (1995), The utility of information systems: View of
CEOs and information system executives. Information Management and Computer
Security 3 (2), 34-38.
Yaverbaum, G. J. (1988), Critical factors in the user environment: An experimental study
of users, organisations and tasks. MIS Quarterly 75-88.
Yaverbaum, G. J. and Nosek, J. (1992), Effects of in formation system education and
training on user satisfaction. Information and Management 22 (4), 217-225.
Yelland, N. (1995), Young children’s attitudes to computers and computing. Australian
Journal of Early Childhood 20 (2), 20- 25.
Zeffane, R. and Cheek, B. (1993), Profiles and correlates of computer usage: A study of
the Australian Telecommunications industry. Computers in Industry 22 (1), 53-69.
Zoltan, E. and Chapanis, A. (1982), What do professional persons think about
computers? behaviour and Information Technology 1, 55-68.
Zoltan-Ford, E. (1984), Professionals person's attitudes toward computer: Comparative
analysis and some suggestion. IEEE 536-539.
Zviran, M. (1992), Evaluating user satisfaction in a hospital environment: An exploratory
study. Health Care Management Review 17 (3), 51-62.
295

Appendices
Appendix 3.1
List of Studies that Used for Variables in the Research Model
The research model of the present study includes; users' age, gender, level of education,
organisational position, length of time organisational position, task characteristics, work
tenure, organisational tenure, user computer training, positive and negative subjective
computer experience, objective computer experience, general support, information centre
support and users' involvement, as external variables. Examples of variables in
information systems studies include; users' age (Schewe, 1976; Dambrot et al., 1985;
Massoud, 1991; Torkzadeh and Koufteros, 1993; Schiffman et al., 1992), gender
(Schiffman et al., 1992; Dyck and Smither, 1994; Grann, 1984; Zoltan-Ford, 1984),
Level of education (Schewe, 1976; Grann, 1984; Gamble, 1988; Scarpa et al., 1992;
Schiffman et al., 1992; Igbaria et al., 1995b), organisational position (Igbaria, 1990;
Nelson and Hall, 1991; Schiffman et al., 1992; Pare and Elam, 1995), work tenure
(Brodt and Stronge, 1986; Bongartz, 1988; Scarpa et al., 1992; Schiffman et al., 1992),
Organisational tenure (Schewe, 1976; Schiffman et al., 1992), computer training
(Schewe, 1976; Yaverbaum, 1988; Mawhinnery andLederer, 1990; Siguaardsson, 1991;
Schiffman et al., 1992; Igbaria, 1992; Richards and Pelley, 1994), com puter
experience (Igbaria and Chakrabarti, 1990; Scarpa et al., 1992; Igbaria, 1992; Leach
and Caputi, 1995), management support and information centre support
(Igbaria and Chakrabarti, 1990; Igbaria, 1992; Schiffman et al., 1992; Henery and Stone,
1995), users’ involvement (Schewe, 1976; Hawk, 1993; Hartwick and Barki 1994),
users' attitude toward using computer (Strong and Brodt, 1985; Igbaria and
Chakrabarti, 1990; Scarpa et al., 1992; Hebert, 1994; Jayasuriya, 1994), subjective
norm s (Nederhof, 1989; Koslowsky et al., 1990; Hebert, 1994; Taylor and Todd,
1995) and intention to use computers (Nederhof, 1989; Koslowsky et al., 1990;
Hartwick and Barki, 1994; Hebert, 1994; Taylor and Tood, 1995).

Appendix 5.1
Permission from the Illawarra Area Health Service for
Conducting Focus Group and Interview with Health Staff

P A G E . 0 0 1
lllawarra Area Health Service
Address all correspondence: Chief Executive Officer Private Mail Bag 3 Port Kembla N.S.W . 2505
Telephone: (042) 755 111
Ext__ 107
y o u h r e f jl;m w
14 May 1996 OUR REF
Farideh YaghmaieCfo Department of Public Health and Nutrition University of Wollongong NortbUelds Avenue WOLLONGONG 2522
Fax No. (042)213486
Dear Ms Yaghmaie
In reply to your letter of 17 April 1996 requesting permission to conduct research for your PhD “Factors affecting the use of information systems in hospitals in the fllawarra Area” I am pleased to inform you that permission has been granted for you to confer with Mr Michael Potts, Nurse Informatics Manager and to personnel from Community Health, as agreed by Dr Sue Kirby.
I note that approval has been granted by the Umversity/TAHS Ethics Committee.
I wish you well in your research.
Yours faithfully
TTNEKE ROBINSONDirector of Health Services Development
“working together fo r a healthier community”* * TOTAL P A G E . 0 0 1 * *

Appendix 5.2
Discussion Topics for Focus Group 1
• To get "dimension of computer experience" (15 minutes)
• Develop items for each dimension (15 minutes)
• Assess face validity (15 minutes)
• Refine items (Wording, sequence and format) (15 minutes)
Appendix 5.3 Discussion Topics for Focus Group 2
The purpose of the questions is to:
1 Identify dimension of computer experience (30 minutes)
2 Identity items for each dimension (30 minutes)
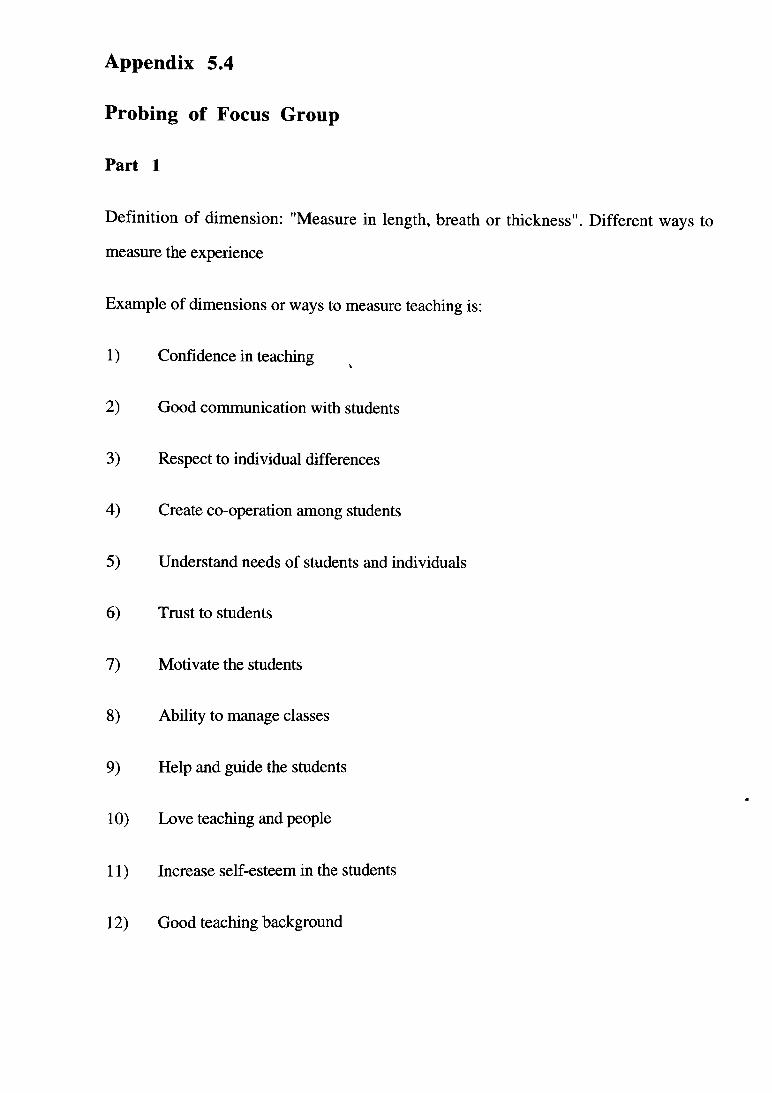
Appendix 5.4
Probing of Focus Group
Part 1
Definition of dimension: "Measure in length, breath or thickness". Different ways to
measure the experience
Example of dimensions or ways to measure teaching is:
1) Confidence in teaching
2) Good communication with students
3) Respect to individual differences
4) Create co-operation among students
5) Understand needs of students and individuals
6) Trust to students
7) Motivate the students
8) Ability to manage classes
9) Help and guide the students
10) Love teaching and people
11) Increase self-esteem in the students
12) Good teaching background

Part 2
What are the dimensions of computer experience?
Prompts:
• What is computer experience?
• How you can identify someone with computer experience from someone
who does not have it?
Probes:
• Did you ever think about different type of computer
experience?
• How you ever tried to measured experience?
• How do you do it?
Part 3
What is the items for each dimension?
Prompts:
• What questions or items should be asked to find the level
computer experience based on each dimension?

Appendix 5.5
Interview Schedule
1 Do you like using computers in your work?
2 From your experience, what are some advantages/ disadvantages of using
computers at work?
3 Have your experiences with computers and computer software been positive or
negative? Can you elaborate ? Can you give examples?
4- What do you do when things go wrong with computers? Who do you go to? How
do you feel when things go wrong?
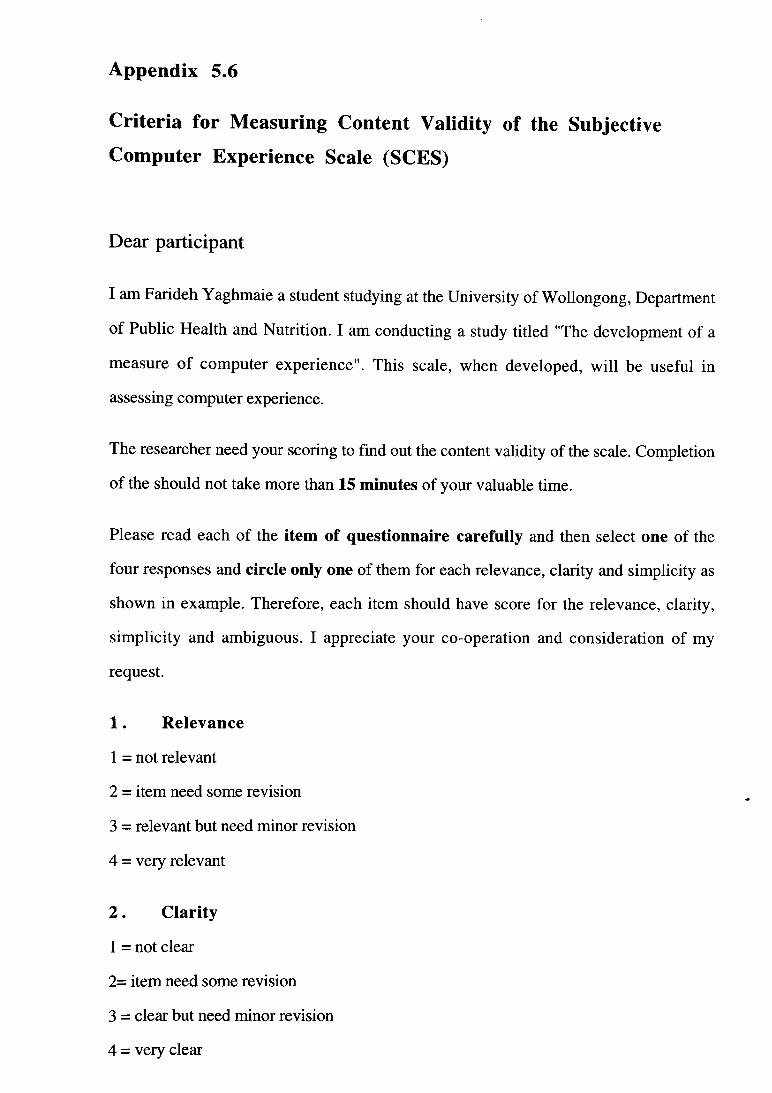
Appendix 5.6
Criteria for Measuring Content Validity of the Subjective
Computer Experience Scale (SCES)
Dear participant
I am Farideh Yaghmaie a student studying at the University of Wollongong, Department
of Public Health and Nutrition. I am conducting a study titled "The development of a
measure of computer experience". This scale, when developed, will be useful in
assessing computer experience.
The researcher need your scoring to find out the content validity of the scale. Completion
of the should not take more than 15 minutes of your valuable time.
Please read each of the item of questionnaire carefully and then select one of the
four responses and circle only one of them for each relevance, clarity and simplicity as
shown in example. Therefore, each item should have score for the relevance, clarity,
simplicity and ambiguous. I appreciate your co-operation and consideration of my
request.
1 . Relevance
1 = not relevant
2 = item need some revision
3 = relevant but need minor revision
4 = very relevant
2 . Clarity
1 = not clear
2= item need some revision
3 = clear but need minor revision
4 = very clear

3 . S im plicity
1 = not simple
2 = item need some revision
3 = simple but need minor revision
4 = very simple
4 . A m biguous
1 = doubtful
2 = item need some revision
3 = no doubt but need minor revision
4 = meaning is clear

Appendix 5.7
Permission from the Human Research Ethics Committee from
the University of Wollongong for Collecting Data from the
Students at the University of Wollongong
University of Wollongong Office of Research
University of Wollongong NSW 2522 Australia
Tel (042) 21 3386 Fax(042) 21 4338
In reply please quote: DC:KM HE96/44International +61+42
Further information: Karen McRae (Ext 4457)
12 A ugust 1996
Ms F arideh Y aghm aie C /- D r R ohan Jayasuriya D epartm en t of Public H ealth and N u tr itio n
Dear M s Y aghm aie,
T hank y o u for y o u r resp o n se to the C om m ittee 's req u irem en ts for y o u r H u m a n R esearch Ethics A pp lica tion H E 96/44 "The developm en t of a m easu re of com puter experience".
Your response m eets w ith the requ irem ents of the C om m ittee an d y ou r app lica tion is now form ally app roved .
Yours Sincerely,
C h a irp e rso nH u m an R esearch Ethics C om m ittee

Appendix 6.1
The Main Questionnaire for Nurses and Health workers

U N I V E R S I T Y O F W O L L O N G O N GGraduate School o f Health and Medical Sciences
Dear Participant:
I am Farideh Yaghmaie a student studying at the University of Wollongong,
Department of Public Health and Nutrition. I am conducting research on "Factors
Affecting the use of Computerised Information Systems by Health Workers”. The
study, when completed will be useful in assessing factors that can affect use of
computers in hospitals or health centres. This would help organisations provide
better computer service responsive to the needs of their staff. This study is
supervised by Dr Rohan Jayasuriya of the Department of Public Health and Nutrition.
Your answers to the questionnaire will be critical to the study. It is important that you
answer each question as thoughtfully and frankly as possible. Completion of the
questionnaire should not take more than 20 minutes of your valuable time.
Anonymity and confidentiality will be ensured for this part of the questionnaire as
this section will be separated from the main questionnaire before it is sent to me.
Your name is not required and you are free to withdraw consent and discontinue
participation at any time without penalty.
If you have any questions regarding this research, you may contact the Secretary of
the Ethics Committee at Wollongong University on (042) 214457. If you require any
further information, I am also available on Monday to Friday Ph: (042) 214274.
I appreciate your cooperation and consideration of my request and thank you very
much for your time.
Postal Address: Northfields Avenue, Wollongong NSW 2522 Australia Location: Northfields Avenue, Wollongong, New South Wales 2522 Australia
Telephone: (042) 21 3462/3463 Facsimile: (042) 21 34X6
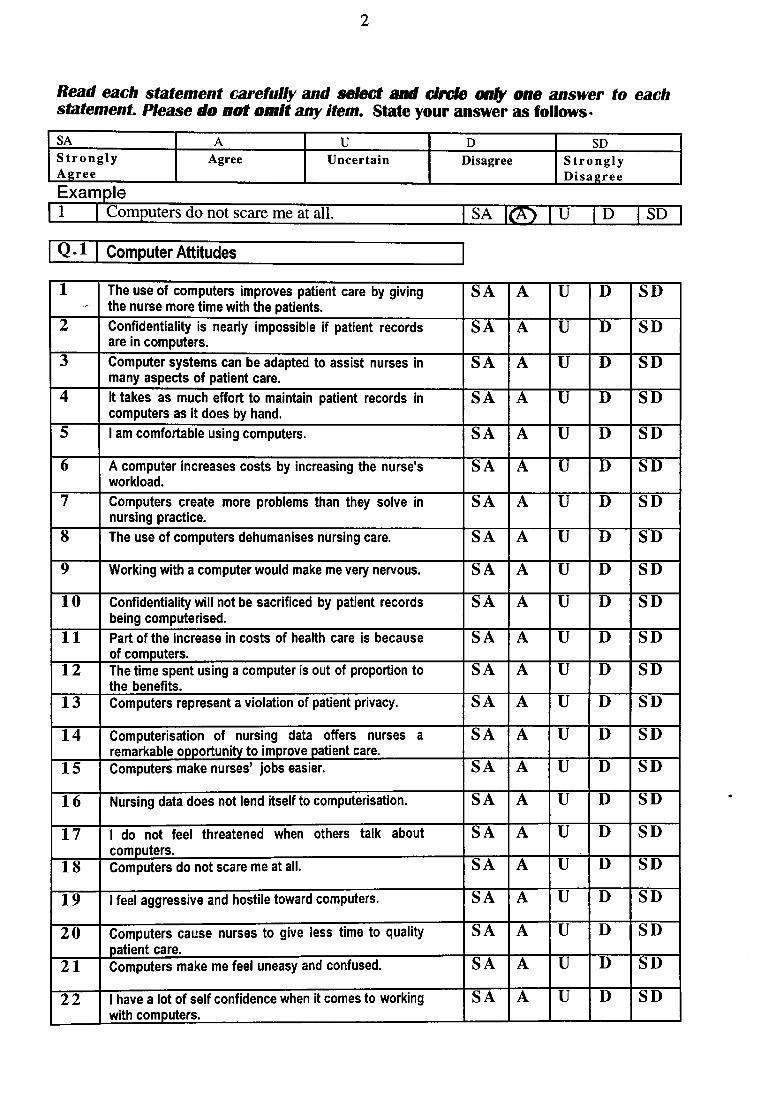
2
Read each statement carefully and select and circle only one answer to eachstatement Please do not omit any item. State your answer as follows*SA A U D SDS trong lyAgree
Agree Uncertain Disagree S trong lyD isagree
Example| 1 | Computers do not scare me at a ll SA | gT) | U | D | SD
Q.l Computer Attitudes
1 T h e use o f com p uters im p roves patient care b y giving the nurse m ore tim e with the patients.
SA A U D SD
2 Confidentiality is nearly im possible if patient records are in com puters.
SA A U D SD
3 C om p u ter s ys te m s can be adapted to assist nurses in m a n y aspects o f patient care.
SA A U D SD
4 It takes as m uch effort to maintain patient records in com puters as it does b y hand.
SA A U D SD
5 1 am com fortable using com puters. SA A U D SD
6 A com p uter increases c osts b y increasing the nurse's w orkload.
SA A U D SD
7 C om pu ters create m ore problem s than th ey so lve in nursing practice.
SA A U D SD
8 T h e use o f com puters dehum anises nursing care. SA A U D SD
9 W orking w ith a com puter w ould make me v e ry nervous. SA A U D SD
10 Confidentiality will not be sacrificed b y patient records being com puterised.
SA A U D SD
11 Part of the increase in costs of health care is because of com puters.
SA A U D SD
12 T h e tim e spent using a com puter is out of proportion to the benefits.
SA A U D SD
13 C om pu ters represent a violation of patient privacy. SA A U D SD
14 Com puterisation of nursing data offers nurses a rem arkable opp ortu nity to im prove patient care.
SA A U D SD
15 C om pu ters make n u rse s’ jo b s easier. SA A U D SD
16 N ursing data do e s not lend itself to computerisation. SA A U D SD
17 1 do not feel threatened when others talk about com puters.
SA A U D SD
18 C om pu ters do not scare me at all. SA A u D SD
19 1 feel a g g re ssive and hostile toward com puters. SA A u D SD
20 C om pu ters cause nurses to give less time to quality patient care.
SA A u D SD
21 C o m pu ters m ake me feel uneasy and confused. SA A u D SD
22 1 have a lot o f self confidence w hen it com es to working with com puters.
SA A u D SD
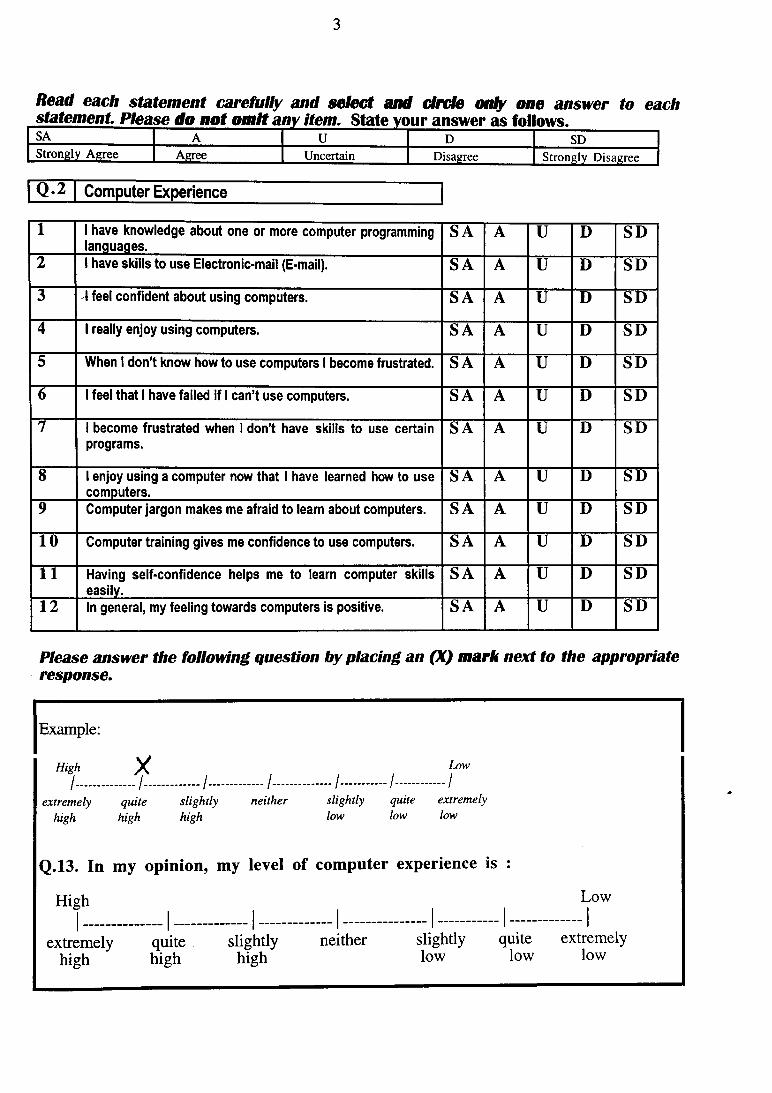
3
Read each statement carefully and select and circle only one answer to eachstatement Please do not omit any item. State your answer as follows.__________SA A U D SDStrongly Agree Agree Uncertain Disagree Strongly Disagree
Q -2 Computer Experience
1 1 have know ledge about one or m ore com puter programming languages.
SA A U D SD
2 1 have skills to use Electronic-m ail (E-mail). SA A U D SD
3 A feel confident about using com puters. SA A U D SD
4 1 really e n jo y using com puters. SA A U D SD
5 W hen 1 d o n ’t kn o w h o w to use com puters 1 becom e frustrated. SA A U D SD
6 1 feel that 1 have failed if 1 can’t use com puters. SA A U D SD
7 1 becom e frustrated w hen 1 d o n ’t have skills to use certain program s.
SA A U D SD
8 1 enjoy using a com puter now that 1 have learned how to use com puters.
SA A U D SD
9 C om puter ja rg o n m akes me afraid to learn about computers. SA A U D SD
1 0 C om puter training g ive s me confidence to use computers. SA A U D SD
1 1 H aving self-confidence helps me to learn com puter skills easily.
SA A U D SD
1 2 In general, m y feeling tow ards com puters is positive. SA A u D SD
Please answer the following question by placing an (X ) m ark next to the appropriate response.
Example:
T ........J ..............extremely quite slightly
high high high
......... /........neither
...... /..........slightlylow
Low- 1 ............/
quite extremely low low
Q.13. In my opinion, my level of computer experience is . • •
High !Low
extremely quite high high
slightlyhigh
neither slightlylow
quitelow
extremelylow

4
Read each statement carefully and select and circle only one answer to eachstatement Please do not omit any item. State your answer as follows_________SA A U D SDStrongly Agree Agree Uncertain Disagree Strongly Disagree
Q.3 | Management Support
1 M anagem ent understands the benefits to be achieved w ith the use o f com puters.
SA A U D SD
2 Th e re is a lw ays a person in the organisation to whom w e can turn fo r help in solvin g problem s with the com p uter system .
SA A U D SD
3 A central su p p ort (e.g. information centre) is available to help with problem s.
SA A U D SD
4 Training c o u rse s are readily available for us to im p rove o u rse lve s in the use of computers.
SA A U D SD
5 1 am alw ays supported and encouraged b y m y boss to use com puters in the perform ance of m y job.
SA A U D SD
6 M anagem ent has provided m ost of the n e c e s sa ry help and resources to achieve rapid familiarity with com puters.
SA A U D SD
7 W e are constan tly update on new software that can help us use the com puters m ore effectively.
SA A U D SD
$ O u r satisfied usage of com puters is of high interest to m anagem ent.
SA A U D SD
CM Subjective Nom7
1 My co-w orkers think that 1 should use com puters in m y job.
SA A U D SD
2 M y Nursing Unit M anager thinks that 1 should use com puters in m y job.
SA A U D SD
3 My Senior N urse Manager thinks that 1 should use com puters in m y job.
SA A U D SD
4 W ith respect to the Nursing Unit, 1 want to do what m y c o-w orkers think 1 should do.
SA A U D SD
5 W ith respect to the Nursing Unit, 1 want to do what m y Nursing Unit Manager thinks 1 should do.
SA A u D SD
6 W ith respect to the Nursing Unit, 1 want to do what m y S enior Nurse Manager thinks 1 should do.
SA A LI D SD
Q.5 Intend to Use Computers
1 If the decision w ere totally up to me, 1 would decide to start using com puters in the near future.
SA A U D SD
2 1 intend to use com puters frequently. SA A LJ D SD3 1 intend to be a h e a vy user of computers. SA A U D SDQ.6. When I am faced with a task of the sort that a computer is designed to support, I intend to use computers..._________________ % of the time ( give percentage, see below)[Indicate a number between 0 and 100 where:
0 = 1 don't intend to use computer a t all.100 = I intend to use computers each and every time that I am faced
with a task or decision o f the sort that computers is designed to support.]

5
Q. 7. Have you completed any computer course? [please tick correct box]
1. Yes [ZI
2. No □
If Y es, please answer the following questions if N o. please go to Q.9
Q-8 | Computer Training"
1 T h e num ber o f com puter course that 1 have completed w a s n e c e s s a ry.
SA A U D SD
2 ' T h e num ber o f hou rs on com puter course/courses that 1 h a ve com pleted w a s necessa ry.
SA A U D SD
3 T h e course/courses has increased m y com puter knowledge. SA A U D SD
4 T h e course/courses has increased m y com puter skills. SA A U D SD
5 In general, 1 am satisfied with the content of com puter course/courses.
SA A U D SD
Q.9. The purpose of the following questions is to measure your involvement or interest in computer based information systems itself.
Please answer the following question by placing an (X ) m ark next to the appropriate response.
Example:
1. Important____: X :____ :____ :____ :____ :_____ Unimportant
Indicate yo u r thoughts concerning computers.
I consider com puters to be:
1. Important : : : : : : Unimportant2. Not needed : : : : : : Needed3. Essential : : : : : : Nonessential
4. Trivial : : : : : : Fundamental
5. Significant : : : : : : Insignificant
6. Means nothing to me : : : : : : Means a lot to me
7. Of no concern to me : : : : : : Of concern to me
8. Irrelevant to me : : : : : : Relevant to me
9. Matters to me : : : : : : Doesn’t matter to me

6
Please answer these questions.
Q.10. Do you have experience with computers at school and high school, TAFE, University or work situations? (this includes any form of computer use such as, playing games, word processing? [Please tick box]
1. Yes □ 2. No □
If Yes, please go to Q. 11 if NO* please go to Q. 12
Q .l l . How long have you been using computers at school and high school, TAFE, University or work situations? (this includes any form of computer use such as, playing games, word processing,...). Please write the length of time in years for each item in the box where appropriate.
1. School and high school □ 2. College (TAFE) □
3. University □ 4. Work □
Q.12. Do you have a computer at home? [Please tick box]
1. Yes □ 2. No □
If Yes, please go to Q. 13 if please go to Q. 17
Q.13. How often do you use a computer at home?
Never □ Less than 3 hours per week □ More than 3 hours per week □
Q.14. Is the computer at home connected to a modem or network?
1. Yes □ 2. No □ 3. Do not know □
Q. 15. Does the computer at home have a CD-ROM player?
1. Yes 2. No □ 3. Do not know □
Q. 16. Does someone else in your home use the computer (computer use includes playing games, word processing, etc..)?
1. Yes □ 2. No □

7
Please answer these question about you Q. 17. Gender
1. Male I— I 2. Female I I
Q. 18. Duration of employment in nursing; [Please tick correct box]1. less than one year □2. 1-5 years □3. 6-10 years □4. 11-15 years □5. more than 15 years □
Q. 19.1 have been employed in this centre for; [Please tick correct b1. less than one year □2. 1-5 years □3. 6-10 years □4. 11-15 years □5. more than 15 years □
Y o u r c o n tr ib u t io n to th is s tu d y is g r a te f u l l y a p p r e c ia te d .

U N I V E R S I T Y O F W O L L O N G O N GG rad u a te S choo l o f H ealth and M ed ica l S c iences
Dear Participant:
I am Farideh Yaghmaie a student studying at the University of Wollongong,
Department of Public Health and Nutrition. I am conducting research on "Factors
Affecting the use of Computerised Information Systems by Health Workers”. The
study, when completed will be useful in assessing factors that can affect use of
computers in hospitals or health centres. This would help organisations provide
better computer service responsive to the needs of their staff. This study is
supervised by Dr Rohan Jayasuriya of the Department of Public Health and
Nutrition.
Your answers to the questionnaire will be critical to the study. It is important that you
answer each question as thoughtfully and frankly as possible. Completion of the
questionnaire should not take more than 20 minutes of your valuable time.
Anonymity and confidentiality will be ensured for this part of the questionnaire as
this section will be separated from the main questionnaire before it is sent to me.
Your name is not required and you are free to withdraw consent and discontinue
participation at any time without penalty.
If you have any questions regarding this research, you may contact the Secretary of
the Ethics Committee at Wollongong University on (042) 214457. If you require any
further information, I am also available on Monday to Friday Ph: (042) 214274.
I appreciate your cooperation and consideration of my request and thank you very
much for your time.
Postal Address: Northfields Avenue, Wollongong NSW 2522 Australia Location: Northfields Avenue, Wollongong, New South Wales 2522 Australia
Telephone: (042) 21 3462/3465 Facsimile: 21 54S6

2
Read each statement carefully and select and circle only one answer to eachstatement Please do not omit any item. State your answer as follows.
SA A U D SDS trong lyAgree
Agree Uncertain Disagree S tronglyDisagree
ExampleComputers do not scare me at all. SA | U | D | SD
Q . l Computer Attitudes
1 T h e use o f com puters im proves client care b y giving the health w orkers (clinicians) more time with the clients.
SA A U D SD
2 Confidentiality is nearly im possible if client records are in com puters.
SA A U D SD
3 C om puter s ys te m s can be adapted to assist health w o rk e rs (clinicians) in m any aspects of client care.
SA A U D SD
4 It takes as m uch effort to maintain client records in com puters as it does b y hand.
SA A u D SD
5 1 am com fortable using computers. SA A u D SD
6 A com puter increases costs b y increasing the health worker's (clinician’s) workload.
SA A u D SD
7 C om puters create more problem s than they solve in health practice.
SA A u D SD
S T h e use of com puters dehum anises health care. SA A u D SD
9 W orking with a com puter w ould make me ve ry nervous. SA A u D SD10 Confidentiality will not be sacrificed b y client records
being com puterised.SA A u D SD
11 Part of the increase in costs of health care is because of com puters.
SA A u D SD
12 T h e tim e spent using a com puter is out of proportion to the benefits.
SA A u D SD
13 C om puters represent a violation of client privacy. SA A u D SD14 Com puterisation of health data offers health workers
(clinicians) a remarkable opportunity to im prove client care.
SA A u D SD
15 C om puters make health w orkers’ (clinicians’) jobs easier.
SA A u D SD
16 Health data does not lend itself to computerisation. SA A u D SD
17 1 do not feel threatened when others talk about com puters.
SA A u 1) SD
18 C om puters do not scare me at all. S A A u D SD
19 1 feel a g gressive and hostile toward computers. S A A u D SD
20 C om puters cause health w orkers (clinicians) to g ive less tim e to quality client care.
S A A u D SD
21 C om pu ters make me feel uneasy and confused. S A A u D SD
22 1 have a lot o f self confidence when it com es to working with com puters.
S A A u 1) SD
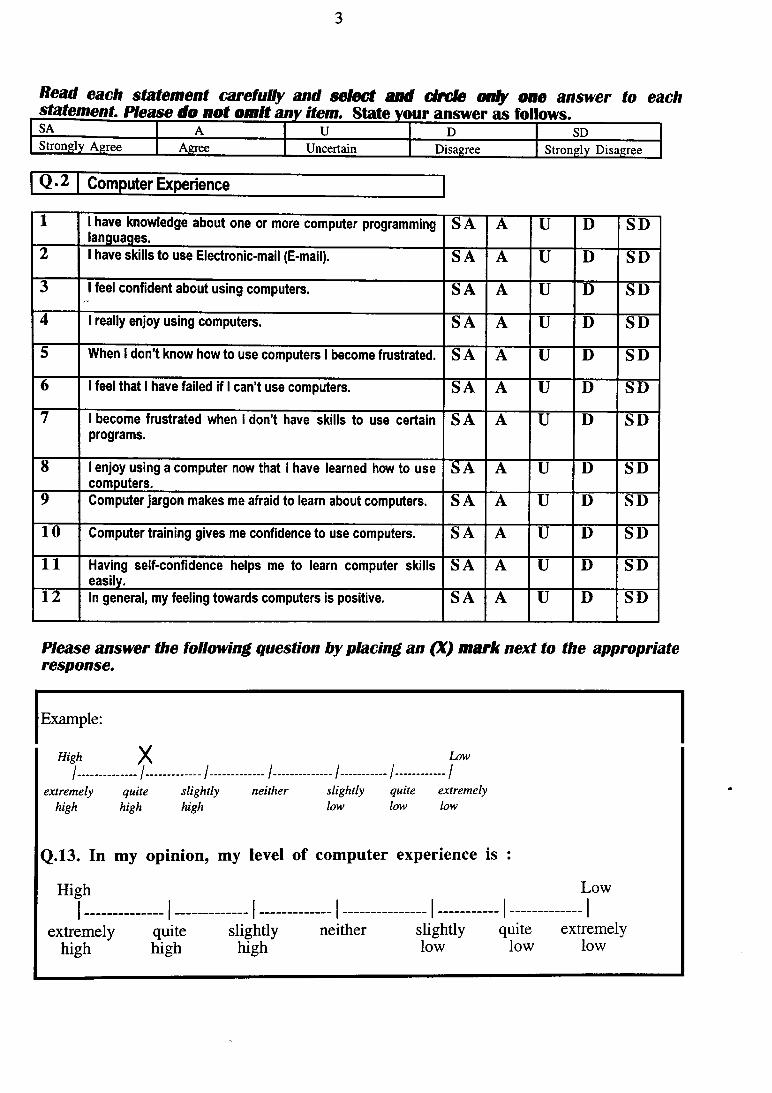
3
Read each statement carefully and select and circle only one answer to eachstatement. Please do not omit any item. State your answer as follows.__________SA A U D SDStrongly Agree Agree Uncertain Disagree Strongly Disagree
Q • 2 Computer Experience
1 1 have know ledge about one o r more com puter program m ing languages.
SA A U D SD
2 1 have skills to use Electronic-m ail (E-mail). SA A U D SD
3 1 feel confident about using com puters. SA A U D SD
4 1 really e n jo y using com puters. SA A U D SD
5 W hen 1 d o n ’t know h o w to use com puters 1 becom e frustrated. SA A u D SD
6 1 feel that 1 have failed if 1 can’t use computers. SA A u D SD
7 1 becom e frustrated w hen 1 don’t have skills to use certain program s.
SA A u D SD
8 1 e n jo y using a com puter now that 1 have learned how to use com puters.
SA A u D SD
9 C om puter jargon m akes me afraid to learn about com puters. SA A u D SD
1 0 C om puter training g ive s me confidence to use com puters. SA A u D SD
1 1 H aving self-confidence helps me to learn com puter skills easily.
SA A u D SD
1 2 In general, m y feeling tow ards com puters is positive. SA A u D SD
Please answer the following question by placing an (X ) m ark next to the appropriate response.
Example:
High X- 1 .........
Low1........ ....... j..... ........../ - - ......../...........— /....... ...../
extremely quite slightly neither slightly quite extremelyhigh high high low low low
Q.13. In my opinion, my level of computer experience is :
High . , , , 1Low
extremelyhigh
quitehigh
slightlyhigh
neither slightlylow
quitelow
extremelylow

4
Read each statement carefully and select and circle only one answer to eachstatement Please do not omit any item. State your answer as follows._________SA A U D SDStrongly Agree Agree Uncertain Disagree Strongly Disagree
Q«3 Management Support
1 M anagement understands the benefits to be achieved with the use of com puters.
S A A U D S D
2 Th e re is alw ays a person in the organisation to whom w e can turn for help in solving problems with the com puter system .
S A A U D S D
3 A central support (e.g. information centre) is available to help with problems.
S A A U D S D
4 Training courses are readily available for us to im p rove ou rselves in the use of computers.
S A A u D S D
5 1 am alw ays supported and encouraged by m y boss to use com puters in the performance of m y job.
S A A u D S D
6 Management has provided m ost of the n e c e ssa ry help and resources to achieve rapid familiarity with com puters.
S A A u D S D
7 W e are constantly update on new software that can help us use the com puters more effectively.
S A A u D S D
8 O u r satisfied usage of com puters is of high interest to m anagem ent.
S A A u D S D
Q-4 Subjective Norm
1 M y co-w orkers think that 1 should use computers in m y job.
S A A U D S D
2 M y Manager thinks that 1 should use computers in m y job.
S A A U D S D
3 My General Manager thinks that 1 should use com puters in m y job.
S A A U D S D
4 W ith respect to the Health Unit, 1 want to do what m y co-w orkers think 1 should do.
S A A U D S D
5 W ith respect to the Health Unit, 1 want to do what m y Manager thinks 1 should do.
S A A U D S D
6 W ith respect to the Health Unit, 1 want to do what m y General Manager thinks 1 should do.
S A A U D S D
Q-5 | Intend to Use Computers
1 If the decision were totally up to me, 1 would decide to start using computers in the near future.
S A A U D S D
2 1 intend to use computers frequently. S A A U D S D
3 1 intend to be a heavy user of computers. S A A U D S D
Q.6. When I am faced with a task of the sort that a computer is designed to support, I intend to use computers..._________________ % of the time ( give percentage, see below)
[Indicate a number between 0 and 100 where:0 = 1 don't intend to use computer a t alt.
100 = I intend to use computers each and every time that I am faced with a task or decision o f the sort that computers is designed to support.]

5
Q. 7. Have you completed any computer course? [please tick correct box]
1. Yes □
2. No □
If Yes, please answer the following questions if N o. please go to Q.9
Q -8 1 Computer TrainjncT
1 Th e number of com puter course that 1 have completed w as n e c e ssa ry.
SA A U D SD
2 Th e num ber of hours on com puter course/courses that 1 ha ve com pleted w as necessary.
SA A U D SD
3 Th e course/courses has increased m y computer knowledge. SA A u D SD
4 Th e course/courses has increased m y computer skills. SA A u D SD
5 In general, 1 am satisfied with the content of com puter course/courses.
SA A u D SD
Q.9. The purpose of the following questions is to measure your involvement or interest in computer based information systems itself.
Please answer the following question by placing an (X) mark next to the appropriate response.
Example:
1. Important___:_X_:____:____:____:____:_____Unimportant
Indicate your thoughts concerning computers.
I consider computers to be:
1. Important : : : : : : Unimportant2. Not needed : : : : : : Needed3. Essential : : : : : : Nonessential4. Trivial : : : : : : Fundamental5. Significant : : : : : : Insiqnificant6. Means nothing to me : : : : : : Means a lot to me
7. Of no concern to me : : : : : : Of concern to me
8. Irrelevant to me : : : : : : Relevant to me9. Matters to me : : : : : : Doesn’t matter to me
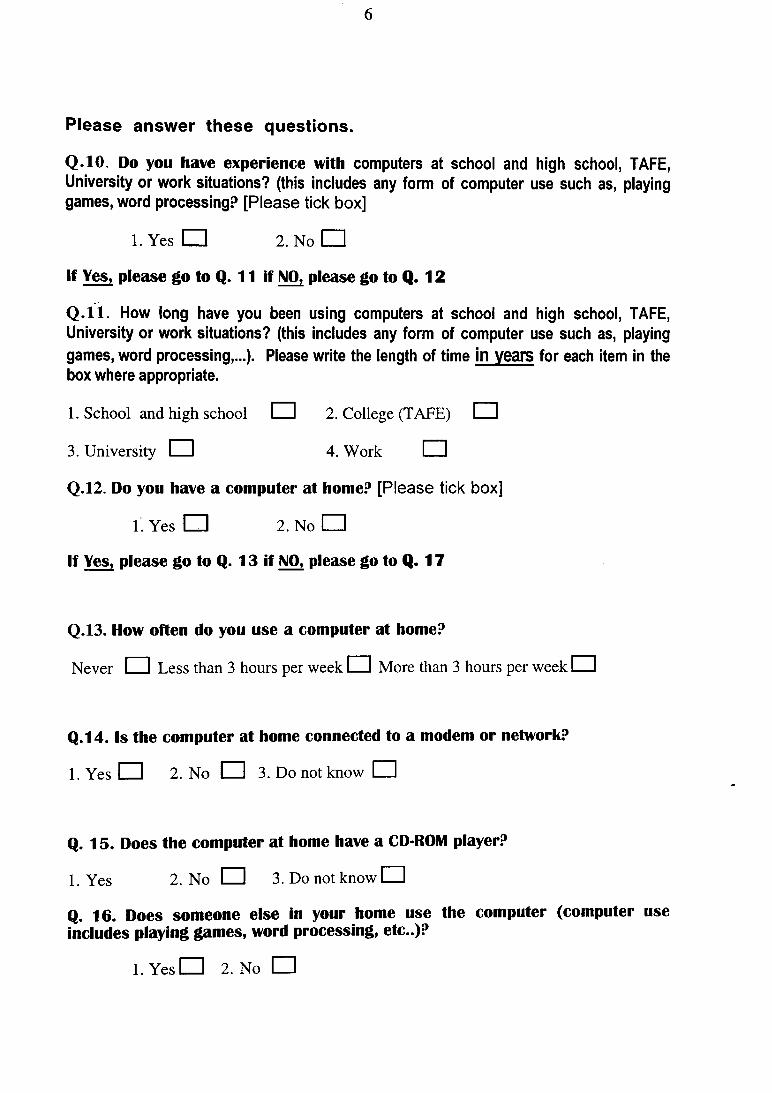
6
Please answer these questions.
Q.10. Do you have experience with computers at school and high school, TAFE, University or work situations? (this includes any form of computer use such as, playing games, word processing? [Please tick box]
1. Yes □ 2. No □
If Yes, please go to Q. 11 if NO* please go to Q. 12
Q .l l . How long have you been using computers at school and high school, TAFE, University or work situations? (this includes any form of computer use such as, playing games, word processing,...). Please write the length of time in years for each item in the box where appropriate.
1. School and high school IZZI 2. College (TAFE) □3. University □ 4. Work □
Q.12 Do you have a computer at home? [Please tick box]
1. Yes □ 2. No □
If Yes, please go to Q. 13 if NO* please go to Q. 17
Q.13. How often do you use a computer at home?
Never □ Less than 3 hours per week □ More than 3 hours per week □
Q.14. Is the computer at home connected to a modem or network?
1. Yes □ 2. No □ 3. Do not know □
Q. 15. Does the computer at home have a CD-ROM player?
1. Yes 2. No □ 3. Do not know □
Q. 16. Does someone else in your home use the computer (computer use includes playing games, word processing, etc..)?
1. Y e s D 2. No □

7
Please answer these question about you Q. 17. Gender
1. Male I— I 2. Female CZU
Q. 18. Duration of employment in health service: [Please tick correct box]1. less than one year □ □2. 1-5 years 1 13. 6-10 years I I4. 11-15 years I I5. more than 15 years I I
Q. 1 9 . 1 have been employed in this centre for [Please tick correct box]1. less than one year □2. 1-5 years □3. 6-10 years □4. 11-15 years n5. more than 15 years □
Y o u r c o n tr ib u t io n to th is s tu d y is g r a t e f u l l ya p p r e c ia t e d .
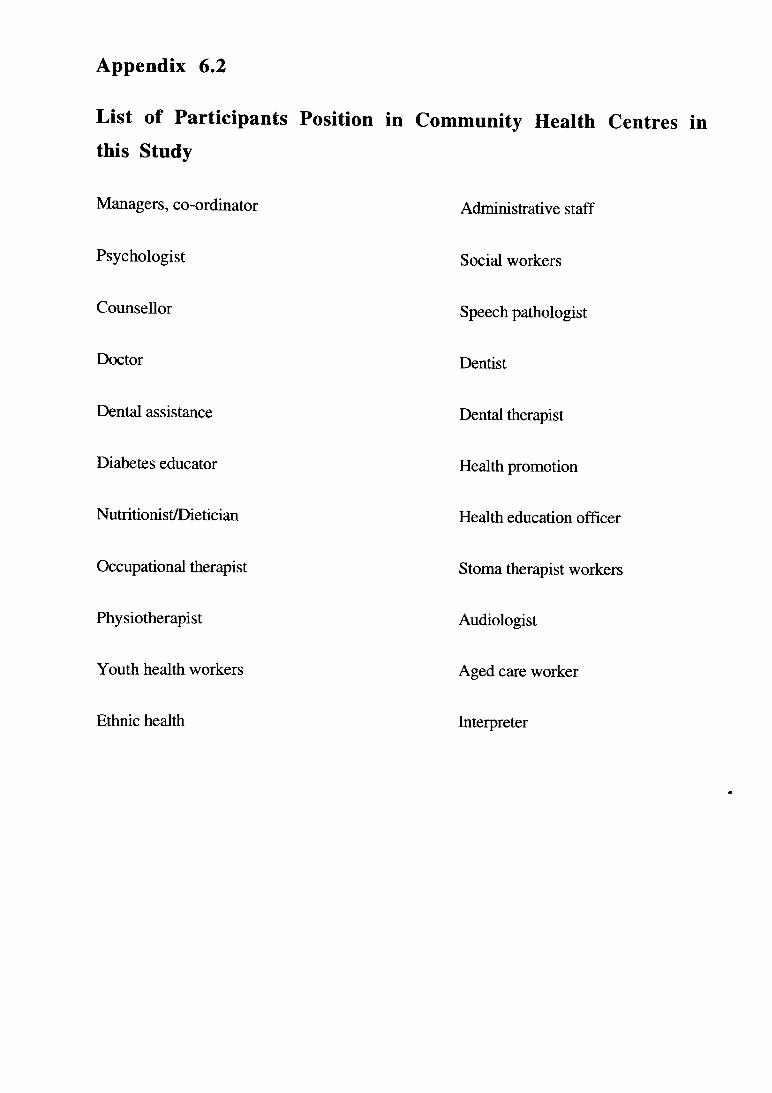
Appendix 6.2
List of Participants Position in Community Health Centresthis Study
Managers, co-ordinator Administrative staff
Psychologist Social workers
Counsellor Speech pathologist
Doctor Dentist
Dental assistance Dental therapist
Diabetes educator Health promotion
Nutritionist/Dietician Health education officer
Occupational therapist Stoma therapist workers
Physiotherapist Audiologist
Youth health workers Aged care worker
Ethnic health Interpreter

Appendix 6.3
Site Champion Instruction Sheet

Site Champion Instruction Sheet.
Dear Site Champion.
The results of this study depends on your help and cooperation and your contribution to thesuccess of this survey is appreciated greatly. Please consider the following points.
• Each questionnaire contains two parts, computer training and computer usage.• The colour of the questionnaire for nurses is Blue ( training part) and Yellow ( usage
part). The colour for other staff is Blue ( training part) and Green ( usage part). If you do not have enough of one colour for all the staff please call Kim Moran on 751999 and she will sent more out to you. Please do not use the wrong colour if you run out.
• The questionnaire should be completed by every staff member. ( nurse, health worker or admin.)
• Firstly the participants should complete the consent form, then this sheet must be separated from the questionnaire.
• The consent forms should be collected be each Site Champion in each community health centre and must be returned with the questionaries.
• the participants should be requested to complete all the questions of the questionnaire.• After completing the questionnaire the participants should return the questionnaire to the
Site Champion in each Community Health Centre.• The Site Champions are responsible for checking that the questionnaires have been
completed.
• All questionnaires must be returned to Kim Moran at Health Promotion by the 19th December 1996. This time frame is very important.
• Site Champions in each community Health Centre should complete this table for requested numbers.
Number of blank questionnaires that you received
Number of completed questionaries that you received
Number of nurses in your centre
Number of other staff in your centre.

Appendix. 6.4 Consent Form of the Main Questionnaire

Factors Affecting The Use of Computerised Information SystemsIn Health Services
I agree to participate in the study and I have received a copy of this consent form with a questionnaire. I have been assured of it's confidentiality and anonymity, and my identity will not be disclosed when the research is being carried out or when it is published. My consent to participate is voluntary so I am allowed to withdraw from the study at any time.This study is supervised by Dr Rohan Jayasuriya of the Department of Public Health and Nutrition. If participants have any questions regarding this study they can contact the secretary of the University of Wollongong Human Research Ethics Committee on (042)214457.
Participant's Signature Date
This page should be separated from the questionnaire.

Appendix 6.5
Permission of the Human Research Ethics Committee at the
University of Wollongong for Conducting Field Study

University of Wollongong
In reply please quote: DC:KM H E 96/207 Further information: Karen McRae (Ext 4457)
20 N ovem ber 1996
Ms Farideh Yaghm aieD epartm en t of Public H ealth & N utritionU niversity of W ollongong
D ear Ms Yaghm aie,
T hank you for your response and am endm ents to the C om m ittee 's requirem ents for your H u m a n R esearch Ethics A pplication H E 96/207 "Factors affecting the use of com puterised in form ation system s in health services".
Your response and am endm ents m eet w ith the requ irem ents of the Com m ittee and your application is now form ally approved.
H um an R esearch Ethics C om m ittee
cc: Supervisor: Dr R ohan Jayasuriya
Office of Research
University of Wollongong NSW 2522 Australia
Tel (042) 21 3386 Fax (042) 21 4338
International +61+42

Appendix 6.6
Perm ission of the Illawarra Area Health Service for
Conducting Field Study

Illaw arra Area Health Service
Community Health Service Telephone w y
YOUR REF:
OUR REF:Memo To: All Staff
Subject: Community Health Information Development Project NSW Health. Staff Survey.
From: Sue KirbyGeneral Manager Community Health.
Date: 25/11/96
As you are all aware the Office Productivity Technology (OPT) roll out is scheduled for early next year. We are responsible for the needs analysis of training and the implementation of training subsequently. It is therefore essential to obtain information on all staff regarding their current skills and training needs for the project to be successful. It is very important that all staff complete the questionnaire attached.
This will allow us to :1. Identity computer training needs and develop a training plan.2. Information can be used as a base line for evaluation at the end of the training.
Your Site Champion will distribute and collect the questionaries. Please give this your urgent attention to enable the questionaries to be collected on the due date given below.
We have been fortunate to have the Department of Public Health & Nutrition of the University of Wollongong help us in developing the needs analysis. They have undertaken to analyse the data for us and assist us in developing the tender for the computer training. In return, we have agreed to allow a student from the University to distribute her research questionnaire in the same package. A letter explaining the research and the assurance of confidentiality is attached. I would encourage you to support this research, which will provide some additional information of value on computer experience and use.
Sue Kirby
Site:________________________
Date Questionnaire Given: _____________________________
Due date:_____________________________
Name of person questionnaire is to be returned to:
Designation:______ ___________________
Centre: ________ ___________________
“working together for a healthier community”
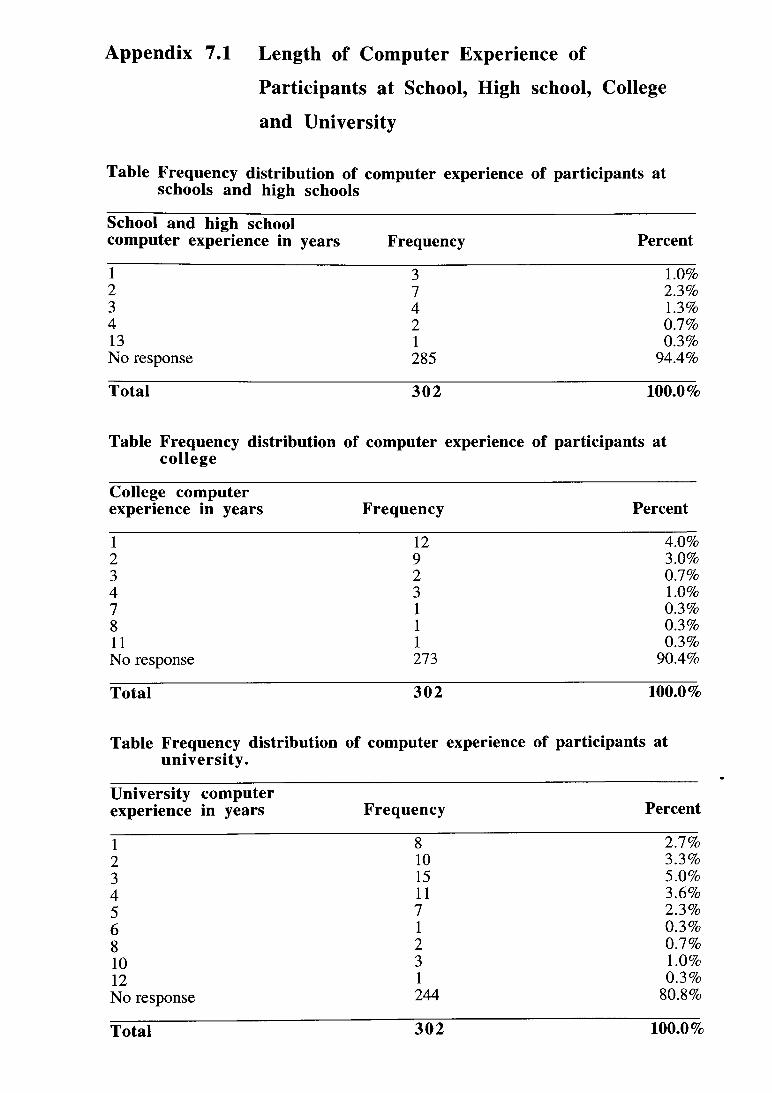
Appendix 7.1 Length of Computer Experience of
Participants at School, High school, College
and University
Table Frequency distribution of computer experience of participants at schools and high schools
School and high school computer experience in years Frequency Percent
1 3 1.0%2 7 2.3%3 4 1.3%4 2 0.7%13 1 0.3%No response 285 94.4%
Total 3 0 2 1 0 0 . 0 %
Table Frequency distribution of computer experience of participants at college
College computer experience in years Frequency Percent
1 12 4.0%2 9 3.0%3 2 0.7%4 3 1.0%7 1 0.3%8 1 0.3%11 1 0.3%No response 273 90.4%
Total 3 0 2 1 0 0 . 0 %
Table Frequency distribution of computer experience of participants at university.
University computer experience in years Frequency Percent
1 8 2.7%2 10 3.3%3 15 5.0%4 11 3.6%5 7 2.3%6 1 0.3%8 2 0.7%10 3 1.0%12 1 0.3%No response 244 80.8%
Total 3 0 2 1 0 0 . 0 %

D.B. AITCH1SON BOOKBINDER
1 2 2 WINDANG RD PR1MBEE 2 5 0 2 P H .4 2 7 4 2 2 2 9