Factors affecting detection and referral of malnourished ...
Upload
independentCategory
view
0download
0
Lactobacillus casei addition to a repletion diet-induced early normalisation ofcytokine profils during a pneumococcal infection in malnourished mice
Susana Salvaa, Julio Villenaa,b, Silvia Racedob, Susana Alvareza,b andGraciela Agueroa*
aFacultad de Bioquımica, Quımica y Farmacia. Universidad Nacional de Tucuman, Balcarce, SanMiguel de Tucuman, Tucuman, Argentina; bCentro de Referencia para Lactobacilos(CERELA-CONICET), San Miguel de Tucuman, Tucuman, Argentina
(Received 5 March 2008; final version received 3 June 2008)
This work studied the influence of Lactobacillus casei on cytokine production duringrepletion of malnourished mice in the face of an infectious challenge. In addition, thenumber and function of cells involved in the immune response against a respiratoryinfection was evaluated. Weaned mice were malnourished after consuming a protein-freediet (PFD) for 21 days. Malnourished mice were fed a balanced conventional diet (BCD)for 7 days or BCD for 7 days with L. casei supplementation on day 6 and day 7 (BCD�Lc). The malnourished control group (MNC) received PFD while the well-nourishedcontrol (WNC) mice consumed BCD. Mice were challenged intranasally withStreptococcus pneumoniae at the end of each dietary treatment. Malnutrition impairedthe levels of serum tumour necrosis factor (TNF)-a and interleukin (IL)-1b, IL-4, IL-6and IL-10. In addition, neutrophil number and activity, lymphocyte maturation andbone marrow CD4�, CD8� and CD19� cells number, were also impaired in the MNCgroup. Repletion with BCD induced a slight improvement in some of the parametersstudied. However, when L. casei was added to the BCD, a normalisation of TNF-a, IL-1b and IL-6 values after infection and an increase in the levels of IL-10 and IL-4compared to the WNC group was observed. Moreover, BCD�Lc induced a significantimprovement in blood and bone marrow cells. Consequently, the use of L. casei as asupplement in a repletion diet was associated with a pattern of inflammatory and anti-inflammatory cytokines that led to an increased number and functionality of the cellsthat participate in the immune response against a pneumococcal infection.
Keywords: Lactobacillus casei; malnourished mice; cytokine; Streptococcus pneumoniae
Introduction
The development of a normal immune system is impaired by undernutrition in critical
periods of gestation and neonatal maturation and during weaning (Keusch, 2003;
McDade, Beck, Kuzawa, & Adair, 2001). Several investigations have demonstrated the
influence of nutrition in the production of proinflammatory (Abo-Shousha, Hussein,
Rashwan, & Salama, 2005; Hillyer, Maliwichi, & Woodward, 2007) and anti-inflammatory
cytokines (Hillyer et al., 2006), and it has been described that malnutrition reduces the
capacity of mononuclear phagocytes to release the cytokines that mediate the acute phase
response (Woodward, 2001). In addition, protein malnutrition affects organs with high cell
proliferation such as blood-forming tissues, which leads to an impairment of myelopoiesis
*Corresponding author. Email: [email protected]
Food and Agricultural Immunology
Vol. 19, No. 3, September 2008, 195�211
ISSN 0954-0105 print/ISSN 1465-3443 online
# 2008 Taylor & Francis
DOI: 10.1080/09540100802247243
http://www.informaworld.com
and lymphopoiesis and to a decrease in phagocytosis and oxidative burst in leukocytes
(Chandra, 1991; Deo, Mathur, & Ramalingaswami, 1967). During infection, malnutrition
decreases inflammatory cell mobilisation from circulation into the tissues (Borelli,
Mariano, & Borojevic, 1995). Moreover, decreased numbers and functions of T and B
lymphocytes have been observed in malnourished hosts so that both the innate and the
adaptive immune responses are impaired (Chandra, 1991).
Lactic acid bacteria (LAB) have been reported to increase resistance to infections
(Erickson & Hubbard, 2000) and modulate cytokine production (McNaught, Woodcock,
Anderson, & MacFie, 2005; Vinderola, Matar, & Perdigon, 2005). Besides, LAB can
modify leukocyte counts and induce recovery of cell populations in mice undergoing
chemotherapy (Krusteva et al., 1997).
In previous works we demonstrated that the addition of Lactobacillus casei to a
repletion diet fed to malnourished mice exerted a beneficial effect on a Streptococcus
pneumoniae infection by accelerating the recovery of the defence mechanisms against the
pathogen (Villena et al., 2005). However, the mechanisms by which LAB exert their
immunomodulatory activity are not completely understood. In the present work we
studied the influence of L. casei on cytokine production during repletion of malnourished
mice, especially in the face of an infectious challenge. We studied whether the poor
response to S. pneumoniae infection in malnourished mice, which is significantly improved
by the repletion with L. casei, could be caused by the effect of the probiotic bacteria on the
blood concentration of proinflammatory and anti-inflammatory cytokines and the number
and activity of blood and bone marrow leukocytes.
Materials and methods
Microorganisms
Lactobacillus casei CRL 431 was obtained from the CERELA culture collection
(Chacabuco 145, San Miguel de Tucuman, Argentina). The culture was kept freeze-dried
and then rehydrated using the following medium: peptone 15.0 g, tryptone 10.0 g, meat
extract 5.0 g, distilled water 1l, pH 7. It was cultured for 8 h at 378C (final log phase) in
Man-Rogosa-Sharpe broth (MRS, Oxoid). The bacteria were harvested by centrifugation
at 3000xg for 10 min and washed three times with sterile 0.01 mol/l phosphate buffer saline
(PBS), pH 7.2. Capsulated pneumococcus (serotype 14) was isolated from the respiratory
tract of a patient from the Department of Clinical Bacteriology of the Nino Jesus
Children’s Hospital in San Miguel de Tucuman, Argentina.
Animals and feeding procedures
Male 6-week-old Swiss albino mice were obtained from the closed colony kept at
CERELA. They were housed in plastic cages at room temperature. Mice were housed
individually during the experiments and the assays for each parameter studied were
performed in 5�6 mice per group for each time point. Weaned mice were malnourished
after consuming a protein-free diet (PFD) (Table 1) for 21 days (Figure 1A). At the end of
this period, mice that weighed 45�50% less than well-nourished mice were selected for
experiments. Well-nourished control (WNC) mice consumed a balanced conventional diet
(BCD) ad libitum (Table 1).
196 S. Salva et al.
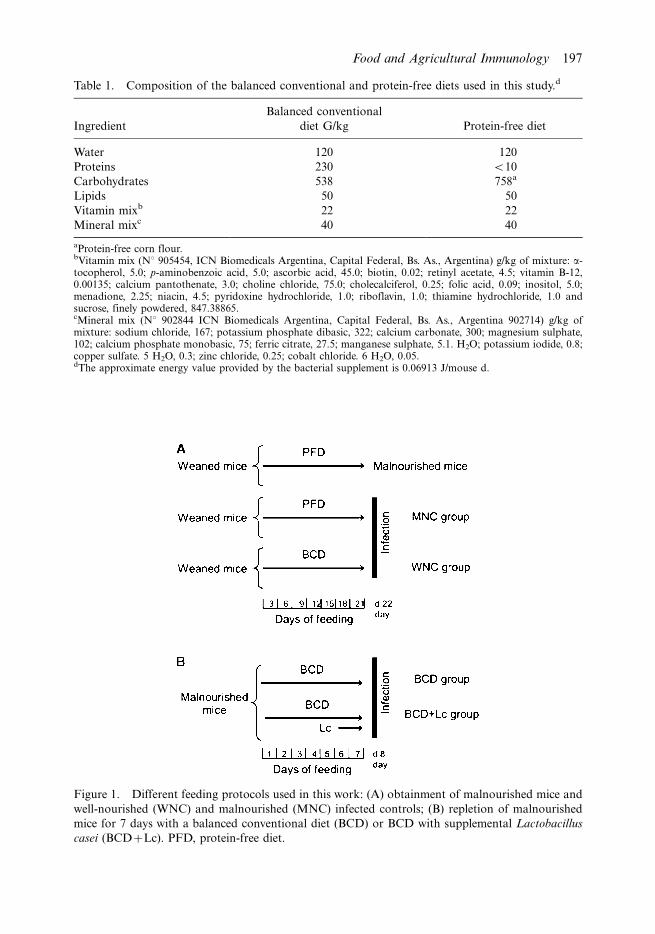
Table 1. Composition of the balanced conventional and protein-free diets used in this study.d
Ingredient
Balanced conventional
diet G/kg Protein-free diet
Water 120 120
Proteins 230 B10
Carbohydrates 538 758a
Lipids 50 50
Vitamin mixb 22 22
Mineral mixc 40 40
aProtein-free corn flour.bVitamin mix (N8 905454, ICN Biomedicals Argentina, Capital Federal, Bs. As., Argentina) g/kg of mixture: a-tocopherol, 5.0; p-aminobenzoic acid, 5.0; ascorbic acid, 45.0; biotin, 0.02; retinyl acetate, 4.5; vitamin B-12,0.00135; calcium pantothenate, 3.0; choline chloride, 75.0; cholecalciferol, 0.25; folic acid, 0.09; inositol, 5.0;menadione, 2.25; niacin, 4.5; pyridoxine hydrochloride, 1.0; riboflavin, 1.0; thiamine hydrochloride, 1.0 andsucrose, finely powdered, 847.38865.cMineral mix (N8 902844 ICN Biomedicals Argentina, Capital Federal, Bs. As., Argentina 902714) g/kg ofmixture: sodium chloride, 167; potassium phosphate dibasic, 322; calcium carbonate, 300; magnesium sulphate,102; calcium phosphate monobasic, 75; ferric citrate, 27.5; manganese sulphate, 5.1. H2O; potassium iodide, 0.8;copper sulfate. 5 H2O, 0.3; zinc chloride, 0.25; cobalt chloride. 6 H2O, 0.05.dThe approximate energy value provided by the bacterial supplement is 0.06913 J/mouse d.
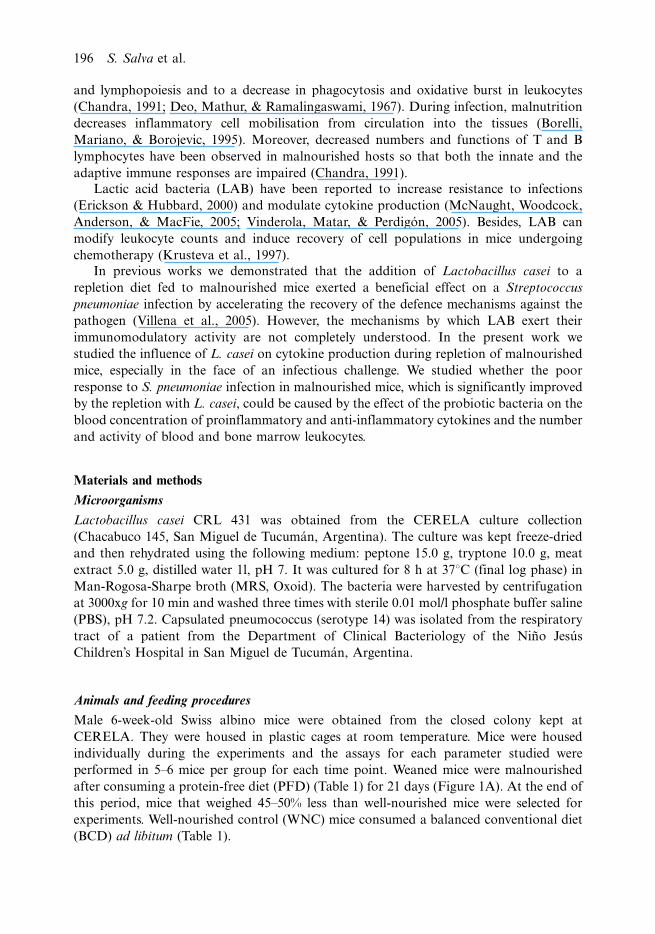
Figure 1. Different feeding protocols used in this work: (A) obtainment of malnourished mice and
well-nourished (WNC) and malnourished (MNC) infected controls; (B) repletion of malnourished
mice for 7 days with a balanced conventional diet (BCD) or BCD with supplemental Lactobacillus
casei (BCD�Lc). PFD, protein-free diet.
Food and Agricultural Immunology 197
Malnourished mice were separated in two groups for repletion treatment (Figure 1B).
One group of malnourished mice were fed BCD for 7 consecutive days (BCD group). As
administration of L. casei for 2 days is the optimal dose to provide protection against
S. pneumoniae in malnourished mice (Villena et al., 2005), the second group of animals
received BCD for 7 days with L. casei supplementation (109 cfu/mouse/day) on days 6 and
7 (BCD�Lc group). The malnourished control group (MNC) received only PFD while the
WNC mice consumed the BCD ad libitum (Figure 1A). The Ethical Committee for Animal
Care at CERELA approved the experiments.
Experimental infection
The experimental animal model of infection was used as previously described (Villena
et al., 2005). Briefly, challenge with S. pneumoniae was performed on the day after the end
of each dietary treatment (day 8) (Figure 1B). Mice were infected by dropping 25 ml of the
inoculum containing 105 log-phase cfu of S. pneumoniae in 0.01 mol/l PBS into each nostril
and allowing it to be inhaled. Mice were killed on day 0 (before infection) and on hour 12
and days 1, 2, 5, and 10 post-infection. Control groups (WNC and MNC) were infected in
the same way (Figure 1A). During day 10 post-infection, all mice were fed only BCD, with
the exception of the MNC, which received PFD.
Cytokine concentrations in serum
Tumour necrosis factor (TNF)-a, interleukin (IL)-1b, IL-4, IL-6 and IL-10 concentrations
in serum were measured with commercially available enzyme-linked immunosorbent assay
kits following the manufacturer’s recommendations (R&D Systems, MN, USA).
Total and differential number of blood leukocytes
Animals were anaesthetised with a mixture of Ketamine hydrochloride (#K2753, Sigma-
Aldrich Co, St Louis, MO, USA), 70 mg/kg, and xylazine hydrochloride (#X1126, Sigma-
Aldrich), 10 mg/kg, intraperitoneally. Blood samples were obtained through cardiac
puncture at the end of each dietary treatment (day 0) and on days 1, 2, 5 and 10 after
challenge. The total number of leukocytes and differential cell counts were performed as
described previously (Villena et al., 2005).
Bone marrow differential cell counts
Anaesthetised mice were killed by cervical dislocation and bone marrow samples were
obtained by flushing the femoral cavity with PBS. Differential cell counts were carried out
by counting 400 cells in bone marrow smears stained with May Grunwald-Giemsa.
Myeloid cells were grouped into the mitotic pool, which includes cells capable of
replication (myeloblasts, promyelocytes and myelocytes), and the post-mitotic pool, whose
cells usually do no replicate but are able to evolve towards more mature and differentiated
cells (metamyelocytes, band cells and neutrophils). The cells of the lymphocytic lineage
were also counted and were expressed as percentages of total bone marrow leukocytes.
198 S. Salva et al.
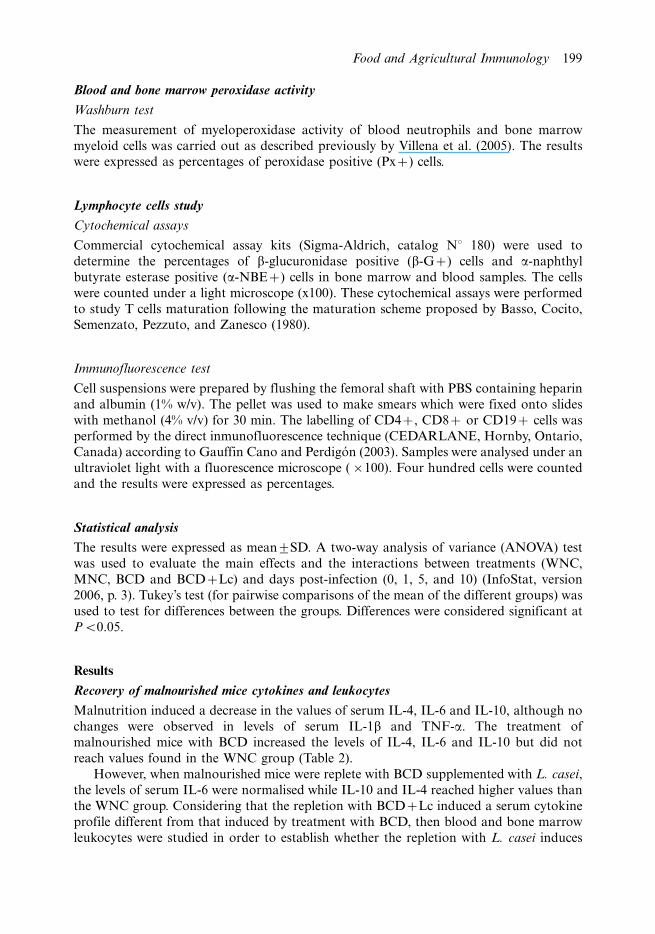
Blood and bone marrow peroxidase activity
Washburn test
The measurement of myeloperoxidase activity of blood neutrophils and bone marrow
myeloid cells was carried out as described previously by Villena et al. (2005). The resultswere expressed as percentages of peroxidase positive (Px�) cells.
Lymphocyte cells study
Cytochemical assays
Commercial cytochemical assay kits (Sigma-Aldrich, catalog N8 180) were used to
determine the percentages of b-glucuronidase positive (b-G�) cells and a-naphthyl
butyrate esterase positive (a-NBE�) cells in bone marrow and blood samples. The cells
were counted under a light microscope (x100). These cytochemical assays were performed
to study T cells maturation following the maturation scheme proposed by Basso, Cocito,Semenzato, Pezzuto, and Zanesco (1980).
Immunofluorescence test
Cell suspensions were prepared by flushing the femoral shaft with PBS containing heparin
and albumin (1% w/v). The pellet was used to make smears which were fixed onto slides
with methanol (4% v/v) for 30 min. The labelling of CD4�, CD8� or CD19� cells was
performed by the direct inmunofluorescence technique (CEDARLANE, Hornby, Ontario,Canada) according to Gauffin Cano and Perdigon (2003). Samples were analysed under an
ultraviolet light with a fluorescence microscope (�100). Four hundred cells were counted
and the results were expressed as percentages.
Statistical analysis
The results were expressed as mean9SD. A two-way analysis of variance (ANOVA) test
was used to evaluate the main effects and the interactions between treatments (WNC,
MNC, BCD and BCD�Lc) and days post-infection (0, 1, 5, and 10) (InfoStat, version
2006, p. 3). Tukey’s test (for pairwise comparisons of the mean of the different groups) was
used to test for differences between the groups. Differences were considered significant at
PB0.05.
Results
Recovery of malnourished mice cytokines and leukocytes
Malnutrition induced a decrease in the values of serum IL-4, IL-6 and IL-10, although no
changes were observed in levels of serum IL-1b and TNF-a. The treatment ofmalnourished mice with BCD increased the levels of IL-4, IL-6 and IL-10 but did not
reach values found in the WNC group (Table 2).
However, when malnourished mice were replete with BCD supplemented with L. casei,
the levels of serum IL-6 were normalised while IL-10 and IL-4 reached higher values than
the WNC group. Considering that the repletion with BCD�Lc induced a serum cytokine
profile different from that induced by treatment with BCD, then blood and bone marrow
leukocytes were studied in order to establish whether the repletion with L. casei induces
Food and Agricultural Immunology 199
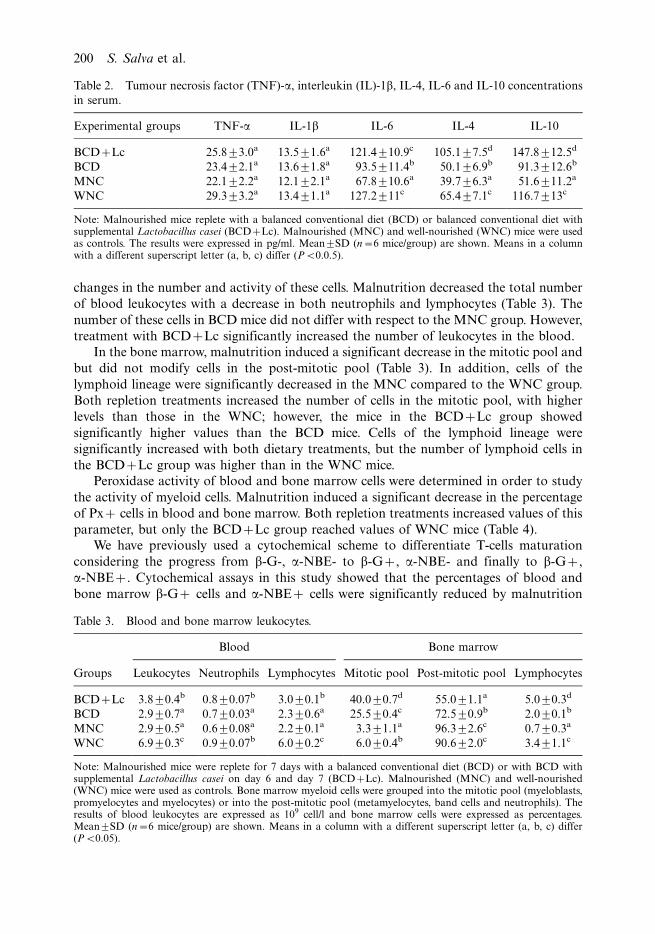
changes in the number and activity of these cells. Malnutrition decreased the total number
of blood leukocytes with a decrease in both neutrophils and lymphocytes (Table 3). The
number of these cells in BCD mice did not differ with respect to the MNC group. However,
treatment with BCD�Lc significantly increased the number of leukocytes in the blood.
In the bone marrow, malnutrition induced a significant decrease in the mitotic pool and
but did not modify cells in the post-mitotic pool (Table 3). In addition, cells of the
lymphoid lineage were significantly decreased in the MNC compared to the WNC group.
Both repletion treatments increased the number of cells in the mitotic pool, with higher
levels than those in the WNC; however, the mice in the BCD�Lc group showed
significantly higher values than the BCD mice. Cells of the lymphoid lineage were
significantly increased with both dietary treatments, but the number of lymphoid cells in
the BCD�Lc group was higher than in the WNC mice.
Peroxidase activity of blood and bone marrow cells were determined in order to study
the activity of myeloid cells. Malnutrition induced a significant decrease in the percentage
of Px� cells in blood and bone marrow. Both repletion treatments increased values of this
parameter, but only the BCD�Lc group reached values of WNC mice (Table 4).
We have previously used a cytochemical scheme to differentiate T-cells maturation
considering the progress from b-G-, a-NBE- to b-G�, a-NBE- and finally to b-G�,
a-NBE�. Cytochemical assays in this study showed that the percentages of blood and
bone marrow b-G� cells and a-NBE� cells were significantly reduced by malnutrition
Table 2. Tumour necrosis factor (TNF)-a, interleukin (IL)-1b, IL-4, IL-6 and IL-10 concentrations
in serum.
Experimental groups TNF-a IL-1b IL-6 IL-4 IL-10
BCD�Lc 25.893.0a 13.591.6a 121.4910.9c 105.197.5d 147.8912.5d
BCD 23.492.1a 13.691.8a 93.5911.4b 50.196.9b 91.3912.6b
MNC 22.192.2a 12.192.1a 67.8910.6a 39.796.3a 51.6911.2a
WNC 29.393.2a 13.491.1a 127.2911c 65.497.1c 116.7913c
Note: Malnourished mice replete with a balanced conventional diet (BCD) or balanced conventional diet withsupplemental Lactobacillus casei (BCD�Lc). Malnourished (MNC) and well-nourished (WNC) mice were usedas controls. The results were expressed in pg/ml. Mean9SD (n�6 mice/group) are shown. Means in a columnwith a different superscript letter (a, b, c) differ (PB0.0.5).
Table 3. Blood and bone marrow leukocytes.
Blood Bone marrow
Groups Leukocytes Neutrophils Lymphocytes Mitotic pool Post-mitotic pool Lymphocytes
BCD�Lc 3.890.4b 0.890.07b 3.090.1b 40.090.7d 55.091.1a 5.090.3d
BCD 2.990.7a 0.790.03a 2.390.6a 25.590.4c 72.590.9b 2.090.1b
MNC 2.990.5a 0.690.08a 2.290.1a 3.391.1a 96.392.6c 0.790.3a
WNC 6.990.3c 0.990.07b 6.090.2c 6.090.4b 90.692.0c 3.491.1c
Note: Malnourished mice were replete for 7 days with a balanced conventional diet (BCD) or with BCD withsupplemental Lactobacillus casei on day 6 and day 7 (BCD�Lc). Malnourished (MNC) and well-nourished(WNC) mice were used as controls. Bone marrow myeloid cells were grouped into the mitotic pool (myeloblasts,promyelocytes and myelocytes) or into the post-mitotic pool (metamyelocytes, band cells and neutrophils). Theresults of blood leukocytes are expressed as 109 cell/l and bone marrow cells were expressed as percentages.Mean9SD (n�6 mice/group) are shown. Means in a column with a different superscript letter (a, b, c) differ(PB0.05).
200 S. Salva et al.
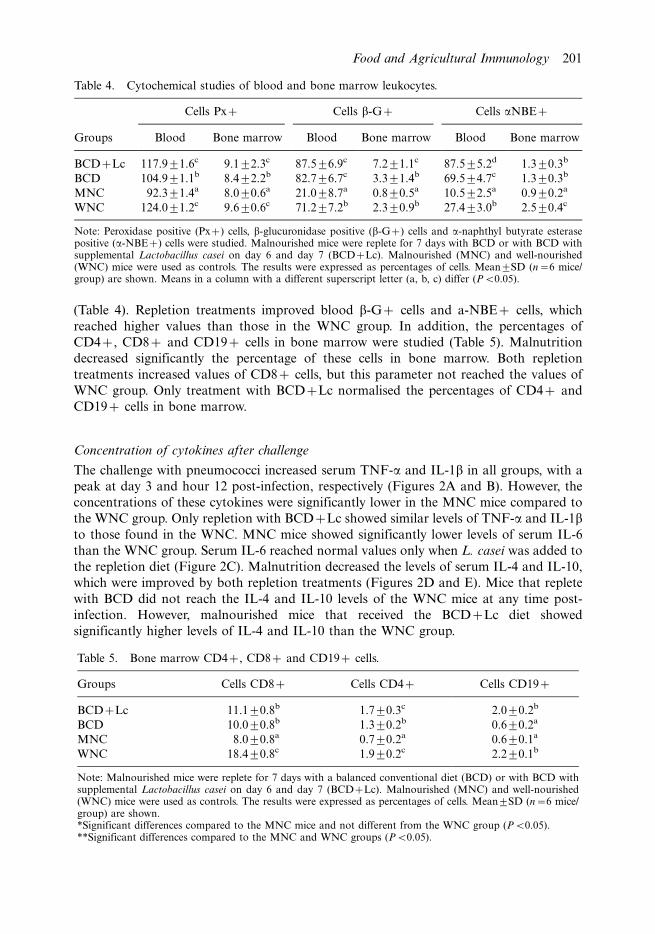
(Table 4). Repletion treatments improved blood b-G� cells and a-NBE� cells, which
reached higher values than those in the WNC group. In addition, the percentages of
CD4�, CD8� and CD19� cells in bone marrow were studied (Table 5). Malnutrition
decreased significantly the percentage of these cells in bone marrow. Both repletion
treatments increased values of CD8� cells, but this parameter not reached the values of
WNC group. Only treatment with BCD�Lc normalised the percentages of CD4� and
CD19� cells in bone marrow.
Concentration of cytokines after challenge
The challenge with pneumococci increased serum TNF-a and IL-1b in all groups, with a
peak at day 3 and hour 12 post-infection, respectively (Figures 2A and B). However, the
concentrations of these cytokines were significantly lower in the MNC mice compared to
the WNC group. Only repletion with BCD�Lc showed similar levels of TNF-a and IL-1bto those found in the WNC. MNC mice showed significantly lower levels of serum IL-6
than the WNC group. Serum IL-6 reached normal values only when L. casei was added to
the repletion diet (Figure 2C). Malnutrition decreased the levels of serum IL-4 and IL-10,
which were improved by both repletion treatments (Figures 2D and E). Mice that replete
with BCD did not reach the IL-4 and IL-10 levels of the WNC mice at any time post-
infection. However, malnourished mice that received the BCD�Lc diet showed
significantly higher levels of IL-4 and IL-10 than the WNC group.
Table 4. Cytochemical studies of blood and bone marrow leukocytes.
Cells Px� Cells b-G� Cells aNBE�
Groups Blood Bone marrow Blood Bone marrow Blood Bone marrow
BCD�Lc 117.991.6c 9.192.3c 87.596.9c 7.291.1c 87.595.2d 1.390.3b
BCD 104.991.1b 8.492.2b 82.796.7c 3.391.4b 69.594.7c 1.390.3b
MNC 92.391.4a 8.090.6a 21.098.7a 0.890.5a 10.592.5a 0.990.2a
WNC 124.091.2c 9.690.6c 71.297.2b 2.390.9b 27.493.0b 2.590.4c
Note: Peroxidase positive (Px�) cells, b-glucuronidase positive (b-G�) cells and a-naphthyl butyrate esterasepositive (a-NBE�) cells were studied. Malnourished mice were replete for 7 days with BCD or with BCD withsupplemental Lactobacillus casei on day 6 and day 7 (BCD�Lc). Malnourished (MNC) and well-nourished(WNC) mice were used as controls. The results were expressed as percentages of cells. Mean9SD (n�6 mice/group) are shown. Means in a column with a different superscript letter (a, b, c) differ (PB0.05).
Table 5. Bone marrow CD4�, CD8� and CD19� cells.
Groups Cells CD8� Cells CD4� Cells CD19�
BCD�Lc 11.190.8b 1.790.3c 2.090.2b
BCD 10.090.8b 1.390.2b 0.690.2a
MNC 8.090.8a 0.790.2a 0.690.1a
WNC 18.490.8c 1.990.2c 2.290.1b
Note: Malnourished mice were replete for 7 days with a balanced conventional diet (BCD) or with BCD withsupplemental Lactobacillus casei on day 6 and day 7 (BCD�Lc). Malnourished (MNC) and well-nourished(WNC) mice were used as controls. The results were expressed as percentages of cells. Mean9SD (n�6 mice/group) are shown.*Significant differences compared to the MNC mice and not different from the WNC group (PB0.05).**Significant differences compared to the MNC and WNC groups (PB0.05).
Food and Agricultural Immunology 201
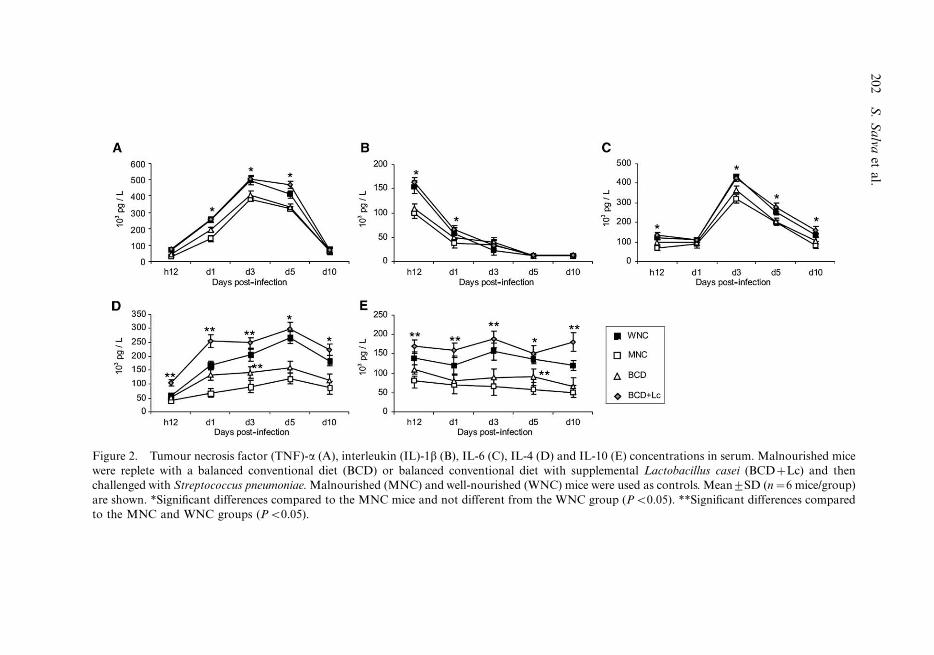
Figure 2. Tumour necrosis factor (TNF)-a (A), interleukin (IL)-1b (B), IL-6 (C), IL-4 (D) and IL-10 (E) concentrations in serum. Malnourished mice
were replete with a balanced conventional diet (BCD) or balanced conventional diet with supplemental Lactobacillus casei (BCD�Lc) and then
challenged with Streptococcus pneumoniae. Malnourished (MNC) and well-nourished (WNC) mice were used as controls. Mean9SD (n�6 mice/group)
are shown. *Significant differences compared to the MNC mice and not different from the WNC group (PB0.05). **Significant differences compared
to the MNC and WNC groups (PB0.05).
20
2S
.S
alva
eta
l.
Total and differential counts of leukocytes after challenge
The pathogen increased the number of blood leukocytes in all experimental groups;
however, the values were significantly lower in the MNC than in the WNC mice. Both
repletion treatments increased blood leukocytes, but only the BCD�Lc group reached
similar levels to those of the WNC mice (Figure 3A). When we analysed the different
leukocytes populations, it was noted that the treatment with BCD was effective in
increasing values of blood leukocytes (Figure 3C). However, the number of neutrophils was
similar to the MNC mice (Figure 3B). Malnourished mice that replete with BCD�Lc
showed normal values of both neutrophils and lymphocytes (Figures 3B and C).
The study of bone marrow cells, after infection, showed that the MNC group had
decreased percentages of proliferating myeloid cells (mitotic pool cells) compared to the
WNC mice. Both repletion diets (BCD and BCD�Lc) increased the percentage of
proliferating cells, with higher levels than those in the MNC group (Figure 3D). However,
BCD supplemented with L. casei treatment caused a higher proliferation (mitotic pool)
than the one found in the WNC group. Malnutrition induced a significant decrease in
lymphoid lineage cells. Although both repletion treatments improved these values, only the
BCD�Lc group showed values similar to those of the WNC group (Figure 3F).
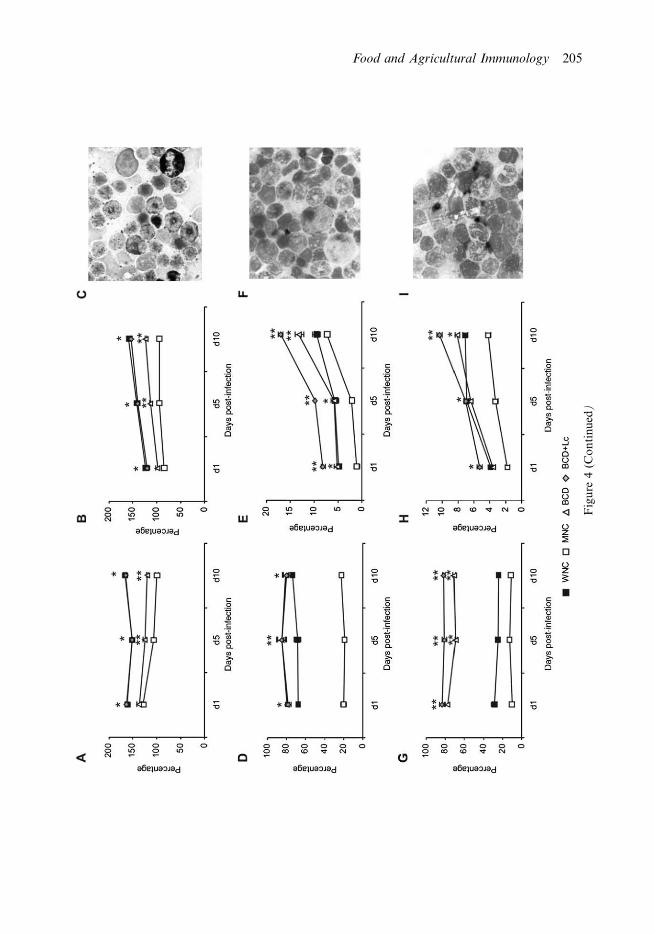
Peroxidase activity of blood and bone marrow cells after challenge
After the challenge with S. pneumoniae, the percentage of Px� cells increased in all
experimental groups. However, MNC mice showed significantly decreased levels of Px�cells (Figures 4A and B). Both repletion treatments improved blood and bone marrow
peroxidase activity during infection, but only the BCD�Lc group showed similar values to
those in the WNC group (Figures 4A and B).
Lymphocyte study after challenge
Bone marrow b-G� and a-NBE� cell populations were significantly lower in the MNC
than in the WNC group after challenge. Repletion treatments increased b-G� and a-
NBE� cell populations but BCD�Lc mice showed values of b-G� cells higher than those
in the WNC group (Figures 4E and H). The number of bone marrow CD4�, CD8� and
CD19� cells was significantly reduced by malnutrition (Figure 4). Repletion with BCD
increased only the number of CD4� cells while the BCD�Lc treatment was able to
normalise the number of bone marrow CD4� and CD19� cells (Figures 5A and C). The
percentage of CD8� cells was not modified either with the BCD or with the BCD�Lc
treatment (Figure 5B).
Discussion
Nutrition and infection interact with each other synergistically. It is clear that nutritional
deficiencies increase the frequency and severity of infections, leading to altered cell
populations (Najera et al., 2001; Savino, 2002). Most nutrients are directly or indirectly
involved in protein synthesis and most immune responses involve the production of
proteins with specific functions (Scrimshaw & Sangiovanni, 1997). It was reported that
malnutrition reduces the capacity of mononuclear phagocytes to release cytokines that
mediate the acute phase response (Knapp et al., 2004; Komatsu, Mawatari, Miura, &
Food and Agricultural Immunology 203
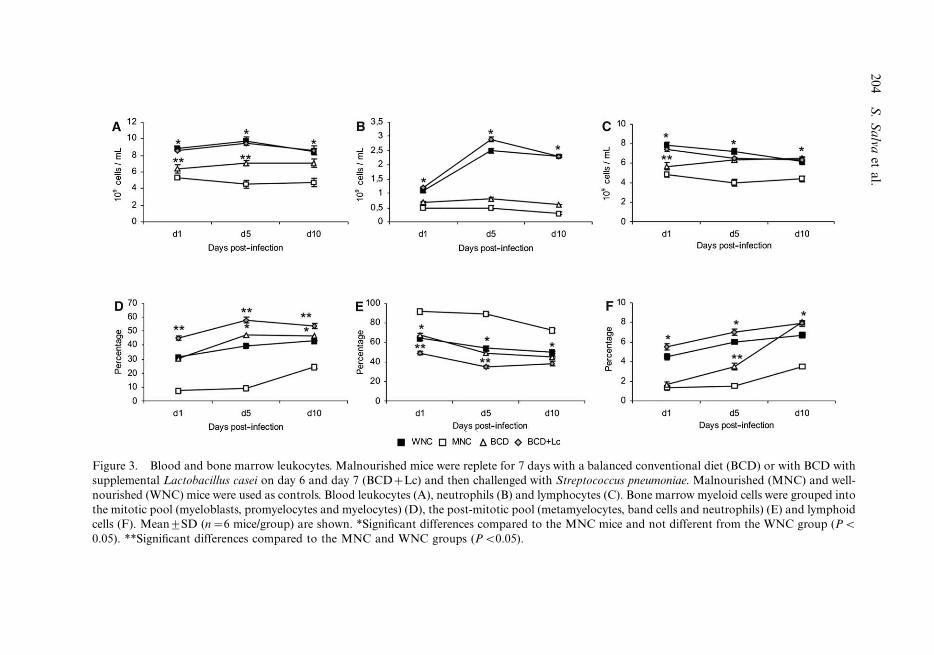
Figure 3. Blood and bone marrow leukocytes. Malnourished mice were replete for 7 days with a balanced conventional diet (BCD) or with BCD with
supplemental Lactobacillus casei on day 6 and day 7 (BCD�Lc) and then challenged with Streptococcus pneumoniae. Malnourished (MNC) and well-
nourished (WNC) mice were used as controls. Blood leukocytes (A), neutrophils (B) and lymphocytes (C). Bone marrow myeloid cells were grouped into
the mitotic pool (myeloblasts, promyelocytes and myelocytes) (D), the post-mitotic pool (metamyelocytes, band cells and neutrophils) (E) and lymphoid
cells (F). Mean9SD (n�6 mice/group) are shown. *Significant differences compared to the MNC mice and not different from the WNC group (PB
0.05). **Significant differences compared to the MNC and WNC groups (PB0.05).
20
4S
.S
alva
eta
l.
Fig
ure
4(C
on
tin
ued
)
Food and Agricultural Immunology 205
Yagasaki, 2007; Woodward, 2001). In our experimental model, malnutrition did not alter
basal levels of TNF-a and IL-1b. However, after infection, these cytokines were
significantly lower in malnourished animals compared with well-nourished ones. The
diet with supplemental L. casei was able to normalise these cytokines after infection. TNF-
a can activate and stimulate the recruitment of neutrophils and monocytes to sites of
infection to eradicate microbes (Knapp et al., 2004). It was reported that TNF-a and IL-1breduce the numbers of lymphocytes but not of Gr-1� granulocytes in bone marrow, which
would represent a physiological response to ensure increased neutrophil production in
response to infection (Ueda, Kondo, & Kelsoe, 2005). The addition of L. casei to a
repletion diet was able to improve host defence against infection by increased recruitment
and enhanced performance of phagocytes during pneumococcal pneumonia, as demon-
strated by the normalisation of blood leukocyte counts reported in this work and by the
normalisation of neutrophils and macrophages numbers in bronchoalveolar lavages (BAL)
described in a previous paper (Villena et al., 2005).
T cell functions are more sensitive than B cell functions to most nutrient deficiencies.
Thus, some specific immune tests such as of phagocytic capacity, T cell subtypes,
complement levels, and delayed cutaneous hypersensitivity can be useful indicators of
malnutrition (Scrimshaw & Sangiovanni, 1997). In this paper, quantitative and qualitative
damage in leukocyte populations in our malnourished experimental model, evidenced by
the number of blood leukocytes, the alteration of bone marrow mitotic and post-mitotic
pools and the impairment of blood and bone marrow cells peroxidase activity was
observed. This effect of malnutrition on leukocytes would lead to a deficiency in the innate
immune response against S. pneumoniae, which is in agreement with our previous findings
that showed that pneumococcal colonisation of lung and bacteraemia were significantly
higher in MNC compared to the WNC group (Villena et al., 2005). Repletion with BCD�Lc reduced significantly leukocytes alterations; thus, this dietary treatment would restore
the innate immune response, allowing replete mice to reach rates of pneumococcal
clearance similar to the WNC group (Villena et al., 2005).
The increased percentage of proliferating bone marrow myeloid cells (mitotic pool)
observed in the BCD�Lc group could be related to the stimulation of murine granulocyte/
macrophage colony formation by IL-6 (Marin et al., 1998; Suda et al., 1988). In addition,
the decrease in post-mitotic pool cells observed after challenge in the BCD�Lc mice is
probably caused by a release of mature cells into peripheral blood. The effect of
malnutrition on the production of Th2 cytokines cannot be generalised. Some studies
showed that the ability of blood and splenic T-cells to produce IL-4, IL-5, IL-6 and IL-10
in response to stimulation is conserved while INF-g production is decreased (Hill, Naama,
Shou, Calvano, & Daly, 1995b; Malave et al., 1998; Shi, Scott, Stevenson, & Koski, 1998).
In contrast, other reports showed an impaired production of mucosal and systemic IL-4
Figure 4. Cytochemical studies of blood and bone marrow leukocytes peroxidase positive (Px�)
cells in blood (A) and bone marrow (B, C), b-glucuronidase positive (b-G�) cells in blood (D) and
bone marrow (E, F) and a-naphthyl butyrate esterase positive (a-NBE�) cells in blood (G) and bone
marrow (H, I) were studied. Malnourished mice were replete for 7 days with BCD or with BCD with
supplemental Lactobacillus casei on day 6 and day 7 (BCD�Lc) and then challenged with
Streptococcus pneumoniae. Malnourished (MNC) and well-nourished (WNC) mice were used as
controls. Mean9SD (n�6 mice/group) are shown. *Significant differences compared to the MNC
mice and not different from the WNC group (PB0.05). **Significant differences compared to the
MNC and WNC groups (PB0.05).
206 S. Salva et al.
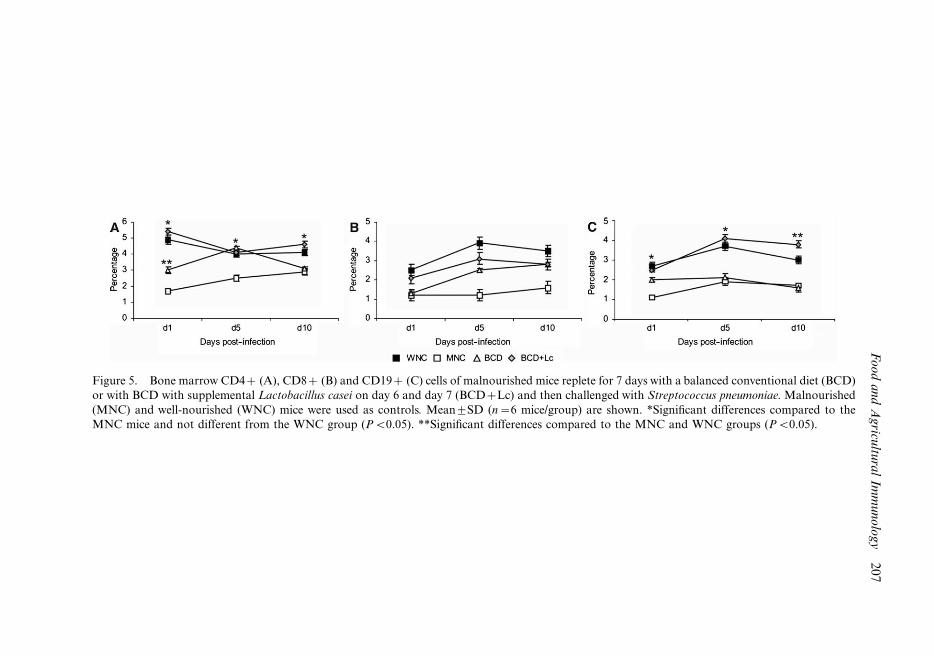
Figure 5. Bone marrow CD4� (A), CD8� (B) and CD19� (C) cells of malnourished mice replete for 7 days with a balanced conventional diet (BCD)
or with BCD with supplemental Lactobacillus casei on day 6 and day 7 (BCD�Lc) and then challenged with Streptococcus pneumoniae. Malnourished
(MNC) and well-nourished (WNC) mice were used as controls. Mean9SD (n�6 mice/group) are shown. *Significant differences compared to the
MNC mice and not different from the WNC group (PB0.05). **Significant differences compared to the MNC and WNC groups (PB0.05).
Fo
od
an
dA
gricu
ltura
lIm
mu
no
log
y2
07
and IL-6 by immune cells in malnourished hosts (Hill et al., 1995a; McCarter et al., 1998;
Zhang & Petro, 1997). In this experimental model, malnutrition affects IL-4, IL-6 and IL-
10 serum levels and repletion with BCD�Lc, showed normal levels of serum IL-6 and
higher values of IL-4 and IL-10 than those found in the WNC group. Under inflammatory
conditions, cytokines change dramatically. When a Th2 response is needed, additional
sources of IL-4, IL-5, IL-6 and IL-10 contribute to stimulating B-cells to proliferate and
mature into polymeric IgA-producing cells and to develop specific antibodies (Corthesy,
2002). In addition, during the generation of an efficient effector immune response, DCs
also have to overcome suppression by Treg cells, which they apparently accomplish by
producing IL-6 (De Heer, Hammad, Kool, & Lambrecht, 2005). Thus, Th2 cytokines are
essential for an adequate induction of the antigen-specific humoral immune response.
The decrease in blood and bone marrow b-G� and a-NBE� cells in malnourished
mice would suggest deficiencies in the maturation of T cells (Basso et al., 1980), while the
increase in blood a-NBE� cells induced by BCD� Lc administration would indicate an
improvement in T cells maturation. This effect would be beneficial for replete
malnourished mice because T cells play a significant role in the lung during pneumococcal
infection (Kadioglu et al., 2000). It was reported that T cells are important in the inductionof the humoral immune response against S. pneumoniae and that they are rapidly recruited
after pneumococcal pulmonary infection (Kadioglu, Coward, Colston, Hewitt, & Andrew,
2004). In our study, bone marrow CD4� cells increased in all groups after challenge but
only the BCD�Lc mice reached WNC values. This fact would be important for a
protective response against pneumococcal infection because of the role of CD4�T-cells as
coordinators of the adaptive immune response and haematopoiesis amplifiers of the innate
immune response (Monteiro, Benjamin, Costa, Barcinski, & Bonomo, 2005). The number
of CD8� cells was significantly decreased after challenge with the pathogen and treatment
with BCD�Lc did not increase the percentage of these cells in the bone marrow. This
finding would mean that L. casei is unable to induce cytotoxicity mechanisms.
The BCD�Lc group showed a normal number of CD19� cells, which would correlate
with an increase in the levels of BAL and serum anti-pneumococcal immunoglobulin
demonstrated previously (Villena et al., 2005). This fact is probably related to the increase
in IL-6, which stimulates the growth of B-lymphocytes that have differentiated into
antibody producers (Abbas, Lichtman, & Pober, 2004). Thus, the improvement of the
antibody response to pneumococcal infection would be mediated by the different cytokine
profile induced by L. casei.
In a diet-restricted murine peritonitis model, Hidemura et al. (2003) demonstrated that
the oral administration of LAB increased IL-10 concentrations, which probably
contributed to attenuating excessive host inflammatory response. Consequently, the
increase in this cytokine observed in the BCD�Lc group could be involved in the lower
lung injury reported in a previous work (Villena et al., 2005). Moreover, IL-10 could play a
regulatory role in haematopoiesis through its ability to inhibit the release of the
granulocyte macrophage-colony stimulating factor (GM-CSF) by accessory cells (Oehler
et al., 1997). In addition, L. casei administration induced an increase in IL-4 concentra-
tion. This cytokine antagonises the macrophage-activating effects of IFN-g and thus
inhibits cell-mediated immune reactions. This may be one of the mechanisms by which Th2
cells function as inhibitors of immune inflammation (Oehler et al., 1997).
The production of blood cells, which are part of the immune system, is the result of the
balance between positive and negative growth signals. Malnutrition affects the immune
response and haematopoiesis and we observed previously that feeding with the BCD for 21
208 S. Salva et al.
days was necessary to normalise the response against infection (Villena et al., 2005). The
use of L. casei as a supplement in a repletion diet was associated with a pattern of
inflammatory and anti-inflammatory cytokines that led to an increased number and
functionality of the cells that participate in the immune response against a pneumococcal
infection. These results seem to be associated with an improvement in the production and
maturation of myeloid and lymphoid cells. However, more studies with specific markers are
needed to demonstrate this hypothesis.
We propose that, in order to improve compromised immunity in malnourished hosts,future treatments should consider the potential benefits of LAB as promoters of the early
recovery of defence mechanisms against infection.
Acknowledgements
The authors gratefully acknowledge to Lic. Elena Bru de Labanda for the statistical analysis. Thisresearch was supported by grants from FONCyT PICT 99 no. 5�7206 and CIUNT 26 D/202.
References
Abbas, A.K., Lichtman, A.H., & Pober, J.S. (2004). Cytokines. In W. Schmit, H.A. Hacker, &J. Ehlers (Eds.), Cellular and molecular immunology (pp. 235�269). Philadelphia, PA: WB Saunders.
Abo-Shousha, S.A., Hussein, M.Z., Rashwan, I.A., & Salama, M. (2005). Production ofproinflammatory cytokines: Granulocyte-macrophage colony stimulating factor, interleukin-8and interleukin-6 by peripheral blood mononuclear cells of protein energy malnourished children.Egyptian Journal of Immunology, 12, 125�131.
Basso, G., Cocito, M., Semenzato, G., Pezzuto, A., & Zanesco, L. (1980). Cytochemical study ofthymocytes and T lymphocytes. British Journal of Haematology, 44, 577�582.
Borelli, P., Mariano, M., & Borojevic, R. (1995). Protein malnutrition: Effect on myeloid cellproduction and mobilization into inflammatory reactions in mice. Nutrition Research, 15, 1477�1485.
Chandra, R.K. (1991). McCollum award lecture. Nutrition and immunity: Lessons from the past andnew insights into the future. American Journal of Clinical Nutrition, 53, 1087�1101.
Corthesy, B. (2002). Recombinant immunoglobulin A: Powerful tools for fundamental and appliedresearch. Trends in Biotechnology, 20, 65�71.
De Heer, H.J., Hammad, H., Kool, H., & Lambrecht, B.N. (2005). Dendritic cell subsets and immuneregulation in the lung. Seminars in Immunology, 17, 295�303.
Deo, M.G., Mathur, M., & Ramalingaswami, V. (1967). Cell regeneration in protein deficiency.Nature, 216, 499�500.
Erickson, K.L., & Hubbard, N.E. (2000). Probiotic inmmunomodulation on health and disease.Journal of Nutrition, 130, 403�409.
Gauffin Cano, P., & Perdigon, G. (2003). Probiotics induce resistance to enteropathogens in a re-nourished mouse model. Journal of Dairy Research, 70, 433�440.
Hidemura, A., Saito, H., Fukatsu, K., Matsuda, T., Kitayama, J., Ikeda, S., et al. (2003). Oraladministration of Bifidobacterium longum culture condensate in a diet-restricted murineperitonitis model enhances polymorphonuclear neutrophil recruitment into local inflammatorysite. Nutrition, 19, 270�274.
Hill, A.D., Naama, H.A., Gallagher, H.J., Shou, J., Calvano, S.E., & Daly, J.M. (1995a).Glucocorticoids mediate macrophage dysfunction in protein calorie malnutrition. Surgery, 118,130�137.
Hill, A.D., Naama, H.A., Shou, J., Calvano, S.E., & Daly, J.M (1995b). Antimicrobial effects ofgranulocyte-macrophage colony-stimulating factor in protein-energy malnutrition. Archives ofSurgery, 130, 1273�1278.
Hillyer, L., Dao, B., Niemiec, P., Lee, S., Doidge, M., Bemben, I., et al. (2006). Elevated bioactivity ofthe tolerogenic cytokines, interleukin-10 and transforming growth factor-beta, in the blood ofacutely malnourished weanling mice. Experimental Biology and Medicine, 231, 1439�1447.
Food and Agricultural Immunology 209
Hillyer, L.M., Maliwichi, H.E., & Woodward, B. (2007). Blood serum interferon-gamma bioactivityis low in weanling mice subjected to acute deficits of energy or both protein and energy. BritishJournal of Nutrition, 97, 528�534.
Kadioglu, A., Coward, W., Colston, M., Hewitt, C., & Andrew, P. (2004). CD4-T-lymphocytesinteractions with pneumolysin and pneumococci suggest a crucial protective role in the hostresponse to pneumococcal infection. Infection and Immunity, 72, 2689�2697.
Kadioglu, A., Gingles, N., Grattan, K., Kerr, A., Mitchell, T., & Andrew, P. (2000). Host cellularimmune response to pneumococcal lung infection in mice. Infection and Immunity, 68, 492�501.
Keusch, G.T. (2003). The history of nutrition: Malnutrition, infection and immunity. Journal ofNutrition, 133, 336�340.
Knapp, S., Hareng, L., Rijneveld, A.W., Bresser, P., van der Zee, J.S., Florquin, S, et al. (2004).Activation of neutrophils and inhibition of the proinflammatory cytokine response by endogenousgranulocyte colony-stimulating factor in murine pneumococcal pneumonia. Journal of InfectiousDiseases, 189, 1506�1515.
Komatsu, W., Mawatari, K., Miura, Y., & Yagasaki, K. (2007). Restoration by dietary glutamine ofreduced tumor necrosis factor production in a low-protein-diet-fed rat model. Bioscience.Biotechnology and Biochemistry, 71, 352�357.
Krusteva, E., Hristova, S., Damyanov, D., Bogdanov, A., Altaparmakov, I., & Pacelli, E. (1997).Clinical study of the effect of the preparation DEODAN on leucopoenia, induced by cytostatics.International Journal of Immunopharmacology, 19, 487�492.
Malave, I., Vethencourt, M.A., Charcon, R., Quinones, D., Rebrij, C., & Bolivar, G. (1998).Production of interleukin-6 in cultures of peripheral blood mononuclear cells from children withprimary protein-calorie malnutrition and from eutrophic controls. Annals of Nutrition andMetabolism, 42, 266�273.
Marin, K.L., Tejada-Simon, M.V., Lee, J.H., Murtha, J., Ustunol, Z., & Pestka, J.J. (1998).Stimulation of cytokine production in clonal macrophage and T-cell models by Streptococcusthermophilus: Comparison with Bifidobacterium sp. and Lactobacillus bulgaricus. Journal of FoodProtection, 61, 859�864.
McCarter, M.D., Naama, H.A., Shou, J., Kwi, L.X., Evoy, D.A., Calvano, S.E., et al. (1998). Alteredmacrophage intracellular signalling induced by protein-calorie malnutrition. Cellular Immunology,183, 131�136.
McDade, T.W., Beck, M.A., Kuzawa, C.W., & Adair, L.S. (2001). Prenatal undernutrition andpostnatal growth are associated with adolescent thymic function. Journal of Nutrition, 131, 1225�1231.
McNaught, C.E., Woodcock, N.P., Anderson, A.D., & MacFie, J. (2005). A prospective randomisedtrial of probiotics in critically ill patients. Clinical Nutrition, 24, 211�219.
Monteiro, J., Benjamin, A., Costa, E., Barcinski, M., & Bonomo, A. (2005). Normal haematopoiesisis maintained by activated bone marrow CD4� T cells. Blood, 105, 1484�1491.
Najera, O., Gonzalez, C., Toledo, G., Lopez, L., Cortes, E., & Betancourt, M. (2001). CD45RA andCD45RO isoforms in infected malnourished and infected well-nourished children. Clinical andExperimental Immunology, 126, 461�465.
Oehler, L, Foedinger, M., Koeller, M., Kollars, M., Reiter, E., Bohle, B., et al. (1997). Interleukin-10inhibits spontaneous colony-forming unit-granulocyte-macrophage growth from human periph-eral blood mononuclear cells by suppression of endogenous granulocyte-macrophage colony-stimulating factor release. Blood, 89, 1147�1153.
Savino, W. (2002). The thymus gland is a target in malnutrition. European Journal of ClinicalNutrition, 56, S46�S49.
Scrimshaw, N.S., & Sangiovanni, J.P. (1997). Synergism of nutrition, infection, and immunity: Anoverview. American Journal of Clinical Nutrition, , S, 66, 464S�477.
Shi, H.N., Scott, M.E., Stevenson, M.M., & Koski, J.K. (1998). Energy restriction and zinc deficiencyimpair the functions of murine T cells and antigen-presenting cells during gastrointestinalnematode infection. Journal of Nutrition, 128, 20�27.
Suda, T., Yamaguchi, Y., Suda, J., Miura, Y., Okano, A., & Akiyama, Y. (1988). Effect of interleukin6 (IL-6) on the differentiation and proliferation of murine and human haemopoietic progenitors.Experimental Hematology, 16, 891�895.
Ueda, Y., Kondo, M., & Kelsoe, G. (2005). Inflammation and reciprocal production of granulocytesand lymphocytes in bone marrow. Journal of Experimental Medicine, 201, 1771�1780.
210 S. Salva et al.

Villena, J., Racedo, S., Aguero, G., Bru, E., Medina, M., & Alvarez, S. (2005). Lactobacillus caseiimproves resistance to pneumococcal respiratory infection in malnourished mice. Journal ofNutrition, 135, 1462�1469.
Vinderola, G., Matar, C., & Perdigon, G. (2005). Role of intestinal epithelial cells in immune effectsmediated by gram-positive probiotic bacteria: Involvement of toll-like receptors. Clinical andDiagnostic Laboratory Immunology, 12, 1075�1084.
Woodward, B. (2001). The effect of protein-energy malnutrition on immune competence. In R.M.Suskind & K. Tontisirin (Eds.), Nutrition, immunity and infection in infants and children (pp. 89�116). Nestle Nutrition Workshop Series, Paediatric Programme, Nestle Nutrition, SA.
Zhang, S., & Petro, T.M. (1997). The effect of moderate protein malnutrition on murine T cellcytokine production. Nutrition Research, 17, 51�64.
Food and Agricultural Immunology 211
Copyright © 2022 FDOKUMEN