LABORATORY TESTING DATA SHEET - Westerly, RI
15
10.25.17 Boring ID Sample No. Depth (ft) Laboratory No. Water Content % LL % PL % Gravel % Sand % Fines % Org. % g d MAX (pcf) W opt (%) g d MAX (pcf) W opt (%) Corrected CBR Setup as % of Proctor CBR Dry unit wt. pcf CBR Water Content % CBR @ 0.1" @ 0.2" Laboratory Log and Soil Description WPVC-1 S-1 0-0.8 S-1 1.4 63.1 35.5 Grey f-m SAND and SILT, trace fine Gravel WPVC-1 S-2 0.8-1.4 S-2 0.0 44.0 56.0 Grey SILT and fine SAND WPVC-1 S-3 1.4-2.8 S-3 0.6 72.4 27.0 Grey fine SAND, some Silt, trace fine Gravel WPVC-3 S-1 0-4.7 S-4 0.0 97.2 2.8 Grey fine SAND, trace Silt WPVC-3 S-2 4.7-6 S-5 0.0 58.7 41.3 Brownish Grey f-m SAND and SILT WPVC-4 S-1 0-1 S-6 0.1 91.7 8.2 Grey fine SAND, trace Silt, trace fine Gravel WPVC-4 S-2 1-1.7 S-7 0.0 89.2 10.8 Grey fine SAND, little Silt WPVC-4A S-1 0-1.1 S-8 0.0 92.7 7.3 Grey fine SAND, trace Silt WPVC-4A S-2 1.1-3.8 S-9 0.0 77.8 22.2 Grey fine SAND, some Silt WPVC-4B S-1 0-2.4 S-10 0.2 93.8 6.0 Grey fine SAND, trace Silt, trace fine Gravel WPVC-4B S-2 2.4-4.8 S-11 1.6 59.0 39.4 Grey f-m SAND and SILT, trace f- c Gravel WPVC-9A S-1 0-2 S-12 0.0 98.7 1.3 Grey fine SAND, trace Silt WPVC-9A S-2 2-3.1 S-13 0.0 91.8 8.2 Grey fine SAND, trace Silt WPVC-9A S-3 3.1-4.1 S-14 0.0 61.0 39.0 Grey fine SAND and SILT Reviewed By Date Reviewed: 10.27.17 Phone: (401)-467-6454 Cranston RI, 02910 195 Frances Avenue Westerly, RI Winnapaug Pond Permit/Dredge Project Name: Laboratory Information PM: Jesse Baldwin Providence, RI GZA Geoenvironmental Client Information: Assigned By: Nicholas Hetland http://www.thielsch.com GZA Project Number: 03.0034068.01 Fax: (401)-467-2398 Report Date: LABORATORY TESTING DATA SHEET Collected By: Jesse Baldwin Identification Tests Density Strength Tests
-
Upload
khangminh22 -
Category
Documents
-
view
2 -
download
0
Transcript of LABORATORY TESTING DATA SHEET - Westerly, RI

10.25.17
Boring ID Sample No. Depth (ft)Laboratory
No.
Water
Content
%
LL
%
PL
%
Gravel
%
Sand
%
Fines
%
Org.
%
gd
MAX
(pcf)
Wopt (%)
gd
MAX
(pcf)
Wopt (%)
Corrected
CBR
Setup as
% of
Proctor
CBR Dry
unit wt. pcf
CBR
Water
Content
%
CBR
@ 0.1"
@ 0.2"
Laboratory Log
and
Soil Description
WPVC-1 S-1 0-0.8 S-1 1.4 63.1 35.5
Grey f-m SAND and SILT, trace
fine Gravel
WPVC-1 S-2 0.8-1.4 S-2 0.0 44.0 56.0Grey SILT and fine SAND
WPVC-1 S-3 1.4-2.8 S-3 0.6 72.4 27.0
Grey fine SAND, some Silt, trace
fine Gravel
WPVC-3 S-1 0-4.7 S-4 0.0 97.2 2.8Grey fine SAND, trace Silt
WPVC-3 S-2 4.7-6 S-5 0.0 58.7 41.3
Brownish Grey f-m SAND and
SILT
WPVC-4 S-1 0-1 S-6 0.1 91.7 8.2
Grey fine SAND, trace Silt, trace
fine Gravel
WPVC-4 S-2 1-1.7 S-7 0.0 89.2 10.8Grey fine SAND, little Silt
WPVC-4A S-1 0-1.1 S-8 0.0 92.7 7.3Grey fine SAND, trace Silt
WPVC-4A S-2 1.1-3.8 S-9 0.0 77.8 22.2Grey fine SAND, some Silt
WPVC-4B S-1 0-2.4 S-10 0.2 93.8 6.0
Grey fine SAND, trace Silt, trace
fine Gravel
WPVC-4B S-2 2.4-4.8 S-11 1.6 59.0 39.4
Grey f-m SAND and SILT, trace f-
c Gravel
WPVC-9A S-1 0-2 S-12 0.0 98.7 1.3Grey fine SAND, trace Silt
WPVC-9A S-2 2-3.1 S-13 0.0 91.8 8.2Grey fine SAND, trace Silt
WPVC-9A S-3 3.1-4.1 S-14 0.0 61.0 39.0Grey fine SAND and SILT
Reviewed By Date Reviewed: 10.27.17
Phone: (401)-467-6454Cranston RI, 02910
195 Frances Avenue
Westerly, RIWinnapaug Pond Permit/Dredge
Project Name:Laboratory Information
PM: Jesse BaldwinProvidence, RI
GZA GeoenvironmentalClient Information:
Assigned By: Nicholas Hetlandhttp://www.thielsch.com GZA Project Number: 03.0034068.01Fax: (401)-467-2398
Report Date:
LABORATORY TESTING DATA SHEET
Collected By: Jesse Baldwin
Identification Tests Density Strength Tests

S-1
Thielsch Engineering Inc.
Cranston, RI
(no specification provided)*
PL= LL= PI=
USCS (D 2487)= AASHTO (M 145)=
D90= D85= D60=D50= D30= D15=D10= Cu= Cc=
Remarks
Grey f-m SAND and SILT, trace fine Gravel
0.75"0.5"
0.375"#4#10#20#40#80
#100#200
100.099.899.298.698.196.891.552.943.835.5
NP NV NP
SM A-4(0)
0.4012 0.3452 0.20500.1704
Sample contained trace shells.
10/23/17 10/25/17
RR / JAL
Matthew Colman P.E.
Laboratory Manager
GZA GeoEnvironmental
Winnapaug Pond Permit/DredgeWesterly, RI
03.0034068.01
Material Description
Atterberg Limits (ASTM D 4318)
Classification
Coefficients
Date Received: Date Tested:
Tested By:
Checked By:
Title:
Date Sampled:Source of Sample: Mar. Sed. Depth: 0-0.8'Sample Number: WPVC-1 / S-1
Client:
Project:
Project No: Figure
Test Results (D6913 & ASTM D 1140)
Opening Percent Spec.* Pass?
Size Finer (Percent) (X=Fail)
PE
RC
EN
T F
INE
R
0
10
20
30
40
50
60
70
80
90
100
GRAIN SIZE - mm.
0.0010.010.1110100
% +3"Coarse
% Gravel
Fine Coarse Medium
% Sand
Fine Silt
% Fines
Clay
0.0 0.0 1.4 0.5 6.6 56.0 35.5
6 in
.
3 in
.
2 in
.
1½
in.
1 in
.
¾ in
.
½ in
.
3/8
in.
#4
#1
0
#2
0
#3
0
#4
0
#6
0
#1
00
#1
40
#2
00
Particle Size Distribution Report
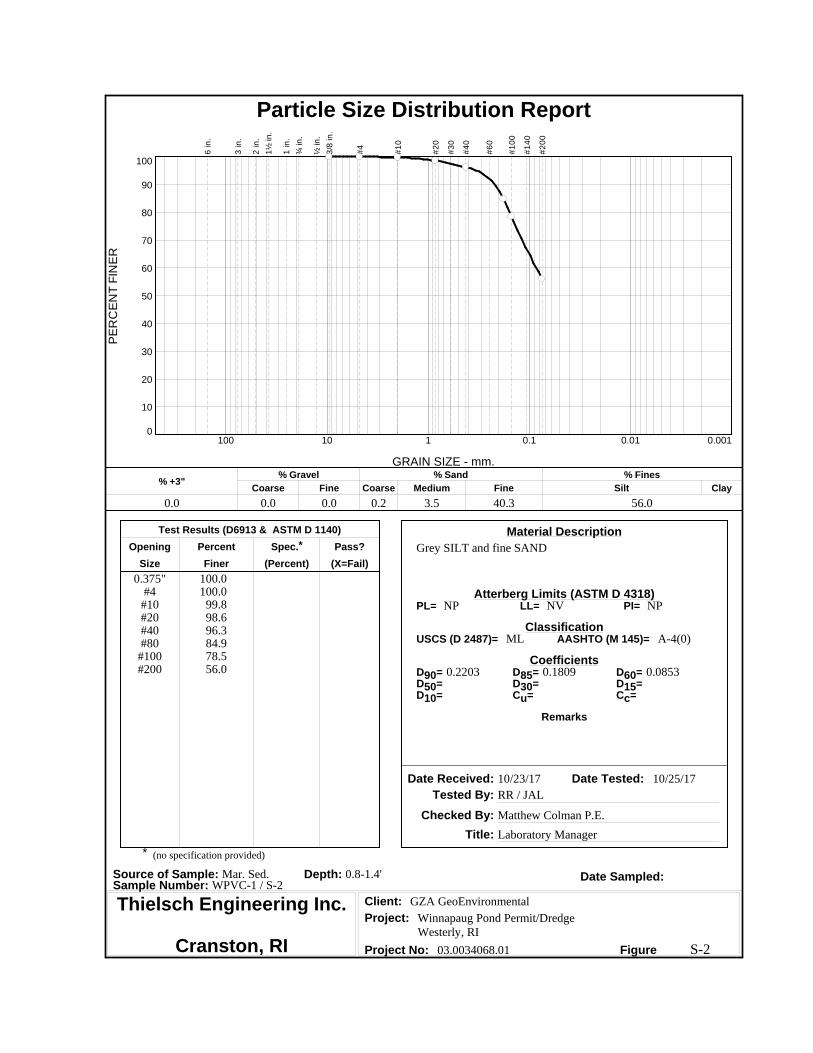
S-2
Thielsch Engineering Inc.
Cranston, RI
(no specification provided)*
PL= LL= PI=
USCS (D 2487)= AASHTO (M 145)=
D90= D85= D60=D50= D30= D15=D10= Cu= Cc=
Remarks
Grey SILT and fine SAND
0.375"#4#10#20#40#80
#100#200
100.0100.0
99.898.696.384.978.556.0
NP NV NP
ML A-4(0)
0.2203 0.1809 0.0853
10/23/17 10/25/17
RR / JAL
Matthew Colman P.E.
Laboratory Manager
GZA GeoEnvironmental
Winnapaug Pond Permit/DredgeWesterly, RI
03.0034068.01
Material Description
Atterberg Limits (ASTM D 4318)
Classification
Coefficients
Date Received: Date Tested:
Tested By:
Checked By:
Title:
Date Sampled:Source of Sample: Mar. Sed. Depth: 0.8-1.4'Sample Number: WPVC-1 / S-2
Client:
Project:
Project No: Figure
Test Results (D6913 & ASTM D 1140)
Opening Percent Spec.* Pass?
Size Finer (Percent) (X=Fail)
PE
RC
EN
T F
INE
R
0
10
20
30
40
50
60
70
80
90
100
GRAIN SIZE - mm.
0.0010.010.1110100
% +3"Coarse
% Gravel
Fine Coarse Medium
% Sand
Fine Silt
% Fines
Clay
0.0 0.0 0.0 0.2 3.5 40.3 56.0
6 in
.
3 in
.
2 in
.
1½
in.
1 in
.
¾ in
.
½ in
.
3/8
in.
#4
#1
0
#2
0
#3
0
#4
0
#6
0
#1
00
#1
40
#2
00
Particle Size Distribution Report

S-3
Thielsch Engineering Inc.
Cranston, RI
(no specification provided)*
PL= LL= PI=
USCS (D 2487)= AASHTO (M 145)=
D90= D85= D60=D50= D30= D15=D10= Cu= Cc=
Remarks
Grey fine SAND, some Silt, trace fine Gravel
0.75"0.5"
0.375"#4#10#20#40#80
#100#200
100.099.699.599.499.195.893.260.753.227.0
NP NV NP
SM A-2-4(0)
0.3713 0.3186 0.17720.1382 0.0813
Sample contained trace roots.
10/23/17 10/25/17
RR / JAL
Matthew Colman P.E.
Laboratory Manager
GZA GeoEnvironmental
Winnapaug Pond Permit/DredgeWesterly, RI
03.0034068.01
Material Description
Atterberg Limits (ASTM D 4318)
Classification
Coefficients
Date Received: Date Tested:
Tested By:
Checked By:
Title:
Date Sampled:Source of Sample: Mar. Sed. Depth: 1.4-2.8'Sample Number: WPVC-1 / S-1
Client:
Project:
Project No: Figure
Test Results (D6913 & ASTM D 1140)
Opening Percent Spec.* Pass?
Size Finer (Percent) (X=Fail)
PE
RC
EN
T F
INE
R
0
10
20
30
40
50
60
70
80
90
100
GRAIN SIZE - mm.
0.0010.010.1110100
% +3"Coarse
% Gravel
Fine Coarse Medium
% Sand
Fine Silt
% Fines
Clay
0.0 0.0 0.6 0.3 5.9 66.2 27.0
6 in
.
3 in
.
2 in
.
1½
in.
1 in
.
¾ in
.
½ in
.
3/8
in.
#4
#1
0
#2
0
#3
0
#4
0
#6
0
#1
00
#1
40
#2
00
Particle Size Distribution Report

S-4
Thielsch Engineering Inc.
Cranston, RI
(no specification provided)*
PL= LL= PI=
USCS (D 2487)= AASHTO (M 145)=
D90= D85= D60=D50= D30= D15=D10= Cu= Cc=
Remarks
Grey fine SAND, trace Silt
#4#10#20#40#80
#100#200
100.099.999.093.138.018.2
2.8
NP NV NP
SP A-3
0.3822 0.3359 0.22600.2022 0.1677 0.13000.1038 2.18 1.20
10/23/17 10/26/17
RR / JAL
Matthew Colman P.E.
Laboratory Manager
GZA GeoEnvironmental
Winnapaug Pond Permit/DredgeWesterly, RI
03.0034068.01
Material Description
Atterberg Limits (ASTM D 4318)
Classification
Coefficients
Date Received: Date Tested:
Tested By:
Checked By:
Title:
Date Sampled:Source of Sample: Mar. Sed. Depth: 0-4.7'Sample Number: WPVC-3 / S-1
Client:
Project:
Project No: Figure
Test Results (D6913 & ASTM D 1140)
Opening Percent Spec.* Pass?
Size Finer (Percent) (X=Fail)
PE
RC
EN
T F
INE
R
0
10
20
30
40
50
60
70
80
90
100
GRAIN SIZE - mm.
0.0010.010.1110100
% +3"Coarse
% Gravel
Fine Coarse Medium
% Sand
Fine Silt
% Fines
Clay
0.0 0.0 0.0 0.1 6.8 90.3 2.8
6 in
.
3 in
.
2 in
.
1½
in.
1 in
.
¾ in
.
½ in
.
3/8
in.
#4
#1
0
#2
0
#3
0
#4
0
#6
0
#1
00
#1
40
#2
00
Particle Size Distribution Report
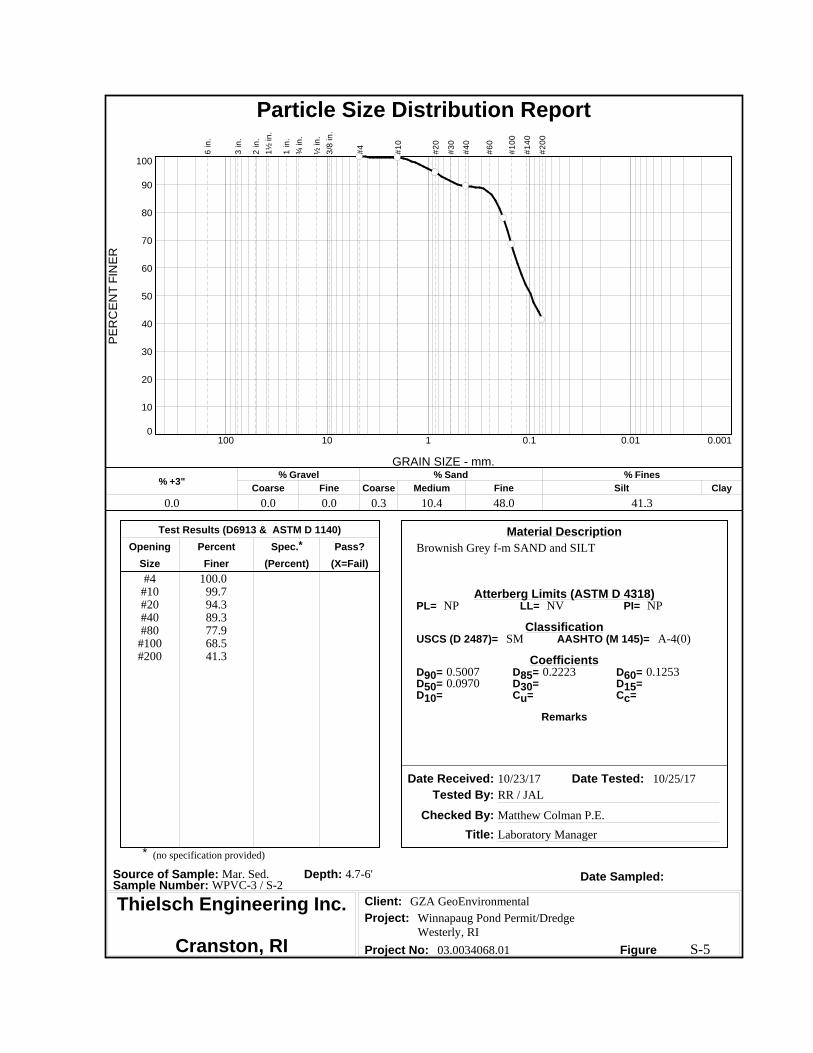
S-5
Thielsch Engineering Inc.
Cranston, RI
(no specification provided)*
PL= LL= PI=
USCS (D 2487)= AASHTO (M 145)=
D90= D85= D60=D50= D30= D15=D10= Cu= Cc=
Remarks
Brownish Grey f-m SAND and SILT
#4#10#20#40#80
#100#200
100.099.794.389.377.968.541.3
NP NV NP
SM A-4(0)
0.5007 0.2223 0.12530.0970
10/23/17 10/25/17
RR / JAL
Matthew Colman P.E.
Laboratory Manager
GZA GeoEnvironmental
Winnapaug Pond Permit/DredgeWesterly, RI
03.0034068.01
Material Description
Atterberg Limits (ASTM D 4318)
Classification
Coefficients
Date Received: Date Tested:
Tested By:
Checked By:
Title:
Date Sampled:Source of Sample: Mar. Sed. Depth: 4.7-6'Sample Number: WPVC-3 / S-2
Client:
Project:
Project No: Figure
Test Results (D6913 & ASTM D 1140)
Opening Percent Spec.* Pass?
Size Finer (Percent) (X=Fail)
PE
RC
EN
T F
INE
R
0
10
20
30
40
50
60
70
80
90
100
GRAIN SIZE - mm.
0.0010.010.1110100
% +3"Coarse
% Gravel
Fine Coarse Medium
% Sand
Fine Silt
% Fines
Clay
0.0 0.0 0.0 0.3 10.4 48.0 41.3
6 in
.
3 in
.
2 in
.
1½
in.
1 in
.
¾ in
.
½ in
.
3/8
in.
#4
#1
0
#2
0
#3
0
#4
0
#6
0
#1
00
#1
40
#2
00
Particle Size Distribution Report

S-6
Thielsch Engineering Inc.
Cranston, RI
(no specification provided)*
PL= LL= PI=
USCS (D 2487)= AASHTO (M 145)=
D90= D85= D60=D50= D30= D15=D10= Cu= Cc=
Remarks
Grey fine SAND, trace Silt, trace fine Gravel
0.5"0.375"
#4#10#20#40#80
#100#200
100.099.999.999.899.697.455.037.7
8.2
NP NV NP
SP-SM A-3
0.3158 0.2794 0.19040.1708 0.1358 0.09940.0818 2.33 1.18
Sample contained trace shells.
10/23/17 10/25/17
RR / JAL
Matthew Colman P.E.
Laboratory Manager
GZA GeoEnvironmental
Winnapaug Pond Permit/DredgeWesterly, RI
03.0034068.01
Material Description
Atterberg Limits (ASTM D 4318)
Classification
Coefficients
Date Received: Date Tested:
Tested By:
Checked By:
Title:
Date Sampled:Source of Sample: Mar. Sed. Depth: 0-1'Sample Number: WPVC-4 / S-1
Client:
Project:
Project No: Figure
Test Results (D6913 & ASTM D 1140)
Opening Percent Spec.* Pass?
Size Finer (Percent) (X=Fail)
PE
RC
EN
T F
INE
R
0
10
20
30
40
50
60
70
80
90
100
GRAIN SIZE - mm.
0.0010.010.1110100
% +3"Coarse
% Gravel
Fine Coarse Medium
% Sand
Fine Silt
% Fines
Clay
0.0 0.0 0.1 0.1 2.4 89.2 8.2
6 in
.
3 in
.
2 in
.
1½
in.
1 in
.
¾ in
.
½ in
.
3/8
in.
#4
#1
0
#2
0
#3
0
#4
0
#6
0
#1
00
#1
40
#2
00
Particle Size Distribution Report

S-7
Thielsch Engineering Inc.
Cranston, RI
(no specification provided)*
PL= LL= PI=
USCS (D 2487)= AASHTO (M 145)=
D90= D85= D60=D50= D30= D15=D10= Cu= Cc=
Remarks
Grey fine SAND, little Silt
0.375"#4#10#20#40#80
#100#200
100.0100.0
99.898.893.048.533.010.8
NP NV NP
SP-SM A-2-4(0)
0.3785 0.3268 0.20810.1832 0.1439 0.1009
Sample contained trace shells.
10/23/17 10/25/17
RR / JAL
Matthew Colman P.E.
Laboratory Manager
GZA GeoEnvironmental
Winnapaug Pond Permit/DredgeWesterly, RI
03.0034068.01
Material Description
Atterberg Limits (ASTM D 4318)
Classification
Coefficients
Date Received: Date Tested:
Tested By:
Checked By:
Title:
Date Sampled:Source of Sample: Mar. Sed. Depth: 1-1.7'Sample Number: WPVC-4 / S-2
Client:
Project:
Project No: Figure
Test Results (D6913 & ASTM D 1140)
Opening Percent Spec.* Pass?
Size Finer (Percent) (X=Fail)
PE
RC
EN
T F
INE
R
0
10
20
30
40
50
60
70
80
90
100
GRAIN SIZE - mm.
0.0010.010.1110100
% +3"Coarse
% Gravel
Fine Coarse Medium
% Sand
Fine Silt
% Fines
Clay
0.0 0.0 0.0 0.2 6.8 82.2 10.8
6 in
.
3 in
.
2 in
.
1½
in.
1 in
.
¾ in
.
½ in
.
3/8
in.
#4
#1
0
#2
0
#3
0
#4
0
#6
0
#1
00
#1
40
#2
00
Particle Size Distribution Report

S-8
Thielsch Engineering Inc.
Cranston, RI
(no specification provided)*
PL= LL= PI=
USCS (D 2487)= AASHTO (M 145)=
D90= D85= D60=D50= D30= D15=D10= Cu= Cc=
Remarks
Grey fine SAND, trace Silt
0.375"#4#10#20#40#80
#100#200
100.0100.0
99.999.899.563.741.5
7.3
NP NV NP
SP-SM A-3
0.2524 0.2300 0.17440.1610 0.1332 0.10280.0864 2.02 1.18
Sample contained trace shells.
10/23/17 10/25/17
RR / JAL
Matthew Colman P.E.
Laboratory Manager
GZA GeoEnvironmental
Winnapaug Pond Permit/DredgeWesterly, RI
03.0034068.01
Material Description
Atterberg Limits (ASTM D 4318)
Classification
Coefficients
Date Received: Date Tested:
Tested By:
Checked By:
Title:
Date Sampled:Source of Sample: Mar. Sed. Depth: 0-1.1'Sample Number: WPVC-4A / S-1
Client:
Project:
Project No: Figure
Test Results (D6913 & ASTM D 1140)
Opening Percent Spec.* Pass?
Size Finer (Percent) (X=Fail)
PE
RC
EN
T F
INE
R
0
10
20
30
40
50
60
70
80
90
100
GRAIN SIZE - mm.
0.0010.010.1110100
% +3"Coarse
% Gravel
Fine Coarse Medium
% Sand
Fine Silt
% Fines
Clay
0.0 0.0 0.0 0.1 0.4 92.2 7.3
6 in
.
3 in
.
2 in
.
1½
in.
1 in
.
¾ in
.
½ in
.
3/8
in.
#4
#1
0
#2
0
#3
0
#4
0
#6
0
#1
00
#1
40
#2
00
Particle Size Distribution Report
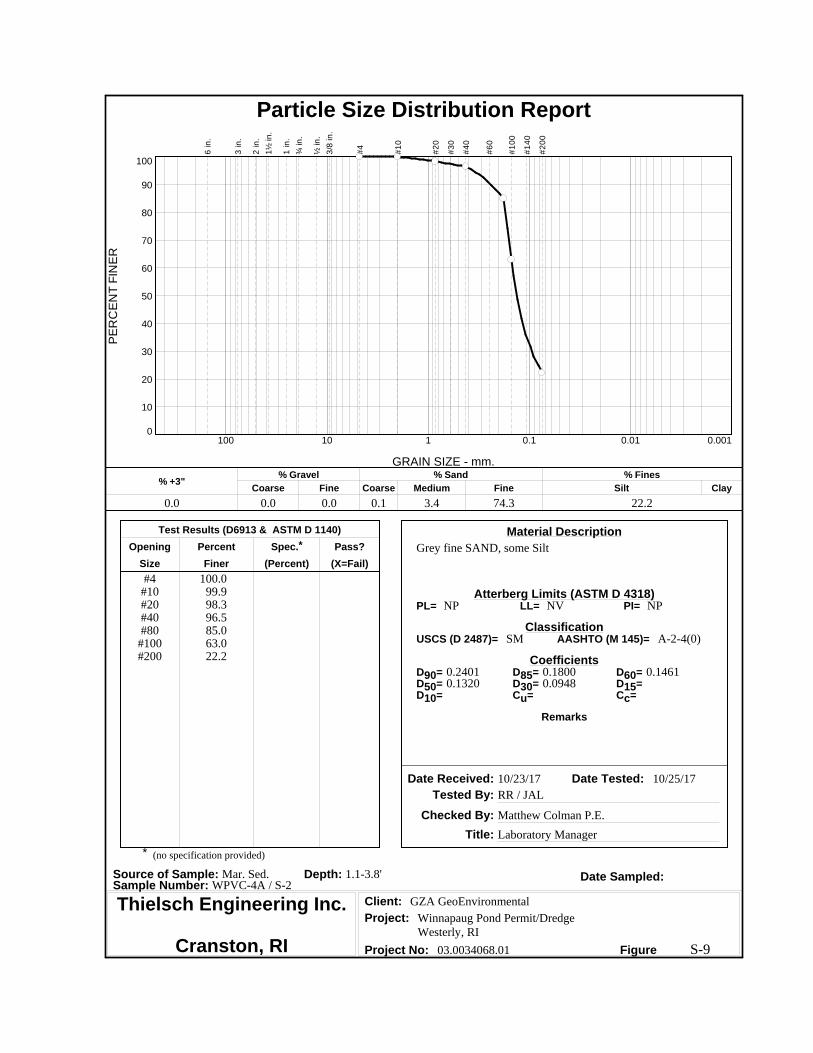
S-9
Thielsch Engineering Inc.
Cranston, RI
(no specification provided)*
PL= LL= PI=
USCS (D 2487)= AASHTO (M 145)=
D90= D85= D60=D50= D30= D15=D10= Cu= Cc=
Remarks
Grey fine SAND, some Silt
#4#10#20#40#80
#100#200
100.099.998.396.585.063.022.2
NP NV NP
SM A-2-4(0)
0.2401 0.1800 0.14610.1320 0.0948
10/23/17 10/25/17
RR / JAL
Matthew Colman P.E.
Laboratory Manager
GZA GeoEnvironmental
Winnapaug Pond Permit/DredgeWesterly, RI
03.0034068.01
Material Description
Atterberg Limits (ASTM D 4318)
Classification
Coefficients
Date Received: Date Tested:
Tested By:
Checked By:
Title:
Date Sampled:Source of Sample: Mar. Sed. Depth: 1.1-3.8'Sample Number: WPVC-4A / S-2
Client:
Project:
Project No: Figure
Test Results (D6913 & ASTM D 1140)
Opening Percent Spec.* Pass?
Size Finer (Percent) (X=Fail)
PE
RC
EN
T F
INE
R
0
10
20
30
40
50
60
70
80
90
100
GRAIN SIZE - mm.
0.0010.010.1110100
% +3"Coarse
% Gravel
Fine Coarse Medium
% Sand
Fine Silt
% Fines
Clay
0.0 0.0 0.0 0.1 3.4 74.3 22.2
6 in
.
3 in
.
2 in
.
1½
in.
1 in
.
¾ in
.
½ in
.
3/8
in.
#4
#1
0
#2
0
#3
0
#4
0
#6
0
#1
00
#1
40
#2
00
Particle Size Distribution Report

S-10
Thielsch Engineering Inc.
Cranston, RI
(no specification provided)*
PL= LL= PI=
USCS (D 2487)= AASHTO (M 145)=
D90= D85= D60=D50= D30= D15=D10= Cu= Cc=
Remarks
Grey fine SAND, trace Silt, trace fine Gravel
0.5"0.375"
#4#10#20#40#80
#100#200
100.099.899.899.899.698.356.936.7
6.0
NP NV NP
SP-SM A-3
0.2905 0.2592 0.18540.1691 0.1395 0.10900.0930 1.99 1.13
10/23/17 10/25/17
RR / JAL
Matthew Colman P.E.
Laboratory Manager
GZA GeoEnvironmental
Winnapaug Pond Permit/DredgeWesterly, RI
03.0034068.01
Material Description
Atterberg Limits (ASTM D 4318)
Classification
Coefficients
Date Received: Date Tested:
Tested By:
Checked By:
Title:
Date Sampled:Source of Sample: Mar. Sed. Depth: 0-2.4'Sample Number: WPVC-4B / S-1
Client:
Project:
Project No: Figure
Test Results (D6913 & ASTM D 1140)
Opening Percent Spec.* Pass?
Size Finer (Percent) (X=Fail)
PE
RC
EN
T F
INE
R
0
10
20
30
40
50
60
70
80
90
100
GRAIN SIZE - mm.
0.0010.010.1110100
% +3"Coarse
% Gravel
Fine Coarse Medium
% Sand
Fine Silt
% Fines
Clay
0.0 0.0 0.2 0.0 1.5 92.3 6.0
6 in
.
3 in
.
2 in
.
1½
in.
1 in
.
¾ in
.
½ in
.
3/8
in.
#4
#1
0
#2
0
#3
0
#4
0
#6
0
#1
00
#1
40
#2
00
Particle Size Distribution Report
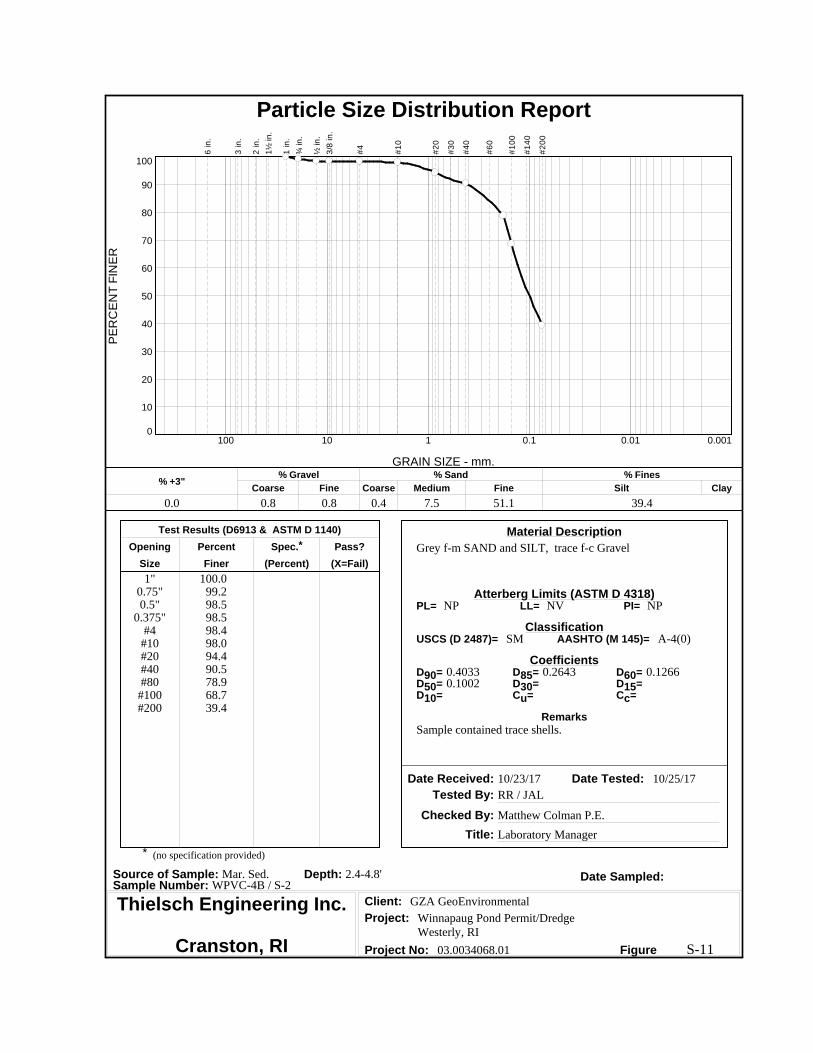
S-11
Thielsch Engineering Inc.
Cranston, RI
(no specification provided)*
PL= LL= PI=
USCS (D 2487)= AASHTO (M 145)=
D90= D85= D60=D50= D30= D15=D10= Cu= Cc=
Remarks
Grey f-m SAND and SILT, trace f-c Gravel
1"0.75"0.5"
0.375"#4#10#20#40#80
#100#200
100.099.298.598.598.498.094.490.578.968.739.4
NP NV NP
SM A-4(0)
0.4033 0.2643 0.12660.1002
Sample contained trace shells.
10/23/17 10/25/17
RR / JAL
Matthew Colman P.E.
Laboratory Manager
GZA GeoEnvironmental
Winnapaug Pond Permit/DredgeWesterly, RI
03.0034068.01
Material Description
Atterberg Limits (ASTM D 4318)
Classification
Coefficients
Date Received: Date Tested:
Tested By:
Checked By:
Title:
Date Sampled:Source of Sample: Mar. Sed. Depth: 2.4-4.8'Sample Number: WPVC-4B / S-2
Client:
Project:
Project No: Figure
Test Results (D6913 & ASTM D 1140)
Opening Percent Spec.* Pass?
Size Finer (Percent) (X=Fail)
PE
RC
EN
T F
INE
R
0
10
20
30
40
50
60
70
80
90
100
GRAIN SIZE - mm.
0.0010.010.1110100
% +3"Coarse
% Gravel
Fine Coarse Medium
% Sand
Fine Silt
% Fines
Clay
0.0 0.8 0.8 0.4 7.5 51.1 39.4
6 in
.
3 in
.
2 in
.
1½
in.
1 in
.
¾ in
.
½ in
.
3/8
in.
#4
#1
0
#2
0
#3
0
#4
0
#6
0
#1
00
#1
40
#2
00
Particle Size Distribution Report

S-12
Thielsch Engineering Inc.
Cranston, RI
(no specification provided)*
PL= LL= PI=
USCS (D 2487)= AASHTO (M 145)=
D90= D85= D60=D50= D30= D15=D10= Cu= Cc=
Remarks
Grey fine SAND, trace Silt
#4#10#20#40#80
#100#200
100.0100.0
99.997.617.5
7.71.3
NP NV NP
SP A-3
0.3788 0.3565 0.27820.2539 0.2092 0.17340.1583 1.76 0.99
10/23/17 10/25/17
RR / JAL
Matthew Colman P.E.
Laboratory Manager
GZA GeoEnvironmental
Winnapaug Pond Permit/DredgeWesterly, RI
03.0034068.01
Material Description
Atterberg Limits (ASTM D 4318)
Classification
Coefficients
Date Received: Date Tested:
Tested By:
Checked By:
Title:
Date Sampled:Source of Sample: Mar. Sed. Depth: 0-2'Sample Number: WPVC-9A / S-1
Client:
Project:
Project No: Figure
Test Results (D6913 & ASTM D 1140)
Opening Percent Spec.* Pass?
Size Finer (Percent) (X=Fail)
PE
RC
EN
T F
INE
R
0
10
20
30
40
50
60
70
80
90
100
GRAIN SIZE - mm.
0.0010.010.1110100
% +3"Coarse
% Gravel
Fine Coarse Medium
% Sand
Fine Silt
% Fines
Clay
0.0 0.0 0.0 0.0 2.4 96.3 1.3
6 in
.
3 in
.
2 in
.
1½
in.
1 in
.
¾ in
.
½ in
.
3/8
in.
#4
#1
0
#2
0
#3
0
#4
0
#6
0
#1
00
#1
40
#2
00
Particle Size Distribution Report
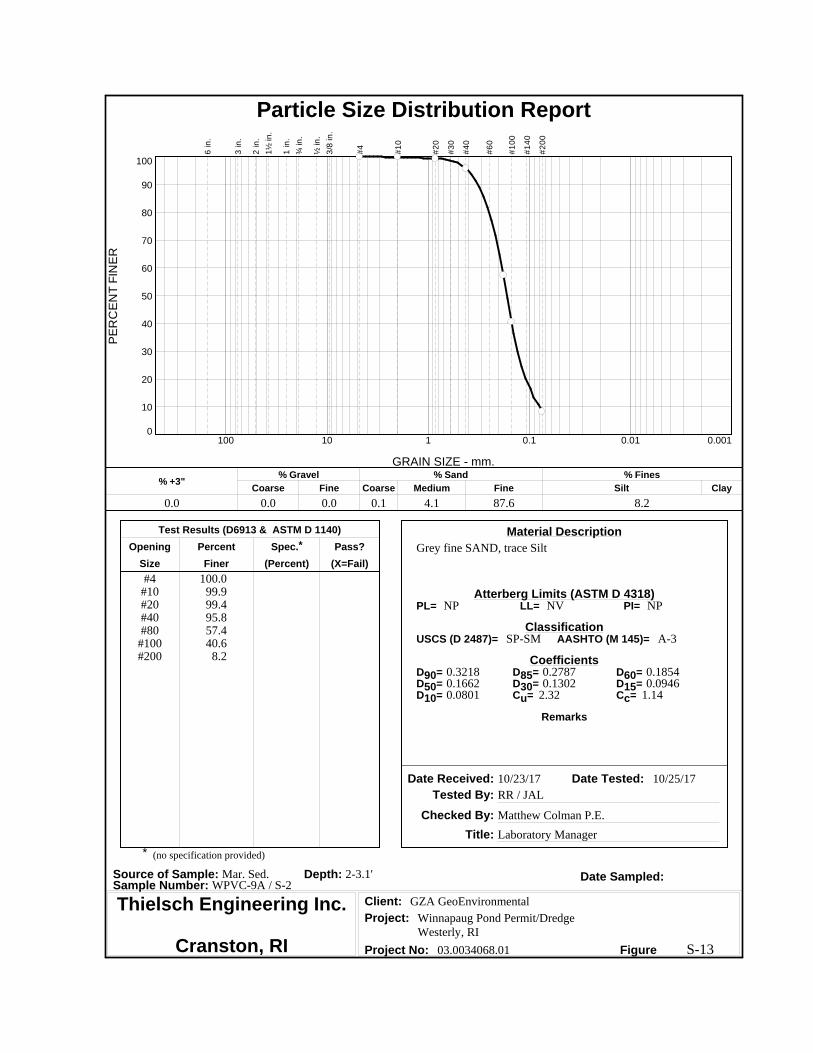
S-13
Thielsch Engineering Inc.
Cranston, RI
(no specification provided)*
PL= LL= PI=
USCS (D 2487)= AASHTO (M 145)=
D90= D85= D60=D50= D30= D15=D10= Cu= Cc=
Remarks
Grey fine SAND, trace Silt
#4#10#20#40#80
#100#200
100.099.999.495.857.440.6
8.2
NP NV NP
SP-SM A-3
0.3218 0.2787 0.18540.1662 0.1302 0.09460.0801 2.32 1.14
10/23/17 10/25/17
RR / JAL
Matthew Colman P.E.
Laboratory Manager
GZA GeoEnvironmental
Winnapaug Pond Permit/DredgeWesterly, RI
03.0034068.01
Material Description
Atterberg Limits (ASTM D 4318)
Classification
Coefficients
Date Received: Date Tested:
Tested By:
Checked By:
Title:
Date Sampled:Source of Sample: Mar. Sed. Depth: 2-3.1'Sample Number: WPVC-9A / S-2
Client:
Project:
Project No: Figure
Test Results (D6913 & ASTM D 1140)
Opening Percent Spec.* Pass?
Size Finer (Percent) (X=Fail)
PE
RC
EN
T F
INE
R
0
10
20
30
40
50
60
70
80
90
100
GRAIN SIZE - mm.
0.0010.010.1110100
% +3"Coarse
% Gravel
Fine Coarse Medium
% Sand
Fine Silt
% Fines
Clay
0.0 0.0 0.0 0.1 4.1 87.6 8.2
6 in
.
3 in
.
2 in
.
1½
in.
1 in
.
¾ in
.
½ in
.
3/8
in.
#4
#1
0
#2
0
#3
0
#4
0
#6
0
#1
00
#1
40
#2
00
Particle Size Distribution Report
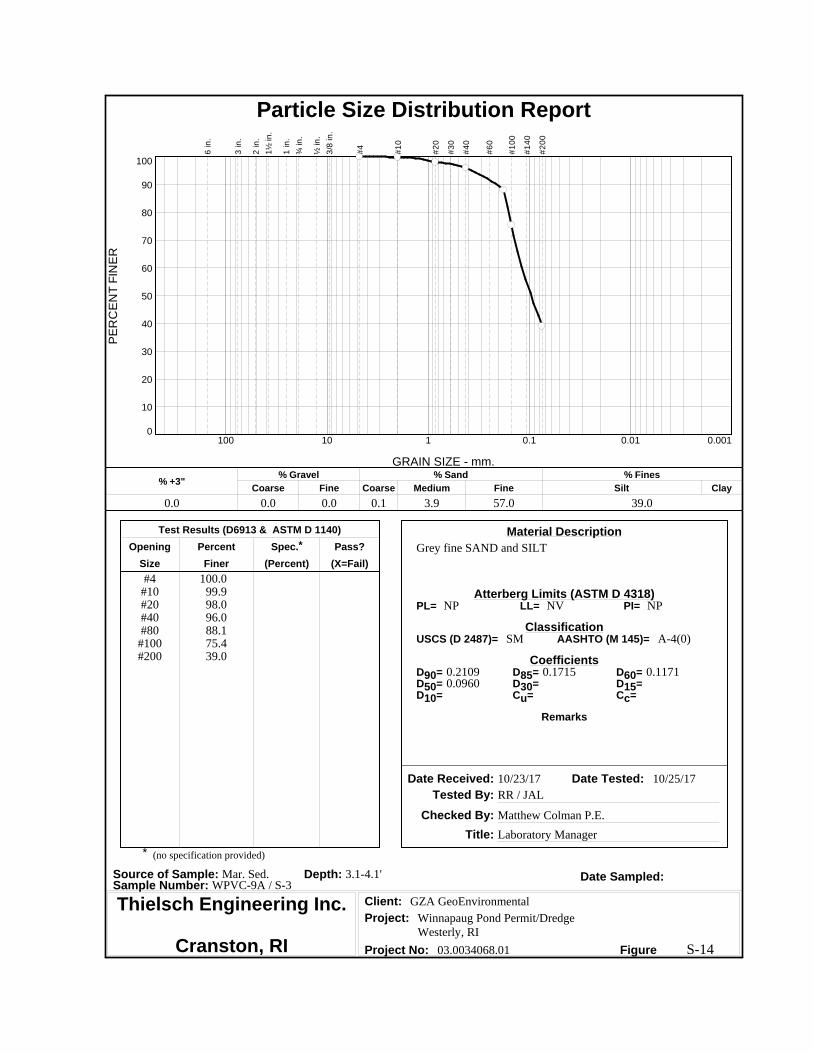
S-14
Thielsch Engineering Inc.
Cranston, RI
(no specification provided)*
PL= LL= PI=
USCS (D 2487)= AASHTO (M 145)=
D90= D85= D60=D50= D30= D15=D10= Cu= Cc=
Remarks
Grey fine SAND and SILT
#4#10#20#40#80
#100#200
100.099.998.096.088.175.439.0
NP NV NP
SM A-4(0)
0.2109 0.1715 0.11710.0960
10/23/17 10/25/17
RR / JAL
Matthew Colman P.E.
Laboratory Manager
GZA GeoEnvironmental
Winnapaug Pond Permit/DredgeWesterly, RI
03.0034068.01
Material Description
Atterberg Limits (ASTM D 4318)
Classification
Coefficients
Date Received: Date Tested:
Tested By:
Checked By:
Title:
Date Sampled:Source of Sample: Mar. Sed. Depth: 3.1-4.1'Sample Number: WPVC-9A / S-3
Client:
Project:
Project No: Figure
Test Results (D6913 & ASTM D 1140)
Opening Percent Spec.* Pass?
Size Finer (Percent) (X=Fail)
PE
RC
EN
T F
INE
R
0
10
20
30
40
50
60
70
80
90
100
GRAIN SIZE - mm.
0.0010.010.1110100
% +3"Coarse
% Gravel
Fine Coarse Medium
% Sand
Fine Silt
% Fines
Clay
0.0 0.0 0.0 0.1 3.9 57.0 39.0
6 in
.
3 in
.
2 in
.
1½
in.
1 in
.
¾ in
.
½ in
.
3/8
in.
#4
#1
0
#2
0
#3
0
#4
0
#6
0
#1
00
#1
40
#2
00
Particle Size Distribution Report