Laboratory assessment of the effect of cattle slurry pre-treatment on organic N degradation after...
14
RESEARCH ARTICLE Laboratory assessment of the effect of cattle slurry pre-treatment on organic N degradation after soil application and N 2 O and N 2 emissions David Fangueiro Æ Jose ´ Pereira Æ David Chadwick Æ Joa ˜o Coutinho Æ Nuno Moreira Æ Henrique Trindade Received: 19 December 2006 / Accepted: 9 July 2007 / Published online: 27 July 2007 Ó Springer Science+Business Media B.V. 2007 Abstract Slurry separation using mechanical and chemical methods is one of the options considered to solve problems of slurry management at the farm scale. The fractions obtained with such treatments have distinct compositions, which allow different options for their utilization (composting, direct application, and fertigation). In this study, four fractions of slurry were obtained using a combined treatment system including slurry treatment with a screw press separator (solid and liquid fractions) followed by sedimentation with the addition of Polyacrylamide (PAM) (PAM-Supernatant and PAM-Sediment) to the LF. These fractions were then incorporated into arable soil under controlled labora- tory conditions and the organic N degradation from each treatment was followed for 94 days. Total N emissions (N 2 O+N 2 ) as well as the sources of the N emissions (nitrification or denitrification) were also studied during this period. Results showed that the slurry fractions (SFs) had distinct behavior relative to the whole slurry (WS), namely in terms of N degradation in soil, where N mineralization was observed only in the WS treatment whereas N immobilization occurred in the other treatments. In terms of N 2 O emissions, higher losses, expressed as a percentage of the total N added, occurred from the LF treatments (liquid, PAM-Supernatant and PAM-Sediment). This work indicates that the slurry treatment by mechanical and chemical separation may be a good option for slurry management at the farm scale since it allows greater utilization of the different fractions with a small effect on N 2 O emissions after SFs’ application to soil. Keywords Dairy-cattle slurry N immobilization N mineralization N 2 O emissions Polyacrylamide Slurry treatment Slurry separation Introduction In intensive dairy farming systems large quantities of dairy-cattle slurry are produced representing a major challenge for their effective management and protec- tion of the environment. At the farm scale, slurry storage is required to optimize spreading timings, but D. Fangueiro (&) J. Coutinho N. Moreira H. Trindade CECEA, Department of Plant Science and Agricultural Engineering, Universidade de Tra ´s-os-Montes e Alto Douro, Apartado 1013, 5001-801 Vila Real, Portugal e-mail: [email protected] J. Pereira Department of Animal Sciences and Agricultural Engineering, Escola Superior Agra ´ria de Viseu, Quinta da Alagoa, 3500-606 Viseu, Portugal D. Chadwick Institute of Grassland and Environmental Research, North Wyke Research Station, Okehampton, Devon EX20 2SB, UK 123 Nutr Cycl Agroecosyst (2008) 80:107–120 DOI 10.1007/s10705-007-9124-4
-
Upload
independent -
Category
Documents
-
view
1 -
download
0
Transcript of Laboratory assessment of the effect of cattle slurry pre-treatment on organic N degradation after...

RESEARCH ARTICLE
Laboratory assessment of the effect of cattle slurrypre-treatment on organic N degradation after soilapplication and N2O and N2 emissions
David Fangueiro Æ Jose Pereira Æ David Chadwick ÆJoao Coutinho Æ Nuno Moreira Æ Henrique Trindade
Received: 19 December 2006 / Accepted: 9 July 2007 / Published online: 27 July 2007
� Springer Science+Business Media B.V. 2007
Abstract Slurry separation using mechanical and
chemical methods is one of the options considered to
solve problems of slurry management at the farm
scale. The fractions obtained with such treatments
have distinct compositions, which allow different
options for their utilization (composting, direct
application, and fertigation). In this study, four
fractions of slurry were obtained using a combined
treatment system including slurry treatment with a
screw press separator (solid and liquid fractions)
followed by sedimentation with the addition of
Polyacrylamide (PAM) (PAM-Supernatant and
PAM-Sediment) to the LF. These fractions were then
incorporated into arable soil under controlled labora-
tory conditions and the organic N degradation from
each treatment was followed for 94 days. Total N
emissions (N2O + N2) as well as the sources of the N
emissions (nitrification or denitrification) were also
studied during this period.
Results showed that the slurry fractions (SFs) had
distinct behavior relative to the whole slurry (WS),
namely in terms of N degradation in soil, where
N mineralization was observed only in the WS
treatment whereas N immobilization occurred in the
other treatments. In terms of N2O emissions, higher
losses, expressed as a percentage of the total N
added, occurred from the LF treatments (liquid,
PAM-Supernatant and PAM-Sediment).
This work indicates that the slurry treatment by
mechanical and chemical separation may be a good
option for slurry management at the farm scale since
it allows greater utilization of the different fractions
with a small effect on N2O emissions after SFs’
application to soil.
Keywords Dairy-cattle slurry � N immobilization �N mineralization � N2O emissions � Polyacrylamide �Slurry treatment � Slurry separation
Introduction
In intensive dairy farming systems large quantities of
dairy-cattle slurry are produced representing a major
challenge for their effective management and protec-
tion of the environment. At the farm scale, slurry
storage is required to optimize spreading timings, but
D. Fangueiro (&) � J. Coutinho � N. Moreira �H. Trindade
CECEA, Department of Plant Science and Agricultural
Engineering, Universidade de Tras-os-Montes e Alto
Douro, Apartado 1013, 5001-801 Vila Real, Portugal
e-mail: [email protected]
J. Pereira
Department of Animal Sciences and Agricultural
Engineering, Escola Superior Agraria de Viseu,
Quinta da Alagoa, 3500-606 Viseu, Portugal
D. Chadwick
Institute of Grassland and Environmental Research,
North Wyke Research Station, Okehampton,
Devon EX20 2SB, UK
123
Nutr Cycl Agroecosyst (2008) 80:107–120
DOI 10.1007/s10705-007-9124-4

this requires significant investment. Effective slurry
spreading can also be expensive and time consuming.
Although slurry applied to soil is a valuable source of
nutrients to crops, it may also lead to water and air
pollution due to high N losses by nitrate leaching or
ammonia (NH3) and nitrous oxide (N2O) emissions.
Nitrous oxide is one of the major greenhouse gases
contributing to global warming and is also considered
as a stratospheric ozone destroyer (Davidson 1991).
As a consequence, management practices have been
developed for the treatment of slurry (prior to land
application) in order to improve plant use efficiency
of slurry nutrients and reduce losses. High emissions
of N2O were observed in the few days following the
application of animal slurries to the soil (Clemens
and Huschka 2001). These N emissions are originated
mainly by the nitrification and denitrification pro-
cesses, which are stimulated after slurry application
to soils due to high concentrations of NH4+ and readily
available organic C (Granli and Bockman 1994; Ellis
et al. 1998). Large amounts of N are also lost via
dinitrogen (N2) emissions to the atmosphere after
slurry application to soil. However, N2 is a neutral
gas with no effect for the environment.
Strategies to reduce N losses after slurry applica-
tion include slurry treatment by physical and chem-
ical methods that result in fractions with different
physical and chemical characteristics that increase
the options for dairy slurry management. A single
treatment using a screw press separator results in a
solid fraction (SF) and a liquid fraction (LF) and
removes a considerable part of solids and nutrients
from the LF and, consequently, a reduction of ca.
20% of the slurry storage requirement (MAFF 1991;
Burton and Turner 2003). However, the nutrient
concentrations as well as the amounts of solids in the
LF obtained by screw press separation are still
considerable, making the direct utilization of this
fraction for fertigation difficult to manage.
Four different fractions may be obtained when the
mechanical separation is combined with a sediment
settling treatment. Indeed, the LF obtained by sepa-
ration of solids using a mechanical separator can be
treated with a flocculating agent such as polyacryl-
amide (PAM) or bentonite in order to produce two
fractions by chemically enhanced settling. The low
concentration of solids and nutrients in the superna-
tant fraction obtained presents advantages in terms of
handling, odors, required storage volume, partial or
total waste treatment, land application and fertigation
(Burton and Turner 2003).
In contrast to the mineral N content, which is
immediately available to plants, the release of N from
organic forms contained in slurry depends on the
mineralization process (Beauchamp 1986). Quantifi-
cation of organic N mineralization from slurry in
intensive dairy farms is an important step to improve
the N use efficiency and to reduce losses to the
environment. It may be hypothesized that the differ-
ent fractions of slurry obtained after separation have
distinct C:N ratios, considering that large particles are
dominated by relatively intact plant material whereas
smaller particles sizes consist of partially digested
plant and microbially processed material. Since the
C:N ratio is commonly used as a parameter to predict
the mineralization rate of organic materials, it is
expected that each fraction may display a specific
mineralization rate (Haynes 1986).
The aim of the present work was to evaluate the
organic N degradation kinetics after addition of
different fractions of dairy-cattle slurry applied to
arable soils and the N emissions (N2O and N2) arising
from nitrification and denitrification.
Materials and methods
Soil and dairy slurry treatment
The soil used was collected in NW Portugal (Vila do
Conde) from the upper 20 cm arable layer during the
period of maize cropping. The selected soil was
characteristic of the main soil type of the region with
a sandy loam texture (27% coarse sand, 45% fine
sand, 21% silt and 6% clay) and classified as a
Dystric Cambisol. The soil was sieved through a
2 mm sieve, homogenized and then stored at 4�C
until required. The main physico-chemical properties
of the soil were then determined.
Cattle-slurry was obtained from a concrete tank on
an intensive dairy farm where cows were fed mainly
with maize silage and concentrate feeds. In order to
obtain the different SFs, the whole slurry (WS) was
first subjected to a mechanical separation with a
screw press separator (FAN model S650,
PAC2505009) generating a solid and a LF. Then
the LF was subjected to chemically enhanced settling
for 20 h after addition of 200 mg l�1 (0.02%) of a
108 Nutr Cycl Agroecosyst (2008) 80:107–120
123
flocculating agent, the cationic polyacrylamide
(PAM) (VTA F 941) (Vanotti et al. 2002a). This
chemical treatment resulted in two more fractions: a
supernatant and a sediment fraction. Representative
samples of the WS and the different fractions were
collected and sub-samples were frozen before anal-
ysis. The cattle slurry used in the present work was
representative of the slurry produced in the intensive
dairy farms of North West Portugal since it has
characteristics very close to those observed in this
region (Trindade 1997; Trindade et al. 2002).
The efficiency of the separation processes was
estimated using the percentage of removal calculated
as followed: percentage removal = [(inlet concentra-
tion�outlet concentration)/inlet concentration] · 100
(Vanotti and Hunt 1999; Vanotti et al. 2002a).
To estimate the influence of the slurry treatment by
separation on the N losses by gas emissions, N losses
from the WS were compared with the sum of losses
observed from each SF. Assuming that the N losses
from each slurry faction are not C limited, the sum of
losses was calculated taking into account the propor-
tion of each fraction relative to the WS and using the
following formulae:
NLT ¼ ðNL1 � Q1Þ þ ðNL2 � Q2Þ þ � � � þ ðNLn � QnÞð1Þ
with NLT, sum of N losses from the individual
fractions; NLn, N losses observed from fraction n; Qn,
proportion of fraction n relatively to the WS (%).
Aerobic incubation experiment
An aerobic laboratory incubation of soil/slurry
(treated and untreated) mixtures was performed over
94 days in PVC boxes ([ = 24 cm, h = 20 cm)
allowing a 18 cm depth soil, at controlled tempera-
ture (20�C). This temperature was chosen because it
offered optimal conditions for potential N minerali-
zation and N emissions (Bateman and Baggs 2005).
There were five replicates of each of the following
treatments: control (no slurry), WS, SF, LF, sediment
fraction with PAM (PAM-Sed) and supernatant
fraction with PAM (PAM-Sup). The volume of
effluent applied in each treatment was the equivalent
rate of 32 t ha�1 of effluent. The soil/slurry mixture
was homogenized and the water-filled pore space
(WFPS) was adjusted to 60% in order to promote
N-mineralization as well as N2O emissions originat-
ing from nitrification and denitrification processes
(Merino et al. 2001). A WFPS around 60% favours
nitrification because the diffusion of substrates and
O2 is not restricted (Parton et al. 1996). The mixture
soil/slurry was packed at a bulk density close to 1.0
similar to field conditions and the PVC boxes were
daily aerated during the incubation period. In addi-
tion, the soil water content and the temperature used
here were similar to the conditions observed when
slurry is applied to soil in the intensive dairy systems
of the northwest region of Portugal.
Total N2O measurements and emissions source
Independent incubations were also performed in
order to determine total N2O emissions and identify
the source of these emissions (nitrification or
denitrification). Three sub samples (200 g each) of
each replicate from each treatment were trans-
ferred to three hermetically sealable PVC boxes
(14 · 19 · 8 cm) with two septa fitted to the lid and
each soil/effluent mixture was exposed to 0, 0.01 or
2% acetylene (C2H2) atmospheres (injected thought
the septa). Incubation under the three acetylene
concentrations leads to the identification of the
source of the N2O losses (Mosier and Klemedtsson
1994; Merino et al. 2001).
The first step in autotrophic nitrification, mediated
by ammonium oxidase, can be inhibited by using
acetylene at low pressure (0.01–0.1%) (Mosier and
Klemedtsson 1994); thus, N2O produced by incubation
with acetylene at low pressure originates from deni-
trification and heterotrophic nitrification. The produc-
tion of N2O by autotrophic nitrification can be
estimated by the difference between N2O production
in the incubations without acetylene and with low-
pressure acetylene. Thereafter, in this work autotroph-
ic nitrification will be referred using the term
nitrification. On the other hand, N2O reduction to N2,
last step in the denitrification process, can be blocked
by acetylene at high pressure (1–10%) (Merino et al.
2001). Rates of total denitrification (N2O + N2) can be
measured as the amount of N2O produced in soil
incubated under high-pressure acetylene (Merino et al.
2001). The production of N2 by denitrification can be
estimated by the difference between N2O production
in the incubations with high-pressure acetylene and
with low-pressure acetylene. The incubation with no
Nutr Cycl Agroecosyst (2008) 80:107–120 109
123

acetylene allows determining the N2O production from
nitrification and denitrification processes. Previous
incubation studies (unpublished data) were performed
with the same soil and slurry with similar composition
using different acetylene concentrations in order to
check if the acetylene levels used are sufficient to
completely inhibit nitrification (0.01%) and reduction
of N2O to N2 (2%).
All boxes were incubated under the same con-
trolled environmental conditions used for the main
incubation experiment and 10 ml gas samples were
taken from each box after 30 min (T0) and 20 h (T1)
of C2H2 addition and stored in 10 ml vials (Vacu-
tainer1) prior to analysis. Nitrous oxide fluxes were
measured on days 1, 2, 4, 5, 9, 13, 16, 22, 35, 49, 73,
and 94. Nitrous oxide concentrations were measured
using a gas chromatograph (DANI1 86.10) equipped
with an electron capture 63Ni detector (ECD). Emis-
sions rates were calculated from the difference
between N2O concentrations at time T1 and T0.
Cumulative N2O losses were calculated assuming a
mean flux rate between sampling dates as described
by Mosier and Klemedtsson (1994).
It was assumed that any ammonia emission was
prevented by mixing the slurry or the fractions with
the soil. Therefore, ammonia emissions were not
measured.
Soil mineral N measurements
On the same days as N2O measurements, the N
mineral content was measured for each treatment in
order to assess the mineralization/immobilization
rates. For this, 15 g of the soil/slurry mixture were
removed from boxes containing no acetylene and
shaken with 30 ml 2 M KCl for 1 h. The suspension
was then centrifuged for 10 min at 3,000 rpm and the
supernatant analyzed for NH4+ and NO3
� content by
automated segmented-flow spectrophotometric meth-
ods (Houba et al. 1994). The remaining soil was used
to determine soil moisture content after drying at
105�C for 24 h.
Statistical analysis
Results were analyzed by analysis of variance
(ANOVA) to test the effects of slurry treatment and
time. To determine the statistical significance of the
mean differences, least significant difference (LSD)
tests were carried out based on a t-test. The statistical
software package used was Statistix 7.0 (Analytical
Software—User Manual 2000).
Results
Slurry fraction characteristics and efficiency of
separation technologies
The slurry pre-treatments using a screw press sepa-
rator resulted in a solid and a LF in the proportions of
20% and 80% by mass, respectively. The subsequent
treatment of the LF by sedimentation after addition of
the PAM resulted in two more fractions, PAM-Sup
(42.4% by mass) and PAM-Sed (57.6% by mass).
Figure 1 illustrates the fractionation scheme and
gives the relative proportions of each fraction relative
to an initial slurry quantity of 100 kg.
The four SFs were distinct in terms of nutrients
and solids contents. As can be seen in Table 1, the
solid fraction was very different from the others and
characterized by a high dry matter content as well as
a high total C, N, and P content. The liquid and PAM-
Sed fractions had similar compositions whereas the
PAM-Sup fraction had a very low dry matter and a
low total C, N, and P content. The PAM-Sed fraction
Screw press separator
Addition of PAM
Whole slurry 100 kg
Solid Fraction 20 kg Liquid Fraction 80 kg
PAM-Sup 33.9 kg PAM-Sed 46.1 kg
Fig. 1 Yields of the slurry
fractionation scheme used
in the present work
110 Nutr Cycl Agroecosyst (2008) 80:107–120
123

had lower values of total C and dry matter than was
expected since this fraction should be more concen-
trated than the original LF. The water soluble C
represents more than 50% of the total carbon in the
liquid and PAM-Sed fraction with a maximum value
of 98% in the PAM-Sup fraction whereas only 6%
and 22% of total carbon is water soluble in the solid
fraction and untreated slurry, respectively. It is worth
noting that the total K content did not vary very much
between fractions and that the lowest K concentration
was found in the solid fraction.
The results of nutrients and solids separation
efficiency obtained with the treatment technologies
are shown in Table 2. The screw press separator was
efficient at separating solid matter but also organic N
as well as total and water soluble P, while the
addition of PAM allowed the efficient separation of
all the nutrients except K and water soluble C. The
screw press separator removed 50% of the dry matter
from the WS, whereas the application of PAM to the
LF resulted in an additional removal of 42% of dry
matter. The PAM treatment removed a significant
amount of water soluble P.
In the case of total K, it appears that its concen-
tration in the LF was higher than in the WS but this
difference was lower than 5% so it can be assumed
that there is no K removal from the LF by slurry
screw press separation. For water soluble C, the
separated fractions obtained after treatment (liquid
and PAM-Sup) had higher concentrations than the
Table 1 Characteristics of the effluent used in the present work (data expressed on a fresh weight basis)
WS SF� LF� PAM-Sed fraction PAM-Sup fraction
Total C (g kg�1) 26.84 81.94 12.37 11.30 7.00
Total N (g kg�1) 4.00 4.86 3.75 4.01 2.24
C:N 7 17 3 3 3
Total P (g kg�1) 0.40 0.58 0.34 0.45 0.19
Total K (g kg�1) 2.39 2.33 2.50 2.29 2.56
Organic N (g kg�1) 2.78 3.85 2.48 2.73 1.10
NH4+–N (g kg�1) 1.22 1.01 1.27 1.28 1.14
NO3�–N (g kg�1) <1 <1 <1 <1 <1
Water-soluble P (mg kg�1) 63 78 51 55 15
Water-soluble C (g kg�1) 5.94 5.13 6.72 6.69 6.90
Water-soluble C:total C 0.22 0.06 0.54 0.59 0.98
Dry matter (g kg�1) 86.0 248.1 43.3 37.8 25.2
PH 8.1 8.1 7.8 7.3 8.2
� Fractions of the whole slurry obtained after mechanical separation
Table 2 Separation efficiency percentage of nutrients and solids by the mechanical and chemical treatments applied
Parameters Screw press
(LF/WS) (%)
PAM treatment
(PAM-Sup/LF) (%)
Screw press + PAM treatment
(PAM-Sup/WS) (%)
Total N �6 �40 �44
Organic N �11 �56 �60
Total C �54 �43 �74
Water soluble C +13 +3 +16
Total P �15 �44 �52
Water soluble P �19 �71 �76
Total K +5 �2 �7
NH4+–N +4 �10 �6
Dry matter (%) �50 �42 �71
Nutr Cycl Agroecosyst (2008) 80:107–120 111
123
non separated material due to the lower dry matter
content of these fractions (less than 50% in the LF
and less than 42 % in the PAM-Sup fraction).
Soil mineral N concentration
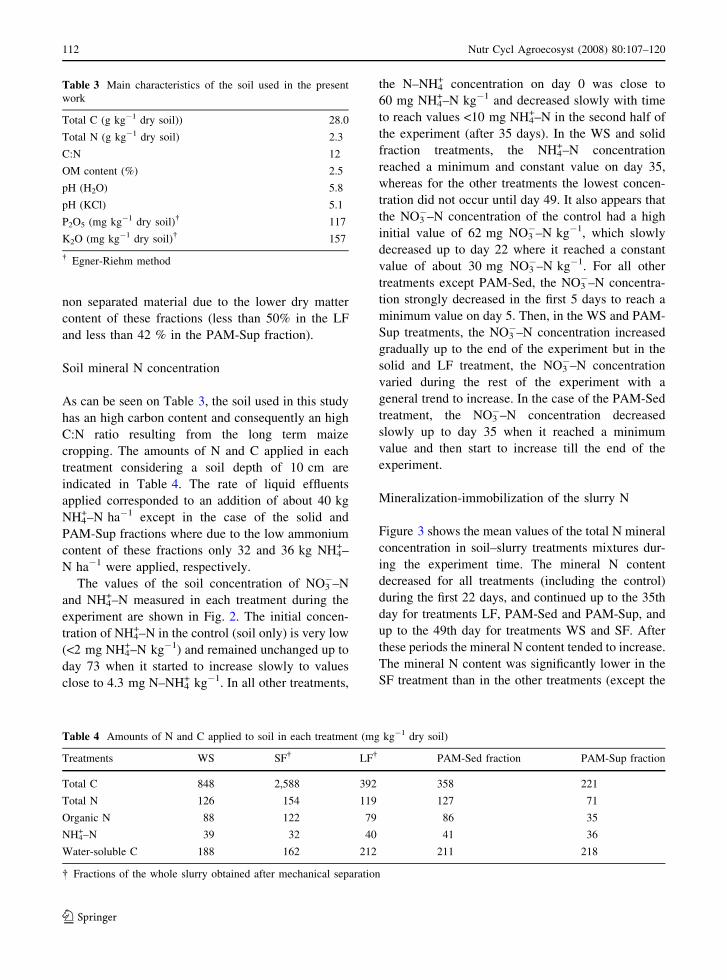
As can be seen on Table 3, the soil used in this study
has an high carbon content and consequently an high
C:N ratio resulting from the long term maize
cropping. The amounts of N and C applied in each
treatment considering a soil depth of 10 cm are
indicated in Table 4. The rate of liquid effluents
applied corresponded to an addition of about 40 kg
NH4+–N ha�1 except in the case of the solid and
PAM-Sup fractions where due to the low ammonium
content of these fractions only 32 and 36 kg NH4+–
N ha�1 were applied, respectively.
The values of the soil concentration of NO3�–N
and NH4+–N measured in each treatment during the
experiment are shown in Fig. 2. The initial concen-
tration of NH4+–N in the control (soil only) is very low
(<2 mg NH4+–N kg�1) and remained unchanged up to
day 73 when it started to increase slowly to values
close to 4.3 mg N–NH4+ kg�1. In all other treatments,
the N–NH4+ concentration on day 0 was close to
60 mg NH4+–N kg�1 and decreased slowly with time
to reach values <10 mg NH4+–N in the second half of
the experiment (after 35 days). In the WS and solid
fraction treatments, the NH4+–N concentration
reached a minimum and constant value on day 35,
whereas for the other treatments the lowest concen-
tration did not occur until day 49. It also appears that
the NO3�–N concentration of the control had a high
initial value of 62 mg NO3�–N kg�1, which slowly
decreased up to day 22 where it reached a constant
value of about 30 mg NO3�–N kg�1. For all other
treatments except PAM-Sed, the NO3�–N concentra-
tion strongly decreased in the first 5 days to reach a
minimum value on day 5. Then, in the WS and PAM-
Sup treatments, the NO3�–N concentration increased
gradually up to the end of the experiment but in the
solid and LF treatment, the NO3�–N concentration
varied during the rest of the experiment with a
general trend to increase. In the case of the PAM-Sed
treatment, the NO3�–N concentration decreased
slowly up to day 35 when it reached a minimum
value and then start to increase till the end of the
experiment.
Mineralization-immobilization of the slurry N
Figure 3 shows the mean values of the total N mineral
concentration in soil–slurry treatments mixtures dur-
ing the experiment time. The mineral N content
decreased for all treatments (including the control)
during the first 22 days, and continued up to the 35th
day for treatments LF, PAM-Sed and PAM-Sup, and
up to the 49th day for treatments WS and SF. After
these periods the mineral N content tended to increase.
The mineral N content was significantly lower in the
SF treatment than in the other treatments (except the
Table 3 Main characteristics of the soil used in the present
work
Total C (g kg�1 dry soil)) 28.0
Total N (g kg�1 dry soil) 2.3
C:N 12
OM content (%) 2.5
pH (H2O) 5.8
pH (KCl) 5.1
P2O5 (mg kg�1 dry soil)� 117
K2O (mg kg�1 dry soil)� 157
� Egner-Riehm method
Table 4 Amounts of N and C applied to soil in each treatment (mg kg�1 dry soil)
Treatments WS SF� LF� PAM-Sed fraction PAM-Sup fraction
Total C 848 2,588 392 358 221
Total N 126 154 119 127 71
Organic N 88 122 79 86 35
NH4+–N 39 32 40 41 36
Water-soluble C 188 162 212 211 218
� Fractions of the whole slurry obtained after mechanical separation
112 Nutr Cycl Agroecosyst (2008) 80:107–120
123

control). Furthermore, the PAM-Sup and PAM-Sed
treatments had, in most of days, the highest values of N
mineral content. The ANOVA for both treatments and
concentration of mineral N showed significant effects
from treatment, incubation time (P < 0.001), as well
as the interaction (treatment · incubation time)
(P < 0.05) during the experiment.
Table 5 shows the values of mineral N (NH4+–
N + NO3�–N) at the beginning and at the end of the
experiment as well as the total mineral N released by
the SFs during the experiment (including the total N
gaseous losses N2O + N2) expressed in absolute
value and percentage of N supplied by slurry in each
treatment. Values of net mineralization or net immo-
bilization for the 94 days incubation were calculated
considering the immobilization value that occurred in
the control as the contribution of soil organic N and
subtracting it from each slurry treatment. As can be
0
10
20
30
40
50
60
70
80
0 5 10 15 20 25 30 35 40 45 50 55 60 65 70 75 80 85 90 95Days
HN lioS
4+gk
N gm( tnetnoc
N- 1-
lios yrd)
0
10
20
30
40
50
60
70
80
0 5 10 15 20 25 30 35 40 45 50 55 60 65 70 75 80 85 90 95
Days
ON lio
S3
-gk
N gm( tnetnoc
N-1-
lios yrd )
Control WS SF LF PAM-SED PAM-SUPa)
b)
Fig. 2 Evolution of the
NH4+–N (a) and NO3
––N
(b) concentrations in the six
treatments studied during
the whole experiment.
Vertical bars represent
SEM (N = 5)
0
10
20
30
40
50
60
70
80
90
100
110
120
0 4 8 12 16 20 24 28 32 36 40 44 48 52 56 60 64 68 72 76 80 84 88 92Days
gkNlareni
mg
m1-
Control WS SF LF PAM-SED PAM-SUP
Fig. 3 Mean values of the
N mineral concentration
(NO3�–N + NH4
+–N) in
soil–SFs mixtures during
the experiment. Vertical
bars represent SEM (N = 5)
Nutr Cycl Agroecosyst (2008) 80:107–120 113
123
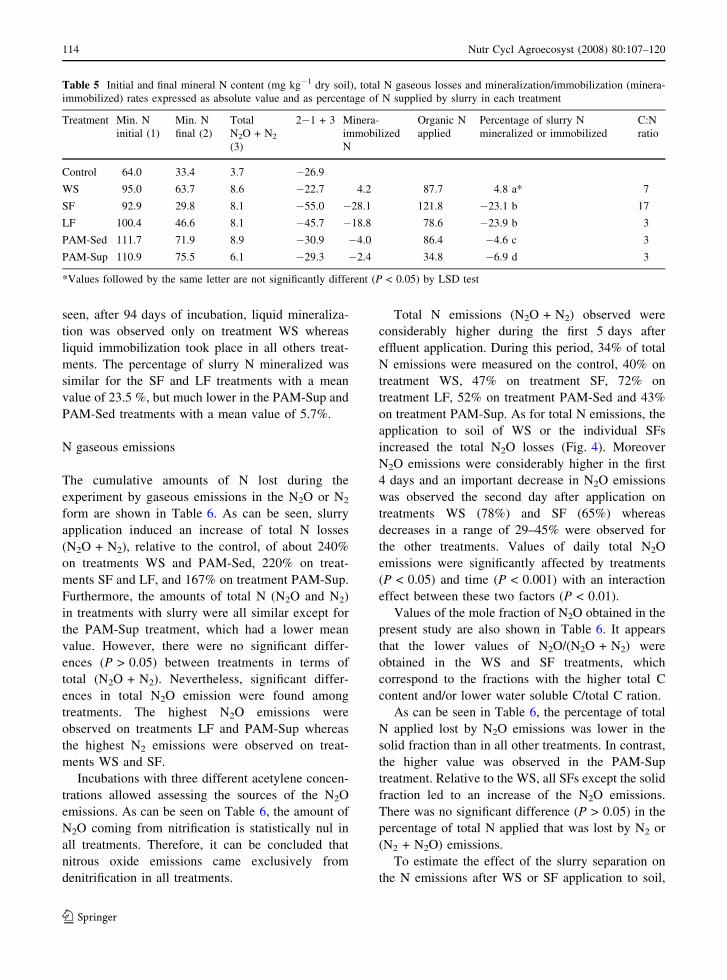
seen, after 94 days of incubation, liquid mineraliza-
tion was observed only on treatment WS whereas
liquid immobilization took place in all others treat-
ments. The percentage of slurry N mineralized was
similar for the SF and LF treatments with a mean
value of 23.5 %, but much lower in the PAM-Sup and
PAM-Sed treatments with a mean value of 5.7%.
N gaseous emissions
The cumulative amounts of N lost during the
experiment by gaseous emissions in the N2O or N2
form are shown in Table 6. As can be seen, slurry
application induced an increase of total N losses
(N2O + N2), relative to the control, of about 240%
on treatments WS and PAM-Sed, 220% on treat-
ments SF and LF, and 167% on treatment PAM-Sup.
Furthermore, the amounts of total N (N2O and N2)
in treatments with slurry were all similar except for
the PAM-Sup treatment, which had a lower mean
value. However, there were no significant differ-
ences (P > 0.05) between treatments in terms of
total (N2O + N2). Nevertheless, significant differ-
ences in total N2O emission were found among
treatments. The highest N2O emissions were
observed on treatments LF and PAM-Sup whereas
the highest N2 emissions were observed on treat-
ments WS and SF.
Incubations with three different acetylene concen-
trations allowed assessing the sources of the N2O
emissions. As can be seen on Table 6, the amount of
N2O coming from nitrification is statistically nul in
all treatments. Therefore, it can be concluded that
nitrous oxide emissions came exclusively from
denitrification in all treatments.
Total N emissions (N2O + N2) observed were
considerably higher during the first 5 days after
effluent application. During this period, 34% of total
N emissions were measured on the control, 40% on
treatment WS, 47% on treatment SF, 72% on
treatment LF, 52% on treatment PAM-Sed and 43%
on treatment PAM-Sup. As for total N emissions, the
application to soil of WS or the individual SFs
increased the total N2O losses (Fig. 4). Moreover
N2O emissions were considerably higher in the first
4 days and an important decrease in N2O emissions
was observed the second day after application on
treatments WS (78%) and SF (65%) whereas
decreases in a range of 29–45% were observed for
the other treatments. Values of daily total N2O
emissions were significantly affected by treatments
(P < 0.05) and time (P < 0.001) with an interaction
effect between these two factors (P < 0.01).
Values of the mole fraction of N2O obtained in the
present study are also shown in Table 6. It appears
that the lower values of N2O/(N2O + N2) were
obtained in the WS and SF treatments, which
correspond to the fractions with the higher total C
content and/or lower water soluble C/total C ration.
As can be seen in Table 6, the percentage of total
N applied lost by N2O emissions was lower in the
solid fraction than in all other treatments. In contrast,
the higher value was observed in the PAM-Sup
treatment. Relative to the WS, all SFs except the solid
fraction led to an increase of the N2O emissions.
There was no significant difference (P > 0.05) in the
percentage of total N applied that was lost by N2 or
(N2 + N2O) emissions.
To estimate the effect of the slurry separation on
the N emissions after WS or SF application to soil,
Table 5 Initial and final mineral N content (mg kg�1 dry soil), total N gaseous losses and mineralization/immobilization (minera-
immobilized) rates expressed as absolute value and as percentage of N supplied by slurry in each treatment
Treatment Min. N
initial (1)
Min. N
final (2)
Total
N2O + N2
(3)
2�1 + 3 Minera-
immobilized
N
Organic N
applied
Percentage of slurry N
mineralized or immobilized
C:N
ratio
Control 64.0 33.4 3.7 �26.9
WS 95.0 63.7 8.6 �22.7 4.2 87.7 4.8 a* 7
SF 92.9 29.8 8.1 �55.0 �28.1 121.8 �23.1 b 17
LF 100.4 46.6 8.1 �45.7 �18.8 78.6 �23.9 b 3
PAM-Sed 111.7 71.9 8.9 �30.9 �4.0 86.4 �4.6 c 3
PAM-Sup 110.9 75.5 6.1 �29.3 �2.4 34.8 �6.9 d 3
*Values followed by the same letter are not significantly different (P < 0.05) by LSD test
114 Nutr Cycl Agroecosyst (2008) 80:107–120
123

the N emissions balance of the slurry separation
process has been established considering the relative
proportion of each fraction and assuming that the N
losses from each SF were not C-limited since all SFs
led to N-immobilization. As can be seen in Fig. 5,
relative to the WS, higher N2O emissions were
observed when the liquid and the solid fractions were
applied separately. However, in terms of N2 and total
N (N2O and N2) emissions, no significant differences
were observed. Considering the chemical separation
using PAM, no significant differences in terms of N2,
N2O and total N (N2O and N2) emissions were
observed between the LF s and the estimated sum of
the PAM-Sup and PAM-Sed fractions. When consid-
ering the combined separation processes (screw
press + PAM), higher N2O emissions were observed
when the solid, PAM-Sup and PAM-Sed fractions
were applied separately compared with the WS. But
there was no significant difference in terms of N2 and
total N emissions (P > 0.05).
Discussion
Slurry fractions characteristics and efficiency
of separation technologies
The separation efficiency of the screw press in this
study was higher than that obtained by other authors
with the same process (Moller et al. 2002) and in the
same range as those obtained by Jakobsen and Hjort-
Gregersen (unpublished data) with a decanter centri-
fuge. These differences were mainly due to the
original slurry composition, particularly the solids
content, which controls the separation efficiency. The
main practical advantage of this first separation is the
reduction in the amount of slurry that needs to be
stored prior to spreading in the fields, the lower cost
of slurry storage and the modification of the main LF
characteristics, which could improve its fertilizer
value. A larger storage capacity also provides farmers
with greater flexibility about the timings of slurry
applications. Furthermore, the solid fraction is gen-
erally composted and may be then exported out of the
farm representing a potential extra income. This
compost exportation may also be considered as a
solution for environmental problems in intensive
farms, which have generally high N and P surplusTa
ble
6C
um
ula
tiv
eN
lost
by
N2
and
N2O
emis
sio
ns
(lg
Nk
g�
1d
ryso
il)
du
rin
gth
eex
per
imen
t
To
tal
Ng
aseo
us
loss
esC
on
tro
lW
SS
FL
FP
AM
-Sed
PA
M-S
up
P
N2
2,0
31
a*(7
84
)5
,80
0a
(1,7
65
)5
,38
8a
(2,1
24
)3
,50
7a
(1,0
22
)5
,19
5a
(2,2
60
)1
,68
1a
(2,6
29
)>
0.0
5
To
tal
Nap
pli
edlo
stas
N2
(%)
4.6
3.5
2.9
4.1
2.4
To
tal
N2O
1,6
26
c(3
44
)2
,77
0b
(21
8)
2,6
96
bc
(23
4)
4,5
93
a(4
34
)3
,74
0ab
(44
3)
4,4
37
a(6
80
)<
0.0
01
To
tal
Nap
pli
edlo
stas
N2O
(%)
2.2
1.8
3.9
2.9
6.2
N2O
den
itri
fica
tio
n1
,24
8c
(17
0)
2,8
67
b(5
29
)2
,82
2b
(50
3)
4,5
95
a(1
,06
0)
4,3
85
a(6
74
)4
,61
8a
(77
1)
<0
.00
1
To
tal
N2O
emis
sio
n(%
)1
00
10
01
00
10
01
00
10
0
N2O
nit
rifi
cati
on
37
8a
(37
7)
�9
7a
(46
0)
12
7a
(52
1)
�1
a(1
,00
0)
�6
45
a(5
12
)�
18
1a
(60
2)
>0
.05
To
tal
N2O
emis
sio
n(%
)0
00
00
0
To
tal
N2O
+N
23
,65
7b
(2,0
88
)8
,57
0ab
(3,5
24
)8
,08
3ab
(4,2
75
)8
,10
0ab
(1,9
54
)8
,93
5a
(5,2
28
)6
,11
8ab
(5,4
66
)>
0.0
5
To
tal
Nap
pli
edlo
stas
(N2O
+N
2)
(%)
6.8
5.2
6.8
7.0
8.6
N2O
/(N
2O
+N
2)
rati
o0
.44
40
.32
30
.33
30
.56
70
.41
80
.72
5
Val
ues
bet
wee
np
aren
thes
esre
pre
sen
tS
EM
(N=
5)
*V
alu
esfo
llo
wed
by
the
sam
ele
tter
ina
sam
eli
ne
are
no
tsi
gn
ifica
ntl
yd
iffe
ren
t(P
<0
.05
)b
yL
SD
test
Nutr Cycl Agroecosyst (2008) 80:107–120 115
123

since it represents a nutrient exportation. The LF can
be applied directly to fields or be used for fertigation.
However, for fertigation, nutrients levels in the liquid
have to be reduced, so a second separation by
chemically enhanced sedimentation is of interest.
Indeed, the N removal efficiency with the screw press
Fig. 5 N emissions balance
(N2, N2O, and total) of: (a)
the mechanical separation
process (Screw press), (b)
the chemical separation
process (PAM), and (c) the
combined separation
processes (Screw
press + PAM)
Fig. 4 Total N2O
emissions (lg N2O–N
kg�1 day�1) by treatment
along the experiment. Bars
represent SEM (standard
error of mean) (N = 5)
116 Nutr Cycl Agroecosyst (2008) 80:107–120
123

separator was low compared to the PAM application.
This result may be related to the fact that most of the
organic nutrients of slurry are associated with small
particles and particles smaller than 0.25 mm have to
be removed to ensure an effective reduction of
nutrient contents and odor-generating compounds
contained in liquid manure (Vanotti and Hunt 1999).
Furthermore, the values of N removal efficiency
obtained in our study using PAM addition to the LF
were lower than those obtained in other works (on
average 85%), probably due to the fact that PAM had
no effect on the removal of inorganic N forms
(Vanotti and Hunt 1999; Vanotti et al. 2002a) since
about 30% of total N in the LF used in this study was
in an inorganic form. The results of P separation
efficiency by the screw press separator were similar
to those obtained for total N although a more efficient
removal was reached for total P than for total N with
the screw press separator.
Both separation processes have poor effect on total
K and NH4+–N separation. However, Chastain et al.
(2001) also obtained low percentage of K removal
(lower than 4.5%) from screened dairy slurry by
settling with PAM but they obtained higher percent-
age of NH4+–N removal using a screen separator
(46%). Similarly, Converse et al. (unpublished data)
using the screw press for dairy manure separation
obtained NH4+–N removal percentage lower than
3.5% and K removal percentage lower than 10%
with both techniques.
Separation processes, such as screw press and
PAM settling, result in effluents with low C:N ratios.
This characteristic may be useful for dairy effluent
management and application to fields assuming that
materials with low C:N ratio should lead to rapid N
mineralization and other nutrients release. Indeed, the
application of the solid and LFs at different periods of
the year according to the N plant requirement could
be a good tool to improve N fertilization efficiency.
Soil mineral N concentration and mineralization/
immobilization of slurry N
Slurry applications to soil increased its NH4+ content
of about 40 mg NH4+–N kg�1 and 35 days after
application this value was about 7 mg NH4+–N kg�1.
This decrease can be related to losses by NH3
volatilization, nitrification and denitrification pro-
cesses (Haynes 1986). But, in the present work, it
may be mainly due to the immobilization process that
occurred in this soil. A decrease of soil mineral N was
also observed by Merino et al. (2001) after cattle
slurry application to grassland; this was attributed to
NH4+–N immobilization. On another hand, in all
treatments with slurry applications, the NO3� concen-
trations strongly decreased during the first 13 days
and then increased except in the solid fraction where
NO3� content remained more or less constant after
day 13. It was evidence of a high immobilization of
NH4+–N during the first 13 days followed by the start
of the nitrification process. When mineral N immo-
bilization occurrs microorganisms generally have a
preference for NH4+ rather than NO3
� (Ragab et al.
1994). It may explain why N2O emissions are coming
exclusively from denitrification. Indeed, nitrous oxide
emissions were observed mainly during the first
5 days and during this period, N mineralization
resulted in NH4+–N immobilization and no nitrifica-
tion occurred.
In all treatments, the total soil mineral N content
declined during the first 36 days of incubation. This
decrease is due in part to the N2O and N2 emissions
even if these losses should have a small effect on total
soil mineral N considering that emissions occurred
mainly during the first 5 days of the experiment.
Therefore, the decrease of the total soil mineral N
content should be mainly due to N immobilization in
soil.
During the entire experiment, N mineralization
only occurred in the WS treatment whereas, in all
other treatments, N immobilization was observed.
Similarly, Clemens and Huschka (2001) obtained low
values of mineralization and verified immobilization
by the soil after application of different SFs. The C:N
ratio of organic residues is an important factor to
predict liquid mineralization or immobilization of
nitrogen. The effluents used in the present work had
low C:N ratios. Indeed, the WS and the solid fraction
had C:N ratios of 7 and 17, respectively; whereas the
other three fractions had a C:N ratios of 3. According
to Haynes (1986) and Tisdale et al. (1993), organic
material with C:N ratio values less than 20:1 or 30:1
lead to N mineralization. Indeed, Chadwick et al.
(2000) observed both N-mineralization and N-immo-
bilization in soil after application of manures with
different C:N ratios. In the present study, the
percentage of N immobilized relative to the organic
N incorporated by the slurry were very close on
Nutr Cycl Agroecosyst (2008) 80:107–120 117
123

treatments SF and LF as well as in treatments PAM-
Sed and PAM-Sup. However, if the effluents applied
in treatments with PAM have similar C:N ratio, the
same is not true for treatments SF and LF, and
consequently, a distinct behavior was expected
between the last ones.
The N immobilization occurred in the treatments
with slurry applications can not be explained through
the C:N ratio of the effluents applied. However, an
effect associated to the soil used should be considered
since the C:N ratio of the soil was much higher than
those of the SFs used. Moreover, in addition to the
C:N ratio, other parameters might have influenced the
balance between mineralization and immobilization.
In instance, the maintenance of the soil moisture
content at a constant value (60% WFPS) may have
limited the N mineralization process since soil
drying/wetting cycles stimulate the decomposition
of soil organic N (Haynes 1986). Furthermore, the N
immobilization observed from the solid fraction
treatment may be attributed to the high carbon
contents of this fraction and more specifically to the
readily available C supplied by the SF, which lead to
denitrification and immobilization of potentially
available N (Calderon et al. 2005).
The N immobilization that occurred in the control
may be due to some plant residues. Despite our best
efforts to remove them from the soil, the soil may
have contained roots that were not excluded during
sieving and which decomposed during the experiment
(Hatch et al. 1990). Roots and radicular exudates of
plants have a high C:N ratio and, therefore, their short
term decomposition can induce N immobilization
(Ross et al. 1985; Trindade 1997). Nevertheless, the
use of this type of soil allowed us estimating the
effect of utilizing the liquid and PAM-Sup fractions
for fertigation in maize production.
The N immobilization was more important in the
LF than in the PAM-Sup even if both fractions have a
C:N ratio equal to 3. Such difference in N immobi-
lization may be attributed to the N content of each
fraction, which was higher in the LF. However, the
differences in N immobilization observed between
the liquid and the PAM-Sed fraction may not be
attributed to the composition of each fraction since
they have similar contents of C and N (see Table 1).
The own difference between this two fractions is the
presence or absence of PAM. Even if no effect of this
flocculent on N mineralization was previously
reported, the results obtained here indicated that the
presence of PAM induced a higher nitrification and
consequently reduced the N immobilization in the
PAM-Sed fraction.
The differences observed between fractions in
terms of N degradation in soil could be used to
improve slurry management. Indeed, as the LFs
induced mainly N immobilization, this fraction could
be applied to plants when they need an immediate N
supply for a short period, whereas the WS could be
applied in another period of plant growth when there
is a requirement for a more continuous N supply.
N gaseous emissions
In the present work, nitrous oxide emissions were
restricted to the first 5 days after untreated slurry or
fractions application to soil. Similarly, Ellis et al.
(1998), in an experiment with application of cattle
slurry, observed high N losses by denitrification
during the first 5 days. The highest N2O emissions
were observed from the LF and PAM-Sup treatments,
whereas the highest N2 emissions were observed
from the WS and solid fraction. These differences
may be related to the (water-soluble C:total C) ratio,
which showed higher values in the liquid effluents.
Weier and MacRae (1993) report that an increase in
total C content may lead to an increase in denitrifi-
cation, but many authors argue that total C content is
less important than the readily available C in form of
volatile fatty acids, which have a strong influence on
N losses by denitrification (Beauchamp et al. 1989;
Paul and Beauchamp 1989; Misselbrook et al. 1998;
Petersen 1999).
We expected to see a reduction in emissions from
the PAM-Sup treatment. Indeed, the degree of solid
and nutrient removal normally induced by the PAM
(Vanotti et al. 2002b) should have more effect on
these emissions. However, in the present study, the
efficiency of nutrient and solid removal in the PAM-
Sup fraction was not as great as expected and this
fraction has an important readily available carbon
content coupled with higher values of mineral N,
which can help to explain the results obtained with
this fraction in terms of emissions
The fact that N2O emissions are coming quite
exclusively from denitrification may be explained
considering that a high NH4+–N and NO3
—N reduc-
tion occurred due to mineral N immobilization, in
118 Nutr Cycl Agroecosyst (2008) 80:107–120
123
particular during the first 13 days. However, Ellis
et al. (1998) showed in a similar study that N losses
generated by denitrifcation were much higher than
those arising from nitrification, and that N2 losses
represent an important portion of the total N emis-
sions following slurry application. Furthermore,
Clemens and Huschka (2001) verified that for WFPS
values of 35%, 54%, and 71%, the N2O emissions
were originated predominantly by denitrification and
were related, not with the input of N–NH4+, but with
the input of readily available carbon and the amount
of N–NO3� in the soil. The low N2O emissions
coming from nitrification can still be explained by the
fact that the N–NH4+ was immobilized instead of
being oxidized to form nitrates. During the first days
of incubation, the immobilization of mineral-N
applied in the treatments strongly reduced, or even
exhausted, the amount of ammonium available for the
nitrification process, which explains why N2O emis-
sions were found to be only originated by the
denitrification process. In contrast, the high denitri-
fication rates may have been due to the high amounts
of nitrate N and readily available C. In addition,
Tenuta et al. (2001) reported a positive correlation
between N2O emissions from manure and NO3�N
content, suggesting that denitrification is an important
source of N2O following manure applications to soil.
In the present work, the nitrate immobilization
together with the exhaustion of available carbon
explains the negligible emissions from denitrification
after 5 days of incubation.
The ratio N2O/(N2O + N2) defined as the mole
fraction of N2O, produced by denitrification varies
with the environmental conditions and on the micro-
bial populations present (Stevens and Laughlin
2001). A slurry application should tend to favor N2
production and lead to a low N2O/(N2O + N2) ratio
because it supplies organic C at high pH and low
NO3� concentration conditions (Stevens and Laughlin
2001). Values of the mole fraction of N2O reported in
previous studies were in a range <0.1–1 (Jarvis and
Pain, 1994; Stevens and Laughlin, 1997). Values
obtained in the present study were in the same range.
Conclusion
During the 94 days of incubation, N immobilization
was observed in all the separated SFs treatments
whereas N mineralization was observed in the WS
treatment. Our results showed that N2O emissions
observed after slurry incorporation to soils mainly
originated from the denitrification process and most
of total N (N2O and N2) lost occurred in 4 days
after slurry application. Furthermore, higher N2O/
(N2 + N2O) ratios were observed from the treated LF
than from solid fraction. The N emissions balance
following slurry separation showed that there was no
effect on N emissions from the separate applications
of the fractions relative to the WS. Therefore, it can
be concluded that the slurry treatment by mechanical
and chemical separation is potentially a good tool for
slurry management at the farm scale with no effect on
the N emissions after fractions are applied to soil.
References
Analytical Software (2000) Users Manual—Statistix 7.0
Bateman EJ, Baggs EM (2005) Contributions of nitrification
and denitrification to N2O emissions. Biol Fertil Soils
41:379–388
Beauchamp EG (1986) Availability of nitrogen from three
manures to corn in the field. Can J Soil Sci 66:713–720
Beauchamp EG, Trevors JT, Paul JW (1989) Carbon sources
for bacterial denitrification. Adv Soil Science 10:113–142
Burton CH, Turner C (2003) Manure management. Treatment
strategies for sustainable agriculture. 2nd edn. Silsoe
Research Institute, Silsoe, UK
Calderon FJ, McCarty GW, Reeves III JB (2005) Analysis of
manure and soil nitrogen mineralization during incuba-
tion. Biol Fertil Soils 41:328–336
Chadwick DR, John F, Pain BF, Chambers BJ, Williams J
(2000) Plant uptake of nitrogen from the organic nitrogen
fraction of animal manures: a laboratory experiment. J
Agric Sci, Cambridge 134:159–168
Chastain JP, Vanotti MB, Wingfield MM (2001) Effectiveness
of liquid-solid separation for treatment of flushed dairy
manure: a case study. Appl Eng Agric 17(3):343–354
Clemens J, Huschka A (2001) The effect of biological oxygen
demand of cattle slurry and soil moisture on nitrous oxide
emissions. Nutr Cycl Agroecosys 59:193–198
Davidson EA (1991) Fluxes of nitrous oxide and nitric oxide
from terrestrial ecosystems. A global inventory of nitric
oxide emissions from soils. In: Rogers JE, Whitman WB
(eds) Microbial production and consumption of green-
house gases: methane, nitrogen oxides, and halomethanes.
American Society for Microbiology, Washington, DC, pp
217–274
Ellis S, Yamulki S, Dixon E, Harrison R, Jarvis SC (1998)
Denitrification and N2O emissions from a UK pasture soil
following the early spring application of cattle slurry and
mineral fertiliser. Plant Soil 202:15–25
Granli T, Bockman OC (1994) Nitrous oxide from agriculture.
Norwegian J Agric Sci Suppl 12:1–128
Nutr Cycl Agroecosyst (2008) 80:107–120 119
123

Hatch DJ, Jarvis SC, Philipps L (1990) Field measurement
of nitrogen mineralization using soil core incubation and
acetylene inhibition of nitrification. Plant Soil 124:97–107
Haynes RJ (1986) The decomposition process: mineralization,
immobilization, humus formation, and degradation. In:
Haynes RJ (ed) Mineral nitrogen in the plant-soil system.
Academic Press, Physiological Ecology, London, UK, pp
52–126
Houba VJG, Novozamsky I, Tenminghoff E (1994) Soil
analysis procedures. Department of Soil Science and Plant
Nutrition, Wageningen Agricultural University, The
Netherlands
Jarvis SC, Pain BF (1994) Greenhouse gas emissions from
intensive livestock systems: their estimation and thech-
nologies for reduction. Clim Change 27:27–38
MAFF (1991) Code of good agricultural practice for the pro-
tection of water. Ministry of Agriculture, Fisheries and
Food and Welsh Office Agriculture Department (MAFF),
UK
Merino P, Estavillo JM, Besga G, Pinto M, Gonzalez-Murua C
(2001) Nitrification and denitrification derived N2O pro-
duction from a grassland soil under application of DCD
and Actilith F2. Nutr Cycl Agroecosys 60:9–14
Misselbrook TH, Chadwick DR, Pain BF, Headon DM (1998)
Dietary manipulation as a means of decreasing N losses
and methane emissions and improving herbage N uptake
following application of pig slurry to grassland. J Agric
Sci 130:183–191
Moller HB, Sommer SG, Ahring BK (2002) Separation effi-
ciency and particle size distribution in relation to manure
type and storage conditions. Bioresour Technol 85:189–
196
Mosier AR, Klemedtsson L (1994) Measuring denitrification in
the field. In: Weaver RW et al (eds) Methods of soil
analysis. Part 2. Microbiological and biochemical prop-
erties. Number 5 in the Soil Science Society of American
Book Series. SSSA. Madison
Parton WJ, Mosier AR, Ojima DS, Valentine DW, Schimel DS,
Weier K, Kulmala AE (1996) Generalised model for N2
and N2O production from nitrification and denitrification.
Global Biogeochem Cy 10:401–412
Paul JW, Beauchamp EG (1989) Effect of carbon constituents in
manure on denitrification in soil. Can J Soil Sci 69:49–61
Petersen SO (1999) Nitrous oxide emissions from manure and
inorganic fertilizers applied to spring barley. J Environ
Qual 28(5):1610–1618
Ragab M, Aldag R, Mohamed S, Mehana T (1994) Denitrifi-
cation and nitrogen immobilization as affected by organic
matter and different forms of nitrogen added to an
anaerobic water-sediment system. Biol Fertil Soils
17:219–224
Ross DJ, Speir TW, Tate KR, Orchard VA (1985) Effects of
sieving on estimations of microbial biomass and carbon
and nitrogen mineralization under pasture. Austral J Soil
Res 23:319–324
Stevens RJ, Laughlin RJ (2001) Effect of liquid manure on the
mole fraction of nitrous oxide evolved from soil con-
taining nitrate. Chemosphere 42:105–111
Stevens RJ, Laughlin RJ (1997) The impact of cattle sluries
and their management on ammonia and nitrous oxide
emissions from grassland. In: Jarvis SC, Pain BF (eds)
Gaseous nitrogen emissions from grasslands. CAB Inter-
national, Oxford, UK, pp 223–256
Tenuta M, Barry DAJ, Fairchild G, Beauchamp EG (2001)
Nitrous oxide production by manure samples collected
from six manure-handling systems. Can J Soil Sci
81(1):33–38
Tisdale SI, Nelson WI, Beaton JD, Havlin JL (1993) Soil
Fertility and Fertilizers. 5th edn. Macmillan Publishing
Company, New York, USA, pp 540–607
Trindade H. (1997). Fluxos e Perdas de Azoto em Exploracoes
Forrageiras de Bovinicultura Leiteira no Noroeste de
Portugal. PhD Thesis, University of Tras-os-Montes e
Alto Douro, Portugal
Trindade H., Coutinho J. and Moreira N (2002) Separacao desolidos de chorumes bovinos por tamisacao: rendimentode separacao e da remocao de nutrientes. Encontro Anual
da Sociedade Portuguesa de Ciencia do Solo - Escola
Superior Agraria de Ponte de Lima, Ponte de Lima, 5 a 7
de Setembro de 2002, pp 234–237
Vanotti MB, Hunt PG (1999) Solids and nutrient removal from
flushed swine manure using polyacrylamides. Trans
ASAE 42(6):1833–1840
Vanotti MB, Rashash DM, Hunt PG (2002a) Solid–liquid
separation of flushed swine manure with PAM: effect of
wastewater strength. Trans ASAE 45(6):1959–1969
Vanotti MB, Rice JM, Ellison AQ, Hunt PG, Humenik FJ,
Baird CL (2002b) Solids–liquids separation of swine
manure with polymer treatment and sand filtration. ASAE
Meeting Paper No. 024158. St Joseph, Mich., ASAE
Weier KL, MacRae IC (1993) Net mineralization, net nitrifi-
cation and potentially available nitrogen in the subsoil
beneath a cultivated crop and a permanent pasture. J Soil
Sci 44:451–458
120 Nutr Cycl Agroecosyst (2008) 80:107–120
123
![Tetra-kis(μ(2)-cyanido-κ(2)C:N)dicyanido-tetra-kis-[tris-(2-amino-eth-yl)amine-κ(3)N,N',N'',N''']tetra-copper(II)iron(II) bis[pentacyanidonitrosoferrate(II)] hexahydrate](https://static.fdokumen.com/doc/165x107/634199118718ae62200b4f38/tetra-kism2-cyanido-k2cndicyanido-tetra-kis-tris-2-amino-eth-ylamine-k3nnnntetra-copperiiironii.jpg)


![2-[5-Methyl-2-(propan-2-yl)phenoxy]- N ′-{2-[5-methyl-2-(propan-2-yl)phenoxy]acetyl}acetohydrazide](https://static.fdokumen.com/doc/165x107/6344862303a48733920aed56/2-5-methyl-2-propan-2-ylphenoxy-n-2-5-methyl-2-propan-2-ylphenoxyacetylacetohydrazide.jpg)