Lab Work 01. Wireshark Introduction. - Computer Networks
21
© Yuriy Shamshin, 2021 1/21 LAB WORK 01. WIRESHARK INTRODUCTION. 1. LAB WORK GUIDELINES Disclaimer. This guidelines was created on the basis of the textbook «Data Communication and Networking», 5th.Edition, 2012, -1269 pp., by Behrouz A. Forouzan. We have created lab assignments for several layers of TCP/IP. We have only theoretical lab assignments for physical layer. We cannot use a standard packet sniffer, such as Wireshark, to capture bits. We cannot sniff management packets because we have normally no permission to act as a manager. In this document, we give an introduction to packet sniffing, introduce the Wireshark software, talk about the lab reports, and finally tell you what to do in this lab assignment. 1.1 PACKET SNIFFING The purpose of lab assignments is to show how we can get a deeper understanding of the networking concepts by capturing and analysing the packets sent and received from our host. One way to do so is to use a packet sniffer. A packet sniffer is a piece of soft- ware that should be running in parallel with the application whose packets needed to be analysed. However, before running a packet sniffer, we need to interpret the term packet. Communication via the Internet is done using a five-layer suite. We can analyse the packets at four layers: application, transport, network, and data-link. There is no packet exchange at the physical layer; communication at this layer is done using bits. Although it is useful to analyse the packets in each of the four upper layers of the TCP/IP protocol suite, should a packet sniffer software be designed to capture packets at each of these layers? The answer to this question can be found in encapsulation-decapsulation. Figure 1.1 Encapsulation and Decapsulation In an outgoing situation, a packet created at any upper-layer is encapsulated in a frame (at the data-link layer); in an incoming situation, a packet intended for any layer is decapsulated from the received frame. This means we need to capture only outgoing or incoming frames; a packet-sniffer software can extract the packets at any layer desired to be analysed from these frames. For this reason, a packet-sniffer software is normally having two components:
-
Upload
khangminh22 -
Category
Documents
-
view
6 -
download
0
Transcript of Lab Work 01. Wireshark Introduction. - Computer Networks

© Yuriy Shamshin, 2021 1/21
LAB WORK 01. WIRESHARK INTRODUCTION.
1. LAB WORK GUIDELINES Disclaimer. This guidelines was created on the basis of the textbook «Data Communication and Networking», 5th.Edition, 2012, -1269 pp., by Behrouz A. Forouzan.
We have created lab assignments for several layers of TCP/IP. We have only theoretical lab assignments for physical layer. We cannot use a standard packet sniffer, such as Wireshark, to capture bits. We cannot sniff management packets because we have normally no permission to act as a manager. In this document, we give an introduction to packet sniffing, introduce the Wireshark software, talk about the lab reports, and finally tell you what to do in this lab assignment.
1.1 PACKET SNIFFING
The purpose of lab assignments is to show how we can get a deeper understanding of the networking concepts by capturing and analysing the packets sent and received from our host. One way to do so is to use a packet sniffer. A packet sniffer is a piece of soft- ware that should be running in parallel with the application whose packets needed to be analysed. However, before running a packet sniffer, we need to interpret the term packet. Communication via the Internet is done using a five-layer suite. We can analyse the packets at four layers: application, transport, network, and data-link. There is no packet exchange at the physical layer; communication at this layer is done using bits.
Although it is useful to analyse the packets in each of the four upper layers of the TCP/IP protocol suite, should a packet sniffer software be designed to capture packets at each of these layers? The answer to this question can be found in encapsulation-decapsulation.
Figure 1.1 Encapsulation and Decapsulation
In an outgoing situation, a packet created at any upper-layer is encapsulated in a frame (at the data-link layer); in an incoming situation, a packet intended for any layer is decapsulated from the received frame. This means we need to capture only outgoing or incoming frames; a packet-sniffer software can extract the packets at any layer desired to be analysed from these frames. For this reason, a packet-sniffer software is normally having two components:

© Yuriy Shamshin, 2021 2/21
a packet-capturer and a packet-analyser. The packet-capturer captures a copy of all outgoing and incoming frames (at the data-link layer) and passes them to the packet-analyser. The packet- analyser can then extract different headers and the ultimate message for analysis.
Before we continue with our discussion, we need to make a point clear. Although Figure 1.1 in the textbook shows that the encapsulation starts or decapsulation ends at the application layer, a packet in the Internet can belong to any layer above the data- link layer. As we will see in future, protocols at the transport or network layer protocols also need to exchange packets. All of these packets are encapsulated in or decapsulated from the frames. A packet sniffer needs to capture all incoming and out- going frames and show the headers of all protocols used for communication. The source or the sink of a packet is not necessarily the application layer. Figure 1.2 shows two examples.
Figure 1.2 Role of frame capturing and packet analysing in a packet-sniffer
In Example I, an outgoing frames is captured. The source of the frame is the HTTP protocol at the application layer. A copy of the frame is passed to the analyser. The analyser extracts the general information in the frame (the box marked frame), headers 2, 3, and 4, and the HTTP message for analysis. In Example II, an incoming frame is captured. The sink (final destination) is the ARP protocol at the network layer. A copy of the frame is passed to the analyser. The analyser extracts the general information in the header (the box marked frame), header 2 and the ARP message for analysis.

© Yuriy Shamshin, 2021 3/21
1.2 WIRESHARK
In this and other lab assignments, we use a packet-sniffer called Wireshark. Wireshark is a free packet sniffer/analyser which is available for both UNIX-like (Unix, Linux, Mac OS X, BSD) and Windows operating systems. It captures packets from a network interface and displays them with detailed protocol information.
Wireshark, however, is a passive analyser. It only captures packets without manipulate them; it neither sends packets to the network nor does other active operations. Wireshark is not an intrusion-detection tool either. It does not give warning about any network intrusion.
It, nevertheless, can help network administrators to figure out what is going on inside a network and to troubleshoot network problems. In addition, Wireshark is a valuable tool for protocol developers, who may use it to debug protocol implementations. It is also a great educational tool for computer-network students who can use it to see details of protocol operations in real time.
1.2.1 Main Window
The Wireshark main window (shown in Figure 1.3.) is made of seven sections: title bar, menu bar, filter bar, packet list pane, packet detail pane, packet byte pane, and status bar.
Figure 1.3 Main window of Wireshark
© Yuriy Shamshin, 2021 4/21
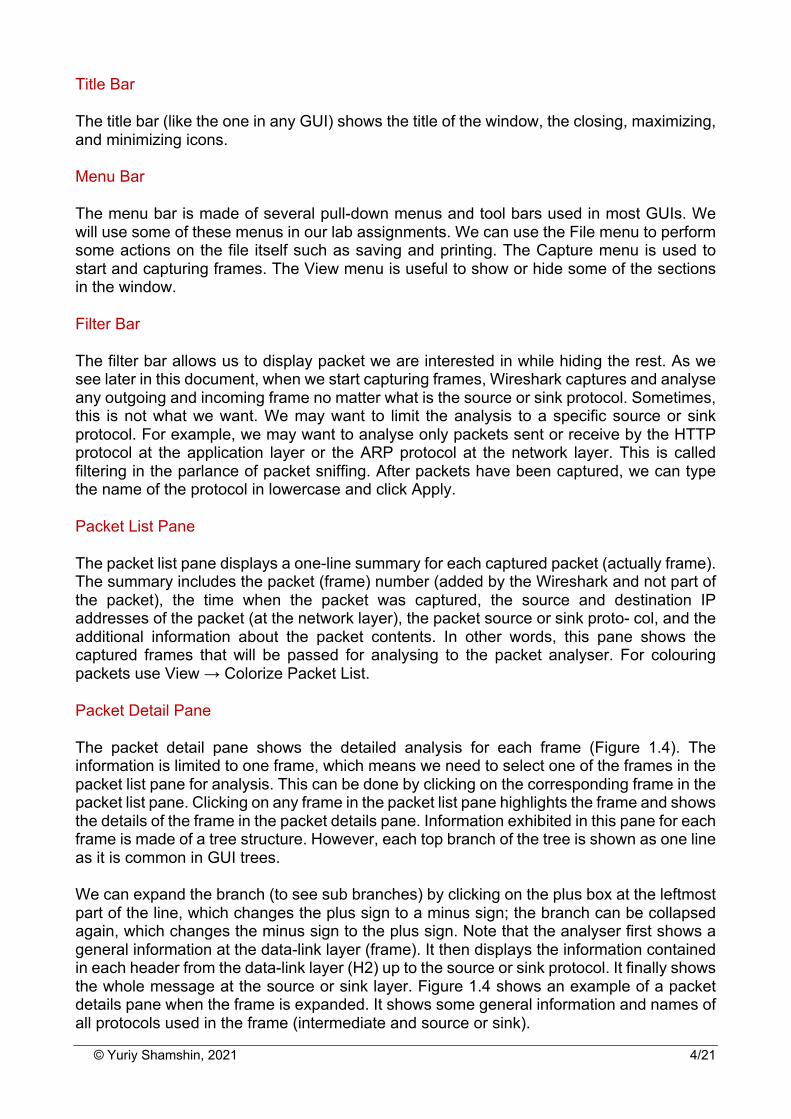
Title Bar
The title bar (like the one in any GUI) shows the title of the window, the closing, maximizing, and minimizing icons.
Menu Bar
The menu bar is made of several pull-down menus and tool bars used in most GUIs. We will use some of these menus in our lab assignments. We can use the File menu to perform some actions on the file itself such as saving and printing. The Capture menu is used to start and capturing frames. The View menu is useful to show or hide some of the sections in the window.
Filter Bar
The filter bar allows us to display packet we are interested in while hiding the rest. As we see later in this document, when we start capturing frames, Wireshark captures and analyse any outgoing and incoming frame no matter what is the source or sink protocol. Sometimes, this is not what we want. We may want to limit the analysis to a specific source or sink protocol. For example, we may want to analyse only packets sent or receive by the HTTP protocol at the application layer or the ARP protocol at the network layer. This is called filtering in the parlance of packet sniffing. After packets have been captured, we can type the name of the protocol in lowercase and click Apply.
Packet List Pane
The packet list pane displays a one-line summary for each captured packet (actually frame). The summary includes the packet (frame) number (added by the Wireshark and not part of the packet), the time when the packet was captured, the source and destination IP addresses of the packet (at the network layer), the packet source or sink proto- col, and the additional information about the packet contents. In other words, this pane shows the captured frames that will be passed for analysing to the packet analyser. For colouring packets use View → Colorize Packet List.
Packet Detail Pane
The packet detail pane shows the detailed analysis for each frame (Figure 1.4). The information is limited to one frame, which means we need to select one of the frames in the packet list pane for analysis. This can be done by clicking on the corresponding frame in the packet list pane. Clicking on any frame in the packet list pane highlights the frame and shows the details of the frame in the packet details pane. Information exhibited in this pane for each frame is made of a tree structure. However, each top branch of the tree is shown as one line as it is common in GUI trees.
We can expand the branch (to see sub branches) by clicking on the plus box at the leftmost part of the line, which changes the plus sign to a minus sign; the branch can be collapsed again, which changes the minus sign to the plus sign. Note that the analyser first shows a general information at the data-link layer (frame). It then displays the information contained in each header from the data-link layer (H2) up to the source or sink protocol. It finally shows the whole message at the source or sink layer. Figure 1.4 shows an example of a packet details pane when the frame is expanded. It shows some general information and names of all protocols used in the frame (intermediate and source or sink).

© Yuriy Shamshin, 2021 5/21
Figure 1.4 Packet detail pane
Packet byte pane
The packet byte pane shows the entire current frame (selected in the packet list pane) in hex dump format (hexadecimal view of data) and ASCII format. The number in the left field shows the offset in the packet data; the hex dump of the packet is shown in the middle field; the corresponding ASCII characters are shown in the right field. If we need the byte (or ASCII equivalent) of any line in the packet detail pane, we can click on the line in the packet detail pane and the byte contents will be highlighted. Figure 1.5 shows an example of a packet byte pane. It shows all the bytes in the frame, but we can select the bytes in any protocol header by highlighting it in the packet detail pane section.
Figure 1.5 Packet byte pane
Status Bar
The last section of the window (at the bottom) is the status bar which shows the current protocol, the total number of packets captured, and so on.

© Yuriy Shamshin, 2021 6/21
1.2.2 Working with Wireshark
When we work with Wireshark in labs, there are some actions that we need to repeat over and over. We mention the details of some of this action to avoid rementioning them.
Start Capturing
To begin capturing, select the Capture from the pull down menu and click Options… to open the Wireshark capture dialog box. There are several steps that you need to follow before you start capturing:
1. The network interfaces are shown in the Interface list at the Input box. Select the network interface (or use the default interface chosen by Wireshark). If the IP address in the dialog box is unknown, you must select a different interface; otherwise, the Wireshark will not capture any packet (Figure 1.6).
Figure 1.6 Capture Input window
2. You normally will use the default values in the capture options dialog box, but there are some options that you may need to override the default (Figure 1.7).
Figure 1.7 Capture Output and Options window

© Yuriy Shamshin, 2021 7/21
3. It is possible to configure packet filtering using the window Capture Filters (Figure 1.8).
Figure 1.8 Capture Filters window
After the above three steps, click Start. Wireshark starts to captures packets that are exchanged between your computer and the network. If, after a minute, Wireshark does not capture any packet, there must be a problem; check for possible reason and troubleshooting.
Stop Capturing
Whenever you feel you have captured all the packets (frames) that you need to do your lab report, you can stop capturing. To do so, you need to use the Capture pull-down menu and click Stop. Wireshark stops capturing the frames.
Saving the Captured Information
After you have stopped capturing, you may want to save the captured information (File à Save) or save interesting packet (Right Mouse Button à Copy à Copy Bytes as Hex Dump.
1.2.3 Incoming and Outgoing Frames
When we see the list of the captured frames, we often wonder which frames are the incoming and which ones are outgoing. This can be found by looking at the frame in packet list pane. The packet list pane shows the source and destination addresses of the frame (generated and inserted at the network layer). If the source address is the address of the host you are working with (shown on the Capture window when you start capturing), the frame is the outgoing frame; if the destination address is the address of your host, the frame is the incoming frame.
© Yuriy Shamshin, 2021 8/21
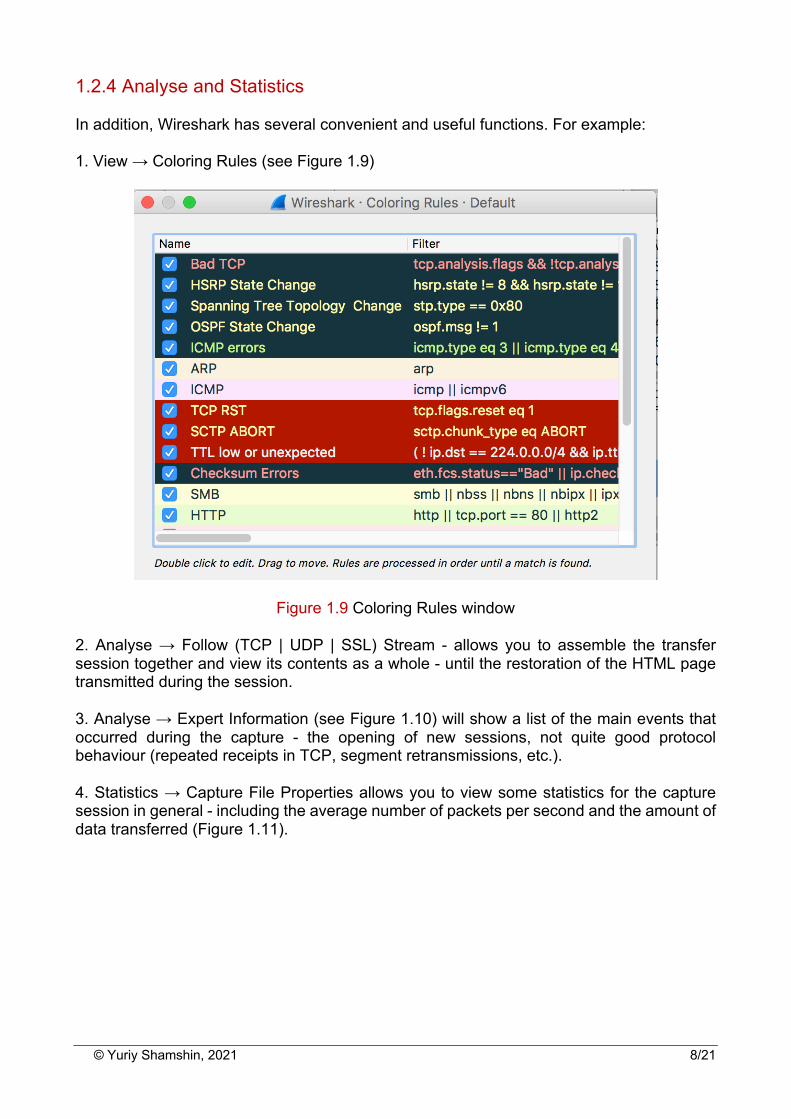
1.2.4 Analyse and Statistics
In addition, Wireshark has several convenient and useful functions. For example:
1. View → Coloring Rules (see Figure 1.9)
Figure 1.9 Coloring Rules window
2. Analyse → Follow (TCP | UDP | SSL) Stream - allows you to assemble the transfer session together and view its contents as a whole - until the restoration of the HTML page transmitted during the session.
3. Analyse → Expert Information (see Figure 1.10) will show a list of the main events that occurred during the capture - the opening of new sessions, not quite good protocol behaviour (repeated receipts in TCP, segment retransmissions, etc.).
4. Statistics → Capture File Properties allows you to view some statistics for the capture session in general - including the average number of packets per second and the amount of data transferred (Figure 1.11).

© Yuriy Shamshin, 2021 9/21
Figure 1.10 Expert Information window
Figure 1.11 Capture File Properties window

© Yuriy Shamshin, 2021 10/21
5. Statistics → Protocol Hierarchy - statistics on the protocols used (Figure 1.12).
Figure 1.12 Protocol Hierarchy window
6. Statistics → Conversations shows information about the participants in the communication, who sent packets and data to whom to whom and how (Figure 1.13).
Figure 1.13 Conversations window

© Yuriy Shamshin, 2021 11/21
7. Statistics → IO Graphs allows to you build an almost arbitrary statistical graph of the captured data (Figure 1.14).
Figure 1.14 IO Graphs window
8. Statistics → Packet Lengths allows to you finding a very short and very long frames (Figure 1.15).
Figure 1.15 Packet Lengths window

© Yuriy Shamshin, 2021 12/21
2. LAB WORK ASSIGNMENT
2.1. Lab Target
The lab assignment for this chapter is a warm-up testing of the Wireshark software. In this lab, we retrieve a web page and then, using Wireshark, capture and analyze packets.
Process:
• Visiting a Web site • Type in the URL in Web browser • First your computer will send a connection
request message to the Web Server • Web Server will respond by returning a
connection reply message • Your computer then sends the name of the
web page • Finally the server returns the page to you.
2.2. Assignment
2.2.1. Calculate Your variant number.
a) Write your surname in the letters of the English alphabet. Must be at least 4 letters, if not enough, then add the required number of letters from the name.
For example, for student Li Yuriy there will be LIYU. b) Replace the first 4 letters with their ordinal numbers in the alphabet, writing the
numbers as two-digit decimal numbers. For example, 12 09 25 21.
c) Consistently add modulo 26 these 4 numbers and add 1 For example, (12 + 09 + 25 + 21)mod26 + 1 = 67mod26 + 1 = 15 +1 = 16.
d) The resulting will be your variant Nr. For example, 16.
Remark. Find only unsecure http:// sites for your variant. a) Read “Why No HTTPS?” https://whynohttps.com/ and select your site from Reports
by Country. b) Read topic: https://www.acunetix.com/websitesecurity/google-hacking/ and use
Google operators to search inurl: and intitle:
For example, inurl:http\:+intitle:isma

© Yuriy Shamshin, 2021 13/21
Variants. Variant Nr: Web site name (dns) Variant Nr: Web site name (dns) 1. english.www.gov.cn 14. www.gov.cn 2. moodle.isma.lv 15. 360.com 3. 1182.lv 16. cnnic.cn 4. sunrepublic.lv 17. 581232.com 5. go.com 18. redfin.com 6. tianya.cn 19. rs6.net 7. nginx.org 20. faqs.org 8. babytree.com 21. rutracker.org 9. washington.edu 22. www.rej.lv 10. eepurl.com 23. fao.org 11. people.com.cn 24. consultant.ru 12. example.com 25. med.uz 13. soso.com 26. mtv.de
2.2.3. Start your browser and clear cache.
Start up your web browser and clear the browser's cache memory (Use the following website if you don’t know how to do this), but do not access any site yet.
• http://www.wikihow.com/Clear-Your-Browser’s-Cache
2.2.3. Open and configure Wireshark.
a) Start Wireshark. b) Change interface language. Edit – Preference – Appearance – Language - English. c) Use the display filter box to show only frames that the source or the sink protocol is
HTTP. Note that you need to type “http” in the display filter box and click Apply. d) Use the capture filter box to capture only frames that the destination port is HTTP.
Note that you need to type “tcp port 80 or tcp port 443” in the capture filter box. e) Select Active Interface, example Local Area Connection.

© Yuriy Shamshin, 2021 14/21
2.2.4. Capturing traffic.
a) Start Wireshark capturing; b) Now, go back to your browser, access one of your variant of web site; c) Stop capturing and save the captured file (File à Save à name.pcap). d) For open pcap file in Wireshark select File à Open à name.pcap.
2.2.5. Saving & Printing the Captured Information for next analysis
As a supporting document for lab assignment, you need to turn in a printout of the captured information. You can do this:
• or by Save Hex Dump Interesting Frame; • or by make Screen Shots; • or by Print from the File menu (mark “Selected packet only” and “All expanded”).
Save Interesting frame for analysis
a) Open the captured file from the previous paragraph (name.pcap). b) Find the first frame with the source protocol HTTP (interesting frame). c) From frame contecst menu (Right Mouse Button) select Copy à Copy Bytes as
Hex Dump. d) Insert Hex Dump to Your Report or Save it Hex Dump as simple txt file. (Example in
notepad.exe make: Edit à Paste and after File à Save à hex-dump.txt). e) For open Hex Dump file in Wireshark select File à Import from Hex Dump…

© Yuriy Shamshin, 2021 15/21
2.2.6. Answer Questions
Using the first frame with the source protocol HTTP for answer the questions in your Lab Work Report Sheet (see below).
2.3. Lab Work Report Sheet
To make the report of your observation easier and consistent, we have created Lab Work Report Sheet for lab assignment (see below).
A copy of the Lab Work Report sheets that contains:
1. The formation of an individual variant of the assignment; 2. Answered questions; 3. Hex dump interesting HTTP frame; 4. A Screen Shots or Printout of the supporting captured information.
Report send to teacher.
2.5. Grade.
Grade on 10 points: correctly formed individual variant, correctly made of all 10 assignments, hex-dump copies and captured information Screen Shots or Printout.

© Yuriy Shamshin, 2021 16/21
3. LAB WORK REPORT
Report for Lab Work 01: Wireshark Introduction. Student Name Surname Student ID Date
Yuriy Li 12345 20.09.2019
1. Assignment Variant
Instruction: The step by step formation of an individual variant of the assignment from the surname-name to the final number.
Example: Li Yuriy à LIYU à (12+09+25+21)mod26+1=16 à variant Nr.16 changed to (academy)
2. HTTP Frame Analyse
Nr Question Answer
1 Is the frame an outgoing or an incoming frame?
2 What is the source MAC address of the data-link layer header in the frame?
3 What is the destination MAC address of the data-link layer header in the frame?
4 Source IP address of the network-layer header in the frame:
5 Destination IP address of the network-layer header in the frame:
6 Total number of bytes in the whole frame:
7 Number of bytes in the Ethernet (data-link layer) header:
8 Number of bytes in the IP header:
9 Number of bytes in the TCP header:
10 Total bytes in the message at the application layer (“payload”):
© Yuriy Shamshin, 2021 17/21
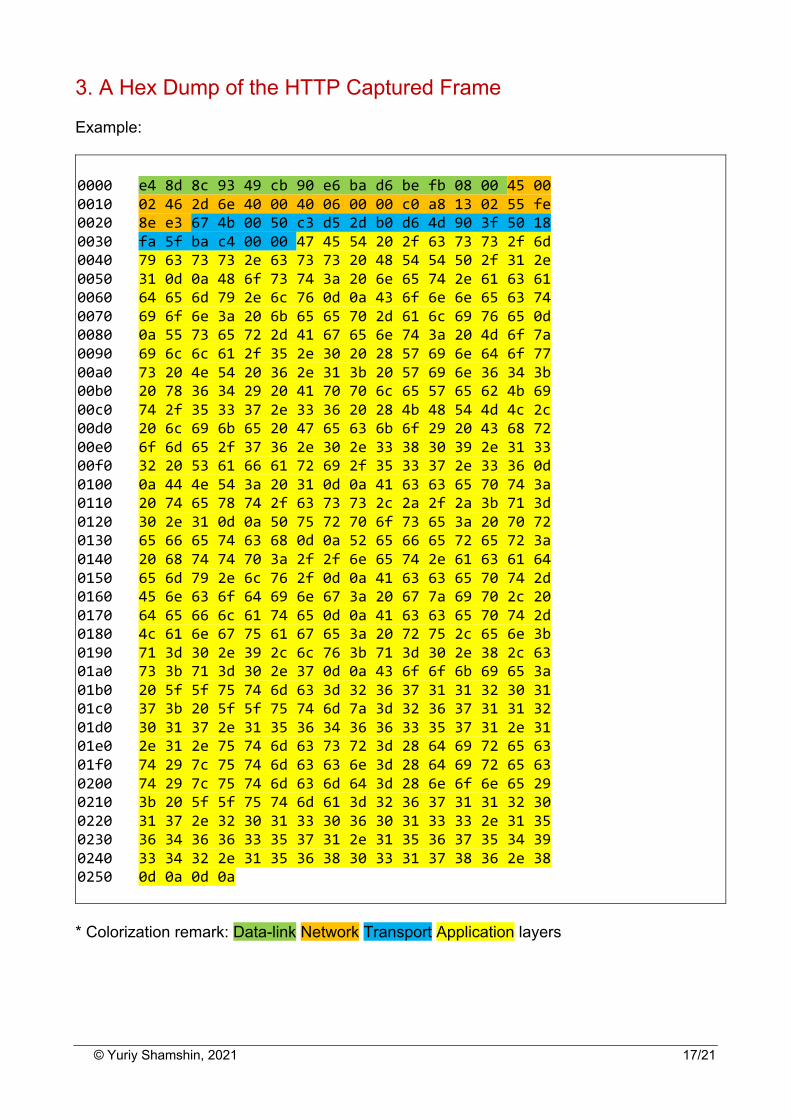
3. A Hex Dump of the HTTP Captured Frame
Example:
0000 e4 8d 8c 93 49 cb 90 e6 ba d6 be fb 08 00 45 00 0010 02 46 2d 6e 40 00 40 06 00 00 c0 a8 13 02 55 fe 0020 8e e3 67 4b 00 50 c3 d5 2d b0 d6 4d 90 3f 50 18 0030 fa 5f ba c4 00 00 47 45 54 20 2f 63 73 73 2f 6d 0040 79 63 73 73 2e 63 73 73 20 48 54 54 50 2f 31 2e 0050 31 0d 0a 48 6f 73 74 3a 20 6e 65 74 2e 61 63 61 0060 64 65 6d 79 2e 6c 76 0d 0a 43 6f 6e 6e 65 63 74 0070 69 6f 6e 3a 20 6b 65 65 70 2d 61 6c 69 76 65 0d 0080 0a 55 73 65 72 2d 41 67 65 6e 74 3a 20 4d 6f 7a 0090 69 6c 6c 61 2f 35 2e 30 20 28 57 69 6e 64 6f 77 00a0 73 20 4e 54 20 36 2e 31 3b 20 57 69 6e 36 34 3b 00b0 20 78 36 34 29 20 41 70 70 6c 65 57 65 62 4b 69 00c0 74 2f 35 33 37 2e 33 36 20 28 4b 48 54 4d 4c 2c 00d0 20 6c 69 6b 65 20 47 65 63 6b 6f 29 20 43 68 72 00e0 6f 6d 65 2f 37 36 2e 30 2e 33 38 30 39 2e 31 33 00f0 32 20 53 61 66 61 72 69 2f 35 33 37 2e 33 36 0d 0100 0a 44 4e 54 3a 20 31 0d 0a 41 63 63 65 70 74 3a 0110 20 74 65 78 74 2f 63 73 73 2c 2a 2f 2a 3b 71 3d 0120 30 2e 31 0d 0a 50 75 72 70 6f 73 65 3a 20 70 72 0130 65 66 65 74 63 68 0d 0a 52 65 66 65 72 65 72 3a 0140 20 68 74 74 70 3a 2f 2f 6e 65 74 2e 61 63 61 64 0150 65 6d 79 2e 6c 76 2f 0d 0a 41 63 63 65 70 74 2d 0160 45 6e 63 6f 64 69 6e 67 3a 20 67 7a 69 70 2c 20 0170 64 65 66 6c 61 74 65 0d 0a 41 63 63 65 70 74 2d 0180 4c 61 6e 67 75 61 67 65 3a 20 72 75 2c 65 6e 3b 0190 71 3d 30 2e 39 2c 6c 76 3b 71 3d 30 2e 38 2c 63 01a0 73 3b 71 3d 30 2e 37 0d 0a 43 6f 6f 6b 69 65 3a 01b0 20 5f 5f 75 74 6d 63 3d 32 36 37 31 31 32 30 31 01c0 37 3b 20 5f 5f 75 74 6d 7a 3d 32 36 37 31 31 32 01d0 30 31 37 2e 31 35 36 34 36 36 33 35 37 31 2e 31 01e0 2e 31 2e 75 74 6d 63 73 72 3d 28 64 69 72 65 63 01f0 74 29 7c 75 74 6d 63 63 6e 3d 28 64 69 72 65 63 0200 74 29 7c 75 74 6d 63 6d 64 3d 28 6e 6f 6e 65 29 0210 3b 20 5f 5f 75 74 6d 61 3d 32 36 37 31 31 32 30 0220 31 37 2e 32 30 31 33 30 36 30 31 33 33 2e 31 35 0230 36 34 36 36 33 35 37 31 2e 31 35 36 37 35 34 39 0240 33 34 32 2e 31 35 36 38 30 33 31 37 38 36 2e 38 0250 0d 0a 0d 0a
* Colorization remark: Data-link Network Transport Application layers

© Yuriy Shamshin, 2021 18/21
4. A Screenshots or Printout of the Captured HTTP Frame
4.1. Frame and Data-link layer (Ethernet)
Example:

© Yuriy Shamshin, 2021 19/21
4.2. Network layer (IP)
Example:

© Yuriy Shamshin, 2021 20/21
4.3. Transport layer (TCP)
Example:

© Yuriy Shamshin, 2021 21/21
4.4. Application layer (HTTP)
Example:


![[Lab Report] PSpice](https://static.fdokumen.com/doc/165x107/631a338ebb40f9952b01e638/lab-report-pspice.jpg)