The Wireshark Field Guide: Analyzing and Troubleshooting ...
149
-
Upload
khangminh22 -
Category
Documents
-
view
0 -
download
0
Transcript of The Wireshark Field Guide: Analyzing and Troubleshooting ...


The Wireshark Field Guide

This page intentionally left blank

The Wireshark Field GuideAnalyzing and TroubleshootingNetwork Traffic
Robert Shimonski
AMSTERDAM • BOSTON • HEIDELBERG • LONDONNEW YORK • OXFORD • PARIS • SAN DIEGO
SAN FRANCISCO • SINGAPORE • SYDNEY • TOKYOSyngress is an imprint of Elsevier

Acquiring Editor: Chris KatsaropoulosDevelopment Editor: Benjamin RearickProject Manager: Mohana Natarajan
Syngress is an imprint of Elsevier225 Wyman Street, Waltham, MA 02451, USA
First published 2013
Copyright r 2013 Elsevier Inc. All rights reserved.
No part of this publication may be reproduced or transmitted in any form or by any means,electronic or mechanical, including photocopying, recording, or any information storage andretrieval system, without permission in writing from the publisher. Details on how to seekpermission, further information about the Publisher’s permissions policies and our arrangementwith organizations such as the Copyright Clearance Center and the Copyright Licensing Agency,can be found at our website: www.elsevier.com/permissions.
This book and the individual contributions contained in it are protected under copyright by thePublisher (other than as may be noted herein).
NoticesKnowledge and best practice in this field are constantly changing. As new research andexperience broaden our understanding, changes in research methods, professional practices,or medical treatment may become necessary.
Practitioners and researchers must always rely on their own experience and knowledgein evaluating and using any information, methods, compounds, or experiments described herein.In using such information or methods they should be mindful of their own safety and the safetyof others, including parties for whom they have a professional responsibility.
To the fullest extent of the law, neither the Publisher nor the authors, contributors, or editors,assume any liability for any injury and/or damage to persons or property as a matter of productsliability, negligence or otherwise, or from any use or operation of any methods, products,instructions, or ideas contained in the material herein.
British Library Cataloguing in Publication DataA catalogue record for this book is available from the British Library
Library of Congress Cataloging-in-Publication DataA catalog record for this book is available from the Library of Congress
ISBN: 978-0-12-410413-6
For information on all Syngress publicationsvisit our website at www.syngress.com

DEDICATION
This book is dedicated to my wonderful children, Dylan Shimonskiand Vienna Shimonski. I love you!

This page intentionally left blank

CONTENTS
Preface................................................................................................ xiAbout the Author .............................................................................. xiiiAcknowledgment .................................................................................xvIntroduction.......................................................................................xvii
Chapter 1 About Wireshark ..................................................................1
1.1 Introduction....................................................................................11.2 What Is Wireshark? ........................................................................11.3 What Is Network and Protocol Analysis?.......................................31.4 The History of Wireshark...............................................................51.5 Troubleshooting Problems..............................................................81.6 Using Wireshark to Analyze Data..................................................91.7 The OSI Model.............................................................................131.8 Summary ......................................................................................15
Chapter 2 Installing Wireshark ...........................................................17
2.1 Introduction..................................................................................172.2 Getting Started .............................................................................182.3 Requirements................................................................................202.4 Installation Preparation ................................................................212.5 Installing Wireshark .....................................................................212.6 Summary ......................................................................................31
Chapter 3 Configuring a System .........................................................33
3.1 Introduction..................................................................................333.2 Getting Started .............................................................................333.3 Configuring a Cisco Port Monitor................................................363.4 Other Tools and Methodologies ...................................................413.5 Summary ......................................................................................44
Chapter 4 Capturing Packets ..............................................................45
4.1 Introduction..................................................................................454.2 Getting Started .............................................................................454.3 Summary ......................................................................................53
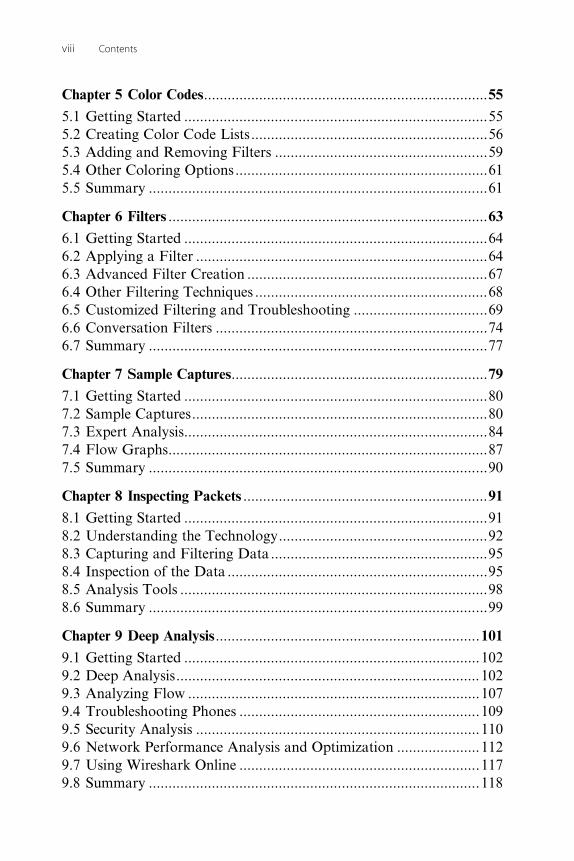
Chapter 5 Color Codes........................................................................55
5.1 Getting Started .............................................................................555.2 Creating Color Code Lists ............................................................565.3 Adding and Removing Filters ......................................................595.4 Other Coloring Options ................................................................615.5 Summary ......................................................................................61
Chapter 6 Filters .................................................................................63
6.1 Getting Started .............................................................................646.2 Applying a Filter ..........................................................................646.3 Advanced Filter Creation .............................................................676.4 Other Filtering Techniques ...........................................................686.5 Customized Filtering and Troubleshooting ..................................696.6 Conversation Filters .....................................................................746.7 Summary ......................................................................................77
Chapter 7 Sample Captures.................................................................79
7.1 Getting Started .............................................................................807.2 Sample Captures...........................................................................807.3 Expert Analysis.............................................................................847.4 Flow Graphs.................................................................................877.5 Summary ......................................................................................90
Chapter 8 Inspecting Packets ..............................................................91
8.1 Getting Started .............................................................................918.2 Understanding the Technology.....................................................928.3 Capturing and Filtering Data .......................................................958.4 Inspection of the Data ..................................................................958.5 Analysis Tools ..............................................................................988.6 Summary ......................................................................................99
Chapter 9 Deep Analysis ...................................................................101
9.1 Getting Started ...........................................................................1029.2 Deep Analysis............................................................................. 1029.3 Analyzing Flow ..........................................................................1079.4 Troubleshooting Phones .............................................................1099.5 Security Analysis ........................................................................1109.6 Network Performance Analysis and Optimization .....................1129.7 Using Wireshark Online .............................................................1179.8 Summary ....................................................................................118
viii Contents

Chapter 10 Saving Captures..............................................................119
10.1 Getting Started .........................................................................12010.2 Saving Captures ........................................................................12010.3 Saving Captures (Multiple Files) ..............................................12110.4 Saving in Other Formats ..........................................................12310.5 Importing and Exporting Data .................................................12510.6 Merging Data ...........................................................................12610.7 Summary .................................................................................. 128
ixContents

This page intentionally left blank

PREFACE
Welcome to The Wireshark Field Guide: Analyzing and TroubleshootingNetwork Traffic book, your guide to get up to speed using Wireshark ina quick and efficient manner. This book provides hackers, pen testers,and network administrators with practical guidance on capturing andinteractively browsing the traffic running on a computer network.Wireshark is the world’s foremost network protocol analyzer, with arich feature set that includes deep inspection of hundreds of protocols,live capture, offline analysis, and many other features.
Wireshark is a multiplatform application that can be set up and putto work in minutes to help analyze and troubleshoot some of the mostcomplex security problems found today. This book covers the installa-tion, configuration, and use of this powerful tool. It provides readerswith the hands-on skills to be more productive with Wireshark as theydrill down into the information contained in real-time network traffic.
• Learn the fundamentals of using Wireshark in a concise fieldmanual.
• Quickly create functional filters that will allow you to get to workquickly on solving problems.
• Understand the myriad of options and the deep functionality ofWireshark to get working quicker.
• Solve common problems seen in networks today with what is taughtin this guide.
• Learn some advanced features, methods, and helpful ways to workquicker and more efficient.
The goal of this book is to teach the basics quickly in a very shortformat publication. Use the following link and similar other links foundat the books companion website www.learnwireshark.com.

This page intentionally left blank

ABOUT THE AUTHOR
Robert Shimonski (www.shimonski.com) is a best-selling author and edi-tor with over 15 years experience developing, producing, and distributingprint media in the form of books, magazines, and periodicals. To date,Rob has successfully created over 100 books that are currently in circu-lation. Rob has worked for countless companies including CompTIA,Entrepreneur Magazine, Microsoft, McGraw-Hill Education, Cisco, theNational Security Agency, and Digidesign.
Rob also has over 15 years experience in direct support of networkinfrastructures and systems and has spent a considerable amount of thattime in leading teams in operational support and engineering architec-ture. Rob authored the award-winning Syngress book Sniffer ProNetwork Optimization and Troubleshooting Handbook back in 2002.He has also contributed to many other network and security-relatedpublications on penetration, security design, network analysis, and sys-tems engineering. He can be reached online at www.shimonski.com orat www.learnwireshark.com.

This page intentionally left blank

ACKNOWLEDGMENT
I would like to thank all who made this book possible. Special thanksto Pete Cheung for his technical help in creating this book and toChris and Ben for their assistance in producing this book.

This page intentionally left blank

INTRODUCTION
Welcome to the Syngress “Wireshark Field Guide,” your indispensablecompanion to using Wireshark successfully and solving problems withone of the most commonly used tools in the networking arena today.In this concise text, I will cover how to acquire Wireshark, what youneed to know about it to get it up and running and then using it tohelp solve problems.
For over two decades, the need for an understanding of protocolanalysis has grown as the networks we rely on to connect our compu-ters, mobile devices, and systems to use the Internet, access the cloud,and work within our corporate networks have also grown. As morereliance on using the network becomes the norm, solving problemsquickly is also becoming increasingly more important.
As we will learn in this book, Wireshark (as well as other protocolanalysis tools) is used often to help find and solve problems on internet-works for all sizes. In this book, we will cover the following sections:
ABOUT WIRESHARK
Experienced network technicians, operators, and engineers across theglobe use Wireshark and tools of its kind to solve problems and wewill cover not only the nuts and bolts of using it but also why we do.In this section, we will briefly go over the history of Wireshark as wellas to discuss the use of packet capture and analysis in the field of net-working. First, we need to understand the history of Wireshark andpacket capture and analysis to get a solid understanding of the purposeof using this tool. An in-depth look at Wireshark, its features, and thetoolset are covered as well as a granular look at the specifics of whyprotocol capture and analysis is so critical to solving problems.
INSTALLING WIRESHARK
In this chapter of the book, we will cover how to get Wireshark, installit, and set it up for use on a computer. We will cover how the tool
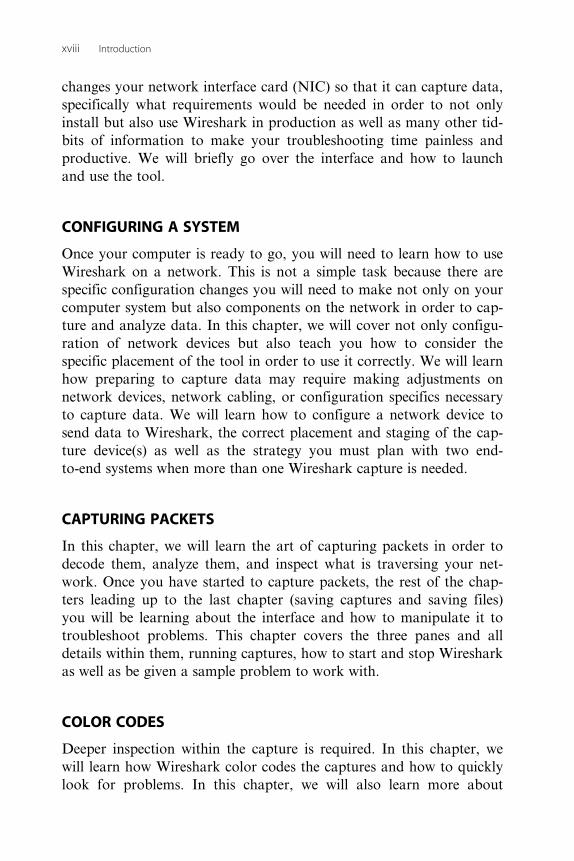
changes your network interface card (NIC) so that it can capture data,specifically what requirements would be needed in order to not onlyinstall but also use Wireshark in production as well as many other tid-bits of information to make your troubleshooting time painless andproductive. We will briefly go over the interface and how to launchand use the tool.
CONFIGURING A SYSTEM
Once your computer is ready to go, you will need to learn how to useWireshark on a network. This is not a simple task because there arespecific configuration changes you will need to make not only on yourcomputer system but also components on the network in order to cap-ture and analyze data. In this chapter, we will cover not only configu-ration of network devices but also teach you how to consider thespecific placement of the tool in order to use it correctly. We will learnhow preparing to capture data may require making adjustments onnetwork devices, network cabling, or configuration specifics necessaryto capture data. We will learn how to configure a network device tosend data to Wireshark, the correct placement and staging of the cap-ture device(s) as well as the strategy you must plan with two end-to-end systems when more than one Wireshark capture is needed.
CAPTURING PACKETS
In this chapter, we will learn the art of capturing packets in order todecode them, analyze them, and inspect what is traversing your net-work. Once you have started to capture packets, the rest of the chap-ters leading up to the last chapter (saving captures and saving files)you will be learning about the interface and how to manipulate it totroubleshoot problems. This chapter covers the three panes and alldetails within them, running captures, how to start and stop Wiresharkas well as be given a sample problem to work with.
COLOR CODES
Deeper inspection within the capture is required. In this chapter, wewill learn how Wireshark color codes the captures and how to quicklylook for problems. In this chapter, we will also learn more about
xviii Introduction

protocols, ports, and other critical network-based information that willhelp you solve problems.
FILTERS
How to filter captures correctly is the key to finding problems especiallywhen running Wireshark on networks where a lot of data traverses.Consider capturing data from one system communicating withanother . . . what would you specifically search for to help solve a prob-lem? Filtering on protocols, IP addresses and using specific Booleanarguments commonly used today are covered as well as specific exampleof filters that you can use right away to help get you up and runningwith Wireshark immediately.
SAMPLE CAPTURES
In this chapter, we will expand on what we learned in the Filters chap-ter by covering some advanced problems, how to solve them usingWireshark, and the more complex use of analysis by applying more fil-ters and reviewing expert analysis reports.
INSPECTING PACKETS
As we learn more about Wireshark, we will discuss problems found ona network and specifically why they occur from the packet level. Inthis chapter, we will take an in-depth look at a few common (and notso common) problems and what you are looking for in the packets,how to use the tool to get and view this information, and how to useWireshark to solve them. We will also look at other tools you can useto augment the use of Wireshark to solve complex network and systemissues.
DEEP ANALYSIS
In this chapter, we take a deeper look into the packets in order todefine and find root cause of problems as well as how to useWireshark and other enterprise tools to solve problems that occur overwide area network links. We will learn about probes, taps, and how allof these tools can be used together to create a complete picture to helpyou not only understand why data traverses a network a certain way
xixIntroduction

but also why it chooses specific paths, how it interacts with destinationsystems, and what could go wrong within those conversations. We willlook at voice over IP (VoIP) problems, malicious software issues, howintrusion detection/prevention, scanning, and many other serviceswork on a network and how Wireshark can help you work with themwhen solving issues.
SAVING CAPTURES
Once you are completed with your analysis, you may want to save andarchive your files for future use. This chapter covers file formats, howto use capture files with other protocol analysis systems, how to gener-ate reports and more.
Now, let us get our hands dirty and starting inspecting data to solveproblems!
xx Introduction

CHAPTER 11About Wireshark
1.1 INTRODUCTION ...................................................................................1
1.2 WHAT IS WIRESHARK? .......................................................................1
1.3 WHAT IS NETWORK AND PROTOCOL ANALYSIS? .........................3
1.4 THE HISTORY OF WIRESHARK ..........................................................5
1.5 TROUBLESHOOTING PROBLEMS ......................................................8
1.6 USING WIRESHARK TO ANALYZE DATA..........................................9
1.7 THE OSI MODEL ............................................................................... 13
1.8 SUMMARY ......................................................................................... 15
1.1 INTRODUCTION
Experienced network technicians, operators, and engineers across theglobe use Wireshark and tools of its kind to solve problems and we willcover the how and why. In this section, we will briefly go over the his-tory of Wireshark as well as to discuss the use of packet capture andanalysis in the field of networking. First, we need to understand the his-tory of Wireshark and packet capture, and analysis to get a solid under-standing of the purpose of using this tool. Once we cover Wireshark’shistorical background, we will cover the most current release, how toget it and what you need to prepare for an install and setup of the prod-uct. We will also cover the fundamentals of packet capture and analysisso that you are aware of what the tool is inherently used for.
This book can be used by beginners and those new to networking, how-ever, having a background and solid knowledge on the topic will makereading, understanding, and absorbing this book much easier.
1.2 WHAT IS WIRESHARK?
Protocol capture and analysis is nothing new, it is actually beenaround for decades. With the release of UNIX systems, many tools

contained directly in the operating system allowed for the capture andreview of packet level data for the purpose of solving problems. Asdata moves across a network from client to server or to printers, acrosswireless access points, and across the Internet, it moves in the form ofelectrical signals and frequencies. A packet capture tool (also called anetwork analyzer) can be used to capture this data for analysis. A net-work analyzer is a troubleshooting tool that is used to find and solvenetwork communication problems, plan network capacity, and per-form network optimization. Network analyzers can capture all thetraffic that is going across your network and interpret the capturedtraffic to decode and interpret the different protocols in use. Thedecoded data is shown in a format that makes it easy to understand,peeling away the layers of encapsulated data that is used to identify itor enable it to be used on the network. A network analyzer can alsocapture only traffic that matches the selection criteria as defined by afilter. This allows a technician to capture only traffic that is relevant tothe problem at hand. A typical network analyzer displays the decodeddata in three panes:
• Summary: Displays a one-line summary of the highest layer proto-col contained in the frame, as well as the time of the capture andthe source and destination addresses.
• Detail: Provides details on all the layers inside the frame.• Hex: Displays the raw captured data in hexadecimal format.
Figure 1.1 shows the Wireshark tool with captured data ready forinspection. In the figure, we can see all three panes in use. From top tobottom, you can see the Summary, Detail, and Hex panes. TheSummary pane shows the high-level detail, such as sequence number-ing of captured packets, the time captured, source and destinationaddress, protocol used, length, and other information. If you select apacket in the summary pane, you can see more granular detail in thedetail pane. By drilling down even further, you can select details in theDetail pane and see the specific hex data captured in the Hex pane.
As we work through this guide, we will dig deeper into each paneand learn exact specifics on how to use it, interpret what is in it, andtroubleshoot problems. Network analyzers further provide the abilityto create display filters so that a network professional can quickly findwhat he or she is looking for.
2 The Wireshark Field Guide

Advanced network analyzers provide pattern analysis capabilities.This feature allows the network analyzer to go through thousands ofpackets and identify problems. The network analyzer can also providepossible causes for these problems and hints on how to resolve them.
1.3 WHAT IS NETWORK AND PROTOCOL ANALYSIS?
Electronic distribution of information is becoming increasingly impor-tant, and the complexity of the data exchanged between systems isincreasing at a rapid pace. Computer networks today carry all kinds ofdata, voice, and video traffic. Network applications require full avail-ability without interruption or congestion. As the information systemsin a company grow and develop, more networking devices aredeployed, resulting in large physical ranges covered by the networkedsystem. It is crucial that this networked system operates as effectivelyas possible, because downtime is both costly and an inefficient use ofavailable resources. Network and/or protocol analysis is a range of
Figure 1.1 Using Wireshark.
3About Wireshark

techniques that network engineers and technicians use to study theproperties of networks, including connectivity, capacity, and perfor-mance. Network analysis can be used to estimate the capacity of anexisting network, look at performance characteristics, or plan forfuture applications and upgrades.
One of the best tools for performing network analysis is a networkanalyzer like Wireshark. A network analyzer is a device that gives youa very good idea of what is happening on a network by allowing youto look at the actual data that travels over it, packet by packet. A typi-cal network analyzer understands many protocols, which enables it todisplay conversations taking place between hosts on a network.Wireshark can be used in this capacity.
Network analyzers typically provide the following capabilities:
• Capture and decode data on a network• Analyze network activity involving specific protocols• Generate and display statistics about the network activity• Perform pattern analysis of the network activity.
Packet capture and protocol decoding is sometimes referred to as “sniff-ing.” This term came about because of the nature of the network analy-zers ability to “sniff” traffic on the network and capture it.
Figures 1.1 and 1.2 show the Wireshark tool with captured datawith a typical problem seen on network today—an address resolutionprotocol (ARP) storm. Figure 1.2 allows you to look deeper into the
Figure 1.2 Performing protocol analysis.
4 The Wireshark Field Guide

data in order to troubleshoot the issue. Although we will get moreinvolved in later chapters covering how to inspect traffic in detail, hereyou can see how a network analyzer performs “protocol analysis.”
When decoding the capture of ARP packets, we can drill down intothe tool (and the packets) to find the source and destination addressesof the storm. Now, Wireshark cannot solve all of your problems with-out some help! First, it takes you the technician with the inquisitivemind to first understand where to place Wireshark to capture thisdata. It then takes some inspect and analysis work to review what wascaptured and at minimum a basic understanding on how data workson a network. It also takes detective work on your part. . . you willneed to know how to trace this ARP problem (in the form of a MACaddress) to the offending client causing the storm. You will then needto know how to fix said problem. As you can see, protocol captureand analysis with a network analyzer tool like Wireshark only helpsyou begin to paint a picture of a problem, it does not always solve itdirectly for you.
•••Beware of false positives. What this means is, you may see a problem,however, it is in fact not a problem but normal behavior. You may get acapture or a report from a network analyzer that may instruct you that aproblem exists when it in fact does not. Using a network analyzer andperforming network analysis is a function of a scientific mind. You notonly need to question what you see but you may also need to conductfurther testing and analysis to find root cause of a problem. Do not jumpto conclusions, scientifically sort out the data, analyze and conductresearch, discuss possibilities with peers and colleagues if you are not sureof your findings.
1.4 THE HISTORY OF WIRESHARK
Wireshark (http://www.wireshark.org/) is a software application usedto capture and inspect protocol level data. As data traverses a networkfrom clients to servers (as an example), the data is sent and althoughthere are many tools of its kind, it is a tool that can be freely down-loaded on the Internet. The history of Wireshark is one of many twistsand turns. Although the tool has always been for the most part veryreliable and incredibly useful, it has changed names and hands quite afew times.
5About Wireshark

One of the first well-known versions of Wireshark came in the formof Ethereal. Due to copyright issues and legal problems, the name waschanged to Wireshark. We can, however, start this tools history backwhen it was named Ethereal. Ethereal (and its new form Wireshark) isan open-source freeware network analyzer available freely for down-load and can be used on many computer system platforms. In itsinfancy, tools such as Sniffer Pro were more robust and somewhatcostly. Other tools like those sold by Fluke Networks were not onlycostly but also distributed with hardware raising its cost. Etherealwhen released was not as robust and provided protocol decode fea-tures, however, lacked a number of features that the other tools avail-able provided, such as the ability to monitor applications, expertanalysis, advanced reporting tools, and the ability to capture mangledframes. Wireshark is the current version of the Ethereal tool, whichnow handles expert analysis and many of the other features that weremissing from previous versions.
WinPcap (http://www.winpcap.org/) is the “other” application thatmust be used with Wireshark. WinPcap is nothing more than a librarythat Wireshark pulls from within a Windows system. Non-Windowsbased systems may use libcap. Either one used supplies a driver thatallows for the capture of packets at the system and hardware level. Wewill learn in the next chapter that your network interface card (NIC)must be used in promiscuous mode in order to capture packets, andWireshark uses these libraries to facilitate that functionality. Whenyou download and use Wireshark, this set of libraries comes with itand must be installed with Wireshark in order to use it. This library sethas been produced and distributed by a company named CACE(http://www.cacetech.com/).
A few years ago, CACE was purchased by a company namedRiverbed (http://www.riverbed.com/), which is also a provider of net-work analysis and reporting tools, software, and hardware. WithRiverbed behind CACE and supporting Wireshark, it is likely that thispowerhouse trio of groups can not only bring network analysis to anew level but also give Wireshark more steam to grow into an evenmore robust application than it is today.
6 The Wireshark Field Guide

Using tcpdump
Tcpdump (http://www.tcpdump.org/) is a protocol capture/packet ana-lyzer that is used at the command line. Much like Wireshark [which usesa graphical user interface (GUI)], it captures packets and shows specificdetails about them which can be used for granular analysis of a problem.It also worked with libcap and puts the NIC in promiscuous mode allow-ing for the capturing of packets. It shows at the command line detailsand can be tailors with switches to show more or less specific detail. It isextremely helpful when you need to capture data at the time of problemas it is normally always installed and ready on most systems, primarilyUNIX based. It is also freely available with the operating system youinstall.
Figure 1.3 shows the use of tcpdump on a UNIX system. Here we canview the conversations between two hosts, the one it is installed on (thesource) and the destination address it is communicating with.
As you can see here, it is very easy to use and manipulate. You canget much of the same data out of tcpdump as you can with Wireshark,however, Wireshark will provide you with more bells and whistles, suchas an easy to use GUI, an expert analysis tool, and reporting tools.
You can also find tcpdump on many of the UNIX-based firewallsdeployed today. Firewalls, such as those from McAfee and Juniper, havetcpdump integrated into their toolsets so that they can be quickly invokedto solve or report on a problem.
Figure 1.3 Using tcpdump.
7About Wireshark

•••For those who use Windows based systems, you can download and installWinDump, which is the Windows version of tcpdump. Like tcpdumpuses libcap, WinDump like Wireshark on Windows uses WinPcap. ForWindows 7, Windows 8, and Server 2008 SP2, the “netsh trace start cap-ture5 yes” command is a good alternative to tcpdump. No installation isrequired to capture packets.
1.5 TROUBLESHOOTING PROBLEMS
Now that we have learned about protocol capture and analysis, andhow Wireshark fits into the picture, let us continue to expand on its useby discussing how Wireshark can be used to analyze data. Although wewill go into greater detail as we progress through this book, it is worth-while to introduce the topic so we can begin to build on it.
When you work with a network or are directly responsible for it, youwill often hear that there are problems with it. Some are common helpdesk requests from users who have problems remembering their systempasswords, and others are calls from users who cannot login becausetheir network cable got unplugged again. Although these are commonproblems, and annoying at times, they are easily fixed through a quickseries of troubleshooting steps and usually require a simple solution.
Next on the complaint list are the calls from users who say that thenetwork is too slow. That is a common complaint, but what happenswhen almost all the users on your network call en masse to complainabout the speed of their logins, hanging applications, or timed out ses-sions? Obviously, there could be a problem with network performanceif the majority of your users call to complain. Where do you begin tolook for the source of this problem? With enterprise networks growingand connecting to other companies’ networks increasingly rapidly,monitoring network performance can become a cumbersome task.
To investigate problems and attempt to find root cause you need to ini-tially isolate a problem, monitor the network’s performance usingWireshark, and then work to correct the issues. If performance is the issue,what are the many things we can look at in the map to troubleshoot wherethe problems are occurring and how to diagnose them correctly? Questionsyou need to ask immediately upon starting performance analysis are:
• Is poor network performance affecting one user, several users, orthe entire network?
8 The Wireshark Field Guide

• Is the poor performance centered at a particular location or theentire network?
• When exactly did you start noticing poor performance or has italways been bad?
• Have any recent changes taken place—no matter how large orsmall?
• Are all applications at a particular location experiencing problems,or are problems localized to a specific application?
• Do you have any network documentation or topology maps?
These are but a sampling of the questions that could be asked butsome of the most common. Ultimately, we will want to use Wiresharkto troubleshoot and solve problems but it must be manipulated bysomeone such as yourself who knows how to uncover problems.Finding the root cause of a problem is what we can use this tool toaccomplish at a granular level if your detective work is done correctly.You will want to capture data from the network, analyze it and usecommon network model, knowledge of protocols and specific method-ology to assist in analyzing the problem and the data captured.
1.6 USING WIRESHARK TO ANALYZE DATA
The key to successful troubleshooting is knowing how the network func-tions under normal conditions. This knowledge allows a network engi-neer to quickly recognize abnormal operations. Using a strategy fornetwork troubleshooting, the problem can be approached methodicallyand resolved with minimum disruption to customers. Unfortunately,many network professionals with years of experience have not masteredthe basic concept of troubleshooting; a few minutes spent evaluating thesymptoms can save hours of time lost chasing the wrong problem.
A good approach to problem resolution involves these steps:
• Recognizing symptoms and defining the problem• Isolating and understanding the problem• Identifying and testing the cause of the problem• Solving the problem• Verifying that the problem has been resolved• If the problem is not found, reiterate until resolved or use to find
more data to analyze.
The first step toward trying to solve a network issue is to recognizethe symptoms. You might hear about a problem in one of many ways:
9About Wireshark

an end user might complain that he or she is experiencing performanceor connectivity issues, or a network management station might notifyyou about it. Compare the problem to normal operation. Determinewhether something was changed on the network just before the prob-lem started. In addition, check to make sure you are not troubleshoot-ing something that has never worked before. Write down a cleardefinition of the problem.
Once the problem has been confirmed and the symptoms identified,the next step is to isolate and understand the problem. When the symp-toms occur, it is your responsibility to gather data for analysis and to nar-row down the location of the problem. The best approach to reduce theproblem’s scope is to use divide-and-conquer methods. Try to figure outif the problem is related to a segment of the network or a single station.Determine if the problem can be duplicated elsewhere on the network.
The third step in problem resolution is to identify and test the causeof the problem. You can use network analyzers and other tools to ana-lyze the traffic. After you develop a theory about the cause of theproblem, you must test it.
Once a resolution to the problem has been determined, it should beput in place. The solution might involve upgrading hardware or soft-ware. It may call for increasing LAN segmentation or upgrading hard-ware to increase capacity.
The final step is to ensure that the entire problem has been resolvedby having the end customer test for the problem. Sometimes a fix forone problem creates a new problem. At other times, the problem yourepaired turns out to be a symptom of a deeper underlying problem. Ifthe problem is indeed resolved, you should document the steps youtook to resolve it. If, however, the problem still exists, the problem-solving process must be repeated from the beginning.
To understand network analysis, it is very important to learn thetheory behind how networks operate. For a network to work, the com-puters running on it need to agree on a set of rules. Such a set of rulesis known as a protocol. A protocol in networking terms is very similarto a language in human terms. Two computers using different proto-cols to talk to each other would be like someone trying to communi-cate in Japanese to another person who did not understand thatlanguage. It simply would not work!
10 The Wireshark Field Guide
Many protocols exist in today’s world of network communication.In the early days of networking, each networking vendor wrote its ownprotocol. Eventually, standards were developed so that devices frommultiple vendors could communicate with each other using a commonprotocol. The most commonly used protocol is the transmission con-trol protocol/Internet protocol (TCP/IP).
We will cover the granular details of TCP/IP in later chapters when webegin digging into the packets we captured.
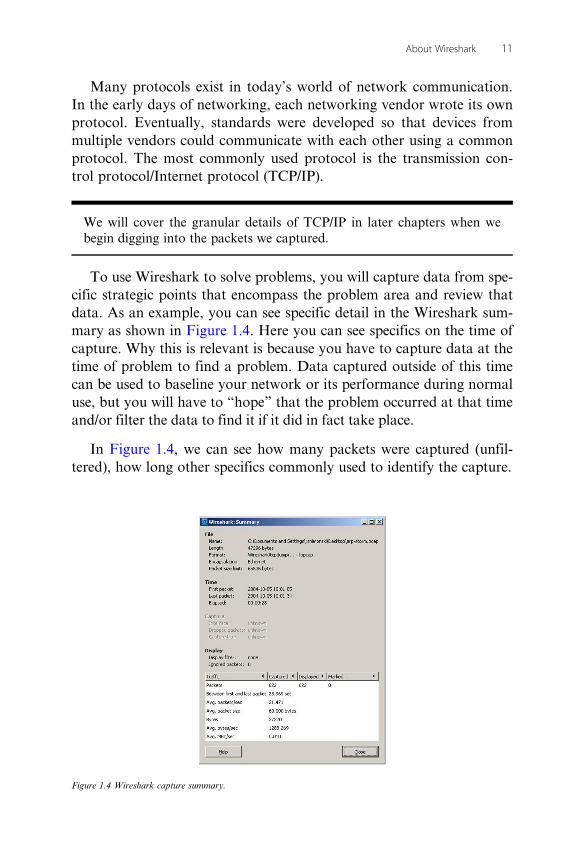
To use Wireshark to solve problems, you will capture data from spe-cific strategic points that encompass the problem area and review thatdata. As an example, you can see specific detail in the Wireshark sum-mary as shown in Figure 1.4. Here you can see specifics on the time ofcapture. Why this is relevant is because you have to capture data at thetime of problem to find a problem. Data captured outside of this timecan be used to baseline your network or its performance during normaluse, but you will have to “hope” that the problem occurred at that timeand/or filter the data to find it if it did in fact take place.
In Figure 1.4, we can see how many packets were captured (unfil-tered), how long other specifics commonly used to identify the capture.
Figure 1.4 Wireshark capture summary.
11About Wireshark

Figure 1.5 shows another tool you can use within the Wiresharkprogram. For example, let us say you had an issue and wanted to getWireshark’s opinion as to what it thinks the problem could be. Youcan ask the Expert and find out. Although this is not always accurateinformation due to false positives, you can start to gain clues. Datatraversing your network may be flagged as problematic, but it may bethe way the data functions normally so therefore it may not indicate aproblem, or point out the specific problem that was reported.
Figure 1.6 shows more granular data that can be obtained fromWireshark’s Expert. Here we can review more “hints,” but more so wecan drill down further from this tool back into Wireshark’s Summarypane to go directly to the packet that was flagged in order to generatean Expert message or alert.
In Figure 1.6, we can see specific problems that may be occurringin sequencing. Another helpful tip would be to expand the sequencedata that was flagged and double click the packet flagged to inspectthat specific packet in the Summary, Detail, and Hex panes.
Figure 1.5 Using the Wireshark expert analysis tabs.
Figure 1.6 Viewing problems with Wireshark expert.
12 The Wireshark Field Guide

Do not always trust what Wireshark tells you. False positives can mis-lead you. It may steer you in the wrong direction. It is, however, a goodway for you to begin using the tool in order to better understand yournetwork, the data traversing it, and the TCP/IP stack.
1.7 THE OSI MODEL
The open systems interconnection (OSI) model is used to provide amethodical way to approach how data traverses networks, systems,and operates with application used on those computers and networks.It is a helpful tool that seems to be timeless as it is continuously refer-enced and used today since its inception many years ago. Foundedfrom the Department of Defense (DoD) four-layer model back whenthe Internet (ARPAnet) was first conceived, it serves as a way to helpnot only describe how data traverses systems and networks but also anoutstanding tool that can be used to help troubleshoot problems.
When the data arrives at its destination, the receiving station’s physi-cal layer picks it up and performs the reverse process (also known asdecapsulation). The physical layer converts the bits back into frames topass on to the data link layer. The data link layer removes its headerand trailer and passes the data on to the network layer. Once again, thisprocess repeats itself until the data reaches all the way to the applicationlayer. In Figure 1.7, we see the layers of the OSI model.
The layers of the OSI model are described as follows:
Application layer: This topmost layer of the OSI model is responsiblefor managing communications between network applications. Thislayer is not the application itself, although some applications may per-form application layer functions. Examples of application layer proto-cols include file transfer protocol (FTP), hypertext transfer protocol(HTTP), simple mail transfer protocol (SMTP), and Telnet.Presentation layer: This layer is responsible for data presentation,encryption, and compression.Session layer: The session layer is responsible for creating and man-aging sessions between end systems. The session layer protocol isoften unused in many protocols. Examples of protocols at the ses-sion layer include NetBIOS and remote procedure call (RPC).
13About Wireshark

Transport layer: This layer is responsible for communicationbetween programs or processes. Port or socket numbers are used toidentify these unique processes. Examples of transport layer proto-cols include TCP, user datagram protocol (UDP), and SPX.Network layer: This layer is responsible for addressing and deliver-ing packets from the source node to the destination node. The net-work layer takes data from the transport layer and wraps it inside apacket or datagram. Logical network addresses are generallyassigned to nodes at this layer. Examples of network layer protocolsinclude IP and IPX.Data link layer: This layer is responsible for delivering framesbetween NICs on the same physical segment. It is subdivided intothe media access control (MAC) layer and the logical link control(LLC) layer. Communication at the data link layer is generallybased on hardware addresses. The data link layer wraps data fromthe network layer inside a frame. Examples of data link layer proto-cols include Ethernet, the now almost defunct token ring, andpoint-to-point protocol (PPP). Devices that operate at this layerinclude bridges and switches.
OSI model
Layer 1Physical layer
Layer 2Data link layer
Layer 3Network layer
Layer 4Transport layer
Layer 5Session layer
Layer 6Presentation layer
Layer 7Application layer
Figure 1.7 The OSI model.
14 The Wireshark Field Guide

Physical layer: This layer defines connectors, wiring, and the speci-fications on how voltage and bits pass over the wired (or wireless)media. Devices at this layer include repeaters, concentrators, andhubs. Devices that operate at the physical layer do not have anunderstanding of paths.
When using Wireshark, you must consider the methodologies usedto troubleshoot with as well as how the data works on networks andsystems. Knowing how to launch and run the tool is not enough! Youneed to specifically know where to place it, when to run it, and what itis you will capture. You will then need to analyze which tests yourknowledge of networks, computers, applications, and systems.
1.8 SUMMARY
In this chapter, we have learned about protocol capture and analysis,learned the fundamentals of Wireshark as well as the fundamentals oftroubleshooting with it. In the next chapter, we will learn how toinstall and setup Wireshark so that you can begin to use and workwith it.
15About Wireshark

This page intentionally left blank

CHAPTER 22Installing Wireshark
2.1 INTRODUCTION ................................................................................ 17
2.2 GETTING STARTED........................................................................... 18
2.3 REQUIREMENTS................................................................................ 20
2.4 INSTALLATION PREPARATION ....................................................... 21
2.5 INSTALLING WIRESHARK ................................................................ 21
2.6 SUMMARY ......................................................................................... 31
2.1 INTRODUCTION
Understanding a network, how it works and why we use tools such asWireshark is only the beginning . . . now we must build our toolkit inorder to get to work. In this chapter of the book we will cover how toget Wireshark, install it, and set it up for use on a computer. We willcover how the tool changes your NIC so that it can capture data, spe-cifically what requirements would be needed in order to not onlyinstall but use Wireshark in production as well as many other tidbitsof information to make your troubleshooting time painless and pro-ductive. We will briefly go over the interface and how to launch anduse the tool.
To use this field guide to its fullest potential, you must have a workingWireshark instance running on a computer system that is stable andvirus-free. It is assumed that before you begin installing Wireshark foruse, that your computer is network-capable and fully operational.Wireshark uses a lot of system resources, so make sure that whatever sys-tem you choose to work with is one you can preferably dedicate to thistask alone. It is also recommended that any computer system you usefor the purpose of packet capture and analysis be one that isportable whenever possible.

2.2 GETTING STARTED
Now that we have covered the basics and have an overview of whatWireshark can do for you and where you are going to apply this tech-nology, next we need to get the product installed and running on acomputer system so we can use it. In this chapter, you will learn howto acquire, prep, and install Wireshark.
First, you will need to consider where you will install Wireshark.There are many options for placement. For example, if you were trou-bleshooting a client to server connection problem on your network,you can simply install Wireshark on the offending client and problem-atic server. Since you don’t know where the problem is and/or if it’sthe client or server itself, you need to do some investigation work.Once you figure out your placement points, download or copy theWireshark executable program to each system and run the installationuntil completed. This is typical of how to use Wireshark and commonpractice for most network engineers. Figure 2.1 shows a very simplisticnetwork segment with two client computer systems and two server sys-tems connected together with a network switch.
Although this is a simplistic diagram and the network seems small, itdoesn’t change much when planning the installation of Wireshark on alarge-scale enterprise network. Even if you had wide area network con-nections, firewalls and layers of network components between the client
Install Wireshark on the client
Install Wireshark on the server
Figure 2.1 Planning Wireshark placement.
18 The Wireshark Field Guide

and the server, you would still want to place Wireshark on the same sys-tems you are having problems with. What changes is how you will readthe captures taking into consideration all of the complexity foundbetween the problem hosts.
Another common option and the one we will model our installationafter here in this chapter is the preparation of a mobile computer (suchas a laptop) that you can take with you and configure on the networkfor use. This is a more complicated way to use Wireshark, however,the least intrusive to your systems. Figure 2.2 shows a very simplisticnetwork segment with two client computer systems and two server sys-tems connected together with a network switch. In this scenario, wewill not install Wireshark on the client system having a problem foundon port 1/1 of the network switch and instead use Wireshark connectedon port 1/3. The server on port 1/2 for purposes of this discussion willhave Wireshark installed on it.
In this scenario, you would have to apply a secondary configurationon the network switch to send traffic from port 1/1 to port 1/3 forWireshark to capture. This is called port spanning and/or port mirror-ing. We will cover this in depth in Chapter 3.
Not all network switches support port spanning or mirroring. There areother ways to perform analysis and we will cover these steps in Chapter 3.
Port 1/1
Port 1/3
Port 1/2
Install Wireshark on the server
Wireshark installed on mobile system
Figure 2.2 Planning Wireshark placement.
19Installing Wireshark

The point to be made here is this . . . you will need to know how toinstall and configure Wireshark for use in and around your network (or aclient’s network) without fail and configure it as well on adjacent systemsfor you to get the most out of it. Let’s take a look at what requirementsare needed to get Wireshark up and running anywhere on the network.
If you do not set up the software correctly, you might not get accuratedata. If you do not span a port, you may not capture the traffic youintend to see, if you install Wireshark on a system that cannot useWireshark you might not see accurate data; if this data is not picked upwith a promiscuously set NIC, you will not receive accurate data to helpsolve a problem. If you do not span a port you may not capture networktraffic destined for a specific host. Although we will continue to learn thespecifics of this throughout the book it is important to reinforce thesefacts before installing and using Wireshark.
2.3 REQUIREMENTS
As we just learned, you may be tasked with installing Wireshark morethan just once. Therefore, it’s imperative to learn what you need to getit running quickly and how much pressure it puts on your system.Let’s cover a few important pieces of information that are vital to yoursuccessful use of Wireshark.
• If your system does not have proper hardware resources it will notbe able to run Wireshark.
• If your system is not stable it may crash while running Wireshark.• If your system is not compatible (software and hardware) you will
not be able to install or have problems after installation.• You need administrative rights to the system in which you will
install Wireshark on.
Make sure you have a large disk drive and plenty of memory to runWireshark and capture data. A large disk drive is needed for runningand storing large captures that take up a lot of disk space.
•••When running a capture using Wireshark, try to shut down and/or notuse any other nonessential applications to conserve hardware resourcessuch as memory, disk space, and CPU.
20 The Wireshark Field Guide

2.4 INSTALLATION PREPARATION
When using Wireshark, you need to know which operating systems itcan function on. If the operating system is not compatible, Wiresharkmight not function properly. Luckily since Wireshark is an open-source-based application, finding a compatible system is not difficult.Check the Wireshark web site to find compatibility for your operatingsystem platform. Go to 3rd Party Packages on the download page formore information.
http://www.wireshark.org/download.html
If you do not set up the software correctly, you might not get accuratedata. If you use the wrong drivers, you might not see collisions; if thesecollisions are not picked up with a promiscuously set NIC, you will notreceive accurate reporting data. Make sure you are using the appropriatehardware verified by the Wireshark web site.
http://www.wireshark.org/docs/wsug_html_chunked/ChIntroPlatforms.htmlhttp://wiki.wireshark.org/CaptureSetup/NetworkMedia
In the previous section, the download link was provided forWireshark. Once you have selected the appropriate download for yoursystem and your system has been verified for proper resources, down-load Wireshark and let’s get started.
2.5 INSTALLING WIRESHARK
In this example, Wireshark will be installed on a 32-bit version ofWindows. Although you can install it on other systems, we will focuson the most common, the Windows operating system. Once you havedownloaded the executable for the Wireshark installation procedure,simply double-click on it to execute it.
Some versions of operating systems may have incompatibility issues. Aworkaround that can be used in the case of Windows 8 is to installWinPcap prior to installing Wireshark because of possible incompatibil-ity issue.
Figure 2.3 shows that once executed, you will be provided with asecurity warning from Windows about the installation. Here we will
21Installing Wireshark

see that the publisher is the Wireshark Foundation and that the file isdigitally signed and safe. You can always scan your files with an anti-virus program first.
In this example, we will be installing the most current version ofWireshark as of the writing of this book which is 1.8.4. This is themost current (and stable) version of the program.
You can also download and test newer versions; however, it is safer touse a stable version so that you can ensure that you are working with themore reliable version when capturing and analyzing data.
You may run into an issue when installing if you already haveWireshark installed. We will discuss this briefly. In Figure 2.4, you cansee that because Wireshark is already installed on the host system,Wireshark is asking for permission to uninstall the older version before
Figure 2.3 Starting the Wireshark installation.
Figure 2.4 Updating Wireshark.
22 The Wireshark Field Guide
proceeding. By accepting and clicking on Yes, Wireshark will uninstallthe older version before installing the current version.
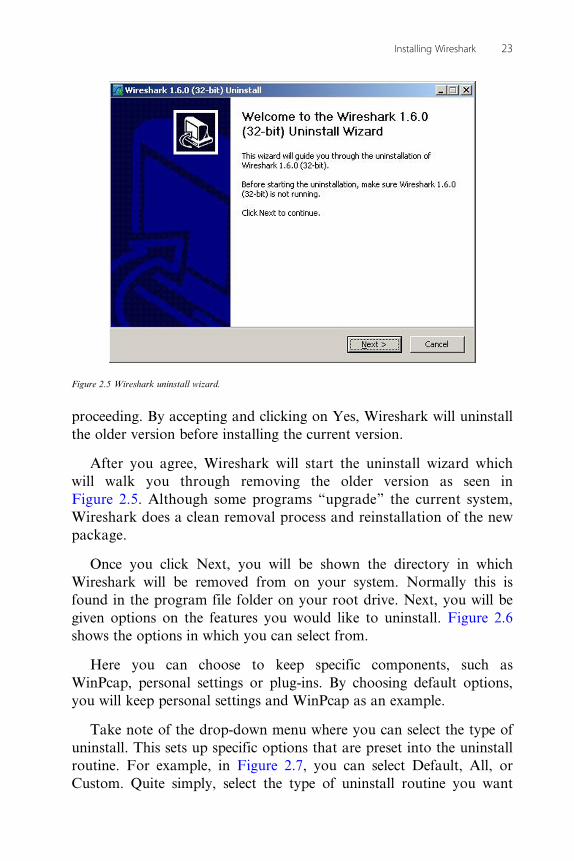
After you agree, Wireshark will start the uninstall wizard whichwill walk you through removing the older version as seen inFigure 2.5. Although some programs “upgrade” the current system,Wireshark does a clean removal process and reinstallation of the newpackage.
Once you click Next, you will be shown the directory in whichWireshark will be removed from on your system. Normally this isfound in the program file folder on your root drive. Next, you will begiven options on the features you would like to uninstall. Figure 2.6shows the options in which you can select from.
Here you can choose to keep specific components, such asWinPcap, personal settings or plug-ins. By choosing default options,you will keep personal settings and WinPcap as an example.
Take note of the drop-down menu where you can select the type ofuninstall. This sets up specific options that are preset into the uninstallroutine. For example, in Figure 2.7, you can select Default, All, orCustom. Quite simply, select the type of uninstall routine you want
Figure 2.5 Wireshark uninstall wizard.
23Installing Wireshark

Figure 2.6 Choosing uninstall options.
Figure 2.7 Selecting the type of uninstall.
24 The Wireshark Field Guide

and you can always customize the options regardless. This just makesit easier for you to select when you uninstall Wireshark.
Once you click on Uninstall, you will be shown a dialog box whereyou see the files and directories being removed from your system.Once it completes, select Next and you will be shown the dialog boxthat closes the Wizard and completes the Uninstall. Click Finish toclose the wizard.
Once you have finished the uninstall, you will then invoke theWizard to install Wireshark on your system. Figure 2.8 shows theWireshark Setup Wizard. The current version of Wireshark (1.8.4) willbe installed on the target host once you click Next.
Once you click Next, you will be shown a license agreement inwhich you need to select I Agree if you do to continue the installationprocess. Once you agree, you will then be brought the choosing com-ponents portion of the installation process. Here as seen in Figure 2.9,you can select specifically what components you would like to install.
In Figure 2.9, you are presented with the following components:Wireshark, TShark, plug-ins and extensions, tools and a user’s guide.
Figure 2.8 Installing Wireshark.
25Installing Wireshark

You can also see that you can expand the options in the plug-ins andextensions as well as the tools components.
TShark is a terminal emulation program that you work with via the com-mand line, much like tcpdump. To learn more about how to use TSharkand the commands and switches you can use with it, please visit theWireshark documentation for more info.
http://www.wireshark.org/docs/man-pages/tshark.html
The plug-ins component has multiple options within it. You caninstall Simple Network Management Protocol (SNMP) Managementinformation bases (MIBs) as well, which are used with managementsoftware solutions that capture and alert on specific criteria. This canbe helpful if you want to use Wireshark via SNMP to accomplish man-agement and alerting tasks. Plug-in options can be seen in Figure 2.10.Select which plug-ins you would like to use and deselect those you donot want to use when preparing to install.
You can also select options within the Tools component as seen inFigure 2.11.
You can use tools, such as Editcap, Text2Pcap, and others formore. For example, Editcap is another command line tool that works
Figure 2.9 Choosing components.
26 The Wireshark Field Guide

Figure 2.10 Viewing plug-in options.
Figure 2.11 Selecting tools options.
27Installing Wireshark

much like a Unix input�output function where you can pipe data tofiles. Some technicians really enjoy the use of command line tools formany reasons; however, one of the most common of those reasons isthat they can be used in scripting files that help to automate processes.
Please make sure you check your space required field in the dialogbox to ensure that you have allotted for this space. If you select every-thing that Wireshark has to offer, you will only need approximately85 MB for the installation to take place.
Once you have decided what components you would like to install,click Next to continue. Once you do, you will be asked to check whatadditional tasks you would like the Wireshark wizard to perform wheninstalling the program. Figure 2.11 shows these specific tasks. InFigure 2.12 you can tell Wireshark upon completing installation thatyou want Start Menu Item’s created and if specific file extensionsshould always be tied to Wireshark when accessed by default.
Once you click on Next, you will have to choose the directory inwhich to install Wireshark. By default (much like uninstall), the pro-gram file folder in the root drive will be selected. You can also see inthis dialog box how much space is required and how much space you
Figure 2.12 Wireshark installation tasks.
28 The Wireshark Field Guide

have available on the drive you wish to install it on to. Click Next tocontinue.
•••To install WinPcap on Windows 8 systems, download the executable filefrom http://www.winpcap.org/install/bin/WinPcap_4_1_2.exe first. Beforerunning the file, modify the Compatibility Mode to Windows 7 withinProperties. Otherwise the installation for both WinPcap and Wiresharkwill fail.
In Figure 2.13, we can verify if we want to install WinPcap if andonly if it’s a different version. For example, since we did an uninstalland WinPcap remained on the computer we are installing Wiresharkon to, we have an option. For example, if this was an older version,we may be given an option to upgrade to the new version which at thetime of this writing is version 4.1.2. Click on Install to install the latestversion of WinPcap or upgrade it.
Next, you will be shown the extraction and installation ofWireshark and WinPcap on your Windows system. Once the installa-tion is completed, you will be shown the final dialog box as seen inFigure 2.14. Here you can click on Finish to complete the install. If
Figure 2.13 WinPcap installation.
29Installing Wireshark

you select the Run Wireshark or Show News check boxes, you canimmediately start Wireshark as well as be shown a list of the updatesand new features of Wireshark. If you are new to Wireshark, this pagewill be helpful to read.
Once you have completed the installation, reboot and then you canrun the application. Figure 2.15 shows the desktop icon that is createdpostinstallation. Double-click this icon to complete the launchWireshark if you did not select it to be run postinstallation.
You have officially installed Wireshark and have it ready to use onyour computer. Now, in our next chapter, we will cover the specificsof configuring your system to prepare it for captures, filtering, andanalysis of network traffic.
Figure 2.14 Completing the Wireshark installation.
Figure 2.15 Wireshark desktop icon.
30 The Wireshark Field Guide

2.6 SUMMARY
In this chapter, we have learned about how to acquire, prepare for aninstallation, and conduct an installation of Wireshark. In the nextchapter, we will learn how to prepare your system with Wiresharkinstalled to capture data and conduct the appropriate analysis neededto solve problems.
31Installing Wireshark

This page intentionally left blank

CHAPTER 33Configuring a System
3.1 INTRODUCTION ................................................................................ 33
3.2 GETTING STARTED........................................................................... 33
3.3 CONFIGURING A CISCO PORT MONITOR ..................................... 36
3.4 OTHER TOOLS AND METHODOLOGIES ........................................ 41
3.5 SUMMARY ......................................................................................... 44
3.1 INTRODUCTION
Now that we know what Wireshark does and how to get and install it,we now need to prepare it for use. Using Wireshark is not impossible,but there needs to be an understanding of what you will use it for inorder to get the most out of it. For example, simply installing it on acomputer and running it, capturing data, and analyzing it may helpyou learn more about your network the computer is connected to. Youmay find some protocols being used that you did not realize were inuse, or verify the correct usage of the ones that you did know about.However, how would you solve a problem such as “slow response timeto a server” as an example?
In this chapter, we will learn how to configure a system to useWireshark correctly. This chapter will also learn how to correctly posi-tion it for use and provide you with sample scenarios in whichWireshark may be handy. This chapter will also cover the specifics ofhow to get all of the components of the network either working foryou and Wireshark, or show you how to rule them out of the possibleproblem you may be encountering.
3.2 GETTING STARTED
Once your computer is ready to go, you will need to learn where toplace Wireshark on a network. As mentioned in the last chapter, this isno simple task. In this chapter, we will cover not only configuration ofnetwork devices but also teach you how to consider the specific

placement of the tool in order to use it correctly. We will learn howpreparing to capture data may require making adjustments on networkdevices, network cabling or configuration specifics necessary to capturedata. We will learn how about configuring a network device to senddata to Wireshark, the correct placement and staging of the capturedevice(s) as well as the strategy you must plan with two end-to-end sys-tems when more than one Wireshark capture is needed. Figure 3.1shows a very simplistic network segment with two client computer sys-tems connected via a network switch.
Although this is a simplistic diagram and the network seems small,this is the same methodology that we will use when working on anenterprise network. For example, if you had to use a laptop withWireshark to analyze a connectivity problem on a server, instead of theserver being connected via the same network switch as seen inFigure 3.1, imagine that server is connected across the world, across10 router connections and 20 switches in a remote data center. It doesnot change the fact you still need to configure the switch the same wayto send traffic to Wireshark in order for you to analyze it for any issues.
In this scenario, you would have to apply a secondary configurationon the network switch to send traffic from port 1/1 to port 1/3 forWireshark to capture. This is called port spanning and/or port mirroring.
Figure 3.1 Planning Wireshark placement.
34 The Wireshark Field Guide

You can capture an entire conversation without impacting the systems asthey work on the network by conducting this type of analysis.
Before we get into the details on how to configure mirroring, let’smake sure we understand why we would do this. Let’s say we wantedto troubleshoot a conversation between Computer A and Computer Bas seen in Figure 3.2. For example, Computer A had a slow login toComputer B and there were no clue in obtained logs or any othermethod of analysis to prove why. This is where Wireshark makes itsmoney. Connecting Wireshark to a network switch and spanning thetraffic over to the computer with Wireshark installed will allow for thecapture and analysis of the entire conversation in order for you to ana-lyze it. Yes, you could install Wireshark directly on the system itself;however, there may be reasons why you may not want to or be ableto. Incompatibility may be one reason. Policy may be another (yourcompany does not allow it). You may not have access to install it onthe system; therefore, mirroring and spanning may be your only alter-native. Regardless, this chapter covers the final items you would needto get Wireshark up and running to use it for data capture andanalysis.
Port 1/1
Port 1/2Port 1/3
Monitoring systemwireshark
Computer B
Computer A
Figure 3.2 Planning Wireshark placement.
35Configuring a System

Although this chapter covers Cisco Systems switches in detail, you can in factinstall mirroring and/or spanning on other systems such as a Nortel switchand many others. Cisco is the most commonly used switch today, therefore,we will cover Cisco in detail; however, if you need to configure Wireshark ona Juniper, Nortel or HP switch, please look up the configurations online asthey will be similar to what is discussed here in theory.
3.3 CONFIGURING A CISCO PORT MONITOR
In this chapter, we will configure a Cisco switch to mirror traffic fromone port to another for capture and data analysis. As we mentionedbefore, although other switches can be used in the same fashion, thesame holds true for the packet capture and analysis tool itself. Forexample, when configure Netflow, you can use similar functions.When sending traffic, you can send it to a Fluke Packet capture device,or a Netscout repository. There are many ways you can use what islearned in this chapter as a network engineer so take note.
To configure port monitoring (also called Switched Port Analyzeror SPAN) on a Cisco Catalyst switch, first you need to know whatmodel of switch you are using. For example, using a 2940, 2950, 2955,2970, 3550, or 3750 series switch is different than using a switch fromthe Nexus line. Rest assured that there is plenty of documentationavailable to aid you in the configuration of any device in Cisco’s prod-uct line; however, it’s important to note that the commands are notcompletely universal.
So what does SPAN do? SPAN when configured correctly (as seenin Figure 3.2) will send a copy of the data traversing a port to anotherport for copy. If you have a computer system with a NIC set in pro-miscuous mode and a protocol analyzer configured, you can capturethe data and filter and analyze it.
•••Remote Monitoring (RMON) probes and other devices such as IPS unitsto provide secure also function this way. As we will learn, there are manyways to configure a SPAN port, not only for Wireshark but many othertools and systems that need to capture and use a copy of data traversinglinks for the purposes of analysis. This chapter is extremely valuable tonot only learning how to use Wireshark, but to become a network engi-neer or security engineer in general.
36 The Wireshark Field Guide

SPAN mirrors can receive or transmit traffic on one or more sourceports to a destination port for analysis. You can SPAN multiple portsto one destination. It does this without impacting the network or inter-fering with the transmission of data. There are special cases, however,when running a span of a trunk port (or port channel) on overutilizedsystems you may encounter resource depletion such as high CPU as anexample.
Other functions of SPAN include Remote SPAN (RSPAN) whichis used to extend SPAN by enabling RMON on multiple switches overan enterprise network. This can also be configured over an RSPANVirtual Local Area Network (VLAN) used only for these types of ses-sions and copied via specified reflector ports. Although this is some-what complex, it really isn’t in theory, however can get a slightlycomplicated in application. Once configured however, also note that anetwork is a living entity whereas if you need to “troubleshoot” aproblem somewhere on your network, you may need to move a probe,move a monitor or move a packet capture device to the problem whichmeans that you will need to conduct configurations at that time. Thatbeing said, let’s walk through the most common you will do:
1. First find where your connections map to on the network. Forexample, a computer or server network connection may disappearinto the distance, an Intermediate Distribution Facility (IDF) or apatch panel. What you need to know is what switch port thedevice connects into in order to SPAN it.
2. You can always look in the switches ARP cache for the MACaddress and what port it’s associated to. This is extremely helpful incases where you cannot map the connection. You may need the IPaddress of the source (and or destination) computer in order to mapthe device to a port in this fashion.
3. Once you find this information, you need to find a free port on thenetwork to connect your analyzer (Wireshark) to in order toconfigure it for promiscuous capture.
Next, you will want to log into the device in which you want toconfigure a SPAN session. Once logged in, you will need to makeadministrative changes to the switch.
37Configuring a System

Before making any changes to a production network, make sure that youare authorized to do so. If you are reading a book about capturing dataand analyzing it at the packet level, it’s assumed you know a thing ortwo about working on a production network; however, this is not alwaysthe case. If you do not have experience working on a production networkprofessionally, please do not make any of these configuration changeswithout first running them in a controlled lab environment first.
You first configuration is to turn off any current session monitoringif session monitoring is already in place. If you want to turn off moni-toring on a particular session, simply list it by its session number.
LabSwitch1(config)# no monitor session allLabSwitch1(config)# no monitor session 1
Next, you will want to configure session monitoring to and fromthe specific ports you mapped out earlier. In Figure 3.3, we see a cur-rent example of what we will be configuring on this lab switch. Wewill install Wireshark on Computer A (Chapter 2) and we will SPANa port from port 2 to port 3 for a production server where we cannotinstall Wireshark.
This example shows how to set up a SPAN session (session 1) formonitoring source port traffic to a destination port. First, any existingSPAN configuration for session 1 is cleared and then bidirectional traf-fic is mirrored from source port 1/2 to destination port 1/3:
LabSwitch1(config)# monitor session 1 source interfacefastEthernet1/2LabSwitch1 (config)# monitor session 1 destination interfacefastEthernet1/3LabSwitch1 (config)# end
Now you will be able to capture data from source to destination foranalysis. When you run a capture, make sure that you capture bothends of the communication real time at the same time. For example, ifyou wanted to find out why it takes a long time for the client(Computer A) to login to a server, you can run Wireshark on
38 The Wireshark Field Guide

Computer A and the monitoring device while attempting to login andthen analyzing both sets of data to find root cause.
•••Do not forget the basics. Although Wireshark is extremely handy in find-ing problems, it is best used when leveraged with other tools. For example,you may want to parse the event logs on the Windows server as well as theclient computer while examining the Wireshark data. You may see that aslow login problem can be identified in the event logs; however, the specificreasons (congested switch) may only show up in the Wireshark detail.Remember, even though you are troubleshooting and using Wireshark asa tool, it’s not the only tool in your toolbelt. The best technicians, analysts,and engineers use server logs, infrastructure device logs, packet analysis,and many other tools to solve the most complex problems.
Once you have set Wireshark up correctly, you need to considerplacement. We touched on this earlier in the book. Placement is some-thing that takes a little time, patience, and experience to get right. For
Port 1/1
Port 1/2Port 1/3
Monitoring systemwireshark
Server
Computer A
Figure 3.3 Planning Wireshark placement.
39Configuring a System

example, if someone said that they had a problem accessing data.Consider all of the areas in which you may have to consider:
• Client: The client is the most common place to start . . . that’s wheremost problems are reported from. The end user could not do some-thing like surf the Internet, use a specific application or having a hardtime logging into a server. This is where you get most of your clues.
• Application: Could the application be having issues? When movingbetween services in the application, is the application passing multi-ple tiers? Is there an application layer? Would installing Wiresharkon the application tier make more sense than installing it on theweb services portion? What if the application is delivered using asolution such as Citrix? Do we install Wireshark on the Citrixserver? Why would we?
• Database: Is the Database server the cause of the issue? Whatgives us this impression? Was the user doing something thatcaused a lock? Why would we install Wireshark on the Databaseserver?
• Web services: Was the front end the cause of the problem?• Cluster: Are the systems clustered? What is the active node in the
cluster?• Server: Is the server the cause of the issue? Running low on
resources?• Virtualization: Is the server a virtualized system? Is the Virtual
server causing issues? Where do you install Wireshark?• Network: Is the path congested? Is it a LAN connection problem,
WAN link, or the Internet that is slow? Is the connection via a vir-tual private network (VPN)? Where do we install Wireshark?
• Load balancer: Are the applications or services load balanced andrunning through a load balancer? Where would we installWireshark?
• Proxy services: Is the client directed to a proxy service? Is this theproblem? Do we install Wireshark on the proxy?
• Firewall: Is the traffic running through a firewall or some otherinspection device such as Intrusion Prevention System (IPS)/Intrusion Detection System (IDS)?
• Name resolution: Is name resolution a cause of the issue? Howwould we know? Where do we install Wireshark?
• Would we use Wireshark to find out why RADIUS is problematic?
40 The Wireshark Field Guide

Mind you, these are just “some” of the areas in which to consider.This is why as mentioned earlier Wireshark is but a tool to be used asan extension of an experienced technicians brain. This is why usingother tools such as system logs is so important. By finding clues inthese logs you can narrow down where you want and may need toinstall and capture data with Wireshark. As you can see, it’s not aseasy as it may seem. It’s not about how to install and use this tool, butspecifically why and where.
We are almost done with Chapter 3. Chapters 1�3 simply covered whatWireshark does, how to get and install it and how to use it in the mostbasic format. The most important thing to consider before moving toChapter 4 is that if you do not grasp what is covered in the first threechapters, then using it in chapters 4�10 will be useless. Unless you knowwhere to place it and know what you are doing to capture data, analyz-ing the captured data is useless. For example, I have personally receivedone Wireshark data capture from a workstation asking me to find a prob-lem. Not knowing what the problem is why it happened, when it hap-pened and what the problem was specifically, it will prove fruitless.Sometimes you can glean clues, however, to truly use this tool correctly,you need to plan to use it correctly.
3.4 OTHER TOOLS AND METHODOLOGIES
When troubleshooting with Wireshark, it’s recommended that youtake the time to use other tools and methodologies while you are ana-lyzing the problem. For example, in the same switches and routers youare piping the information from, you can use commands on them tohelp find the problem. Although there are books and many online arti-cles that cover these in more detail, for the purposes of this field guidewe will help you develop the methodology instead of specifically stat-ing what those commands may be. For example, if you find you havea user complaining of an application that seems to freeze up or appearsluggish, you can do the following tests in phases of complexity:
Phase 1 Testing (quick checks, somewhat nonintrusive)1. First try to understand what the problem is by framing it. Ask as
many questions as needed. Put on the private investigator hatand attempt to capture the end user’s experience.
2. Next verify that no changes were made that could impact.3. Verify path and check all devices in the path. Check logs.
41Configuring a System

4. You can then look over the basics. Ping, traceroute, advancedping commands where you can specific packet sizes will help youto provide a load (to test fragmentation) as an example.
5. Checking performance. Bandwidth, CPU, it can get as deep aschecking performance on a storage area network (SAN).
6. You could install and use Wireshark at this point, however.7. You can run checks on the network devices and infrastructure—
look at the logs, run basic checks with specific commands thathighlight—run nonintrusive debugs
Phase 2 Testing (deeper level of inspection and more time consum-ing and may be intrusive)1. Wireshark set up on both ends from source to destination, check-
ing the timing of the packets from source to destination. This ismore difficult to perform because you need access to both systems(as an example) and will have to run the tests in tandem. You willhave to analyze both captures using timestamps in order to verifywhen data was sent and when it was received and any errors oranomalies that took place during that period of time. When ana-lyzing timestamps a recommended procedure would be to ensurethat all devices you run Wireshark on have the correct time whichcan be done through configuring Network Time Protocol (NTP),or the Windows Time Service (W32Time).
2. Real-time analysis of traffic and deep inspection by looking intopacket headers will uncover a more granular level of detail, how-ever, will take more time to review and analyze.
3. Run intrusive tests such as performance test on network links thatwill verify the validity of the bandwidth and size however willinadvertently shut down the link for use thus causing an outage.
4. Run heavy debugs on infrastructure devices. This may cause thedevice to process heavily therefore spike the CPU and cause thedevice to perform poorly (if at all) to process production traffic.
5. Other tests to conduct would be to reboot physical servers, movecluster nodes from primary to secondary, moving virtual machine(VM instances) from one host to another and other “server-related” testing that may help isolate the issue.
6. Cabling testing where cables need to be replaced or verified maycause a disruption or an outage if not redundant.
Although I created a framework for this methodology and called itphased testing, it’s nothing more than how normal network engineers
42 The Wireshark Field Guide

perform their jobs every day. As you can see from this example, usingWireshark is not the only tool used to solve problems, its only one ofthe many different tools (or processes) used to solve simple to complexproblems every day. Figures 3.4 and 3.5 show examples of other test-ing methods you can deploy with Wireshark to solve a problem.
In Figure 3.4, we see an example of using the ping command to testconnectivity as well as the stability of a network connection. This canbe used to help assess if bandwidth or latency can be an issue with forexample, a slow application response time. If the application is slow torespond and the network is suspect, by running a quick ping from thesource to the destination can quickly help rule out what the networklooks like and is performing in seconds.
In Figure 3.5 we see an example of another helpful tool called theSolarWinds Engineer’s Toolset. This tool much like the rest of the
Figure 3.4 Using the ping command.
43Configuring a System

SolarWinds product line make network management and troubleshoot-ing easier; for example, you can run a ping sweep of a subnet to verifyconnectivity of a device or devices quickly and easily through the GUI.
In sum, remember that Wireshark is but one tool—and using italone can be helpful but when used in conjunction with other tools canhelp solve problems quicker. It should also be considered that whentroubleshooting, you have to learn “where” to place your packet ana-lyzers so that you can collect the correct data. You also have to timethe problem correctly and sometimes collect baseline data to ensureyou can understand how the network performs normally before youcan suspect a problem.
3.5 SUMMARY
In this chapter, we have learned about protocol capture and analysislearned the fundamentals of Wireshark as well as the fundamentals oftroubleshooting with it. In the next chapter, we will learn how to useWireshark once data is captured and how to analyze specific data.
Figure 3.5 SolarWinds engineer’s toolset.
44 The Wireshark Field Guide

CHAPTER 44Capturing Packets
4.1 INTRODUCTION ................................................................................ 45
4.2 GETTING STARTED........................................................................... 45
4.3 SUMMARY ......................................................................................... 53
4.1 INTRODUCTION
In the last three chapters, we covered the fundamental basics ofWireshark and how to get it up and running on a computer systemand/or network. We covered how to set it up so that you can capturepackets and begin to analyze them. In this chapter, we will start to useWireshark to capture those packets to troubleshoot problems.Capturing packets is a fairly easy concept to digest once your system isup and running correctly and you understand what Wireshark does.
In this chapter, we will learn how to capture data and how to viewit within Wireshark so that you can start solving problems. Packetanalysis starts with the inspection of packets, however, if you do notcapture the data correctly you will have a tough time understandingwhat you are looking at or finding what you need. There are alsomany ways you can approach the capturing of this data.
Wireshark can be used to capture packets on a computer network via theNIC in promiscuous mode. This means that all data traversing the net-work and touching this interface can and will be recorded. As we men-tioned with spanned ports in the previous chapter, you can also set upWireshark to collect data from a particular port. That being said, makesure you have permission to do so. You could be doing this against policyif you are not authorized to do so.
4.2 GETTING STARTED
In this chapter, we will learn the art of capturing packets in order todecode them, analyze them, and inspect what is traversing your net-work. Once you have started to capture packets, the rest of the

chapters leading up to the last chapter (saving captures and savingfiles), you will be learning about the interface and how to manipulateit to troubleshoot problems. This chapter covers more of what youlearnt in Chapter 1 about the three panes and all details within them,running captures as well as how to start and stop Wireshark. We willalso review a sample problem.
To start capturing packets, simply open Wireshark on your com-puter as shown in Figure 4.1. In the window, you will find the Capturesection in the top left pane. You can view the Interface List, Start acapture based on a particular interface and set Capture Options.
As we have learned, there are many things you can do withWireshark and in this chapter, we will expand on all the ways you cancapture packets. It should be noted that you can also use the Filespane in the middle of the window as shown in Figure 4.1 to open pre-viously saved captures or click on the Sample Captures link to goonline and view the saved repository of samples.
Figure 4.1 Opening Wireshark to capture packets.
46 The Wireshark Field Guide

•••If you are very interested in learning about Wireshark, protocol analysis,or networking in general, it is highly advisable that you visit this onlinerepository of samples. Here you can see a large set of captures that showspecific types of protocol behavior: http://wiki.wireshark.org/CaptureFilters.
As an example, if you want to learn more about how dynamic hostconfiguration protocol (DHCP) operates (and looks like in a capture),simply download the capture files and open them within the Files panelink. Since this is only a field guide, we cannot get too deep into every lit-tle detail, so this is a great way to augment your studies and learn moreabout the Wireshark tool.
Once you have opened Wireshark and want to start to run a cap-ture, the first step would be to select an interface (NIC) in which youwant to capture on. As shown in Figure 4.1, there are commonly morethan one interface on any given machine you may work with. Forexample, on the system where captures will be taken here, there is aphysical NIC, a virtual NIC (VPN connection) and a Wireless NIC.You can click on the Interface List link to produce the WiresharkCapture Interfaces dialog box as shown in Figure 4.2.
Once you open this dialog box, you will be presented with a full setof functional network connections configured on your computer. Youcan put a checkbox into the interface you would like to select. For thisexample, we will select the physical NIC which is an Intel GigabitNIC. You can further drill down into the interface specifics by clickingon the Details button found within the Wireshark Capture Interfacesdialog box to produce the Wireshark Interface Details dialog box asshown in Figure 4.3.
This dialog box can be very helpful if you need to check specificinformation about your NIC card. For example, if you want to verifyinformation about your NIC that may be relevant to the capture data,
Figure 4.2 The Wireshark Capture Interfaces dialog box.
47Capturing Packets
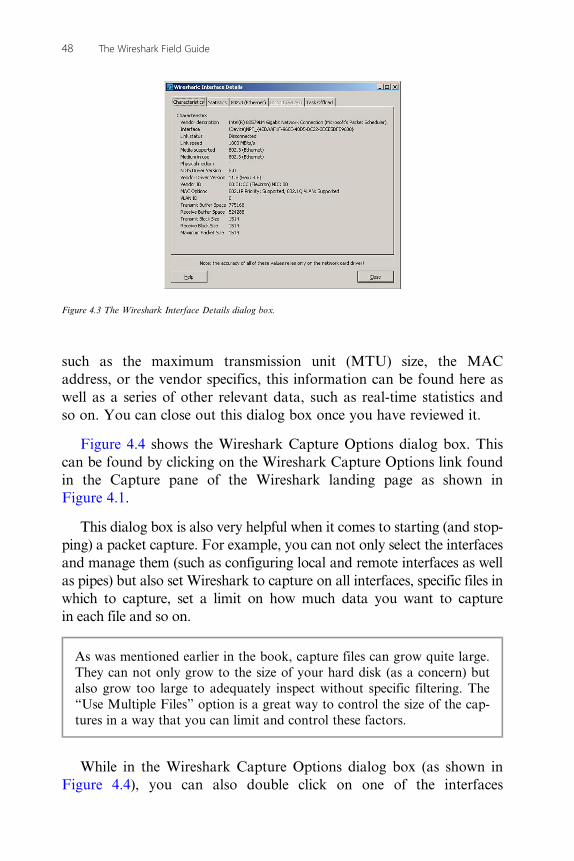
such as the maximum transmission unit (MTU) size, the MACaddress, or the vendor specifics, this information can be found here aswell as a series of other relevant data, such as real-time statistics andso on. You can close out this dialog box once you have reviewed it.
Figure 4.4 shows the Wireshark Capture Options dialog box. Thiscan be found by clicking on the Wireshark Capture Options link foundin the Capture pane of the Wireshark landing page as shown inFigure 4.1.
This dialog box is also very helpful when it comes to starting (and stop-ping) a packet capture. For example, you can not only select the interfacesand manage them (such as configuring local and remote interfaces as wellas pipes) but also set Wireshark to capture on all interfaces, specific files inwhich to capture, set a limit on how much data you want to capturein each file and so on.
As was mentioned earlier in the book, capture files can grow quite large.They can not only grow to the size of your hard disk (as a concern) butalso grow too large to adequately inspect without specific filtering. The“Use Multiple Files” option is a great way to control the size of the cap-tures in a way that you can limit and control these factors.
While in the Wireshark Capture Options dialog box (as shown inFigure 4.4), you can also double click on one of the interfaces
Figure 4.3 The Wireshark Interface Details dialog box.
48 The Wireshark Field Guide

themselves in the top pane to make additional settings adjustments. InFigure 4.5, you will find the Edit Interface Settings dialog box. Hereyou can change the Link-layer header type, set buffering options, orconfigure a capture filter on that particular interface.
We will learn more about capture filters in a future chapter, how-ever, as a general explanation here, a capture filter is nothing morethan a configured filter that will allow you to refine your capturedetails. As an example seen in Figure 4.5, we will only allow for the IPto be captured on this particular interface. If you click on the CaptureFilter button, you will open the Wireshark Capture Filter (ProfileDefault) dialog box as shown in Figure 4.6. In this specific example, Iam setting a specific Filter Name and Filter String in the fields found
Figure 4.4 Wireshark capture options.
Figure 4.5 The Edit Interface Settings dialog box.
49Capturing Packets
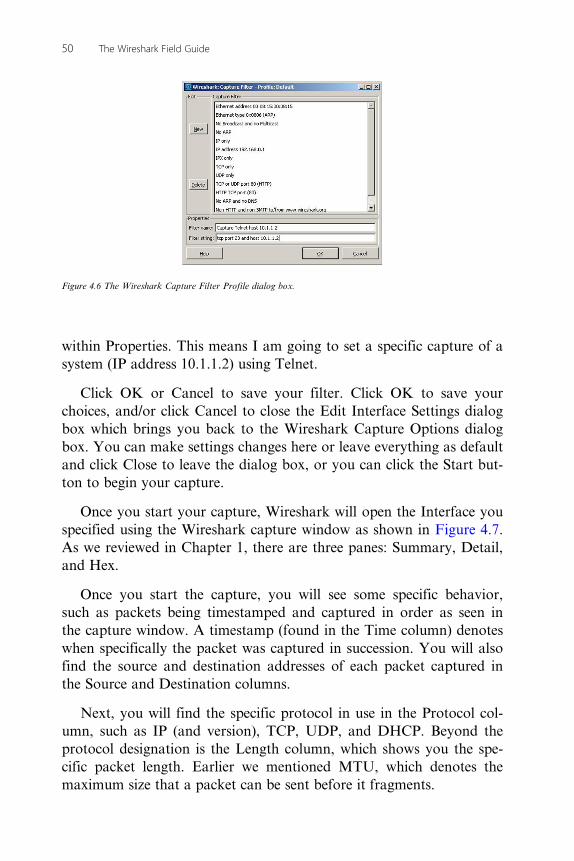
within Properties. This means I am going to set a specific capture of asystem (IP address 10.1.1.2) using Telnet.
Click OK or Cancel to save your filter. Click OK to save yourchoices, and/or click Cancel to close the Edit Interface Settings dialogbox which brings you back to the Wireshark Capture Options dialogbox. You can make settings changes here or leave everything as defaultand click Close to leave the dialog box, or you can click the Start but-ton to begin your capture.
Once you start your capture, Wireshark will open the Interface youspecified using the Wireshark capture window as shown in Figure 4.7.As we reviewed in Chapter 1, there are three panes: Summary, Detail,and Hex.
Once you start the capture, you will see some specific behavior,such as packets being timestamped and captured in order as seen inthe capture window. A timestamp (found in the Time column) denoteswhen specifically the packet was captured in succession. You will alsofind the source and destination addresses of each packet captured inthe Source and Destination columns.
Next, you will find the specific protocol in use in the Protocol col-umn, such as IP (and version), TCP, UDP, and DHCP. Beyond theprotocol designation is the Length column, which shows you the spe-cific packet length. Earlier we mentioned MTU, which denotes themaximum size that a packet can be sent before it fragments.
Figure 4.6 The Wireshark Capture Filter Profile dialog box.
50 The Wireshark Field Guide

•••The size of the packets can also be problematic. If you find that most ofyour packets traversing your interface are small packets, which meansthat the interface itself has more to do to process each packet (usually forreassembly) and handle encapsulation.
Fragmented packets can become a problem. IP packets can be frag-mented from their original size into smaller chunks for transmission overa network. They need to be reassembled which causes more work for thedevice handling this task.
It is also recommended that you learn more about the actual packetsyou will capture and inspect, and there is no better starting point thanInternet RFCs or Request for Comment files. This one covers IP anddetails the issues behind fragmentation: http://tools.ietf.org/html/rfc791.
The Info column highlights particular information you may need toknow about the packet that was captured. For example, in the case ofthe captured ARP packets, it was helpful to learn that it was a gratu-itous ARP and simply a request. This covers the details of theSummary pane. The Details pane simply breaks down each packet
Figure 4.7 Starting a capture in Wireshark.
51Capturing Packets
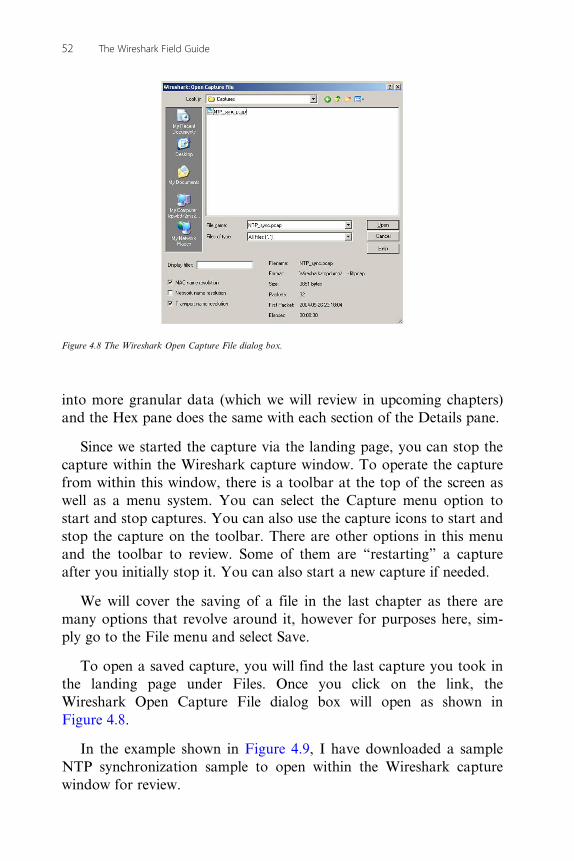
into more granular data (which we will review in upcoming chapters)and the Hex pane does the same with each section of the Details pane.
Since we started the capture via the landing page, you can stop thecapture within the Wireshark capture window. To operate the capturefrom within this window, there is a toolbar at the top of the screen aswell as a menu system. You can select the Capture menu option tostart and stop captures. You can also use the capture icons to start andstop the capture on the toolbar. There are other options in this menuand the toolbar to review. Some of them are “restarting” a captureafter you initially stop it. You can also start a new capture if needed.
We will cover the saving of a file in the last chapter as there aremany options that revolve around it, however for purposes here, sim-ply go to the File menu and select Save.
To open a saved capture, you will find the last capture you took inthe landing page under Files. Once you click on the link, theWireshark Open Capture File dialog box will open as shown inFigure 4.8.
In the example shown in Figure 4.9, I have downloaded a sampleNTP synchronization sample to open within the Wireshark capturewindow for review.
Figure 4.8 The Wireshark Open Capture File dialog box.
52 The Wireshark Field Guide

In the example, we will review how an NTP (time synchronization)transfer between source and destination should look like and analyzewhy there may be a problem, or if it is working as it should.
In the example, we see no problems in this synchronization of aclock on the 192.168.50.x network using a public Internet time source.It is using port 123 as seen in the Details pane data (source and desti-nation port). What could have gone wrong? The connection to the net-work could have been local with no Internet access therefore notallowing the sync to take place. A firewall (either locally or remote)could have been blocking this IP range and/or the NTP port 123.
4.3 SUMMARY
In this chapter, we covered how to get start with Wireshark—to launchit, configure it to capture and start capturing data. Now we havelearned how to capture protocol data within Wireshark. Next, we willcover how to start to view, manipulate, filter, and analyze what youare capturing.
Figure 4.9 Viewing an NTP capture file.
53Capturing Packets

This page intentionally left blank

CHAPTER 55Color Codes
5.1 GETTING STARTED........................................................................... 55
5.2 CREATING COLOR CODE LISTS ...................................................... 56
5.3 ADDING AND REMOVING FILTERS................................................ 59
5.4 OTHER COLORING OPTIONS .......................................................... 61
5.5 SUMMARY ......................................................................................... 61
In this chapter, we will learn how to customize your captures. Thischapter will be a segue into the next chapter, which will cover creatingfilters. In Chapter 4, we have covered the basics of performing a cap-ture and learned how to set up a quick filter on your profile’s defaultconfiguration. In this chapter, we will learn how to further your cap-tures in a visual representation for quick and easy viewing purposes.
Wireshark is a very visual tool. The tool includes prebuilt filtersand coloring codes, and it lets you create new ones or edit the onesalready in place. As you will see, it is extremely flexible. When work-ing with Wireshark, you will see that when capturing packets, theamount of data can become unwieldy most times. A quick and easyway to interpret what you are viewing is to view (and understand) howWireshark color codes packets. Once you have used the tool longenough, you will find that by simply seeing a color, you will alreadyknow specific details about the packets you are capturing without hav-ing to read the contents of each one to get a general understanding ofwhat is taking place on your network.
5.1 GETTING STARTED
Deeper inspection within the capture is required. In this chapter, wewill learn how Wireshark color codes the captures and how we canquickly look for problems. We will also learn more about protocols,ports, and other critical network-based information that help solveproblems.

First, we have to understand why we color code. The easiest answerto this question is to make it easier for use as problem solvers and tomore quickly visualize problems on our network. That being said,Wireshark allows us to do this by expanding what is already availableby default using custom color coding schemes. There are two types ofcolor coding profiles you can use with Wireshark. One is temporaryand the other is one that can be kept by Wireshark to be used eachand every time you use the system.
Do not worry about making changes to the defaults of Wireshark; youcan always reset your work and remove any of the custom color codingprofile data you insert by clearing any and all changes. You will learnhow to do this in this chapter.
5.2 CREATING COLOR CODE LISTS
To get started, open the last capture you took or create a new capturefile. Once you are done capturing data, go to the View menu in theWireshark capture window. Select the Coloring Rules option from themenu. You will open the Wireshark Coloring Rules (Profile Default)dialog box as shown in Figure 5.1.
Here, you will find many predefined filter sets as shown inFigure 5.1. In the middle window, you will see a list of filters denotedas Name and String. The string is the “action” that Wireshark is tak-ing when it applies this filter. It should also be noted that the list isprocessed from top to down and goes in that order until a match ismade and processed.
Figure 5.1 The Wireshark Coloring Rules dialog box.
56 The Wireshark Field Guide

On the left side of the dialog box is the Edit area. Here, you can cre-ate a new color code filter, edit a preexisting one, enable or disable one,or remove one completely. If you choose to create a new color code fil-ter, click on the New button as shown in Figure 5.1. This will open theWireshark Edit Color Filter dialog box as shown in Figure 5.2.
In this example, a filter that specifically highlights a particular IPaddress in yellow font with a blue background was created for quickand easy viewing. Before we get into how we created this filter, it shouldbe apparent as to why and how this could be extremely helpful. In thisinstance, let us say you were troubleshooting a specific IP address thatyou wanted to view in your capture and isolate. Now, visually you cansee when that IP address is found in a packet that Wireshark capturesby viewing the Summary Pane in the Wireshark capture window. Howwas this created? Simple, here is how it was done.
When making filters, try to use a color coding scheme that is visible toyou as well; try not to duplicate anything else already in use.
Open the Display Colors by selecting either the Foreground Coloror Background Color buttons as shown in Figure 5.2. In Figure 5.2,we see the Wireshark Choose Foreground Color dialog box openwhere you can select the written font color; here yellow color was cho-sen. Click on the eyedropper icon and then on the color map in theleft-hand side of the dialog box and select the color, or if you knowHex coloring schemes (Figure 5.3), you can configure it in the color“name” field within the dialog box.
Follow the same method for the background color and then chooseOK.
Once you have completed these steps, you need to configure theactual filter in which you will capture data. You can do this by
Figure 5.2 The Wireshark Edit Color Filter dialog box.
57Color Codes

clicking on Expression as shown in Figure 5.2. This will open the dia-log box as shown in Figure 5.4. Here, you will find the WiresharkFilter Expression dialog box.
If you know how to enter the string manually, you do not need toopen the dialog box; however, if you are new to Wireshark and toapplying filters, there is no better way to learn than to using this dialogbox. Here, you can select the field name and then the relation which isnothing more than applying Boolean math to your selection criteria.For example, if you want to capture an address that is equal to a spe-cific value, it would look similar to
ip55192.168.50.50
Once you have finished, you can click on OK two times to get backto the Wireshark Coloring Rule dialog box as shown in Figure 5.5.Here, you will find the new filter applied to the rules filter list.
Figure 5.3 The Wireshark Choose Foreground Color dialog box.
Figure 5.4 The Wireshark Filter Expression dialog box.
58 The Wireshark Field Guide

Now, you can see the new rule applied which, when you run a newcapture, can be used to color code that specific data in the Wiresharkcapture window for easy viewing.
•••You can use the Order section on the right side of the dialog box tomove rules up or down in the list if you want to decrease the processingthat Wireshark will have to do in order to match your data against thefilter list.
5.3 ADDING AND REMOVING FILTERS
You can disable a filter by selecting it with your mouse and then click-ing on the Disable button in the Edit section. Once you have done so,the filter will be crossed out and disabled (but not removed) from theprocessing list, which is shown in Figure 5.6.
Figure 5.5 The Wireshark Coloring Rules dialog box.
Figure 5.6 Disabling a Wireshark color code filter.
59Color Codes

You can select Enable to enable it, or Delete to remove it from thelist. One last feature we review here is the importing and exporting ofcolor code lists that were already made and found on the WiresharkWiki. This is incredibly handy when you want to build lists, where itwould take you a lot of time in minutes. You can also export your cus-tom lists to either submit to the Wiki and/or use in your own groups,give to peers, or use to help others as needed. To import a list, youfirst need to get the list you will import.
To do this, you can visit the online list repository where there aremany capture filters available:
http://wiki.wireshark.org/ColoringRules
Once you download a list that you find may be helpful, simply clickon the Import button and browse to the import list file. Once com-pleted and imported, you will see it in your Wireshark Coloring Rulesdialog box as shown in Figure 5.7.
In this example, we have configured Wireshark to capture data andcolor code it specifically as seen in the filter list. Now, if you have ane-mail problem and you are trying to view packets using SMTP orPOP, they will show up colored pink with white font or black font.
Again, this is just a way for you to quickly visualize a problem andmake it easier to troubleshoot. This book intends on getting you up torun and use Wireshark quickly for the purpose of solving problems.The keywords here are “quick” and “easy.” There is nothing simpleabout this program; however, it is designed very well to make using it
Figure 5.7 Viewing an imported color code list.
60 The Wireshark Field Guide

very digestible. Color coding is one such way where this isaccomplished.
Once you have test driven your new color code filters, you canalways reset Wireshark back to custom defaults easily. To do this, youcan open the Wireshark Coloring Rules dialog box backup and clickon the Clear button in the Manage section, which will allow you toclear all your rules as shown in Figure 5.8. Click Clear to remove allsettings from the global default profile.
5.4 OTHER COLORING OPTIONS
Wireshark also allows you to apply color in another way to help youisolate problems. In this example, we will look at conversations suchas source IP address and destination IP address as shown inFigure 5.9. Here, click on the View menu option and scroll down toColorize Conversation and expand the menu to view the coloringoptions.
What this helps you do is “mark” conversations in a capture file foreasy viewing. Now, to do this, simply click on a conversation pairfound in one packet in the Summary pane. Next, click on the Viewmenu option, Colorize Conversation, and select Color 1.
This will then mark every packet in the capture having this conver-sation with that specific color code you have chosen. This is very help-ful when you are trying to quickly visualize that particularconversation in a large capture file.
5.5 SUMMARY
In this chapter, we have discussed how you can customize Wiresharkwith color coding in order to mark specific data you are capturingand/or have captured. This is essential when you try to solve problems
Figure 5.8 Removing all personal color settings dialog box.
61Color Codes

quickly in the field and need to use your visual skills to interpret pro-blems while working in the Summary pane of the Wireshark capturewindow. In Chapter 6, we will expand our discussion on filters to gomore in depth on using filtering options to capture and sort your cap-tured data to perform protocol analysis.
Figure 5.9 Coloring Conversation in Wireshark.
62 The Wireshark Field Guide

CHAPTER 66Filters
6.1 GETTING STARTED........................................................................... 64
6.2 APPLYING A FILTER......................................................................... 64
6.3 ADVANCED FILTER CREATION....................................................... 67
6.4 OTHER FILTERING TECHNIQUES.................................................... 68
6.5 CUSTOMIZED FILTERING AND TROUBLESHOOTING .................. 69
6.6 CONVERSATION FILTERS ................................................................ 74
6.7 SUMMARY ......................................................................................... 77
In this chapter, we will learn how to filter data in Wireshark to trou-bleshoot problems. How to filter captures correctly is the key to find-ing problems especially when running Wireshark on networks where alot of data traverses. Consider capturing data from one system com-municating with another. . . what would you specifically search for tohelp solve a problem? Filtering on protocols, IP addresses, and usingspecific Boolean arguments are covered as well as specific example offilters that you can use right away to help get you up and running andworking with Wireshark immediately.
When it comes to networks, you can separate out unnecessary data,data irrelevant to the problem or the event that we are exploring. Themost important and the most difficult thing to do is not to capturedata but to find out which of the thousands of packets traversing yournetwork are related to a problem you are working on, diagnose theproblem correctly, and prove out the problem to move directly to elim-inating its cause. Wireshark is a very good tool to perform this trouble-shooting as long as you choose the correct filter to help sort through(or initially capture) the relevant data needed. Choosing (or creating)the correct filter will make your life easier when it comes to scanningthe data and analyzing it for problems and that is what we will coverspecifically in this chapter.

If you incorrectly define a filter, you may in adversely omit criteria youwant to search for therefore making what you are looking for evenharder to find.
6.1 GETTING STARTED
In the data transmission environment, filtering becomes very importantwhen it comes to the search and use of specific information hidden inthe midst of unimportant data. One of the most difficult and signifi-cant task involved in working with Wireshark is to define the right fil-ter. Having defined a correct filter, you will be able to save a greatdeal of time when it comes to detecting a problem on your network oranalyzing data you have captured using a particular filter. Differenttypes of filtering are available: You can filter traffic based on Layer 2and Layer 3 addresses, protocol types, and/or data patterns.
•••To learn more about the specifics of filtering above and beyond this fieldguide’s capacity, it is recommended that you read the filtering section onthe Wireshark Wiki: http://wiki.wireshark.org/CaptureFilters
Here you will find useful information that can help you create filtersas well as find a repository of already predefined capture filters that canassist you in your studies or work.
6.2 APPLYING A FILTER
Applying a filter can be done in many ways. First, we learnt in earlierchapters that when running a capture you can simply apply a filter tothe profile’s default configuration. This will apply once you begin yourrelevant captures. You can also apply a filter before running a captureand/or apply a filter after you run a capture. We already covered theprofile default in Chapter 4.
In this chapter, we will learn how to apply a filter before and afterrunning a capture. You can apply a filter prior to running a captureand after as we learnt in Chapters 4 and 5. In this chapter, we willfocus primarily on how to apply a filter to a capture after it has beenrunning to sort out unwanted data. An example of a capture thatneeds filtering is shown in Figure 6.1.
64 The Wireshark Field Guide

There are multiple ways you can go about filtering for data; how-ever, since this is a field guide there is an important step you shouldtake prior to applying any filter. Before you consider a filter, first con-sider why you need any filtering in particular so that you can assesswhich filter you need to build and apply. Here is an example:
1. You get a report that you believe a problem exists on a networkwhere you may need to do protocol analysis in order to solve it.You first ask specific questions so that you know where you needto place Wireshark in order to capture this relevant data. The prob-lem is reported that an Apple wireless device cannot connect to thenetwork.
2. You find a network device in which you can mirror a port and col-lect SPAN data from a Cisco switchport to collect the relevant dataneeded to solve the problem into Wireshark.
3. You collect 30 minutes worth of capture data and save it to yourdisk in a capture file. You revisit the capture file and open it toinspect and analyze it. You want to narrow down what you are
Figure 6.1 The Wireshark capture window.
65Filters

looking for, so you can either filter by IP address (suspect system)and/or protocol used (Apple-based).
This is what needs to be done before you place Wireshark in a loca-tion to collect the data, prior to collecting data and essentially beforedoing any filtering or analysis of said data. You will then want to lookfor the problems by filtering out any data that is not relevant to theproblem and inspecting the data that is relevant.
So, how do we apply a filter? The most basic way to apply a filteris by typing it into the filter box at the top of the Wireshark capturewindow and clicking Apply (or pressing Enter). For example, type“arp” and you can only view ARP packets. When you start typing,Wireshark will help you autocomplete your filter and you may nothave to click on Apply; however, to remove the filter, you need to clickon Clear. You can Save the filter by clicking on Save. In the examplein Figure 6.2, we were able to narrow down that we have multipledevices using Address Resolution Protocol (ARP) broadcasting on thenetwork segment.
Figure 6.2 Viewing ARP packets.
66 The Wireshark Field Guide

In this example, we were able to narrow down our view of the prob-lem area and quickly isolate relevant data that maybe part of theproblem.
6.3 ADVANCED FILTER CREATION
In some cases you can always create a filter by using the WiresharkFilter Expression dialog box as shown in Figure 6.3. By doing so, youcan get into more advanced level filter creation techniques such aspicking a Filter name, its Relation, Value, Predefined values, andRange as seen in Figure 6.3. You can find the Expression Filter byclicking on the Expression link next to the Filter field in the Wiresharkcapture window.
•••Using the advanced filters you build in the expression filter teach you howto write out advanced filter strings in the Wireshark capture window Filterfield. Once you create enough filters, you will learn how to type themdirectly into the Filter field. By using autocomplete, you can speed up yourability to quickly build and apply filters and search for relevant data.
Another advanced level tip you can apply when creating filters is tosimply let autocomplete assist you in your journey. In Figure 6.4, youcan see an example of autocomplete in use. In this example, if youwant to search for an arp filter, simply type the letter “a” into the fieldand a dropdown box will appear showing you all options starting with“a” (arp included). You can further develop this by learning the
Figure 6.3 The Wireshark Filter Expression dialog box.
67Filters
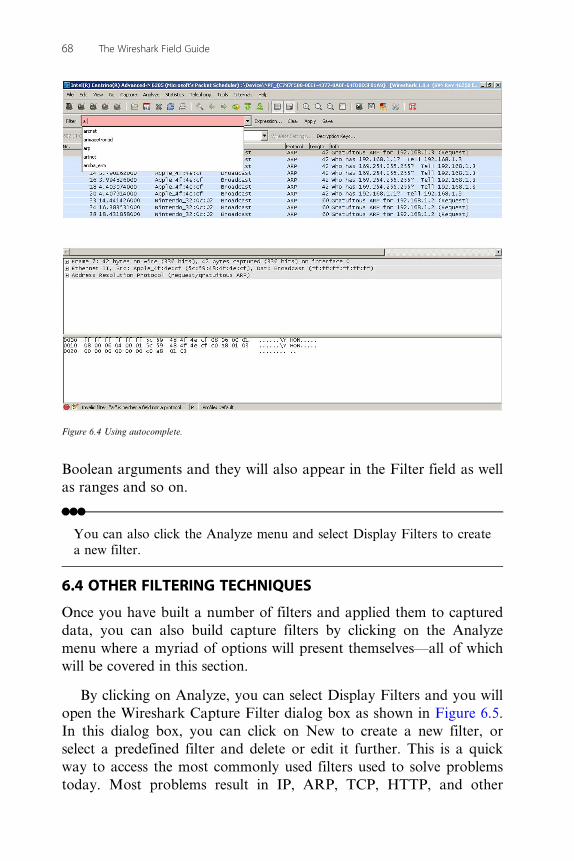
Boolean arguments and they will also appear in the Filter field as wellas ranges and so on.
•••You can also click the Analyze menu and select Display Filters to createa new filter.
6.4 OTHER FILTERING TECHNIQUES
Once you have built a number of filters and applied them to captureddata, you can also build capture filters by clicking on the Analyzemenu where a myriad of options will present themselves—all of whichwill be covered in this section.
By clicking on Analyze, you can select Display Filters and you willopen the Wireshark Capture Filter dialog box as shown in Figure 6.5.In this dialog box, you can click on New to create a new filter, orselect a predefined filter and delete or edit it further. This is a quickway to access the most commonly used filters used to solve problemstoday. Most problems result in IP, ARP, TCP, HTTP, and other
Figure 6.4 Using autocomplete.
68 The Wireshark Field Guide

commonly used protocols on networks. If you click on the CaptureFilter field in Figure 6.5 and look at the Properties fields, you can seeexactly how the filter is created.
You can also Add the Filter name and Filter string data and clickon New to add the filter you just created to the Display Filter field.
In Chapter 3, we learnt how to apply filters to the profile default prior toopening and running an actual capture in the Wireshark capture window.The Wireshark Capture Filter dialog box discussed here is identical tothat same filter discussed in Chapter 3.
Another helpful tip to set up filter expressions is to go into theWireshark capture window menu system. Under Analyze selectDisplay Filter Macros. You can build a complete macro set to applywhen you select filters. For those of you have done C programming inthe past, macros are basically creating a function with one or morevariables. Yet another way to build filter expressions to be added tothe predefined set is to go into Wireshark Preferences in the Editmenu. This will open the dialog box as shown in Figure 6.6.
In the Filter Expressions menu option, you can click on Add andbuild a new filter expression as well as enable and disable it as needed.
6.5 CUSTOMIZED FILTERING AND TROUBLESHOOTING
In the previous sections, we covered the basic configuration of creatingand applying filters to captured traffic in hopes that by doing so it will
Figure 6.5 The Wireshark Capture Filter dialog box.
69Filters

be easier and quicker for you as a technician to solve network pro-blems. That being said, let us take a deeper dive into filter creation totroubleshoot common problems. In Figure 6.7, we will analyze a TCP-based conversation to assess it for problems.
In this example, we can select a packet in the Wireshark capturewindow and apply a filter directly to that packet. By right clicking ona particular packet you can produce a menu as seen in Figure 6.7,where you can apply as a Filter, set up a Conversation Filter, apply aColor Filter, or follow streams. We have already focused on applyingspecific filters, so for this example we will learn how to follow streams.
The next logical questions that may come to mind are what is atraffic stream and why would we want to filter it out? The answers aresimple. The stream dialog window as seen in Figure 6.8 is going to fil-ter out the Application layer details and show you what they are. InChapter 1, we covered the OSI model which is extremely important inthe field of networking to understand. The top layer which is theApplication layer is at times very important to analyze when trouble-shooting a problem. For example, let us say we had a problem to solvethat resulted in a web browser having issues accessing a Web page. Wewould want to inspect HTTP traffic.
Figure 6.6 Setting Filter Expressions in preferences.
70 The Wireshark Field Guide

Figure 6.7 Configuring a filter on TCP traffic.
Figure 6.8 Following a TCP stream.
71Filters

The application stream would be from the TCP-based IP addressand the Details pane could show you the specifics of HTTP, howevertoo really filter and see the HTTP traffic, you would need to apply thestream filter. In Figure 6.8, we can see the specifics of the communica-tion with the web server and the interaction with the web browser.
You could also apply this type of filter directly into the Filter fieldin the Wireshark capture window as shown in Figure 6.9.
You could type the following into the Filter field to get the sameresult:
tcp.stream eq 1
You can also apply UDP stream filters as shown in Figure 6.10,where the Follow UDP Stream dialog box shows the UDP protocolspecifics we want to analyze at the Application layer.
Here in this conversation we can see XML-based information show-ing how UDP is interacting at the Application layer. In this particular
Figure 6.9 Applying a TCP stream filter in the Filter Field.
72 The Wireshark Field Guide

stream, we can see that there may be an issue with the Microsoftdefined Automatic Private IP Addressing (APIPA) where a host can-not communicate with other hosts on the same range.
In Figure 6.11, we can see the application of a stream filter in theFilter field of the Wireshark capture window. Here we see that APIPAwhile being used via UDP can be further filtered out for analysis.
You could type the following into the Filter field to get the sameresult:
(ip.addr eq 169.254.1.143 and ip.addr eq 255.255.255.255) and(udp.port eq 21302 and udp.port eq 21302)
It should be mentioned that this does not mean that you will imme-diately be able to diagnose a problem with this information, rememberthat Wireshark helps you uncover the data in packets so you canattempt to isolate and resolve problems, Wireshark does not necessar-ily point out problems to you, you have to understand and know whatyou are looking for.
In this example, we would have a computer that does not communi-cate on the network using a specific IP address. We could go to thatworkstation and open a command prompt, type in ipconfig/all andfind that the computer is in fact using an automatically configured IP
Figure 6.10 Follow UDP stream.
73Filters
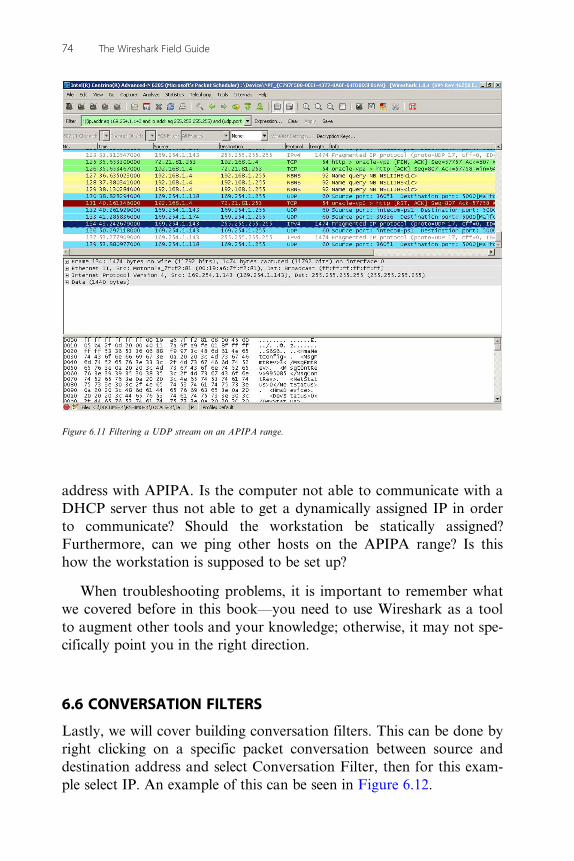
address with APIPA. Is the computer not able to communicate with aDHCP server thus not able to get a dynamically assigned IP in orderto communicate? Should the workstation be statically assigned?Furthermore, can we ping other hosts on the APIPA range? Is thishow the workstation is supposed to be set up?
When troubleshooting problems, it is important to remember whatwe covered before in this book—you need to use Wireshark as a toolto augment other tools and your knowledge; otherwise, it may not spe-cifically point you in the right direction.
6.6 CONVERSATION FILTERS
Lastly, we will cover building conversation filters. This can be done byright clicking on a specific packet conversation between source anddestination address and select Conversation Filter, then for this exam-ple select IP. An example of this can be seen in Figure 6.12.
Figure 6.11 Filtering a UDP stream on an APIPA range.
74 The Wireshark Field Guide
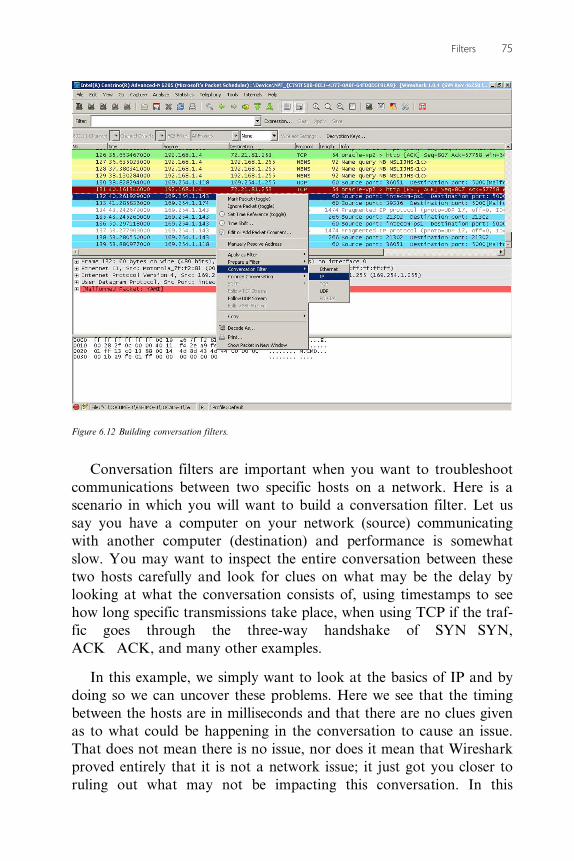
Conversation filters are important when you want to troubleshootcommunications between two specific hosts on a network. Here is ascenario in which you will want to build a conversation filter. Let ussay you have a computer on your network (source) communicatingwith another computer (destination) and performance is somewhatslow. You may want to inspect the entire conversation between thesetwo hosts carefully and look for clues on what may be the delay bylooking at what the conversation consists of, using timestamps to seehow long specific transmissions take place, when using TCP if the traf-fic goes through the three-way handshake of SYN�SYN,ACK�ACK, and many other examples.
In this example, we simply want to look at the basics of IP and bydoing so we can uncover these problems. Here we see that the timingbetween the hosts are in milliseconds and that there are no clues givenas to what could be happening in the conversation to cause an issue.That does not mean there is no issue, nor does it mean that Wiresharkproved entirely that it is not a network issue; it just got you closer toruling out what may not be impacting this conversation. In this
Figure 6.12 Building conversation filters.
75Filters

example, the hosts are communicating without issue; however, theproblem is that the network switch got disconnected from the gatewaywhere the DHCP server was sitting and the hosts moved to the APIPArange therefore they are not able to communicate with a specific appli-cation; however, more filtering and analysis need to take place todetermine why.
In Figure 6.13, we can use the Details pane of the Wireshark cap-ture window to uncover malformed packets when UDP/IP conversa-tions are built via Wireshark.
You could type the following into the Filter field to get the sameresult:
ip.addr eq 169.254.1.143 and ip.addr eq 169.254.1.255
In this example and previous examples in the chapter, the specificsof building filters to concisely list out what it is you need to look at(relevant data). There are literally hundreds if not thousands of exam-ples that can be given depending on what the problem is, how big your
Figure 6.13 Filtering out an IP conversation via UDP.
76 The Wireshark Field Guide

network is, how many systems are being used, and so on. Remember,it takes time to learn how to build filters so hopefully this field guidegave you enough to get you started on your journey. Make sure youvisit the Wireshark wiki as well as other sources of information tolearn more.
6.7 SUMMARY
In this chapter, we learnt about filtering captured data in hopes to giveyou the ability to analyze and troubleshoot your problems by stream-lining the data you will view and find relevant. As you can see fromthe last two chapters, filtering data can be done in many ways and insome ways can be confusing if you do not know what you are essen-tially looking for so understanding the problem at a high level isimportant to the process. In the next chapter, we will look at samplecaptures and apply some of these filtering techniques we learnt thusfar. This will set us up for Chapter 8 where we will start inspectingpackets for problems, looking into the headers, and learning about thedeeper analysis we need to do to solve problems.
77Filters

This page intentionally left blank

CHAPTER 77Sample Captures
7.1 GETTING STARTED........................................................................... 80
7.2 SAMPLE CAPTURES.......................................................................... 80
7.3 EXPERT ANALYSIS............................................................................ 84
7.4 FLOW GRAPHS ................................................................................. 87
7.5 SUMMARY ......................................................................................... 89
In the previous six chapters of this field guide, we have explored thefundamental steps of getting Wireshark downloaded, installed, andprepped for use. We have explored common problems and looked athow to get up and running quickly with this packet capture and analy-sis tool. In the last three chapters, we have looked at how to captureand filter data as well as the common problems associated with whyyou would need to use Wireshark in the first place. We have gonethrough troubleshooting methodologies and given you an understand-ing of why knowing when to use Wireshark is essential to using iteffectively. We have also learned tips on how to capture and filter rele-vant data.
In this chapter, we will learn more about captured data as weexplore sample captures and discuss problems that can be solved withWireshark in conjunction with the situation presented. For example, ifyou had a Dynamic Host Configuration Protocol (DHCP) problem,what exactly would you do to set Wireshark up to help you isolate theproblem? What exactly does the tool offer you to help baseline whatthe problem may be? Let us review a sample capture and find out.
This chapter of the field guide covers a few basic problems and focuseson methodology, which is one of the most important aspects to learnwhen trying to master Wireshark. Review each problem in its entirety inorder to benefit from each example.

7.1 GETTING STARTED
In this chapter, we expand on what we learned in Chapter 6 by cover-ing some advanced problems, how to solve them using Wireshark, andthe more complex use of analysis by applying more filters and review-ing expert analysis reports. Your learning of Wireshark can be aug-mented by real-world examples, which we will cover here. You can runyour own captures and filter for relevant data, or you can downloadthe sample captures highlighted within the chapter. You can also usethis chapter as a way to build a methodology you can use each timeyou are presented with a new problem. No matter how you approacheach issue, remember that methodology is the key to unlocking youranswers to root cause.
7.2 SAMPLE CAPTURES
Sample captures can be downloaded online. We will start with using apredownloaded capture file so that you can learn the methodology. Toview capture samples on the Wireshark Wiki, simply open theWireshark tool, and on the landing page, click on Sample Captures.Here, you will find approximately 100 samples of previously captureddata that you can review. This is an excellent way to help bolster yourknowledge on packet capture and analysis and network protocols. Forexample, you can review the many different protocols used on net-works today if you are not an expert in protocol analysis and can per-form this function everyday. You can also capture and filter your owndata if you prefer.
•••You can find and review captured data on the Wireshark Wiki. You canfind the data to review in the following pages:
http://wiki.wireshark.org/SampleCaptureshttp://wiki.wireshark.org/CaptureFilters
You can contribute to the capture sample repository by going to the sam-ple captures page and following the instructions listed on the main page.It will explain the correct process and format for you to follow so thatyou can contribute.
80 The Wireshark Field Guide

In this example, we will look at the DHCP, which is an extremelycommon protocol used today. DHCP is used to dynamically assign IPaddresses to systems that request them so they can connect to andcommunicate on a network. What you may know already is how thebasic architecture of DHCP is laid out; however, you may or may notknow the specifics of the underlying functions of the protocol andwhat may go wrong. You would use Wireshark to determine this.
Figure 7.1 shows the basic architecture that would be needed forDHCP clients to get dynamically assigned addressing from a DHCPserver. Here, we have put the clients on one subnet and the server on aseparate subnet. We have added a firewall as well.
How is it supposed to work?
1. DHCP clients will communicate with a server using UDP port 67to send data to the DHCP server, and UDP port 68 to send data tothe DHCP client.
Figure 7.1 Understanding how DHCP works.
81Sample Captures

2. Since DHCP communicates via UDP, they can communicate onthe same subnet without issue; however, if moving across a routerto a separate subnet, a DHCP relay will be needed to forward thecommunications to the DHCP server for communication to takeplace.
3. Once the path has been verified and communication is possible, theclients and the server communicate via a process called DORA:Discovery, Offer, Request, and Acknowledgment.
4. A discovery packet is sent from the client to the server. The serverthen makes an IP lease offer. The client then makes an IP request,and the server acknowledges with an IP lease.
As you can see, there are many things that could go wrong andmany reasons why it would be important to perhaps set up a port mir-ror (or Wireshark on the host directly) to solve this issue. You can alsoset up Wireshark directly on the DHCP server or the clients.
•••You can find more information on protocols, ports, and address assign-ments by visiting this site: http://www.iana.org/assignments/service-names-port-numbers/service-names-port-numbers.xml.
To see this in Wireshark, you would need to capture the client(source) communicating with the DHCP server (destination) and filterfor DHCP. This is shown in Figure 7.2.
Here, we can see how the communication takes place between theclient, to the server, back to the client and then finally with the serverresponding back to the client with an acknowledgment and IP lease.
In Wireshark, we can see the specifics of this communication andcould quite potentially verify its taking place and/or find where theproblems may be taking place. Here are some examples:
1. If the DHCP relay agent (a Cisco IP Helper Address commonlyfound on Cisco devices) is not configured properly (or at all), youwill not see a communication back from the server.
2. If a firewall in place does not allow for the DHCP protocol to com-municate bidirectional, it will be blocked.
3. If the clients are sending discovery packets to an IP address, but arogue DHCP server exists, we can find those packets in the trace.
82 The Wireshark Field Guide

4. If the clients have a firewall configured locally, we can see that thediscovery packets are not getting to the port mirror configured tocapture the traffic.
This is one example of how Wireshark can help you see the detailsof what may be causing a network issue, specifically with dynamicassignment of IP addresses. We can even look deeper into the data tosolve problems.
DHCP works by using BOOTP, also known as the BootstrapProtocol. In the Wireshark capture window, you can view theDiscover data by highlighting that specific frame and expanding theDetail pane’s view and scrolling down to the BOOTP data. This isshown in Figure 7.3.
Here, we can isolate specific data. Specifically, we can see that thedata is sent unicast and contains no relevant IP addressing data untilthe full DORA process takes place. By jumping ahead and reviewingthe final IP lease information provided by the DHCP server, you can
Figure 7.2 Viewing DHCP traffic in Wireshark.
83Sample Captures

see that an IP address has been given to the client for use:192.168.0.10. This is shown in Figure 7.4.
This is only one simple example that you can view to understandwhy methodology and knowledge of architecture and basic protocolwill help you solve problems using Wireshark. Without knowing thelayout of the systems, which can come from discovery or alreadydrawn up maps, you will have a hard time isolating what the problemmay be or where it may be coming from.
Having basic knowledge of protocols is also important for you to suc-cessfully troubleshoot the Wireshark. Without knowing that DHCP func-tions a certain way, using certain ports and underlying protocols, you willhave a hard time isolating a break in the system with Wireshark.
7.3 EXPERT ANALYSIS
A commonly used tool with Wireshark is called Expert Info. It canhelp you diagnose serious problems, or sometimes point you to a prob-lem that does not really exist. This is called a “false positive.”
As we mentioned in Chapter 1, Wireshark is a tool that requiresyou to understand the basics of networking, know how computer
Figure 7.3 Viewing DHCP discover in Wireshark.
84 The Wireshark Field Guide

systems operate, and even know details down into the hardware, soft-ware, and NIC card drivers.
This is where troubleshooting can get tricky. In Figure 7.5, theWireshark Expert Info is shown. This can be invoked by going to theAnalyze menu in the Wireshark capture window and selecting ExpertInfo from the drop down menu. Here, you can view the Errors,Warnings, Notes, Chats, Details, and Packet Comments tabs.
Each tab provides specific data you can use to learn more aboutyour current capture data and get clues on possible issues. For exam-ple, in these tabs, you may find that these are malformed packets asshown in Figure 7.5. Commonly found problems are malformed pack-ets, checksum errors, out-of-order packets, Transmission ControlProtocol (TCP) retransmissions, resets, and duplicate acknowledg-ments, to name a few.
In each section, you can find specific details on what Wireshark hasanalyzed from the captured data. What the Expert Info does is
Figure 7.4 Viewing DHCP acknowledgment in Wireshark.
85Sample Captures

correlate the entire capture and come up with some basic assumptionsof what is taking place on the network. For example, in Figure 7.5,Wireshark has found a series of malformed packets that you wouldhave had to scan through each packet in the Details pane to find.
As we reviewed earlier in the chapter with the DHCP acknowledgepacket in the DORA process, we found an error in the packet asshown in Figure 7.6.
What this means is simple; there is a calculated error found on thedata that Wireshark captured and Wireshark flagged this data as“bad.” This does not necessarily mean that you have a problem, how-ever. What this could mean in this sequence of packets is that thechecksum may not have been calculated prior to Wireshark capturingthe data.
To troubleshoot TCP problems with a high degree of success, you willneed to understand how TCP is a connection-based technology andUDP is connectionless. Understanding how the three-way-handshakeworks and the inner workings of TCP is critical to solving problems inregards to communications on data networks. We will learn more aboutthe three-way-handshake in Chapter 8.
It can be confusing to some to see an error and find that it is notalways an error, but how the system works with Wireshark, hence why
Figure 7.5 Viewing Expert Info in Wireshark.
86 The Wireshark Field Guide

they call it a false positive. The checksum is in fact bad to Wireshark;however, because it was captured before it was calculated simplymeans that it could possibly be ok. A good way to root out false posi-tives is by looking at the Expert Info window’s “other” problems tak-ing place at the same time. If there are dozens of retransmissions, out-of-order packets, and so on, it means, it is possible that the bad check-sum may also be relevant. Figure 7.7 shows an example of a badchecksum problem where no other problems exist, ruling that it couldpossibly be a false positive.
•••A quick way to find a problematic packet is to open the Expert Info dia-log box and click on the error message in the tabs. This will direct you tothe problem packet in the Wireshark capture window Summary pane.
7.4 FLOW GRAPHS
Another commonly used tool with Wireshark is a flow graph. A flowgraph can be used to find details about all messages used in a stream.We learned about TCP and UDP streams and what they can provide.In a flow graph, you can show all of them (or sections of them) in areportable graph tool. By opening the Wireshark capture window and
Figure 7.6 Viewing a bad checksum in Wireshark.
87Sample Captures
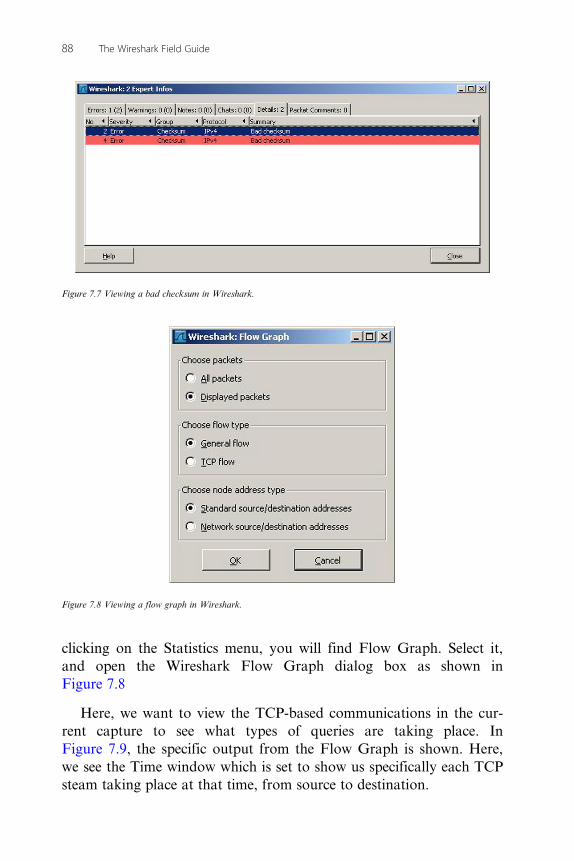
clicking on the Statistics menu, you will find Flow Graph. Select it,and open the Wireshark Flow Graph dialog box as shown inFigure 7.8
Here, we want to view the TCP-based communications in the cur-rent capture to see what types of queries are taking place. InFigure 7.9, the specific output from the Flow Graph is shown. Here,we see the Time window which is set to show us specifically each TCPsteam taking place at that time, from source to destination.
Figure 7.7 Viewing a bad checksum in Wireshark.
Figure 7.8 Viewing a flow graph in Wireshark.
88 The Wireshark Field Guide

•••If you click on one of the arrows/flows within the graph, it will highlightthe relevant packet in the main window.
Flow graphs help in seeing how the traffic on the network lookslike as a whole, not just from single source and destination pairs. Youcan see how many hosts are having conversations with a single hostand then can find out if that host may or may not be overwhelmedwith connections.
You may have to adjust the time-stamping options in order to spe-cifically report on time. In order to do this, open the Wireshark cap-ture window and click on the View menu, select Time Display Format,and then adjust the time settings you would like to see, which is shownin Figure 7.10.
•••To learn more about specific problems, a great place to learn from, dis-cuss with all levels of expertise, and ask questions is the Wireshark Askforum.
http://ask.wireshark.org
Figure 7.9 Viewing a flow graph in Wireshark.
89Sample Captures

7.5 SUMMARY
In this chapter, we have learned more about how to solve problemswith captured and filtered data. So far, we have learned how to getWireshark up and running and use it to capture data and filter it; how-ever, we have now expanded into topics that show the real power ofWireshark and what it can help you discover. In Chapter 8, we willlook under the hood and learn how to conduct more detailed analysiswith Wireshark.
Figure 7.10 Adjusting time in Wireshark.
90 The Wireshark Field Guide
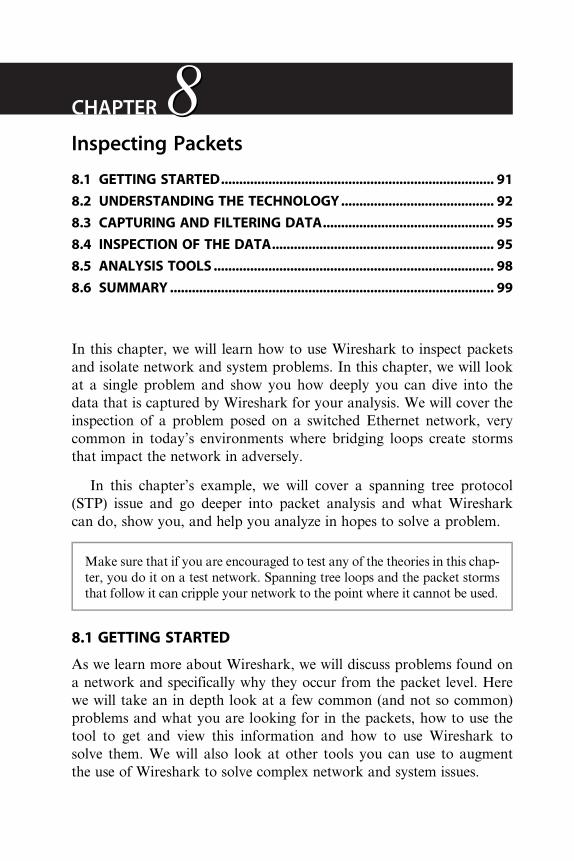
CHAPTER 88Inspecting Packets
8.1 GETTING STARTED........................................................................... 91
8.2 UNDERSTANDING THE TECHNOLOGY.......................................... 92
8.3 CAPTURING AND FILTERING DATA............................................... 95
8.4 INSPECTION OF THE DATA............................................................. 95
8.5 ANALYSIS TOOLS ............................................................................. 98
8.6 SUMMARY ......................................................................................... 99
In this chapter, we will learn how to use Wireshark to inspect packetsand isolate network and system problems. In this chapter, we will lookat a single problem and show you how deeply you can dive into thedata that is captured by Wireshark for your analysis. We will cover theinspection of a problem posed on a switched Ethernet network, verycommon in today’s environments where bridging loops create stormsthat impact the network in adversely.
In this chapter’s example, we will cover a spanning tree protocol(STP) issue and go deeper into packet analysis and what Wiresharkcan do, show you, and help you analyze in hopes to solve a problem.
Make sure that if you are encouraged to test any of the theories in this chap-ter, you do it on a test network. Spanning tree loops and the packet stormsthat follow it can cripple your network to the point where it cannot be used.
8.1 GETTING STARTED
As we learn more about Wireshark, we will discuss problems found ona network and specifically why they occur from the packet level. Herewe will take an in depth look at a few common (and not so common)problems and what you are looking for in the packets, how to use thetool to get and view this information and how to use Wireshark tosolve them. We will also look at other tools you can use to augmentthe use of Wireshark to solve complex network and system issues.

8.2 UNDERSTANDING THE TECHNOLOGY
STP is a network technology that helps logically manage a switched(or bridged) network that has redundant connections so that you donot have “loops” in the network topology. It is a protocol that runs onthe network switches and can be configured to be optimized, however,it is generally operational by default. STP (which we will call SpanningTree for short ongoing) is an IEEE standard. It is known by the identi-fier 802.1D.
The way it works is simple. It will allow data to traverse on oneconnection, but will block the redundant connection to prevent a loop,which in turn can cause a broadcast storm that floods the networkwith packets and causes all devices to process this data at a rapid ratethereby causing other symptoms, such as high CPU and I/O use.When Spanning Tree is put in place, it can keep a network verystable and it recommended whenever you have more than one connec-tion to any single device. A Spanning Tree is created by the switcheson the network and can be configured.
A device called a root bridge (usually the system with the lowest bridgeID computed by a priority number, a port number, and a MAC address)maintains the Spanning Tree for that particular network segment.
Figure 8.1 shows an example of a very simple network hierarchywhere five network switches are connected together to form a LAN.
In Figure 8.1, we see ports (where connecting links uplink to otherswitches) configured in a way where data can traverse the networkwithout creating a loop. The root port (RP) forwards the data basedon a computation of least cost path from the switch in which it is con-nected. The designated port (DP) is the least cost path for that segmentthat connects each switch. This creates the least cost path. However, ifa loop is present from a redundant port, that port is put into a blockedstate and becomes a blocked port (BP).
When the Spanning Tree is configured, running and optimal and all portsare stable as well the Spanning Tree is considered “converged.”
Ports become a RP, DP, or BP by going through a series of states.When a connection is made to a switch the port (through Spanning
92 The Wireshark Field Guide

Tree) will go through the process of listening, learning, forwarding,blocking, or disabling. These are explained as follows:
1. Listening: When a port is listening, it does not pass traffic. It doesnot populate the MAC address table where the switch makes itsswitching decisions.
2. Learning: When a port is learning, it does not pass traffic. It doespopulate the MAC address table where the switch makes its switch-ing decisions.
3. Forwarding: When a port is forwarding, it is sending traffic basedon the MAC address table where the switch makes its switchingdecisions.
4. Blocking: If a port is identified as a potential for a loop, the port isput into blocking state. This does not disable the port, it onlyblocks traffic to and from it. The reason why this is important isbecause when you want redundancy this port becomes part of theredundancy. For example, you may have a switch to fail over toanother switch if it fails. If one switch fails, the BP switches to for-warding and data continues to flow through the network.
5. Disabling: Normally a port is in disabling state when it is manuallyshutdown or disconnected completely.
Root bridge
RPRP
RPRP
DP DP
DPBP
Figure 8.1 Typical network with STP.
93Inspecting Packets

•••It is recommended that you use rapid spanning tree protocol (RSTP)IEEE 802.1w to limit the default timers used in order to reach conver-gence. RSTP uses roles, such as root, designated, alternate, backup, anddisabled. It ports the port states learning, forwarding, and discarding.
The states in which the Spanning Tree transform into and how itmaintains convergence is done by information sent to and from eachswitch through bridge protocol data units (BPDUs).
A BPDU is the data that traverses the Spanning Tree topologydevices through the network to control how the Spanning Tree oper-ates. When using Wireshark, this is specifically what you will capturein order to troubleshoot Spanning Tree problems. A BPDU frame isbroken down into 12 fields as shown in Figure 8.2.
These fields will become relevant when you start to captureSpanning Tree data and review within the Wireshark capturewindow.
Protocol identifier
Protocol version identifier
Root identifier
Bridge identifier
Port identifier
Message age
Max age
Hello time
Forward delay
Root path cost
BPDU type
Flags
Figure 8.2 BPDU fields.
94 The Wireshark Field Guide

8.3 CAPTURING AND FILTERING DATA
Now that we understand how a Spanning Tree is supposed to operate,let’s look at some common problems that may occur within it and whywhen capturing data with Wireshark is equally important to under-stand. Some common problems you may encounter are (but not lim-ited to):
• Spanning Tree 802.1D used instead of 802.1w• No root bridge configured or a root bridge configured on an under-
powered device not centered in your topology• Using redundancy [with protocols such as Cisco’s hot standby
router protocol (HSRP)] and designing Spanning Tree incorrectlywhen using it
• Too many redundant links in a blocking state• Not using STP or any other technology of its kind.
In this example, we connected to a switch in the core of the networkclosest to the center of the topology. Spanning Tree when captured byWireshark can be filtered by using the Expression Filter as shown inFigure 8.3. As you review the filter expressions, it should clear thateverything we just learned about is something you could filter forwithin the captured data you collect. In this example, we will look forthe location of the root bridge using the captured BPDU frames.
Once we filter the data, we can see the root bridge captured inFigure 8.4. In this example, we filtered for the STP. BPDUs sentthrough the network every 2 seconds are sent via a multicast address.The address is 01:80:C2:00:00:00.
To do a deep dive of this, we need to select a frame with this multi-cast address and filter deeper for the root bridge. We can then movefrom the Summary pane into the Detail pane as shown in Figure 8.5.
The root bridge can be found within the sections of the Detailspane, which we will dig into next.
8.4 INSPECTION OF THE DATA
Now that we have captured and filtered for the relevant data, we arenow ready to do a deeper inspect of the data within the frame. Weneed to recall the BPDU frame we learned about in Figure 8.2. In the
95Inspecting Packets

Figure 8.3 Filtering STP.
Figure 8.4 Wireshark with captured data.
96 The Wireshark Field Guide

Details pane, we can review the specifics we learned about such as firstreviewing the Frame field as shown in Figure 8.6. Here we can reviewwhen the frame was captured and its size.
Next, we can review the Ethernet field as shown in Figure 8.7. Herewe can review the source and destination MAC address. We can see inthe destination section the multicast address 01:80:C2:00:00:00. Wecan see the source MAC address comes from a Cisco switch.
Once we have found where the frame is coming from and where itis going to, we can inspect the LLC field. In Chapter 1, we reviewedthe OSI model and learned that at layer 2 of the model we see its splitinto two layers, one being the LLC. When frames operate at layer 2(using MAC addresses), the LLC field maintains specific data at ahigher level in the model. In Figure 8.8, we can see that data as theBPDU information.
Once we have reviewed that data, we can see in the STP field (asshown in Figure 8.9) the specifics we were looking for, primarily theroot bridge assignment as well as the MAC address associated with it.
Figure 8.5 Searching for the root bridge in the Detail pane.
97Inspecting Packets

Now we know what system holds the identity of the root bridge. Tofind what device this is on your network, you can either look in theMAC address tables and find the relevant port, then map the ARPtables to IP addresses if a layer 3 assignment is given.
8.5 ANALYSIS TOOLS
To maintain a healthy Spanning Tree and be able to monitor its stabil-ity, you should consider not only designing it correctly, but also
Figure 8.6 Inspecting the frame field.
Figure 8.7 Inspecting the Ethernet field.
Figure 8.8 Inspecting the LLC field.
98 The Wireshark Field Guide

managing and monitoring it the best you can. There are tools availableto help you to do this.
Two notable tools that can help you manage and monitor yourSpanning Tree network is the SolarWinds (www.solarwinds.com) net-work monitoring tools or the Cisco (www.cisco.com) network monitor-ing tools called Cisco Prime.
Other technologies you can put into place are configurations, suchas RootGuard, PortFast, UplinkFast, LoopGuard, BPDUGuard,BPDUFilter, and BackboneFast from Cisco, which help you to furthermanage the stability of your Spanning Tree network.
8.6 SUMMARY
In this chapter, we looked at the specific details you could find wheninspecting packets using Wireshark. In the example given, we took alook at how understanding a technology like Spanning Tree is criticalto the process before a capture is even taken. Then, understanding thetopology and where to capture data from equally important to findingspecifically what you are looking for. We then filtered the data to findwhat we needed and inspected the data closely to find what we werelooking for. In the next chapter, we will look deeper into the data tofind out ways Wireshark can assist you with finding more complexissues and how to use other tools to help find a problem’s root cause.
Figure 8.9 Inspecting the STP field.
99Inspecting Packets

This page intentionally left blank

CHAPTER 99Deep Analysis
9.1 GETTING STARTED......................................................................... 102
9.2 DEEP ANALYSIS.............................................................................. 102
9.3 ANALYZING FLOW......................................................................... 107
9.4 TROUBLESHOOTING PHONES ...................................................... 109
9.5 SECURITY ANALYSIS...................................................................... 110
9.6 NETWORK PERFORMANCE ANALYSISAND OPTIMIZATION ...................................................................... 112
9.7 USING WIRESHARK ONLINE ......................................................... 117
9.8 SUMMARY ....................................................................................... 118
In this chapter, we will learn how to use Wireshark to go deeper intoinspecting packets and isolating network and system problems. In thischapter, we will expand on what we learned in the last chapter butlook at other areas of the network and the systems in use so that youcan learn more about how to troubleshoot with Wireshark to solveproblems at a deeper level.
In this chapter, we take a deeper look into the data, the systemsand the network in order to define and find root cause of problems aswell as how to use Wireshark and other enterprise tools to solve issuesthat occur over WAN links, when using a softphone and to find secu-rity problems. We will learn about probes, taps, and how all of thesetools can be used together to create a complete picture to help you notonly understand why data traverses a network a certain way but alsowhy it chooses specific paths, how it interacts with destination systems,and what could go wrong within those conversations. We will look atVoice over IP (VoIP) problems, malicious software issues, how intru-sion detection/prevention, scanning, and many other services work ona network and how Wireshark can help you work with them whensolving issues.
9.1 GETTING STARTED
When you work with a network or are directly responsible for it, youwill often hear that there are problems with it. Some are common helpdesk requests from users who have problems remembering their systempasswords, and others are calls from users who cannot login becausetheir network cable got unplugged again. Although these are commonproblems, and annoying at times, they are easily fixed through a quickseries of troubleshooting steps and usually require a simple solution.We learned about using a troubleshooting methodology throughoutthis entire field guide.
End users constantly call the help desk and complain about the net-work, they normally say that the network is too slow. On the complaintlist is a steady flow of why the speed of their logins is slow, hanging orfrozen applications, or timed-out sessions? Obviously, there could be aproblem with network performance if the majority of your users call tocomplain, however, sometimes it is isolated to a single location, networksegment, or even one or two users. Where do you begin to look for thesource of this problem? With enterprise networks growing and connect-ing to other companies’ networks increasingly rapidly, monitoring net-work performance can become a cumbersome task.
In this chapter, we look at how to initially isolate a problem, moni-tor the network’s performance using tools like Wireshark, and thenoffer tips on how to correct the issues.
9.2 DEEP ANALYSIS
For our first discussion, we will look at how to analyze a connectionrequest from a source system to a destination system and analyzingany problems that can occur in between. When connections are estab-lished using the TCP/IP protocol stack the “manager” of this effort ishandled by the TCP.
Some of the problems that can occur to cause issues with TCP fromfunctioning correctly is ports being blocked by a firewall, a faulty net-work connection (such as a NIC card or switch port), or misconfiguredsettings on network and system devices.
TCP handshake is how connection-oriented communication takesplace. For connectionless UDP is used. When TCP is used (e.g., to
102 The Wireshark Field Guide

visit a website), TCP handles the connection establishment between thesource and destination devices. When this connection establishmenttakes place, the first few packets sent back and forth are called theTCP handshake. How the TCP handshake works is shown inFigure 9.1. The source computer will request a connection to the desti-nation by sending a packet with a SYN. This is usually initiated if youare going to use a resource on the server from the client such asrequesting to view or use a web page as an example.
Once the request for connection has been made, the destination system(the server with the web page) will grant the connection with a SYN,ACK. Then the source system acknowledges the destination system withan ACK. Once the three-way handshake takes place, the connection isdeemed established and data can pass. The result is that the source system(the client) can view the web page on the destination system (the server).
So now that we have an understanding on how TCP/IP works onyour network, what would Wireshark show when you capture thiscommunication between the source and destination? To view this com-munication, you need to capture data in between a source system anda destination and configure Wireshark to capture it. You can performthe same test by having a client connect to a web page on a server andcapture the communication as seen in Figure 9.2.
As you can see in Figure 9.2, the client (192.168.1.4) is making a con-nect request to view a web page on a server (72.21.81.253). We havecaptured the communication as seen in the Wireshark capture windowand it can be verified by looking in the Summary pane. Here you see thesource and destination IP addresses as well as the protocols being usedwhich are TCP and HTTP. This maps directly to our discussion and
Source DestinationRequest for connection (SYN)
Connection granted (SYN, ACK)
Connection acknowledged (ACK)
Established connectionpassing data
Figure 9.1 The TCP handshake sequence.
103Deep Analysis

example on a client visiting a web page on a server. You can use theInfo section to derive the data such as the TCP handshake taking place.
So let us dive into reviewing the segments and review the finerdetails in the Details pane of Wireshark. In Figure 9.3, we haveselected the first portion of the handshake to review. Here we see theclient (source) sending a connection request to the server (destination)using port 80 (HTTP). In the flags field, we see the SYN bit set.
Once the connection is underway, the destination system needs tosend a SYN, ACK back to the source as seen in Figure 9.4. InFigure 9.4, we can see the source IP address as the server and then desti-nation switches to the client. We can see the flags set to SYN and ACK.
In Figure 9.5, we see the completion of the handshake by the source(client) sending an ACK to the destination (server) completing thehandshake. In the flags section, we can see the ACK set.
When working with Wireshark to solve a network problem, youcould attempt to capture this three-way handshake and check these
Figure 9.2 Viewing the TCP handshake in Wireshark.
104 The Wireshark Field Guide

Figure 9.3 Viewing the TCP handshake in the Detail pane (SYN).
Figure 9.4 Viewing the TCP handshake in the Detail pane (SYN, ACK).
105Deep Analysis

specific sections to see if, for example, the client sends a connectionestablishment request (SYN), and you do not see a SYN, ACK inreturn. Or, you can see disconnects in the established connection.
The flags are important because this is where you can see specificdata in regards to what bits are actually turned on. TCP Windowingcan also be seen in the flags section. Many applications rely on a net-work to be able to perform adequately and if there is a large amountof small packets, fragmentation, retransmissions, high buffering, orother problems associated with causing performance problems, youcan use the data found in your captures to find and then resolve them.
In Figure 9.6, we can review the TCP windowing flag. TCP hostswhen communicating need to agree to limit or amount of data thatcan be sent at any given time. This is called the TCP window size andfound in the TCP header.
In this example, we can see that the window size has been config-ured to a predetermined (or agreed) size. This is determined on the ini-tial SYN sent to establish the connection via the source system. In this
Figure 9.5 Viewing the TCP handshake in the Detail pane (ACK).
106 The Wireshark Field Guide

example, no scaling was used and the preset or predetermined sizingwas used. If a problem did exist, you would see congestion notifica-tions in use as seen in Figure 9.6.
Some Windows systems (such as Vista as an example) used autotuningfeatures to adjust TCP flow. You can also find these types of issues whenworking with Wireshark by reviewing the details pane very closely andmonitoring the specific sizing details noted earlier.
9.3 ANALYZING FLOW
There are other ways you can use Wireshark to review connectionsfrom source to destination. As we covered earlier in the field guide,using flow graphs can be a helpful way to review communications onyour network. To set up a flow graph, go to the Wireshark capturewindow and select the Statistics menu and choose Flow Graph fromthe drop down menu. In Figure 9.7, you can configure the flow graphhow you would like to see it. In this example, choose TCP flow.
Figure 9.6 The TCP windowing process.
107Deep Analysis

In Figure 9.8, you can see the flow graph created around the previ-ous example of the TCP handshake sequence. Here you can see specifi-cally how long it took and what sequence numbers were being used.This is a quick way to see if you have latency issues where or problemswith the sequence.
Figure 9.7 Configuring a flow graph.
Figure 9.8 Viewing the TCP handshake in a flow graph.
108 The Wireshark Field Guide

In sum, TCP communication is a critical component to TCP/IP net-work communication. It manages the established connection andensures that the oriented connection remains established and data tra-verses the network from source to destination and if any problemsoccur, Wireshark can help find exactly what may have caused the issuewhen you review and analyze the captured and filtered data.
9.4 TROUBLESHOOTING PHONES
In this example, we will look at another problem and take a deep diveinto how to solve it using Wireshark. Here we will look at how a soft-phone could have an issue connecting to a destination and howWireshark can help assist you in finding out why.
In Figure 9.9, we use a simple softphone loaded on a Windows cli-ent to initiate a call to another host. In this example, we can see thatthe account failed to enable and the error given by the phone isthat the network data needs to be verified. This is something thatWireshark should be able to uncover rather quickly.
Our next step would be to use Wireshark to capture the data fromthe source (the softphone) to the destination (the connecting host). InFigure 9.10, we see the data captured by Wireshark indicating that thephone is trying to register a connection to the connecting host. We cansee the source and destination IP addresses as well as the protocol inuse which is the session initiation protocol (SIP).
As we dig deeper into the Detail pane, we can see specific data thatis relevant to solving the problem. In this case, a firewall was blockingthe connection and causing the softphone to ring but no one is able toanswer thus not being able to register to the unified communicationssystem where it needs to register (Figure 9.11).
You can also review specific SIP statistics as seen in Figure 9.12 bygoing to the Wireshark capture window and selecting the Telephonymenu, then selecting SIP. Once you select SIP you can click on CreateStat. You can then review the specific statistics such as how manypackets were sent, resent, and specifically get an average baseline forhow long it takes for calls to setup.
109Deep Analysis

9.5 SECURITY ANALYSIS
In our next example, we will look at how Wireshark can be used toidentify security issues on your network. In this example, we have usedsample captures found in the Wireshark online capture repository.
To take a deep dive into security problems, you can also get ageneral feel for what is going on with your captured data by review-ing the Expert Info. In the DNS Remoteshell pcap file, we canreview the Expert Info in Figure 9.13. Here we see specific Denialof Service (DoS) attempts by constant connection establishment
Figure 9.9 Using a network softphone.
110 The Wireshark Field Guide

requests. This also relates to the TCP handshake sequence we learnedabout earlier.
By taking a quick look at the Expert, we can see constant SYNsuntil a RST (reset) takes place.
We can also review the Teardrop pcap file. This is another formof a DoS attack. This type of attack takes place by a host sending“mangled” data (IP fragments) with problematic payload sizes to adestination (target) system. By doing so, they could potentially crashthe destination system if it becomes overwhelmed.
Figure 9.10 Viewing SIP connections in Wireshark.
Figure 9.11 Viewing SIP in the Detail pane.
111Deep Analysis

Figure 9.14 shows the detail pane where you can see the payloadsizes and if you do analysis on multiple attempts at the destination,you could find that the mangled data fragments occur at differing sizeswhich could potentially be problematic to the target system.
Wireshark can quickly and easily help you identify problems withsecurity on your network. For example, if you wanted to capture clear-text passwords, you can do so with Wireshark. TCP/IP version 4 pro-tocols, such as FTP, Telnet, SNMP, and others send data in cleartextand if captured, the credentials to a system could be read andcompromised.
9.6 NETWORK PERFORMANCE ANALYSIS AND OPTIMIZATION
Another problem you may have to contend with (and optimize) isapplication traffic crippling your WAN connections. Application
Figure 9.12 Reviewing SIP statistics.
112 The Wireshark Field Guide

analysis is the hallmark of an experienced technician. As the networkor protocol analyst, it is your organization’s responsibility to makesure that you know what protocols are being introduced into the net-work. It is up to you to be able to use a tool-like Wireshark to captureand analyze them to solve problems. You can use Timestamps in theWireshark capture window Summary pane to analyze response timesthrough time stamp analysis. This will help you rule out latency issues.You can also use Wireshark to find out if bandwidth is an issue.
You can use tools and analyze the bandwidth being used over aWAN link (as an example) to verify that you have enough so data cantraverse a network without issues. If you are using a 100 Mbps
Figure 9.14 Using the Detail pane to find security issues.
Figure 9.13 Using the expert analysis to find security issues.
113Deep Analysis
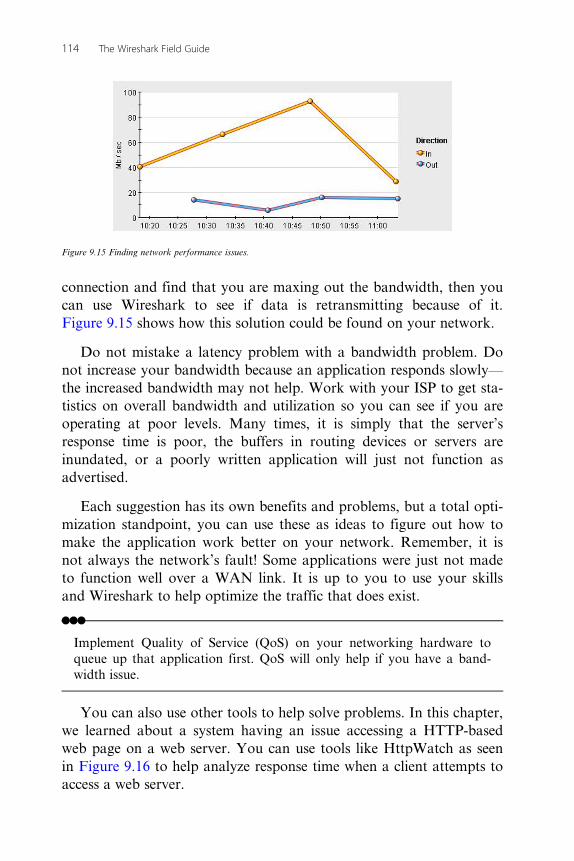
connection and find that you are maxing out the bandwidth, then youcan use Wireshark to see if data is retransmitting because of it.Figure 9.15 shows how this solution could be found on your network.
Do not mistake a latency problem with a bandwidth problem. Donot increase your bandwidth because an application responds slowly—the increased bandwidth may not help. Work with your ISP to get sta-tistics on overall bandwidth and utilization so you can see if you areoperating at poor levels. Many times, it is simply that the server’sresponse time is poor, the buffers in routing devices or servers areinundated, or a poorly written application will just not function asadvertised.
Each suggestion has its own benefits and problems, but a total opti-mization standpoint, you can use these as ideas to figure out how tomake the application work better on your network. Remember, it isnot always the network’s fault! Some applications were just not madeto function well over a WAN link. It is up to you to use your skillsand Wireshark to help optimize the traffic that does exist.
•••Implement Quality of Service (QoS) on your networking hardware toqueue up that application first. QoS will only help if you have a band-width issue.
You can also use other tools to help solve problems. In this chapter,we learned about a system having an issue accessing a HTTP-basedweb page on a web server. You can use tools like HttpWatch as seenin Figure 9.16 to help analyze response time when a client attempts toaccess a web server.
Figure 9.15 Finding network performance issues.
114 The Wireshark Field Guide
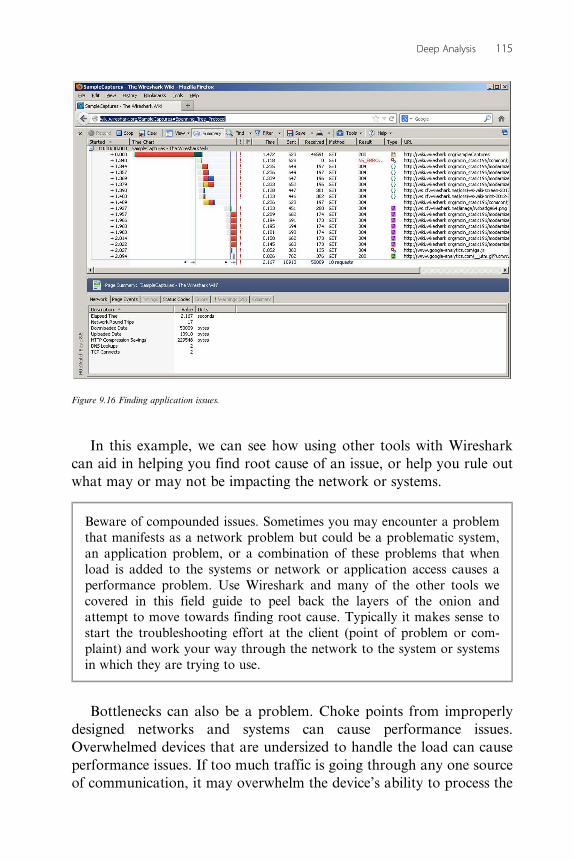
In this example, we can see how using other tools with Wiresharkcan aid in helping you find root cause of an issue, or help you rule outwhat may or may not be impacting the network or systems.
Beware of compounded issues. Sometimes you may encounter a problemthat manifests as a network problem but could be a problematic system,an application problem, or a combination of these problems that whenload is added to the systems or network or application access causes aperformance problem. Use Wireshark and many of the other tools wecovered in this field guide to peel back the layers of the onion andattempt to move towards finding root cause. Typically it makes sense tostart the troubleshooting effort at the client (point of problem or com-plaint) and work your way through the network to the system or systemsin which they are trying to use.
Bottlenecks can also be a problem. Choke points from improperlydesigned networks and systems can cause performance issues.Overwhelmed devices that are undersized to handle the load can causeperformance issues. If too much traffic is going through any one sourceof communication, it may overwhelm the device’s ability to process the
Figure 9.16 Finding application issues.
115Deep Analysis

traffic. This will cause dropped packets, which will require the origi-nating system to resend them, increasing the load on your network. Tooptimize Ethernet-based networks, you can design your network prop-erly with a high-speed backbone and high-speed desktop switching.Make sure your servers, routers, desktops, or any other device are notthe source of the bottleneck.
Unnecessary protocols, which depend on broadcast traffic, canincrease the amount of traffic on your network. Also, multicast trafficsuch as name resolution and switch and bridge updates can consumebandwidth needed for other traffic. To optimize Ethernet, you can dothe following:
• Eliminate unneeded protocols from your network hosts (clients, ser-vers, routers, etc.).
• Eliminate unneeded hosts on your network that are not in use andare perhaps sending out keepalives or some other traffic on the wire(make the collision domain smaller).
• Use Switching instead of shared access hubs.• Implement VLANs if possible to separate broadcast domains or use
a router to block broadcast traffic.• Watch for high percentages of network utilization. It can vary from
network to network, but anything over 40% is generally too high onan Ethernet network. If you are on a switched network, then any-thing over 70% is too high.
• Watch for hardware-related errors. Jabbers or failing NICs oftencause long or short frames and Cyclic Redundancy Check (CRC)errors. Correct these problems as they are found.
• Broadcasts and multicasts should be no more than 20% of all net-work traffic.
• On Ethernet networks there should be no more than 1 CRC errorper 1 million bytes of data.
You can also ask specific questions to help you get closer to ananswer:
• Is poor network performance affecting one user, several users, orthe entire network?
• Is the poor performance centered at a particular location or theentire network?
116 The Wireshark Field Guide
• When exactly did you start noticing poor performance or has italways been bad?
• Have any recent changes taken place—no matter how large orsmall?
• Do you have any network documentation or topology maps?
Always try to see if poor network performance is affecting one user,several users, or the entire network. Isolate your problems and nailthem down one at a time, if possible.
Always view network documentation and topology maps, if avail-able, to try to find out whether the initial design itself is causing per-formance issues. You need not use Wireshark immediately toformulate a clue on where the problems lie; detailed topology mapsspeak for themselves, however, you can run a sample capture to helpascertain a clue or two.
When you are initially analyzing performance on a network, it isimportant to interview the staff (both users and administrators) to geta solid picture of network health from a “maintenance performed”point of view. Involve vendor support if needed. Ask administratorsabout changes made to the network recently, find out if things had got-ten bad at a specific time, and use the information you gather as partof your analysis. Often changes made to a network result in poor per-formance, and the staff might be unaware of the cause.
Always involve your ISP in your overall analysis if you cannot ver-ify the connecting links. Ask for service-level agreements (SLAs) ifthey are available and bandwidth utilization charts if they keep them.This information will help you get a bigger picture of possible perfor-mance problems.
9.7 USING WIRESHARK ONLINE
You can always do deeper dives into captured data by simply usingWireshark’s ability to link to online documentation. In Figure 9.17,you can see a specific example of how to click and pull up a menufrom data in the Detail pane to produce a link where you can pull upthe Wireshark Wiki pages to help explain specific data you may or
117Deep Analysis
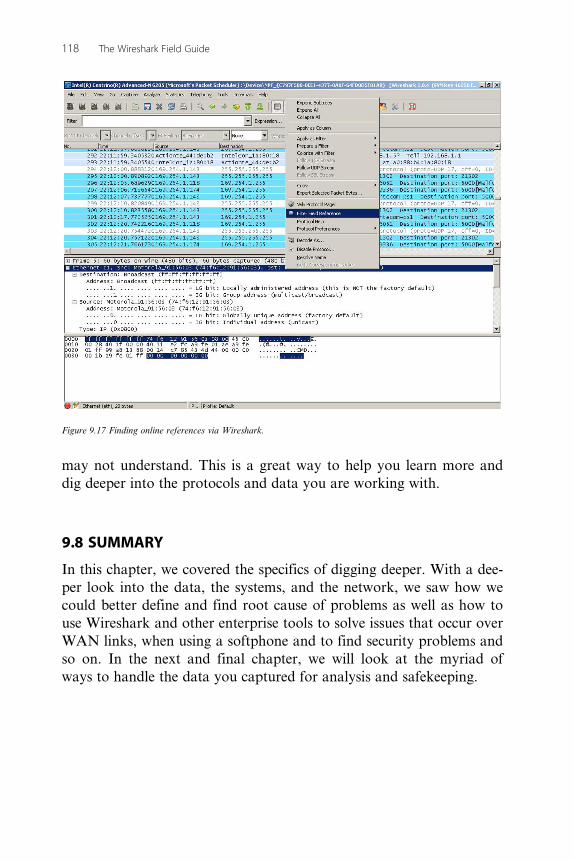
may not understand. This is a great way to help you learn more anddig deeper into the protocols and data you are working with.
9.8 SUMMARY
In this chapter, we covered the specifics of digging deeper. With a dee-per look into the data, the systems, and the network, we saw how wecould better define and find root cause of problems as well as how touse Wireshark and other enterprise tools to solve issues that occur overWAN links, when using a softphone and to find security problems andso on. In the next and final chapter, we will look at the myriad ofways to handle the data you captured for analysis and safekeeping.
Figure 9.17 Finding online references via Wireshark.
118 The Wireshark Field Guide

CHAPTER 1010Saving Captures
10.1 GETTING STARTED....................................................................... 120
10.2 SAVING CAPTURES ...................................................................... 120
10.3 SAVING CAPTURES (MULTIPLE FILES)...................................... 121
10.4 SAVING IN OTHER FORMATS..................................................... 123
10.5 IMPORTING AND EXPORTING DATA......................................... 125
10.6 MERGING DATA ........................................................................... 126
10.7 SUMMARY..................................................................................... 128
Wireshark can be used to isolate and troubleshoot network and systemproblems, and we have flipped open the hood and taken a look into itsinner workings. In this field guide, we have learned how to useWireshark to capture and filter data in hopes that by doing so, we cansolve problems. We have learned quite a bit in a short amount of time.In this chapter, we will cover how to save your files, import and exportdata, and other key information on how to store your captured packetsfor further analysis.
In this chapter, we will learn how to save captured data. It is not assimple as saving a file; there are many options that you can select, andunderstanding the options available will help you in making the correctdecisions on how and where you want to save your data.
Make sure that when you prepare to save data, you have plenty of diskspace available, i.e., a system with the proper resources to handle thistask. It is recommended that you also consider encrypting this data if youconsider it sensitive. You should also make sure that you follow the prac-tice of ensuring that you limit who can access the data by securing thesystem or storage device in which it is stored as filtered data can containsecure information such as passwords.

10.1 GETTING STARTED
Once you have completed your analysis, you may want to save andarchive your files for future use. This chapter covers file formats, how touse capture files with other protocol analysis systems, how to merge files,and more. In Section 10.2, we review the basics of saving captured data.
When working on a network, a running Wireshark with the inten-tion of capturing and saving data, there are times where you may wantto know how you will save it before you even start the capture. In thesections within this chapter, we will cover when that would be applica-ble. For now, we will cover the basics of saving a capture file onceyour capture is completed.
10.2 SAVING CAPTURES
Once you are done capturing data, there are many options available toyou for controlling the data you wish to store. When you run a cap-ture, all of the data is viewable in the Wireshark capture window. Youmay want to save all of the captured data or a subset of it. There areoptions available for both. Before we cover these options, you shouldconsider the following essential guidelines:
1. If you are going to be running captures over a longer period oftime, you may wish to break them up into more manageable chunksto store and review from. For most systems, anything more than a256-megabyte file size is too big.
2. You should consider how you will label your stored files. This way,when you want to access specific portions of saved data, you have aviewable reference by viewing just the file name. For example, ifyou are capturing data to and from a specific set of IP addresses,you may want to label them in the file name. You should also con-sider folderizing your saved data for easy reference.
3. Always consider where you will be storing this data (size, security,accessibility, etc).
In Figure 10.1, the Wireshark main page shows options for viewingsaved files. In the Open section, you can see the most recently savedfiles that you can open. They will be colored blue (hyperlink), and byclicking on them, you will open that particular capture. You can alsoclick directly on the Open link denoted by the image of the folder toopen the Open Capture File dialog box.
120 The Wireshark Field Guide

To save data, simply open Wireshark and run a capture. Stop thecapture and go to the Wireshark capture window’s menu system. Byclicking on File, you will see a drop-down menu of options in whichyou can save your data. By selecting Save As, you can then name yourfile and store it in a location of your choice. By clicking on Save, youwill be presented with the same options; however, if you already havesaved the file, by selecting Save you can update the currently saved filewith the newest information, e.g., when you want to continue your cap-ture and collect more packets. This is fairly straightforward. If you wantto perhaps save data in groupings of files, you have to go another route.
10.3 SAVING CAPTURES (MULTIPLE FILES)
There may come a time where you want to save a capture in a subsetof files. In order to do this, you need to configure Wireshark to handlethis task before you start the capture of your data. To do this, youneed to first go to the Wireshark launch page, or you can do it fromwithin the Wireshark capture window if you are starting a new capturesaving to multiple files. In the Wireshark capture window, you canclick on Capture menu option and select Options. On the launch page,you can click on the Capture Options link.
Figure 10.1 Opening capture files.
121Saving Captures

Once you select either, you will see the Wireshark Capture Optionsdialog box as shown in Figure 10.2.
Within this dialog box, you see many options you can select andchoose from. The relevant area in the dialog box where you willconfigure the captured data for population into multiple files is in theCapture File(s) section. Here, you can choose the location in whichyou would like to store your data. Figure 10.3 shows the location ofwhere you would set your capture file when selecting the Browsebutton.
Once you are done, you can click OK. Then, you canconfigure options on where you will save the files as well as how tosize it, time it, and control it. Once you have selected your relevantoptions, click Start to begin the capture.
Once the capture has started and run through its routine and stops,you can view these files within the Wireshark capture window by
Figure 10.2 Configuring Wireshark capture options.
122 The Wireshark Field Guide

clicking on the File menu and selecting File Set. Expand this option toview List Files as shown in Figure 10.4.
To view the same files where they are stored, you can go to the Filemenu and click Save As and/or simply navigate to the location inwhich you decided to store the files. As shown in Figure 10.5 you cansee how Wireshark chunked out the capture into multiple files.
10.4 SAVING IN OTHER FORMATS
Once you have finished your capture, you can save the capture inmany file formats. By going to the File menu and selecting Save As,you can then select the Save as type as shown in Figure 10.6
Figure 10.3 Wireshark specific a capture file dialog box.
Figure 10.4 Wireshark list files dialog box.
123Saving Captures

Figure 10.5 Wireshark saving data in multiple files.
Figure 10.6 Saving files in multiple formats.
124 The Wireshark Field Guide

There may be times where you would like to save the captured datain the native format of the tool you may be transferring the data to,e.g., if you want to send captured data to another associate helpingyou troubleshoot, and they use Microsoft Network Monitor, you canchoose to save in the native format for that specific tool. You can seethe different file extensions in Figure 10.6 from the Save as type menu.Click Save to complete this task.
10.5 IMPORTING AND EXPORTING DATA
When saving data, there may be times where you simply want to savea portion of this data for use. A great example would be when you rana large capture and had a lot of data in your window that you did notwant to save. You could filter out this data and export the relevantdata to a new file. You can also import data into a file.
To import data into a file, go to the File menu and select Importfrom the drop-down menu. You will then open the Wireshark Importfrom Text dialog box as shown in Figure 10.7.
When using this option, you will need to select a preconfigured textfile with the relevant data already configured in the file to import.
To export data, simple click on the File menu again and select fromthe multiple Export options listed. Depending on where you are in theWireshark capture window and what data you have captured will thengive you the specific options for what you can export; otherwise, theoption will be grayed out and unusable.
In Figure 10.8, the option to Export Specified Packets was chosen.This was predetermined from the example provided earlier where wewanted to filter out the data we did not want to use and populate anew file for reference.
You will not be able to use the filter option if you do not choose“displayed” in the export options for Packet Range.
125Saving Captures
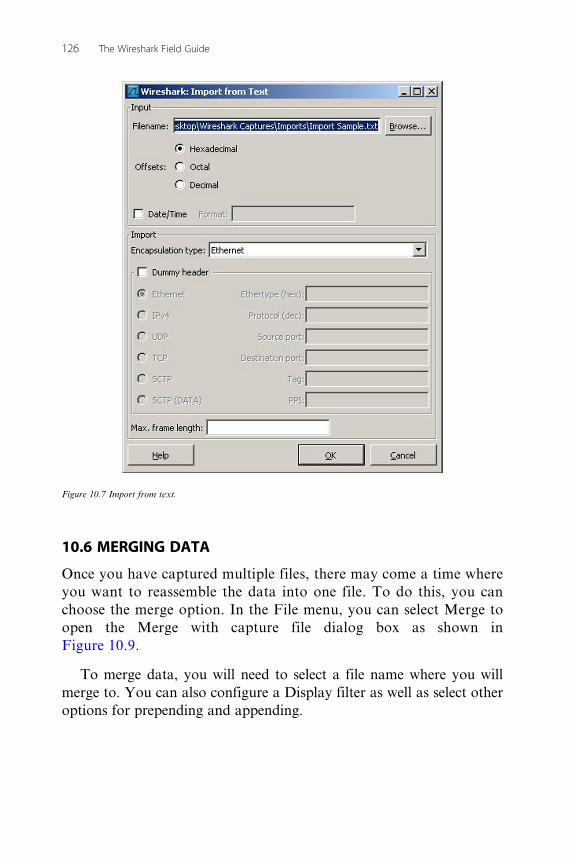
10.6 MERGING DATA
Once you have captured multiple files, there may come a time whereyou want to reassemble the data into one file. To do this, you canchoose the merge option. In the File menu, you can select Merge toopen the Merge with capture file dialog box as shown inFigure 10.9.
To merge data, you will need to select a file name where you willmerge to. You can also configure a Display filter as well as select otheroptions for prepending and appending.
Figure 10.7 Import from text.
126 The Wireshark Field Guide

Figure 10.8 Exporting specified packets.
Figure 10.9 Merging capture files.

10.7 SUMMARY
Now you know how to save data to files for storage and future analysis.You can send these files to others to troubleshoot as a team or get helpfrom others.
We have completed the final steps of learning Wireshark in thisfield guide. This is written in the hope of getting you up to speedquickly in using one of the most common network-based troubleshoot-ing tools used in the industry today. To learn more, visit the websiteslisted in this book.
128 The Wireshark Field Guide