Koncentracja i wydatek rumowiska unoszonego w wezbraniach roztopowych w małej rzece nizinnej
8
Annals of Warsaw University of Life Sciences – SGGW Land Reclamation No 42 (1), 2010: 61–68 (Ann. Warsaw Univ. of Life Sci. – SGGW, Land Reclam. 42 (1), 2010) Suspended sediment concentration and yield in snowmelt flood events in a small lowland river AGNIESZKA HEJDUK, KAZIMIERZ BANASIK Department of Water Engineering and Environmental Restoration, Warsaw University of Life Sciences – SGGW Abstract: Suspended sediment concentration and yield in snowmelt flood events in a small lowland river. Results of investigation on suspended sedi- ment delivery from small lowland, agriculturally used catchment of Zagożdżonka River, located in central Poland, during snowmelt periods of 2001– –2007 are presented. The study catchment‘s area, upstream of the well equipped gauging station at Czarna, is 23.4 km 2 . Suspended sediment concen- tration and sediment yield has been calculated and analysed for 15 snowmelt flood events. The relationship between suspended sediment con- centration and the discharge has been analyzed. It has been found that the relation, in majority of the cases, has the form of clockwise hysteresis, however the existance of other types of hysteresis i.e. anticlockwise and “8” shape, have been also confirmed. Significant relation between suspended sediment yield and runoff volume of snowmelt flood events has been also found. Key words: snowmelt flood, suspended sediment concentration, sediment yield, hysteresis. INTRODUCTION Intensive suspended sediment transport occurs mainly during flood runoff, caused by heavy rainfall or rapid snowmelt events. Increase of suspended sediment concentration has negative influence on biological life in river, on economic use of water and on recreation conditions of reservoirs. It may degrade aquatic eco- systems by increasing turbidity, reducing light penetration and may damage habi- tats by sedimentation. The particles of suspended sediment play also important role in transport of nutrients and con- taminates (Droppo et al. 2000; Martinez- -Carreras et al. 2010). In order to reduce the problems, effective sediment control strategies are requiret (Walling and Col- lins 2008). Previous investigation carried out by the Department of Water Engi- neering and Environmental Restoration of Warsaw University of Life Sciences – SGGW have shown an intensive sus- pended sediment transport during the winter and spring time (Banasik 1983). So the detailed investigation of the snow- melt floods in the small catchment of Zagożdżonka should help in explaining the dynamics of sediment concentration the sediment fluxes. The literature put the attention on the suspended sediment transport in general, but the processes connected with the snowmelt floods are not very well known (Ollesch et al. 2006). STUDY CATCHMENT AND MONITORING GAUGE Location and area: Zagożdżonka wa- tershed, shown in Figure 1 is located in central Poland, about 100 km south of 10.2478/v10060-008-0065-7
-
Upload
independent -
Category
Documents
-
view
4 -
download
0
Transcript of Koncentracja i wydatek rumowiska unoszonego w wezbraniach roztopowych w małej rzece nizinnej
Annals of Warsaw University of Life Sciences – SGGWLand Reclamation No 42 (1), 2010: 61–68(Ann. Warsaw Univ. of Life Sci. – SGGW, Land Reclam. 42 (1), 2010)
Suspended sediment concentration and yield in snowmelt fl ood events in a small lowland river
AGNIESZKA HEJDUK, KAZIMIERZ BANASIKDepartment of Water Engineering and Environmental Restoration, Warsaw University of Life Sciences – SGGW
Abstract: Suspended sediment concentration and yield in snowmelt fl ood events in a small lowland river. Results of investigation on suspended sedi-ment delivery from small lowland, agriculturally used catchment of Zagożdżonka River, located in central Poland, during snowmelt periods of 2001––2007 are presented. The study catchment‘s area, upstream of the well equipped gauging station at Czarna, is 23.4 km2. Suspended sediment concen-tration and sediment yield has been calculated and analysed for 15 snowmelt fl ood events. The relationship between suspended sediment con-centration and the discharge has been analyzed. It has been found that the relation, in majority of the cases, has the form of clockwise hysteresis, however the existance of other types of hysteresis i.e. anticlockwise and “8” shape, have been also confi rmed. Signifi cant relation between suspended sediment yield and runoff volume of snowmelt fl ood events has been also found.
Key words: snowmelt fl ood, suspended sediment concentration, sediment yield, hysteresis.
INTRODUCTION
Intensive suspended sediment transport occurs mainly during fl ood runoff, caused by heavy rainfall or rapid snowmelt events. Increase of suspended sediment concentration has negative infl uence on biological life in river, on economic use of water and on recreation conditions of reservoirs. It may degrade aquatic eco-systems by increasing turbidity, reducing
light penetration and may damage habi-tats by sedimentation. The particles of suspended sediment play also important role in transport of nutrients and con-taminates (Droppo et al. 2000; Martinez--Carreras et al. 2010). In order to reduce the problems, effective sediment control strategies are requiret (Walling and Col-lins 2008). Previous investigation carried out by the Department of Water Engi-neering and Environmental Restoration of Warsaw University of Life Sciences – SGGW have shown an intensive sus-pended sediment transport during the winter and spring time (Banasik 1983). So the detailed investigation of the snow-melt fl oods in the small catchment of Zagożdżonka should help in explaining the dynamics of sediment concentration the sediment fl uxes. The literature put the attention on the suspended sediment transport in general, but the processes connected with the snowmelt fl oods are not very well known (Ollesch et al. 2006).
STUDY CATCHMENT AND MONITORING GAUGE
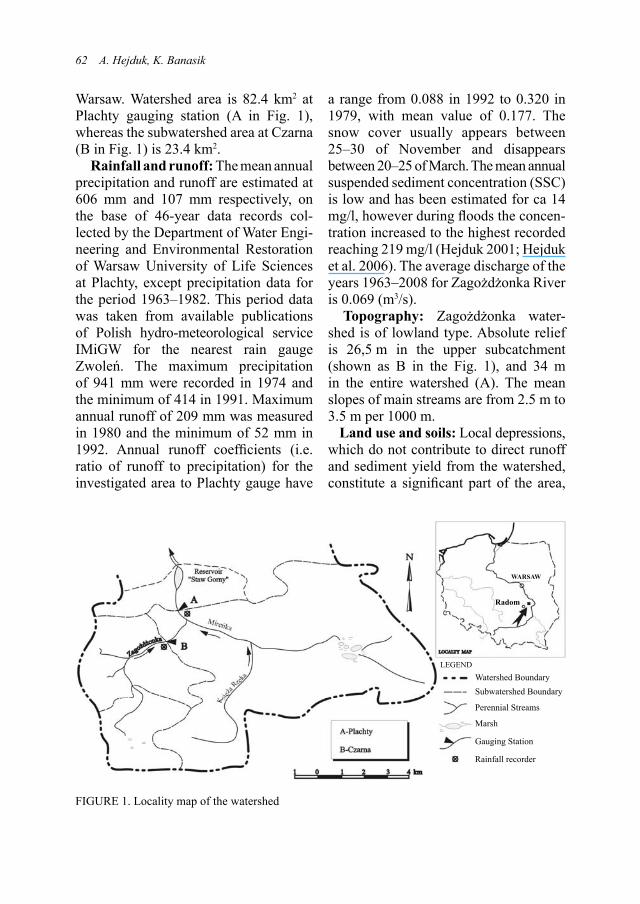
Location and area: Zagożdżonka wa-tershed, shown in Figure 1 is located in central Poland, about 100 km south of
10.2478/v10060-008-0065-7
62 A. Hejduk, K. Banasik
Warsaw. Watershed area is 82.4 km2 at Plachty gauging station (A in Fig. 1), whereas the subwatershed area at Czarna (B in Fig. 1) is 23.4 km2.
Rainfall and runoff: The mean annual precipitation and runoff are estimated at 606 mm and 107 mm respectively, on the base of 46-year data records col-lected by the Department of Water Engi-neering and Environmental Restoration of Warsaw University of Life Sciences at Plachty, except precipitation data for the period 1963–1982. This period data was taken from available publications of Polish hydro-meteorological service IMiGW for the nearest rain gauge Zwoleń. The maximum precipitation of 941 mm were recorded in 1974 and the minimum of 414 in 1991. Maximum annual runoff of 209 mm was measured in 1980 and the minimum of 52 mm in 1992. Annual runoff coeffi cients (i.e. ratio of runoff to precipitation) for the investigated area to Plachty gauge have
a range from 0.088 in 1992 to 0.320 in 1979, with mean value of 0.177. The snow cover usually appears between 25–30 of November and disappears between 20–25 of March. The mean annual suspended sediment concentration (SSC) is low and has been estimated for ca 14 mg/l, however during fl oods the concen-tration increased to the highest recorded reaching 219 mg/l (Hejduk 2001; Hejduk et al. 2006). The average discharge of the years 1963–2008 for Zagożdżonka River is 0.069 (m3/s).
Topography: Zagożdżonka water-shed is of lowland type. Absolute relief is 26,5 m in the upper subcatchment (shown as B in the Fig. 1), and 34 m in the entire watershed (A). The mean slopes of main streams are from 2.5 m to 3.5 m per 1000 m.
Land use and soils: Local depressions, which do not contribute to direct runoff and sediment yield from the watershed, constitute a signifi cant part of the area,
FIGURE 1. Locality map of the watershed
Watershed BoundarySubwatershed Boundary
Perennial Streams
Marsh
Gauging Station
Rainfall recorder
LEGEND
WARSAW
Radom
Suspended sediment concentration... 63
i.e. 3.8 km2 upstream of Czarna and 19.8 km2 upstream Plachty gauge station. So the catchment area, which contribute to direct runoff and sediment delivery to river system, upstream of the Czarna gauge, is 19.6 (i.e. 23.4–3.8) km2. Land use is dominated by arable land (small grain and potatoes). 20% of the contrib-uting area is covered by forest, 70% is arable lands, 9.4% is pastures and 0.6 is paved areas. The dominant soil type is sandy soil, ranging from almost pure to loamy sands. In local depressions and
river fl ood planes, peaty soils can be found. Generally sandy soils cover over 90% of watershed to Czarna gauging station.
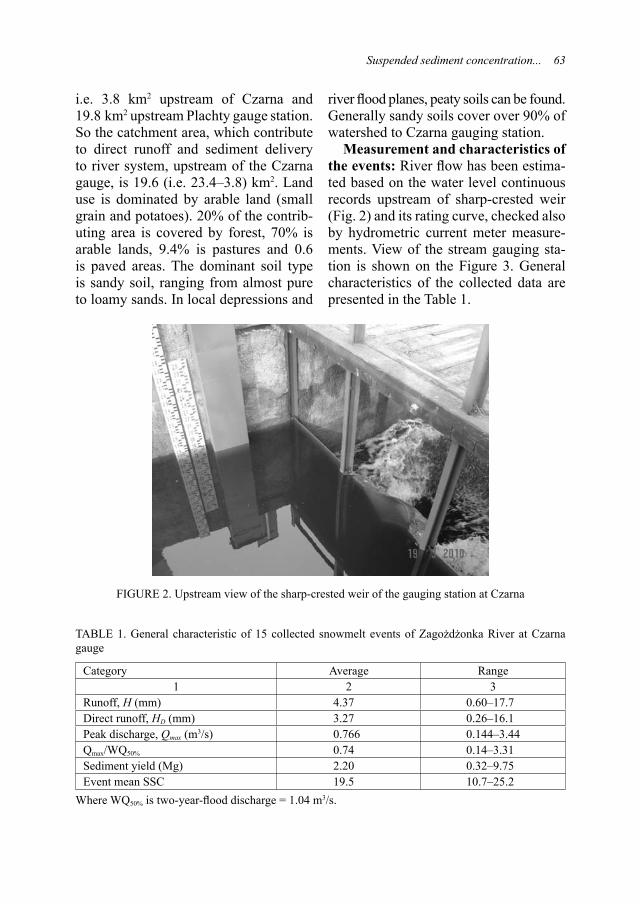
Measurement and characteristics of the events: River fl ow has been estima-ted based on the water level continuous records upstream of sharp-crested weir (Fig. 2) and its rating curve, checked also by hydrometric current meter measure-ments. View of the stream gauging sta-tion is shown on the Figure 3. General characteristics of the collected data are presented in the Table 1.
FIGURE 2. Upstream view of the sharp-crested weir of the gauging station at Czarna
TABLE 1. General characteristic of 15 collected snowmelt events of Zagożdżonka River at Czarna gauge
Category Average Range1 2 3
Runoff, H (mm) 4.37 0.60–17.7Direct runoff, HD (mm) 3.27 0.26–16.1Peak discharge, Qmax (m3/s) 0.766 0.144–3.44Qmax/WQ50% 0.74 0.14–3.31Sediment yield (Mg) 2.20 0.32–9.75Event mean SSC 19.5 10.7–25.2
Where WQ50% is two-year-fl ood discharge = 1.04 m3/s.
64 A. Hejduk, K. Banasik
METHODS OF FIELD INVESTIGATIONS
The gauging station in Czarna at Zagożdżonka River, operated by Warsaw University of Life Sciences – SGGW, Department of Water Engineering and Environmental Restoration, is equipped with electronic system of data collection and transmitting them through Internet. Beside water stage also continues water turbidity, air, soil and water tempera-ture, precipitation with the 10 minutes time step were measured, recorded and transmitted. Also the depth of snow and snow water equivalent during the winter time are measured each day or twice a day during snowmelts period. The time integrated bathometers self-acting ba-thometers, refrigerated samplers and set-tling tanks collect samples for suspended
sediment grain size analysis were also in use.
RESULTS AND DISCUSSION
In the period of 1998–2007 fi fteen fl ood events, with continues suspended sediment concentration, were collected (Hejduk 2009). Characteristics of the events are presented in Table 2. Snowmelt fl oods in Zagożdżonka catchment were not rapid, but the amount of transported sediment was notable.
The mean annual sediment yield from Zagożdżonka catchment upstream of Czarna gauge was estimated for ca 60 Mg (Hejduk 2001). Sediment yield of the 15 analyzed snowmelt fl ood events fl uctu-ated between 0.32–9.75 Mg, with the average value of 2.20 Mg (see column 8 in Tab. 2). Floods number 7 and 9 trans-
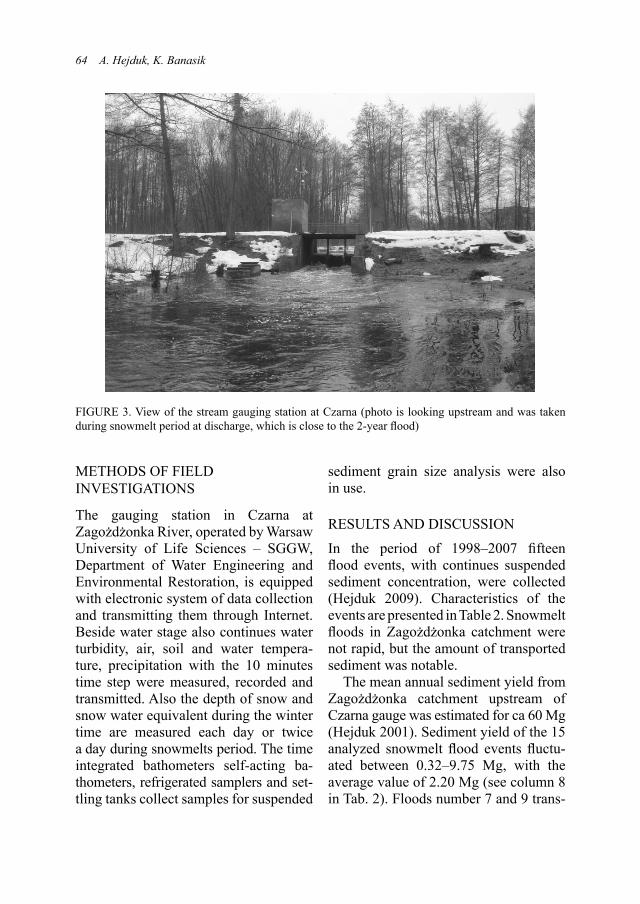
FIGURE 3. View of the stream gauging station at Czarna (photo is looking upstream and was taken during snowmelt period at discharge, which is close to the 2-year fl ood)
Suspended sediment concentration... 65
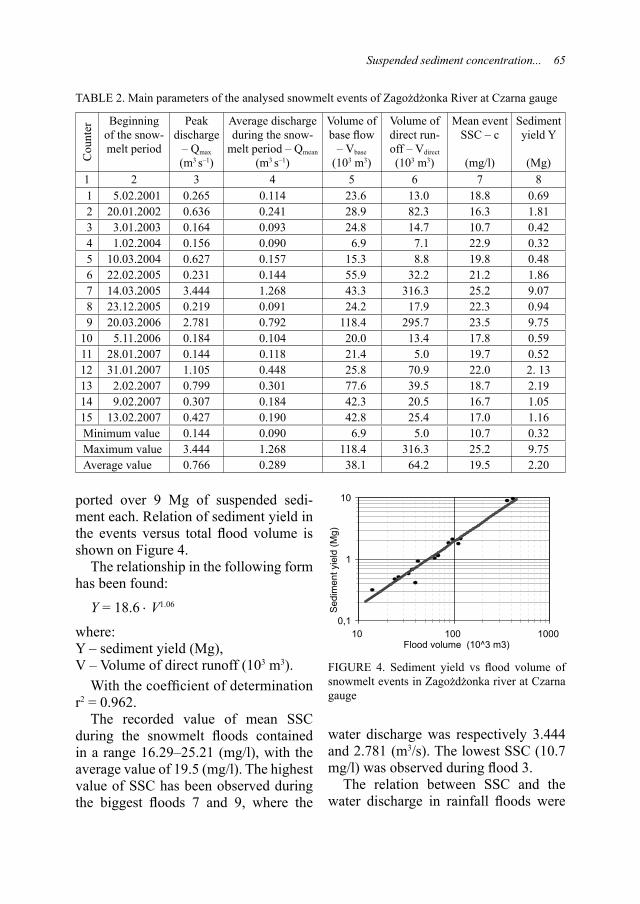
ported over 9 Mg of suspended sedi-ment each. Relation of sediment yield in the events versus total fl ood volume is shown on Figure 4.
The relationship in the following form has been found:
Y = 18.6 ⋅ V1.06
where:Y – sediment yield (Mg),V – Volume of direct runoff (103 m3).
With the coeffi cient of determination r2 = 0.962.
The recorded value of mean SSC during the snowmelt fl oods contained in a range 16.29–25.21 (mg/l), with the average value of 19.5 (mg/l). The highest value of SSC has been observed during the biggest fl oods 7 and 9, where the
water discharge was respectively 3.444 and 2.781 (m3/s). The lowest SSC (10.7 mg/l) was observed during fl ood 3.
The relation between SSC and the water discharge in rainfall fl oods were
TABLE 2. Main parameters of the analysed snowmelt events of Zagożdżonka River at Czarna gauge C
ount
er Beginning of the snow-melt period
Peak discharge
– Qmax
(m3 s–1)
Average discharge during the snow-
melt period – Qmean
(m3 s–1)
Volume of base fl ow
– Vbase
(103 m3)
Volume of direct run-off – Vdirect
(103 m3)
Mean event SSC – c
(mg/l)
Sediment yield Y
(Mg)1 2 3 4 5 6 7 81 5.02.2001 0.265 0.114 23.6 13.0 18.8 0.692 20.01.2002 0.636 0.241 28.9 82.3 16.3 1.813 3.01.2003 0.164 0.093 24.8 14.7 10.7 0.424 1.02.2004 0.156 0.090 6.9 7.1 22.9 0.325 10.03.2004 0.627 0.157 15.3 8.8 19.8 0.486 22.02.2005 0.231 0.144 55.9 32.2 21.2 1.867 14.03.2005 3.444 1.268 43.3 316.3 25.2 9.078 23.12.2005 0.219 0.091 24.2 17.9 22.3 0.949 20.03.2006 2.781 0.792 118.4 295.7 23.5 9.75
10 5.11.2006 0.184 0.104 20.0 13.4 17.8 0.5911 28.01.2007 0.144 0.118 21.4 5.0 19.7 0.5212 31.01.2007 1.105 0.448 25.8 70.9 22.0 2. 1313 2.02.2007 0.799 0.301 77.6 39.5 18.7 2.1914 9.02.2007 0.307 0.184 42.3 20.5 16.7 1.0515 13.02.2007 0.427 0.190 42.8 25.4 17.0 1.16Minimum value 0.144 0.090 6.9 5.0 10.7 0.32Maximum value 3.444 1.268 118.4 316.3 25.2 9.75Average value 0.766 0.289 38.1 64.2 19.5 2.20
FIGURE 4. Sediment yield vs fl ood volume of snowmelt events in Zagożdżonka river at Czarna gauge
0,1
1
10
Sed
imen
t yie
ld (M
g)
10 100 1000Flood volume (10^3 m3)
66 A. Hejduk, K. Banasik
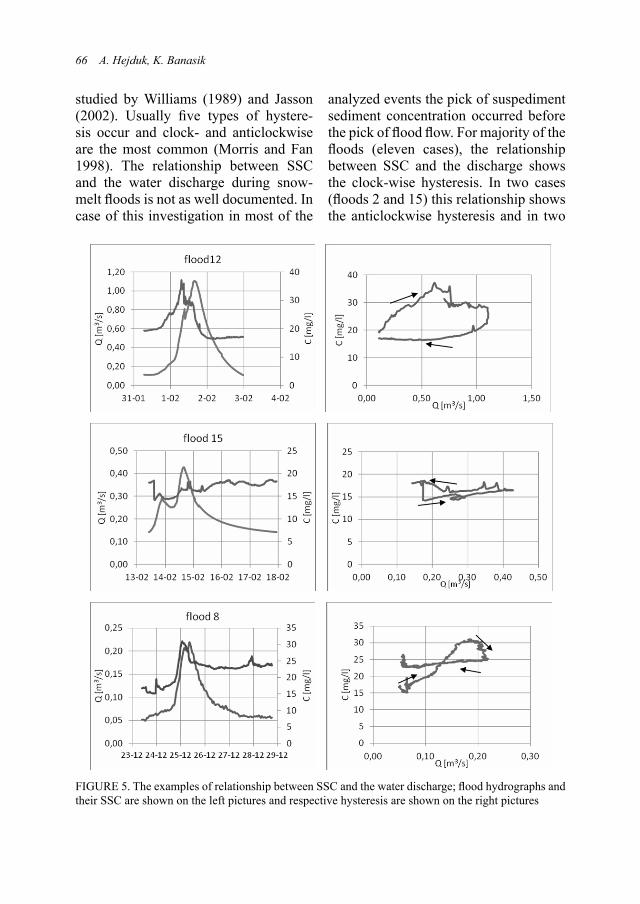
studied by Williams (1989) and Jasson (2002). Usually fi ve types of hystere-sis occur and clock- and anticlockwise are the most common (Morris and Fan 1998). The relationship between SSC and the water discharge during snow-melt fl oods is not as well documented. In case of this investigation in most of the
analyzed events the pick of suspediment sediment concentration occurred before the pick of fl ood fl ow. For majority of the fl oods (eleven cases), the relationship between SSC and the discharge shows the clock-wise hysteresis. In two cases (fl oods 2 and 15) this relationship shows the anticlockwise hysteresis and in two
FIGURE 5. The examples of relationship between SSC and the water discharge; fl ood hydrographs and their SSC are shown on the left pictures and respective hysteresis are shown on the right pictures
Suspended sediment concentration... 67
others (fl oods 4 and 8) the hysteresis had an eight-shape.The example of the rela-tionship between SSC and discharge is shown on Figure 5. The clock-wise hys-teresis may suggest that in the fi rst phase of the fl ood, the smallest particles are washed out and transported. In case of anticlockwise relation it can be assumed, that area snowmelt and precipitation var-iability causes sediment delivery from those parts of the catchment, which are more susceptible to erosion.
Suspended sediment concentration during the snowmelt fl oods is lower than during rainfall fl oods recorded in this catchment (Hejduk et al. 2006), and its average value is a bit higher than the mean annual SSC for Zagożdżonka River. Similar results presented Lenzi i Marchi (2000). The explanation of this phenom-enon can be the fact that in summer the erosion of the slope is the main source of sediment particles transported with the water. The rain makes the mechanic impact on the surface, separates the parti-cles which are moved by water runoff. In winter time the rain, which occurs during the snowmelt periods has an impact on snowmelt intensity, but doesn’t have direct contact with soil surface, as long as the snow cover exists. Similar results have presented Lenzi i Marchi (2000) from the catchment in Dolomites. The soil moisture conditions as well as the conditions of freezing have great impor-tance in the formation of surface runoff. (Øygarden 2003; Ollesch et al. 2006). In this investigation the soil hasn’t been frozen during analyzed snowmelt periods.
Acknowledgment: The study has been conducted with a fi nancial support of a grant from Iceland, Liechtenstein and
Norway through the EEA Financial Mechanism and the Norwegian Financial Mechanism and Resource for Sciences (2007–2010). The support provided by the organization is gratefully acknow-ledged.
REFERENCESBANASIK K.,1983: Rozmieszczenie użytków
w zlewni jak czynnik minimalizujący natęże-nie transportu rumowiska w korycie rzecznym (Land use redistribution as factor minimalizing the sediment transport in river channel). Un-published PhD, SGGW.
DROPPO I.G., WALLING D.E., ONGLEY E.D., 2000: The infl uence of fl ock size and porosity on sediment and contaminant transport. In: The Role of Erosion end Sediment Transport in Nutrient and Contaminant Transfer (edited by M. Stone), IAHS Press 263: 141–147.
HEJDUK A., 2009: Transport rumowiska unoszo-nego podczas wezbrań roztopowych w małej zlewni rolniczej (Suspended sediment transport during snowmelt fl ood events in small agricul-tural watershed). Unpublished PhD, SGGW.
HEJDUK L., 2001: Transport rumowiska uno-szonego i fosforu w wezbraniach rzeki Zagoż-dżonki (Suspended sediment and phosforus transport in fl ood events in river of Zagożdżon-ka). Unpublished PhD, SGGW.
HEJDUK L., HEJDUK A., BANASIK K., 2006: Suspended sedniment transport during rainfall and snowmelt fl oods in a small lowland ca-tchment (central Poland). Chapter 9 in: Mo-nografh CABI pod redakcją P.N. Owens i A.J. Collins.
JASSON M.B., 2002: Determining sediment source areas in tropical River basin, Costa Rica. Catena 47, 63–84.
MARTINEZ-CARRERAS N., KREIN A., UDEL-HOVEN T., GALLART F., IFFLY J.F., HOFF-MANN L., PFISTER L., WALLING D.E., 2010: A rapid spectral-refl ectance-based fi nger-printing approach for documenting suspended sedimen sources during storm runoff events. Journal of Soil Sediments 10, 400–413.
MORRIS G.L., FAN J., 1998: Reservoir Sedimen-tation Handbook. Mc Graw-Hill, New York.
68 A. Hejduk, K. Banasik
LENZI M., MARCHI L., 2000. Suspended sedi-ment load during foods in a small stream of the Dolomites (northeastern Italy). Catena 39, 267–282.
OLLESCH G., KRISTNER I., MEISSNER R., LINDENSCHMIDT K-E., 2006: Modeling of snowmelt erosion and sediment yield in a small low-mountain catchment in Germany. Catena 68, 161–176.
ØYGARDEN L., 2003: Rill and gully develop-ment during an extreme winter runoff event in Norway. Catena 50, 217–242.
WALLING D.E., COLLINS A.L., 2008: The catchment sediment budget as a management tool. Environmental Science & Policy II, 136––143.
WOŚ A., 1996: Zarys klimatu Polski (Outline of climat of Poland). Wydawnictwo Naukowe UAM, second edition. Poznań.
WILLIAMS G.R., 1989: Sediment concentration versus water discharge during single hydro-logic events in rivers. Journal of Hydrology, Volume 111 (1–4): 89–106.
Streszczenie: Koncentracja i wydatek rumowiska unoszonego w wezbraniach roztopowych w małej rzece nizinnej. W pracy przedstawiono wyniki ba-
dań transportu rumowiska unoszonego, przeprowa-dzonych w małej zlewni nizinnej (A = 23,4 km2) położonej na Równinie Radomskiej. Przeanalizo-wano 15 wezbrań z lat 2001–2007, dla których zarejestrowano kompletne dane obejmujące zasi-lanie zlewni, przepływ i koncentracje.
Analiza zależności koncentarcji z przepływem wskazuje na występowanie w większości z ana-lizowanych zdarzeń histerezy prawostronnej (tj. zgodnej z ruchem wskazówek zegara). Koncentra-cja rumowiska unoszonego wzrastała wraz z prze-pływem, a jej kulminacja w większości z badanych przypadkach wystąpiła przed kulminacją przepły-wu. Ustalono zależność, statystycznie istotną, wy-datku rumowiska od objętości wezbrania.
MS. received April 2010
Authors’ address:Katedra Inżynierii Wodnej i Rekultywacji Środowiska SGGW02-787 Warszawa, ul. Nowoursynowska 166Polande-mail: agnieszka [email protected]: [email protected]

![Dr Teofil Zegarski i jego Gimnazjum Koedukacyjne w Gdyni – Orłowie” [w:]„Z dziejów kultury i historii Pomorza w XIX i XX wieku” t. IV, pod red. J. Borzyszkowskiego i L. Molendowskiego,](https://static.fdokumen.com/doc/165x107/63321a39b6829c19b80bcec5/dr-teofil-zegarski-i-jego-gimnazjum-koedukacyjne-w-gdyni-orlowie-wz.jpg)