Key Opinion Leaders Relationship Management and Segmentation Data QUICK SUMMARY Report Features...
16
Key Opinion Leaders Relationship Management and Segmentation Data QUICK SUMMARY Report Features Table of Contents Sample Content Metrics Introduction Charts & Graphics Index About CEI REPORT DATE AND FORMAT 2009 Adobe PDF E-Copy TOTAL NUMBERS OF PROFILED COMPANIES 85+ Pharmaceutical, Biotechnology, Medical Device Companies and Third-Party Providers REPORT LENGTH 180 pages METRICS AND CHARTS 1000+ Metrics 105+ Charts and Graphics CONTACT INFORMATION Adam Bianchi 919-433-0202 [email protected] 1 2 3 8 10 16 www.cuttingedgeinfo.com How do you successfully balance remaining compliant and man- aging productive relationships with key opinion leaders? Thought leader management teams are grappling with this question as they adapt to increasingly restrictive guidelines and demands for transparency. This issue comes on top of the life-sciences industry battling a negative public image. To compete for KOLs even in the midst of seemingly overwhelming pressure, teams must be proac- tive, and their thought leader development well-coordinated and focused. Based on interviews and survey data with leading pharma executives, Key Opinion Leaders gives concrete strategies to opti- mize opinion leader relationships. Confidently and correctly identify, assess and recruit thought leaders. Learn how to formalize your processes to eliminate communication mistakes and inefficiency. And use our detailed segmentation data to match the right thought leader with the right activity and the right price. Realize the benefits of airtight documentation.
-
Upload
independent -
Category
Documents
-
view
0 -
download
0
Transcript of Key Opinion Leaders Relationship Management and Segmentation Data QUICK SUMMARY Report Features...

Key Opinion LeadersRelationship Management and Segmentation Data
QUICK SUMMARYReport Features
Table of ContentsSample Content
Metrics IntroductionCharts & Graphics Index
About CEI
REPORT DATE AND FORMAT
2009Adobe PDF E-Copy
TOTAL NUMBERS OF PROFILED COMPANIES
85+ Pharmaceutical, Biotechnology, Medical Device
Companies and Third-Party Providers
REPORT LENGTH180 pages
METRICS AND CHARTS1000+ Metrics
105+ Charts and Graphics
CONTACT INFORMATIONAdam [email protected]
12381016
www.cuttingedgeinfo.com
How do you successfully balance remaining compliant and man-aging productive relationships with key opinion leaders? Thought leader management teams are grappling with this question as they adapt to increasingly restrictive guidelines and demands for transparency. This issue comes on top of the life-sciences industry battling a negative public image. To compete for KOLs even in the midst of seemingly overwhelming pressure, teams must be proac-tive, and their thought leader development well-coordinated and focused.
Based on interviews and survey data with leading pharma executives, Key Opinion Leaders gives concrete strategies to opti-mize opinion leader relationships. Confidently and correctly identify, assess and recruit thought leaders. Learn how to formalize your processes to eliminate communication mistakes and inefficiency. And use our detailed segmentation data to match the right thought leader with the right activity and the right price. Realize the benefits of airtight documentation.
Cutting Edge Information
KEY OPINION LEADERS �
TABLE OF CONTENTS
11 Executive Summary
15 Study Methodology17 Study Definitions19 Profiled Companies and Therapeutic Areas20 Five Key Findings and Recommendations
29 Trends Affecting Thought Leader Relationships
31 Roadblocks to Working with Thought Leaders43 MSL Interactions with Thought Leaders
55 Tools for Thought Leader Management Succes
57 Targeting and Recruiting Thought Leader Candidates79 Segmenting Thought Leader Candidates94 Documenting and Measuring Thought Leader Activities
101 Thought Leader Development Structure, Staffing and Spending
102 Thought Leader Management Structure and Staffing111 Thought Leader Development Spending
133 Appendix A: Opinion Leader Segmentation Data
Cutting Edge Information
KEY OPINION LEADERS �
SAMPLE CONTENTThe following samples from Key Opinion Leaders: Relationship Management and Segmentation Data offer brief insight into the report and its findings. If you are interested in learning how the report addresses other specific needs or would like to read more from the report, please call Adam Bianchi at 919-433-0202.
The following excerpts are taken from Chapter 2, “Tools for Thought Leader Management Success,” section 2, “Segmenting Thought Leader Relationships.”
Establish Guidelines to Segmentation and Tier in line with Company
Needs
The number of tiers that companies divide their thought leader candidates into varies depending upon the size of the company, the variety of the company’s pursuits, and the particular regions and markets the company operates in. Oftentimes, smaller companies forgo segmenting thought leaders because of the limited reach of their pool of candidates and their small pipelines. Many companies have not reached a point where a differential of thought leader candidates based on consultation task is necessary. Not only may they be forced to accept the thought leader they can entice to work with them, but they may also have no need of different levels of thought leader. In efforts to establish a foothold in a market, burgeoning companies aim for the most influential thought leaders they can find and do not attempt to find less influential thought leaders for localized markets.
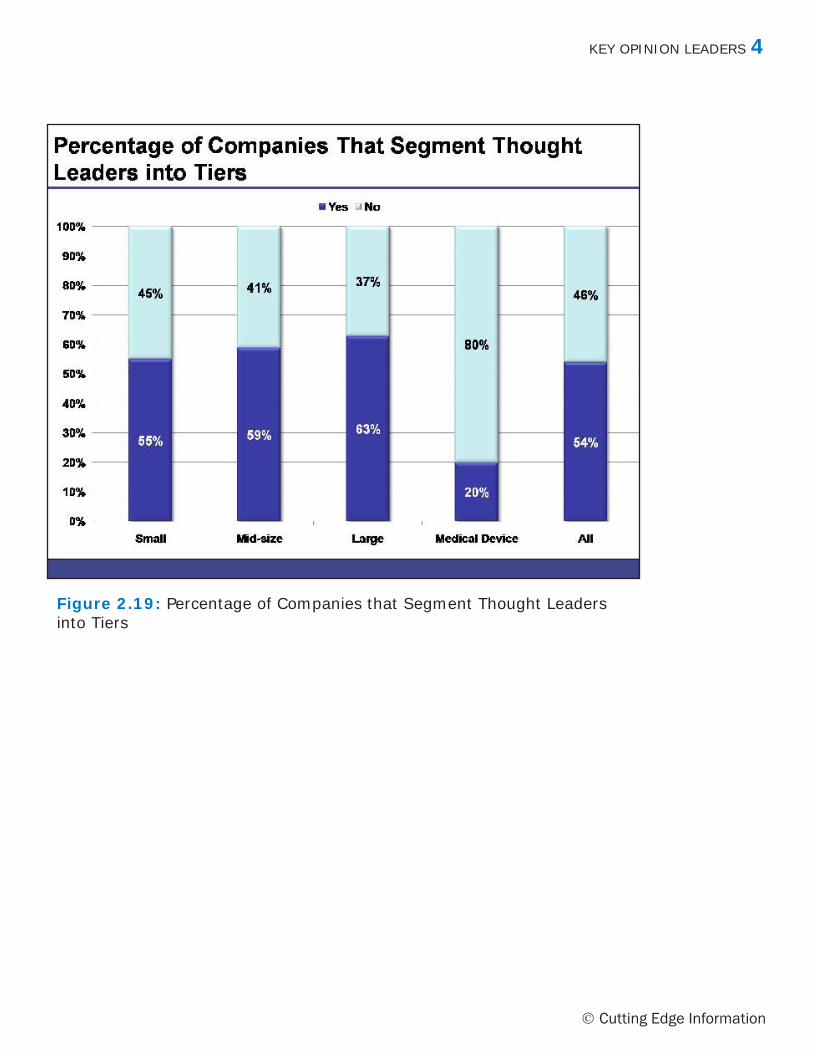
According to survey data, as Figure 2.19 illustrates, of all responding companies, 54% segment thought leader relationships and candidates into tiers. Not surprisingly, only 20% of medical device companies use tiers. Medical device companies’ relatively small size and narrow focus oftentimes negate the need for segmentation. Only 52% of small companies segment thought leaders, while a similar percentage of mid-size and large companies segment thought leaders — 64% and 63%, respectively.
Cutting Edge Information
KEY OPINION LEADERS �
Figure �.19: Percentage of Companies that Segment Thought Leaders into Tiers
Cutting Edge Information
KEY OPINION LEADERS �
Chapter 2 includes detailed profiles of thought leaders, broken down into tiers reflecting a thought leader’s level of influence.
Tier 3
In the previous study, Tiers 1 through 3 were all early adopters of new drugs. In this study, only Tier 1 thought leaders were indicated as most likely to be early adopters. In addition, in the previous study, only Tier 3 thought leaders and below had never led a clinical research study. The shift in criteria in segmentation indicates a shift in the industry’s view of physicians’ uses.
Tier 2 and 3 thought leaders can provide strong advice for positioning or campaigns, as well as serve on advisory boards or give speeches. In many ways, the fact that the thought leader promoting a product does not always jump at a new drug may look more objective to the public. Moreover, many thought leaders can provide excellent advice about a drug’s prospects by relying upon their medical practice experience, rather than on any clinical research leads. In contrast, for prominent, leading figures of a drug, companies want a thought leader at the forefront of the respective field.
Cutting Edge Information
KEY OPINION LEADERS �
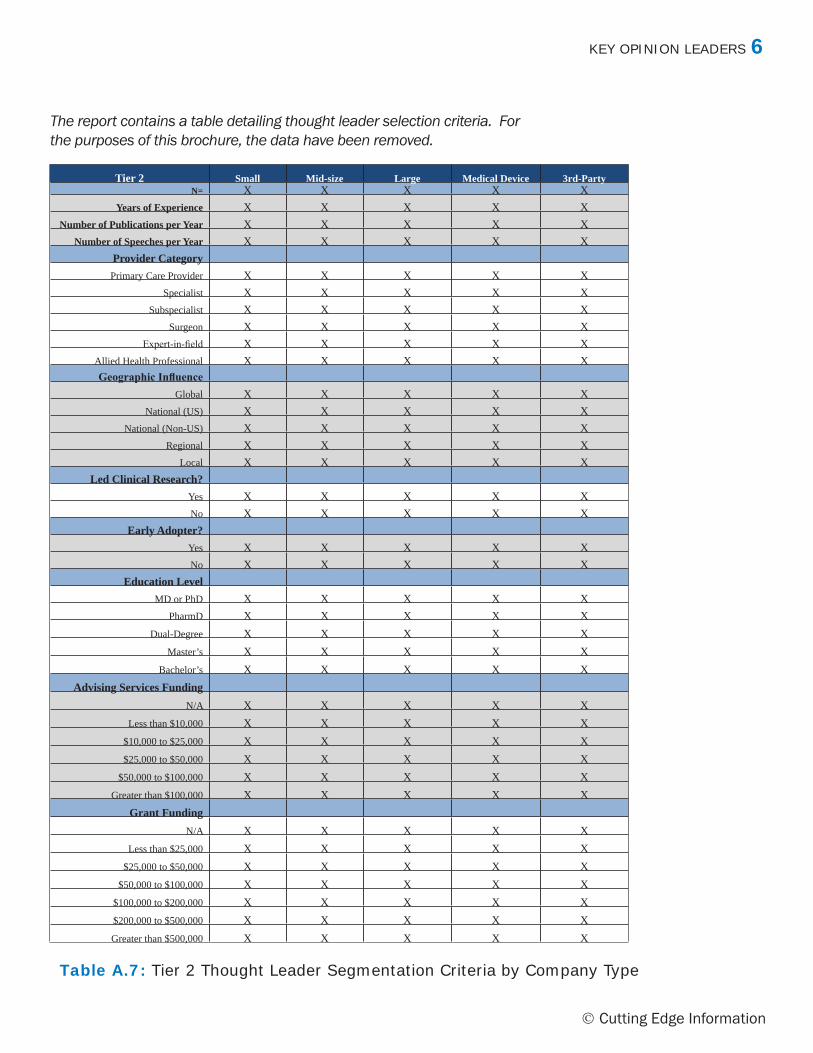
The report contains a table detailing thought leader selection criteria. For the purposes of this brochure, the data have been removed.
Table A.7: Tier 2 Thought Leader Segmentation Criteria by Company Type
Tier 2 Small Mid-size Large Medical Device 3rd-PartyN= X X X X X
Years of Experience X X X X XNumber of Publications per Year X X X X X
Number of Speeches per Year X X X X XProvider CategoryPrimary Care Provider X X X X X
Specialist X X X X XSubspecialist X X X X X
Surgeon X X X X XExpert-in-field X X X X X
Allied Health Professional X X X X XGeographic Influence
Global X X X X XNational (US) X X X X X
National (Non-US) X X X X XRegional X X X X X
Local X X X X XLed Clinical Research?
Yes X X X X XNo X X X X X
Early Adopter?Yes X X X X XNo X X X X X
Education LevelMD or PhD X X X X X
PharmD X X X X XDual-Degree X X X X X
Master’s X X X X XBachelor’s X X X X X
Advising Services FundingN/A X X X X X
Less than $10,000 X X X X X$10,000 to $25,000 X X X X X$25,000 to $50,000 X X X X X
$50,000 to $100,000 X X X X XGreater than $100,000 X X X X X
Grant Funding N/A X X X X X
Less than $25,000 X X X X X$25,000 to $50,000 X X X X X
$50,000 to $100,000 X X X X X$100,000 to $200,000 X X X X X$200,000 to $500,000 X X X X XGreater than $500,000 X X X X X
Cutting Edge Information
KEY OPINION LEADERS 7
Thought Leader Development, a Must for Small Companies
A thought leader development department should be a strong consideration for small companies early in the development cycle. With a dedicated department in place from the start, a small company can begin documenting all thought leader interactions. This is very important several reasons:
• Thought leaders are integral to guiding the development process and clinical direction of companies. Detailed documentation helps identify the most and least influential thought leaders working on a given project.
• A dedicated department will help protect and cultivate valuable thought leader relationships for use in the development of future drugs.
• A thought leader database and network can remain intact even if a developmental drug is partnered/sold to another company. The list of contacts and interactions will help the small company grow well after the drug changes hands.
A member of the board of directors for Company 20 says that creating a dedicated thought leader development department is one of the most important steps a small company can take. If the eventual goal is to partner with a larger company to commercialize the drug, the valuable network of thought leaders remain for years to come.
The board member also recommends that…
Metrics IntroductionKey Opinion Leaders’ three chapters include thought leader segmentation, structure, budget and staffing metrics. Study participants include five top-20 and eight top-40 pharmaceutical companies, as well as biotechnology companies, medical device firms and third-party providers.
Chapter 1: Relationship Management Trends
• Number of thought leader relationships per MSL, by company category
• Number of interactions per thought leader by activity, per month by company category
Chapter 2: Tools for Thought Leader Management Success
Note: To create more targeted benchmarks and opinion leader profiles, surveyed companies were asked to consider thought leaders within six categories: expert in field; specialist; subspecialist; surgeon; primary care provider; allied health professional.
• Percentage of companies targeting specific thought leader categories, broken down by company category
• Percentage of companies targeting specific medical professional categories, broken down by company category
• Percentage of companies contracting KOLs for consulting services by thought leader category — broken down by company category
• Number of promotional/commercial thought leader relationships by company
• Number of clinical thought leader relationships by company
Segmenting Thought Leader Candidates
• Percentage of companies that segment thought leaders into tiers
• Percentage of tiers used by companies that segment thought leaders
• Tables profiling Tier 1, Tier 2, and Tier 3 thought leaders:
o Years of experience
o Number of publications per year
o Number of speeches delivered per year
Cutting Edge Information
KEY OPINION LEADERS �
Cutting Edge Information
KEY OPINION LEADERS 9
o Clinical research background
o Early-adopter profile
o Education level
o Level of annual advising fee funding
o Level of annual grant funding
• Selection tables compile data about the categories above. Data are organized by
o company category
o individual therapeutic area
o provider category
• Rating of factors increasing thought leader tiering by company category (ranking from 1 to 6, with 6 being most influential)
Chapter 3: Thought Leader Development Structure, Staffing and
Spending
• Reporting relationships of companies’ thought leader development groups by company category
• Reporting relationships and company interactions with thought leader development
• Number of FTEs dedicated to companies’ thought leader development groups, by company category
• Number of contract employees dedicated to thought leader groups, by company category
• US 2008 thought leader development budgets, by company category
• Rest-of-World 2008 medical device thought leader development budgets, by company category
• Percentage of companies whose thought leader development is supported by brands, by company category
• Percentage of companies that compensate thought leaders for travel, by company category
• Percentage of companies that compensate thought leaders for training, by company category
Cutting Edge Information
KEY OPINION LEADERS 10
CHARTS AND GRAPHICSExecutive Summary
25 Figure E.1: Percentage of Companies Targeting Specific Thought Leader Categories
Trends Affecting Thought Leader Relationships
Roadblocks to Working with Thought Leaders36 Figure 1.1: Percentage of Companies with Annual Compensation Limits for Thought Leaders
MSL Interactions with Thought Leaders 47 Figure 1.2: Large Companies’ Thought Leader Relationships per MSL 47 Figure 1.3: Mid-Size Companies’ Thought Leader Relationships per MSL 48 Figure 1.4: Small Companies’ Thought Leader Relationships per MSL 47 Figure 1.5: Medical Device Companies’ Thought Leader Relationships per MSL 50 Figure 1.6: Number of Interactions per Thought Leader per Month by Activity for Small Companies50 Figure 1.7: Number of Interactions per Thought Leader per Month by Activity for Mid-Size Companies51 Figure 1.8: Number of Interactions per Thought Leader per Month by Activity for Large Companies51 Figure 1.9: Number of Interactions per Thought Leader per Month by Activity for Medical Device Companies
Tools for Thought Leader Management Success Targeting and Recruiting Thought Leader Candidates62 Figure 2.1: Percentage of Companies Targeting Specific Thought Leader Categories 63 Figure 2.2: Percentage of Small Companies Targeting Specific Thought Leader Categories64 Figure 2.3: Percentage of Mid-size Companies Targeting Specific Thought Leader
Categories
66 Figure 2.4: Percentage of Large Companies Targeting Specific Thought Leader Categories67 Figure 2.5: Percentage of Medical Device Companies Targeting Specific Thought Leader Categories68 Figure 2.6: Percentage Breakdown of Companies Targeting One or More Thought Leader Categories69 Figure 2.7: Percentage of Companies Targeting Specific Medical Professional Categories70 Figure 2.8: Percentage of Small Companies Targeting Specific Medical Professional Categories70 Figure 2.9: Percentage of Mid-size Companies Targeting Specific Medical Professional Categories71 Figure 2.10: Percentage of Large Companies Targeting Specific Medical Professional Categories72 Figure 2.11: Percentage of Companies Contracting KOLs for Consulting Services by Thought Leader Category73 Figure 2.12: Percentage of Small Companies Contracting KOLs for Consulting Services by Thought Leader Category73 Figure 2.13: Percentage of Mid-size Companies Contracting KOLs for Consulting Services by Thought Leader Category74 Figure 2.14: Percentage of Large Companies Contracting KOLs for Consulting Services by Thought Leader Category75 Figure 2.15: Percentage of Medical Device Companies Contracting KOLs for Consulting Services by Thought Leader Category77 Figure 2.16: Number of Promotional/Commercial Thought Leader Relationships by Company77 Figure 2.17: Number of Clinical Thought Leader Relationships by Company 78 Figure 2.18: Average Number of Thought Leader Relationships by Company Category
Segmenting Thought Leader Candidates80 Figure 2.19: Percentage of Companies that Segment Thought Leaders into Tiers 81 Figure 2.20: Percentage of Tiers Used by Companies that Segment Thought Leaders 83 Table 2.1: Tier 1 Thought Leader Profile 84 Table 2.2: Tier 2 Thought Leader Profile 85 Table 2.3: Tier 3 Thought Leader Profile
Cutting Edge Information
KEY OPINION LEADERS 11
CHARTS AND GRAPHICS
86 Figure 2.21: Rating of Factors Increasing Thought Leaders’ Tiering by Company Category (with 6 Denoting the Most Influential Characteristic)89 Figure 2.22: Percentage of Companies Choosing a Specific Factor as Most Influential on KOLs’ Tiering89 Figure 2.23: Percentage of Companies Choosing a Specific Factor as the Second Most Influential on KOLs’ Tiering90 Figure 2.24: Percentage of Companies Choosing a Specific Factor as the Third Most Influential on KOLs’ Tiering91 Figure 2.25: Percentage of Companies Choosing a Specific Factor as the Fourth Most Influential on KOLs’ Tiering92 Figure 2.26: Percentage of Companies Choosing a Specific Factor as the Fifth Most Influential on KOLs’ Tiering93 Figure 2.27: Percentage of Companies Choosing a Specific Factor as the Least Influential on KOLs’ Tiering
Thought Leader Development Structure, Staffing and Spending102 Figure 3.1 Reporting Relationships of Companies’ Thought Leader Development Groups by Company Category
Thought Leader Management Structure and Staffing104 Figure 3.2: Reporting Relationships and Company Interactions with Thought Leader Development106 Figure 3.3: Number of FTEs Dedicated to Small Companies’ Thought Leader Development Groups107 Figure 3.4: Number of FTEs Dedicated to Mid-size Companies’ Thought Leader Development Groups107 Figure 3.5: Number of FTEs Dedicated to Large Companies’ Thought Leader Development Groups108 Figure 3.6: Number of FTEs Dedicated to Medical Device Companies’ Thought Leader Development Groups109 Figure 3.7: Number of Employees Dedicated to Small Companies’ Thought Leader Development Groups110 Figure 3.8: Number of Employees Dedicated to Mid-size Companies’ Thought Leader Development Groups
Cutting Edge Information
KEY OPINION LEADERS 1�
CHARTS AND GRAPHICS
Thought Leader Development Spending111 Figure 3.9: Small Companies’ 2008 US Thought Leader Development Budgets 112 Figure 3.10: Mid-size Companies’ 2008 US Thought Leader Development Budgets 112 Figure 3.11: Large Companies’ 2008 US Thought Leader Development Budgets 113 Figure 3.12: Medical Device Companies’ 2008 US Thought Leader Development Budgets114 Figure 3.13: Small Companies’ 2008 ROW Thought Leader Development Budgets 115 Figure 3.14: Mid-size Companies’ 2008 ROW Thought Leader Development Budgets 115 Figure 3.15: Medical Device Companies’ 2008 US Thought Leader Development Budgets117 Figure 3.16: Overall Percentage Breakdown of Thought Leader Development Spending by Company Size118 Figure 3.17: Percentage Breakdown of Small Companies’ Thought Leader Development Spending118 Figure 3.18: Percentage Breakdown of Mid-Size Companies’ Thought Leader Development Spending119 Figure 3.19: Percentage Breakdown of Large Companies’ Thought Leader Development Spending119 Figure 3.20: Percentage Breakdown of Medical Device Companies’ Thought Leader Development Spending120 Figure 3.21: Percentage of Companies Whose Thought Leader Budgets are Supported by Brands121 Figure 3.22: Percentage of Companies’ Thought Leader Budgets Supported by Brands 122 Figure 3.23: Percentage of Small Companies’ Thought Leader Budgets Supported by Brands122 Figure 3.24: Percentage of Mid-size Companies’ Thought Leader Budgets Supported by Brands123 Figure 3.25: Percentage of Large Companies’ Thought Leader Budgets Supported by Brands124 Figure 3.25: Number of Brands Supported by Thought Leader Development Groups: Small Companies125 Figure 3.26: Number of Brands Supported by Thought Leader Development Groups: Mid-size Companies125 Figure 3.27: Number of Brands Supported by Thought Leader Development Groups: Large Companies
Cutting Edge Information
KEY OPINION LEADERS 1�
CHARTS AND GRAPHICS
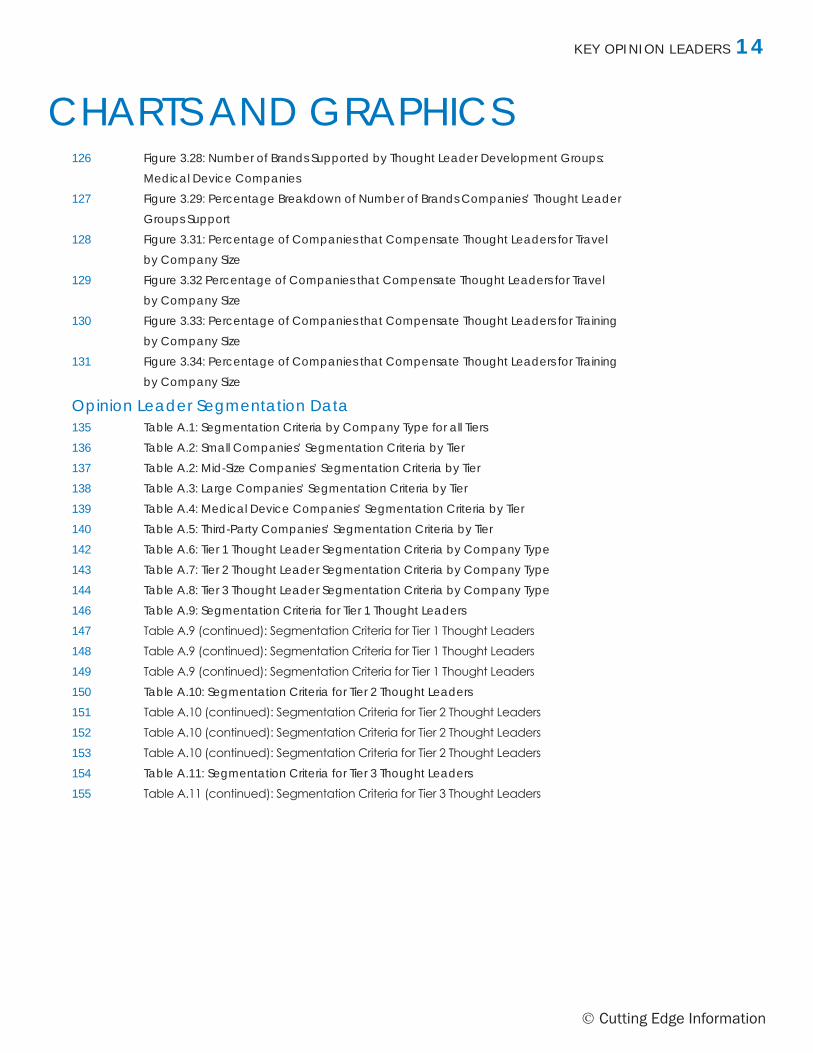
126 Figure 3.28: Number of Brands Supported by Thought Leader Development Groups: Medical Device Companies127 Figure 3.29: Percentage Breakdown of Number of Brands Companies’ Thought Leader Groups Support128 Figure 3.31: Percentage of Companies that Compensate Thought Leaders for Travel by Company Size129 Figure 3.32 Percentage of Companies that Compensate Thought Leaders for Travel by Company Size130 Figure 3.33: Percentage of Companies that Compensate Thought Leaders for Training by Company Size131 Figure 3.34: Percentage of Companies that Compensate Thought Leaders for Training by Company Size
Opinion Leader Segmentation Data135 Table A.1: Segmentation Criteria by Company Type for all Tiers 136 Table A.2: Small Companies’ Segmentation Criteria by Tier 137 Table A.2: Mid-Size Companies’ Segmentation Criteria by Tier 138 Table A.3: Large Companies’ Segmentation Criteria by Tier 139 Table A.4: Medical Device Companies’ Segmentation Criteria by Tier 140 Table A.5: Third-Party Companies’ Segmentation Criteria by Tier 142 Table A.6: Tier 1 Thought Leader Segmentation Criteria by Company Type 143 Table A.7: Tier 2 Thought Leader Segmentation Criteria by Company Type 144 Table A.8: Tier 3 Thought Leader Segmentation Criteria by Company Type 146 Table A.9: Segmentation Criteria for Tier 1 Thought Leaders 147 Table A.9 (continued): Segmentation Criteria for Tier 1 Thought Leaders 148 Table A.9 (continued): Segmentation Criteria for Tier 1 Thought Leaders 149 Table A.9 (continued): Segmentation Criteria for Tier 1 Thought Leaders 150 Table A.10: Segmentation Criteria for Tier 2 Thought Leaders 151 Table A.10 (continued): Segmentation Criteria for Tier 2 Thought Leaders 152 Table A.10 (continued): Segmentation Criteria for Tier 2 Thought Leaders 153 Table A.10 (continued): Segmentation Criteria for Tier 2 Thought Leaders 154 Table A.11: Segmentation Criteria for Tier 3 Thought Leaders 155 Table A.11 (continued): Segmentation Criteria for Tier 3 Thought Leaders
CHARTS AND GRAPHICS
Cutting Edge Information
KEY OPINION LEADERS 1�
CHARTS AND GRAPHICS
Cutting Edge Information
KEY OPINION LEADERS 1�
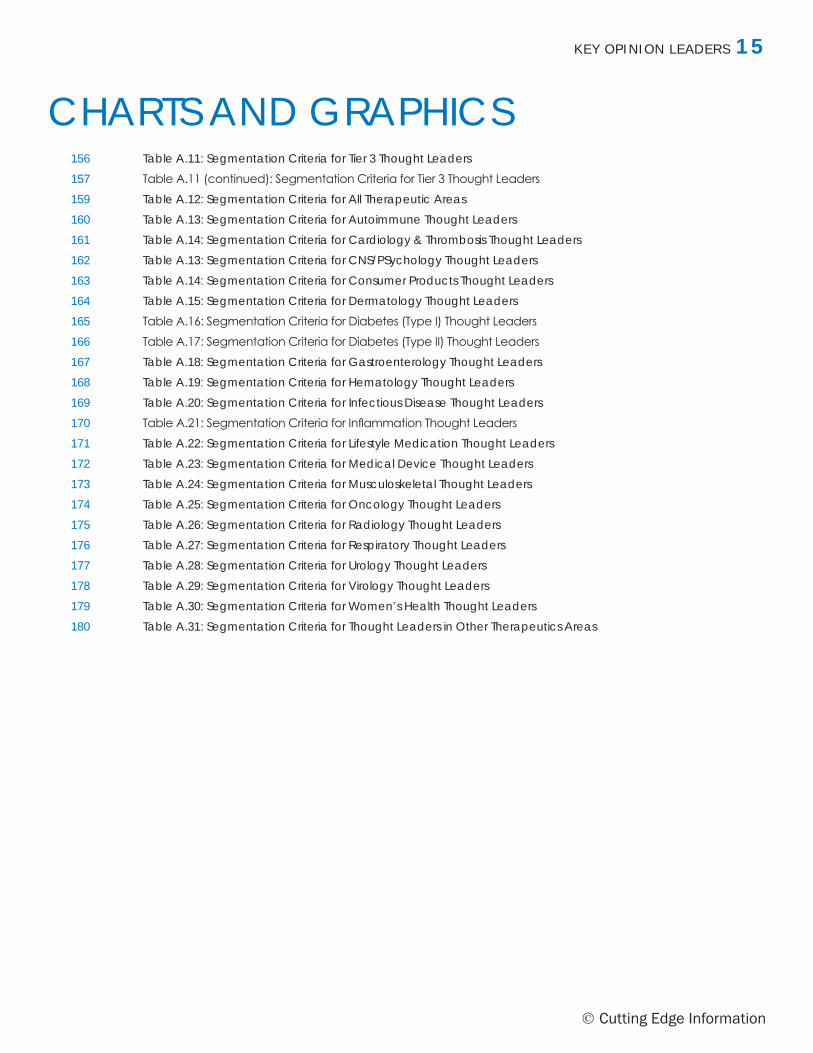
156 Table A.11: Segmentation Criteria for Tier 3 Thought Leaders 157 Table A.11 (continued): Segmentation Criteria for Tier 3 Thought Leaders 159 Table A.12: Segmentation Criteria for All Therapeutic Areas 160 Table A.13: Segmentation Criteria for Autoimmune Thought Leaders 161 Table A.14: Segmentation Criteria for Cardiology & Thrombosis Thought Leaders 162 Table A.13: Segmentation Criteria for CNS/PSychology Thought Leaders 163 Table A.14: Segmentation Criteria for Consumer Products Thought Leaders 164 Table A.15: Segmentation Criteria for Dermatology Thought Leaders 165 Table A.16: Segmentation Criteria for Diabetes (Type I) Thought Leaders 166 Table A.17: Segmentation Criteria for Diabetes (Type II) Thought Leaders 167 Table A.18: Segmentation Criteria for Gastroenterology Thought Leaders 168 Table A.19: Segmentation Criteria for Hematology Thought Leaders 169 Table A.20: Segmentation Criteria for Infectious Disease Thought Leaders 170 Table A.21: Segmentation Criteria for Inflammation Thought Leaders 171 Table A.22: Segmentation Criteria for Lifestyle Medication Thought Leaders 172 Table A.23: Segmentation Criteria for Medical Device Thought Leaders 173 Table A.24: Segmentation Criteria for Musculoskeletal Thought Leaders 174 Table A.25: Segmentation Criteria for Oncology Thought Leaders 175 Table A.26: Segmentation Criteria for Radiology Thought Leaders 176 Table A.27: Segmentation Criteria for Respiratory Thought Leaders 177 Table A.28: Segmentation Criteria for Urology Thought Leaders 178 Table A.29: Segmentation Criteria for Virology Thought Leaders 179 Table A.30: Segmentation Criteria for Women’s Health Thought Leaders 180 Table A.31: Segmentation Criteria for Thought Leaders in Other Therapeutics Areas
Cutting Edge Information
KEY OPINION LEADERS 1�
More Cutting Edge Information Reports: Thought Leader Fair-Market Value: Compensation Benchmarks and Procedures
http://www.cuttingedgeinfo.com/thought-leader-fmv
The Changing MSL Role: Proving Value through Performance Measurement
http://www.cuttingedgeinfo.com/msl
Monitoring and Ensuring Pharmaceutical Compliance
http://www.cuttingedgeinfo.com/compliance
About Cutting Edge Information Cutting Edge Information is your one-stop shop for real-company business research. Our Real-Company ResearchSM reports combine strong quantitative tactical insights and rich qualitative information to create a map for you and your team to follow — to provide you with information “from the cutting edge.”
Our reports contain real-world, tested strategies — not synthesized findings or academic guesswork — provided to you at a fraction of the cost and time of a full consulting study.
REPORT LINKS