july/august 2005 • volume 30 • number 4 • 409-560 - Allen Press
156
(ISSN 0361-7734) july/august 2005 • volume 30 • number 4 • 409-560 OPERATIVE DENTISTRY volume 30 • number 4 • pages 409-560 july-august 2005 Downloaded from http://meridian.allenpress.com/operative-dentistry/article-pdf/30/4/1/1819389/1559-2863-30-4-1.pdf by guest on 12 January 2022
-
Upload
khangminh22 -
Category
Documents
-
view
4 -
download
0
Transcript of july/august 2005 • volume 30 • number 4 • 409-560 - Allen Press

RECOMMENDATIONS FOR CLINICAL PRACTICEReasons for Replacement of Restorations . . . . . . . . . . . . . . . . . . . . . . . . . . . . . . . . . . . . . . . . . . . . . . . . . . . . . . . . . . . . . . . . . . . . . . . . . . . . . . . . . . . . . . . . . .409
CLINICAL RESEARCH
Comparative Study of the Effects of Two Bleaching Agents on Oral Microbiota—YT Alkmin • R Sartorelli • FM Flório • RT Basting . . .417
Eighteen-month Clinical Performance of a Self-etching Primer in Unprepared Class V Resin RestorationsWW Brackett • MG Brackett • A Dib • G Franco • H Estudillo . . . . . . . . . . . . . . . . . . . . . . . . . . . . . . . . . . . . . . . . . . . . . . . . . . . . . . . . . . . . . . . . .424
LABORATORY RESEARCH
Effect of Desensitizers on the Bond Strength of a Self-etching Adhesive System to Caries-affected Dentin on the Gingival WallA Sengun • AE Koyuturk • Y Sener • F Ozer . . . . . . . . . . . . . . . . . . . . . . . . . . . . . . . . . . . . . . . . . . . . . . . . . . . . . . . . . . . . . . . . . . . .430
Color and Translucency of A2 Shade Resin Composites After Curing, Polishing and Thermocycling Y-K Lee • B-S Lim • S-H Rhee • H-C Yang • JM Powers . . . . . . . . . . . . . . . . . . . . . . . . . . . . . . . . . . . . . . . . . . . . . . . . . . . . . . . . . .436
Degree of Remaining C=C Bonds, Polymerization Shrinkage and Stresses of Dual-cured Core Build-up Resin CompositesMM Stavridakis • AI Kakaboura • I Krejci . . . . . . . . . . . . . . . . . . . . . . . . . . . . . . . . . . . . . . . . . . . . . . . . . . . . . . . . . . . . . . . . . . . . . .443
Effects of Dentin Disinfectants on the Shear Bond Strength of All-ceramics to Dentin—M Turkun • E Cal • M Toman • S Toksavul . . .453
Comparison of Linear Polymerization Shrinkage and Microhardness Between QTH-cured & LED-cured CompositesS-H Park • S-S Kim • Y-S Cho • S-Y Lee • B-D Noh . . . . . . . . . . . . . . . . . . . . . . . . . . . . . . . . . . . . . . . . . . . . . . . . . . . . . . . . . . . . . .461
Shear Bond Strength of Tooth-colored Indirect Restorations Bonded to Coronal and Cervical EnamelY Shimada • N Tomimatsu • T Suzuki • MA Uzzaman • MF Burrow • J Tagami . . . . . . . . . . . . . . . . . . . . . . . . . . . . . . . . . . . . . . . .468
Post-gel Polymerization Shrinkage Associated with Different Light Curing Regimens—CH Chye • AUJ Yap •YC Laim • MS Soh . . . . . .474
Microscopic Evaluation of Dentin Interface Obtained with 10 Contemporary Self-etching Systems: Correlation with Their pHG Grégoire • A Millas . . . . . . . . . . . . . . . . . . . . . . . . . . . . . . . . . . . . . . . . . . . . . . . . . . . . . . . . . . . . . . . . . . . . . . . . . . . . . . . . . . . . . . .481
Enamel Bond Strengths of Pairs of Adhesives from the Same Manufacturer—J Perdigão • G Gomes • S Duarte Jr • MM Lopes . . . . .492
Microtensile Bond Strength of Light- and Self-cured Adhesive Systems to Intraradicular Dentin Using a Translucent Fiber PostA Mallmann • LB Jacques • LF Valandro • P Mathias • A Muench . . . . . . . . . . . . . . . . . . . . . . . . . . . . . . . . . . . . . . . . . . . . . . . . . .500
Surface Changes and Acid Dissolution of Enamel After Carbamide Peroxide Bleach Treatment—S-T Yeh • Y Su • Y-C Lu • S-Y Lee . . . .507
Temperature Change and Hardness with Different Resin Composites and Photo-activation MethodsLFJ Schneider • S Consani • MAC Sinhoreti • L Correr Sobrinho • FM Milan . . . . . . . . . . . . . . . . . . . . . . . . . . . . . . . . . . . . . . . . .516
Fluoride Release and Neutralizing Effect by Resin-based Materials—T Itota • OT Al-Naimi • TE Carrick • M Yoshiyama • JF McCabe .522
Effect of Handpiece Maintenance Method on Bond Strength—HW Roberts • KS Vandewalle • DG Charlton • DL Leonard . . . . . . . . . . .528
The Influence of Sodium Hypochlorite and Root Canal Sealers on Post Retention in Different Dentin Regions—L Muniz • P Mathias . . . . . . .533
Effect of Curing Time and Light Curing Systems on the Surface Hardness of CompomersZ Okte • P Villalta • F Garcia-Godoy • F Garcia-Godoy Jr • P Murray . . . . . . . . . . . . . . . . . . . . . . . . . . . . . . . . . . . . . . . . . . . . . . . . . .540
CLINICAL TECHNIQUE/CASE REPORTDivergent Cast Post and Core Technique for Severely Compromised Molars with Potential for Corrosion Fracture Considered—D Newitter . .546
Case Report—Pre-Eruptive Intracoronal Resorption—JF McEntire • CB Hermesch • BS Wall • DL Leonard . . . . . . . . . . . . . . . . . . . . . . . .553
DEPARTMENTSFaculty Positions . . . . . . . . . . . . . . . . . . . . . . . . . . . . . . . . . . . . . . . . . . . . . . . . . . . . . . . . . . . . . . . . . . . . . . . . . . . . . . . . . . . . . . . . . . . . . . . . . . . . . . . . .557Announcements . . . . . . . . . . . . . . . . . . . . . . . . . . . . . . . . . . . . . . . . . . . . . . . . . . . . . . . . . . . . . . . . . . . . . . . . . . . . . . . . . . . . . . . . . . . . . . . . . . . . . . . . . .558Instructions to Contributors . . . . . . . . . . . . . . . . . . . . . . . . . . . . . . . . . . . . . . . . . . . . . . . . . . . . . . . . . . . . . . . . . . . . . . . . . . . . . . . . . . . . . . . . . . . . . . .559
Operative Dentistry Home Page . . . . . . . . . . . . . . . . . . . . . . . . . . . . . . . . . . . . . . . . . . . . . . . . . . . . . . . . . . . . . . . . . . . . . . . . . . . . . . . . . . . . . . . . . . .559
(ISSN 0361-7734)
july/august 2005 • volume 30 • number 4 • 409-560
OP
ER
AT
IVE
DE
NT
IST
RY
volu
me 30 • n
um
ber 4 • p
ages 409-560
july-au
gu
st 2005
Periodicals10-9385Operative DentistryIndiana University School of Dentistry, Rm S4111121 West Michigan StreetIndianapolis, IN 46202-5186 USA
JULY/AUGUST 2005 • VOLUME 30 • NUMBER 4 • 409-560
©OPERATIVE DENTISTRY, Inc.
Dow
nloaded from http://m
eridian.allenpress.com/operative-dentistry/article-pdf/30/4/1/1819389/1559-2863-30-4-1.pdf by guest on 12 January 2022

These Dental Manufacturers have joined Operative Dentistry in our commitment topublish quality dental literature in a timely manner. We thank them for their support.Aim and Scope
Operative Dentistry publishes articles that advance the practice ofoperative dentistry. The scope of the journal includes conservationand restoration of teeth; the scientific foundation of operative dentaltherapy; dental materials; dental education; and the social, political,and economic aspects of dental practice. Review papers, book reviews,letters and classified ads for faculty positions are also published.
Subscriptions: Fax (317) 852-3162
Current pricing for individual, institutional and dental student sub-scriptions (both USA and all other countries) can be found at our web-site: www.jopdent.org, or by contacting our subscription manager:
Fax 317/852-3162E-mail: [email protected]
Information on single copies, back issues and reprints is also avail-able. Make remittances payable (in US dollars only) to OperativeDentistry and send to the above address. Credit card payment (Visa,MasterCard) is also accepted by providing card type, card number,expiration date, and name as it appears on the card.
Contributions
Contributors should study submission requirements found on ourwebsite at www.jopdent.org and follow them carefully.
Permission
For permission to reproduce material from Operative Dentistry pleaseapply to Operative Dentistry at the above address.
The views expressed in Operative Dentistry do not necessarily repre-sent those of the Academies or of the Editors.
Editorial OfficeOperative DentistryIndiana University School of Dentistry, Room S4111121 West Michigan Street, Indianapolis, IN 46202-5186Telephone: (317) 278-4800, Fax: (317) 278-4900URL: http://www.jopdent.org/
Editorial Staff
Editor: Michael A CochranEditorial Assistant/Subscription Manager: Joan MatisEditorial Associate: Karen E WilczewskiAssociate Editors: Bruce A Matis, Edward J DeSchepper
and Richard B McCoyManaging Editor: Timothy J CarlsonAssistant Managing Editors: Joel M Wagoner
and Ronald K Harris
JULY/AUGUST 2005 • VOLUME 30 • NUMBER 4 • 409-560
Operative Dentistry (ISSN 0361-7734) is published bimonth-ly by Operative Dentistry, Indiana University School ofDentistry, Room S411, 1121 West Michigan Street,Indianapolis, IN 46202-5186. Periodicals postage paid atIndianapolis, IN, and additional mailing offices. Postmaster:Send address changes to: Operative Dentistry, Indiana Univer-sity School of Dentistry, Room S411, 1121 West MichiganStreet, Indianapolis, IN 46202-5186.
Editorial Board
Kinley K AdamsRaed AljouniMaxwell H AndersonDaniel J ArmstrongSteven R ArmstrongTar-Chee AwWayne W BarkmeierDouglas M BarnesGardner BassettMark W BeattyDavid BerzinsLars BjørndalLawrence W BlankPaul K BlaserMurray R BouschlicherWilliam W BrackettJames C BroomeWilliam BrowningPaul A BruntonMichael BurrowFred J CertosimoDaniel CN ChanDavid G CharltonGordon J ChristensenN Blaine CookDavid CoveyGerald E DenehyJoseph B DennisonJeffery R DentonKim E DiefenderferWillaim J DunnFrederick C EichmillerSigfus T EliassonOmar M El-MowafyJohn W FarahDennis J FasbinderJack L FerracaneMark FitzgeraldKevin B FrazierJames C GoldCarlos Gonzalez-CabezasValeria V GordanJeanette GorthyKevin M GureckisCarl W HavemanVan B HaywoodCharles B HermeschHarald O HeymannThomas J HiltonBarry W HolleronRonald C HouseJames HowardPoonam JainWilliam JohnsonGordon K JonesRobert C KeeneWilliam P Kelsey, IIIHarold R LaswellMark A LattaJames S LindemuthMelvin R Lund
Barbara MaxsonDorothy McCombJonathan C MeiersGeorg MeyerJan MitchellIvar A MjörMichael P MolvarB Keith MooreGraham J MountDavid F MurchisonAnn-Marie NemeJennifer NeoJacques NörJeffery NordinJohn W OsborneJ David OvertonJames OxfordMichael W ParkerCraig J PassonTilly PetersAnne PeutzfeldtFrank E PinkJeffrey A PlattJames C RagainJohn W ReinhardtEduardo RestonPhilip J RinaudoAndré RitterJ William RobbinsFrank J RobertelloHoward W RobertsBoyd E RobinsonClyde L RoggenkampWilliam RoseJean-Francois RouletFrederick A RueggebergHenry A St Germain, JrDavid C SarrettJohn W ShanerGregory E SmithW Dan SneedIvan StangelJames M StrotherJames B SummittEdward J Swift, JrWilliam H TateFranklin R TayChoi Gait TohPeter T Triolo, JrKaren TroendleRichard D TuckerKraig Van De WalleMarcos VargasDouglas VerhoefWarren C WagnerJoel M WagonerCharles W WakefieldSteve W WallaceTimothy F WatsonNairn H F WilsonPeter YamanAdrian U J YapAndrea G F Zandona
©2005 Operative Dentistry, Inc. • Printed in USA
Dow
nloaded from http://m
eridian.allenpress.com/operative-dentistry/article-pdf/30/4/1/1819389/1559-2863-30-4-1.pdf by guest on 12 January 2022

©Operative Dentistry, 2005, 30-4, 409-416
INTRODUCTION
Surveys of the time spent on various procedures in gen-eral dental practice show that restorative dentistry,including caries diagnosis and preventive measures,comprises the major workload (Eklund, 1999; Gilbert,2004). Non-implant restorative procedures alone repre-sent almost 60% of treatment time in the US and,together with diagnostic and preventive measures, theycomprise about 70% (Gilbert, 2004). Practice-basedstudies have shown that replacement of restorationsinvolves from 50% to 80% of all restorative work donein general dental practice (Mjör, 1981; Tveit & Espelid,1986; Klausner, Green & Charbeneau, 1987; Qvist,Qvist & Mjör, 1990a,b; Mjör & Qvist, 1997; Burke &others, 1999; Mjör, Moorhead & Dahl, 2000b; Mjör &others, 2002). Thus, “replacement therapy” constitutesa major part of general dental practice. A number ofdetermining elements effect the replacement rate ofrestorations, including patient, material and clinicianfactors.
Detailed, practice-based, longitudinal studies on theselection of restorative materials, reasons for replace-ment and longevity of restorations in the primary den-tition have recently been published (Qvist & others,2004a,b; Qvist, Manscher & Teglers, 2004c). Thisreview will be limited to restorations in the permanentteeth of adults and will focus on composite andamalgam restorations, because they are the most fre-quently used restorations.
FAILURE OF RESTORATIONS
Restorations diagnosed as failed will, in most cases, bereplaced. The cost of this treatment must represent bil-lions of dollars annually on a worldwide basis. Manyfactors play a role in determining the rate of thereplacement of restorations, notably, the definition ofwhat constitutes a failure. The date when studies offailures are carried out will also have a profound effect
on the results. For example, reasons for the replace-ment of restorations using basically the same method-ology have shown marked differences in the reasons forreplacement of resin-based composite restorations instudies 20 years apart (Mjör, 1981; Mjör & others,2000b). The increased use of composites and the widerindications for their use are included in these differ-ences. The indications have changed markedly frombeing primarily used in small restorations in anteriorteeth and in single-surface facial restorations to becomingan all-round material used in small and large, anteriorand posterior restorations. Degradation, sometimesreferred to as wear which was only a part of the prob-lem, was the main reason for replacement of compositerestorations in the 1970s, while secondary caries wascited as the main reason for failure in the 1990s. Twomain reasons are considered important for the changein reasons for replacement of composite restorations;improved clinical techniques based on more adequateteaching of posterior composites at dental schools (Mjör& Wilson, 1998; Wilson & Mjör, 2000) and, on accumu-lated experience, largely by trial and error by cliniciansin practice. The other main reason for the changesincludes improved composite properties and adhesivetechnology.
The reasons for replacement of amalgam restorationshave remained basically the same from the 1970s up tonow (Mjör, 2001); in fact, they have not changed signifi-cantly during the last 100 years (Mjör, 2005). Moderateimprovements in ditched margins as a reason forreplacement has been noted in practice-based studies,possibly as a result of the introduction of high copper/“non-gamma-two” amalgams or due to the exclusion ofamalgams with high creep (Mjör & Espevik, 1980).Presently, the reasons for replacement of amalgam andmodern composite restorations are similar, with theexception of discoloration, which is not applicable foramalgam restorations (Mjör & others, 2000b).
Recommendations for Clinical Practice
Reasons for Replacementof Restorations
Dow
nloaded from http://m
eridian.allenpress.com/operative-dentistry/article-pdf/30/4/1/1819389/1559-2863-30-4-1.pdf by guest on 12 January 2022

410 Operative Dentistry
Diagnosis of Failures
Some diagnoses of restoration failures are easyand cannot be disputed, for example, entire orpartial loss of the restoration. Other diagnosesare more dubious and open to subjective opinionand interpretation. The clinical diagnosis of sec-ondary (recurrent) caries is the most frequentlycited, but a most ambiguous diagnosis for thereplacement of restorations. The diagnosis ofsecondary caries is poorly defined, both in prac-tice (Mjör & Toffenetti, 2000; Mjör, 2005) and inteaching programs (Clark & Mjör, 2001), andmany studies have pointed to marked variationsin this diagnosis among clinicians, both inter-and intra-individual variations (Merrett &Elderton, 1984; Tveit & Espelid, 1986;Maryniuk, 1990; Espelid & Tveit, 1991; Bader &Shugars, 1992, 1993; Tveit & Espelid, 1992;Setcos & others, 2004). This clinical diagnosiswill be dealt with under a separate subheading.Part of the explanation for the variations notedmay be because the studies did not discriminatebetween diagnosing and treatment planning(Özer & Thylstrup, 1995).
Some reasons for failure are only indirectlyrelated to the restoration. Fracture of tooth, forexample, is usually listed as a reason forreplacement of restorations, but bulk fracture,such as cusp fracture, associated with restora-tions, may just as well be a failure of the toothrather than a failure of the restoration per se.On the other hand, marginal fractures/degrada-tion (or “ditching”) differs in extent and degree,and the magnitude of marginal degradation isopen to discussion as a reason for replacement.Degradations are commonly seen on the occlusal part ofamalgam restorations. Such marginal defects do notpredispose to secondary caries. Caries lesions are foundequally often at non-ditched and ditched amalgammargins (Pimenta, Navarro & Consolaro, 1995), andditching is not related to the consistency and color ofthe subjacent dentin (Kidd, Joyston-Bechal &Beighton, 1994; 1995). Only frank caries lesions at themargin of restorations constitute reliable diagnosis ofsecondary caries lesions (Kidd & Beighton, 1996).
Pain/sensitivity is a reason for replacement of only 1%to 2% of all restorations replaced, irrespective of therestorative material. “Change of material” of functionalrestorations without any defects has also become areason for replacement, especially of amalgam restora-tions.
Discoloration of the bulk and/or margin of tooth-col-ored restorations are criteria that are subject to inter-pretation by the clinician and patient, either individu-ally or together. The first resin-based composites intro-
duced on the market were deficient in many respects,and bulk discoloration was a major problem. Marginaldiscoloration was also common before clinicians acceptedacid etching as a legitimate and required part of theclinical procedure for placement of resin-based restora-tions. Improvements in adhesive technology and mate-rials must also have played a role. These discolorationissues have largely been resolved, but extrinsicstaining is still a factor to be considered.
A number of other defects result in the replacement ofrestorations. Some are of iatrogenic origin, for example,lack of adequate contact to adjacent teeth, overhangs atgingival margins, porosities in the restorative materialand poor anatomical form of the restoration. Otherdefects, such as material degradation, were found to beassociated with silicate cement restorations when theywere in use. The first marketed composites also exhib-ited material degradation that predisposed them towear and loss of anatomical form. Bruxism and unusualpatient behavior may contribute to excessive wear.
Figure 1. Reasons for replacement of amalgam restorations (n=5,731). Data from Mjörand others (2000b).
Figure 2. Reasons for replacement of composite restorations (n=2,952). Data fromMjör and others (2000b).
1. Secondary caries 57%2. Restoration fracture 25%3. Discoloration 0%4. Tooth fracture 7%5. Other reasons 11%
1. Secondary caries 47%2. Restoration fracture 24%3. Discoloration 15%4. Tooth fracture 4%5. Other reasons 11%
Dow
nloaded from http://m
eridian.allenpress.com/operative-dentistry/article-pdf/30/4/1/1819389/1559-2863-30-4-1.pdf by guest on 12 January 2022

411Reasons for Replacement of Restorations
In an early practice-based study where a list of rea-sons for replacement of restorations was provided tothe clinicians, the last alternative was “more than onereason” (Mjör, 1979). Only about 2% of all replacementshad more than one reason cited for replacement.Subsequent studies have not included this question,and all the infrequently cited reasons have usuallybeen lumped into “other reasons;” the main reasons forfailure have been limited to:
1. Secondary caries
2. Fracture of restoration
3. Discoloration of tooth-colored restorations
4. Fracture of tooth
5. Other reasons
Restoration and discoloration fractures have oftenbeen subdivided into bulk and marginal defects. Sincethe question regarding “more than one reason” wasincluded in only the 1979 study, the topic should berepeated in a future investigation, with the restorativematerials currently in use, and the information shouldbe updated on a regular basis.
The relative frequency cited as reasons for replace-ment of amalgam and composite restorations in adultsfrom a practice-based study carried out in the late1990s are illustrated in Figures 1 and 2. Secondarycaries, fracture of restorations, fracture of tooth anddiscoloration of tooth-colored materials comprise 82%to 90% of all reasons for replacement, leaving only 10%to 18% for a number of “other reasons.” Other reasonsinclude loss of restoration, poor anatomical form,pain/sensitivity, “change of material” and any unde-fined reason.
Fracture of tooth is recorded as a reason for replace-ment in 4% to 7% of all replaced restorations. A recentstudy has confirmed that tooth fracture occurs infre-quently, and no significant difference exists betweencusp fractures associated with amalgam and compositerestorations (Wahl & others, 2004). Poor anatomicform, which may be associated with material degrada-tion, is not a problem like it was for the composites used20 to 30 years ago. Conventional glass ionomer restora-tions replaced at the 9% level based on poor anatomicalform (Mjör & others, 2000b) indicate that materialdegradation is still a problem for certain types ofrestorative material. It is noteworthy that marginaldiscoloration is not much of a problem with present-daycomposite restorations, suggesting that proper clinicaltechniques have been adopted. Excess material at thegingival margin or “overhang” is rarely a reason forreplacement of restorations, possibly because they canbe removed without replacing the entire restoration.However, small overhangs may be difficult to detectand they are closely linked to plaque accumulations atthe gingival margin of restorations (Özer, 1997).
This brief review of reasons for replacement ofrestorations highlights two issues:
1. The main reasons are few and easy to describe, butsome are difficult to diagnose and open to subjec-tive interpretation.
2. The need for definitions of what constitutes fail-ures, to a degree that requires replacement ofrestorations, is imminent.
These issues should be at the forefront of tasks to bestudied, evaluated, discussed and finalized within thefield of Operative Dentistry. If we do not come to termswith these tasks, others, such as insurance companiesor patient advocacy groups, may take over and dictateterms that may not optimally serve the public and theprofession. It is important in this context to recognizethat treatment decisions should be based on factsrather than on traditions (Boyd, 1989).
Secondary Caries
Practice-based studies over the last decades and, infact, ever since GV Black’s time more than 100 yearsago, have shown that the clinical diagnosis of secondarycaries is by far the most common reason for replace-ment of all types of restorations (Black, 1908; Healy &Philips, 1949; Dahl & Eriksen, 1978; Mjör, 1981; Qvist& others, 1990a,b; Wilson, Burke & Mjör, 1997; Mjör,1997; Burke & others, 1999; Mjör & Toffenetti, 2000;Delgorgi & others, 2000; Mjör & others, 2000b; Mjör &others, 2002; Setcos & others, 2004). Depending on anumber of variables, practice-based studies haveshown the relative percentage of restorations replacedon adults due to secondary caries to vary from 32%(Qvist & others, 1990a,b) to 72% (Mjör, 1985). Mostoften, the percentage of replacements of amalgamrestorations with the clinical diagnosis of secondarycaries is at the 50% to 60% level. For tooth-coloredrestorations, this percentage is about 50%. Other rea-
Figure 3. Note two small lesions on the canine gingival to thecomposite restoration.The one at the margin of the restorationwas diagnosed as a secondary caries lesion and the one fur-ther gingivally as a primary root caries lesion. (From the UFCDstudent clinic.)
Dow
nloaded from http://m
eridian.allenpress.com/operative-dentistry/article-pdf/30/4/1/1819389/1559-2863-30-4-1.pdf by guest on 12 January 2022

412 Operative Dentistry
sons for failure of all types of restorations includerestoration fracture, bulk and marginal, poor anatom-ical form and fracture of tooth. Tooth-colored restora-tions may also fail as a result of bulk and marginal dis-colorations. It should be noted that the differentialdiagnosis of stained margins and secondary carieslesions (Figures 3 and 4) is difficult (Tyas, 1991; Kidd &Beighton, 1996), and these defects may often berepaired rather than lead to replacement of the restora-tions in order to save tooth tissues (Figure 5).
A number of additional reasons have also been citedin many studies, but since these generally comprise 2%to 4% and less than 10% of all replacements, they areincluded under “other” reasons.
A summary of multiple, longitudinal controlled clin-ical trials of amalgam restorations showed that 80% ofthe reasons for failures were due to some form of frac-ture of the restorations (Letzel & others, 1997), whilesecondary caries was only diagnosed in 2% of the casesafter up to nine years’ observation periods. After nineyears, secondary caries comprised 11%, making a totalfailure due to secondary caries of 5%. The differences inthe reasons for failure of restorations in controlled clin-ical trials and in practice-based studies are amazing(Mjör, 2001).
Although the clinical diagnosis of secondary caries ispoorly defined and shows great variations in diagnosticagreement between clinicians, it has remained themain reason for replacement of all types of restorationsover the last century. Relevant, modern textbooks pro-vide little information on this major issue in clinicaldentistry. Therefore, a short, critical assessment of thediagnosis will be presented.
Diagnosis of Secondary Caries Lesions
It has repeatedly been pointed out that the nature ofsecondary caries lesions has not been studied in detail
(Özer & Thylstrup, 1995; Mjör, 2005). Review papers,supported by case reports, indicate that the lesions arelimited and localized and, therefore, lend themselves torepair without the need for replacement of the entirerestoration (Mjör & Toffenetti, 2000; Mjör & Gordan,2002; Mjör, 2005). “Microleakage,” which is often incor-rectly associated with the clinical diagnosis of sec-ondary caries, has no clinical support or even in vitrofoundation related to secondary caries (Goldberg & oth-ers, 1981; Merrett & Elderton, 1984; Söderholm,Antonson & Fishlschweiger, 1989; Özer & Thylstrup,1995; Mjör & Toffenetti, 2000). This term should be lim-ited to results from in vitro permeability studies, andthese should not be extrapolated to be valid for in vivoconditions without clinical evidence (Özer & Thylstrup,1995; Sá & others, 2004).
Taking into account the magnitude, consequences andsignificance, including the financial implications of thediagnosis of secondary caries in general dental practice,it is astounding that few detailed studies have beendevoted to the etiology of secondary caries.
Based on the literature reviewed in this paper andrelated publications (Mjör & Toffenetti, 2000; Mjör2005), case reports and clinical experience, the mostimportant points relevant to the clinical diagnosis ofsecondary caries may be summarized as follows:
1. Secondary caries lesions are, per definition, locat-ed at the tooth-restoration junction; the lesionsstart and develop at this surface location; it doesnot selectively progress into the tooth/restorationinterface.
2. The lesions are diagnosed gingivally in about 90%or more of all cases recorded and usually as aresult of an explorer “catch,” often without thepossibilities for direct visual inspection, ratherthan by carefully exploring the softness of the tis-sues involved.
Figure 4. The cavity preparation included the two lesionsshown in Figure 3. Note that the “secondary caries lesion”was a limited, stained, localized, surface defect at themargin of the restoration.
Figure 5. The gingival defects shown in Figure 3 after thelesions were restored/repaired.
Dow
nloaded from http://m
eridian.allenpress.com/operative-dentistry/article-pdf/30/4/1/1819389/1559-2863-30-4-1.pdf by guest on 12 January 2022

413Reasons for Replacement of Restorations
3. The lesions can be diagnosed radiographically,provided a radiopaque restorative material doesnot obstruct the x-rays.
4. The bacteriology of secondary caries lesions issimilar to that of primary caries lesions.
5. Overhangs of any size located interproximallypredispose to the development of secondary carieslesions due to predisposition for plaque accumu-lation.
6. No well-defined, objective clinical criteria fordiagnosing secondary caries lesions have beenpresented.
7. Poor agreement between clinicians has beenfound in in vivo and in vitro studies diagnosingsecondary caries lesions.
8. Clinical studies have shown that the diagnosis ofsecondary caries associated with tooth-coloredrestorations is difficult to differentiate fromstained margins.
9. Leaching of fluorides from restorative materialsdoes not result in a lower frequency of clinicallydiagnosed caries lesions compared to non-fluoridereleasing materials.
10. Crevices at the restoration-tooth interfaces areunrelated to the development of secondary carieslesions, except when the crevices are large.
11. “Microleakage” is unrelated to the development ofsecondary caries lesions.
12. Degraded, “ditched” restoration margins, whichare characteristically found on the occlusal part ofrestorations, do not lead to the development ofsecondary caries lesions.
Based on the findings outlined in these 12 points, ithas been concluded that secondary caries lesions arethe same as primary caries lesions, the only differencebeing that the lesions are located adjacent to restora-tions (Özer, 1997; Mjör & Toffenetti, 2000; Mjör, 2005).The accumulation of cariogenic plaque is the funda-mental etiological factor for the development of pri-mary and secondary caries lesions (Özer & Thylstrup,1995). As a consequence, the same diagnostic criteriashould be used for primary and secondary carieslesions, including a differentiation between active andarrested lesions.
Radiolucency of the hard tissues involved is a commonfinding for both primary and secondary caries lesions,but radiopaque restorative materials may make thediagnosis of secondary lesions difficult or impossible.Active caries lesions are diagnosed clinically by carefulprobing to detect softening of the mineralized tissues,and by visual examination to assess discoloration andwetness of the tissues involved (Kidd, Joyston-Bechal &Beighton, 1993; Kidd & Beighton, 1996). Cavitation
occurs as the lesion progresses. However, no investiga-tions are available to show the progression of secondarycaries lesions, and such studies are urgently needed. Ifthe progression is like that for primary caries lesions(Shwartz & others, 1984), secondary caries will take upto four years before they progress through enamel in apopulation exposed to fluoride, for example, fluoridetoothpaste. At any rate, it must be acknowledged thatit takes time to develop caries lesions. Provided thecavosurface margins were caries-free at the time therestoration was placed, it is unlikely that caries willdevelop within a short time, especially when it is asso-ciated with fluoride-releasing materials. It is, therefore,unlikely that the diagnosis of secondary caries on glassionomer restorations after less than two years (Mjör,Dahl & Moorhead, 2000a) really is caries. They prob-ably represent localized defects other than caries. If allthese defects diagnosed clinically as secondary carieslesions, in fact, were carious, fluoride release fromrestorative materials should have a beneficial effect.
Arrested caries lesions may not be radiolucent due toremineralization of a previously active lesion.Furthermore, an arrested lesion appears characteristi-cally dark brown, hard and dry. It is important to dif-ferentiate between arrested and actively progressinglesions, because the arrested lesions do not requireoperative treatment except to improve esthetics whenapplicable.
The outlined criteria for the diagnosis of secondarycaries are similar to that used to diagnose primarycaries lesions. If they are adopted, they are likely to sig-nificantly reduce the number of lesions diagnosed and,therefore, fewer restorations will be replaced. A repairoption must always be considered in the treatment ofsecondary caries lesions (Mjör & Gordan, 2002; Gordan& others, 2003; Blum & others, 2003; Mjör, 2005).Repair of restorations is also in line with the conceptsof minimal intervention (Mjör, 2003).
LONGEVITY OF RESTORATIONS
The longevity of restorations is closely linked to theirreplacement rate; it being lower in the primary denti-tion and in the permanent teeth of adolescents ratherthan in adults (Qvist & others, 1990a,b; Mjör & others,2000). The diagnoses of failures are critical in studiesof longevity of restoration. However, no generallyaccepted, objective guidelines have been forwarded forwhat degree of failure constitutes conditions that willcause future damage to the tooth involved.
Apart from patient age, factors such as oral hygiene,access to fluorides and other caries preventive agents,oral habits, difficult conditions during placement of therestorations and the size of restoration will each poten-tially have an effect on the replacement rate of restora-tions. Furthermore, patient factors such as oral
Dow
nloaded from http://m
eridian.allenpress.com/operative-dentistry/article-pdf/30/4/1/1819389/1559-2863-30-4-1.pdf by guest on 12 January 2022

414 Operative Dentistry
hygiene seem to influence the choice of materials andpossibly the replacement rate (Burke & others, 2001).The type of reimbursement system for services mayalso play a role (Mjör & others, 2000a; Burke & others,2001). Clinician gender has also been indicated in onestudy to be a factor affecting the longevity of restora-tions, especially tooth-colored restorations (Mjör & oth-ers, 2000a), as well as the clinicians’ experience,expressed as years since graduation (Mjör & others,2002). The physical properties of the restorative mate-rial also play a role, but often not as decisively as it isoften believed. In general, tooth-colored restorationshave a shorter longevity than metal restorations. Thesingle most important factor seems to be the skill of theoperator, not only technically, but also diagnostically.
CONCLUDING REMARKS
The etiology of reasons for failures and reasons for thereplacement of restorations will vary depending onmany factors. These restorations will change with thecontinuous development of operative dentistry.Practice-based studies should, therefore, be conductedat regular, predetermined time intervals to monitorchanges that occur. The results from such surveys areimportant, not only for the practitioners, but also forupdating teaching programs and for information tomanufacturers of restorative materials.
The total body of practice-based evidence emphasizesthe importance of clinically diagnosed secondary carieslesions. However, little information is available on thenature of “secondary caries” and, based on literaturereviews and practice-based data, it is evident that notall clinically diagnosed secondary lesions are true carieslesions. In this context it is important to keep in mindthat the explorer, a major diagnostic tool in the detec-tion of secondary caries lesions, will catch in any creviceand narrow space whether or not caries is present.Strict criteria for diagnosing secondary caries lesionsmust be established, and it should be basically similarto that used to diagnose primary caries. In this context,it is important to distinguish between diagnosing thelesions as a result of disease or as part of treatmentplanning, which refers to decisions about clinical proce-dures to remedy the lesion diagnosed.
Acknowledgement
This review was supported in part by grant #DE13412-03 fromthe NIDCR/NIH.
References
Bader JD & Shugars DA (1992) Understanding dentists’ restora-tive treatment decisions Journal of Public Health Dentistry 52102-110.
Bader JD & Shugars DA (1993) Agreement among dentists’ rec-ommendations for restorative treatment Journal of DentalResearch 72 891-896.
Black GV (1908) A Work on Operative Dentistry Vol II TheTechnical Procedures in Filling Teeth Chicago Medico-DentalPublishing Co.
Blum I, Schriever A, Heidemann D, Mjör IA & Wilson NHF(2003) The repair of direct composite restorations: An interna-tional study of the teaching of operative techniques and mate-rials European Journal of Dental Education 7 41-48.
Boyd MA (1989) Amalgam replacement: Are decisions based onfact or tradition? In Anusavice KJ (ed) Quality Evaluation ofDental Restorations Chicago Quintessence 73-80.
Burke FJT, Cheung SW, Mjör IA & Wilson NHF (1999)Restoration longevity and analysis of reasons for the place-ment and replacement of restorations provided by vocationaldental practitioners and their trainers in the United KingdomQuintessence International 30 234-242.
Burke FJT, Wilson NHF, Cheung SW & Mjör IA (2001) Influenceof patient factors on age of restoration at failure and reasonsfor the placement and replacement of restorations Journal ofDentistry 29 317-324.
Burke FJT, Wilson NHF, Cheung SW & Mjör IA (2002) Influenceof the method of funding on age of failed restorations in gener-al practice in the UK British Dental Journal 192 699-702.
Clark TD & Mjör IA (2001) Current teaching of cariology inNorth American dental schools Operative Dentistry 26(3) 412-418.
Dahl JE & Eriksen HM (1978) Reasons for replacement of amal-gam restorations Scandinavian Journal of Dental Research 86404-407.
Delgeorgi V, Wilson NHF, Fouzas D, Kouklaki E, Burke FJT &Mjör IA (2000) Reasons for placement and replacement ofrestorations in student clinics in Manchester and AthensEuropean Journal of Dental Education 4 153-159.
Eklund SA (1999) Changing treatment patterns Journal of theAmerican Dental Association 130 1707-1712.
Espelid I & Tveit AB (1991) Diagnosis of secondary caries andcrevices adjacent to amalgam International Dental Journal 41359-364.
Gilbert G (2004) Unpublished summary of enrollment forms onwww.DentalPBRN.org
Gordan VV, Mjör IA, Blum IR & Wilson NHF (2003) Teachingstudents the repair of resin-based composite restorations: Asurvey of North American dental schools Journal of theAmerican Dental Association 134 317-23.
Goldberg J, Tanzer J, Munster E, Amara J, Thal F & BirkheadD (1981) Cross-sectional clinical evaluation of recurrent enam-el caries, restoration of marginal integrity, and oral hygienestatus Journal of the American Dental Association 102 635-641.
Healy HJ & Philips RW (1949) A clinical study of amalgam fail-ures Journal of Dental Research 28 439-446.
Kidd EAM & Beighton D (1996) Prediction of secondary cariesaround tooth-colored restorations: A clinical and microbiologi-cal study Journal of Dental Research 75 1942-1946.
Kidd EAM & O’Hara JW (1990) Caries status of occlusal amal-gam restorations with marginal defects Journal of DentalResearch 69 1275-1277.
Dow
nloaded from http://m
eridian.allenpress.com/operative-dentistry/article-pdf/30/4/1/1819389/1559-2863-30-4-1.pdf by guest on 12 January 2022

415Reasons for Replacement of Restorations
Kidd EAM, Joyston-Bechal, S & Beighton D (1993) Microbialvalidation of assessments of caries activity during cavitypreparation Caries Research 27 402-408.
Kidd EAM, Joyston-Bechal, S & Beighton D (1994) Diagnosis ofsecondary caries: A laboratory study British Dental Journal176 135-139.
Kidd EAM, Joyston-Bechal S & Beighton D (1995) Marginalditching and staining as a predictor of secondary caries aroundamalgam restorations: A clinical and microbiological studyJournal of Dental Research 74 1206-1211.
Klausner LH, Green TG & Charbeneau GT (1987) Placementand replacement of amalgam restorations: A challenge for theprofession Operative Dentistry 12 102-112.
Letzel H, Van T Hof MA, Marshall GW & Marshall SJ (1997)The influence of amalgam alloy on the survival of amalgamrestorations: A secondary analysis of multiple controlled clini-cal trials Journal of Dental Research 76 1787-1798.
Maryniuk GA (1990) Practice variation: Learned and socioeco-nomic factors Advances in Dental Research 4 19-24.
Merrett MCW & Elderton RJ (1984) An in vitro study of restora-tive dental treatment decisions and dental caries BritishDental Journal 157 128-133.
Mjör IA (1979) [Orsaker till revision av fyllningar]Tandläkartidningen 71 552-556.
Mjör IA (1981) Placement and replacement of restorationsOperative Dentistry 6 49-54.
Mjör IA (1985) The frequency of secondary caries at variousanatomical locations Operative Dentistry 10 88-92.
Mjör IA (1997) The reasons for replacement and the age of failedrestorations in general dental practice Acta OdontologicaScandinavica 55 58-68.
Mjör IA (2001) The basis for everyday, real life operative den-tistry Operative Dentistry 26(6) 521-524.
Mjör IA (2003) Repair of restorations Oral Health Prevention inDentistry 1 70-72. Part of Ericson D, Kidd E, McComb D, MjörI & Noack MJ (2003) Minimally invasive dentistry–conceptsand techniques in cariology Oral Health Prevention inDentistry 1 59-72.
Mjör IA (2005) The clinical diagnosis of recurrent caries Journalof the American Dental Association (submitted).
Mjör IA, Dahl JE & Moorhead JE (2000a) The age of restora-tions at replacement in permanent teeth in general dentalpractice Acta Odontologica Scandinavica 58 97-101.
Mjör IA & Espevik S (1980) Assessment of variables in clinicalstudies of amalgam restorations Journal of Dental Research59 1511-1515.
Mjör IA & Gordan VV (2002) Failure, repair, refurbishing, andlongevity of restorations Operative Dentistry 27(6) 528-534.
Mjör IA, Moorhead JE & Dahl JE (2000b) Reasons for replace-ment of restorations in permanent teeth in general dentalpractice International Dental Journal 50 360-366.
Mjör IA & Qvist V (1997) Marginal failures of amalgam andcomposite restorations Journal of Dentistry 7 25-30.
Mjör IA, Shen C, Eliasson ST & Richter S (2002) Placement andreplacement of restorations in general dental practice inIceland Operative Dentistry 27(2) 117-123.
Mjör IA & Toffenetti F (2000) Secondary caries: A literaturereview with case reports Quintessence International 31 165-179.
Mjör IA & Wilson NHF (1998) The teaching of Class I and ClassII direct composite restorations in North American dentalschools Journal of the American Dental Association 129 1415-1421.
Özer L (1997) The relationship between gap size, microbial accu-mulation and the structural features of natural caries inextracted teeth with Class II amalgam restorations Universityof Copenhagen Thesis.
Özer L & Thylstrup A (1995) What is known about caries in rela-tion to restorations as a reason for replacement? A reviewAdvances in Dental Research 9 394-402.
Pimenta LAF, Navarro MFL & Consolaro A (1995) Secondarycaries around amalgam restorations Journal of ProstheticDentistry 74 133-142.
Qvist V, Laurberg L, Poulsen A & Teglers PT (2004a) 8-yearstudy on conventional glass ionomer and amalgam restora-tions in primary teeth Acta Odontologica Scandinavica 62 37-45.
Qvist V, Laurberg L, Poulsen, A & Teglers PT (2004b) Class IIrestorations in primary teeth: 7-year study on three resin-modified glass ionomer cements and a compomer EuropeanJournal of Oral Science 128 188-196.
Qvist V, Manscher E & Teglers PT (2004c) Resin-modified andconventional glass ionomer restorations in primary teeth: 8-year results Journal of Dentistry 76 1387-1397.
Qvist J, Qvist V & Mjör IA (1990a) Placement and longevity ofamalgam restorations in Denmark Acta OdontologicaScandinavica 48 297-303.
Qvist V, Qvist J & Mjör IA (1990b) Placement and longevity oftooth-colored restorations in Denmark Acta OdontologicaScandinavica 48 305-311.
Sá LT, Gonzalez-Cabezas C, Cochran MA, Fontana M, Matis BA& Moore BK (2004) Fluoride releasing materials: Their anti-cariogenic properties tested in in vitro caries models OperativeDentistry 29(5) 524-531.
Setcos JC, Khosravi R, Wilson NHF, Shen C, Yang M & Mjör IA(2004) Repair and replacement of amalgam restorations:Decisions at a USA and a UK dental school OperativeDentistry 29(3) 392-397.
Shwartz M, Gröndahl H-G, Pliskin JS & Boffa J (1984)Longitudinal analysis from bite-wing radiographs of the rateof progression of approximal carious lesions through humanenamel Archives of Oral Biology 29 529-536.
Söderholm K-J, Antonson DE & Fishlschweiger W (1989)Correlation between marginal discrepancies at the amal-gam/tooth interface and recurrent caries In Anusavice KJ (ed)Quality Evaluation of Dental Restorations ChicagoQuintessence 85-108.
Tveit AB & Espelid I (1986) Radiographic diagnosis of caries andmarginal defects in connection with radiopaque composite fill-ings Dental Materials 2 159-162.
Tveit AB & Espelid I (1992) Class II amalgams: Interobservervariations in replacement decisions and diagnosis of cariesand crevices International Dental Journal 42 12-18.
Tyas MJ (1991) Cariostatic effect of glass ionomer cement: Afive-year clinical study Australian Dental Journal 36 236-239.
Dow
nloaded from http://m
eridian.allenpress.com/operative-dentistry/article-pdf/30/4/1/1819389/1559-2863-30-4-1.pdf by guest on 12 January 2022

416 Operative Dentistry
Wahl MJ, Schmitt MM, Overton DA & Gordon MK (2004)Prevalence of cusp fractures in teeth restored with amalgamand with resin-based composite Journal of the AmericanDental Association 135 1127-1132.
Wilson NHF & Mjör IA (2000) The teaching of Class I and ClassII direct composite restorations in European dental schoolsJournal of Dentistry 26 15-21.
Wilson NHF, Burke FJT & Mjör IA (1997) The reasons for place-ment and replacement of direct restorative materials by aselect group of practitioners in the UK QuintessenceInternational 28 245-248.
Dow
nloaded from http://m
eridian.allenpress.com/operative-dentistry/article-pdf/30/4/1/1819389/1559-2863-30-4-1.pdf by guest on 12 January 2022

SUMMARY
This study evaluated the in vivo effects ofbleaching agents containing 10% carbamide per-oxide (Platinum/Colgate) or 7.5% hydrogen per-oxide (Day White 2Z/Discus Dental) on mutansStreptococcus during dental bleaching. The prod-ucts were applied on 30 volunteers who neededdental bleaching. In each volunteer, one of thetwo bleaching agents was used on both dentalarches one hour a day for three weeks. Analysisof the bacterial counts was made by collecting
saliva before (baseline values), during (7 and 21days) bleaching treatments and 14 days post-treatment. The Friedman non-parametricanalysis (α=0.05) found no differences in micro-organism counts at different times for each groupfor both agents (p>0.05). The Mann Whitney non-parametric test (α=0.05) showed no differences inmicro-organism counts for both agents (p>0.05).Different bleaching agents did not change theoral cavity mutans Streptococcus counts.
INTRODUCTION
Haywood and Heymann (1989) introduced the homevital tooth bleaching technique with 10% carbamideperoxide. Since then, this method has been widelyused, because it is a simple and efficient procedure forremoving intrinsic and extrinsic stains from teeth(Haywood, 1994).
Different products and tooth bleaching systems havebeen introduced, such as the use of other concentra-tions of carbamide peroxide (16% to 22%), hydrogenperoxide and over-the-counter products. However, car-bamide peroxide at 10% seems to be the most effectiveand safest, as well as having the American Dental
Yara Tardelli Alkmin, graduate student, School of Dentistry,Hermínio Ometto University Center (UNIARARAS), Araras-SP, Brazil
Renata Sartorelli, graduate student, School of Dentistry,Hermínio Ometto University Center (UNIARARAS), Araras-SP, Brazil
Flávia Martão Flório, DDS, MS, ScD, professor, DentistryResearch Center São Leopoldo Mandic, Campinas-SP, Brazil
*Roberta Tarkany Basting, DDS, MS, ScD, PhD, professor,Dentistry Research Center São Leopoldo Mandic, Campinas-SP, Brazil
*Reprint request: Rua José Rocha Junqueira, 13, Campinas—SP,CEP: 13045-620, Brazil; e-mail: [email protected]
©Operative Dentistry, 2005, 30-4, 417-423
Comparative Study of theEffects of Two Bleaching Agents
on Oral Microbiota
YT Alkmin • R SartorelliFM Flório • RT Basting
Clinical Relevance
While being a simple and effective procedure for achieving dental aestetics, 10% car-bamide peroxide and 7.5% hydrogen peroxide agents do not provide changes in theStreptococcus mutans counts during bleaching procedures.
Clinical Research
Dow
nloaded from http://m
eridian.allenpress.com/operative-dentistry/article-pdf/30/4/1/1819389/1559-2863-30-4-1.pdf by guest on 12 January 2022

418 Operative Dentistry
Association (ADA) approval for some products(Haywood & Robinson, 1997).
Alterations in enamel and dentin mineral content,due to the acid properties of these materials (Ben-Amar& others, 1995; Ernst, Marroquin & Willerhausen-Zönnchen, 1996; Leonard, Bentley & Haywood, 1994;Murchinson, Charlton & Moore, 1992; Smidt, Weller &Roman, 1998; Zalkind & others, 1996), may occur. Lossof mineral content or demineralization alters themicrohardness of enamel and dentin (Featherstone,ten Cate & Shariati, 1983; Rotstein & others, 1996)despite the presence of saliva, fluorides or other rem-ineralizing solutions, which are capable of maintainingthe balance between the de- and remineralizationprocesses. However, few in vivo research reports havebeen found that focus on oral microbiota and on the useof bleaching agents, mainly on the pathogenic bacteriaof dental caries (Streptococcus mutans, total andLactobacillus).
Gürgan, Bolay and Alacam (1997) proved, in vitro, asignificant decrease in the adherence of Streptococcusmutans on the surface of tooth enamel with the use of10% carbamide peroxide. Bentley, Leonard andCrawford (2000) reported a bacteriostatic effect of onStreptococcus mutans and Lactobacillus when sub-mitted to the action of 10% carbamide peroxide in vitroand a decrease in the salivary levels of Lactobacilluswhen analyzed in vivo.
Firestone, Schmid and Mühlemann (1982) assessedthe action of hydrogen peroxide on periodontal tissues,tooth surfaces and the oral pH of rats. A reduction inthe accumulation of bacterial plaque, the incidence ofcaries and decreased pH was noted.
However, in vivo studies regarding the action of 10%carbamide peroxide or 7.5% hydrogen peroxide on thebacteria responsible for dental caries are absent in theliterature.
This study analyzed, in vivo, the effects of two bleachingagents containing 10% carbamide peroxide and 7.5%hydrogen peroxide on the oral microbiota(Streptococcus mutans and total) at different times(before, during and after bleaching treatment).
METHODS AND MATERIALS
Experimental Design
The factors under study were:
Bleaching Agents at Two Levels: a bleaching agent con-taining 7.5% hydrogen peroxide (Day White 2Z/DiscusDental Inc, Culver City, CA, USA) and one containing10% carbamide peroxide (Platinum/Colgate-PalmoliveCompany, New York, NY, USA).
Bleaching Time at Four Levels: baseline, 7 and 21 daysof treatment, and 14 days post-treatment period (corre-sponding to 35 days after beginning the bleaching treat-ment). At these times, saliva was collected to evaluateoral microbiota.
The experimental units consisted of stimulatedhuman saliva collection from 30 volunteers, consideringeach volunteer as a block. The volunteers were ran-domly divided and submitted to a home-used dentalbleaching treatment with 7.5% hydrogen peroxideagent or a 10% carbamide peroxide product for threeweeks. The response variable, Mutans Streptococcicolony forming units per mL saliva (CFU/mL), wasquantitatively evaluated.
The basic principles of experimental design—repeti-tion, randomization and blocking—were followed,according to Montgomery (1996).
Material Specifications
Two different brands of home-use bleaching agentswere evaluated: Day White 2Z/Discus Dental (DW),which contains 7.5% hydrogen peroxide andPlatinum/Colgate (PLA), which contains 10% car-bamide peroxide. Table 1 presents their composition,batch number and manufacturer.
Preparation of the Volunteers for the ExperimentalPhase
The volunteers were 30 adults (23 women and 7 men)ranging in age from 18 to 25 years. Each volunteer wasinformed about the goals, benefits and possible risksinvolved in this experiment and participated only afterproviding formal written consent. This study had theapproval of the Uniararas Ethical Committee
Material Composition* Batch # Manufacturer
Day White 2Z 7.5% hydrogen peroxide, carbopol, 02352012 Discus Dental, Inccoloring, flavoring 02354056 Culver City, CA, USA
02281025
Platinum 10% carbamide peroxide, flavoring, 301002 Colgate-Palmolivewater, calcium pyrophosphate, 208001 Company, New York,polossamero 407, PEG-12, PEG-2M, NY, USAglycerin, calcium phosphate dihydrate,sodium pyrophosphate acid, sodiumlaurel Sulphate, sodium saccharine,EDTA- disodium dihydrate.
*According to the manufacturer.
Table 1: Composition, Batch Number and Manufacturer of Each Material Used in This Study
Dow
nloaded from http://m
eridian.allenpress.com/operative-dentistry/article-pdf/30/4/1/1819389/1559-2863-30-4-1.pdf by guest on 12 January 2022

Guidelines, in agreement with the National HealthCouncil (Brazil, 1996).
The volunteers who were candidates for bleachingtreatment were graduate students from the DentistrySchool of Uniararas, Araras, Brazil. Each volunteer’sneed for bleaching treatment was assessed, and onlythose who had esthetic or pathologic reasons wereselected. The tooth color assessment was made by usinga Vita shade guide (Vita Zahnbabrik, H= Rauter GmbH& Co KG, Bad Säckingen, Germany) and was alsorecorded through photographs to provide a comparisonbetween the initial and final color achieved. Inclusioncriteria included: tooth color A2 or higher, tetracyclinestain degrees I and II, fluorosis with brown discol-oration and physiological dark stains. Exclusion cri-teria for participation in this study included: volunteerswho wore fixed or removable dentures or orthodonticappliances, pregnant or nursing women, smokers, vol-unteers with dentin sensitivity, those ingesting medi-cines that would decrease salivary flow or those indi-viduals who used any microbial agent for the threemonths prior to the start of the study.
Top and bottom dental arch impressions were takenwith alginate (Jeltrate/Dentsply Caulk, Milford, DE,USA) and stone cast molds were made (Vigodent, Riode Janeiro, RJ, Brazil). The maxillary casts were horse-shoe shaped without a palate to avoid interference withvacuum pull efficiency on the hot thermoplastic sheet.In the molds, vestibular reservoirs with three coatingsof nail varnish (Colorama/CEIL Com Exp Ind Ltda, SãoPaulo, SP, Brazil) were prepared for all teeth for bleachingagent deposition. A scalloped tray was manufacturedfor each volunteer in a vacuum forming machine(P7/Bio-Art Equip Odontológicos Ltda, São Carlos, SP,Brazil) using a 1.0-mm thick flexible ethyl vinyl acetatepolymer (Bio-Art Equip Odontológicos Ltda). The trayswere trimmed and polished up to the cervical margin ofthe teeth, restricting the bleaching agent action to theteeth.
Two weeks before the experiment began, toothbrushes(Oral B P30/Gillette do Brasil Ltda, Manaus, AM,Brazil) and sodium fluoride dentifrices (1100 ppm)(Sorriso/Colgate Ltda, Osasco, SP, Brazil) were given tothe volunteers. They were instructed on how to performthe Bass dental hygiene technique to standardize thetoothbrushing method and fluoride levels in the mouth.This phase was called the run-in period and lasted fortwo weeks. The volunteers were asked for a daily dietform for mapping their food habits starting from therun-in period through to final saliva collection.
The 30 volunteers were randomly divided into twoequal groups of 15. One group received the 7.5% car-bamide peroxide bleaching agent (DW), while the other
received the 10% carbamide peroxide bleaching agent(PLA).
Saliva Collections
Microbiological Samples
The morning prior to starting bleaching treatment,whole saliva samples were collected in sterile tubesfrom each of the volunteers after stimulation in order toassess the Mutans Streptococci (MS) levels in saliva.Volunteers were asked to chew on a piece of paraffinwax until it attained the soft consistency of chewinggum. They swallowed any saliva present in the mouth,chewed on the paraffin for an additional minute, usingboth sides of the mouth and intermittently spat salivainto a sterile glass tube (Dasanayake & others, 1995).
All the samples were placed on ice and plated withinthree hours. Most samples were processed within 90minutes of collection.
Bacteriological Methods
The samples were dispersed by vortex (Wan & others,2001a,b; 2003) for 60 seconds to disperse bacteriam,then submitted to 10-fold dilutions in saline solution(0.9% NaCl) through 10-4. Aliquots of 5 µL of each dilu-tion were spread on small Petri dishes (5x2 cm), induplicate, containing Mitis Salivarius Agar (Difco Co,Detroit, MI, USA) supplemented with two IU of baci-tracin/ml (Sigma Chemical Co, St Louis, MO, USA), 1%potassium tellurite (Sigma Chemical Co) and 15%sucrose (Synth, Diadema, SP, Brazil) for MS cultivation(MSB) (Gold, Jordan & Van Houte, 1973). All plateswere incubated under anaerobic conditions (37°C, 10%CO2) for 48 hours.
Thereafter, a stereoscopic microscope was used toverify the presence of colony-forming units (CFU)resembling MS. They were distinguished by their molarand granular frosted glass-like formation, adherentgrowth in agar and production of glucans surroundingcolonies (Emilson, 1983). MS Counts were consideredas baseline.
Bleaching Agents Protocol
The volunteers were instructed to put the correspon-ding bleaching agents in the trays and wear them forone hour during the day, concurrently for both arches.Directions were given to avoid consuming foods or bev-erages while using the tray and cleaning it after takingit out of the mouth and storing it in the container pro-vided. The volunteers were instructed to apply thebleaching agent for 21 days and were monitoredweekly for the presence of tooth sensitivity or gingivalirritation.
On the seventh and twenty-first days, saliva collec-tions were performed. Upon completion of the treat-ment, another saliva collection was performed after 14
Alkmin & Others: Effects of Bleaching Agents on Oral Microbiota 419
Dow
nloaded from http://m
eridian.allenpress.com/operative-dentistry/article-pdf/30/4/1/1819389/1559-2863-30-4-1.pdf by guest on 12 January 2022
420 Operative Dentistry
days (corresponding to 35 days from the start of thetreatment).
Statistical Analysis
To compare differences among the various saliva collec-tion times for each group, the data of volunteers whomissed some of the collections were excluded. For PLA,seven volunteers were excluded due to problems withsensitivity or lack of compliance, while one volunteerwas discarded from group DW.
Means, standard deviations and confidence intervals(95% CI) were determined for all data. The MS levels inCFU/mL of volunteers’ saliva were converted into loga-rithm (log10) for statistical analyses. Non-parametricanalysis were used to compare bacteriological countsfor each bleaching agent over time and between prod-ucts.
RESULTS
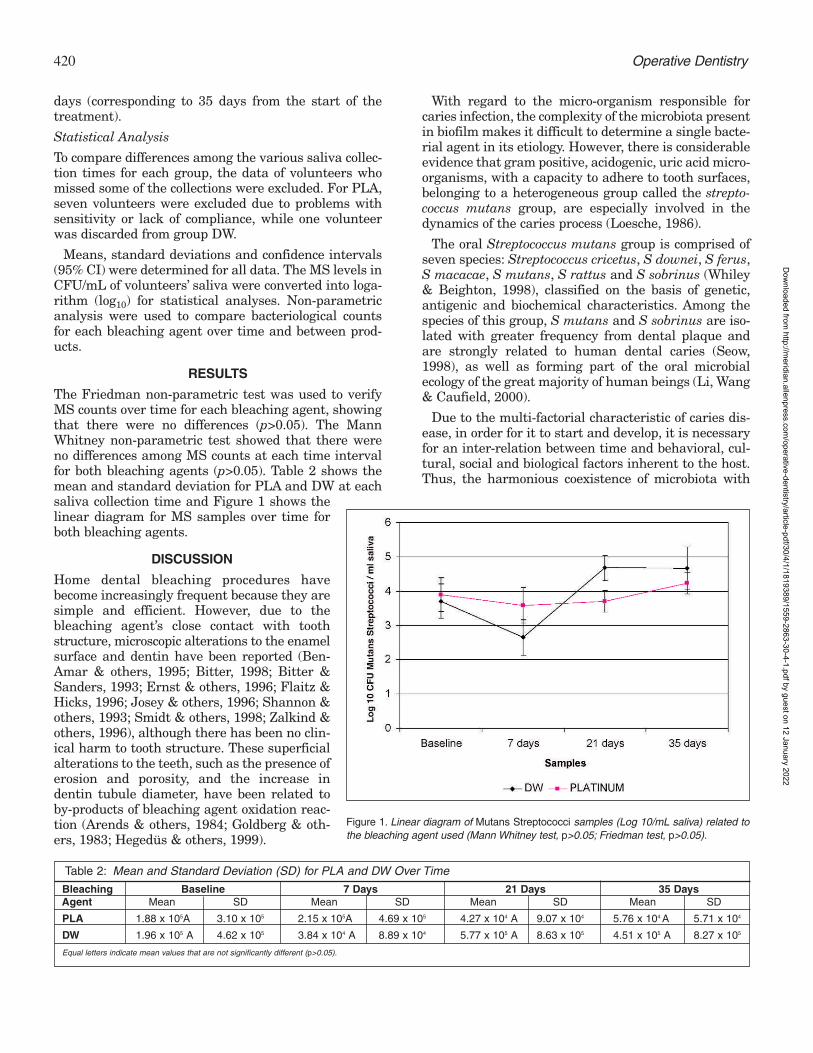
The Friedman non-parametric test was used to verifyMS counts over time for each bleaching agent, showingthat there were no differences (p>0.05). The MannWhitney non-parametric test showed that there wereno differences among MS counts at each time intervalfor both bleaching agents (p>0.05). Table 2 shows themean and standard deviation for PLA and DW at eachsaliva collection time and Figure 1 shows thelinear diagram for MS samples over time forboth bleaching agents.
DISCUSSION
Home dental bleaching procedures havebecome increasingly frequent because they aresimple and efficient. However, due to thebleaching agent’s close contact with toothstructure, microscopic alterations to the enamelsurface and dentin have been reported (Ben-Amar & others, 1995; Bitter, 1998; Bitter &Sanders, 1993; Ernst & others, 1996; Flaitz &Hicks, 1996; Josey & others, 1996; Shannon &others, 1993; Smidt & others, 1998; Zalkind &others, 1996), although there has been no clin-ical harm to tooth structure. These superficialalterations to the teeth, such as the presence oferosion and porosity, and the increase indentin tubule diameter, have been related toby-products of bleaching agent oxidation reac-tion (Arends & others, 1984; Goldberg & oth-ers, 1983; Hegedüs & others, 1999).
With regard to the micro-organism responsible forcaries infection, the complexity of the microbiota presentin biofilm makes it difficult to determine a single bacte-rial agent in its etiology. However, there is considerableevidence that gram positive, acidogenic, uric acid micro-organisms, with a capacity to adhere to tooth surfaces,belonging to a heterogeneous group called the strepto-coccus mutans group, are especially involved in thedynamics of the caries process (Loesche, 1986).
The oral Streptococcus mutans group is comprised ofseven species: Streptococcus cricetus, S downei, S ferus,S macacae, S mutans, S rattus and S sobrinus (Whiley& Beighton, 1998), classified on the basis of genetic,antigenic and biochemical characteristics. Among thespecies of this group, S mutans and S sobrinus are iso-lated with greater frequency from dental plaque andare strongly related to human dental caries (Seow,1998), as well as forming part of the oral microbialecology of the great majority of human beings (Li, Wang& Caufield, 2000).
Due to the multi-factorial characteristic of caries dis-ease, in order for it to start and develop, it is necessaryfor an inter-relation between time and behavioral, cul-tural, social and biological factors inherent to the host.Thus, the harmonious coexistence of microbiota with
Bleaching Baseline 7 Days 21 Days 35 DaysAgent Mean SD Mean SD Mean SD Mean SD
PLA 1.88 x 10⁵A 3.10 x 10⁵ 2.15 x 10⁵A 4.69 x 10⁵ 4.27 x 10⁴ A 9.07 x 10⁴ 5.76 x 10⁴ A 5.71 x 10⁴
DW 1.96 x 10⁵ A 4.62 x 10⁵ 3.84 x 10⁴ A 8.89 x 10⁴ 5.77 x 10⁵ A 8.63 x 10⁵ 4.51 x 10⁵ A 8.27 x 10⁵
Equal letters indicate mean values that are not significantly different (p>0.05).
Table 2: Mean and Standard Deviation (SD) for PLA and DW Over Time
Figure 1. Linear diagram of Mutans Streptococci samples (Log 10/mL saliva) related tothe bleaching agent used (Mann Whitney test, p>0.05; Friedman test, p>0.05).
Dow
nloaded from http://m
eridian.allenpress.com/operative-dentistry/article-pdf/30/4/1/1819389/1559-2863-30-4-1.pdf by guest on 12 January 2022

421Alkmin & Others: Effects of Bleaching Agents on Oral Microbiota
the host is disturbed the moment environmental alter-ations influence the balance of the oral eco-system andmakes the micro-organisms with better adaptive capa-bility begin to act as pathogens, predisposing the hostto disease (Marsh, 1991).
The formation of dental biofilm occurs in two distinctphases. During the first phase, proteins from the bac-terial surface interact with the host or with bacterialproducts adsorbed on the tooth surface. In the secondphase, bacteria accumulate in the biofilm by cell prolif-eration, the interaction between receptors and adesinesbetween micro-organisms of the same species or dif-ferent species and through the production of an extra-cellular polysaccharide matrix (Kolenbrander, 2000). Smutans secrete various proteins that may be involvedin tooth surface colonization mechanisms in processesdependent on and independent of sucrose (Hamada &Slade, 1980; Loesche, 1986; Steinberg & others, 1999).
Bacterial adherence to tooth surface is also dependenton properties of the surface on which it will beadsorbed. Some factors that may facilitate bacterialaccumulation on the tooth structure are brought aboutby the presence of surface roughness and electrostaticand hydrophobic interactions (Steinberg & others,1999). Bleaching agents may affect tooth structure,altering the biofilm formation process (Steinberg & oth-ers, 1999). Although Mc Guckin, Babin and Meyer(1992) had observed an increase in enamel surfaceroughness after using 10% carbamide peroxide,Gürgan and others (1997) showed that there were nodifferences between a bleached and non-bleached sur-face. Furthermore, the effects of 10% carbamide peroxideseem to minimize the adherence of Streptococcusmutans, Streptococcus sobrinus and Actinomisesviscosus (Steinberg & others, 1999), present a bacterio-static effect in vitro for Streptococcus mutans (Bentley& others, 2000; Gürgan, Bolay & Alacam, 1996),Streptococcus mitis, Streptococcus sanguis (Gürgan &others, 1996) and Lactobacillus (Bentley & others,2000; Gürgan & others, 1996) and reduce the salivarylevels of Lactobacillus in vivo (Bentley & others, 2000).These results indicate that bleaching agents containingcarbamide peroxide may present a beneficial effect tobe used as an anti-cariogenic agent. In opposition,Hosoya and others (2003), assessing the effect of vitalbleaching in an in vitro study, found an increase in bothenamel surface roughness and S mutans’ adherence tothe tooth surface.
In this in vivo study, the sample plan comprised 30dentistry graduate students, making up a homogenoussample with regard to adequate oral hygiene and fit-ting into a context of being motivated with regard tooral health. Therefore, the mean prevalence of thestreptococcus mutans group in this population duringbaseline collection was shown to be reduced, as noted in
Table 2 and Figure 1. This factor may have masked themore realistic results related to reductions in microbialcounts after application of the bleaching agents at theirdifferent times.
The study was carried out for five weeks—baseline(prior to bleaching treatment), 7 and 21 days ofbleaching treatment and 14 days after bleaching—inwhich saliva samples were collected to assess oralmicrobiota. The choice for quantifying the streptococcusmutans group in saliva was made because of its associ-ation with the prevalence and activity of dental caries(Gibbons & Houte, 1975; Loesche, 1986; Dasanayake &others, 1995; Bowden, 1996). The reduction in thenumber of these bacteria has been related to the controland prevention of the disease (Zickert, Emilson &Krasse, 1982; Gisselsson, Birkhed & Bjorn, 1988;Lindquist & others, 1989; Isokangas & others, 1991;Bowden, 1996). Furthermore, saliva is considered aniche representative of the oral colonization standard,as the count of its micro-organisms is pointed to as themain method used for the quantification of this micro-bial group (Dasanayake & others, 1995), there being adirect relation between its number and the number ofintra-oral sites colonized (Togelius & others, 1984;Dasanayake & others, 1995). Thus, the number ofmicro-organisms having been reduced or not as a resultof carrying out the treatment may indicate a conditionof reduction in the cariogenic potential of the bacterialbiofilm or of caries disease, although these parametershave not been measured.
The results obtained show that there were no differ-ences among the different times or between products,bearing in mind the lack of homogeneity of variance ofthe results. It is emphasized that, in the literature,there are no studies using this in vivo methodology forassessing the effect of bleaching agents containing 10%carbamide peroxide and 7.5% hydrogen peroxide on thestreptococcus mutans group. In an in vivo study,Bentley and others (2000) did not find the effects ofreduction in the streptococcus mutans group countswith the use of 10% carbamide peroxide, which may bethe result of the short period of exposure to peroxide(one hour per day for six weeks), loss of the active agentor even the possibility of the number of volunteersbeing insufficient (10 adults), as plausible justificationsfor this study.
Results of in vitro studies, although they contributevery important findings, may not be representative ofin vivo oral conditions since, under these conditions,the oral cavity is continually bathed by organic andinorganic salivary components that influence bacterialadhesion (Gürgan & others, 1997).
An important factor to consider for not finding alter-ations in the salivary microbial count relates to thetooth faces on which bleaching occurs. With special
Dow
nloaded from http://m
eridian.allenpress.com/operative-dentistry/article-pdf/30/4/1/1819389/1559-2863-30-4-1.pdf by guest on 12 January 2022

esthetic purposes, the elected faces are restricted to thevestibular surfaces of front teeth. It is known that thestreptococcus mutans group, weak initial colonizers,present greater affinity of adherence to retentive sur-faces, especially occlusal ones (Gonçalves & Flório,2003). This being the case, bleaching gel contact withthose tooth surfaces most colonized by the group occursthrough the compound diluted in oral fluids. Differentresults may have been obtained if the collection of bac-terial plaque had been done on different tooth surfacesand if the volunteers had halted the procedures ofmechanical dental biofilm removal during the treat-ment period.
CONCLUSIONS
Based on the results obtained, no alterations werefound in the streptococcus mutans group count duringbleaching treatment with bleaching agents containing10% carbamide peroxide or 7.5% hydrogen peroxide.
Acknowledgement
The authors are grateful for the financial support received fromFAPESP (Foundation for Research Support of São Paul o State).Grants: 02/08314-0.
(Received 8 July 2004)
References
Arends J, Jongebloed WL, Goldberg M & Schuthof J (1984)Interaction of urea and human enamel Caries Research 18(1)17-24.
Brasil (1996) Resolução no 196 Conselho Nacional de SaúdeBrasília, CNS.
Ben-Amar A, Liberman R, Gorfil C & Bernstein Y (1995) Effect ofmouthguard bleaching on enamel surface American Journal ofDentistry 8(1) 29-32.
Bentley CD, Leonard RH & Crawford JJ (2000) Effect of whiten-ing agents containing carbamide peroxide on cariogenic bacte-ria Journal of Esthetic Dentistry 12(1) 33-37.
Bitter NC (1998) A scanning electron microscope study of thelong-term effect of bleaching agents on the enamel surface invivo General Dentistry 46(1) 84-88.
Bitter NC & Sanders JL (1993) The effect of four bleaching agentson enamel surface: A scanning electron microscopic studyQuintessence International 24 817-824.
Bowden GH (1996) Mutans streptococci caries and chlorhexidineJournal of the Canadian Dental Association 62(9) 700, 703-707.Review.
Dasanayake AP, Caufield PW, Cutter GR, Roseman JM & KohlerB (1995) Differences in the detection and enumeration ofmutans streptococci due to differences in methods Archives ofOral Biology 40(4) 345-351.
Emilson CG (1983) Prevalence of Streptococcus mutans with dif-ferent colonial morphologies in human plaque and salivaScandinavian Journal of Dental Research 91(1) 26-32.
Ernst CP, Marroquin BB & Willershausen-Zönnchen B (1996)Effects of hydrogen peroxide-containing bleaching agents on
the morphology of human enamel Quintessence International27(1) 53-56.
Featherstone JDB, ten Cate JM & Shariati M (1983) Comparisonof artificial caries-like lesions by quantitative micro radi-ographic and microhardness profiles Caries Research 17 385-391.
Firestone AR, Schmid R & Mühlemann HR (1982) Effect of topi-cal application of urea peroxide on caries incidence and plaqueaccumulation in rats Caries Research 16 112-117.
Flaitz CM & Hicks MJ (1996) Effects of carbamide peroxidewhitening agents on enamel surfaces and caries-like lesion for-mation: A SEM and polarized light microscopic in vitro studyJournal of Dentistry for Children 63(4) 249-256.
Gibbons RJ & Houte JV (1975) Bacterial adherence in oral micro-bial ecology Annual Review Microbiology 29 19-44.
Gisselsson H, Birkhed D & Bjorn AL (1988) Effect of professionalflossing with chlorhexidine gel on approximal caries in 12- to15-year-old schoolchildren Caries Research 22(3) 187-192.
Gold OG, Jordan HV & Van Houte J (1973) A selective medium forStreptococcus mutans Archives of Oral Biology 18(11) 1357-1364.
Goldberg M, Arends J, Jongebloed WL & Schuthof J (1983) Actionof urea solutions on human enamel surfaces Caries Research17(2) 106-112.
Gonçalves RB & Florio FM (2003) [Ecologia microbiana da cavidadebucal] in Pereira AC et al Odontologia em saúde coletiva: Planejandoações e promovendo saúde 1ª edição—Porto Alegre Artmed.
Gürgan S, Bolay S & Alacam R (1997) In vitro adherence of bac-teria to bleached or unbleached enamel surfaces Journal ofOral Rehabilitation 24(8) 624-627.
Gürgan S, Bolay S & Alacam R (1996) Antibacterial activity of10% carbamide peroxide bleaching agents Journal ofEndodontics 22(7) 356-357.
Hamada S & Slade HD (1980) Biology, immunology, and cario-genicity of Streptococcus mutans Microbiology Review 44(2)331-384.
Haywood VB & Heymann HO (1989) Nightguard vital bleachingQuintessence International 20 173-176.
Haywood VB & Robinson FG (1997) Vital tooth bleaching withnightguard vital bleaching Current Opinion in CosmeticDentistry 4 45-52.
Haywood VB (1994) Consideration and variations of dentist-pre-scribed, home applied vital tooth-bleaching techniquesCompendium 17 S616-621.
Hegedüs C, Bistey T, Flora-Nagy F, Keszthelyi G & Jenei A (1999)An atomic force microscopy study on the effect of bleachingagents on enamel surface Journal of Dentistry 27(7) 509-515.
Hosoya N, Honda K, Iino F & Arai T (2003) Changes in enamelsurface roughness and adhesion of Streptococcus mutans toenamel after vital bleaching Journal of Dentistry 31(8) 543-548.
Isokangas P, Tenovuo J & Soderling E (1991) Dental caries andmutans streptococci in the proximal areas of molars affected bythe habitual use of xylitol chewing gum Caries Research 25(6)444-448.
Josey AL, Meyers IA, Romaniuk K & Symons AL (1996) Theeffect of a vital bleaching technique on enamel surface mor-phology and the bonding of composite resin to enamel Journalof Oral Rehabilitation 23(4) 244-250.
422 Operative Dentistry
Dow
nloaded from http://m
eridian.allenpress.com/operative-dentistry/article-pdf/30/4/1/1819389/1559-2863-30-4-1.pdf by guest on 12 January 2022

423Alkmin & Others: Effects of Bleaching Agents on Oral Microbiota
Kolenbrander PE (2000) Oral microbial communities: Biofilms,interactions, and genetic systems Annual Review Microbiology54 413-437. Review.
Leonard RH, Bentley CD & Haywood VB (1994) Salivary pHchanges during 10% carbamide peroxide bleachingQuintessence International 25 547-550.
Li Y, Wang W & Caufield PW (2000) The fidelity of mutans strep-tococci transmission and caries status correlate with breast-feeding experience among Chinese families Caries Research34(2) 123-132.
Lindquist B, Edward S, Torell P & Krasse B (1989) Effect of dif-ferent carriers preventive measures in children highly infectedwith mutans streptococci Scandinavian Journal of DentalResearch 97(4) 330-337.
Loesche WJ (1986) Role of Streptococcus mutans in human den-tal decay Microbiology Review 50(4) 353-380. Review.
Marsh PD (1991) Sugar, fluoride, pH and microbial homeostasisin dental plaque Proceed Finnish Dental Social 87(4) 515-525.Review.
Mc Guckin RS, Babin JF & Meyer BJ (1992) Alterations inhuman enamel surface morphology following vital bleachingJournal of Prosthetic Dentistry 68(5) 754-760.
Montgomery DC (1996) Design and Analysis of Experiments 4th
ed Singapure John Wiley and Sons 649.
Murchison DF, Charlton DG & Moore BK (1992) Carbamide per-oxide bleaching: Effects on enamel surface hardness and bond-ing Operative Dentistry 17(5) 181-185.
Rotstein I, Danker E, Goldman A, Heling I, Stabholz A & ZalkindM (1996) Histochemical analysis of dental hard tissues follow-ing bleaching Journal of Endodontics 22(1) 23-26.
Seow WK (1998) Biological mechanisms of early childhood cariesCommunity Dental Oral Epidemiology 26(1 Supplement) 8-27. Review.
Shannon H, Spencer P, Gross K & Tira D (1993) Characterizationof enamel exposed to 10% carbamide peroxide bleaching agentsQuintessence International 24(1) 39-44.
Smidt A, Weller D & Roman I (1998) Effect of bleaching agentson microhardness and surface morphology of tooth enamelAmerican Journal of Dentistry 11 83-85.
Steinberg D, Mor C, Dogan H, Zacks B & Rotstein I (1999) Effectof salivary biofilm on the adherence of oral bacteria to bleachedand non-bleached restorative material Dental Materials 15(1)14-20.
Togelius J, Kristoffersson K, Anderson H & Bratthall D (1984)Streptococcus mutans in saliva: Intraindividual variations andrelation to the number of colonized sites Acta OdontologicaScandanavica 42(3) 157-163.
Wan AK, Seow WK, Purdie DM, Bird PS, Walsh LJ & TudehopeDI (2001a) Oral colonization of Streptococcus mutans in six-month-old predentate infants Journal of Dental Research80(12) 2060-2065.
Wan AK, Seow WK, Walsh LJ, Bird P, Tudehope DL & Purdie DM(2001b) Association of Streptococcus mutans infection and oraldevelopmental nodules in pre-dentate infants Journal ofDental Research 80(10) 1945-1948.
Wan AK, Seow WK, Purdie DM, Bird PS, Walsh LJ & TudehopeDI (2003) The effects of chlorhexidine gel on Streptococcusmutans infection in 10-month-old infants: A longitudinal, place-bo-controlled, double-blind trial Pediatric Dentistry 25(3) 215-222.
Whiley RA & Beighton D (1998) Current classification of the oralstreptococci Oral Microbiology and Immunology 13(4) 195-216.
Zalkind M, Arwaz JR, Goldman A & Rotstein I (1996) Surfacemorphology changes in human enamel, dentin and cementumfollowing bleaching: A scanning electron microscopy studyEndodontics & Dental Traumatology 12(2) 82-88.
Zickert I, Emilson CG & Krasse B (1982) Effect of caries preven-tive measures in children highly infected with the bacteriumStreptococcus mutans Archives of Oral Biology 27(10) 861-868.
Zickert I, Emilson CG & Krasse B (1983) Correlation of level andduration of Streptococcus mutans infection with incidence ofdental caries Infectology and Immunology 39(2) 982-985.
Dow
nloaded from http://m
eridian.allenpress.com/operative-dentistry/article-pdf/30/4/1/1819389/1559-2863-30-4-1.pdf by guest on 12 January 2022
©Operative Dentistry, 2005, 30-4, 424-429
Eighteen-monthClinical Performance of a
Self-etching Primerin Unprepared Class V
Resin Restorations
WW Brackett • MG BrackettA Dib • G Franco • H Estudillo
Clinical Relevance
The use of acid etching or a self-etching primer for the minimum specified time is not,alone, sufficient to retain resin restorations of unprepared Class V lesions.
SUMMARY
This study evaluated the clinical performance ofunprepared Class V resin composites, placedusing a self-etching primer and a single-bottleadhesive, over a period of 18 months. Thirty-eightpairs of restorations of Renew hybrid resin com-posite (BISCO, Inc) were placed using adhesivesfrom the same manufacturer in caries-free cer-vical erosion/abfraction lesions. Based on insensi-
tivity to air, the dentin in 76% of these lesions wasconsidered to be sclerotic. The restorations wereplaced without abrasion of tooth surfaces, exceptfor cleaning with plain pumice. One of each pairwas placed using Tyrian, a self-etching primerand the other was placed using One-Step, a sin-gle-bottle adhesive placed after acid etching.Both the etchant and self-etching primer wereapplied for 20 seconds. The restorations wereclinically evaluated at baseline, 6, 12 and 18months, using modified Ryge/USPHS criteria. Forboth adhesives, very low retention of 50% to 56%of the restorations was observed over 18 months,leading to the conclusion that tooth surfacesmust receive some additional treatment prior torestoration with these adhesives. No statisticallysignificant difference (p=0.75) between the twoadhesives was observed in overall performance,and dentinal sclerosis and axial depth did notappear to be important factors in the study.
INTRODUCTION
The adhesion of resin to dentin became feasible withthe advent of hydrophilic resins capable of infiltratinginto and polymerizing within a moist decalcifieddentinal surface to form a hybrid layer (Nakabayashi,
*William W Brackett, DDS, MSD, associate professor,Department of Oral Rehabilitation, School of Dentistry, MedicalCollege of Georgia, Augusta, GA, USA
Martha Goel Brackett, DDS, MSD, instructor, Department ofOral Rehabilitation, School of Dentistry, Medical College ofGeorgia, Augusta, GA, USA
Alejandro Dib, CD, MO, professor and director, PostgraduateGeneral Dentistry, Facultad de Estomatologia, BenémeritaUniversidad Autónoma de Puebla, Puebla, Mexico
Guillermo Franco, CD, MS, professor, Postgraduate GeneralDentistry, Facultad de Estomatologia, Benémerita UniversidadAutónoma de Puebla, Puebla, Mexico
Hugo Estudillo, CD, MS, professor, Postgraduate GeneralDentistry, Facultad de Estomatologia, Benémerita UniversidadAutónoma de Puebla, Puebla, Mexico
*Reprint request: Augusta, Georgia 30912, USA; e-mail: [email protected]
Dow
nloaded from http://m
eridian.allenpress.com/operative-dentistry/article-pdf/30/4/1/1819389/1559-2863-30-4-1.pdf by guest on 12 January 2022

425Brackett & Others: Self-etching Primer in Unprepared Class V Resin Restorations
Ashizawa & Nakamura, 1992). Although nomenclaturevaries, in this report, dentin-adhesive resins that useetching and rinsing prior to application have beencalled “total-etch” and “single-” or “two-bottle,”depending on whether the primer and adhesive arecombined. Self-etching resins have been termed “self-etching primers” when there is a separate adhesive or“self-etching adhesives” when etchant, primer andadhesive are combined.
The adhesive restoration of non-carious cervicallesions with resin composites is considered problematic,because the dentinal surface of such lesions is oftenhypermineralized and resistant to acid etching (VanMeerbeek & others, 1994). Laboratory studies consis-tently demonstrate reduced efficacy of resin-basedadhesives in bonding to dentin of this type (Yoshiyama& others, 1996; Tay & others, 2000; Kwong & others,2002), which has led some investigators to advocate themechanical removal of the surface with rotary instru-ments or more aggressive etching (Kwong & others,2002). Laboratory bond strength studies also indicatethat some self-etching resins do not adhere as stronglyto unprepared enamel as total-etch materials(Kanemura, Sano & Tagami, 1999; Perdigão &Geraldeli, 2003).
Clinical studies of non-retentive Class V resin com-posites typically include lesions in both sclerotic andnon-sclerosed dentin with an incisal or occlusal enamelmargin. Prior abrasion of tooth surfaces in such studiesis not always reported, and it is controversial whetherthe use of this method constitutes restoration with “nocavity preparation,” as is specified in the protocol forclinical studies of the 2001 American DentalAssociation acceptance program for dentin and enameladhesive materials.
Surprisingly, dentinal sclerosis does not appear to bea factor in the retention of resin restorations in non-car-ious cervical lesions when total-etch resin adhesives areused and when dentinal surfaces are abraded with adiamond bur (Bayne & others, 2003). A two-year studyof three adhesives, both total-etch and self-etching, hasalso shown neither sclerosis nor roughening of restoredsurfaces as being important factors in the retention ofunprepared Class V resins (van Dijken, 2004), althougha previous study by the same author showed bothroughening and sclerosis to be detrimental to the reten-tion of one acetone-based single bottle adhesive (vanDijken, 2000).
Non-retentive Class V resin restorations placed inunabraded lesions and retained with two-bottle adhe-sives have demonstrated high retention rates in repre-sentative two-year studies, ranging from 86% to 100%(Van Meerbeek & others, 1996; Browning, Brackett &Gilpatrick, 2000; De Munck & others, 2003). Morerecent adhesives, with various components combined,
demonstrate reduced laboratory dentin bond strengthsrelative to earlier formulations (Bouillaguet & others,2001; Inoue & others, 2001; Molla, Park & Haller,2002). In clinical studies, however, Class V retentionrates for single-bottle adhesives are variable, with someproducts retaining Class V resins and two-bottle adhe-sives (Swift & others, 2001; Turkun, 2003) and some atlower rates (Brackett & others, 2003; van Dijken, 2004).Among these studies, there seems to be no correlationbetween adhesive solvent (acetone, alcohol, water),dentinal surface abrasion or dentinal sclerosis and clin-ical performance.
One acetone-based adhesive, One Step (BISCO, Inc,Schaumburg, IL, USA), has been widely studied andvaries widely in clinical performance according todentinal sclerosis and application technique. The reten-tion of resins placed with this adhesive appears to worsenin sclerotic lesions, with two authors reporting up to a40% loss over two years (van Dijken, 2000; Baratieri &others, 2003). This effect appears to be ameliorated bythe application of three or four separately-dried coats ofthe adhesive, as needed, to attain a shiny dentinal sur-face, according to an article published after the start ofthis study, which reported 87% retention over two yearsusing this method (Tyas & Burrow, 2002).
Peer-reviewed reports on the clinical performance ofself-etching resins are rare, and many products appearto not have been evaluated in controlled clinical trials,although some studies have been reported in abstractform. Two different adhesives with self-etching primershave demonstrated retention greater than 90% overtwo years in unprepared Class V restorations, while aself-etching adhesive has demonstrated relatively poorresults, with retention ranging from 79% to 84% (Friedl& others, 2004; van Dijken, 2004).
Over a period of 18 months, this study compared theclinical performance in non-retentive Class V resinrestorations of a well-studied acetone-based single-bottleadhesive to that of an adhesive with a self-etchingprimer for which no clinical trials have been published.
METHODS AND MATERIALS
Tyrian (BISCO, Inc) was the self-etching primer chosenfor this study, while One-Step (BISCO, Inc) was thesingle-bottle adhesive chosen. The use of both adhesivespreceded restoration with the same manufacturer’shybrid resin composite, Renew (BISCO, Inc). The studywas conducted according to the protocol for clinicalstudies set forth in the 2001 American DentalAssociation acceptance program for dentin and enameladhesive materials.
Thirty-eight pairs of equivalent-sized cervical ero-sion/abfraction lesions, primarily in premolar and ante-rior teeth, were identified in 25 healthy patients pre-senting for treatment at student clinics of the Facultad
Dow
nloaded from http://m
eridian.allenpress.com/operative-dentistry/article-pdf/30/4/1/1819389/1559-2863-30-4-1.pdf by guest on 12 January 2022

426 Operative Dentistry
de Estomatologia, Benémerita Universidad Autónomade Puebla. The study was conducted in accordancewith all local regulations for the ethical treatment of
human subjects. The median age ofthese patients was 52 years, whilethe age range was 28 to 69 years.Each pair of cervical erosion/abfrac-tion lesions received one restora-tion placed using each adhesive,assigned randomly. No patientreceived more than two pairs ofrestorations. All of the lesionsincluded in the study were 1-2 mmin axial depth. The approximatesize of each lesion and any sensitiv-ity of the lesion to air from the den-tal unit was recorded prior torestoration (Table 1). Seventy-sixpercent of the lesions were insensi-tive to air and considered sclerotic.
Two experienced investigatorsfamiliar with adhesive dentistryplaced all the restorations.Isolation was accomplished usingcotton rolls, with gingival retrac-tion cord placed to expose any sub-gingival margins. All restorationswere placed according to manufac-turers’ instructions and are sum-marized in Table 2. Other thancleaning with plain pumice andwater in a rubber prophylaxis cup,no mechanical preparation or abra-sion of tooth surfaces was done. Theapplication of acid or self-etchingprimer was not extended beyondthe manufacturer’s recommended20 seconds, which the authors con-sider minimal.
Because the lesions were of minimal axial depth, eachrestoration was placed in one increment and light-
Adhesive Technique
One-Step Universal Etch, 32% phosphoric acid, 20 seconds, Rinse,Dentin Adhesive Briefly air dry, leaving tooth surfaces moist,
Apply two thick coats, agitate 10-15 seconds,Air dry, Verify shiny surface,Light cure, 10 seconds
Tyrain SPE Shake and activate unit-dose capsule, stir,Self-Priming Etchant Air dry tooth surfaces, apply two coats with agitation, 20 seconds,
Blot dry, verify shiny surface,Apply two thick coats One-step Plus, agitate 10-15 seconds,Air dry, verify shiny surface,Light cure, 10 seconds
Table 2: Adhesives, Manufacturer’s Instructions/Technique
Tyrian SPE
Incisors Canines Premolars Molars
n s o a b c n s o a b c n s o a b c n s o a b c
Maxillary 2 2 1 1 4 4 4 13 5 8 5 8
Mandibular 3 3 3 14 3 11 5 9 2 2 2
One-Step
Incisors Canines Premolars Molars
n s o a b c n s o a b c n s o a b c n s o a b c
Maxillary 2 2 2 3 3 3 10 3 7 4 6
Mandibular 3 1 2 1 2 2 1 1 2 17 6 11 3 14 1 1 1
s = sensitive to air a = axial depth < 1 mmo = insensitive to air b = axial depth 1-2 mm
c = axial depth > 2 mm
Table 1: Distribution of Restorative Materials to Teeth Restored; Axial Depth and Preoperative Sensitivity of Erosion/Abfraction Lesions
Category Score Criteria
Retention Alpha No loss of restorative materialCharlie Any loss of restorative material
Color match Alpha Matches toothBravo Acceptable mismatchCharlie Unacceptable mismatch
Marginal Alpha No discolorationDiscoloration Bravo Discoloration without axial penetration
Charlie Discoloration with axial penetration
Secondary Alpha No caries presentCaries Charlie Caries present
Anatomic Alpha ContinuousForm Bravo Slight discontinuity, clinically acceptable
Charlie Discontinuous, failure
Marginal Alpha Closely adapted, no detectable marginAdaptation Bravo Detectable margin, clinically acceptable
Charlie Marginal crevice, clinical failure
Surface Alpha Enamel-like surfaceTexture Bravo Surface rougher than enamel, clinically acceptable
Charlie Surface unacceptably rough
Table 3: Modified USPHS Rating System
Dow
nloaded from http://m
eridian.allenpress.com/operative-dentistry/article-pdf/30/4/1/1819389/1559-2863-30-4-1.pdf by guest on 12 January 2022

Brackett & Others: Self-etching Primer in Unprepared Class V Resin Restorations 427
cured for 40 seconds. Light output of the SL3000 curinglight used (3M ESPE, St Paul, MN, USA) was found toexceed 450 mW/cm2 prior to and after the study andwas verified during placement of the restorations withthe unit’s built-in radiometer. For all restorations, theshade considered to be the closest match using a Vitashade guide (Vita-Zahnfabrik, Bad Säckingen,Germany) was selected. Restorations, shaped with aplastic instrument prior to light curing, were contouredwith finishing burs using air/water coolant and pol-ished with wet abrasive rubber points and cups.
At baseline, 6, 12 and 18 months, the restorationswere clinically evaluated by two other calibrated inves-tigators using modified Ryge/USPHS criteria (Cvar &Rype, 1971) which are listed in Table 3. The examinerswere unaware of which adhesive had been used for anyrestoration, and any discrepancy between examinerswas resolved before the patient was dismissed.
For purposes of statistical analysis, restorationsreceiving a score of “charlie” in any category were clas-sified as failed restorations, The incidence of failureswas analyzed as a pairwise comparison usingMcNemar’s Chi square test at a confidence level of 5%.
RESULTS
At the end of 18 months, 36 pairs of restorations wereavailable for evaluation, a recall rate of 95%. Overallretention was 50% for One-Step and 56% for Tyrian,with lost restorations the only scores of “charlie”assigned in the study. Of the 22 pairs of lesions fromwhich restorations were lost, 12 showed loss of bothrestorations. There was no difference in the percentageof retained restorations between the two operators. Ofthe 18 One-Step-retained restorations lost, three werelost prior to the six-month recall, five during the 6 to 12month interval and 10 during the 12 to 18 monthinterval. Of the 16 Tyrian-retained restorations lost,two were lost prior to the six-month recall, six during
the 6 to 12 month interval and eight during the 12 to 18month interval.
None of the teeth with retained restorations thatexhibited sensitivity to air at the beginning of the studywere sensitive at any recall. Twenty-four percent of thelost restorations in this study had been placed in lesionswhich were sensitive to air, while 75% of the lostrestorations had been placed in lesions with a 1-2 mmaxial depth. This was nearly the same as the incidenceof sensitive and moderate depth lesions in the overallstudy populace, 25% and 77%, respectively.
The hybrid resin composite displayed good colormatch and surface texture over the course of the study,with scores of 90% alpha or more for both categories. Nostatistically significant difference in the incidence offailed restorations was found between the materials(McNemar’s Chi square test; p=0.75). Complete resultsare presented in Table 4.
DISCUSSION
The low rate of retention for both adhesives observed inthis study was disappointing and unexpected, as bothdemonstrate good bond strengths in laboratory studies.Neither axial depth nor sclerosis appears to have beenimportant factors, given their relative incidence preop-eratively and among lost restorations.
Performance of the One-Step-retained restorationswas similar to data reported for sclerotic lesions in aprevious study (van Dijken, 2000) and would likelyhave been better had the authors known to apply morelayers than specified by the manufacturer according tothe protocol since established by Tyas and Burrow(2002). Although the phosphoric acid supplied by thismanufacturer contains benzalkonium chloride and is ofa lower concentration than some other manufacturers,the same etchant was used by Tyas and Burrow andprobably was not a factor. Although Tyas and Burrow
Tyrian SPE
Retention** Color Match Marg Disc Sec Caries Anat Form Marg Adapt Surf Texture
n* alpha charlie n* alpha bravo alpha bravo alpha charlie alpha bravo alpha bravo alpha bravo
baseline 38 100 0 38 100 0 100 0 100 0 100 0 94 6 100 06 months 38 92 8 35 100 0 100 0 100 0 100 0 85 15 97 312 months 38 79 21 30 100 0 100 0 100 0 100 0 71 29 97 318 months 36 56 44 20 100 0 90 10 100 0 100 0 80 20 90 10
One-Step
Retention** Color Match Marg Disc Sec Caries Anat Form Marg Adapt Surf Texture
n* alpha charlie n* alpha bravo alpha bravo alpha charlie alpha bravo alpha bravo alpha bravo
baseline 38 100 0 38 100 0 100 0 100 0 100 0 100 0 97 36 months 38 89 11 34 97 3 97 3 100 0 97 3 91 9 100 012 months 38 79 21 28 96 4 96 4 100 0 96 4 82 18 89 1118 months 36 50 50 18 95 5 94 6 100 0 94 6 72 28 100 0
*Sample size larger for retention than for other criteria because lost restorations were unavailable for evalation.
**Cumulative throughout the study.
Table 4: Results of Clinical Evaluation of Class V Resin Composites Placed with Self-etching Primer and Single-bottle Adhesive (%)
Dow
nloaded from http://m
eridian.allenpress.com/operative-dentistry/article-pdf/30/4/1/1819389/1559-2863-30-4-1.pdf by guest on 12 January 2022

428 Operative Dentistry
abraded dentinal surfaces, this did not improve adhe-sion in the previously cited study of One-Step (vanDijken, 2000), so the protocol of restoration withouttooth abrasion in this study probably was not detri-mental to retention. Both operators who placed therestorations for this study were aware that acetone-based adhesives, such as One-Step, must be applied tomoist dentin and used care not to over-dry tooth sur-faces.
Although no clinical studies of Tyrian have been pub-lished, similar products employing self-etching primersperform better in laboratory and clinical studies thanself-etching adhesives and approach the efficacy oftotal-etch adhesives. Because the pH of this material isabout 1, inadequate demineralization of tooth surfacesprobably did not contribute to the relatively poor adhe-sion observed, although retention might have improvedhad the enamel margin been ground. Since a filled ver-sion of One-Step serves as the adhesive for Tyrian, theapplication of more coats of primer or more separatelydried coats of the adhesive might have improved theperformance of Tyrian.
It is not possible to determine the primary mecha-nism by which restorations failed in this clinical study.If failure involved the loss of adhesion to dentin, thiscould have occurred because the bonding procedure didnot produce sufficient infiltration of the adhesives intothe dentinal surface, because there was not sufficientadhesion between the resin composite and hybrid layeror because the hybrid layer or bond were not sufficientlystable in the oral environment. The loss of the greatestnumber of restorations for both adhesives after sixmonths to a year in place indicates that stability of thebond under oral conditions may be an important factor.
The authors believe that the results of this and pre-vious studies indicate that separate manufacturers’instructions for the restoration of erosion/abfractionlesions should be given for all resin-based adhesives.Since laboratory studies do not appear to be adequatelypredictive, these instructions should be verified viaclinical studies.
CONCLUSIONS
Under the protocol used in this study, neither adhesivewas effective in retaining unprepared Class V resincomposite restorations.
(Received 19 July 2004)
References
Baratieri LN, Canabarro S, Lopes GC & Ritter AV (2003) Effectof resin viscosity and enamel beveling on the clinical perform-ance of Class V composite restorations: Three-year resultsOperative Dentistry 28(5) 482-487.
Bayne SC, Swift EJ Jr, Wilder AD Jr, Sturdevant JR & HeymannHO (2003) Post-operative sensitivity, retention, and sclerosislevels in Class V clinical trials Journal of Dental Research82(Special Issue B) Abstract #909 p B-126.
Bouillaguet S, Gysi P, Wataha JC, Ciucchi B, Cattani M, Godin C& Meyer JM (2001) Bond strength of composite to dentin usingconventional, one-step, and self-etching adhesive systemsJournal of Dentistry 29(1) 55-61.
Brackett WW, Dib A, Brackett MG, Reyes AA & Estrada BE(2003) Two-year clinical performance of Class V resin-modifiedglass-ionomer and resin composite restorations OperativeDentistry 28(5) 477-481.
Browning WD, Brackett WW & Gilpatrick RO (2000) Two-yearclinical comparison of a microfilled and a hybrid resin-basedcomposite in non-carious Class V lesions Operative Dentistry25(1) 46-50.
Cvar JF & Ryge G (1971) Criteria for the clinical evaluation ofdental restorative materials, US Public Health ServicePublication No 790-244 San Francisco Government PrintingOffice.
De Munck J, Van Meerbeek B, Peumans M & Lambrechts P(2003) Five-year clinical effectiveness of two three-step total-etch adhesives and two composites in cervical lesions Journal ofDental Research 82(Special Issue B) Abstract #907 p B-126.
Friedl KH, Hiller KA, Jung H, Schlittenbauer T, Lichtblau J &Schmalz G (2004) Clinical evaluation of composite restorationsusing different adhesive systems Journal of Dental Research83(Special Issue A) Abstract #535.
Inoue S, Vargas MA, Abe Y, Yoshida Y, Lambrechts P, Vanherle G,Sano H & Van Meerbeek B (2001) Microtensile bond strengthof eleven contemporary adhesives to dentin Journal ofAdhesive Dentistry 3(3) 237-245.
Kanemura N, Sano H & Tagami J (1999) Tensile bond strengthto and SEM evaluation of ground and intact enamel surfacesJournal of Dentistry 27(7) 523-530.
Kwong SM, Cheung GS, Kei LH, Itthagarun A, Smales RJ, TayFR & Pashley DH (2002) Micro-tensile bond strengths to scle-rotic dentin using a self-etching and a total-etching techniqueDental Materials 18(5) 359-369.
Molla K, Park HJ & Haller B (2002) Bond strength of adhe-sive/composite combinations to dentin involving total- and self-etch adhesives Journal of Adhesive Dentistry 4(3) 171-180.
Nakabayashi N, Ashizawa M & Nakamura M (1992)Identification of a resin-dentin hybrid layer in vital humandentin created in vivo: Durable bonding to vital dentinQuintessence International 23(2) 135-141.
Perdigão J & Geraldeli S (2003) Bonding characteristics of self-etching adhesives to intact versus prepared enamel Journal ofEsthetic Restorative Dentistry 15(1) 32-42.
Swift EJ Jr, Perdigão J, Wilder AD Jr, Heymann HO, SturdevantJR & Bayne SC (2001) Clinical evaluation of two one-bottledentin adhesives at three years Journal of the American DentalAssociation 132(8) 1117-1123.
Tay FR, Kwong SM, Itthagarun A, King NM, Yip HK, MouldingKM & Pashley DH (2000) Bonding of a self-etching primer tonon-carious cervical sclerotic dentin: Interfacial ultrastructureand microtensile bond strength evaluation Journal of AdhesiveDentistry 2(1) 9-28.
Dow
nloaded from http://m
eridian.allenpress.com/operative-dentistry/article-pdf/30/4/1/1819389/1559-2863-30-4-1.pdf by guest on 12 January 2022
Brackett & Others: Self-etching Primer in Unprepared Class V Resin Restorations 429
Turkun SL (2003) Clinical evaluation of a self-etching and a one-bottle adhesive system at two years Journal of Dentistry 31(8)527-534.
Tyas MJ & Burrow MF (2002) Three-year clinical evaluation ofOne-Step in non-carious cervical lesions American Journal ofDentistry 15(5) 309-311.
van Dijken JW (2000) Clinical evaluation of three adhesive sys-tems in Class V non-carious lesions Dental Materials 16(4)285-291.
van Dijken JW (2004) Durability of three simplified adhesive sys-tems in Class V non-carious cervical dentin lesions AmericanJournal of Dentistry 17(1) 27-32.
Van Meerbeek B, Braem M, Lambrechts P & Vanherle G (1994)Morphological characterization of the interface between resinand sclerotic dentine Journal of Dentistry 22(3) 141-146.
Van Meerbeek B, Peumans M, Gladys S, Braem M, LambrechtsP & Vanherle G (1996) Three-year clinical effectiveness of fourtotal-etch dentinal adhesive systems in cervical lesionsQuintessence International 27(11) 775-784.
Yoshiyama M, Sano H, Ebisu S, Tagami J, Ciucchi B, CarvalhoRM, Johnson MH & Pashley DH (1996) Regional strengths ofbonding agents to cervical sclerotic root dentin Journal ofDental Research 75(6) 1404-1413.
Dow
nloaded from http://m
eridian.allenpress.com/operative-dentistry/article-pdf/30/4/1/1819389/1559-2863-30-4-1.pdf by guest on 12 January 2022

©Operative Dentistry, 2005, 30-4, 430-435
A Sengun • AE KoyuturkY Sener • F Ozer
Clinical Relevance
The application of Micro Prime and Gluma Desensitizer to caries-affected dentin showedno negative effect on bond strength. Therefore, they can be used as desensitizing and anti-bacterial agents after caries removal.
SUMMARY
A self-etching dentin adhesive was evaluated forits ability to bond to caries-affected and sounddentin after applying three desensitizers to thegingival walls. Sixty extracted human molars,with approximal dentin caries, were cut horizon-tally on the long axis of the tooth through caries-affected gingival walls. Carious dentin wasremoved with SiC paper by means of a cariesdetector to expose caries-affected dentin. Themolars were randomly assigned to four groups:
control and three experimental groups—MicroPrime, Glauma Desentizer and Cervitec.Desensitizers were applied to the dentinal sur-faces according to manufacturers’ instructions. Aresin composite was bonded to both the caries-affected and sound dentin of each tooth using abonding system and plastic rings. The restora-tion was debonded by shear bond strength. Theapplication of Micro Prime and GlumaDesensitizer to caries-affected dentin did notshow any effect on bond strength testing.However, Cervitec caused a decrease in bondstrength to caries-affected dentin. The effect ofdesensitizers on the bond strength of the self-etch bonding agent to caries-affected dentinchanged according to the chemical compositionof the materials. Desensitizer application onsound dentin is recommended with self-etchbonding systems.
INTRODUCTION
The clinical consequence of leaving residual bacteriaunder restorations is still a subject of considerabledebate (Yoshiyama & others, 2002). Although it was
Abdulkadir Sengun, DDS, PhD, associate professor, Departmentof Conservative Dentistry, Selcuk University, Faculty ofDentistry, Konya, Turkey
*Alp Erdin Koyuturk, DDS, PhD, Department of PediatricDentistry, Selcuk University, Faculty of Dentistry, Konya, Turkey
Yagmur Sener DDS, PhD, assistant professor, Department ofPediatric Dentistry, Selcuk University, Faculty of Dentistry,Konya, Turkey
Fusun Ozer DDS, PhD, professor and chair, Department ofConservative Dentistry, Selcuk University, Faculty of Dentistry,Konya, Turkey
*Reprint request: 42075, Konya, Turkey; e-mail: [email protected]
Effect of Desensitizerson the Bond Strength
of a Self-etching Adhesive Systemto Caries-affected Dentin
on the Gingival Wall
Laboratory Research
Dow
nloaded from http://m
eridian.allenpress.com/operative-dentistry/article-pdf/30/4/1/1819389/1559-2863-30-4-1.pdf by guest on 12 January 2022

431Sengun & Others: Effect of Desensitizers on the Bond Strength of a Self-etching Adhesive System
assumed that bacteria were dormant in arrested cariesunder restorations (Björndal & Larsen, 2000), a studyby Weerheijm and Groen (1999) demonstrated thatamalgam or resin-modified glass-ionomer restorationsthat were placed over carious dentin still containedviable, cultivable bacteria flora after two years.
Anaerobic and protolytic bacteria may be active inalready-established dentin caries. The metabolic prod-ucts of oral microbiata can also contribute to theadvancement of dentin carious lesions (Baca &Liébana, 1995). Besides affecting the evaluation ofdental caries, oral bacteria play a role in the problemsthat may arise after restorative therapy, such as dentalsensitivity or recurrent caries (Brännström, 1986).
In-vitro studies (Duran & others, 2003; Settembrini &others, 1997; Chan & Lo, 1994) report the possibleresidual antibacterial effects of antimicrobial etchants,cavity disinfectants and dentin desensitizers followingtooth preparation. Conclusions from these studiesrevealed that these pre-treatments exhibit varyingdegrees of antimicrobial inhibition. Any materialand/or procedure that infers resistance to intraoral bac-terial assault will improve the clinical performance andlongevity of adhesive bonding systems and the accom-panying composite restorations. While components ofthese pre-treatment solutions can eliminate caries-pro-ducing bacteria, currently, the same components canpossibly induce leakage by interfering with themechanical bond at the tooth/material interface(Owens, Lim & Arheart, 2003).
A recent study confirmed that most recently devel-oped desensitizers have different antibacterial effects(Duran & others, 2003). Specifically, fluoride and/orchlorhexidine components of these materials have beenfound to reduce or eliminate bacteria in dentinaltubules (Vahdaty, Pitt Ford & Wilson, 1993; Munshi,Reddy & Shetty, 2001). However, the potential diffi-culty of desensitizing pre-treatment use in cavitypreparation with dentin bonding systems couldadversely affect hydrophilic adherence of the adhesivecomponents to dentin. However, there is no literaturedetailing the effect of desensitizers on the bondstrength of adhesive systems to caries-affected dentin.
When different desensitizers are used for caries-affected dentin on the gingival wall, the bond strengthsof bonding agents may be different in Class II cavities.This study determined whether desensitizer pre-treat-ment solutions have a detrimental effect on thebonding process of a self-etching dentin adhesive.
METHODS AND MATERIALS
Specimen Preparation
Sixty extracted human molars with approximal dentincaries stored in isotonic saline at +4°C were employedin this study. The teeth had only mesial or distal
approximal caries, and the gingival wall of carieslesions were 1 mm±D1 (the D1 diagnostic thresholdencompasses initial, enamel lesions and dentinalcaries) above the cemento-enamel junction. Bothcaries-affected and sound dentin surfaces wereobtained on the same tooth (Figure 1A). All teeth werecut perpendicular to the long axis of the tooth from thegingival border of the carious lesion by using an Isometsaw (Buehler Ltd, Lake Bluff, IL, USA) under water toexpose a flat dentin surface. Grinding with 320 siliconcarbide abrasive papers was performed under runningwater to remove caries-infected dentin. It was deter-mined that caries-infected dentin was removed byusing the combined criteria of visual examination,hardness to a sharp excavator and staining with acaries detector solution (Kuraray Co, Ltd, Osaka,Japan). The relatively soft, dark-red stained dentin wasclassified as caries-infected dentin, while the discol-ored, harder dentin that stained pink was classified ascaries-affected. Yellow, hard dentin was classified assound dentin.
The roots of the teeth were mounted in a 3-cm diam-eter circular mold using chemically cured acrylic resin.The teeth were positioned so that their bonding surfacewas parallel to the base of the molds.
Shear Bond Strength Analysis
The teeth were randomly divided into four groups,three experimental and one control, of 15 teeth. Theflat dentin surfaces were hand polished with 600-gritsilicon carbide abrasive papers under running water.The surfaces were examined after polishing to ensurethat the orientation was not altered. Three commer-cially available desensitizers, Micro Prime (DanvilleEngineering Inc, San Ramon, CA, USA), Cervitec
Figure 1: A: The tooth with approximal caries.B: Cylindrical composite attachments at gingival wall of the tooth.
Dow
nloaded from http://m
eridian.allenpress.com/operative-dentistry/article-pdf/30/4/1/1819389/1559-2863-30-4-1.pdf by guest on 12 January 2022

432 Operative Dentistry
(Ivoclar-Vivadent, Konstanz, Germany) and GlumaDesensitizer (Heraeus Kulzer, Hanau, Germany) (Table1) were applied to the dentinal surfaces according to themanufacturers’ instructions. Next, a self-etch primer(Optibond Solo Plus SE, Kerr Corporation, Orange, CA,USA) was applied to dentin surfaces with a brushingmotion for 15 seconds and gently air-dried for three sec-onds. Then, a bonding system (Optibond Solo Plus SE)was applied to the dentin surfaces with a light brushingmotion for 15 seconds and gently air-dried for three sec-onds. After the bonding system was reapplied to thedentin surfaces for 15 seconds and dried gently with anair syringe for three seconds, the bonding agent wascured for 20 seconds with a curing light (Hilux 250,Benlioglu, Ankara, Turkey). A resin composite (Point 4,Kerr Corporation) was built-up on the caries-affectedand sound dentin regions of the same tooth by packingthe material into a cylindrically shaped plastic appa-ratus with an internal diameter of 2.34 mm and aheight of 3 mm (Ultradent Products, Inc, South Jordan,UT, USA) (Figure 1B). Excess composite was carefullyremoved with an explorer from the periphery of theapparatus. The resin composite was light-cured for 40seconds. The intensity of light was at least 400mW/cm2.The specimens of the control group were preparedwithout any application of desensitizers on dentin. Thespecimens were stored in distilled water at 37°C for 24hours, then mounted in a universal testing machine(Testometric Micro 500, Lancashire, England) for shearbond testing. A notched blade attached to a compressionload cell traveling at a crosshead speed of 1 mm/minutewas applied to each specimen at the interface betweenthe tooth and the composite until failure occurred. Themaximum load (N) was divided by the cross-sectionalarea of the bonded composite blocks to determine shearbond strength in MPa.
Fracture Analysis
Fracture analyses were performed at 20x magnificationusing an optical stereomicroscope (Olympus SZ4045TRPT, Osaka, Japan). The failure modes were desig-nated as adhesive fracture if 90% to 100% of the bonded
interface failed between the dentin and resin composite,cohesive fracture if 90% to 100% of the failure was inthe resin composite or dentin or mix fracture if the fail-ures were partially adhesive and partially cohesiveresin fractures and/or dentin fracture.
Statistical Analysis
Since the data were homogenous and parametric, one-way ANOVA and Tukey HSD Post Hoc tests were usedto test shear bond strength differences between desen-sitizers for both caries-affected and sound dentin.Paired Samples t-test was used to test shear bondstrength differences between caries-affected and sounddentin in the same tooth for each adhesive material.The frequency of fracture modes was analyzed usingKruskal-Wallis and Mann-Whitney U tests. The level ofstatistical significance was set at 0.05 for all statisticalanalyses.
RESULTS
Table 2 summarizes the results of shear bond testing.The bonding system alone gave the highest bondstrength value (29.25±6.40 MPa) on sound dentin. MicroPrime and Gluma Desensitizer application to caries-affected dentin did not show any effect on bond strengthwhen compared to the control group (p>0.05).Alternately, Cervitec caused a decrease in bond strengthto caries-affected dentin (p<0.05). Bonding to sounddentin was negatively influenced by all desensitizerswhen compared to the control group (p<0.05). Althoughbond strengths to sound dentin in the control andCervitec groups were higher than those to caries-affected dentin, the application of Micro Prime andGluma Desensitizer on sound dentin significantlydecreased bond strengths.
The fracture patterns of the materials involved areshown in Table 3. In general, a greater percentage of thefractures were adhesive at the tooth-composite junction.That is, the fractures failed in the dentin/compositeinterface in both caries-affected dentin and sounddentin.
Materials Contents Manufacturers
Micro PrimeTM Benzethonium chloride and HEMA Danville Engineering Inc, San Ramon, CA, USALot #1424
Cervitec Chlorhexidine and thymol Ivoclar-Vivadent, Konstanz, GermanyLot #C02356
Gluma Desensitizer HEMA, glutardialdehyde, and purified water Heraeus Kulzer, Hanau, GermanyLot #010032
Optibond Solo Plus Primer: HEMA, GPDM, MMEP, Ethanol, Water Kerr, Orange, CA, USASelf-etch system Adhesive:Bis-GMA, HEMA, GPDM,silicate glass filler Lot #205187
Point 4 Optimized Particle Composite Kerr, Orange, CA, USALot #202688
Abbreviations: Bis-GMA, bisphenyl-glycidyl-methacrylate; HEMA, 2-hydroxyethyl methacrylate; GPDM, glycerophosphoric acid dimethacylate; MMEP, mono 2-methacryloxy ethyl phthalate
Table 1: Contents and Manufacturers’ Information of the Materials Used
Des
ensi
tizer
sB
ondi
ngA
gent
Com
-po
site
Dow
nloaded from http://m
eridian.allenpress.com/operative-dentistry/article-pdf/30/4/1/1819389/1559-2863-30-4-1.pdf by guest on 12 January 2022

433Sengun & Others: Effect of Desensitizers on the Bond Strength of a Self-etching Adhesive System
DISCUSSION
Caries-affected dentin may contain deposits of whit-lockite in dentinal tubules (Daculsi & others, 1979).Dentinal tubules beneath the dentin surface may becompletely obliterated with mineral deposits, con-firming the quantitative results reported by Pashleyand others (1991) that caries-affected dentin, even afterexcavation and removal of the smear layer, has verylow permeability. The tubules include acid-resistantcrystals and extrinsic proteins that have permeatedinto the mineral phase during cycles of remineraliza-tion and demineralization. This tends to result in lowbond strengths (Nakajima & others, 1999; Kwong &others, 2000; Sengun & others, 2002). The results ofthis study are in agreement with previous studieswhere a higher bond strength to sound dentin wasfound in the control group compared to that observed incaries-affected dentin.
After removing the infected dentin, caries-affecteddentin may have remaining micro-organisms.Cariogenic bacteria under the sealed restoration couldmultiply through dentinal tubules and cause secondarycaries (Yoshiyama & others, 2002).
In some studies, the antibacterial effectiveness ofdental materials was found to be related to either thepH or chemical composition of the materials (Imazato& others, 1997; Imazato, Imai & Ebisu, 1998). Forexample, current desensitizers include antibacterialcomponents such as fluoride, triclosan, benzalkoniumchloride, ethylene dianinetetraacetic acid and glu-taraldehyde (Duran & others, 2003). Similarly, thematerials used in this study have some antibacterialcomponents.
Micro Prime is used as a desensitizing agent underdental cements and temporary, provisional or finalrestorative materials,as well as on abra-sions, cervical ero-sions and preps. Theantibacterial activityof Micro Prime maybe related to thechemical composi-tion, benzalkoniumchloride. In a pre-
vious study, it was found that Micro Prime had a sig-nificant inhibitory effect on most oral bacteria (Duran& others, 2003). The antibacterial activity of Glumadesensitizer may be related to its glutaraldehyde com-position. Only a few products containing gluataralde-hyde exhibited antibacterial effectiveness, but theseproducts were shown to depend upon the leaching ofglutaraldehyde from cured materials (Fraga, Siqueira,Jr & de Uzeda, 1996; Meiers & Miller, 1996). BothMicro Prime and Gluma Desensitizer contain HEMA,while the bonding agent primer also contains HEMA.Thus, HEMA produced an acidic effect twice on thecaries-affected dentin. This acid, applied to the dentinalsurface, may have caused sufficient priming/etching ofthe surface prior to placement of the bonding agent.This caused higher bond strength values on caries-affected dentin.
Cervitec contains chlorhexidine. Chlorhexidine, deliv-ered in a varnish form, has been shown to be effectivein the control and prevention of caries (Bowden, 1990).Chlorhexidine is a most effective antibacterial agent inthe reduction of dental plaque and is particularlypotent against S mutans (Murata, Miyamoto & Ueda,1990). However, the varnish form of chlorhexidineprobably prevented adequate diffusion of the bondingagent and, therefore, resulted in the lowest bondstrength to caries-affected dentin.
The principle of dentin bonding relies on the forma-tion of a resin-infiltrated layer in intertubular and per-itubular conditioned dentin. Following polymerization,these monomers may form a micro-mechanical bondwith primed dentin, forming the hybrid layer that isthe principle mechanism of bonding (Perdigão, Swift &Cloe, 1993; Santini & Mitchell, 1998). However, toobtain reliable dentin adhesion, the open tubules andexposed collagen-rich meshwork must be completely
Desensitizers Sound Dentin* Significance (P)** Caries-affected Dentin*
Micro Prime 20.44±7.11c 0.001 25.15±5.58a
Gluma Desensitizer 18.51±5.88c 0.001 22.67±5.85a
Cervitec 20.23±6.08c 0.001 16.95±5.78b
Control 29.25±6.40d 0.011 21.98±7.92a
*There is no statistical difference between same letters in same column.
**The differences between caries-affected and sound according to paired samples t-test.
Table 2: Mean±SD (MPa) Shear Bond Strength Values to Caries-affected and Sound Dentin (n=15)
Sound Dentin Caries-affected DentinDesensitizers A (%) M (%) C (%) Grouping A (%) M (%) C (%) GroupingMicro Prime 10 (66.6) 4 (26.6) 1 (6.6) a 8 (53.3) 6 (40) 1 (6.6) aGluma Desensitizer 11 (73.3) 1 (6.6) 3 (20) a 14 (93.3) 1 (6.6) 0 a, bCervitec 12 (80) 0 3 (20) a 12 (80) 3 (20) 0 a, bControl 15 (100) 0 0 a 15 (100) 0 0 b
(A: Adhesive, M: Mixed, C: Cohesive).
There is no statistical difference between same letters in same column (p>0.05).
Table 3: Failure Modes of the Bonding Agents Used After Shear Bond Testing
Dow
nloaded from http://m
eridian.allenpress.com/operative-dentistry/article-pdf/30/4/1/1819389/1559-2863-30-4-1.pdf by guest on 12 January 2022

434 Operative Dentistry
and homogeneously infiltrated by resin monomers.Otherwise, a weak layer, formed by non-encapsulatedcollagen, remains at the bottom of the hybrid layer,propagating fracture. This reduces the bond strengthand durability of adhesion (Santini & Mitchell, 1998;Titley & others, 1994; Gwinnett, 1993).
Many factors contribute to the reduction of dentinbond strength through incomplete resin infiltration.Among them, dentin permeability is one of the mostimportant (Tagami, Tao & Pashley, 1990; Hamid, Sutton& Hume, 1996). Several studies observed that desensi-tizing agents effectively reduced dentin permeabilitybetween 60% and 80% (Jain & others, 1997; Camps &others, 1998). In a study by Pashley, Tao and Pashley(1993), the effect of a dentin desensitizer on the bondstrength on three different dentin bonding systems wasevaluated. In another study by Seara and others (2002),a dentin desensitizer was used to evaluate the effect ofbond strength of two different dentin bonding systems.Seara and others (2002) reported that dentin desensi-tizers significantly decreased the bond strength ofdentin bonding agents. These observations confirm theresults obtained in this study. The application of desen-sitizers before the bonding system significantly reducedshear bond strengths to sound dentin. Effective bondingrequires acid etching, rinsing and drying of dentinbefore applying the primer. Self-etching primers suc-ceeded in eliminating the dentin-conditioning stepsbefore priming. However, self-etching primers have lowacidic components. One possible reason for thedecreased bond strengths to sound dentin may be theresult of desensitizer deposition blocking the dentintubule orifices and intertubular diffusion channels. Theprecipitation of desensitizers on the dentin surface maychemically and/or physically prevent complete penetrationof the bonding system resin components through thedemineralized zone, thus decreasing bond strength values.
Most published reports on the performance of bondingsystems have used sound dentin on the pulp chamber asa substrate, even though caries-affected dentin on thegingival wall is often the clinically relevant bonding sub-strate. Dentin tubule orientation is different betweenthe pulpal and gingival walls of Class II cavities. Whendifferent adhesive systems were used on caries-affecteddentin on the gingival wall, bond strengths may changeaccording to the bonding mechanism and chemical com-position of the adhesives. In this study, the application ofCervitec, a chlorhexidine and thymol-containing varnishto caries-affected dentin decreased bond strengths com-pared to sound dentin. However, Micro Prime andGluma Desensitizer increased bond strengths to caries-affected dentin.
CONCLUSIONS
Based on the results obtained in this study, the authorsfeel that desensitizers containing the acidic ingredient
HEMA can be used safely on caries-affected dentin.However, care should be taken with chlorhexidine con-taining varnishes.
(Received 11 February 2004)
Acknowledgement
The authors thank Yusuf Kitiz and Turgut Endes from KOSGEBfor their technical help.
References
Baca P & Liébana J editors (1995) [Microbiologia de la caries den-tal] in Microbiologia Oral Madrid Interamericana p 447-462.
Björndal L & Larsen T (2000) Changes in the cultivable flora indeep carious lesions following a stepwise excavation procedureCaries Research 34(6) 502-508.
Bowden GH (1990) Microbiology of root surface caries in humansJournal of Dental Research 69(5) 1205-1210. Review.
Brännström M (1986) The cause of post-restorative sensitivityand its prevention Journal of Endodontics 12(10) 475-481.
Camps J, Pizant S, Dejou J & Franquin JC (1998) Effects ofdesensitizing agents on human dentin permeability AmericanJournal of Dentistry 11(6) 286-290.
Chan DCN & Lo WW (1994) Residual antimicrobial action of ben-zalkonium chloride-containing etchant Journal of Dental Research73 IADR Abstract (Special Issue) Abstract #995 p 226.
Daculsi G, Kerebel B, Le Cabellec MT & Kerebel LM (1979)Qualitative and quantitative data on arrested caries in dentineCaries Research 13(4) 190-202.
Duran I, Sengun A, Hadimli HH, Ulker M & Ozer F (2003)Evaluation of antibacterial effectiveness of desensitizersagainst oral bacteria Journal of Dental Research 82 Abstract#759 p B-107.
Fraga RC, Siqueira JF Jr & de Uzeda M (1996) In vitro evalua-tion of antibacterial effects of photo-cured glass ionomer linersand dentin bonding agents during setting Journal of ProstheticDentistry 76(5) 483-486.
Gwinnett AJ (1993) Quantitative contribution of resin infiltra-tion/hybridization to dentin bonding American Journal ofDentistry 6(1) 7-9.
Hamid A, Sutton W & Hume WR (1996) Variation in phosphoricacid concentration and treatment time and HEMA diffusionthrough dentin American Journal of Dentistry 9(5) 211-214.
Imazato S, Imai T & Ebisu S (1998) Antibacterial activity of pro-prietary self-etching primers American Journal of Dentistry11(3) 106-108.
Imazato S, Kinomoto Y, Tarumi H, Torii M, Russell RR & McCabeJF (1997) Incorporation of antibacterial monomer MDPB intodentin primer Journal of Dental Research 76(13) 768-772.
Jain P, Vargas MA, Denehy GE & Boyer DB (1997) Dentin desen-sitizing agents: SEM and X-ray microanalysis assessmentAmerican Journal of Dentistry 10(1) 21-26.
Kwong SM, Tay FR, Yip HK, Kei LH & Pashley DH (2000) Anultrastructural study of the application of dentine adhesives toacid-conditioned sclerotic dentine Journal of Dentistry 28(7)515-528.
Dow
nloaded from http://m
eridian.allenpress.com/operative-dentistry/article-pdf/30/4/1/1819389/1559-2863-30-4-1.pdf by guest on 12 January 2022

435Sengun & Others: Effect of Desensitizers on the Bond Strength of a Self-etching Adhesive System
Meiers JC & Miller GA (1996) Antibacterial activity of dentinbonding systems, resin-modified glass ionomers, and polyacid-modified composite resin Operative Dentistry 21(6) 257-264.
Munshi AK, Reddy NN & Shetty V (2001) A comparative evalua-tion of three fluoride varnishes: An in-vitro study Journal of theIndian Society of Periodontics and Preventive Dentistry 19 92-102.
Murata Y, Miyamoto E & Ueda M (1990) Antiplaque activity ofsome antimicrobial agents using a simple in vitro methodCaries Research 24(2) 113-116.
Nakajima M, Ogata M, Okuda M, Tagami J, Sano H & PashleyDH (1999) Bonding to caries-affected dentin using self-etchingprimers American Journal of Dentistry 12(6) 309-314.
Owens BM, Lim DY & Arheart KL (2003) The effect of antimi-crobial pre-treatments on the performance of resin compositerestorations Operative Dentistry 28(6) 716-722.
Pashley EL, Talman R, Horner JA & Pashley DH (1991)Permeability of normal versus carious dentin Endodontics &Dental Traumatology 7(5) 207-211.
Pashley EL, Tao L & Pashley DH (1993) Sterilization of humanteeth: Its effect on permeability and bond strength AmericanJournal of Dentistry 6(4) 189-191.
Perdigão J, Swift EJ Jr & Cloe BC (1993) Effects of etchants, sur-face moisture, and composite resin on dentin bond strengthsAmerican Journal of Dentistry 6(2) 61-64.
Santini A & Mitchell S (1998) Effect of wet and dry bonding tech-niques on marginal leakage American Journal of Dentistry11(5) 219-224.
Seara SF, Erthal BS, Ribeiro M, Kroll L & Pereira GD (2002) Theinfluence of a dentin desensitizer on the microtensile bondstrength of two bonding systems Operative Dentistry 27(2) 154-160.
Sengun A, Unlu N, Ozer F & Oztürk B (2002) Bond strength offive current adhesives to caries-affected dentin Journal of OralRehabilitation 29(8) 777-781.
Settembrini L, Boylan R, Strassler H & Scherer W (1997) A com-parison of antimicrobial activity of etchants used for a totaletch technique Operative Dentistry 22(2) 84-88.
Tagami J, Tao L & Pashley DH (1990) Correlation among dentindepth, permeability, and bond strength of adhesive resinsDental Materials 6(1) 45-50.
Titley K, Chernecky R, Maric B & Smith D (1994) Penetration ofa dentin bonding agent into dentin American Journal ofDentistry 7(4) 190-194.
Vahdaty A, Pitt Ford TR & Wilson RF (1993) Efficacy of chlorhex-idine in disinfecting dentinal tubules in vitro Endodontics &Dental Traumatology 9(6) 243-248.
Weerheijm KL & Groen HJ (1999) The residual caries dilemmaCommunity Dentistry and Oral Epidemiology 27(6) 436-441.
Yoshiyama M, Tay FR, Doi J, Nishitani Y, Yamada T, Itou K,Carvalho RM, Nakajima M & Pashley DH (2002) Bonding ofself-etch and total-etch adhesives to carious dentin Journal ofDental Research 81(8) 556-560.
Dow
nloaded from http://m
eridian.allenpress.com/operative-dentistry/article-pdf/30/4/1/1819389/1559-2863-30-4-1.pdf by guest on 12 January 2022

Color and Translucency ofA2 Shade Resin CompositesAfter Curing, Polishing and
Thermocycling
©Operative Dentistry, 2005, 30-4, 436-442
Y-K Lee • B-S Lim • S-H RheeH-C Yang • JM Powers
SUMMARY
This study determined the differences in valuesand changes of color and translucency of eightbrands of A2 shade resin composites after curing,polishing and thermocycling (TC). The color ofspecimens 10-mm in diameter and 2-mm thickwas measured on a reflection spectrophotometerwith SCE geometry under D65 illumination over
a white and black background. Measurementswere obtained before curing, after curing, afterpolishing and after TC. The color change (∆E*ab),translucency parameter (TP) and contrast ratio(CR) were then compared. The range of ∆E*abafter curing was 3.8 to 10.2 (average ∆E*ab for theeight composites = 6.4), which was deemed per-ceptible to the observer. Polishing caused ∆E*abof 1.9 to 4.5, which was perceptible in five of theeight composites. After 2,000 TC, ∆E*ab was 0.4 to1.3. TP values tended to increase after curing anddecrease after TC (range before curing was 7.1 to17.2). Changes in TP values after curing were sta-tistically significant in all composites (p<0.05).Changes in CR values were similar to the translu-cency changes in TP. Though the compositeshades were all designated as A2, color coordi-nates, TP and CR values, changes in color andtranslucency after curing, polishing and thermo-cycling varied by brand.
INTRODUCTION
With increasing patient demand for an esthetic denti-tion, resin composite restorations enjoy great popularitydue to their excellent esthetics, acceptable longevity andrelatively low cost. However, the relatively significant
*Yong-Keun Lee, DDS, PhD, associate professor, Departmentof Dental Biomaterials Science, Dental Research Institute,College of Dentistry, Seoul National University, Seoul, Korea
Bum-Soon Lim, associate professor, Department of DentalBiomaterials Science, Dental Research Institute, College ofDentistry, Seoul National University, Seoul, Korea
Sang-Hoon Rhee, PhD, assistant professor, Department ofDental Biomaterials Science, Dental Research Institute,College of Dentistry, Seoul National University, Seoul, Korea
Hyeong-Cheol Yang, PhD, assistant professor, Department ofDental Biomaterials Science, Dental Research Institute,College of Dentistry, Seoul National University, Seoul, Korea
John M Powers, PhD, professor, Department of RestorativeDentistry and Biomaterials, Houston Biomaterials ResearchCenter, The University of Texas Dental Branch at Houston,Houston, TX, USA
*Reprint request: 28 Yeongeon-dong, Jongro-gu, Seoul, Korea;e-mail: [email protected]
Clinical Relevance
Color changes from pre-cure to post-cure shades were perceptible in all compositesstudied (∆E*ab>3.8), and polishing caused perceptible color changes in some composites(∆E*ab=1.9-4.5). This study supports the clinical practice of curing a small amount of com-posites in the tooth to select the desired shade before esthetic restorative procedures.
Dow
nloaded from http://m
eridian.allenpress.com/operative-dentistry/article-pdf/30/4/1/1819389/1559-2863-30-4-1.pdf by guest on 12 January 2022

Lee & Others: Color Difference of A2 Shade Resin Composites
color changes of resin composites after curing and agingindicate that these changes must be taken into accountduring initial clinical shade match at placement of theuncured composite (Johnston & Reisbick, 1997).
Several studies on the color changes of resin compos-ites after curing and aging have reported significantcolor changes, and the magnitude of color change variedby the characteristics of the composites (Eldiwany,Friedl & Powers, 1995; Lee & Powers, 2001). Also, thecolor change of resin composites after curing showedcharacteristic chromatic shifts (Seghi, Gritz & Kim,1990). Since human enamel has inherent translucency,esthetic restorations should reproduce the translucencyof natural teeth (Paul & others, 1996; Arikawa & others,1998). Relatively high variability in translucencychanges after curing and aging has been shown amongresin composites, with some products increasing andothers decreasing (Johnston & Reisbick, 1997). The sig-nificant changes in color and translucency that occurwhen resin composites are cured, stored or processedunder various conditions indicate that such changesshould be taken into account when these materials are used.
The optical properties of dental resin composites arealso influenced by surface changes during the restora-tive procedures of finishing and polishing (Chung,1994). Colors change with the varied surface conditionsof materials and this difference was perceptible in someof the tested materials (Lee, Lim & Kim, 2002; Kim &others, 2003).
There also may be differences among composites withthe same shade designation in the changes of opticalproperties after curing, polishing and aging. This study
evaluated the values and changes of color and translu-cency after curing, polishing and thermocycling of eightresin composites.
METHODS AND MATERIALS
Eight light-curing resin composites designated as A2body shade were studied (Table 1).
After applying a drop of optical fluid (refractive index= 1.5) on a white or black background and laying acover glass on the background, the resin compositeswere packed into a polytetrafluoroethylene mold (10mm in diameter and 2-mm thick) on a cover glass.Optical fluid was placed between the cover glass andbackground so that an optical connection was achieved(Eldiwany & others, 1995). After packing the com-posite, another cover glass was pressed on top of thespecimen and pressed with a 5-kg load for three min-utes to produce a uniform thickness. Color and spectralreflectance measurements before curing were obtainedwith the two cover glasses attached. Five specimenswere employed for each material.
The specimens were light cured for 40 seconds inthree overlapping areas with a light-curing unit(Spectrum 800, Dentsply/Caulk, Milford, DE, USA)with an intensity setting of 400 mW/cm2. The output ofthe curing light was checked with a radiometer(SDS/Kerr, Orange, CA, USA). “After curing” colormeasurements were made after storage in distilledwater for 24 hours and blot drying. The specimens werethen polished with 1,500-grit wet SiC paper on bothsides. The final specimen thickness was 1.97 ± 0.10mm. The color after polishing was measured afterimmersion in distilled water for 24 hours and blot
437
Code Brand Name Composition Batch # Manufacturer
CHR Charisma BisGMA matrix, 65 vol% (76 wt%) barium 070066 Heraeus Kulzer, Wehrheim, aluminum fluoride glass filler of 0.02-2 µm, Germany5 vol% pyrogenic silicon dioxide filler of 0.02-0.07 µm
CLF Clearfil AP-X BisGMA and TEGDMA matrix, barium glass 759AA Kuraray, Okayama, Japanand colloidal silica filler
ESX Esthet X Micro matrix restorative, 60 vol% filler of 0302132 Dentsply/Caulk, Milford, DE, USA0.6-0.8 µm
FSP Filtek Supreme 58-60 vol% (78.5 wt%) combination of 3BK 3M ESPE, St Paul, MN, USAaggregated zirconia/silica cluster filler withprimary particle size of 5-20 nm, and anon-agglomerated/non-aggregated 20 nmsilica filler
PAE Palfique Estelite 71 vol% (82 wt%) submicron zirconia YE616233 Tokuyama Dental Corp, Tokyo, spherical filler of 0.2 µm and composite filler Japan
PO4 Point 4 57 vol% (75 wt%) inorganic filler of 0.04 µm 203498 SDS/Kerr, Orange, CA, USA
TEC Tetric Ceram 60 vol% (79 wt%) filler of 0.04-3.0 µm F56709 Ivoclar Vivadent, Liechtenstein(average 0.7 µm)
TPH TPH Spectrum 57 vol% (77 wt %) bariumaluminoborosilicate 0301281 Dentsply/Caulk, Milford, DE, USAglass and highly dispersed silicon dioxide ofsubmicron filler (0.8 µm)
Table 1: Materials Used in This Study
Dow
nloaded from http://m
eridian.allenpress.com/operative-dentistry/article-pdf/30/4/1/1819389/1559-2863-30-4-1.pdf by guest on 12 January 2022

438 Operative Dentistry
drying. Thermocycling (TC) was then performed for2,000 cycles between 5°C and 55°C in distilled waterand the color was measured after blot drying.
The color was measured according to the CIELABcolor scale relative to the standard illuminant D65against a white background (CIE L*=96.68, a*=-0.18,and b*=-0.22) and a black background (CIE L*=1.15,a*=-0.11, and b*=-0.50) on a reflection spectrophotometer(CM-3500d, Minolta, Osaka, Japan) with specular com-ponent excluded (SCE) geometry. The illuminating andviewing configuration was CIE diffuse/10˚ geometry.
Color change (∆E*ab) was calculated by the followingequation, with the color coordinates over the whitebackground; ∆E*ab=[(∆L*)2 + (∆a*)2 + (∆b*)2]1/2. Thetranslucency parameter (TP) was obtained by calcul-ating the color difference between the specimen overthe white background and the specimen over the blackbackground; TP= [(LB*-LW*)2 + (ab*-aW*)2 + (bB*-bW*)2]1/2, where subscript B refers to the color parame-ters over the black background and subscript W refersto those over the white background (Johnston, Ma &Kienle, 1995). The contrast ratio (CR) was calculatedfrom the luminous reflectance (Y) of the specimens witha black (Yb) and white (Yw) backing to give Yb/Yw (0.0= transparent, 1.0 = opaque) (Craig & Powers, 2001).
Differences in the values and changes in color, TP andCR by the composites and specimen conditions wereanalyzed by analysis of variance and Scheffe’s multiplerange tests (SPSS 11.0, SPSS, Chicago, IL, USA,p=0.05). Multiple regression analysis was used to deter-mine the correlation among the color changes and CIEL*, a*, b*, TP and CR values of specimens. Also, multipleregression analysis was used to determine the correla-tion among the color changes and changes in CIE L*,a*, b*, TP and CR values. Regression analysis with for-ward data input was selected (p=0.01). When the toler-ance between independent variables was lower than0.3, the variable with the lower β value (= standardized
correlation coefficient of each variable) was excludedfrom the regression (Norman & Streiner, 1994).
RESULTS
CIE L* values before curing ranged from 69.2 to 77.5,and ranged from 65.6 to 73.7 after curing. The range ofchanges in CIE L* value was from –4.2 to 1.8 aftercuring, from 1.3 to 4.4 after polishing and from –0.9 to–0.2 after TC. CIE a* values before curing ranged from3.3 to 5.8 and from 2.2 to 6.1 after curing. The range ofchanges in CIE a* value was from –0.7 to 0.6 aftercuring, from –0.5 to 0.5 after polishing and from –0.4 to0.5 after TC. CIE b* values before curing ranged from21.0 to 32.3 and ranged from 15.8 to 25.8 after curing.The range of changes in CIE b* value ranged from –9.2to –0.9 after curing, from –1.8 to 0.5 after polishing andfrom –1.0 to 0.3 after TC. Figure 1 presents the vecto-rial changes of CIE a* and b* values from before curingto after curing, and those before and after polishing arepresented in Figure 2. Arrow tails indicate before curingor polishing values and arrow heads indicate aftercuring or polishing values. After curing, changes in CIEa* varied by composite, however, CIE b* decreased inall composites tested. After polishing, CIE a* and b*increased or decreased by composites. The magnitude ofchanges were higher after curing than after polishing.
∆E*ab values after curing, polishing and TC are listedin Table 2. Changes in color varied by composite(p<0.05). Average ∆E*ab of the eight composites aftercuring was 6.4, and this value was significantly higherthan those after polishing (3.3) or after TC (0.8). Therange of ∆E*ab was 3.8 to 10.2 after curing, 1.9 to 4.5after polishing and 0.4 to 1.3 after TC.
TP values before curing, after curing, after polishingand after TC are listed in Table 3. TP values varied bycomposite (p<0.05). The average TP value of eight com-posites before curing was 11.1, and this value was sta-tistically significantly lower than those after curing,
Figure 1. Changes in color coordinates after curing. Figure 2. Changes in color coordinates after polishing.
Dow
nloaded from http://m
eridian.allenpress.com/operative-dentistry/article-pdf/30/4/1/1819389/1559-2863-30-4-1.pdf by guest on 12 January 2022

Lee & Others: Color Difference of A2 Shade Resin Composites
after polishing and after TC (13.9, 14.5 and 14.4,respectively). The range of TP values before curing was7.1 to 17.2, 11.5 to 15.8 after curing, 11.4 to 17.6 afterpolishing and 11.2 to 17.4 after TC. TP increased aftercuring except for ESX and PAE. Changes in TP afterpolishing varied by composite. TP generally decreasedafter TC.
CR values are listed in Table 4. CR values varied bycomposite (p<0.05). Changes in CR values by compositeand specimen conditions were similar to the changes intranslucency measured in TP. The correlation coeffi-cient between TP and CR was -0.88 before curing, -0.79after curing, -0.85 after polishing and -0.85 after TC.
The results of multiple regression analyses among∆E*ab values and three-color coordinates (CIE L*, a*and b*), TP and CR of before-and-after each correspon-ding condition (10 independent variables) are listed inTable 5. CR, CIE a* and CIE b* weresignificant predictors depending on thecondition (p<0.01). Color change aftercuring was highly correlated with CRvalues.
The results of multiple regressionanalyses among ∆E*ab values andchanges in three-color coordinates, TPand CR after each corresponding con-dition (five independent variables) arelisted in Table 6. ∆b*, ∆L*, ∆CR and∆a* were significant predictorsdepending on the condition (p<0.01).And the multiple correlation coeffi-cients (r) were as high as 0.94-0.99.
DISCUSSION
In this study, the color changes aftercuring varied among composites(p<0.05). FSP and PO4 showed rela-tively small color changes (∆E*ab<4.0);however, CHR, CLF andESX showed greater colorchanges (∆E*ab>9.1). Asthe color change aftercuring was perceptible(∆E*ab>3.8) for all com-posites studied, the clini-cal practice of curingsome composite on thetooth to select shades ofcomposites beforerestorative procedures isprudent.
In previous studies,measurement with SCEgeometry has resulted inaccurate color determina-
tion (Lee & others, 2002). Therefore, SCE geometrywas employed in this study considering the fact thatthe surface could be changed after polishing and TC. Inthis study, the range of three color coordinates was sig-nificant, though the shade designation was A2. The fullrange of CIE L* value was about eight units, that ofCIE a* value was about 3 to 4 units and that of CIE b*value was about 9 to 11 units (Figures 1 and 2).
Regression analysis was performed to determinewhich color parameter significantly influenced the colorchange (Table 5). The results after curing indicatedthat CR before curing (standardized correlation coeffi-cient; β=-1.04) and CR after curing (β=0.60) significantlyinfluenced curing color change. Thus, when translucencybefore curing was high (low CR value), the color changeduring curing procedure was high. Low translucencyafter curing (high CR value) was correlated with
439
Code Before Cure After Cure After Polish After TC DGa
(Gr 1) (Gr 2) (Gr 3) (Gr 4)
CHR 11.2 (0.1)b4 15.8 (0.1)5 17.6 (0.8)5 17.4 (0.9)5 1<2<4,3
CLF 10.7 (0.3)34 14.7 (0.4)4 14.1 (0.2)23 13.5 (0.1)23 1<4<3<2
ESX 13.8 (0.3)5 12.5 (0.2)2 13.5 (0.6)2 13.3 (0.6)2 2<4.3,1
FSP 8.8 (0.5)2 11.5 (0.4)1 11.4 (0.4)1 11.2 (0.6)1 1<4.3,2
PAE 17.2 (0.7)6 15.1 (0.3)4 15.5 (0.6)45 15.5 (0.6)4 2.3.4<1
PO4 8.3 (0.4)2 13.4 (0.3)3 14.7 (0.3)34 14.5 (0.5)34 1<2<4,3
TEC 10.1 (0.4)3 15.3 (0.6)45 16.2 (0.9)5 16.9 (0.8)5 1<2<3,4
TPH 7.1 (0.1)1 13.0 (0.1)23 13.2 (0.3)2 12.9 (0.4)2 1<4.2,3
AVG 11.1 (3.1) 13.9 (1.5) 14.5 (1.9) 14.4 (2.1) 1<2.4,3
a: DG = Different groups by the specimen condition. "<" means significantly different group marker (Scheffe test, p<0.05).b: Standard deviations are in parentheses.
Same superscript number means not-significantly different group in the same column.
Table 3: Translucency Parameter (TP) After Curing, Polishing and Thermocycling (n=5)
Code After Curea After Polishb After TCc DGd
(Gr 1) (Gr 2) (Gr 3)
CHR 9.2 (0.2)e4 4.5 (1.0)4 0.9 (0.2)3 3<2<1
CLF 10.2 (0.3)5 3.0 (0.1)23 1.3 (0.1)4 3<2<1
ESX 9.1 (0.2)4 3.4 (0.4)23 0.9 (0.1)23 3<2<1
FSP 3.8 (0.4)1 3.5 (0.3)23 0.4 (0.1)1 3<2,1
PAE 5.7 (0.3)3 1.9 (0.3)1 0.6 (0.2)12 3<2<1
PO4 4.0 (0.2)12 3.6 (0.3)34 0.7 (0.1)23 3<2<1
TEC 4.4 (0.2)2 3.8 (0.7)34 0.4 (0.2)1 3<2<1
TPH 6.0 (0.2)3 2.6 (0.5)12 1.0 (0.2)34 3<2<1
AVG 6.4 (0.4) 3.3 (0.9) 0.8 (0.3) 3<2<1
a: Between uncured and cured specimens. After curing, Mylar strip was removed and specimen immersed in DW for 24 hours and blot dried before measurement.
b: Between cured and polished specimens. Both specimens were in wet condition.c: Between polished and thermocycled specimens. Both specimens were in wet condition.d: DG = Different groups by the specimen condition. “<” means significantly different group marker (Scheffe test, p<0.05).e: Standard deviations are in parentheses.
Same superscript number means not-significantly different group.
Table 2: Color Change (∆E*ab) After Curing, Polishing and Thermocycling (n=5)
Dow
nloaded from http://m
eridian.allenpress.com/operative-dentistry/article-pdf/30/4/1/1819389/1559-2863-30-4-1.pdf by guest on 12 January 2022

440 Operative Dentistry
limited color change dur-ing the curing procedure.Color changes after thecuring and aging of resincomposites of conven-tional and bleachedshades were determined(Lee & Powers, 2001). Asa result, higher CIE a*and b* values had a nega-tive influence on the colorchange for both curingand aging. In this study,the results of similarregression analysesamong ∆E*ab values aftercuring and color parame-ters indicated that CRvalues had significant influence on curingcolor change. This discrepancy in resultsreflects the fact that the difference in colorcoordinates of this study was relativelysmall compared to the previous study,because the color designation was the sameas A2 and the change in translucency aftercuring was prominent.
Regression analysis was also performed todetermine the degree of change to whichcolor parameter influenced color change(Table 6). The results after curing indicatedthat ∆b* (β=-1.04) and ∆L* (β=-0.15) signifi-cantly influenced color change. This resultwas in part coincidental with a previousstudy (Yap, Sim & Loganathan, 1999) wherechanges in CIE L* value were significantafter curing. In general, light-cured compos-ites produce a characteristic chromatic shifttoward the blue region of color space, whichresult in a perceived decrease in yellow chro-ma (Seghi & others, 1990). In this study, therange of changes in CIE b* value after cur-ing was –9.2 to –0.9, and six of nine compos-ites showed changes of more than 3.3 unitsthat could make color difference higher thanthe perceptible limit of 3.3 in ∆E*ab unit(Ruyter, Nilner & Moller, 1987).
Color and TP changes after the curing of resin com-posites have been evaluated. There was relatively highvariability in both lightness and TP changes, with someproducts increasing and others decreasing (Johnston &Reisbick, 1997). In this study, changes in CIE L* andCIE b* values after curing ranged from –4.2 to 1.8 and–9.2 to –0.9, respectively. Lightness decreased in mostmaterials and hue shifted due to the blue direction(higher CIE b* value after curing). TP values increasedafter curing except for ESX and PAE (p<0.05). TP values
increased or decreased after polishing and decreasedafter TC. Changes in translucency after long-termexposure to the oral cavity might contribute to shademismatches. A greater TP value is indicative of greatertranslucency or less opacity. The TP is specific for agiven thickness of material and for the backing used.The clinical meaning of TP would vary, depending onthe application of the material. Currently, a TP func-tions only to specify the translucency of the material,and further research is indicated to determine theeffects of changes in the TP on any changes in appear-
Code Before Cure After Cure After Polish After TC DGa
(Gr 1) (Gr 2) (Gr 3) (Gr 4)
CHR 0.82 (0.10)2 0.74 (0.14)2 0.72 (0.15)1 0.72 (0.15)1 4.3<2<1
CLF 0.85 (0.10)23 0.76 (0.13)3 0.77 (0.12)34 0.78 (0.12)3 2<3,4<1
ESX 0.78 (0.12)1 0.80 (0.13)5 0.79 (0.13)4 0.79 (0.13)3 1.4<2
FSP 0.85 (0.09)23 0.79 (0.11)4 0.79 (0.11)4 0.79 (0.11)3 2.3,4<1
PAE 0.76 (0.16)1 0.73 (0.12)1 0.72 (0.12)1 0.72 (0.12)1 3.4,2<1
PO4 0.89 (0.09)4 0.80 (0.13)45 0.78 (0.13)34 0.78 (0.13)3 4.3<2<1
TEC 0.87 (0.10)34 0.76 (0.11)3 0.75 (0.13)2 0.74 (0.14)12 4.3,2<1
TPH 0.87 (0.09)34 0.76 (0.11)3 0.76 (0.11)23 0.76 (0.11)23 3.4,2<1
AVG 0.84 (0.05) 0.77 (0.03) 0.76 (0.03) 0.76 (0.03) 4.3,2<1
a: DG = Different groups by the specimen condition. “<” means significantly different group marker (Scheffe test, p<0.05).b: Standard deviations are in parentheses.
Same superscript number means not-significantly different group.
Table 4: Contrast Ratio (CR) After Curing, Polishing and Thermocycling (n=5)
Color Change Influencing Parametersa in Orders
∆E*ab after curing CR before curing (βb=-1.04), CR after curing (βb=0.60)rc=1.00
∆E*ab after polishing CIE a* (βb=0.43) after curingrc=0.43
∆E*ab after CIE b* (βb=0.318) after thermocyclingthermocycling rc=0.32a:Results from multiple regression among the color change and three color coordinates (CIE L*, a* and b*), TP
value and CR value of before- and after- each corresponding condition (10 independent variables).b:Standardized correlation coefficient.c:Multiple correlation coefficient.
Table 5: Influencing Color Parameters on the Color Change
Color change Influencing Changes of Parametersa in Orders
∆E*ab after curing ∆b* after curing (βb=-1.04), ∆L* after curing (βb=-0.15)rc=0.99
∆E*ab after polishing ∆L* after polishing (βb=1.05), ∆b* (βb=-0.11) after polishingrc=0.98
∆E*ab after ∆L* after TC (βb=-0.72), ∆b* (βb=-0.73) after TCthermocycling ∆CR after TC (βb=0.23), ∆a* after TC (βb=-0.15)
rc=0.94a: Results from multiple regression among the color change and changes in three-color coordinates, TP value
and CR value of each corresponding condition (5 independent variables).b: Standardized correlation coefficient.c: Multiple correlation coefficient.
Table 6: Influencing “Change of Color Parameters” on the Color Change
Dow
nloaded from http://m
eridian.allenpress.com/operative-dentistry/article-pdf/30/4/1/1819389/1559-2863-30-4-1.pdf by guest on 12 January 2022

Lee & Others: Color Difference of A2 Shade Resin Composites
ance (Johnston & Reisbick, 1997). Nevertheless, six ofthe eight composites in this study showed a significantincrease in TP after curing. Therefore, the change intranslucency after curing was significant.
The change in color and TP values after the curing ofcomposites in previous studies has been reported.∆E*ab after curing varied from 3.7 to 12.0; whereas, theTP values of cured resin composites varied from 2.0 to7.1 (Paravina, Ontiveros & Powers, 2002). In this study,although the filler type of seven composites was hybridand only one (FSP) was nanofilled, the changes in colorand TP value after curing were significant for all thematerials. Curing-dependent color and TP changesindicate that dentists should use cured composite formatching shade and translucency.
The color stability of composites under various physi-co-chemical conditions improved when materialsshowed low water sorption, high filler-resin ratio,reduced particle size and hardness and an optimalfiller-matrix coupling system. Optimal coupling meantdirect grafting of the resin to the filler, thus providingthe composite with lower water sorption rates (Dietschi& others, 1994). In this study, the color changes afterTC were small, so although these values were statisti-cally significantly different among the compositestested, none would reveal a clinically discernible colorshift. These results may reflect differences in the prop-erties of composites suggested in the Dietschi and others(1994) study.
Translucency of all-ceramic systems was measured byCR value (Heffernan & others, 2002a,b). In this study,CR values were 0.76 to 0.89 before curing, 0.73 to 0.80after curing, 0.72 to 0.79 after polishing and 0.72 to0.79 after TC, with a final specimen thickness of 1.97mm. Translucency varied even though shade designa-tion and thickness were the same. After polishing, CRvalues decreased for CHR and PO4 and increased forCLF (p<0.05). Therefore, the influence of polishing onthe translucency of resin composites varied among thecomposites tested. Such variability could potentiallyinfluence their ability to match natural teeth.
Changes in the translucency of resin composites havebeen examined after immersion in 60°C water. Somecomposites demonstrated a significant decrease intranslucency (6% to 7%) after water immersion(Nakamura & others, 2002). In this study, TP valueschanged slightly after TC, but in general, the valuesbefore and after TC were not different (p>0.05). Thisdiscrepancy may be the result of differences in theaging method. Opacity decrease has been reported to bea factor in discoloration for some tooth-colored restora-tive materials and might be caused by a refractiveindex change in the matrix phase of the materials(Inokoshi & others, 1996). In this study, the results ofmultiple regression analysis among ∆E*ab values after
TC and changes in color parameters indicated thatchanges in CR significantly influenced color change(β=0.23, Table 6). Therefore, it was reconfirmed thatchanges in translucency significantly influenced thecolor change after TC, although other variables alsoinfluenced color change. Considering the fact that theinfinite optical thickness at which the reflectance of amaterial with an ideal black background would attain99.9% of its light reflectivity of resin compositesranged from 3.0 to 5.9 mm (Powers, Yeh & Miyagawa,1983), changes in translucency could be a major con-tributing factor for color mismatch intraorally afterlong-term service.
CONCLUSIONS
Although shade designation of the composites used inthis study was the same as A2, color coordinates (CIEL*, a* and b*), TP and CR values and changes in colorand translucency after curing, polishing and thermocy-cling varied significantly by brand of composite. Colorchanges after curing were perceptible in all composites(∆E*ab>3.8), and polishing caused perceptible colorchanges in five of the eight materials (∆E*ab=1.9-4.5).However, color change after thermocycling was negligi-ble (∆E*ab=0.4-1.3).
Acknowledgement
This study was supported by the Korea Science and EngineeringFoundation (KOSEF) through the Intellectual BiointerfaceEngineering Center at the Seoul National University.
(Received 23 February 2004)
References
Arikawa H, Fujii K, Kanie T & Inoue K (1998) Light transmit-tance characteristics of light-cured composite resins DentalMaterials 14(6) 405-411.
Chung KH (1994) Effects of finishing and polishing procedureson the surface texture of resin composites Dental Materials 10(5) 325-330.
Craig RG & Powers JM (2001) Restorative Dental Materials 11th
ed St Louis CV Mosby p 39-42.
Dietschi D, Campanile G, Holz J & Meyer JM (1994) Comparisonof the color stability of ten new-generation composites: An invitro study Dental Materials 10(6) 353-362.
Eldiwany M, Friedl KH & Powers JM (1995) Color stability oflight-cured and post-cured composites American Journal ofDentistry 8(4) 179-181.
Heffernan MJ, Aquilino SA, Diaz-Arnold AM, Haselton DR,Stanford CM & Vargas MA (2002a) Relative translucency ofsix all-ceramic systems. Part I: Core materials Journal ofProsthetic Dentistry 88(1) 4-9.
Heffernan MJ, Aquilino SA, Diaz-Arnold AM, Haselton DR,Stanford CM & Vargas MA (2002b) Relative translucency ofsix all-ceramic systems. Part II: Core and veneer materialsJournal of Prosthetic Dentistry 88(1) 10-15.
441
Dow
nloaded from http://m
eridian.allenpress.com/operative-dentistry/article-pdf/30/4/1/1819389/1559-2863-30-4-1.pdf by guest on 12 January 2022

442 Operative Dentistry
Inokoshi S, Burrows MF, Kataumi M, Yamada T & Takatsu T(1996) Opacity and color changes of tooth-colored restorativematerials Operative Dentistry 21(2) 73-80.
Johnston WM, Ma T & Kienle BH (1995) Translucency parame-ter of colorants for maxillofacial prostheses InternationalJournal of Prosthodontics 8(1) 79-86.
Johnston WM & Reisbick MH (1997) Color and translucencychanges during and after curing of esthetic restorative mate-rials Dental Materials 13(2) 89-97.
Kim IJ, Lee YK, Lim BS & Kim CW (2003) Effect of surfacetopography on the color of dental porcelain Journal ofMaterials Science Materials in Medicine 14(5) 405-409.
Lee YK, Lim BS & Kim CW (2002) Effect of surface conditions onthe color of dental resin composites Journal of BiomedicalMaterials Research Applied Biomaterials 63(5) 657-663.
Lee YK & Powers JM (2001) Color and optical properties of resincomposites for bleached teeth after polymerization and accel-erated aging American Journal of Dentistry 14(6) 349-354.
Nakamura T, Saito O, Mizuno M & Tanaka H (2002) Changes intranslucency and color of particulate filler composite resinsInternational Journal of Prosthodontics 15(5) 494-499.
Norman GR & Streiner DL (1994) Biostatistics: The BareEssentials St Louis CV Mosby p 100-116.
Paravina RD, Ontiveros JC & Powers JM (2002) Curing-depend-ent changes in color and translucency parameter of compositebleach shades Journal of Esthetic and Restorative Dentistry14(3) 158-166.
Paul SJ, Pliska P, Pietrobon N & Scharer P (1996) Light trans-mission of composite luting resins International Journal ofPeriodontics & Restorative Dentistry 16(2) 164-173.
Powers JM, Yeh CL & Miyagawa Y (1983) Optical properties ofcomposites of selected shades in white light Journal of OralRehabilitation 10(4) 319-324.
Ruyter IE, Nilner K & Moller B (1987) Color stability of dentalcomposite resin materials for crown and bridge veneers DentalMaterials 3(5) 246-251.
Seghi RR, Gritz MD & Kim J (1990) Colorimetric changes in com-posites resulting from visible-light-initiated polymerizationDental Materials 6(2) 133-137.
Yap AU, Sim CP & Loganathan V (1999) Polymerization colorchanges of esthetic restoratives Operative Dentistry 24(5) 306-311.
Dow
nloaded from http://m
eridian.allenpress.com/operative-dentistry/article-pdf/30/4/1/1819389/1559-2863-30-4-1.pdf by guest on 12 January 2022

Degree of Remaining C=C Bonds,Polymerization Shrinkage
and Stresses of Dual-curedCore Build-up Resin Composites
SUMMARY
This study measured the degree of remainingC=C bonds (RDB), linear polymerization shrink-age (LPS) and polymerization stresses (PS) ofdual-cured resin composite build-up materialsusing a variety of light exposure scenarios.
Four commercially available materials wereused: Bis-Core, FluoroCore, Build-it! andPermalute. The RDB was measured using FTIRspectroscopy, and custom-made devices wereused to measure LPS and PS values. Data wereobtained using three different modes of photo-
activation: NLC (No Light-Curing); ILC(Immediate Light-Curing, where 60 second light-curing was applied at the start of the observationperiod); and DLC (Delayed Light-Curing, where60-second light-curing was applied 10 minutesfrom the start of the observation period).Statistical evaluation of the data at the end of the13-minute observation period was performedwith two-way analysis of variance (ANOVA),Tukey’s Studentized Range (HSD) Test (p=0.05)and simple linear regression. Differences in thedevelopment of LPS and PS during the 13 min-utes were studied using mathematical calculus.
Bis-Core presented the highest RDB andPermalute the lowest when ILC was applied,while no differences were found between Build-it! and FluoroCore and NLC and DLC increasedRDB for FluoroCore and Permalute compared toILC; whereas, no differences were noted forBuild-it! and Bis-Core. Using DLC, a decrease inRDB was found only for Build-it!
Permalute and Bis-Core presented the highestand lowest LPS and PS after ILC, accordingly.Higher LPS and PS were recorded for Build-it!compared to Fluorocore in the ILC group.
MM Stavridakis • AI Kakaboura • I Krejci
Clinical Relevance
The polymerization behavior of dual-cured core build-up resin composites is stronglymaterial-related. None of the materials can be efficiently polymerized in terms of theremaining C=C bonds in regions of restorations with no direct light accessibility.
*Minos M Stavridakis, MS, Dr med dent, visiting professor sci-entist, Division of Cariology and Endodontology, School ofDentistry, University of Geneva, Geneva, Switzerland; post-doc-torate assistant, Department of Operative Dentistry, Faculty ofDentistry, University of Athens, Athens, Greece
Afrodite I Kakaboura, Dr med dent, associate professor,Department of Operative Dentistry, Faculty of Dentistry,University of Athens, Athens, Greece
Ivo Krejci, Prof Dr med dent, PDCH, professor and chairman,Division of Cariology and Endodontology, School of Dentistry,University of Geneva, Geneva, Switzerland
*Reprint request: 24 Karneadou Street, 106 75 Athens, Greece;e-mail: [email protected]
©Operative Dentistry, 2005, 30-4, 443-452
Dow
nloaded from http://m
eridian.allenpress.com/operative-dentistry/article-pdf/30/4/1/1819389/1559-2863-30-4-1.pdf by guest on 12 January 2022

444 Operative Dentistry
FluoroCore and Permalute exhibited a reductionin LPS and PS using NLC relative to ILC. No dif-ferences in LPS and PS values were detected forthe materials Bis-Core and Build-it! when sub-jected to NLC or DLC, compared to ILC.
Simple linear regression showed that only thetwo polymerization shrinkage properties studiedwere highly correlated (LPS-PS r2=0.85). TheRDB rate was not correlated with either poly-merization shrinkage properties (RDB-LPSr2=0.40; RDB-PS r2=0.57). A study of the evolutionof the real-time curves of percentage values ofLPS and PS showed that these propertiesevolved in a similar exponential mode and that,most often, there was a delay in the developmentof PS.
INTRODUCTION
Foundation restorations are often required in order tobuild damaged teeth to ideal anatomic form prior totheir preparation. Despite amalgam, resin compositesfrom the early days of chemically cured materials havealso been used for foundation restorations, even thoughpoor adhesion to dentin was provided with previousgenerations of bonding systems (Bowen, 1985;Munksgaard & Asmussen, 1984; Asmussen &Munksgaard, 1983). Lately, light-cured resin compos-ites, in combination with improved bonding agents,were recommended for core build-ups. These materialsoffer ample working time and present mechanical prop-erties comparable to amalgam (Bonilla, Mardirossian &Caputo, 2000). Light-cured core build-up materials aremore convenient to use than amalgam, when mechan-ical retention is difficult to achieve and when easyplacement is required without the use of elaboratematrices. Additionally, these materials expedite theclinical process, as the restored tooth may be preparedin the same appointment. Thus, light-cured resin com-posites are often the material of choice.
Nevertheless, there are some concerns associatedwith resin composites: polymerization shrinkage(Stavridakis, Kakaboura & Krejci, 2000; Stavridakis &others, 2003), delayed expansion due to water sorption(Pearson, 1979; Chai & others, 2004) and the high coef-ficient of thermal expansion (Asmussen & Jorgensen,1978). As a result, poor adaptation of the material topreparation is common (Dietschi & others, 2002). Manystrategies have been used to overcome limitationscaused by polymeriza-tion shrinkage.Various layering tech-niques are suggestedin direct resin compos-ite restorations. Never-theless, time limita-tions, when placing
core build-ups, do not usually allow the clinician to useelaborate multi-layering techniques, as the ideal restora-tion is not the final goal. The use of photo-activatedmaterials often poses the problem wherein it is difficultfor light to reach the deepest parts of a restoration inorder to provide maximal resin composite polymerization.
Dual-cured core build-up resin materials have beendesigned to allow the clinician to build extended foun-dation restorations quickly, in bulk, as the chemicalmode of the polymerization process can initiate resinpolymerization in deep resin layers. However, the incor-poration of chemical and light curing modes in the samematerial has not been shown to ensure maximal curingof the material, as the different curing modes may coun-teract one another. Additionally, polymerizationshrinkage of dual-cured resin composite build-up mate-rials has not been assessed.
Thus, this study investigated the polymerization reac-tion of dual-cured resin composite build-up materials interms of the degree of carbon-carbon double bond (C=C)remaining, linear polymerization shrinkage (LPS) andpolymerization stresses (PS) developed under variouslight exposure scenarios.
METHODS AND MATERIALS
The dual-cured resin composite core build-up materialstested are listed in Table 1. Three different experi-mental groups for each material were prepared, corre-sponding to three different light-curing modes: no light-curing (NLC), the materials were not light cured andkept under dark conditions; immediate light curing(ILC), immediate light exposure of the materials for 60seconds (Translux EC, Kulzer & Co GmbH, Wehrheim,Germany) with a relative power density of 500 mW/cm2
(Curing Radiometer, Demetron Research, Danbury, CT,USA) and delayed light curing (DLC), specimens weredark-stored for 10 minutes, then light cured for 60 sec-onds, as described above. Within each experimentalgrouping, three different parameters were measured:remaining C=C bonds (RDB), linear polymerizationshrinkage (LPS) and polymerization stresses (PS).
For evaluation of RDB, five rectangular specimens(3x2x0.5 mm) per polymerization mode were preparedbetween two transparent glass slides covered withtransparent polystyrene strips. An additional groupsample per material, consisting of unset pastes, wasperformed for the RDB measurements. Spectra of theunset pastes and the directly irradiated surfaces were
Material Manufacturer Color Batch #
Bis-Core BISCO, Inc, Schaumburg, IL, USA Natural 109268
FluoroCore Caulk/Dentsply, Milford, DE, USA Tooth shade 990211
Build-it! Jeneric/Pentron Inc, Wallingford, CT, USA A2 17564
Permalute Ultradent Products, Inc, South Jordan, UT, USA A2 34F8
Table 1: Dual-cured Resin Composite Core Build-up Materials Used
Dow
nloaded from http://m
eridian.allenpress.com/operative-dentistry/article-pdf/30/4/1/1819389/1559-2863-30-4-1.pdf by guest on 12 January 2022

445Stavridakis, Kakaboura & Krejci: Polymerization Behavior of Dual-cured Core Build-up Resin Composites
acquired employing a micro-MIR cell attached on aFourier Transformation Infrared Spectroscopy (FTIR)spectrometer (Micro-MIR accessory and Spectrum GXFTIR spectrometer, Perkin-Elmer, Norwalk, CT, USA)under the following conditions: 4000-400 cm-1 range, 4cm-1 resolution, 45° para edge KRS-5 mini-crystal ofseven internal reflections and 40 co-added scans co-additions at 30 ± 1°C, which were kept constant with atemperature controller. The quantitative measurementof the % RDB was performed based on the two-frequencytechnique. The stretching vibrations of the methacry-late C=C bonds (1638 cm-1) were used as an analyticalfrequency; whereas, the stretching vibrations of thearomatic bonds (1605 cm-1) were used as a reference fre-quency for Bis-Core, Build-it! and Permalute, and theester bonds (1712 cm-1) for FluoroCore (Ruyter &Gyorosi, 1976; Rueggeberg, Hashinger & Fairhurst,1990). The net peak absorbance areas of these peakswere used to quantify the extent of C=C remaining onthe directly irradiated resin composite surfaces.
The measurement of LPS was performed with a custom-made measuring device (Figure 1) based on principlessuggested by de Gee, Feilzer and Davidson (1993). Astandardized amount of each dual-cured material wasthoroughly mixed for 30 seconds, then placed on thealuminum platelet. The material was carefully flat-tened by means of a glass plate to a test height of 1.5mm. Light-curing was performed from a distance of 1mm through the glass plate. The vertical movement ofthe diaphragm caused by polymerization shrinkage ofthe tested material was detected by the infrared sensorfor 13 minutes at a sampling frequency of 5 Hz to anaccuracy of 100 nm. Using custom software, data were
fed on-line by means of an A/D converter to a personalcomputer (Macintosh II fx, Apple Computer, Cupertino,CA, USA). Eight specimens for each material and poly-merization mode were tested.
PS was measured using a custom-made device(Figure 2) developed following Feilzer, de Gee andDavidson (1987). The upper part consisted of a semi-rigid load cell (PM 11-K, Mettler, Greifensee,Switzerland) to which a metal cylinder was screwed, 8-mm in diameter. A standardized quantity of test mate-rial, the same as for the specimens used for measure-ment of the linear polymerization displacement, wasplaced on the cylinder and compressed onto a glassplate attached to the base of the device in order to pro-duce a specimen 1.5-mm in height. To improve adhe-sion of the resinous core build-up material, the surfacesof the metal cylinder and glass plate were sandblastedwith 50 mm Al2O3 (Microetcher, Danville Engineering,Danville, CA, USA) and silanized (Monobond S,Vivadent Ets, Schaan, Liechtenstein). Light curing wascarried out via a recess in the lower frame, through theglass plate, at a distance 1-mm from the tested mate-rial. The polymerization stresses developed during the13 minutes were measured with a load cell at a sam-pling frequency of 5 Hz. Using custom software, datawere fed online by means of an A/D converter to a per-sonal computer. Eight specimens for each material andpolymerization mode were tested.
Statistical evaluation of the data at the end of the 13-minute observation period was performed by two-wayanalysis of variance (ANOVA). Following the ANOVA,Tukey’s Studentized Range (HSD) Test (p=0.05) wasused to identify pairwise differences. Simple linear
Figure 1: Schematic presentation of the measuring device for linearpolymerization shrinkage: (A) metal frame; (B) aluminum platelet;(C) diaphragm (8 x 8 mm); (D) infrared measuring sensor; (E) specimen;(F) glass plate (41 x 18 x 1 mm); (G) aluminum platen (13 x 20 mm);(H) light-curing tip.
Figure 2: Schematic presentation of the measuring device for polymer-ization stresses: (A) upper part of measuring device; (B) lower part ofmeasuring device; (C) load cell; (D) metal cylinder; (E) glass plate;(F) holder of glass plate; (G) specimen; (H) light-curing tip.
Dow
nloaded from http://m
eridian.allenpress.com/operative-dentistry/article-pdf/30/4/1/1819389/1559-2863-30-4-1.pdf by guest on 12 January 2022

446 Operative DentistryOperative Dentistry
regressions were also performed to determine correla-tions among all the characteristics measured.
The difference in evolution of LPS and PS over timewas also measured using the following equations:
(1)
(2)
(3)
where
ADPS-LPS(13min) is the proportional difference betweenthe percentage of polymerization stress-es (PS) and linear polymerizationshrinkage (LPS) with respect to themaximal value observed at 13 minutes(780 seconds), which numericallyexpresses the area difference betweenPS and LPS real-time curves after 13minutes.
YLPSiis the percentage of maximal value atany specific time (i) during the meas-urement of LPS.
YLPS13minis the maximum value of LPS recordedat 13 minutes (780 seconds) and takenas 100%.
YPSiis the percentage of maximal value atany specific time (i) during measure-ment of PS.
YPS13minis the maximum value of LPS recordedis the maximum value of PS recorded at13 minutes (780 seconds) and taken as100%.
This effort depicted the area difference derivedbetween two curves: the real-time curve of percentage
values of LPS and the real-time curve of percentagevalues of PS over time. Therefore, equation 1 was ableto show the area that expresses the result of the deduc-tion of the areas below the two aforementioned curvesand expressed it in percentage points in relation to thelarger curve (LPS)
RESULTS
The RDB values measured at the end of the observationperiod are reported in Table 2. Bis-Core presented sta-tistically significant higher and Permalute statisticallysignificant lower RDB when ILC was applied (Bis-Core:DLC=NLC<ILC, Permalute: ILC<DLC=NLC).FluoroCore and Build-it! exhibited statistically signifi-cant differences among all the different curing modes(FluoroCore: ILC<DLC<NLC, Build-it!: DLC<NLC<ILC). Statistically significant differences were observedamong all the materials when DLC and NLC wereapplied (Build-it!<Permalute<Bis-Core<Fluorocore).Statistically significant differences were also detectedamong all the materials, except FluoroCore and Build-it!, in the ILC group (Permalute<Fluorocore=Build-it!<Bis-Core).
LPS values measured at the end of the observationperiod are reported in microns in Table 3. Bis-Core pre-sented statistically significant lower LPS when NLCwas applied (DLC=ILC>NLC). FluoroCore andPermalute exhibited statistically significant differencesamong all the different curing modes (FluoroCore:ILC>DLC>NLC, Permalute: DLC>ILC>NLC), whileBuild-it! demonstrated no differences (ILC=DLC=NLC). Statistically significant differences were foundamong all the materials, except Bis-Core andFluoroCore when DLC and NLC were applied(Permalute>Build-it !>Bis-Core=Fluorocore) .ILC resulted in statistically significant differencesamong all the materials (Permalute>Build-it!>Fluorocore>Bis-Core).
PS values measured at the end of the observationperiod are reported in kilograms in Table 4. Bis-Coreexhibited statistically significant differences among allthe different curing modes (DLC>ILC>NLC).FluoroCore and Permalute presented statistically sig-nificant lower PS when NLC was applied
(sum%PS - sum%LPS)ADPS-LPS(13 min) = x 100%sum%LPS
780YLPS1sum% LPS= ∑
i=0 YLPS13min
780YPS1sum% PS= ∑
i=0 YPS13min
Method of Light-curing Application
Material NLC ILC DLC
Bis-Core 48.6 ± 1.4 C a 53.6 ± 1.5 C b 45.7 ± 1.7 C a
FluoroCore 78.7 ± 2.3 D c 29.1 ± 1.6 B a 68.5 ± 2.6 D b
Build-it! 26.1 ± 1.8 A b 31.3 ± 2.8 B c 20.1 ± 1.8 A a
Permalute 30.0 ± 1.9 B b 21.5 ± 0.5 A a 29.4 ± 2.7 B b
NLC: No Light-Curing; ILC: Immediate Light-Curing; DLC: Delayed Light-Curing.Within a column, values having similar upper case letters did not exhibit statistical difference (p>0.05); comparison of materials within the same method of light-curing application. Within a row,values having similar lower case letters did not exhibit statistical difference (p>0.05); comparison of methods of light-curing application within the same material.
Table 2: Remaining C=C Double Bonds (%) at 13 Minute Post-mix (mean±SD)
Dow
nloaded from http://m
eridian.allenpress.com/operative-dentistry/article-pdf/30/4/1/1819389/1559-2863-30-4-1.pdf by guest on 12 January 2022
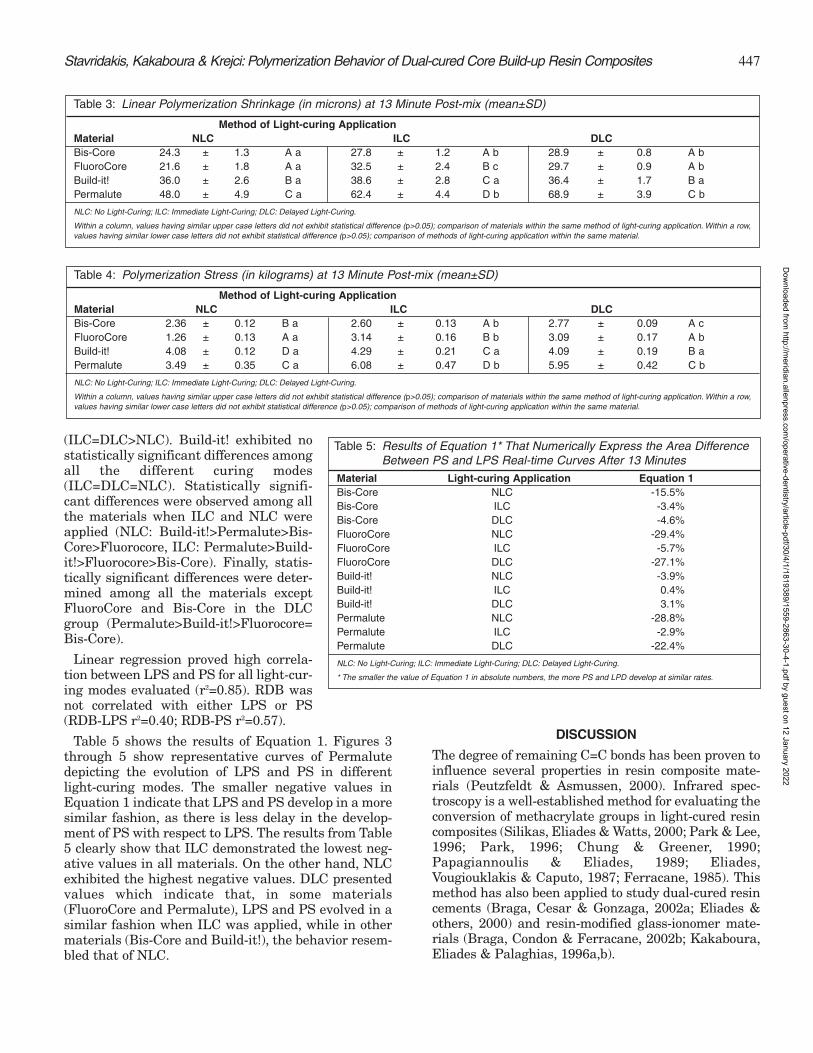
447
(ILC=DLC>NLC). Build-it! exhibited nostatistically significant differences amongall the different curing modes(ILC=DLC=NLC). Statistically signifi-cant differences were observed among allthe materials when ILC and NLC wereapplied (NLC: Build-it!>Permalute>Bis-Core>Fluorocore, ILC: Permalute>Build-it!>Fluorocore>Bis-Core). Finally, statis-tically significant differences were deter-mined among all the materials exceptFluoroCore and Bis-Core in the DLCgroup (Permalute>Build-it!>Fluorocore=Bis-Core).
Linear regression proved high correla-tion between LPS and PS for all light-cur-ing modes evaluated (r2=0.85). RDB wasnot correlated with either LPS or PS(RDB-LPS r2=0.40; RDB-PS r2=0.57).
Table 5 shows the results of Equation 1. Figures 3through 5 show representative curves of Permalutedepicting the evolution of LPS and PS in differentlight-curing modes. The smaller negative values inEquation 1 indicate that LPS and PS develop in a moresimilar fashion, as there is less delay in the develop-ment of PS with respect to LPS. The results from Table5 clearly show that ILC demonstrated the lowest neg-ative values in all materials. On the other hand, NLCexhibited the highest negative values. DLC presentedvalues which indicate that, in some materials(FluoroCore and Permalute), LPS and PS evolved in asimilar fashion when ILC was applied, while in othermaterials (Bis-Core and Build-it!), the behavior resem-bled that of NLC.
DISCUSSION
The degree of remaining C=C bonds has been proven toinfluence several properties in resin composite mate-rials (Peutzfeldt & Asmussen, 2000). Infrared spec-troscopy is a well-established method for evaluating theconversion of methacrylate groups in light-cured resincomposites (Silikas, Eliades & Watts, 2000; Park & Lee,1996; Park, 1996; Chung & Greener, 1990;Papagiannoulis & Eliades, 1989; Eliades,Vougiouklakis & Caputo, 1987; Ferracane, 1985). Thismethod has also been applied to study dual-cured resincements (Braga, Cesar & Gonzaga, 2002a; Eliades &others, 2000) and resin-modified glass-ionomer mate-rials (Braga, Condon & Ferracane, 2002b; Kakaboura,Eliades & Palaghias, 1996a,b).
Method of Light-curing ApplicationMaterial NLC ILC DLCBis-Core 2.36 ± 0.12 B a 2.60 ± 0.13 A b 2.77 ± 0.09 A cFluoroCore 1.26 ± 0.13 A a 3.14 ± 0.16 B b 3.09 ± 0.17 A bBuild-it! 4.08 ± 0.12 D a 4.29 ± 0.21 C a 4.09 ± 0.19 B aPermalute 3.49 ± 0.35 C a 6.08 ± 0.47 D b 5.95 ± 0.42 C b
NLC: No Light-Curing; ILC: Immediate Light-Curing; DLC: Delayed Light-Curing.
Within a column, values having similar upper case letters did not exhibit statistical difference (p>0.05); comparison of materials within the same method of light-curing application. Within a row,values having similar lower case letters did not exhibit statistical difference (p>0.05); comparison of methods of light-curing application within the same material.
Table 4: Polymerization Stress (in kilograms) at 13 Minute Post-mix (mean±SD)
Stavridakis, Kakaboura & Krejci: Polymerization Behavior of Dual-cured Core Build-up Resin Composites
Method of Light-curing ApplicationMaterial NLC ILC DLCBis-Core 24.3 ± 1.3 A a 27.8 ± 1.2 A b 28.9 ± 0.8 A bFluoroCore 21.6 ± 1.8 A a 32.5 ± 2.4 B c 29.7 ± 0.9 A bBuild-it! 36.0 ± 2.6 B a 38.6 ± 2.8 C a 36.4 ± 1.7 B aPermalute 48.0 ± 4.9 C a 62.4 ± 4.4 D b 68.9 ± 3.9 C b
NLC: No Light-Curing; ILC: Immediate Light-Curing; DLC: Delayed Light-Curing.
Within a column, values having similar upper case letters did not exhibit statistical difference (p>0.05); comparison of materials within the same method of light-curing application. Within a row,values having similar lower case letters did not exhibit statistical difference (p>0.05); comparison of methods of light-curing application within the same material.
Table 3: Linear Polymerization Shrinkage (in microns) at 13 Minute Post-mix (mean±SD)
Material Light-curing Application Equation 1Bis-Core NLC -15.5%Bis-Core ILC -3.4%Bis-Core DLC -4.6%FluoroCore NLC -29.4%FluoroCore ILC -5.7%FluoroCore DLC -27.1%Build-it! NLC -3.9%Build-it! ILC 0.4%Build-it! DLC 3.1%Permalute NLC -28.8%Permalute ILC -2.9%Permalute DLC -22.4%
NLC: No Light-Curing; ILC: Immediate Light-Curing; DLC: Delayed Light-Curing.
* The smaller the value of Equation 1 in absolute numbers, the more PS and LPD develop at similar rates.
Table 5: Results of Equation 1* That Numerically Express the Area Difference Between PS and LPS Real-time Curves After 13 Minutes
Dow
nloaded from http://m
eridian.allenpress.com/operative-dentistry/article-pdf/30/4/1/1819389/1559-2863-30-4-1.pdf by guest on 12 January 2022

448 Operative Dentistry
The RDB levels obtained afterILC simulate the values reachedunder common clinical practice.Also, as both mechanisms ofpolymerization, chemical andlight, are induced within 13 min-utes after ILC, it can be hypoth-esized that each materialreached nearly its minimumRDB value. The wide range ofRDB values observed under theILC scenario (21.5% to 53.6%)were consistent with thosereported for restorative resincomposites (Chung & Greener,1990; Park, 1996; Peutzfeldt &Asmussen, 2000; Silikas & oth-ers, 2000). The differences foundin RDB values of the materialsinvestigated may be attributedeither to differences in monomercomposition or to variations incatalyst systems. The results ofthis study suggest that ILC pro-vides low levels of RDB on thedirect irradiated surface of allmaterials except Bis-Core.However, an even lower RDBvalue was achieved in Build-it!when DLC was applied. Thisfinding indicates that the imme-diate light curing of Build-it!may lead to increased steric hin-drance, which decreases the seg-mental mobility of methacrylategroups and reduces reactivity ofthe chemical polymerizationreaction.
A comparison of the threelight-curing modes revealedinteresting observations withrespect to the dominant curingmode in each material. That wasthe reason why a clinically unac-ceptable 10-minute delay waschosen as a curing mode in thisstudy. DLC provides ample timefor the chemical curing mecha-nism to progress prior to lightapplication. The dominant cur-ing mode is a point of outmostclinical importance in order todifferentiate which materials’chemical curing plays a substan-tial role compared to light poly-merization. Thus, these mate-
Figure 3: Real-time curves of percentage values (13-minute value taken as 100%) of LPS and PS devel-opment using NLC for Permalute.The result of Equation 1, which numerically expresses the area difference(downward diagonal marked area) between PS and LPS real-time curves, was -28.8%.
Figure 4: Real-time curves of percentage values (13-minute value taken as 100%) of LPS and PS devel-opment using DLC for Permalute.The result of Equation 1, which numerically expresses the area difference(downward diagonal marked area) between PS and LPS real-time curves, was -22.4%.
Figure 5: Real-time curves of percentage values (13-minute value taken as 100%) of LPS and PS devel-opment using ILC for Permalute. The result of Equation 1, which numerically expresses the area difference(downward diagonal marked area) between PS and LPS real-time curves, was -2.9%.
Dow
nloaded from http://m
eridian.allenpress.com/operative-dentistry/article-pdf/30/4/1/1819389/1559-2863-30-4-1.pdf by guest on 12 January 2022

449
rials may be used in areas where negligible light isapplicable.
Differences in RDB between the surface layer of arestoration, expressed in this study using ILC, and thedeep aspects, represented by the NLC group, may developanisotropic properties in the core material under load.This difference, in turn, may stress the tooth-materialinterface and may cause a non-uniform distribution ofstress within the material. According to the results ofthis study, such differences were found only forFluoroCore. This material’s dominant curing mode wasas a light-cured resin composite, because a very highRDB level (78.7%) was measured when NLC wasapplied. Even more, DLC resulted in high RDB, as well(68.5%). On the contrary, when this material underwentILC, low RDB was recorded (29.1%). This result couldbe attributed to the fact that 60-second light-curingcould not substantially increase the restricted mobilityof the monomer chains embedded into the “poorly devel-oped” polymer network, which resulted in a chemicalcure within the first 10 minutes. Materials like Build-it!and Permalute exhibited high levels of chemical curing,as low RDB was found even when NLC was used.Nevertheless, when these materials were subjected toDLC, only Build-it! presented a decrease in RDB. Thisresult could be due to the fact that the polymer networkdeveloped in Permalute by chemical cure did not allowany additional mobility of the polymer chains in order toimprove the C=C conversion. Even though Build-it! andPermalute can be polymerized under dark conditions,the degree of C=C conversion under ILC surpassed thatof NLC and light curing acted as the dominant mecha-nism. The curing mode had no impact on the RDB ofBis-Core, since high values were measured under thethree curing modes applied. The latter finding mayhighlight the monomer type(s) and concentration as themain contributor factors for the insufficient polymeriza-tion of this material and not the curing mechanism.
Various experimental methods have been used todetermine shrinkage and stress of resin compositesduring polymerization. Dilatometric methods are com-monly used to measure polymerization shrinkage ofchemically cured materials (Iga & others, 1991; Rees &Jacobsen, 1989; Hay & Shortall, 1988; Feilzer, de Gee &Davidson, 1988; Bullard, Leinfelder & Russell, 1988;Patel, Braden & Davy, 1987; Penn, 1986;Bandyopadhyay, 1982; de Gee, Davidson & Smith, 1981;Jacobsen, Whiting & Richardson, 1977; Hegdahl &Gjerdet, 1977; Jacobsen, 1975; Dennison & Craig, 1972;Lee, Swartz & Smith, 1969). These techniques presenta significant number of problems related to the access oflight to the light-cured material tested. Furthermore,when water is used, temperature changes occur due tothermal expansion/contraction of the surrounding fluid.Non-volume dilatometric methods have been used latelyfor measurement of polymerization shrinkage in light-
cured resin-based restorative materials (Feilzer, de Gee& Davidson, 1993; de Gee, Feilzer & Davidson, 1993;Watts & Cash, 1991; Feilzer, de Gee & Davidson, 1989;Walls, McCabe & Murray, 1988; Bausch & others, 1982).The materials tested in this study were dual-cured, andboth chemical and light-curing polymerization processeswere assessed. Therefore, a non-volume dilatometricmeasurement technique, as described in the materialsand methods section, was used to measure linear poly-merization displacement. The LPS values of this studyare reported in microns, as these were the recordingunits of the infrared sensor used for measuring the ver-tical movement of the diaphragm, which was caused bypolymerization shrinkage of the test material. The tech-nique used in this study permitted measurement of theevolution of linear polymerization displacementthrough time.
Methods commonly used for polymerization stressmeasurement differ in the configuration by which spec-imens are connected to the load cell (Feilzer & others,1993; Bullard & others, 1988; Feilzer & others, 1987;Hegdahl & Gjerdet, 1977). Various techniques havebeen used to maintain the distance between the load-cell and the testing machine crosshead stable. The latterpermits for the measurement of stress developing whenshrinkage is restrained, simulating clinical conditionswhere resin composite is bonded to non-flexible prepa-ration walls. The PS values of this study are reported inkilograms (actual measurements of load cell) and werenot transformed in Megapascals (MPa) to avoid confu-sion with literature data with completely rigid experi-mental set-ups. In the experimental design of this study,axial specimen deformation was partially restricted,since the load cell was axially displaced 4 mm for eachkilogram of measured force, resulting in a maximum of28 mm deformation of the specimen. In this way, a semi-rigid configuration of a preparation having a C-factor of2.67 was simulated. Several studies have demonstratedthat cusps of molars and premolars deflect inward afterplacement of Class II resin composite restorations, withthe amount of the reported contraction ranging from 18to 45 µm (Smith & Caughman, 1989; Causton, Miller &Sefton, 1985; Lutz, Krejci & Barbakow, 1991), thusjustifying the experimental set-up used in this research.
Most of the LPS and PS values encountered in thisresearch, when ILC was applied, were consistent withthose reported for restorative resin composites(Stavridakis & others, 2000; Stavridakis & others,2003). However, in the case of Permalute, higher valueswere measured. Nevertheless, this result was expected,as Permalute is characterized by the manufacturer as alow-viscosity composite luting/restorative resin. Thesmall filler fraction and high portion of monomer causedincreased LPS and PS (Stavridakis & others, 2000). Onthe other hand, the high flow capacity of Permaluteshould compensate for the shrinkage effect during the
Stavridakis, Kakaboura & Krejci: Polymerization Behavior of Dual-cured Core Build-up Resin Composites
Dow
nloaded from http://m
eridian.allenpress.com/operative-dentistry/article-pdf/30/4/1/1819389/1559-2863-30-4-1.pdf by guest on 12 January 2022

450 Operative Dentistry
pre-gelation phase. However, using ILC, the materialreaches the gel point rapidly. Therefore, viscous flowcannot reduce the shrinkage stress developed inPermalute. The low LPS and PS exhibited by Bis-Corecannot be characterized as an advantage, because theyare attributed to the high RDB of the material.
The high correlation of LPS and PS noted in this studyis in accordance with results from similar studies(Davidson & Feilzer, 1997; Stavridakis & others, 2000;Stavridakis & others, 2003). Generally, although theamount of shrinkage is related to the extent of C=Cremaining, no high correlation was found between RDBand either LPS or PS. Thus, when ILC was applied, highRDB was associated with low values in LPS and PS. Onthe contrary, using NLC or DLC, neither LPS nor PSwas related to RDB. For example, after DLC ofFluoroCore, very high RDB resulted in unexpectedlyhigh values of PS. This result may be explained by thekinetics of the polymerization process. It is likely thatafter 10 minutes of chemical cure, the material hasreached a state where restricted mobility of free radicalsin the polymer network resulted in the development ofthe polymer network. As a consequence, there was anincrease in the modulus of elasticity that restricts thematerial’s capacity for viscous flow and decreases itscompliance, thus causing a dramatic increase in PS(Braga & Ferracane, 2002). One should always keep inmind that low polymerization stresses alone are not theonly quest, as adequate C=C conversion is also a pre-requisite that was not obtained in some dual-curedmaterials. The evolution of PS was both material- andcuring-mode dependent.
The inconsistencies noted between the development ofLPS and PS may be more easily understood byobserving the kinetics of the properties that werestudied. In the chemical curing mode of Permalute(Figure 3), the delay in PS development is easilyobserved. Equation 1 expresses the differences in evolu-tion of the two properties over time in a numericalmanner. The application of Equation 1 in some casesresulted in high negative values, indicating that largerdelays in development of PS, with respect to LPS, wereevident due to the slow development of polymerizationstresses. In other cases, the results of Equation 1 wereagain negative values but of a lower magnitude (Figures4 and 5). In those cases, there was again a delay in thedevelopment of PS with respect to LPS, but of a lowermagnitude, meaning that the two properties developedmore at the same rate and at the same proportionallevel. In two instances, Equation 1 resulted in positivevalues, demonstrating that PS evolved faster than LPS.
From a clinical standpoint, materials with a low RDB,LPS and PS are preferable. Low RDB is necessary inorder for the material to obtain maximal mechanicalproperties. This is why ILC is the polymerization modeof choice for FluoroCore, as the other two curing modes
produce a low degree of RDB. The second aim is to usematerials that produce low polymerization stresses. Forthis reason materials with low LPS are preferred, asthis property is highly correlated with PS. Nevertheless,this research showed that there are other options avail-able as a means of lowering PS, depending on thebehavior of the dual-cured materials. In some situations,obtaining low polymerization stresses was acquired byusing NLC when this curing mode provided low RDB(Bis-Core). In other cases, using DLC resulted in lowerPS (Permalute and Build-it!).
CONCLUSIONS
1. Significant differences were manifested amongthe materials tested in terms of the remainingC=C bonds (RDB), linear polymerization shrink-age (LPS) and polymerization stresses (PS) underall different modes of photo-activation studied.
2. Bis-Core provided the highest percentage of RDBwith the lowest LPS and PS; whereas, Permalutepresented the lowest RDB along with the highestLPS and PS, irrespective of curing mode.
3. The RDB in Build-it! was equal, using either ILCor NLC conditions with no significant changes ineither LPS and PS; DLC reduced RDB.
4. The polymerization of FluoroCore using NLC orDLC modes caused a dramatic increase in RDB.
5. No correlation was found between RDB and LPSor PS. On the contrary, a strong correlation wasevident between LPS and PS.
(Received 25 February 2004)
References
Asmussen E & Jorgensen KD (1978) Restorative resins:Coefficient of thermal expansion—a factor of clinical signifi-cance? Quintessence International 9(9) 79-82.
Asmussen E & Munksgaard EC (1983) Bonding of restorativeresins to dentin by means of methacryloylchloride andmethacryloyl-R-isocyanate Scandinavian Journal of DentalResearch 91(2) 153-155.
Bandyopadhyay S (1982) A study of the volumetric settingshrinkage of some dental materials Journal of BiomedicalMaterials Research 16(2) 135-144.
Bausch JR, de Lange K, Davidson CL, Peters A & de Gee AJ(1982) Clinical significance of polymerization shrinkage ofcomposite resins Journal of Prosthetic Dentistry 48(1) 59-67.
Bonilla ED, Mardirossian G & Caputo AA (2000) Fracturetoughness of various core build-up materials Journal ofProsthodontics 9(1) 14-18.
Bowen RL (1985) Bonding of restorative materials to dentine:The present status in the United States International DentalJournal 35(2) 155-159.
Dow
nloaded from http://m
eridian.allenpress.com/operative-dentistry/article-pdf/30/4/1/1819389/1559-2863-30-4-1.pdf by guest on 12 January 2022

451
Braga RR, Cesar PF & Gonzaga CC (2002a) Mechanical prop-erties of resin cements with different activation modesJournal of Oral Rehabilitation 29(3) 257-262.
Braga RR, Condon JR & Ferracane JL (2002b) In vitro wearsimulation measurements of composite versus resin-modifiedglass ionomer luting cements for all-ceramic restorationsJournal of Esthetic and Restorative Dentistry 14(6) 368-376.
Braga RR & Ferracane JL (2002) Contraction stress related todegree of conversion and reaction kinetics Journal of DentalResearch 81(2) 114-118.
Bullard RH, Leinfelder KF & Russell CM (1988) Effect of coef-ficient of thermal expansion on microleakage Journal of theAmerican Dental Association 116(7) 871-874.
Causton BE, Miller B & Sefton J (1985) The deformation ofcusps by bonded posterior composite restorations: An in vitrostudy British Dental Journal 159(12) 397-400.
Chai J, Takahashi Y, Hisama K & Shimizu H (2004) Water sorp-tion and dimensional stability of three glass fiber-reinforcedcomposites The International Journal of Prosthodontics 17(2)195-199.
Chung KH & Greener EH (1990) Correlation between degree ofconversion, filler concentration and mechanical properties ofposterior composite resins Journal of Oral Rehabilitation17(5) 487-494.
Davidson CL & Feilzer AJ (1997) Polymerization shrinkage andpolymerization shrinkage stress in polymer-based restora-tives Journal of Dentistry 25(6) 435-440.
de Gee AF, Feilzer AJ & Davidson CL (1993) True linear poly-merization shrinkage of unfilled resins and composites deter-mined with a linometer Dental Materials 9(1) 11-14.
de Gee AJ, Davidson CL & Smith A (1981) A modified dilatome-ter for continuous recording of volumetric polymerizationshrinkage of composite restorative materials Journal ofDentistry 9(1) 36-42.
Dennison JB & Craig RG (1972) Physical properties and fin-ished surface texture of composite restorative resins Journalof the American Dental Association 85(1) 101-108.
Dietschi D, Bindi G, Krejci I & Davidson C (2002) Marginal andinternal adaptation of stratified compomer-composite Class IIrestorations Operative Dentistry 27(5) 500-509.
Eliades GC, Vougiouklakis GJ & Caputo AA (1987) Degree ofdouble bond conversion in light-cured composites DentalMaterials 3(1) 19-25.
Eliades T, Eliades G, Bradley TG & Watts DC (2000) Degree ofcure of orthodontic adhesives with various polymerization ini-tiation modes European Journal of Orthodontics 22(4) 395-399.
Feilzer AJ, de Gee AJ & Davidson CL (1987) Setting stress incomposite resin in relation to configuration of the restorationJournal of Dental Research 66(11) 1636-1639.
Feilzer AJ, de Gee AJ & Davidson CL (1988) Curing contractionof composites and glass-ionomer cements Journal ofProsthetic Dentistry 59(3) 297-300.
Feilzer AJ, de Gee AJ & Davidson CL (1989) Increased wall-to-wall curing contraction in thin bonded resin layers Journal ofDental Research 68(1) 48-50.
Feilzer AJ, de Gee AJ & Davidson CL (1993) Setting stresses incomposites for two different curing modes Dental Materials9(1) 2-5.
Ferracane JL (1985) Correlation between hardness and degreeof conversion during the setting reaction of unfilled dentalrestorative resins Dental Materials 1(1) 11-14.
Hay JN & Shortall AC (1988) Polymerization contraction andreaction kinetics of three chemically activated restorativeresins Journal of Dentistry 16(4) 172-176.
Hegdahl T & Gjerdet NR (1977) Contraction stresses of com-posite resin filling materials Acta Odontologica Scandinavica35(4) 191-195.
Iga M, Takeshige F, Ui T, Torii M & Tsuchitani Y (1991) Therelationship between polymerization shrinkage measured bya modified dilatometer and the inorganic filler content of lightcured composites Dental Materials Journal 10(1) 38-45.
Jacobsen PH (1975) Clinical aspects of composite restorativematerials British Dental Journal 139(7) 276-280.
Jacobsen PH, Whiting R & Richardson PC (1977) Viscosity ofsetting anterior restorative materials British Dental Journal143(12) 393-396.
Kakaboura A, Eliades G & Palaghias G (1996a) An FTIR studyon the setting mechanism of resin-modified glass ionomerrestoratives Dental Materials 12(3) 173-178.
Kakaboura AI, Eliades GC & Palaghias G (1996b) Laboratoryevaluation of three visible light-cured resinous liners Journalof Dentistry 24(3) 223-231.
Lee HL Jr, Swartz ML & Smith FF (1969) Physical propertiesof four thermosetting dental restorative resins Journal ofDental Research 48(4) 526-535.
Lutz F, Krejci I & Barbakow F (1991) Quality and durability ofmarginal adaptation in bonded composite restorations DentalMaterials 7(2) 107-113.
Munksgaard EC & Asmussen E (1984) Bond strength betweendentin and restorative resins mediated by mixtures of HEMAand glutaraldehyde Journal of Dental Research 63(8) 1087-1089.
Papagiannoulis L & Eliades G (1989) [Degree of double conver-sion in nine pit and fissure sealants] OdontostomatologikiProodos 43(5) 435-442.
Park SH (1996) Comparison of degree of conversion for light-cured and additionally heat-cured composites Journal ofProsthetic Dentistry 76(6) 613-618.
Park SH & Lee CS (1996) The difference in degree of conversionbetween light-cured and additional heat-cured compositesOperative Dentistry 21(5) 213-217.
Patel MP, Braden M & Davy KW (1987) Polymerization shrink-age of methacrylate esters Biomaterials 8(1) 53-56.
Pearson GJ (1979) Long term water sorption and solubility ofcomposite filling materials Journal of Dentistry 7(1) 64-68.
Penn RW (1986) A recording dilatometer for measuring poly-merization shrinkage Dental Materials 2(2) 78-79.
Peutzfeldt A & Asmussen E (2000) The effect of postcuring onquantity of remaining double bonds, mechanical properties,and in vitro wear of two resin composites Journal of Dentistry28(6) 447-452.
Stavridakis, Kakaboura & Krejci: Polymerization Behavior of Dual-cured Core Build-up Resin Composites
Dow
nloaded from http://m
eridian.allenpress.com/operative-dentistry/article-pdf/30/4/1/1819389/1559-2863-30-4-1.pdf by guest on 12 January 2022

452 Operative Dentistry
Rees JS & Jacobsen PH (1989) The polymerization shrinkage ofcomposite resins Dental Materials 5(1) 41-44.
Rueggeberg FA, Hashinger DT & Fairhurst CW (1990)Calibration of FTIR conversion analysis of contemporary den-tal resin composites Dental Materials 6(4) 241-249.
Ruyter IE & Gyorosi PP (1976) An infrared spectroscopic studyof sealants Scandinavian Journal of Dental Research 84(6)396-400.
Silikas N, Eliades G & Watts DC (2000) Light intensity effectson resin-composite degree of conversion and shrinkage strainDental Materials 16(4) 292-296.
Smith CD & Caughman WF (1989) The effects of compositepolymerization shrinkage on intercuspal distance Journal ofDental Research 67(Special Issue) Abstract #864 p 221.
Stavridakis M, Kakaboura A & Krejci I (2000) Study of linearpolymerization shrinkage and polymerization shrinkageforces of resin-based restorative materialsOdontostomatologiki Proodos 54(2) 213-225.
Stavridakis MM, Lutz F, Johnston WM & Krejci I (2003) Lineardisplacement and force induced by polymerization shrinkageof resin-based restorative materials American Journal ofDentistry 16(6) 431-438.
Walls AW, McCabe JF & Murray JJ (1988) The polymerizationcontraction of visible-light activated composite resins Journalof Dentistry 16(4) 177-181.
Watts DC & Cash AJ (1991) Determination of polymerizationshrinkage kinetics in visible-light- cured materials: Methodsdevelopment Dental Materials 7(4) 281-287.
Dow
nloaded from http://m
eridian.allenpress.com/operative-dentistry/article-pdf/30/4/1/1819389/1559-2863-30-4-1.pdf by guest on 12 January 2022
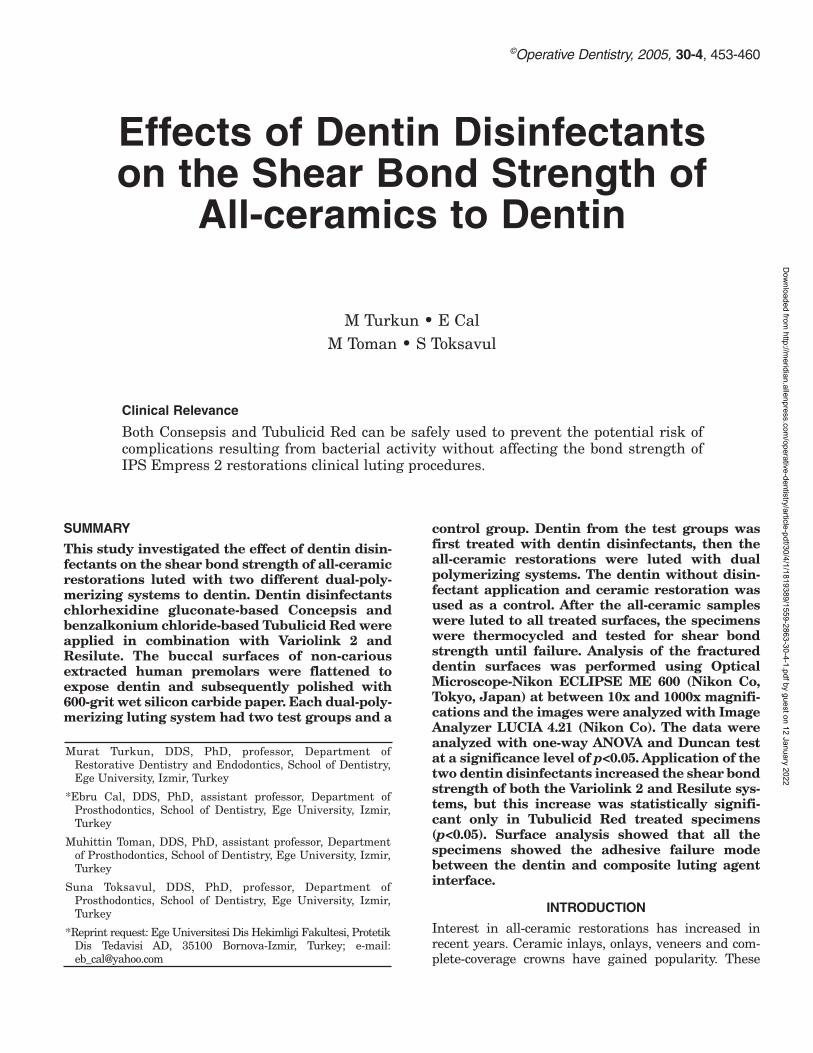
©Operative Dentistry, 2005, 30-4, 453-460
Effects of Dentin Disinfectantson the Shear Bond Strength of
All-ceramics to Dentin
M Turkun • E CalM Toman • S Toksavul
Clinical Relevance
Both Consepsis and Tubulicid Red can be safely used to prevent the potential risk ofcomplications resulting from bacterial activity without affecting the bond strength ofIPS Empress 2 restorations clinical luting procedures.
SUMMARY
This study investigated the effect of dentin disin-fectants on the shear bond strength of all-ceramicrestorations luted with two different dual-poly-merizing systems to dentin. Dentin disinfectantschlorhexidine gluconate-based Concepsis andbenzalkonium chloride-based Tubulicid Red wereapplied in combination with Variolink 2 andResilute. The buccal surfaces of non-cariousextracted human premolars were flattened toexpose dentin and subsequently polished with600-grit wet silicon carbide paper. Each dual-poly-merizing luting system had two test groups and a
control group. Dentin from the test groups wasfirst treated with dentin disinfectants, then theall-ceramic restorations were luted with dualpolymerizing systems. The dentin without disin-fectant application and ceramic restoration wasused as a control. After the all-ceramic sampleswere luted to all treated surfaces, the specimenswere thermocycled and tested for shear bondstrength until failure. Analysis of the fractureddentin surfaces was performed using OpticalMicroscope-Nikon ECLIPSE ME 600 (Nikon Co,Tokyo, Japan) at between 10x and 1000x magnifi-cations and the images were analyzed with ImageAnalyzer LUCIA 4.21 (Nikon Co). The data wereanalyzed with one-way ANOVA and Duncan testat a significance level of p<0.05. Application of thetwo dentin disinfectants increased the shear bondstrength of both the Variolink 2 and Resilute sys-tems, but this increase was statistically signifi-cant only in Tubulicid Red treated specimens(p<0.05). Surface analysis showed that all thespecimens showed the adhesive failure modebetween the dentin and composite luting agentinterface.
INTRODUCTION
Interest in all-ceramic restorations has increased inrecent years. Ceramic inlays, onlays, veneers and com-plete-coverage crowns have gained popularity. These
Murat Turkun, DDS, PhD, professor, Department ofRestorative Dentistry and Endodontics, School of Dentistry,Ege University, Izmir, Turkey
*Ebru Cal, DDS, PhD, assistant professor, Department ofProsthodontics, School of Dentistry, Ege University, Izmir,Turkey
Muhittin Toman, DDS, PhD, assistant professor, Departmentof Prosthodontics, School of Dentistry, Ege University, Izmir,Turkey
Suna Toksavul, DDS, PhD, professor, Department ofProsthodontics, School of Dentistry, Ege University, Izmir,Turkey
*Reprint request: Ege Universitesi Dis Hekimligi Fakultesi, ProtetikDis Tedavisi AD, 35100 Bornova-Izmir, Turkey; e-mail:[email protected]
Dow
nloaded from http://m
eridian.allenpress.com/operative-dentistry/article-pdf/30/4/1/1819389/1559-2863-30-4-1.pdf by guest on 12 January 2022

454 Operative Dentistry
restorations offer superior esthetics compared withmetal-ceramic restorations (Christensen, 1999). Thestrength of all-ceramic crowns is influenced by theshape of the tooth preparation, pretreatment of thecrown and abutment and the method of luting (Burke,1995). The dentin-bonded crown can be defined as acomplete coverage restoration in which the crown isbonded only to the underlying dentin using a lutingcomposite. The bond is mediated by the use of adentinal bonding system and chemomechanical adhe-sion to the ceramic surface (Strub & Beschnidt, 1998).
IPS Empress 2 (Ivoclar Vivadent, Schaan,Liechtenstein) is a lithium disilicate, heat-pressed all-ceramic material offering the advantages of increasedbiocompatibility, natural appearance and superioresthetics. A chemical bond between the etched porce-lain and tooth structure is accomplished in the IPSEmpress 2 system (Zawta, 2001).
One of the most important factors determining thesuccess of a restoration is adhesion between the toothstructure and restorative material. Dentin bonding isdesigned to produce a hermetic seal between a com-posite restoration and the surrounding dentin (Oram& Pearson, 1994). The use of dual-polymerizing resincement in combination with a dentin bonding agenthas reduced the problem of loss of retention (Milleding,Ortengren & Karlsson, 1995). In spite of encouragingresults, clinical performance of the dentin bond isimpaired by composite polymerization shrinkage andstresses resulting from thermal dimensional changes(Van Meerbeek & others, 1998). The choice of restora-tive method has a critical impact on the behavior of thedentin-resin interface. In addition to the cementationvariables, dentin is a heterogeneous substrate, and it isdifficult to predict the overall behavior of the dentin-resin interface (Pashley & others, 1995).
If a proper adhesion cannot be achieved, micro-leakage, defined as the passage of bacteria, fluids,chemical substances, molecules and ions between thetooth and its restoration, can occur. This wouldthreaten clinical performance and longevity of therestoration, contributing to staining, recurrent caries,adverse pulpal response and postoperative sensitivity(Bauer & Henson, 1984).
The problems associated with microleakage can bemagnified by incomplete sterilization of the prepara-tion from all infected enamel and dentin (Meiers &Kresin, 1996), especially if the carious lesion exists inthe prepared tooth. Brännström (1987) has reportedthat multiple bacterial sources may be implicated intooth preparation infection, including 1) invasion fromthe tooth surface via marginal gap formation betweena tooth and restorative material; 2) bacteria present inthe smear layer; 3) bacteria present in the dentinaltubules; 4) bacteria at the dentino-enamel junction and
5) bacteria recontaminating the surface of a tooth priorto placing a restoration. Even when the tooth prepara-tion is sealed completely, bacteria existing in the smearlayer can multiply and their toxins and degradationproducts can diffuse in the pulp, resulting in irritationand inflammation (Brännström, 1986). Numerousexperiments have shown that infection is the maincause of pulpal damage; tissue fluids from pulp andorganic substances within dentin and enamel providesufficient substrate for microbial growth underrestorations (Brännström, 1987). Brännström (1996)states that about 5% to 24% of crowns and fixed partialdentures may, in time, result in pulpal complicationsand periapical inflammatory lesions.
When the restoration walls are completely encased inenamel, excellent clinical service can be obtained since theseal would be perfect (Lacy & others, 1992). On theother hand, where dentin is exposed, the application ofetchants will increase the permeability of dentin,increasing the possibility of pulpal irritation or damageand increase sensitivity (Kedici, Kalipcilar & Bilir, 1992).Since cut dentin is always bonded to the all-ceramicmaterial, expectations of higher risks of sensitivityleading to these complications should be the concern ofthe restorative dentist practicing with all-ceramics.
To reduce the potential risk of pulpal inflammationresulting from bacterial activity, the use of anti-bacterial materials during restorative procedures hasbeen recommended (Gultz & others, 1999; Palenik &Setcos, 1996; Meiers & Kresin, 1996). Currently, theapplication of a disinfectant after tooth preparationand before inserting the restoration is gaining wideracceptance (Gwinnett, 1992b; Meiers & Kresin, 1996;Meiers & Shook, 1996).
A potential problem in the use of a disinfectant withdentin bonding agents is the possibility of an adverseeffect on the bond strength of the restorative materialto dentin (Cao & others, 1995; Gurgan, Bolay &Kiremitçi, 1999; Meiers & Shook, 1996). Shear bondstrength values to dentin between 18 and 20 MPa areconsidered to be optimal (Eick & others, 1993; Swift,Perdigão & Heymann, 1995). Dentin disinfectantsapplied to the dentin surface should not compromisethe shear bond strength of the bonding systems. It hasbeen suggested that disinfectants remoisten the cavitywalls prior to placing an adhesive resin and actuallyenhance adhesion (Miller, 1995). Many studies haveinvestigated the effect of cavity disinfectants on thebond strength of resin composites (Cao & others, 1995;Gurgan & others, 1999; Gwinnett, 1992a; Meiers &Shook, 1996; Perdigão, Denehy & Swift, 1994),reporting bond strengths as varying according to theactive ingredients in cavity disinfectants and thebrand of dentin adhesive system. However, there is alack of literature on the effect of dentin disinfectants tothe bonding performance of all-ceramic systems.
Dow
nloaded from http://m
eridian.allenpress.com/operative-dentistry/article-pdf/30/4/1/1819389/1559-2863-30-4-1.pdf by guest on 12 January 2022

455Turkun & Others: Effects of Dentin Disinfectants on the Shear Bond Strength of All-ceramics to Dentin
The null hypothesis of this study was that chlorhexi-dine gluconate-based disinfectant (Consepsis) and ben-zalko-nium chloride-based disinfectant (Tubulicid Red)would not adversely effect the shear bond strength of anall ceramic system bonded to dentin with the lutingagents Variolink 2 and Resilute.
METHODS AND MATERIALS
Sixty non-carious, freshly extracted human premolarswere used in this study. The teeth were scraped clean ofany residual tissue tags, kept in 2.6% sodium hypochlo-ride for 15 minutes and rinsed under running water for15 minutes. They were then stored in distilled water at+4°C until use. The roots were removed from thecrowns approximately 2 mm below the cemento-enamel junction using a slow speed diamond saw undercopious water spray. The teeth were then mounted in aplastic holder filled with cold-cure acrylic resin. Theywere then placed with the buccal surfaces upward justabove the surface of the embedding medium. Just priorto preparation of the test specimens, the underlyingsuperficial dentin was exposed by mounting the buccal
surfaces on a metallurgical polishing wheel and wetgrinding them flush with the surface of the embeddingmedium using 180-grit, followed by 600-grit, siliconcarbide paper. The exposed dentin surfaces wereinspected with a dissecting microscope at 50x magnifi-cation to ensure that no enamel was left. The teethwere then randomly divided into two main groupsaccording to the luting resin used, either Variolink 2 orResilute. Each luting resin system was assigned to twodisinfectant groups of 10 specimens each (Table 1).
The dentin disinfectants were applied with a sterilebrush applicator after the etching step for each lutingsystem and left in contact with the dentin surface for 60seconds. The excess disinfectant was removed with five-second light air drying in order to prevent dessication.After dentin disinfection, a piece of adhesive tape, witha 4-mm diameter hole, was securely fastened to the cen-ter of the dentin surface to delimit the bonding surface.The specimens not treated with any of the disinfectantswere used as controls for each luting system. All the lut-ing steps were carried out as performed in the experi-mental groups.
Material Manufacturer Batch # Material Composition
Luting Systems
Variolink-2 Ivoclar Vivadent, Etchant: D 57027 37 % phosphoric acidSchaan, Liechtenstein
Primer (Syntac pr.): E 34592 Tetraethylenglycol dimethacrylate, maleic acid, dimethylketone, water
Adhesive (Syntac ad.): E 30794 Polyethyleneglycol dimethacrylate, glutaraldehyde, maleic acid, water
Bond (Heliobond): E 51105 Bis-GMA, triethyleneglycol dimethacrylate
Cement base: E 51946 Bis-GMA, UEDMA, TEGDMA, filler
Cement low viscosity catalyst: E 52170 Bis-GMA, UEDMA, TEGDMA, filler
Silane: E 26882 3-methacryloxy propyl-trimethoxysilane, water, ethanol
Ceramic etchant: E 52923 5% hydrofluoric acid
Oxygen inhibiting gel: D 50843 Glycerine, silica
ResiLute Pulpdent Co, Etchant: 020314 38% phosphoric acidWatertown, MA, USA
Adhesive (DenTASTIC UNO): 020326 PMGDM, monomer resin, activators, acetone
Dual-cure catalyst for adhesive Mg NTG-GMA, acetone(DenTASTIC DUO): 020419
Cement part 1: 020207 Monomer, filler
Cement part 2: 020529 Monomer, filler
Oxygen inhibiting gel: 020530 Glycerine, silica
Ceramic etchant: 020606 9.6 % hydrofluoric acid
Drying agent: 020606 Ethyl alcohol
Silane: 020606 Ethyl alcohol, acetone, benzene
Dentin Disinfectants
Consepsis Ultradent Products, Inc, 454D 2% chlorhexidine gluconateSouth Jordan, UT, USA
Tubulicid Dental Therapeutics Ab, 311100 0.1% benzalkonium chloride, 0.2% EDTA, 1% Red Saltsjö-Boo, Sweden sodium floride
Table 1: Materials Used in the Study
Dow
nloaded from http://m
eridian.allenpress.com/operative-dentistry/article-pdf/30/4/1/1819389/1559-2863-30-4-1.pdf by guest on 12 January 2022

456 Operative Dentistry
A total of 60 IPS Empress 2samples were fabricated byheat-pressing them intosprues and sectioning theminto disc shapes, 2 mm indiameter and 3 mm inheight, using diamondwheels at low speed. Thesamples were subjected tosandblasting with 50 µmAl2O3. Following ultrasoniccleaning for 10 minutes in distilled water, IPSEmpress 2 discs were acid etched according to theetching procedures, then silanated as described ineach luting system. Applying a load of 20 N, simu-lating finger pressure, the IPS Empress 2 sampleswere luted in accordance with the manufacturers’instructions using the compact material tester(EZTest, Shimadzu Corporation, Kyoto, Japan) ondelimited dentin surfaces with the luting systemsshown in Table 2.
The specimens were stored in distilled water at 37°Cfor 24 hours. They were then subjected to 500 thermalcycles between 5°C and 55°C water baths, with a dwelltime of 30 seconds and a transfer time of 30 seconds.
The shear bond strength was measured with aShimadzu Universal Testing Machine (Model AG-50kNG, Shimadzu Corporation, Kyoto, Japan). A knife-edge shearing rod with a crosshead speed of 0.5mm/minute was used (Figure 1). The distance from theshearing rod to the dentin surface was maintainedusing a spacer of two celluloid matrices (Hawe NeosDental, Gentilino, Switzerland). The load at failure wasrecorded by Labtech Notebook software version 6.3(Labtech, Wilmington, MA, USA). The shear bondstrengths of the specimens were calculated andexpressed in MPa.
The analysis of the debonded dentin surfaces of allsamples was performed over the entire bonding areausing an Optical Microscope Nikon ECLIPSE ME 600(Nikon Co, Tokyo, Japan) at between 10x and 1000xmagnifications, and the images were analyzed withImage Analyzer LUCIA 4.21 (Nikon Co).
The shear bond strength data of the disinfectantgroups in each luting resin group were analyzed byANOVA (one-way analysis of variance) and Duncan testusing SPSS 10.0 for Windows. For the surface analysisdata of fracture sites, the Chi-Square test was used. Alltests were performed at a 95% confidence level.
RESULTS
The shear bond strengths in MPa (Mean ± SD) for thesix groups are shown in Table 3. Although these resultsshow that application of the two dentin disinfectantsincreased the shear bond strengths of both Variolink 2
and Resilute luting systems, this increase was statisti-cally significant only in the Tubulicid Red treated spec-imens (p<0.05).
Light microscope analysis of the dentin surfaces indi-cated that all specimens showed the adhesive failuremode between the dentin and composite luting agentinterface. However, adhesive resin remained on thedentin surfaces of nearly all specimens (Figure 2).Adhesive resin was completely debonded from thedentin surfaces of two specimens in Group 2 and Group4 and one specimen in Group 5 (Figure 3). Adhesiveresin was partly debonded from the dentin surface ofone specimen in Group 4 and Group 6 (Figure 4). Puredentin and pure ceramic cohesive failures were notobserved. The Chi-Square test revealed no significantdifferences in failure mode frequency between the con-trol group and the two disinfectant groups for eitheradhesive luting system (p>0.05).
Material Conditioning Priming Adhesive CementResin
Variolink-2 Conditioner Syntac primer Syntac adhesive Dual-cured (15 seconds) (15 seconds) (10 seconds) cementwash and dry
ResiLute Conditioner DenTASTIC Dual-cured(15 seconds) UNO DUO cementwash and dry
Table 2: Adhesive Luting Systems Used in the Study
Figure 1: Schematic diagram of the test assembly for determiningshear bond strength.
Dow
nloaded from http://m
eridian.allenpress.com/operative-dentistry/article-pdf/30/4/1/1819389/1559-2863-30-4-1.pdf by guest on 12 January 2022

457Turkun & Others: Effects of Dentin Disinfectants on the Shear Bond Strength of All-ceramics to Dentin
DISCUSSION
The use of disinfec-tant solutions aftertooth preparationhas been recom-mended for disinfect-ing dentin andreducing post-opera-tive sensitivity(Brännström, 1996,1986; Gultz & oth-ers, 1999; Meiers & Kresin, 1996). However, any posi-tive benefits are negated if the disinfectant decreasesthe shear bond strength of the all-ceramic materialwhich is bonded with a resin composite by altering itssealing ability to dentin.
This study found the chlorhexidine gluconate-baseddisinfectant (Consepsis) to not adversely affect theshear bond strength to dentin of IPS Empress 2 lutedwith Variolink 2 and Resilute. Previous studies tend tosupport the findings of this study, where treatment ofthe dentinal surface with chlorhexidine gluconate priorto application of dentin bonding agents did not have aneffect on the bond strength of resin composite(Gwinnett, 1992b; Perdigão & others, 1994; Türkün,Türkün & Kalender, 2004; Say & others, 2004). Meiersand Shook (1996) reported that a chlorhexidine glu-conate-based disinfectant, BISCO Cavity Cleanser, didnot affect the bond strength of resin composite bondedwith Tenure but decreased bonding with Syntac.However, Meiers and Kresin (1996) found that thesame disinfectant did not significantly affect thesealing ability of Tenure and Syntac when compared tothe control groups. In a similar study with resin modi-fied glass-ionomer cements, Cunningham and Meiers(1997) found that chlorhexidine solution did not signif-icantly affect the bond strengths of any of the cementstested. In addition, el-Housseiny and Jamjoum (2000)reported that these disinfectants do not adverselyaffect the bonding of resin composite to enamel ordentin before acid etching. On the other hand, Gurganand others (1999) found that pre-applied chlorhexidinegluconate (Consepsis) reduced the bond strength ofadhesive resin (Permagen). However, they observed noreduction in composite-to-dentin shear bond strengthwhen the disinfectant was rinsed off prior to thebonding procedure. Nevertheless, washing chlorhexi-dine that contains a surfactant might only partiallydrive away the chlorhexidine molecules, and the boundmolecules might serve as a co-surfactant on the condi-tioned dentin before the resin is applied (Schaeken,Keltjens & Van der Hoeven, 1991). Cao and others(1995) reported most commercial chlorhexidine glu-conate-based disinfectants decreased the bondstrengths of adhesive resins, to varying degrees. Theyfound that Consepsis was the only disinfectant that did
not significantly affect the bond strength of any of theseadhesive resins.
The benzalkonium chloride-based dentin disinfectant(Tubulicid Red) did not alter the bond strength of IPSEmpress 2 samples that were luted with Variolink 2and Resilute. Surprisingly, it produced an increase inshear bond strength. Derhami, Coli and Brännström(1995) reported that treatment of the cavity walls with
Groups Disinfectant Dentin Bonding System Luting Resin Mean Std Deviation
1 Control None Syntac Variolink 2 20.5700±5.0320a*
2 Consepsis Syntac Variolink 2 24.2430±3.0798ab
3 Tubulicid Red Syntac Variolink 2 26.9100±5.1387b
4 Control None DenTASTIC UNO DUO ResiLute 15.0800±4.1386c
5 Consepsis DenTASTIC UNO DUO ResiLute 17.1640±2.5562cd
6 Tubulicid Red DenTASTIC UNO DUO ResiLute 20.3590±4.2260d
*Different letters indicate that there were statistically significant differences (p<0.05).
Table 3: Treatment Groups and Mean Shear Bond Strength Values (MPa)
Figure 2: Appearance of adhesive resin on the dentin surface.
Figure 3: Appearance of the dentin surface free from adhesive resin.
Dow
nloaded from http://m
eridian.allenpress.com/operative-dentistry/article-pdf/30/4/1/1819389/1559-2863-30-4-1.pdf by guest on 12 January 2022

458 Operative Dentistry
Tubulicid Red, instead of the respective conditioners ofthe adhesive systems (Superbond D-liner and ClearfilLiner Bond), had no adverse effect on their sealingability in Class II resin composite restorations. Thismay depend on the fact that benzalkonium chloridehas been shown to link the collagen but does not impairhybridization (Gwinnett, 1992b). A previous study con-ducted by Türkün and others (2004) indicates thattreatment of cavity preparations with Tubulicid Redbefore application of dentin bonding systems did notadversely affect both their sealing ability and bondstrengths. Similarly, Say and others (2004) showedthat the benzalkonium chloride-based disinfectantUltracid F, after etching the dentin, did not have anadverse effect both on the shear and tensile bondstrengths of dentin bonding systems. However, Caoand others (1995) showed that Tubulicid Red decreasedthe shear bond strength of All Bond 2 andAmalgambond Plus but did not adversely affectPermagen.
It has been shown that adhesive luting increases thefracture resistance of all-ceramic crowns (McCormick& others, 1993; Burke & Watts, 1994). Strub andBeschnidt (1998) tested five different all-ceramic crownsystems, including the Empress system, for their frac-ture strengths. Their results revealed that the crownsof the Empress staining technique showed the fewestcrown fractures. The probable reason for the fractureresistance of Empress crowns was attributed to theirbeing pressed as full crowns. Their results indicatethat the composite had a higher bond strength toceramic material than to prepared dentin. The resultsof this study are in accordance with Strub andBeschnidt’s study, since all the specimens showed theadhesive failure mode between the dentin and com-posite luting agent interface.
The application sequence of the disinfectant is also animportant factor to be considered. While some clini-
cians prefer to apply disinfectants after tooth prepara-tion, prior to the bonding procedure (Meiers & Shook,1996; Gurgan & others, 1999; el-Housseiny &Jamjoum, 2000; Meiers & Kresin, 1996), others preferto apply disinfectants after etching (Pilo & others,2001; Cao & others, 1995; Schaeken & others, 1991;Perdigão & others, 1994; Say & others, 2004; Owens,Lim & Arheart, 2003). In this study, the effect of dentindisinfectants on the bond strength of all-ceramic lutingsystems was investigated after etching procedures.The manufacturer recommends the use of Consepsisand Tubulicid Red after etching. The use of dentin dis-infectants would be more preferable after etching thedentin, as removal of the smear layer leads to the elim-ination of most microorganisms. Then, the use of disin-fectants would be more beneficial for those micro-organisms and their toxins that remain viable in thedentinal tubules (Say & others, 2004).
This study did not primarily intend to compare theshear bond strengths of the two luting systems; how-ever, it is interesting to note that the adhesive per-formance of the luting systems was not the same interms of shear bond strength. This may be due to thedifference in the adhesive systems of the luting resinsused. One adhesive system used in this study, Syntac,is a fourth-generation dentin bonding agent that worksin three steps: etching, priming and bonding. The otheradhesive system, DenTASTIC UNO DUO, is a fifth-generation one-bottle bonding system. One-bottle sys-tems combine the primer and adhesives into one solu-tion to be applied after the enamel and dentin areetched simultaneously (Kugel & Ferrari, 2000). In thissystem, the dentin surface should remain in a moiststate to prevent collapse of the unsupported collagenand promote primer-resin infiltration (Gwinnett,1992b; Kanca, 1992). In this study, Syntac showedmore favorable results in the shear bond strength testthan DenTASTIC UNO DUO. Studies that comparethe shear bond strength of these adhesive systems arenot available in the dental literature; therefore, com-parison of the results of this study could not be per-formed.
Regarding the adhesive systems used in the study,Syntac adhesive system is water-based, whileDenTASTIC UNO DUO is acetone-based. Reis andothers (2003) have demonstrated that the degree ofmoisture of dentin is effective on the bond strength ofadhesive systems. By monitoring the amount of waterused to rewet the air-dried dentin surface, they haveshown that total etch adhesive systems achieve opti-mal bond strengths at different moisture degrees,which is dependent on the solvent present in each system.Their data confirmed, in a quantitative manner, thatwater-based systems require a drier dentin surface,while acetone-based systems require a wetter dentinsurface for improved bond strengths. In this study,
Figure 4: Partly debonded adhesive resin from the dentin surface.
Dow
nloaded from http://m
eridian.allenpress.com/operative-dentistry/article-pdf/30/4/1/1819389/1559-2863-30-4-1.pdf by guest on 12 January 2022

459Turkun & Others: Effects of Dentin Disinfectants on the Shear Bond Strength of All-ceramics to Dentin
excess water (or disinfectant) was removed by light airdrying instead of cotton pellet drying. The favorableresults of Syntac in shear bond test may be attributedto this light air drying.
It should be noted that this study was performedunder in vitro conditions. Simulation of oral conditionsin the laboratory is quite difficult. However, laboratorystudies that compare materials under similar condi-tions give us insight into probable clinical behavior andprovide guidance for clinical trials.
CONCLUSIONS
Within the limitations of this in vitro study, the nullhypothesis must not be rejected. The application ofConsepsis and Tubulicid Red did not adversely affectthe shear bond strengths of IPS Empress 2 all-ceramicsamples, which were luted with Variolink 2 andResilute dual polymerizing systems. Furthermore,Tubulicid Red caused an increase in the shear bondstrength.
(Received 1 March 2004)
References
Bauer JG & Henson JL (1984) Microleakage: A measure of theperformance of direct filling materials Operative Dentistry9(1) 2-9.
Brännström M (1986) The cause of postrestorative sensitivityand its prevention Journal of Endodontics 11(10) 475-481.
Brännström M (1987) Infection beneath composite resin restora-tions: Can it be avoided? Operative Dentistry 12(4) 158-163.
Brännström M (1996) Reducing the risk of sensitivity and pulpalcomplications after the placement of crowns and fixed partialdentures Quintessence International 27(10) 673-678.
Burke FJ (1995) The effect of variations in bonding procedure onfracture resistance of dentin-bonded all-ceramic crownsQuintessence International 26(4) 293-300.
Burke FJ & Watts DC (1994) Fracture resistance of teethrestored with dentin-bonded crowns QuintessenceInternational 25(5) 335-340.
Cao DS, Hollis RA, Christensen RP & Christensen GJ (1995)Effect of tooth disinfecting procedures on dentin shear bondstrength Journal of Dental Research 74 73 Abstract #493.
Christensen GJ (1999) Porcelain-fused to metal vs non-metalcrowns Journal of the American Dental Association 130(3)409-411.
Cunningham MP & Meiers JC (1997) The effect of dentin disin-fectants on shear bond strength of resin-modified glass-ionomer materials Quintessence International 28(8) 545-551.
Derhami K, Coli P & Brännström M (1995) Microleakage inClass II composite resin restorations Operative Dentistry20(3) 100-105.
Eick JD, Robinson SJ, Chappell RP, Cobb CM & Spencer P(1993) The dentinal surface: Its influence on dentinal adhe-sion Part III Quintessence International 24(8) 571-582.
el-Housseiny AA & Jamjoum H (2000) The effect of caries detec-tor dyes and a cavity cleansing agent on composite resin bond-ing to enamel and dentin Journal of Clinical PediatricDentistry 25(11) 57-63.
Gultz J, Do L, Boylan R, Kaim J & Scherer W (1999)Antimicrobial activity of cavity disinfectants GeneralDentistry 47(2) 187-190.
Gurgan S, Bolay S & Kiremitçi A (1999) Effect of disinfectantapplication methods on the bond strength of composite todentin Journal of Oral Rehabilitation 26(10) 836-840.
Gwinnett AJ (1992b) Effect of cavity disinfection on bondstrength to dentin Journal of Esthetic Dentistry4(Supplement) 11-13.
Gwinnett AJ (1992a) Moist versus dry dentin: Its effect on shearbond strength American Journal of Dentistry 5(3) 127-129.
Kanca J 3rd (1992) Resin bonding to wet substrate 1 Bonding todentin Quintessence International 23(1) 39-41.
Kedici PS, Kalipcilar B & Bilir OG (1992) Effect of glass ionomerliners on bonding strength of laminate veneers Journal ofProsthetic Dentistry 68(1) 29-32.
Kugel G & Ferrari M (2000) The science of bonding: From firstto six generation Journal of the American Dental Association131(Supplement) 205-255.
Lacy AM, Wada C, Du W & Watanabe L (1992) In vitromicroleakage at the gingival margin of porcelain and resinveneers Journal of Prosthetic Dentistry 67(1) 7-10.
McCormick JT, Rowland W, Shillingburg HT Jr & DuncansonMG Jr (1993) Effect of luting media on the compressivestrengths of two types of all-ceramic crown QuintessenceInternational 24(6) 405-408.
Meiers JC & Kresin JC (1996) Cavity disinfectants and dentinbonding Operative Dentistry 21(4) 153-159.
Meiers JC & Shook LW (1996) Effect of disinfectants on the bondstrength of composite to dentin American Journal of Dentistry9(1) 11-14.
Milleding P, Ortengren U & Karlsson S (1995) Ceramic inlay sys-tems: Some clinical aspects Journal of Oral Rehabilitation22(8) 571-580.
Miller MB (1995) Ed Cavity cleansers/disinfectants Reality 9 37.
Oram DA & Pearson GJ (1994) A survey of current practice intothe use of aesthetic inlays British Dental Journal 176(12)457-462.
Owens BM, Lim DY & Arheart KL (2003) The effect of antimi-crobial pre-treatments on the performance of resin compositerestorations Operative Dentistry 28(6) 716-722.
Palenik CJ & Setcos JC (1996) Antimicrobial abilities of variousdentine bonding agents and restorative materials Journal ofDentistry 24(4) 289-295.
Pashley DH, Sano H, Ciucchi B, Yoshiyama M & Carvalho RM(1995) Adhesion testing of dentin bonding agents: A reviewDental Materials 11(2) 117-125.
Perdigão J, Denehy GE & Swift EJ Jr (1994) Effects of chlorhex-idine on dentin surfaces and shear bond strengths AmericanJournal of Dentistry 7(2) 81-84.
Dow
nloaded from http://m
eridian.allenpress.com/operative-dentistry/article-pdf/30/4/1/1819389/1559-2863-30-4-1.pdf by guest on 12 January 2022

460 Operative Dentistry
Pilo R, Cardash HS, Oz-Ari B & Ben-Amar A (2001) Effect of pre-liminary treatment of the dentin surface on the shear bondstrength of resin composite to dentin Operative Dentistry26(6) 569-575.
Reis A, Loguercio AD, Azevedo CL, de Carvalho RM, de JulioSinger M & Grande RH (2003) Moisture spectrum of dem-ineralized dentin for adhesive systems with different solventbases Journal of Adhesive Dentistry 5(3) 183-192.
Swift EJ Jr, Perdigão J & Heymann HO (1995) Bonding to enam-el and dentin: A brief history and state of the art QuintessenceInternational 26(2) 95-110.
Say EC, Koray F, Tarım B, Soyman M & Gülmez T (2004) Invitro effect of cavity disinfectants on the bond strength ofdentin bonding systems Quintessence International 35(1) 56-60.
Schaeken MJ, Keltjens HMAM & Van der Hoeven JS (1991)Effects of fluoride and chlorhexidine on the microflora of den-tal root surfaces and progression of root surfaces cariesJournal of Dental Research 70(2) 150-153.
Strub JR & Beschnidt SM (1998) Fracture strength of 5 differentall-ceramic crown systems International Journal ofProsthodontics 11(6) 602-609.
Türkün M, Türkün LS & Kalender A (2004) Effect of cavity dis-infectants on the sealing ability of non-rinsing dentin-bondingresins Quintessence International 35(6) 469-476.
Van Meerbeek B, Perdigão J, Lambrechts & Vanherle G (1998)The clinical performance of adhesives Journal of Dentistry26(1) 1-20.
Zawta C (2001) Fixed partial dentures with an all-ceramic sys-tem: A case report Quintessence International 32 351-358.
Dow
nloaded from http://m
eridian.allenpress.com/operative-dentistry/article-pdf/30/4/1/1819389/1559-2863-30-4-1.pdf by guest on 12 January 2022

©Operative Dentistry, 2005, 30-4, 461-467
Comparison ofLinear Polymerization Shrinkage
and MicrohardnessBetween QTH-cured &LED-cured Composites
S-H Park • S-S Kim • Y-S ChoS-Y Lee • B-D Noh
Clinical Relevance
The second generation LED is an improvement over the first generation LED. Despite itsreported efficiency in composite curing, the second generation LED performs as well asthe QTH system for composite curing and does not produce more rapid composite poly-merization compared to the QTH unit.
SUMMARY
This study evaluated the effectiveness of secondgeneration light emitting diode (2ndLED) units incomposite curing. In order to compare their effec-tiveness with that of conventional quartz tungstenhalogen light curing units (QTH) and first genera-tion LEDs (1stLED), the amount of linear polymer-ization shrinkage, polymerization speed andmicrohardness were measured. Linear polymer-
ization shrinkage was measured every 0.5-0.55 sec-onds for 60 seconds when composite specimens(Z250, 3M ESPE Dental Products, St Paul, MN,USA) were light cured with five different lightsources: XL 3000 (QTH, 3M ESPE DentalProducts), Elipar FreeLight 2 (2ndLED, 3M ESPEDental Products), Ultra-Lume LED2 (2ndLED,Ultradent Products, South Jordan, UT, USA),Elipar FreeLight (1stLED, 3M ESPE DentalProducts) and experimental product X (1stLED,Biomedisys, Seoul, Korea). The amount of linearpolymerization shrinkage in 60 seconds and thespeed of polymerization shrinkage in the first 15seconds were measured for the different lightingunits. The amount of polymerization was com-pared with one-way ANOVA using Tukey at the95% confidence level. In order to compare thespeed of polymerization, the peak time (PT) show-ing the highest speed of polymerization and maxi-mum speed of polymerization (Smax) were deter-mined from the data and compared using one-wayANOVA with Tukey at the 95% confidence level foreach material.
*Sung-Ho Park, DDS, PhD, associate professor, Dept ofConservative Dentistry, BK21 Project of Medical Science,Dept of Oral Science Research Center, Seoul, South Korea
Su-Sun Kim, post-graduate student, Dept of ConservativeDentistry, Yonsei University, Seoul, South Korea
Yong-Sik Cho, post-graduate student, Dept of ConservativeDentistry, Yonsei University, Seoul, South Korea
Soon-Young Lee, post-graduate student, Dept of ConservativeDentistry, Yonsei University, Seoul, South Korea
Byung-Duk Noh, assistant professor, Dept of ConservativeDentistry, Institute of Oral Science, Yonsei University, Seoul,South Korea
*Reprint request: 134 Shinchon-Dong, Seodaemun-Gu, Seoul,South Korea; e-mail: [email protected]
Dow
nloaded from http://m
eridian.allenpress.com/operative-dentistry/article-pdf/30/4/1/1819389/1559-2863-30-4-1.pdf by guest on 12 January 2022
462 Operative Dentistry
For microhardness measurements, the micro-hardness of 2-mm composites, Z250, which hadbeen light cured by XL 3000 (G1), FreeLight 2 (G2),Ultra-Lume LED2 (G3), FreeLight (G4) or experi-mental product X (G5) were compared on theupper and lower surface. The microhardness ofeach surface was compared between groups usingtwo-way ANOVA with Tukey test at 95% levels ofconfidence.
The amount of polymerization shrinkage at 60seconds was G1, G2, G3> G4, G5 (p<0.05). PT wasG1, G3<G2<G4, G5. Smax was G1, G2 > G3 >G4, G5(p<0.05).
On the upper composite surface, there was nodifference in microhardness between groups(p<0.05).
On the lower surface, the microhardness was G1,G2> G3> G4, G5 (p<0.05).
There was no difference in microhardnessbetween the upper and lower surface in G1 andG2; whereas, microhardness of the lower surfacewas lower in G3, G4 and G5.
It was concluded that 2ndLEDs and the conven-tional QTH unit cured composites more effectivelythan 1stLEDs.
INTRODUCTION
Adequate polymerization of a resin composite is consid-ered a very important factor in obtaining adequatephysical (Asmussen, 1982) and biological properties(Caughman & others, 1991). It is reported that thepower density required for effective polymerization of acomposite should be more than 280mW/cm2
(Rueggeberg, Caughman, & Curtis, 1994). QuartzTungsten Halogen (QTH) units have been most widelyused for curing composites. However, the power den-sity of a QTH system decreases as time passes, andhalogen bulbs or filters should be replaced. The problemis that most dentists do not notice the decrease in light-emission if they fail to regularly check the power den-sity of curing lights (Miyazaki & others, 1998; Martin,1998).
Plasma Arc Curing (PAC) systems have a higherpower density than conventional QTH units. They usea high-frequency electrical field to generate plasmaenergy, and matter is, thereby, transformed into a mix-ture of ions, electrons and molecules. The large amountof energy released during this process is used for curingphotosensitive composites. Although manufacturersrecommend that three seconds is sufficient for curing,12 seconds of light curing is usually necessary for ashallow cavity not exceeding 2 mm (Park, Krejci &Lutz, 2002). In addition, as composites are cured fasterin the PAC-cure than the QTH-cure, they may producemore strain in the cavosurface margin (Park & others,
2002). As the light spectrum emitted by the PACsystem is narrower (450-470 nm) than the conventionalQTH unit, some composites and bonding systems thatdo not use camphorquinone as a photo-initiator systemdo not react. The price of the PAC system is also muchhigher than the QTH unit.
An argon (Ar) laser, which has a more consistent lightoutput over distance, has also been used to cure com-posites (Blankenau & others, 1991a,b; Kelsey & others,1989). It emits specific bandwidths of light in ranges of454 nm to 466 nm, 472 nm to 497 nm and 514 nm.Because it generates little infrared output, not muchheat is produced. Even though 10 to 15 seconds is neededto cure composites with an Ar laser, the curing tip is sosmall that more time is generally needed to cure therestoration. Argon lasers also have narrow spectral out-puts, they are expensive, inefficient and occupy toomuch space, and currently they are not popular(Burgess & others, 2002).
Light emitting diodes (LED) have recently been intro-duced to cure dental composites. LED curing lights usegallium nitride semiconductors that produce a bluelight when subjected to an electrical current. An LEDgenerates a narrower light-output of around 470 nm.As compared with the QTH unit, the LED has consid-erable merit from the clinician’s viewpoint. Regardingits use as a semiconductor for light-emission, the powerdensity of light does not decrease. Therefore, cliniciansdo not need to be concerned with loss of power densityin the curing light. In addition, battery-powered LEDshave excellent battery life, because 1) the powerrequirements are significantly lower than QTH andPAC lights; 2) LEDs produce little heat during opera-tion, which means that fans are not required to cool theunits and 3) LEDs have no moving parts (Burgess &others, 2002). However, it has been reported that thepower density of LEDs is so low that they do not suffi-ciently cure 2-mm composite specimens (Kurachi &others, 2001; Park & others, 2003). The recently intro-duced second generation LEDs (2ndLED) have a higherpower density than first generation LEDs (1stLED).
A linear relationship between light intensity andpolymerization contraction has been demonstrated(Sakaguchi & others, 1992). The contraction rate oflight-cured composite is highest during the first 30 to40 seconds of the polymerization reaction (Sakaguchi &others, 1992). This is clinically important, because theintegrity of the tooth-composite interface is rapidlychallenged during the early phase of polymerization,when the bond between hard tissue and the compositeis still maturing. The speed and amount of polymeriza-tion shrinkage of a resin composite is easily and accu-rately measured by a specially designed linometer (deGee, Feilzer & Davidson, 1993; Park, Krejci & Lutz, 1999,2002).
Dow
nloaded from http://m
eridian.allenpress.com/operative-dentistry/article-pdf/30/4/1/1819389/1559-2863-30-4-1.pdf by guest on 12 January 2022

463Park & Others: Comparison of Linear Polymerization Shrinkage and Microhardness
In a resin composite, the physical properties are closelyrelated to the degree of conversion and a hardnessmeasurement is an effective way to evaluate the degreeof cure (Rueggeberg & Craig, 1988).
This study evaluated the effectiveness of second gen-eration LEDs (2ndLED) for composite curing. To com-pare its effectiveness with conventional LEDs (1stLED)and QTH units, the amount of linear polymerizationshrinkage, speed of polymerization and microhardnessof composites were compared.
METHODS AND MATERIALS
A. Measurement of Linear PolymerizationShrinkage
Z250 was used as the test composite. It was transferredto a Teflon mold to ensure that the same amount of com-posite was used for each linometer sample. The com-posite was then transferred to the disk in the custom-made linometer, which had been previously coated witha separating glycerin gel. The resin composite was thencovered with a glass slide and loaded under constantpressure. The surface of the glass slide facing the com-posite had also been coated with separating gel. Thecomposites were light cured with QTH, 1stLEDs or2ndLEDs (Table 1). The power density of each curingunit was measured using a Coltolux Light Meter(Coltene, Altstätten, Switzerland) (Table 1). The tip ofthe curing light was positioned 2-mm above the slideglass and the specimens were light cured for 60 sec-onds. As the composite under the glass slide was cured,it shrank towards the light source and the aluminumdisk under the composite was moved upward. Theamount of disk displacement caused by linearshrinkage of the resin composite was measured using aLinear Variable Differential Transformer (LVDT)linometer (R&B Inc, Daejon, South Korea). The digitaldata was recorded on a computer for 60 seconds usingthe Microsoft Excel 2002 program. Park and others(1999, 2002) previously reported the design of thelinometer. Fifteen measurements were made for eachgroup and the amount of linear shrinkage occurringover 60 seconds was statistically compared using a one-way ANOVA test, and a Tukey’s test was used as a posthoc test at the 95% confidence level.
B. Determination of Polymerization Speed
From the data in A, the peak time (PT) that showed thehighest speed of polymerization and maximum speed ofpolymerization (Smax) in the first 15 seconds of curingwere determined.
The speed of polymerization at time = t was calculat-ed as follows;
St = (Lt+∆t– Lt-∆t)/(Tt+∆t-Tt-∆t)
St: Speed of polymerization shrinkage at time t
Lt+∆t: Amount of linear shrinkage at time t = t + ∆t
Lt-∆t: Amount of linear shrinkage at time t = t - ∆t
Tt+∆t: The time when Lt+0.5 was measured.
Tt-∆t: The time when Lt+0.5 was measured.
(∆t was 0.5-0.55s in this study)
PT and Smax were compared between groups with oneway ANOVA test, using a Tukey’s test as a post hoc testat the 95% confidence level.
C. Measurement of Microhardness
A 6-mm diameter hole was made in a 2-mm thick Teflonplate, and a glass slide was positioned along the lowerside of the hole. Titanium-coated instruments(Composite Instrument, Coltene, Switzerland) wereused to place the Z250 into the mold. The slide glasswas placed on top of the composite and pressed flat. Thespecimens were light cured using QTH, 1stLEDs or2ndLEDs (Table 1). Ten specimens were assigned to eachgroup. After the composites were light cured, the speci-mens were removed from the mold. The upper surface(closer to the light source) and lower surface of the spec-imens were then marked with a pen. The specimenswere stored in the dark in 100% humidity at 37°C forseven days. The microhardness of the upper and lowersurfaces were then measured with a Vickers hardness-measuring instrument (Optidur, GöttfertFeinwerktechnik GmbH, Buchen, Germany). Themicrohardness was compared using a two-way ANOVAtest and Tukey test to compute statistical significanceat the 95% confidence level. In each group, the hardnessratio was also calculated.
Hardness ratio = (Microhardness of lower sur-face)/(Microhardness of upper surface)
Groups Curing Light Type Curing Time Manufacturer Power Density(seconds) (mW/cm2)
1 XL 3000 QTH 60 3M ESPE, St Paul, MN, USA 730
2 Elipar FreeLight2 2ndLED 60 3M ESPE, St Paul, MN, USA 980
3 Ultra Lume LED2 2ndLED 60 Ultradent Products, South Jordan, UT, USA 560
4 Elipar FreeLight 1stLED 60 3M ESPE, St Paul, MN, USA 330
5 X(Experimental Product) 1stLED 60 Biomedisis, Seoul, Korea 310
Table 1: Curing Lights Used in this Study
Dow
nloaded from http://m
eridian.allenpress.com/operative-dentistry/article-pdf/30/4/1/1819389/1559-2863-30-4-1.pdf by guest on 12 January 2022

464 Operative Dentistry
RESULTS
A. Polymerization Shrinkage
Change in the amount of linear polymer-ization shrinkage versus time is shownin Figure 1.
Table 2 lists the amount of linear poly-merization shrinkage measured in 60seconds.
The order of the amount of polymeriza-tion shrinkage in 60 seconds was G1, 2, 3> G4, 5 (p<0.05).
B. Polymerization Speed
Changes in the speed of polymerizationshrinkage versus time are shown inFigure 2.
The PT and Smax are listed in Table 3.The order of Smax was G1, 2 >G3 > G4, 5(p<0.05). The order of PT was G1, G3 <G2 < G4, 5 (p<0.05).
C. Microhardness
In a two-way ANOVA, significant differ-ences in microhardness were observedfor curing lights (Group 1 to 5) (p<0.05)and observation surfaces (Upper surfaceor Lower surface) (p<0.05). A significantinteraction existed between the curinglights and observed surface (p<0.05).There was no difference between groupsin the microhardness of the upper sur-face. However, on the lower surface, theorder of microhardness was G1, 2 > G3 >G4, 5 (p<0.05) (Table 4). There was nodifference in microhardness between theupper and lower surface in G1 and G2;whereas, the microhardness of the uppersurface was higher than the lower sur-face in G3, G4, G5 (p<0.05) (Table 4).
The hardness ratio was more than 0.8in all groups (Table 4).
DISCUSSION
Results on the polymerization shrink-age, polymerization speed and microhardness showedthat the 2ndLED was an improvement over the 1stLEDand has similar performance to a QTH system.
LEDs were reported to be more effective than a QTHlamp in composite polymerization when power densi-ties of both the LED and QTH lamp were adjusted to300mW/cm2, because LEDs produced a narrower spec-trum of light that fell closely within the absorptionrange of the camphoroquinone (Mills, Jandt &Ashworth, 1999). When this study was first designed, itwas assumed that the polymerization speed of G2
would be much faster than G1, because G2 was an LEDand had a higher power density than G1. However, theshrinkage patterns of G1 and G2 were similar (Table 3,Figures 1 and 2). Some factors may be responsible forthis discrepancy. First, the efficacy of the LED lampmay not be tied to the composite polymerization. Eventhough the efficiency of the LED lamp was 31% greaterthan the QTH lamp, the scrape-back lengths from thecomposites polymerized using the LED lamp were only6% higher than those polymerized using the QTH lampdue to the exponential decay of light through the com-
Figure 1: Change in the amount of linear polymerization shrinkage versus time.
Figure 2: Change in the speed of polymerization versus time.
Dow
nloaded from http://m
eridian.allenpress.com/operative-dentistry/article-pdf/30/4/1/1819389/1559-2863-30-4-1.pdf by guest on 12 January 2022

465
posites (Halvorson, Erickson& Davidson, 2004). Second,the power density valuemay be incorrect, because ahand-held radiometer thathas an opening with a setdiameter was used. It hasbeen reported that aradiometer with a fixedopening does not allow foran accurate measurement ofpower density (Leonard,Charlton & Hilton, 1999).Burgess and others (2002)reported that the power den-sity of XL3000 (G1) andElipar FreeLight2 (G2) was750mW/cm2 and 808mW/cm2, respectively, whenthey were measured using aradiometer that did nothave a fixed opening andallowed for an accuratemeasurement. In this study,the power density was730mW/cm2 and 980mW/cm2,respectively. Another possibility is that this might be amaterial-specific phenomenon. In Z250, a three-compo-nent initiation system (camphorquinone, tertiaryamine and Iodonium salt) was introduced to initiateand activate the composite (US patent #5,545,676).Park and others (2002) reported that this initiationsystem was quite effective in composite polymerizationkinetics and induced a more rapid cure with the QTHunit. However, the similarity in the amount of linearpolymerization shrinkage and the similar shrinkagepatterns between G1 & G2 is currently unclear,because there are many factors that can influence poly-merization kinetics. Therefore, further research will beneeded.
There was no difference in the amount of linear poly-merization shrinkage between G1, G2 and G3 (Table 2,Figure 1). G3 showed a slower shrinkage pattern thanG1 and G2 (Table 3, Figure 2), but it achieved the sameshrinkage amount in 60 seconds. It has been reportedthat pre-polymerization at a low power density followedby a final cure at a high power density may allow forincreased flow of material and a decrease in polymer-ization shrinkage stress in a restoration, which mayproduce a more favorable margin (Mehl, Hickel &Kunzelmann, 1997; Feilzer & others, 1995). G3 showeda slower cure than G1 and G2, but there was no differ-ence in the amount of linear polymerization shrinkagein 60 seconds (Figures 1 and 2). Further research isneeded to determine whether G3 provides better mar-ginal adaptation than G1 and G2.
In this study, there were no differences in the micro-hardness of upper surfaces between groups. However,the order of microhardness of the lower surfaces wasG1, G2 >G3 >G4, 5, and the microhardness of the uppersurfaces was higher than the lower surfaces in G3, G4and G5, whereas, there was no difference in G1 and G2.This is consistent with an article by Kurachi and others(2001). It has been reported that composite curing of adeep cavity layer is considered to be complete if theminimum hardness value is >80% of the maximumvalue measured on the specimen surface (Lutz, Krejci &Frischknecht, 1992; Breeding, Dixon & Caughman,1991). Even though microhardness of the lower surfacewas lower than the upper surface in G3, G4 and G5, thehardness ratio was >0.8 in all groups. Therefore, it ispossible that all LED systems used in this study can beused for a 2-mm cavity with 60 seconds of light curing.In a recent study, second generation LED was able topolymerize top and bottom composite surfaces equiva-lent to or greater than the 40 second-QTH control inonly 10 seconds (Rueggeberg, Daronch & de Goes,2004). Further research will be needed to determine thecorrect curing depth and curing time.
For Ultra-Lume LED 2 (G3), the power density was560mW/cm2. Due to its unique elliptical shape, exactpower-density measuring was difficult. Burgess andothers (2002) reported that the power density of Ultra-Lume LED2 was 500 mW/cm2 when measured using aradiometer that did not have a fixed opening andallowed for accurate measurement. According to themanufacturer, the major emission of Ultra-Lume 2 lies
Park & Others: Comparison of Linear Polymerization Shrinkage and Microhardness
Groups 1 2 3 4 5
8.8(1.1)a 8.7(0.6)a 8.5(0.7)a 6.8(0.8)b 6.6(0.9)b
Different letters indicate different amounts of linear shrinkage at p<0.05 level.Figures in the parenthesis indicate standard deviations.
Table 2: Amount of Linear Polymerization Shrinkage (µm) at 60 Seconds of Light Curing
G1 G2 G3 G4 G5
PT(sec) 3.65(0.05)c 4.20(0.03)b 3.65(0.05)c 5.25(0.05)a 5.25(0.03)aSmax (µm/sec) 1.36(0.30)a 1.38(0.30)a 1.00(0.20)b 0.60(0.20)c 0.59(0.25)c
Different letters indicate different amounts of linear shrinkage at p<0.05 level.Figures in the parenthesis indicate standard deviations.
Table 3: Peak Time (PT) That Showed the Highest Speed of Polymerization and Maximum Speed of Polymerization (Smax)
G1 G2 G3 G4 G5
Upper surface 81.7(1.8)a 81.3(1.5)a 82.0(1.8)a *
80.5(1.3)a *
80.7(2.7)a *
Lower surface 80.5(2.2)a 80.7(2.5)a 77.7(3.9)b 75.0(1.3)c 74.7(2.8)c
Hardness Ratio 0.98(0.02) 0.99(0.01) 0.95(0.02) 0.93(0.01) 0.93(0.03)
*Indicates different microhardness between upper and lower surface at 95% levels of confidence.Different letters indicate different microhardness on the upper or lower surface at the 95% levels of confidence.Hardness Ratio: (Microhardness of lower surface)/(Microhardness of upper surface)
Table 4: Microhardness of Upper and Lower Surface
Dow
nloaded from http://m
eridian.allenpress.com/operative-dentistry/article-pdf/30/4/1/1819389/1559-2863-30-4-1.pdf by guest on 12 January 2022

466 Operative Dentistry
between 445 and 472, and the peak wavelength of theunit is shifted away from a conventional LED: from 468nm to 459 nm. Such a shift may provide additionalenergy within the spectral region of some of the alter-native photoinitiators on the market. In this study, thePT was G1, 3<G2<G4, 5 (Table 3). It is not yet clearwhether the shift in peak wavelength in G3 inducedsuch a fast PT.
As long as camphorquinone is used as the photoini-tiator, LED curing lights have adequate cure. However,photoinitiators, such as 1- phenyl-1,2- propanedion(with a peak absorption of 410 nm), bisacylphosphineoxide or triacylphosphine oxide (with peak absorptionof 320 nm to 390 nm) may fall outside this range. Sincethe wavelength of light that LEDs emit range from 440nm to 490 nm, some bonding agents and compositesthat use other agents as photo initiators sufferedcuring problems (Palmer & others, 2004). Recently, athird generation LED, which has a bimodal emissionspectrum and covers a broader spectral range, has beenreleased.
The 1stLEDs, G4 & G5, aligned small LEDs of lowerpower output into arrays. Their power density wasmuch lower than 2ndLEDs, G2 & G3. Ultra-Lume LED2 has two LEDs that are not arranged in array, but theyrely on AC power to produce higher output. Of theLEDs used in this study, FreeLight2 provided the high-est power density. According to the manufacturer, the5W Luxeon LED was introduced and the effectivenessof the emitted light is enhanced by the application of aspecial reflector that increases coupled light.
CONCLUSIONS
The results of this study show that second generationLED is an improvement over first generation LED andperforms as well as a QTH system for composite curing.
Acknowledgement
This study was supported by a grant (02-PJ3-PG4-PT03A-0018)by the Korea Health 21 R&D Project, Ministry of Health &Welfare, Republic of Korea.
(Received 2 January 2004)
References
Asmussen E (1982) Restorative resins: Hardness and strength vsquantity of remaining double bonds Scandinavian Journal ofDental Research 90(6) 484-489.
Blankenau RJ, Powell GL, Kelsey WP & Barkmeier WW (1991a)Post polymerization strength values of an argon laser curedresin Lasers in Surgery Medicine 11(5) 471-474.
Blankenau RJ, Kelsey WP, Powell GL, Shearer GO, BarkmeierWW & Cavel WT (1991b) Degree of composite resin polymer-ization with visible light and argon laser American Journal ofDentistry 4(1) 40-42.
Breeding LC, Dixon DL & Caughman WF (1991) The curingpotential of light-activated composite resin luting agentsJournal of Prosthetic Dentistry 65(4) 512-518.
Burgess JO, Walker RS, Porche CJ & Rappold AJ (2002) Lightcuring—An update Compendium 23(10) 889-906.
Caughman WF, Caughman GB, Shiflett RA, Rueggeberg F &Schuster GS (1991) Correlation of cytotoxicity, filler loadingand curing time of dental composites Biomaterials 12(8) 737-740.
de Gee AF, Feilzer AJ & Davidson CL (1993) True linear poly-merization shrinkage of unfilled resins and composites deter-mined with a linometer Dental Materials 9(1) 11-14.
Feilzer AJ, Dooren LH, de Gee AJ & Davidson CL (1995)Influence of light intensity on polymerization shrinkage andintegrity of restoration-cavity interface European Journal ofOral Science 103(5) 322-326.
Halvorson RH, Erickson RL & Davidson CL (2004)Polymerization efficiency of curing lamps: A universal energyconversion relationship predictive of conversion ofresin-based composite Operative Dentistry 29(1) 105-111.
Kelsey WP 3rd, Blankenau RJ, Powell GL, Barkmeier WW, CavelWT & Whisenant BK (1989) Enhancement of physical proper-ties of resin restorative materials by laser polymerizationLasers in Surgery Medicine 9(6) 623-627.
Kurachi C, Tuboy AM, Magalhaes DV & Bagnato VS (2001)Hardness evaluation of a dental composite polymerized withexperimental LED-based devices Dental Materials 17(4) 309-315.
Leonard DL, Charlton DG & Hilton TJ (1999) Effect of curing-tipdiameter on the accuracy of dental radiometers OperativeDentistry 24(1) 31-37.
Lutz F, Krejci I & Frischknecht A (1992) [Lichtpolymerization.Grundlagen und Praxistips für Anwendung] SchweizMonatsschr Zahnmed 102(5) 574-588.
Martin FE (1998) A survey of the efficiency of visible light curingunits Journal of Dentistry 26(3) 239-243.
Mehl A, Hickel R & Kunzelmann KH (1997) Physical propertiesand gap formation of light-cured composites with and without“softstart polymerization” Journal of Dentistry 25(3-4) 321-330.
Mills RW, Jandt KD & Ashworth SH (1999) Dental compositedepth of cure with halogen and blue light emitting diode tech-nology British Dental Journal 186(8) 388-391.
Miyazaki M, Hattori T, Ichiishi Y, Kondo M, Onose H & MooreBK (1998) Evaluation of curing units used in private dentaloffices Operative Dentistry 23(2) 50-54.
Palmer TM, Gessel TF, Steele DB & Ploeger BJ (2004)Polymerization of non-CQ resin by LED curing lights Journalof Dental Research 83(Special Issue A) Abstract #552.
Park SH, Krejci I & Lutz F (1999) Consistency in the amount oflinear polymerization shrinkage in syringe-type compositesDental Materials 15(6) 442-446.
Park SH, Krejci I & Lutz F (2002) Microhardness of resin com-posites polymerized by plasma arc or conventional visible lightcuring Operative Dentistry 27(1) 30-37.
Park SH, Kim SS, Cho YS & Lee SY (2003) The amount andspeed of polymerization shrinkage and microhardness in LED-cured composites The Journal of Korean Academy ofConservative Dentistry 28(4) 354-359.
Dow
nloaded from http://m
eridian.allenpress.com/operative-dentistry/article-pdf/30/4/1/1819389/1559-2863-30-4-1.pdf by guest on 12 January 2022

467Park & Others: Comparison of Linear Polymerization Shrinkage and Microhardness
Rueggeberg FA & Craig RG (1988) Correlation of parametersused to estimate monomer conversion in a light-cured compos-ite Journal of Dental Research 67(6) 932-937.
Rueggeberg FA, Caughman WF & Curtis JW Jr (1994) Effect oflight intensity and exposure duration on cure of resin compos-ite Operative Dentistry 19(1) 26-32.
Rueggeberg FA, Daronch M & de Goes (2004) Composite conver-sion using a variety of light type Journal of Dental Research83(Special Issue A) Abstract #1864.
Sakaguchi RL, Peters MC, Nelson SR, Douglas WH & Poort HW(1992) Effects of polymerization contraction in compositerestorations Journal of Dentistry 20(3) 178-182.
Dow
nloaded from http://m
eridian.allenpress.com/operative-dentistry/article-pdf/30/4/1/1819389/1559-2863-30-4-1.pdf by guest on 12 January 2022

©Operative Dentistry, 2005, 30-4, 468-473
Y Shimada • N Tomimatsu • T SuzukiMA Uzzaman • MF Burrow • J Tagami
Shear Bond Strength ofTooth-colored Indirect Restorations
Bonded to Coronal andCervical Enamel
SUMMARY
This study evaluated the shear bond strength ofresin inlays bonded with resin cement to cervicaland mid-coronal enamel. Two regions of enamel,
cervical and mid-coronal, were chosen from thebuccal surface of extracted molars. Composite“inlays” (Estenia, Kuraray Medical Inc) were fab-ricated indirectly and cemented with a dual-cured resin cement (Panavia Fluoro Cement II,Kuraray Medical Inc). The resin cement wascured with or without light irradiation for 30 sec-onds. After 24-hours or one-week’s storage in37°C water, the bonded inlays were subjected toa microshear bond test, whereby a shear forcewas applied to the inlays at a crosshead speed of1 mm/minute. The data were statistically ana-lyzed using ANOVA and Fisher’s PLSD test, withsignificance defined as p<0.05. Observationsusing confocal laser scanning microscopy werealso performed after debonding the specimens.The light-cure method showed significantly higherbond strengths to both enamel regions comparedwith self-cure, especially at 24 hours (p<0.05).However, bond strength of the self-cured resincement significantly improved after one week’sstorage (p<0.05; cervical enamel: p=0.022, mid-coronal enamel: p=0.0024). The cervical enamelshowed significantly lower bonding than mid-coronal enamel (p<0.05), except for the self-curedspecimens at 24 hours. Light curing of resin
Clinical Relevance
The cervical enamel region showed lower bond strengths of bonded indirect restorativesthan the mid-coronal enamel region.
*Yasushi Shimada, DDS, PhD, instructor, Cariology andOperative Dentistry, Department of Restorative Sciences,Graduate School, Tokyo Medical and Dental University,Tokyo, Japan
Md Akhtar Uzzaman, BDS, graduate student, Cariology andOperative Dentistry, Department of Restorative Sciences,Graduate School, Tokyo Medical and Dental University,Tokyo, Japan
Nobuyoshi Tomomatsu, undergraduate student, Tokyo Medicaland Dental University, Tokyo, Japan
Tsuyoshi Suzuki, undergraduate student, Tokyo Medical andDental University, Tokyo, Japan
Michael F Burrow, MDS, PhD, MEd, associate professor, Schoolof Dental Science, Faculty of Medicine, Dentistry and HealthSciences, University of Melbourne, Melbourne, Victoria, Australia
Junji Tagami, DDS, PhD, professor and chair, Cariology andOperative Dentistry, Department of Restorative Sciences,Graduate School, Tokyo Medical and Dental University,Tokyo, Japan
*Reprint request: 1-5-45 Yushima, Bunkyo-ku, Tokyo 113-8549,Japan; e-mail: [email protected]
Dow
nloaded from http://m
eridian.allenpress.com/operative-dentistry/article-pdf/30/4/1/1819389/1559-2863-30-4-1.pdf by guest on 12 January 2022

469Shimada & Others: Shear Bond Strength of Tooth-colored Indirect Restorations Bonded to Enamel
cement is a better choice than self-curing forluting of indirect restorations. The bond strengthof indirect restorations to cervical enamel waslower than mid-coronal enamel.
INTRODUCTIONAdvances in polymer chemistry have led to the develop-ment of an indirect adhesive procedure for estheticrestorations. Metal-free inlays, veneers, crowns, resin-bonded fixed prostheses, and even posts are now rou-tinely bonded to tooth structure with resin cement(Burrow & others, 1996; el-Mowafy, Rubo & el-Badrawy,1999; Christensen, 2000; Shimada, Yamaguchi &Tagami, 2002a; Foxton & others, 2002). On the otherhand, evidence of insufficient marginal sealing of bondedrestorations has also been shown in microleakagestudies (Kubo & others, 2001; Belli & others, 2001;Jayasooriya & others, 2003). Especially, the cervicaltooth region/composite interface has repeatedly beenreported to be more vulnerable to microleakage than theocclusal or mid-coronal tooth region/composite interfacein vitro (Kubo & others, 2001).
At the cervical enamel region, an irregular prismarrangement, lacking a normal keyhole appearance, hasbeen frequently observed (Silverstone & others, 1975;Gaspersic, 1995; Shimada, Kikushima & Tagami,2002b). The structural characteristics of cervical enamelare likely to have important clinical implications, asthey may have some influence on the development ofdental caries and, particularly, the efficacy of thebonding of restorative materials (Gaspersic, 1995;Shimada & others, 2002b).
Furthermore, although many studies have focused onthe bonding of resin cement to enamel, dentin or indirectrestorative materials, little is known about the bondingof indirect restorative materials to tooth structure withresin cement (Burrow & others, 1996; el-Mowafy &others, 1999; Christensen, 2000; Furukawa, Inai &Tagami, 2002; Shimada & others, 2002a,b; Foxton &others, 2002). This lack of information, especially ontoenamel, is probably due to difficulties with fabricatingsamples and designing a simple method of testing twoadhesive interfaces (one interface between the tooth andresin cement, and the other between the indirectrestoration and resin cement).
Recently, a microshear bond test was developed thatenabled measurement of the bonding of adhesive mate-rials to a variety of tooth substrates; the method allowsfor ease of sample preparation and gives precise resultswith relatively small standard deviations (Shimada &others, 2002a,b).
This study evaluated the bonding of an adhesivelyluted resin inlay to coronal and cervical enamel. Bond
strengths were assessed by means of a microshear bondtest and failure mode was observed using a confocallaser scanning microscope (CLSM). CLSM has beenwidely used in biology for non-invasive and non-destruc-tive imaging in vivo of many organ tissues and is con-venient for detecting the failure mode of de-bonded sur-faces, because an accurate 3-D image with no out-offocus blur can be quickly obtained by making andassembling a series of optical tomograms (Shimada &others, 1999; Jayasooriya & others, 2003; Foxton & oth-ers, 2002). Specimens examined by CLSM do not requireany special preparation and are not subjected to distor-tion caused by dehydration, which results from proce-dures such as scanning electron microscopy. The nullhypothesis was that there are no differences in themicroshear bond strength of bonded indirect restora-tions between cervical enamel and mid-coronal enamel.
METHODS AND MATERIALS
Tooth Preparation
Bonding was performed on the buccal surfaces of enamelfrom extracted human molars stored at 4°C in saline.Forty teeth were used in this study. Before sectioning,two enamel regions obtained from the cervical and mid-coronal regions were chosen as substrates for themicroshear bond test. The cervical region was 2 mmabove the cemento-enamel junction. Each slice, approx-imately 1.0-mm thick, was obtained by cutting with aslow rotating diamond blade (Struers Minitom, Struers,Copenhagen, Denmark) under a flow of water. Theenamel surfaces were then resurfaced with wet 600 gritSiC paper. Enamel depth was controlled for bondtesting by obtaining a sample from near the center,between the dento-enamel junction (DEJ) and the sur-face.
The enamel surfaces were treated with ED Primer II(Kuraray Medical, Inc, Osaka, Japan, Lot # Liquid A:000168; Liquid B: 00050) for 30 seconds, then an iris cutfrom micro bore tygon tubing (R-3603, NortonPerformance Plastic Co, Cleveland, OH, USA), with aninternal diameter and height approximately 0.7 mmand 0.5 mm, respectively (Figure 1), was mounted onthe mid-coronal and cervical regions of the enamelslices to delineate the bonding area.
Preparation of Resin Composite “Inlay”
A cylinder from the same micro bore tygon tubing (R-3603) was cut and used as a mold for the resin com-posite “inlay” (Figure 1). A resin composite for indirectrestorations (Estenia, Shade DA2, Kuraray MedicalInc, Lot #00209B) was placed into the tubing on a flatsurface covered with a paper mixing pad; a clear plasticmatrix strip was placed over the resin, gently pressedflat and irradiated for 60 seconds using a visible lightcuring unit for laboratory (α-Light II, J Morita Co,
Dow
nloaded from http://m
eridian.allenpress.com/operative-dentistry/article-pdf/30/4/1/1819389/1559-2863-30-4-1.pdf by guest on 12 January 2022

Tokyo, Japan) prior to heat curing at 110°C for 15 min-utes in air (KL 100, Kuraray Medical, Inc). Very smallcylinders of resin inlay, approximately 0.7 mm in diam-eter and 0.5 mm high, were removed from the tygontubing and silanized with application of a mixture ofacidic primer (Clearfil SE Bond Primer, KurarayMedical, Inc, Lot #00287B) and a silane agent (Clearfilporcelain bond activator, Kuraray Medical, Inc, Lot#00127A) for 20 seconds.
Bonding of Resin Composite Inlay
Forty enamel slices with tygon tubing were divided intotwo groups of 20 specimens each according to curingmethod:
Group 1 (self-cure): Dual-cured resin cement(Panavia Fluoro Cement II, Kuraray Medical, Inc, Lot# A paste: T030410, B paste: T030410) was mixed andinjected into the tubing on the tooth surface. The smallcylindrical resin “inlay” was then inserted into thetubing and air-inhibiting agent was applied to the resincement borders and placed in darkness at room tem-perature (23°C).
Group 2 (light-cure): Dual-cured resin cement(Panavia Fluoro cement II) was mixed and injected intothe tubing on the tooth surface. The small cylindricalresin “inlay” was inserted into the tubing and lightcured (Curing Light XL3000, 3M ESPE, St Paul, MN,USA) for 20 seconds.
In this manner, the small cylindrical resin “inlays”were bonded to the enamel surface; 40 resin “inlays”were bonded to the mid-coronal and cervical regions,respectively. The specimens were stored at room tem-perature (23°C) for one hour prior to removing thetygon tubing. Each group was further divided into twosub-groups of 10 specimens each, including 10 mid-coronal resin inlays and 10 cervical resin inlays, accordingto storage periods of 24 hours or one week. All speci-mens were stored at 37°C.
Microshear Bond Test
The microshear bond test apparatus is shown in Figure2. The enamel slice with cylindrical resin “inlay” wasattached to the testing device (Bencor-Multi-T, DanvilleEngineering Co, San Ramon, CA, USA) with a cyano-acrylate adhesive (Zapit, Dental Ventures of America,Corona, CA, USA), which, in turn, was placed in aUniversal testing machine (EZ-test-500N, Shimadzu,Kyoto, Japan) for shear bond testing. A thin wire (diam-eter: 0.20 mm) was looped around the resin inlay,making contact with half of the cylinder base and thewire was held flush against the resin/tooth interface. Ashear force was applied to each specimen at acrosshead speed of 1.0 mm/minute until failureoccurred.
Ten specimens from each group were tested. Theenamel regions (mid-coronal and cervical region), curing
method (self-cure and light-cure) and storage periods(24 hours and one week) were the three factors ana-lyzed using three-way analysis of variance (ANOVA).After three-way ANOVA, one-way ANOVA and multiplecomparisons were carried out using the Fisher’s PLSDtest. Statistical significance was defined as p<0.05.
All of the debonded tooth surfaces were examinedwith an optical microscope at 30x magnification andCLSM (1LM21H/W, Lasertec Co, Yokohama, Japan) to
470 Operative Dentistry
Figure 1. Bonding procedure for Estenia inlay.
Figure 2. Schematic diagram of the micro-shear bond test apparatus.
Dow
nloaded from http://m
eridian.allenpress.com/operative-dentistry/article-pdf/30/4/1/1819389/1559-2863-30-4-1.pdf by guest on 12 January 2022

471Shimada & Others: Shear Bond Strength of Tooth-colored Indirect Restorations Bonded to Enamel
determine the mode of failure. Failure modes were cat-egorized into one of six types (Figure 3): T: 100% cohe-sive failure in the tooth substrate; A1: 100% adhesivefailure between the tooth substrate or hybrid-like layerand resin cement; C: 100% cohesive failure in the resincement; A2; 100% adhesive failure between the resincement and resin inlay; I: 100% cohesive failure of theresin inlay; M: mixed failure with more than two fail-ures of T, A1, C, A2 and I. The modes of failure wereanalyzed using the Kruskal-Wallis test, with signifi-cance defined as p<0.05.
RESULTS
The mean shear bond strength values (MPa), standarddeviations and modes of failure are shown in Table 1.The ANOVA indicated that there were statistically sig-nificant interactions between the enamel regions andcuring method (F=5.597, p=0.0207), as well as thecuring method and storage periods (F=9.734,p=0.0026). However, no significant interaction wasobserved between the enamel regions or storageperiods (F=0.028, p=0.8685). Fisher’s PLSD test indi-cated that significant differences existed between theenamel regions (p<0.0001), curing method (p<0.0001)and storage period (p<0.0001).
The light-cured groups showed significantly higherbond strengths at one day than did the self-curedgroups (Fisher’s PLSD test, p<0.05). However, the bondstrength of the self-cured groups was significantlyimproved after storage for one week. Mid-coronalenamel showed significantly higher bond strengthsthan cervical enamel if the resin cement was light-cured (Fisher’s PLSD test, p<0.05), whereas, no differ-ence was seen between the self-cured groups (Fisher’sPLSD test, p>0.05).
CLSM observations revealed different failure pat-terns between the two curing methods but were not sta-tistically significant (Kruskal-Wallis, p=0.057). If theresin cement was self-cured, adhesive failure generallyoccurred within the resin cement (type C failure) orbetween the resin cement and enamel (type M failure).The light-cured specimens also showed cohesive failurewithin the resin cement (type C failure) and adhesive ormixed failure between the resin cement and enamelsurface (type A1 or M failure); however, some specimensshowed cohesive failure within the enamel (type T or Mfailure). In both self-cured and light-cured specimens,failure never occurred within the “inlay” material(Table 2).
DISCUSSION
Previous research hasshown that chemicallyinitiated polymerizationdoes not enable dual-cureresin cement to develop
optimal mechanical properties (Burrow & others,1996; el-Mowafy & others, 1999; Foxton & others,2002; Furukawa & others, 2002). In this study, thebond strength of dual-cure resin cement was dependentupon the curing method; the shear bond strength ofbonded resin inlay to enamel was high if the resincement was light-cured. Meanwhile, the bond strengthof indirect restoration bonded with self-cured resincement significantly improved after one week, probablyindicating continuation of the curing process of resincement. In view of the adhesion results, it was inter-esting to note the mode of failure after the shear bondtest. If the resin cement was self-cured, failure fre-quently occurred within the resin cement or the inter-face between the cement and enamel, possibly sug-gesting that the fracture toughness of self-curedcement was lower than enamel or resin inlay.However, light-cured specimens showed a more com-plex failure pattern, some of which also includedenamel fracture within the debonded area. Probably,this complex failure pattern after light activation indi-cates an improvement in fracture toughness and goodbonding to enamel. This change in failure pattern forcuring strategies is similar to previous studies: thehardness and bonding of dual-cured resin cement haveboth been reported to be low under conditions of self-cure alone without light irradiation (el-Mowafy &others, 1999; Foxton & others, 2002).
Figure 3. CLSM image of a debonded surface. Mid-coronal enamel with light-cured cement. Adhesive failure below the bonding resin and enamel can beseen.
Cervical Mid-coronal
Self-cure Light-cure Self-cure Light-cure
1 day 19.6 ± 5.82c 29.1 ± 6.80b 22.6 ± 4.59c 40.3 ± 7.79a
1 week 26.0 ± 4.11b,c 28.7 ± 3.14b 31.2 ± 5.94b 38.6 ± 8.75a
Mean values designated with a different superscript letters were significantly different (p<0.05).
Table 1: Results of the Microshear Bond Test (MPa, Mean ± SD)
Dow
nloaded from http://m
eridian.allenpress.com/operative-dentistry/article-pdf/30/4/1/1819389/1559-2863-30-4-1.pdf by guest on 12 January 2022

472 Operative Dentistry
Even though the shear bond strength values werestill low, the one-week period clearly improved thebond strength of self-cured cement to a level similar tolight-cured cement. In the cervical region, thisimprovement decreased the discrepancy of bondingbetween the self-cure and light-cure group (p<0.05). Itis often probable that light-activation of resin cementin the cervical region is not sufficient clinically, espe-cially if the cavity is located in the proximal region.Consequently, this improvement after one week wouldbe expected to show a better clinical outcome of thisresin cement in the cervical region. However, neitherlight curing nor self-curing could create a bond to cer-vical enamel to the same degree as that of mid-coronalenamel. Additionally, our previous laboratory studyevaluating the bonding of directly bonded resin com-posite showed that both a self-etching adhesive and atotal-etch one-bottle adhesive produced 36 to 37 MPato the cervical enamel region (Shimada & others,2002b). Clearly, these values were higher than that ofadhesively luted indirect restorations obtained in thisstudy. Further study on the regional effect of toothstructure on clinical success seems necessary for bothdirect and indirect bonded restorations.
In the case of light curing, the intensity of light pen-etrating through the indirect restoration has beenshown to be reduced by thickness and shade (Strydom& others, 2002; Tashiro & others, 2004). Consideringthese factors, it becomes clear that a curing unit mustbe able to effectively transmit light through an indirectrestoration in order to obtain sufficient hardness andbonding of the resin cement immediately after setting(Strydom, 2002; Foxton & others, 2002; Tashiro &others, 2004). Foxton and others (2002) showed that a2-mm thick ceramic inlay did not adversely affect thebonding and hardness of light-cured resin cement.This was not a problem in the current study.
With regard to tooth-colored indirect restorations,factors affecting the overall restoration longevity maybe related to luting and finishing procedures and maybe dependent on the thickness and adhesion of theresin cement (Furukawa & others, 2002; Foxton & oth-ers, 2002). Furukawa and others (2002) reported thatreinforcement by unification of the tooth substrate and
indirect restora-tion was achievedif bonding of theresin cement tothe tooth sub-strate was ade-quate. In theinstance wherethe restorationwas greater than2-mm thick orincluded proximal
regions, light activation of the resin cement may be dif-ficult (Foxton & others, 2002). In such clinical cases, areview of the bonded indirect restoration, for instanceafter one week, may be recommended when bonding ofa self-cured resin cement should be stable. Bonding ofindirect restorations, especially at the cervical enamelregion, was poorer than at the mid-coronal region evenafter light-curing. Further investigation is necessaryto develop bonding resins and cements that producehigh, uniform bond strength and/or gap-free marginsfor indirect restorations.
CONCLUSIONS
The results require that the null hypothesis should berejected. The cervical enamel region showed poorerbond strengths of bonded indirect restorations thanmid-coronal enamel. In spite of the limitations of thislaboratory study, light curing of resin cement is thebetter choice than self-curing alone. Further investiga-tions using clinical trials are necessary.
(Received 4 March 2004)
References
Belli S, Inokoshi S, Ozer F, Pereira PN, Ogata M & Tagami J(2001) The effect of additional enamel etching and a flowablecomposite to interfacial integrity of Class II adhesive compositerestorations Operative Dentistry 26(1) 70-75.
Burrow MF, Nikaido T, Satoh M & Tagami J (1996) Early bond-ing of resin cements to dentin—effect of bonding environmentOperative Dentistry 21(5)196-202.
Christensen GJ (2000) Resin cements and postoperative sensi-tivity Journal of the American Dental Association 131(8) 1197-1199.
el-Mowafy OM, Rubo MH & el-Badrawy WA (1999) Hardening ofnew resin cements cured through a ceramic inlay OperativeDentistry 24(1) 38-44.
Foxton RM, Pereira PN, Nakajima M, Tagami J & Miura H(2002) Durability of the dual-cure resin cement/ceramic bondwith different curing strategies Journal of Adhesive Dentistry4(1) 49-59.
Furukawa K, Inai N & Tagami J (2002) The effects of luting resinbond to dentin on the strength of dentin supported by indirectresin composite Dental Materials 18(2) 136-142.
Failure Moden T A1 C A2 I M
CervicalChemical-cure
1 day 10 0 2 3 0 0 51 week 10 0 5 2 0 0 3
Light-cure 1 day 10 0 7 0 0 0 31 week 10 0 3 1 0 0 6
Mid-coronalChemical-cure
1 day 10 0 4 3 0 0 31 week 10 0 3 3 1 0 3
Light-cure1 day 10 1 1 3 0 0 5
1 week 10 0 0 0 0 0 10
Table 2: Frequency of Mode of Failure
Dow
nloaded from http://m
eridian.allenpress.com/operative-dentistry/article-pdf/30/4/1/1819389/1559-2863-30-4-1.pdf by guest on 12 January 2022

473Shimada & Others: Shear Bond Strength of Tooth-colored Indirect Restorations Bonded to Enamel
Gaspersic D (1995) Micromorphometric analysis of cervicalenamel structure of human upper third molars Archives of OralBiology 40(5) 453-457.
Jayasooriya PR, Pereira PN, Nikaido T, Burrow MF & Tagami J(2003) The effect of a “resin coating” on the interfacial adapta-tion of composite inlays Operative Dentistry 28(1) 28-35.
Kubo S, Yokota H, Sata Y & Hayashi Y (2001) The effect of flex-ural load cycling on the microleakage of cervical resin compos-ites Operative Dentistry 26(5) 451-459.
Shimada Y, Kondo Y, Inokoshi Y, Tagami J & Antonucci JM (1999)Demineralizing effect of dental cements on human dentinQuintessence International 30(4) 267-273.
Shimada Y, Yamaguchi S & Tagami J (2002a) Micro-shear bondstrength of dual-cured resin cement to glass ceramic DentalMaterials 18(5) 380-388.
Shimada Y, Kikushima D & Tagami J (2002b) Micro-shear bondstrength of resin-bonding systems to cervical enamel AmericanJournal of Dentistry 15(6) 373-377.
Silverstone LM, Saxton CA, Dogon IL & Fejerskov O (1975)Variations in the pattern of acid etching of human dentalenamel examined by scanning electron microscope CariesResearch 9(5) 373-387.
Strydom C (2002) Curing lights—the effects of clinical factors onintensity and polymerisation Journal of South African DentalAssociation 57(5) 181-186.
Tashiro H, Inai N, Nikaido T & Tagami J (2004) Effects of lightintensity through the resin inlays on bond strength of dual-cured resin cement Journal of Adhesive Dentistry 6(3) 233-238.
Dow
nloaded from http://m
eridian.allenpress.com/operative-dentistry/article-pdf/30/4/1/1819389/1559-2863-30-4-1.pdf by guest on 12 January 2022

©Operative Dentistry, 2005, 30-4, 474-480
Post-gel Polymerization ShrinkageAssociated with DifferentLight Curing Regimens
SUMMARY
This study compared post-gel polymerizationshrinkage associated with five different lightcuring regimens of similar light energy density. Alight-cure unit (VIP, BISCO) that allowed forindependent command over time and intensitywas used. The five regimens investigated werepulse delay (PD), soft-start (SS); pulse cure (PC),turbo cure (TC) and standard continuous cure(C) [control]. With the exception of TC, the lightenergy density for all curing regimens was fixedat 16 J/cm2. A strain-monitoring device and testconfiguration were used to measure the linearpolymerization shrinkage of 2-mm thick com-posite specimens (Z100, 3M ESPE) during andpost-light polymerization up to 60 minutes. Five
samples were made for each curing mode. Theresults were analyzed using ANOVA/Scheffee’spost-hoc test at significance level 0.05. Post-gelshrinkage ranged from 0.30% to 0.46 % at 60 min-utes. The use of PD resulted in significantlylower shrinkage compared to PC, TC, SS and C.Shrinkage associated with SS was, in general,significantly lower than C. No significant differ-ence in shrinkage was observed between PC, TCand C at all time intervals. The use of pulse delayand soft-start regimens decreased post-gel poly-merization shrinkage.
INTRODUCTION
Polymerization shrinkage has been a perennial problemwith dental composites (Carvalho & others, 1996;Davidson & Feilzer, 1997; Yap & others, 2000;Sakaguchi & others, 1991). Modern composites undergovolumetric polymerization shrinkage of 1% to 5%(Davidson & Feilzer, 1997). Composite shrinkage can besubdivided into pre- and post-gel phases. During pre-gelpolymerization, composite flow occurs and stress withinthe structure is relieved (Davidson & de Gee, 1984).Flow ceases after gelation and cannot compensate forshrinkage stresses. As a result, post-gel polymerizationcauses significant stresses in the surrounding toothstructure and affects the composite-tooth bond (Feilzer,de Gee & Davidson, 1987). Clinical problems such aspost-operative pain, tooth fracture and marginal
CH Chye, student, Faculty of Dentistry, National University ofSingapore, Republic of Singapore
*Adrian UJ Yap, BDS, MSc, PhD, FAMS, FADM, FRSH, associ-ate professor, Department of Restorative Dentistry, Faculty ofDentistry, National University of Singapore, Republic ofSingapore
YC Laim, student, Faculty of Dentistry, National University ofSingapore, Republic of Singapore
MS Soh, BSc (Hons), MSc, research scholar, Department ofRestorative Dentistry, Faculty of Dentistry, National Universityof Singapore, Republic of Singapore
*Reprint request: 5 Lower Kent Ridge Road, Singapore 119074,Republic of Singapore; e-mail: [email protected]
CH Chye • AUJ YapYC Laim • MS Soh
Clinical Relevance
The use of pulse delay and soft-start regimens significantly decreased post-gel polymer-ization shrinkage when compared to standard continuous cure.
Dow
nloaded from http://m
eridian.allenpress.com/operative-dentistry/article-pdf/30/4/1/1819389/1559-2863-30-4-1.pdf by guest on 12 January 2022

475Chye & Others: Post-gel Polymerization Shrinkage Associated with Different Light Curing Regimens
debonding that can leadto microleakage and sec-ondary caries may arisedue to these stresses(Eick & Welch, 1986;Torstenson & Oden,1989; Asmussen, 1975).
With the use of con-trolled polymerization,shrinkage stresses canbe minimized by allow-ing flow to occur duringsetting. This can beachieved with the appli-cation of pulse activation(short pulses of energy)or soft start techniques(pre-polymerization atlow intensity light fol-lowed by a final cure athigh intensity). Thesecuring modes have beenshown to result in lowershrinkage, smaller marginal gap, increased marginalintegrity and improved material properties (Hofmann &others, 2003; Kanca & Suh, 1999; Mehl, Hickel &Kunzelmann, 1997; Uno & Asmussen, 1991). Somestudies have, however, found no significant difference inshrinkage when compared to continuous cure modes(Yap, Soh & Siow, 2002; Yap, Ng & Siow, 2001; Price,Rizkalla & Hall, 2000; Silikas, Eliades & Watts, 2000;Koran & Kürschner, 1998).
The apparent discrepancies in findings may be due todifferences in the composite material evaluated, curingregimens and testing methods used. In most studies,light energy density (intensity x time) of the curing reg-imens investigated was not controlled or standardized.Difficulty in controlling light energy density can beattributed to the use of manufacturer determinedcuring protocols and the fact that most commerciallights do not allow for operator variation of intensityand irradiation time. The polymerization process hasbeen reported to be more dependent on light energy den-sity than light intensity, alone (Yap & Seneviratne,2001; Miyazaki & others, 1996). It is, therefore, crucialthat the former is standardized when evaluating differ-ences between curing regimens. This study comparedthe post-gel polymerization shrinkage associated withdifferent light curing regimens of similar light energydensity.
METHODS AND MATERIALS
A mini-filled resin composite (Z100, 3M-ESPE DentalProducts, St Paul, MN, USA) of A2 shade and a com-mercial light-cure unit that allowed for independentcommand over time and intensity (Variable Intensity
Polymerizer [VIP]; BISCO Inc, Schaumburg, IL, USA)were selected for this study. The technical profile ofZ100 is shown in Table 1. VIP has an output wave-length range of 400-500 nm. It is programmed withpre-set exposure times of 2 through 5, 10 and 30 sec-onds, a continuous mode up to 225 seconds and anintensity setting of 100, 200, 300, 400, 500 and 600mW/cm2. The diameter of the exit window of the lightcure tip is 11 mm. Light intensity for each light-curingmode was checked and verified with the in-builtradiometer prior to use. Table 2 shows the details ofthe five light curing modes investigated. The controlmode (C) involves light irradiation at 400mW/cm2 for40 seconds. Pulse delay (PD) uses an initial low energydose (100 mW/cm2 for 10 seconds), followed by awaiting time of three minutes and a final cure at highenergy dose (500 mW/cm2 for 30 seconds). For the softstart (SS) mode, an initial low energy dose (200mW/cm2 for 20 seconds) is followed immediately by ahigh energy dose (600 mW/cm2 for 20 seconds). Thepulse cure (PC) mode involves the use of two 400mW/cm2 20 second pulses with 20 second intervalsbetween them. The total light energy density of thesefour curing modes was 16 J/cm2. Turbo cure (TC)involves irradiation at 600mW/cm2 for 27 seconds,giving a total light energy density of 16.2 J/cm2, whichclosely matched the standardized density of 16 J/cm2.The sample size for all curing modes was five.
Post-gel polymerization shrinkage was measuredusing foil electrical resistance strain gauges (foilStrain Gauge, RS Components Ltd, Singapore). Thegauges were 2 mm in length and had an electricalresistance of 120Ω and a gauge factor of 2.00. A dia-
Light-curing Mode Regimen Light Energy Density
Pulse Delay 100 mW/cm2 → Delay → 500 mW/cm2 16 J/cm2
PD (10 seconds) (3 minutes) (30 seconds)
Soft Start 200 mW/cm2 → 600 mW/cm2 16 J/cm2
(SS) (20 seconds) (20 seconds)
Pulse Cure 400 mW/cm2 → Delay → 400 mW/cm2 16 J/cm2
(PC) (20 seconds) (20 seconds) (20 seconds)
Turbo Cure 600 mW/cm2 16.2 J/cm2
(TC) (27 seconds)
Standard Continuous 400 mW/cm2 16 J/cm2
Cure (C) (40 seconds)
Table 2: Technical Profiles of the Materials Evaluated
Material/ Manufacturer Recommended Composition(shade/Lot #) Curing Parameter
Z100 3M-ESPE, 400 mW/cm2 for Resins: BIS-GMA,(A2/ 20021212) St Paul, MN, USA 40 seconds TEGDMA
Fillers: Zirconia, silicaFiller volume: 66%
BIS-GMA = Bisphenol A-glycidyl methacrylateTEGDMA = Triethylene glycol dimethacrylate
Table 1: Technical Profiles of the Materials Evaluated
Dow
nloaded from http://m
eridian.allenpress.com/operative-dentistry/article-pdf/30/4/1/1819389/1559-2863-30-4-1.pdf by guest on 12 January 2022

476 Operative Dentistry
grammatic representation of the test configuration formeasuring polymerization shrinkage is shown inFigure 1. A glass slide served as the base of the set-upand a stiff, black delrin frame (inner length 7.0 mm,width 4.0 mm and height 2.0 mm) was used to circum-scribe the composite sample with the exception of awindow for the strain gauge leads. The strain gaugeswere attached onto the flat glass surface and resincomposites were placed in the cavity of the delrinframe with the strain gauge in place. Care was takento ensure complete filling of the frame, and the excesscomposite material was extruded by applying pressurethrough a second glass slide. This was subsequentlyremoved with a plastic instrument. The surface tack ofthe composite was adequate to ensure adhesion
between the strain gauge and the composite materials.The leads from the strain gauge were connected to astrain monitoring device (Strain Gauge Recorder, ColeParmer Instruments, Vernon Hills, IL, USA) initiallybalanced at zero. The strain monitoring device consistedof a chart recorder that functions by rationing sensevoltage to signal voltage and converting it to analogoutput. Dimensional changes were effectively trans-ferred to the gauges and measured in terms of resistance.
The composite specimens were light polymerizedusing the different cure modes, and the dimensionalchange during post-light polymerization was moni-tored in air at room temperature (25 ± 1°C). Post-lightpolymerization shrinkage measurements were takenat 0 (immediately after light polymerization), 1, 10, 30and 60 minutes after removing the curing lights. Thepercentage linear shrinkage was derived from the fol-lowing equation: Percentage linear shrinkage = (∆L/Lx 100) = (∆R/R)/K x 100 where ∆L = Change in length,L = Original length, ∆R = Change of resistance, R =Original resistance and K = Gauge factor (2). Data wassubjected to one way ANOVA and Scheffe’s post-hoctests at significance level 0.05.
RESULTS
Figures 2 through 6 show the mean linear percentshrinkage during the light polymerization process.Table 3 and Figure 7 reflect the mean linear percentshrinkage post-light polymerization. The results ofstatistical analysis are shown in Table 4.
For the control (C) group (Figure 2), shrinkage beganat four seconds and increased steeply from 0% to 0.16%between 4 and 16 seconds. This was followed by a moregradual and uniform increase in shrinkage between 16seconds and 40 seconds. For pulse delay (PD) (Figure
3), no shrinkage was observed during theinitial low energy cure and three minuteswaiting time. Subsequently, light poly-merization at higher energy intensityresulted in a low, gradual increase inshrinkage up from 0% to 0.02% between132 seconds and 198 seconds. Between198 seconds and 220 seconds, a steepincrease in shrinkage was observed. Theshrinkage profile of pulse cure (PC)(Figure 4) during light polymerizationdiffered markedly from PD. Shrinkageassociated with the initial cure resultedin progressive shrinkage even during thedelay period. The rate of shrinkageincreased steeply to 0.2% for the first 30seconds. For the next 30 seconds, the rateof increase in shrinkage was lower andreached 0.28%. With soft-start (SS)(Figure 5), there was no shrinkage duringthe initial 12 seconds, but the shrinkage
Figure 1. Set up of the polymerization shrinkage experiment.
0.00
0.05
0.10
0.15
0.20
0.25
0.30
0.35
0 5 10 15 20 25 30 35 40
Time (Seconds)
Figure 2. Mean linear percent shrinkage during light polymerization for the control group.
Dow
nloaded from http://m
eridian.allenpress.com/operative-dentistry/article-pdf/30/4/1/1819389/1559-2863-30-4-1.pdf by guest on 12 January 2022

Chye & Others: Post-gel Polymerization Shrinkage Associated with Different Light Curing Regimens 477
increased gradually and uniformly to0.18% during the remaining 28 seconds.For the turbo (TC) regime (Figure 6),there was a uniform increase in shrinkagefrom 0% to 0.24% between 2.7 secondsand 27 seconds.
Linear shrinkage immediately afterlight polymerization ranged from 0.12%to 0.29%. Regardless of curing modes, thecomposite continued to shrink afterremoval of the light source and linearshrinkage ranged from 0.30% to 0.46% at60 minutes. At 0 minutes after light poly-merization, the use of PD resulted in sig-nificantly lower shrinkage than with PC,TC, SS and C, and SS resulted in signifi-cantly lower shrinkage than PC and C. Atone minute post-light polymerization, theshrinkage associated with PD was signifi-cantly less than PC, TC, SS and C. Theresults at 10, 30 and 60 minutes wereidentical. At 0, 10 and 60 minutes, SS hadsignificantly lower shrinkage than C.
DISCUSSION
Many methods and techniques have beenemployed to determine polymerizationshrinkage. They range from dilatometermethods, specific gravity methods anddeflecting disc systems to optical methods.The linear strain gauge method wasselected, as it provides real-time measure-ment of the curing process and a means ofstudying the kinetics of polymerization(Sakaguchi & others, 1991). Z100 waschosen, as it exhibited large contractionstresses during post-gel shrinkage(Versluis & others, 1993). Shade A2 wasused to reduce the effects of colorants onlight polymerization (Bayne, Heymann &Swift, 1994), and 2-mm thick com-posite specimens were used toensure uniform and maximum poly-merization (Yap & others, 2000).BISCO VIP was selected, as itsintensity and curing time can beeasily manipulated to obtain simi-lar light energy density for the dif-ferent cure modes.
There are many factors influenc-ing the transmission of light,including the thickness of therestorative material, the presenceand size of filler particles, the shadeof the restorative material and thedistance of the light tip to the
0.00
0.02
0.04
0.06
0.08
0.10
0.12
0.14
0 50 100 150 200 250
Time (Seconds)
Figure 3. Mean linear percent shrinkage during light polymerization with the pulse delay mode.
0.00
0.05
0.10
0.15
0.20
0.25
0.30
0 10 20 30 40 50 60
Time (Seconds)
Figure 4. Mean linear percent shrinkage during light polymerization with the pulse cure mode.
Time (minutes) 0 1 10 30 60
Control 0.29 0.36 0.41 0.43 0.46(0.05) (0.04) (0.04) (0.04) (0.02)
Pulse Delay 0.12 0.21 0.26 0.28 0.30(0.04) (0.03) (0.02) (0.02) (0.02)
Pulse Cure 0.28 0.33 0.38 0.40 0.41(0.05) (0.05) (0.04) (0.05) (0.05)
Soft Start 0.18 0.30 0.34 0.37 0.39(0.01) (0.02) (0.02) (0.03) (0.02)
Turbo 0.24 0.32 0.36 0.39 0.41(0.03) (0.02) (0.02) (0.02) (0.03)
Table 3: Mean Linear Percent Shrinkage (SD) for the Different Light-curing Modes
Dow
nloaded from http://m
eridian.allenpress.com/operative-dentistry/article-pdf/30/4/1/1819389/1559-2863-30-4-1.pdf by guest on 12 January 2022

478 Operative Dentistry
restoration surface (Tate, Porter & Dosch,1999). Light energy density (intensity xtime) indirectly affects polymerizationshrinkage. Although greater light energydensity results in a more effective cure, italso results in higher polymerizationshrinkage (Sakaguchi, Douglas & Peter,1992). As all these factors were standard-ized in this study, any reduction in poly-merization shrinkage may be attributedto the light-curing regimen used. A mini-mum light intensity of 400mW/cm2 wassuggested for routine polymerization(Rueggeberg, Caughman & Curtis, 1994;Manga, Charlton & Wakefield, 1995). Thislight intensity, together with the manu-facturer’s recommended cure time of 40seconds, was used as the control. With theexception of the turbo cure, the total lightenergy was kept at 16 J/cm2. Light energyfor the turbo cure was slightly greater at16.2 J/cm2. This was primarily due to tech-nical constraints. Volumetric curing con-traction determinations (Attin & others,1995; Rueggeberg & Tamareselvy, 1995)are non-specific quantitative shrinkagemeasurements and constitute the total(pre- and post-gel) curing contractions.Dimensional changes in linear curing con-traction determinations employed in thisand other studies (de Gee, Feilzer &Davidson, 1993; Uno & Shimokobe, 1994)are, however, more or less “hindered” andshould be regarded as a post-gel curingphenomenon. As displacement transduc-ers (strain gauges) are activated by force,they can only monitor and measure post-gel polymerization shrinkage when thecomposite is sufficiently strong to exertforces (Davidson & Feilzer, 1997).
The rate of shrinkage during light poly-merization in the control group was not uniform.Shrinkage was very rapid during the initial 16 secondsand decreased during the latter 24 seconds of the 40-second cycle. Soft-start polymerization, pulse activationor a combination of these curing modes could reducethe high initial shrinkage by allowing composite flow tooccur during this period. The pulse-delay mode is acombination of pulse activation and soft-start polymer-ization. No linear shrinkage was detected during theinitial low energy cure and the three-minute waitingperiod for pulse delay mode. This phenomenon may beaccounted for by two possible hypotheses: either thelight energy density (intensity x time) was insufficientto initiate polymerization or only pre-gel polymeriza-tion occurred. As stated earlier, the latter will not be
0.00
0.02
0.04
0.06
0.08
0.10
0.12
0.14
0.16
0.18
0.20
0 5 10 15 20 25 30 35 40
Time (Seconds)
Figure 5. Mean linear percent shrinkage during light polymerization with the soft start mode.
0.00
0.05
0.10
0.15
0.20
0.25
0.30
0 5 10 15 20 25 30
Time (Seconds)
Figure 6. Mean linear percent shrinkage during light polymerization with the turbo cure mode.
Time (minutes) Significance
0 PD < PC, T, CSS < PC, C
1 PD < PC, SS, T, C
10 PD < PC, SS, T, CSS < C
30 PD < PC, SS, T, C
60 PD < PC, SS, T, CSS < C
< denotes statistically significant differences in mean linear percentage shrinkage(results of one way ANOVA/Scheffe’s post-hoc test [p<0.05])
Table 4: Comparison of Mean Liner Percentage Shrinkage at the Various Time Intervals
Dow
nloaded from http://m
eridian.allenpress.com/operative-dentistry/article-pdf/30/4/1/1819389/1559-2863-30-4-1.pdf by guest on 12 January 2022

Chye & Others: Post-gel Polymerization Shrinkage Associated with Different Light Curing Regimens 479
detected by strain gauges. The initial use of low-lightenergy density must, however, be compensated for by afinal cure at high light energy density (Yap &Seneviratne, 2001) to ensure optimal physico-mechan-ical properties and prevent clinical problems caused bythe cytotoxicity of inadequately polymerized materials(Caughman & others, 1991). Post-gel shrinkage ofpulse delay immediately after light polymerization wassignificantly lower than pulse cure, turbo and the con-trol. As VIP only had a maximum intensity of 600mW/cm2, an initial 20-second cure of 200 mW/cm2 and afinal 20-second cure at 600mW/cm2 were selected tocharacterize soft-start polymerization and to maintainthe light energy density at 16 J/cm2. Shrinkage imme-diately after light polymerization was significantlylower than pulse cure and control. Although soft-starthad a higher shrinkage compared to pulse delay, thedifference was statistically insignificant.
Resin composites continue to shrink after removal ofthe light source as a result of composite post-curing.Polymerization is approximately 75% complete at 10minutes after light exposure and curing continues forat least 24 hours (O’Brien, 1997). Thermal contractiondue to the loss of radiant heat can also contribute to theinitial post-light polymerization shrinkage. At all timeintervals, pulse delay was found to have significantlylower post-gel shrinkage compared to all other curingregimens. This can be explained by the use of both alow initial light energy density and a relatively longdelay period that allowed for a prolonged period of thepre-gel state. Soft-start polymerization generallyresulted in lower post-gel shrinkage than the control.Some studies found that soft-start polymerization sig-nificantly reduced post-gel shrinkage (Dennison &others, 2000; Sakaguchi & Berge, 1998). Others reportedno significant difference in post-gel shrinkage between
soft-start and continuous cure (Koran &Kürschner, 1998; Silikas & others, 2000;Yap & others, 2002). The difference can beexplained by the fact that the use of initiallower light intensities was not compensat-ed for by a final cure at higher intensitiesin the former studies. Commercially avail-able soft-start polymerization light-cureunits usually use a final cure of 500mW/cm2 or greater. The beneficial effect ofthe initial low intensity cure may there-fore be annulled by the high intensityfinal cure. The results of this study have,however, shown that when light energydensity is kept constant, the use of soft-start curing can reduce polymerizationshrinkage.
CONCLUSIONS
Under the conditions of this in vitro study:
1. Post-gel shrinkage immediately after lightpolymerization ranged from 0.12% to 0.29%for pulse delay and continuous cure, respec-tively.
2. Composites continue to shrink after light cur-ing, and shrinkage at 60 minutes post-poly-merization ranged from 0.3% to 0.46% forpulse delay and continuous cure, respectively.
3. At all time intervals, the use of pulse delayresulted in significantly lower post-gel poly-merization shrinkage compared to continu-ous, pulse and turbo cure.
4. Soft-start generally exhibited significantlylower post-gel shrinkage than continuouscure.
(Received 15 March 2005)
References
Attin T, Buchalla W, Kielbassa AM & Helwig E (1995) Curingshrinkage and volumetric changes of resin-modified glassionomer restorative materials Dental Materials 11(6) 359-362.
Asmussen E (1975) Composite restorative resins-compositionversus wall-to-wall polymerization construction ActaOdontologica Scandinavia 33(3) 337-343.
Bayne SC, Heymann HO & Swift EJ Jr (1994) Update on dentalcomposite restorations Journal of the American DentalAssociation 125(6) 687-701.
Burgess JO, DeGoes M, Walker R & Ripps AH (1999) An evalua-tion of four light-curing units comparing soft and hard curingPractical Periodontics and Aesthetic Dentistry 11(1) 125-132.
Carvalho RM, Pereira JC, Yoshiyama M & Pashley DH (1996) Areview of polymerization contraction: The influence of stressdevelopment versus stress relief Operative Dentistry 21(1) 17-24.
0.00
0.05
0.10
0.15
0.20
0.25
0.30
0.35
0.40
0.45
0.50
0 10 20 30 40 50 60
Time (Minutes)
Control
Pulse Delay
Pulse Cure
Soft Start
Turbo
Figure 7. Mean linear percent shrinkage after light curing for the various modes.
Dow
nloaded from http://m
eridian.allenpress.com/operative-dentistry/article-pdf/30/4/1/1819389/1559-2863-30-4-1.pdf by guest on 12 January 2022

480 Operative Dentistry
Caughman WF, Caughman GB, Shiflett RA, Rueggeberg F &Schuster GS (1991) Correlation of cytotoxicity, filler loadingand curing time of dental composites Biomaterials 12(8) 737-740.
de Gee AF, Feilzer AJ & Davidson CL (1993) True linear poly-merization shrinkage of unfilled resins and composites deter-mined with linometer Dental Materials 9(1) 11-14.
Davidson CL & de Gee AJ (1984) Relaxation of polymerizationshrinkage stresses by flow in dental composites Journal ofDental Research 63(2) 146-148.
Davidson CL & Feilzer AJ (1997) Polymerization shrinkage andpolymerization shrinkage stress in polymer-based restorativesJournal of Dentistry 25(6) 435-440.
Dennison JB, Yaman P, Seir R & Hamilton JC (2000) Effect ofvariable light intensity on composite shrinkage Journal ofProsthetic Dentistry 84(5) 499-505.
Eick JD & Welch FH (1986) Polymerization shrinkage of posteri-or composite resins and its possible influence on postoperativesensitivity Quintessence International 17(2) 103-111.
Feilzer AJ, de Gee AJ & Davidson CL (1987) Setting stress incomposite resin in relation to configuration of the restorationJournal of Dental Research 66(11) 1636-1639.
Feilzer AJ, de Gee AJ & Davidson CL (1988) Curing contractionof composites and glass-ionomer cements Journal of ProstheticDentistry 59(3) 297-300.
Hofmann N, Denner W, Hugo B & Klaiber B (2003) The influenceof plasma arc vs halogen standard or soft-start irradiation onpolymerization shrinkage kinetics of polymer matrix compos-ites Journal of Dentistry 31(6) 383-393.
Jandt KD, Mills RW, Blackwell GB & Ashworth SH (2000) Depthof cure and compressive strength of dental composites curedwith blue light emitting diodes (LEDs) Dental Materials 16(1)41-47.
Kanca J 3rd & Suh BI (1999) Pulse activation: Reducing resin-based composite contraction stresses at the enamel cavosur-face margins American Journal of Dentistry 12(3) 107-112.
Koran P & Kürschner R (1998) Effect of sequential versus con-tinuous irradiation of a light-cured resin composite on shrink-age, viscosity, adhesion, and degree of polymerizationAmerican Journal of Dentistry 11(1) 17-22.
Manga RK, Charlton DG & Wakefield CW (1995) In vitro evalu-ation of a curing radiometer as a predictor of polymerizationdepth General Dentistry 43(3) 241-243.
Mehl A, Hickel R & Kunzelmann HK (1997) Physical propertiesand gap formation of light-cured composites with and withoutsoftstart-polymerization Journal of Dentistry 25(3-4) 321-330.
Miyazaki M, Oshida Y, Moore BK & Onose H (1996) Effect oflight exposure on fracture toughness and flexural strength oflight-cured composites Dental Materials 12(6) 328-332.
O’Brien WJ ed (1997) Dental Materials and Their Selection 2nd
edition Illinois Quintessence Publishing Co pp 97-114.
Price RB, Rizkalla AS & Hall GC (2000) Effect of stepped lightexposure on the volumetric polymerization shrinkage and bulkmodulus of dental composites and an unfilled resin AmericanJournal of Dentistry 13(4) 176-180.
Rueggeberg FA, Caughman WF & Curtis JW Jr (1994) Effect oflight intensity and exposure duration on cure of resin compos-ite Operative Dentistry 19(1) 26-32.
Rueggeberg F & Tamareselvy K (1995) Resin cure determinationby polymerization shrinkage Dental Materials 11(4) 265-268.
Sakaguchi RL & Berge HX (1998) Reduced light energy densitydecreases post-gel contraction while maintaining degree ofconversion in composites Journal of Dentistry 26(8) 695-700.
Sakaguchi RL, Douglas WH & Peter MCRB (1992) Curing lightperformance and polymerization of composite restorativematerials Journal of Dentistry 20(3) 183-188.
Sakaguchi RL, Sasik CT, Bunczak MA & Douglas WH (1991)Strain gauge method for measuring polymerization contrac-tion of composite restoratives Journal of Dentistry 19(5) 312-316.
Silikas N, Eliades G & Watts DC (2000) Light intensity effects onresin-composite degree of conversion and shrinkage strainDental Materials 16(4) 292-296.
Tate WH, Porter KH & Dosch RO (1999) Successful photocuring:Don’t restore without it Operative Dentistry 24(2) 109-114.
Torstenson B & Oden A (1989) Effects of bonding agent types andincremental techniques on minimizing contraction gapsaround resin composites Dental Materials 5(4) 218-223.
Uno S & Asmussen E (1991) Marginal adaptation of a restorativeresin polymerized at reduced rate Scandinavian Journal ofDental Research 99(5) 440-444.
Uno S & Shimokobe H (1994) Contraction stress and marginaladaptation of composite restorations in dentinal cavity DentalMaterials Journal 13(1) 19-24.
Versluis A, Sakaguchi RL, Sun T & Douglas WH (1993) Post-gelshrinkage measurements by means of strain gauges Journalof Dental Research 72 Abstract #2263 p 386.
Yap AU, Wang HB, Siow KS & Gan LM (2000) Polymerizationshrinkage of visible-light-cured composites OperativeDentistry 25(2) 98-103.
Yap AU, Ng SC & Siow KS (2001) Soft start polymerization:Influence on effectiveness of cure and post-gel shrinkageOperative Dentistry 26(3) 260-266.
Yap AU & Seneviratne C (2001) Influence of light energy densityon effectiveness of composite cure Operative Dentistry 26(5)460-466.
Yap AU, Soh MS & Siow KS (2002) Post-gel shrinkage with pulseactivation and soft-start polymerization Operative Dentistry27(1) 81-87.
Dow
nloaded from http://m
eridian.allenpress.com/operative-dentistry/article-pdf/30/4/1/1819389/1559-2863-30-4-1.pdf by guest on 12 January 2022

Microscopic Evaluation ofDentin Interface Obtained with
10 ContemporarySelf-etching Systems:
Correlation with Their pH
G Grégoire • A Millas
Clinical Relevance
The morphology of the dentin/self-etch bonding system/composite interface enables agood seal to be obtained with most self-etching adhesives currently in use. Clinically, thismay have an influence on the risk of post-operative sensitivity. Most acid primers did notsystematically provide the best interfaces.
SUMMARY
This study investigated micromorphological dif-ferences in the hybridized complex formed using10 commercially available self-etch bonding sys-tems. In addition, the influence of the pH of theprimer of these adhesives was evaluated. Theself-etching systems tested were AdheSE, AdperPrompt L-Pop, Clearfil SE Bond, Etch&Prime 3.0(Degussa, Germany), Prime & Bond NT NonRinse Conditioner (Dentsply, Konstanz,Germany), One-Up Bond F, OptiBond Solo PlusSelf Etch, Prompt L-Pop and Xeno III.
One hundred non-carious human third molarswere used. The teeth were divided into twogroups of 50 and prepared for evaluation byoptical microscopy or scanning electronmicroscopy. The specimens in each group werefurther divided into 10 subgroups of five speci-mens each to evaluate the 10 bonding systems.The pH of the primers of the bonding systemswas measured. The results demonstrated mor-phological differences at the interface, dependingon adhesive composition. The differences mainlyconcerned thickness of the hybrid layer, theabsence or presence of microscopic voids at theadhesive-composite interface and whether thedentinal tubuli were completely sealed. The pHwas not the determining factor conditioning theaction of the self-etching adhesives.
INTRODUCTION
Most early bonding systems were hydrophobic, whichdid not allow them to adapt to dentin properly. Theadhesive must be able to diffuse and penetrate in an
*Geneviève Grégoire, DDS, MS, PhD, professor and chair,Biomaterials Laboratory, Faculty of Odontology, University ofToulouse III, Toulouse, France
Arlette Millas, TRF, research and training technician,Biomaterials Laboratory, Faculty of Odontology, University ofToulouse III, Toulouse, France
*Reprint request: 3, chemin des Maraîchers, 31062 ToulouseCedex 4, France; e-mail: [email protected]
©Operative Dentistry, 2005, 30-4, 481-491
Dow
nloaded from http://m
eridian.allenpress.com/operative-dentistry/article-pdf/30/4/1/1819389/1559-2863-30-4-1.pdf by guest on 12 January 2022

482 Operative Dentistry
aqueous environment and, therefore, be hydrophilic oramphiphilic. Amphiphilic monomers contain bifunc-tional, hydrophilic and hydrophobic groups with a greataffinity for both dentin and restoration material (VanDijken & Horstedt, 1998). The non-rinsing self-etchadhesives, designed to bond with dentin covered with asmear layer, contain higher concentrations of acidmonomers, often mixed with water, to make the adhe-sive systems sufficiently acid to cross the smear layerand form a bond with the underlying dentin. Theyincorporate the smear layer in the hybrid layer (Tay &Pashley, 2001; Van Meerbeek & others, 2003). Thisintended utilization assumes that the acidic resinmonomers will penetrate beyond the smear layer intomineralized dentin (Watanabe, Nakabayashi &Pashley, 1994).
The self-etching adhesives vary in their acidity byvirtue of the composition and concentration of polymer-izable acids and acidic resin monomers in these sys-tems (Pashley & Tay, 2001). Water is also an essentialcomponent, as it provides hydrogen ions that are indis-pensable for demineralization of the smear layer andhard tissues. Acidic resin monomers are used as boththe etchant and priming resins, thus reducing the like-lihood of incomplete resin infiltration within the par-tially demineralized dentin (Kwong & others, 2002;Kiyomura, 1987).
The component parts of self-etch bonding systems arenot all new: phosphonates have already been used asenamel or dentin adhesives (Anbar & Farley, 1974).However, the aim at that time was for to the resins tochelate with the Ca. The acids were therefore neutral-ized to increase their chelating power and thus reducedtheir etching capacity (Tay & Pashley, 2001). The newadhesives include polymerizable acid monomers withphosphoric acid functional groups such as MDP orphenyl-P, and the concentration of these monomers ishigh (Tani & others, 1993; Hayakawa, Kikutake &Nemoto, 1998). According to Watanabe and others(1994), the etching potential of self-etch bonding sys-tems induces the formation of a hybridized complexcomprising a surface zone made up of the hybridizedsmear layer with a true hybrid layer underneath.
This research used optical and scanning electronmicroscopy to investigate the interface obtainedbetween 10 self-etch bonding systems and dentin. Theobjectives of this microscopy study were to examinehow effective the self-etching systems were in pene-trating the dentin smear layer and to produce hybridlayers within the subsurface dentin; that is, to form ahybridized complex. The primary null hypothesis testedwas that the pH of self-etch adhesives plays a majorrole in the formation of the hybrid layer and resin tagsand influences the morphology of the dentin-adhesive-composite interfaces. The secondary null hypothesis
was that the topography of the interface would be prac-tically identical for all the self-etch bonding systems.
METHODS AND MATERIALS
One hundred non-carious human third molars wereused within one month following extraction. They werestored at 4°C in a 1% chloramine T solution. The teethwere equally divided into two groups and prepared forevaluation with optical microscopy (Grégoire, Akon &Millas, 2002) (n=50) or with scanning electronmicroscopy (n=50) (Perdigão & others, 1996). The spec-imens in each group were further divided into 10 sub-groups of five specimens each to evaluate 10 differentadhesives (Table 1). Dentin disks were cut from crownsegments parallel to the occlusal surface at the top ofthe pulp chamber (Tagami, Tao & Pashley, 1990;Camps & others, 1997).
Using a low-speed saw (Isomet 2000, Buehler Ltd,Evanston, IL, USA) equipped with a rotating diamond-impregnated copper disk (11-4244-15 HC, Buehler Ltd)under water spray, a fine smear layer was obtainedwhich was reproducible on all specimens. The dentinspecimens were considered to be deep dentin, an areawhere the number and diameter of the tubuli increase(Fogel, Marshall & Pashley, 1988). Deep dentin waschosen to favor diffusion of the dentin bonding systemin demineralized dentin, thus providing the best condi-tions for the resin-dentin interaction mechanism.
The adhesive was applied to each group following themanufacturer’s instructions (Table 2). The same com-posite, Esthet X (Vivadent), was applied to each speci-men and photopolymerized for 20 seconds.
The pH of each adhesive was measured four timesusing a Bench pH Meters 210 microchip (HannaInstruments, Woonsoket, RI, USA) with a HannaInstruments HI 1083 B electrode. The mean and stan-dard deviation were calculated. (Table 3).
Specimen Preparation for Optical Microscopy
Five dentin disks from each group were prepared foroptical microscopy. They were fixed in 10% formalde-hyde (Rhône-Poulenc Ltd, Manchester, England) fortwo days, demineralized with 5% trichloracetic acid(Merck, Darmstadt, Germany) for five days, thenrinsed in water for two hours. The specimens weredehydrated in ascending grades of alcohol and subse-quently cleared in toluene for 30 minutes. The speci-mens were impregnated with paraffin (Merck) for twodays, then embedded in paraffin and 5 µm sectionswere cut with a microtome. The sections were stainedwith crystal violet and picric acid.
Observations were made by two blind study operatorswho worked independently using the same opticalmicroscope (020-507-010 Wild Leitz GmbH, Heerbrugg,Switzerland). When in disagreement, the investigators
Dow
nloaded from http://m
eridian.allenpress.com/operative-dentistry/article-pdf/30/4/1/1819389/1559-2863-30-4-1.pdf by guest on 12 January 2022

483Grégoire & Millas: Microscopic Evaluation of Dentin Interface Obtained with Self-etching Systems
Products Tested Manufacturer Groups Classification Flacon 1: Flacon 2: CompositionBatch # Batch #
AdheSE Vivadent I Two-step self-etch E 70925 Primer:Schaan, F 39363 Phosphoric acid acrylate,Liechtenstein Bis-acrylic acid amine, water,
initiators, stabilizersBonding:HEMA, highly dispersed silicone dioxide, initiators, stabilizers
Adper 3M-ESPE II One-step self-etch 20021002 Mono and di HEMA phosphates,Prompt L-Pop Seefeld, 158821 Bis-GMA, Camphor quinone,
Germany Substituted aromatic amine, substituted, aminobenzoate, phosphine oxide, stabilizer
Clearfil Kuraray III Two-step self-etch 00112B Primer:SE Bond Osaka, Japan 00114B HEMA, MDP, Hydrophilic
0051A dimethacrylate, water, Ethanol,0053A dl-camphorquinone, N,
N-Diethanol-p-toluidine
Adhesive:HEMA, MDP, Bis-GMA, Hydrophilic dimethacrylate, dl-camphorquinone, N,N-Diethanol-p-toluidine, Silanated colloidal silica
Etch & Degussa- IV One-step self-etch 30000155 30000155 Universal:PrimeE 3.0 Hüls AG HEMA, ethanol, distilled water,
Hanau, stabilizersGermany Catalyst:
HEMA, Pyro-phosphate, initiators, stabilizers
I Bond Heraeus V One-step self-etch 010024 UDMA, 4-META, acetone,Kulzer, NY, water, Glutaraldehyde,USA camphorquinone
Non Rinse Dentsply VI Two-step self-etch 9901000169 0007324 NRC:Conditioner/ Konstanz, 0101100058 0005216 Itaconic acid, maleic acid, waterPrime&Bond NT Germany NT:
Di- and trimethacrylate resin, Functional silica, PENTA , Cetylamine hydrofluoride, acetone, stabilizers, initiators, silica nanofiller
One-Up Tokuyama VII One-step self-etch N482461E Bonding agent A:Bond F Corp, Phosphoric monomer
Tokyo, Japan Propanedioic acid,2-methyl-1-oxo-2-propenyl oxy decyl, Bis-GMA, multi functional methacrylic monomers co-initiator
Bonding agent B:HEMA monofunctional monomers, silicate filler, dye-sensitizer, borate derivative, water
Optibond SDS Kerr VIII Two-step self-etch 2051872 21168 HEMA, Bis GMA, GDM, TS Solo Plus Glendora, 530, OX , Barium borosilicate,Self-Etch CA, USA sodium hexafluorosilicate,
ethanol
Prompt 3M-ESPE, IX One-step self-etch FW0056206 Liquid 1:L-Pop Seefeld, L666136 Methacrylic phosphates,
Germany initiators, stabilizersLiquid 2:Fluorine complex, stabilizers, water
Table 1: Bonding Products Tested
Dow
nloaded from http://m
eridian.allenpress.com/operative-dentistry/article-pdf/30/4/1/1819389/1559-2863-30-4-1.pdf by guest on 12 January 2022

484 Operative Dentistry
Products Tested Manufacturer Groups Classification Flacon 1: Flacon 2: CompositionBatch # Batch #
Xeno III Dentsply X One-step self-etch 360-02 360-05 Universal:Konstanz, 0206001237 HEMA, purified water, ethanol,Germany 2,6-di-tert-butyl-p-cresol
Catalyst:Tetra-methacryl-ethyl-pyrophos-phate, Penta-methacryl-oxy-ethyl-cyclo-phosphazen-mono-fluoride, 1,6 dimethacryl-ethyl-oxy-carbonyl amino-trimethyl hexan, 2,6-di-tert-butyl-p-cresol, 2,3-bornanedione, P-dimethyl amine ethyl benzoate
HEMA: Hydroxy ethyl methacrylatePENTA: Dipentaerythritol penta acrylate monophosphateGDM: Glycidyl dimethacrylateMDP: 10-methacryloyloxydecyl dihydrogen phosphateBis-GMA: Bis-phenol A diglycidylemethacrylate
Table 1: Bonding Products Tested (cont.)
Products Tested Application ProcedureAdheSE Apply primer for 10 seconds, massaging gently, briefly air-dry. The total reaction time should not be shorter thanVivadent, Schaan, 30 secondsLiechtenstein Apply bonding and allow to act for 10 seconds, briefly air-dry and light activate for 10 seconds
Adper Prompt L-Pop Activate blister pack by emptying the liquid out of the red blister into the yellow blister3M-ESPE Brush the adhesive onto the entire dentin surface, massage it in for 15 seconds, apply pressure, this time cannotSt Paul, MN, USA be shortened
Use a gentle stream of air to thoroughly dry the adhesive to a thin filmHarden the adhesive with a halogen light for 10 seconds
Clearfil SE Bond Apply the Primer and allow to act for 20 secondsKuraray, Japan Briefly air-dry
Apply the bond, spread with a light air blow and light activate for 10 seconds
Etch&Prime 3.0 Mix equal amounts of the universal and catalystDegussa, Germany Apply to tooth substrates and allow to act for 30 seconds, with no rinsing, Briefly air-dry, light-activate for 10
seconds Re-apply adhesive mixture, briefly air-dry and light-activate for 10 seconds
I Bond Apply a copious amount. Apply two additional coats. Wait for 30 seconds. Use a gentle stream of air.Heraeus-Kulzer, USA Light activate for 20 seconds
Non Rinse Conditioner Apply NRC on slightly moist dentin 20 secondsPrime & Bond NT Briefly air-dry while keeping slightly moistDentsply, Konstanz, Apply NT for 30 seconds, no rinsing, briefly air-dry, light activate for 20 secondsGermany
One-Up Bond F Mix equal droplets of the bonding agents A (clear liquid) and B (bright yellow liquid) until a pink, homogenousTokuyama, Japan liquid mixture is obtained
Apply to tooth substrates and leave undisturbed for 20 seconds, no rinsing—without further air-drying, light-activate for 10 seconds or 15 seconds
OptiBond Solo Apply self etch primer to the enamel/dentin surface with brushing motion for 15 secondsKerr, USA Air thin for 3 seconds
Shake OptiBond Solo Plus bottle briefly. Apply OptiBond Solo Plus to the dentin surface with light brushing motion for 15 secondsAir thin for 3 secondsReapply OptiBond Solo Plus with light brushing motion for 15 secondsAir thin for 3 secondsLight cure for 20 seconds
Prompt L-Pop Activate blister pack by emptying the liquid out of the red blister into the yellow blister3M-ESPE, St Paul, Apply activated mixture to tooth substrates with shaking for 15 seconds, no rinsingMN, USA Briefly air-dry, light-activate for 10 seconds, using only halogen light-curing unit
Xeno III Mix equal amounts of the universal and catalystDentsply, Konstanz, Apply to tooth substrates and allow to act for at least 20 seconds, no rinsingGermany Briefly air-dry, light-activate for 10 seconds
Table 2: Application Techniques of the Self-etch Adhesives Tested
Dow
nloaded from http://m
eridian.allenpress.com/operative-dentistry/article-pdf/30/4/1/1819389/1559-2863-30-4-1.pdf by guest on 12 January 2022
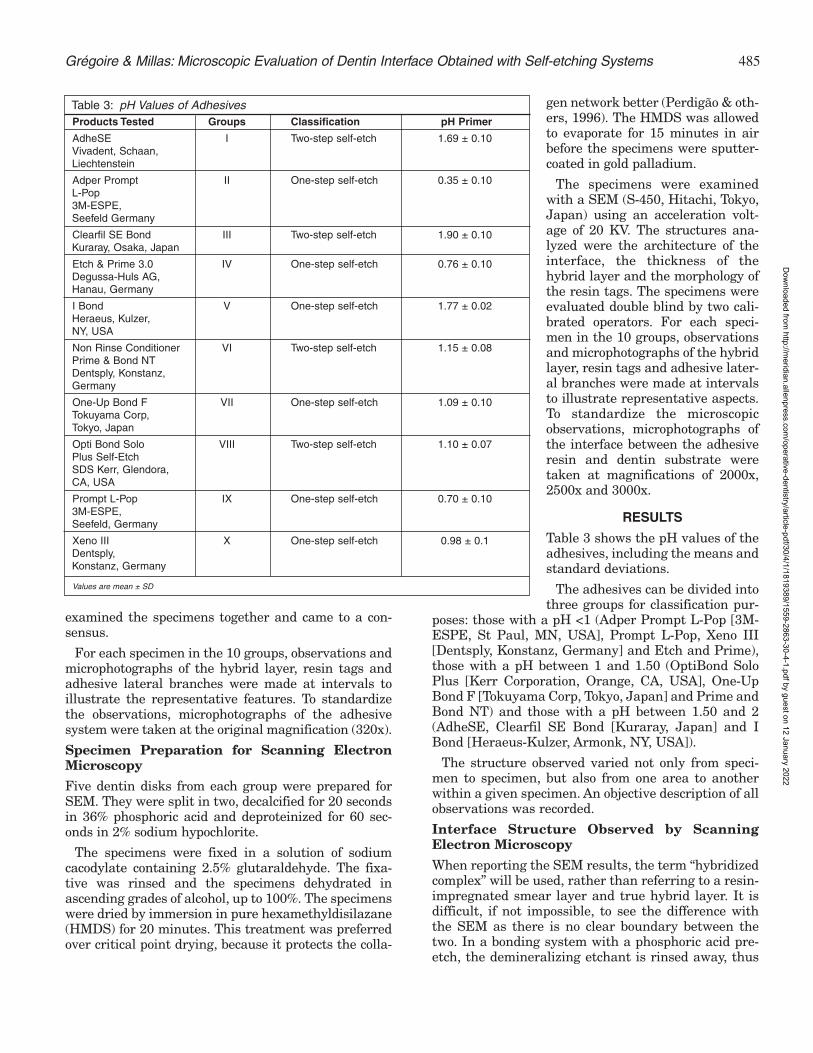
485Grégoire & Millas: Microscopic Evaluation of Dentin Interface Obtained with Self-etching Systems
examined the specimens together and came to a con-sensus.
For each specimen in the 10 groups, observations andmicrophotographs of the hybrid layer, resin tags andadhesive lateral branches were made at intervals toillustrate the representative features. To standardizethe observations, microphotographs of the adhesivesystem were taken at the original magnification (320x).
Specimen Preparation for Scanning ElectronMicroscopy
Five dentin disks from each group were prepared forSEM. They were split in two, decalcified for 20 secondsin 36% phosphoric acid and deproteinized for 60 sec-onds in 2% sodium hypochlorite.
The specimens were fixed in a solution of sodiumcacodylate containing 2.5% glutaraldehyde. The fixa-tive was rinsed and the specimens dehydrated inascending grades of alcohol, up to 100%. The specimenswere dried by immersion in pure hexamethyldisilazane(HMDS) for 20 minutes. This treatment was preferredover critical point drying, because it protects the colla-
gen network better (Perdigão & oth-ers, 1996). The HMDS was allowedto evaporate for 15 minutes in airbefore the specimens were sputter-coated in gold palladium.
The specimens were examinedwith a SEM (S-450, Hitachi, Tokyo,Japan) using an acceleration volt-age of 20 KV. The structures ana-lyzed were the architecture of theinterface, the thickness of thehybrid layer and the morphology ofthe resin tags. The specimens wereevaluated double blind by two cali-brated operators. For each speci-men in the 10 groups, observationsand microphotographs of the hybridlayer, resin tags and adhesive later-al branches were made at intervalsto illustrate representative aspects.To standardize the microscopicobservations, microphotographs ofthe interface between the adhesiveresin and dentin substrate weretaken at magnifications of 2000x,2500x and 3000x.
RESULTS
Table 3 shows the pH values of theadhesives, including the means andstandard deviations.
The adhesives can be divided intothree groups for classification pur-
poses: those with a pH <1 (Adper Prompt L-Pop [3M-ESPE, St Paul, MN, USA], Prompt L-Pop, Xeno III[Dentsply, Konstanz, Germany] and Etch and Prime),those with a pH between 1 and 1.50 (OptiBond SoloPlus [Kerr Corporation, Orange, CA, USA], One-UpBond F [Tokuyama Corp, Tokyo, Japan] and Prime andBond NT) and those with a pH between 1.50 and 2(AdheSE, Clearfil SE Bond [Kuraray, Japan] and IBond [Heraeus-Kulzer, Armonk, NY, USA]).
The structure observed varied not only from speci-men to specimen, but also from one area to anotherwithin a given specimen. An objective description of allobservations was recorded.
Interface Structure Observed by ScanningElectron Microscopy
When reporting the SEM results, the term “hybridizedcomplex” will be used, rather than referring to a resin-impregnated smear layer and true hybrid layer. It isdifficult, if not impossible, to see the difference withthe SEM as there is no clear boundary between thetwo. In a bonding system with a phosphoric acid pre-etch, the demineralizing etchant is rinsed away, thus
Products Tested Groups Classification pH Primer
AdheSE I Two-step self-etch 1.69 ± 0.10Vivadent, Schaan,Liechtenstein
Adper Prompt II One-step self-etch 0.35 ± 0.10L-Pop3M-ESPE,Seefeld Germany
Clearfil SE Bond III Two-step self-etch 1.90 ± 0.10Kuraray, Osaka, Japan
Etch & Prime 3.0 IV One-step self-etch 0.76 ± 0.10Degussa-Huls AG,Hanau, Germany
I Bond V One-step self-etch 1.77 ± 0.02Heraeus, Kulzer,NY, USA
Non Rinse Conditioner VI Two-step self-etch 1.15 ± 0.08Prime & Bond NTDentsply, Konstanz,Germany
One-Up Bond F VII One-step self-etch 1.09 ± 0.10Tokuyama Corp,Tokyo, Japan
Opti Bond Solo VIII Two-step self-etch 1.10 ± 0.07Plus Self-EtchSDS Kerr, Glendora,CA, USA
Prompt L-Pop IX One-step self-etch 0.70 ± 0.103M-ESPE,Seefeld, Germany
Xeno III X One-step self-etch 0.98 ± 0.1Dentsply,Konstanz, Germany
Values are mean ± SD
Table 3: pH Values of Adhesives
Dow
nloaded from http://m
eridian.allenpress.com/operative-dentistry/article-pdf/30/4/1/1819389/1559-2863-30-4-1.pdf by guest on 12 January 2022

486 Operative Dentistry
eliminating the calciumphosphates. The self-etchsystems are not rinsed andthe dissolved compoundsremain where they are.From the depth of the dentinto the outside, there is a gra-dient in the concentration ofdemineralized products andpH. The hybridized complexis made up of calcium salts,phosphates, collagen, waterand adhesive resin. The ionsreleased by the acid of theprimer are trapped in a poly-mer structure. Thus, thereare no distinct areas;instead, there is a complexzone characteristic of eachsystem.
The interface obtained inGroup I had a thickhybridized complex (1 to 11µm thick), very long tags (upto 100 µm) with small sidebranches and a conicalswelling at the base (Figure 1).For Group II, the hybridizedcomplex was about 6 µmthick. Tags were numerousand fine, some reaching 80µm long. Conical swellingscould be distinguished at thebase of the hybridized com-plex (Figure 2). The inter-face in Group III showed ahybridized complex varyingbetween 2 and 3 µm in thick-ness with tags of 5 to 30 µm.They were thicker at theirbase and, thus, formed plugs(Figure 3). In Group IV, thehybridized complex wasabout 1 µm thick. At theinterface between thehybridized complex and therestoration composite it waspossible to see fairly fre-quent voids, which Tay andothers (2002) refer to as blis-ters (Figure 4). The interfaceobtained in Group V showeda thin, irregular hybridizedcomplex, having a thicknessof about 1 µm. The fine tags,often widely spaced and
Figure 2. SEM micrograph showing the adhesive-dentin interface with Adper Prompt L-Pop after dem-ineralization with 36% H3PO4 and deproteinizationwith 2% Na OCl. A thick hybridized complex withnumerous tags can be seen (original magnification2500x).
Figure 1. SEM micrograph showing the adhesive-dentin interface with AdheSE after demineralizationwith 36% H3PO4 and deproteinization with 2% NaOCl. A conical swelling can be observed. Note thethick, uniform hybridized complex and the numeroustags with conical swellings at their junction with thehybrid layer (original magnification 2500x).
Figure 3. SEM micrograph showing the adhesive-dentin interface with Clearfil SE Bond after deminer-alization with 36% H3PO4 and deproteinization with2% Na OCl (original magnification 2500x).
Figure 4. SEM micrograph showing the adhesive-dentin interface with Etch & Prime 3.0 after deminer-alization with 36% H3PO4 and deproteinization with2% Na OCl. A blister can be observed between theadhesive and the composite (original magnification2500x).
Dow
nloaded from http://m
eridian.allenpress.com/operative-dentistry/article-pdf/30/4/1/1819389/1559-2863-30-4-1.pdf by guest on 12 January 2022

487Grégoire & Millas: Microscopic Evaluation of Dentin Interface Obtained with Self-etching Systems
leaving numerous tubuliempty, were 60 to 70 µm long(Figure 5). For Group VI, thehybridized complex formedwas about 3 µm thick. All thetags were attached to thehybridized complex by largeconical swellings. A few sidebranches could also be seen.The tags were 60 to 70 µmlong (Figure 6). In GroupVII, a hybridized complex, 2to 3 µm thick, was observed,with a few fine tags up to 40µm long, often broken(Figure 7). The Group VIIIinterface showed a regularhybridized complex about 9µm thick. The numeroustags, which were about 40µm long, had side branches(Figure 8). In Group IX, thehybridized complex was con-tinuous and about 3.5 µmthick. The long, thin tagsreached up to 60 µm (Figure9). In Group X, a regular, con-tinuous hybridized complex 5to 8 µm thick was observed.The tags were numerous anddense, sometimes reaching50 to 70 µm in length. Sidebranches were seen. Contactbetween the hybrid layerand tags was very good andformed a kind of swelling.Such conical shapes of theupper part of the tags ensurea good seal as the hybridlayer extends into the wallsof the dentin tubuli, leadingto hybridization of the walls(Figure 10). This structurewas also noted with NRC NTand AdheSE (Vivadent,Schaan, Liechtenstein). VanMeerbeek and others (2001)consider this interpenetra-tion as more important thanthe length of the tags.
Interface StructureObserved Under OpticalMicroscopy
The stains used in thisexperiment colored the resinbright pink and the dentin
Figure 6. SEM micrograph showing the adhesive-dentin interface with Non Rinse ConditionerPrime&Bond NT after demineralization with 36%H3PO4 and deproteinization with 2% Na OCl. Tagsare numerous and systematically show marked con-ical swellings at their bases, which is the sign of agood seal (original magnification 2500x).
Figure 5. SEM micrograph showing the adhesive-dentin interface with I Bond after demineralizationwith 36% H3PO4 and deproteinization with 2% NaOCl. The hybridized complex is thin (original magnifi-cation 2500x).
Figure 8. SEM micrograph showing the adhesive-dentin interface with Opti Bond Solo Plus after dem-ineralization with 36% H3PO4 and deproteinizationwith 2% Na OCl. Note the thick hybridized complexand very numerous tags (original magnification2000x).
Figure 7. SEM micrograph showing the adhesive-dentin interface with One-Up Bond F after demineral-ization with 36% H3PO4 and deproteinization with 2%Na OCl. Particularly noteworthy is the small numberof tags that often seem not to be well attached to thehybrid layer (original magnification 2000x).
Dow
nloaded from http://m
eridian.allenpress.com/operative-dentistry/article-pdf/30/4/1/1819389/1559-2863-30-4-1.pdf by guest on 12 January 2022

488 Operative Dentistry
yellow, thus, allowing theboundaries between the twoto be determined accurately.The contrast was such thatdifferences were clear, evenin black and white photo-graphs. The composite couldnot be observed, because itfell out during the technicalpreparations for opticalmicroscopy.
With Group I, thehybridized complex was reg-ular, and numerous tagsblocked the tubuli mouthswith V-shaped plugs (Figure11). Group II formed a con-tinuous hybridized complex.The numerous V-shaped tagssealed the tubuli mouthswell (Figure 12). Group IIIhad a continuous hybridcomplex. The tags were oftenshort and conical (Figure13). The hybridized complexof Group IV varied in thick-ness. Fine tags wereobserved, sometimes broken,which did not block the tubu-li (Figure 14). In Group V,the hybridized complex wasnot uniform. Tag formationwas irregular and the tubulidid not seem to be perfectlysealed, as gaps could be seenbetween the tags and thetubuli walls (Figure 15).Group VI had a continuoushybridized complex, with V-shaped tags blocking thetubuli mouths (Figure 16). InGroup VII, the hybridizedcomplex was regular but thetags were not in contact withthe walls of the tubuli(Figure 17). Group VIII gavea regular hybridized com-plex, with tags that were notin contact with the tubuliwalls (Figure 18).
For Group IX, thehybridized complex was con-tinuous and the tags longand conical, apparentlyblocking off the tubuli(Figure 19). Finally, the
Figure 10. SEM micrograph showing the adhesive-dentin interface with Xeno III after demineralizationwith 36% H3PO4 and deproteinization with 2% NaOCl. The hybridized complex is thick and dense.Numerous tags (original magnification 3000x).
Figure 9. SEM micrograph showing the adhesive-dentin interface with Prompt L-Pop after demineral-ization with 36% H3PO4 and deproteinization with 2%Na OCl. Hybridized complex 3.5 to 4 mm thick. Tagsare fairly numerous (original magnification 2500x).
Figure 12. Optical micrograph showing the adhesive-dentin interface with Adper Prompt L-Pop. V-shapedtags are visible (original magnification 320x).
Figure 11. Optical micrograph showing the adhesive-dentin interface with AdheSE. The hybridized com-plex is thick with numerous tags. V-shaped plugs arevisible at the tubuli mouths (original magnification320x).
Figure 14. Optical micrograph showing the adhesive-dentin interface with Etch & Prime 3.0. The resinsometimes penetrates fairly deeply into the tubuli butis not in contact with the hybridized complex (originalmagnification 320x).
Figure 13. Optical micrograph showing the adhesive-dentin interface with Clearfil SE Bond. Irregular tagsare visible. Some longer ones are not homogeneousand do not seem to be in continuity with thehybridized complex (original magnification 320x).
Dow
nloaded from http://m
eridian.allenpress.com/operative-dentistry/article-pdf/30/4/1/1819389/1559-2863-30-4-1.pdf by guest on 12 January 2022

489Grégoire & Millas: Microscopic Evaluation of Dentin Interface Obtained with Self-etching Systems
hybridized complex of GroupX was regular. All the tubuliwere filled with long, finetags (Figure 20).
DISCUSSION
The two observational meth-ods used, optical and scan-ning electron microscopy,proved to be complementary.The optical microscope gavea very clear image of thehybrid layer and resin tagswith respect to dentin struc-tures not impregnated withresin. The variation in colorintensity allowed the homo-geneity of the hybrid layer tobe assessed. Since the tech-nique required completedemineralization of harddental tissues, there was nopossibility of compositeexamination, which prevent-ed any study of the hybridlayer/composite junction.With the scanning electronmicroscope, advantages ofthe staining disappeared,but the structures and theirrelationships could beviewed on a different scale.
It was easy to compare themorphological differences(hybridization and tags) pro-duced by using 10 differentbonding systems.
The pH values of the adhe-sive systems measured inthis study enabled threegroups to be distinguishedamong the adhesives: thosewith a pH well below 1,adhesives having a pH closeto 1 and those for which thepH was between 1.5 and 2.These differences had beennoted by Tay and Pashley(2001) and Van Meerbeek and others (2003), with fewvariants. Adper Prompt L-Pop, Etch and Prime 3.0 andPrompt L-Pop have a pH lower than 1 (see Table 3).Great differences were noticeable in the thickness ofthe hybridized complex and in the density of the tags.Adper Prompt L-Pop gave a thicker, uniformhybridized complex, corresponding to deeper deminer-alization. Numerous tags joined the hybrid layer at a
conical swelling, showing good penetration of resininto the tubuli walls. With Etch and Prime 3.0,many ovoid zones of separation between the adhe-sive and composite were observed. These separationzones, resembling blisters, were found systematicallyon all the Etch and Prime 3.0 specimens but did notexist for any other adhesive. The same technique was
Figure 16. Optical micrograph showing the adhesive-dentin interface with Non Rinse ConditionerPrime&Bond NT. V-shaped plugs are visible (originalmagnification 320x).
Figure 15. Optical micrograph showing the adhesive-dentin interface with I Bond. Note the non-uniformhybridized complex (original magnification 320x).
Figure 18. Optical micrograph showing the adhesive-dentin interface with Opti Bond Solo Plus. Note thenumerous V-shaped tags (original magnification320x).
Figure 17. Optical micrograph showing the adhesive-dentin interface with One-Up Bond F.The tags are notvery numerous and most do not adhere to the tubuliwalls (original magnification 320x).
Figure 20. Optical micrograph showing the adhesive-dentin interface with Xeno III. The hybridized com-plex is thick and continuous. Tags are numerous andthick, with V-shaped tag—hybridized complex junc-tion (original magnification 320x).
Figure 19. Optical micrograph showing the adhesive-dentin interface with Prompt L-Pop. Numerous finetags are visible (original magnification 320x).
Dow
nloaded from http://m
eridian.allenpress.com/operative-dentistry/article-pdf/30/4/1/1819389/1559-2863-30-4-1.pdf by guest on 12 January 2022

490 Operative Dentistry
used for all specimens, so that the hypothesis thatlight-cured composite may not have been activatedimmediately, thus leading to formation of blisters, canbe set aside (Tay, Pashley & Peters, 2003). Tay andPashley (2001) studied the interface of Prompt L-Popusing transmission electron microscopy and demon-strated the existence of a true hybrid layer having athickness of 3.5 to 4.0 mm. The same value was alsofound in the current study. The optical microscoperevealed the regularity of this layer, proving that dem-ineralization and penetration had been homogeneous.Non Rinse Conditioner (NRC), OneUp Bond F,OptiBond Solo Plus Self-etch and Xeno III have a pHclose to 1. Xeno III is a one-step, while the other threeare two-step systems. NRC, OptiBond Solo Plus Self-etch and Xeno III gave hybridized complexes of differ-ent thicknesses (the thinnest obtained with NRC), butwhich appeared to be homogeneous. The tags werenumerous and had marked conical swellings at theirbases, which is the sign of a good seal. The acidmonomers penetrated the fine smear layer that wasformed using the diamond-impregnated disk and dem-ineralized the dentinal sub-surface and the mouths ofthe dentin tubuli. The results of this demineralizationwere the obtention of resin funnels making a goodjunction between the tag and the hybrid layer. WithOne Up Bond F, demineralization was not obtaineddown to the dentinal sub-surface and tubuli mouths.The junction between the hybrid layer and tags wasvery thin, and sometimes the bond was absent. Theother three bonding systems tested, AdheSE, ClearfilSE Bond and I Bond had a pH between 1.7 and 1.9.Van Meerbeek and others (2003) classes Xeno III and IBond as “Intermediary strong” self-etch adhesives andstates that their resultant interfacial interaction isconsequently expected to be similar. In this study, IBond gave a hybridized complex that was muchthinner than Xeno III and was thinner than AdheSE,which has a similar pH. In the three bonding systemsthat have a pH between 1.7 and 1.9, AdheSE provideda thick, uniform hybridized complex and numerousthick tags with swellings at their junction with thehybrid layer, proving that the zone had been correctlydemineralized.
Under the conditions of this study, the pH groupingof the 10 systems tested did not correspond to groupswith similar bonding. Different interface morphologiesoccurred with the same pH, leading to rejection of thefirst null hypothesis.
Thus, pH, alone, cannot explain the differences inaction. Demineralizing power depends on several fac-tors: pH, the dissociation constant (pKa), the structureof the compounds, which may be more or less chelat-ing, solubility of the salts formed and the applicationtime. Action depends on the acid monomers and theirconcentration.
Xeno III contains a phosphoester (a substituted phos-phoric acid with two acid functions). This phosphoesteris a strong acid, which explains the product’s low pH.In addition to the acid monomer, its compositionincludes a pyrophosphate function (tetra-methacryl-ethyl-pyrophosphate), a hydrophobic chain (trimethyl-hexane) and a prepolymer (tetra-methacryl). It is avery amphiphilic product. Pyrophosphate is a chelatingphosphate for calcium, which increases the demineral-izing power of the product. Adding a hydrophobic chainto the acid components is intended to keep the calciumin the organic phase after it is dissolved. The incorpo-ration of calcium will then crosslink the photopolymer-ized polymer by an ion bond. Adper Prompt L-Pop alsocontains a very acid phosphoester. However, it is one ofthe rare products not having a hydrophobic chain. So,it dissolves the calcium but does not incorporate it inthe organic phase. Its action is therefore close to thatof phosphoric acid, which dissolves calcium but doesnot retain it. As an exception, AdheSE contains a phos-phonate with less acid than a phosphoester (hence ahigher pH), but the absence of hydrophobic functionbrings its action closer to Adper Promt L-Pop. Thepresence of a phosphoric acid acrylate and a Bis acrylicacid amine completes its acidic action. However, not alldifferences can be explained by the specific esters con-tained in the self-etch primers. The second nullhypothesis must be rejected, since the interface mor-phology was seen to vary from one self-etch bondingsystem to another.
CONCLUSIONS
Within the limitations imposed by the experimentalconditions, the authors draw the following conclu-sions:
1. The two observational methods used, opticaland scanning electron microscopy, proved tobe complementary. The optical microscopegave a clear image of the hybrid layer andresin tags, thus making it possible to checkthe layer’s uniformity and continuity over thepreparation as a whole. The scanning electronmicroscope allowed details of the dentin/adhe-sive interface to be better analyzed.
2. There are morphological differences at theinterface, which depend on the self-etchingadhesive composition.
3. The pH is not the determining factor condi-tioning the action of self-etching adhesives.
(Received 17 March 2004)
Dow
nloaded from http://m
eridian.allenpress.com/operative-dentistry/article-pdf/30/4/1/1819389/1559-2863-30-4-1.pdf by guest on 12 January 2022

491Grégoire & Millas: Microscopic Evaluation of Dentin Interface Obtained with Self-etching Systems
References
Anbar M & Farley EP (1974) Potential use of organic polyphos-phonates as adhesives in restoration of teeth Journal of DentalResearch 53 879-888.
Camps J, Tardieu C, Dejou J, Franquin JC, Ladaique P & RieuR (1997) In vitro cytotoxicity dental adhesive systems undersimulated pulpal pressure Dental Materials 13 34-42.
Fogel HM, Marshall FJ & Pashley DH (1988) Effects of distancefrom the pulp and thickness on the hydraulic conductance ofhuman radicular dentin Journal of Dental Research 67 1381-1385.
Grégoire GL, Akon B & Millas A (2002) Interfacial micromor-phological differences in hybrid layer formation betweenwater- and solvent-based dentin bonding systems Journal ofProsthetic Dentistry 87(6) 633-641.
Hayakawa T, Kikutake K & Nemoto K (1998) Influence of self-etching primer treatment on the adhesion of resin composite topolished dentin and enamel Dental Materials 14 99-105.
Kiyomura M (l987) Bonding strength to bovine dentin with 4-META/MMA-TBB resin: Long-term stability and influence ofwater Dental Materials 6 860-872.
Kwong SN, Cheung GS, Kei LH, Itthagarun A, Smales RJ, TayFR & Pashley DH (2002) Micro-tensile bond strengths to scle-rotic dentin using a self-etching and a total etching techniqueDental Materials 18 359-369.
Pashley DH & Tay FR (2001) Aggressiveness of contemporaryself-etching adhesives. Part II: Etching effects on ungroundenamel Dental Materials 17 430-444.
Perdigão J, Lambrechts P, Van Meerbeek B, Braem NT, Yildiz E,Yucel T & Vanherle G (1996) The interaction of adhesive sys-tems with human dentin American Journal of Dentistry 9 167-173.
Tagami J, Tao L & Pashley DH (1990) Correlation among dentindepth, permeability, and bond strength of adhesive resinsDental Materials 6 45-50.
Tani C, Itoh K, Hisamitsu H & Wakumoto S (1993) Efficacy ofdentin bonding agents combined with self-etching dentinprimers containing Phenyl-P Dental Materials 12 219-224.
Tay FR & Pashley DH (2001) Aggressiveness of contemporaryself-etching: Depth of penetration beyond dentin smear layersDental Materials 17 296-308.
Tay FR, Pashley DH, Suh BI, Carvalho RM & Itthagarun A(2002) Single step adhesives are permeable membranesJournal of Dentistry 30 371-382.
Tay FR, Pashley DH & Peters MC (2003) Adhesive permeabilityaffects composite coupling to dentin treated with a self-etchadhesive Operative Dentistry 28(5) 610-621.
Van Dijken JW & Horstedt P (1998) The effect of pretreatmentwith an oxalic acid solution on marginal adaptation to enamelin vivo Journal of Prosthetic Dentistry 80 75-80.
Van Meerbeek B, De Munck J, Yoshida Y, Inoue S, Vargas M,Vijay P, Van Landuyt K, Lambrechts P & Vanherle G (2003)Adhesion to enamel and dentin: Current status and futurechallenges Operative Dentistry 28(3) 215-235.
Van Meerbeek B, Vargas M, Inoue S, Yoshida Y, Lambrechts P &Vanherle G (2001) Operative Dentistry Supplement 6 119-144.
Watanabe I, Nakabayashi N & Pashley DH (1994) Bonding toground dentin by a phenyl-P self-etching primer Journal ofDental Research 73 1212-1220.
Watanabe I, Nikaido T & Nakabayashi N (1990) Effect of adhe-sion to, ground dentin Journal of Japanese Society of DentalMaterials and Devices 9 888-893.
Dow
nloaded from http://m
eridian.allenpress.com/operative-dentistry/article-pdf/30/4/1/1819389/1559-2863-30-4-1.pdf by guest on 12 January 2022

©Operative Dentistry, 2005, 30-4, 492-499
Enamel Bond Strengths ofPairs of Adhesives
From the Same Manufacturer
SUMMARY
Most manufacturers of dental adhesives haveboth a total-etch adhesive and a simplified self-etching adhesive available on the market. Thisstudy measured the enamel microtensile bondstrengths of five pairs of enamel adhesives as afunction of enamel roughness. The proximal sur-faces of 25 extracted mandibular molars weresectioned with a diamond saw to obtain 50 enamelrectangles with an area of 8x4 mm2. The enamelrectangles were divided in two equal parts via agroove to obtain 4x4 mm2 squared bonding sur-faces. One half was roughened with a coarse dia-
mond bur under water for five seconds, while theother half was kept intact. The enamel surfaceswere randomly assigned to 10 enamel adhesivesgrouped into five pairs. Each pair included oneself-etch adhesive and one total-etch adhesivefrom the same manufacturer: Adper Prompt andAdper Single Bond (PLP and SB, 3M ESPE);AdheSE and Excite (ADH and EXC, IvoclarVivadent); OptiBond Solo Plus SE and OptiBondSolo Plus (OPTSE and OPT, Kerr); TyrianSPE/One-Step Plus and One-Step (TYR and OST,BISCO, Inc); Xeno III and Prime&Bond NT (XENand PBNT, Dentsply). The adhesives wereapplied according to the manufacturers’ instruc-tions. Buildups were constructed with FiltekZ250 (3M ESPE). The specimens were sectionedin sticks with a cross section of 0.8±0.2 mm2 andtested to failure in tension at a crosshead speedof 1 mm/minute. Two-way ANOVA followed byDuncan’s post-hoc test at p<0.05 was computed.The highest mean bond strengths were obtainedwith total-etch adhesives. For “roughened enam-el,” three pairs of materials had statistically dif-ferent means in which the total-etch adhesiveresulted in statistically higher bond strengths
J Perdigão • G Gomes
S Duarte Jr • MM Lopes
Clinical Relevance
Some total-etch adhesives bond more effectively to enamel than the corresponding self-etch adhesives from the same manufacturer. For self-etch adhesives, roughening enam-el with a diamond bur resulted in a tendency toward higher bond strengths.
*Jorge Perdigão, associate professor, Division of OperativeDentistry, Department of Restorative Sciences, University ofMinnesota, Minneapolis, MN, USA
George Gomes, PhD candidate, University of Granada, HospitalReal, Granada, Spain; Private Practice, Lisbon, Portugal
Sillas Duarte Jr, visiting professor, Division of OperativeDentistry, University of Minnesota, Minneapolis, MN, USA
M Manuela Lopes, research associate, Department of OralSciences, University of Minnesota, Minneapolis, MN, USA
*Reprint request: 8-450 Moos Tower, 515 SE Delaware St,Minneapolis, MN 55455, USA: e-mail: [email protected]
Dow
nloaded from http://m
eridian.allenpress.com/operative-dentistry/article-pdf/30/4/1/1819389/1559-2863-30-4-1.pdf by guest on 12 January 2022

493Perdigão & Others: Enamel Bond Strengths of Pairs of Adhesives From the Same Manufacturer
(MPa) than the corresponding self-etch adhesive:EXC (36.6) > ADH (23.0) at p<0.026; OPT (34.5) >OPTSE (25.3) at p<0.028; PBNT (36.6) > XEN (19.5)at p<0.0001. For “intact enamel,” four pairs ofmaterials resulted in statistically differentmeans: SB (31.7) > PLP (20.9) at p<0.049; EXC(37.9) > ADH (16.3) at p<0.0001; OST (30.1) > TYR(18.0); PBNT (43.8) > XEN (16.0) at p<0.0001. Whenthe same adhesive was compared on intact vsroughened enamel, all the self-etch materialsresulted in lower bond strengths on intact enamel,but this difference was only significant for TYR(p<0.042) and ADH (p<0.050). For total-etch mate-rials, only OPT resulted in statistically lowerbond strengths when applied on intact enamel(p<0.011).
INTRODUCTION
In the last 10 years, the rate of development of newdentin/enamel adhesives has been too rapid to allow forclinical evaluation of all materials. Laboratory testshave therefore been used to screen new adhesives fortheir ability to bond to enamel and dentin. The intro-duction of enamel acid etching with phosphoric acid in1955 (Buonocore, 1955) has changed the concepts ofrestorative and preventive dentistry. Enamel bondingis now considered a durable, reliable clinical procedure.More recently, the application of acids to dentin hasalso been proposed and widely used to improve dentinbond strengths (Buonocore, Wileman & Brudevold,1956; Fusayama & others, 1979; Kanca, 1992). Currentadhesive systems utilize one of two approaches to inter-act with dental substrate—the “total-etch technique” orthe “self-etch technique” (Perdigão, 2002).
While total-etch (TE) adhesives include a phosphoricacid gel that demineralizes dentin and enamel simulta-neously, self-etch (SE) adhesives do not require a sepa-rate acid-etch step. SE adhesives condition and primeenamel and dentin simultaneously without rinsing,relying on their ability to partially dissolve hydroxyap-atite to generate a resin-infiltrated zone with mineralsincorporated (Perdigão, 2002). SE adhesives are com-posed of aqueous mixtures of acidic functionalmonomers, generally phosphoric acid esters or carboxy-lates, with a pH higher than that of phosphoric acidgels (Pashley & Tay, 2001; Oliveira & others, 2003).Water is a very important component of SE adhesives,as it participates in the chemical reaction associatedwith the interaction of SE with enamel and dentin.Water is needed for acidic monomers to ionize andtrigger the demineralization of hard dental tissues. SEadhesives are classified in three categories according totheir acidity: mild, moderate and aggressive (Tay &others, 2000b). Because of their higher pH, SE adhe-sives result in shallow enamel demineralization com-pared to phosphoric acid (Pashley & Tay, 2001).
As SE adhesives have become popular among clini-cians (CRA Newsletter, 2001), most dental adhesivemanufacturers have both a TE adhesive and a simpli-fied SE adhesive available on the market. SE adhesiveshave been reported to bond well to normal dentin andground enamel in vitro (Blunck & Roulet, 1999;Hannig, Reinhardt & Bott, 1999; Pashley & Tay, 2001;Oliveira & others, 2003; Castro & others, 2003;Perdigão & Geraldeli, 2003). Conversely, SE materialsmay not bond as well to sclerotic dentin or intact enamel(Kanemura, Sano & Tagami, 1999; Tay & others,2000a; Perdigão & Geraldeli, 2003).
Therefore, this study compared the enamel adhesionstrength of SE adhesives with the corresponding TEadhesives from the same manufacturer. The nullhypothesis tested is two-fold: 1) There is no differencein enamel bond strengths between each SE adhesiveand TE adhesive made by the same manufacturer; 2)There is no difference in enamel bond strengths for thesame adhesive applied to roughened enamel versusintact enamel.
METHODS AND MATERIALS
Twenty-five extracted sound molars stored in 0.5%chloramine solution for up to one month were used inthis study. The enamel was evaluated under a stere-omicroscope to observe the presence of possible cracksor fissures. If defects were detected, the tooth was dis-carded. Care was taken to choose teeth with similarproximal flat surfaces in order to eliminate interveningvariables. Each tooth was cleaned with pumice using aprophy cup under low speed for 10 seconds. The selectedteeth were attached to a phenolic ring (Buehler Ltd,Lake Bluff, IL, USA) with sticky wax and sectioned ina precision low-speed diamond saw (Isomet 1000,Buehler Ltd) to obtain an enamel specimen of 8.0 x 4.0mm2 from each proximal surface. The two proximalsurfaces were divided into two halves 4.0m x 4.0 mm2,separated by a groove prepared with the diamond saw.One half was roughened with a coarse diamond bur(Two Striper 770.8C, Premier Products Co, PlymouthMeeting, PA, USA) for five seconds under water, whilethe other half was left intact, resulting in a total of 50roughened and 50 intact enamel surfaces. The enamelspecimens were then randomly assigned to each of 10experimental groups (Table 1).
This study included five self-etch adhesives and fivetotal etch-adhesives. Composite buildups 6-mm highwere constructed in three increments on the bondedsurfaces with Filtek Z250 shade A2 (3M ESPE, StPaul, MN, USA). Light curing was carried out with anAstralis 10 (Ivoclar Vivadent, Amherst, NY, USA)curing device in the adhesion mode. The intensity ofthe light was consistently above 600mW/cm2 as meas-ured with a radiometer (Kerr Dental, Orange, CA,USA).
Dow
nloaded from http://m
eridian.allenpress.com/operative-dentistry/article-pdf/30/4/1/1819389/1559-2863-30-4-1.pdf by guest on 12 January 2022

494 Operative Dentistry
Manufacturer Material Composition Manufacturers’ Instructions3M ESPE Adper Prompt HEMA (2-hydroxy ethyl methacrylate) 1. Apply adhesive to the entire surface ofSt Paul, MN, USA L-Pop Self-Etch phosphates provide the acidic component, the cavity, rubbing in the solution with
Adhesive with HEMA, BisGMA, and a modified moderate finger pressure for 15 seconds.Lot #132149 polyalkenoic acid providing the resin 2. Gentle air stream of air to dry (surface
components. Water based. smooth and glossy).3. Repeat as necessary.4. Light cure 10 seconds (3-second exposure
with a plasma arc lamp).
35% H3PO4 Water, ethanol, HEMA, BisGMA, 1. Apply H3PO4 for 15 seconds.silica-thickened dimethacrylates, a photoinitiator system 2. Apply two consecutive coats of bond adhe-gel + and a methacrylate functional copolymer sive to enamel and dentin.Adper Single Bond of polyacrylic and polyitaconic acids. 3. Dry gently for 2 to 5 seconds.Lot #20030607 4. Light-cure for 10 seconds.
Ivoclar Vivadent AdheSE Primer: Phosphonic acid acrylate, 1. Apply self-etch primer. Once the cavity isSchaan, Primer Bis-acrylic acid amide, Water, Initiators thoroughly coated, brush for 15 seconds.Liechenstein Lot #F15093 and stabilizers Total reaction time should not be shorter
Bonding Bonding Component: Dimethacrylate, than 30 seconds.Lot #F15094 HEMA, Highly dispersed silicon dioxide, 2. Dry with mild airflow.
Initiators and stabilizers. 3. Apply self-etch bonding.4. Dry with mild airflow.5. Light cure for 10 seconds.
37% H3PO4 silica- Dimethacrylates, alcohol, phosphonic 1. Apply H3PO4 on enamel 15 seconds andthickened gel + acid acrylate, HEMA, SiO2, initiators dentin 10 seconds.Excite and stabilizers. 2. Rinse and dry (moist).Lot #E48521 3. Apply and brush for 10 seconds.
4. Evaporate 3 seconds.5. Light cure for 20 seconds.
Dentsply Caulk, Xeno III Liquid A: 1. Dispense equal amounts of A and B.Milford, DE, USA Lot #0301001041 HEMA, Purified water, Ethanol, 2. Mix for 5 seconds.
2, 6-Di-tert-butyl-p hydroxy toluene (BHT), 3. Apply generous amounts of adhesive.Nanofiller Leave on for at least 20 seconds.Liquid B: Tetramethacryloxyethyl 4. Uniformly spread adhesive by a gentle pyrophosphate (Pyro-EMA), stream of air until there is no flow (at least Pentamethacryloxyethyl cyclophosphazen 2 seconds).mono fluoride (PEM-F), Urethane 5. Light-cure 10 seconds.dimethacrylate (UDMA), 2,6-Di-tert-butyl-p-hydroxy toluene (BHT), Camphorquinone,p-Dimethylamino ethyl benzoate (EPD).
34% H3PO4 silica- PENTA, UDMA + T-resin (cross-linking 1. Apply H3PO4 for 15 seconds.thickened gel + agent) + D-resin (small hydrophilic 2. Brush generous amounts of Prime & BondPrime & Bond NT molecule), butylated hydroxitoluene, NT to thoroughly wet the cavity surface.Lot #020509 4-ethyl dimethyl aminobenzoate, cetilamine This surface should remain wet for 20
hydrofluoride, acetone, silica nanofiller. seconds, which may necessitate additional Prime & Bond NT.
3. Air thin for 5 seconds. Surface should have a uniform glossy appearance. If not, repeat steps 1 and 2.
4. Light cure for 10 seconds.
BISCO Inc Tyrian SPE Uni- Part A: Ethanol 1. Shake Tyrian SPE unit-dose for 3 to 5Schaumburg, IL, Dose/One-Step Part B: 2-Acrylamido-2-methyl seconds.USA Plus Tyrian SPE propanesuflonic acid, Bis 2. Slowly press the chambers together, noting
Lot #0200002694 (2-(methacryloyloxy)ethyl) phosphate, color change to Tyrian (purple).One Step Plus ethanol 3. Stir, using a foam pellet or an applicator.Lot #0200004974 One Step Plus: BPDM (Biphenyl 4. Dry the preparation for at least 5 seconds.
dimethacrylate), HEMA, acetone, Make sure no moist spots remain on the glass frit. tooth.
5. Apply 1 to 2 coats. Agitate slightly for 20 seconds.
6. Using a foam pellet (new or original blotted dry), blot excess from preparation, until Tyrian color disappears.
7. Shake One-Step Plus bottle for 3 to 5 seconds.
8. Apply 2 coats of One-Step Plus.9. Air dry for a minimum of 10 seconds.
10. Light-cure for 10 seconds per surface.
Table 1: Materials Used
Dow
nloaded from http://m
eridian.allenpress.com/operative-dentistry/article-pdf/30/4/1/1819389/1559-2863-30-4-1.pdf by guest on 12 January 2022

495Perdigão & Others: Enamel Bond Strengths of Pairs of Adhesives From the Same Manufacturer
The bonded specimens were attached to a phenolicring with cyanoacrylate glue (Zapit, Dental Venturesof America, Inc, Corona, CA, USA) and sectioned in Xand Y directions to obtain bonded sticks with a cross-sectional area of 0.8±0.2 mm2. The sticks were testedindividually by setting and attaching them on theGeraldeli’s jig (Perdigão & Geraldeli, 2003) usingcyanoacrylate glue (Zapit). The sticks were then sub-mitted to a tension load using an Instron 4204 testingmachine (Instron Co, Canton, MA, USA) at a 1mm/minute crosshead speed. A Mitutoyo absolute dig-ital caliper (Mitutoyo Corp, Kanogawa, Japan) with anaccuracy of 0.001 mm was used to measure the sides ofthe bonding interface and calculate the bonding areain mm2. The load (in Kg) and the bonding surface areaof the specimen were registered on a worksheet andthe microtensile bond strengths calculated in MPa.
A two-way ANOVA followed by Duncan’s post-hoc testwas computed. The significance level was set at 95%.Statistical analysis was carried out with the SPSS 10for Windows (SPSS, Inc, Chicago, IL, USA) softwarepackage.
RESULTS
Two-way ANOVA (Table 2) found statistical differencesbetween pairs of means at p<0.0001 for the variable“adhesive” and p<0.015 for the variable “enamel sub-strate.” The interactions were not significant(p>0.176). The Duncan’s test grouped the adhesivesinto five subsets. PBNT, EXC and SB were grouped inthe highest subset, followed by SB, OST and OPT inthe second subset.
For “roughened enamel” (Table 3), three pairs ofmaterials resulted in statistically different means:EXC > ADH at p<0.026; OPT > OPTSE at p<0.028;PBNT > XEN at p<0.0001. For “intact enamel,” fourpairs of materials resulted in statistically differentmeans: SB > PLP at p<0.049; EXC > ADH at p<0.0001;OST > TYR at p<0.005; PBNT > XEN at p<0.0001.When the same adhesive was compared on intact vsroughened enamel (Table 4), all self-etch materialsresulted in lower bond strengths on intact enamel, butthis difference was only significant for TYR (p<0.042)and ADH (p<0.050). For total-etch adhesives, OPTresulted in statistically higher bond strengths to“roughened enamel” than to “intact enamel.” All other
Source Type III Sum of Squares df Mean Square F Sig
Adhesive 29324.653 9 3258.295 9.918 .000
Enamel Surface 1938.890 1 1938.890 5.902 .015
Adhesive* Enamel Surface 4195.188 9 466.132 1.419 .176
Error 184294.107 561 328.510
Corrected Total 219667.829 58
Table 2: Two-way ANOVA
Manufacturer Material Composition Manufacturers’ Instructions32% H3PO4 polymer- BPDM (Biphenyl dimethacrylate), 1. Apply H3PO4 for 15 seconds.thickened gel + HEMA, acetone, photoiniators. 2. Rinse thoroughly and dry (moist).One-Step 3. Apply for 10 seconds.Lot #0200003632 4. Dry with mild airflow.
5. Light cure for 20 seconds.
Kerr Dental OptiBond Solo Ethyl alcohol, water, alkyl dimethacrylate 1. Apply SE Primer for 15 seconds usingOrange, CA, USA Plus SE resins, Stabilizers, Activators. light brushing motion.
Lot #205187 2. Air thin for 3 seconds.3. Apply OptiBond Solo Plus for 15 seconds
using light brushing motion.4. Air thin for 3 seconds.5. Reapply adhesive for 15 seconds using light
brushing motion.6. Air thin for 3 seconds.7. Light cure for 20 seconds.
37.5% H3PO4 Ethyl alcohol, alkyl dimethacrylate 1. Apply H3PO4 for 15 seconds.silica-thickened gel resins, barium aluminoborosilicate glass, 2. Rinse thoroughly and dry (moist).+ OptiBond Solo fumed silica (silicon dioxide), sodium 3. Apply for 15 seconds, using light brushing Plus hexafluorosilicate. motion.Lot #203D20 4. Air thin for 3 seconds.
5. Reapply for 15 seconds, using light brushing motion.
6. Air thin for 3 seconds.7. Light cure for 20 seconds.
Table 1: Materials Used (cont.)
Dow
nloaded from http://m
eridian.allenpress.com/operative-dentistry/article-pdf/30/4/1/1819389/1559-2863-30-4-1.pdf by guest on 12 January 2022

496 Operative Dentistry
total-etch adhesives resulted in statistically similarbond strengths regardless of the degree of enamelroughness.
DISCUSSION
As bonding to enamel has been successful and reliablesince the introduction of the acid-etch technique, bondingto dentin has been considered the weakest link ofbonded restorations and, consequently, the subject ofnumerous research reports (Pashley & others, 1995;Swift, Perdigão & Heymann, 1995; Eick & others, 1997;Sano & others, 1999; Hashimoto & others, 2000). Withthe introduction of SE adhesives, phosphoric acid hasbeen replaced with acidic monomers that are not rinsedoff and, therefore, are incorporated in the adhesivejoint. As SE adhesives do not rely on a separate acid-etching step, research interest has shifted back fromdentin bonding to enamel bonding (Ferrari & others,1997; Perdigão & others, 1997; Gordan, Vargas &
Denehy, 1998;Shinchi, Soma &Nakabayashi, 2000;Shimada & others,2002).
Phosphoric acidetching of enamelcreates microporosi-ties on enamel sur-faces (Buonocore,Matsui & Gwinnett,1968). Low viscosityenamel bondingagents flow into theirregularities ofetched enamel(Miyazaki, Sato &Onose, 2000) to pro-vide reliable enamelbond strengths, pre-vent microleakage
and reinforce residual tooth structure (Buonocore &others, 1968; Swift & others, 1995; Perdigão &Geraldeli, 2003).
The enamel etching capability of SE adhesives hasbeen studied profusely (Perdigão & others, 1997;Ferrari & others, 1997; Kanemura & others, 1999;Miyazaki & others, 2000; Miyazaki & others, 2002;Perdigão & Geraldeli, 2003; Shimada & Tagami, 2003).One of the shortfalls of SE adhesives is that they maynot etch enamel to the same depth achieved with phos-phoric acid (Miguez & others, 2003; Perdigão &Geraldeli, 2003). Other studies, however, have demon-strated that enamel bonding with SE adhesives is of thesame magnitude as enamel bonding after phosphoricacid etching (Hannig & others, 1999; Shimada &others, 2002). In this study, SE adhesives resulted inlower bond strengths on intact enamel than on rough-ened enamel, which is in agreement with other studies
Intact Enamel Roughened Enamel
Significance Mean ± SD N Enamel Adhesive N Mean ± SD Significance
20.9±9.9 28 Adper Prompt L-Pop 31 26.8±9.5 NSp<0.049
31.7±12.9 25 Adper Single Bond 31 35.8±10.0
16.3±7.2 30 AdheSE 32 23.0±10.3p<0.0001
37.9±13.5 29 Excite 24 36.6±14.2 p<0.026
16.0±7.3 31 XENO III 30 19.5±7.8p<0.0001
43.8±12.7 27 Prime&Bond NT 31 36.6±9.0 p<0.0001
18.0±8.8 26 Tyrian SPE/One Step Plus 24 28.0±11.2 NSp<0.005
30.1±10.6 29 One Step 32 29.3±6.3
NS 20.9±7.5 29 OptiBond Solo Plus SE 32 25.3±8.0
21.9±9.7 29 OptiBond Solo Plus 31 34.5±11.3 p<0.028
Since the group sizes are unequal, the harmonic mean of the group sizes was usedNS = Not significantly different
Table 3: Comparison of Pairs of Adhesives from the Same Manufacturer
Self-etch
Adhesive Means Significance
Roughened Enamel Intact Enamel
AdheSE 23.0 16.3 p<0.050
Adper Prompt L-Pop 26.8 20.9 NS
OptiBond Solo Plus SE 25.3 20.9 NS
Tyrian SPE/One Step Plus 28.0 18.0 p<0.042
XENO III 19.5 16.0 NS
Total-etch
Adhesive Means Significance
Roughened Enamel Intact Enamel
Adper Single Bond 35.8 31.7 NS
Excite 36.6 37.9 NS
One-Step 29.3 30.1 NS
OptiBond SOLO Plus 34.5 21.9 p<0.011
Prime&Bond NT 36.6 43.8 NS
NS- Not significantly different
Table 4: Mean bond Strengths for Each Adhesive in Function of the Enamel Substrate
Dow
nloaded from http://m
eridian.allenpress.com/operative-dentistry/article-pdf/30/4/1/1819389/1559-2863-30-4-1.pdf by guest on 12 January 2022

497Perdigão & Others: Enamel Bond Strengths of Pairs of Adhesives From the Same Manufacturer
that reported SE adhesives as being only effective onground enamel but less effective on intact enamel(Pashley & Tay, 2001; Perdigão & Geraldeli, 2003). Thelow bond strengths of SE adhesives to intact enamel,present in the cervical aspect of some restorations,raise clinical concerns (Opdam & others, 1998).Optimal bonding to intact enamel is important toaccomplish good clinical performance and preventmicroleakage (Swift & others, 1995). A recent clinicalstudy showed that enamel etching prior to the applica-tion of an SE adhesive is crucial for the clinical per-formance of composite restorations, especially thosecorresponding to Class IV and V lesions (Matsuya &others, 2003). Another study reported the 10-year clin-ical performance of an SE adhesive. Forty out of 44restorations were rated as Bravo for marginalintegrity, while 39 had some degree of marginal discol-oration (Akimoto & Takamizu, 2004).
The lower adhesion strength of SE adhesives to intactenamel may be a result of the less pronounced enameletching pattern obtained with SE adhesives on intactenamel than the pattern obtained with phosphoric acid(Shimada & others, 2002; Perdigão & Geraldeli, 2003).Intact enamel is less accessible to SE adhesives,because it is hypermineralized and may contain morefluoride than instrumented enamel (Kanemura & oth-ers, 1999). Additionally, changes occur in the outermostenamel layer after eruption (Brudevold, 1948), and aprismless enamel layer may be present (Gwinnett,1967), preventing further penetration of the SE adhe-sives. Longer application times may actually compen-sate for the higher pH of SE adhesives compared tophosphoric acid etchants (Itou & others, 2001). In fact,when a self-etching primer was applied for 60 secondsinstead of the recommended 30 seconds, Ferrari andothers (1997) demonstrated that an adequate seal isprovided in Class V cavities both in vitro and in vivo.
When the acid etch technique was a relatively newclinical procedure, formation of tag-like resin exten-sions into enamel microporosities was considered themechanism of bonding of resin to phosphoric acid-etched enamel (Gwinnett & Matsui, 1967; Myers, Rossi& Cartz, 1974). Resin tag penetration into roughenedenamel treated with SE adhesives has been deemedcomparable to phosphoric acid etched enamel (Gordan& others, 1998). Other studies reported that theetching pattern of SE adhesives was not as well definedas TE adhesives on roughened enamel but resulted insimilar enamel bond strengths (Perdigão & others,1997; Shimada & others, 2002). This similarity in bondstrengths for SE adhesives in spite of their shalloweretching pattern compared to TE adhesives may seemconflicting. However, the length of the tags created onphosphoric acid-etched enamel may contribute little tobond strength. Adhesive strength may be a result of theability of resin to penetrate between enamel crystallites
and rods (Shinchi & others, 2000). Additionally, anideal etch pattern is not essential in order to produce astrong bond (Hobson & McCabe, 2002).
OPT and OPTSE were the only pair of adhesives thatresulted in statistically similar bond strengths onintact enamel. This similarity was not a result ofincreased bond strengths for the SE adhesive OptiBondSolo Plus Self-Etch (Kerr Dental), but was due to therelatively low bond strengths associated with TE adhe-sive OptiBond Solo Plus (Kerr Dental). When used onroughened enamel, the enamel bond strengths of OPTreached the same magnitude as the other TE adhe-sives, which is corroborated by Yost and others (2004).
PLP and TYR resulted in similar bond strengths com-pared to their corresponding TE adhesives, while theremaining three SE adhesives, ADH, OPTSE and XEN,still resulted in significantly lower enamel bondstrengths to roughened enamel than the correspondingTE adhesives. This distinct behavior of different SEadhesives might be related to variations in pH.According to the respective manufacturers, PLP has apH of 1.1, while the pH associated with TYR is 1.2. Theinability of some SE adhesives to bond adequately toroughened enamel raises an important clinical ques-tion as to whether dentists are currently consideringthe ease of application of the new simplified adhesivesto be more important than the longevity of the bondedrestorations, ultimately, compromising the dentalhealth of our patients.
The null hypotheses tested in this study are rejected.Although the enamel bond strengths of each SE adhe-sive were generally lower than the correspondingenamel bond strengths of the TE adhesive made by thesame manufacturer, for some pairs of materials, the dif-ference was not statistically different. Additionally,some adhesives resulted in similar bond strengths toroughened enamel than to intact enamel.
CONCLUSIONS
1. SE materials resulted in lower bondstrengths on intact enamel than on rough-ened enamel, but this difference was only sig-nificant for Tyrian/One Step Plus and forAdheSE.
2. For the same manufacturer, most TE adhe-sives bonded better to enamel than their cor-responding SE adhesive.
(Received 24 March 2004)
References
Akimoto N & Takamizu M (2004) Ten-year clinical evaluation ofself-etching primer system Journal of Dental Research83(Special Issue A) Abstract #249 (www.dentalresearch.org).
Dow
nloaded from http://m
eridian.allenpress.com/operative-dentistry/article-pdf/30/4/1/1819389/1559-2863-30-4-1.pdf by guest on 12 January 2022

498 Operative Dentistry
Blunck U & Roulet JF (1999) Marginal adaptation of compomerClass V restorations in vitro Journal of Adhesive Dentistry 1143-151.
Brudevold F (1948) A study of the phosphate solubility of thehuman enamel surface Journal of Dental Research 27 320-329.
Buonocore M, Wileman W & Brudevold F (1956) A report on aresin composition capable of bonding to human dentin surfacesJournal of Dental Research 35 846-851.
Buonocore MG (1955) A simple method of increasing the adhesionof acrylic filling materials to enamel surfaces Journal of DentalResearch 34 849-853.
Buonocore MG, Matsui A & Gwinnett AJ (1968) Penetration ofresin dental materials into enamel surfaces with reference tobonding Archives of Oral Biology 13 61-70.
Castro FLA, Andrade MF, Duarte SLL Jr, Vaz LG & Ahid FJM(2003) Effect of 2% chlorhexidine on microtensile bond strengthof composite to dentin Journal of Adhesive Dentistry 5 129-138.
Clinical Research Associates Newsletter (2001) Clinician’sPreferences Volume 25(12) p 1-4.
Eick JD, Gwinnett AJ, Pashley DH & Robinson SJ (1997)Current concepts on adhesion to dentin Critical Reviews in OralBiology and Medicine 8 306-335.
Ferrari M, Mannocci F, Vichi A & Davidson CL (1997) Effect oftwo etching times on the sealing ability of Clearfil Liner Bond2 in Class V restorations American Journal of Dentistry 10 66-70.
Fusayama T, Nakamura M, Kurosaki N & Iwaku M (1979) Non-pressure adhesion of a new adhesive restorative resin Journalof Dental Research 58 1364-1370.
Gordan VV, Vargas MA & Denehy GE (1998) Interfacial ultra-structure of the resin-enamel region of three adhesive systemsAmerican Journal of Dentistry 11 13-16.
Gwinnett AJ (1967) The ultrastructure of prismless enamel ofpermanent teeth Archives of Oral Biology 12 381-386.
Gwinnett AJ & Matsui A (1967) A study of enamel adhesives. Thephysical relationship between enamel and adhesive Archives ofOral Biology 12 1615-1620.
Hannig M, Reinhardt KJ & Bott B (1999) Self-etching primer vsphosphoric acid: An alternative concept for composite-to-enam-el bonding Operative Dentistry 24(2) 172-180.
Hashimoto M, Ohno H, Kaga M, Endo K, Sano H & Oguchi H(2000) In vivo degradation of resin bonds in humans over 1 to 3years Journal of Dental Research 79 1385-1391.
Hobson RS & McCabe JF (2002) Relationship between enameletch characteristics and resin-enamel bond strength BritishDental Journal 192 463-468.
Itou K, Torii Y, Takimura T, Chikami K, Ishikawa K & Suzuki K(2001) Effect of priming time on tensile bond strength to bovineteeth and morphologic structure of interfaces created by self-etching primers International Journal of Prosthodontics 14225-230.
Kanca J (1992) Resin bonding to wet substrate I Bonding todentin Quintessence International 23 39-41.
Kanemura N, Sano H & Tagami J (1999) Tensile bond strength toand SEM evaluation of ground and intact enamel surfacesJournal of Dentistry 27 523-530.
Matsuya Y, Miyatake S, Unemori M, Bunno E, Smiyoshi K,Matsuya S, Akiyama Y & Higuchi Y (2003) Clinical evaluationof composite resin restorations with self-etching adhesive sys-tems Journal of Dental Research 82(Special Issue B) Abstract#908 (www.dentalresearch.org).
Miguez PA, Castro PS, Nunes MF, Walter R & Pereira PNR(2003) Effect of acid-etching on the enamel bond of two self-etching systems Journal of Adhesive Dentistry 5 107-112.
Miyazaki M, Hinoura K, Honjo G & Onose H (2002) Effect of self-etching primer application method on enamel bond strengthAmerican Journal of Dentistry 15 412-416.
Miyazaki M, Sato M & Onose H (2000) Durability of enamel bondstrength of simplified bonding systems Operative Dentistry25(2) 75-80.
Myers CL, Rossi F & Cartz L (1974) Adhesive tag-like extensionsinto acid-etched tooth enamel Journal of Dental Research 53435-441.
Oliveira SSA, Pugach MK, Hilton JF, Watanabe LG, Marshall SJ& Marshall Jr GW (2003) The influence of the dentin smearlayer on adhesion: A self-etching primer vs a total-etch systemDental Materials 19 758-767.
Opdam NJM, Roeters FJM, Feilzer AJ & Smale I (1998) A radi-ographic and scanning electron microscopic study of approxi-mal margins of Class II resin composite restorations placed invivo Journal of Dentistry 26 319-327.
Pashley DH, Sano H, Ciucchi B, Yoshiyama M & Carvalho RM(1995) Adhesion testing of dentin bonding agents: A reviewDental Materials 11 117-125.
Pashley DH & Tay FR (2001) Aggressiveness of contemporaryself-etching adhesives. Part II: Etching effects on ungroundenamel Dental Materials 17 430-444.
Perdigão J (2002) Dentin bonding as function of dentin structureDental Clinics of North America 46 1-25.
Perdigão J & Geraldeli S (2003) Bonding characteristics of self-etching adhesives to intact vs prepared enamel Journal ofEsthetic and Restorative Dentistry 15 32-42.
Perdigão J, Lopes L, Lambrechts P, Leitão J, Van Meerbeek B &Vanherle G (1997) Effects of a self-etching primer on enamelshear bond strengths and SEM morphology American Journalof Dentistry 10 141-146.
Sano H, Yoshikawa T, Pereira PN, Kanemura N, Mongami M,Tagami J & Pashley DH (1999) Long-term durability of dentinbonds made with a self-etching primer, in vivo Journal ofDental Research 78 906-911.
Shimada Y, Senawongse P, Harnirattisai C, Burrow MF, NakaokiY & Tagami J (2002) Bond strength of two adhesive systems toprimary and permanent enamel Operative Dentistry 27(4) 403-409.
Shimada Y & Tagami J (2003) Effects of regional enamel andprism orientation on resin bonding Operative Dentistry 28(1)20-27.
Shinchi MJ, Soma K & Nakabayashi N (2000) The effect of phos-phoric acid concentration on resin tag length and bond strengthof a photo-cured resin to acid-etched enamel Dental Materials16 324-329.
Swift EJ, Perdigão J & Heymann HO (1995) Bonding to enameland dentin: A brief story and state of the art QuintessenceInternational 26 95-110.
Dow
nloaded from http://m
eridian.allenpress.com/operative-dentistry/article-pdf/30/4/1/1819389/1559-2863-30-4-1.pdf by guest on 12 January 2022

499Perdigão & Others: Enamel Bond Strengths of Pairs of Adhesives From the Same Manufacturer
Tay FR, Kwong S-M, Itthagarun A, King NM, Yip H-K, MouldingKM & Pashley DH (2000a) Bonding of a self-etching primer tonon-carious cervical sclerotic dentin: Interfacial ultrastructureand microtensile bond strength evaluation Journal of AdhesiveDentistry 2 9-28.
Tay FR, Sano H, Carvalho R, Pashley EL & Pashley DH (2000b)An ultrastructural study of the influence of acidity of self-etch-ing primers and smear layer thickness on bonding to intactdentin Journal of Adhesive Dentistry 2 83-98.
Tay FR, Wei SHY, Pashley DH & Carvalho RM (2003)Ultrastructure of resin-enamel bonds in unground enamel—occlusal fissures Journal of Dental Research (Special Issue B)Abstract #718 (www.dentalresearch.org).
Yost MP, McEwan M, Linford D & Warner R (2004) Dentin andenamel shear bond strengths of self-etching primer adhesivesJournal of Dental Research (Special Issue A) Abstract #3955(www.dentalresearch.org).
Dow
nloaded from http://m
eridian.allenpress.com/operative-dentistry/article-pdf/30/4/1/1819389/1559-2863-30-4-1.pdf by guest on 12 January 2022

Microtensile Bond Strength ofLight- and Self-curedAdhesive Systems to
Intraradicular Dentin Using aTranslucent Fiber Post
A Mallmann • LB JacquesLF Valandro • P Mathias • A Muench
Clinical Relevance
The use of fiber posts for the restoration of endodontically treated teeth has increased tremen-dously over the last few years. However, the choice of an adhesive system that provides a reli-able, long-lasting bonding mechanism to root canal dentin is still unclear.
SUMMARY
This study evaluated the bond strength of a light-and self-cured adhesive system to differentintraradicular dentin areas (cervical, middle andapical thirds). Twenty single-rooted teeth wereinstrumented and their roots were prepared toreceive a #2 translucent fiber post (Light Post).
The root canals were irrigated with 0.5% sodiumhypochlorite for one minute, rinsed with waterand dried using paper tips. The teeth were dividedinto two groups (n=10): Single Bond [SB] (light-cured) and Scotchbond Multi-Purpose Plus[SBMP] (self-cured). To avoid polymerization ofthe materials through the root lateral walls, theteeth were placed in a silicone mold and theadhesives applied with a thin microbrushaccording to manufacturer’s instructions. Theresin cement, Rely X ARC, was inserted into theroot canals using Lentulo burs. The post was thenplaced and the light-curing procedure was car-ried out for 40 seconds (±500 mW/cm2). The rootswere kept in a 100% relative moisture environ-ment for 24 hours and stored in distilled waterfor an additional 24 hours. Each root was per-pendicularly sectioned into 1-mm thick sections,resulting in approximately four slices per region.Dumbbell-shaped slices were obtained by trim-ming the proximal surfaces of each slice using adiamond bur until it touched the post. The bondedarea was calculated, slices were attached to aspecial device and submitted to microtensiletesting at 1 mm/minute crosshead speed. Datawere analyzed using ANOVA and Tukey’s test. The
*André Mallmann, DDS, PhD, assistant professor, School ofDentistry, Bahiana Foundation for Science Development,Salvador–BA, Brazil
Letícia Borges Jacques, DDS, MSc, PhD, assistant professor,Department of Restorative Dentistry, School of Dentistry,Federal University of Santa Maria, Santa Maria–RS, Brazil
Luis Felipe Valandro, DDS, MSc, assistant professor,Department of Restorative Dentistry, School of Dentistry,Federal University of Santa Maria, Santa Maria–RS, Brazil.
Paula Mathias, DDS, MSc, PhD, assistant professor,Department of Dental Practice, School of Dentistry, FederalUniversity of Bahia, BA, Brazil
Antonio Muench, DDS, PhD, chair and professor, Department ofDental Materials, School of Dentistry, University of São Paulo,SP, Brazil
*Reprint request: Rua Aratuba 233, apartment 1104–ResidencialUp Tower, Salvador–BA–Brazil, 40275-350; e-mail: [email protected]
©Operative Dentistry, 2005, 30-4, 500-506
Dow
nloaded from http://m
eridian.allenpress.com/operative-dentistry/article-pdf/30/4/1/1819389/1559-2863-30-4-1.pdf by guest on 12 January 2022

501Mallmann & Others: Translucent Fiber Post Bond Strength to Intraradicular Dentin
mean bond strength values (MPa) were: SBMP:cervical=10.8a, middle=7.9bc, apical=7.1bc; SB: cer-vical=8.1b, middle=6.0c, apical=6.9bc. Significantdifferences were found between adhesive sys-tems only for the cervical third. The cervicalregion showed higher mean bond strength val-ues than the middle and apical regions(p<0.0001).
INTRODUCTION
Prefabricated posts have been used for some time withthe aim of improving the retention of core build-upmaterials in endodontically-treated teeth when theremaining crown dentin is scarce. Some researchersand practitioners have advocated the use of endodonticposts, which have mechanical properties that moreclosely resemble dentin, such as elastic modulus, thusachieving better stress distribution (Sidoli, King &Setchell, 1997).
Carbon fiber posts were the first used for this purpose(Duret, Reynaud & Duret, 1990), followed by glass fiberposts, carbon fiber posts coated with quartz and quartzfiber posts, all presenting elastic modulus similar todentin.
One of the main concerns regarding prefabricatedendodontic posts is the bonding mechanism of com-posite materials both to posts and root dentin. Thebonding effectiveness among dentin, resin cement andpost can be evaluated by means of microleakage(Mannocci, Ferrari & Watson, 2001a), bond strengthtests (Gaston & others, 2001) and using microscopicanalysis (Ferrari & others, 2000b).
Traditionally, dual-cured adhesive systems in associa-tion with self- or dual-cured resin cements are used forcementation of endodontic posts. Some manufacturersindicate only light-cured adhesives and dual-curedresin cements for this procedure. Some studies, employingmicrotensile bond strength tests, have been performedin order to investigate the bond strength of such mate-rials in specific areas of the root. However, the externalsurface of the root was used as the bonding substrate inthese experiments (Yoshiyama & others, 1996a,b;1998).
By means of a microtensile test, Gaston and others(2001) evaluated theregional bondstrength of two resincements toi n t r a r a d i c u l a rdentin. However, nopost was insertedinto the root canal.Ferrari, Vichi andGrandini (2001)described a uniform
bonding mechanism along the entire root canal when alight-cured single bottle adhesive system was employedfor cementation of posts, using scanning electronmicroscopy (SEM). However, few investigationsregarding the bond strength of light-cured adhesiveshave been associated with resin cements and fiber postsin different root canal regions (Bouillaguet & others,2003). Hence, some doubts about the bonding of light-cured materials to intraradicular dentin still remain,especially in areas of difficult light access, such as themiddle and apical thirds of the root canal.
This in vitro study evaluated the regional (cervical,middle and apical thirds) bond strength of light- andself-cured adhesive systems to intraradicular dentinemployed for the cementation of a translucent quartzfiber post.
METHODS AND MATERIALS
Twenty single-rooted teeth previously stored in 0.5%chloramine solution were used for this study. Theocclusal surfaces were transversely sectioned at 1 mmabove the cementoenamel junction using a low speeddiamond saw mounted in a Labcut 1010 cuttingmachine (Extec Corp, Enfield, CT, USA) under constantwater cooling.
The root canals were manually instrumented alongthe entire working length (WL) using #15 to 40 K-fileseries (Maillefer, Ballalgues, Switzerland) and, subse-quently, were enlarged using #2, 3 and 4 Largo drills(Maillefer). Irrigation using distilled water was carriedout after each file or drill size change throughout theshaping process. Teeth presenting some obliterationalong the root canal or with a working length of lessthan 14 mm were discarded from the sample. The rootcanals were not obturated, because the purpose of thisstudy was to evaluate bond strength in the entire rootcanal extension, including the deepest regions, such asthe apical third.
The root apices were externally sealed using theSingle Bond adhesive system (3M ESPE, St Paul, MN,USA) and Filtek Z250 resin composite (3M ESPE) inorder to avoid extravasation of luting materialsthrough the apex. The root canals were prepared toreceive a #2 translucent quartz fiber post (Light Post—
Adhesive Systems Mode of Activation Resin Cement(Manufacturer) (Manufacturer)
Scotchbond Multi-Purpose Plus—SBMP Self-cured Rely X ARC[Activator, Primer, Catalyst—3 bottles] (3M-ESPE)
(3M-ESPE)
Single Bond—SB Light-cured Rely X ARC[1 bottle] (3M-ESPE)
(3M-ESPE)
Table 1: Luting Materials Used in this Experiment
Dow
nloaded from http://m
eridian.allenpress.com/operative-dentistry/article-pdf/30/4/1/1819389/1559-2863-30-4-1.pdf by guest on 12 January 2022

502 Operative Dentistry
BISCO, Schaumburg, IL, USA) using the burs suppliedby the manufacturer. The prepared roots were randomlydivided into two groups (n=10) according to the adhe-sive systems tested.
The roots were molded with heavy-body addition sili-cone impression material (Simply Perfect—DiscusDental, Culver City, CA, USA) to avoid light propaga-tion through external surfaces of the roots during poly-merization of the adhesive systems and resin cement.
Prior to application of the resin cement systems(Table 1), the root canals were irrigated with 0.5%sodium hypochlorite solution for one minute, rinsedwith distilled water and dried using paper tips. Thecanals were etched with 35% phosphoric acid (3MESPE) for 30 seconds, rinsed with distilled water andthoroughly dried until no visible moisture could beobserved. The fiber posts were etched with 35% phos-phoric acid (3M ESPE) for 60 seconds, rinsed with dis-tilled water and thoroughly air dried, as recommendedby the manufacturer.
With the roots placed in silicone molds, the adhesivesystems were applied strictly according to the manu-facturer’s recommendations and the resin cement wasinserted into the root canal with the aid of a Lentulobur (Maillefer). The posts were positioned into the rootcanals immediately after insertion of the resin cement,and light curing was performed through the cervicalportion of the root for 40 seconds. Before testing, theroot-post sets were kept in a 100% relative moistureenvironment for 24 hours, then stored in distilled waterfor an additional 24 hours, always at 37°C.
The roots were affixed with sticky wax into a specialdevice adapted to the Labcut 1010 cutting machine(Extec Corp) and perpendicularly sectioned intoapproximately 1-mm thick sections using a low speeddiamond saw under constant water cooling (Figure 1).This procedure resulted in 12 serial sections or slices
Figure 1: Perpendicular sectioning of root-post sets intoapproximately 1-mm thick sections.
Figure 2: Proximal slice trimming using tapered diamondbur.
Figure 3: A dumbbell-shaped slice. A close view showing the extension of resin cement bonded to root dentin (A2).
Dow
nloaded from http://m
eridian.allenpress.com/operative-dentistry/article-pdf/30/4/1/1819389/1559-2863-30-4-1.pdf by guest on 12 January 2022

503Mallmann & Others: Translucent Fiber Post Bond Strength to Intraradicular Dentin
per root, identified as cervical 1, 2, 3, 4; middle 1, 2, 3,4 and apical 1, 2, 3, 4.
With the aid of a 4x magnifying glass, sections wereheld with finger pressure and trimmed using a tapereddiamond bur (ref 3195—KG Sorensen, São Paulo,Brazil) from the mesial surface until the bur touchedthe post. The same procedure was carried out from thedistal surface, so that a dumbbell-shaped section couldbe obtained, as demonstrated in Figure 2. All sliceswere examined under a stereomicroscope (Bausch &Lomb, Bern, Switzerland) at 25x magnification toensure that the diamond bur really touched the postduring trimming procedures (Figure 3).
An electronic caliper with 0.01-mm precision wasused to measure the thickness (A1) of each section. Theresin cement extension bonded to the root canal dentinin one side of each dumbbell-shaped slice (Figure 3)was obtained by applying the following equation: A2 =(PP÷2) - DBWD, where PP is the post perimeter andDBWD is the diamond bur working diameter (0.6 mm).The post diameter was 1.8 mm in the cervical and middlethirds and 1.2 mm in the apical third. The workingdiameter was 0.6 mm. The PP was calculated using theformula: PP=2πr, where the π value is 3.14 and r is postradius. Hence, the following PP values were obtainedfor the cervical and middle thirds: PPCM = 2 x 3.14 x 0.9= 5.6 mm, and for the apical third: PPA = 2 x 3.14 x 0.6= 3.8 mm. Therefore, the extension of resin cementbonded to dentin (A2) in the cervical and middle thirdswas: A2CM = (5.6÷2) - 0.6 = 2.2 mm, and in the apicalthird was: A2A= (3.8÷2) - 0.6 = 1.3 mm. The followingequation was applied to calculate the total bonded area(TBA): TBA = A1 x A2. Dumbbell-shaped sections wereattached to a special device designed for the microten-sile bond strength test using cyanoacrylate glue (SuperBonder Gel—Loctite, São Paulo, Brazil) (Figure 4).Each slice was submitted to microtensile bond strengthtesting in a Universal Testing Machine (KratosIndustry, São Paulo, Brazil) at a 1 mm/minutecrosshead speed until failure occurred. After each test,fractured sections were examined under a stereomicro-scope at 25x magnification (Bausch & Lomb) to deter-mine the mode of fracture. Failure modes were classi-fied as: a) adhesive between resin cement and post (RC- P), b) adhesive between resin cement and root dentin(RC - RD), c) mixed failure, if the fracture was partiallyat the resin cement-post interface and partially at theresin cement-root dentin interface or d) cohesive with-in the resin cement, post or root dentin.
Statistical Analysis
The load at failure divided by the total bonded area wasused to calculate the bond strength in MPa for eachslice or serial section. During preparation of the serialsections, some bonds were lost before they could be testedand, hence, they were scored as zero bonds for sta-
tistical purposes. For each tooth, the sum of bondstrength values of each region (cervical, middle andapical) was divided by four, resulting in bond strengthvalues that were considered a statistic unit or specimen(n=10) during statistical analysis. Considering the vari-ables tested, that is, two adhesive systems and threeroot canal regions, six mean bond strength values wereobtained. Working with 10 replications (n=10) resultedin 60 mean bond strength values that were submittedto two-way ANOVA with region as the linked factor.Post-hoc comparisons were made using Tukey’s test ata significance level of 5% (p<0.05).
RESULTS
Table 2 describes the total number of slices, mode offracture distribution and number of slices lost duringpreparation for each experimental condition. The meanbond strength values (MPa), standard deviations (SD),number of tested slices for each experimental conditionand respective statistical interpretation are shown inTable 3. Significant differences in bond strength valueswere found among regions (p<0.0001). For the SBMPadhesive system, the mean bond strength values in thecervical region were demonstrated to be higher than inthe middle and apical thirds, and for the SB adhesivesystem, bond strength values in the cervical regionwere higher than in the middle third (p<0.05). Therewas no statistically significant difference between themiddle and apical thirds. Regarding adhesive systems,significant differences were only observed for thecervical third when Scotchbond Multi Purpose Plus(SBMP) was used and led to the highest mean bondstrength values for this region. Such behavior demon-strated that the self-cured adhesive system (SBMP)presented good results.
Figure 4: Microtensile bond strength test device.
Dow
nloaded from http://m
eridian.allenpress.com/operative-dentistry/article-pdf/30/4/1/1819389/1559-2863-30-4-1.pdf by guest on 12 January 2022

504 Operative Dentistry
DISCUSSION
The good performance of adhesive systems when bondedto enamel and coronal dentin is well documented inRestorative Dentistry. However, some aspects relatedto intraradicular dentin are still uncertain, especiallywhen adhesive systems are used for endodontic postcementation, once many failures have been clinicallyobserved (Ferrari & others, 2000a).
Some experiments evaluating the microtensile bondstrength of resin materials to intraradicular dentinwere carried out by only applying adhesive systemsand resin cements into root canals without any postinsertion (Gaston & others, 2001; Ngoh & others, 2001;Mannocci & others, 2001b; Kanno & others, 2002). Thecurrent study verified that it is possible to performmicrotensile bond strength tests to evaluateintraradicular dentin bonding using non-rigid prefab-ricated endodontic posts, as was also observed byBouillaguet and others (2003), who used resin compos-ite prefabricated posts (Z100) luted with different resincement systems.
One of the critical aspects of bonding to root canaldentin is the use of adhesive systems that depend onlight curing. Ferrari and Mannocci (2000) observed bymeans of scanning electron microscopy that hybridlayers were present in intraradicular dentin when acarbon fiber post was luted in vivo using a light-curedadhesive system combined with a self-cured resincement. Other studies (Ferrari & others, 2001; Vichi &others, 2002) also demonstrated the presence of aninter-diffusion resin-dentin zone (IRDZ) in root canaldentin when endodontic posts were luted using light-
and self-cured adhe-sives. Vichi and others(2002) described a moreeffective micromechani-cal bonding mechanismin the apical third withself-cured adhesivesinstead of light-curedsystems. ComparingSEM observations
reported by Vichi and others (2002) with the bondstrength values observed in this study, it was not pos-sible to establish any concordance between the find-ings of both experiments once the bond strength valuesobtained for the self-cured adhesive—ScotchbondMulti Purpose Plus—in the apical third of root dentindid not differ from that demonstrated for the light-cured system—Single Bond. One of the reasons whythe light-cured adhesive was polymerized, especiallyin areas of difficult light access, such as the middle andapical thirds, may be due to halogen light propagationthrough the translucent fiber post used in this study.In SEM observations, Pest and others (2002) alsoreported good results with the combination of translu-cent posts and light-cured resin cements.
In this study, the mean bond strength values for bothadhesive systems (Single Bond: 7.0 MPa andScotchbond Multi Purpose Plus: 8.6 MPa) were muchlower than those observed by Mallmann and others(2001) when they performed a microtensile bondstrength test employing the same materials used inthis experiment, but using coronal dentin as the bondingsubstrate. They reported mean bond strength values of40.97 MPa for Single Bond and 41.00 MPa forScotchbond Multi Purpose Plus. Besides the differentcharacteristics between substrates, coronal dentin androot canal dentin, it is believed that polymerizationcontraction of the resin cement might be the factorthat most influenced bond strength values. This phe-nomenon may affect the dentin-adhesive interface atdifferent levels, depending on the configuration factor(C-factor) and adhesive system used, as described by
Mode of Fracture
Materials Regions Total # of sl Adhesive Adhesive Mixed Number of sl (RC-P)* (RC-RD)** Lost in
Preparation
Light Post + Cervical 38 34 (89.5) 1 (2.6) 3 (7.9) 0
SBMP/RelyX Middle 39 36 (92.3) 3 (7.7) 0 0
Apical 40 37 (92.5) 2 (5.0) 0 1 (2.5)
Light Post + Cervical 37 14 (37.9) 9 (24.3) 11 (29.7) 3 (8.1)
SB/RelyX Middle 35 14 (40.0) 8 (22.9) 11 (31.4) 2 (5.7)
Apical 39 18 (46.2) 5 (12.8) 8 (20.5) 8 (20.5)
*RC - P: Resin cement - post **RC-RD: Resin cement-root dentin
Table 2: Total Number of Slices (sl), Mode of Fracture Distribution (%) and the Number of Slices Lost During Preparation
RegionsAdhesives Cervical Middle Apical
SBMP 10.8 ± 2.60 (38)a 7.9 ± 1.57 (39)b,c 7.1 ± 1.60 (40)b,c
SB 8.1 ± 4.10 (37)b 6.0 ± 3.67 (35)c 7.0 ± 4.11 (39)b,c
Values are mean ± SD (number of tested slices). Groups identified by different superscript letters are statistically different (p<0.05).
Table 3: Mean (n=10) Bond Strength Values (MPa), Standard Deviations (SD), Number of Tested Slices (sl) and Respective Statistical Interpretation for Each Experimental Condition
Dow
nloaded from http://m
eridian.allenpress.com/operative-dentistry/article-pdf/30/4/1/1819389/1559-2863-30-4-1.pdf by guest on 12 January 2022

505Mallmann & Others: Translucent Fiber Post Bond Strength to Intraradicular Dentin
Mallmann and others (2003). When endodontic postsare cemented into root canals, the C-factor may exceed200 (ratio of bonded and unbonded surfaces), as recentlysuggested by Bouillaguet and others (2003). This isbecause there is a large area of resin cement bonded tothe dental substrate and endodontic post and almostno free area to compensate for polymerization contrac-tion. Using a similar methodology to this study,Bouillaguet and others (2003) also observed that thecombination of Single Bond adhesive system with RelyX ARC resin cement produced lower bond strength val-ues (5.3 MPa). However, when teeth were sectionedlongitudinally and the endodontic post was cementedinto the root canal, the mean bond strength valueswere much higher (23.2 MPa). This increase in bondstrength was attributed to a low stress generation onthe adhesive systems during resin cement polymeriza-tion contraction, regardless of whether in the dentin-adhesive or post-adhesive interface, due to a small con-figuration factor.
Among the variables tested in this study, the regionwas the factor that demonstrated the highest signifi-cant differences (p<0.00001). This study’s findingsregarding bond strength values to different thirds ofroot canals are in agreement with SEM observationsreported by Ferrari and Mannocci (2000), whichshowed higher resin tag density in the cervical thirdcompared to the middle and apical thirds. On the otherhand, Gaston and others (2001) verified higher meanbond strength values in the apical third of root dentinwhen compared to the middle and cervical regions, andreported far superior values (23 MPa) to thoseobserved in this experiment. However, although bothwere microtensile bond strength tests using root canaldentin as bonding substrate, Gaston and others (2001)did not actually insert any endodontic posts into theroot canal. Moreover, the roots were sectioned longitu-dinally and the resin cement was applied directlythrough the open surface of the root canal, thusreducing polymerization contraction, which may be acrucial factor when using resin cements for root canaldentin bonding.
Several factors, such as materials used for root canalobturation, dentin and/or post surface treatments toobtain an effective bonding, resin cement polymeriza-tion contraction and even the compatibility betweenadhesive systems and resin cements may influencecementation of the endodontic posts into root canals.Hence, some doubts regarding these points stillremain and must be solved in future experiments.
CONCLUSIONS
No significant difference was found between the light-cured (Single Bond) and self-cured Scotchbond Multi-Purpose Plus system. Higher mean bond strengthvalues in the cervical region, when compared to the middle
and apical thirds of root dentin, could be observed onlywith the self-cured adhesive system.
Acknowledgements
This study was partially supported by the CNPq and CAPESgrants. Materials used in this experiment were supplied byBISCO, 3M ESPE, Dentsply-Maillefer, Discus Dental and KGSorensen. The authors gratefully acknowledge Mr Paulo Santosand Mr Antônio Lascala for their illustrations and Mrs ElianePlácido for language support.
(Received 30 March 2004)
References
Bouillaguet S, Troesch S, Wataha JC, Krejci I, Meyer JM &Pashley DH (2003) Microtensile bond strength between adhe-sive cements and root canal dentin Dental Materials 19(3)199-205.
Duret PB, Reynaud M & Duret F (1990) [Un nouveau concept dereconstitution corono-radiculaire - Le composipost (1)] LeChirurgien-dentiste de France 60(540) 131-141.
Ferrari M & Mannocci F (2000) A “one-bottle” adhesive systemfor bonding a fiber post into a root canal: A SEM evaluation ofthe post-resin interface International Endodontic Journal33(4) 397-400.
Ferrari M, Vichi A, Mannocci F & Mason PN (2000a)Retrospective study of the clinical performance of fiber postsAmerican Journal of Dentistry 13 9B-13B.
Ferrari M, Mannocci F, Vichi A, Cagidiaco MC & Mjör I (2000b)Bonding to root canal: Structural characteristics of the sub-strate American Journal of Dentistry 13(5) 256-260.
Ferrari M, Vichi A & Grandini S (2001) Efficacy of different adhe-sive techniques on bonding to root canal walls: An SEM inves-tigation Dental Materials 17(5) 422-429.
Gaston BA, West LA, Liewehr FR, Fernandes C & Pashley DH(2001) Evaluation of regional bond strength of resin cement toendodontic surfaces Journal of Endodontics 27(5) 321-324.
Kanno T, Foxton RM, Nakajima M, Tagami J & Miura H (2002)Bond strength of dual cure resin cement to bovine root canaldentine Dental Materials 18 A11.
Mallmann A, Santos JFF, Cardoso PEC, Jacques LB & TavaresAU (2001) Bonding ability of adhesive systems and resincements to human dentin evaluated by means of microtensiletests Journal of Dental Research 80 62.
Mallmann A, Soares FZM, Plácido E, Ferrari M & Cardoso PEC(2003) Microtensile dentin bond strength of self-etching andsingle-bottle adhesive systems in different cavity configura-tions Journal of Adhesive Dentistry 5(2) 121-127.
Mannocci F, Ferrari M & Watson TF (2001a) Microleakage ofendodontically treated teeth restored with fiber posts andcomposite cores after cycling loading: A confocal microscopicstudy Journal of Prosthetic Dentistry 85(3) 284-291.
Mannocci F, Sherriff M, Ferrari M & Watson TF (2001b)Microtensile bond strength and confocal microscopy of dentaladhesives bonded to root canal dentin American Journal ofDentistry 14(4) 200-204.
Dow
nloaded from http://m
eridian.allenpress.com/operative-dentistry/article-pdf/30/4/1/1819389/1559-2863-30-4-1.pdf by guest on 12 January 2022

506 Operative Dentistry
Ngoh EC, Pashley DH, Loushine RJ, Weller RN & KimbroughWF (2001) Effects of eugenol on resin bond strengths to rootcanal dentin Journal of Endodontics 27(6) 411-414.
Pest LB, Cavalli G, Bertani P & Gagliani M (2002) Adhesive post-endodontic restorations with fiber posts: Push-out tests andSEM observations Dental Materials 18(8) 596-602.
Sidoli GE, King PA & Setchell DJ (1997) An in vitro evaluation ofa carbon fiber-based post and core system Journal ofProsthetic Dentistry 78(1) 5-9.
Vichi A, Grandini S, Davidson CL & Ferrari M (2002) An SEMevaluation of several adhesive systems used for bonding fiberposts under clinical conditions Dental Materials 18(7) 495-502.
Yoshiyama M, Carvalho RM, Sano H, Horner JA, Brewer PD &Pashley DH (1996a) Regional bond strengths of resin tohuman root dentine Journal of Dentistry 24(6) 435-442.
Yoshiyama M, Sano H, Ebisu S, Tagami J, Ciucchi B, CarvalhoRM, Johnson MH & Pashley DH (1996b) Regional strengths ofbonding agents to cervical sclerotic root dentin Journal ofDental Research 75(6) 1404-1413.
Yoshiyama M, Matsuo T, Ebisu S & Pashley DH (1998) Regionalbond strength of self-etching/self-priming adhesive systemsJournal of Dentistry 26(7) 609-616.
Dow
nloaded from http://m
eridian.allenpress.com/operative-dentistry/article-pdf/30/4/1/1819389/1559-2863-30-4-1.pdf by guest on 12 January 2022
©Operative Dentistry, 2005, 30-4, 507-515
Surface Changes andAcid Dissolution of EnamelAfter Carbamide Peroxide
Bleach Treatment
Clinical Relevance
Bleaching treatment should be performed with caution in patients who are at high riskfor enamel erosion.
S-T Yeh • Y SuY-C Lu • S-Y Lee
SUMMARY
Objectives: To evaluate the effects of homebleaching (carbamide peroxide) on enamel sur-face morphology and the degree of acid dissolu-tion.
Methods: Buccal surfaces of 15 caries-freehuman premolars were used in the study. The 15teeth were cut in half in a buccal-lingual direc-tion at midline; in total, 15 pairs of specimenswere obtained. Group A consisted of five pairsthat studied surface morphology change andGroup B consisted of 10 pairs that studied thesusceptibility of bleached enamel to acid dissolu-tion. Tooth halves were prepared following a flu-
oride-free prophylaxis paste cleaning. One half ofthe tooth was untreated (control), and the otherhalf was bleached (experimental) for eight hoursdaily for 10 days using 10% carbamide peroxide.Tooth samples were then stored in distilled waterfor seven days, after which scanning electronmicroscopy (SEM) was performed on Group A.Only halves from the same tooth were comparedto rule out natural variations between teeth.Group B was etched with 37% phosphoric acidbefore being examined by SEM. The severity ofthe acid attack was graded from I to V, and thegrades of each pair were compared.
Results: Results of the SEM observation showedthat surface porosity slightly increased afterbleaching, and more surface dissolution by phos-phoric acid was seen with bleached, compared tounbleached, enamel.
INTRODUCTION
With the desire for a whiter, more-attractive smile,tooth bleaching in the dentist’s office or at home is rap-idly gaining in popularity. The most popular method ishome bleaching, also referred to as “nightguard vitalbleaching,” “matrix bleaching” and “dentist-pre-scribed/home-applied bleaching.” The home techniqueinvolves wearing a custom-made, vacuum-formed tray
Shu-Tuan Yeh, DDS, visiting doctor, Dental Department ofMackay Memorial Main Branch Hospital, Taipei, Taiwan,ROC
Yu Su, DDS, visiting doctor, Dental Department of MackayMemorial Main Branch Hospital, Taipei, Taiwan, ROC
Yo-Chin Lu, DDS, MS, visiting doctor, Dental Department ofMackay Memorial Main Branch Hospital, Taipei, Taiwan,ROC
*Sheng-Yang Lee, DDS, MS, PhD, professor and dean, Schoolof Dentistry, Dental Department of Wan-Fang Hospital,Taipei Medical University, Taipei, Taiwan, ROC
*Reprint request: 250 Wu-Hsing Street, Taipei, Taiwan 110,ROC; e-mail: [email protected]
Dow
nloaded from http://m
eridian.allenpress.com/operative-dentistry/article-pdf/30/4/1/1819389/1559-2863-30-4-1.pdf by guest on 12 January 2022

508 Operative Dentistry
containing a mild bleaching agent, usually 10% car-bamide peroxide, which is suspended in a viscous geland applied for a period of time during the day or atnight (Christensen, 1997; Haywood, 1997). Because ofits simplicity, ease, relative effectiveness and low cost,there has been rapid acceptance of this technique bydentists.
Enamel is more than 96% inorganic mineral (hydrox-yapatite), with the remaining 4% being water andorganic material, namely, the protein enamelin (tenCate, 1998). Carbamide peroxide contains about 3%hydrogen peroxide and 7% urea, both of which are pro-tein denaturants. Urea also deproteinizes enamel bydissociating hydrogen bonds in protein molecules(Goldberg & others, 1983; Arends & others, 1984;Hegedus & others, 1999). It is possible that hydrogenperoxide and urea penetrate into the enamel subsur-face and change the organic matrix during thebleaching procedure. Thus, the enamel’s physical andchemical properties might differ from those ofunbleached enamel.
Dental erosion is the loss of hard tissue from thetooth’s surface by a chemical, not a bacterial, process. Itis a common condition that is increasing in prevalence.For example, in a Swiss study, 16% of 391 subjects hadat least one tooth showing signs of erosion (Lussi,1996). The frequent consumption of citrus fruits andsoft drinks and recurrent vomiting were predisposingfactors. The progression of erosion results in toothstructure loss or total destruction of the teeth. Somefactors such as enamel type, temperature and exposuretime influence the development of dental erosion(Amaechi, Higham & Edgar, 1999). It is possible thattooth whitening also plays a role. Rotstein and others(1996) reported a higher solubility of enamel afterbleaching. Cimilli and Pameijer (2001) observed achemical change in surface enamel from hydroxyap-atite to primary calcium orthophosphate after car-bamide peroxide bleach treatment. They also observed
dissolution of calcium from enamel. Attin and others(2003) used a hardness test and pointed out that car-bamide peroxide gel rendered enamel more susceptibleto demineralization. Although there is little direct evi-dence, it is possible that bleached enamel may be moreprone to acid dissolution.
The phosphoric acid etching of unbleached, intactsurface enamel was poor, exposing only some prismaticenamel. This poorer etching effect of the buccal surfaceof human premolars was seen in studies (Oliver, 1987;Gardner & Hobson, 2001; Hobson, Rugg-Gunn &Booth, 2002), but not in studies by Bhad and Hazarey(1995). Bhad and Hazarey (1995) etched ground enamel,instead of intact enamel surfaces, and found mainlytypical etching (honeycombed and fish scale appear-ance). Nevertheless, the structure of surface enamelwas prismless and hypermineralized, contained moreinorganic materials and was more acid-resistant thanground enamel (Kanemura, Sano & Tagami, 1999).Oliver (1987) stated that when grinding was notundertaken, etching lacked uniformity, and increasedamounts of poor or/no etching were evident. Gardnerand Hobson (2001) pointed out that individual teethreact differently to phosphoric acid, and some etchpoorly, even with 60 seconds of acid application.Hobson and others (2002) stated that poor etching wascommon on the middle third of the buccal surface ofteeth when intact enamel was etched with 37% phos-phoric acid for 30 seconds. It is still not clear whetherbleached enamel is more prone to acid dissolution thanunbleached enamel. This study compared the degree ofacid dissolution of intact surface enamel in bothbleached and unbleached cases.
Many studies have concentrated on the surface alter-ations of bleached enamel. However, the results arecontroversial (Table 1) (Haywood & others, 1990;Bitter, 1992; Mcgukin, Babin & Mayer, 1992; Shannon& others, 1993; Ben-Amar & others, 1995; Ernst,Marroquin & Willershausen-Zonnchen, 1996; Zalkind
Tooth Samples Treatment Time Surface Change
Haywood and others, 1990 32 premolars 245 hours No change
Bitter, 1992 14 teeth 30 hours Increased porosity
McGuckin and others, 1992 14 anterior teeth 30 days Increased porosity
Shannon and others, 1993 72 unerupted teeth 4 weeks Superficial erosion
Ben-Amar and others, 1995 32 anterior teeth 21 days Slight change
Flaitz and Hicks, 1996 10 molars ? Increased porosity
Ernst and others, 1996 10 molars 6 hours No or slight change
Josey and others, 1996 24 teeth 10 hours, 7 days Shallow depression
Zalkind and others, 1996 18 premolars 7 days Various changes, + and -
Bitter, 1998 14 teeth 14 days Enamel prism exposure
Potocnik and others, 2000 6 teeth 336 hours Prism exposure
Akal and others, 2001 40 anterior teeth 4 weeks Surface dissolution
Table 1: SEM Studies of Carbamide Peroxide-treated Enamel Surface Changes
Dow
nloaded from http://m
eridian.allenpress.com/operative-dentistry/article-pdf/30/4/1/1819389/1559-2863-30-4-1.pdf by guest on 12 January 2022

509Yeh & Others: Surface Changes and Acid Dissolution of Enamel After Carbamide Peroxide Bleach Treatment
& others, 1996; Josey & others, 1996; Flaitz & Hicks,1996; Bitter, 1998; Akal & others, 2001; Potocnik,Kosec & Gaspersic, 2000), because the pH and compo-sition of commercial bleaching agents, dosage, treat-ment duration and frequency, and origin of tooth sam-ples differed from study to study. In particular, naturalvariations in enamel morphology may be very signifi-cant. Enamel is a herterogeneous material, both froma structural and chemical viewpoint; it varies in min-eral content, amount of organic matrix and chemicalconstruction (Goldberg & others, 1983). Variationoccurs between individuals and teeth, and age alsochanges enamel surface characteristics, permeabilityand color (ten Cate, 1998).
In this study, changes in the surface morphology ofenamel samples after carbamide peroxide bleachingwere evaluated, along with the relative susceptibilityof bleached and unbleached enamel to acid dissolution.Paired enamel samples from premolars were comparedto exclude natural variations between samples. Thehypotheses to be tested were: 1) surface porosityincreased after bleaching and 2) there was a higheracid dissolution of bleached enamel.
METHODS AND MATERIALS
Fifteen freshly extracted, non-carious premolars, freefrom enamel defects and extracted from patients rangingin age from 12 to 30 years, were selected for this studyand stored in a 0.5% sodium azide solution until used.Five teeth were used to study bleach-induced surfacechanges. The other 10 were used to determine the dis-solution susceptibility of bleached relative tounbleached surface enamel. Each tooth was cut in halfin the buccal-lingual direction at midline with a low-speed saw. One-half was used as a test specimen andthe other as the control. In total, 30 parts from 15teeth were obtained. The halves were embedded inacrylic resin and the labial surface was exposed. Thesurfaces of the samples were cleaned using a pumiceslurry and slow rotating hand-piece with an attached rubbercup. Bleaching gel was applied tothe test group of teeth for optimalwhitening, as recommended bythe manufacturer.
For the 15 paired specimens(n=30), half of each tooth wastreated, while the other halfserved as the control. The samplepairs were assigned to one of fourtreatment groups. Group A con-sisted of five pairs that studiedthe surface morphology change ofbleached enamel and Group Bconsisted of 10 pairs that studiedthe susceptibility of bleached
enamel to acid dissolution. The specific groups weredesignated AC (bleaching control group: no bleaching,no acid etching); AT (bleaching treatment group: 10%carbamide peroxide home bleaching [Opalescence,Ultradent Products, Inc, South Jordan, UT, USA] withoutacid etching); BC (no bleaching, only acid etching with37% phosphoric acid for one minute and irrigation withair/water syringe for 30 seconds) and BT (10% car-bamide peroxide home bleaching, then acid etching).
Bleaching Procedure
One-millimeter-thick bleaching gel (10% carbamideperoxide, Opalescence, Ultradent Products, Inc) wasapplied to the halves of 15 teeth and left for eight hoursper day. A Mayer strip covered the gel to ensure inti-mate contact between the gel and the tooth sample.Test samples were then stored in a 100% humidity con-tainer. At the end of the procedure, the bleaching gelwas removed by rinsing with tap water for 30 secondsand each tooth half was brushed for 30 strokes andrinsed with tap water. For the remaining time of thatday, the samples were stored in distilled water. Theprocedure was continued for 10 days. Control sampleswere treated the same except that a drop of water wasused instead of bleaching gel.
After bleaching treatment, the samples were storedin distilled water for one week, then washed with tapwater for one minute and cleaned ultrasonically for 10minutes. Group AC and Group AT teeth were exam-ined by SEM. Group BC and Group BT teeth wereetched for 60 seconds with 37% phosphoric acid andwashed for 30 seconds with an air/water syringe beforeSEM examination (Figure 1).
All samples were vacuum-desiccated and gold sput-ter-coated prior to examination of the surfaces usingSEM (Hitachi S-3500N) at an accelerating voltage of15.0 kV. Photographs were taken of the control andexperimental specimens and surface changes werecompared.
Figure 1. Summary of procedure.
Dow
nloaded from http://m
eridian.allenpress.com/operative-dentistry/article-pdf/30/4/1/1819389/1559-2863-30-4-1.pdf by guest on 12 January 2022

510 Operative Dentistry
The study examined the middle third of the buccalsurface of sample pairs. Only sample pairs of thesame tooth were compared and recorded. To provide arepresentation of events over the entire surface, thisstudy used magnifications of 50x, 200x, 500x and1000x to compare surface changes. Attention wasfocused on the degree of acid dissolution over a largearea of the enamel surface rather than to specificsites. In Group A, no statistical analysis was per-formed, because the observation of SEM was designedto be qualitative. In Group B, paired t-test was per-formed to compare the degree of acid dissolution.
RESULTS
Enamel Surface Characteristics With andWithout Bleaching Treatment
In both Groups AC and AT samples, surface periky-mata, the surface manifestations of the striae ofRetzius, were predominant (Figure 2). The gross struc-ture showed undulating and overlapping patterns
with grooves and convex ridges (at both 30x, and100x).
In Group AC samples, an alternating structure ofrows of numerous shallow and deeper prism-end pitswere combined with a smooth band (at 200x and500x). Pits or pit rows were usually located in grooves(at 500x and 1000x). Scratch lines were common onthe surface of all samples (Figure 3A).
The surface perikymata of Group AT sampleslooked well defined at lower magnification (200x). Athigh magnification (500x and 1000x), pits in groovesincreased and some prisms were exposed, but thesmooth band areas were less affected (Figure 3B).The experimental group showed greater density ofsurface pitting than the control.
Acid Dissolution Patterns of Bleached andUnbleached Enamel
Because surface enamel is prismless and hyperminer-alized, Hobson and others (2002) used a four-pointscale to assess the quality of etching on certain sur-face areas from a flat enamel surface, a pitted enamelsurface, a discernible etched patterns, to ideal etching.To record and compare SEM results, this study modi-fied Hobson’s observation and assigned degrees I–V toindicate progressively greater acid dissolution of sur-face enamel as follows (Figure 4): Degree I: littlechange, only micropitting; Degree II: prismatic enamelstructure visible and sparsely distributed; Degree III:prismatic enamel structure obvious; Degree IV: com-plete loss of the aprismatic surface structure and pris-matic enamel observed throughout the lesion andDegree V: typical etched patterns (honeycomb or fishscale appearance) over the entire surface.
The extent of acid dissolution in Group BC samplesvaried, and the change in grade ranged from Degree Ito III (Table 2). On the less-affected samples, only sur-
Figure 2. Scanning electron micrograph of labial surface of premolar, showing perikymata.The surface shows undulating patterns with groovesand a convex ridge. There is some surface pitting. A, 30x; B, 100x, bar=200 µm.
Control Treatment Degree of Change
Sample A I III +2
Sample B I II +1
Sample C III III 0
Sample D II IV +2
Sample E II II +2
Sample F II V +3
Sample G II IV +2
Sample H II IV +2
Sample I II IV +2
Sample J III IV +1
t=6.32, t99.5 (9)=3.2, p<0.05
Table 2: Results of the Degree of Acid Dissolution of Bleached and Unbleached Enamel
Dow
nloaded from http://m
eridian.allenpress.com/operative-dentistry/article-pdf/30/4/1/1819389/1559-2863-30-4-1.pdf by guest on 12 January 2022

511Yeh & Others: Surface Changes and Acid Dissolution of Enamel After Carbamide Peroxide Bleach Treatment
face pitting was found, while others showed sparsely orobviously distributed prismatic enamel. Sparsely dis-tributed prismatic enamel (Degree II) was the mostcommon pattern (Figure 5A).
Acid dissolution patterns in Group BT ranged fromDegree II to V. Degree III (prismatic enamel clearlyevident) was the most common pattern (Figure 5B).
Paired t-test was used to compare paired samples ofbleached and unbleached surface changes after acidexposure. The results revealed that acid attack seems
Figure 4. Varies degree of acid dissolution ofsurface enamel. A. Degree I: micropitting only.B. Degree II: prismatic enamel structure visible.C. Degree III: more-obvious prismatic enamelstructure apparent. D. Degree IV: complete lossof aprismatic surface (prismatic enamelobserved throughout the surface). E. Degree V:typical etched patterns over entire surface. A-E, 500x, Bar=20 µm.
Figure 3. Scanning electron micrograph of paired unbleached and bleached enamel surfaces. A. Unbleached surface has some scratches and pit-ting, and pitting is in lines of Retzius and appears to run parallel to the furrow (A1, 200x; A2, 500x; A3, 1000x). B. On the bleached surface, thedensity of pitting is increased (B1, 200x; B2, 500x; B3, 1000x). Bar=20 µm.
Dow
nloaded from http://m
eridian.allenpress.com/operative-dentistry/article-pdf/30/4/1/1819389/1559-2863-30-4-1.pdf by guest on 12 January 2022

512 Operative Dentistry
more severe on bleached than on unbleached surfaces(Table 2) (p<0.05).
DISCUSSION
This study assessed surface changes caused by thebleaching of premolars. Surface perikymata were pre-dominant in all samples, while in a study by Josey andothers (1996), enamel surfaces were amorphous. Thesamples in this study were from younger individuals,compared to the samples used in the latter study and,so, the surface was mainly covered by perikymata,which are wavelike features normally found on theenamel surface (Kodaka & others, 1990). Perikymatapresents itself as parallel, alternating ridges andgrooves (Risnes, 1984). The grooves are considered tobe a more porous, less mineralized area (Huang & oth-ers, 1998). These structures are known to undergogradual attrition, mechanical abrasion or chemical ero-sion over time (Smith, 1991). In the unbleached treat-ment group, more or less porosity was found in grooves.After bleaching treatment, the effect of bleach onenamel was not uniform. This study found that the pitsin the grooves increased, while the smooth bandsremained relatively smooth after bleach treatment.The unevenness of the chemical attack on enamel sur-faces has been discussed in other reports. Klinger,Rudolph and Gabriel (1978) showed that the solubilityof enamel, when treated with lactic acid, varied alongthe lines of Retzius. The results of this study showedthat the smooth ridge area is less affected than theporous groove. The possible explanation may be that
the grooves of the perikymata act as a large diffusionpathway (Huang & others, 1998). It seems that bleachingagents tend to easily attack porous and hypomineral-ized areas. The use of premolars from young individ-uals was proposed to eliminate natural variations insurface enamel between samples, because, with aging,enamel characteristics change, including loss of perme-ability, the wearing down of surfaces and increased flu-oride content (ten Cate, 1998). Aged and well-mineral-ized enamel surfaces might be less affected by bleaching.The discrepancy between the results of this study andothers (Table 1) can partially be explained by differ-ences in the sample age and surface texture. The firsthypothesis, that bleach treatment increases surfaceporosity, was confirmed. On the basis of these results,caution is recommended before deciding to bleach theteeth of a young age group.
Because the structure of surface enamel is prismlessand hypermineralized, that is, it contains more inor-ganic materials and is more acid-resistant than groundenamel (Kanemura & others, 1999), its structure isregarded as different from that of subsurface enamel.Hobson and others (2002) described how, when intactsurface enamel is etched, the greatest area of theetched enamel surface consists of pitting and only asmall percentage of the enamel surface shows an idealetching pattern. This could be due to non-uniformetched pattern distribution and the fact that the dis-cernible etched pattern could be limited to either smallor large areas. This study compared the acid dissolu-
Figure 5. Scanning electron micrograph showing acid etching of paired unbleached and bleached enamel surfaces. A. Unbleached and acid etched,degree II acid dissolution (A1, 200x; A2, 500x; A3, 1000x). B. Bleached and acid etched, degree III acid dissolution (B1, 200x; B2, 500x; B3, 1000x).Bar=20 µm.
Dow
nloaded from http://m
eridian.allenpress.com/operative-dentistry/article-pdf/30/4/1/1819389/1559-2863-30-4-1.pdf by guest on 12 January 2022

513Yeh & Others: Surface Changes and Acid Dissolution of Enamel After Carbamide Peroxide Bleach Treatment
tion properties of enamel surfaces of bleached andunbleached sample pairs through a comparison of sam-ple pairs from the same tooth; a higher degree of aciddissolution was seen in samples of the bleached groupcompared to the unbleached group (Table 2). It seemsthat the solubility of the enamel surface by 37% phos-phoric acid increased after bleaching treatment. Attinand others (2003) evaluated the effects of carbamideperoxide gel on the formation of erosively induced dem-ineralization of enamel and found that carbamide per-oxide gel renders enamel more susceptible to deminer-alization. The results of the current study were inagreement with that of Attin and others (2003).
The second hypotheses, that bleach treatmentincreases in acid dissolution of bleached enamel, hasalso been confirmed. The increase in acid dissolution bybleaching may be secondary to bleach-induced changesin the composition and microstructure of the enamel.Bleaching with hydrogen peroxide and urea (both ofwhich are protein denaturants) may enhance the chem-ical destruction of the protein matrix around the enamelcrystallite. During deproteinization, any mineral ele-ments associated with enamel proteins are alsoremoved (Goldberg & others, 1983; Arends & others,1984; Hegedus & others, 1999). Several studies haveshown microchemical variations after bleaching. Joseyand others (1996), using polarized light microscopy,observed blurring of the striae of Retzius in enamel sec-tions and suggested a loss of subsurface minerals.McCracken and Haywood (1996) reported a loss of cal-cium from enamel after six hours exposure to 10% car-bamide peroxide, and the amount of calcium loss wassimilar to that of teeth exposed to cola for 2.5 minutes.Cimilli and Pameijer (2001) demonstrated that somehome bleaching agents caused the dissolution of calciumfrom enamel through the conversion of hydroxyapatiteto primary calcium orthophosphate. It may be due tothe fact that the solubility factors of hydroxyapatite andprimary calcium orthophosphate are 1.6 x 10-58 and 1.0x 10⁻³, respectively, so that calcium orthophosphate ismore soluble than hydroxyapatite. The clinical implica-tions of the above observations are still unknown. Theresults of this study indicated that bleached enamelmay be more prone to acid dissolution (Table 2). Thebleach-induced loss of chemical molecules did not causemuch change in surface morphology, only surface pit-ting increased in a localized area, but it did increasesusceptibility to acid dissolution.
Most bleach treatment studies have used in vitro sam-ples, and the results showed little surface change oronly pitting (Table 2). However, Shannon and others(1993) used enamel slabs that were attached to remov-able appliances worn by volunteers and found superfi-cial erosion of the enamel surface. In another in vivostudy by Bitter (1998), where teeth were bleached for 14days, maintained in the oral cavity for 21–90 days, then
extracted and examined by SEM, the results indicatedexposure of the enamel prismatic layer, frequently tothe depth of the enamel rods and possibly the dentin,and concluded that long-term bleach-induced changesdo occur (Hobson & others, 2002). Both of those in vivostudies found more severe surface changes than did thein vitro studies. The results of this study might explainthe difference between in vivo and in vitro studies. Acidin the oral cavity, together with an increase in acid dis-solution of bleached enamel, probably results in erosivelesions in vivo; whereas, in vitro, only artificial saliva ordistilled water was used as the storage medium, whichis neutral (not acidic), thus, permitting only pitting-type surface damage. In this study, the acid resistanceof bleached enamel was assessed by phosphoric etchingfor one minute; clinical acid challenge through food,fruits and soft drinks, although milder, is more pro-longed and frequent. It is still unknown whether theeffects of bleaching are long-term and whether dietarycomponents augment bleach-induced enamel erosion.More research is needed, especially in vivo, and thedynamic interaction of saliva and bleaching agentshould be considered.
Natural variations in tooth enamel surfaces makecomparison of changes in bleached and unbleached sur-face morphology difficult. Sample pairs from the sametooth were used to evaluate surface changes and it wasfound that pitting increased in localized areas.However, after acid etching of the bleached enamel, theamount of dissolution appeared to be higher. Thisincrease may be attributable to infiltration of the enam-el’s crystallite protein matrix by hydrogen peroxide andurea. This change may increase the enamel’s solubilityin acid. Considering the erosive effects of dietary com-ponents on the dentition, the change in the amount ofacid dissolution may be of great importance. It must beemphasized that this study was performed in vitro withintact enamel stored in distilled water. In the oral cavity,the remineralization property of saliva must be consid-ered. Many clinical procedures, as well as contact withfood, damage surface enamel; therefore, the risks/bene-fits of bleaching must be considered. The results of thisstudy indicate that surface porosity was slightlyincreased and more surface dissolution by acid occurredafter bleaching.
The possible adverse effects of bleached enamel foundin this study were mild surface pitting at localizedareas and higher surface dissolution by acid. To avoidthe possible adverse effects of bleaching, the topicalapplication of fluoride or a surface glaze is recommendedafter bleaching. Topical fluoride application mayimprove remineralization of bleached enamel and pro-tect the teeth from erosive challenges (Attin & others,1997; Imfeld, 1996). Dental structure coated with a pro-tective coating (for example, dental adhesive) wasshown to increase acid resistance (Hachiya & others,
Dow
nloaded from http://m
eridian.allenpress.com/operative-dentistry/article-pdf/30/4/1/1819389/1559-2863-30-4-1.pdf by guest on 12 January 2022

514 Operative Dentistry
1995; Kuhar & others, 1999). Because the results ofthis in vitro study cannot necessarily be extrapolated tothe clinical situation, it is suggested that bleaching beperformed with caution in young patients and those athigh risk of dental erosion. More research is needed toevaluate the altered acid dissolution properties afterbleaching and their clinical relevance
CONCLUSIONS
Within the limits of this study, it was concluded that sur-face porosity was slightly increased and more surfacedissolution by acid occurred after bleaching.
(Received 6 April 2004)
References
Akal N, Over H, Olmez A & Bodur H (2001) Effects of carbamideperoxide containing bleaching agents on the morphology andsubsurface hardness of enamel Journal of Clinical PediatricDentistry 25(4) 293-296.
Amaechi BT, Higham SM & Edgar WN (1999) Factors influenc-ing the development of dental erosion in vitro: Enamel type,temperature and exposure time Journal of Oral Rehabilitation26(8) 624-630.
Arends J, Jongebloed WL, Goldberg M & Schuthof J (1984)Interaction of urea and human enamel Caries Research 18(1)17-24.
Attin T, Kielbassa M, Schwanenberg M & Hellwig E (1997) Effectof fluoride treatment on remineralization of bleached enamelJournal of Oral Rehabilitation 24(4) 282-286.
Attin T, Kocabiyik M, Buchalla W, Hannig C & Becker K (2003)Susceptibility of enamel surfaces to demineralization afterapplication of fluoridated carbamide peroxide gels CariesResearch 37(2) 93-99.
Ben-Amar A, Libeman R, Gorfil C & Bernstein Y (1995) Effect ofmouthguard bleaching on enamel surface American Journal ofDentistry 8(1) 29-32.
Bhad WA & Hazarey PV (1995) Scanning electron microscopicstudy and shear bond strength measurement with 5 and 37%phosphoric acid American Journal of Orthodontics &Dentofacial Orthopedics 108(4) 410-414.
Bitter NC (1992) A scanning electron microscopy study of theeffect of bleaching agents on enamel: A preliminary reportJournal of Prosthetic Dentistry 67(6) 852-855.
Bitter NC (1998) A scanning electron microscopy study of thelong-term effect of bleaching agents on the enamel surface invivo General Dentistry 46(1) 84-88.
Christensen GJ (1997) Bleaching teeth: Practitioner trendsJournal of the American Dental Association128(Supplement) 16S-18S.
Cimilli H & Pameijer CH (2001) Effect of carbamide peroxidebleaching agents on the physical properties and chemical com-position of enamel American Journal of Dentistry 14(2) 63-66.
Ernst CP, Marroquin BB & Willershausen-Zonnchen B (1996)Effects of hydrogen peroxide-containing bleaching agents onthe morphology of human enamel Quintessence International27(1) 53-56.
Flaitz CM & Hicks MJ (1996) Effects of carbamide peroxide whit-ing agents on enamel surfaces and caries-like lesion formation:An SEM and polarized light microscopic in vitro study Journalof Dentistry for Children 63(4) 249-256.
Gardner A & Hobson R (2001) Variations in acid-etch patternswith different acids and etch times American Journal ofOrthodontics & Dentofacial Orthopedics 120(1) 64-67.
Goldberg M, Arends J, Jongebloed WL, Schuthof J & Septier D(1983) Action of urea solutions on human enamel surfacesCaries Research 17(2) 106-112.
Hachiya Y, Takatsu T, Hosoda H & Fusayama T (1995) A varnishto prevent etching unrestored enamel Journal of ProstheticDentistry 53(1) 46-50.
Haywood VB, Leech T, Heymann HO, Crumpler D & Bruggers K(1990) Nightguard vital bleaching: Effects on enamel surfacetexture and diffusion Quintessence International 21(10) 801-804.
Haywood VB (1997) Nightguard vital bleaching: Current con-cepts and research Journal of the American Dental Association128(Supplement) 19S-25S.
Hegedus C, Bistey T, Flora-Nagy E, Keszthely G & Jenei A (1999)An atomic force microscopy study on the effect of bleachingagents on enamel surface Journal of Dentistry 27(7) 509-515.
Hobson RS, Rugg-Gunn AJ & Booth TA (2002) Acid-etch patternson the buccal surface of human permanent teeth Archives ofOral Biology 47(5) 407-412.
Huang A, Nakagaki H, Tsuboi S & Haixiang J (1998) Fluorideprofiles of perikymata in enamel surfaces of human premolarsArchives of Oral Biology 43(9) 669-677.
Imfeld T (1996) Prevention of progression of dental erosion byprofessional and individual prophylactic measures EuropeanJournal of Oral Sciences 104(2) 215-220.
Josey AL, Meyers K, Romaniuk K & Symons AL (1996) The effectof a vital bleaching technique on enamel surface morphologyand the bonding of composite resin to enamel Journal of OralRehabilitation 23(4) 244-250.
Kanemura N, Sano H & Tagami J (1999) Tensile bond strengthand SEM evaluation of ground and intact enamel surfaceJournal of Dentistry 27(7) 523-30.
Klinger HG, Rudolph C & Gabriel E (1978) Quantitative evalua-tion of the etching pattern in the enamel of a tooth sectionCaries Research 12(4) 231-237.
Kodaka T, Koroiwa M, Higashi S & Miake K (1990) Three-dimen-sional observations of the relation between the natural enam-el surface and the outermost layer in human permanent toothBulletin of Tokyo Dental College 31(2) 105-115.
Kuhar M, Cevc P, Schara M & Funduk N (1999) In vitro perme-ability and scanning electron microscopy study of acid-etchedand ground enamel surfaces protected with dental adhesivecoating Journal of Oral Rehabilitation 26(9) 722-730.
Lussi A (1996) Dental erosion: Clinical diagnosis and case histo-ry taking European Journal of Oral Sciences 104(2) 191-198.
Dow
nloaded from http://m
eridian.allenpress.com/operative-dentistry/article-pdf/30/4/1/1819389/1559-2863-30-4-1.pdf by guest on 12 January 2022

515Yeh & Others: Surface Changes and Acid Dissolution of Enamel After Carbamide Peroxide Bleach Treatment
McCracken MS & Haywood VB (1996) Demineralization effectsof 10% carbamide peroxide Journal of Dentistry 24(6) 395-398.
McGukin RS, Babin JE & Meyer BJ (1992) Alterations in humanenamel surface morphology following vital bleaching Journalof Prosthetic Dentistry 68(5) 754-760.
Oliver RG (1987) The effects of differing etch times on the etchpattern on enamel of unerupted and erupted human teethexamined using the scanning electron microscope BritishJournal of Orthodontics 14(2) 105-107.
Potocnik I, Kosec L & Gaspersic D (2000) Effect of 10% car-bamide peroxide bleaching gel on enamel microhardness,microstructure and mineral content Journal of Endodontics26(4) 203-206.
Risnes S (1984) Rationale for consistency in the use of enamelsurface terms: Perikymata and imbrications ScandinavianJournal of Dental Research 92(1) 1-5.
Rotstein I, Dankner E, Goldman A, Heling I, Stabholz A &Zalkind M (1996) Histochemical analysis of dental hard tis-sues following bleaching Journal of Endodontics 22(1) 23-25.
Shannon H, Spencer P, Gross K & Tira D (1993) Characterizationof enamel exposed to 10% carbamide peroxide bleachingagents Quintessence International 24(1) 39-44.
Smith BC (1991) Changes in perikymata and their significance toa postmortem dental identification Journal of ForensicSciences 36(1) 166-178.
ten Cate AR (1998) Oral Histology: Development, Structure andFunction 5th edition St Louis CV Mosby 227-237.
Zalkind M, Arwaz JR, Goldman A & Rotstein I (1996) Surfacemorphology changes in human enamel, dentin and cementumfollowing bleaching: A scanning electron microscopy studyEndodontics & Dental Traumatology 12(2) 82-88.
Dow
nloaded from http://m
eridian.allenpress.com/operative-dentistry/article-pdf/30/4/1/1819389/1559-2863-30-4-1.pdf by guest on 12 January 2022
©Operative Dentistry, 2005, 30-4, 516-521
Temperature Changeand Hardness
with Different Resin Compositesand Photo-activation Methods
SUMMARY
This study verifies whether there is any temper-ature change during photoactivation of two resincomposites (Filtek Z250 and Filtek Flow) with
three different light curing methods (conven-tional halogen light curing unit, light emittingdiodes curing unit and xenon plasma arc curingunit) and the relationship of temperature changewith resin composite hardness. A type-K thermo-couple registered the temperature rise peak inan elastomer mold during photoactivation. Afterphotoactivation, the specimens were submittedto Knoop hardness test performed by an indenter(HMV-2000) under a load of 50g for 15 seconds.Both the temperature change data and results ofthe Knoop hardness test were submitted toANOVA and Tukey’s test at the 5% significancelevel. No statistical differences in temperaturerise were recorded for the different compositesfollowing processing by light curing unit(p>0.05). The conventional halogen source pro-duced statistically higher temperatures (p<0.05)than the other units. The plasma arc source pro-moted statistically lower (p<0.05) Knoop hard-ness values and temperature changes than theother light curing units.
LFJ Schneider • S ConsaniMAC Sinhoreti • L Correr Sobrinho • FM Milan
**Luis Felipe Jochims Schneider, DDS, post-graduate student, DentalMaterials, School of Dentistry of Piracicaba, State University ofCampinas, Piracicaba, Brazil
*Simonides Consani, DDS, PhD, titular professor of Dental Materials,Department of Restorative Dentistry, School of Dentistry ofPiracicaba, State University of Campinas, Piracicaba, Brazil
Mário Alexandre Coelho Sinhoreti, DDS, MS, PhD, associate professorof Dental Materials, Department of Restorative Dentistry, School ofDentistry of Piracicaba, State University of Campinas, Piracicaba,Brazil
Lourenço Correr Sobrinho, DDS, MS, PhD, titular professor of DentalMaterials, Department of Restorative Dentistry, School of Dentistryof Piracicaba, State University of Campinas, Piracicaba, Brazil
Fábio Machado Milan, DDS, MS, PhD, professor of OperativeDentistry, University of Santa Cruz do Sul–Brazil
*Reprint request: Av Limeira 901, Caixa Postal 52, CEP–13414-903,Piracicaba–SP–Brazil; e-mail: [email protected]**Rua Nossa Senhora Da Medianeira 180, CEP 90870-370,Porto Alegre–RS–Brazil; e-mail: [email protected]
Clinical Relevance
Temperature increase is affected by the material, shade and light source; however,light source is the most important factor that produces different temperature changesduring the photo-activation of resin composite.
Dow
nloaded from http://m
eridian.allenpress.com/operative-dentistry/article-pdf/30/4/1/1819389/1559-2863-30-4-1.pdf by guest on 12 January 2022
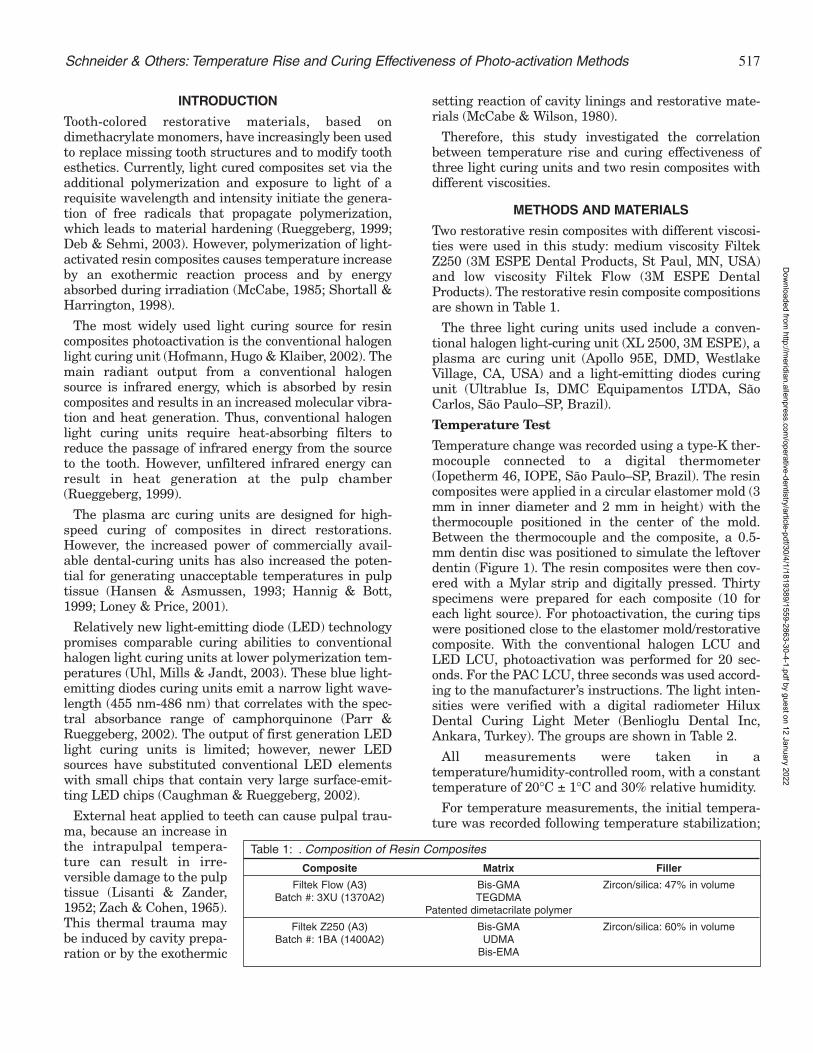
517Schneider & Others: Temperature Rise and Curing Effectiveness of Photo-activation Methods
INTRODUCTION
Tooth-colored restorative materials, based ondimethacrylate monomers, have increasingly been usedto replace missing tooth structures and to modify toothesthetics. Currently, light cured composites set via theadditional polymerization and exposure to light of arequisite wavelength and intensity initiate the genera-tion of free radicals that propagate polymerization,which leads to material hardening (Rueggeberg, 1999;Deb & Sehmi, 2003). However, polymerization of light-activated resin composites causes temperature increaseby an exothermic reaction process and by energyabsorbed during irradiation (McCabe, 1985; Shortall &Harrington, 1998).
The most widely used light curing source for resincomposites photoactivation is the conventional halogenlight curing unit (Hofmann, Hugo & Klaiber, 2002). Themain radiant output from a conventional halogensource is infrared energy, which is absorbed by resincomposites and results in an increased molecular vibra-tion and heat generation. Thus, conventional halogenlight curing units require heat-absorbing filters toreduce the passage of infrared energy from the sourceto the tooth. However, unfiltered infrared energy canresult in heat generation at the pulp chamber(Rueggeberg, 1999).
The plasma arc curing units are designed for high-speed curing of composites in direct restorations.However, the increased power of commercially avail-able dental-curing units has also increased the poten-tial for generating unacceptable temperatures in pulptissue (Hansen & Asmussen, 1993; Hannig & Bott,1999; Loney & Price, 2001).
Relatively new light-emitting diode (LED) technologypromises comparable curing abilities to conventionalhalogen light curing units at lower polymerization tem-peratures (Uhl, Mills & Jandt, 2003). These blue light-emitting diodes curing units emit a narrow light wave-length (455 nm-486 nm) that correlates with the spec-tral absorbance range of camphorquinone (Parr &Rueggeberg, 2002). The output of first generation LEDlight curing units is limited; however, newer LEDsources have substituted conventional LED elementswith small chips that contain very large surface-emit-ting LED chips (Caughman & Rueggeberg, 2002).
External heat applied to teeth can cause pulpal trau-ma, because an increase inthe intrapulpal tempera-ture can result in irre-versible damage to the pulptissue (Lisanti & Zander,1952; Zach & Cohen, 1965).This thermal trauma maybe induced by cavity prepa-ration or by the exothermic
setting reaction of cavity linings and restorative mate-rials (McCabe & Wilson, 1980).
Therefore, this study investigated the correlationbetween temperature rise and curing effectiveness ofthree light curing units and two resin composites withdifferent viscosities.
METHODS AND MATERIALS
Two restorative resin composites with different viscosi-ties were used in this study: medium viscosity FiltekZ250 (3M ESPE Dental Products, St Paul, MN, USA)and low viscosity Filtek Flow (3M ESPE DentalProducts). The restorative resin composite compositionsare shown in Table 1.
The three light curing units used include a conven-tional halogen light-curing unit (XL 2500, 3M ESPE), aplasma arc curing unit (Apollo 95E, DMD, WestlakeVillage, CA, USA) and a light-emitting diodes curingunit (Ultrablue Is, DMC Equipamentos LTDA, SãoCarlos, São Paulo–SP, Brazil).
Temperature Test
Temperature change was recorded using a type-K ther-mocouple connected to a digital thermometer(Iopetherm 46, IOPE, São Paulo–SP, Brazil). The resincomposites were applied in a circular elastomer mold (3mm in inner diameter and 2 mm in height) with thethermocouple positioned in the center of the mold.Between the thermocouple and the composite, a 0.5-mm dentin disc was positioned to simulate the leftoverdentin (Figure 1). The resin composites were then cov-ered with a Mylar strip and digitally pressed. Thirtyspecimens were prepared for each composite (10 foreach light source). For photoactivation, the curing tipswere positioned close to the elastomer mold/restorativecomposite. With the conventional halogen LCU andLED LCU, photoactivation was performed for 20 sec-onds. For the PAC LCU, three seconds was used accord-ing to the manufacturer’s instructions. The light inten-sities were verified with a digital radiometer HiluxDental Curing Light Meter (Benlioglu Dental Inc,Ankara, Turkey). The groups are shown in Table 2.
All measurements were taken in atemperature/humidity-controlled room, with a constanttemperature of 20°C ± 1°C and 30% relative humidity.
For temperature measurements, the initial tempera-ture was recorded following temperature stabilization;
Composite Matrix Filler
Filtek Flow (A3) Bis-GMA Zircon/silica: 47% in volumeBatch #: 3XU (1370A2) TEGDMA
Patented dimetacrilate polymer
Filtek Z250 (A3) Bis-GMA Zircon/silica: 60% in volumeBatch #: 1BA (1400A2) UDMA
Bis-EMA
Table 1: . Composition of Resin Composites
Dow
nloaded from http://m
eridian.allenpress.com/operative-dentistry/article-pdf/30/4/1/1819389/1559-2863-30-4-1.pdf by guest on 12 January 2022

518 Operative Dentistry
the composite was then light cured and the tempera-ture peak was registered. The initial temperature wasdeducted from the final temperature.
The temperature change data were submitted to two-way ANOVA and the means were compared by Tukey’stest (5% of significance level).
Knoop Hardness Test
After the photoactivation procedure, the specimenswere placed in 3/4-inch diameter PVC rings filled withself-curing acrylic resin (JET, Artigos OdontológicosClássico, São Paulo–SP, Brazil) to keep them fixed.After 24 hours, each group was flattened with carbidesandpaper of decreasing grit (320, 400, 600 and 1200)on an automatic polisher APL-4 (Arotec Ind Com,Cotia–SP, Brazil) to obtain flattened surfaces. TheKnoop hardness readings were performed with anindenter (HMV-2000, Shimadzu, Tokyo, Japan) under aload of 50g for 15 seconds.
Three indentations were made on three differentregions: surface, 1-mm and 2-mm depths, for a total ofnine indentations per specimen. The values obtained inmicrometers were converted to Knoop HardnessNumber (KHN) by indenter software.
The results of the Knoop hardness test were sub-mitted to two-way ANOVA and the means were com-pared by Tukey’s test (5% of significance level).
RESULTS
Table 3 shows the mean values of Knoop hardness ineach appraised depth for all the photoactivationmethods with Filtek Z250. It was noted that, generally,there was no statistical decrease in hardness as depth
increased. Only PAC LCU had a sig-nificant decrease in hardness valuesat the 2-mm depth (p<0.05).Comparing the methods, at the sur-face and 1-mm depth, there were nostatistical differences (p>0.05). Atthe 2-mm depth, PAC LCU was sta-tistically lower (p<0.05) than theothers.
Table 4 shows the mean values ofKnoop hardness in each appraiseddepth for all the photoactivationmethods with Filtek Flow. It wasalso verified that, similar to Z250,there generally was no decrease inhardness as depth increased, andonly PAC had a significant decreasein hardness values at the 2-mmdepth (p<0.05). Comparing themethods at all depths, there were nostatistical differences (p>0.05)between the conventional halogenLCU and LED LCU. However, PACLCU was statistically lower (p<0.05)than the others.
Table 5 shows the mean values of the temperaturesrecorded (Celsius degree). No statistical difference wasobserved for the different composites with any of thephotoactivation methods (p>0.05). However, the lightcuring unit factor demonstrated that the conventionalhalogen LCU produced statistically higher tempera-tures (p<0.05) than the other units. It was alsoobserved that the LED LCU produced statisticallyhigher temperatures than PAC LCU (p<0.05).
DISCUSSION
Thermal transfer is affected by dentin thickness(Goodis & others, 1989). According to Loney and Price(2001), thicker dentin specimens reduce temperaturechanges. While dentin has a relatively low thermal con-ductivity, the potential for pulpal damage is greater indeep cavities when the residual dentin thickness issmall and the tubular surface area increases (Shortall& Harrington, 1998). Thus, the 0.5-mm dentin disc wasused to standardize the leftover dentin and provide amore realistic value of thermal transfer.
Resin composite shade is another factor that couldaffect temperature change (Uhl & others, 2003). Withconventional halogen light curing units, darker shadesproduce higher temperatures than lighter shades.However, for LED light curing units, there is a tendencyfor composites that have a lighter shade to producehigher temperatures (Uhl & others, 2003). This can beexplained by their generally higher light transmittancefor light at a wavelength of 470 nm, where there is the
Figure 1. Apparatus for measuring temperature changes.
Dow
nloaded from http://m
eridian.allenpress.com/operative-dentistry/article-pdf/30/4/1/1819389/1559-2863-30-4-1.pdf by guest on 12 January 2022

519Schneider & Others: Temperature Rise and Curing Effectiveness of Photo-activation Methods
maximum absorption of camphorquinone (Uhl &others, 2003). For this reason, only one shade was usedin this study.
According to McCabe (1985) and Shortall andHarrington (1998), the degree of temperature rise inthe tooth is caused by the exothermic setting reaction ofthe composite during the polymerization process andthe energy input of the light curing unit. The rate of theexothermic setting reaction is a function of the irradi-ance of the light curing unit, the composite chemicalcomposition and the light transmission properties ofthe resin composite (Shortall & Harrington, 1998). Aslight passes through the composite, it is absorbed andscattered, attenuating the intensity and reducing theeffectiveness of the light for resin polymerization as thedepth increases (Rueggeberg, 1999; Knezevic & others,2001). Since the resin composite should be cured inincrements of 2-mm thicknesses to assure maximalpolymerization of the material, this measurement wasused in this study.
As Knoop Hardnessprovides a goodparameter to esti-mate monomer con-version in a light-cured composite(Ferracane, 1985;DeWald & Ferra-
cane, 1987; Rueggeberg & Craig,1988), this was used as an indirectmeasure of the degree of cure in thisstudy.
The temperature rise with the twocomposites used is higher in the caseof photoactivation with a conventionalhalogen light curing unit than withLED and plasma arc sources (Table5). With conventional halogen lightcuring units, the emitted radiation atthe light curing tip is mainly visiblelight and infrared energy, which doesnot contribute to activation of pho-toinitiators (Hofmann & others, 2002;Deb & Sehmi, 2003). This couldexplain why the higher temperatureproduced by conventional halogenlight curing units does not correlatewith Knoop Hardness, when com-pared to LED source. The tempera-ture rise during photoactivation wassmaller with the LED light curingunit than with the conventional halo-gen source, but the mean values ofKnoop Hardness were not staticallydifferent (p>0.05). Thus, the LEDsource promoted a similar degree ofcure with lower temperatures since it
emits a narrow wavelength of light (455 nm-486 nm)that correlates with the spectral absorbance range ofcamphoquinone (Parr & Rueggeberg, 2002).
Plasma arc curing sources have higher intensities oflight emitted over a narrow range of wavelengths and,due to the high irradiance, offer a much shorter curingtime in comparison to conventional halogen light units(Deb & Sehmi, 2003). However, the high irradiancedelivered by the plasma arc source over a few secondsis not enough to produce optimum properties in resincomposites and has a great influence on the degree ofpolymerization (Peutzfeldt, Sahafi & Asmussen, 2000).Thus, it can be suggested that plasma arc light curingunits led to inefficient curing (Deb & Sehmi, 2003).This confirms the current study, where a plasma arccuring unit promoted lower temperatures, but alsocaused lower mean values of Knoop Hardness. Thus,the lower temperature during photoactivation cannotbe regarded as an advantage, but has to be attributed
LCU Intensity of Light Equipment Exposure Z250 (n) Flow (n)
Halogen 600 mW/cm2 XL 2500 20 seconds 10 10
LED 400 mW/cm2 Ultrablue 1S 20 seconds 10 10
PAC 1450 mW/cm2 Apollo 95E 3 seconds 10 10
Table 2: Characteristics of the Groups
Halogen LED PAC
Surface 80.89 (8.53)a,A 76.44 (7.77)a,A 74.85 (6.53)a,A
1 mm 76.92 (4.81)a,A 75.08 (4.65)a,A 73.89 (8.23)a,A
2 mm 74.12 (5.38)a,A 73.48 (4.89)a,A 65.72 (12.58)b,B
Mean values followed by different small letters in the column differ statistically among themselves for the Tukey´s Test at the5% level. Mean values followed by different capital letters in the line differ statistically for the photoactivation methods by theTukey´s Test at the 5% level (Standard Deviation).
Table 3: Mean Values of Knoop Hardness (KHN) in Each Appraised Depth for All the Photoactivation Methods with Filtek Z250
Halogen LED PAC
Surface 38.18 (7.35)a,A 36.54 (3.55)a,A 23.94 (7.77)a,B
1 mm 41.32 (9.16)a,A 39.50 (3.70)a,A 27.19 (4.91)a,B
2 mm 36.53 (7.45)a,A 35.01 (5.59)a,A 17.17 (7.91)b,B
Mean values followed by different small letters in the column differ statistically among themselves for the Tukey´s Test at the5% level. Mean values followed by different capital letters in the line differ statistically for the photoactivation methods by theTukey´s Test at the 5% level (Standard Deviation).
Table 4: Mean Values of Knoop Hardness (KHN) in Each Appraised Depth for All the Photoactivation Methods with Filtek Flow
Mean Values of Temperature Rise in Celsius Degree Halogen LED PAC
Filtek Z250 1.36 (0.13)a,A 1.08 (0.20)a,B 0.83 (0.25)a,C
Filtek Flow 1.60 (0.19)a,A 1.15 (0.27)a,B 0.85 (0.30)a,C
Mean values followed by different small letters in the column differ statistically among themselves for the Tukey´s Test at the5% level. Mean values followed by different capital letters in the line differ statistically for the photoactivation methods by theTukey´s Test at the 5% level (Standard Deviation).
Table 5: Mean Values of Temperature Rise (Celsius Degree)
Dow
nloaded from http://m
eridian.allenpress.com/operative-dentistry/article-pdf/30/4/1/1819389/1559-2863-30-4-1.pdf by guest on 12 January 2022

520 Operative Dentistry
to incomplete activation of the materials by the plasmaarc curing unit, which results in lower hardness values.
The cure temperature rise of a photoactivated resincomposite is based on the total energy delivered to it(Rueggeberg, 1999; Yap & Seneviratne, 2001). The con-ventional halogen light curing unit produces 12.0 J/cm2
(600 mW/cm2 for 20 seconds), the LED produces 8.0J/cm2 (400 mW/cm2 for 20 seconds) and the plasma arcproduces 4.35 J/cm2 (1450 mW/cm2 for 3 seconds). Thedifference in energy produced by these units probablyaccounts for differences in the observed temperaturechanges.
With regard to resin composite composition, Shortalland Harrington (1998) concluded that temperature risealso relates to the light transmission characteristics ofthe resin composite. Masutami and others (1988) sug-gested that the resin exothermic reaction has a greaterinfluence on temperature rise during curing than thelight source. However, Lloyd, Joshi and Mcglynn (1986)and Strang and others (1988) reported that the majorfactor for a temperature increase during light-activatedpolymerization of resin composites is the energyabsorbed during irradiation; whereas, the exothermiccomposite polymerization process is of secondaryimportance for the temperature increase. Thesefindings support this study, where material composi-tion does not affect the temperature rise observed withall light curing units (Table 5).
CONCLUSIONS
With Filtek Z250 and Filtek Flow resin composites, itwas noted that, generally, there was no decrease inKnoop hardness as depth increased, with all photoacti-vation methods.
Comparing the photoactivation methods at all depths,there were no statistical differences (p>0.05) in KnoopHardness values between conventional halogen andlight-emitting diodes curing units.
Plasma arc curing units promoted statistically lower(p<0.05) Knoop Hardness values and temperaturechanges compared to other units.
The composite factor does not show any statistical dif-ference in temperature rises for any light curing unit(p>0.05).
The conventional halogen light curing unit producedstatistically higher temperatures (p<0.05) compared toother units.
(Received 8 April 2004)
References
Caughman WF & Rueggeberg FA (2002) Shedding new light oncomposite polymerization Operative Dentistry 27(6) 636-638.
Deb S & Sehmi H (2003) A comparative study of the properties ofdental resin composites polymerized with plasma and halogenlight Dental Materials 19(6) 517-522.
DeWald JP & Ferracane JL (1987) A comparison of four modes ofevaluating depth of cure of light-activated composites Journalof Dental Research 66(3) 727-730.
Ferracane JL (1985) Correlation between hardness and degree ofconversion during the setting reaction of unfilled dentalrestorative resins Dental Materials 16(1) 11-14.
Goodis HE, White JM, Andrews J & Watanabe LG (1989)Measurements of temperature generated by visible-light-curelamps in an in vitro model Dental Materials 5(4) 230-234.
Hannig M & Bott B (1999) In-vitro pulp chamber temperaturerise during composite resin polymerization with various light-curing sources Dental Materials 15(4) 275-281.
Hansen EK & Asmussen E (1993) Correlation between depth ofcure and temperature rise of a light-activated resinScandinavian Journal of Dental Research 101(3) 176-179.
Hofmann N, Hugo B & Klaiber B (2002) Effect of irradiation type(LED or QTH) on photo-activated composite shrinkage strainkinetics, temperature rise, and hardness European Journal ofOral Sciences 110(6) 471-479.
Knezevic A, Tarle Z, Meniga A, Sutalo J, Pichler G & Ristic M(2001) Degree of conversion and temperature rise during poly-merization of composite resin samples with blue diodesJournal of Oral Rehabilitation 28(6) 586-591.
Lisanti VF & Zander HA (1952) Thermal injury to normal dogteeth: In vivo measurements to pulp temperature increasesand their effect on the pulp tissue Journal of Dental Research31(4) 548-558.
Lloyd CH, Joshi A & Mcglynn E (1986) Temperature rises pro-duced by light sources and composites during curing DentalMaterials 2(4) 170-174.
Loney RW & Price RBT (2001) Temperature transmission ofHigh-output light-curing units through dentin OperativeDentistry 26(5) 516-520.
Masutami S, Setcos JC, Schinell RJ & Phillips RW (1988)Temperature rise during polymerization of visible light-acti-vated composite resins Dental Materials 4(4) 174-178.
McCabe JF (1985) Cure performance of light-activated-compos-ites by differential thermal analysis (DTA) Dental Materials1(6) 231-234.
McCabe JF & Wilson HJ (1980) The use of differential scanningcalorimetry for the evaluation of dental materials Journal ofOral Rehabilitation 7(3) 235-243.
Parr GR & Rueggeberg FA (2002) Spectral analysis of commer-cial LED dental curing lights Journal of Dental Research81(Special Issue) Abstract #507 p 88.
Peutzfeldt A, Sahafi A & Asmussen E (2000) Characterization ofresin composites polymerized with plasma arc curing unitsDental Materials 16(5) 330-336.
Dow
nloaded from http://m
eridian.allenpress.com/operative-dentistry/article-pdf/30/4/1/1819389/1559-2863-30-4-1.pdf by guest on 12 January 2022

521Schneider & Others: Temperature Rise and Curing Effectiveness of Photo-activation Methods
Rueggeberg F (1999) Contemporary issues in photocuringCompendium 20(25) S4-S15.
Rueggeberg FA & Craig RG (1988) Correlation of parametersused to estimate monomer conversion in a light-cured compos-ite Journal of Dental Research 67(6) 932-937.
Shortall AC & Harrington (1998) Temperature rise during poly-merization of light-activated resin composites Journal of OralRehabilitation 25(12) 908-913.
Strang R, Paterson CJW, Mclundie AC, Cummings A & SmailSRJ (1988) In vitro temperature rises produced by five poly-merizing light sources Restorative Dentistry 4(2) 33-35.
Uhl A, Mills RW & Jandt KD (2003) Polymerization and light-induced heat of dental composite cured with LED and halogentechnology Biomaterials 24(10) 1809-1820.
Yap AUJ & Seneviratne C (2001) Influence of light energy densi-ty on effectiveness of composite cure Operative Dentistry 26(5)460-466.
Zach L & Cohen G (1965) Pulp response to externally appliedheat Oral Surgery Oral Medicine Oral Pathology 19(4) 515-530.
Dow
nloaded from http://m
eridian.allenpress.com/operative-dentistry/article-pdf/30/4/1/1819389/1559-2863-30-4-1.pdf by guest on 12 January 2022

Clinical Relevance
The fluoride-releasing and neutralizing ability of resin-based materials are affected bythe nature of fluoride incorporated into materials.
Fluoride Releaseand Neutralizing Effect by
Resin-based Materials
©Operative Dentistry, 2005, 30-4, 522-527
SUMMARY
This study evaluated the fluoride-releasing andneutralizing abilities of resin-based materialscontaining fluoride in water and aqueous lacticacid. Two composites, containing a low-solubilityfluoride component (Heliomolar) and a fluoro-alumino-silicate glass (UniFil S), and twogiomers, containing surface reaction type pre-reacted glass-ionomer filler (Beautifil) and full
reaction type glass-ionomer filler (Reactmerpaste), were used. Resin-modified glass-ionomercement (Fuji II LC) was used as a control. The flu-oride release and pH value in storage medium,after immersion in each material, was measuredfor 10 weeks. For UniFil S and Beautifil, theamount of fluoride released in acid solutionmarkedly increased compared to storage inwater (p<0.05). Although all materials, exceptHeliomolar, neutralized the storage media, theneutralizing ability of these resin-based mate-rials in acid solution sharply decreased withaging of the specimens, except for Fuji II LC.These results suggest that the nature of fluorideincorporated into resin-based materials affectthe fluoride-releasing and neutralizing ability ofmaterials in water and aqueous lactic acid.
INTRODUCTION
For evaluation of the effect of fluoride-releasingrestorative materials on the potential for secondarycaries inhibition, determining the amount of fluoridereleased from the materials in distilled/deionized wateris generally investigated. However, the fluoride-releasingability of a material is affected by the nature of thestorage medium, particularly its pH value. In acid solu-tion, the amount of fluoride released is reported to besignificantly greater than in distilled/deionized water(Forss, 1993; Attin & others, 1999; Itota & others, 1999;
T Itota • OT Al-Naimi • TE CarrickM Yoshiyama • JF McCabe
*Toshiyuki Itota, DDS, PhD, research assistant, DentalMaterials Science Unit, School of Dental Sciences, University ofNewcastle upon Tyne, Newcastle upon Tyne, United Kingdom,and assistant professor, Department of Operative Dentistry,Okayama University Graduate School of Medicine andDentistry, Okayama, Japan
Omar T Al-Naimi, postgraduate student, Dental MaterialsScience Unit, School of Dental Sciences, University of Newcastleupon Tyne, Newcastle upon Tyne, United Kingdom
Thomas E Carrick, research technician supervisor, DentalMaterials Science Unit, School of Dental Sciences, University ofNewcastle upon Tyne, Newcastle upon Tyne, United Kingdom
Masahiro Yoshiyama, DDS, PhD, professor and chair,Department of Operative Dentistry, Okayama UniversityGraduate School of Medicine and Dentistry, Okayama, Japan
John F McCabe, BSc, PhD, DSc, professor, Dental MaterialsScience Unit, School of Dental Sciences, University of Newcastleupon Tyne, Newcastle upon Tyne, United Kingdom
*Reprint request: 2-5-1 Shikata-cho, Okayama 700-8525, Japan;e-mail: [email protected]
Dow
nloaded from http://m
eridian.allenpress.com/operative-dentistry/article-pdf/30/4/1/1819389/1559-2863-30-4-1.pdf by guest on 12 January 2022

523Itota & Others: Fluoride Release and Neutralization by Dental Materials
Karantakis & others, 2000; Behrend & Geurtsen, 2001;Sales & others, 2003). Since secondary caries occurs ina low pH environment around restorations, deter-mining the fluoride released from materials in acidicconditions may be important for evaluating caries inhi-bition by materials.
On the other hand, it has been reported that glass-ionomer cements (GICs) and certain resin-modifiedGICs neutralize acid solutions (Nicholson, Czarnecka &Limanowska-Shaw, 1999a; Nicholson & others; 1999b;Czarnecka, Limanowska-Shaw & Nicholson, 2002).This effect is thought to be produced by the formation ofa salt between the cement and the acid solution and thedissolution of soluble products from materials. The neu-tralizing ability of these materials, which changes thepH of the surrounding aqueous media, may contributeto the inhibition of secondary caries arising from theformation of lactic acid by bacteria.
Recently, numerous resin-based materials containinga fluoride-releasing source, normally a fluoride-richglass or pre-reacted glass-ionomer filler, have beendeveloped. Although these materials can be expected toprevent secondary caries by fluoride release (Itota &others, 2002; Yap & others, 2002; Han & others, 2002),it is not known whether they produce a greater fluoriderelease in acidic conditions and whether this also pro-duces a marked neutralizing effect. As the nature of thefluoride incorporated into resin-based materials differsin different products, this may affect the fluoride-releasing and neutralizing ability of materials.
This study evaluated the fluoride-releasing and neu-tralizing ability of resin-based materials containing flu-oride in distilled/deionized water and in lactic acid solu-tion in order to determine whether the nature of fluo-ride affects these properties. The weight changes of thematerials after immersion in storage media were alsoevaluated in order to examine whether the fluorideincorporated into the materials is disintegrated by acidsolution.
METHODS AND MATERIALS
Test Specimens
Two resin composites containing an inorganic fluoride(Heliomolar, Ivoclar Vivadent AG, Schaan,Liechtenstein) and a fluoro-alumino-silicate glass(UniFil S, GC Co, Tokyo, Japan), two giomers containingsurface reaction type pre-reacted glass-ionomer filler(Beautifil, Shofu Inc, Kyoto, Japan) and full reactiontype pre-reacted glass-ionomer filler (Reactmer paste,Shofu Inc) were used. A resin-modified GIC (Fuji II LCCapsule, GC Co) was used as a control. The compositionof these materials is given in Table 1.
Ten disk specimens of each material were preparedby a single operator. Resin-based material was placedin a Teflon mold (diameter of 10 mm, depth of 1.0 mm)mounted on a polymethylmethacrylate plate coveredwith a Melinex film (Toray, Tokyo, Japan) and com-pressed using a second plate covered with film, thenlight-cured for 40 seconds from the top and bottomsides using a visible light-curing unit (Visilux II, 3M,St Paul, MN, USA). Fuji II LC was mixed mechani-cally for 10 seconds in a Silamat device (Vivadent),placed in a mold, then light-cured for 40 seconds fromthe top and bottom sides. After setting, all specimenswere removed from the molds and stored at 37°C and100% relative humidity for 24 hours. The specimenswere then ground by hand with a dry 1200-grit siliconecarbide paper and their dimensions (diameter andthickness) and weight (W0) were measured.
Measurement of Specimen Weight, pH Value andFluoride Content of the Storage Medium
Five specimens of each material were immersed inindividual plastic containers with 5 ml distilled/deion-ized water and another five specimens were individu-ally immersed in 5 ml lactic acid solution which wasadjusted to pH 4.0. After storage at 37°C for one week,the specimens were removed from their containers,wiped with a clean dry cloth, waved in the air for 15seconds and weighed 60 seconds after removal from
Material Type Compositions Manufacturer
Heliomolar Resin composite Ytterbium trifluoride, silica filler, Bis-GMA, Ivoclar Vivadent AG,UDMA, decandiol dimethacrylate, catalyst Schaan, Liechtenstein
UniFil S Resin composite Fluoro-alumino-silicate glass, silica filler, GC Co, Tokyo, JapanUDMA, dimethacrylate, catalyst
Beautifil Giomer S-PRG, fluoro-boroalumino-silicate glass, Shofu Inc, Kyoto, JapanBis-GMA, TEGDMA, catalyst
Reactmer paste Giomer F-PRG, glass filler, UDMA, HEMA, catalyst Shofu Inc, Kyoto, Japan
Fuji II LC Capsule Resin-modified GIC Fluoro-alumino-silicate glass, polyacrylic GC Co, Tokyo, Japanacid, HEMA, TEGDMA, UDMA, water, catalyst
S-PRG=surface reaction type pre-reacted glass-ionomerF-PRG=full reaction type pre-reacted glass-ionomerBis-GMA=2,2-bis [4-(2'-hydroxy-3'-methacryloyloxy-propoxy) phenyl] propaneHEMA=2-hydroxyethyl methacrylateTEGDMA=triethylene glycol dimethacrylateUDMA=urethane dimethacrylate
Table 1. Materials Used in This Study
Dow
nloaded from http://m
eridian.allenpress.com/operative-dentistry/article-pdf/30/4/1/1819389/1559-2863-30-4-1.pdf by guest on 12 January 2022

524 Operative Dentistry
the solution (Wn). After measuring the weight, eachspecimen was placed in a new container with a fresh 5-ml aliquot of distilled/deionized water or lactic acidsolution and storage was continued.
The pH value of the storage medium after immersionof the specimen was measured using an ion meter (660pH Meter, Russell pH Ltd, Auchtermuchty, UK). ThepH values of the distilled/deionized water and lacticacid solution without a specimen were also measuredas controls.
After measurement of the pH value, 5 ml of each storagesolution and 0.5 ml of acetic buffer solution (TISAB III,Orion Research Inc, Beverly, MA, USA) were mixedand fluoride concentrations were determined using acalibrated fluoride-specific electrode (CombinationElectrode 96-09BN, Orion Research Inc) attached toan ion meter (model 720A, Orion Research Inc).
Measurements of the weight, pH and fluoriderelease were made each week for 10 weeks. Eachphase of the experiment involved replacing thestorage medium on a weekly basis as the specimenwas aged and soaked. After 10 weeks, the speci-mens were removed from the storage media andreconditioned in a desiccator at room temperatureuntil a constant desiccated weight was obtained(We). The weight changes by water sorption (Wsor)and water solubility (Wsol) were calculated and con-verted to a percentage of the initial desiccatedweight (W0) according to the following equations:Wsor = 100 x (Wn –W0)/W0 and Wsol = 100 x (W0 –We)/W0, where Wn is the sample weight after eachperiod tested.
Statistical Analysis
Data were analyzed by ANOVA and Scheffe’s test ata significance level of 0.05. Three-way ANOVA was
used to investigate the effects of material, storagemedium and aging on both fluoride release and weightchange of the specimen by sorption. Two-way ANOVAwas used to investigate the effect of material andstorage medium on weight change of the specimen bysolubility and pH value.
RESULTS
The cumulative amount of fluoride released from eachmaterial in distilled/deionized water and lactic acidsolution is given in Figure 1 and Table 2. For clarity, thedata are replotted for all materials except Fuji II LCand Heliomolar in Figure 2. All materials exceptHeliomolar showed a significantly greater amount of
Figure 1. The plots of the amount of fluoride release from all materials in dis-tilled/deionized water and lactic acid solution. Note: The storage medium (wateror lactic acid solution) was replaced weekly.
Fluoride release (µg/cm2) Wsor (%) Wsol (%)
1 Week 10 Weeks 1 Week 10 Weeks
Heliomolar Water 0.62±0.144 1.34±0.205 0.70±0.053 0.76±0.073 0.35±0.072
Acid 1.03±0.31D 1.49±0.40D 0.68±0.17C 0.60±0.04C 0.52±0.04B
UniFil S Water 3.61±0.283 7.95±0.744 0.45±0.044 0.55±0.024 0.18±0.023
Acid 12.87±0.72B 53.95±2.73B 0.45±0.08C 0.20±0.05D 0.58±0.03B
Beautifil Water 4.25±0.213 11.69±0.493 0.65±0.063 0.77±0.013 0.17±0.033
Acid 9.41±0.91C 34.54±0.91C 0.53±0.07C 0.34±0.06D 0.62±0.08B
Reactmer Water 9.70±0.572 28.48±2.092 3.22±0.142 4.97±0.091 -1.23±0.084
paste Acid 12.50±0.54B 36.37±1.61C 3.18±0.11B 4.80±0.13A -0.94±0.06C
Fuji II LC Water 27.95±1.071 138.04±2.681 3.62±0.101 3.35±0.112 2.46±0.091
Acid 31.64±2.17A 168.36±6.71A 3.47±0.16A 3.28±0.11B 2.64±0.09A
Mean values in the same column identified by the same superscript are not significantly different (p>0.05). Pairs of means linked by horizontal lines indicate no significant difference between1 week and 10 weeks values. Pairs of means linked by vertical lines indicate no significant difference between water storage and lactic acid storage.
Table 2. Cumulative Amount of Fluoride Release, Percentage Weight Changes by Water Sorption (Wsor) and Water Solubility
(Wsol) of Each Material in Distilled/Deionized Water and Lactic Acid Solution
Dow
nloaded from http://m
eridian.allenpress.com/operative-dentistry/article-pdf/30/4/1/1819389/1559-2863-30-4-1.pdf by guest on 12 January 2022
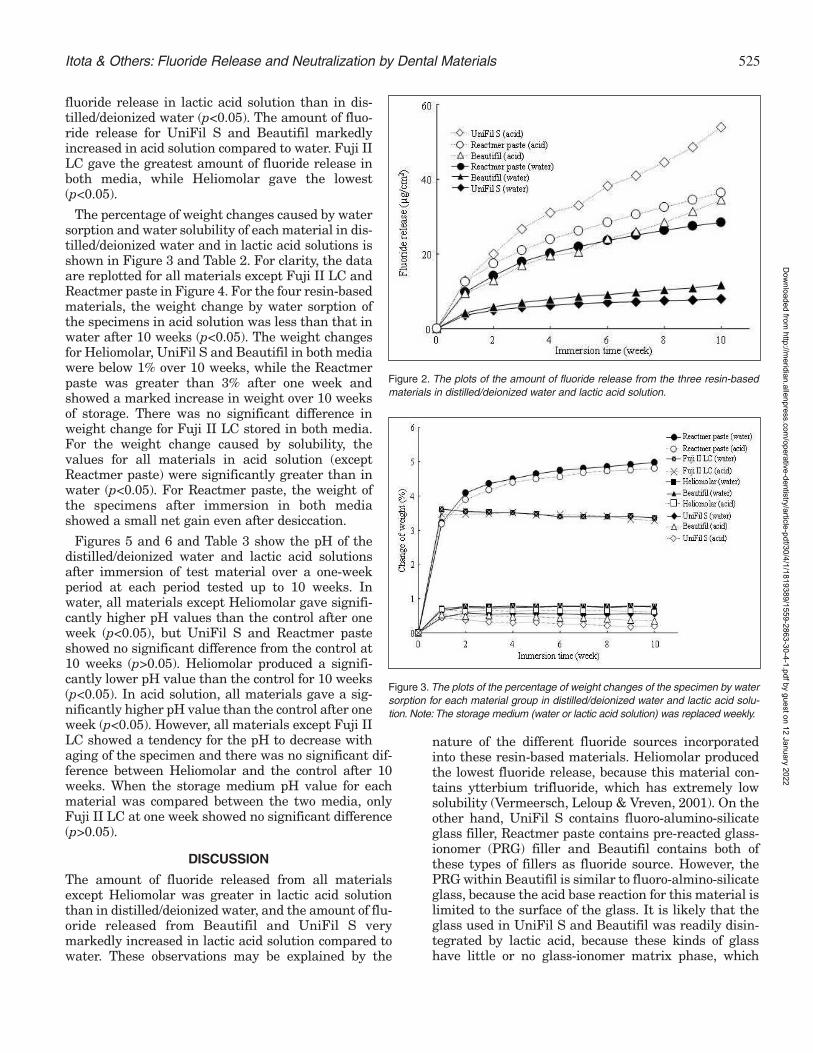
525Itota & Others: Fluoride Release and Neutralization by Dental Materials
fluoride release in lactic acid solution than in dis-tilled/deionized water (p<0.05). The amount of fluo-ride release for UniFil S and Beautifil markedlyincreased in acid solution compared to water. Fuji IILC gave the greatest amount of fluoride release inboth media, while Heliomolar gave the lowest(p<0.05).
The percentage of weight changes caused by watersorption and water solubility of each material in dis-tilled/deionized water and in lactic acid solutions isshown in Figure 3 and Table 2. For clarity, the dataare replotted for all materials except Fuji II LC andReactmer paste in Figure 4. For the four resin-basedmaterials, the weight change by water sorption ofthe specimens in acid solution was less than that inwater after 10 weeks (p<0.05). The weight changesfor Heliomolar, UniFil S and Beautifil in both mediawere below 1% over 10 weeks, while the Reactmerpaste was greater than 3% after one week andshowed a marked increase in weight over 10 weeksof storage. There was no significant difference inweight change for Fuji II LC stored in both media.For the weight change caused by solubility, thevalues for all materials in acid solution (exceptReactmer paste) were significantly greater than inwater (p<0.05). For Reactmer paste, the weight ofthe specimens after immersion in both mediashowed a small net gain even after desiccation.
Figures 5 and 6 and Table 3 show the pH of thedistilled/deionized water and lactic acid solutionsafter immersion of test material over a one-weekperiod at each period tested up to 10 weeks. Inwater, all materials except Heliomolar gave signifi-cantly higher pH values than the control after oneweek (p<0.05), but UniFil S and Reactmer pasteshowed no significant difference from the control at10 weeks (p>0.05). Heliomolar produced a signifi-cantly lower pH value than the control for 10 weeks(p<0.05). In acid solution, all materials gave a sig-nificantly higher pH value than the control after oneweek (p<0.05). However, all materials except Fuji IILC showed a tendency for the pH to decrease withaging of the specimen and there was no significant dif-ference between Heliomolar and the control after 10weeks. When the storage medium pH value for eachmaterial was compared between the two media, onlyFuji II LC at one week showed no significant difference(p>0.05).
DISCUSSION
The amount of fluoride released from all materialsexcept Heliomolar was greater in lactic acid solutionthan in distilled/deionized water, and the amount of flu-oride released from Beautifil and UniFil S verymarkedly increased in lactic acid solution compared towater. These observations may be explained by the
nature of the different fluoride sources incorporatedinto these resin-based materials. Heliomolar producedthe lowest fluoride release, because this material con-tains ytterbium trifluoride, which has extremely lowsolubility (Vermeersch, Leloup & Vreven, 2001). On theother hand, UniFil S contains fluoro-alumino-silicateglass filler, Reactmer paste contains pre-reacted glass-ionomer (PRG) filler and Beautifil contains both ofthese types of fillers as fluoride source. However, thePRG within Beautifil is similar to fluoro-almino-silicateglass, because the acid base reaction for this material islimited to the surface of the glass. It is likely that theglass used in UniFil S and Beautifil was readily disin-tegrated by lactic acid, because these kinds of glasshave little or no glass-ionomer matrix phase, which
Figure 2. The plots of the amount of fluoride release from the three resin-basedmaterials in distilled/deionized water and lactic acid solution.
Figure 3. The plots of the percentage of weight changes of the specimen by watersorption for each material group in distilled/deionized water and lactic acid solu-tion. Note: The storage medium (water or lactic acid solution) was replaced weekly.
Dow
nloaded from http://m
eridian.allenpress.com/operative-dentistry/article-pdf/30/4/1/1819389/1559-2863-30-4-1.pdf by guest on 12 January 2022

526 Operative Dentistry
could account for the high fluoride release in acid con-ditions. The lower water sorption and higher water sol-ubility of UniFil S and Beautifil in acid solution com-pared to that in water suggests that the weight loss wasdue to erosion and disintegration of the glass filler. Inaddition, a glass-ionomer matrix, which is easily pene-trated by water, may be formed on the surfaces of theglass particles by reaction of the glass with lactic acid,and this may result in a significantly greater fluoriderelease from these materials. On the other hand, thePRG filler within Reactmer paste, in which the glass isfully consumed and converted to a hydrogel matrix,might be more resistant to acid attack and can suppressthe surface reaction in lactic acid solution (Sales &others, 2003). The weight of Reactmer paste in thisstudy showed a small net gain even after desiccation.This finding agrees with a previous report that
Reactmer paste showedgreater expansion and a gainin weight after desiccationfor two weeks (McCabe &Rusby, 2004). As it is not like-ly that the water absorbed inReactmer paste is tightlybound to the resin matrix,this gain might be caused byan insufficient desiccation ofthe specimen of Reactmerpaste.
As for the neutralizing abil-ity of these materials, farfrom neutralizing the stor-age medium, Heliomolardecreased the pH value ofdistilled/deionized water.The unpolymerizedmonomer released fromHeliomolar may be respon-
Figure 4. The plots of the percentage of weight changes of the specimenby water sorption for the three resin-based material groups indistilled/deionized water and lactic acid solution.
Figure 5. The plots of the pH value of each material group indistilled/deionized water for 10 weeks. Note: Distilled/deionized waterwas replaced weekly.
Figure 6. The plots of the pH value of each material group in lactic acidsolution for 10 weeks. Note: Lactic acid solution was replaced weekly.
pH value
1 week 10 weeks
Heliomolar Water 5.03±0.145 5.16±0.104
Acid 4.40±0.16D 4.08±0.09D
UniFil S Water 5.86±0.053 5.44±0.033
Acid 5.54±0.04C 4.80±0.04B
Beautifil Water 6.52±0.041 5.89±0.031
Acid 6.06±0.03A 4.87±0.02B
Reactmer paste Water 5.93±0.092,3 5.64±0.042
Acid 5.80±0.04B 4.25±0.02C
Fuji II LC Water 6.12±0.102 5.90±0.041
Acid 6.16±0.03A 5.72±0.02A
Control Water 5.51±0.084 5.53±0.052,3
Acid 4.15±0.04E 4.03±0.05D
Mean values in the same column identified by the same superscript are not significantly different (p>0.05). Pairs of means linked byvertical lines indicate no significant difference between water storage and lactic acid storage.
Table 3. Value of pH of the Distilled/Deionized Water and Lactic Acid Solution After Immersion of Each Material
Dow
nloaded from http://m
eridian.allenpress.com/operative-dentistry/article-pdf/30/4/1/1819389/1559-2863-30-4-1.pdf by guest on 12 January 2022

527Itota & Others: Fluoride Release and Neutralization by Dental Materials
sible for decreasing the pH value of water, because it isknown that the dissolution of ytterbium trifluoridecauses no reduction in pH value of the storage medium(Young & others, 1996). Although all materials exceptHeliomolar, showed a greater neutralizing effect in acidsolution at the initial period, the neutralizing ability ofmaterials, except Fuji II LC, became weaker with agingof the specimens. Fuji II LC was the only material thatretained a pH value of greater than 5.5 in acid solutionafter 10 weeks. The neutralizing effect in acid solutionis an important property of the materials for secondarycaries inhibition, because the organic acid which is pro-duced by oral bacteria may be neutralized (Nicholson &others, 1999b). Stephan (1940) concluded that cariesresults from prolonged exposure to a pH below the crit-ical value of 5.5. These results may suggest that glass-ionomer cements provide a caries-inhibitory effect notonly by fluoride release but also through an acid neu-tralizing ability. Although some resin-based materialsproduced a neutralizing effect in acidic storage media,it is desirable that these materials should promote aneven more rapid neutralization of the acid solution forcaries inhibition.
CONCLUSIONS
In conclusion, resin-based materials containing fluori-dated glass filler showed a greater fluoride release andmore marked neutralizing effect in lactic acid solutioncompared to a material containing ytterbium trifluoride.However, a resin-modified GIC showed significantlygreater fluoride release and neutralizing effect in acidsolution compared to resin-based materials containingfluoride. Further investigations will be necessary toclarify the effect of fluoride incorporated into resin-basedmaterials on secondary caries inhibition.
(Received 16 April 2004)
References
Attin T, Buchalla W, Siewert C & Hellwig E (1999) Fluoriderelease/uptake of polyacid-modified resin composites (com-pomers) in neutral and acidic buffer solutions Journal of OralRehabilitation 26(5) 388-393.
Behrend B & Geurtsen W (2001) Long-term effects of four extrac-tion media on the fluoride release from four polyacid-modifiedcomposite resins (compomers) and one resin-modified glass-ionomer cement Journal of Biomedical Materials Research58(6) 631-637.
Czarnecka B, Limanowska-Shaw H & Nicholson JW (2002)Buffering and ion-release by a glass-ionomer cement undernear-neutral and acidic conditions Biomaterials 23(13) 2783-2788.
Forss H (1993) Release of fluoride and other elements from light-cured glass ionomers in neutral and acidic conditions Journalof Dental Research 72(8) 1257-1262.
Han L, Cv E, Li M, Niwano K, Ab N, Okamoto A, Honda N &Iwaku M (2002) Effect of fluoride mouth rinse on fluoridereleasing and recharging from aesthetic dental materialsDental Materials Journal 21(4) 285-295.
Itota T, Okamoto M, Sato K, Nakabo S, Nagamine M, Torii Y &Inoue K (1999) Release and recharge of fluoride by restorativematerials Dental Materials Journal 18(4) 347-353.
Itota T, Nakabo S, Iwai Y, Konishi N, Nagamine M & Torii Y(2002) Inhibition of artificial secondary caries by fluoride-releasing adhesives on root dentin Journal of OralRehabilitation 29(6) 523-527.
Karantakis P, Helvatjoglou-Antoniades M, Theodoridou-Pahini S& Papadogiannis Y (2000) Fluoride release from three glassionomers, a compomer, and a composite resin in water, artifi-cial saliva, and lactic acid Operative Dentistry 25(1) 20-25.
McCabe JF & Rusby S (2004) Water absorption, dimensionalchange and radial pressure in resin matrix dental restorativematerials Biomaterials 25(18) 4001-4007.
Nicholson JW, Czarnecka B & Limanowska-Shaw H (1999a) Apreliminary study of the effect of glass-ionomer and relateddental cements on the pH of lactic acid storage solutionsBiomaterials 20(2) 155-158.
Nicholson JW, Millar BJ, Czarnecka B & Limanowska-Shaw H(1999b) Storage of polyacid-modified resin composites (“com-pomers”) in lactic acid solution Dental Materials 15(6) 413-416.
Sales D, Sae-Lee D, Matsuya S & Ana ID (2003) Short-term flu-oride and cations release from polyacid-modified composites ina distilled water, and an acidic lactate buffer Biomaterials24(10) 1687-1696.
Vermeersch G, Leloup G & Vreven J (2001) Fluoride release fromglass-ionomer cements, compomers and resin compositesJournal of Oral Rehabilitation 28(1) 26-32.
Stephan RM (1940) Changes in the hydrogen-ion concentrationon tooth surfaces and in caries lesions Journal of the AmericanDental Association 27 718-723.
Yap AU, Tham SY, Zhu LY & Lee HK (2002) Short-term fluoriderelease from various aesthetic restorative materials OperativeDentistry 27(3) 259-265.
Young A, Von Der Fehr FR, Sonju T & Nordbo H (1996) Fluoriderelease and uptake in vitro from a composite resin and twoorthodontic adhesives Acta Odontologoca Scandinavica 54(4)223-228.
Dow
nloaded from http://m
eridian.allenpress.com/operative-dentistry/article-pdf/30/4/1/1819389/1559-2863-30-4-1.pdf by guest on 12 January 2022

Clinical Relevance
Handpieces, which do not require the user to lubricate them, are available. Neitherthese handpieces, nor the use of more traditional lubricated handpieces, adverselyaffect the bond strength of current types of bonding agents.
©Operative Dentistry, 2005, 30-4, 528-532
SUMMARY
This study evaluated the effect of dental hand-piece lubricant on the shear bond strength ofthree bonding agents to dentin. A lubrication-free handpiece (one that does not require theuser to lubricate it) and a handpiece requiringroutine lubrication were used in the study. Inaddition, two different handpiece lubricationmethods (automated versus manual application)were also investigated. One hundred and eightyextracted human teeth were ground to exposeflat dentin surfaces that were then finished withwet silicon carbide paper. The teeth were ran-domly divided into 18 groups (n=10). The dentin
surface of each specimen was exposed for 30 sec-onds to water spray from either a lubrication-free handpiece or a lubricated handpiece. Priorto exposure, various lubrication regimens wereused on the handpieces that required lubrica-tion. The dentin surfaces were then treated withtotal-etch, two-step; a self-etch, two-step or a self-etch, one-step bonding agent. Resin compositecylinders were bonded to dentin, the specimenswere then thermocycled and tested to failure inshear at seven days. Mean bond strength datawere analyzed using Dunnett’s multiple compar-ison test at an 0.05 level of significance. Resultsindicated that within each of the bonding agents,there were no significant differences in bondstrength between the control group and thetreatment groups regardless of the type of hand-piece or use of routine lubrication.
INTRODUCTION
Dentin bonding has undergone many changes in recentyears and continues to evolve. New products and, per-haps more importantly, new techniques for their clin-ical application, are routinely introduced to the profes-sion. Despite these changes, bonding remains rela-tively technique-sensitive, and bond strength can be
Effect ofHandpiece Maintenance Method
on Bond Strength
HW Roberts • KS VandewalleDG Charlton • DL Leonard
*Howard W Roberts, DMD, Fellow, Dental GraduateBiomaterials, Marquette University, Milwaukee WI, USA
Kraig S Vandewalle, DDS, MS, USAF Dental InvestigationService, Great Lakes, IL, USA
David G Charlton, DDS, MSD, Naval Institute for Dental andBiomedical Research, Det 1 USAFSAM, Great Lakes, IL, USA
Daniel L Leonard, DDS, Children’s Dental Health Program,Mission St Joseph’s Hospital, Asheville, NC, USA
*Reprint request: 310C B Street, Building 1H, Great Lakes IL,60088, USA; e-mail: [email protected]
Dow
nloaded from http://m
eridian.allenpress.com/operative-dentistry/article-pdf/30/4/1/1819389/1559-2863-30-4-1.pdf by guest on 12 January 2022

529Roberts & Others: Effect of Handpiece Maintenance Method on Bond Strength
affected by many factors, including improper technique(Chan & others, 2003; Peutzfeldt & Asmussen, 2002;Van Meerbeek & others, 2003), inadequate preparationor contamination of the bonding surface substrate(Johnson & others, 1994).
The effect on bond strength of dentin contaminationhas been previously investigated (el-Kalla & García-Godoy, 1997; Hiraishi & others, 2003; Hitmi, Attal &Degrange, 1999; Johnson & others, 1994; Kaneshima &others, 2000; Sung & others, 2002). Contaminants thathave been studied include saliva, blood, plasma, dentalcements, caries-detecting dyes and irrigating solutions.The effects have varied depending on the contaminantand when the contamination occurred during thebonding process.
It has been anecdotally suggested that contaminationwith lubrication oils used for maintaining dental air-turbine handpieces may adversely affect bond strength(Christensen, 1999). Residual lubricants retained in thehandpiece can be displaced from the handpiece onto thetooth surface during operative procedures. It is thesecontaminants that some researchers believe mayreduce bond strength if not properly removed.Lubrication-free air-turbine handpieces (those that donot require the user to lubricate them) are commer-cially available. However, these handpieces should notbe interpreted as being devoid of lubrication, for theirbearings are lubricated at the factory and bearing lubri-cant is released over time. Therefore, lubrication-freehandpieces still have the potential to release somelubrication oils during use.
A number of studies have examined the effect of con-tamination from handpiece lubrication oils on enameland/or dentin bond strengths (Knight, Draughn &Evans, 1999; Powers, Finger & Xie, 1995; Rosa & oth-ers, 2000; Xie, Powers & McGuckin, 1993), but theresults have been equivocal. None of these studies usedthe most recently developed bonding agents. This inves-tigation determined the effect of handpiece lubricantand the method of applying it to handpieces on dentinshear bond strength when using a total-etch, two-step;a self-etch, two-step and a self-etch, one-step dentinbonding system.
METHODS AND MATERIALS
One hundred and eighty non-carious recently extractedhuman third molars stored in a Chloramine-T solutionwere used in this study. The occlusal surfaces of theteeth were removed by sectioning with a water-cooleddiamond saw (Buehler, Lake Bluff, IL, USA) to pre-pare flat dentin surfaces. Each tooth was mounted inautopolymerizing acrylic resin (Tray Resin,Dentsply/Caulk, Milford, DE, USA) using cylindricalpolytetrafluoroethylene molds, placing the prepareddentin surface approximately 2 mm above the end of
the resin cylinder. After the resin had polymerized, thedentin surface was hand finished with wet 400- and600-grit silicon carbide abrasive papers and examinedat 8x magnification using a stereomicroscope (ZeissStemi SR, Carl Zeiss Inc, Thornwood, NY, USA) toensure that all enamel had been removed from thebonding area. The teeth were randomly divided into 18treatment groups of 10 teeth each. The prepared teethwere stored at room temperature in distilled waterprior to bonding.
Two dental air-turbine handpieces with differentmaintenance requirements were used. The Star 430SWL (DentalEz Group, Lancaster, PA, USA) does notrequire routine lubrication by the end-user, because ithas factory pre-lubricated bearings. The W&H 98L(W&H DentalWerk, Bürmoos, Austria) requires lubri-cation after each use; the lubricant can either beapplied manually or by using an automatic-processingstation. Only one handpiece of each type was used tohelp standardize treatments of the various groups.Both handpieces were maintained and cleaned followingmanufacturer’s recommendations. The W&H hand-piece was manually lubricated with the manufacturer’saerosol cleaner/lubricant precisely as recommended.Automatic lubrication of the W&H handpiece wasaccomplished using the Assistina Plus 301 Cleaningand Lubricating Unit (W&H DentalWerk). Because cli-nicians have anecdotally reported that air-turbinehandpieces have greater longevity if they are relubri-
Figure 1. Specimen exposure to handpiece spray.
Material Manufacturer Type of DBASingle Bond 3M ESPE Total-etch, two-step
Clearfil SE Bond Kuraray Self-etch, two-step
One-Up Bond F Tokuyama Self-etch, one-step
Table 1: Bonding Systems Used
Dow
nloaded from http://m
eridian.allenpress.com/operative-dentistry/article-pdf/30/4/1/1819389/1559-2863-30-4-1.pdf by guest on 12 January 2022

530 Operative Dentistry
cated after exposure to the rigors of steam sterilization,two additional test groups were added for the W&Hhandpiece. In these groups, in addition to the normalpre-sterilization lubrication, the handpiece was alsolubricated following sterilization. In one group, thiswas done manually, while in the other group, auto-matic lubrication was used. Between each use, thehandpieces were sterilized using a steam autoclave(model 2540EK, Tuttnauer, Ronkonkoma, NY, USA).After lubrication and prior to use, the handpieces wererun for 30 seconds at maximum speed with distilledwater coolant spray to purge the handpiece of potentialgross amounts of lubricant (Knight & others, 1999).Prepared dentin surfaces were then exposed to 30 sec-onds of water coolant spray from the handpiece oper-ating at full speed approximately 10 mm from thedentin surface. This distance was determined by insertinga #56 bur fully into the handpiece chuck, as would bedone clinically (Figure 1). After exposure to the treat-ment method, the dentin surface was rinsed and blottedwith cotton gauze, leaving the dentin slightly moist.Table 1 lists the bonding products used in this study.
The manufacturer’s directions for applying eachdentin bonding agent (DBA) were followed. For photo-polymerization, a halogen-based Optilux 501 visible-light curing unit (Sybron Dental Specialties, Orange,CA, USA) was used. The adequacy of its irradiancelevel was measured using a laboratory-grade laserpower meter (Molectron Power Max 500D with PM10probe, Coherent Molectron, Portland, OR, USA) andwas found to be approximately 1000 mW/cm2. Afterapplication of the bonding agent, Z100 resin composite(3M ESPE, St Paul, MN, USA) was placed onto thetreated dentin surface using a 4-mm high split polyte-trafluoroethylene mold held in place by a positioningring. The resin was placed in 2-mm increments andeach increment was photo-polymerized for 40 seconds.After polymerization of the final increment of resincomposite, the positioning ring and mold were removedand the specimens stored in 37°C distilled water. Forty-eight hours after preparation, the specimens were ther-mocycled for 500 cycles between 5°C and 55°C in dis-tilled-water baths with a dwell time of 30 seconds for
each bath and a transfer time of 10 seconds. Seven daysafter bonding, the specimens were tested to failure inshear at a crosshead speed of 0.5 mm/minute using aperforated steel ring attached by a chain to a universaltesting machine (Series 1000, Tinius Olsen, WillowGrove, PA, USA). The dentin treatment groups towhich each of the bonding agents was applied are listedin Table 2. The primary scientific issue of interest wasthe evaluation of differences between the control groupand each of the treatment groups for each of the threebonding agent classes. These planned (a priori) con-trasts were evaluated using Dunnett’s tests at an 0.05level of significance.
The debonded surfaces were examined using a stere-omicroscope at 8x to determine the failure mode.Failures were classified as Adhesive, Cohesive or Mixedand were defined as follows: Adhesive failures werethose that occurred at the resin composite/dentin inter-face; Cohesive failures occurred within the resin com-posite and/or dentin interface and Mixed failures werea combination of Adhesive and Cohesive ones.
RESULTS
Mean bond strength results for the bonding agents areshown in Tables 3, 4 and 5. For the total-etch, two-stepbonding agent (Single Bond), there were no significantdifferences in bond strength between the control andthe treatment groups. For a majority of the groups,most failures were cohesive in nature. Similarly, no sig-nificant differences in bond strength were noted for theself-etch, two-step product (Clearfil SE Bond). A majorityof the failures in most groups, however, were mixed.For the self-etch, one-step bonding agent (One-Up BondF), although there were more adhesive failures and atrend towards lower bond strengths when manuallubrication was used, none of the groups’ mean bondstrength values differed significantly from the controlgroup.
DISCUSSION
Demands by the dental professional for dentin bondingagents that are easier to use and faster to apply have
Group Lubrication Regimen
Control No exposure of dentin to handpiece
Star Exposure of dentin to Star handpiece
W&H auto pre- Exposure of dentin to W&H handpiece: automated lubrication of handpiece(manufacturer recommended) before autoclaving
W&H man pre- Exposure of dentin to W&H handpiece: manual lubrication of handpiece before(manufacturer recommended) autoclaving
W&H auto pre-/post Exposure of dentin to W&H handpiece: automated lubrication of handpiece before and after autoclaving
W&H man pre-/post Exposure of dentin to W&H handpiece: manual lubrication of handpiece before and after autoclaving
Table 2: Description of Dentin Treatment Prior to Bonding
Dow
nloaded from http://m
eridian.allenpress.com/operative-dentistry/article-pdf/30/4/1/1819389/1559-2863-30-4-1.pdf by guest on 12 January 2022

531Roberts & Others: Effect of Handpiece Maintenance Method on Bond Strength
resulted in the develop-ment of self-etching andself-priming products.These products usuallyinvolve fewer applicationsteps and are, therefore,simpler to use and requireless chair time than tradi-tional total-etch three-step bonding agents.Total-etch three-step andsome of the simplifiedbonding agents have beenshown to provide goodclinical service (VanMeerbeek & others, 2003).The most recently mar-keted bonding productsuse an even simpler appli-cation technique than ear-lier ones. The procedureinvolves application of asingle solution that etch-es, primes and bonds inone step. These newerbonding agents, however,do not appear to performas well in laboratory bondstrength tests (VanMeerbeek & others, 2003).
The effect on the bondstrength of these newproducts to dentin thathas been contaminatedwith handpiece lubrica-tion oils has not been eval-uated. Theoretically, total-etch procedures shouldremove any minuteamounts of handpiecelubricant from the toothsubstrate surfaces. Self-etching bonding agentsshould also possess theinherent acidity requiredto degrade lubrication con-taminants. However, incontrast to total-etch prod-ucts, where the etchant isrinsed from the tooth sur-face following use, self-etching products employ anetchant that is not removed by rinsing following use. Asa result, there is the potential for lubricants to remainon the dentin surface despite application of the etchant.It is possible that the contaminants will interfere withthe basic process of mechanical interlocking between
bonding agent and dentin that is responsible foradhesion.
Previous studies that have examined the effect ofhandpiece oil contamination on shear bond strength todentin have produced equivocal results. In one study,contamination resulted in a significant decrease for one
Group Mean ± st dev Failure ModesA C M
Control 26.5 ± 5.7 0 9 1
Star 26.0 ± 3.1 0 9 1
W&H auto pre- 24.8 ± 3.9 0 10 0(manufacturer recommended)
W&H man pre- 26.9 ± 6.0 0 6 4(manufacturer recommended)
W&H auto pre-/post 25.5 ± 3.6 0 5 5
W&H man pre-/post 27.9 ± 5.0 0 5 5
n = 10A = Adhesive failure at the resin composite/dentin interfaceC = Cohesive failure within the resin composite and/or dentinM = Combination of adhesive and cohesive failuresNo significant differences were found between the control group and each individual experimental group.
Table 3: Mean Shear Bond Strengths for Single Bond (MPa)
Group Mean ± st dev Failure ModesA C M
Control 25.0 ± 5.3 0 1 9
Star 24.0 ± 5.6 1 3 6
W&H auto pre- 20.5 ± 7.0 3 0 7(manufacturer recommended)
W&H man pre- 21.3 ± 4.8 3 1 6(manufacturer recommended)
W&H auto pre-/post 25.6 ± 4.1 0 8 2
W&H man pre-/post 23.8 ± 4.6 1 1 8
n = 10A = Adhesive failure at the resin composite/dentin interfaceC = Cohesive failure within the resin composite and/or dentinM = Combination of adhesive and cohesive failuresNo significant differences were found between the control group and each individual experimental group.
Table 4: Mean Shear Bond Strengths for Clearfil SE Bond (MPa)
Group Mean ± st dev Failure ModesA C M
Control 14.5 ± 4.0 8 1 1
Star 17.0 ± 4.4 0 0 10
W&H auto pre- 19.3 ± 5.9 3 0 7(manufacturer recommended)
W&H man pre- 14.0 ± 4.9 5 0 5(manufacturer recommended)
W&H auto pre-/post 19.6 ± 3.8 1 3 6
W&H man pre-/post 10.0 ± 5.2 8 0 2
n = 10A = Adhesive failure at the resin composite/dentin interfaceC = Cohesive failure within the resin composite and/or dentinM = Combination of adhesive and cohesive failuresNo significant differences were found between the control group and each individual experimental group.
Table 5: Mean Shear Bond Strengths for One-Up Bond F (MPa)
Dow
nloaded from http://m
eridian.allenpress.com/operative-dentistry/article-pdf/30/4/1/1819389/1559-2863-30-4-1.pdf by guest on 12 January 2022

532 Operative Dentistry
bonding agent but a slight increase for another (Xie &others, 1993). In a second study, contamination causeda significant decrease in bond strength (Powers & oth-ers, 1995). The current study found that none of thetested bonding agents exhibited a significant differencein bond strength between the control and the experi-mental groups. For the self-etch, one-step bondingagent (One-Up Bond F), there were more adhesive fail-ures and a trend toward lower bond strength valueswhen manual lubrication was used, but again the dif-ferences were not significant. These results should bereassuring for clinicians, because it indicates that theyneed not be concerned about the influence of residualhandpiece lubricant on dentin bond strength. However,because bonding remains a technique-sensitive proce-dure, proper isolation of the treated teeth and meticu-lous adherence to manufacturers’ instructions shouldbe followed. Future research should investigate theeffect of oil contamination on the dentin bond strengthof a larger number of product brands within eachbonding agent class.
CONCLUSIONS
Under the conditions of this study, the handpiece main-tenance method did not produce a significant differencein bond strength when using a total-etch, two-step; aself-etch, two-step or a self-etch one-step dentin bondingagent.
Disclaimer
The opinions expressed in this paper are those of the authors anddo not represent the official opinion of the United States AirForce, the United States Navy, the Department of Defense or theUnited States Government. The use of specific products in thisstudy does not imply their endorsement.
(Received 20 April 2004)
References
Chan KM, Tay FR, King NM, Imazato S & Pashley DH (2003)Bonding of mild self-etching primers/adhesives to dentin withthick smear layers American Journal of Dentistry 16(5) 340-346.
Christensen G (1999) The high-speed handpiece dilemmaJournal of the American Dental Association 130(10) 1494-1496.
el-Kalla IH & García-Godoy F (1997) Saliva contamination andbond strength of single-bottle adhesives to enamel and dentinAmerican Journal of Dentistry 10(2) 83-87.
Hiraishi N, Kitasako Y, Nikaido T, Nomura S, Burrow MF &Tagami J (2003) Effect of artificial saliva contamination on pHvalue change and dentin bond strength Dental Materials 19(5)429-434.
Hitmi L, Attal JP & Degrange M (1999) Influence of the time-point of salivary contamination on dentin shear bond strengthof 3 dentin adhesive systems Journal of Adhesive Dentistry1(3) 219-232.
Johnson ME, Burgess JO, Hermesch CB & Buikema DJ (1994)Saliva contamination of dentin bonding agents OperativeDentistry 19(6) 205-210.
Kaneshima T, Yatani H, Kasai T, Watanabe EK & Yamashita A(2000) The influence of blood contamination on bond strengthsbetween dentin and an adhesive resin cement OperativeDentistry 25(3) 195-201.
Knight JS, Draughn R & Evans MD (1999) Effects of handpiecelubrication on resin-based composite bond strength to enamelAmerican Journal of Dentistry 12(3) 116-118.
Peutzfeldt A & Asmussen E (2002) Adhesive systems: Effect onbond strength of incorrect use Journal of Adhesive Dentistry4(3) 233-242.
Powers JM, Finger WJ & Xie J (1995) Bonding of composite resinto contaminated human enamel and dentin Journal ofProsthodontics 4(1) 28-32.
Rosa BT, Heymann HO, Swift EJ Jr, Perdigão J & Ritter AV(2000) Shear bond strengths of one-bottle adhesives to oil-con-taminated enamel Operative Dentistry 12(3) 139-145.
Sung EC, Tai ET, Chen T & Caputo AA (2002) Effect of irrigationsolutions on dentin bonding agents and restorative shear bondstrength Journal of Prosthetic Dentistry 87(6) 628-632.
Van Meerbeek B, De Munck J, Yoshida Y, Inoue S, Vargas M,Vijay P, Van Landuyt K, Lambrechts P & Vanherle G (2003)Adhesion to enamel and dentin: Current status and futurechallenges Operative Dentistry 28(3) 215-235.
Xie J, Powers JM & McGuckin RS (1993) In vitro bond strengthof two adhesives to enamel and dentin under normal and con-taminated conditions Dental Materials 9(5) 295-299.
Dow
nloaded from http://m
eridian.allenpress.com/operative-dentistry/article-pdf/30/4/1/1819389/1559-2863-30-4-1.pdf by guest on 12 January 2022

©Operative Dentistry, 2005, 30-4, 533-539
SUMMARY
This study evaluated the influence of 5.25%NaOCl irrigant and root canal sealers on postretention in different dentin regions. Seventy-two human incisors were decoronated at thecemento-enamel junction and randomly dividedinto six groups (n=12) according to irrigant andsealer technique: G1-Distilled water (DW) with-out sealer; G2-DW + AH Plus (Dentsply/Maillefer);G3-DW + Endofill (Dentsply/Maillefer); G4-5.25%NaOCl without sealer; G5-5.25% NaOCl +AH Plus; G6-5.25% NaOCl + Endofill. Specimenswere stored in a humid environment for 30 daysat 37°C and were prepared with FRC Postec’sdrills for post insertion. The posts were cementedwith Excite DSC/Variolink II (Ivoclar/ Vivadent).The specimens were sectioned through theirlong axis into three dental slices approximately2.5 mm each, representing the cervical (C), mid-
dle (M) and apical (A) thirds of the root prepara-tion. After calculating the adhered area of thespecimens, they were submitted to the push-outtest in a universal testing machine. The datawere submitted to an analysis of variance(ANOVA) at a 5% significance level and to theTukey test (p<0.05). The mean values (MPa)obtained for cervical, middle and apical areas ofthe root preparation, respectively, were: G1=8.6;12.5 and 14.3, G2=13.5; 15.4 and 16.9; G3=6.9; 10.0and 12.1; G4=13.0; 14.9 and 15.4; G5=11.3; 13.5 and18.0; and G6=11.0; 11.8 and 11.5. Based on theresults, the eugenol-based sealer (Endofill)resulted in significantly lower mean retentionstrength values compared with the resin-basedsealer (AH Plus). The apical region showed thegreatest retention. The lowest resistance to dis-lodgment was found in the cervical region,mainly in the groups that used distilled water forirrigating the root canal.
INTRODUCTION
The use of pre-fabricated fiber posts adhesively cementedcan potentially reduce the incidence of root fractures(Ferrari & others, 2000c). This is mainly because theelasticity modulus of fiber posts is closer to dentin than
The Influence ofSodium Hypochlorite
and Root Canal Sealerson Post Retention
in Different Dentin Regions
L Muniz • P Mathias
Clinical Relevance
The irrigant solution and endodontic cement used for root canal treatment can signifi-cantly affect post retention when the posts are luted with dual-cured composite cement.
Leonardo Muniz, DDS, MS, Dentistry at FOUFBA, Salvador,Bahia, Brazil
*Paula Mathias, DDS, MS, ScD, Professor of the DentistryDiscipline at FOUFBA, Salvador, Bahia, Brazil
*Reprint request: Av Araújo Pinho, No 62, Zip Code 41110-150,Salvador, Bahia, Brazil; e-mail: [email protected]
Dow
nloaded from http://m
eridian.allenpress.com/operative-dentistry/article-pdf/30/4/1/1819389/1559-2863-30-4-1.pdf by guest on 12 January 2022

534 Operative Dentistry
that of metal posts (Ferrari, Vichi & Godoy,2000b; Heidecke, Butz & Strub, 2001).
In spite of the advantages, the indicationof fiber posts for teeth with a remainingcoronal structure smaller than 2 mm waslimited (Ferrari & others, 2000c), mainlydue to the difficulty of adhesion to intra-canal dentin (Patierno & others, 1996;Manocci & others, 2001). This difficultymay be related to modification of the adhe-sive substrate after endodontic procedures(Goldman, De Vitre & Pier, 1984; Schwartz,Murchison & Walker, 1998; Nikaido & oth-ers, 1999; Morris & others, 2001).
Endodontic treatment includes chemicaland mechanical preparation of the peri-canal dentin, which is the substrate forapplication of the adhesive system. Sodiumhypochlorite is the substance most used inroot canal preparation due to its antimicro-bial properties. It acts by removing organictissues and denaturing protein, including the collagenfibers in dentin (Estrela & others, 2002). It is importantto note that collagen fibers are the fundamental ele-ment for hybrid layer formation (Nakabayashi, Kojima& Masuhara, 1982). With regard to filling the rootcanal, the majority of the endodontic sealers used con-tain eugenol. These products might adversely affect theadhesion process, because residual eugenol impreg-nated in the root canal walls might interfere with thepolymerization of resin-based materials (Tjan &Nemetz, 1992; Hagge, Wong & Lindemuth, 2002).However, this effect of eugenol has been questioned(Schwartz & others, 1998; Burns & others, 2000).
Because it is difficult to directly visualize the sealerduring the adhesive procedure, especially in the middleand apical root thirds and, because of the differentregional characteristics of intracanal dentin (Ferrari &others, 2000a), it becomes necessary to assess thebehavior of adhesive systems at the various levels ofthe root. It is possible to test adhesive strength with theuse of mechanical tests that analyze specimens withreduced areas (Yoshiyama & others, 1998; Gaston &others, 2001; Ngoh & others, 2001).
This study assessed the influence 5.25% NaOCl irrig-ant solution and different endodontic sealers on theretention of fiber posts luted with a resin-based cement.
METHODS AND MATERIALS
Seventy-two human incisors with root sizes rangingbetween 14 mm and 16 mm were selected for this study.The teeth were stored in a 0.5% chloramine T solutionuntil they were used.
The specimens were cleaned and the crowns sectionedat the cemento-enamel junction (Patierno & others,
1996) using double-faced diamond disks (#7020, KGSorensen Ind, Barueri-SP, Brazil) at low speed undercooling and then discarded. After the apical foramenwas enlarged using K-files #15 to 30, the root canal wasreamed of the initial thirds with a #12 Batt drill.During these procedures, the root canal was irrigatedwith 10 mL of distilled water.
The specimens were randomly divided into groupsaccording to the factors under study (Table 1).
Endodontic Treatment
The working length was determined by viewing the tipof a #30 file and allowing a 1-mm withdrawal. All theteeth were instrumented with #35, 40, 45, 50 and 55 K-files, while 5 mL of the chemical substance under studywas used to irrigate the preparation after each instru-ment (distilled water or 5.25% NaOCl). After apicalpreparation, instrumentation of the canal was donewith #60, 70 and 80 K-files, also using 5 mL of thetested chemical substance at each change of instru-ment. Each file was used for three minutes, totaling 24minutes of chemical-mechanical preparation for eachtooth. Final irrigation was done with 5 mL of distilledwater (Morris & others, 2001) for all groups.
The prepared canals were blotted with #55(Dentsply/Maillefer, Ballagues, Switzerland, lot: 2080)paper points and obturated filled with #55 gutta-perchacones (Dentsply/Maillefer, lot: 5710) with either (1)Endofill (eugenol-based endodontic sealer), (2) AH Plus(resin-based endodontic sealer) or (3) no sealer (controlcondition), utilizing the lateral condensation tech-nique. After cutting away the excess gutta-percha, thecoronal access was sealed with temporary fillingcement (Cotosol–Vigodent S/A Ind, Rio de Janeiro–RJ,Brazil) and stored in a humid environment at 37°C for30 days.
Irrigating Solution Endodontic Sealer Regions
None CervicalMiddleApical
Distilled Water AH Plus Cervical(36 teeth) Middle
Apical
Endofill CervicalMiddleApical
None CervicalMiddleApical
5.25% NaOCl AH Plus Cervical(36 teeth) Middle
Apical
Endofill CervicalMiddleApical
Table 1: Division of the Experimental and Control Groups According to the Factors Under Study (n=12)
Dow
nloaded from http://m
eridian.allenpress.com/operative-dentistry/article-pdf/30/4/1/1819389/1559-2863-30-4-1.pdf by guest on 12 January 2022

535Muniz & Mathias: The Influence of Sealers on Post Retention in Different Dentin Regions
Root Canal Preparation for Posts and AdhesiveCementing
With #3 Gates Glidden drills, 11-mm to 12-mm of obtu-ration material was removed from inside the rootcanal, maintaining 3-mm of gutta-percha in the apicalthird of the specimen. Post preparation was done witha #3 pilot reamer and a #3 reamer (Ivoclar/Vivadent,Schaan/ Liechtenstein) (Figure 1), using 5 mL of dis-tilled water to irrigate the canal during and after mod-eling.
The fiberglass posts (FRC Postec–No 3,Ivoclar/Vivadent, lot: E94033) were tested inside thecanal (Figure 2) and sectioned with a double-faced dia-mond disk (#7020, KG Sorensen Ind) 2 mm above thespecimens’ coronal margin. The posts were cleanedwith 70% isopropyl alcohol, silanated (Monobond-S-Ivoclar/Vivadent, lot: e10084) and stored for 60 secondsin a closed receptacle. The surplus silane was removedwith a short blast of air.
The resin-based system Variolink II (Ivoclar/Vivadent) was used to cement the posts. The root canalwas etched with phosphoric acid at 37% (TotalEtch,Ivoclar/Vivadent, lot: E44932) for 15 seconds, washedfor 10 seconds and dried with paper points. A dual-cured adhesive agent (Excite DSC, Ivoclar/Vivadent,lot: E27904) was applied with an extra-fine microbrush(Ferrari, Vichi & Grandini, 2001), and after 20 seconds,the surplus was removed with absorbent paper tipswith a short blast of air to evaporate the solvent. Theprepared resin-based cement Variolink II(Ivoclar/Vivadent, lot: E14434) was placed inside theroot canal with lentulo drills (#40). The post was intro-
duced into the root canal, the surplus cement wasremoved from the coronal area and the exposed mar-gins were photopolymerized (Optilight 600, GnatusEquip Med Odont Ltda, calibrated to ±500mW/cm2) for60 seconds. The specimens were stored for 24 hours inan environment with 100% humidity and thenimmersed in distilled water at 37°C for 24 hours(Patierno & others, 1996).
Obtaining the Test Specimens and Push-out Test
The specimens were sectioned perpendicular to thelong axis with a diamond disk (Extec 1010 Extec Corp,Enfield, CT, USA) into approximately 2.5-mm slicesunder cooling (Frankenberger & others, 2000)(Figure 3).
With a digital caliper and 4x magnifying glass, theheight of the slices and their internal diameters weremeasured, greatest base and smallest base, to calculatethe adhered area of each test specimen.
The studies that use the push-out methodology triedto obtain tapered specimens to favor extrusion of theposts during mechanical testing and to reduce the dif-ficulty of calculation of the area from mathematical for-mulas for regular geometrical figures (Wakefield &others, 1998; Frankenberger & others, 2000). It is notalways possible to obtain these figures in the root canaland, although an attempt was made to standardize theshape of the canal preparation, many specimens in thisstudy presented one or two elliptic-shaped bases,making it difficult to calculate the adhered area of eachspecimen. The lateral areas of these solids were calcu-lated integrating complex mathematical functionsused to generate the figure in the tri-dimensionalspace. Calculation of the double integrations was doneusing the computer program Maple, version 5.1(Maple, Waterloo Inc, Waterloo, Canada).
The resultant area of the solid with circular base ofray R and elliptic top of axes E1 and e1 (Figure 4A) canbe expressed as:
2π1
Lateral area = ∫ ∫ ƒ(t,s)dsdt where:0 0
Figure 1. Modeling of the canalfor the pre-fabricated post.
Figure 2. Testing the post inside theroot canal and the 2-mm measure-ment of the post for cutting.
Figure 3. Root slabs representing the cervical, medium and apical thirdsof the cemented post. D
ownloaded from
http://meridian.allenpress.com
/operative-dentistry/article-pdf/30/4/1/1819389/1559-2863-30-4-1.pdf by guest on 12 January 2022

536 Operative Dentistry
f(t,s)=[Rcos(t),Rsin(t),0]+s[((e1/2)-R)cos(t),((E1/2)-R)sin(t),h]
=[R+s((e1/2)-R)]cos(t),[R+s((E1/2)–R)]sin(t),shs∈(0,1),t∈(0, 2π).
The lateral area of the solids with elliptic base and topof axes e1 and E1 and e2 and E2, respectively (Figure4B), can be expressed as:
2π1
Lateral area = ∫ ∫ g(t,s)dsdt where:0 0
g(t,s)=[(e1/2)cos(t),(E1/2)sin(t),0] + s[((e2/2)-(e1/2))cos(t),((E2/2) - (E1/2))sin(t), h]
s ∈ (0,1),t ∈ (0, 2π).
The test specimens were fixed in a device fitted to theUniversal Testing Machine (EMIC/Equipamento eSistemas de ensaio Ltda, Curitiba, Brazil). A tip 0.8-mm in diameter (Figure 5) was placed over thesmallest base of the test specimen and compressionforce was applied in an apical-coronal direction (loadcell 50 Kgf) at a speed of 0.5 mm/minute until the postpiece was dislocated (Patierno & others, 1996).
Statistical Methods
The experimental design used was a factorial Split Plotarrangement, distributing the factors irrigation solu-tion (two conditions) and sealer (three conditions) inthe main plots; as sub-plots, the factor region was con-sidered (three levels).
Statistical analysis of the data was performed usingthe analysis of variance (ANOVA) and Tukey Test atthe 5% level.
RESULTS
Statistically significant differences were found for thefactors’ irrigation solution, sealer and region. Theresults are presented in Tables 2, 3 and 4.
The analysis of the irrigation substance (Table 2)shows lower mean retention values for distilled waterin comparison with 5.25% NaOCl in the cervical third.
With regard to the endodontic sealers (Table 3), AHPlus presented greater mean retention values thanEndofill in all thirds when the irrigation substance wasdistilled water, and in the apical third when NaOClwas used. There was no statistical difference amongthe groups that used the eugenol-based sealer andthose that did not use sealer (control condition).
Analysis of the regions considering the different treat-ments (Table 4) demonstrated significant differencesbetween the apical and cervical thirds, with betterbehavior of the apical third, except when NaOCl wasused with Endofill or with the control condition. Thecomparison between the middle and cervical thirdsshows greater mean values of retention in the middle
third when distilled water was used with Endofill orwith the control condition (without sealer). When com-pared to the middle third, the apical third presentedgreater retention mean values only in association withNaOCl at 5.25% and AH Plus.
DISCUSSION
In this study, the endodontic procedure and the pro-tocol for the adhesive cementation of fiberglass postsare performed in the clinical situations, except for theuse of distilled water as an irrigating solution or forfilling the root canal without endodontic sealer (controlconditions). Contrary to this study, some studies didnot use posts to assess post retention (Gaston & oth-ers, 2001; Ngoh & others, 2001), while others used lon-gitudinal cuts of the specimens (Burns & others, 2000).The specimen cutting methodology avoids important
Figure 4A. Solid with circular base and elliptic top.
Figure 4B. Solid with elliptic base and top.
Figure 5. Application of load on a piece of post.
Dow
nloaded from http://m
eridian.allenpress.com/operative-dentistry/article-pdf/30/4/1/1819389/1559-2863-30-4-1.pdf by guest on 12 January 2022

537Muniz & Mathias: The Influence of Sealers on Post Retention in Different Dentin Regions
factors that make intracanal cementing difficult, as itfavors visualization of the space prepared for placementof the post and removal of filling sealer residues. Thismethodology also allows for a greater reach of lightduring photopolymerization and significantly reducesthe cavitary factor associated with polymerization ofthe resin-based luting materials (Bouillaguet & others,2003). In this study, the posts were cemented into theroot canal, enabling the reproduction of polymerizationshrinkage as a cavitary factor compatible with clinicalprocedures.
An analysis of Table 2 allows one to observe differ-ences between 5.25% NaOCl and distilled water only inthe cervical third, which may be explained by thegreater dentin permeability of this region (Ferrari &others, 2000a), making it more susceptible to action ofthe chemical substances used in preparing the rootcanal. Although the substance/filling sealers interactionwas not assessed in this study, analysis of the irrigationsubstance on the adhesive substrate should be assessedin the control group for the sealer since the fillingsealer comes into contact with the dentin after action ofthe irrigating substances.
The lower retention values observed for distilledwater in the cervical third of the tooth may be justifiedby the need for a mechanical preparation of the rootcanal, which determines the formation of scrapings of
dentin which are deposited into the dentin tubules(Becker & Woollard, 2001; Estrela & others, 2002).During the experimental phase, there was great diffi-culty in maintaining the patency of the canal, as dis-tilled water is not capable of dissolving organic matter,compared to 5.25% NaOCl (Guerisolli, Souza Neto &Pécora, 1998; Estrela & others, 2002). Organic tissueremaining on the teeth favors the formation of a smearlayer rich in organic components, making it difficult foracid substances to act (Yamada & others, 1983). Thus,the action of 5.25% NaOCl on the organic tissue mayhave favored better conditioning of the dentin sub-strate with phosphoric acid during adhesive proce-dures.
Distilled water is not used as an irrigating solution inendodontic treatment. It was used in this study toestablish a control, enabling assessment of the effectsof the 5.25% NaOCl treatment during endodontic pro-cedures. However, further studies should be conductedto analyze other chemical substances used in endodon-tic treatment, such as Chlorexidine, EDTA and NaOCl,itself, in other concentrations.
The analysis of the factor sealer (Table 3) did notshow statistically significant differences between thecontrol (without sealer) and Endofill. However, theretention means in the groups in which the sealer wasnot used have been shown to be greater, being close to
the critical value of signifi-cance for the middle and api-cal thirds, when 5.25%NaOCl was used as the irri-gating solution. The canalfilling without sealer doesnot represent a clinical real-ity but was used to establisha control for endodontic seal-
Substance Without Sealer
Cervical Middle Apical
Distilled Water 8.6 (± 6.2) a 12.5 (± 6.7) a 14.3 (± 4.8) a
5.25% NaOCl 13 (± 6.1) b 14.9 (± 4.6) a 15.4 (± 3) a
The comparisons are made per column, vertically. Different letters identify statistically significant differences (p<0.05/Tukey LSD=3.82).
Table 2: Means (SD) (in MPa) of Retention Values of Posts Considering the Effect of ChemicalSubstances in the Dentin Regions and in the Control Condition for the Factor Sealer
Sealer Distilled Water 5.25% NaOCl
Cervical Middle Apical Cervical Middle Apical
With no sealer 8.6 (± 6.2) a 12.5 (± 6.7) ab 14.3 (± 4.8) ab 13 (± 6.1) a 14.9 (± 4.6) a 15.4 (± 3) ab
AH Plus 13.5 (± 2.8) b 15.4 (± 3.2) b 16.9 (± 5.8) b 11.3 (± 3) a 13.5 (± 3.4) a 18 (± 3.8) b
Endofill 6.9 (± 3.5) a 10 (± 4.1) a 12.1 (± 4.4) a 11 (± 5.8) a 11.8 (± 4.8) a 11.5 (± 5.6) a
The comparisons are made per column, vertically. Different letters identify statistically significant differences (p<0.05/Tukey LSD=4.58).
Table 3: Means (SD) (in MPa) of the Post Retention Values Considering the Interaction of Endodontic Sealers with Chemical Substances and with the Dentin Regions
Region Distilled Water 5.25% NaOCl
Without Sealer AH Plus Endofill Without Sealer AH Plus Endofill
Cervical 8.6 (± 6.2) a 13.5 (±2.8) a 6.9 (± 3.5) a 13.0 (± 6.1) a 11.3 (± 3) a 11 (± 5.8) a
Middle 12.5 (± 6.7) b 15.4 (± 3.2) ab 10 (± 4.1) b 14.9 (± 4.6) a 13.5 (± 3.4) a 11.8 (± 4.8) a
Apical 14.3 (± 4.8) b 16.9 (± 5.8) b 12.1 (± 4.4) b 15.4 (± 3) a 18 (± 3.8) b 11.5 (± 5.6) a
The comparisons are made per column, vertically. Different letters identify statistically significant differences (p<0.05/Tukey LSD=2.83).
Table 4: Means (SD) (in MPa) of the Posts Retention Values Considering the Interaction of Dentin Regions with Chemical Substances and with Endodontic Sealers
Dow
nloaded from http://m
eridian.allenpress.com/operative-dentistry/article-pdf/30/4/1/1819389/1559-2863-30-4-1.pdf by guest on 12 January 2022
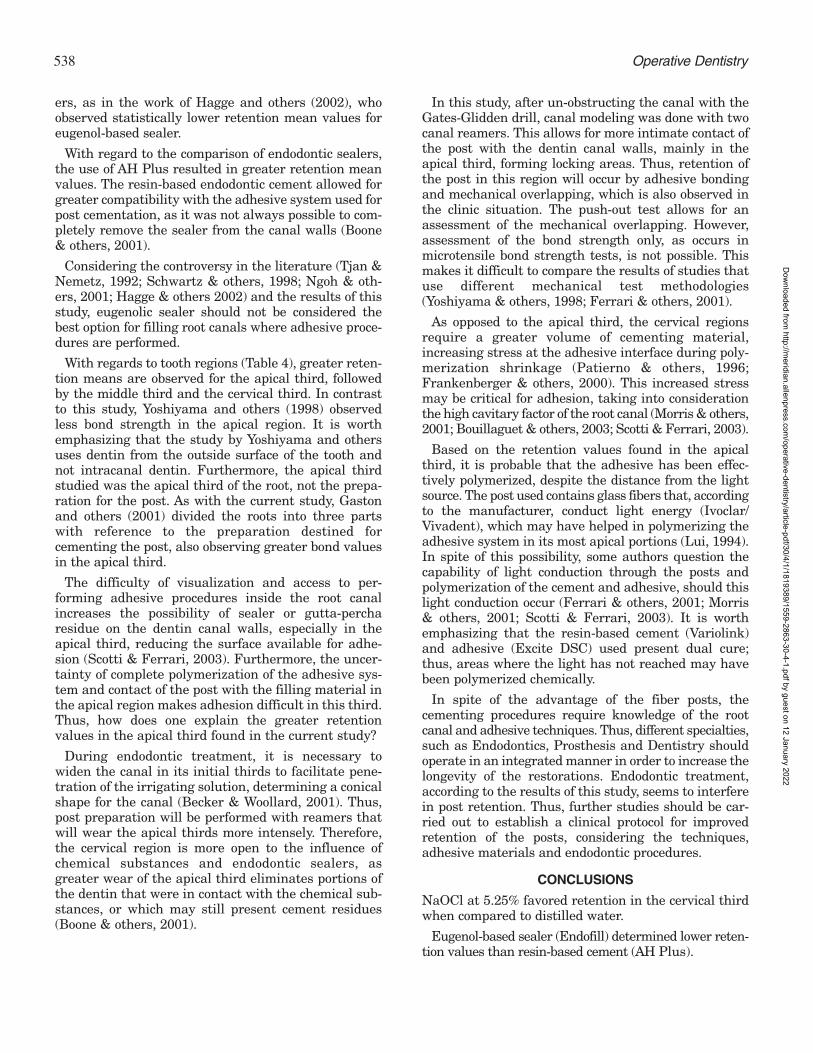
538 Operative Dentistry
ers, as in the work of Hagge and others (2002), whoobserved statistically lower retention mean values foreugenol-based sealer.
With regard to the comparison of endodontic sealers,the use of AH Plus resulted in greater retention meanvalues. The resin-based endodontic cement allowed forgreater compatibility with the adhesive system used forpost cementation, as it was not always possible to com-pletely remove the sealer from the canal walls (Boone& others, 2001).
Considering the controversy in the literature (Tjan &Nemetz, 1992; Schwartz & others, 1998; Ngoh & oth-ers, 2001; Hagge & others 2002) and the results of thisstudy, eugenolic sealer should not be considered thebest option for filling root canals where adhesive proce-dures are performed.
With regards to tooth regions (Table 4), greater reten-tion means are observed for the apical third, followedby the middle third and the cervical third. In contrastto this study, Yoshiyama and others (1998) observedless bond strength in the apical region. It is worthemphasizing that the study by Yoshiyama and othersuses dentin from the outside surface of the tooth andnot intracanal dentin. Furthermore, the apical thirdstudied was the apical third of the root, not the prepa-ration for the post. As with the current study, Gastonand others (2001) divided the roots into three partswith reference to the preparation destined forcementing the post, also observing greater bond valuesin the apical third.
The difficulty of visualization and access to per-forming adhesive procedures inside the root canalincreases the possibility of sealer or gutta-percharesidue on the dentin canal walls, especially in theapical third, reducing the surface available for adhe-sion (Scotti & Ferrari, 2003). Furthermore, the uncer-tainty of complete polymerization of the adhesive sys-tem and contact of the post with the filling material inthe apical region makes adhesion difficult in this third.Thus, how does one explain the greater retentionvalues in the apical third found in the current study?
During endodontic treatment, it is necessary towiden the canal in its initial thirds to facilitate pene-tration of the irrigating solution, determining a conicalshape for the canal (Becker & Woollard, 2001). Thus,post preparation will be performed with reamers thatwill wear the apical thirds more intensely. Therefore,the cervical region is more open to the influence ofchemical substances and endodontic sealers, asgreater wear of the apical third eliminates portions ofthe dentin that were in contact with the chemical sub-stances, or which may still present cement residues(Boone & others, 2001).
In this study, after un-obstructing the canal with theGates-Glidden drill, canal modeling was done with twocanal reamers. This allows for more intimate contact ofthe post with the dentin canal walls, mainly in theapical third, forming locking areas. Thus, retention ofthe post in this region will occur by adhesive bondingand mechanical overlapping, which is also observed inthe clinic situation. The push-out test allows for anassessment of the mechanical overlapping. However,assessment of the bond strength only, as occurs inmicrotensile bond strength tests, is not possible. Thismakes it difficult to compare the results of studies thatuse different mechanical test methodologies(Yoshiyama & others, 1998; Ferrari & others, 2001).
As opposed to the apical third, the cervical regionsrequire a greater volume of cementing material,increasing stress at the adhesive interface during poly-merization shrinkage (Patierno & others, 1996;Frankenberger & others, 2000). This increased stressmay be critical for adhesion, taking into considerationthe high cavitary factor of the root canal (Morris & others,2001; Bouillaguet & others, 2003; Scotti & Ferrari, 2003).
Based on the retention values found in the apicalthird, it is probable that the adhesive has been effec-tively polymerized, despite the distance from the lightsource. The post used contains glass fibers that, accordingto the manufacturer, conduct light energy (Ivoclar/Vivadent), which may have helped in polymerizing theadhesive system in its most apical portions (Lui, 1994).In spite of this possibility, some authors question thecapability of light conduction through the posts andpolymerization of the cement and adhesive, should thislight conduction occur (Ferrari & others, 2001; Morris& others, 2001; Scotti & Ferrari, 2003). It is worthemphasizing that the resin-based cement (Variolink)and adhesive (Excite DSC) used present dual cure;thus, areas where the light has not reached may havebeen polymerized chemically.
In spite of the advantage of the fiber posts, thecementing procedures require knowledge of the rootcanal and adhesive techniques. Thus, different specialties,such as Endodontics, Prosthesis and Dentistry shouldoperate in an integrated manner in order to increase thelongevity of the restorations. Endodontic treatment,according to the results of this study, seems to interferein post retention. Thus, further studies should be car-ried out to establish a clinical protocol for improvedretention of the posts, considering the techniques,adhesive materials and endodontic procedures.
CONCLUSIONS
NaOCl at 5.25% favored retention in the cervical thirdwhen compared to distilled water.
Eugenol-based sealer (Endofill) determined lower reten-tion values than resin-based cement (AH Plus).
Dow
nloaded from http://m
eridian.allenpress.com/operative-dentistry/article-pdf/30/4/1/1819389/1559-2863-30-4-1.pdf by guest on 12 January 2022

539Muniz & Mathias: The Influence of Sealers on Post Retention in Different Dentin Regions
The retention of root canal posts was influenced bythe dentin region of the preparation, the apical thirdbeing the most retentive.
Acknowledgements
The authors thank Professor Dr Gilênio Fernandes and DrElinalva Vergasta for the statistical analyses and compiling themathematical function for calculating the adhered area of speci-mens; Professor Dr Paulo Rocha for support during the retentiontests and Professors Drs Luiz André Pimenta, André Mallmannand Céres Fontes for their cooperation. They also thankIvoclar/Vivadent and Dentsply for donating the material.
(Received 22 April 2004)
References
Becker TD & Woollard GW (2001) Endodontic irrigation GeneralDentistry 49(3) 272-276.
Boone KJ, Murchison DF, Schindler WG & Walker WA (2001)Post retention: The effect of sequence of post-space prepara-tion, cementation time, and different sealers Journal ofEndodontics 27(12) 768-771.
Bouillaguet S, Troesch S, Wataha JC, Krejci I, Meyer J & PashleyDH (2003) Microtensile bond strength between adhesivecements and root canal dentin Dental Materials 19(3) 199-205.
Burns DR, Moon PC, Webster NP & Burns DA (2000) Effect ofendodontic sealers on dowels luted with resin cement Journalof Prosthodontics 9(3) 137-141.
Estrela C, Estrela CRA, Barbin EL, Spanó JCE, Marchesan MA& Pécora JD (2002) Mechanism of action of sodium hypochlo-rite Brazilian Dental Journal 13(2) 113-117.
Ferrari M, Manocci F, Vichi A, Cagidiaco MC & Mjör IA (2000a)Bonding to root canal: Structural characteristics of the sub-strate American Journal of Dentistry 13(5) 256-260.
Ferrari M, Vichi A & Godoy F (2000b) Clinical evaluation of fiber-reinforced epoxy resin posts and cast post and core AmericanJournal of Dentistry 13(SI) 15-18.
Ferrari M, Vichi A, Manocci F & Mason PN (2000c) Retrospectivestudy of the clinical performance of fiber post AmericanJournal of Dentistry 13(SI) 9-13.
Ferrari M, Vichi A & Grandini S (2001) Efficacy of different adhe-sive techniques on bonding to root canal walls an SEM inves-tigation Dental Materials 17(5) 422-429.
Frankenberger R, Krämer N, Oberschachtsiek H & Petschelt A(2000) Dentin bond strength and marginal adaptation afterNaOCl pre-treatment Operative Dentistry 25(1) 40-45.
Gaston BA, West LA, Liwehr FR, Fernandes C & Pashley DH(2001) Evaluation of regional bond strength of resin cement toendodontic surface Journal of Endodontics 27(5) 321-324.
Goldman M, De Vitre R & Pier M (1984) Effect of the dentinsmeared layer on tensile strength of cemented posts Journal ofProsthetic Dentistry 52(4) 485-488.
Guerisolli DMZ, Souza Neto MD & Pécora JD (1998) The effectsof sodium hypoclorite in different concentrations on the dentinstructure [Ação do hipoclorito de sódio em diversas concen-trações sobre a estrutura dentinária] Revista Odontológica daUNAERP 1(1) 7-11.
Hagge MS, Wong RDM & Lindemuth J S (2002) Effect of threeroot canal sealers on the retentive strength of endodontic postsluted with a resin cement International Endodontic Journal35(4) 372-378.
Heidecke G, Butz F & Strub JR (2001) Fracture strength and sur-vival rate of endodontically treated maxillary incisors withapproximal cavities after restoration with different post andcore systems: An in-vitro study Journal of Dentistry 29(6) 427-433.
Lui JL (1994) Depth of composite polymerization within simulat-ed root canals using light-transmitting posts OperativeDentistry 19(5) 165-168.
Manocci F, Sherriff M, Ferrari M & Watson TF (2001)Microtensile bond strength and confocal microscopy of dentaladhesives bonded to root canal dentin American Journal ofDentistry 14(4) 200-215.
Morris MD, Lee K, Agee KA, Bouillaguet S & Pashley DH (2001)Effects of sodium hypoclorite and RC-Prep on bond strengthsof resin cement to endodontic surfaces Journal of Endodontics27(12) 753-757.
Nakabayashi N, Kojima K & Masuhara E (1982) The promotionof adhesion by infiltration of monomers into tooth substratesJournal of Biomedical Materials Research 16(3) 265-273.
Ngoh EC, Pashley DH, Loushine RJ, Weller RN & KimbroughWF (2001) Effects of eugenol on resin bond strengths to rootcanal dentin Journal of Endodontics 27(6) 411-414.
Nikaido T, Tacano Y, Sasafuchi Y, Burrow MF & Tagami J (1999)Bond strength to endodontically-treated teeth AmericanJournal of Dentistry 12(4) 177-180.
Patierno JM, Rueggerberg FA, Anderson RW, Weller RN &Pashley DH (1996) Push-out strength and SEM evaluation ofresin composite bonded to internal cervical dentin Endodontics& Dental Traumatology 12(5) 227-236.
Schwartz RS, Murchison DF & Walker WA (1998) Effects ofeugenol and noneugenol endodontic sealer cements on postretention Journal of Endodontics 24(8) 564-567.
Scotti R & Ferrari M (2003) Pinos de fibra. Tradução MarcoAntônio Bottino and Luiz Felipe Valandro São Paulo ArtesMédicas p 132.
Tjan AHL & Nemetz H (1992) Effect of eugenol-containingendodontic sealer on retention of prefabricated posts lutedwith adhesive composite resin cement QuintessenceInternational 23(12) 839-844.
Wakefield CW, Draughn RA, Sneed WD & Davis TN (1998) Shearbond strengths of six bonding systems using the pushoutmethod of in vitro test Operative Dentistry 23(2) 69-76.
Yamada RS, Armas A, Goldman M & Lin PS (1983) A scanningelectron microscopic comparison of a high volume final flushwith several irrigating solutions: Part 3 Journal ofEndodontics 9(4) 137-142.
Yoshiyama M, Matsuo T, Ebisu S & Pashley D (1998) Regionalbond strength of self-etching/self-priming adhesive systemsJournal of Dentistry 26(7) 609-616.
Dow
nloaded from http://m
eridian.allenpress.com/operative-dentistry/article-pdf/30/4/1/1819389/1559-2863-30-4-1.pdf by guest on 12 January 2022
©Operative Dentistry, 2005, 30-4, 540-545
SUMMARY
This study compared the Vickers hardness of thetop and bottom surfaces of two compomers(Compoglass F and Dyract AP) polymerized for20 and 40 seconds with two different light curingsystems. Five samples for each group were pre-pared using Teflon molds (9x2 mm) and werelight-cured either with a conventional halogen
lamp (Optilux 501) or LED light (LEDemetron I)for 20 or 40 seconds. After curing, all the sampleswere stored in distilled water for 24 hours at37°C. The Vickers hardness measurements wereobtained from the top and bottom surfaces ofeach sample. ANOVA, Scheffé and t-test wereused to evaluate the statistical significance of theresults. For the top and bottom surfaces, the lightcuring systems and curing times tested showedno statistical difference, except for Optilux 501,which used 20 seconds for both compomers(p<0.05). There was no significant difference inthe microhardness of both surfaces ofCompoglass F and Dyract AP cured for either 20or 40 seconds using LEDemetron I. With Optilux501, the microhardness of samples cured for 40seconds was significantly higher than 20 seconds(p<0.05).
INTRODUCTION
Polyacid-modified resin-based composites (compomers)have been widely used since their introduction to themarket. These resin-based composites combine glasspolyalkenoate components, such as fluoro-silicate-glasses, with polymerizable resin composite, such asdimethacrylates (Geurtsen, Spahl & Leyhausen, 1998;Geurtsen, Leyhausen & Garcia-Godoy, 1999; Kwon &
Effect of Curing Time andLight Curing Systems
on the Surface Hardnessof Compomers
Z Okte • P Villalta • F Garcia-GodoyF Garcia-Godoy Jr • P Murray
Clinical Relevance
The LED light curing units used in this study can be expected to effectively polymer-ize 2-mm thick compomers in 20 seconds.
*Zeynep Okte, DDS, PhD, associate professor, Department ofPediatric Dentistry, Faculty of Dentistry, University of Ankara,Ankara, Turkey
Patricia Villalta, DDS, MS, assistant professor, BioscienceResearch Center, College of Dental Medicine, NovaSoutheastern University, Fort Lauderdale, FL, USA
Franklin Garcia-Godoy, DDS, MS, professor, associate dean forResearch, Director, Bioscience Research Center, and Director,Clinical Research Center, Nova Southeastern University, FortLauderdale, FL, USA
Franklin Garcia-Godoy Jr, research assistant, BioscienceResearch Center, College of Dental Medicine, NovaSoutheastern University, Fort Lauderdale, FL, USA
Peter Murray, PhD, assistant professor, Department ofEndodontics, College of Dental Medicine, Nova SoutheasternUniversity, Fort Lauderdale, FL, USA
*Reprint request: Besevler 06500—Ankara, Turkey; e-mail:[email protected]
Dow
nloaded from http://m
eridian.allenpress.com/operative-dentistry/article-pdf/30/4/1/1819389/1559-2863-30-4-1.pdf by guest on 12 January 2022

541
others, 2002) and have the advantages of fluoriderelease, esthetics, improved physical properties com-pared to glass-ionomer cements and ease of handlingproperties (El-Kalla & Garcia-Godoy, 1999; Kwon &others, 2002; Millar, Abiden & Nicholson, 1998). Theyare recommended for use in the restoration of primaryteeth and non-stress bearing cavities in permanentteeth (Abdalla, Alhadainy & Garcia-Godoy, 1997; Huth& others, 2003; Yap, Low & Ong, 2000).
Compomers are light polymerizable. Visible light-curing units are used to polymerize light sensitiverestorative materials. Halogen light-curing units arethe most commonly used units in dentistry. However,despite the popularity of halogen lights, they have somedisadvantages. The halogen bulb generates high heat,which degrades the bulb’s components over time (Dunn& Bush, 2002; Hammesfahr, O’Connor & Wang, 2002;Leonard & others, 2002; Mills, Jandt & Ashworth,1999), so they have a limited effective lifetime of 40 to100 hours (Soh, Yap & Siow, 2003).
More recently, blue LED (light-emitting diodes) lightcuring units have been introduced as an alternative tohalogen lights. LED light curing units may have apotential for use in dental practice, because their per-formance does not significantly reduce with time as doconventional halogen light curing units (Mills & others,1999). LEDs produce light within a narrow spectralrange and are therefore highly efficient light sources(Garcia-Godoy, Garcia-Godoy & Garcia-Godoy, 2003;Hofmann, Hugo & Klaiber, 2002; Leonard & others,2002). LEDs have a lifetime of more than 10,000 hoursand undergo little degradation of light output over time(Hammesfahr & others, 2002; Soh & others, 2003).These lights have the potential to be powered withrechargeable batteries. Another advantage is that theyproduced less heat, so there may be lower potential forgingival and pulpal irritation (Leonard & others, 2002).
Adequate polymerization of light curing materialsdepends on the light source intensity, wavelength, expo-sure duration (Leonard & others, 2002) and size, loca-tion and orientation of the tip of the source, and shade,thickness and composition of the material (Mc Cabe &Carrick, 1989).
With the new technologies, it is thought that adequateresin polymerization and improved mechanical proper-ties may be obtained in a shorter time when using highpower light curing units. Shorter curing times canreduce chair time, especially in children and whenincremental techniques are applied. The recommendedcuring time for halogen lights is 40 seconds for 2-mmthick resin. Optimal cure times for LEDs and theirability to cure all resins are not yet clear, although onestudy showed similar bottom:top curing ratios thanhalogen light (Garcia-Godoy, Garcia-Godoy & Garcia-Godoy, 2004).
Surface hardness is an indirect measure of the degreeof conversion, and important information can beobtained by comparing hardness values at the top andbottom surfaces (Dietschi, Marret & Krejci, 2003;Hofmann & others, 2002; Jandt & others, 2000; Mills &others, 1999). Many investigators have reported the topand bottom surface hardness of resin composites poly-merized with different types of light curing units(Hofmann & others, 2002; Jandt & others, 2000;Leonard & others, 2002; Mc Cabe & Carrick, 1989;Mills & others, 1999). However, there is one study(Oberholzer & others, 2003) that compares the top andbottom surface hardness of compomers polymerizedwith halogen light or LED.
This study evaluated the top and bottom surfacemicrohardness of two compomers using a conventionalvisible light or an LED light-curing unit at 20 or 40 sec-onds of polymerization time.
METHODS AND MATERIALS
The two tested compomers in this study wereCompoglass F (Ivoclar Vivadent, Schaan,Liechtenstein) and Dyract AP (Dentsply Caulk,Milford, DE, USA). Four different groups of five speci-mens each were prepared for each material. A total of40 specimens were prepared using a Teflon mold (2x9mm). A conventional halogen light-curing unit (Optilux501, Kerr Corporation, Danbury, CT, USA) and an LEDlight-curing unit (LEDemetron, Kerr Corporation)were used to polymerize the compomers. The studygroups were designed as:
Group 1: Compoglass F, polymerized withLEDemetron for 20 seconds.
Group 2: Compoglass F, polymerized withLEDemetron for 40 seconds.
Group 3: Compoglass F, polymerized with Optilux501 for 20 seconds.
Group 4: Compoglass F, polymerized with Optilux501 for 40 seconds.
Group 5: Dyract AP, polymerized with LEDemetronfor 20 seconds.
Group 6: Dyract AP, polymerized with LEDemetronfor 40 seconds.
Group 7: Dyract AP, polymerized with Optilux 501 for20 seconds.
Group 8: Dyract AP, polymerized with Optilux 501 for40 seconds.
The materials were handled according to the manu-facturers’ instructions. The mold with the specimenmaterial was held between two glass slides, coveredwith a transparent Mylar strip and gently pressedtogether to remove excess compomer. The sampleswere polymerized from the top surface for 20 or 40 sec-
Okte & Others: Surface Hardness of Compomers
Dow
nloaded from http://m
eridian.allenpress.com/operative-dentistry/article-pdf/30/4/1/1819389/1559-2863-30-4-1.pdf by guest on 12 January 2022

542 Operative Dentistry
onds by using a conventional halo-gen light curing unit (Optilux 501)or an LED light curing unit(LEDemetron I) with an 8-mm lightguide. The distance between thelight source and sample was stan-dardized by using a 1-mm glassslide. The end of the light guide wasin contact with the cover glass dur-ing the light-polymerizationprocess. The light output forOptilux 501 was 600 mW/cm2 andfor LEDemetron 1, it was 800mW/cm2, measured with a curingradiometer (Demetron). The meas-urement was done after every fivespecimens. After curing, all thesamples were stored in distilledwater for 24 hours at 37°C to assurecomplete resin curing.Microhardness measurements wereobtained 24 hours after polymeriza-tion by using a Vickers HardnessTesting Machine (Buehler, LakeBluff, IL, USA). Vickers hardnessreadings were undertaken using a50gr load for 20 seconds. Threeindentations were made at randomon each specimen, and a meanvalue and hardness ratio and depthof cure percentage were calculated.The hardness ratio was calculatedby dividing the bottom hardnessvalue by the top hardness value andmultiplying this with 100 depth ofcure percentage was calculated.
ANOVA, Scheffé and t-test wereused to evaluate the statistical sig-nificance of the results at 0.05 sig-nificance level.
RESULTS
Table 1 shows the mean (±SD)microhardness values and hardness
Figure 1. Bars show that top surface hardness was significantly higher than the bottom surface hardness(p<0.05). (LED: LEDemetron I; OX: Optilux 501; CG: Compoglass F; DT: Dyract AP; 20: 20 seconds; 40:40seconds).
Compoglass F Dyract AP
Top Bottom Hardness Depth Top Bottom Hardness DepthRatio of Ratio of
Cure Cure(%) (%)
LED 20 50.8 (3.5) 47.8 (2.3) 0.94 94 43.2 (0.8) 38.5 (4.6) 0.89 89
40 51.8 (2.6) 48.4 (3.1) 0.93 93 44.2 (1.9) 43.0 (5.0) 0.97 97
OPTILUX 20 40.7 (1.7) 34.7 (1.8) 0.85 85 33.6 (1.9) 24.8 (2.2) 0.73 73
501 40 48.5 (4.6) 43.8 (5.5) 0.90 90 42.1 (1.8) 38.8 (4.3) 0.92 92
Table 1: Mean Microhardness (Std Dev) and Hardness Ratio and Depth of Cure of Compomers
Figure 2. Bars show that significant difference in Optilux 501 groups (p<0.05) where the microhardnesswas significantly higher (p<0.05) in the 40 seconds group than that of 20 seconds on both compomers.(LED:LEDemetron I;OX:Optilux 501;CG:Compoglass F;DT:Dyract AP;20:20 seconds;40:40 seconds).
Dow
nloaded from http://m
eridian.allenpress.com/operative-dentistry/article-pdf/30/4/1/1819389/1559-2863-30-4-1.pdf by guest on 12 January 2022
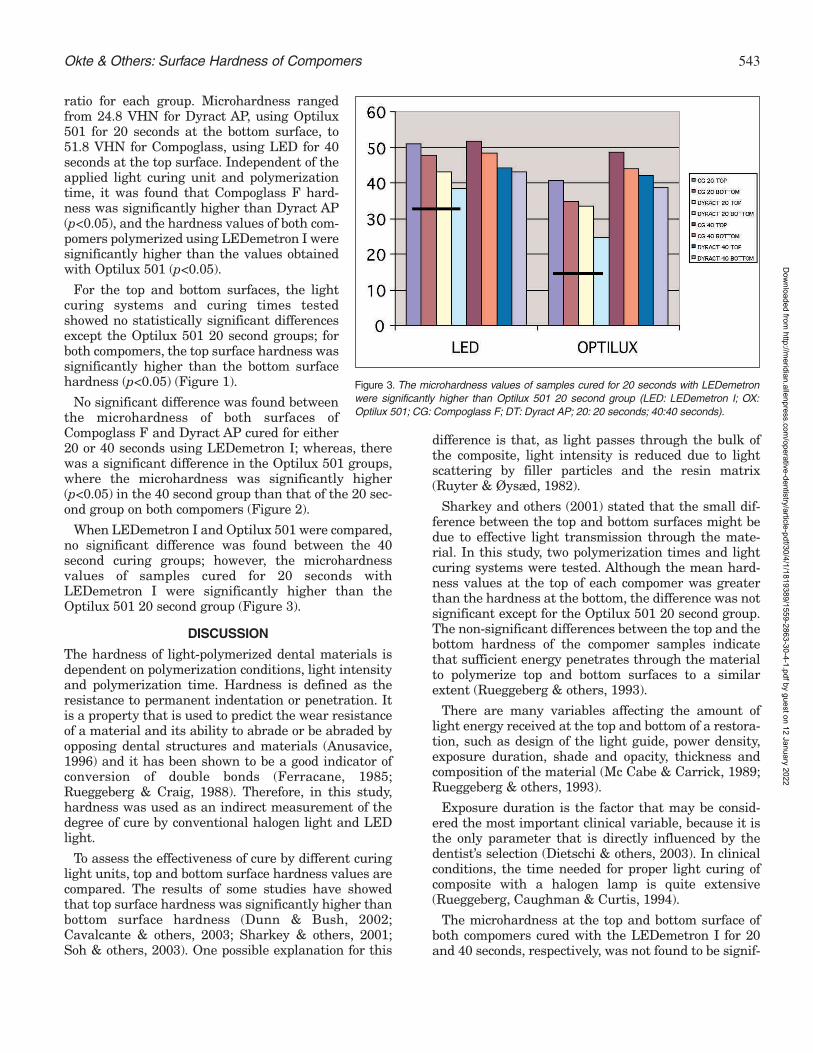
543
ratio for each group. Microhardness rangedfrom 24.8 VHN for Dyract AP, using Optilux501 for 20 seconds at the bottom surface, to51.8 VHN for Compoglass, using LED for 40seconds at the top surface. Independent of theapplied light curing unit and polymerizationtime, it was found that Compoglass F hard-ness was significantly higher than Dyract AP(p<0.05), and the hardness values of both com-pomers polymerized using LEDemetron I weresignificantly higher than the values obtainedwith Optilux 501 (p<0.05).
For the top and bottom surfaces, the lightcuring systems and curing times testedshowed no statistically significant differencesexcept the Optilux 501 20 second groups; forboth compomers, the top surface hardness wassignificantly higher than the bottom surfacehardness (p<0.05) (Figure 1).
No significant difference was found betweenthe microhardness of both surfaces ofCompoglass F and Dyract AP cured for either20 or 40 seconds using LEDemetron I; whereas, therewas a significant difference in the Optilux 501 groups,where the microhardness was significantly higher(p<0.05) in the 40 second group than that of the 20 sec-ond group on both compomers (Figure 2).
When LEDemetron I and Optilux 501 were compared,no significant difference was found between the 40second curing groups; however, the microhardnessvalues of samples cured for 20 seconds withLEDemetron I were significantly higher than theOptilux 501 20 second group (Figure 3).
DISCUSSION
The hardness of light-polymerized dental materials isdependent on polymerization conditions, light intensityand polymerization time. Hardness is defined as theresistance to permanent indentation or penetration. Itis a property that is used to predict the wear resistanceof a material and its ability to abrade or be abraded byopposing dental structures and materials (Anusavice,1996) and it has been shown to be a good indicator ofconversion of double bonds (Ferracane, 1985;Rueggeberg & Craig, 1988). Therefore, in this study,hardness was used as an indirect measurement of thedegree of cure by conventional halogen light and LEDlight.
To assess the effectiveness of cure by different curinglight units, top and bottom surface hardness values arecompared. The results of some studies have showedthat top surface hardness was significantly higher thanbottom surface hardness (Dunn & Bush, 2002;Cavalcante & others, 2003; Sharkey & others, 2001;Soh & others, 2003). One possible explanation for this
difference is that, as light passes through the bulk ofthe composite, light intensity is reduced due to lightscattering by filler particles and the resin matrix(Ruyter & Øysæd, 1982).
Sharkey and others (2001) stated that the small dif-ference between the top and bottom surfaces might bedue to effective light transmission through the mate-rial. In this study, two polymerization times and lightcuring systems were tested. Although the mean hard-ness values at the top of each compomer was greaterthan the hardness at the bottom, the difference was notsignificant except for the Optilux 501 20 second group.The non-significant differences between the top and thebottom hardness of the compomer samples indicatethat sufficient energy penetrates through the materialto polymerize top and bottom surfaces to a similarextent (Rueggeberg & others, 1993).
There are many variables affecting the amount oflight energy received at the top and bottom of a restora-tion, such as design of the light guide, power density,exposure duration, shade and opacity, thickness andcomposition of the material (Mc Cabe & Carrick, 1989;Rueggeberg & others, 1993).
Exposure duration is the factor that may be consid-ered the most important clinical variable, because it isthe only parameter that is directly influenced by thedentist’s selection (Dietschi & others, 2003). In clinicalconditions, the time needed for proper light curing ofcomposite with a halogen lamp is quite extensive(Rueggeberg, Caughman & Curtis, 1994).
The microhardness at the top and bottom surface ofboth compomers cured with the LEDemetron I for 20and 40 seconds, respectively, was not found to be signif-
Okte & Others: Surface Hardness of Compomers
Figure 3. The microhardness values of samples cured for 20 seconds with LEDemetronwere significantly higher than Optilux 501 20 second group (LED: LEDemetron I; OX:Optilux 501; CG: Compoglass F; DT: Dyract AP; 20: 20 seconds; 40:40 seconds).
Dow
nloaded from http://m
eridian.allenpress.com/operative-dentistry/article-pdf/30/4/1/1819389/1559-2863-30-4-1.pdf by guest on 12 January 2022

544 Operative Dentistry
icantly different. However, there were significant dif-ferences in the Optilux 501 groups, where the 40 secondcure group was significantly harder than the 20 secondcure group. This indicates that the hardness, whencured for 20 second exposure time, is similar to the 40second exposure duration with LEDemetron I.However, a 20 second curing duration with Optilux 501was not enough to polymerize the compomers to thesame extent as a 40 second cure. Due to the reductionin bottom surface hardness and the conversion of con-ventional resin composites with increasing thickness, ithas been recommended that composites should not beirradiated in increments greater than 2.0-mm thick.Manufacturers of halogen light curing units recom-mend 40 seconds of curing for 2.0-mm thickness. In thisstudy, 40 seconds of exposure duration was used as areference (Rueggeberg & others, 1994).
Contrary to the results of this study, Dunn and Bush(2002) found that halogen light curing units producedsignificantly harder top and bottom surfaces than LEDlight-curing units, but they used a first generation LEDlight. Leonard and others (2002), also using a first gen-eration LED light, reported that the time needed topolymerize composites with LED was between 83 and131 seconds; whereas, halogen lights required only 21and 42 seconds to cure hybrid and microfill resin com-posites. Garcia-Godoy and others (2004) found that thetwo LED systems (Freelight 2 and LEDemetron) werenot significantly different from each other and pro-duced equivalent hardness on the composites tested. Inthis study, when LEDemetron was compared withOptilux 501, no significant differences were foundbetween the 40 second curing samples. However, thetop and bottom surface hardness of compomers curedwith LEDemetron for 20 seconds was significantlyhigher than with the Optilux 501 20 second group. Thedifferences between these studies may be due to theLED light curing unit’s properties and material type.According to the manufacturers, the LEDemetroncuring system produces the same or greater intensitythan Optilux 501 for 10 seconds cures.
With light cured resins, the physical and mechanicalproperties are determined by size, distribution and con-tent per volume of the filler particles in the matrix.Smaller particles and a higher filler content canincrease the hardness of the material. Microfill resincomposites have been shown to require more powerthan hybrid resin composites for adequate polymeriza-tion (Ruyter & Øysæd, 1982), as their small filler parti-cles cause light scattering which decreases the effec-tiveness of the curing light (Leonard & others, 2002).
Ideally, the bottom/top hardness percentage would be100%; however, previous studies have used 80% as theminimum value required to indicate adequate polymer-ization (Breeding, Dixon & Caughman, 1991; Watts,
Amer & Combe, 1984). The hardness ratio should be 1if polymerization is completely effective, as the hard-ness of the bottom surface should be the same as thetop surface (Yap, Wong & Siow, 2003). Using this crite-ria, all the groups in this study achieved adequate cure,as the hardness ratio obtained was found to be greaterthan 80% with the exception of the Dyract Optilux 501,which was the 20 second curing group.
The results of this in vitro study indicated that theLED light curing unit used in this study can effectivelypolymerize compomers in 20 seconds of curing time.Reducing polymerization time is an important point,especially in young children, so that the LEDemetroncould be a good alternative when polymerizing com-pomers in children or in large cavities where incremen-tal techniques are required. Further research is neededregarding the effectiveness of short polymerizationtimes with LED curing units as they evolve.
CONCLUSIONSUnder the conditions of this in vitro study:
• The LED systems evaluated were not significant-ly different from each other and produced equiva-lent hardness on composites.
• The LED light curing unit used in this study canbe expected to effectively polymerize 2-mm thickcompomers in 20 seconds.
(Received 29 April 2004)
References
Abdalla A, Alhadainy H & Garcia-Godoy F (1997) Clinical evalu-ation of glass ionomers and compomers in Class V cariouslesions American Journal of Dentistry 10(1) 18-20.
Anusavice KJ (1996) Phillips’ Science of Dental Materials 10th edi-tion Philadelphia WB Saunders p 69-71.
Breeding LC, Dixon DL & Caughman WF (1991) The curingpotential of light-activated composite resin luting agents TheJournal of Prosthetic Dentistry 65(4) 512-518.
Cavalcante LM, Peris AR, Amaral CM, Ambrosano GMB &Pimenta LAF (2003) Influence of polymerization technique onmicroleakage and microhardness of resin composite restora-tions Operative Dentistry 28(2) 200-206.
Dietschi D, Marret N & Krejci I (2003) Comparative efficiency ofplasma and halogen light sources on composite micro-hard-ness in different curing conditions Dental Materials 19(6) 493-500.
Dunn WJ & Bush AC (2002) A comparison of polymerization bylight-emitting diode and halogen-based light curing unitsJournal of the American Dental Association 133(3) 335-341.
El-Kalla IH & Garcia-Godoy F (1999) Mechanical properties ofcompomer restorative materials Operative Dentistry 24(1) 2-8.
Ferracane JL (1985) Correlation between hardness and degree ofconversion during the setting reaction of unfilled dentalrestorative resins Dental Materials 1(1) 11-14.
Dow
nloaded from http://m
eridian.allenpress.com/operative-dentistry/article-pdf/30/4/1/1819389/1559-2863-30-4-1.pdf by guest on 12 January 2022

545
Garcia-Godoy F Jr, Garcia-Godoy A & Garcia-Godoy F (2003)Composite hardness at different thicknesses using QHL andLED light-curing systems 32nd Annual Meeting and Exhibitionof the AADR, March 12-15.
Garcia-Godoy F Jr, Garcia-Godoy A & Garcia-Godoy F (2004)Composite hardness ratio: Effect of different LED curing sys-tems IADR/AADR/CADR 82nd General Session, March 10-13.
Geurtsen W, Leyhausen G & Garcia-Godoy F (1999) Effect ofstorage media on the fluoride release and surface microhard-ness of four polyacid-modified composite resins (compomers)Dental Materials 15(3) 196-201.
Geurtsen W, Spahl W & Leyhausen G (1998) Residualmonomer/additive release and variability in cytotoxicity oflight-curing glass-ionomer cements and compomers Journal ofDental Research 77(12) 2012-2019.
Hammesfahr PD, O’Connor MT & Wang X (2002) Light-curingtechnology: Past, present and future Compendium ofContinuing Education in Dentistry 23(9) 18-24.
Hofmann N, Hugo B & Klaiber B (2002) Effect of irradiation type(LED or QTH) on photo-activated composite shrinkage strainkinetics, temperature rise, and hardness European Journal ofOral Science 110(6) 471-479.
Huth KC, Manhard J, Hickel R & Kunzelmann KH (2003) Three-year clinical performance of a compomer in stress-bearingrestorations in permanent posterior teeth American Journal ofDentistry 16(4) 257-259.
Jandt KD, Mills RW, Blackwell GB & Ashwort SH (2000) Depthof cure and compressive strength of dental composites curedwith blue light emitting diodes (LEDs) Dental Materials 16(1)41-47.
Kwon YH, Kwon TY, Ong JL & Kim KH (2002) Light polymerizedcompomers: Coefficient of thermal expansion and microhard-ness The Journal of Prosthetic Dentistry 88(4) 396-401.
Leonard DL, Charlton DG, Roberts HW & Cohen ME (2002)Polymerization efficiency of LED curing lights Journal ofEsthetic and Restorative Dentistry 14(5) 286-295.
Mc Cabe J & Carrick T (1989) Output from visible light activa-tion units and depth of cure of light activated compositesJournal of Dental Research 68(11) 1534-1539.
Millar BJ, Abiden F & Nicholson JW (1998) In vitro caries inhi-bition by polyacid-modified composite resins (compomers)Journal of Dentistry 26(2) 133-136.
Mills RW, Jandt KD & Ashworth SH (1999) Dental compositedepth of cure with halogen and blue light emitting diode tech-nology British Dental Journal 186(8) 388-391.
Oberholzer TG, Grobler SH, Pameijer CH & Hudson APG (2003)The effects of light intensity and method of exposure on thehardness of four light-cured dental restorative materialsInternational Dental Journal 53(4) 211-215.
Rueggeberg FA & Craig RG (1988) Correlations of parametersused to estimate monomer conversion in a light-cured compos-ite Journal of Dental Research 67(6) 932-937.
Rueggeberg FA, Caughman WF & Curtis JW (1994) Effect oflight intensity and exposure duration on cure of resin compos-ites Operative Dentistry 19(1) 26-32.
Rueggeberg FA, Caughman WF, Curtis JW & Davis HC (1993)Factors affecting cure at depths within light-activated resincomposites American Journal of Dentistry 6(2) 91-95
Ruyter IE & Øysæd H (1982) Conversion in different depths ofultraviolet and visible light activated composite materials ActaOdontologica Scandinavia 40(3) 179-192.
Sharkey S, Ray N, Burke F, Ziada H & Hannigan A (2001)Surface hardness of light-activated resin composites cured bytwo different visible-light sources: An in vitro studyQuintessence International 32(5) 401-405.
Soh MS, Yap AU & Siow KS (2003) Effectiveness of compositecure associated with different curing modes of LED lightsOperative Dentistry 28(4) 371-377.
Watts DC, Amer O & Combe EC (1984) Characteristics of visible-light activated composite systems British Dental Journal156(6) 209-215.
Yap AU, Low JS & Ong LF (2000) Effect of food-simulating liquidon surface characteristics of composite and polyacid-modifiedcomposite restoratives Operative Dentistry 25(3) 170-176.
Yap AUJ, Wong NY & Siow KS (2003) Composite cure andshrinkage associated with high intensity curing lightOperative Dentistry 28(4) 357-364.
Okte & Others: Surface Hardness of Compomers
Dow
nloaded from http://m
eridian.allenpress.com/operative-dentistry/article-pdf/30/4/1/1819389/1559-2863-30-4-1.pdf by guest on 12 January 2022

Clinical Technique/Case Report
©Operative Dentistry, 2005, 30-4, 546-552
Clinical Relevance
Endodontically treated molars with almost total coronal destruction may be salvage-able by using multiple posts in divergent canals. In order to avoid possible corrosionstress fracture, it is best to fabricate all the parts of a metal multiple post and coreassembly from the same metal alloy. This article describes an easy method for makinga multi-piece metal post and core assembly from the same homogeneous casting alloy.
Divergent Cast Postand Core Technique for
Severely Compromised Molarswith Potential for
Corrosion Fracture Considered
D Newitter
INTRODUCTION AND PURPOSE
Near total loss of the clinical crown of molars (Figure 1)presents a challenge for restoration. It is often mostdesirable to avoid periodontal crown lengthening forthese cases due to the risk of iatrogenic furca involve-ment as a compromising factor in prognosis. Therefore,if the tooth is to be retained and restored, a method forbuilding a secure core for supporting a crown is needed.
Conventional approaches for securing resistance andretention from the coronal portion of the tooth do notapply for these severely damaged teeth because of thelack of supporting coronal tooth substance. Stablematrixing for direct restoration is difficult or impossibleto achieve. A core with a single post may not offer ade-quate retention for the core and resistance to dislodg-
ment of the core, whether by the direct or indirectmethod. Passive placement of a flowable core material,such as resin composite or glass ionomer, for extensivecoronal replacement with or without a matrix, is lesssuitable than metal materials for long-term service dueto physical properties that can lead to failure (Lloyd &Adamson, 1987; Oliva & Lowe, 1987; Huysmans & oth-ers, 1992; Kovarik, Breeding & Caughman, 1992;Yaman & Thorsteinsson, 1992; Gateau, Sabek &Dailey, 1999).
In this difficult situation, the dentist is caughtbetween the conflicting needs to restore the tooth tofunction by harnessing additional tooth structure andthe maintenance of periodontal integrity. A practicalapproach to this dilemma is to harness the divergentgeometry of multiple molar canals by creating a multi-ple-piece cast assembly that has a core with multipledivergent (non-parallel) posts (Wearn, 1974; Michnick& Raskin, 1978; Weiner, 1981; Mora & Firtell, 1984;Chiche & Mikhail, 1985; Boberick & Rickert, 1999).
*David Newitter, DDS, MA, associate professor, Division ofOperative Dentistry, University of Connecticut Health Center,School of Dental Medicine, Farmington, CT, USA
*Reprint request: 263 Farmington Avenue, Farmington, CT,06030-1615, USA; e-mail: [email protected]
Dow
nloaded from http://m
eridian.allenpress.com/operative-dentistry/article-pdf/30/4/1/1819389/1559-2863-30-4-1.pdf by guest on 12 January 2022

547
Retention, by this design, relies upon the geometricdivergent relationship of the posts from each other, thatis, “mechanical lock” (Wearn, 1974). The cement andgoodness of post adaptation to canal walls are not crit-ical factors. In fact, with the use of cylindrical posts,Wearn (1974) recommended adapting the core patternto the occlusal portion of flared canals, rather than sac-rificing root wall thickness for adapting a larger sizecylindrical post only for the sake of gaining a good fit tothe canal walls. Resistance is borne by the roots andany remaining vertical components of the pulp chamberand clinical crown. The union of core to roots is secureand depends upon the strength of the roots for resistinglateral forces.
Some reported methods for fabricating a cast diver-gent post and core assembly were complex procedures(Michnick & Raskin, 1978; Mora & Firtell, 1984; Chiche& Mikhail, 1985). Some authors (Wearn, 1974;Michnick & Raskin, 1978; Weiner, 1981; Mora & Firtell,1984; Chiche & Mikhail, 1985; Boberick & Rickert,1999) advocated the use of a combination of metals forthe parts of the assembly. Those parts were gold alloyfrom multiple sources and types, stainless steel cylin-drical posts and the casting of dental gold to prefabri-cated metal posts.
A post and core assembly with unlike metals poses apotential for corrosion due to generation of a galvaniccurrent (Pameijer, Glantz & Mobasherat, 1983;Ravnholt, 1988; Fernandes & Dessai, 2001). Non-noblemetals, such as stainless steel, can promote corrosion orbe subject to corrosion in non-biologic (Pickering, Beck& Fontana, 1962; McNally, 2004) and in biologic envi-ronments such as in the mouth (Silness, Gustavsen &
Hunsbeth, 1979; Pameijer & others, 1983; Beague,1992; Luu & Walker, 1992; Angell, 1999; Beech &Gaylarde, 1999; Kusy & others, 2002). Corrosionmechanisms are complex and can be related to factorssuch as biofilm, low oxygen tension and electricalpotentials (Wilson & others, 1995; Breech & Gaylarde,1999), conditions that exist in the oral environment.Corrosion has been implicated, although not proven,as a factor in tooth root fracture (Angmar-Månsson,Omnell & Rud, 1969; Rud & Omnell, 1970; Petersen,1971; Silness & others, 1979); science based documen-tation of corrosion expansion stress was not provided.Considerable physical damage has been attributed toexpansion forces in confined spaces generated by thecorrosion of metal (Pickering & others, 1962; Hoke,Chama & Rosengarth, 1983; NTSB, 1984; Hahin &South, 1992; Virmani & Clemena, 1998), and it hasbeen postulated that these forces may cause fracture ofthe roots when posts corrode (Silness & others, 1979).The research by Pickering and others (1962) and Hokeand others (1983) demonstrated stress forces and/orthe wedging effect of metal corrosion in confinedspaces. To avoid encouraging corrosion, it has been rec-
ommended that metals of differing electrochemicalpotential not be mixed, and that noble metal posts andcores made of the same metal be used (Angmar-Månsson & others, 1969; Arvidson & Wróblewski, 1978;Ravnholt, 1988; Luu & Walker, 1992).
This article presents an easy method for fabricating adivergent post and core assembly from the same homo-geneous metal for all of the parts.
TECHNIQUE
Overview
Figure 2 shows the product resulting from the tooth-conserving fabrication of a cast post and core assemblypattern directly in the mouth. The assembly in Figure2 consists of acast core andthree cylindri-cal posts, one ofwhich isattached to thecore. The corecan have oneattached post,plus one or twor e m o v a b l eposts. Theattached postcan be cylindri-cal (parallelsided) or cus-tom designedto fit the anato-my of a tapered
Figure 2. Example of cast divergent post & coreassembly with three cylindrical posts.
Figure 1. Severely damaged teeth.
Newitter: Divergent Cast Post and Core Technique
Dow
nloaded from http://m
eridian.allenpress.com/operative-dentistry/article-pdf/30/4/1/1819389/1559-2863-30-4-1.pdf by guest on 12 January 2022

548 Operative Dentistry
canal. After the core and attached post are cemented,the removable posts are immediately cemented into
their respectiveroot canalsthrough holes inthe core that arealigned with theroot canals. Theremovable cylin-drical posts werecast from plasticpatterns investedin the same moldused for the core.P r e f a b r i c a t e dmetal posts werenot used. Theresult was a verysecure post/core
assembly with minimal removal of the remaining toothstructure, with particular emphasis on maintainingroot wall thickness. The stability of the unitedassembly does not depend on a cement or luting mate-rial; the geometry provides stability. Fabrication of allparts from the same molten alloy solution presents amore favorable environment for avoiding electro-corro-sive potentials.
Considerations for Selection of Canals and Posts
Depending upon the number, size, path and configura-tion of the root canals, two or three canals are selectedto receive posts. Preservation of tooth structure is ofprimary consideration. That translates to minimalreduction in thickness of canal walls and to avoidanceof perforation to the outer root surface.
Note that Figure 3 shows a post and core assemblywith two cylindrical removable (accessory) posts andone fixed custom fitted post. The custom fitted post ismost useful for a flared canal. For this method, as pre-sented here, the fitted post must be cast attached tothe core. An attached (fixed) post can be either customfitted or cylindrical and must have a path of draw thatis complementary to the draw of the core. There aremore complicated methods for incorporating accessory,removable posts that are custom fitted, but that is notthe topic of this article (Michnick & Raskin, 1978;Mora & Firtell, 1984). The focus here is on practicality,simplicity and ease of use.
Supplies and Instruments
1. Non-end-cutting rotary instruments for canalpreparation: Gates Glidden Drills (sizes 1–6) or PeesoReamers (sizes 1–6) (Pulpdent Corporation,Watertown, MA, USA).
2. Endodontic spreader or plugger for heating in aflame to remove gutta percha.
3. Selection of matched sizes (3–7) of cylindricalplastic post patterns and nickel silver posts (Parapostsystem, Coltene Whaledent, Cuyahoga Falls, Ohio,USA): Sizes 3 and 4 are most often used.
4. Twist drills sized matched (1–7) to cylindrical postdiameters for reaming post hole in cast core (Parapostsystem, Coltene Whaledent).
5. Petroleum jelly (Vaseline, Unilever, New York, NY,USA).
6. Pattern resin (Duralay, Reliance Dental Mfg Co,Worth, IL or GC Pattern Resin, GC America Inc, Alsip,IL, USA).
7. Nitric acid concentrated (Baker Analyzed Reagent69.0-71.0%, JT Baker Inc, Phillipsburg, NJ, USA).
8. Lentulo spiral (Pulpdent Corporation).
9. Porcelain Casserole (William Dixon Co, Div ofGrobet, USA, Carlstadt, NJ, USA).
Figure 3. Example of cast divergent post &core assembly with a fixed custom post andtwo cylindrical accessory posts. These cylin-drical posts had to be recast because theywere shortened by error prior to trial seating.
Figure 4. Basic illustrations of technique for divergent post & core method withall parts cast in the same casting mold.
Dow
nloaded from http://m
eridian.allenpress.com/operative-dentistry/article-pdf/30/4/1/1819389/1559-2863-30-4-1.pdf by guest on 12 January 2022

549
Technique
Figure 4 is a series of illustrations showing the firstnine steps for fabrication of a core with divergentposts:
• Steps 1 and 2: After obturation of the root canals ofa mandibular molar, undercuts were eliminatedfrom the coronal and pulp chamber portions of thetooth by removing tooth structure and/or block outwith a material such as glass ionomer cement.
• Step 3: Removal of gutta percha from the canalscan be accomplished with a heated endodonticspreader or plugger in addition to using a GatesGliddon drill. Gates Gliddon drills or Peeso ream-ers, rather than twist drills, are preferred for shap-ing and/or enlarging the canals. Twist drills arecomparatively aggressive end cutting instrumentsthat are more difficult to control.
• Step 4: A plastic post pattern has been placed intothe distal canal, which has a path of removal thatdoes not conflict with the anticipated draw of acore. A nickel silver post, lightly lubricated withpetroleum jelly on the coronal portion, is shown inthe mesial canal. If any of these posts do not
assume a stableposition, they can bestabilized with pat-tern acrylic at thecoronal end of thecanal. This acrylicwill become part ofthe core.
• Step 5: A core is inplace after it wasbuilt up using asmall brush to deliv-er increments ofpowdered acrylicpattern resin wettedwith monomer.
• Step 6: The lubri-cated nickel silver
post is withdrawn using a hemostat or similarinstrument.
• Step 7: The nickel silver post is set aside in a cupfor later use, and the core with attached post pat-tern is withdrawn as a single unit.
• Step 8: The core-post unit is re-seated and rough-prepared with a diamond rotary instrument.
• Step 9: The core-post unit is then withdrawn again,and the nickel silver post is inserted into the holefrom which it was removed. Figure 5 shows anexample of a core-post unit mounted on a sprue for-mer. Additionally, a plastic post pattern, sizematched to the nickel silver post, is sprued on thesame sprue former.
• Step 10: Thereafter, the assembly is invested andcast in a precious gold alloy (Figure 6). The castcore-post unit is placed in warm, concentratednitric acid to dissolve the nickel silver post; thisleaves a hole in the core (Figure 7). Non-preciousand silver platinum alloys should not be used; theywill be dissolved by the nitric acid (Whaledent).
• Step 11: The separately cast post can be tried intothe hole. If the post does not easily slide into thehole, then the hole is reamed with a size matchedtwist drill (Figure 8).
• Step 12: Visual inspection with magnification mayreveal positive bubbles that should be removedwith a small rotary bur or stone.
Figure 5. Example of post and coreassembly mounted on a sprue formerprior to investing and casting.
Figure 6. Example of plastic patterns and their corresponding gold alloycastings.
Figure 7. Example of dissolving nickel silverposts with warm concentrated nitric acid.
Figure 8. Example of a size matched Paraposttwist drill bit used to ream an accessory posthole.
Newitter: Divergent Cast Post and Core Technique
Dow
nloaded from http://m
eridian.allenpress.com/operative-dentistry/article-pdf/30/4/1/1819389/1559-2863-30-4-1.pdf by guest on 12 January 2022

550 Operative Dentistry
• Step 13: The remov-able posts should not beshortened; they shouldremain at their fulllength at the try-in andduring cementation.Note that the postlengths in Figure 3 werereduced in error, andthey had to be recastprior to trial seatinginto the tooth. Thelength of these postsprotruding from theocclusal surface shouldbe noted at the try-inseating so that the den-tist can determine thatthey are fully seatedduring cementation.
• Step 14: The cement chosen should allow for ade-quate working time for cementation of the parts.Zinc phosphate cement is easily controlled for thispurpose. Nevertheless, it is necessary to workquickly. A lentulo spiral is used to introduce cementinto the canals. After the cement has set, the pro-truding portions of the accessory posts at theocclusal surface are removed with a high-speedrotary instrument.
CLINICAL CASE EXAMPLE
See Figures 9A-G for illustrations. This patient reportedwith significant mobility on tooth #30. The tooth had anover-contoured crown, endodontic root fillings and apost in the distal canal. Sulcus depths were minimal. Abitewing radiograph showed a radiolucency in bone inthe disto-occlusal portion of the bifurcation area.
Figure 9 A and B. Radiographs taken before (A) and after (B). Note thatdecrease in furcation radiolucency and excessive enlargement of distalcanal in the second radiograph.
Figure 9C. Remaining tooth structure.
Figure 9D. Cast posts and core. Figure 9E. Cementation of divergent post & core assembly.
Figure 9F. Occlusal view of completed crown preparation.
Dow
nloaded from http://m
eridian.allenpress.com/operative-dentistry/article-pdf/30/4/1/1819389/1559-2863-30-4-1.pdf by guest on 12 January 2022

551
Removal of the crown, core and post revealed an unsus-pected perforation in the pulp chamber floor and exten-sive caries. Additionally, there was very little remainingclinical crown. Crown lengthening as a method forincreasing crown resistance and retention would haveexposed the furcation and, therefore, was not a pre-ferred option. The perforation was addressed by over-laying it with dental amalgam. Access to the distalcanal was limited, and the portion available was broadand of limited depth after post and caries removal. Acustom acrylic post, attached to the core, was made forthe distal canal. The two mesial canals were preparedto receive posts cast from Parapost plastic patterns. Theposts, core and crown have been in place for over 15years, functioning satisfactorily without sequelae.Following treatment, the mobility and furcation radi-olucency were reduced.
SUMMARY OF DISADVANTAGES AND ADVANTAGES
Potential problems that the dentist may have with thismethod are as follows:
If a cement that sets too quickly is used, there may notbe adequate time to seat or fully seat accessory posts.Once cemented, removal of the divergent post and corerequires extensive grinding. Working with small piecesin the mouth presents a risk for aspiration or swallowingof these pieces; rubber dam is recommended to precludethese events, and careful cotton isolation is a less pre-ferred option. Acrylic use in the mouth of a patient withacrylic allergy is not indicated. A lab procedure isrequired. The possibility of void or particle inclusions isa risk inherent in the casting method. Good ventilationand care is required for nitric acid use and storage.
Advantages to consider are the following: The lab pro-cedure need not be, but can be done in dental officeswith casting capability. A solid root-core union is estab-lished by this method; separation requires fracture.Restoration is facilitated for teeth that may otherwisebe designated “non-restorable.” Fabrication of all parts
of the post and core assembly in the same casting moldmay reduce the potential for corrosion potential andcorrosion stress forces. The procedure predictably pro-vides stability that lessens the amount of crown prepa-ration needed to extend cervically onto tooth structure.This can reduce the need for, or extent of, crown length-ening with its accompanying encroachment into furca-tions. The technique is simple and practical.
(Received 28 June 2004)
References
Angell P (1999) Understanding microbially influenced corrosionas biofilm-mediated changes in surface chemistry CurrentOpinion in Biotechnology 10(3) 269-272.
Angmar-Månsson B, Omnell K & Rud J (1969) Root fractures dueto corrosion 1. Metallurgical aspects Odontologisk Revy 20(3)245-265.
Arvidson K & Wróblewski R (1978) Migration of metallic ionsfrom screwposts into dentin and surrounding tissuesScandinavian Journal of Dental Research 86(3) 200-205.
Beague TP (1992) Galvanic corrosion of Class II amalgamrestorations in contact with orthodontic brackets/bands NewYork State Dental Journal 58(9) 48-49.
Beech IB & Gaylarde CC (1999) Recent advances in the study ofbiocorrosion—an overview Revista de Microbiologia 30(3) 177-190.
Boberick KG & Rickert D (1999) Post and core fabrication fordivergent canals with a cast post and core and a prefabricateddowel General Dentistry 47(1) 94-97.
Chiche GJ & Mikhail MG (1985) Laminated single impressiontechnique for cast posts and cores Journal of ProstheticDentistry 53(3) 325-328.
Deutsch, AS, Musikant BL, Cavallari J, Silverstein L, Lepley J,Ohlen K & Lesser M (1985) Root fracture during insertion ofprefabricated posts related to root size Journal of ProstheticDentistry 53(6) 786-789.
Fernandes AS & Dessai GS (2001) Factors affecting the fractureresistance of post-core reconstructed teeth: A review TheInternational Journal of Prosthodontics 14(4) 355-363.
Gateau P, Sabek M & Dailey B (1999) Fatigue testing and micro-scopic evaluation of post and core restorations under artificialcrowns Journal of Prosthetic Dentistry 82(3) 341-347.
Hahin C & South JM (1992) Accurate and rapid determination offatigue damage in bridge superstructures Illinois Departmentof Transportation Bureau of Materials and Physical Research:Springfield, IL Physical Research Report No 106.
Hoke JH, Chama C & Rosengarth K (1983) Measurement ofstresses developing during corrosion of embedded concretereinforcing bars The International Corrosion Forum, NationalAssociation of Corrosion Engineers, Anaheim, CA Paper No168.
Huysmans MCDNJM, Van der Varst PGT, Schäfer R, PetersMCRB, Plasschaert AJM & Soltész U (1992) Fatigue behaviorof direct post-and-core restored premolars Journal of DentalResearch 71(5) 1145-1150.
Figure 9G. Full gold alloy crown restoration.
Newitter: Divergent Cast Post and Core Technique
Dow
nloaded from http://m
eridian.allenpress.com/operative-dentistry/article-pdf/30/4/1/1819389/1559-2863-30-4-1.pdf by guest on 12 January 2022

552 Operative Dentistry
Kovarik RE, Breeding LC & Caughman WF (1992) Fatigue life ofthree core materials under simulated chewing conditionsJournal of Prosthetic Dentistry 68(4) 584-590.
Kusy RP, Ambrose WW, LaVanier LA, Newman JG & Whitley JQ(2002) Analyses of rampant corrosion in stainless-steel retain-ers of orthodontic patients Journal of Biomedical MaterialsResearch 62(1) 106-118.
Lloyd CH & Adamson M (1987) The development of fracturetoughness and fracture strength in posterior restorative mate-rials Dental Materials 3(5) 225-231.
Luu KQ & Walker RT (1992) Corrosion of nonprecious metalpost: A case report Quintessence International 23(6) 389-392.
McNally W (2004) Corrosion problems associated with stainlesssteel Technical Bulletins MacNally Institute 4 Paper No 1http://www.mcnallyinstitute.com/04-html/4-1.html.
Michnick BT & Raskin RB (1978) A multiple post-core techniqueJournal of Prosthetic Dentistry 39(6) 622-626.
Mora AF & Firtell DN (1984) Cast post and core for nonparallelcanals Journal of Prosthetic Dentistry 52(2) 235-237.
NTSB National Transportation Safety Board (1984) Collapse of asuspended span of route 95 highway bridge over the MianusRiver Highway Accident Report NTSB Number: HAR-84/03,NTIS Number: PB84-916203.
Oliva RA & Lowe JA (1987) Dimensional stability of silver amal-gam and composite used as core materials Journal ofProsthetic Dentistry 57(5) 554-559.
Pameijer CH, Glantz P & Mobasherat MA (1983) On clinical cor-rosion of pins Swedish Dental Journal 7(4) 161-167.
Petersen KB (1971) Longitudinal root fracture due to corrosion ofan endodontic post Journal of the Canadian DentalAssociation 37(2) 66-68.
Pickering HW, Beck FH & Fontana MG (1962) Wedging action ofsolid corrosion product during stress corrosion of austeniticstainless steels Corrosion 18 230t-239t.
Ravnholt G (1988) Corrosion current and pH rise around titani-um coupled to dental alloys Scandinavian Journal of DentalResearch 96(5) 466-472.
Rud J & Omnell K (1970) Root fractures due to corrosion:Diagnostic aspects Scandinavian Journal of Dental Research78(5) 397-403.
Silness J, Gustavsen F & Hunsbeth J (1979) Distribution of cor-rosion products in teeth restored with metal crowns retainedby stainless steel posts Acta Odontologica Scandinavica 37(6)317-321.
Virmani YP & Clemena GG (1998) Corrosion protection: Concretebridges US Department of Transportation Federal HighwayAdministration Turner-Fairbank Highway Research Center:McLean, VA Publication No FHWA-RD-98-088.
Wearn DI (1974) Posts and cores in divergent canals AustralianDental Journal 19(5) 346-348.
Weiner AL (1981) A nonparallel cast post and core technique forteeth with divergent canals Journal of Prosthetic Dentistry46(3) 290-292.
Whaledent International, New York, NY Nickel Silver PostDivergent Root Procedure instructions P/N86257.
Wilson M, Kpendema H, Noar JH, Hunt N & Mordan NJ (1995)Corrosion of intra-oral magnets in the presence and absence ofbiofilms of Streptococcus sanguis Biomaterials 16(9) 721-725.
Yaman P & Thorsteinsson TS (1992) Effect of core materials onstress distribution of posts Journal of Prosthetic Dentistry68(3) 416-420.
Dow
nloaded from http://m
eridian.allenpress.com/operative-dentistry/article-pdf/30/4/1/1819389/1559-2863-30-4-1.pdf by guest on 12 January 2022

INTRODUCTION
A pre-eruptive intracoronal resorption is a radiolucentlesion in the crown of an unerupted tooth. The reportedincidence of pre-eruptive intracoronal resorption is 3%to 6% of the population and 0.5% to 2% of all teeth(Kupietzky, 1999; Seow, Wan, & Mc Allen, 1999b).Permanent molars have the highest incidence, followedby permanent premolars (Seow, 1998; Seow & Hackley,1996; Seow & others, 1999b). While the cause of thesedefects is not firmly established, the current theory isdentin resorption. This theory is supported by histolog-ical studies that show osteoclasts, multinucleated giantcells and macrophages present in the lesions (Seow,1998; Singer, Abbott & Booth, 1991). Resorptive cellsmay enter the developing tooth from the surroundingbone through breaks in the dental follicle or enamelepithelium and cause resorption until the tooth erupts(Johnson & Harkness, 1997; Kupietzky, 1999; Seow,1998; Seow, Lu & Mc Allen, 1999a; Seow & others,1999b). After eruption into the oral cavity, cariogenicbacteria may then enter the tooth through grooves inthe occlusal surface and begin caries formation in theresorptive lesion (Seow, 1998; Johnson & Harkness,1997). Early detection of the resorptive defect before
eruption may prevent unnecessary loss of tooth struc-ture. Many of these lesions go undetected until the per-manent tooth has fully erupted. The purpose of thiscase report is to increase the dentist’s awareness of thiscondition, recognize the radiographic and clinical find-ings of these lesions and suggest treatment strategies.
CASE REPORT
A nine-year-old female patient reported for a routineexamination in August 1998. Her medical history wasnon-contributory. She was in good oral health, with nohistory of caries or soft tissue defects at previous dentalexaminations. All of her primary teeth had exfoliated,and all permanent teeth had erupted except for secondand third molars. Bitewing radiographs were taken atthis appointment (Figure 1). A well-circumscribed radi-olucent, occlusal lesion found at the dentino-enameljunction (DEJ) of the mandibular left second premolar
Case Report—Pre-EruptiveIntracoronal Resorption
JF McEntire • CB HermeschBS Wall • DL Leonard
John F McEntire, BS, dental student, The University of TexasHealth Science Center at San Antonio Dental School, SanAntonio, TX, USA
*Charles B Hermesch, DMD, associate professor, Department ofGeneral Dentistry, The University of Texas Health ScienceCenter at San Antonio Dental School, San Antonio, TX, USA
Bryan S Wall, DDS, LT DC, USNR Camp Pendleton, CA, USA
Daniel L Leonard, DDS, ABGD, Children’s Dental Program,Mission St Joseph’s Hospital, Asheville, NC, USA
*Reprint request: Mail Code 7914, 7703 Floyd Curl Drive, SanAntonio, TX 78229-3900, USA; e-mail: [email protected]
©Operative Dentistry, 2005, 30-4, 553-556
Figure 1. Radiograph shows a well-circumscribed occlusal radiolucency oftooth #20.
Dow
nloaded from http://m
eridian.allenpress.com/operative-dentistry/article-pdf/30/4/1/1819389/1559-2863-30-4-1.pdf by guest on 12 January 2022

554 Operative Dentistry
(tooth #20) extended approximately half-way throughthe dentin towards the pulp. The lesion was centeredmesio-distally and spread along the DEJ. Clinicalexamination showed intact enamel over the defect, noclinical evidence of decay and no history of symptoms. Apanoramic radiograph taken 31 months prior to thisappointment showed a similar radiolucent lesion intooth #20 prior to its eruption (Figure 2). The lesionappeared to have increased in size since that time.
The decision was made to restore tooth #20. Removalof the overlying enamel revealed a lesion in which thedentin had a chalky, grayish, dry and flaky consistency.This was removed with a slow speed round bur untilhard dentin was reached. The lesion was restored witha bonded resin composite. Figure 3 shows the post-opradiograph. The tooth has been followed for five yearsand continues to test vital, remains asymptomatic andpresents a stable radiographic appearance (Figure 4).
DISCUSSION
Pre-eruptive intracoronal resorption is the preferredterm to describe these lesions, because histological andclinical findings suggest that they are resorptive innature (Seow, 2003). The term “pre-eruptive caries” wasonce used to describe coronal lesions in unerupted teeth(Seow & others, 1999a). This term reflects the fact thatcariogenic bacteria had been cultured from pre-eruptivelesions after their eruption into the oral cavity. It wasthought that caries in a primary tooth might infect theunderlying permanent tooth. However, this could onlyoccur if the overlying tooth had a periapical infection orif a fistula was present that allowed microbes access tothe unerupted tooth (Johnson & Harkness, 1997;Singer & others, 1991). It is important to keep in mindthat the tooth with the highest prevalence of theselesions is the permanent molar, which, of course, has nooverlying primary tooth. Therefore, caries is not consid-ered the primary cause of this lesion. However, cariesmay develop in these lesions after eruption.
A mechanism for resorption in these lesions may beectopic positioning of the unerupted tooth or of an adja-cent tooth. Seow and others (1999a) reported a 6%prevalence of pre-eruptive coronal lesions in ectopicallypositioned teeth. This was significantly higher than the2% prevalence of teeth in the group that were notectopically positioned. Seow and others (1999a) sug-gests that the ectopic positioning of the tooth may causebreaks in the dental follicle, allowing resorptive cellsfrom the surrounding bone an opportunity to enter thedeveloping tooth. Factors other than tooth positioningmay also be involved, because the majority of ectopicallypositioned teeth show no defects. More research isneeded to determine other etiologic factors.
Early diagnosis of pre-eruptive intracoronal resorp-tion is elusive. Many of these defects are undiagnosedor have delayed diagnosis even though they can appearon the radiographs of unerupted teeth.
Figure 2. Panoramic radiograph taken 31 months prior to Figure 1 showspre-eruptive radiolucency on tooth #20.
Figure 3. Post-operative radiograph.
Figure 4. Five-year follow-up.
Dow
nloaded from http://m
eridian.allenpress.com/operative-dentistry/article-pdf/30/4/1/1819389/1559-2863-30-4-1.pdf by guest on 12 January 2022

555
Radiographically, the pre-eruptive lesion appears as awell-circumscribed radiolucent lesion located at theDEJ (Seow, 1998; Seow & others, 1999a). The radiolu-cent area resembles caries, making diagnosis of theselesions difficult (Kunz, 1997; Seow, 1998; Seow & oth-ers, 1999a). Following eruption, caries may develop inthe pre-eruptive lesion, obscuring the resorptive originof the lesion. In this case, the overlying enamelappeared clinically intact and delayed the diagnosis.Also, in this case report and others, the defect was notdiagnosed until the tooth had already erupted (Kunz,1997; Kupietzky, 1999). Kunz (1997) reported that rootcanal therapy was necessary on a tooth that was laterfound to have a pre-eruptive intracoronal defect despitean intact enamel surface and an occlusal sealant. Seowand others (1999a) reported in their clinical observa-tions that, out of 66 patients with clinically undetectedocclusal caries (“occult caries”), 31 had pre-eruptivedentin radiolucencies. Seow (2000) hypothesizes anassociation between occult caries and pre-eruptiveresorptive lesions. This possible association warrantsfurther investigation.
Pre-eruptive intracoronal resorption lesions that donot become carious have a different clinical and histo-logical appearance. Usually, the occlusal enamel sur-face is intact (Johnson & Harkness, 1997; Kupietzky,1999; Seow, 1998; Singer & others, 1991; Wood &Crozier, 1985), with a chalky, grayish, dry, flaky dentinthat has a different consistency from caries-induceddemineralized dentin (Kunz, 1997; Seow, 1998).Histological examination has shown resorption(Grundy, Pyle & Adkins, 1984; Rankow, Croll & Miller,1986) and scalloping of the enamel at the DEJ, sug-gesting osteoclastic activity (Seow, 1998; Singer & oth-ers, 1991). Johnson and Harkness (1997) performed ahistological study of a pre-eruptive intracoronal resorp-tion lesion found in a pre-molar extracted for ortho-dontic therapy. They noted that the margins of thedentin surrounding the debris-filled cavity had anirregular, “moth-eaten” appearance, which is sugges-tive of resorption. Upon histological examination of twoseparate lesions in teeth also extracted for orthodonticreasons, Singer and others (1991) found macrophagesand giant cells lying in Howship’s lacunae in thedentin. Histological studies have also reported intactdentin between pre-eruptive lesions and the pulpchamber, indicating that the resorptive cells are notrelated to pulpal tissue (Grundy & others, 1984; Rutar,1997; Singer & others, 1991). Intact dentin has beenobserved between the base of the lesion and the pulp(Holan, Eidelman & Mass, 1994; Rankow & others,1986; Wood & Crozier, 1985). In contrast, O’Neal,Gound and Cohen (1997) described a case in which thelesion communicated with a vital pulp.
Pre-eruptive intracoronal resorption has generallybeen noted to be progressive in nature, yet not aggres-
sive (Johnson & Harkness, 1997). In the 31-month timeperiod between radiographs, in this case, the lesion wasfound to increased in size, probably due to continuedresorption prior to eruption. However, Kunz (1997)reported a case in which radiographs taken five monthsapart showed no progression of the radiolucent lesionprior to eruption.
There are several management strategies for pre-eruptive intracoronal resorption based on the size of thelesion. Small, pre-eruptive lesions can be radiographi-cally monitored until the tooth erupts into the oralcavity and then restored with conservative operativeprocedures (Dowling, Fleming & Corcoran, 1999; Holan& others, 1994; Rutar, 1997; Seow & others, 1999b). Forsome small lesions, clinicians may choose to closelymonitor the lesion and restore the tooth only if furtherprogression is noted (Dowling & others, 1999). If patientcompliance with monitoring is a concern, it may be bestto restore immediately. When considering treatment, itis important to keep in mind that a tooth with pre-erup-tive resorption is probably more vulnerable to decay andfracture due to the presence of undermined enamel.Large lesions approaching the pulp may be restored assoon as possible and might include an indirect pulp cap(Kupietzky, 1999). Some authors suggest that, for verylarge, progressive lesions, the tooth be restored in itsunerupted state, removing an overlying primary tooth,if necessary (Dowling & others, 1999; Holan & others,1994; Johnson & Harkness, 1997; Rutar, 1997; Seow &others, 1999a,b). Seow (1998) reported a case in whichthe lesion was so extensive that the coronal tooth struc-ture fractured at the CEJ during orthodontic debracket-ing. Restoration of the tooth required endodontics, postand core and a crown. Similarly, Kunz (1997) reportedcarious activity extended into the pulp after the tootherupted and required endodontic therapy. Currently,there are no reported cases of progression of pre-erup-tive coronal radiolucent lesions after restoration (Seow,2003).
CONCLUSIONS
In conclusion, dentists should examine radiographs forabnormalities in the number, size, shape and positionof unerupted teeth as well as for intracoronal radiolu-cencies. With an accurate diagnosis of pre-eruptiveintracoronal resorption, the lesion can be monitoredand managed appropriately. Proper management willaid in preventing unnecessary loss of tooth structure.
(Received 23 August 2004)
References
Dowling PA, Fleming P & Corcoran F (1999) A case report of pre-eruptive coronal resorption in a mandibular canine DentalUpdate 26(10) 444-445.
McEntire & Others: Case Report—Pre-Eruptive Intracoronal Resorption
Dow
nloaded from http://m
eridian.allenpress.com/operative-dentistry/article-pdf/30/4/1/1819389/1559-2863-30-4-1.pdf by guest on 12 January 2022

556 Operative DentistryOperative Dentistry
Grundy GE, Pyle RJ & Adkins KF (1984) Intra-coronal resorp-tion of unerupted molars Australian Dental Journal 29(3)175-179.
Holan G, Eidelman E & Mass E (1994) Pre-eruptive coronalresorption of permanent teeth: Report of three cases and theirtreatments Pediatric Dentistry 16(5) 373-377.
Johnson M & Harkness M (1997) Pre-eruptive coronal radiolu-cency in a mandibular premolar: A case report and literaturereview New Zealand Dental Journal 93 84-86.
Kunz GT (1997) Pre-eruptive intracoronal lesion of a mandibu-lar first molar General Dentistry 45(6) 574-576.
Kupietzky A (1999) Treatment of an undiagnosed pre-eruptiveintra-coronal radiolucency Pediatric Dentistry 21(6) 369-372.
O’Neal KM, Gound TG & Cohen DM (1997) Pre-eruptive idio-pathic coronal resorption: A case report Journal ofEndodontics 23(1) 58-59.
Rankow H, Croll TP & Miller AS (1986) Pre-eruptive idiopathiccoronal resorption of permanent teeth in children Journal ofEndodontics 12(1) 36-39.
Rutar JE (1997) Paediatric dentistry: Coronal radiolucency. Casereports Australian Dental Journal 42(4) 221-224.
Seow WK (2003) Diagnosis and management of unusual dentalabscesses in children Australian Dental Journal 48(3) 156-168.
Seow WK (2000) Pre-eruptive intracoronal resorption as an enti-ty of occult caries Pediatric Dentistry 22(5) 370-376.
Seow WK (1998) Multiple pre-eruptive intracoronal radiolucentlesions in the permanent dentition: Case report PediatricDentistry 20(3) 195-198.
Seow WK & Hackley D (1996) Pre-eruptive resorption of dentinin primary and permanent dentitions: Case reports and liter-ature review Pediatric Dentistry 18 67-71.
Seow WK, Lu PC & McAllen LH (1999a) Prevalence of pre-erup-tive intracoronal dentin from panoramic radiographsPediatric Dentistry 21(6) 332-339.
Seow WK, Wan A & McAllen L (1999b) The prevalence of pre-eruptive dentin radiolucencies in the permanent dentitionPediatric Dentistry 21(1) 26-33.
Singer S, Abbott PV & Booth DR (1991) Idiopathic coronal radi-olucencies in unerupted permanent teeth. Case reportsAustralian Dental Journal 36(1) 32-37.
Wood PF & Crozier DS (1985) Radiolucent lesions resemblingcaries in the dentine of permanent teeth. A report of sixteencases Australian Dental Journal 30(3) 169-173.
Dow
nloaded from http://m
eridian.allenpress.com/operative-dentistry/article-pdf/30/4/1/1819389/1559-2863-30-4-1.pdf by guest on 12 January 2022

Departments
The University of North CarolinaDepartment of Operative Dentistry
The University of North Carolina seeks to fill a full-time,tenure-track or clinical-track position at theAssistant/Associate Professor level in the Department ofOperative Dentistry. Responsibilities for this position willinclude pre-clinical and clinical teaching, service activi-ties, intramural practice and research. Candidates withproven teaching abilities and advanced training or docu-mented scholarly activity in operative dentistry or a relatedfield are preferred. Salary will be determined commensu-rate with the applicant’s qualifications and experience.Applications, including a curriculum vitae, and the namesand addresses of four references, along with any nomina-tions or inquiries, should be directed to Dr Harald OHeymann, Chair of Search Committee, Department ofOperative Dentistry, School of Dentistry, CB #7450,University of North Carolina, Chapel Hill, NC 27599-7450 or http://www.dent.unc.edu/depts/academic/oper/
Application deadline with be open until the position isfilled. As an Equal Opportunity/Affirmative ActionEmployer, the University is committed to equality of edu-cational and employment opportunities and actively seeksto promote diversity through its recruitment endeavors.
The Oregon Health & Science UniversitySchool of Dentistry
The School of Dentistry at the Oregon Health & ScienceUniversity is seeking an energetic, motivated and quali-fied individual for a full-time position at the level ofAssistant/Associate professor in the Department ofRestorative Dentistry, Division of Operative Dentistry.Experience in teaching, research, service and patientcare, as well as excellent interpersonal and communica-tion skills are preferred. Implant experience, especiallyteaching at the pre-doctoral level, is considered an addi-tional asset but not a requirement. Specific teachingresponsibilities will include participation at the pre-doc-toral level in both the clinical and pre-clinical curriculum,with the opportunity to serve as course director.Candidates should posses a DMD/DDS degree. One dayper week (0.2 FTE) will be available for participation inthe Faculty Dental Practice. Collaboration in researchopportunities is available and encouraged. Salary will be
determined by credentials and experience. OHSU is anEqual Employment Opportunity institution. Interestedcandidates should submit a letter, curriculum vitae andreferences to:
John C Lee, DDSDirector, Division of Operative DentistryDepartment of Restorative DentistryOHSU School of Dentistry611 SW Campus Drive #175Portland, OR, 97239-3097([email protected])503-494-8948
The UCLA School of DentistryDivision of Restorative Dentistry
University of California, Los Angeles, School of Dentistry,Division of Restorative Dentistry, invites applications fora full-time, tenure track position at the AssistantProfessor level. Responsibilities will include conductingand mentoring research in the restorative dental sciencesas well as clinical and/or preclinical teaching. Candidatesmust have a strong scientific background and preferencewill be given to applicants with an established record oflaboratory or clinical research in areas directly relevant torestorative dentistry and the potential for continued gen-eration of extramural research support. Teaching experi-ence is required. Candidates must posses a DDS or DMDfrom an ADA-accredited dental school. A PhD degree ispreferred, but not required.
Opportunity with intramural practice is available for anindividual with a California license or a Board eligible orcertified specialist. The University of California is anequal opportunity and affirmative action employer. Allqualified applicants are encouraged to apply. Applicantsshould submit a curriculum vitae and the names of threereferences to Dr Edmond R Hewlett, Vice-Chair, Divisionof Restorative Dentistry, UCLA School of Dentistry, Box951668, Los Angeles, CA 90095-1668.
The University of MinnesotaSchool of DentistryDivision of Operative Dentistry
The University of Minnesota, School of Dentistry, wel-comes candidates for a full-time, tenured or tenure-trackposition in the Division of Operative Dentistry.Responsibilities include clinical, pre-clinical and didacticinstruction in operative dentistry, provision and monitor-ing of patient care, and participation in an expanding
557
FacultyPositions
Dow
nloaded from http://m
eridian.allenpress.com/operative-dentistry/article-pdf/30/4/1/1819389/1559-2863-30-4-1.pdf by guest on 12 January 2022

558 Operative Dentistry
research program. The selected candidate will participatein the School of Dentistry meetings, committees, contin-uing education and outreach, along with other opportuni-ties. Applicants must have a DDS degree or equivalentand must have or be eligible for licensure in Minnesota.An MS, PhD or equivalent degree is highly desirable. Aminimum of two years full-time teaching and/or patientcare experience desired. Private practice in the School ofDentistry’s intramural practice is available one day perweek. Salary and rank will be commensurate with expe-rience and credentials. The search will remain open untilthe position is filled.
A Curriculum Vitae, letter of interest and three profes-sional references should be sent to: Dr Gary Hildebrandt,Chair of the Search Committee, 8-450 Moos Tower, 515Delaware St SE, Minneapolis, MN 55455. Applicationsmay be faxed to (612) 625-7440 or e-mailed to:[email protected].
The University of Minnesota, School of Dentistry, is oneof seven schools in our Academic Health Center, one of themost comprehensive academic health centers in theUnited States. The School of Dentistry consistentlyattracts high quality faculty and students and hasachieved an international reputation for research, educa-tion and service. The University of Minnesota is an equalopportunity educator and employer.
The University of Texas Health Science Center atHouston Dental Branch
The University of Texas Health Science Center atHouston Dental Branch seeks applicants for a full-timetenure or clinical educator track position in theDepartment of Restorative Dentistry and Biomaterials atthe Assistant or Associate Professor level. Applicantsmust have a DDS/DMD degree with prior teaching and/orprivate practice experience. Responsibilities include pre-clinical and clinical teaching to undergraduate dental stu-dents, research and service. The position is availableAugust 1, 2005. Academic rank and salary are commen-surate with qualifications and experience. The DentalBranch is located in the heart of the Texas MedicalCenter, which offers significant resources and importantopportunities for collaboration and advanced training.The Dental Branch is one of six schools in the most com-prehensive health science center in Texas. The Universityof Texas Health Science Center at Houston is an equalopportunity employer and a non-smoking environment.Women and minorities are encouraged to apply. Send aletter of application, a curriculum vitae and a list of threereferences to: Dr Arthur Jeske, The University of TexasDental Branch at Houston, Department of RestorativeDentistry and Biomaterials, 6516 M D Anderson Blvd,Suite 493, Houston, Texas 77030.
Ralph Phillips Student Research Award 2006
Applications are invited for the 2006 Ralph PhillipsStudent Research Award, sponsored by the FoundersFund of the Academy of Operative Dentistry. The Awardis open to students at all levels wishing to undertakenovel research relevant to contemporary operative den-tistry.
The application should take the form of a protocol out-lining the background, aims and hypothesis of the pro-posed research, the methodology to be employed, theanticipated work schedule and the expected impact of thework on the clinical practice of operative dentistry. Theprotocol should not exceed three double-spaced, type-written pages and a budget sheet, including details forpayment of the award. The budget for the proposedresearch may not exceed $6,000.
The recipient of the award will be required to present atable clinic reporting the findings of the research sup-ported by the Award at the 2007 annual meeting of theAcademy of Operative Dentistry to be held in Chicago, 22-23 February, 2007. Additional funds not to exceed $1,000will be made available to offset the cost of attending themeeting.
A research mentor, who is a member of the Academy ofOperative Dentistry, should be named and be a co-signa-tory to the application.
If the research supported by the Award leads to aresearch report intended for publication, it is expectedthat the report be submitted in the first instance toOperative Dentistry.
Applications for the award must be submitted electron-ically to Dr Nairn Wilson ([email protected]),Chairman of the Research Committee of the Academy ofOperative Dentistry no later than 31st December 2005.
The award recipient will be announced during the 2006Annual Meeting of the Academy of Operative Dentistry,which will be held in Chicago, 23-24 February, 2006.
Academy of Operative Dentistry EuropeanSection Conference:
New Horizons in Operative DentistryFriday 18th November 2005
Guy’s Tower, GKT Dental Institute,King’s College London
The Academy of Operative Dentistry, European Section, isdelighted to announce its 2005 Conference.
Announcements
Dow
nloaded from http://m
eridian.allenpress.com/operative-dentistry/article-pdf/30/4/1/1819389/1559-2863-30-4-1.pdf by guest on 12 January 2022

559
The Conference will be chaired by Nairn Wilson andStephen Dunne, who will introduce speakers of interna-tional reputation, including Ivo Krejci, University ofGeneva; Paul Lambrects, Catholic University of Leuven;George Vougiouklakis, University of Athens and AlfonsPlasschaert, University of Nijmegen, who will be fullysupported by presentations from the GKT DentalInstitute representatives, including Paul Sharpe, TimWatson, Avijit Banerjee and Christos Louca.
The highly topical subjects covered include air abrasion,lasers, photoactivated disinfection, dental caries includingoperative and non-operative management, the ADEE per-spective on the teaching of conservative dentistry andstem-cell based tissue engineering of teeth. IADR-styleposters will be displayed during lunch.
The Conference Dinner will be held on board the historicWWII Battle Cruiser HMS Belfast, which will bring themeeting to a memorable conclusion. In addition toenjoying a five-course meal and fine wines, delegates willhave, by special arrangement, the opportunity to view theCruiser’s Operating Theatre, Sick Bay and DentalSurgery.
For further information and booking information, pleasecontact: Cynthia Casimir, Primary Dental Care Secretary,GKT Dental Institute, Denmark Hill Campus, CaldecotRoad, London SE5 9RW
Tel: 00 44 (0)207 346 3585 Fax: 00 44 (0)207 346 3826
Email: [email protected]
The newly revised and expanded Instructions toContributors is posted on the Operative DentistryHome Page: http://www.jopdent.org/
Click on Contributors for the most up-to-date way tosubmit your research papers electronically.
NOTE: As of May 1, 2005, all papers must be submitedelectronically.
We hope all our readers will take advantage of theinformation available by accessing our Internet homepage. Our address is: http://www.jopdent.org/
The home page contains a search engine and buttonsthat, hopefully, will lead you to answers to any ques-tions you may have related to Operative Dentistry.These are:
Journal: leads to information on the Editorial Staffand Editorial Board; a complete index of journal vol-umes; a compilation of direct gold references; highlightsof the current issue and a more detailed look at pub-lished Editorials and Clinical Pearls.
Subscribe: leads to complete information on subscrip-tion rates; purchasing back issues, reprints, and boundvolumes; and subscription and change of addressforms.
Affiliates: provides links to the American Academy ofGold Foil Operators, the Academy of OperativeDentistry, the AADS-Operative Section, and ourCorporate Sponsors. In addition, membership applica-tions for the journal’s parent academies are availablefor downloading.
News: announcements of interest to our readers,including meeting information, advertised facultypositions, and upcoming CE courses.
Authors: complete instructions for contributors to thejournal.
Reviewers: Link for our Editorial Board to submitmanuscript reviews electronically.
Operative DentistryHome Page
Instructions to Contributors
Dow
nloaded from http://m
eridian.allenpress.com/operative-dentistry/article-pdf/30/4/1/1819389/1559-2863-30-4-1.pdf by guest on 12 January 2022

560 Operative Dentistry
Operative Dentistry:The first 29 years—
Now available on CDOperative Dentistry volumes 1-29 (all issues from 1976 through 2004) are now
available on a 3 CD-set, including all six supplements. Cost for the complete set:Only $200 U.S.
To order sets:
Fax your mailing address with credit card #, expiration date (Master Card or Visaonly) and number of copies requested to:
317-852-3126
or
send your check drawn on a U.S. bank account to:
Editor, Operative DentistryIndiana University School of Dentistry
1121 West Michigan StreetIndianapolis, IN 46202, USA
Dow
nloaded from http://m
eridian.allenpress.com/operative-dentistry/article-pdf/30/4/1/1819389/1559-2863-30-4-1.pdf by guest on 12 January 2022

Dow
nloaded from http://m
eridian.allenpress.com/operative-dentistry/article-pdf/30/4/1/1819389/1559-2863-30-4-1.pdf by guest on 12 January 2022
RECOMMENDATIONS FOR CLINICAL PRACTICEReasons for Replacement of Restorations . . . . . . . . . . . . . . . . . . . . . . . . . . . . . . . . . . . . . . . . . . . . . . . . . . . . . . . . . . . . . . . . . . . . . . . . . . . . . . . . . . . . . . . . . .409
CLINICAL RESEARCH
Comparative Study of the Effects of Two Bleaching Agents on Oral Microbiota—YT Alkmin • R Sartorelli • FM Flório • RT Basting . . .417
Eighteen-month Clinical Performance of a Self-etching Primer in Unprepared Class V Resin RestorationsWW Brackett • MG Brackett • A Dib • G Franco • H Estudillo . . . . . . . . . . . . . . . . . . . . . . . . . . . . . . . . . . . . . . . . . . . . . . . . . . . . . . . . . . . . . . . . .424
LABORATORY RESEARCH
Effect of Desensitizers on the Bond Strength of a Self-etching Adhesive System to Caries-affected Dentin on the Gingival WallA Sengun • AE Koyuturk • Y Sener • F Ozer . . . . . . . . . . . . . . . . . . . . . . . . . . . . . . . . . . . . . . . . . . . . . . . . . . . . . . . . . . . . . . . . . . . .430
Color and Translucency of A2 Shade Resin Composites After Curing, Polishing and Thermocycling Y-K Lee • B-S Lim • S-H Rhee • H-C Yang • JM Powers . . . . . . . . . . . . . . . . . . . . . . . . . . . . . . . . . . . . . . . . . . . . . . . . . . . . . . . . . .436
Degree of Remaining C=C Bonds, Polymerization Shrinkage and Stresses of Dual-cured Core Build-up Resin CompositesMM Stavridakis • AI Kakaboura • I Krejci . . . . . . . . . . . . . . . . . . . . . . . . . . . . . . . . . . . . . . . . . . . . . . . . . . . . . . . . . . . . . . . . . . . . . .443
Effects of Dentin Disinfectants on the Shear Bond Strength of All-ceramics to Dentin—M Turkun • E Cal • M Toman • S Toksavul . . .453
Comparison of Linear Polymerization Shrinkage and Microhardness Between QTH-cured & LED-cured CompositesS-H Park • S-S Kim • Y-S Cho • S-Y Lee • B-D Noh . . . . . . . . . . . . . . . . . . . . . . . . . . . . . . . . . . . . . . . . . . . . . . . . . . . . . . . . . . . . . .461
Shear Bond Strength of Tooth-colored Indirect Restorations Bonded to Coronal and Cervical EnamelY Shimada • N Tomimatsu • T Suzuki • MA Uzzaman • MF Burrow • J Tagami . . . . . . . . . . . . . . . . . . . . . . . . . . . . . . . . . . . . . . . .468
Post-gel Polymerization Shrinkage Associated with Different Light Curing Regimens—CH Chye • AUJ Yap •YC Laim • MS Soh . . . . . .474
Microscopic Evaluation of Dentin Interface Obtained with 10 Contemporary Self-etching Systems: Correlation with Their pHG Grégoire • A Millas . . . . . . . . . . . . . . . . . . . . . . . . . . . . . . . . . . . . . . . . . . . . . . . . . . . . . . . . . . . . . . . . . . . . . . . . . . . . . . . . . . . . . . .481
Enamel Bond Strengths of Pairs of Adhesives from the Same Manufacturer—J Perdigão • G Gomes • S Duarte Jr • MM Lopes . . . . .492
Microtensile Bond Strength of Light- and Self-cured Adhesive Systems to Intraradicular Dentin Using a Translucent Fiber PostA Mallmann • LB Jacques • LF Valandro • P Mathias • A Muench . . . . . . . . . . . . . . . . . . . . . . . . . . . . . . . . . . . . . . . . . . . . . . . . . .500
Surface Changes and Acid Dissolution of Enamel After Carbamide Peroxide Bleach Treatment—S-T Yeh • Y Su • Y-C Lu • S-Y Lee . . . .507
Temperature Change and Hardness with Different Resin Composites and Photo-activation MethodsLFJ Schneider • S Consani • MAC Sinhoreti • L Correr Sobrinho • FM Milan . . . . . . . . . . . . . . . . . . . . . . . . . . . . . . . . . . . . . . . . .516
Fluoride Release and Neutralizing Effect by Resin-based Materials—T Itota • OT Al-Naimi • TE Carrick • M Yoshiyama • JF McCabe .522
Effect of Handpiece Maintenance Method on Bond Strength—HW Roberts • KS Vandewalle • DG Charlton • DL Leonard . . . . . . . . . . .528
The Influence of Sodium Hypochlorite and Root Canal Sealers on Post Retention in Different Dentin Regions—L Muniz • P Mathias . . . . . . .533
Effect of Curing Time and Light Curing Systems on the Surface Hardness of CompomersZ Okte • P Villalta • F Garcia-Godoy • F Garcia-Godoy Jr • P Murray . . . . . . . . . . . . . . . . . . . . . . . . . . . . . . . . . . . . . . . . . . . . . . . . . .540
CLINICAL TECHNIQUE/CASE REPORTDivergent Cast Post and Core Technique for Severely Compromised Molars with Potential for Corrosion Fracture Considered—D Newitter . .546
Case Report—Pre-Eruptive Intracoronal Resorption—JF McEntire • CB Hermesch • BS Wall • DL Leonard . . . . . . . . . . . . . . . . . . . . . . . .553
DEPARTMENTSFaculty Positions . . . . . . . . . . . . . . . . . . . . . . . . . . . . . . . . . . . . . . . . . . . . . . . . . . . . . . . . . . . . . . . . . . . . . . . . . . . . . . . . . . . . . . . . . . . . . . . . . . . . . . . . .557Announcements . . . . . . . . . . . . . . . . . . . . . . . . . . . . . . . . . . . . . . . . . . . . . . . . . . . . . . . . . . . . . . . . . . . . . . . . . . . . . . . . . . . . . . . . . . . . . . . . . . . . . . . . . .558Instructions to Contributors . . . . . . . . . . . . . . . . . . . . . . . . . . . . . . . . . . . . . . . . . . . . . . . . . . . . . . . . . . . . . . . . . . . . . . . . . . . . . . . . . . . . . . . . . . . . . . .559
Operative Dentistry Home Page . . . . . . . . . . . . . . . . . . . . . . . . . . . . . . . . . . . . . . . . . . . . . . . . . . . . . . . . . . . . . . . . . . . . . . . . . . . . . . . . . . . . . . . . . . .559
(ISSN 0361-7734)
july/august 2005 • volume 30 • number 4 • 409-560
OP
ER
AT
IVE
DE
NT
IST
RY
volu
me 30 • n
um
ber 4 • p
ages 409-560
july-au
gu
st 2005
Periodicals10-9385Operative DentistryIndiana University School of Dentistry, Rm S4111121 West Michigan StreetIndianapolis, IN 46202-5186 USA
JULY/AUGUST 2005 • VOLUME 30 • NUMBER 4 • 409-560
©OPERATIVE DENTISTRY, Inc.
Dow
nloaded from http://m
eridian.allenpress.com/operative-dentistry/article-pdf/30/4/1/1819389/1559-2863-30-4-1.pdf by guest on 12 January 2022