
July 2020 Volume XXII No. 2 - Central Bank of Trinidad and ...
107
July 2020 Volume XXII No. 2 ISSN: 1818 - 0027
-
Upload
khangminh22 -
Category
Documents
-
view
0 -
download
0
Transcript of July 2020 Volume XXII No. 2 - Central Bank of Trinidad and ...

July 2020 Volume XXII No. 2
ISSN: 1818 - 0027


CENTRAL BANK OF TRINIDAD AND TOBAGO
Economic BullEtin
VolumE XXII No. 2
July 2020
contEnts
Pages
Review of economic and financial developments
Part I Overview and Outlook 1
Part II International and Regional Economic Developments 5
Part III International Commodity Prices 11
Part IV Domestic Economic Activity 13
Part V Labour Market 15
Part VI Domestic Prices 17
Part VII Central Government Fiscal Operations 18
Part VIII Public Sector Debt 21
Part IX Money, Credit and Interest Rates 23
Part X Capital Market 26
Part XI International Trade and Payments 30
appendix I: Statistical Tables (Tables 1 - 35) 34
appendix II: Feature Articles -
In a Time of COVID-19: The Impact of External Conditions on the
Trinidad and Tobago Economy 86
Measuring Economic Uncetainty in Trinidad and Tobago 93
appendix III: Calendar of Key Economic Events, January - June, 2020 99


ECONOMIC BULLETIN VOLUME XXII NO. 2 1
REViEw of Economic and financial dEVElopmEnts
July 2020
paRt I - oVERViEw and outlook
oVERViEw
The Novel Coronavirus (COVID-19) pandemic has triggered a global economic recession in 2020—the deepest since the Great Depression. Notwithstanding sizable fiscal and monetary stimulus packages, economic growth contracted sharply across Advanced Economies (AEs) and Emerging Market and Developing Economies (EMDEs) during the first half of 2020. The economic fallout also severely affected the labour market, with the International Labour Organization (ILO) estimating declines in global working hours by 5.4 per cent (equivalent to 155 million full-time jobs) and 14.0 per cent (equivalent to 400 million full-time jobs) in the first and second quarters of 2020 respectively, relative to the fourth quarter of 2019. Meanwhile, containment measures associated with COVID-19 have stymied global demand, resulting in a sharp drop in commodity prices and muted inflationary pressures. Financial conditions tightened significantly for most of the first half of 2020, primarily reflective of heightened uncertainty and worsening global prospects. Moreover, EMDEs experienced an unprecedented surge in capital outflows in March and April 2020, widening sovereign borrowing spreads, and currency depreciations.
On the domestic front, activity in the energy sector declined in the second quarter of 2020. Broad contractions were observed in this sector, including natural gas, crude oil, liquefied natural gas while methanol output improved. Outside of energy, indicators monitored by the Central Bank suggest that activity across the non-energy sectors was uneven and somewhat lethargic in the first quarter of 2020. The Financial and Insurance, and Real Estate sectors remained resilient and activity in the Electricity and Water (excluding Gas), and Manufacturing (excluding Refining and Petrochemicals) sectors increased. At the same time,
the Wholesale and Retail Trade (excluding Energy), Construction, and Transportation and Storage sectors posted declines. As in the rest of the world, the global pandemic has had a dampening effect on output that is likely to persist into the final quarter of 2020.
COVID-19 has also impacted Trinidad and Tobago’s labour market, either directly or via the mitigation measures employed to restrict the virus. The national ‘Stay-at-Home’ public health measure implemented in March 2020 contributed to labour market adjustments such as furloughed employment, layoffs, pay cuts, and reductions in working hours. There was a sharp falloff in demand for labour, and job advertisements in the print media declined by 43.4 per cent (year-on-year) during the first half of 2020. Retrenchment notices filed with the Ministry of Labour and Small Enterprise Development (MLSED) show that 363 persons were retrenched during the first half of 2020, with the majority of layoffs occurring in the manufacturing industry.
Domestic inflation remained low in the early months of 2020, partly reflecting slow consumer demand. Headline inflation measured 0.4 per cent (year-on-year) in March 2020, unchanged from January 2020. Core inflation remained weak at 0.2 per cent due to slower price increases in the health sub-index, while an uptick in food inflation to 1.2 per cent was a result of higher prices for vegetables.
The Energy Commodity Prices Index (ECPI), which is an indicator of the average prices of Trinidad and Tobago’s energy exports, declined 30.1 per cent (year-on-year) during the first eight months of 2020. Following low energy demand and excess supply at the close of 2019, international crude oil prices were further suppressed by geopolitical tensions and adverse demand shocks emanating

ECONOMIC BULLETIN VOLUME XXII NO. 2 2
1 The fiscal year runs from October 1st to September 30th.
from the COVID-19 pandemic. The benchmark West Texas Intermediate (WTI) oil price fell 33.3 per cent (year-on-year) to an average of US$38.05 per barrel over the first eight months of the year. Meanwhile, the Henry Hub (HH) natural gas price declined by 29.1 per cent (year-on-year) to average US$1.86 per million British Thermal Units (mmbtu) over the same period.
The Central Government operations registered an overall deficit of $10.7 billion during the first nine months of the fiscal year (FY) 2019/20 (October 2019 - June 2020). This was larger than the deficit of $4.8 billion recorded in the corresponding period one year earlier and was due to lower revenues, which outpaced the decline in expenditure. The deficit was financed by a combination of external and domestic borrowings and withdrawal from the Heritage and Stabilisation Fund (HSF). At the end of July 2020, net public sector debt outstanding increased to $120.5 billion (71.7 per cent of GDP) from $103.2 billion (62.2 per cent of GDP) in September 2019. In the Mid-Year Budget Review (June 2020), it was indicated that the fiscal accounts are anticipated to record a deficit of $14.5 billion in FY2019/20 compared to original estimates of $5.3 billion. The larger deficit is attributable to a falloff in revenue caused by a slump in energy prices, coupled with a rise in expenditure for support measures amid the COVID-19 pandemic. Some of these measures included salary relief and income supports grants, rent relief grants, accelerated income tax and VAT refunds, and additional food cards. The Central Government issued a US$500 million bond on the international capital market in June 2020 for budgetary support and refinancing purposes. Multilateral support, such as the US$20.0 million loan facility approved by the World Bank in July 2020, was also tapped to address the fallout from COVID-19.
The Central Bank maintained the Repo rate at 3.50 per cent in June 2020, following a 150 basis points reduction in March, when it also cut commercial banks’ reserve requirement by 300 basis points (see Monetary Policy Report May 2020). The changes in March, along with higher net maturities of open market operations and increased fiscal injections, helped push excess liquidity to a daily average of $7,307.4 million over the first eight
months of 2020 compared to $3,379.8 million over the same period in 2019. However, the deliberate boost to liquidity has not yet engendered a pickup in private sector credit on the whole, especially business lending. Nevertheless, consumer lending continued to be robust, supported mainly by lending for debt consolidation and refinancing. Reflecting falling interest rates in the US market, the TT-US rate differential improved to 86 basis points at the end of August.
At the end of August 2020, gross official reserves amounted to US$7,442.4 million (8.8 months of import cover), which was US$513.4 million higher than the end of 2019. Over the reference period, gross official reserves were boosted by drawdowns from the HSF and proceeds from Central Government borrowings. The Central Bank continued to intervene regularly in the foreign exchange market and sales to the authorised dealers amounted to US$890.0 million in the year to August 2020. The increase in gross official reserves suggests that the external accounts registered an overall surplus during the first eight months of 2020.
outlook
World economic performance will be severely impacted by the emergence of COVID-19. Faced with the uncertainty surrounding the prospects for global growth, the International Monetary Fund (IMF) in its June 2020 World Economic Outlook (WEO) Update anticipates global growth to contract by 4.9 per cent in 2020. However, recovery is forecasted for 2021 as policy support aids in normalising economic activity. The IMF notes that swift implementation of targeted fiscal, monetary and financial stability measures are crucial to prevent further contagion effects, support disrupted markets and protect financially impacted households.
Similarly, the health crisis has affected all aspects of the Trinidad and Tobago economy in 2020. The energy sector is expected to slow as global economic activity and international travel have been curtailed, resulting in significant contractions in demand for many energy products. The non-energy sector will also continue to be impacted in a climate of uncertainty as to the course of the disease and the implementation of needed

ECONOMIC BULLETIN VOLUME XXII NO. 2 3
measures. Moreover, global supply disruptions will have knock-on effects on domestic manufacturing, and wholesale and retail trade. Inflation is expected to stay subdued. Working conditions—including shift lengths and timing, rostering and ‘work from home’ arrangements—have already adapted to the changed circumstances in recent months and will continue to evolve.
The room for additional fiscal accommodation will be fairly narrow in the current circumstances, while the prevailing high excess liquidity will influence the timing of fresh monetary policy actions. Overall, the impact of the pandemic has heightened
the imperative for coordinated fiscal, monetary and structural policies for assuring macroeconomic stability. Structural reform is especially important to increase the ease of doing business; enhance flexibility in the provision of public and private sector goods and services; and move forward widespread and safe adoption of digital processes. At the same time, the virus’ pervasive reach has put a stronger light on distributional issues, notably the need to protect the most vulnerable members of society who are likely to bear a disproportionate burden from the pandemic.

ECONOMIC BULLETIN VOLUME XXII NO. 2 4
2016 2017 2018 2019 2020p
intERnational1 World Output 3.4 3.9 3.6 2.9 -4.9Advanced Economies (% change) 1.7 2.5 2.2 1.7 -8.0Emerging and Developing Markets (% change) 4.6 4.8 4.5 3.7 -3.0
domEstic EconomyReal Sector ActivityReal GDP (y-o-y % change)2 -6.3 -2.3 -0.2 n.a. n.a.Energy (y-o-y % change)2 -9.8 0.7 -3.2 n.a. n.a.Non-Energy (y-o-y % change)2 -3.1 -3.4 0.4 n.a. n.a.Headline Inflation (% end-of-period) 3.1 1.3 1.1 0.4 0.4*Headline Inflation (% average) 3.1 1.9 1.0 1.0 0.4**Core Inflation (% average) 2.2 1.6 1.0 1.1 0.2**Unemployment Rate (% average) 4.0 4.8 4.1*** n.a. n.a.
Fiscal Operations3
Central Government Fiscal Balance (% GDP) -5.3 -8.9 -3.6 -2.5pr -3.2bPublic Sector Debt4 (% GDP) 58.3 61.8 60.1 62.2 71.7^
Money and Finance
Commercial Banks Credit to the Private Sector (y-o-y % change)
4.1 5.1 4.1 4.5 1.3^^
Broad Money Supply (M2) (y-o-y % change) 3.2 -2.1 3.1 0.1 6.5^^
External SectorCurrent Account Balance (% GDP)5 -4.4 5.3 5.7 4.8 n.a.Net Official Reserves (end-of-period) (US$ Mn) 9,465.8 8,369.8 7,575.0 6,929.0 7,442.4^^^Net Official Reserves (in months of prospective imports of goods and non-factor services)
10.5 9.7 8.0 7.7 8.8^^^
Sources: Central Bank of Trinidad and Tobago, Ministry of Finance, Central Statistical Office and the International Monetary Fund 1 Sourced from the IMF World Economic Outlook Update, April 2020 and June 2020.2 Real GDP growth rates are sourced from the Central Statistical Office.3 On a fiscal year basis (October – September) - Fiscal flows represent data for the twelve months October to September, debt stocks as at
September of each year.4 Represents outstanding balances at the end of the fiscal year and excludes all securities issued for Open Market Operations (OMOs) including:
Treasury Bills, Treasury Notes, Treasury Bonds and Liquidity Absorption Bonds. 5 Energy goods data for 2016-2019 comprise estimates by the Central Bank of Trinidad and Tobago. * As at March 2020.** For the period January to March 2020.*** For the period January to September 2018.^ As at July 2020.^^ As at June 2020.^^^ As at August 2020.p Provisional.pr Preliminary.b Budgeted.n.a. Not Available.
taBlE 1summaRy of Economic indicatoRs

ECONOMIC BULLETIN VOLUME XXII NO. 2 5
paRt II - intERnational and REgional Economic dEVElopmEnts
1 Year-on-year unemployment rates in the US were recorded at 14.7 per cent in April 2020, 13.3 per cent in May 2020, 11.1 per cent in June 2020, and 10.2 per cent in July 2020.
2 On a year-on-year basis in the second quarter of 2020, Spain, France and Italy registered contractions of 22.1, 19.0 and 17.3 per cent, respectively.
ExtERnal EnViRonmEnt
In 2020, the world economy faces its greatest economic crisis since the 2008-09 global financial crisis. The COVID-19 virus quickly spread throughout the world triggering a pandemic and engendering substantial economic fallout. The International Monetary Fund (IMF), in its June 2020 World Economic Outlook Update (WEO), forecasts the global economy to contract by 4.9 per cent in 2020. Meanwhile, a recovery of 5.4 per cent is anticipated for world growth in 2021. This outcome hinges primarily on the effectiveness of virus containment measures.
adVancEd EconomiEs
Advanced economies have been adversely affected by the COVID-19 virus and have taken swift measures to reduce economic fallout. Economic growth in the United States (US) contracted by 9.1 per cent (year-on-year) in the second quarter of 2020 amid individual state “Stay-at-Home” orders aimed at curbing the effects of the novel coronavirus (Table 2). This order led to a reduction in demand as consumers redirected or restricted their spending and businesses and schools ceased operations or switched to remote work. Over the first seven months of 2020, inflation as measured by the Core Personal Consumption Expenditure (PCE) Index remained below the target rate of 2.0 per cent. In the four months to July 20201, US unemployment rates registered double-digits, as the closure of many businesses resulted in an increased number of persons filing for unemployment benefits (Table 3). The US Federal Reserve (the Fed) reduced its target range for the federal funds rate by a cumulative 150 basis points in March 2020, bringing the range to 0 to 0.25 per cent, and maintained in July 2020. On April 09 2020, in an effort to bolster the economy, the Fed announced a new stimulus package, which provides up to US$2.3 trillion in loans.
In the second quarter of 2020, economic activity in the Euro Area recorded its sharpest contraction since the time series began in 1995. Economic growth contracted by 15.0 per cent (year-on-year) with
some of the Euro Area’s largest economies recording steep contractions: Spain, France and Italy2—which were some of the most significantly impacted from the coronavirus—registered the highest declines. The European Central Bank (ECB) maintained the interest rate on the main refinancing operations and deposit facility at 0.0 per cent and -0.5 per cent, respectively in April, June and July 2020, and expects interest rates to remain at present levels until inflation converges sufficiently close to, but below 2.0 per cent. In July 2020, the Euro Area’s inflation rate increased to 0.4 per cent (year-on-year) following a rate of 0.3 per cent in the previous month, reflecting an uptick in prices for non-energy industrial goods, and services (Table 4).
Economic activity in the United Kingdom (UK) contracted by 21.7 per cent (year-on-year) in the second quarter of 2020, marking two consecutive quarters of decline. Meanwhile, the Bank of England (BoE) cut its key interest rate by 15 basis points to 0.1 per cent in a special meeting held on March 19, 2020, which was subsequently maintained in August 2020. In other developments, as at July 23, 2020 six rounds of negotiations were completed on the future partnership between the European Union (EU) and the UK. Negotiations have centred on; trade in goods and services, transport, energy and civil nuclear cooperation, security and law enforcement, participation in EU programmes and governance arrangements. It is intended that full ratification and implementation of these arrangements will begin from January 01, 2021.
Real GDP in Japan contracted by 9.9 per cent (year-on-year) in the second quarter of 2020 due to declines in private consumption and capital expenditure. Meanwhile, inflation increased moderately to 0.3 per cent (year-on-year) in July 2020. The Bank of Japan (BoJ) anticipates that economic activity and inflation will remain weak in the near-term. The BoJ left its key short-term interest rate unchanged at -0.1 per cent in July 2020 and pledged to increase its purchases of corporate debt, and implement a new programme of short-term, zero-rated loans to financial institutions.

ECONOMIC BULLETIN VOLUME XXII NO. 2 6
taBlE 3RatE of unEmploymEnt in adVancEd EconomiEs
(pER cEnt)
Dec-19 Jan-20 Feb-20 Mar-20 Apr-20 May-20 Jun-20 Jul-20
United States 3.5 3.6 3.5 4.4 14.7 13.3 11.1 10.2
United Kingdom 3.8 3.9 4.0 3.9 3.9 3.9 3.9 n.a.
Euro Area 7.4 7.4 7.3 7.2 7.4 7.5 7.7 7.9
Japan 2.2 2.4 2.4 2.5 2.6 2.9 2.8 2.9Source: Bloomberg
taBlE 4HEadlinE inflation in adVancEd EconomiEs
(yEaR-on-yEaR pER cEnt cHangE)
Dec-19 Jan-20 Feb-20 Mar-20 Apr-20 May-20 Jun-20 Jul-20
United States1 1.6 1.8 1.9 1.7 0.9 1.0 1.1 1.3
United Kingdom 1.3 1.8 1.7 1.5 0.8 0.5 0.6 1.0
Euro Area 1.3 1.4 1.2 0.7 0.3 0.1 0.3 0.4
Japan 0.8 0.7 0.4 0.4 0.1 0.1 0.1 0.3Source: Bloomberg
1 Core PCE price index.
taBlE 2adVancEd EconomiEs – QuaRtERly gdp gRowtH
(yEaR-on-yEaR pER cEnt cHangE)
2019 2020
QI QII QIII QIV QI QII
United States 2.3 2.0 2.1 2.3 0.3 -9.1
United Kingdom 2.0 1.4 1.3 1.1 -1.7 -21.7
Euro Area 1.4 1.3 1.4 1.0 -3.1 -15.0
Japan 0.8 0.9 1.7 -0.7 -1.8 -9.9
Source: Bloomberg
EmERging maRkEt and dEVEloping EconomiEs
Despite the efforts by EMDEs to mitigate the adverse spill-over effects of the COVID-19 outbreak, the economic fallout has been widespread. In the second quarter of 2020, China’s economy expanded by 3.2 per cent, following a contraction of 6.8 per cent in the previous quarter (Table 5). Economic activity in the world’s second-largest economy rebounded in the three months to June 2020, as the manufacturing and retail sectors resumed activity. Following above-target inflation in the first four months of 2020, China’s inflation rate averaged 2.5 per cent over the three months to July 20203 (Table 6). In an effort to shore up economic output, the Peoples Bank of China (PBoC)
injected liquidity into the financial system via open market operations. In July, the PBoC maintained its benchmark interest rate—the 1-year Loan Prime Rates (LPR)—at 3.85 per cent while the 5-year LPR, which is generally applied to new mortgage loans, remained unchanged at 4.65 per cent. This follows reductions of 20 basis points (bps) and 10 bps, respectively in March. Further, the banks granted deferral extensions to qualifying small and medium-sized businesses on payments or interest due between January 25 and June 30, 2020.
The Brazilian economy shrank by 11.4 per cent (year-on-year) in the second quarter of 2020, marking two consecutive quarters of contractions. Meanwhile, Brazil’s inflation rate accelerated to 2.3
3 Central Bank inflation target rates and ranges for selected emerging market and developing economies: China (3.0 per cent); Brazil (4.0 +/-1.5 per cent); India (4.0+/-2.0 per cent); and Russia (4.0 per cent).

ECONOMIC BULLETIN VOLUME XXII NO. 2 7
taBlE 6HEadlinE inflation in EmERging EconomiEs
(yEaR-on-yEaR pER cEnt cHangE)
Dec-19 Jan-20 Feb-20 Mar-20 Apr-20 May-20 Jun-20 Jul-20
China 4.5 5.4 5.2 4.3 3.3 2.4 2.5 2.7India 7.4 7.6 6.6 5.8 7.2 6.3 6.2 6.9Russia 3.0 2.4 2.3 2.5 3.1 3.0 3.2 3.4Brazil 4.3 4.2 4.0 3.3 2.4 1.9 2.1 2.3
Source: Bloomberg
taBlE 5EmERging EconomiEs - QuaRtERly gdp gRowtH
(yEaR-on-yEaR pER cEnt cHangE)
2019 2020
QI QII QIII QIV QI QII
China 6.4 6.2 6.0 6.0 -6.8 3.2India 5.7 5.2 4.4 4.1 3.1 -23.9Russia 0.4 1.1 1.5 2.1 1.6 -8.5Brazil 0.6 1.1 1.2 1.7 -0.3 -11.4
Source: Bloomberg
4 Jamaica’s fiscal year runs from April 01 to March 31.
per cent (year-on-year) in July 2020. In monetary policy developments, the Central Bank lowered its overnight interbank interest rate by 25 basis points to a historic low of 2.00 per cent in August 2020. The World Health Organization (WHO) stated in May 2020 that South America was the ‘new epicentre’ of the pandemic, with Brazil recording the largest number of fatalities within the region.
The Indian economy registered its largest contraction on record of 23.9 per cent (year-on-year) in the second quarter of 2020, down from the previous quarter’s growth of 3.1 per cent. Meanwhile, inflation continued to trend above the Reserve Bank of India’s (RBI) target rate in July 2020. The RBI
lowered its repo rate by 40 bps to 4.0 per cent in May 2020 following a previous 75 bps reduction in March.
Against the backdrop of a weakened foreign economic environment, declining commodity prices, and coronavirus-related lockdown measures, Russia’s real GDP growth rate contracted by 8.5 per cent (year-on-year) in the second quarter of 2020. In July 2020, the Bank of Russia’s main interest rate—the benchmark one-week repo rate—was lowered by 25 bps to 4.25 per cent, alongside additional facilities such as the restructuring of loans of citizens, and limits on bank fees charged to customers.
REgional Economic dEVElopmEnts
The Latin American region faced a low-growth environment in early 2020. Economic growth in Mexico, Chile and Colombia recorded double-digit contractions (year-on-year) in the second quarter of 18.7 per cent, 14.1 per cent and 15.7 per cent (Table 7), respectively, owing to disruptions in production. On a year-on-year basis, real GDP in Peru declined by 3.4 per cent in the first quarter. In the Caribbean, international organisations have provided financial and other forms of aid to the region (Table 9).
In the first quarter of 2020, Jamaica’s year-on-year real GDP growth recorded its steepest contraction
since the second quarter of 2010. Undermined by declines in mining and quarrying, hotels and restaurants, construction, and other services, growth contracted by 2.3 per cent (Table 8). The Bank of Jamaica (BOJ) anticipates lower than target inflation (4.0 per cent to 6.0 per cent) over the fiscal year4, as well as the ensuing eight quarters. The BOJ maintained its key policy rate at 0.5 per cent in August 2020 for the twelfth straight meeting. Furthermore, the BOJ took pre-emptive measures to bolster foreign currency liquidity and Jamaican dollar liquidity by reducing the cash reserve requirements of deposit-taking institutions.

ECONOMIC BULLETIN VOLUME XXII NO. 2 8
Real GDP in Barbados contracted by an estimated 27.0 per cent in the second quarter of 2020, largely driven by sharp declines in tourism, construction, distribution, transportation, and other related activities. Gross international reserves continued on an upward trend increasing to US$1,008.3 million (26.9 weeks of import cover) as at June 2020, from US$740.5 million (18.6 weeks of import cover) at the end of December 2019. The Central Bank of Barbados (CBB) announced a reduction in the Bank’s deposit rate—the rate at which it provides overnight lending to commercial banks and deposit-taking non-banks—to 2.0 per cent from 7.0 per cent. In addition, the CBB reduced its securities ratio—the percentage of deposits that commercial banks are required to hold as cash—for banks to
5.0 per cent from 17.5 per cent. The country also successfully completed its third Review under the IMF’s Extended Fund Facility in June 2020.
The Bank of Guyana introduced several measures including: loan payment deferrals to assist customers and companies with their liquidity positions and, waivers of particular banking-related fees. Guyana’s economic prospects continued to improve following another crude oil discovery in January 2020, marking the 16th discovery on the Stabroek Block. In January 2020, Guyana officially exported its first shipment of crude oil to the US (1.0 million barrels of oil) receiving US$55.0 million which was deposited into the National Resource Fund.
taBlE 7latin amERica - QuaRtERly gdp gRowtH
(yEaR-on-yEaR pER cEnt cHangE)
2019 2020
QI QII QIII QIV QI QII
Mexico 1.1 -1.2 -0.4 -0.7 -1.3 -18.7Chile 1.4 1.8 3.4 -2.1 0.2 -14.1Colombia 2.9 3.1 3.4 3.5 1.4 -15.7Peru 2.4 1.2 3.2 1.8 -3.4 n.a.
Source: Bloomberg

ECONOMIC BULLETIN VOLUME XXII NO. 2 9
taBlE 8sElEctEd macRoEconomic indicatoRs foR tHE caRiBBEan
indicatoR countRy 2015r 2016r 2017r 2018r 2019r 2020
Balance of Payments Current Account Balance/GDP -
Per Cent
Barbados -6.1 -4.3 -3.8 -4.0 -2.8 -8.0
Belize -10.1 -9.2 -7.1 -8.1 -7.8 -1.6
Guyana -4.6 -2.4 -6.2 -32.1 -40.3e n.a.
Jamaica -3.0 -0.3 -2.6 -1.8 -1.9 0.3
ECCU -5.4 -8.3 -7.7 -12.0 n.a. n.a.
Real GDP Growth - Per Cent
Barbados 2.4 2.6 0.6 -0.4 -0.1 -27.0
Belize 2.8 0.1 1.9 2.1 0.3 -23.3
Guyana 3.1 3.4 2.1 4.1 4.7 n.a.
Jamaica 0.9 1.4 1.0 1.9 0.9 -2.3
ECCU 2.0 3.2 0.8 3.9 3.3 n.a.
Inflation (End of Period) - Year-on-Year Per Cent
Change
Barbados -2.5 3.8 6.6 0.6 7.2 2.4
Belize -0.6 1.1 1.1 -0.1 0.2 0.6
Guyana -1.8 1.5 1.5 1.6 2.1 0.4
Jamaica 3.7 1.7 5.2 2.4 6.2 5.7
ECCU -1.2 -1.3 2.3 1.4 -0.2 0.0
Reserves - Months of Imports of Goods and
Services
Barbados 2.6 1.9 1.2 2.9 4.3 6.2
Belize 5.0 4.5 4.0 3.6 3.1 3.2
Guyana 3.7 3.7 3.2 2.6 1.6 n.a.
Jamaica 4.4 5.6 6.3 4.5 5.3 8.4
Foreign Currency Long-Term Credit Rating :
S&P
Barbados B B- CCC+ SD B- B-
Belize B- CC B- B- B- CCC+
Jamaica B B B B B+ B+
Foreign Currency Long-Term Credit Rating :
Moody’s
Barbados B3 Caa1 Caa3 Caa3 Caa1 Caa1
Belize Caa2 Caa2 B3 B3 B3 Caa1
Jamaica Caa2 B3 B3 B3 B2 B2Sources: Bloomberg, International Monetary Fund, Central Bank of Barbados, Central Bank of Belize, Bank of Guyana, Bank of
Jamaica, Eastern Caribbean Central Bank, Guyana Bureau of Statistics, Statistical Institute of Belize and Statistical Institute of Jamaica
Notes:
1 Data for Reserves are unavailable for the Eastern Caribbean Currency Union (ECCU).2 Credit ratings for S&P and Moody’s are not available for Guyana and the ECCU. Individual credit ratings are available for se-
lected member countries of the ECCU. Ratings for 2020 are as at September 1, 2020.3 Data for 2020 for Barbados are as follows: balance of payments data are for the first six months of 2020, real GDP growth data
are for the second quarter of 2020, inflation data are for June 2020 and import cover data are for June 2020 and converted from 26.9 weeks to months.
4 Data for 2020 for Belize are as follows: balance of payments data are for the first quarter of 2020, real GDP growth data are for the second quarter of 2020, inflation data are for June 2020 and import cover data are for May 2020.
5 Data for 2020 for Guyana are as follows: inflation data are for July 2020.6 Data for 2020 for Jamaica are as follows: balance of payments data are for the first quarter of 2020, real GDP growth data are
for the first quarter of 2020, inflation data are for July 2020 and import cover data are for July 2020 and converted from 36.54 weeks to months.
7 Data for 2020 for the ECCU are as follows: inflation data are for the June 2020.e Estimate.r Revised.

ECONOMIC BULLETIN VOLUME XXII NO. 2 10
Institution Financial Assistance Provided
The International Monetary Fund (IMF)
Haiti became the first Caribbean recipient of IMF financial assistance in April 2020 to assist the economy with COVID-19 related challenges. The IMF approved a disbursement of US$111.6 million through the Rapid Financing Instrument (RFI) to address balance of payments needs, aid with essential health expenditures and provide income support to households. Furthermore, the Fund intends to support Haiti through a Staff Monitored Program to aid with restoring macroeconomic stability and sustainability.
In April 2020, the IMF Executive Board approved the disbursement of funds to Grenada (US$22.4 million), St. Lucia (US$29.2 million), and Dominica (US$14.0 million), to aid with the countries’ relief and development efforts amid the COVID-19 pandemic. These funds were received under the RFI and will focus on balance of payments needs, fostering fiscal space for necessary health expenditures, income relief to workers, and cash assistance to households.
In May 2020, the IMF approved the disbursement of US$520.0 million to Jamaica under the RFI to address balance of payment requirements stemming from COVID-19 related economic disruptions. The IMF also approved the disbursement of US$16.0 million to St. Vincent and the Grenadines in May 2020 under the RCF.
In June 2020, the IMF disbursed US$250.0 million to The Bahamas under the RFI to help address balance of payments needs. During the same month, Barbados received US$91.0 million under the IMF’s Extended Fund Facility (EFF) to assist the economy in dealing with COVID-19 related shocks.
The World Bank (WB)
The WB has made available funding to five (5) Caribbean territories through the redeployment of existing projects. More specifically, Grenada (US$20.0 million), St. Lucia (US$10.5 million), Dominica (US$6.6 million), St. Vincent and the Grenadines (US$4.5 million), and Suriname (US$0.4 million) will utilise the funding to enhance the capacity of their respective healthcare systems, support agricultural and food security initiatives and provide assistance to unemployed individuals. Trinidad and Tobago also received US$20.0 million through the WB’s Emergency Response Project to support the Government’s COVID-19 responsiveness plan.
Caribbean Development Bank (CDB)
In May 2020, the CDB made available emergency loans to seven (7) Caribbean nations; Antigua and Barbuda (US$13.0 million), Belize (US$15.0 million), Dominica (US$2.5 million), Grenada (US$5.9 million), St. Lucia (US$10.8 million), St. Vincent and the Grenadines (US$11.3 million), and Suriname (US$8.2 million). These facilities provide liquidity and fiscal room needed by the respective Governments to address emergency spending requirements.
In response to the impact on the cultural and creative industries, the CDB has made a grant of US$100,000.0 available to these industries through its Cultural and Creative Industries Innovation Fund (CIIF). The grant is focused on entrepreneurs to aid with product creation, market distribution activities and the development of digital technologies to share the content.
Inter-American Development Bank (IDB)
The IDB approved a policy-based loan of US$100.0 to help Trinidad and Tobago finance its public health response against the COVID-19 pandemic.
Furthermore, in May 2020, the IDB approved a grant of US$750,000 to support the Caribbean Public Health Agency (CARPHA) in the co-ordination of its regional response to the pandemic.
CAF Development Bank of Latin America
CAF granted two loans with a total value of US$150.0 million to Trinidad and Tobago, which are geared towards assisting the country’s COVID-19 response. Additionally, a donation of US$400,000 was received to enhance the country’s healthcare system against the fight.
European Union (EU)
The EU provided a grant of US$8.6 million to assist the Caribbean region in its fight against COVID-19. The proceeds were made available to CARPHA and will be used to purchase test kits, personal protective equipment and all other materials required for testing purposes.
United Kingdom (UK)
In May 2020, the UK contributed US$3.8 million to assist eight (8) Caribbean nations - Antigua and Barbuda, Belize, Dominica, Grenada, Guyana, Jamaica, St. Lucia, and St. Vincent and the Grenadines - to be distributed through the Pan American Health Organization (PAHO). The financial support focused on the following areas; improving healthcare settings and laboratory capacity, scale-up communication on public health information, and the implementation of infection prevention and control measures.
taBlE 9intERnational financial assistancE to tHE caRiBBEan in REsponsE to tHE coVid-19 pandEmic
Source: International Monetary Fund, World Bank, Caribbean Development Bank, Eastern Caribbean Central Bank, Inter-American Development Bank, CAF Development Bank of Latin America, European Union, and the Pan American Health Organisation.
ECONOMIC BULLETIN VOLUME XXII NO. 2 11
paRt III - intERnational commodity pRicEs
5 The ECPI is used by the Central Bank to gauge the overall movements in the prices of Trinidad and Tobago’s main energy export products. For further details, see http://www.central-bank.org.tt/sites/default/files/page-file-uploads/Economic%20Bulletin%20July%202010%20Article%20IIb.pdf.
6 On April 20, 2020, West Texas Intermediate (WTI) futures prices for delivery in May 2020 turned negative as fears arose that oil storage space in the US was running out.
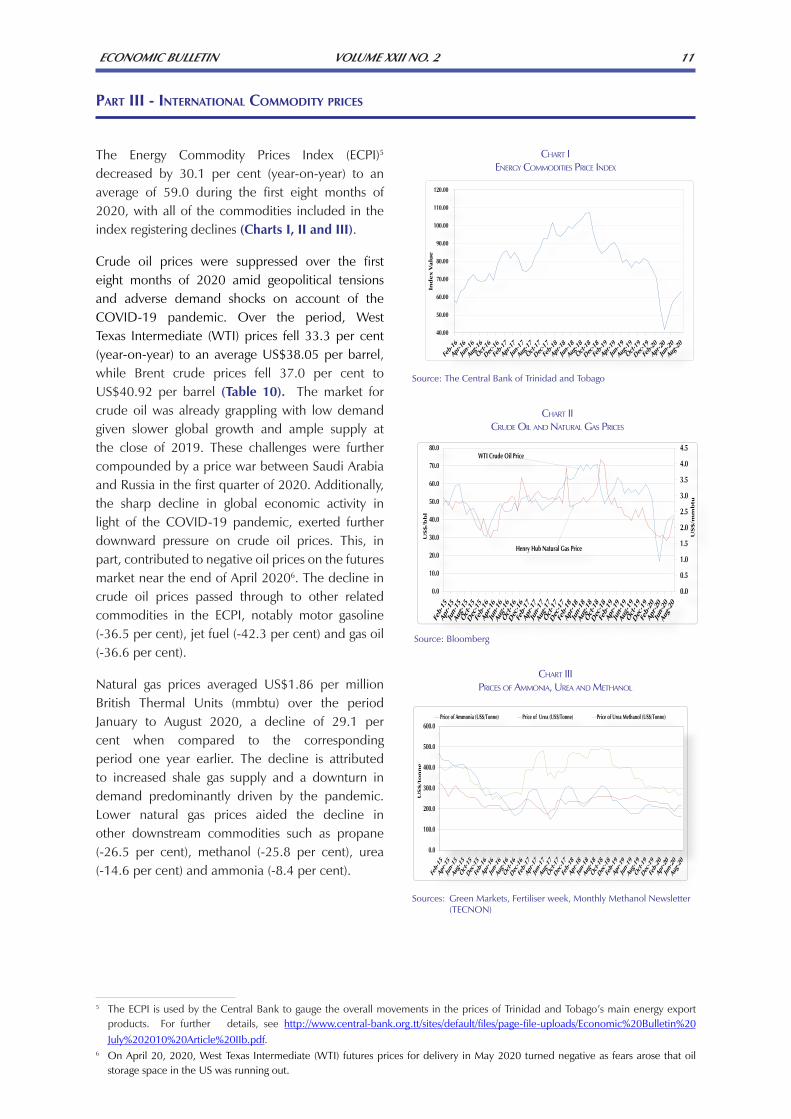
The Energy Commodity Prices Index (ECPI)5 decreased by 30.1 per cent (year-on-year) to an average of 59.0 during the first eight months of 2020, with all of the commodities included in the index registering declines (Charts I, II and III).
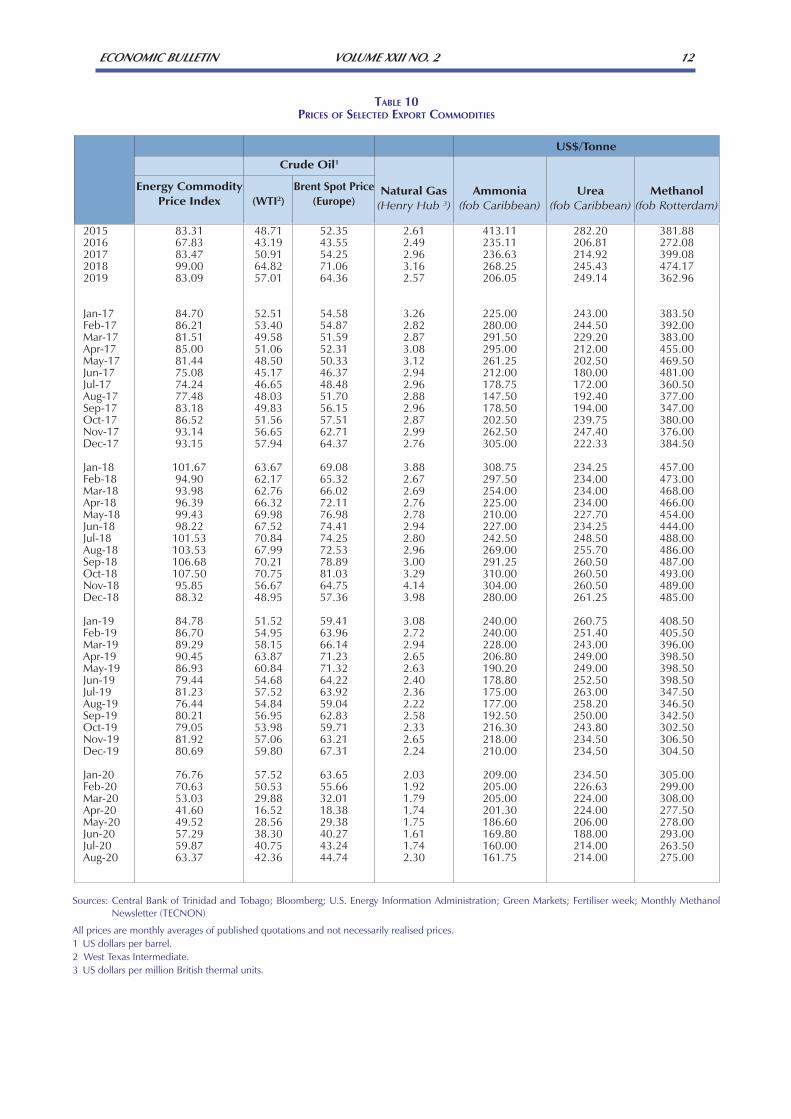
Crude oil prices were suppressed over the first eight months of 2020 amid geopolitical tensions and adverse demand shocks on account of the COVID-19 pandemic. Over the period, West Texas Intermediate (WTI) prices fell 33.3 per cent (year-on-year) to an average US$38.05 per barrel, while Brent crude prices fell 37.0 per cent to US$40.92 per barrel (Table 10). The market for crude oil was already grappling with low demand given slower global growth and ample supply at the close of 2019. These challenges were further compounded by a price war between Saudi Arabia and Russia in the first quarter of 2020. Additionally, the sharp decline in global economic activity in light of the COVID-19 pandemic, exerted further downward pressure on crude oil prices. This, in part, contributed to negative oil prices on the futures market near the end of April 20206. The decline in crude oil prices passed through to other related commodities in the ECPI, notably motor gasoline (-36.5 per cent), jet fuel (-42.3 per cent) and gas oil (-36.6 per cent).
Natural gas prices averaged US$1.86 per million British Thermal Units (mmbtu) over the period January to August 2020, a decline of 29.1 per cent when compared to the corresponding period one year earlier. The decline is attributed to increased shale gas supply and a downturn in demand predominantly driven by the pandemic. Lower natural gas prices aided the decline in other downstream commodities such as propane (-26.5 per cent), methanol (-25.8 per cent), urea (-14.6 per cent) and ammonia (-8.4 per cent).
Sources: Green Markets, Fertiliser week, Monthly Methanol Newsletter (TECNON)
chaRt IIIpRices of ammonia, URea and methanol
Source: The Central Bank of Trinidad and Tobago
chaRt IeneRgy commodities pRice index
Source: Bloomberg
chaRt IIcRUde oil and natURal gas pRices
ECONOMIC BULLETIN VOLUME XXII NO. 2 12
taBlE 10pRicEs of sElEctEd ExpoRt commoditiEs
US$/Tonne
Crude Oil1
Natural Gas(Henry Hub 3)
Ammonia(fob Caribbean)
Urea(fob Caribbean)
Methanol(fob Rotterdam)
Energy CommodityPrice Index (WTI2)
Brent Spot Price(Europe)
2015 83.31 48.71 52.35 2.61 413.11 282.20 381.882016 67.83 43.19 43.55 2.49 235.11 206.81 272.082017 83.47 50.91 54.25 2.96 236.63 214.92 399.082018 99.00 64.82 71.06 3.16 268.25 245.43 474.172019 83.09 57.01 64.36 2.57 206.05 249.14 362.96
Jan-17 84.70 52.51 54.58 3.26 225.00 243.00 383.50Feb-17 86.21 53.40 54.87 2.82 280.00 244.50 392.00Mar-17 81.51 49.58 51.59 2.87 291.50 229.20 383.00Apr-17 85.00 51.06 52.31 3.08 295.00 212.00 455.00May-17 81.44 48.50 50.33 3.12 261.25 202.50 469.50Jun-17 75.08 45.17 46.37 2.94 212.00 180.00 481.00Jul-17 74.24 46.65 48.48 2.96 178.75 172.00 360.50Aug-17 77.48 48.03 51.70 2.88 147.50 192.40 377.00Sep-17 83.18 49.83 56.15 2.96 178.50 194.00 347.00Oct-17 86.52 51.56 57.51 2.87 202.50 239.75 380.00Nov-17 93.14 56.65 62.71 2.99 262.50 247.40 376.00Dec-17 93.15 57.94 64.37 2.76 305.00 222.33 384.50
Jan-18 101.67 63.67 69.08 3.88 308.75 234.25 457.00Feb-18 94.90 62.17 65.32 2.67 297.50 234.00 473.00Mar-18 93.98 62.76 66.02 2.69 254.00 234.00 468.00Apr-18 96.39 66.32 72.11 2.76 225.00 234.00 466.00May-18 99.43 69.98 76.98 2.78 210.00 227.70 454.00Jun-18 98.22 67.52 74.41 2.94 227.00 234.25 444.00Jul-18 101.53 70.84 74.25 2.80 242.50 248.50 488.00Aug-18 103.53 67.99 72.53 2.96 269.00 255.70 486.00Sep-18 106.68 70.21 78.89 3.00 291.25 260.50 487.00Oct-18 107.50 70.75 81.03 3.29 310.00 260.50 493.00Nov-18 95.85 56.67 64.75 4.14 304.00 260.50 489.00Dec-18 88.32 48.95 57.36 3.98 280.00 261.25 485.00
Jan-19 84.78 51.52 59.41 3.08 240.00 260.75 408.50Feb-19 86.70 54.95 63.96 2.72 240.00 251.40 405.50Mar-19 89.29 58.15 66.14 2.94 228.00 243.00 396.00Apr-19 90.45 63.87 71.23 2.65 206.80 249.00 398.50May-19 86.93 60.84 71.32 2.63 190.20 249.00 398.50Jun-19 79.44 54.68 64.22 2.40 178.80 252.50 398.50Jul-19 81.23 57.52 63.92 2.36 175.00 263.00 347.50Aug-19 76.44 54.84 59.04 2.22 177.00 258.20 346.50Sep-19 80.21 56.95 62.83 2.58 192.50 250.00 342.50Oct-19 79.05 53.98 59.71 2.33 216.30 243.80 302.50Nov-19 81.92 57.06 63.21 2.65 218.00 234.50 306.50Dec-19 80.69 59.80 67.31 2.24 210.00 234.50 304.50
Jan-20 76.76 57.52 63.65 2.03 209.00 234.50 305.00Feb-20 70.63 50.53 55.66 1.92 205.00 226.63 299.00Mar-20 53.03 29.88 32.01 1.79 205.00 224.00 308.00Apr-20 41.60 16.52 18.38 1.74 201.30 224.00 277.50May-20 49.52 28.56 29.38 1.75 186.60 206.00 278.00Jun-20 57.29 38.30 40.27 1.61 169.80 188.00 293.00Jul-20 59.87 40.75 43.24 1.74 160.00 214.00 263.50Aug-20 63.37 42.36 44.74 2.30 161.75 214.00 275.00
Sources: Central Bank of Trinidad and Tobago; Bloomberg; U.S. Energy Information Administration; Green Markets; Fertiliser week; Monthly Methanol Newsletter (TECNON)
All prices are monthly averages of published quotations and not necessarily realised prices.1 US dollars per barrel.2 West Texas Intermediate.3 US dollars per million British thermal units.

ECONOMIC BULLETIN VOLUME XXII NO. 2 13
paRt IV - domEstic Economic actiVity
7 The CSO is the official source of National Accounts (GDP) data in Trinidad and Tobago. The Bank compiles a Quarterly Index of Real Economic Activity (QIEA) to gauge short-term economic activity. The QIEA differs from the CSO’s national accounts statistics in terms of methodologies and coverage. The QIEA is based on production indicators, excludes price effects and does not comprehensively cover all sub-industries measured by the CSO. For further details on the QIEA methodology and differences in the data see Box 2 of the January 2020 Economic Bulletin (pages 15-17); Box2 of the March 2017 Economic Bulletin (pages 19-20); and Public Education Statement – November 2016. See link to the CSO’s quarterly National Accounts (GDP) data – National Accounts.
8 The Central Bank of Trinidad and Tobago has rebased its Quarterly Index of Real Economic Activity (QIEA) from a base year of 2010 to 2012 and has changed the classification system from the Trinidad and Tobago System of National Accounts (TTSNA) to the International Standard Industrial Classification of All Economic Activities, Revision 4 (ISIC Rev. 4).
9 Under the ISIC Rev. 4 classification system, refining and petrochemicals are subsumed within the Manufacturing sector. However, to better understand economic performance of the non-energy sector, Manufacturing is analysed after removing the refining and petrochemicals components. Manufacturing as presented here includes the production of food, drink and tobacco; textiles, clothing, leather, wood, paper and printing; chemicals and chemical products; and other manufactured products (pharmaceuticals, other non-metallic products, rubber and plastic products and other manufacturing).
Domestically, production of some energy products contracted during the second quarter of 2020, while other indicators monitored by the Central Bank pointed to sluggishness in the non-energy economy during the first quarter of the year.7, 8(Table 11).
EnERgy
Lower natural gas output resulted in widespread contractions in the domestic energy sector. Natural gas production declined by 6.1 per cent (year-on-year) compared to the second quarter of 2019, given lower output from bpTT, the country’s largest natural gas producer. Meanwhile, crude oil production fell by 5.7 per cent (year-on-year) to average 55,945.3 barrels per day (b/d) in the second quarter of 2020 (Table 12). Along with the decline in natural gas production, activity in the midstream sector also registered decreases. Liquefied natural gas (LNG) production fell by 2.3 per cent and natural gas liquids (NGLs) output fell by 9.1 per cent. In the downstream industry, the closure of several petrochemical plants in 2020, largely resulting from the COVID-19 pandemic and its effect on the world economy, led to a decline of 10.9 per cent (year-on-year) in petrochemical output during the second quarter of 2020. Methanol production suffered the largest decrease (25.1 per cent year-on-year) aided by the suspension of operations at Proman’s TTMC II (M3) facility, the Caribbean Methanol Company facility and the Yara facility. On the other hand, strong performance by several ammonia operators in the second quarter of 2020 resulted in a 2.4 per cent increase in ammonia production over its second quarter performance in 2019.
non-EnERgy
The pace of activity in the non-energy sector was mixed in the first quarter of 2020. Beginning January 30, 2020 with travel restrictions imposed on visitors from China, measures to contain the spread of COVID-19 during the first quarter of 2020 were extended to include the restriction of travelers from several other countries (Italy, Iran, Japan, South Korea, Singapore, France, Germany, and Spain), halting the cruise ship season and closing schools and tertiary education facilities. The Financial and Insurance, and Real Estate activity remained resilient and activity in the Electricity and Water (excluding gas) and Manufacturing (excluding Refining and Petrochemicals) sectors increased, while the Wholesale and Retail Trade (excluding Energy), Construction, and Transportation and Storage sectors posted declines (Appendix Table 1A and Table 1B).
Robust activity of 5.5 per cent (year-on-year) in the Financial and Insurance sector primarily occurred as a result of increases in the loan, investment and deposit portfolios of the commercial banks. The activities of non-banking financial institutions and insurance providers also gained momentum. The number of real estate loans increased by 4.6 per cent, indicative of a higher level of real estate activity. In addition, the Electricity and Water (excluding Gas) sector performed well, posting growth of 2.0 per cent in the first quarter of 2020. Partial data suggest that activity in the Manufacturing (excluding Refining and Petrochemicals)9 sector increased by 0.9 per cent. Capacity utilisation in the manufacturing sector fell to 61.2 per cent during

ECONOMIC BULLETIN VOLUME XXII NO. 2 14
the first quarter of 2020, when compared to 62.8 per cent for the same period in 2019 (Table 13).
Available indicators show a small decline in the Wholesale and Retail Trade (excluding Energy) sector in the first quarter of 2020, despite the elevated demand for food and essential grocery products that occurred in March on account of reports of panic
buying. The Transportation and Storage sector was negatively affected due to restrictions on passenger air transport. The Construction sector slowed, based on evidence of a drop in local sales of cement, as work on several public infrastructural projects including the Curepe Interchange, the Valsayn Pedestrian Walkover and Bridge B1/4 at Mamoral Road, neared completion.
taBlE 12pRoduction of sElEctEd commoditiEs
2019 2020
QI QII QIII QIV QI QII
Crude Oil (000s bbls/d) 59.2 59.3 58.0 59.0 57.4 55.9
Refinery Thoughput (000s bbls/d)1 0.0 0.0 0.0 0.0 0.0 0.0
Natural Gas (mmcf/d) 3,790.0 3,478.7 3,605.0 3,477.3 3,525.7 3,272.0
LNG (000s cubic metres) 7,678.2 6,730.8 7,309.6 7,163.7 7,252.4 6,573.5
Methanol (000s tonnes) 1,375.8 1,382.1 1,490.3 1,423.6 1,467.5 1,035.8
Ammonia (000s tonnes) 1,486.5 1,366.6 1,387.0 1,204.2 1,283.6 1,399.1Source: Ministry of Energy and Energy Industries
1 Petrotrin’s refinery was closed in November 2018.
taBlE 11QuaRtERly indEx of REal Economic actiVity - kEy indicatoRs
yEaR-on-yEaR pER cEnt cHangE
2019 2020
QI QII QIII QIV QI
Total QIEA -3.1 -4.2 -0.2 1.4 -1.9
Energy -6.0 -8.2 0.1 0.2 -4.9
Non-Energy -1.2 -1.5 -0.3 2.1 0.2
Construction 2.9 -3.5 2.8 1.3 -0.7
Wholesale and Retail Trade (Exc. Energy) -0.3 -0.1 -2.1 2.6 -1.0
Manufacturing (Exc. Refining and Petrochemical) -2.7 -1.4 2.2 0.3 0.9
Financial and Insurance Activities 1.9 2.5 4.3 5.9 5.5
Source: Central Bank of Trinidad and Tobago
taBlE 13capacity utilisation in tHE manufactuRing sEctoR
(pER cEnt)
2019 2020
QI QII QIII QIV QI
Manufacturing 62.8 64.1 65.0 65.5 61.2
Food, Beverages and Tobacco Products 69.1 67.9 69.5 72.9 67.7
Textiles, Clothing, Leather, Wood, Paper and Printing 60.3 58.3 63.9 57.8 55.3
Chemical Products 49.8 61.7 56.2 56.8 50.1
Other Manufactured Products 64.5 64.6 63.6 65.2 65.6Source: Central Bank of Trinidad and Tobago
1 Manufacturing excludes the ourput of Petrochemicals, Liquified Natural Gas and Natural Gas Liquids.p Provisional.

ECONOMIC BULLETIN VOLUME XXII NO. 2 15
paRt V - laBouR maRkEt
chaRt ivnUmbeR of peRsons RetRenched
Source: Ministry of Labour and Small Enterprise Development
EmploymEnt
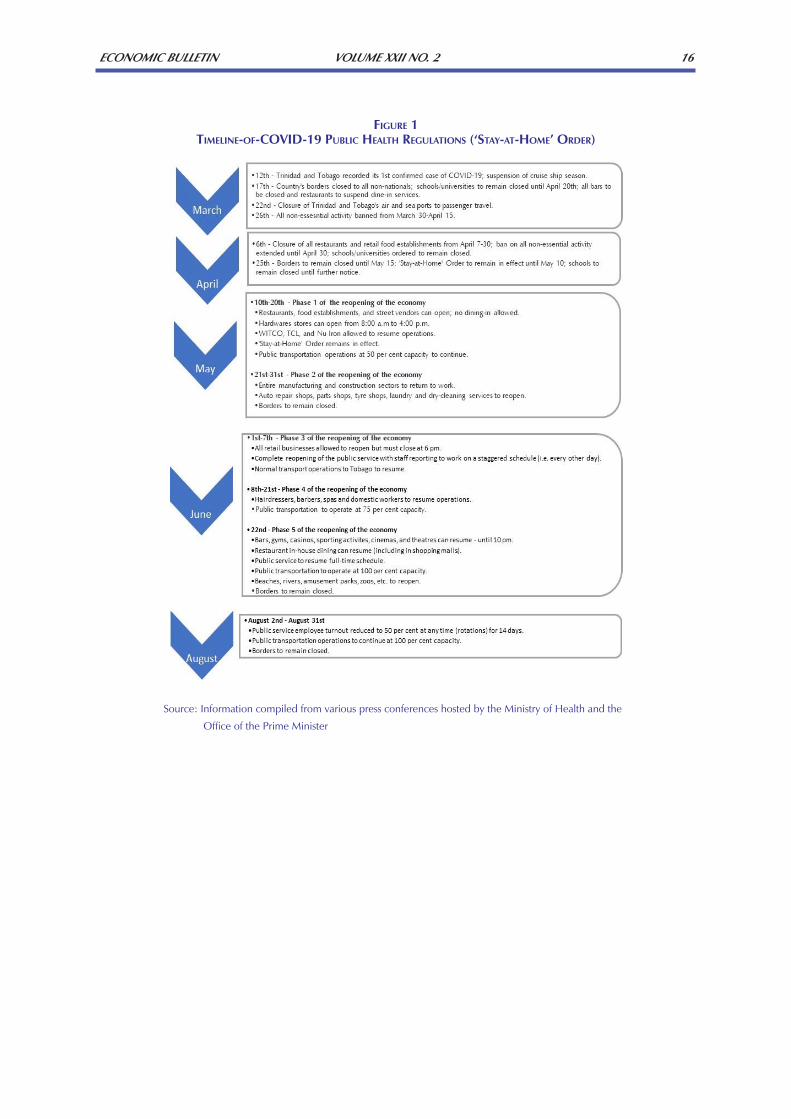
Unsurprisingly, domestic working conditions have been strongly affected by COVID-19 developments, including ‘Stay at Home’ restrictions (see Figure 1). Official Central Statistical Office (CSO) labour statistics are only available through to the third quarter of 2018. Nonetheless, information from the Ministry of Labour and Small Enterprise Development (MLSED) indicated that 363 persons were retrenched during the first six months of 2020, with the manufacturing sector accounting for 64 per cent of all retrenchments during the period (Chart IV). Meanwhile, job advertisements in the print media during the first half of 2020 averaged 192 advertisements compared with 338 advertisements during the similar period of 2019 (a decline of 43.4 per cent), suggesting a sharp decline in the demand for labour compared to last year.
ECONOMIC BULLETIN VOLUME XXII NO. 2 16
figuRE 1timElinE-of-coVid-19 puBlic HEaltH REgulations (‘stay-at-HomE’ oRdER)
Source: Information compiled from various press conferences hosted by the Ministry of Health and the
Office of the Prime Minister
ECONOMIC BULLETIN VOLUME XXII NO. 2 17
paRt VI - domEstic pRicEs
Source: The Central Statistical Office
chaRt Vindex of Retail pRices
(Year on-Year Per Cent Change)
REtail pRicEs
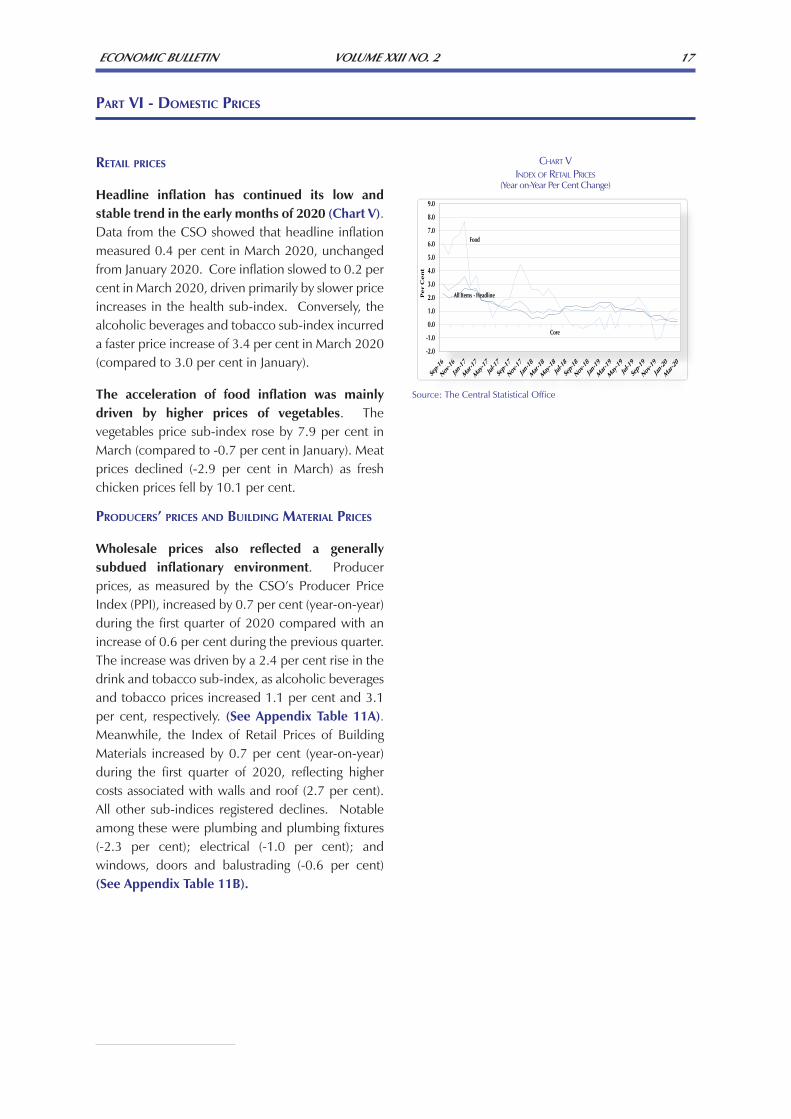
Headline inflation has continued its low and stable trend in the early months of 2020 (Chart V). Data from the CSO showed that headline inflation measured 0.4 per cent in March 2020, unchanged from January 2020. Core inflation slowed to 0.2 per cent in March 2020, driven primarily by slower price increases in the health sub-index. Conversely, the alcoholic beverages and tobacco sub-index incurred a faster price increase of 3.4 per cent in March 2020 (compared to 3.0 per cent in January).
The acceleration of food inflation was mainly driven by higher prices of vegetables. The vegetables price sub-index rose by 7.9 per cent in March (compared to -0.7 per cent in January). Meat prices declined (-2.9 per cent in March) as fresh chicken prices fell by 10.1 per cent.
pRoducERs’ pRicEs and Building matERial pRicEs
Wholesale prices also reflected a generally subdued inflationary environment. Producer prices, as measured by the CSO’s Producer Price Index (PPI), increased by 0.7 per cent (year-on-year) during the first quarter of 2020 compared with an increase of 0.6 per cent during the previous quarter. The increase was driven by a 2.4 per cent rise in the drink and tobacco sub-index, as alcoholic beverages and tobacco prices increased 1.1 per cent and 3.1 per cent, respectively. (See Appendix Table 11A). Meanwhile, the Index of Retail Prices of Building Materials increased by 0.7 per cent (year-on-year) during the first quarter of 2020, reflecting higher costs associated with walls and roof (2.7 per cent). All other sub-indices registered declines. Notable among these were plumbing and plumbing fixtures (-2.3 per cent); electrical (-1.0 per cent); and windows, doors and balustrading (-0.6 per cent) (See Appendix Table 11B).

ECONOMIC BULLETIN VOLUME XXII NO. 2 18
paRt VII - cEntRal goVERnmEnt fiscal opERations
10 The Central Government amended the HSF Act to allow for withdrawals of funds not exceeding US$1.5 billion or TT$10.0 billion at any time during the fiscal year where: a disaster area is declared under the Disaster Measures Act; a dangerous infectious disease is declared under the Public Health Ordinance; or there is, or is likely to be, a precipitous decline in budgeted revenues which are based on the production or price of crude oil or natural gas.
11 West Texas Intermediate (WTI) crude oil prices averaged US$43.57 per barrel in the first nine months of FY2019/20 compared with US$57.82 per barrel in the corresponding period of FY2018/19. Similarly, Henry Hub natural gas prices averaged US$2.01 per British Thermal Units (mmbtu) in the first nine months of FY2019/20 compared with US$3.09 per mmbtu in the corresponding period of FY2018/19.
12 Implemented as a policy decision through the Cabinet in response to the COVID-19 pandemic. 13 The Mid-Year Budget Review was presented in Parliament on June 12, 2020. https://www.finance.gov.tt/wp-content/uploads/2020/06/
Supplementary-Appropriation-and-Mid-Year-Review-Statement-2020.pdf.14 Measures include a temporary salary relief grant and income support grant of up to $1,500 for a period of up to 3 months, a rent
relief grant of $2,400 for a period of up to 3 months, a liquidity support programme for Credit Unions, accelerated income tax and VAT refunds for individuals and companies within a particular threshold and a special grant facility for Tobago hoteliers.
The Central Government fiscal accounts registered an overall deficit for the first nine months of the fiscal year (FY) 2019/20 (October 2019 – June 2020). According to data provided by the Ministry of Finance, the fiscal accounts recorded a deficit of $10.7 billion over the period (Table 14). This compares with a deficit of $4.8 billion recorded in the corresponding period one year earlier. The higher deficit was primarily on account of lower revenues which outpaced the decline in expenditure and was financed from a combination of external and domestic borrowings, as well as a withdrawal from the HSF10. Moreover, the non-energy fiscal deficit expanded over the period to $16.6 billion from $15.2 billion one year earlier.
Central Government total revenue collections declined by 30.2 per cent to roughly $25.0 billion over the nine months to June 2020. The reduction in earnings was reflective of a simultaneous fall-off in both energy and non-energy receipts. Energy revenue fell by 43.1 per cent to $5.9 billion owing to lower energy commodity prices11. Meanwhile, non-energy receipts fell to $18.7 billion from $24.5 billion on account of lower non-tax revenue and collections from taxes on income and profits and international trade. Capital revenue also declined
by $588.3 million to reach $383.1 million over the period due to lower proceeds from the sale of assets when compared to the similar period one year ago.
Smaller outlays on all categories of recurrent expenditure, particularly transfers and subsidies and goods and services precipitated the decline in overall expenditure. However, lower expenditure on transfers and subsidies was partially offset by higher redistributive spending on the Senior Citizens Grant, Disability Grant, Social Assistance, Food Price Support Programme and Salary Relief Grant12.
The Central Government anticipates a higher fiscal deficit than initially budgeted for FY2019/20 in light of the novel coronavirus pandemic. In the June Mid-Year Budget Review13, the Central Government maintained its position of a $9.2 billion decline in revenue and revised its projection for aggregate expenditure upwards by approximately $70.6 million. The increase in expenditure is aimed at priority areas, particularly transfers and subsidies14. The revised fiscal deficit is projected at $14.5 billion (8.8 per cent of GDP) for FY2019/20. The higher deficit is expected to be financed from a combination of domestic and external borrowings, as well as withdrawals from the HSF.

ECONOMIC BULLETIN VOLUME XXII NO. 2 19
2016/2017 2017/2018r 2018/2019pr Oct. 19 to Jun. 20
Oct. 18 to Jun. 19 2019/2020b
total REVEnuE1 36,180.6 43,169.7 45,877.0 25,009.9 35,836.4 47,748.9
Current Revenue 34,870.1 42,331.9 44,904.2 24,626.8 34,864.9 46,798.4 Energy Revenue* 7,759.5 11,031.3 15,033.5 5,902.1 10,374.4 16,362.7 Non-Energy Revenue* 27,110.6 31,300.6 29,870.7 18,724.7 24,490.6 30,435.7
Income 11,733.1 12,726.6 13,620.0 8,464.7 10,663.6 13,060.9Property 3.0 3.9 49.5 1.2 46.7 52.0Goods and Services 6,830.1 9,084.9 7,842.8 5,768.1 6,387.8 8,924.2International Trade 2,684.8 2,732.5 2,629.6 1,738.9 2,189.9 2,723.3Non-Tax Revenue 5,859.6 6,752.7 5,728.8 2,751.8 5,202.7 5,675.3
Capital Revenue 1,310.5 837.8 972.8 383.1 971.4 950.5
total ExpEndituRE 49,712.0 48,866.5 49,972.8 35,681.3 40,681.9 53,036.4
Current Expenditure 46,263.5 45,374.4 46,225.5 33,336.0 37,952.3 47,800.4 Wages and Salaries 9,937.8 9,094.4 9,145.4 6,880.0 7,585.8 9,486.9 Goods and Services 5,827.2 6,102.1 6,386.0 3,459.4 4,640.9 6,951.4 Interest Payments 4,468.4 4,786.8 3,950.2 2,882.6 3,009.3 3,990.1 Transfers and Subsidies2 26,030.1 25,391.1 26,743.8 20,114.0 22,716.3 27,372.0Capital Expenditure and Net Lending3 3,448.5 3,492.1 3,747.3 2,345.3 2,729.6 5,236.0
Current Account Surplus (+)/Deficit (-) -11,393.4 -3,042.5 -1,321.3 -8,709.2 -3,087.4 -1,002.0Current Account Surplus /Deficit (% of GDP) -7.5 -1.9 -0.8 - - -0.6
Overall Surplus (+)/Deficit (-) -13,531.4 -5,696.8 -4,095.8 -10,671.4 -4,845.6 -5,287.5Overall Surplus /Deficit (% of GDP) -8.9 -3.6 -2.5 - - -3.2
Financing 13,531.4 5,696.8 4,095.7 10,671.4 4,845.5 5,287.5Foreign Financing 3,266.7 1,239.4 855.4 4,625.3 439.0 1,476.1Domestic Financing 10,264.7 4,457.4 3,240.3 6,046.1 4,406.5 3,811.4
mEmo itEms:Non-Energy Fiscal Deficit3 -21,290.9 -16,728.1 -19,129.3 -16,573.5 -15,219.9 -21,650.2Non-energy Fiscal Deficit (% of GDP) -14.1 -10.5 -11.5 - - -12.9HSF Transfers (+) / Withdrawals (-) -1,712.2 0.0 0.0 3,251.2 0.0 0.0
Source: Ministry of Finance
1 Prior to FY2018, asset sales are recorded under capital revenue. In FY2018, proceeds from the sale of NIF bonds are recorded under current revenue within the sub-category non-tax revenue.
2 Adjusted for transfers to the Infrastructure Development Fund, Government Assisted Tertiary Education Fund and CARICOM Petroleum Fund.
3 Computed as the sum of non-energy revenue and capital revenue less total expenditure.* The energy and non-energy breakdown is based on the Central Bank’s computations. Energy revenues comprise oil revenues
plus revenues from Petrochemical companies. Budgeted data for FY2020 are estimates.r Revised.pr Preliminary.b Budgeted.
taBlE 14summaRy of cEntRal goVERnmEnt fiscal opERations
(TT$ Millions)

ECONOMIC BULLETIN VOLUME XXII NO. 2 20
Box 1:tHE RolE of soVEREign wEaltH funds in comBatting tHE socioEconomic fallout of
tHE noVEl coRonaViRus in otHER countRiEs
Global economic activity has fallen significantly in the first quarter of 2020 due to the COVID-19 pandemic. Policymakers have implemented macroeconomic support to cushion the impact of the pandemic on domestic economic activity. In this vein, several countries—Norway, Nigeria and Turkey—have indicated that they would draw down on their Sovereign Wealth Funds (SWFs) to support fiscal spending. The objectives for establishing SWFs are diverse but are generally grouped into three categories; stabilisation funds, saving funds and reserve investment corporations (International Forum of Sovereign Wealth Funds 2014)1. The primary objective of stabilisation funds is to offset macroeconomic volatility—mainly from fluctuating commodity and natural resource prices—and its impact on a country’s fiscal balance. Meanwhile, saving funds are geared toward ensuring inter-generational equity and reserve investment corporations aim to manage excess foreign exchange reserves. SWFs have risen in number and value primarily reflective of elevated commodity prices during the period 2003 and 2013 (Sovereign Wealth Fund Institute 2020)2. There are currently 122 SWFs globally with the Norway Government Pension Fund Global being the largest at value of US$1,098.8 billion as at December 2019 (Figure 1).
Several Governments have tapped into their SWFs to support affected households and businesses amid the novel coronavirus outbreak. For instance, the Government of Norway proposed to spend approximately US$41.0 billion or 4.2 per cent of its SWF in 2020 to avoid an even sharper downturn and help healthy companies through the crisis3. Similarly, the Government of Nigeria announced in April 2020, plans to make its first withdrawal of US$150.0 million from its SWF to assist in addressing the emerging fiscal risks due to the novel coronavirus pandemic and the decline in government revenue4. In April 2020, Turkey’s parliament approved a bill allowing the Turkish Wealth Fund (TWF) to buy or become a partner in distressed companies hit by the pandemic. The following month, the TWF injected US$3.0 billion into three (3) state banks to bolster their capital positions and cushion the effect of the pandemic5. Against the backdrop of a recession triggered by the coronavirus pandemic, a slump in oil prices and the meltdown in global markets, the decline in assets from the Gulf Sovereign Wealth Funds—Abu Dhabi, Kuwait, Qatar, and Saudi Arabia—is expected to exceed US$300.0 million in 2020 (Bloomberg 2020)6.
1 International Forum of Sovereign Wealth Funds (2014). Santiago Principles: 15 Case Studies. How IFSWF Members implement the Santiago Principles. https://www.ifswf.org/sites/default/files/SantiagoP15CaseStudies1_0.pdf.
2 Sovereign Wealth Fund Institute (2020). What is a Sovereign Wealth Fund? https://www.swfinstitute.org/research/sovereign-wealth-fund.
3 Ministry of Finance, Office of the Prime Minister (2020). Revised National Budget A budget to help us safely reclaim ordinary life https://www.regjeringen.no/en/aktuelt/a-budget-to-help-us-safely-reclaim-ordinary-life/id2701787/.
4 Nigeria Sovereign Investment Authority (2020). Nigerian Government to withdraw US$150 million from the Stabilisation Fund (SF) of the Sovereign Wealth Fund (SWF) to contain emerging fiscal risks https://nsia.com.ng/~nsia/sites/default/files/press-release/Press%20Release%20-%20First%20Withdrawal%20from%20Stabilisation%20Fund%20of%20NSIA_0.pdf.
5 Turkey Wealth Funds (2020). Core banks of public banks are increased by 21 billion TL https://www.tvf.com.tr/iletisim/duyurular/2020/kamu-bankalarinin-cekirdek-sermayeleri-21-milyar-tl-artiriliyor.
6 Bloomberg (2020). Gulf Sovereign Funds Seen Shedding $300 Billion in Market Mayhem. https://www.bloombergquint.com/business/gulf-sovereign-funds-seen-shedding-300-billion-in-market-mayhem.
figURe 1laRgest soveReign wealth fUnds woRldwide as at decembeR 2019
(US$ Billion)
Source: Statista 2020
ECONOMIC BULLETIN VOLUME XXII NO. 2 21
paRt VIII - puBlic sEctoR dEBt
15 Debt outstanding under the Development Loans Act reached $45.8 billion at the end of July 2020. In March 2020, the borrowing limit under the Development Loans Act was increased to $55.0 billion. Of the $8.8 billion borrowed in the ten months to July, $2.3 billion was used for refinancing existing debt.
16 In March 2020, the Miscellaneous Provisions (Heritage and Stabilisation Fund, Government Savings Bonds and Value Added Tax) Act, 2020 was assented to in Parliament. It allows for bonds, not exceeding $6.0 billion in total to be issued for the purposes of meeting any liability to refund any tax.
17 A US$200.0 million loan for the Roads and Bridges Programme was contracted during the FY2018/19, of which US$100.0 million was disbursed in August 2019 and the remainder was disbursed during the FY2019/20, in December 2019. More recently, another US$200.0 million loan was contracted for the Development of Air and Sea Transport and Tourism Infrastructure, of which US$100.0 million was disbursed in May 2020 and the remainder disbursed in July 2020, while US$100.0 million was disbursed in June 2019 for financial support for the economic impact and fiscal pressures related to COVID-19.
18 While US$139.0 million has thus far been disbursed, the total loans contracted amounts to US$207.1 million.19 Half of the proceeds from this bond was used to repay a US$250.0 million bond which matured in July 2020.
At the end of July 2020, Central Government domestic debt outstanding (excluding sterilised debt) amounted to $56.8 billion, up from the $47.0 billion recorded at the end of September 2019. Over the ten-month period, approximately $8.8 billion was borrowed under the Development Loans Act15, while $3.0 billion was issued for the purpose of refunding outstanding VAT obligations16. Meanwhile, external debt outstanding increased to US$4,589.9 million in July 2020, from US$3,939.4 million at the end of September 2019. Most of the external disbursements originated from three sources, namely the Corporación Andina de Fomento (CAF), the Development Bank of Latin America17
(US$400.0 million), Export Finance and Insurance Corporation of Australia (US$139.0 million) for the acquisition of ferries to service the inter-island sea bridge and for two patrol vessels18 and the Export-Import Bank of China for the Phoenix Park Industrial Estate (US$31.6 million). In addition, the Inter-American Development Bank made disbursements on existing loans. External debt also increased due to the issuance of a US$500.0 million bond on the international capital market in June 202019 and a US$20.0 million loan from the World Bank in July 2020. Contingent liabilities outstanding reached $32.8 billion at end-July 2020, from $30.0 billion at
the end September 2019 (Table 15).

ECONOMIC BULLETIN VOLUME XXII NO. 2 22
Sep-19p Dec-19r Mar-20r Jun-20p Jul-20p
gRoss puBlic dEBt 121,016.0 122,369.1 130,452.1 132,869.3 134,099.8
nEt puBlic dEBt1 103,213.2 107,413.8 112,289.8 119,299.0 120,529.5 cEntRal goVERnmEnt domEstic dEBt 64,779.0 64,456.8 71,179.5 68,362.3 70,343.3Bonds and Notes 45,840.1 47,232.8 49,198.3 49,874.4 51,867.7
Of which:General Development Bonds2 27,059.2 28,921.9 30,889.1 31,565.4 31,559.5CLICO Fixed-Rate Bonds 14,193.8 14,193.8 14,193.8 14,193.8 14,193.8CLICO Zero-Coupon Bonds 2,006.5 1,535.5 1,534.8 1,534.6 1,533.8 HCU Zero-Coupon bonds 254.8 254.8 254.8 254.8 254.8VAT Bonds3 0.0 0.0 0.0 1,000.0 3,000.0Liquidity Absorption Bonds 0.0 0.0 0.0 0.0 0.0Treasury Bonds 2,309.3 2,309.3 2,309.3 1,309.3 1,309.3Other4 16.5 16.5 16.5 16.5 16.5
Treasury Bills 14,061.5 10,514.0 13,721.0 10,129.0 10,129.0Treasury Notes 1,432.0 2,132.0 2,132.0 2,132.0 2,132.0Debt Management Bills 3,340.0 4,475.0 6,036.0 6,136.0 6,136.0BOLTS 105.4 104.0 92.2 90.9 78.6
cEntRal goVEnmEnt domEstic dEBt 26,283.8 27,284.9 27,489.7 32,022.7 30,911.1
contigEnt liaBilitiEs 29,953.2 30,627.4 31,782.9 32,484.3 32,845.4 State Enterprises 20,474.6 21,371.0 21,965.9 22,168.9 22,305.9 Statutory Authorities 9,478.6 9,256.4 9,817.0 10,315.4 10,539.5
peR cent of GDP5
Gross Public Debt 72.9 72.8 77.6 79.0 79.8Net Public Debt 62.2 63.9 66.8 71.0 71.7Central Government Domestic Debt1 28.3 29.4 31.5 32.6 33.8Central Government External Debt 15.8 16.2 16.4 19.0 18.4Contingent Liabilities 18.1 18.2 18.9 19.3 19.5
Sources: Ministry of Finance and Central Bank of Trinidad and Tobago
1 Excludes all debt issued for sterilisation purposes including: Treasury Bills (OMOs), Treasury Notes, Treasury Bonds and liquidity absorption bonds.
2 Includes Central Government Domestic Loans.3 Refers to bonds issued by the Government under the Value Added Tax Act for the settlement of VAT refunds owed to
businesses in Trinidad and Tobago.4 Comprises outstanding balances of national tax-free saving bonds, public sector arrears and Central Bank fixed-rate bonds.5 Debt ratios from FY2019 onwards are based on nominal GDP estimates from the Ministry of Finance.r Revised.p Provisional.
taBlE 15puBlic sEctoR dEBt outstanding
(TT$ Millions)
ECONOMIC BULLETIN VOLUME XXII NO. 2 23
paRt IX - monEy, cREdit and intEREst RatEs
Source: Central Bank of Trinidad and Tobago
chaRt VIcommeRcial banks’ excess ReseRves
(TT$ Millions)
Source: Central Bank of Trinidad and Tobago
chaRt VIIcommeRcial banks’ weighted aveRage loan and deposit Rate
20 Net domestic fiscal infections refer to the excess of government domestic expenditure over domestic revenue. (no. It includes financing also).
21 Excess liquidity refers to commercial banks’ holdings of reserves at the Central Bank in excess of the statutory requirement.
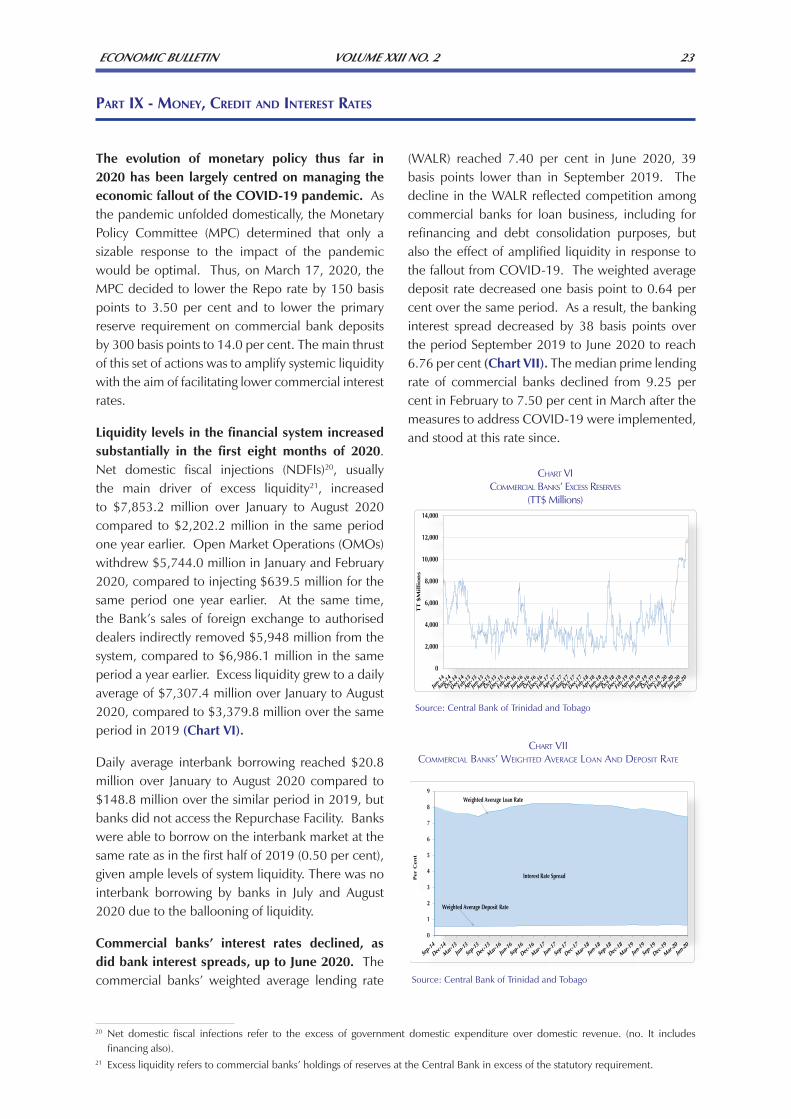
The evolution of monetary policy thus far in 2020 has been largely centred on managing the economic fallout of the COVID-19 pandemic. As the pandemic unfolded domestically, the Monetary Policy Committee (MPC) determined that only a sizable response to the impact of the pandemic would be optimal. Thus, on March 17, 2020, the MPC decided to lower the Repo rate by 150 basis points to 3.50 per cent and to lower the primary reserve requirement on commercial bank deposits by 300 basis points to 14.0 per cent. The main thrust of this set of actions was to amplify systemic liquidity with the aim of facilitating lower commercial interest rates.
Liquidity levels in the financial system increased substantially in the first eight months of 2020. Net domestic fiscal injections (NDFIs)20, usually the main driver of excess liquidity21, increased to $7,853.2 million over January to August 2020 compared to $2,202.2 million in the same period one year earlier. Open Market Operations (OMOs) withdrew $5,744.0 million in January and February 2020, compared to injecting $639.5 million for the same period one year earlier. At the same time, the Bank’s sales of foreign exchange to authorised dealers indirectly removed $5,948 million from the system, compared to $6,986.1 million in the same period a year earlier. Excess liquidity grew to a daily average of $7,307.4 million over January to August 2020, compared to $3,379.8 million over the same period in 2019 (Chart VI).
Daily average interbank borrowing reached $20.8 million over January to August 2020 compared to $148.8 million over the similar period in 2019, but banks did not access the Repurchase Facility. Banks were able to borrow on the interbank market at the same rate as in the first half of 2019 (0.50 per cent), given ample levels of system liquidity. There was no interbank borrowing by banks in July and August 2020 due to the ballooning of liquidity.
Commercial banks’ interest rates declined, as did bank interest spreads, up to June 2020. The commercial banks’ weighted average lending rate
(WALR) reached 7.40 per cent in June 2020, 39 basis points lower than in September 2019. The decline in the WALR reflected competition among commercial banks for loan business, including for refinancing and debt consolidation purposes, but also the effect of amplified liquidity in response to the fallout from COVID-19. The weighted average deposit rate decreased one basis point to 0.64 per cent over the same period. As a result, the banking interest spread decreased by 38 basis points over the period September 2019 to June 2020 to reach 6.76 per cent (Chart VII). The median prime lending rate of commercial banks declined from 9.25 per cent in February to 7.50 per cent in March after the measures to address COVID-19 were implemented, and stood at this rate since.

ECONOMIC BULLETIN VOLUME XXII NO. 2 24
22 Hilaire and Mahabir, (2020). The Great Exchange: Rapid demonetization in Trinidad and Tobago. Central Bank of Trinidad and Tobago Working Papers, WP03/2020.
Other short-term interest rates also declined in the first eight months of 2020. The TT 91-day OMO Treasury Bill rate decreased by 12 basis points over the period January to August 2020, settling at 0.96 per cent. Uncertainty in the global economy related to the ongoing economic fallout of COVID-19, and a highly accommodative policy response by the US Federal Reserve resulted in decreased yields on US short-term instruments. The yield on the US 91-day short-term benchmark lost 145 basis points over the first eight months of 2020 to reach 0.10 per cent by the end of August. As a result, the TT-US 91-day differential improved to 86 basis points in August 2020 compared with -47 basis points in December 2019.
consolidatEd financial systEm cREdit dEVElopmEnts
The growth in private sector credit has been sluggish. Throughout 2019 consolidated system credit expanded by an average of 4.1 per cent (Chart VIII). In March 2020 credit expanded by 3.6 per cent year-on-year and 1.1 per cent year-on-year in June 2020. Nonetheless, consumer lending remained relatively strong into 2020, supported mainly by lending for debt consolidation and refinancing purposes. In March 2020, consumer lending grew by 5.2 per cent (year-on-year) compared to 6.1 per cent (year-on-year) in December 2019. However, consumer lending slowed to 1.9 per cent (year-on-year) in June 2020. Lending for the purpose of debt consolidation and refinancing remain the strongest consumer lending categories, growing by 8.5 per cent and 5.8 per cent, respectively in June 2020. Business lending remained frail as firms were cautious to contract new debt: this loan category fell by 6.1 per cent year-on-year in June. Meanwhile, real estate lending grew by 7.7 per cent in June 2020, primarily via mortgages on existing homes lending and renovation loans.
The demonetization of the TT$100 note in December 2019 continues to influence the monetary aggregates. The demonetization was implemented to address financial crimes.
The exercise was successful as over 5 per cent of demonetized bills were not presented for exchange. The demand for money for transactionary purposes was also impacted by the demonetization exercise22. Data to June 2020 points to growth of 4.7 per cent in M-1A which consists of currency in active circulation and demand deposits. Deeper analysis indicates a falloff in currency in active circulation of 20.0 per cent (year-on-year) in June 2020 compared to a decline of 39.8 per cent in December 2019. The broader measure of money, M2, which includes both time and saving deposits grew by 6.5 per cent in June compared to growth of 0.1 per cent in December 2019 suggesting that persons opted to place deposits in the banking system. Time deposits expanded by 10.8 per cent in June while savings deposits grew by 7.5 per cent.
Foreign currency loans declined significantly in March 2020. On a year-on-year basis foreign currency loans fell by 13.8 per cent in June 2020. In particular, loans from banks declined 12.8 per cent and from non-banks by 17.7 per cent.
chaRt VIIIpRivate sectoR cRedit by the consolidated financial system
(Year-on-Year Per cent Change)
Source: Central Bank of Trinidad and Tobago

ECONOMIC BULLETIN VOLUME XXII NO. 2 25
taBlE 16autHoRisEd dEalERs: foREign ExcHangE maRkEt actiVity
(US$ Millions)
datEpuRcHasEs
fRom puBlicsalEs to puBlic nEt salEs
puRcHasEs fRom cBtt*
2014 5,525.2 6,956.0 1,430.8 1,715.02015 4,930.8 7,382.2 2,451.4 2,640.92016 4,274.7 5,776.8 1,502.1 1,811.62017 3,606.9 5,195.3 1,588.4 1,816.02018 4,101.4 5,677.4 1,576.0 1,501.02019 4,285.6 5,939.8 1,654.2 1,504.0
Jan - Aug 2019 2,857.4 4,024.7 1,167.2 1,045.0Jan - Aug 2020 2,338.4 3,097.4 758.9 890.0
Y-o-Y Per cent Change -18.2 -23.0 -35.0 -14.8
Source: Central Bank of Trinidad and Tobago
* Includes purchases under the Foreign Exchange Liquidity Guarantee Facility, an additional source of liquidity which autho-rised dealers may utilise as a last resort.
financial sEctoR dEVElopmEnts
Conditions in the foreign exchange market remained relatively tight in the first eight months of 2020. Over January to August, total purchases in the foreign exchange market by authorised dealers declined by 18.2 per cent, mainly as a result of a 26.6 per cent decrease in conversions by energy companies. Foreign exchange sales to the public by authorised dealers also declined, by 23.0 per cent.
Credit cards (27.5 per cent), Retail and Distribution (26.7 per cent) and Manufacturing (10.1 per cent) made up the bulk of foreign exchange sales by authorised dealers to the public. To support the market, the Central Bank sold US$890.0 million to authorised dealers over the reference period (Table 16).
ECONOMIC BULLETIN VOLUME XXII NO. 2 26
paRt X - capital maRkEt
chaRt IXcomposite pRice index and stock maRket capitalisation
Source: Trinidad and Tobago Stock Exchange
chaRt XtRinidad and tobago stock maRket sUb-indices
(YTD ending August 2020)
Source: Trinidad and Tobago Stock Exchange
chaRt xitRinidad and tobago individUal stock indices
(YTD ending August 2020)
Source: Trinidad and Tobago Stock Exchange
EQuity maRkEt
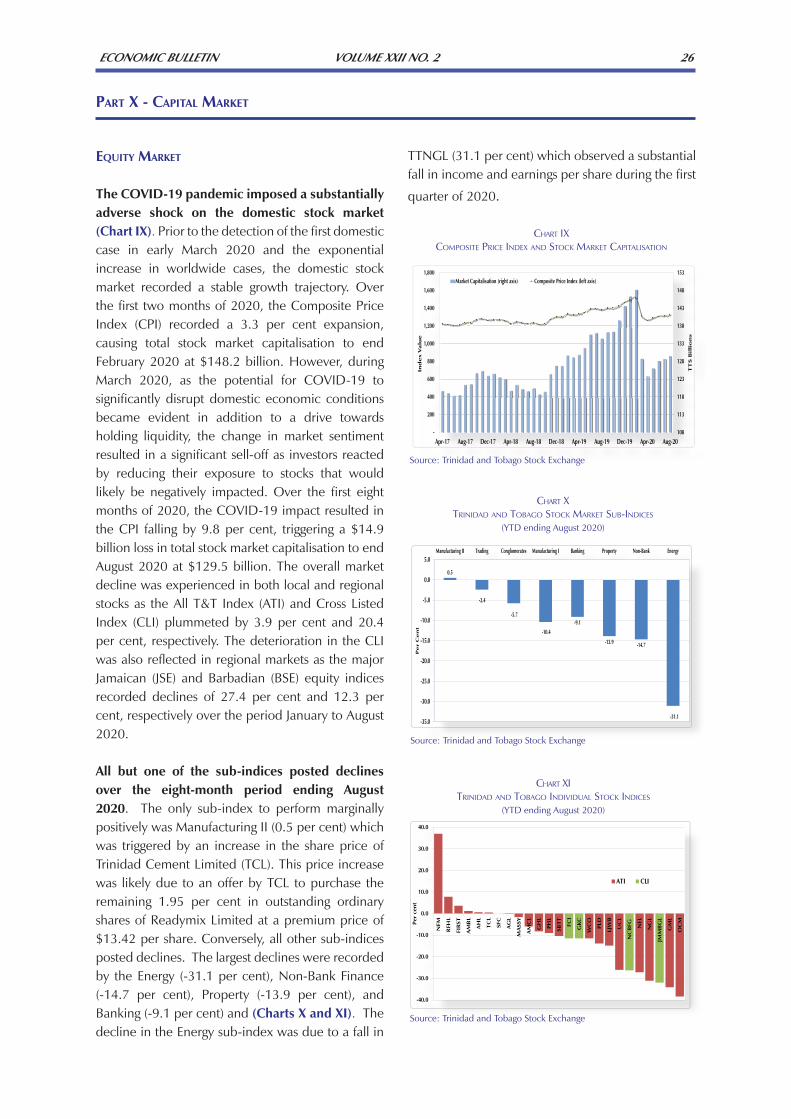
The COVID-19 pandemic imposed a substantially adverse shock on the domestic stock market (Chart IX). Prior to the detection of the first domestic case in early March 2020 and the exponential increase in worldwide cases, the domestic stock market recorded a stable growth trajectory. Over the first two months of 2020, the Composite Price Index (CPI) recorded a 3.3 per cent expansion, causing total stock market capitalisation to end February 2020 at $148.2 billion. However, during March 2020, as the potential for COVID-19 to significantly disrupt domestic economic conditions became evident in addition to a drive towards holding liquidity, the change in market sentiment resulted in a significant sell-off as investors reacted by reducing their exposure to stocks that would likely be negatively impacted. Over the first eight months of 2020, the COVID-19 impact resulted in the CPI falling by 9.8 per cent, triggering a $14.9 billion loss in total stock market capitalisation to end August 2020 at $129.5 billion. The overall market decline was experienced in both local and regional stocks as the All T&T Index (ATI) and Cross Listed Index (CLI) plummeted by 3.9 per cent and 20.4 per cent, respectively. The deterioration in the CLI was also reflected in regional markets as the major Jamaican (JSE) and Barbadian (BSE) equity indices recorded declines of 27.4 per cent and 12.3 per cent, respectively over the period January to August 2020.
All but one of the sub-indices posted declines over the eight-month period ending August 2020. The only sub-index to perform marginally positively was Manufacturing II (0.5 per cent) which was triggered by an increase in the share price of Trinidad Cement Limited (TCL). This price increase was likely due to an offer by TCL to purchase the remaining 1.95 per cent in outstanding ordinary shares of Readymix Limited at a premium price of $13.42 per share. Conversely, all other sub-indices posted declines. The largest declines were recorded by the Energy (-31.1 per cent), Non-Bank Finance (-14.7 per cent), Property (-13.9 per cent), and Banking (-9.1 per cent) and (Charts X and XI). The decline in the Energy sub-index was due to a fall in
TTNGL (31.1 per cent) which observed a substantial fall in income and earnings per share during the first
quarter of 2020.

ECONOMIC BULLETIN VOLUME XXII NO. 2 27
Over the eight months ending August 2020, trading activity on the domestic exchange witnessed a notable increase in value despite a lower volume traded. Over the period, 46.6 million shares were traded at a total value of $798.5 million compared to 52.9 million at a total value of $712.0 million in the comparative period in 2019. Trading volume was dominated by the Non-Bank Finance sector (31.2 per cent). On the other hand, trade value was dominated by the Banking sector accounting for 46.6 per cent or $372.1 million.
Bond maRkEt
Activity on the primary debt market picked up pace over the first half of 2020. Over the period, there were 15 private primary placements totalling $9,245.9 million, in addition to one bond issued on the international financial market for US$500 million (Table 17). In comparison, during the first half of 2019 the market observed six bond issues raising $4,358.2 million. During the 2020 period, the Central Government financed just under $6,512.0 million via seven placements on the domestic market, while on the international bond market, the Central Government borrowed US$500.0 million. In contrast, during the same period in 2019 the Central Government issued just four bonds at $3,142.4 million. State enterprises also engaged in increased activity during the first half of 2020, issuing 6 bonds at a total value of $2,548.9 million. This compares to just one bond issue by a state enterprise financing $200.0 million in the same period one year prior. Additionally, two private sector firms, one local and one regional, financed just $185.0 million in the first six months of 2020. In comparison, only one private sector company was active in the same period in 2019, financing $1,015.7 million. Meanwhile, during the first half of 2020, activity on the secondary government bond market was relatively subdued, but picked up in July. At the same time, there were few trades in secondary corporate bonds.
cEntRal goVERnmEnt yiEld cuRVE23
Over the eight-month period ending August 2020, the Central Government yield curve generally displayed a steepening trend (Chart XII). Over the
period, the short-term 3-month rate dipped by 12 basis points to 0.96 per cent while the 1-year rate declined by 21 basis points to 2.08 per cent. The decline in the short-term rates was largely due to the elevated excess liquidity conditions during the period which would have placed downward pressures on these interest rates. On the longer end of the curve, the 10-year and 15-year rates increased by 9 basis points to 4.63 per cent and 20 basis points 5.47 per cent, respectively. The increase in medium- to long-term yields suggests that despite the elevated liquidity conditions and an accommodative monetary policy position, investors may be placing higher risk and term premiums on long-term government securities due to the government’s increasing financing requirements.
chaRt XIItRinidad and tobago centRal goveRnment tReasURy yield cURve
December 2019 to August 2020
Source: Central Bank of Trinidad and Tobago
23 The TT Treasury Yield Curve is constructed monthly by the Central Bank of Trinidad and Tobago and is based on information from Domestic Market Operations, the Trinidad and Tobago Stock Exchange (TTSE) Secondary Government Bond Market, and market reads from market participants.

ECONOMIC BULLETIN VOLUME XXII NO. 2 28
table 17pRimaRy debt secURity activity JanUaRy 2020 to JUne 2020P
Period Issued Borrower Face Value
(TT$ Mn)Period to Maturity
Coupon Rate per annum (Per Cent)
Placement Type
Jan-20 Trinidad Commercial Development Company Limited 30.00 5.0 years Fixed rate 5.75% Private
Feb-20
WASA 675.44 (US$100.0Mn) 14.0 years Fixed rate 5.60% Private
Telecommunication Services of Trinidad and Tobago Limited (TSTT) - TR1 59.28 0.9 years Fixed rate 5.213% Private
First Citizens Investment Services Limited (FCIS) 200.00 3.0 years Fixed rate 3.30% Private
Mar-20
Telecommunication Services of Trinidad and Tobago Limited (TSTT) - TR2 40.72 0.8 years Fixed rate 5.213% Private
Central Government of Trinidad and Tobago 1,500.00 20.0 years Fixed rate 5.74% Private
First Citizens Bank (FCB) 623.44 (US$92.36Mn) 5.0 years Fixed rate 4.25% Private
Central Government of Trinidad and Tobago 750.00 3.0 years Fixed rate 3.30% Private
Apr-20 Central Government of Trinidad and Tobago 693.12 (US$102.39Mn) 3.0 years Fixed rate 6.30% Private
May-20
Portland (Barbados) Ltd 155.04 (US$23.0Mn) 2.0 years Fixed rate 7.50% Private
Central Government of Trinidad and Tobago (Tranche A) 1,300.00 1.0 year Fixed rate 2.50% Private
Central Government of Trinidad and Tobago (Tranche B) 400.00 15.0 years Fixed rate 5.65% Private
Central Government of Trinidad and Tobago 1,000.00 3.0 years Fixed rate 3.30% Private
Trinidad and Tobago Housing Development Corporation (HDC) 650.00 10.0 years Variable rate 5.823% Private
Jun-20
National Maintenance Training and Security Company Limited (MTS) 300.00 9.0 years Fixed rate 5.20% Private
Central Government of Trinidad and Tobago
3,393.5 (US$500.0Mn) 10.0 years Fixed rate 4.50% International
Central Government of Trinidad and Tobago 268.88 5.0 years Fixed rate 3.85% Private
Central Government of Trinidad and Tobago 600.00 12.0 years Fixed rate 5.50% Private
Source: Central Bank of Trinidad and Tobago
p Provisional.

ECONOMIC BULLETIN VOLUME XXII NO. 2 29
mutual funds maRkEt
The mutual funds market observed a decline during the first quarter of 2020. Aggregate funds under management24 slipped by 1.3 per cent to $46,546.1 million compared to a 2.4 per cent increase in the same period of 2019 (Chart XIII). Mirroring the recent volatility in domestic and international financial markets, Income funds witnessed a 2.4 per cent drop to $27,294.4 million while Equity funds fell by 5.3 per cent to $6,642.7 million. Additionally, funds classified as ‘Other’25 also registered a 1.3 per cent decline to $386.3 per cent. On the other hand, reflective of the drive towards liquidity and the safety of fixed Net Asset Value (NAV) funds, Money Market funds recorded a 3.9 per cent expansion to $12,222.7 million over the three-month period. In terms of currency composition, TT dollar denominated mutual funds observed a 0.8 per cent decline to $37,942.3 million while foreign currency denominated funds deteriorated by 3.4 per cent to $8,603.8 million.
Despite the decline in funds under management, the industry witnessed net sales of approximately $90.1 million over the three-month period ending March 2020. This comprised of total sales of $4,304.1 million and total redemptions of $4,213.9 million. The overall net-sales position was primarily attributed to Money Market funds, which observed $478.6 million in net-sales, reflecting the drive towards the liquidity and safety. On the other hand, net-redemptions were recorded for both Income funds ($262.7 million) and Equity funds ($126.4 million). In terms of currency profile, TT dollar funds attracted net sales of $184.4 million. However, foreign currency funds under management, witnessed the TT equivalent of $94.3 million in net redemptions.
24 Aggregate funds under management refer to mutual fund information collected by the Central Bank of Trinidad and Tobago, including funds managed by the Trinidad and Tobago Unit Trust Corporation, Royal Bank of Trinidad and Tobago, Republic Bank Limited and First Citizens Bank Limited.
25 Other funds represent high yield funds and special purpose funds.26 CIS data from the TTSEC represents 69 registered funds from 15 issuers.
Collective Investment Scheme (CIS) data26 published by the Trinidad and Tobago Securities and Exchange Commission (TTSEC) suggests that during the first quarter of 2020, the total value of Assets Under Management (AUM) for all registered CIS recorded a 2.3 per cent growth to $53,980.7 million, despite reporting net redemptions of $114.9 million. Although the domestic industry recorded overall growth over the three-month period, during March 2020 local and international financial market volatility resulted in the industry sustaining a large loss. During March 2020, registered CIS recorded a decline of 4.1 per cent in AUM from $56,287.1 million, representing an adverse valuation change of $2,306.5 million over the month. In addition to valuation losses, over the month the market also experienced $757.0 million in net repurchases.
chaRt XIIImUtUal fUnds - aggRegate fUnd valUes
Source: Central Bank of Trinidad and Tobago

ECONOMIC BULLETIN VOLUME XXII NO. 2 30
paRt xi - intERnational tRadE and paymEnts(Data in this section are in US dollars unless otherwise stated)
27 Over the period October to December 2019, the total volume of crude oil exports approximated 5.4 million barrels, compared to approximately 1.5 million barrels in the similar period of 2018.
28 Other investment comprises currency and deposits, loans, insurance, pension, and standardized guarantee schemes, trade credit and advances, other accounts receivable/payable and special drawing rights (liabilities).
BalancE of paymEnts
Preliminary data for the last three months of 2019 revealed that the balance of payments of Trinidad and Tobago recorded an overall surplus of $30.0 million, compared to the surplus of $109.8 million for the corresponding period of 2018 (Table 18). The current account surplus narrowed from the year-earlier period mainly due to a lower surplus on the goods account. Meanwhile, a net inflow was recorded on the financial account, which mainly stemmed from the other investment account. These transactions brought the level of gross official reserves to $6,929.0 million at the end of December 2019, representing 7.7 months of prospective imports.
The current account recorded a smaller surplus of $243.2 million (4.0 per cent of GDP) for the final quarter of 2019, 61.8 per cent less than the $637.1 million (10.7 per cent of GDP) surplus registered over the similar period one year earlier. This decline was largely attributed to lower exports in the goods account. Against the background of depressed international commodity prices and weaker external demand, Trinidad and Tobago’s estimated energy export earnings fell by 18.7 per cent (year-on-year) to $1,544.7 million in the fourth quarter of 2019. In particular, compared to the year-earlier period, exports of petrochemicals recorded the largest decline (36.8 per cent), followed by LNG (34.1 per cent). Noteworthy, is the increase in crude oil export earnings of 138.5 per cent to $335.8 million, on account of higher crude oil export volumes27.
Non-energy exports are estimated to have contracted by approximately 16.0 per cent (year-on-year) during the fourth quarter of 2019 primarily on account of lower external demand for machinery and transport equipment. However, the reduction in demand was partially offset by modest increases in manufacturing goods demanded by the US, EU and UK. Notably, the US and CARICOM remained Trinidad and Tobago’s main export destination for more than 85.0 per cent of the country’s non-energy products. Additionally, more than half of non-
energy exports to CARICOM were concentrated in food and live animals, and beverages and tobacco, however there was a reduction in demand for the latter over the reference period. On the other hand, total imports were estimated to have increased to $1,538.3 million, up from $1,380.3 million in the corresponding period one year earlier mainly on account of fuel imports, however there was a falloff of crude oil imports from Russia and Gabon due to the closure of the local state-owned refinery during the fourth quarter in 2018. Meanwhile, other imports marginally increased by 3.8 per cent (year-on-year) owing to rise in imports of capital goods from the US and to a lesser extent increased demand for food and live animals, and beverages and tobacco from the US and EU. Moreover, the US and EU was a major source of imports for Trinidad and Tobago’s economy in the fourth quarter of 2019.
Meanwhile, the deficit on the services account narrowed to $256.6 million (4.2 per cent of GDP) over the three months to December 2019. The lower deficit on the services account was mostly attributable to lower imports of technical, trade-related, and other business services. Reflecting the subdued pace of domestic economic activity, imports of construction services also recorded a decline of $24.7 million (year-on-year) over the period. On the primary income account, a surplus was recorded in the fourth quarter of 2019 compared to a deficit in the corresponding period one year ago. This was largely on account of lower repatriations of earnings and interest payments abroad. The secondary income account recorded a deficit in the fourth quarter of 2019, in contrast to a surplus registered in the same period in 2018. This was due to higher private outbound transfers, as well as lower inbound government transfers.
The financial account recorded a net inflow of $216.6 million in the three months to December 2019, smaller than the net inflow of $423.1 million registered over the same period one year earlier. The other investment28 category primarily contributed towards the overall net inflow on the financial account in the fourth quarter of 2019.

ECONOMIC BULLETIN VOLUME XXII NO. 2 31
More specifically, the decline in other investment assets was primarily reflective of payments received on accounts receivable, as well as drawdowns on currency and deposits by financial institutions. Meanwhile, other investment liabilities fell, mainly attributable to a reduction in accounts payable owed to non-residents. Partially offsetting the fall in accounts payable were increases in loans incurred by the Central Government with non-residents.
Financial flows in the portfolio investment account registered a net outflow, which was primarily characterised by an increase in portfolio assets. The uptick in portfolio assets was largely due to domestic residents increasing their holdings of both short-term (money-market instruments) and long-term debt securities (bonds and notes) held abroad. At the same time, the rise in portfolio liabilities stemmed from an increase in long-term debt securities owed to non-residents. Over the reference period, movements in direct investment assets and liabilities resulted in a net outflow of $38.5 million. The reduction in direct investment liabilities (direct investment in Trinidad and Tobago by foreign investors) was a result of equity transactions within the energy sector. However, this decline was somewhat offset by an increase in inter-company borrowings. Meanwhile, the increase in direct investment abroad was primarily reflective of equity transactions and, to a lesser extent, higher inter-company lending.
At the end of August 2020, gross official reserves amounted to $7,442.4 million, which was $513.4 million higher than the end of 2019. Over the reference period, gross official reserves were boosted by drawdowns from the Heritage and Stabilisation Fund (HSF) and proceeds from Central Government borrowings. The increase in gross official reserves suggests that the external accounts registered an overall surplus during the first eight months of 2020. The level of reserves at the end of August 2020 represents 8.8 months of prospective imports of goods and services.
intERnational inVEstmEnt position
The net international investment position (NIIP) was estimated at $4,240.0 million at the end of December 2019, down $266.9 million from the end of the previous quarter (Table 19). The deterioration in the NIIP reflected an increase in liabilities of $136.4 million, coupled with a fall in assets of $130.5 million.
Over the reference period, the reduction in the stock of assets was due to a decline in other investment. More specifically, the decrease in other investment assets was primarily influenced by reductions in accounts receivable and drawdowns on currency and deposits. Partially offsetting this reduction was the increase in portfolio assets, particularly equity and long-term debt securities. Reserve assets also increased in the final quarter of 2019, supported by disbursements from Central Government loans and energy receipts.
The movement in the stock of liabilities over the three-months was largely due to portfolio investment. The expansion in the stock of portfolio investment liabilities stemmed from an increase in long-term debt securities owed to non-residents. However, the rise in portfolio investment liabilities was partially offset by declines in direct investment and other investment liabilities.

ECONOMIC BULLETIN VOLUME XXII NO. 2 32
taBlE 18tRinidad and toBago summaRy BalancE of paymEnts
(US$ Millions)
2018p 2019p 2018p 2019p
QIV QI QII QIII QIVCurrent Account 1,370.5 1,167.8 637.1 557.4 394.1 -27.0 243.2 Goods and Services 2,178.0 1,401.4 744.4 629.3 423.8 116.7 231.7 Goods, Net* 3,890.2 2,468.8 1,091.5 918.5 685.0 377.1 488.3 Exports** 10,520.8 8,533.5 2,471.7 2,390.7 2,150.0 1,966.3 2,026.5 Energy 8,855.3 6,696.5 1,899.8 2,000.3 1,684.4 1,467.0 1,544.7 Non-energy 1,665.5 1,837.0 572.0 390.4 465.5 499.2 481.8
Imports** 6,630.6 6,064.7 1,380.3 1,472.2 1,465.0 1,589.2 1,538.3 Fuels*** 1,755.3 1,226.0 198.9 314.7 321.2 278.5 311.6 Other 4,875.3 4,838.7 1,181.4 1,157.5 1,143.8 1,310.7 1,226.7
Services, net -1,712.2 -1,067.4 -347.1 -289.2 -261.1 -260.4 -256.6 Primary Income, Net -708.6 -251.2 -113.9 -49.0 -32.0 -192.8 22.6 Secondary Income, Net -98.9 17.6 6.6 -22.8 2.4 49.1 -11.1Capital Account 2.4 6.2 0.5 4.1 0.1 1.5 0.5
Financial Account 176.3 869.9 -423.1 831.7 -317.2 572.0 -216.6 Direct Investment 766.9 137.9 238.8 149.3 84.1 -134.0 38.5Net Acquisition of Financial Assets 65.0 266.4 28.5 119.6 95.9 21.6 29.4Net Incurrence of Liabilities -701.9 128.6 -210.2 -29.7 11.8 155.6 -9.1Portfolio Investment 418.1 1,439.6 -59.9 436.9 177.1 763.4 62.1Net Acquisition of Financial Assets 350.4 1,240.0 -86.2 371.7 143.9 357.9 366.5Net Incurrence of Liabilities -67.7 -199.7 -26.3 -65.2 -33.2 -405.5 304.3Financial Derivatives 5.3 -0.2 0.0 0.3 2.0 -3.5 1.1Net Acquisition of Financial Assets 5.2 -0.4 -0.5 1.2 1.2 -2.9 0.0Net Incurrence of Liabilities -0.2 -0.2 -0.5 1.0 -0.8 0.7 -1.1Other Investment**** -1,014.0 -707.4 -602.0 245.2 -580.4 -53.9 -318.3Net Acquisition of Financial Assets -309.9 362.8 -235.8 200.6 50.9 505.8 -394.5Net Incurrence of Liabilities 704.1 1,070.1 366.2 -44.6 631.3 559.6 -76.2Net Errors and Omissions -1,991.3 -950.2 -951.0 45.6 -1,068.4 502.9 -430.4Overall Balance -794.7 -646.1 109.8 -224.5 -356.9 -94.6 30.0
pER cEnt of gdpCurrent Account 5.7 4.8 10.7 9.1 6.4 -0.4 4.0 Goods, Net 16.3 10.1 18.3 15.0 11.2 6.1 7.9 Exports 44.1 34.7 41.5 38.9 35.0 32.0 33.0 Imports 27.8 24.7 23.2 24.0 23.9 25.9 25.0 Services, Net -7.2 -4.3 -5.8 -4.7 -4.3 -4.2 -4.2 Primary Income, Net -3.0 -1.0 -1.9 -0.8 -0.5 -3.1 0.4Overall Balance -3.3 -2.6 1.8 -3.7 -5.8 -1.5 0.5mEmoRandum itEms
Gross Official Reserves^ 7,575.0 6,929.0 7,575.0 7,350.5 6,993.6 6,898.9 6,929.0Import Cover (months)^ 8.0 7.7 8.0 8.3 7.9 7.7 7.7
Source: Central Bank of Trinidad and Tobago
GDP data for 2018 are sourced from the CSO and that for 2019 are Ministry of Finance estimates sourced from 2019/20 original budget.
Note: This table is an analytical presentation of the Balance of Payments and is presented in accordance with the IMF’s Balance of Pay-ments and International Investment Position Manual, Sixth Edition (BPM6). Refer to Box 3 of the Economic Bulletin, March 2017 for a Technical Note on the Transition to BPM6. The following financial account movements are represented with a negative sign:• A decrease in assets (inflow)• A decrease in liabilities (outflow)• A net inflow in net balancesThe following financial account movements are represented with a positive sign:• An increase in assets (outflow)• An increase in liabilities (inflow)• A net outflow in net balances* Energy goods data for 2018-2019 comprise estimates by the Central Bank of Trinidad and Tobago. ** Exports and imports are reported on a FOB (Free on Board) basis. *** Includes petroleum, petroleum products and related materials. Energy exports include exports of petroleum, petroleum products
and related materials and the exports of petrochemicals. **** Other investment comprise currency and deposits, loans, insurance, pension, and standardized guarantee schemes, trade credit
and advances, other accounts receivable/payable and special drawing rights (liabilities). ^ End of Period.p Provisional.
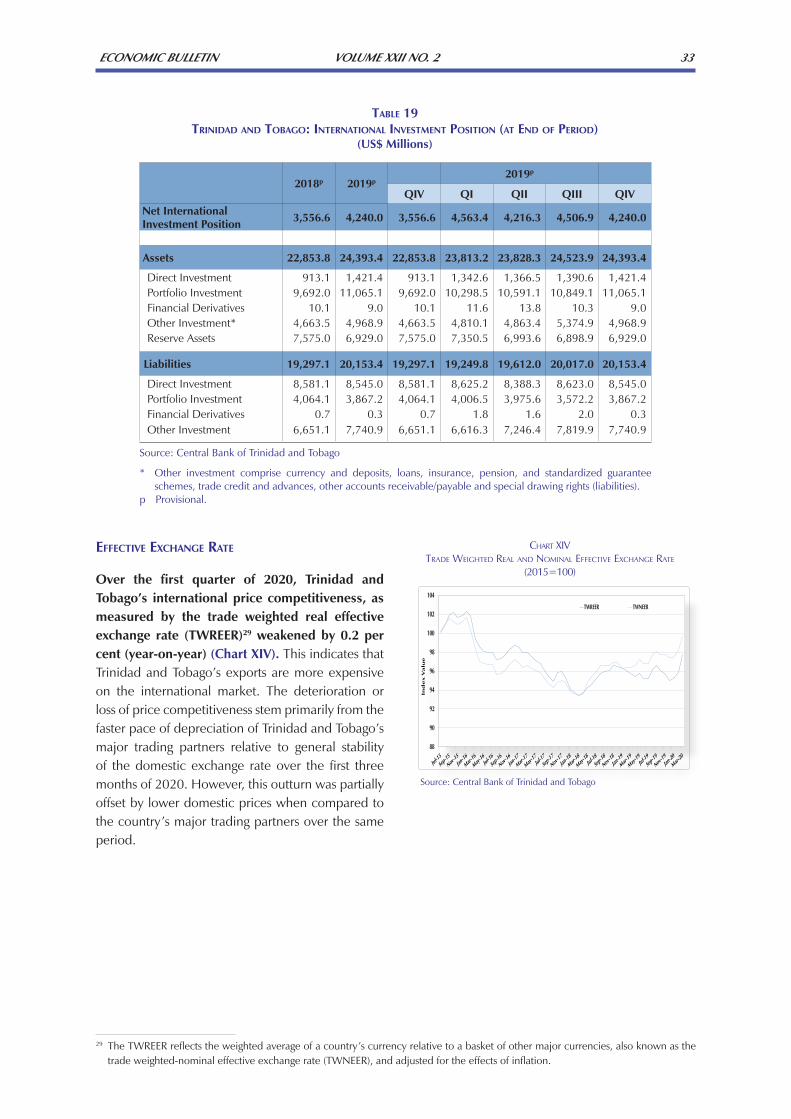
ECONOMIC BULLETIN VOLUME XXII NO. 2 33
taBlE 19tRinidad and toBago: intERnational inVEstmEnt position (at End of pERiod)
(US$ Millions)
2018p 2019p2019p
QIV QI QII QIII QIVNet International Investment Position 3,556.6 4,240.0 3,556.6 4,563.4 4,216.3 4,506.9 4,240.0
Assets 22,853.8 24,393.4 22,853.8 23,813.2 23,828.3 24,523.9 24,393.4
Direct Investment 913.1 1,421.4 913.1 1,342.6 1,366.5 1,390.6 1,421.4Portfolio Investment 9,692.0 11,065.1 9,692.0 10,298.5 10,591.1 10,849.1 11,065.1Financial Derivatives 10.1 9.0 10.1 11.6 13.8 10.3 9.0Other Investment* 4,663.5 4,968.9 4,663.5 4,810.1 4,863.4 5,374.9 4,968.9Reserve Assets 7,575.0 6,929.0 7,575.0 7,350.5 6,993.6 6,898.9 6,929.0
Liabilities 19,297.1 20,153.4 19,297.1 19,249.8 19,612.0 20,017.0 20,153.4
Direct Investment 8,581.1 8,545.0 8,581.1 8,625.2 8,388.3 8,623.0 8,545.0Portfolio Investment 4,064.1 3,867.2 4,064.1 4,006.5 3,975.6 3,572.2 3,867.2Financial Derivatives 0.7 0.3 0.7 1.8 1.6 2.0 0.3Other Investment 6,651.1 7,740.9 6,651.1 6,616.3 7,246.4 7,819.9 7,740.9
Source: Central Bank of Trinidad and Tobago
* Other investment comprise currency and deposits, loans, insurance, pension, and standardized guarantee schemes, trade credit and advances, other accounts receivable/payable and special drawing rights (liabilities).
p Provisional.
chaRt XIVtRade weighted Real and nominal effective exchange Rate
(2015=100)
Source: Central Bank of Trinidad and Tobago
EffEctiVE ExcHangE RatE
Over the first quarter of 2020, Trinidad and Tobago’s international price competitiveness, as measured by the trade weighted real effective exchange rate (TWREER)29 weakened by 0.2 per cent (year-on-year) (Chart XIV). This indicates that Trinidad and Tobago’s exports are more expensive on the international market. The deterioration or loss of price competitiveness stem primarily from the faster pace of depreciation of Trinidad and Tobago’s major trading partners relative to general stability of the domestic exchange rate over the first three months of 2020. However, this outturn was partially offset by lower domestic prices when compared to the country’s major trading partners over the same period.
29 The TWREER reflects the weighted average of a country’s currency relative to a basket of other major currencies, also known as the trade weighted-nominal effective exchange rate (TWNEER), and adjusted for the effects of inflation.

APPENDIX I
STATISTICAL TABLES

ECONOMIC BULLETIN VOLUME XXII NO. 2
STATISTICAL APPENDIX
TABLE 1A QUARTERLY INDEX OF REAL ECONOMIC ACTIVITY
TABLE 1B QUARTERLY INDEX OF REAL ECONOMIC ACTIVITY (CONT’D)
TABLE 2A INDEX OF DOMESTIC PRODUCTION
TABLE 2B INDEX OF DOMESTIC PRODUCTION - PER CENT CHANGE
TABLE 3A INDEX OF HOURS WORKED
TABLE 3B INDEX OF PRODUCTIVITY
TABLE 3C INDEX OF AVERAGE WEEKLY EARNINGS
TABLE 4 PRODUCTION AND SALES OF NATURAL GAS, PETROLEUM AND PETROLEUM- BASED PRODUCTS
TABLE 5 PRODUCTION AND SALES OF PETROCHEMICAL PRODUCTS
TABLE 6 PRODUCTION AND SALES OF CEMENT AND IRON AND STEEL PRODUCTS
TABLE 7A INDEX OF RETAIL SALES
TABLE 7B INDEX OF RETAIL SALES - PER CENT CHANGE
TABLE 8 PRODUCTION AND SALES OF MAJOR AGRICULTURAL COMMODITIES
TABLE 9 PRODUCTION OF SELECTED FOOD CROPS
TABLE 10 INDEX OF RETAIL PRICES
TABLE 11A INDEX OF PRODUCERS’ PRICES
TABLE 11B INDEX OF RETAIL PRICES OF BUILDING MATERIALS
TABLE 11C INDEX OF RETAIL PRICES OF BUILDING MATERIALS - PER CENT CHANGE
TABLE 12 EMPLOYMENT AND LABOUR FORCE
TABLE 13 SECTORAL DISTRIBUTION OF EMPLOYMENT
TABLE 14 CENTRAL GOVERNMENT - FISCAL OPERATIONS
TABLE 15 CENTRAL GOVERNMENT - NET DOMESTIC BUDGET DEFICIT
TABLE 16A CENTRAL GOVERNMENT - EXTERNAL DEBT
TABLE 16B CENTRAL GOVERNMENT - INTERNAL DEBT
TABLE 16C CENTRAL GOVERNMENT - TOTAL DEBT
TABLE 17A MONEY SUPPLY
TABLE 17B PRIVATE SECTOR CREDIT - PER CENT CHANGE
TABLE 18 COMMERCIAL BANKS - SELECTED DATA
TABLE 19A COMMERCIAL BANKS: OUTSTANDING LOANS TO BUSINESSES - PRIVATE SECTOR
- BY ACTIVITY
TABLE 19B COMMERCIAL BANKS: OUTSTANDING LOANS TO BUSINESSES - PRIVATE SECTOR- BY ACTIVITY (CONT’D)
TABLE 20 COMMERCIAL BANKS: OUTSTANDING LOANS TO BUSINESSES - PUBLIC SECTOR
- BY ACTIVITY
TABLE 21 LOANS OUTSTANDING BY PURPOSE - CONSUMERS
TABLE 22 COMMERCIAL BANKS LIQUID ASSETS
TABLE 23 FINANCE HOUSES AND MERCHANT BANKS - SELECTED DATA
TABLE 24 TRUST AND MORTGAGE FINANCE COMPANIES - SELECTED DATA
TABLE 25 SELECTED INTEREST RATES
TABLE 26A COMMERCIAL BANKS: INTEREST RATES
TABLE 26B COMMERCIAL BANKS: RANGE OF INTEREST RATES ON TT DOLLAR LOANSAND DEPOSITS
34

ECONOMIC BULLETIN VOLUME XXII NO. 2
TABLE 27A NON-BANK FINANCIAL INSTITUTIONS: MEDIAN INTEREST RATES
TABLE 27B NON-BANK FINANCIAL INSTITUTIONS: RANGE OF INTEREST RATES
TABLE 28A MONEY AND CAPITAL MARKET: PRIMARY MARKET ISSUES
TABLE 28B MONEY AND CAPITAL MARKET: STOCK MARKET INDICES
TABLE 29 MONEY AND CAPITAL MARKET: SECONDARY MARKET TURNOVER
TABLE 30A MONEY AND CAPITAL MARKET: MUTUAL FUNDS - SALES AND REPURCHASES
TABLE 30B MONEY AND CAPITAL MARKET: MUTUAL FUNDS UNDER MANAGEMENT
TABLE 31A BALANCE OF PAYMENTS - CURRENT ACCOUNT
TABLE 31B BALANCE OF PAYMENTS - CAPITAL AND FINANCIAL ACCOUNT
TABLE 33 TRINIDAD AND TOBAGO FOREIGN RESERVES
r - revised
re - revised estimate
p - provisional
n.a. / – - not available
# - multiple of 100
0 - nil/negligible
.. - infinity
35

� � � � � � � � � �� � � � � � �� �� �� � � � �� � ��� � �� � � ! �" �" �#" $% � # � � & �" � ! #" ��' # � � � � �" � ( � � �� � � � � � &)* # + , #� �- � . . � & /0 " + �� � � � � �0 " , 10 � + # � #" $2 � # � �3 � # $ 3 � #" + �.0 �� #� �0 " #" $- � 0 � #� � � �0 4�40 $ #� �0 " #" $5 0 0 $ - � 6 � � � � � � 6 �� � + 7" '0 � 4 #� �0 "#" $ /0 4 4��" � � #� �0 " 5 �" #" � � # �#" $ 7" + � ��#" � � � � � 6 � � � + 2 # �( + � #� � � � � 6 �� � + 8 � 9 � � �� $ 4 �" � + �� � #� �0 " #" $: ' " � ( $ ��� #� �0 " ; � 1 �+ � 6 � � # � � � 6 �� � +<= >? @AB C D D D EF G H E EF G H C HF C E IF J C E F K J KF K H D LF E E MF C C IF I H JF L M C F J H DF D K DF K H IF C IF DN O P Q R S T U V N W N N N O N P N Q N R N SXY Z [ \ ] Z ^ _ a bc [ dY a e ] aY f g Z ^c Y
2018p I
h ij i k l mn o p mn k o qn k o rn l k q qn p o s n p o s n o k q s n t k q s n p o p n u k k l n k k q p n l o mn l o mn s k q qn t II
h j i k l mn p p l n k p u n o o l n q k q l n r o o n s o mn t k q s n o k q rn o o u n l k k mn q k q on q o qn q o mn s k q qn o III
v hj h k l l n r u o n o p l n t o qn o o p n s o qn u o s n s k q rn l o on o o s n o k k mn q k q p n t p on s o mn q k q k n u
IV
v wj v o u n m u p n s u p n m o qn s o p n m o k n u o l n s o p n l o s n s o s n l k k mn u k q p n o o qn t o mn q k q k n q
2019p I
h �j i k l qn u u o n p p l n r o l n o o p n k o p n r o s n s o mn t o p n k o mn m k k s n m k q on r o mn l o mn q k q qn u
II
v vj x k l s n p u u n l p qn m o qn p o mn p o s n u o mn l o l n t k q qn s o r n s k k tn u k k qn l o qn q o mn q k q k n q
III
v hj v k r tn u u o n u p l n u o s n l o l n s o l n s o l n s o s n l k q p n o o r n l k k on q k k rn m p on s o mn q k q k n u
IV
v hj � k k u n q u p n r u p n o o k n p o mn t o l n k o tn q o mn t k k rn m o s n l k r k n m k k l n r o qn t o mn q k q qn o
2020p I
v vj y k l mn m u s n s p qn p o k n r o p n m o u n m o mn l o qn l o p n k o mn m k r k n p k k mn r o mn l o mn q k q qn uz c Z { dY {| \ ] | z c Z { dY { }Y { ~ Y ] d � � Z ] � Y2018p I
�j w l k n l k n s qn q k n m qn k � qn k qn m � qn m qn o � qn p � k n k qn k mn k qn q � qn s
II � � j � � qn k � k n k � r n m qn u rn l l n o � k n m qn l � rn u � k n m qn p qn t � mn t qn q qn l
III � j y � k n r � l n o � mn o � rn r � mn t � p n p k n q � l n m � rn o � k n m qn q � qn l � qn s � qn t qn p
IV � j i � r tn o � k n u � tn r � qn s � qn k k n k � rn k � l n o � mn m � qn t qn t qn r k n l qn q � qn u
2019p I
j h l mn k k n t tn k l n u � qn l u n q rn k � l n u rn u � qn o qn t qn l mn k qn q � qn l
II � j � l n o � l n k � l n m � l n r � l n l � r n s � k n r � k n q rn s � r n q k n r k n q � mn t qn q qn l
III
� j � � tn u l n k mn k mn o � k n m � r n m � qn o k n p p n l � qn r k n o k n o � qn s qn q qn u
IV � �j v � u n u � k n o � s n u � l n u k n k � qn m rn u � qn p l n r l n l rn k qn u k n l qn q � qn p
2020p I � �j � k mn o � l n s r n m � qn t mn q mn t � k n p � mn t � k rn p � k n q qn l qn o mn k qn q � qn k�Y Z {| \ ] | �Y Z { }Y { ~ Y ] d � � Z ] � Y2018p I
j s n t k n k p n u on t rn k � mn r k n r l n m � rn l � qn p � rn q qn u � qn o qn r � k n k
II
� j w k l n s l n t r n o on m k n p l n m � qn u tn r � l n o � k n o � qn s k n t � l n s qn r � qn s
III � j y k qn t � mn u � u n r � k n q � rn r � tn m k n t k n u � tn k � l n r � qn u qn l k n u � qn t k n r
IV � �j � � s n r � s n r � k l n q � qn u � rn l � mn u � rn l � un s � on l � mn m qn m qn t qn q � qn t qn q
2019p I � ij � � l n k � s n q � u n t k n u � rn u r n o � qn l � k qn u � un r � mn m k n o qn o qn q � qn t qn q
II � xj qn u � u n q � p n t � rn l � p n q � l n s � qn l � k k n k � rn k � mn p rn s k n r qn q � qn t qn q
III � �j � mn o � qn r qn k mn p � s n r r n p � rn k � tn p on k � l n p mn l l n s qn q qn q qn q
IV
� j x r qn k � qn m qn u k n m � l n p k n l rn s � l n o k un l qn q s n o l n o qn q qn q qn q
2020p I � � j h r n o � s n m � r n p � rn o qn l � qn u � k n k � mn p qn q qn q s n s mn t qn q qn q qn q- ;� 2 / (� / " � � # �� #" � 0 ' 3 � �" � $ # $ #" $ 30 9 #� 0�� 3 1 � #" � � 0 4 . � � + # % � # �� � � & 7" $ � 0 '2 # � ( � 0 " 0 4 � � � � � � 6 � � & � % 7 ( � � � 0 � # �� + 10 �� � � � 4 �0 " 0 4 � � # � � � 6 �� &� 3 1 �" $ � + � � & � � # + + � � � #� �0 " �0 " '0 � 4 + � 0 � 1 7" � �" #� �0 " # � - � #" $ # � $ 7" $ � + � � � # � / � # + + � � � #� �0 " ) 2 6 � + �0 " � � 7 - 7 / 2 6� � �� 3 1 / - ; � + � 1 0 ' � � � # � +0 � � � 0 ' * : 8 $ #� # �" 3 � �" � $ # $ #" $ 30 9 #� 0� 3 1 % 7 ( � $ � ' ' � + ' �0 4 � 1 / - ; � + 4 # + � � 0 ' * : 8 �" � � 4 + 0 ' 4 � 10 $0 �0 � � + #" $ � 0 6 � #� � 3 1 % 7 ( � � + 9 # + $ 0 " . �0 $ � � � �0 " �" $ � � #� 0 � + ) � � � � $ + . � � � ' ' � � + #" $ $0 + " 0 �� 0 4 . � 1 " + � 6 � & � 0 6 � # � � + � 9 � �" $ � + � � � + 4 # + � � $ 9 & � 1 / - ;�

� � � � � � � � � ��� �� � � ¡ ¢ �� � � £ � � ¤ � ¢ ¥ ¦ § � ¢ � © ª « ©¬ « ª ª �® ¯° ±² ³ µ ´¶ · ¹ º »¼ ½ ¾¿ À Á  ÿ ÄÁ Ä ÅÆ À¿ ÅÇ È Â Ã¿ Ä ÉÊ Ë Ä Ã Ä Ì Æ Ê Â À¿ È ÍÊ Î Ã È Á ¾Ï Ð Ê ÀÑ Ã È ÊÒ ¿ Ä Â À Á È Â¿ ÀÏ Ó Á À ÔÊ Â Ã Ä ÌÁ Ä ÅÕ ÃÏ Â À Ã Ö Ç Â Ã¿ Ä × ® ¶Ø´¶ · ¹ º Ó Á Ä Ç Ù Á È ÂÇ À Ã Ä ÌÚ »¼ È ¾Û ÉÊ Ë Ä Ã Ä Ì Á Ä ÅÆ Ê Â À¿ È Í Ê Î Ã È Á ¾Ï Ü » ¾ Ê È Â À Ã È Ã ÂÝ Á Ä ÅÞ Á ÂÊ ÀÚ » ¼ È ¾Û ß ÁÏ Ü Þ Í¿ ¾ Ê Ï Á ¾ Ê Á Ä ÅÉÊ Â Á à ¾à À Á ÅÊÚ » ¼ È ¾ Û » ÄÊ À Ì Ý Üáâ ãä åæç è é é é ê è ëì é í î ïð ñ ò ñ ð ó ï ô ð ó î õ ð ñ ö ÷ ð î ë ø ëì é ò õ ð î í í ð õ î ñ ñ ð ñè ù ö ÷ õ ò ï ø ñ î ó î îúû ü ý þ ÿ ü � � � � � �� ý �û � � ÿ �û � ü �� û
2018p I
�� � � � Û � � � Û � � � � Û � � � Û � � � Û � � � � � Û � � � � Û � � � Û � II
�� � � � � � Û � � � Û � � � Û � � � Û � � � Û � � � � � Û � � � � Û � � � Û � III
� � � � � Û � � � Û � � � Û � � � Û � � � Û � � � � � Û � � � � Û � � � Û � IV
�� � � � � Û � � � Û � � � Û � � � Û � � � Û � � � � � Û � � � Û � � � Û �2019p I
�� � �� � � � Û � � � Û � � � � Û � � � Û � � � Û � � � � � Û � � � Û � � � Û � II
� � �� � � � Û � � � Û � � � � Û � � � Û � � � Û � � � � � Û � � � Û � � � Û � III
� � � � � Û � � � Û � � � � Û � � � Û � � � Û � � � � � Û � � � Û � � � Û �
IV
� � � � � � Û � � � Û � � � � Û � � � Û � � � Û � � � � � Û � � � Û � � � Û �
2020p I
� � � � � Û � � � Û � � � � Û � � � Û � � � Û � �� � � � Û � � � � Û � � � Û �� � ü �û ! þ ÿ ! � � ü �û "û # û ÿ � $ % ü ÿ & û2018p I
�� � � � � Û � � Û � � Û � � � Û � � Û � � � � Û � ' � Û � � Û �
II ' � Û � ' � Û � ' � Û � ' � Û � ' � Û � � Û � ' � Û � ' � Û � ' � Û � � Û � ' � Û �
III Ø �� � Ø �� � ' � Û � ' � Û � ' � Û � ' � Û � ' � Û � Ø � � � ' � Û � ' � Û � ' � Û �
IV Ø �� � Ø �� � ' � Û � ' � � Û � � Û � � � Û � � Û � Ø �� � Û � ' � Û � ' � Û �
2019p I
�� �� � � Û � � Û � � � Û � ' � � Û � � Û � �� � Û � ' � Û � � Û �
II ' � Û � ' � Û � ' � Û � ' � � Û � ' � Û � � � Û � ' � Û � ' � Û � ' � Û � ' � Û � ' � Û �
III
� � � � � � Û � � Û � � Û � � � Û � � Û � �� � � Û � � Û � ' � Û �
IV Ø �� Ø �� � ' � Û � ' � Û � ' � Û � ' � Û � ' � Û � � � � ' � Û � � Û � � Û �
2020p I Ø � � Ø � � ' � Û � � Û � � Û � ' � � Û � ' � Û � Ø � � � � Û � � Û � ' � Û �(û ü ! þ ÿ ! (û ü "û # û ÿ � $ % ü ÿ & û2018p I
�� � � � Û � � Û � � � Û � ' � � Û � � � Û � Ø �� � � Û � � Û � � Û �
II
� � � � � � Û � � � Û � � Û � ' � � Û � � � Û � Ø �� � ' � Û � � Û � ' � Û �
III Ø �� � Ø �� ' � Û � ' � Û � ' � � Û � ' � � Û � ' � Û � Ø �� � ' � Û � ' � Û � � Û �
IV Ø �� � Ø � � ' � Û � ' � � Û � ' � Û � � � Û � � Û � Ø �� � ' � Û � ' � Û � ' � Û �
2019p I Ø �� � Ø �� � ' � Û � ' � � Û � � Û � ' � � Û � � Û � Ø � � � ' � Û � ' � Û � ' � Û �
II Ø �� � Ø � � ' � Û � ' � � Û � � � Û � ' � � Û � ' � Û � Ø � � � ' � Û � ' � Û � ' � Û �
III Ø �� � �� � ' � Û � ' � � Û � � � Û � � Û � � Û � Ø �� � � Û � ' � Û � ' � Û �
IV
� � � �� � � Û � ' � Û � � Û � ' � � Û � � Û � � � � Û � ' � Û � � Û �
2020p I Ø � � Ø �� ' � Û � ' � Û � ' � Û � ' � � Û � ' � Û � �� � � Û � � Û � ' � Û �) *+ , -./ -0 1 23 4 56 4 1 78 9: 3 ; 1 ; < 4 < 4 1 < : 8 = 4 >8 ?@ : A0 6 4 1 7B 8 C D ; 50 E 4 FG 43 20 3 5H I 1 <0 J 8 9 ,0 4 5 . B 8 18 C ;B KB 2 ;L ; 2H M F I. K N 28 > 4G >0 E A8 3 2O 20 3 C 0 B 8 18 C ;B 4B 2 ; L ; 2H ? : A0 ; 1 <G E 23 H B 5 4 E E ; PB 4 2 ;8 1 B 8 1 98 3 C E 28 2 A0 I 1 20 3 1 4 2 ;8 1 4 5 ) 2 4 1 < 43 < I 1 <G E 23 ; 4 5 - 5 4 E E ; PB 4 2 ;8 1Q ,0 L ; E ;8 1 R M I ) I - ,0 L ? R N ?: A0 - ) * ; E 2 A0 8 9 PB ; 4 5 E8 G 3 B 0 8 9 ST U < 4 2 4 ; 1 : 3 ; 1 ; < 4 < 4 1 < : 8 = 4 >8 ? : A0 F I. K < ; 9 90 3 E 93 8 C 2 A0 - ) * V E C0 4 EG 3 0 8 9 ST U ; 1 20 3 C E 8 9 C0 2 A8 <8 58 > ;0 E 4 1 <B 8 L 0 3 4 >0 ? : A0 F I. K ; E = 4 E0 <8 1 D 3 8 <G B 2 ;8 1 ; 1 < ;B 4 28 3 E Q 0 JB 5G <0 E D 3 ;B 0 0 9 90 B 2 E 4 1 <<8 0 E 18 2B 8 C D 3 0 A0 1 E ; L 0 5H B 8 L 0 3 4 5 5 EG = O ; 1 <G E 23 ;0 E C0 4 EG 3 0 < =H 2 A0 - ) * ?

W X Y Z [ X \ ] W_ a b c d e b f g g f h c i h d c j b c k l m m no l p p _qr s tu vwx v tx y z { {|} ~� � �� ��} ��� } � � � � w� � �u s � � tu xu �� t � �x v� � � qr � su�� �r � t � � � � � t ���� �� s � �y � �sr �x tx y � z { {| } ~ � � � � �� � � { �� } � � � � � u u vq su �r � � tx y�x v � � � s tr � � s tx �¡u ¢ � � � u ¡r � � t �r �£� � s �r x � ��� u u �¤ r � s q s tx � tx y£q � ¢ � t � � tx y� q � �r s¥ u x¦ r s �r s � §u u v�¨r � � �r vq su v � � � � ¥ �r � t � � � �� �u x �©r � � � � t �q su v � � � � ª � �r � ¢ �«¬ ¡« �r �¨r � � �r vq su v � � � � © t � �© �x � � � ��� � s tx y w �r � � s t � t �« § � �r s ® � y � s° ± ² ³ µ ¶ · ¯ ° ± ² ³2015
¹ º » � ¼ ½ ¾ ¿ À Á Á Â ¿ Ã ½ Á Â Ä Ä » � º Ã ¾ ¾ Â ½ £ ¿ Å ½ Á ½ £ À Æ ¾ Å ¾ ¿ Â Ã Å ¿ Æ Ç ¾ ¿ Â Ç Ã À ¿ ¾ ½ Å ¾ Â ½ ½ Â Æ ½ Ç Æ ½ ¿ ¿2016
¹ È º � É ½ ½ Ç Æ Á ½ Å Ã Å ¾ Å Á º É » � º ½ £ ¿ Æ Á Ç ½ £ ¿ ¾ ½ ¿ ½ £ Á Å À ¾ ¾ ¿ Á ½ Ã ¾ Å ¿ Á Å ½ Ã Á Â Å Ã ½ Ã Ç Å Å ¿ ¾ ½ Â ½ Ç ¿ ¿2017
¹ È » � È ½ ½ Æ Á Á Á ¾ Ç Ã Ã ¾ ¾ º É Ä � ¹ ½ £ Á ¾ ¿ ½ Å Á Å Ç ½ £ ¾ Á ¿ Æ Á Æ Ç Á Æ ¾ Â ¿ ¾ ¿ Æ Ç Á À À Ã ½ Æ Ã Ã Ã ¿ Á ½ ½ Ã Ã ¿ ¿2018
¹ ¹ º � ¼ ½ ½ Á Ç Á ½ Å Æ Æ ¾ ½ Å Ä » Ä � ¹ ½ £ À À Â Á ½ £ ½ Á ½ À ½ £ ¾ ¾ ¾ Ã Á Á Å Æ Ç Ã Â ¿ ¾ Á ¿ ¾ Á ¾ ½ Å ½ Æ Â ¾ Æ ½ À ½ ½ Á Æ ¿ ¿2019
¹ ¹ » � ¹ ½ ¿ Ã ½ Á Á Â À Á ¿ Ç À É º ¹ � Ä ½ £ Ã Æ Á Á ½ £ Á Â ¾ Å ½ £ ¾ Ç ¿ ¾ Á ¿ Â Å Ç Ç Å Å ¾ Á Â À Á Â Ã À ½ Æ ¾ Á Æ ¿ Â ½ ¿ Ã Â ¿ ¿
2015 I
¹ º º � º ½ ¾ Â Ç Á Á À Á Æ Á À Å Ä É » � » Æ Â Æ À ½ £ ¿ Ã ¾ Á ½ £ Â Æ ¿ ½ Á Å Ç Ã Å Á Á ¿ ¾ ¿ ¾ Ã Å Æ ¿ Ç ½ Å ½ Å ½ ½ ¿ Ã ½ Ç Â Â ¿ ¿
II
¹ É » � Ê ½ ¾ ¿ ¾ Á ¿ Å Á Ã Æ Â À É È º � Ê Å À ¾ Æ ½ £ ¿ Å Ã Ç ½ £ Â Æ ½ Á ¾ ¿ À Á Å Á ¿ ¾ ¾ ½ Â À ½ £ ¿ ¾ ½ Â ½ Å Á ¾ ½ ½ Ã Á ½ Ç À Á ¿ ¿
III
¹ Ä É � Ä ½ Á Ã Ã Á Á Å Æ Ã Ç À ¿ Ä Ê º � Ä Å Á Â Á ½ £ ¿ ¿ Å Å ½ £ À Å Å À Á Å ½ À Ã Å Æ ¾ ¾ ¿ À Ç Å Å Å Å ½ Å Â ½ ½ Á ¾ ½ ½ Æ ¾ ½ ¿ ¿
IV
¹ È Ë � Ë ½ Á Ç Ç Á ¾ Ç Ã Æ Ã Â Å º Ä È � Ì Æ ¿ Æ Æ ½ £ ½ Æ ¾ Á ½ £ Á Â À Å ¾ ¾ ¿ Ã Ã Å ¿ Æ Á Å Ã Â ¾ Â Å ¾ ½ Å À Â ½ ½ ¿ Æ ½ Ç Â Â ¿ ¿
2016 I
¹ È Ê � ¹ ½ Á ¾ ½ Á Á ¾ À Å ¾ Ç Æ º É º � » ½ £ ¿ À Ã Å ½ £ ¿ À À Ã ½ £ ¾ ½ Å Á Á Å À ¿ Ã Ç ¿ Ã Á Ã Æ Ã Á Ç Á Ã ½ Å ¿ ¾ ½ ¿ Â Ç ½ Â Ã À ¿ ¿
II
¹ È Ë � º ½ ½ Ç Ç Á ½ Â Â Å À Á Ã º Ä ¹ � ¹ Ã Å Á Ã ½ £ ½ ¾ Ã ½ ½ £ ¾ Á ¿ Á Á Æ Â ¾ Ã Ç Ã À ¾ ¿ ¿ Â Á Â Å Å ½ Ã Å Á Å ¿ Ã ½ Â Æ Á ¿ ¿
III
¹ ¹ È � Ì ½ ¿ Å Ç Á ¿ Ã Æ Å Á ¾ Å Ä Ë ¹ � Ë ½ £ ¾ Â Ã À Å Æ Æ Á ½ £ Á Â ¾ Å Á Ã Ã Æ Ã Ç ¿ Ã Á Ã ¿ ¿ Á Ç À À ½ Ã À ¾ Ã Æ ¾ ½ À Ã Ã ¿ ¿
IV
¹ È Ì � Ì ½ ½ Æ Ç Á ¾ ½ Æ Å Â ¾ À º » Ä � Ë Å Å ¿ ½ Å Ç ¾ Æ ½ £ Á Ã ¾ Å ¾ Â ¿ À Æ Ç Ç ¾ Á Å Ã Ã Á Â Á Á ½ Ã ¾ Å Æ Æ Ç ½ À Á ¾ ¿ ¿
2017 I
¹ Ë Ì � Ë ½ ½ Ç Ã Á Á Á À Ã À Ã ¿ º ¹ Ê � ¹ ½ £ ¿ Ç Â Æ Å ¿ ¾ ¿ ½ £ ¾ ¾ À Á Á Å À ½ Æ Â ¿ ¾ Á Å À ¾ Á ¾ Å Ç ½ Æ Ã Ã Æ ¿ ¿ ½ Á À ½ ¿ ¿
II
¹ È ¼ � Ä ½ ½ À Æ Á ½ Â Å Ã Â ¿ Ã Ä Ì ¹ � È ½ £ À ½ ¿ Ç Ã Å ¾ Ç ½ £ ¾ Â ½ ¾ Á Ç Æ Á Æ À Æ Å ¾ ¿ Å Á Á À Ç ½ ½ Æ Å Ç Ã À Ç ½ Á ¾ Á ¿ ¿
III
¹ » » � » ½ ½ Ã À Á ¾ Â Â Å ½ Ç Æ Ä È º � » ½ £ À Ã À Â Å À Â ¿ ½ £ Á Ã ¾ À Á Æ Â ¿ Æ À Æ ½ ¾ ¿ Á Å Á À Å ¿ ½ Æ Ã Á Ã ¾ ¿ ½ ½ Ç Ç ¿ ¿
IV
¹ Ë ¹ � ¼ ½ ½ Å ½ Á Á ¿ Â Å ½ Æ Â º ¹ É � È Å Â Å Æ Å Æ Ç Ã ½ £ ¾ ½ À ¿ Á Ç Ã Â Ç Å À Ã ¾ Á ¾ Æ Á À À ¾ ½ Æ Ã Ã Ã ¾ Á ½ ½ ½ Â ¿ ¿
2018 I
¹ È ¼ � È ½ ½ Æ Æ Á Â ¾ Æ Ã Ã Á Á º É Ë � Ë ½ £ ¾ Ã ½ ¾ Ã ¿ Å ¾ ½ £ ¾ Ç Â Â Á ¾ Â ½ Ç Å ¿ Â ¾ ½ ¿ ¿ Á Á Â Ã ½ Æ À Å Ç Ç Ã ½ ¿ Æ Å ¿ ¿
II
¹ È ¼ � º ½ ½ Ç ½ Á Á Ã Â Å Á Á Æ º ¼ Ë � Ê ½ £ ¿ Æ ½ Å ½ £ ½ Á À ¾ ½ £ ¾ Ã Á Å Á Á Á Â Ç Ã Å Á ¾ ¾ Á ¿ Á ¾ ½ Æ ½ Æ Ç Á Æ Æ Â ½ ½ Á Å ¿ ¿
III
¹ ¼ Ì � Ì ½ ½ ½ Á Á ¿ À ¾ Ã Æ ¿ Ç É É È � Ì ½ £ Ã Ç Å Ç ½ £ ¾ Ç Â ¿ ½ £ ¾ ½ ¾ Â Á ¾ ¾ Á Ç Å ¾ Ã ¾ ¿ Ç Æ Á ¾ Ã ½ ½ Æ À ¿ Ã ½ ¿ ½ ½ Â Á ¿ ¿
IV
¹ Ì Ä � ¼ ½ ¿ Â Ç ½ Å Á À Á Â Á ½ Ä Ä Ì � ¹ ½ £ À Â Ã Á ½ £ ½ Ã Æ ¿ ½ £ Á Æ ¾ ¾ Á Á Ã ¿ Ç Ç Ç À ¾ ¾ Á Ã Á ¾ Á Á ½ Æ Ç Á Ç ¿ À ½ ½ À Å ¿ ¿
2019 I
¹ ¹ º � É ½ ¿ Å ¾ Á À Å Á Á Á ½ ½ É » Ë � Ê ½ £ Ã Ç Á ¾ ½ £ Á ½ Æ ¾ ½ £ ¾ Å Á Â Á ¿ ¾ Â Ç Ç Å Æ ¾ ½ ¾ ¾ Á Â Á Â ½ Æ Á ¾ Ç Æ Ç ½ ½ ¿ Ã ¿ ¿
II
¹ º É � º ½ ¿ Æ ¿ Á À Ã Ç Á ¿ ¿ à ¼ Ë » � Ê Á£ ½  À Ç ½ £ Á Å Ç Ã ½ £ À ½ ¿ À Á ¿ Á Æ Ç Ç Å ¿ ¾ Á Å ½ Á Â Å Æ ½ Æ ¾ Á Æ Á à ½ ¿  à ¿ ¿
III
¹ » ¹ � È ½ ¿ Ã ¾ Á ¾ ½ À Á ½ ¾ ½ É É É � º ½ £ Å À Á Æ ½ £ ¾ ¿ Æ À ½ £ ¾ ¾ Å Ç Á ½ ½ Ç Ç Æ Ç Ã ¾ Á Á ½ Á Ç ¾ Â ½ Æ Á ¿ Ç Å ¿ ½ ¿ Ã Å ¿ ¿
IVp
¹ Ì Ì � Ä ½ ¿ Æ Ã ½ Æ Á À ½ Å ¿ Ç Ä ¼ Ì � Ì ½ £  Á Å ½ ½ £ ½ Å À ¿ ½ £ Á Å Ã Ç Á ¿ Â Æ Ç Ç ¾ Å ¾ ¾ Æ Á Á Â Æ Å ½ Æ Â Á Æ Á À ½ ¿ Ã Ç ¿ ¿Í ÎÏ Ð ÑÒÓ ÑÔ Õ Ö× Ø Ù Í Ö Ø Ö ÚÛ Ö ÚÜ Ø Ù Î Ý Þ Ü Ôßà á × â ã ä à å æ à çè Ö éÔ Ú Õ êÔ ë Ý â × Õ Ø Öì × Ø Ùí ØÛ × Ô Þ Õ Ú Õí Ú Û × Ô î â × ÖÔ ê ØÛ â Ú Ù × Ô Þ Õ Ú Õí ÝÔ Ù Ù Ö â ïÔ × â Ý â Ù Ù â ð Ú Õí Ö éÔ Ü Ù â Û ì × Ô â Ýñ Ô Ö× â Ö× Ú Õ ò Û ÐÔ Þ ÕÔ × ó Ú Õ ô â õÔ ã öÔ × å æ à ÷ß

ø ù ú û ü ù ý þ ÿ ø� �� � �� � � � � � � ��� �� ��� � � � � � � ��� �� � �� ��� � ! � " � # � �$ % &� ' ( �� �� )* � & '� �+ ' , �� ( �-. /� 0 � . ' & , * � & 12 ' (3 ' &� ' , � 4� � � � 5 � � �� � � � � � � �" 6 � � ! � " � # � 7 � � �� � .� , , �� �8 � � 3 , ( �� , 9 � � : 1;� < ' . . � ;� $ ( � &� ,=+ ' 0� � ( ,17 � � (> � ' � � � ( �� �=� 3 < & � , / � � �1 � ' %� ? � � @� (� , A� � � 1B� & ' (� �� � � 3 . ( , ? /� 0 � . ' & ,1 2� � -C� ( ' & & � .� � � 3 . ( , D , ,� 0 < &EF ;E %� 1B� & ' (� �� � � 3 . ( , C � , .GC '� 3 ) ' .-( 3 �� � � &� . ( � . � (E A ' (� H 3 � ' I J K L M N O P Q I R I I I J I K I L I M I N2015 S T U - VG W X G Y W Z G [ S U U \ [ W G ] G _ - [ Y G V - ] G Z - Y G ] - XG ^ - W XG W - Y G ] - Z G ] W G [ G ^2016 S ` a - [ G V - Y G W [ Z G X S U b c Y ] G _ - Z G Z - [ Y G Y - [ G Y - _ G Z - VG Z - X d G [ - W G V - Y [ G d - d G Y G ^2017 S \ c ^G V [ G _ - X G ^ \ b [ V G _ - d G ] Y G ^ - ] G X - [ Y G V Z G V - Z G ] - V G W - [ [ G Y - Y [ G X G ^2018
b e - W G d - [ G _ - [ _ G [ U a a [ _ G Z Y G X [ G ^ - [ X G ] - XG ] VG Y - Z G Y - Y G ^ - [ G d - Z G Y W G X
2019 S \ c - VG Y G X - [ G X U e e Y d G Z [ [ G ] Y G ^ - [ G V - Y G Y [ G X [ [ G V - [ G Y - [ G V - W G _ - ^ G Z
2015 I S a f - [ G W W W G _ Y [ G X S U U U - _ G Y - [ G d [ G Y - [ W G ^ - ^G [ - W G [ - [ ] G Z - W G V - W G _ - VG W G ^
II
c T - W G d - X G _ Y G ] g e Y V G X [ G V G [ Y G Z - ^G Y W G ] XG W G Y X G _ - ^G ] G ^
III S U f - [ G [ d G ] - [ G W S T a - Y G ^ - ] G [ - VG X - V G Y - Y G Z - W G V - W G [ [ G V V G Y Z G V G ^
IV S U a g - [ G _ W G [ - d G ^ S U f a - Y W G Z [ XG Y - [ XG W [ W G Z - ^G _ - Y G ^ - X VG [ - ^ G W - [ G [ - VG V G ^
2016 I
a e - Y G ] - Z G _ [ d G Y a T V ] G Y - [ G d Z G [ - [ [ G [ - W G V - W G X - Y XG d - Y G Y - V G X - VG W G ^
II S a T - Z G Y - W G Z G X S a U - [ V G d ] G d G [ - X G W G d VG V - [ G [ - ^ G X - [ V G ^ - ^G ] G ^
III
b b - XG [ - W G Y - Y G ^ ` ` Z Y G Y - [ VG [ - Z G V G d - ^G d - XG ] [ G _ - Y G X - W G ] - Z G W G ^
IV S b e _ G V [ [ G W G Y S U \ f - Y _ G [ - [ G V Y G V Y [ G V - [ [ G XG _ - VG X - ^ G Y - [ [ G Y - VG V G ^
2017 I S b U - ^G _ - V G ^ - [ [ G ^ S U a _ G X - XG W W G d - [ X G [ - Y G [ - [ G Z - Z G ^ - Y G ] - d G _ - [ Y G ] G ^
II
e \ - [ G _ - Y G d G W U U ` W Y G V - [ G [ G W - d G [ - ^G W Z G [ Y G _ G V Y G ] - ^G ] G ^
III
T ` W G Y d G [ _ G _ b g Z G Y Z G ] - Z G Y G d - ^G [ - Y G [ G Y - ^ G ] - [ G d - Z G W G ^
IV S ` f ^G X - X G V G [ S U T U - W Z G V W G V Y G V - Y G V - _ G XG d - [ G d G W G W - VG V G ^
2018 I
T e - [ G Y [ Z G ^ - W G ] e b V W G d - [ _ G [ W G d - [ Y G V - ^G X - VG Y - _ G X - Y G Y - [ d G _ - W G Y V G X
II
\ U - [ G V - d G d V G X U f - Y Y G V W ] G d [ G W - Z G W - ^G Y _ G [ Y G X G _ [ X G VG _ G [
III
U c g - VG Y - [ G X - Z G X b a g _ V G V Y [ G V - Z G V G ] G _ - _ G X Y G ] - [ G W V G Z Y G [ Z G _
IV S U f b - Z G ^ - Z G ] - _ [ G ^ S U T c - Y Y G ^ - [ W G ^ - W G [ - Y G Y - W G d ] G Z - Y G Z [ G W - Y Z G V - ^G Y - [ d G W
2019 I
f T W G Z Y d G Z [ V G [ U a b Y _ G _ Y G X d G V - [ G ] G Z - Z G ] ] G ] - Y G Y [ Y G ^ - W G X d G V
II
e c - Y G Y - ^ G Y - d G Y f ` [ Z G _ XG Z [ G W - ^ G V - ^G [ Z G Y G ] G Z _ G X - VG Z X G Z
III S T \ [ G Y - X G d X G Y S T e - d G ] G ] - Z G V G V [ G Y - Y G [ [ G V - ^ G _ - Z G [ Y G d - V G ^
IVp S U a T - ^G Z - Y Z G Z - [ G X S U a c - Y [ G W - ] G _ - W G [ - Y G ] - [ G d VG _ - Y G [ [ G d V G d - ^G Y - [ Y G Vh ij k lmn lo p qr s t h q s q uv q uw s t i x y w oz{ | r } ~ � { � � { �� q �o u p �o � x } r p s q� r s t� sv r o y p u p� u v r o � } r qo � sv } u t r o y p u p� xo t t q } �o r } x } t t } � u p� q �o w t } v � r o } x� o qr } qr u p � v ko y po r � u p � } �o ~ �o r � � { �z

� � � � � � � � � �� �� � � ¡ � ¢ £ £ ¢ ¤ � ¥ ¤ � ¦ � � § © © ª« ¬ ¬ �® °± ²³´ ² ° µ ¶ · ·¸¹ º» ¼ ½¾ ¿À¹ ÁÂà ¹ Ä ¾ Å ¿ ³Æ Ç È± É Ê °±± ËÌ ° È É ²Í É Î ® Ê ±ÏÐ Ñ® Ò ° Ð É È Î Ì ° ÈÓÔÉ ÊÕ É Èµ É Î® Ö´ ° µ × ¶ · ·¸ ¹ º » ¼ ½ ¾ ¿Ä Ø Á · Âà ¹ Ä ¾ Å ¿ Ù ± ± ² ± Ю Î Î ° µÚ´ ² Õ Î Ê ¯ °® Î Û ¯ °´ ÜÓݱ Þ É Ð Ð ± Ý® Æ Ê ° È® ÎßÍ É Ò® Ê ÎÓÙ ± ± Êà ® É ¯ °´ Ê ° µß Õ Þ È ° Î Ñ ° µÓ É Ç®á ± â ® Ê® Î ã± ± ²Óä® È É Ê® ² ± ² Õ Ð Ê Î á Ñ® Ò ° Ð É È ÎÓ Ô± Ïå® Ê É È È ° Ð ± ² Õ Ð Ê Î æ Πή Ò Þ Èçè Ýç Ç® Óä® È É Ê® ² ± ² Õ Ð Ê Î å ° Î Ðéå É Õ Ë É ÐÏÊÕ ¯ ° µ ³ È® ÐÏÊ ¯ ° Ð ° Êç ã É Ê® ê Õ µ Éë ì í î ï ð ñ ò ó ë ô ë ë ë ì ë í ë î ë ï ë ð2015
õ ö Â õ ÷ ø ù é ú ú ú é ù ú û é ú ü ý Â ý ÷ þ ÿé ÿ ÷ ù ú é ø ÷ ÷ ÿé � ÷ ÿ ù é ù ÷ þ øé � ÷ ÿ ÿ é ø � û é ÷ � � é þ ÷ � é � � � é ù ÿé ÿ2016
ü � Â � ÷ þ � é þ ú ù é ø ú � é þ � õ Â ý ÷ û û é û ÷ ÷ � é ÿ ÷ ÿ � é û ÷ ÿ ÷ é ù ÷ û ÷ é ø � þ é ÷ � � é û � ÷ é þ ÷ þ é � � øé ø ÿé ÿ2017
ü � Â ü ÷ ù � é � � � é � ú � é � � � Â õ ÷ ù ú é ù ÷ ÷ û é ú ÷ ÿ ú é ÿ ÷ ÿ ÿé ø ÷ û ÷ é ø � þ é � � øé ù ø � é � ÷ þ é û � øé ø ÿé ÿ2018
ü ö Â � ÷ ù ù é � � � é û � ÷ é ù � � Â õ ÷ ù ú é ú ÷ ÷ ÷ é ÷ ÷ ÿ � é � ÷ ÿ ÷ é � ÷ û � é þ � ÿ é � � � é ÷ ø ÿ é ÷ ÷ û é ÿ � øé ù ÿé ÿ2019
� ö Â � ÷ ÷ ø é � � ÷ é ú ù ÿ ú é ù � � Â � ÷ û ÿé þ � û é ù ÷ ÿ ú é ÿ ÷ ÿ ù é � ÷ þ þé � � û é � � � é � � ø é � ÷ ÷ é ú � þé � ÿé ÿ
2015 I
õ � Â � ÷ ú ÷ é û ú ø é � ú þ é � ü � Â ý ÷ þ ÿé ù ÷ û þ é � ÷ ÷ û é � ÷ ÿ ù é ÿ ÷ � ÷ é û ÷ ÿ ù é ÿ � ù é ù � ú é û ÷ � é � � � é ú ÿé ÿ
II
õ � Â � ÷ � ø é ÿ ú � é � ú ø é ÷ ü � Â � ÷ þ ÷ é ù ÷ û û é ù ÷ ÷ ù é þ ÷ ÿ ÿé ú ÷ � ÷ é ÷ ÷ ÿ û é ÿ � ÿé � � � é û ÷ ú é û � � é � ÿé ÿ
III
õ ö Â � ÷ � ÷ é û ú � é ÷ ú û é ÷ ü ý Â � ÷ þ ÷ é û ÷ ù � é û ÷ ÿ � é � ÷ ÿ ù é � ÷ þ � é � ÷ ÿ ÿ é � � û é � � ø é � ÷ � é ÿ � � é ú ÿé ÿ
IV
ü ü Â õ ÷ þ ù é ø ú � é þ ú ÷ é ù ü � Â � ÷ û � é þ ÷ ù ÿ é � ÷ ÿ � é � ÷ ÿ û é ø ÷ û � é ø � ø é � � øé ÷ � � é ù ÷ ú é ÿ � � é þ ÿé ÿ
2016 I
ü � Â � ÷ � ÿ é û ú þ é þ � � é þ � õ Â � ÷ û ÷ é þ ÷ ÷ ú é ÷ ÷ ÷ ù é û ÷ ÿ ÷ é � ÷ û þé þ � ø é ÷ � ù é û � ù é � ÷ ø é ÿ � � é û ÿé ÿ
II
ü � Â � ÷ ø ÿ é þ ú û é þ ú þ é ÷ ü ö Â � ÷ û ú é þ ÷ ÷ øé � ÷ ÷ ÷ é ÷ ÷ ÿ ÿé ù ÷ û þé ø � � é ÷ � ú é ù � ÷ é þ ÷ û é ø � � é ù ÿé ÿ
III
ü � Â � ÷ û ù é ù ú ù é ù � ÿ é ù � ü Â � ÷ û ù é � ÷ ÷ ù é ÷ ÷ ÿ øé ÷ ÷ ÿ ÷ é þ ÷ û û é ÿ � ÿ é ÿ � ú é ÿ � ÷ é ÿ ÷ þ é þ � � é û ÿé ÿ
IV
ü � Â � ÷ û ú é ø ú ÿ é � � ÿ é ÷ � õ Â � ÷ û ÷ é ÿ ÷ ù ÷ é þ ÷ ÿ � é ú ÷ ÿ ÷ é � ÷ ù þé þ � û é ù ø ÿé ú � ÿ é ú ÷ þ é � � øé ú ÿé ÿ
2017 I
ü � Â õ ÷ û ú é ù � ø é ú ú ÷ é û � ü Â ö ÷ ù ú é ÷ ÷ ÷ � é � ÷ ÷ ÿé þ � � é � ÷ ù þé þ � � é ú � þé ú ø ú é þ ÷ ù é ú � � é û ÿé ÿ
II
ü ý Â � ÷ û ø é � � ú é ÿ ú ø é ù � � Â õ ÷ ù ú é � ÷ ÷ ù é þ ÷ ÿ � é � � � é ø ÷ û � é û � ø é ÷ � � é ÿ ø � é ú ÷ ù é ø � � é ù ÿé ÿ
III
ü � Â ö ÷ ÷ ù é � � ú é ÿ ú ú é � � � Â � ÷ ù � é ÿ ÷ ÷ ÿé � ÷ ÿ � é ÿ ÷ ÿ ÿé � ÷ û øé ø ú ú é � � � é � ø þ é � ÷ û é þ � � é û ÿé ÿ
IV
ü � Â � ÷ û ÷ é ÷ � ø é � ú ø é ÿ � õ Â ý ÷ û ÿé ú ÷ ÷ øé ÿ ÷ ÿ � é û ÷ ÿ ù é ÿ ÷ ù ú é ÷ � � é � � � é � ø þ é � ÷ ú é þ � øé ú ÿé ÿ
2018 I
ü � Â ö ÷ û ÿ é ø � � é � ú ÷ é � � � Â ö ÷ ù � é þ ÷ ÷ ÿé ú ÷ ÿ � é � ÷ ÿ ÿé ú ÷ ù ú é ú � ø é � � û é � ø ÷ é � ÷ û é ÿ � øé � ÿé ÿ
II
ü � Â � ÷ ù � é � � ø é ÷ � ú é û � � Â � ÷ ù ú é þ ÷ ÿ ú é þ ÷ ÿ ú é ú ÷ ÿ ÿé � ÷ þ û é ø � � é û � þé û ø ÿ é ÷ ÷ ù é û � øé þ ÿé ÿ
III
ü � Â ö ÷ ÿ � é ÷ � þ é ø � � é ø � � Â õ ÷ ù � é ÷ ÷ ÷ ÷ é ÷ ÷ ÿ þé ø ÷ ÿ ù é û ÷ þ û é ù ú ú é � � øé � � ú é û ÷ ù é ø � øé ÷ ÿé ÿ
IV
� � Â � ÷ ù þ é û � þ é � þ � é � � � Â ü ÷ û ÿé ù ÷ ÷ þé þ ÷ ÿ � é ÿ ÷ ÿ û é ø ÷ û þé ÿ ú û é ÷ � øé ÿ ø ÿ é ø ÷ þ é û � � é ú ÿé ÿ
2019 I
ý õ Â � ÷ ù û é ú � ù é þ ù ÿ � é û � � Â � ÷ ù øé ú � ÷ é � ÷ ÷ ÿé û ÷ ÿ ÷ é ø ÷ û þé � � ø é ÷ � û é þ � � é þ ÷ ÷ é � � � é � ÿé ÿ
II
ý õ Â ü ÷ ù ù é ú � ù é ù ù ÿ � é ÷ � � Â � ÷ û ÿé ÿ � ÷ é ÷ ÷ ÿ � é ÿ ÷ ÿ ÷ é ú ÷ � ÷ é ø � û é ø � ù é � � � é � ÷ ÷ é þ � � é ÷ ÿé ÿ
III
� ö Â � ÷ ÿ ù é ÷ � ÷ é þ ù ÿ � é û � � Â � ÷ û ÷ é � � û é � ÷ ÿ � é ÷ ÷ ÿ û é ù ÷ � ÷ é ù � ù é þ � � é û � ø é ù ÷ ù é ù � þé � ÿé ÿ
IVp
� ö  � ÷ ÷ ú é û � ÷ é þ ù ÿ � é û � �  � ÷ û ù é � � øé � ÷ ÿ � é ø ÷ ÿ þé þ ÷ þ ÷ é ù � ÷ é ú � � é ÿ � ø é ú ÷ ÷ é ú � þé þ ÿé ÿ � � �� � � �� � � � � � �� � �� � � � � � ��� � � � � � ! " � #$ � %� � � &� ' � � � � � �( � � �) �� � � � � � �) � � � � * � � �� & �� � � � � � � � � �) �� � � � � +� � � � � � � � , � �) � %� � � � � ( � � � �- � �� � �� � � . � �� � �� � / � � 0 � 1� � 2� � ! " � 3�

4 5 6 7 8 5 9 : ; 4< => ? @ A B ? C D D C E @ F E A @ G ? @ H I J J KL I M M <NO P QR STU S Q U V W X XYZ [\ ] ^_aZ bcd Z e _ f Tg h iR P j k QR UR lm Q i jU Sn j o NO k PRpq rO s Q q j i o m Q ituj kv P j iV j oPO wU Q U V x W X XY Z [ \ ] ^_e y b Xcd Z e _ f z R R SN PR q O o o Q U V{U Sv o k P QO o | P QU }t~R � j q q R ~O g k Q iO o�n j P sO U k otz R R k� O j P N P QU k Q U V�N v � i Q o r QU Vt N j h O P� R U� O P kO P o �R R St�O i j kO SN PR S v q k o � rO s Q q j i ot uR Up�O k j i i Q qN PR S v q k o � o o O s � i�� ~� h O t�O i j kO SN PR Sv q k o � Q o q�� jU v l j qpkv P QU V T iO qpk P Q q Q k� � j kO P � v V j P� � � � � � � � � � � � � � � � � � � � � � �2015
� � �c � � �� � � � � � � � � �� � � � c ¡ � � ¢� £ � � ¤ � � ¤ � ¥ � � � £ � � �� � £ � �� ¢ ¥ � ¥ � � ¤ � ¤ � �� � � ¢ �� � £ � ¥ � � � ¤ £� � �� �2016
� � �c � � �� £ � £ £� � ¤ � ¤ � ¥ � £ � ¡ � c � � � £� � � � ¤ � £ ¤ � ¤ � ¢� ¤ � � � � ¢ £ ¥ �� � ¥ ¤ �� ¤ ¢ � ¢� � � £ ¤ � � £ ¤ �� � ¤ � �� � �� �2017
� ¦ ¡ c � ¤ � � � � � � � ¤ � � ¥ ¥ � � � § � c ¨ � £ ¤ � � � ¤ � � ¤ ¤ � � � � � ¢ � � ¢� � � � �� ¥ ¥ � � � � ¢ ¥ � � £ � � ¤ � ¢ � � ¤ � � ¤ � � � � �� �2018
§ © ¦c � �� ¤ � � ¤ � � � � �� ¢ ¦ § � c © ¤ � ¤ � ¤ � � ¤ � � � � � � ¤ � � ¢ �� � � � � � ¢ ¢ � �� � ¥ � ¥ � � ¢ � �� � � � ¤ � � � � ¥ � ¢ ¤ ¢ �� � �� �2019
§ � © c � ¥ � � ¥ ¤ ¥ � £ � �� ¤ ©ª � ¡ § c ¨ ¤ � ¢ ¥ �� � ¤ � ¥ ¢ £� � ¤ � � � � � ¢ � � �� ¢ ¢ £ ¢� � ¢ ¢ ¥ � ¥ ¢ £ £� � ¥ � £� ¢ � � �� ¤ ¤ ¢ ¢� � �� �
2015 I
� ¦ c � � ¢� � � � �� ¢ � � � � £ � � � c � ¢ �� ¢ � � ¥ � ¤ ¤ � ¥ � ¥ � ¤ � � ¤ � ¤ £ � �� ¥ � � �� � ¤ � ¥ ¢ ¢� � � ¢ ¢� � £ � £� � � ¤ �� £ �� �
II
§ � c � � ¢� � � ¥ �� £ ¤ � � ¤ £� ¥ ¦ § © c � £ £ � � � � � ¢� � ¤ � ¥ � � � � ¥ � ¤ � � £ � �� � ¥ � £� ¤ ¤ � ¢ £ ¥ � ¢ � ¢ � � � £ ¢ £� � � ¤ ¤ � ¥ �� �
III
§ � �c � � � � � � � �� � ¤ � � ¢ �� � ¦ © c £ � ¢� � � � £� � ¤ � ¥ � � � ¤ � � ¥ � � £ � £� � ¥ � ¥ � � ¤ � ¥ � �� £ � � ¥ � � � � £� ¢ � � � � ¥ �� �
IV
� © c © � � � � � � ¤ � � � £ � � ¤ �c ¨ � ¤ ¢� � � � �� ¥ ¤ � ¤ ¢ ¤ � � ¥ ¤ �� ¢ £ � £� £ ¥ � � � ¤ ¢ � ¤ � � � � �� � £ ¤ � � ¤ � ¤ ¥ � � �� �
2016 I
� � �c � � ¤ � � � £ ¢� � ¤ � � ¤ ¤ � � � ¡ § c ¨ � � � � ¢ � � ¢� � ¤ � ¤ � ¢� � � � � � � £ ¢ �� � � � �� ¢ � � �� ¥ � £ �� � £ � � � � � � ¢� � �� �
II
� ¦c � � �� � � � � � ¢ ¤ � ¤ � �� £ � �c � £ ¢ ¢� � � � � � ¢ ¤ � ¤ � � � � � � ¢� � £ ¢ � � ¤ ¥ � �� ¢ ¢ ¢ £� ¢ � £ � � ¤ £ £ � � £ � � ¥ � � �� �
III
� ¦ §c ¡ � �� � � � ¢� � ¤ � � � ¢� � � ¦ � c § ¤ � � � � � � � � � � � ¤ � ¤ � ¤ � ¢ � � ¢� � £ ¢ �� � ¥ ¤ ¤ � � ¢ � � � � � � �� £ £ � �� £ ¤ � �� � �� �
IV
� c � � ¢� � � � �� � ¤ � � � � � ¤ ¦ c ¨ � � £� ¤ � � ¢� ¤ ¤ � ¤ � ¤ � ¢ ¥ ¢ � � ¤ £ ¤ � � � ¥ � �� ¢ ¢ ¤ ¢� £ � � �� � � ¤ � � � ¤ � � � ¥ �� �
2017 I
� �c ¨ � ¢� � � � �� ¢ ¤ � � ¢ �� � � © c � � ¥ ¤ � £ � � � � � ¤ � � � � � � � � � � � � £ � ¥ � � ¥ � �� � ¢ ¥ �� � � £ ¤ � ¢ � ¢ £� � ¤ £ �� � �� �
II
� ¦ c ¡ � ¥ � � � � £� � � � �� ¤ � � § c ¡ ¤ � � � ¢� � � � � � ¥ ¤ � � � ¥ ¢� � � £ � � ¥ � ¢ ¢� � ¥ � ¤ � � ¢ ¢ �� � � � �� � £ � �� £ ¤ � �� £ �� �
III
§ � �c � ¤ � � � � ¥ � ¤ � � ¤ � � ¥ � � � ¦ ¡ © c � ¤ � ¤ � �� ¤ � � � � � ¤ � � � � � � ¥ � � �� ¢ � ¢ £� � ¥ ¢ �� � ¢ ¢ �� � � � £� � £ ¤ � � � ¤ � ¢� � �� �
IV
� §c � �� � � � £� � ¤ � � £ �� ¥ � c � � ¥ ¥ � � � ¢ � � ¥ ¤ � � � � ¢� � � £ ¥ � ¤ � ¢ �� � ¥ ¥ �� ¢ ¢ ¤ �� ¥ � � � � ¥ ¢ � ¤ � £ ¤ ¢ � � � �� �
2018 I
� � c § � �� ¤ ¥ ¥ � � ¤ ¤ � � � �� � � § ¡ c � ¤ � � � ¥ � � � ¥ �� � ¤ � � ¢ � � � � ¥ ¥ � � � ¥ £� � ¥ � ¤ � ¤ ¢ � �� � � � ¢� ¥ � ¤ � � � ¤ ¢ �� � �� �
II
� � �c © � �� � ¥ � �� ¥ ¤ � ¤ � � � � � § c § � ¥ � � � ¤ � � ¥ � � £ ¤ � � � ¤ � � � � �� � ¢ � �� � ¥ ¢ � � ¥ ¢ � £� � � � ¥ � ¤ £ ¥ �� � ¤ ¢ �� � �� �
III
§ ¦c ¦ ¤ � ¥ � � � � ¥ � � ¤ � ¤ � ¤ � ¢ ©ª � � § c � ¤ � ¢ ¢ �� � ¤ � � � � � � ¤ � � � £� � � � � � � ¢ � ¢� £ ¥ ¢ � � � ¢ � ¤ � ¢ � � � � £ £ ¢ ¢� ¥ ¤ � ¤ � ¥ �� �
IV
§ © © c © � � � � � � �� � � � �� � ¦ � c � ¤ � ¤ � �� ¤ ¤ � � ¥ � � � ¤ � ¤ � �� ¥ � � �� � ¢ � �� ¢ ¢ � �� ¥ ¢ ¤ ¢� ¢ � � �� � ¢ � ¤ � � ¤ � ¤ � £ �� �
2019 I
§ � �c ¡ � � � ¥ ¥ ¢ ¢� ¢ ¤ � � � £ ©ª � ¡ � c § ¤ � ¢ £ �� � ¤ � ¥ � � � � ¤ � � £ � � ¤ � � �� � ¢ � �� � ¢ ¤ ¤ � � ¢ � ¥ � ¤ � � �� � � £ �� � ¤ ¢ £� � �� �
II
§ � c § � �� ¤ ¥ ¢ ¢� � � �� � ©ª © © § c � ¤ � £ � £� � ¤ � ¢ � ¥ � � ¤ � � � ¥ � � ¤ � �� ¤ ¢ ¢ ¤ � ¥ ¢ ¢ �� � ¢ � ¢� ¢ ¥ ¤ �� � £ ¢ �� ¥ ¤ ¢ �� � �� �
III
§ § © c ¦ ¤ � £� ¤ ¥ � ¢� ¥ ¤ � ¤ � � ©ª � § � c � ¤ � ¢ � ¥ � � ¤ � ¥ � � � � ¤ � � � ¢� � � � � � � ¢ ¢ �� � ¢ ¢ � � ¤ ¢ £ �� � ¥ � £� � � £ ¢� � ¤ ¢ � � � �� �
IVp
� ¦ §c © � ¤ � ¤ � ¢ ¤ � ¢ � ¤ � ¤ � © § c © ¤ � ¤ � �� ¢ ¤ � � ¥ � � � ¤ � � � � � ¤ ¤ � �� ¤ ¢ � �� ¤ ¢ £ �� £ ¢ ¥ �� � ¥ � � � � £ ¤ ¥ � � ¤ ¢ £� � �� �« ¬ ® ¯°± ¯² ³ ´µ ¶ · « ´ ¶ ´ ¸¹ ´ ¸º ¶ · ¬ » ¼º ²½¾ ¿ µ À Á  ¾ Ã Ä ¾ ÅÆ ´ Dz ¸ ³ Ȳ É » À µ ³ ¶ ´Ê µ ¶ ·Ë ¶¹ µ ² ¼ ³ ¸ ³Ë ¸¹ µ ² Ì À µ ´² È ¶¹ À · µ ² ¼ ³ ¸ ³Ë »² · · ´ À Ͳ µ À » À · · À Î ¸ ³Ë ´ Dz º · À ¹ Ê µ ² À »Ï ² ´µ À ´µ ¸ ³ й ®² ¼ ³² µ Ñ ¸ ³ Ò À Ó² Á Ô² µ Ã Ä ¾ Õ½

Ö × Ø Ù Ú × Û Ü Ý ÖÞ ßà á â ã ä á å æ æ å ç â è ç ã â é á â ê ë ì ì íî ë ï ï Þðñ ò óô õö÷ õ ó÷ ø ù ú úûü ýþ ÿ � � ��ü ��� ü � � � � ö �ô ò � óô ÷ô � � ó � �÷ õ� � � ðñ òô�� �ñ � ó � � � � � ó � �� � � ò � �ø � �òñ �÷ ó÷ ø � ù ú úûü ý þ ÿ � � �� � � ú�� ü � � � � � ô ô õð òô �ñ � � ó÷ ø�÷ õ � � ò óñ � � ò ó÷ � � ô ! � � � ô ñ ó �ñ �"� � ò �ñ ÷ ��� ô ô # ñ � ò ð ò ó÷ ó÷ ø"ð � ! � ó � � ó÷ ø� ð � ñ ò$ ô ÷ %ñ ò ñ ò � &ô ô õ �'ñ � � ñ õð òô õ� � � $ �ñ � ó � � � �� �ô ÷ �(ñ � � � ó �ð òô õ� � � ) � �ñ � ! �*+ * ñ �'ñ � � ñ õð òô õ� � � ( ó � �,( �÷ � � � �� � ò ó÷ ø ö �ñ �� ò ó � ó * & � ñ ò - � ø � ò. / 0 1 2 3 4 5 6 . 7 . . . / . 0 . 1 . 2 . 32015
8 8 9 � : ; < = , < > ? ; , = @ A @ , ; 8 B C � 9 ; D E, D @ > > , = ; < @ , D ; D E, A < E D , ; > F > , D @ ? D , E > > < , ; @ F ; , ? = ? @ , @ E, E2016
8 8 8 � B ; < ; , D > A ?, @ @ > A, E 8 G H � 8 ; D E, < @ > F , ; ; D = , A ; D < , ? = ? F , ; > A < , @ > ? ; , ; > @ @ , ? A A ; , D = = ; , ; E, E2017
8 8 : � 9 ; < A, ; > = E, ? @ > ; , = 8 G G � I ; D F , < @ E E , ? ; < D , F > E F , ? = F A , ; > A @ , ; > < F , A > @ < , > A < > , A = A A, > E, E2018
8 : J � G ; ? < , A > < D , A A ; @ , D 8 G C � : ; D @ , > @ ; ; , = ; < ; , < > ; ?, A = = < , A > A A , < @ > > , F > A D , F A F A, D = A D , @ E, E2019
I 8 8 � B ; F @ , A > D @ , ? ; E F , A 8 : K � : ; D ; , ; @ A E , = ; = > , < > @ ; , < ? A E , @ > F ; , < @ A D , ; > A F , E A @ > , < = ? = , < E, E
2015 I
8 8 H � 9 ; < ?, @ @ E F , D @ @ F , E 8 8 8 � B ; < < , D @ > ; , < ; = < , E ; < = , D = ? = , = > A = , @ @ F E , F > > F , = @ > ?, ; = > ?, F E, E
II
8 B 9 � H ; < = , F > F ?, > @ F ?, ; 8 G C � 8 ; < F , D @ > F , = ; < E , A ; < ?, = = @ D , < > F > , F A E A , < > > > , ; @ < F , = = ? = , ? E, E
III
8 I G � 8 ; = A, ? > A ?, = @ @ ?, A 8 I 9 � 9 ; < < , = @ > > , @ ; < < , > ; < < , F < = < , D > F A , = @ A F , @ > > F , @ @ > F , D ? D A, F E, E
IV
8 G 8 � K > E @ , E > @ < , ; @ A A, < 8 C H � J ; D D , D @ > E , < ; < < , D ; D < , ? < F E , ; > F ? , D @ = F , > > @ D , F @ ? < , ? < ? A, = E, E
2016 I
8 8 9 � 8 ; = F , F @ E > , A @ > < , E 8 G B � H ; < F , ? @ @ < , ; ; D ; , ? ; D ; , E < E F , ? > A D , E > @ F , F > > D , D @ D < , < < ? F , F E, E
II
8 B H � G ; = = , = > A E, E @ ; F , F 8 : J � J ; < > , E @ > F , = > E E , @ ; D F , = = ? < , ; > F @ , > > A D , D > @ E , A A @ ?, ; D ; A, A E, E
III
8 I H � K ; ? = , @ > A = , D @ > F , ; 8 I J � I ; < ?, = @ > @ , = > ; ? , E > E E, A = ? E , A > A A , ; > D E , E > @ ; , > A = E, ; F < ; , E E, E
IV
8 8 8 � : > E = , @ ; D A, < @ > = , ? 8 G H � H > E < , = @ ; > , = ; < ; , ? > E = , F = > ? , @ > A ? , D > ? D , E > A @ , E A ? > , ? = > @ , A E, E
2017 I
8 I G � : ; < ; , A @ ; E, F @ E < , ; 8 8 9 � 9 > E E, F @ E ? , F ; < A , ; ; D = , E ? < E , ; > @ ? , F > ? E , @ > @ ; , > A @ @ , @ = > < , > E, E
II
8 8 B � I ; D > , > > F ; , D @ > @ , F 8 G H � I ; D E, E @ > < , @ ; D > , D > E @ , E < E ; , ; > A F , @ > ? < , ; > @ F , ; A @ F , < = ? D , A E, E
III
8 8 : � 8 ; < > , A > F < , E @ @ A, @ 8 B J � I ; < F , < > D = , > > E F , A > E = , > = D F , ? > A > , < @ E E , < > @ F , ; A A A, A = @ D , ? E, E
IV
8 G K � B ; < E, @ > ? > , E @ > ; , ; 8 J I � B > E ?, = > = E , @ ; = F , = > ; F , ; = @ D , F > A = , ? @ ; > , @ > F ; , A ? ; ?, > = @ D , ? E, E
2018 I
8 8 : � : ; ? ?, @ @ > > , = @ @ D , F 8 B K � 9 ; D > , ; > D > , < ; = ? , < > E = , < ? D ? , = > @ ? , @ > D F , E > > = , A A @ = , F = > ; , > E, E
II
8 8 8 � H ; = ?, ; > ? ; , D @ ; A, ? 8 G B � B ; < D , = @ E A , F ; < F , < > ; A, = < A ? , E > A ? , A @ ; > , > > F < , = A A D , @ = A A, @ E, E
III
8 C C � C ; ? ?, D > D > , E A @ = , = 8 : H � H ; < D , > @ ; A , > ; D < , > > ; = , ? < > < , E > F > , > @ F ; , F > A = , = A > = , E = ? A, F E, E
IV
B I : � C ; ? A, ; > < ; , E F ? @ , D 8 C B � I > E ; , D @ @ F , A ; ? ? , F > > F , ? = A > , D > A A , @ @ @ ; , A > ? A , > F E F , < = ? = , > E, E
2019 I
I I 9 � J ; F ; , D @ A = , E ; E F , A 8 G H � G ; < F , = @ @ ? , > ; ? < , @ > > ; , > = E @ , A > A ? , A @ > > , E > > ? , @ A > D , A = @ < , @ E, E
II
I I J � J ; ? E, < > = D , E ; E F , A 8 G 8 � 9 ; < A, > @ A F , @ ; = ? , D > > D , ? ? A < , F > F @ , < @ @ E , F > A ; , D A > A, ; = A D , = E, E
III
I 8 C � C ; F > , @ > = D , F ; E F , A 8 C H � : ; < D , A @ ? ; , = ; < ? , F > @ @ , < ? > ? , D > F F , ? @ ? > , F > A F , ? A A @ , < = D E, > E, E
IVp I 8 C � 8 ; A < , < > ? D , E ; E F , A 8 C K � B > E F , ; @ ; D , F ; F D , F > A > , A F < > , > > F ; , @ @ < ; , F > ? ? , @ A @ @ , D = D @ , E E, EL MN O PQR PS T UV W X L U W U YZ U Y[ W X M \ ][ S^_ ` V a b c _ d e _ fg U hS Y T iS j \ a V T W Uk V W Xl WZ V S ] T Y Tl YZ V S m a V US i WZ a Y X V S ] T Y Tl \S X X U a nS V a \ a X X a o Y Tl U hS [ X aZ k V S a \p S UV a UV Y T q Z OS ] TS V r Y T s a tS b uS V d e _ v^

� � � � � � � � � �PeriodEnding
1TABLE 4 PRODUCTION AND SALES OF NATURAL GAS, PETROLEUM AND PETROLEUM-BASED PRODUCTS Jun 2020
/Thousands of Barrels (unless otherwise stated)/
Natural Gas Production Crude Petroleum Petroleum Based Products
Natural Gas Liquified Natural KeroseneProduction Gas Production Total Daily Refinery Motor Gas/Diesel Fuel and Aviation
cu. ft per day 000’ cu m Production Average Imports Exports Throughput Gasoline Oil Oil Turbine Fuel 1 2 3 4 5 6 7 8 9 10 11
2015 3,833.2 28,909.5 28,709.5 78.7 28,622.3 11,318.6 45,765.6 13,937.9 11,556.6 14,538.7 4,646.22016 3,326.6 24,408.2 26,164.0 71.5 37,014.2 10,291.8 54,256.6 17,500.5 15,758.1 13,616.7 5,529.62017 3,356.2 25,072.8 26,210.9 71.8 32,240.0 9,971.7 47,720.0 13,655.5 10,954.4 15,616.1 4,260.32018 3,585.1 28,449.5 23,175.6 63.5 22,886.1 8,047.0 35,999.8 12,242.4 8,785.0 12,053.3 3,341.72019 3,587.8 28,882.3 21,480.7 58.9 _ 21,971.7 _ _ _ _ _
2015 II 3,776.3 7,062.3 7,282.3 80.0 7,806.1 3,001.7 12,534.9 3,716.1 2,920.5 4,140.9 1,316.9 III 3,790.3 7,033.7 7,033.1 76.4 7,759.9 2,261.4 12,188.5 4,015.6 3,253.1 3,541.1 1,256.4 IV 3,711.7 6,761.8 6,918.5 75.2 7,435.1 2,622.7 10,975.8 3,645.2 3,106.3 3,180.9 1,118.4
2016 I 3,588.3 6,612.0 6,795.7 74.7 9,503.4 2,641.6 13,469.7 4,533.7 3,996.8 3,311.6 1,594.3 II 3,374.3 6,203.4 6,500.9 71.4 8,752.0 2,621.7 13,465.9 4,369.1 3,895.5 3,499.5 1,417.8 III 3,035.0 5,403.6 6,241.6 67.9 9,371.8 1,880.2 13,402.1 4,207.7 3,787.1 3,430.1 1,222.6 IV 3,308.7 6,189.2 6,625.9 72.0 9,387.0 3,148.4 13,918.9 4,389.9 4,078.7 3,375.5 1,295.0
2017 I 3,315.3 6,163.6 6,687.0 74.4 8,461.9 2,915.4 11,894.3 2,869.2 2,768.2 3,857.1 1,058.6 II 3,173.0 5,545.7 6,547.4 72.0 7,284.3 2,807.9 11,263.0 3,230.0 2,639.1 3,911.3 988.4 III 3,449.0 6,692.6 6,479.7 70.4 7,752.3 1,987.3 12,006.3 3,908.1 2,953.1 3,786.9 1,077.5 IV 3,487.3 6,671.0 6,496.9 70.6 8,741.5 2,261.0 12,556.4 3,648.1 2,594.0 4,060.8 1,135.8
2018 I 3,734.0 7,431.0 6,131.6 68.2 7,197.5 2,402.3 11,407.1 3,680.7 2,575.5 3,681.3 1,213.6 II 3,628.7 7,169.0 6,060.8 66.6 7,992.2 2,242.0 11,897.4 4,045.4 2,915.0 3,959.1 1,050.8 III 3,473.0 6,770.6 5,753.2 62.5 7,218.7 1,881.5 11,168.8 3,768.7 2,858.0 3,588.0 960.4 IV 3,504.7 7,078.9 5,229.9 56.8 477.7 1,521.2 1,526.5 747.7 436.4 824.9 116.9
2019 I 3,790.0 7,678.2 5,322.1 59.2 _ 5,818.8 _ _ _ _ _ II 3,478.7 6,730.8 5,393.8 59.3 _ 5,060.6 _ _ _ _ _ III 3,605.0 7,309.6 5,334.6 58.0 _ 5,697.0 _ _ _ _ _ IV 3,477.3 7,163.7 5,430.2 59.0 _ 5,395.3 _ _ _ _ _
2020 I 3,525.7 7,252.4 5,224.5 57.4 _ 5,044.5 _ _ _ _ _ II 3,272.0 6,573.5 5,084.6 55.9 _ 3,794.4 _ _ _ _ _
SOURCES: Ministry of Energy and Energy Industries and Central Bank of Trinidad and Tobago.
1 Petrotrin’s Refinery was closed in November 2018. Therefore, production of petroleum-based products fell to zero in 2019.

Period
REAL SECTOR
TABLE 5 PRODUCTION AND SALES OF PETROCHEMICAL PRODUCTS Jun 2020
Fertilisers - (000 Tonnes) Natural Gas Liquids - (000 bbls) 1 Methanol - (000 Tonnes)
Production Exports Local Sales Production Exports Local Sales Production Exports Local Sales 1 2 3 4 5 6 7 8 9
2015 5,452.7 4,946.3 5.2 10,992.6 10,181.7 936.9 5,515.9 5,479.0 5.82016 5,521.7 5,227.5 5.6 9,213.9 7,996.0 1,084.8 4,655.0 4,637.3 6.62017 5,595.0 5,140.8 5.2 9,806.2 8,541.0 1,151.8 4,974.9 4,961.6 6.82018 5,431.1 4,924.3 5.4 8,695.0 7,667.5 1,307.6 5,081.3 5,010.1 7.22019 6,103.9 5,205.9 4.3 8,530.0 8,118.9 875.9 5,671.8 5,722.0 6.2
2015 II 1,268.9 1,146.9 1.1 2,689.8 2,600.5 311.3 1,368.1 1,343.0 1.0 III 1,401.7 1,228.3 1.3 2,815.9 2,314.4 288.3 1,350.0 1,265.3 1.5 IV 1,444.8 1,281.0 1.5 2,560.5 2,420.1 284.9 1,447.2 1,522.4 1.8
2016 I 1,393.4 1,431.9 1.2 2,502.9 2,091.5 299.4 1,262.1 1,186.0 1.7 II 1,272.4 1,192.1 1.4 2,308.0 1,950.4 280.9 1,240.9 1,328.1 1.4 III 1,432.4 1,355.9 1.6 2,057.7 1,711.1 229.6 1,055.5 1,125.5 1.8 IV 1,423.5 1,247.5 1.5 2,345.2 2,243.0 275.0 1,096.6 997.7 1.8
2017 I 1,337.8 1,279.2 1.0 2,275.6 2,400.4 214.9 1,115.5 1,205.3 1.4 II 1,410.4 1,222.1 1.3 2,385.7 1,583.9 292.0 1,199.0 1,142.1 2.0 III 1,442.6 1,326.2 1.7 2,627.8 2,502.0 324.2 1,321.0 1,354.6 2.2 IV 1,404.2 1,313.3 1.2 2,517.1 2,054.8 320.7 1,339.3 1,259.6 1.2
2018 I 1,455.1 1,313.6 1.4 2,433.4 2,323.9 306.3 1,333.2 1,376.3 1.9 II 1,302.9 1,271.3 1.6 2,215.3 1,899.6 375.8 1,313.4 1,337.0 2.3 III 1,347.9 1,166.3 1.5 2,051.0 1,769.1 354.7 1,118.0 1,033.7 1.9 IV 1,325.3 1,173.0 1.0 1,995.3 1,674.9 270.7 1,316.7 1,263.1 1.1
2019 I 1,663.4 1,391.5 1.3 2,279.3 2,399.8 215.9 1,375.8 1,441.6 2.0 II 1,549.3 1,336.7 1.4 2,074.9 2,140.5 215.6 1,382.1 1,340.0 2.0 III 1,550.1 1,305.1 1.1 2,188.7 1,602.9 213.5 1,490.3 1,524.4 1.7 IV 1,341.1 1,172.5 0.5 1,987.1 1,975.7 230.8 1,423.6 1,415.9 0.4
2020 I 1,468.9 1,156.1 0.3 2,151.7 1,772.9 n.a. 1,467.5 1,513.9 n.a. II 1,577.5 1,276.0 0.7 1,886.8 2,071.3 n.a. 1,035.8 981.7 n.a.
SOURCES: Ministry of Energy and Energy Industries and Central Bank of Trinidad and Tobago.
1 Natural Gas Liquids include Propane, Butane and Natural Gasoline.
� � � � � � � � � �
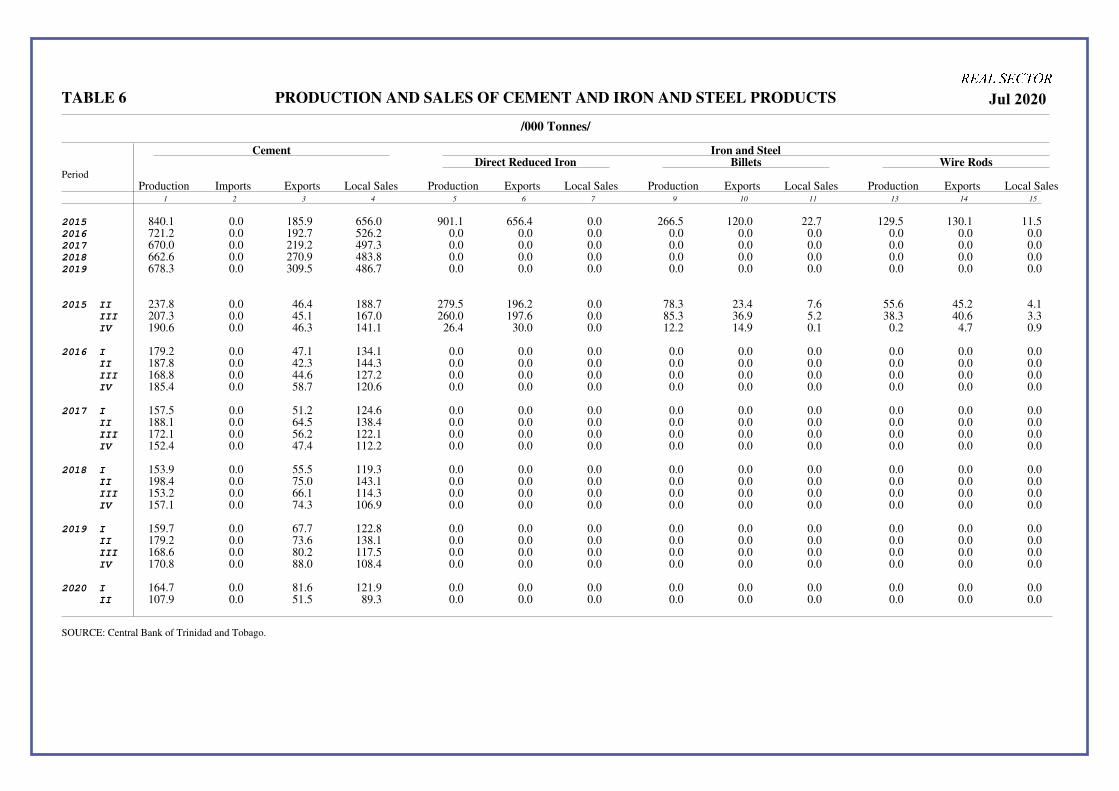
Period
TABLE 6 PRODUCTION AND SALES OF CEMENT AND IRON AND STEEL PRODUCTS Jul 2020
/000 Tonnes/
Cement Iron and SteelDirect Reduced Iron Billets Wire Rods
Production Imports Exports Local Sales Production Exports Local Sales Production Exports Local Sales Production Exports Local Sales 1 2 3 4 5 6 7 9 10 11 13 14 15
2015 840.1 0.0 185.9 656.0 901.1 656.4 0.0 266.5 120.0 22.7 129.5 130.1 11.52016 721.2 0.0 192.7 526.2 0.0 0.0 0.0 0.0 0.0 0.0 0.0 0.0 0.02017 670.0 0.0 219.2 497.3 0.0 0.0 0.0 0.0 0.0 0.0 0.0 0.0 0.02018 662.6 0.0 270.9 483.8 0.0 0.0 0.0 0.0 0.0 0.0 0.0 0.0 0.02019 678.3 0.0 309.5 486.7 0.0 0.0 0.0 0.0 0.0 0.0 0.0 0.0 0.0
2015 II 237.8 0.0 46.4 188.7 279.5 196.2 0.0 78.3 23.4 7.6 55.6 45.2 4.1 III 207.3 0.0 45.1 167.0 260.0 197.6 0.0 85.3 36.9 5.2 38.3 40.6 3.3 IV 190.6 0.0 46.3 141.1 26.4 30.0 0.0 12.2 14.9 0.1 0.2 4.7 0.9
2016 I 179.2 0.0 47.1 134.1 0.0 0.0 0.0 0.0 0.0 0.0 0.0 0.0 0.0 II 187.8 0.0 42.3 144.3 0.0 0.0 0.0 0.0 0.0 0.0 0.0 0.0 0.0 III 168.8 0.0 44.6 127.2 0.0 0.0 0.0 0.0 0.0 0.0 0.0 0.0 0.0 IV 185.4 0.0 58.7 120.6 0.0 0.0 0.0 0.0 0.0 0.0 0.0 0.0 0.0
2017 I 157.5 0.0 51.2 124.6 0.0 0.0 0.0 0.0 0.0 0.0 0.0 0.0 0.0 II 188.1 0.0 64.5 138.4 0.0 0.0 0.0 0.0 0.0 0.0 0.0 0.0 0.0 III 172.1 0.0 56.2 122.1 0.0 0.0 0.0 0.0 0.0 0.0 0.0 0.0 0.0 IV 152.4 0.0 47.4 112.2 0.0 0.0 0.0 0.0 0.0 0.0 0.0 0.0 0.0
2018 I 153.9 0.0 55.5 119.3 0.0 0.0 0.0 0.0 0.0 0.0 0.0 0.0 0.0 II 198.4 0.0 75.0 143.1 0.0 0.0 0.0 0.0 0.0 0.0 0.0 0.0 0.0 III 153.2 0.0 66.1 114.3 0.0 0.0 0.0 0.0 0.0 0.0 0.0 0.0 0.0 IV 157.1 0.0 74.3 106.9 0.0 0.0 0.0 0.0 0.0 0.0 0.0 0.0 0.0
2019 I 159.7 0.0 67.7 122.8 0.0 0.0 0.0 0.0 0.0 0.0 0.0 0.0 0.0 II 179.2 0.0 73.6 138.1 0.0 0.0 0.0 0.0 0.0 0.0 0.0 0.0 0.0 III 168.6 0.0 80.2 117.5 0.0 0.0 0.0 0.0 0.0 0.0 0.0 0.0 0.0 IV 170.8 0.0 88.0 108.4 0.0 0.0 0.0 0.0 0.0 0.0 0.0 0.0 0.0
2020 I 164.7 0.0 81.6 121.9 0.0 0.0 0.0 0.0 0.0 0.0 0.0 0.0 0.0 II
107.9 0.0 51.5 89.3 0.0 0.0 0.0 0.0 0.0 0.0 0.0 0.0 0.0
SOURCE: Central Bank of Trinidad and Tobago.
� � � � � � � � � �
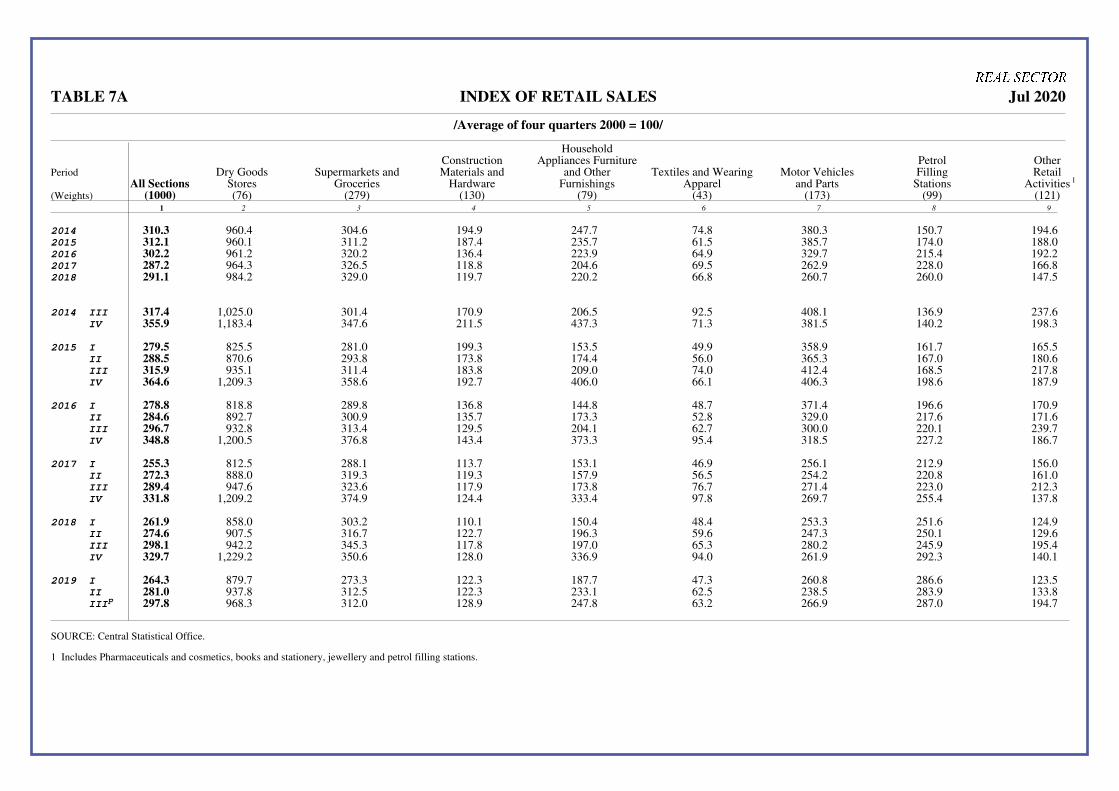
Period
(Weights)
1
REAL SECTOR
TABLE 7A INDEX OF RETAIL SALES Jul 2020
/Average of four quarters 2000 = 100/
HouseholdConstruction Appliances Furniture Petrol Other
Dry Goods Supermarkets and Materials and and Other Textiles and Wearing Motor Vehicles Filling RetailAll Sections Stores Groceries Hardware Furnishings Apparel and Parts Stations Activities
(1000) (76) (279) (130) (79) (43) (173) (99) (121) 1 2 3 4 5 6 7 8 9
2014 310.3 960.4 304.6 194.9 247.7 74.8 380.3 150.7 194.62015 312.1 960.1 311.2 187.4 235.7 61.5 385.7 174.0 188.02016 302.2 961.2 320.2 136.4 223.9 64.9 329.7 215.4 192.22017 287.2 964.3 326.5 118.8 204.6 69.5 262.9 228.0 166.82018 291.1 984.2 329.0 119.7 220.2 66.8 260.7 260.0 147.5
2014 III 317.4 1,025.0 301.4 170.9 206.5 92.5 408.1 136.9 237.6IV 355.9 1,183.4 347.6 211.5 437.3 71.3 381.5 140.2 198.3
2015 I 279.5 825.5 281.0 199.3 153.5 49.9 358.9 161.7 165.5II 288.5 870.6 293.8 173.8 174.4 56.0 365.3 167.0 180.6III 315.9 935.1 311.4 183.8 209.0 74.0 412.4 168.5 217.8IV 364.6 1,209.3 358.6 192.7 406.0 66.1 406.3 198.6 187.9
2016 I 278.8 818.8 289.8 136.8 144.8 48.7 371.4 196.6 170.9II 284.6 892.7 300.9 135.7 173.3 52.8 329.0 217.6 171.6III 296.7 932.8 313.4 129.5 204.1 62.7 300.0 220.1 239.7IV 348.8 1,200.5 376.8 143.4 373.3 95.4 318.5 227.2 186.7
2017 I 255.3 812.5 288.1 113.7 153.1 46.9 256.1 212.9 156.0II 272.3 888.0 319.3 119.3 157.9 56.5 254.2 220.8 161.0III 289.4 947.6 323.6 117.9 173.8 76.7 271.4 223.0 212.3IV 331.8 1,209.2 374.9 124.4 333.4 97.8 269.7 255.4 137.8
2018 I 261.9 858.0 303.2 110.1 150.4 48.4 253.3 251.6 124.9II 274.6 907.5 316.7 122.7 196.3 59.6 247.3 250.1 129.6III 298.1 942.2 345.3 117.8 197.0 65.3 280.2 245.9 195.4IV 329.7 1,229.2 350.6 128.0 336.9 94.0 261.9 292.3 140.1
2019 I 264.3 879.7 273.3 122.3 187.7 47.3 260.8 286.6 123.5II 281.0 937.8 312.5 122.3 233.1 62.5 238.5 283.9 133.8III
p 297.8 968.3 312.0 128.9 247.8 63.2 266.9 287.0 194.7
SOURCE: Central Statistical Office.
1 Includes Pharmaceuticals and cosmetics, books and stationery, jewellery and petrol filling stations.
� � � � � � � � � �

� � � � � � � � � �� ¡ ¢ £¤ ¥ ¦ ¤ ¡ ¢ £ § ¡ £ ¡ ¦ © ª « ¢ ¦ ¬ ¡ �® °± ²³´ ² ° µ ¶ · · ¹ º » ¼½ ¾ ¿ À ¯Á ± ± ²Ã Ä Å± ® à ÄÆ Ç ® È É Ê® ÅÃ É ²Â ± Ë® °® Ã Ì ± à Š¯Æ Ë Å °±Í É Å® ° É Î Ã É ²Ï É ²Ð É ® ϱ Æ Ã ® ѱ Î ²Ò Ç Ç Î ° É Ë® ÃÓÆ ¯ ° ÅÆ ® É ²Ô Å Ñ® ÓÆ ¯ ° Ã Ñ ° µ Ã Õ®Ö Å ° ή Ã É ²×® É ° µ Ò Ç Ç É ® Πͱ ű Ø® Ñ ° Ë Î®É ² É Åà ® Å ± Î Ó ° Î Î ° µÄ Å É Å °± Ã Ô Å Ñ® Ù® Å É ° ÎÒ Ë Å °Ú ° Å °® à ÛÜ ÝÞ ßà áâã ä Ü å æ æ æ ä Ü ç è ä Ü é ç ê ä Ü å ë æ ä Ü ç ê ä Ü ì ë ä Ü å ç ë ä Ü ê ê ä Ü å é å äå é ë ì í è ç î ê2014
ïð ñ ò óô õ ò ò ô ö ÷ ò ô ø ù ô ú ÷ ûô ó üô ó ÷ öô ø ÷ úô ú2015
ýð ï ûô û úô ú ÷ ù ô þ ÷ üô þ ÷ ò õô þ ò ô ü ò ó ô ü ÷ ù ô ü2016 ÿ � ð � ûô ò úô ö ÷ ú õô ú ÷ óô û óô ó ÷ ò üô ó ú ù ô þ úô ù2017 ÿ �ð ý ûô ù úô û ÷ ò úô ö ÷ þô ø õô û ÷ ú ûô ù ó ô ö ÷ ò ù ô ú2018
� ð � úô ò ûô þ ûô õ õô ø ÷ ù ô þ ÷ ûô þ ò üô û ÷ ò ò ô ø
2014 I
�ð � ò ûô ù ò üô ò ò ò ô ù ò üô ù ò þô ø ÷ öô ó ÷ ù ô û úô ú
II
� � ð � ò öô õ ò ù ô ò ò ò ô ù þô ö üô ó ú úô õ ÷ úô û ÷ úô ø
III
ïð ñ ú üô ø ò úô ö ÷ ú ûô þ ò ô ò ò ô ü þ ô ù ÷ ò õô ù ÷ óô õ
IV
� ð ý öô ø þô ü ÷ ù ô ø ÷ ò ô ü ÷ ò þô û ûô ü ÷ ò øô ú ÷ ò ô ú
2015 I
� ð � þô ú ò ô ø üô ò ÷ ò ô ú ÷ ò õô ó ûô þ ÷ ûô õ ÷ úô ò
II ÿ � ð � ûô ò ûô ü ÷ ò óô ü ÷ þô ö ÷ ú óô ù ÷ úô õ úô ø üô û
III ÿ ýð � ÷ þô þ ù ô ù õô ó ò ô ú ÷ ú ûô û ò ô ò ú ù ô ò ÷ þô ù
IV
� ð � úô ú ù ô ú ÷ þô ö ÷ õô ú ÷ õô ù øô ó ü ò ô õ ÷ óô ú
2016 I ÿ ýð � ÷ ûô þ ù ô ò ÷ ù ò ô ü ÷ óô õ ÷ úô ü ù ô ó ú ò ô ø ù ô ù
II ÿ � ð � úô ó úô ü ÷ ú ò ô ö ÷ ûô ø ÷ óô õ ÷ öô ö ù ûô ù ÷ óô û
III ÿ ïð � ÷ ûô ú ûô ø ÷ ú öô ó ÷ úô ù ÷ ò óô ù ÷ ú õô ù ù ûô ø ò ûô ò
IV ÿ �ð � ÷ ûô õ óô ò ÷ ú óô ø ÷ þô ò ü üô ù ÷ ú ò ô ø ò üô ü ÷ ûô ø
2017 I ÿ ñð � ÷ ûô þ ÷ ûô ø ÷ ò øô ö óô õ ÷ ù ô õ ÷ ù ò ô û þ ô ù ÷ þô õ
II ÿ �ð � ÷ ûô ó øô ò ÷ ò úô ò ÷ þô ö õô û ÷ ú úô õ ò ô ó ÷ øô ú
III ÿ � ð � ò ô ø ù ô ù ÷ öô û ÷ ò üô þ ú úô ù ÷ öô ó ò ô ù ÷ ò ò ô ü
IV ÿ �ð � ûô õ ÷ ûô ó ÷ ò ù ô ú ÷ ò ûô õ úô ó ÷ ò ó ô ù ò úô ü ÷ ú øô ú
2018 I
� ð ï óô ø óô ú ÷ ù ô ú ÷ ò ô þ ù ô ú ÷ ò ô ò ò þ ô ú ÷ ò öô ö
II
ýð ñ úô ú ÷ ûô þ úô þ ú üô ù óô ó ÷ úô õ ò ù ô ù ÷ ò öô ó
III
� ð ý ÷ ûô ø øô õ ÷ ûô ò ò ù ô ù ÷ ò üô ö ù ô ú ò ûô ù ÷ þô û
IV ÿ ýð ï ò ô õ ÷ øô ó úô ö ò ô û ÷ ù ô ö ÷ úô ö ò üô ü ò ô õ
2019 I
ýð � úô ó ÷ öô ö ò ò ô ò ú üô þ ÷ úô ù ù ô û ò ù ô ö ÷ ò ô ò
II
� ð � ù ô ù ÷ ò ô ù ÷ ûô ù ò þô õ üô ö ÷ ù ô ø ò ù ô ó ù ô ú
IIIp ÿ ýð � úô þ ÷ öô ø öô ü ú óô þ ÷ ù ô ú ÷ üô õ ò øô õ ÷ ûô ü� � �� �� � �� � � � � � � �� � �� � � � � � � ��� � �� �� �� � � � �� �� � � � �� � �� � � � � ! � � � � � �" # ! ! $� � � � � � � � � ! � �� % � � � & � '� � �� � %�
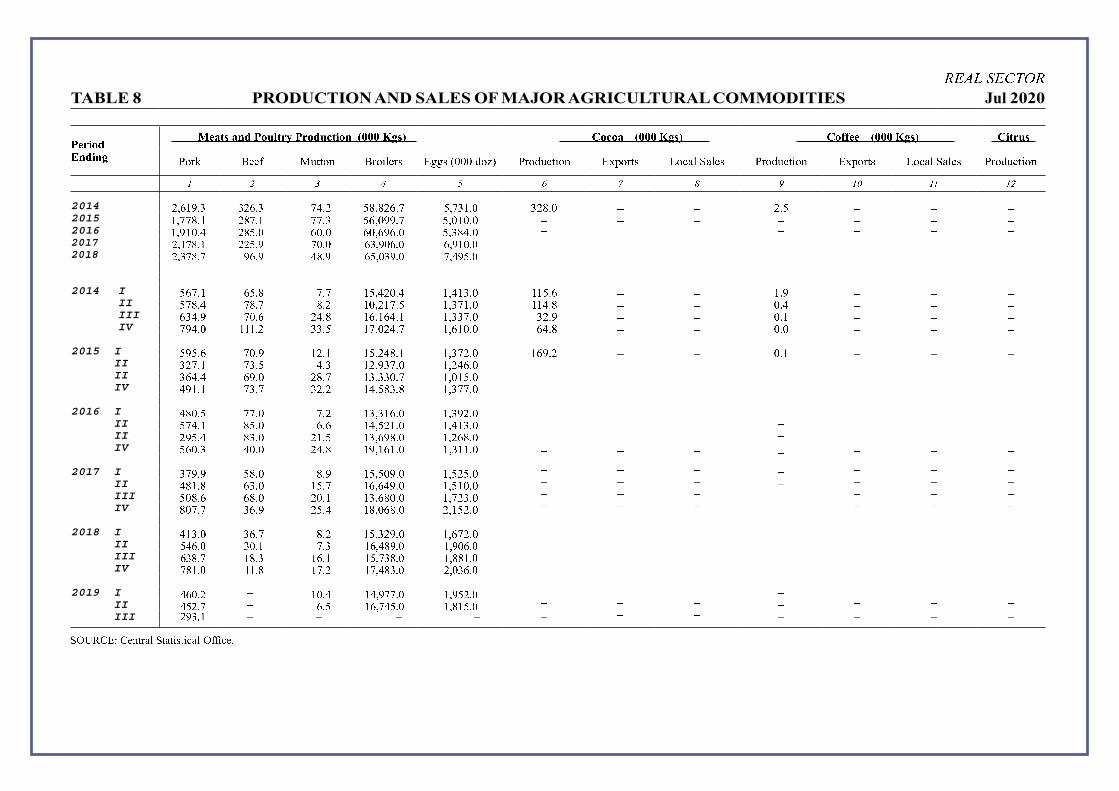
� � � � � � � � � �� �� �� �� � � � �� �� � � � � � � � � � � � �� � � � � � � � � � � � � � �� � � � � � � � � � � � � � � � � � � � � � � � � � � ! " # $% % & '( ) )! * + "! , -. " / 01 1 / 23 3 3 4!5 6 "! 4( 7 ) ,! * 08 9! " ) / :! 7 ; -< ; -. / "! 4( 7 ) ,! * 08 9! " ) / :! 7 ; -< ; - . / "! 4( 7 ) ,! *= > ? @ A B C D E = F = = = >2014
GH I J KL M M G IL M N OP Q R ST S Q U P N V H W M J L X Y Q S P 3 Z Z Q P R Z Z Z2015
[ T N N S P [ G \ WL J N N P Y R UT 3 ] ] P N R T 3 [ 3 P 3 Z Z Z Z Z Z Z2016
[ T ] [ 3 P O G \ VL X U 3 P 3 U 3 T U ] U P 3 R T Y S OP 3 ^ ^ ^ ^2017
GH J W \ L J G G VL K W XL X I M H K X IL X IH K J XL X _ _ _ _ _ _ _2018
GH M W \ L W K IL K \L K I V H X M KL X WH K VL X _ _ _ _ _ _ _2014 I
R U N P [ I VL \ N P N [ R T O Q 3 P O [ T O [ Y P 3 [ [ R P U Z Z [ P ] Z Z Z
II
R N S P O W \L W \L G [ 3 T Q [ N P R [ T Y N [ P 3 [ [ OP S Z Z 3 P O Z Z Z
III
U Y OP ] W XL I Q OP S [ UT [ U OP [ [ T Y Y N P 3 Y Q P ] Z Z 3 P [ Z Z Z
IV
N ] OP 3 J J J L G Y Y P R [ NT 3 Q OP N [ T U [ 3 P 3 U OP S Z Z 3 P 3 Z Z Z
2015 I
R ] R P U N 3 P ] [ Q P [ [ R T Q O S P [ [ T Y N Q P 3 [ U ] P Q Z Z 3 P [ Z Z Z
II
Y Q N P [ N Y P R OP Y [ QT ] Y N P 3 [ T Q O U P 3 ^ ^ ^ ^ II
Y U OP O U ] P 3 Q S P N [ Y T Y Y 3 P N [ T 3 [ R P 3 ^ ^ ^ ^ ^
IV
O ] [ P [ N Y P N Y Q P Q [ OT R S Y P S [ T Y N N P 3 ^ ^ ^ ^ ^
2016 I
O S 3 P R N N P 3 N P Q [ Y T Y [ U P 3 [ T Y ] Q P 3 ^ ^ ^ ^ ^
II
R N OP [ S R P 3 U P U [ OT R Q [ P 3 [ T O [ Y P 3 ^ ^ ^ ^ ^
II
Q ] R P O S Y P 3 Q [ P R [ Y T U ] S P 3 [ T Q U S P 3 ^ ^ ^ ^ ^
IV
R U 3 P Y O3 P 3 Q OP S [ ]T [ U [ P 3 [ T Y [ [ P 3 Z Z Z Z Z Z Z
2017 I
Y N ] P ] R S P 3 S P ] [ R T R 3 ] P 3 [ T R Q R P 3 ^ ^ ^ ^ ^
II
O S [ P S U Y P 3 [ R P N [ UT U O ] P 3 [ T R [ 3 P 3 ^ ^ ^ ^ ^
III
R 3 S P U U S P 3 Q 3 P [ [ Y T U S 3 P 3 [ T N Q Y P 3 ^ ^ ^ ^ ^
IV
S 3 N P N Y U P ] Q R P O [ ST 3 U S P 3 QT [ R Q P 3 ^ ^ ^ _
2018 I
O [ Y P 3 Y U P N S P Q [ R T Y Q ] P 3 [ T U N Q P 3 ^ ^ ^ _
II
V IL X M XL J WL M J IH \ KL X J H K X IL X _ _ _ _ _ _ _
III
I M \ L W J \L M J IL J J V H W M \L X J H \ \ J L X _ _ _ _ _ _ _
IV
W \ J L X J J L \ J WL G J WH \ M L X GH X M IL X _ _ _ _ _ _ _
2019 I
I XL G _ J XL J H K W WL X J H K V GL X _ _ _ _ _ _ _
II
V GL W _ IL V J IH W VL X J H \ J VL X _ _ _ _ _ _ _
III
G K M L J _ _ _ _ _ _ _ _ _ _ _a bc d efg eh i jk l m a j l j no j np l m b q r p hs

Period
REAL SECTOR
TABLE 9 PRODUCTION OF SELECTED FOOD CROPS Jul 2020
/000 Kgs/
Tomato Cabbage Cucumber Dasheen Rice Pigeon Peas Pumpkin Melongene 1 2 3 4 5 6 7 8
2015 2,698.0 593.7 1,173.3 1,916.8 2,721.3 1,687.4 3,279.0 905.52016 2,223.3 433.7 1,101.5 2,395.8 1,822.9 857.9 3,031.7 1,713.42017 2,645.1 434.9 803.9 3,224.3 1,619.1 2,042.5 1,884.2 913.32018 1,678.2 755.5 741.1 2,511.0 584.9 2,601.1 4,532.9 488.22019 1,699.9 364.7 972.5 2,097.2 536.5 1,222.6 2,410.1 1,466.6
2014 IV 90.1 78.1 179.7 912.2 1,507.9 76.6 413.2 214.9
2015 I 572.2 316.9 240.4 438.8 638.6 1,657.9 1,460.3 146.7 II 612.7 53.6 442.3 605.7 428.5 29.4 434.6 248.5 III 1,153.4 65.1 230.5 344.2 912.3 0.0 216.9 232.6 IV 359.7 158.1 260.1 528.1 741.9 0.1 1,167.2 277.7
2016 I 526.7 92.2 106.5 774.7 524.1 810.6 954.0 238.5 II 655.7 198.6 318.1 895.5 86.6 1.7 655.4 725.2 III 523.4 103.4 273.3 351.0 165.9 0.0 659.3 305.9 IV 517.5 39.5 403.6 374.6 1,046.3 45.6 763.0 443.8
2017 I 489.1 38.9 125.8 764.4 586.9 2,012.9 777.5 328.0 II 1,384.4 136.4 295.9 1,283.8 121.2 9.3 442.7 304.5 III 333.8 253.0 176.6 242.4 146.9 0.0 262.5 170.8 IV 437.8 6.6 205.6 933.8 764.1 20.3 401.6 110.0
2018 I 199.9 13.5 348.1 872.3 186.7 2,025.1 835.6 68.3 II 458.8 243.9 101.7 903.4 113.8 405.9 608.1 305.6 III 893.0 325.5 161.0 239.5 56.3 0.0 2,555.4 51.2 IV 126.4 172.7 130.4 495.8 228.2 170.1 533.7 63.1
2019 I 517.9 31.2 97.5 1,156.4 0.0 1,193.8 348.6 119.4 II 370.9 153.5 130.3 607.3 20.3 2.6 316.9 288.4 III 439.3 57.7 254.3 83.1 48.0 0.0 728.3 558.5 IV
p 371.9 122.3 490.4 250.4 468.2 26.2 1,016.4 500.4
SOURCE: Central Statistical Office.
� � � � � � � � � �

¤ ¥ ¦ § ¥ © ª « ¤¬ ® ° ® ± ² ³ µ ¶· µ ¬¸¹ º »¼ ½ ¾¿À ½ » À Á Â Ã Ã Ä ÅÆ Ç È ÉÊ Ë Ì Í ÎÏ Ê ÐÑÏ Ò Ë Ó ÎÔ ÏÕ Ë Ó Ê ÖÔ × Ê ØÑÏ Ò Ë Ó Î Ô ÏÕ Ë Ó Ê ÙÔ Ô ÌÑÏ Ò Ë Ó Î Ô ÏÕ Ë Ó Ê Ú À ½¹Û ¼ ÜÝ ¼ ¼ ½Þ ß¼ Ààá âã ¼ ä¼ â »ãå ¹æ ¹ º ç Á¹ è é â¼ ê ä » À Á ÞÝ ¼ ¼ êë ¹ ç º ì º çÀ èàí¼ º ê ç ê »¼ À î¼ï è » À Á ð ê ä¹ º è ñ ò Æ ó ôÆ õ Å ö÷ õ Å ó ø ùú Å ø÷ õÝ ¼ ¼ ½ é â¼ ê ä » À Á ÞÝ ¼ ¼ êë ¹ ç º ì º çÀ èàí ¼ º ê ç ê »¼ À î¼ ï è » À Á ð ê ä¹ º èûü ýþ ÿ� � � � � � � � � � � � � � � � � � � � � � � � � � � � �� � � � � � � � � � � � � � �2015
� � �� � �� � � � � �� � � � � ! � � � � � � � � � � � " � � � � " # ! $ ! % � $ ! ! � &2016
� � '� ' ( � � ) � ) �� * � � & & � � " # � � ! ! � � � � � � % % " � " + $ � " $ à � & ! $ &2017
� � ,� ' � � - � � � ) � - � � ! � � � " # � � " % � � � � � � & � � $ ! � � & " � # + � "2018
� � .� ' � � / � � / � � � � � " " � � � � � � + % � � � + � � & % � � " à � % � � # � + � � � % "2019
� � 0� 1 � � / � � � /� � � � % � & # " � � $ � � � ! % � � � ! � � ! à � ! # � � � � " + % $ +
2015 I
� � �� � *� ( � � � & + � � � � & & + � � � � � � � � � � � � % # � % � � � & # $ � $ �
II
� � �� � *� � � � � & # � � � & & & � & & & � � � " � � � � " & + # + + + $ ! � # &
III
� � �� 2 �� - � � � � � � � � % � � � � � & & % � � � % � � � + % + � + ! à � � $ $ ! � #
IV
� � 3� 1 � � * ) � � � # � � % � � � � � � � � � � � � # � � ! " � & � � ! � % & & % % � +
2016 I
� � �� � ( � ( ) � ) �� � � � $ + � � " # � � � � � � � + � � ! % " % � $ $ " % % � ! + #
II
� � '� ' ( � � ) � ) -� � � � � " � � � & � � " � � � � � � � % " " # % + � � # " à ! � ! � �
III
� � 1� � ( � / ) � ( �� � � � � " � � " + � � " � & & & � � + " ! + � " $ � � + à % " " � &
IV
� � 1� . ( � � ) � ( �� � � � � � � � # & � � " � & & $ � � # % ! $ % � � ! � " � à # & " " &
2017 I
� � ,� � ) � � ) � � ( � � � � � + � � # " � � " ! & & & � � $ " � " � % " � # � à + # + � �
II
� � ,� � � � * � � � /� * � � � � � � % � � � " % � � � � � � & � + % # & " + � � $ � &
III
� � ,� � � � ) � � � � � - � � ! % � � ! " � � ! # � � � � � � & ! � $ � à % ! à ! " � � # $ "
IV
� � .� � � � ( /� � ( � � � � + � � � � % � � % % � � � + � � & ! " & + à � + � � % $ � % $ " " &
2018 I
� � .� � /� � /� * ) � � � � % � � � � ! � � % $ � � � � � � & ! % � � à " $ $ � + + ! + " ! % #
II
� � .� � /� - /� � � � � � � � % � � � � � � % $ � � � + � � & ! � # � à � & $ � � � # " $ # $
III
� � .� 1 � � � � � � /� / � � ! % � � � � � � % $ � � ! ! � � & # � � à � � � � % � # ! $ � � �
IV
� � 0� 3 � � / � � ( /� � � � + � & $ $ � � $ % � � ! ! � � & + � % à � ! � ! # % + ! � � � &
2019 I
� � 0� , � � * � � � /� - � � + � & $ � � � $ % � � ! " � � � # � � $ à # $ � " # " � � ! � !
II
� � 0� 3 � � � � � ) � � � � � " � & + % � � $ � � � ! ! � � � � � � % à � % & � # " � " & % � �
III
� � 0� . � � � � � / � � * � � % � & $ � � � # & � � ! " � � � # � % ! à � " # � + + � " + � %
IV
� � 0� , /� � /� � 4 � � / � � " & & + � � � # ! � � " � � � � + à % # # à " � $ à " & � % ! % � & + �
2020 I
� � 2� � /� � /� ) � � ) � � # " & " # � � # � � � " � � � � & % " � à " ! " à " & ! " & � $ & !
Jan
� � 0� 2 /� � /� ( /� � � � + % & % ! � � # � � � " � � � � $ � % & à % + " à + + � + + � � ! � +
Feb
� � 0� 2 /� * /� ) � � / � � + + & " " � � # � � � " � � � � $ % � ! à % � � à % ! % % ! ! � � � &
Mar
� � 2� � /� � /� ) � � ) � � # " & " # � � # � � � " � � � � & % " � à " ! " à " & ! " & � $ & !5 67 8 9:; 9< = >? @ A 5 > @ > BC > BD @ A 6 E FD <GH I = = J @ A K @ > @ ? < E< ? >L @ M< ? @ N< C EL ? > O< P< ? B L KQ R J @? >< ? AS K @ > @ ? < E< ? >L K @ > @ EL ? > O< A @C > TL = > O B = > O< R J @? >< ?GU V O BC ? < E< ? C >L > O< D O @ = N< B = > O< L M< ? @ A AW = K< X L E 8< > @ B AY ? BD < CGZ V O BC < XD A J K< D O @ = N< C B = > O< P ? BD < L E EL L KG[ W =D A J K< C I AD L OL A BD \ < M< ? @ N< C ] VL ^ @D D L _ a Q b J? = BC O B = NC OL JC < OL A K : R J B P T< = > ] c @ B = >< = @ =D < _ de a Q f< @ A > O _ [ H a Q 9 L T T J = BD @ > B L = _ [g a Q 8< D ? < @ > B L = ] 9 J A > J? < _ d d a Q : K JD @ > BL = _ H h a Q fL >< ACi 9 @ E< C @ = K 8< C > @ J? @ = >C _ Ug a @ = Kc BC D < A A @ =< L JC jL L KC @ = K 5 < ? M BD < C _ k g aG
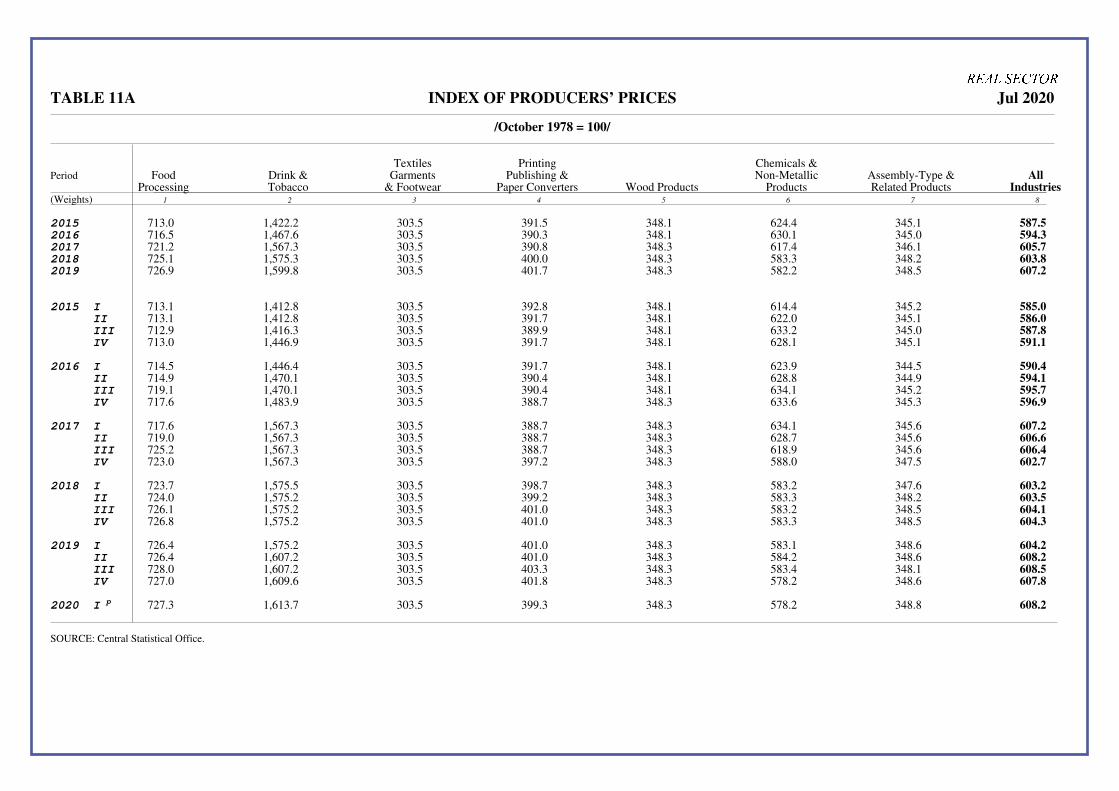
Period
(Weights)
TABLE 11A INDEX OF PRODUCERS’ PRICES Jul 2020
/October 1978 = 100/
Textiles Printing Chemicals &Food Drink & Garments Publishing & Non-Metallic Assembly-Type & All
Processing Tobacco & Footwear Paper Converters Wood Products Products Related Products Industries1 2 3 4 5 6 7 8
2015 713.0 1,422.2 303.5 391.5 348.1 624.4 345.1 587.52016 716.5 1,467.6 303.5 390.3 348.1 630.1 345.0 594.32017 721.2 1,567.3 303.5 390.8 348.3 617.4 346.1 605.72018 725.1 1,575.3 303.5 400.0 348.3 583.3 348.2 603.82019 726.9 1,599.8 303.5 401.7 348.3 582.2 348.5 607.2
2015 I 713.1 1,412.8 303.5 392.8 348.1 614.4 345.2 585.0II 713.1 1,412.8 303.5 391.7 348.1 622.0 345.1 586.0III 712.9 1,416.3 303.5 389.9 348.1 633.2 345.0 587.8IV 713.0 1,446.9 303.5 391.7 348.1 628.1 345.1 591.1
2016 I 714.5 1,446.4 303.5 391.7 348.1 623.9 344.5 590.4II 714.9 1,470.1 303.5 390.4 348.1 628.8 344.9 594.1III 719.1 1,470.1 303.5 390.4 348.1 634.1 345.2 595.7IV 717.6 1,483.9 303.5 388.7 348.3 633.6 345.3 596.9
2017 I 717.6 1,567.3 303.5 388.7 348.3 634.1 345.6 607.2II 719.0 1,567.3 303.5 388.7 348.3 628.7 345.6 606.6III 725.2 1,567.3 303.5 388.7 348.3 618.9 345.6 606.4IV 723.0 1,567.3 303.5 397.2 348.3 588.0 347.5 602.7
2018 I 723.7 1,575.5 303.5 398.7 348.3 583.2 347.6 603.2II 724.0 1,575.2 303.5 399.2 348.3 583.3 348.2 603.5III 726.1 1,575.2 303.5 401.0 348.3 583.2 348.5 604.1IV 726.8 1,575.2 303.5 401.0 348.3 583.3 348.5 604.3
2019 I 726.4 1,575.2 303.5 401.0 348.3 583.1 348.6 604.2II 726.4 1,607.2 303.5 401.0 348.3 584.2 348.6 608.2III 728.0 1,607.2 303.5 403.3 348.3 583.4 348.1 608.5IV 727.0 1,609.6 303.5 401.8 348.3 578.2 348.6 607.8
2020 I p 727.3 1,613.7 303.5 399.3 348.3 578.2 348.8 608.2
SOURCE: Central Statistical Office.
l m n o p m q r s l

t u v w x u y z { t| }~ � � � � � � � � � � � � � � � � � � � � � � �� � � � |�� � �� ��� � � � � � � �� � � � � � � � � � �� � �� � � � � � � � ��� � � � � �� ¡ ¢ � � � �� ��£ � � ¤� ¥ � � � � �� �¦ � � § � �� � � � � � � �¨ � � � � � � � � � � � �� �£ �© � �� � � � ¤ ª � � � ¡ £ � © � �� � ¥ � � �� « �� ¬ � � � � ¡ � � � � � � � � � � � £ �� � � ® � � �� ¯� � � � �°±� � � � �� � � � � � � �� � ¡� © �� �� � � ¥� � ² �³ µ ¶· ¸¹ º » ¼½ ¼ ¼ ¼ » ½ ¾ ¿ À ¿ ½ À Á  Á À Á  à » » ½ Ä Ã Ä » ½ Å ¼ ¾» Ä ¿ à  ¾ À2015
Æ Æ ÇÈ É Ê Ë ÊÈ Ì Æ Ì ÉÈ Ì Æ Ç ËÈ Í Í É ÎÈ É Í Ì Í È É Í Ê Í È Ï2016
Æ Æ ÇÈ Í Æ É ÌÈ Ì Æ Ì ÉÈ Ç Æ Ç ÆÈ Ï Æ Ë ÌÈ Î Í Ì ÆÈ Æ Í Æ ÉÈ É2017
Æ Æ ÐÈ Ì Æ Ç ÊÈ Ï Æ Î ÏÈ Î Æ Ç ÏÈ Î Æ Í ÆÈ Í Í Ì Ê È Î Í Æ Ê È Ï2018
Æ Ê ÇÈ Í Æ É Í È Ê Æ Ç Í È Ê Ê Ë ÆÈ Ð Æ Æ Í È Î Í Ì ÎÈ Ï Í Æ ÌÈ Æ2019
Æ Ï ËÈ Ï Æ É ÌÈ Ì Æ Ç Ê È Ð Ê Ë ÏÈ Ê Æ Æ ÇÈ Ç Í Ì ÐÈ É Í Æ ÌÈ Ë2015 I
Æ Æ ÇÈ Ê Æ É ÉÈ É Æ Î ËÈ Í Æ Ç ËÈ Í Í É ÆÈ Ç Í Ì Í È É Í Ê Í È Ì
II
Æ Æ ÉÈ Î Ê Ë ÎÈ Ì Æ Î ËÈ Ì Æ Ç Í È Ì Í É Ê È Æ Í Ì Í È Ì Í Ê Í È Ì
III
Æ Æ ÇÈ Ç Ê Ë ÏÈ Î Æ Ì ÇÈ Ï Æ Ð ÉÈ Ê Æ Ë ËÈ Ì Í Ì Í È Î Í Ê ÆÈ Í
IV
Æ Æ ÇÈ Ð Ê Ë ÆÈ Ç Æ Ì ÉÈ Í Æ Ð ÉÈ Î Æ Ë Í È Í Í Ì ÆÈ Ï Í Ê ËÈ Ð
2016 I
Æ Æ ÇÈ Ê Æ É ÏÈ É Æ Î ËÈ Ì Æ Ç ÆÈ Í Æ Ë ÇÈ Í Í Ì ÆÈ Æ Í Ê ËÈ Ë
II
Æ Æ ÐÈ Ç Æ É ÎÈ Ç Æ Ì ÇÈ Ç Æ Ç Í È Ð Æ Ë Ê È É Í Ì Í È Ð Í Ê ËÈ Ì
III
Æ Æ ÐÈ Î Æ É ÌÈ Æ Æ Ì ÇÈ Æ Æ Ç ÆÈ É Æ Ë ÌÈ Í Í Ì ÆÈ Î Í Ê ËÈ Ì
IV
Æ Æ ÇÈ Ì Æ É ÌÈ Ë Æ Î Í È Ð Æ Ç ÆÈ Ð Æ Ë ÌÈ Æ Í Ì ÆÈ Ï Í Æ ÇÈ Ì
2017 I
Æ Æ ÐÈ Ð Æ Ç ÇÈ Í Æ Î Ê È Ë Æ Ç ÆÈ Ç Æ Í ËÈ Æ Í Ì Ê È É Í Æ ÌÈ Æ
II
Æ Æ ÎÈ Ê Æ Ç Í È Ê Æ Î Ê È Ë Æ Ç ÊÈ Ð Æ Í Í È Ç Í Ì Ê È Î Í Æ ÆÈ Ì
III
Æ Æ ÐÈ Í Æ Ç Í È Ï Æ Î ÏÈ Ê Æ Ç ÏÈ Ç Æ Í Ê È Í Í Ì Ê È Ð Í Æ Ê È Ï
IV
Æ Æ ÇÈ Ð Æ Ç ÆÈ Ç Æ Î ÐÈ É Æ Ç ÎÈ É Æ Í Ê È Ê Í Ì Ê È Ë Í Æ ÆÈ Ï
2018 I
Æ Ê ÎÈ Ì Æ É ËÈ Ë Æ Ð ÇÈ Ï Ê Ë Í È Æ Æ Æ Í È Ë Í Ì ÌÈ Ð Í Æ ÌÈ Ê
II
Æ Ê ÇÈ Î Æ É ÊÈ Ð Æ Ç Í È Ð Ê Ë ÆÈ Ê Æ Æ Í È Ï Í Ì ÎÈ Ë Í Æ ÌÈ Ê
III
Æ Ê ÉÈ Ï Æ É Í È É Æ Ç Ê È Ç Ê Ë ÊÈ Æ Æ Æ ÆÈ Ð Í Ì ÎÈ É Í Æ ÌÈ Ì
IV
Æ Ê ÐÈ É Æ Ç ÉÈ Ï Æ Ç Í È Ï Ê Ë ÏÈ Ë Æ Æ Í È Æ Í Ì ÎÈ Ç Í Æ ÏÈ Ì
2019 I
Æ Ï ËÈ Í Æ É ÏÈ Ð Æ Ç Ê È Í Ê Ë ÏÈ Ê Æ Ê ËÈ Ð Í Ì ÐÈ É Í Æ ÏÈ É
II
Æ Ï ËÈ Æ Æ É ÌÈ Ê Æ Ç Ê È Æ Ê Ë ÏÈ Ï Æ Æ ÉÈ Ï Í Ì ÇÈ Ê Í Æ ÏÈ Ç
III
Æ Ï ËÈ Ê Æ É ÌÈ É Æ Ç Ê È Æ Ê Ë ÏÈ Ë Æ Æ ÐÈ É Í Ì ÐÈ Ç Í Æ ÌÈ Î
IV
Æ Ï ËÈ É Æ É ÎÈ Æ Æ Ç ÌÈ Ï Ê Ë ÏÈ Ï Æ Æ ÐÈ Í Í Ì ÐÈ Ï Í Æ ÏÈ Ð
2020 I p
Æ Ï Í È É Æ É ÊÈ Î Æ É ËÈ Ð Ê Ë Í È Æ Æ Æ ÌÈ Ì Í Ì ÐÈ Ë Í Æ Ê È ÐÑ ÒÓ Ô ÕÖ× ÕØ Ù ÚÛ Ü Ý Ñ Ú Ü Ú Þß Ú Þà Ü Ý Ò á âà Øã
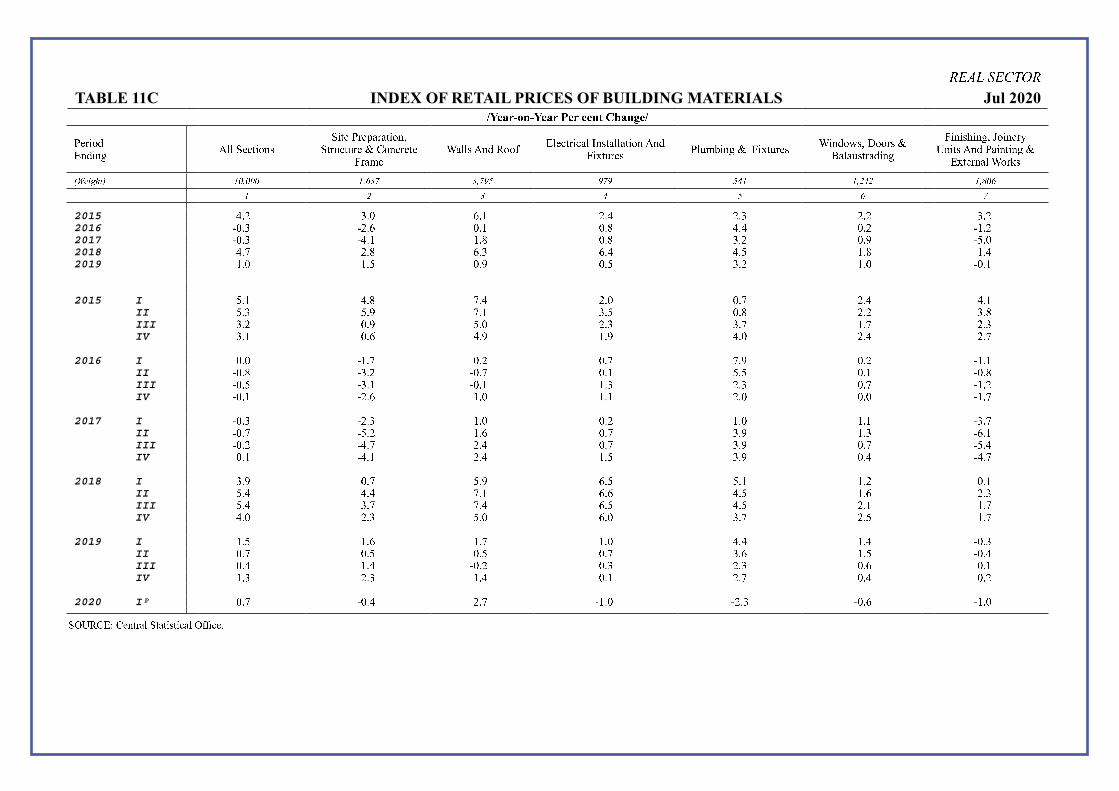
ä å æ ç è å é ê ë äì íî ï ðñ ò ó ñ íî ï ð ô î ð õ î ó ö ÷ ø ï ó ù î ìúû ü ýþ ÿ�� ÿ ý � � � � �� û � � ýþ � � � ý �û ú üû ü � ýþ ��� � ü� � � � üû � þ � � üû �û� ü �û � � � � � � ÿ� þ þ � � �û � � ü ý � �� � � � � � � ýþ � �� ÿ� ý� � � üû � ú � � � � ý � � � ý� � � üû � � ý� ÿþ � �� � þ þ ü � � � � � � ü ÿ ý� � � ý � ý � � ý � �� �þ ý� û ü��� ý � � �� ÿ ú ý � � ý � � �� �û ü� � �þ ü � �� ! "# $% & ' () ( ( ( ' ) * + , + ) , - . - , - . / ' ' ) 0 / 0 ' ) 1 ( *' 0 + / . * ,2015
23 4 5 3 6 73 8 43 2 43 5 43 4 5 3 42016 9 63 5 9 43 7 63 8 63 : 23 2 63 4 9 8 3 42017 9 63 5 9 23 8 8 3 : 63 : 5 3 4 63 ; 9 < 3 62018
23 = 43 : 73 5 73 2 23 < 8 3 : 8 3 22019
8 3 6 8 3 < 63 ; 63 < 5 3 4 8 3 6 9 63 8
2015 I
< 3 8 23 : =3 2 43 6 63 = 43 2 23 8 II
< 3 5 < 3 ; =3 8 5 3 < 63 : 43 4 5 3 : III
5 3 4 63 ; < 3 6 43 5 5 3 = 8 3 = 4 3 5
IV
5 3 8 63 7 23 ; 8 3 ; 23 6 43 2 4 3 =
2016 I
63 6 9 8 3 = 63 4 63 = =3 ; 63 4 9 8 3 8
II 9 63 : 9 5 3 4 9 63 = 63 8 < 3 < 63 8 9 63 :
III 9 63 < 9 5 3 8 9 63 8 8 3 5 43 5 63 = 9 8 3 4
IV 9 63 8 9 43 7 8 3 6 8 3 8 43 6 63 6 9 8 3 =
2017 I 9 63 5 9 43 5 8 3 6 63 4 8 3 6 8 3 8 9 5 3 =
II 9 63 = 9 < 3 4 8 3 7 63 = 5 3 ; 8 3 5 9 73 8
III 9 63 4 9 23 = 43 2 63 = 5 3 ; 63 = 9 < 3 2
IV
63 8 9 23 8 43 2 8 3 < 5 3 ; 63 2 9 23 =
2018 I
5 3 ; 63 = < 3 ; 73 < < 3 8 8 3 4 63 8
II
< 3 2 23 2 =3 8 73 7 23 < 8 3 7 4 3 5
III
< 3 2 5 3 = =3 2 73 < 23 < 43 8 8 3 =
IV
23 6 43 5 < 3 6 73 6 5 3 = 43 < 8 3 =
2019 I
8 3 < 8 3 7 8 3 = 8 3 6 23 2 8 3 2 9 63 5
II
63 = 63 < 63 < 63 = 5 3 7 8 3 < 9 63 2
III
63 2 8 3 2 9 63 4 63 5 43 5 63 7 63 8
IV
8 3 5 43 5 8 3 2 63 8 43 = 63 2 63 4
2020 I p
63 = 9 63 2 43 = 9 8 3 6 9 43 5 9 63 7 9 8 3 6> ?@ A BCD BE F GH I J > G I G KL G KM I J ? N O M EP

Period 1 2
TABLE 12 EMPLOYMENT AND LABOUR FORCE Jul 2020
/000 Persons/
Non-institutional Participation UnemploymentPopulation Labour Persons Persons Rate Rate
15 years and over Force with Jobs without Jobs % % 1 2 3 4 5 6
2013 1,059.6 650.2 626.3 23.9 61.4 3.7
2014 1,063.4 658.6 636.9 21.8 61.9 3.3
2015 1,065.1 645.3 623.3 22.0 60.6 3.4
2016 1,068.5 638.3 613.1 25.3 59.7 4.0
2017 1,071.2 633.7 603.1 30.6 59.2 4.8
2013 III 1,060.1 648.2 624.2 24.0 61.1 3.7 IV 1,061.0 653.5 628.8 24.7 61.6 3.8
2014 I 1,062.0 664.3 643.5 20.7 62.6 3.1 II 1,062.9 659.0 636.2 23.0 62.0 3.5 III 1,063.9 660.1 637.9 22.1 62.0 3.3 IV 1,064.8 651.0 629.8 21.3 61.1 3.3
2015 I 1,063.8 646.0 622.8 23.2 60.7 3.6 II 1,064.7 649.1 628.6 20.5 61.0 3.2 III 1,065.5 642.1 620.2 21.9 60.3 3.4 IV 1,066.3 643.9 621.6 22.3 60.4 3.5
2016 I 1,067.3 641.9 617.8 24.1 60.1 3.8 II 1,068.1 640.9 612.4 28.5 60.0 4.4 III 1,068.9 639.2 613.6 25.5 59.8 4.0 IV 1,069.7 631.3 608.4 22.9 59.0 3.6
2017 I 1,070.5 640.2 611.1 29.1 59.8 4.5 II 1,070.9 636.8 603.0 33.9 59.5 5.3 III 1,072.8 634.1 602.0 32.1 59.1 5.1 IV 1,070.5 623.7 596.4 27.3 58.3 4.4
2018 I 1,070.6 630.9 606.8 24.1 58.9 3.8 II 1,072.5 627.6 603.5 24.0 58.5 3.8 III 1,073.1 634.8 606.0 28.9 59.2 4.6
SOURCE: Central Statistical Office.
1 Labour Force as a percentage of Non-Institutional Population - 15 years and over.2 Total unemployed as a percentage of the Labour Force.
Q R S T U R V W X Q
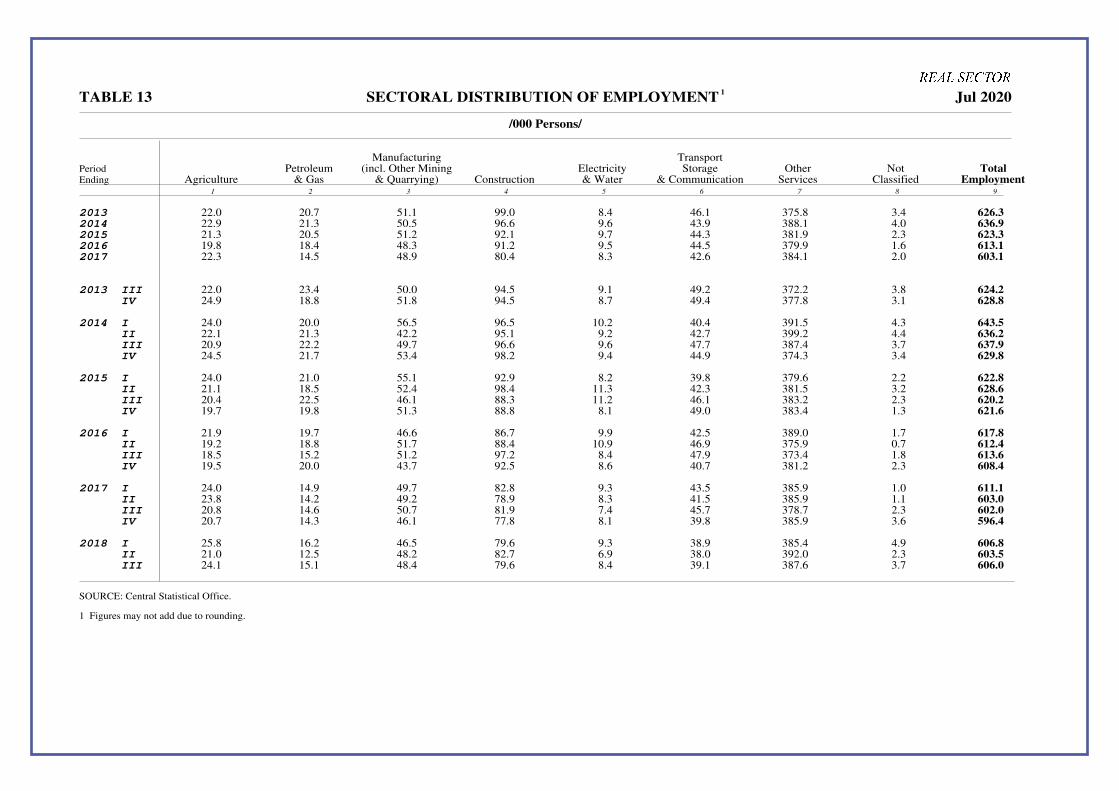
PeriodEnding
TABLE 13 SECTORAL DISTRIBUTION OF EMPLOYMENT 1
Jul 2020
/000 Persons/
Manufacturing TransportPetroleum (incl. Other Mining Electricity Storage Other Not Total
Agriculture & Gas & Quarrying) Construction & Water & Communication Services Classified Employment 1 2 3 4 5 6 7 8 9
2013 22.0 20.7 51.1 99.0 8.4 46.1 375.8 3.4 626.32014 22.9 21.3 50.5 96.6 9.6 43.9 388.1 4.0 636.92015 21.3 20.5 51.2 92.1 9.7 44.3 381.9 2.3 623.32016 19.8 18.4 48.3 91.2 9.5 44.5 379.9 1.6 613.12017 22.3 14.5 48.9 80.4 8.3 42.6 384.1 2.0 603.1
2013 III 22.0 23.4 50.0 94.5 9.1 49.2 372.2 3.8 624.2 IV 24.9 18.8 51.8 94.5 8.7 49.4 377.8 3.1 628.8
2014 I 24.0 20.0 56.5 96.5 10.2 40.4 391.5 4.3 643.5 II 22.1 21.3 42.2 95.1 9.2 42.7 399.2 4.4 636.2 III 20.9 22.2 49.7 96.6 9.6 47.7 387.4 3.7 637.9 IV 24.5 21.7 53.4 98.2 9.4 44.9 374.3 3.4 629.8
2015 I 24.0 21.0 55.1 92.9 8.2 39.8 379.6 2.2 622.8 II 21.1 18.5 52.4 98.4 11.3 42.3 381.5 3.2 628.6 III 20.4 22.5 46.1 88.3 11.2 46.1 383.2 2.3 620.2 IV 19.7 19.8 51.3 88.8 8.1 49.0 383.4 1.3 621.6
2016 I 21.9 19.7 46.6 86.7 9.9 42.5 389.0 1.7 617.8 II 19.2 18.8 51.7 88.4 10.9 46.9 375.9 0.7 612.4 III 18.5 15.2 51.2 97.2 8.4 47.9 373.4 1.8 613.6 IV 19.5 20.0 43.7 92.5 8.6 40.7 381.2 2.3 608.4
2017 I 24.0 14.9 49.7 82.8 9.3 43.5 385.9 1.0 611.1 II 23.8 14.2 49.2 78.9 8.3 41.5 385.9 1.1 603.0 III 20.8 14.6 50.7 81.9 7.4 45.7 378.7 2.3 602.0 IV 20.7 14.3 46.1 77.8 8.1 39.8 385.9 3.6 596.4
2018 I 25.8 16.2 46.5 79.6 9.3 38.9 385.4 4.9 606.8 II 21.0 12.5 48.2 82.7 6.9 38.0 392.0 2.3 603.5 III 24.1 15.1 48.4 79.6 8.4 39.1 387.6 3.7 606.0
SOURCE: Central Statistical Office.
1 Figures may not add due to rounding.
Y Z [ \ ] Z _ Y

� � � � � � � � � � � � � � � � �� �� � � � �� � � �� �� � �� �� � � �� �� � �� � � � � �� � � ! � � � � � �� �� � � � �� " # �� �� � �� �� " # �� � " # � $ ��� � � " # � %& � � � " # � % ��� � � " # � �' &( � � �� � )� *� � � � �+ , - �� " �+ - � -� % � .+ % # � � $ �+ � % �� � $+ . � � � # $+ " " /� $ . " + , , � � � . . + � # . � "01 2 3 45 6 27 2 18 2 9: ; < <= > 9: < ? >= @ A: ; @ B= C <: 9 > <= @ ; : @ B ?= ? <: > > ; = B ; ; : > 9 ; = 9 ; @: > 9 9 = @DE 1F 0 1 2 3 45 6 2 7 2 18 2 A: < 9 ?= < A: < G @ = 9 C: A G <= > ?: A C A= A @: C ; 9 = 9 @: < < G= C 9 ; : 9 > >= A < B: C ? >= ?HIJ 2 K E 1 L 1 M E N 2 I 1 OP 3E QR K 9: ; 9 B= A 9: 9 A B= B 9: ? ? >= 9 <: B 9 C = A <: C G >= ; <: A C A= > ; <: ? < A= A ; 9 : A < >= >HIJ 2 K E 1 P 3E S 2 3R 5 >= @ >= A G ?= B >= ? >= G >= ; 9 = B G B = @HIJ 2 K E 1 TE E O K I 1 OU 2 37 V M 2 K ; : B C ; = < ; : ? > A= < <: 9 ; A= > ; : B C 9 = < ; : B ; @ = @ ; : C A B= G B: > C G= B ?: C G 9 = >HIJ 2 K E 1 L 1 R 2 31 I R V E 1 I W H 3 I O 2 @ ? @ = 9 A ; C = > A C ; = ? ? G ; = @ @ A G= @ G 9 <= B <: ? 9 <= @ <: A < B = ADE 1 HI J 6 2 7 2 18 2 @ G >= @ @ @ >= A ; : C < A= > <: > < <= A G B <= C @: < < G= C A: ? @ <= ? @: ? < C = C( � � �� � XY � � � Z [ � �� � " + # / %� - � � + " � -� % � " + $ / .� - � #+ � # %� . � � + , " #� � � � + � # $� - . -+ , $ .� . . / + " " - � -\I 4 2 K I 1 OU I W I 3 V 2 K <: < < B= A <: < @ <= B <: 9 B <= @ <: 9 G >= @ <: 9 ; A= C <: < < <= A B: > B G= G B: ; G @ = GTE E O K I 1 OU 2 37 V M 2 K ; : @ C A= C ; : 9 9 ?= C <: A C G= > ? C ; = G ; : @ C C = 9 ; : > C B= C A: ; > <= ; A: 9 C A= >L1 R 2 3 2 KR P I 5 N 2 1 R K ; : > < B= ? C < @ = ? ; : < C C = ; ? > ?= B ; : ; C C = B B C @ = ? G: ? C A= C 9: B @ >= <H 3 I 1 K ] 2 3 K I 1 OU 8 ^ K V O V 2 K _ ?: < < <= @ A: C ? B= @ A: 9 B B= B A: < ? C = @ A: < < A= ; ?: A > B= G < @: 9 B ; = ; < A: ? G 9 = C( � � �� � �� � � � � � � � � � a b c d e ! � f� [ b � d � " + $ # �� , � � + $ % #� # " + # , $� " � � � �� , � , + � # �� � � .+ / % #� % � , + # . " � - � � + , " � � ,g I S VR I W 6 2 7 2 18 2 C A ; = @ B B G= > ; = G >= C ? A= @ 9 > @ = C C 9 ?= C B ? < = Cg I S VR I W 0J S 2 1 O VR8 3 2 I 1 O D 2R h 2 1 O V 1 4 B G A= ; ; : ; C B= < ; : 9 ; @ = 9 < A C = 9 ; : ; A ?= A B > B= G 9: G B <= ; 9: ? G ? = 9i ` � � )� *� � � � � #+ " " #� $ �+ - � /� % � .+ % # , � � �+ � % �� � $+ . % $� - $+ - , " � - . , + � / �� $ . - + % $ $� #i ` � � XY � � � Z [ � �� � , + # � .� - � " + . % -� # � .+ # $ �� % � #+ , $ /� % � " + . % $� $ � " + % � /� � . %+ % / /� - . � + � $ " � %j � � X � � � k l m [ a � � � n � �� �� � � � � � � � a b c d e ! � f� [ b � d � -+ � � -� % � -+ " . -� $ � -+ . , /� . � " + / % �� , � /+ - � $� � � $+ " % /� , � � /+ $ " %� � � � �+ � " � � ,� *� � � � � � � � � � � a b c d e ! � f� [ b � d � " + $ � , � % � " + � / %� " $ " , � , � , % /� % � -+ # # #� " � -+ " % .� . � -+ / � /� % � .+ # � - � %i ` � � m [ � � �� [ � k b j � d " + $ � , � % " + � / %� " � $ " , � , , % /� % -+ # # #� " -+ " % .� . -+ / � /� % .+ # � - � %XY � � � � � m [ � � �� [ � k b j� d b j� XY � � � � � n � � o [ � k d , .� , � � , � � " " �� . � / �� � � + , , /� / , + , - %� / � + " , �� . % - - � .p V K ^8 3 K 2 N 2 1 R K < G A= B >= > A A <= A >= > ; : > C B= G B 9 A= ? ; : B 9 @ = 9 ; : ? ; < = G6 2 S I 5 N 2 1 R K < ; <= A B 9 = B G 9 9 = < A B= B < B <= 9 < C B= C A B @ = B C @ ? = >p V7 2 K R N 2 1 R P 3E M 2 2 O K >= > >= > >= > >= > >= > >= > >= > >= >qU r \ VR s O 3 It I W K >= > >= > >= > >= > @ 9 B= @ <: ? ; ; = ? >= > >= >! u� a [� m [ � � � � [ � k b j� d " + $ - �� - , + # / " � " � � - " � � . - /� $ , + / / , � / � + � " -� % .+ . - $� . , + " . # � ,H 3 2 I K8 35 v V W W K w D 2R x >= > C ; @ = > A < >= > ; : ; 9 @ = > ; : @ A ; = > ; > >= > >= > ; : G 9 @ = >v E 1 O K w D 2R x < ? 9 = C <: ; G A= @ F < C ?= C ; : 9 B >= < ; : < 9 >= > F <: > ? ?= @ ; : ; A @ = B 9: ; G < = @p V K ^8 3 K 2 N 2 1 R K A 9 B= A <: G B 9 = < C G >= B 9: < B <= 9 ; : G B A= C 9: ; 9 C = ? A: 9 G B= ; A: 9 > ; = 96 2 S I 5 N 2 1 R K 9 A @ = C 9 G A= ? ; : ; < C = ? ; : B > <= ; < A A= C @: < ; A= < @: ; C 9 = < 9: ; @ C = Cp V7 2 K R N 2 1 R P 3E M 2 2 O K >= > >= > >= > >= > >= > >= > >= > >= >y 1 M I K s 2 O v I W I 1 M 2 K w D 2 R x z <: G C @ = ? ; > >= ? F ; : < C @ = ; F <: > A C = @ C ? <= A 9: @ ? C = 9 9: < B ; = @ F ; : 9 9 ? = <�� u { � u a |} V W 6 27 2 18 2 K ; : ? ? A= B <: ; > ?= > @: @ > >= C ; : ? G ?= < B B B= B ; : @ ? >= 9 A: < ? @ = B ; >: ? 9 A= @DE 1F E V W 6 27 2 18 2 ~ ?: @ C <= 9 ?: G > C = C B: 9 > >= B C: < G ; = B A: G ; ; = ; @: A @ A= G 9 A: > @ A= > 9 G: ; A ? = A� �� � �� �� �� � � � � � � � � � � � � � � �� � �� � �� � � �� � �� � � � � � �� � � �� � � � � � � � � � � � � �� � � � � � �� � � �� � � � � � � �� � � �� � ¡¢ £ ¤¥ ¦ § ¨© ¨ª «¬ ® ¯° ¨© ±© ² ³ ±© ¤ ³© «¬ ± µ¶ ±© · ® ¯¸ ¬ ¨© ¨ ± ´ ±© ´ ¸ ® ¹ ± º ®»¼½ ¾ ½ ¿ ÀÁ Â Ã Ä Å Æ Ç È É Ê Ë Å Â Æ Ì Â Ä Ë Ê Ã Ê Â É Ì À É Á ½Í £ ³ ¯ ³¬ ª « ® ± ² ² ® Ω «ª ® ¯ « Ï ³ ¤ ® © ª ® µ ± « ³ ´ ° Ω ´Ð ¢ © ³ Ñ Ò µ ® Ñ ³© « ° Ω ´Ð £ ® ± ´Ó Ñ Ò ¬ ® Ô ³ Ñ ³© « ° Ω ´ Ð « Ï ³ Ó © ¯¬ ±ª «¬ Î ² « ά ³ Õ ³ Ô ³ µ ® Ò Ñ ³© « ° Ω ´ ±© ´Ö ³ ¬ ¨ « ± º ³ ±© « ± ¹ µ ª ± « ¨ ®© ° Ω ´»× ¸ Ï ª ¨ª ± ¹ ± µ ±© ² ¨© º ¨ « ³ Ñ ±© ´ © ² µ Î ´ ³ ª ³¬ ¬ ® ¬ ª ±© ´ ® Ñ ¨ª ª ¨ ®© ª Ð ± ´ Ô ±© ² ³ª ¯¬ ® Ñ « Ï ³ ¤ ³© «¬ ± µ¶ ±© · ±© ´ ¬ ± Ø ´ ® Ø© ª ¯¬ ® Ñ « Ï ³ «¬ ³ ±ª ά ´ ³ Ò ® ª ¨ « ± ² ² ® Ω «ª » Ù ³ º ± « ¨ Ô ³ ¹ ± µ ±© ² ³ ª ¬ ³ Ò ¬ ³ª ³© « ±© ¨© ² ¬ ³ ±ª ³ ¨© ´ ³ Ò ® ª ¨ «ª ± « « Ï ³ ¤ ³© «¬ ± µ¶ ±© ·»Ú Ù ®©Û ® µ £ ³ Ô ³© Î ³ ² ® Ñ Ò ®© ³© «ª ¦ ¸ ± Ü ³ ª ®© Ý ¬ ® Ò ³¬ « Ð ¸ ± Ü ³ª ® © Þ ® ® ´ª ±© ³ ¬ Ô ¨ ² ³ ª Ð ¸ ± Ü ³ª ® © Ó © « ³ ¬ © ± « ¨ ®© ± µ ¸ ¬ ± ´ ³ ±© ´ Ù ®© ¸ ± Ü £ ³ Ô ³© Î ³ ±¬ ³ « Ï ³ ª ± Ñ ³ ±ª « Ï ± « ® ¯ Ù ® ©Û ¥ © ³ ¬ º £ ³ Ô ³© Î ³ ± ¹ ® Ô ³» Ù ® « ³ Ù ® ©Û ¡ µ £ ³ Ô ³© Î ³¦ ¸ ± Ü ³ ª ® © Ó © ² ® Ñ ³±© ´ Ý ¬ ® ß «ª ¨© ² µ Î ´ ³ª « ± Ü ³ ª Ò ± ¨ ¹ Ò ³ «¬ ® ² Ï ³ Ñ ¨ ² ± µ ² ® Ñ Ò ±© ¨ ³ ª Ø Ï µ ³ Ù ® ©Û ¥ © ³ ¬ º £ ³ Ô ³© Î ³¦ ¸ ± Ü ³ ª ® © Ó © ² ® Ñ ³ ±© ´ Ý ¬ ® ß «ª ´ ® ³ª © ® «»Ò ¬ Ý ¬ ³ µ Ñ ¨© ±¬ »

F G H I J K L J M N M K OPQ R R S TU QVW X YZ [\ ] [ Y ] _Z `a bc Wd W ]e W f Z gW h ` Yi jc Wd W ]e W _Z `a b \ k lW ] [ Y `e XW f Z gW h ` Y i \ k lW ] [ Y `e XW m XZ h h f Z gW h ` Y i n e [ W `fW oi Y ` n Z X XZp Y ] q XZ g rZ ]sn a ] t V X Yd a `W uW i `Z X rW f Z gW h ` Y i n e [ W `fW o i Y `v w x y z { |2014
} }~ � � �� } � �~ � � � � � � � ~ � } �� � � � ~ } � � � � s � �~ � � � � � � � ~ � � � � � s � }~ � � �� �2015
} }~ � � � � � � � ~ � � � � � } �~ } � �� � } �~ � � } � } s � }~ � � } � � � � �� } s � �~ � � } � �2016
� � ~ � � } � � � }~ � } } � � } � ~ � � � � � � �~ � � �� � s � � ~ � � �� � s � � �� � s � �~ � � �� �2017
� �~ � � � � � � �~ � � � � � � �~ } � � � � � �~ � � �� } s � �~ � � � � � �~ � � � � � s � �~ � � �� �2018
� �~ } � �� � � �~ � � � � � � �~ � � �� � � �~ � � � � � s � �~ � � �� � s �~ � � �� � s � �~ � � �� �2014 I
�~ � � � � � }~ � � �� � � � ~ � � �� � � �~ � � } � � s �~ � � � � � s � �� � s �~ � � �� � II
� �~ � } � � � �~ � � �� � � }~ � � �� � � �~ � � �� � s �~ � � �� � � ~ � } �� � s �~ � � �� �
III
� �~ � � � � � �~ � � �� � � � ~ � � �� � � �~ � � �� � s � �~ } � �� � � � �� � s � }~ � � �� �
IV
� �~ � } � � � �~ � � � � � � �~ � � �� � � �~ � � �� � s �~ � � �� � �~ } � � � � s � �~ � � � � �
2015 I
� �~ � � � � � �~ � � � � � � �~ } � �� � � �~ � � � � � s �~ � � �� � s � ~ � � � � � s �~ � � � � �
II
� �~ � } �� � �~ � � } � � � }~ � � � � � � �~ � � �� � s �~ � � �� � � � �� � s }~ � � �� �
III
� �~ � � } � � � � ~ � � � � } � �~ � � } � } � �~ � } � � � s �~ � � �� � �~ � � �� � s �~ � � � � �
IV
� � ~ � � � � � �~ � � � � � � � ~ � � � � � � �~ � � � � � s � ~ � } �� � s � ~ � � } � � � � � � �
2016 I
�~ � � � � � �~ � � � � � � � ~ � � � � � � � ~ } � �� � s �~ � � �� � � ~ � � �� � s �~ � � �� }
II
�~ � � �� } �~ � � � � � � �~ � � } � � � � ~ � � �� } s �~ � � �� � s � ~ � � �� � s �~ � � �� �
III
� �~ � � �� � � �~ � � �� � � �~ � � � � � � �~ � � �� � s � ~ � � �� � s � � �� � s � ~ � � } � }
IV
�~ � � � � � �~ � � � � � � �~ � } �� � �~ � � �� � s �~ � � �� � � � �� � s �~ � � } � �
2017 I
�~ � } �� } �~ � � } � � � � ~ � � � � � � �~ � � �� � s }~ � � �� } � � �� � s �~ � � � � }
II
�~ � � �� � �~ � � �� � � �~ � � � � � �~ � � �� � s �~ � � �� � �~ � � � � � s }~ � � �� �
IIIr
� �~ � � �� � �~ � � � � � � � ~ � } �� � � �~ � � } � � s �~ � � � � � �~ � � � � � s �~ � � �� �
IV
�~ � � } � } �~ � � � � � �~ � � � � � �~ � � �� � s � ~ � � } � � s � �� � s � ~ � � � � �
2018 I
�~ } � �� } �~ � � � � � � �~ � � � � � � �~ � � �� � s �~ � � � � � �~ � � � � � s �~ � � �� �
II
� �~ � � � � � �~ � � � � � � �~ � � � � } � � ~ � � } � � s �~ � � �� � s � ~ � � �� � �~ � � � � �
IIIp
� �~ � � � � } � �~ � � � � � � � ~ � � � � � � � ~ � � } � � s � ~ � � �� � � ~ � � �� � s �~ � � � � �
IV
� � ~ � � �� � �~ } � �� � � �~ � � � � � �~ � � �� � s �~ � � �� } s �~ � � �� � s �~ � � � � �
2019 I
� �~ � � �� � �~ � � � � � � � ~ � � �� } � � ~ � � �� � s �~ � � � � � � ~ � � �� } s }~ � � } � �� �� � �� �� � �� �� �� � � �� �� �� � � �� � � �� � � � �� �� � �¡ � �� � � � � �� � ¡ � ¢ � £ �¤¥ ¡ � ¦ � �� � � �� � � � � �� � �� � �§ � ¨ � © � � � � ª � ¦ �� � � � � « � £ � � ª � ¬ � � � �� � � ¦ « � � � �� ª � ¦ �� � � � �® �� � � � « � � ¦ �� «� ª � ¦ �� � � � � � �� « �¤° ª � ¦ �� � � � � � �� « � ± ¡ � � � � � � �� « �² � � � � £ � � � �� « �¤

PeriodEnding
PUBLIC FINANCE
TABLE 16A CENTRAL GOVERNMENT EXTERNAL DEBT Jul 2020
/US$ Mn/
Central Government
Receipts Amortization Debt Conversion Value Adjustment Balance Outstanding Interest
2016 1,087.4 78.9 0.0 0.0 3,239.0 101.42017 439.0 88.9 0.0 0.0 3,589.5 122.72018 421.2 100.3 0.0 0.0 3,913.9 151.92019 279.8 123.6 0.0 0.0 4,070.1 168.2
2015 II 25.0 24.8 0.0 0.0 2,215.9 23.3
III 42.9 22.6 0.0 0.0 2,236.3 18.8
IV 10.7 16.4 0.0 0.0 2,230.7 23.0
2016 I 5.7 21.0 0.0 0.0 2,215.4 31.3
II 25.9 18.6 0.0 0.0 2,222.9 24.7
III 1,014.1 22.5 0.0 0.0 3,214.4 21.1
IV 41.7 16.8 0.0 0.0 3,239.0 24.3
2017 I 0.0 18.5 0.0 0.0 3,220.5 43.1
II 41.6 25.5 0.0 0.0 3,236.6 24.5
III 318.4 19.6 0.0 0.0 3,535.8 42.7
IV 79.0 25.2 0.0 0.0 3,589.5 12.5
2018 I 2.2 20.6 0.0 0.0 3,571.1 47.7
II 182.0 24.5 0.0 0.0 3,728.6 25.1
III 0.0 32.8 0.0 0.0 3,695.8 49.9
IV 237.0 22.4 0.0 0.0 3,913.9 29.2
2019 I 4.2 32.8 0.0 0.0 3,885.3 52.4
II 24.3 20.6 0.0 0.0 3,889.0 30.6
III 100.0 49.6 0.0 0.0 3,939.4 54.8
IV 151.3 20.6 0.0 0.0 4,070.1 30.4
2020 I 93.8 50.2 0.0 0.0 4,113.7 66.2
II p 793.2 123.6 0.0 0.0 4,783.3 12.9
SOURCE: Central Bank of Trinidad and Tobago
� � � � � � � � � � � �

Period
TABLE 16B CENTRAL GOVERNMENT - INTERNAL DEBT Jul 2020
/TT$Mn/
Treasury Bills and Notes1 Treasury Bonds Bonds and Notes2 BOLTS & LEASES CLICO&HCU Zero-Coupon Bonds Other4 TotalRepay- Out- Repay- Out- Repay- Out- Repay- Out- Repay- Out- Out- Out-
Issue ment standing Issue ment standing Issue ment standing Issue ment standing Issue ment3 standing standing standing1 2 3 4 5 6 7 8 9 10 11 12 13 14 15 16 (3+6+9+12+15+16)
2015 29,602.2 32,349.4 29,102.4 0.0 0.0 2,559.3 3,201.0 2,662.8 28,660.8 0.0 77.2 224.5 346.8 523.8 3,929.8 10.7 64,487.52016 29,914.8 28,957.7 30,059.5 0.0 0.0 2,559.3 4,240.5 986.8 31,593.2 0.0 41.2 183.0 3.3 615.8 3,317.3 16.8 67,729.02017 28,010.8 34,031.0 24,039.3 0.0 0.0 2,559.3 9,893.3 3,770.7 37,884.0 0.0 27.4 155.7 2.4 522.7 2,796.9 16.5 67,451.72018 31,443.7 30,492.5 24,990.4 0.0 0.0 2,309.3 5,940.0 5,054.4 38,947.6 0.0 26.3 129.4 1.0 505.8 2,292.1 16.5 68,685.32019 19,367.5 27,236.9 17,121.0 0.0 0.0 2,309.3 7,285.4 2,874.1 43,115.7 0.0 25.4 104.0 0.3 502.1 1,790.3 16.5 64,456.8
2015 II 6,379.0 5,662.8 34,265.0 0.0 0.0 2,559.3 475.3 916.6 26,938.1 0.0 18.3 264.0 22.0 10.2 4,416.1 10.7 68,453.1III 9,235.0 8,879.3 35,035.7 0.0 0.0 2,559.3 1,201.4 139.0 28,132.8 0.0 20.2 243.8 8.7 22.8 4,401.9 10.7 70,384.3IV 7,321.3 13,254.6 29,102.4 0.0 0.0 2,559.3 1,524.3 1,169.7 28,660.8 0.0 19.3 224.5 10.6 482.7 3,929.8 10.7 64,487.5
2016 I 8,759.0 7,455.8 30,405.6 0.0 0.0 2,559.3 22.1 154.5 28,527.4 0.0 21.2 203.2 0.0 10.3 3,919.5 10.7 65,625.6II 6,006.5 7,592.7 28,819.3 0.0 0.0 2,559.3 3,162.9 520.5 31,169.8 0.0 7.1 196.1 0.0 49.7 3,869.8 10.7 66,625.0III 9,111.2 8,288.9 29,641.7 0.0 0.0 2,559.3 22.7 95.7 30,888.6 0.0 9.7 186.3 1.2 77.0 3,793.9 16.9 67,086.7IV 6,038.1 5,620.3 30,059.5 0.0 0.0 2,559.3 1,032.8 216.1 31,593.2 0.0 3.2 183.0 2.1 478.7 3,317.3 16.8 67,729.0
2017 I 5,721.5 8,560.7 27,220.2 0.0 0.0 2,559.3 2,518.3 237.4 33,861.9 0.0 10.0 173.1 1.3 15.7 3,302.8 16.8 67,134.1II 7,871.4 7,119.5 27,972.2 0.0 0.0 2,559.3 2,200.0 287.5 35,778.6 0.0 3.5 169.6 0.0 5.7 3,297.1 16.8 69,793.6III 8,112.6 9,127.5 26,957.2 0.0 0.0 2,559.3 2,500.0 2,933.3 35,487.1 0.0 10.3 159.3 0.5 28.1 3,269.5 16.5 68,448.9IV 6,305.4 9,223.3 24,039.3 0.0 0.0 2,559.3 2,675.0 312.5 37,884.0 0.0 3.6 155.7 0.6 473.2 2,796.9 16.5 67,451.7
2018 I 7,297.2 6,826.7 24,509.7 0.0 0.0 2,559.3 2,400.0 2,690.7 37,618.5 0.0 10.5 145.2 0.6 7.3 2,790.2 16.5 67,639.4II 8,547.5 7,873.9 25,183.3 0.0 0.0 2,309.3 750.0 680.2 37,769.0 0.0 3.7 141.5 0.0 2.8 2,787.5 16.5 68,207.0III 6,962.0 9,181.9 22,963.4 0.0 0.0 2,309.3 450.0 741.0 37,507.6 0.0 10.9 130.6 0.5 20.0 2,767.9 16.5 65,695.3IV 8,637.0 6,610.1 24,990.4 0.0 0.0 2,309.3 2,340.0 942.5 38,947.6 0.0 1.2 129.4 0.0 475.8 2,292.1 16.5 68,685.3
2019 I 8,108.0 7,804.7 25,293.7 0.0 0.0 2,309.3 642.4 291.3 39,325.6 0.0 11.2 118.2 0.0 5.9 2,286.2 16.5 69,349.5II 2,449.5 8,560.7 19,182.5 0.0 0.0 2,309.3 2,500.0 285.8 41,273.1 0.0 1.3 116.9 0.3 0.2 2,286.4 16.5 65,184.7III 3,325.0 3,674.0 18,833.5 0.0 0.0 2,309.3 843.0 811.7 41,253.0 0.0 11.5 105.4 0.0 25.1 2,261.3 16.5 64,779.0IV 5,485.0 7,197.5 17,121.0 0.0 0.0 2,309.3 3,300.0 1,485.3 43,115.7 0.0 1.4 104.0 0.0 471.0 1,790.3 16.5 64,456.8
2020 I 12,553.0 7,785.0 21,889.0 0.0 0.0 2,309.3 2,250.0 25.4 45,082.9 0.0 11.8 92.2 0.0 0.7 1,789.6 16.5 71,179.5II
p 1,390.0 4,882.0 18,397.0 0.0 1,000.0 1,309.3 4,255.5 2,301.4 46,759.2 0.0 1.3 90.9 0.0 0.2 1,789.4 16.5 68,362.3
SOURCES: Ministry of Finance and The Central Bank of Trinidad and Tobago.
1 Includes Treasury Bills as well as Debt Management Bills & Treasury Notes.2 Includes bonds valued at $1,000 million issued by the Government under the Value Added Tax Act in May 2020 for purposes of settling VAT refunds.3 Also includes bonds exchanged for units in the CLICO Investment Fund (CIF) since these represent a reduction in the outstanding balance. 4 Comprises Central Bank fixed-interest rate bonds, as well as National tax-free saving bonds and Public sector arrears.
� � � � � � � � � � �

Period
PUBLIC FINANCE
TABLE 16C CENTRAL GOVERNMENT - TOTAL DEBT Jul 2020
/TT$Mn/
INTERNAL DEBT EXTERNAL DEBT1 TOTAL DEBTIssued Repayment Outstanding Issue Repayment Outstanding Issued Repayment Outstanding
1 2 3 4 5 6 (1+4) (2+5) (3+6)
2015 33,150.1 35,613.2 64,487.5 897.4 547.4 14,104.5 34,047.5 36,160.6 78,592.02016 34,158.6 30,601.5 67,729.0 7,203.3 523.3 21,578.7 41,361.9 31,124.8 89,307.72017 37,906.5 38,351.8 67,451.7 2,885.9 599.0 23,920.2 40,792.4 38,950.8 91,371.92018 37,384.7 36,079.1 68,685.3 2,795.5 690.6 26,225.9 40,180.2 36,769.7 94,911.22019 26,653.2 30,638.5 64,456.8 1,889.5 799.0 27,284.9 28,542.7 31,437.6 91,741.7
2015 II 6,876.3 6,607.9 68,453.1 152.1 157.5 14,736.3 7,028.4 6,765.4 83,189.4
III 10,445.1 9,061.3 70,384.3 272.4 143.7 13,759.6 10,717.5 9,205.0 84,143.9
IV 8,856.2 14,926.3 64,487.5 67.4 105.0 14,104.5 8,923.6 15,031.3 78,592.0
2016 I 8,781.1 7,641.8 65,625.6 85.3 151.6 14,267.8 8,866.4 7,793.4 79,893.4
II 9,169.4 8,170.0 66,625.0 131.4 123.9 14,533.8 9,300.8 8,293.9 81,158.8
III 9,135.1 8,471.3 67,086.7 6,704.6 137.3 21,362.3 15,839.7 8,608.6 88,449.0
IV 7,073.0 6,318.4 67,729.0 282.0 110.5 21,578.7 7,355.0 6,428.9 89,307.7
2017 I 8,241.0 8,823.8 67,134.1 0.0 129.3 21,478.3 8,241.0 8,953.1 88,612.4
II 10,071.4 7,416.1 69,793.6 236.4 172.0 21,566.0 10,307.8 7,588.1 91,359.6
III 10,613.0 12,099.2 68,448.9 2,131.7 130.7 23,522.7 12,744.7 12,229.9 91,971.6
IV 8,981.0 10,012.6 67,451.7 517.8 167.0 23,920.2 9,498.8 10,179.6 91,371.9
2018 I 9,697.7 9,535.2 67,639.4 14.5 138.3 23,717.6 9,712.2 9,673.5 91,357.0
II 9,297.5 8,560.6 68,207.0 1,213.1 166.3 24,883.7 10,510.6 8,726.9 93,090.7
III 7,412.5 9,953.7 65,695.3 0.0 228.5 24,710.1 7,412.5 10,182.2 90,405.4
IV 10,977.0 8,029.6 68,685.3 1,567.9 157.5 26,225.9 12,544.9 8,187.1 94,911.2
2019 I 8,750.4 8,113.1 69,349.5 28.1 221.2 25,925.6 8,778.5 8,334.3 95,275.1
II 4,949.8 8,848.0 65,184.7 164.0 139.6 25,969.3 5,113.8 8,987.6 91,154.0
III 4,168.0 4,522.3 64,779.0 675.0 298.9 26,283.8 4,843.0 4,821.2 91,062.8
IV 8,785.0 9,155.2 64,456.8 1,022.4 139.3 27,284.9 9,807.4 9,294.5 91,741.7
2020 I 14,803.0 7,822.9 71,179.5 634.1 339.7 27,489.7 15,437.1 8,162.6 98,669.2
IIp 5,645.5 8,184.9 68,362.3 5,366.3 831.6 32,022.7 11,011.8 9,016.5 100,385.0
SOURCES: Ministry of Finance and The Central Bank of Trinidad and Tobago.
� � � � � � � � � � � � �

� � � � � � � � � � � � � PeriodEnding 1
2 3
TABLE 17A MONEY SUPPLY Jul 2020
/TT$Mn/
Narrow Money Factors Affecting Changes in Money Supply Other Liabilities Monetary Aggregates Net Bank Credit to Gov’t Bank Credit Of Which:
ForeignNFIs’ ForeignMoney Currency Demand External Other Currency Currency Money Money Money MoneySupply in Active Deposits Central Commercial Public Private Assets Liabili- Quasi Deposits Deposits Supply Supply Supply Supply(M-1A) Circulation (Adj) Total Bank Banks Total Sector Sector (Net) ties Money (Adj) (Adj) (M-2) (M-2*) (M-3) (M-3*)
1 2 3 4 5 6 7 8 9 10 11 12 13 14 15 16 17 18
2015 44,254.0 7,649.8 36,604.2 -41,801.6 -56,726.4 14,924.7 64,112.0 11,633.8 52,478.2 85,203.3 63,259.7 41,616.6 22,249.7 593.6 85,870.5 108,120.3 87,533.9 110,367.22016 45,383.8 7,846.6 37,537.2 -31,113.8 -50,680.5 19,566.7 65,950.0 11,760.6 54,189.4 87,670.2 77,122.6 43,252.4 23,866.3 988.2 88,636.2 112,502.5 90,531.8 115,386.32017 44,012.7 8,104.1 35,908.7 -27,879.9 -45,444.5 17,564.5 68,158.9 11,213.7 56,945.1 83,921.9 80,188.1 42,741.8 23,986.1 398.5 86,754.6 110,740.7 88,337.0 112,721.52018 44,976.8 7,941.2 37,035.6 -26,287.5 -44,276.0 17,988.5 71,180.2 11,292.6 59,887.6 82,920.6 82,836.4 44,449.0 24,416.5 906.0 89,425.8 113,842.4 90,886.5 116,209.02019 43,036.7 4,782.3 38,254.4 -20,149.8 -34,138.5 13,988.7 75,037.5 12,586.5 62,451.0 48,574.4 60,425.5 46,438.5 24,223.6 656.0 89,475.2 113,698.8 91,251.8 116,131.0
2015 II 44,358.4 7,079.7 37,278.8 -32,439.6 -48,931.9 16,492.3 60,707.2 10,274.4 50,432.8 87,826.0 71,735.2 40,800.2 22,045.7 531.5 85,158.6 107,204.3 86,787.6 109,364.8 III 43,862.5 7,375.4 36,487.1 -36,348.0 -51,352.9 15,004.9 63,602.2 12,607.9 50,994.3 85,303.0 68,694.8 41,610.7 21,261.7 457.8 85,473.1 106,734.8 87,548.3 109,257.8 IV 44,254.0 7,649.8 36,604.2 -41,801.6 -56,726.4 14,924.7 64,112.0 11,633.8 52,478.2 85,203.3 63,259.7 41,616.6 22,249.7 593.6 85,870.5 108,120.3 87,533.9 110,367.2
2016 I 45,151.3 7,606.8 37,544.5 -35,476.1 -51,606.4 16,130.3 64,466.5 11,505.3 52,961.2 81,997.9 65,837.0 42,171.1 23,695.1 501.7 87,322.3 111,017.4 88,975.4 113,063.8 II 44,503.4 7,548.1 36,955.3 -34,738.3 -53,747.4 19,009.1 64,047.6 11,210.7 52,836.9 86,364.1 71,170.0 43,808.9 24,367.4 466.8 88,312.3 112,679.7 90,341.5 115,032.7 III 43,577.5 7,614.1 35,963.4 -28,585.4 -48,112.9 19,527.5 64,492.3 11,454.9 53,037.4 87,242.5 79,571.8 43,125.5 23,370.7 678.6 86,703.0 110,073.7 88,438.0 112,487.3 IV 45,383.8 7,846.6 37,537.2 -31,113.8 -50,680.5 19,566.7 65,950.0 11,760.6 54,189.4 87,670.2 77,122.6 43,252.4 23,866.3 988.2 88,636.2 112,502.5 90,531.8 115,386.3
2017 I 44,001.6 7,854.2 36,147.4 -30,348.3 -49,239.4 18,891.1 65,827.0 11,427.4 54,399.6 85,844.3 77,321.5 43,089.2 24,040.2 1,002.7 87,090.8 111,130.9 89,089.0 114,131.9 II 44,185.3 7,894.6 36,290.7 -32,436.4 -51,420.2 18,983.7 65,556.9 10,953.9 54,603.1 82,946.7 71,881.9 42,110.0 23,784.0 942.4 86,295.3 110,079.3 87,913.8 112,640.3 III 42,842.7 7,805.0 35,037.7 -28,225.7 -46,920.0 18,694.4 65,974.5 10,766.8 55,207.7 82,806.9 77,713.0 42,515.5 23,575.0 399.2 85,358.2 108,933.2 86,979.0 110,953.1 IV 44,012.7 8,104.1 35,908.7 -27,879.9 -45,444.5 17,564.5 68,158.9 11,213.7 56,945.1 83,921.9 80,188.1 42,741.8 23,986.1 398.5 86,754.6 110,740.7 88,337.0 112,721.5
2018 I 43,251.7 7,889.3 35,362.4 -31,263.5 -47,083.0 15,819.5 69,070.4 11,264.7 57,805.7 82,334.9 76,890.1 43,137.6 23,483.5 478.2 86,389.2 109,872.7 87,956.1 111,917.7 II 43,157.4 7,811.2 35,346.2 -30,249.6 -45,590.4 15,340.8 68,560.1 10,306.4 58,253.7 80,771.0 75,924.0 42,645.1 23,342.6 568.7 85,802.5 109,145.1 87,311.9 111,223.2 III 44,429.7 7,722.4 36,707.3 -25,439.8 -41,400.9 15,961.1 69,230.5 10,443.5 58,787.0 76,904.8 76,265.8 42,074.9 22,934.7 777.4 86,504.6 109,439.3 88,015.3 111,727.4 IV 44,976.8 7,941.2 37,035.6 -26,287.5 -44,276.0 17,988.5 71,180.2 11,292.6 59,887.6 82,920.6 82,836.4 44,449.0 24,416.5 906.0 89,425.8 113,842.4 90,886.5 116,209.0
2019 I 43,591.9 7,699.2 35,892.7 -28,770.1 -46,314.0 17,543.9 71,545.8 11,151.2 60,394.6 46,522.3 45,706.1 44,830.1 23,530.7 802.6 88,422.0 111,952.7 89,757.3 114,056.6 II 43,642.5 7,908.4 35,734.1 -25,913.4 -40,254.9 14,341.5 72,077.8 11,362.0 60,715.8 49,058.6 51,580.5 43,953.8 25,152.4 838.2 87,596.3 112,748.6 89,199.3 115,189.5 III 44,332.7 7,764.7 36,568.0 -23,745.9 -37,831.2 14,085.3 73,607.0 12,312.9 61,294.1 50,471.8 56,000.1 43,854.7 24,828.4 778.6 88,187.4 113,015.8 90,209.7 115,816.4 IV 43,036.7 4,782.3 38,254.4 -20,149.8 -34,138.5 13,988.7 75,037.5 12,586.5 62,451.0 48,574.4 60,425.5 46,438.5 24,223.6 656.0 89,475.2 113,698.8 91,251.8 116,131.0
2020 I 44,642.8 5,412.4 39,230.4 -27,430.2 -44,898.8 17,468.6 74,837.4 12,416.4 62,421.0 52,016.7 54,781.2 46,727.6 24,261.8 601.4 91,370.3 115,632.1 92,851.6 117,658.3 II p 45,706.8 6,325.6 39,381.3 -23,049.6 -39,558.8 16,509.2 73,588.9 12,207.1 61,381.7 51,839.9 56,672.3 47,568.2 23,854.5 633.0 93,275.0 117,129.5 94,915.3 119,346.7
SOURCE: Central Bank of Trinidad and Tobago.
1 This refers to commercial banks foreign currency deposits.2 See article on ‘The Floating Exchange Rate - Some Statistical and Other Issues’ December 1993, QEB.3 See article on ’The Floating Exchange Rate - Some Statistical and Other Issues’ December 1997, QEB.

� � � � � � � � � � � � � � � � �� � � � � � � � � � � � � � � � � ��� � �� ��� � �� � � �! " #� $ � % #� � & �� � � # '( )� * # � #+ # �� � , " - � � � � �! " #� $� % #� � & �� � � # & � . / � � � � # *01 2 34 56 27 01 2 34 8 6 2 4 6 9 : ;1 <= ;> : 21 2 ? :1 9@A 4 <= B 8 6 2 4C B = D 8 D= ; : < E= 1 9F 4 <1 <= G 6 D <H 1 H = I 6 1 2 4 I6 1 2 4 <6 0C 4 : 2 = 4 4 > : D B 42015
JK L M K N JK L O K P O K N QK N2016
RK L 7 S K N S K S JK J RK R TK S2017
M K L 7 TK Q RK J M K L O K T L K S2018
RK L PK R RK S JK T JK J TK Q2019
RK M M K N RK J JK L L Q K M 7 M K Q2015 I
JK L M K T JK T O K O N K M L K P II
M K J M K P M K P P K N N K P QK M III
M K O PK P M K N O K J P K S RK R IV
JK L M K N JK L O K P O K N QK N
2016 I
JK Q JK S JK Q O K O O K M S K J
II
M K T QK S RK P N K S P K Q 7 L K L
III
RK L 7 QK T S K M P K J JK Q 7 L K N
IV
RK L 7 S K N S K S JK J RK R TK S
2017 I
S K R 7 RK J QK J M K O RK S 7 TK P
II
S K M 7 S K J QK O S K O RK P L K O
III
RK L 7 L K N S K J RK M JK P TK R
IV
M K L 7 TK Q RK J M K L O K T L K S
2018 I
JK S L K J M K N JK M P K P S K O
II
M K N RK O M K O P K R O K N L K L
III
M K N JK M M K N P K Q P K R S K Q
IV
RK L PK R RK S JK T JK J TK Q
2019 I
S K R M K R S K M JK T O K O 7 RK S
II
RK T PK S RK Q JK P O K O 7 S K O
III
S K N O K Q RK S M K N L TK N 7 M K M
IV
RK M M K N RK J JK L L Q K M 7 M K Q
2020 I
S K S PK Q S K J M K Q L TK L 7 M K P
II p
L K S 7 TK P L K L L K N P K P 7 JK LUV W X Y Z [ \ Z ] ^ X _ `a _ ] b V cd X e ] e f _ f _ ] f d V g _ hVi

PeriodEnding
3 4
1
2
TABLE 18 COMMERCIAL BANKS - SELECTED DATA Jul 2020
/TT$ Mn/
Investments Deposits Liabilities (adj)Total Central Deposits Foreign Balances Loan/ Investment/ Cash/Loans Government Other Special Liabilities Demand Saving Time Currency with the Deposit Deposit Deposit
(Gross) Investments Securities Investments Deposits (adj) Deposits Deposits Deposits Deposits Central Bank Ratio Ratio Ratio1 2 3 4 5 6 7 8 9 10 11 12 13 14
2015 62,749.6 34,361.1 14,830.9 15,462.0 4,068.3 100,470.5 36,604.2 31,886.9 9,729.6 22,249.7 21,993.5 62.5 34.2 19.32016 64,218.6 37,647.1 19,819.2 14,701.0 3,126.9 104,655.9 37,537.2 32,630.2 10,622.2 23,866.3 18,881.1 61.4 36.0 16.52017 67,244.5 34,907.3 17,706.9 15,630.6 1,569.8 102,636.6 35,908.7 32,578.3 10,163.5 23,986.1 16,994.6 65.5 34.0 16.32018 70,236.3 34,450.7 18,446.6 16,004.1 1,570.6 105,901.1 37,035.6 34,218.0 10,231.1 24,416.5 15,903.3 66.3 32.5 16.42019 75,818.8 31,112.7 14,491.0 16,621.7 0.0 108,916.5 38,254.4 34,967.6 11,470.9 24,223.6 18,237.8 69.6 28.6 20.4
2015 II 59,824.3 38,877.2 16,382.4 14,943.7 7,551.1 100,124.6 37,278.8 31,082.7 9,717.5 22,045.7 24,145.5 59.7 38.8 17.6III 62,791.0 37,637.2 14,918.3 15,143.8 7,575.1 99,359.4 36,487.1 31,851.2 9,759.5 21,261.7 22,754.3 63.2 37.9 16.4IV 62,749.6 34,361.1 14,830.9 15,462.0 4,068.3 100,470.5 36,604.2 31,886.9 9,729.6 22,249.7 21,993.5 62.5 34.2 19.3
2016 I 63,343.1 34,405.9 15,995.7 14,312.0 4,098.2 103,410.7 37,544.5 32,300.9 9,870.2 23,695.1 21,284.1 61.3 33.3 17.8II 62,780.8 35,943.6 19,030.6 13,777.8 3,135.2 105,131.6 36,955.3 32,435.3 11,373.7 24,367.4 21,765.1 59.7 34.2 18.7III 62,677.1 37,131.8 19,550.4 14,489.2 3,092.2 102,459.6 35,963.4 32,362.3 10,763.2 23,370.7 19,477.3 61.2 36.2 17.0IV 64,218.6 37,647.1 19,819.2 14,701.0 3,126.9 104,655.9 37,537.2 32,630.2 10,622.2 23,866.3 18,881.1 61.4 36.0 16.5
2017 I 63,984.5 36,018.3 19,133.4 15,301.3 1,583.7 103,276.7 36,147.4 32,915.0 10,174.2 24,040.2 18,693.1 62.0 34.9 17.5II 63,934.4 35,715.4 19,224.3 14,900.4 1,590.8 102,184.7 36,290.7 32,490.2 9,619.8 23,784.0 17,134.2 62.6 35.0 16.3III 64,607.1 36,041.2 18,773.4 15,699.6 1,568.2 101,128.2 35,037.7 32,479.0 10,036.6 23,575.0 16,308.7 63.9 35.6 15.6IV 67,244.5 34,907.3 17,706.9 15,630.6 1,569.8 102,636.6 35,908.7 32,578.3 10,163.5 23,986.1 16,994.6 65.5 34.0 16.3
2018 I 68,084.4 33,415.9 16,086.9 15,745.4 1,583.6 101,983.4 35,362.4 32,715.4 10,422.2 23,483.5 16,616.0 66.8 32.8 15.8II 66,572.8 35,020.1 15,956.7 17,485.3 1,578.0 101,333.9 35,346.2 32,723.0 9,922.1 23,342.6 17,388.1 65.7 34.6 16.6III 67,074.7 33,798.6 16,484.8 17,313.8 1,570.6 101,716.9 36,707.3 32,601.8 9,473.1 22,934.7 17,283.4 65.9 33.2 18.0IV 70,236.3 34,450.7 18,446.6 16,004.1 0.0 105,901.1 37,035.6 34,218.0 10,231.1 24,416.5 15,903.3 66.3 32.5 16.4
2019 I 70,758.1 34,528.0 18,351.1 16,176.9 0.0 104,253.5 35,892.7 34,471.3 10,358.8 23,530.7 15,661.7 67.9 33.1 16.2II 71,172.4 30,969.9 14,947.6 16,022.3 0.0 104,840.2 35,734.1 34,081.8 9,872.0 25,152.4 17,574.7 67.9 29.5 17.8III 73,445.0 31,501.5 14,537.2 16,964.3 0.0 105,251.1 36,568.0 33,600.4 10,254.3 24,828.4 18,516.1 69.8 29.9 18.6IV 75,818.8 31,112.7 14,491.0 16,621.7 0.0 108,916.5 38,254.4 34,967.6 11,470.9 24,223.6 18,237.8 69.6 28.6 20.4
2020 I 76,172.4 33,324.4 18,121.4 15,203.1 0.0 110,219.8 39,230.4 35,021.2 11,706.4 24,261.8 16,549.6 69.1 30.2 16.5II p 75,262.8 33,204.3 16,909.9 16,294.5 0.0 110,803.9 39,381.3 36,630.9 10,937.2 23,854.5 19,225.2 67.9 30.0 18.5
SOURCE: Central Bank of Trinidad and Tobago.
1 Demand Deposit (adj) - Total demand deposits minus non-residents’ and Central Government’s demand deposits, cash items in the process of collection on other banks, and bank clearings, plus cashiers cheques and branch clearings. Time and Savings Deposits (adj) - Total Time or Savings deposits minus Central Government’s deposits and deposits of non-residents. Foreign Currency Deposits (adj) - Total Demand, Savings and Time Deposits in foreign currency minus those of non-residents.2 Effective August 02, 2018, the Central Bank of Trinidad and Tobago eliminated the 2.0 per cent secondary reserve requirement on commercial banks’ prescribed liabilities.3 Includes required reserves and other balances held at the Central Bank, such as requested fixed deposits. Effective March 14, 2017, all fixed deposits have matured. Additionally, a secondary reserve requirement equivalent to 2.0 per cent of prescribed liabilities became effective October 04, 2006. Effective August 02, 2018, the Central Bank eliminated the 2.0 per cent secondary reserve requirement.4 Cash: Includes Local Cash in Hand plus Primary Reserve Balances held at the Central Bank.
u v w x w y v x z { | { } ~ �

PeriodEnding
TABLE 19A COMMERCIAL BANKS : OUTSTANDING LOANS TO BUSINESSES - PRIVATE SECTOR Jul 2020
/TT$Mn/
Production Manufacturing: Of Which:
Textiles PrintingFood Garments Publishing Wood & Chemicals Type Misc.
Produc Agri- Petro- Manufac- Drink Footwear & Paper Related & Non-Metallic & Related Manufac- Construc--tion culture leum turing & Tobacco & Headwear Converters Products Materials Industries turing tion
1 2 3 4 5 6 7 8 9 10 11 12
2015 7,054.4 73.3 1,034.6 3,565.8 867.1 246.1 411.3 90.1 807.9 483.2 660.0 2,380.72016 7,394.4 83.1 817.1 4,193.3 715.2 241.5 266.2 84.6 1,643.0 486.2 756.6 2,301.02017 6,117.7 150.4 579.2 3,911.2 491.6 163.7 336.9 104.3 1,486.2 372.0 956.5 1,477.02018 5,560.8 171.9 583.5 3,495.2 614.8 151.6 379.2 127.4 960.6 392.3 869.3 1,310.22019 5,892.8 171.2 612.3 3,857.7 780.7 106.8 316.4 135.1 1,402.1 310.6 806.0 1,251.5
2015 II 7,017.6 73.5 1,021.7 3,597.7 929.2 259.9 421.3 154.5 851.6 633.8 347.4 2,324.7III 6,766.4 69.3 1,025.5 3,303.1 867.5 263.4 319.1 88.2 570.6 466.3 728.1 2,368.6IV 7,054.4 73.3 1,034.6 3,565.8 867.1 246.1 411.3 90.1 807.9 483.2 660.0 2,380.7
2016 I 7,346.6 78.7 1,006.2 3,895.3 663.3 259.2 485.0 89.6 998.0 564.0 836.3 2,366.5II 7,452.4 70.7 877.1 4,187.2 769.6 263.1 428.0 91.7 1,354.6 551.9 728.4 2,317.3III 7,307.6 118.7 928.8 4,018.1 800.6 251.7 273.1 92.3 1,353.3 529.9 717.2 2,242.1IV 7,394.4 83.1 817.1 4,193.3 715.2 241.5 266.2 84.6 1,643.0 486.2 756.6 2,301.0
2017 I 6,863.3 73.8 769.9 4,356.3 698.4 252.1 318.7 89.0 1,594.9 489.6 913.7 1,663.3II 6,476.4 77.0 664.9 4,222.5 578.1 267.5 335.2 88.8 1,552.5 461.8 938.5 1,511.9III 6,273.0 80.9 668.1 4,068.1 556.9 275.6 336.8 92.8 1,523.7 383.2 899.1 1,455.9IV 6,117.7 150.4 579.2 3,911.2 491.6 163.7 336.9 104.3 1,486.2 372.0 956.5 1,477.0
2018 I 5,998.4 78.7 548.7 3,914.6 541.5 188.4 328.7 95.4 1,447.0 407.2 906.3 1,456.5II 5,234.3 81.7 433.2 3,311.8 574.6 156.0 348.2 111.3 788.6 402.6 930.4 1,407.7III 5,541.9 178.5 527.5 3,470.2 546.0 170.1 353.0 118.8 968.3 392.2 921.8 1,365.6IV 5,560.8 171.9 583.5 3,495.2 614.8 151.6 379.2 127.4 960.6 392.3 869.3 1,310.2
2019 I 5,950.8 240.9 638.6 3,763.1 644.0 144.3 376.2 139.1 1,132.9 380.4 946.2 1,308.2II 5,880.2 246.4 589.5 3,699.7 764.4 121.7 364.8 146.6 1,044.3 377.1 880.9 1,344.6III 6,097.3 201.3 532.8 4,049.6 827.2 123.4 341.3 146.7 1,368.3 408.9 833.8 1,313.6IV 5,892.8 171.2 612.3 3,857.7 780.7 106.8 316.4 135.1 1,402.1 310.6 806.0 1,251.5
2020 I 5,912.8 136.3 632.1 3,861.2 860.1 116.7 306.6 131.0 1,387.6 306.7 752.5 1,283.3II p 5,979.4 141.2 709.9 3,891.7 962.0 108.3 298.8 127.3 1,404.8 293.9 696.5 1,236.7
SOURCE: Central Bank of Trinidad and Tobago.
� � � � � � � � � � � � � � �Assembly-

PeriodEnding
, 1
TABLE 19B COMMERCIAL BANKS : OUTSTANDING LOANS TO BUSINESSES - PRIVATE SECTOR Jul 2020
/TT$Mn/
ServicesFinance Education Leasing
Hotels Transport Insurance Cultural & Real& Guest Storage & Real Electricity & Community Personal Estate
Services Distribution Houses & Communication Estate & Water Services Services Mortgage Total13 14 15 16 17 18 19 20 21 22
2015 12,323.1 3,754.6 731.1 691.2 6,053.5 465.1 124.8 502.7 5,419.8 24,797.32016 12,714.2 3,684.9 815.2 573.3 6,510.8 432.9 118.0 579.0 5,702.0 25,810.62017 14,843.1 3,843.5 1,033.0 643.5 7,935.8 473.0 126.9 787.4 6,269.1 27,229.92018 16,046.6 3,876.6 904.6 891.0 8,537.3 394.5 140.3 1,302.4 6,930.7 28,538.12019 16,326.8 4,068.3 1,649.5 938.5 7,735.0 423.8 128.7 1,383.1 7,903.0 30,122.6
2015 II 12,755.9 3,509.0 873.5 700.4 6,285.1 743.9 138.7 505.3 5,089.9 24,863.5III 12,856.2 3,735.7 794.3 715.6 6,310.4 663.6 154.2 482.4 5,189.5 24,812.2IV 12,323.1 3,754.6 731.1 691.2 6,053.5 465.1 124.8 502.7 5,419.8 24,797.3
2016 I 12,726.0 3,605.6 712.6 691.9 6,684.5 456.9 125.6 448.9 5,509.9 25,582.5II 12,486.1 3,590.0 700.5 621.0 6,548.0 440.8 130.6 455.2 5,575.2 25,513.7III 12,363.6 3,720.6 731.7 614.3 6,209.3 429.7 115.1 542.8 5,612.9 25,284.1IV 12,714.2 3,684.9 815.2 573.3 6,510.8 432.9 118.0 579.0 5,702.0 25,810.6
2017 I 13,472.4 3,719.6 951.0 712.0 6,931.8 418.2 124.2 615.7 5,715.3 26,051.0II 13,883.4 3,651.1 974.2 653.0 7,428.1 402.8 141.5 632.8 5,772.3 26,132.1III 14,000.3 3,863.8 942.1 634.2 7,326.2 475.3 126.1 632.6 5,999.7 26,273.0IV 14,843.1 3,843.5 1,033.0 643.5 7,935.8 473.0 126.9 787.4 6,269.1 27,229.9
2018 I 15,727.2 3,863.7 1,022.3 844.4 8,336.6 457.5 127.5 1,075.2 6,312.6 28,038.2II 16,011.5 3,924.3 1,011.0 860.0 8,564.6 439.9 132.8 1,078.9 6,586.4 27,832.2III 15,579.5 3,910.4 956.0 870.4 8,071.2 421.9 130.6 1,218.8 6,879.9 28,001.3IV 16,046.6 3,876.6 904.6 891.0 8,537.3 394.5 140.3 1,302.4 6,930.7 28,538.1
2019 I 15,672.1 4,049.2 962.3 802.9 8,008.2 378.4 140.1 1,331.0 7,197.4 28,820.2II 15,402.5 4,041.8 962.3 786.6 7,687.5 310.5 148.7 1,465.2 7,433.2 28,715.9III 15,632.7 4,043.0 1,413.6 749.2 7,494.0 340.6 141.0 1,451.4 7,557.5 29,287.5IV 16,326.8 4,068.3 1,649.5 938.5 7,735.0 423.8 128.7 1,383.1 7,903.0 30,122.6
2020 I 16,633.0 3,873.2 1,633.8 1,019.6 8,187.4 403.4 131.2 1,384.4 7,985.9 30,531.7II p 15,925.6 3,891.0 1,644.9 957.6 7,560.9 381.1 129.6 1,360.5 7,943.4 29,848.5
SOURCE: Central Bank of Trinidad and Tobago.
1 Includes a small portion of loans which are unclassified.
� � � � � � � � � � � � � � �

PeriodEnding
1 2
TABLE 20 COMMERCIAL BANKS : OUTSTANDING LOANS TO BUSINESSES - PUBLIC SECTOR Jul 2020
/TT$Mn/
Production ServicesManufacturing: Of Which
Printing Assembly All Transport Finance Leasing &Food Publishing Chemicals & -Type Other Storage & Insurance All Real Central
Produc Agri Manufact- Drinnk & & Paper Non-Metallic & Related Manufac- Construc Electricty Total Communic & Real Other Estate & Local-tion culture Petro-leum uring Tobacco Converters Materials Industries turing tion & Water Services -ation Estate Services Mortgage Gov’t Total
2 3 4 5 6 7 8 9 10 11 12 13 14 15 16 17 1 18
2015 4,059.3 0.0 660.2 307.4 73.7 0.0 228.0 0.0 5.7 3,091.7 3,022.8 6,389.2 1,223.2 2,025.7 3,140.3 0.0 375.0 10,823.52016 3,191.7 0.0 1,545.4 62.7 62.7 0.0 0.0 0.0 0.0 1,583.6 2,538.0 6,213.7 1,120.5 2,555.2 2,538.0 0.1 215.8 9,621.32017 2,946.1 0.7 1,553.4 0.0 0.0 0.0 0.0 0.0 0.0 1,391.9 2,638.0 6,337.4 1,177.6 2,521.8 2,638.0 0.0 376.6 9,660.02018 4,383.7 29.3 2,995.4 0.0 0.0 0.0 0.0 0.0 0.0 1,359.0 1,044.8 4,877.2 1,244.0 2,500.7 1,132.5 0.0 632.2 9,893.12019 3,674.0 29.3 3,114.2 0.0 0.0 0.0 0.0 0.0 0.0 530.5 1,067.8 6,854.0 640.2 4,457.0 1,756.8 0.0 556.5 11,084.5
2015 II 4,293.3 0.0 683.6 251.6 0.0 0.0 246.0 0.0 5.6 3,358.1 1,182.2 4,723.6 1,199.6 2,075.6 1,448.3 0.0 573.3 9,590.3III 4,273.2 0.0 683.6 309.5 79.5 0.0 225.5 0.0 4.4 3,280.1 3,564.0 7,223.3 1,169.0 2,214.4 3,839.9 0.0 530.5 12,027.0IV 4,059.3 0.0 660.2 307.4 73.7 0.0 228.0 0.0 5.7 3,091.7 3,022.8 6,389.2 1,223.2 2,025.7 3,140.3 0.0 375.0 10,823.5
2016 I 3,956.0 0.0 676.9 290.9 72.9 0.0 211.9 0.0 6.1 2,988.2 2,884.7 6,196.6 1,152.0 2,085.0 2,959.6 0.6 378.0 10,531.3II 3,119.5 0.0 1,213.4 252.1 38.3 0.0 213.9 0.0 0.0 1,654.0 2,878.0 6,244.2 1,147.7 2,218.3 2,878.2 0.4 238.3 9,602.4III 3,120.8 0.0 1,419.7 49.2 49.2 0.0 0.0 0.0 0.0 1,651.9 2,448.0 6,146.4 1,123.8 2,574.4 2,448.2 0.2 197.0 9,464.5IV 3,191.7 0.0 1,545.4 62.7 62.7 0.0 0.0 0.0 0.0 1,583.6 2,538.0 6,213.7 1,120.5 2,555.2 2,538.0 0.1 215.8 9,621.3
2017 I 2,948.3 0.0 1,738.9 0.0 0.0 0.0 0.0 0.0 0.0 1,209.4 2,464.2 5,989.0 1,092.6 2,432.2 2,464.2 0.0 188.3 9,125.6II 2,776.9 0.0 1,555.0 0.0 0.0 0.0 0.0 0.0 0.0 1,221.8 2,442.1 5,947.4 1,084.7 2,420.6 2,442.1 0.0 179.9 8,904.2III 2,607.0 0.0 1,362.9 0.0 0.0 0.0 0.0 0.0 0.0 1,244.2 2,505.5 6,099.2 1,039.9 2,553.8 2,505.6 0.0 193.8 8,900.1IV 2,946.1 0.7 1,553.4 0.0 0.0 0.0 0.0 0.0 0.0 1,391.9 2,638.0 6,337.4 1,177.6 2,521.8 2,638.0 0.0 376.6 9,660.0
2018 I 3,202.6 1.0 1,869.4 0.0 0.0 0.0 0.0 0.0 0.0 1,332.2 2,465.4 5,928.7 1,234.6 2,228.7 2,465.4 0.0 269.4 9,400.6II 3,232.3 0.9 1,900.0 0.0 0.0 0.0 0.0 0.0 0.0 1,331.5 932.2 4,336.0 1,236.0 2,167.7 932.2 0.0 171.7 7,740.1III 3,689.0 29.3 2,270.9 0.0 0.0 0.0 0.0 0.0 0.0 1,388.9 1,004.0 3,952.8 1,242.7 1,618.3 1,091.7 0.0 70.0 7,711.8IV 4,383.7 29.3 2,995.4 0.0 0.0 0.0 0.0 0.0 0.0 1,359.0 1,044.8 4,877.2 1,244.0 2,500.7 1,132.5 0.0 632.2 9,893.1
2019 I 4,344.2 29.3 2,988.6 0.0 0.0 0.0 0.0 0.0 0.0 1,326.3 967.7 4,798.3 1,332.9 2,410.1 1,055.4 0.0 791.4 9,934.0II 3,667.0 29.3 3,047.9 0.0 0.0 0.0 0.0 0.0 0.0 589.8 1,086.3 5,543.8 1,300.5 3,069.3 1,174.0 0.0 577.4 9,788.1III 3,819.8 29.6 3,285.1 0.0 0.0 0.0 0.0 0.0 0.0 505.1 994.7 6,347.7 867.6 3,896.5 1,583.6 0.0 543.6 10,711.1IV 3,674.0 29.3 3,114.2 0.0 0.0 0.0 0.0 0.0 0.0 530.5 1,067.8 6,854.0 640.2 4,457.0 1,756.8 0.0 556.5 11,084.5
2020 I 3,904.7 29.3 3,091.6 0.0 0.0 0.0 0.0 0.0 0.0 783.8 857.2 6,465.2 633.9 4,197.4 1,633.9 0.0 523.0 10,892.8II
p 3,823.1 29.3 2,921.3 0.0 0.0 0.0 0.0 0.0 0.0 872.6 965.4 6,668.0 588.9 4,424.8 1,654.3 0.0 622.1 11,113.2
SOURCE: Central Bank of Trinidad and Tobago.
1 Includes loans for Textiles, Garments, Footwear & Headwear, Wood & Related Products and Miscellaneous Manufacturing.2 Includes loans for Distribution, Hotels & Guest Houses, Education, Cultural & Community Services, Electricity & Water, Personal Services and a small portion of loans that are unclassified.
� ¡ ¡ ¢ £ � ¤ ¥ ¦ § ¥ © ª

PeriodEnding 2 2
TABLE 21 LOANS OUTSTANDING BY PURPOSE - CONSUMERS 1 Jul 2016
/TT$Mn/
Insurance RealLand Home & Repairs to Domestic Purchase of Insurance Consolid Misc. Estate
Bridging & Real Improvement Motor Motor Appliances Financial & Professional Re- -ation of Personal Other MortgageFinance Estate /Renovation Vehicles Vehicles & Furnishings Assets Education Medical Travel Services financing Debt Services Purposes Loans Total
1 2 3 4 5 6 7 8 9 10 11 12 13 14 15 16 17
2015 338.7 671.2 1,737.2 3,807.6 23.0 104.9 362.3 350.4 53.7 106.1 61.7 1,834.7 1,652.0 196.5 4,464.5 11,958.9 27,503.82016 314.8 694.5 1,765.6 4,079.7 16.3 98.5 322.0 348.2 57.5 105.0 60.1 1,933.0 1,816.2 211.7 4,893.0 12,513.4 29,001.62017 328.3 624.3 1,777.5 4,210.9 13.8 89.6 359.7 316.4 55.9 98.7 52.4 2,133.1 2,109.4 239.9 5,162.3 13,412.6 30,731.12018 299.7 609.8 1,813.2 4,187.3 10.4 81.8 359.2 312.3 59.6 91.0 44.9 2,374.3 2,487.7 280.1 5,628.2 14,088.3 32,437.32019 252.4 610.0 1,856.5 4,314.6 9.7 78.4 360.4 303.4 68.1 85.7 38.2 2,593.4 2,758.3 360.6 6,069.0 15,780.0 35,168.1
2015 II 371.0 684.5 1,635.8 3,441.0 27.6 103.1 297.1 339.1 53.8 96.6 72.5 1,686.5 1,583.0 183.4 4,137.5 11,442.3 25,943.9III 365.9 692.1 1,640.5 3,585.1 13.5 93.9 318.6 348.4 53.1 102.8 56.9 1,664.1 1,593.0 178.4 4,260.3 11,707.4 26,482.3IV 338.7 671.2 1,737.2 3,807.6 23.0 104.9 362.3 350.4 53.7 106.1 61.7 1,834.7 1,652.0 196.5 4,464.5 11,958.9 27,503.8
2016 I 351.6 672.7 1,727.4 3,851.8 21.2 100.9 329.8 345.1 56.6 104.7 59.7 1,794.3 1,682.8 188.6 4,436.0 12,093.9 27,607.3II 331.3 674.9 1,716.7 3,903.5 20.3 98.9 298.0 336.3 55.1 107.5 59.2 1,771.6 1,665.2 177.7 4,690.5 12,194.4 27,903.1III 335.7 660.2 1,692.8 3,941.3 16.4 95.4 275.9 343.9 57.4 109.0 61.7 1,754.4 1,709.2 174.4 4,742.3 12,346.3 28,125.6IV 314.8 694.5 1,765.6 4,079.7 16.3 98.5 322.0 348.2 57.5 105.0 60.1 1,933.0 1,816.2 211.7 4,893.0 12,513.4 29,001.6
2017 I 302.8 694.0 1,737.1 4,078.6 15.4 93.1 305.9 333.2 57.4 99.5 59.2 1,879.5 1,850.9 209.5 4,835.6 12,669.2 28,996.1II 287.5 686.7 1,710.4 4,072.6 14.2 87.8 286.7 330.0 56.0 98.8 57.5 1,841.3 1,872.0 197.1 4,840.9 12,849.6 29,078.0III 302.2 635.8 1,700.3 4,114.1 14.3 85.7 265.4 333.5 56.6 103.7 55.3 1,855.7 1,923.0 201.6 5,011.9 13,184.8 29,627.9IV 328.3 624.3 1,777.5 4,210.9 13.8 89.6 359.7 316.4 55.9 98.7 52.4 2,133.1 2,109.4 239.9 5,162.3 13,412.6 30,731.1
2018 I 316.0 620.3 1,757.3 4,210.6 13.1 84.7 327.3 323.5 54.5 92.8 51.4 2,160.0 2,159.7 238.2 5,249.2 13,507.9 30,915.0II 303.1 615.3 1,760.4 4,176.7 12.6 82.2 308.9 313.9 56.4 95.9 49.3 2,165.8 2,218.8 236.9 5,284.7 13,740.8 31,172.3III 310.4 612.5 1,742.6 4,140.7 11.5 80.9 286.5 320.3 57.7 95.6 47.4 2,170.6 2,287.2 256.0 5,493.7 13,785.6 31,431.7IV 299.7 609.8 1,813.2 4,187.3 10.4 81.8 359.2 312.3 59.6 91.0 44.9 2,374.3 2,487.7 280.1 5,628.2 14,088.3 32,437.3
2019 I 290.9 623.0 1,801.0 4,193.6 9.7 83.6 338.9 305.2 59.0 88.3 41.8 2,388.5 2,537.2 314.6 5,657.0 14,387.4 32,795.3II 287.2 634.2 1,789.3 4,191.0 9.1 78.1 316.8 295.4 60.8 88.5 40.4 2,388.6 2,573.0 315.9 5,806.1 14,696.3 33,245.7III 267.3 593.8 1,769.4 4,208.2 9.4 74.9 302.1 300.8 65.7 88.0 39.8 2,384.7 2,613.6 309.2 5,908.9 15,373.0 33,990.0IV 252.4 610.0 1,856.5 4,314.6 9.7 78.4 360.4 303.4 68.1 85.7 38.2 2,593.4 2,758.3 360.6 6,069.0 15,780.0 35,168.1
2020 I 231.4 617.5 1,823.6 4,336.3 9.5 76.6 345.0 298.5 68.9 81.2 36.7 2,562.9 2,755.4 342.1 6,062.6 15,974.2 35,270.8II
p 201.5 595.9 1,777.5 4,260.2 9.4 75.0 326.7 291.7 67.5 77.5 36.2 2,518.3 2,747.4 335.5 5,879.8 16,067.9 34,923.2
SOURCE: Central Bank of Trinidad and Tobago.
1 Data are shown gross i.e inclusive of provision for loan losses.2 Included in Other Purposes category.
� � � � � � � � � � � � �

PeriodEnding
1
2 3 4
TABLE 22 COMMERCIAL BANKS LIQUID ASSETS Jul 2020
/Percentage of Prescribed Liabilities (unless otherwise stated)/
Reserve Position Liquid AssetsDeposits at Central Bank
PrescribedDeposits Required Cash Excess (+) or Excess (+) or Cash Special Total Local Cash Treasury
Liabilities (Adj.) Reserves Reserves Shortage (-) Shortage (-) Reserves Deposits Deposits in Hand Bills1 2 3 4 5 6 7 8 9 10
2015 78,413.1 17.0 22.9 5.9 3,367.8 22.9 5.2 28.1 1.8 0.42016 81,346.7 17.0 19.2 2.4 3,985.2 19.2 3.8 23.1 1.9 0.12017 78,489.4 17.0 19.8 2.9 2,982.7 19.8 2.0 21.8 1.7 0.72018 80,893.4 17.0 19.9 2.9 3,499.3 19.9 2.0 19.9 1.8 0.42019 84,655.6 17.0 24.6 7.6 5,453.5 24.6 0.0 24.6 4.7 2.9
2015 II 77,555.9 17.0 21.4 4.4 3,227.6 21.4 9.7 31.1 1.3 0.3III 78,754.9 17.0 19.3 2.3 3,278.1 19.3 9.6 28.9 1.4 0.3IV 78,413.1 17.0 22.9 5.9 3,367.8 22.9 5.2 28.1 1.8 0.4
2016 I 79,912.4 17.0 21.3 4.3 3,853.5 21.3 5.1 26.4 1.5 0.4II 81,762.3 17.0 22.6 5.6 5,644.7 22.6 3.8 26.4 1.3 0.3III 79,612.4 17.0 20.6 3.6 3,150.6 20.6 3.9 24.5 1.3 0.1IV 81,346.7 17.0 19.2 2.4 3,985.2 19.2 3.8 23.1 1.9 0.1
2017 I 79,182.4 17.0 21.7 4.6 4,299.5 21.7 2.0 23.7 1.2 0.2II 79,538.8 17.0 19.5 2.6 2,755.6 19.5 2.0 21.5 1.4 1.0III 78,410.5 17.0 19.1 2.0 2,403.7 19.1 2.0 21.1 1.4 1.2IV 78,489.4 17.0 19.8 2.9 2,982.7 19.8 2.0 21.8 1.7 0.7
2018 I 79,180.9 17.0 19.0 1.9 2,656.0 19.0 2.0 21.0 1.3 1.0II 78,901.2 17.0 20.1 2.8 2,751.6 20.1 2.0 22.1 1.3 0.6III 78,827.0 17.0 21.7 5.2 4,992.0 21.7 2.0 21.7 1.3 0.6IV 80,893.4 17.0 19.9 2.9 3,499.3 19.9 0.0 19.9 1.8 0.4
2019 I 80,580.7 17.0 19.6 2.4 2,761.8 19.6 0.0 19.6 1.5 0.5II 80,939.2 17.0 21.8 5.2 5,130.7 21.8 0.0 21.8 1.3 1.7III 80,878.8 17.0 22.9 6.3 5,179.9 22.9 0.0 22.9 1.4 2.3IV 84,655.6 17.0 24.6 7.6 5,453.5 24.6 0.0 24.6 4.7 2.9
2020 I 87,943.4 14.0 20.3 6.4 4,672.0 20.3 0.0 20.3 1.9 4.4II
p 90,047.3 14.0 24.8 11.0 9,998.5 24.8 0.0 24.8 1.3 4.8
SOURCE: Central Bank of Trinidad and Tobago.
1 Represents total demand, savings and time deposits, short-term credit instruments with a maturity up to and including one year and all fund raising instruments maturing within or beyond one year of the reporting date. These are all denominated in local currency and are adjusted for inter-bank and intra-bank cheques and other items credited to the banks on the books of the Central Bank.2 This includes the total of required and any excess reserves.3 Represents the excess/shortage as an average through the month. Annual data reflect an average of the 12 monthly averages.4 Effective August 02, 2018, the Central Bank of Trinidad and Tobago eliminated the 2.0 per cent secondary reserve requirement on commercial banks’ prescribed liabilities.
· ¹ ¹ º » · ¼ ½ ¾ ¿ ½ À Á Â

PeriodEnding
TABLE 23 FINANCE HOUSES & MERCHANT BANKS - SELECTED DATA Jul 2020
/TT$Mn/
Private Sector Public SectorBalances Due
Cash & Deposits from Local Banks Credit to Credit to Share Capitalat Central Bank (Net) Private Sector Investments Loans Public Sector Investments Loans Deposits & Reserves
1 2 3 4 5 6 7 8 9 10
2015 188.7 184.1 4,345.9 1,228.9 3,116.9 1,098.2 484.4 613.8 1,954.8 2,592.82016 276.4 390.7 4,603.6 1,415.3 3,188.2 976.9 398.9 577.9 2,066.3 2,826.62017 225.7 506.4 4,789.7 1,498.8 3,290.8 702.5 588.5 114.0 2,062.5 3,087.82018 219.7 728.2 5,194.9 1,755.1 3,439.7 831.3 582.6 248.7 2,731.8 3,478.02019 228.4 758.9 5,260.4 1,846.3 3,414.1 1,314.4 1,206.4 108.0 2,843.2 3,789.6
2015 II 282.6 -90.7 4,219.4 1,206.0 3,013.3 1,116.6 640.5 476.2 2,030.1 2,448.4III 305.4 62.7 4,268.4 1,212.0 3,056.4 1,114.8 520.1 594.7 2,010.2 2,516.1IV 188.7 184.1 4,345.9 1,228.9 3,116.9 1,098.2 484.4 613.8 1,954.8 2,592.8
2016 I 199.2 380.7 4,675.2 1,495.3 3,179.9 1,001.4 403.7 597.7 2,204.8 2,715.5II 205.6 295.0 4,776.0 1,539.2 3,236.8 1,044.4 405.6 638.9 2,384.4 2,682.3III 230.6 317.9 4,655.2 1,517.2 3,138.1 994.2 382.5 611.6 2,198.0 2,758.5IV 276.4 390.7 4,603.6 1,415.3 3,188.2 976.9 398.9 577.9 2,066.3 2,826.6
2017 I 286.1 504.9 4,636.2 1,458.2 3,178.0 989.5 388.6 600.9 2,226.2 2,800.3II 276.4 288.0 4,714.6 1,465.6 3,249.0 674.3 367.0 307.3 2,002.3 2,848.9III 238.4 348.3 4,717.1 1,468.2 3,248.9 701.0 377.7 323.3 2,018.6 2,912.8IV 225.7 506.4 4,789.7 1,498.8 3,290.8 702.5 588.5 114.0 2,062.5 3,087.8
2018 I 223.1 547.7 4,894.6 1,566.4 3,328.2 740.9 656.2 84.6 2,175.5 3,105.5II 235.8 425.9 5,022.5 1,620.4 3,402.1 774.9 690.4 84.5 2,282.7 3,138.3III 259.0 636.8 5,103.8 1,709.7 3,394.1 897.3 690.9 206.4 2,656.5 3,220.6IV 219.7 728.2 5,194.9 1,755.1 3,439.7 831.3 582.6 248.7 2,731.8 3,478.0
2019 I 187.0 622.6 5,248.4 1,828.4 3,420.0 832.9 631.7 201.2 2,528.6 3,478.2II 198.2 741.9 5,374.7 1,935.4 3,439.3 899.9 691.1 208.8 2,846.1 3,452.4III 207.6 517.5 5,462.7 2,054.5 3,408.2 1,455.6 956.4 499.1 3,223.4 3,516.8IV 228.4 758.9 5,260.4 1,846.3 3,414.1 1,314.4 1,206.4 108.0 2,843.2 3,789.6
2020 I 195.1 853.1 5,454.8 2,039.4 3,415.4 973.7 862.1 111.6 2,633.0 3,867.8II
p 201.5 1,010.1 5,280.0 1,915.5 3,364.5 1,099.5 795.1 304.3 2,651.0 3,974.6
SOURCE: Central Bank of Trinidad and Tobago.
Ã Ä Å Æ Ç Æ È Å Ç É Å Æ È
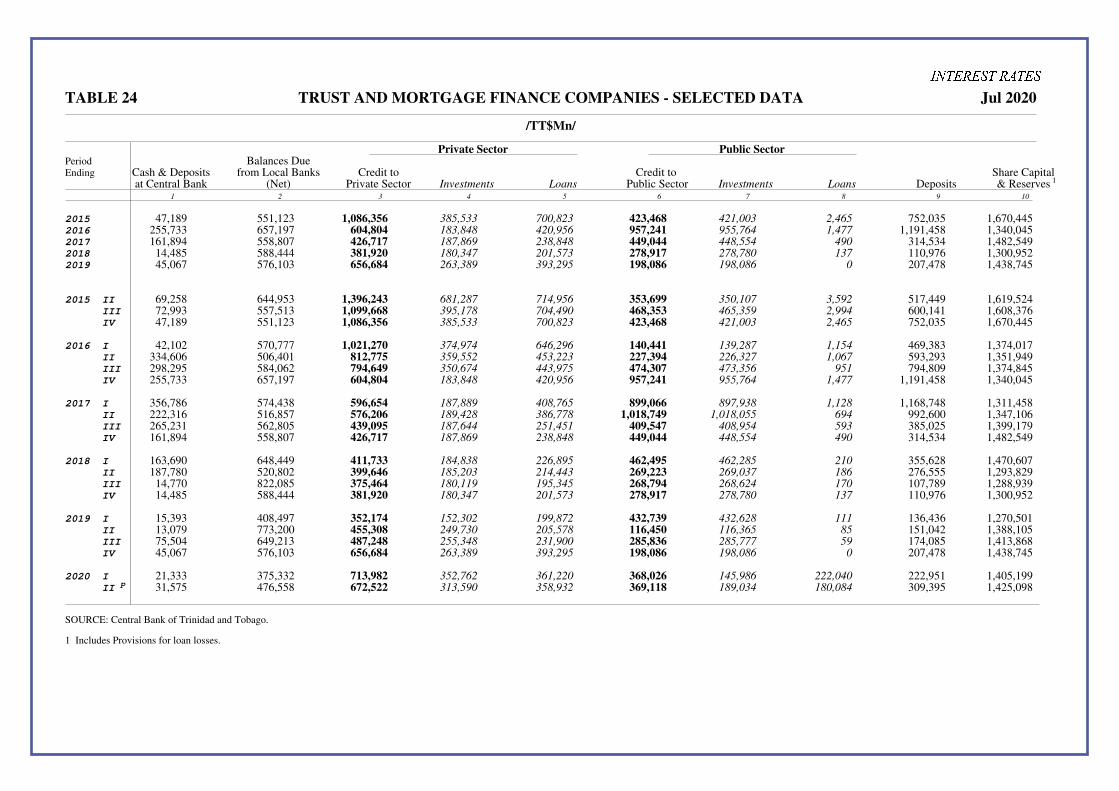
PeriodEnding
1
TABLE 24 TRUST AND MORTGAGE FINANCE COMPANIES - SELECTED DATA Jul 2020
/TT$Mn/
Private Sector Public SectorBalances Due
Cash & Deposits from Local Banks Credit to Credit to Share Capitalat Central Bank (Net) Private Sector Investments Loans Public Sector Investments Loans Deposits & Reserves
1 2 3 4 5 6 7 8 9 10
2015 47,189 551,123 1,086,356 385,533 700,823 423,468 421,003 2,465 752,035 1,670,4452016 255,733 657,197 604,804 183,848 420,956 957,241 955,764 1,477 1,191,458 1,340,0452017 161,894 558,807 426,717 187,869 238,848 449,044 448,554 490 314,534 1,482,5492018 14,485 588,444 381,920 180,347 201,573 278,917 278,780 137 110,976 1,300,9522019 45,067 576,103 656,684 263,389 393,295 198,086 198,086 0 207,478 1,438,745
2015 II 69,258 644,953 1,396,243 681,287 714,956 353,699 350,107 3,592 517,449 1,619,524III 72,993 557,513 1,099,668 395,178 704,490 468,353 465,359 2,994 600,141 1,608,376IV 47,189 551,123 1,086,356 385,533 700,823 423,468 421,003 2,465 752,035 1,670,445
2016 I 42,102 570,777 1,021,270 374,974 646,296 140,441 139,287 1,154 469,383 1,374,017II 334,606 506,401 812,775 359,552 453,223 227,394 226,327 1,067 593,293 1,351,949III 298,295 584,062 794,649 350,674 443,975 474,307 473,356 951 794,809 1,374,845IV 255,733 657,197 604,804 183,848 420,956 957,241 955,764 1,477 1,191,458 1,340,045
2017 I 356,786 574,438 596,654 187,889 408,765 899,066 897,938 1,128 1,168,748 1,311,458II 222,316 516,857 576,206 189,428 386,778 1,018,749 1,018,055 694 992,600 1,347,106III 265,231 562,805 439,095 187,644 251,451 409,547 408,954 593 385,025 1,399,179IV 161,894 558,807 426,717 187,869 238,848 449,044 448,554 490 314,534 1,482,549
2018 I 163,690 648,449 411,733 184,838 226,895 462,495 462,285 210 355,628 1,470,607II 187,780 520,802 399,646 185,203 214,443 269,223 269,037 186 276,555 1,293,829III 14,770 822,085 375,464 180,119 195,345 268,794 268,624 170 107,789 1,288,939IV 14,485 588,444 381,920 180,347 201,573 278,917 278,780 137 110,976 1,300,952
2019 I 15,393 408,497 352,174 152,302 199,872 432,739 432,628 111 136,436 1,270,501II 13,079 773,200 455,308 249,730 205,578 116,450 116,365 85 151,042 1,388,105III 75,504 649,213 487,248 255,348 231,900 285,836 285,777 59 174,085 1,413,868IV 45,067 576,103 656,684 263,389 393,295 198,086 198,086 0 207,478 1,438,745
2020 I 21,333 375,332 713,982 352,762 361,220 368,026 145,986 222,040 222,951 1,405,199II
p 31,575 476,558 672,522 313,590 358,932 369,118 189,034 180,084 309,395 1,425,098
SOURCE: Central Bank of Trinidad and Tobago.
1 Includes Provisions for loan losses.
Ê Ë Ì Í Î Í Ï Ì Î Ð Ì Í Ï

� � � � � � � � � � � � �PeriodEnding
5 6
TABLE 25 SELECTED INTEREST RATES 1,2 Jan 2018
/Per cent/
Central Bank Commercial Banks Non Bank Financial Institutions 4
Foreign Currency 3 Local Currency 3
Discount Gov’tRate T-Bills Loans Deposits Spread New Loans Loans Deposits Spread Loans Deposits Spread
2015
2016
6.25 4.96 0.51 4.45 8.34 7.60 0.55 7.04 8.69 1.74 6.95
2017
6.75 5.43 0.53 4.90 8.50 8.05 0.59 7.46 8.98 2.41 6.57
2018
6.75 5.66 0.52 5.13 8.72 8.23 0.61 7.62 9.66 2.52 7.14
2019
6.94 6.49 0.56 5.93 8.91 8.10 0.64 7.46 9.76 2.66 7.107.00 6.45 0.61 5.85 8.75 7.81 0.66 7.15 10.53 2.85 7.68
II 6.00 4.85 0.51 4.33 8.39 7.60 0.54 7.06 8.82 1.61 7.21III 6.50 5.01 0.51 4.50 7.95 7.44 0.55 6.89 8.57 1.79 6.77IV 6.75 5.03 0.52 4.51 8.45 7.74 0.56 7.18 8.57 2.11 6.46
2016 I 6.75 5.33 0.53 4.80 8.59 7.82 0.58 7.25 8.65 2.36 6.29II 6.75 5.36 0.53 4.83 8.55 8.03 0.59 7.44 8.89 2.39 6.51III 6.75 5.30 0.53 4.77 8.26 8.12 0.60 7.52 9.20 2.45 6.75IV 6.75 5.73 0.54 5.19 8.59 8.24 0.60 7.64 9.19 2.46 6.73
2017 I 6.75 5.45 0.53 4.91 8.59 8.25 0.60 7.65 9.20 2.54 6.67II 6.75 5.71 0.52 5.18 8.71 8.24 0.60 7.64 9.77 2.60 7.17III 6.75 5.41 0.52 4.89 8.71 8.24 0.61 7.62 9.82 2.63 7.19IV 6.75 6.06 0.52 5.54 8.86 8.20 0.62 7.58 9.85 2.30 7.55
2018 I 6.75 6.13 0.54 5.59 8.92 8.15 0.64 7.51 9.84 2.58 7.26II 7.00 6.47 0.56 5.91 8.68 8.13 0.64 7.50 10.00 2.59 7.41III 7.00 6.78 0.57 6.21 9.01 8.11 0.64 7.47 9.61 2.71 6.90IV 7.00 6.58 0.59 5.99 9.04 8.01 0.65 7.36 9.60 2.77 6.83
2019 I 7.00 6.59 0.60 5.99 8.94 7.83 0.66 7.17 10.32 2.86 7.46II 7.00 6.60 0.62 5.98 8.65 7.90 0.65 7.25 10.50 2.86 7.64III 7.00 6.51 0.60 5.91 8.55 7.79 0.65 7.14 10.25 2.83 7.42IV 7.00 6.11 0.61 5.50 8.84 7.72 0.67 7.05 11.05 2.83 8.22
2020 I p 5.50 5.80 0.60 5.20 9.06 7.52 0.68 6.84 10.68 2.97 7.72
SOURCE: Central Bank of Trinidad and Tobago.
1 Annual data refer to the quarterly averages for the respective year and quarterly rates are end of period rates.2 The data are weighted averages unless otherwise stated.3 See article on the ’The Floating Exchange Rate - Some Statistical Issues’ Quarterly Economic Bulletin, Dec. 1993.4 Includes Finance Companies, Merchant Banks, Trust & Mortgage Finance Companies. Data represents rates for reporting institutions only.5 Data are simple averages of the monthly discount rates for end of period issues.6 Quarterly data are simple averages of the monthly rates on new loans. See article in Economic Bulletin - January 2011 ’Weighted Average Interest Rates on New Loans’.
2015
0.550.161.091.201.22
1.14
1.09
0.580.520.97
1.151.201.161.12
1.051.200.951.16
1.151.191.201.26
1.301.261.19

PeriodEnding
TABLE 26A COMMERCIAL BANKS: INTEREST RATES 1,2 Jul 2020
/Per cent Per Annum/
TT Dollar Loans (Prime Rates) TT Dollar DepositsAnnounced Rates Actual Rates
6 Mth Weighted Average
Basic Real Up to 3- Over 3 - 6 Over 6 - 12Bank Repo Prime Estate Ordinary Special Month Month Month TT USRate Rate Rate Term Demand Overdraft Mortgage Savings Savings Time Time Time Dollars Dollars
1 2 3 4 5 6 7 8 9 10 11 12 13 14
2015 6.75 4.75 8.19 7.50 7.50 7.50 7.50 0.20 0.20 0.38 0.45 0.78 1.50 1.502016 6.75 4.75 9.00 7.50 7.50 7.50 7.50 0.20 0.20 0.38 0.45 0.78 1.50 1.502017 6.75 4.75 9.00 7.50 7.50 7.50 7.50 0.20 0.20 0.38 0.45 0.78 1.50 1.502018 7.00 5.00 9.00 7.50 7.50 7.50 7.50 0.20 0.20 0.38 0.45 0.78 1.50 1.502019 7.00 5.00 9.25 7.50 7.50 7.50 7.50 0.20 0.20 0.38 0.45 0.78 1.50 _
2015 II 6.00 4.00 8.00 7.50 7.50 7.50 7.50 0.20 0.20 0.38 0.45 0.78 1.50 1.50III 6.50 4.50 8.50 7.50 7.50 7.50 7.50 0.20 0.20 0.38 0.45 0.78 1.50 1.50IV 6.75 4.75 8.75 7.50 7.50 7.50 7.50 0.20 0.20 0.38 0.45 0.78 1.50 1.50
2016 I 6.75 4.75 9.00 7.50 7.50 7.50 7.50 0.20 0.20 0.38 0.45 0.78 1.50 1.50II 6.75 4.75 9.00 7.50 7.50 7.50 7.50 0.20 0.20 0.38 0.45 0.78 1.50 1.50III 6.75 4.75 9.00 7.50 7.50 7.50 7.50 0.20 0.20 0.38 0.45 0.78 1.50 1.50IV 6.75 4.75 9.00 7.50 7.50 7.50 7.50 0.20 0.20 0.38 0.45 0.78 1.50 1.50
2017 I 6.75 4.75 9.00 7.50 7.50 7.50 7.50 0.20 0.20 0.38 0.45 0.78 1.50 1.50II 6.75 4.75 9.00 7.50 7.50 7.50 7.50 0.20 0.20 0.38 0.45 0.78 1.50 1.50III 6.75 4.75 9.00 7.50 7.50 7.50 7.50 0.20 0.20 0.38 0.45 0.78 1.50 1.50IV 6.75 4.75 9.00 7.50 7.50 7.50 7.50 0.20 0.20 0.38 0.45 0.78 1.50 1.50
2018 I 6.75 4.75 9.00 7.50 7.50 7.50 7.50 0.20 0.20 0.38 0.45 0.78 1.50 1.50II 7.00 5.00 9.00 7.50 7.50 7.50 7.50 0.20 0.20 0.38 0.45 0.78 1.50 _III 7.00 5.00 9.13 7.50 7.50 7.50 7.50 0.20 0.20 0.38 0.45 0.78 1.50 _IV 7.00 5.00 9.25 7.50 7.50 7.50 7.50 0.20 0.20 0.38 0.45 0.78 1.50 _
2019 I 7.00 5.00 9.25 7.50 7.50 7.50 7.50 0.20 0.20 0.38 0.45 0.78 1.50 _II 7.00 5.00 9.25 7.50 7.50 7.50 7.50 0.20 0.20 0.38 0.45 0.78 1.50 _III 7.00 5.00 9.25 7.50 7.50 7.50 7.50 0.20 0.20 0.38 0.45 0.78 1.50 _IV 7.00 5.00 9.25 7.50 7.50 7.50 7.50 0.20 0.20 0.38 0.45 0.78 1.50 _
2020 I p 5.50 3.50 7.50 7.50 7.50 7.50 7.50 0.20 0.20 0.38 0.45 0.78 1.50 1.50
SOURCE: Central Bank of Trinidad and Tobago.
1 Annual data represent the median of the twelve monthly median rates, except for the Bank Rate and Repo Rate which are end of period.2 Quarterly data represent the median rates for the three months of each quarter, except for the Bank Rate and Repo Rate which are end of period.
© ª « ¬ ¬ ® « « ¬ ®

PeriodEnding
TABLE 26B COMMERCIAL BANKS: RANGE OF INTEREST RATES ON TT DOLLAR LOANS AND DEPOSITS 1 Jan 2018
/Per cent/
Loan (Market Rates) Deposits Rates (Announced)Basic Real Estate Ordinary Special Time Time TimePrime Term Demand Overdraft Mortgage Loans Savings Savings 3mth 6mth 1yr
L H L H L H L H L H L H L H L H L H L H
2015 7.00 9.25 0.73 19.50 0.20 25.00 4.00 27.75 3.00 16.43 0.00 1.00 0.00 2.00 0.05 3.95 0.05 3.00 0.05 3.002016 8.50 9.50 0.73 19.50 0.20 15.50 4.00 27.75 3.00 16.43 0.03 1.00 0.03 2.00 0.05 3.95 0.05 3.00 0.05 3.002017 8.75 9.50 0.73 19.50 0.20 15.50 4.00 27.75 3.00 16.43 0.03 1.00 0.03 2.00 0.05 3.95 0.05 3.00 0.05 3.002018 8.75 9.75 0.73 19.50 0.20 15.50 4.00 27.75 3.00 16.43 0.03 1.00 0.03 2.00 0.05 3.95 0.05 3.00 0.05 3.002019 8.85 9.75 0.73 19.50 0.20 15.50 4.00 27.75 3.00 16.43 0.03 1.00 0.03 2.00 0.05 3.95 0.05 3.00 0.05 3.00
2015 I 7.25 8.75 0.73 19.50 0.20 25.00 4.00 27.75 3.00 16.43 0.03 1.00 0.03 2.00 0.05 3.95 0.05 3.00 0.05 3.00II 7.00 9.00 0.73 19.50 0.20 15.50 4.00 27.75 3.00 16.43 0.03 1.00 0.03 2.00 0.05 3.95 0.05 3.00 0.05 3.00III 7.75 9.00 0.73 19.50 0.20 15.50 4.00 27.75 3.00 16.43 0.03 1.00 0.03 2.00 0.05 3.95 0.05 3.00 0.05 3.00IV 8.25 9.25 0.73 19.50 0.20 15.50 4.00 27.75 3.00 16.43 0.03 1.00 0.03 2.00 0.05 3.95 0.05 3.00 0.05 3.00
2016 I 8.50 9.50 0.73 19.50 0.20 15.50 4.00 27.75 3.00 16.43 0.03 1.00 0.03 2.00 0.05 3.95 0.05 3.00 0.05 3.00II 8.75 9.50 0.73 19.50 0.20 15.50 4.00 27.75 3.00 16.43 0.03 1.00 0.03 2.00 0.05 3.95 0.05 3.00 0.05 3.00III 8.75 9.50 0.73 19.50 0.20 15.50 4.00 27.75 3.00 16.43 0.03 1.00 0.03 2.00 0.05 3.95 0.05 3.00 0.05 3.00IV 8.75 9.50 0.73 19.50 0.20 15.50 4.00 27.75 3.00 16.43 0.03 1.00 0.03 2.00 0.05 3.95 0.05 3.00 0.05 3.00
2017 I 8.75 9.50 0.73 19.50 0.20 15.50 4.00 27.75 3.00 16.43 0.03 1.00 0.03 2.00 0.05 3.95 0.05 3.00 0.05 3.00II 8.75 9.50 0.73 19.50 0.20 15.50 4.00 27.75 3.00 16.43 0.03 1.00 0.03 2.00 0.05 3.95 0.05 3.00 0.05 3.00III 8.75 9.50 0.73 19.50 0.20 15.50 4.00 27.75 3.00 16.43 0.03 1.00 0.03 2.00 0.05 3.95 0.05 3.00 0.05 3.00IV 8.75 9.50 0.73 19.50 0.20 15.50 4.00 27.75 3.00 16.43 0.03 1.00 0.03 2.00 0.05 3.95 0.05 3.00 0.05 3.00
2018 I 8.75 9.50 0.73 19.50 0.20 15.50 4.00 27.75 3.00 16.43 0.03 1.00 0.03 2.00 0.05 3.95 0.05 3.00 0.05 3.00II 8.75 9.50 0.73 19.50 0.20 15.50 4.00 27.75 3.00 16.43 0.03 1.00 0.03 2.00 0.05 3.95 0.05 3.00 0.05 3.00III 8.75 9.75 0.73 19.50 0.20 15.50 4.00 27.75 3.00 16.43 0.03 1.00 0.03 2.00 0.05 3.95 0.05 3.00 0.05 3.00IV 8.85 9.75 0.73 19.50 0.20 15.50 4.00 27.75 3.00 16.43 0.03 1.00 0.03 2.00 0.05 3.95 0.05 3.00 0.05 3.00
2019 I 8.85 9.75 0.73 19.50 0.20 15.50 4.00 27.75 3.00 16.43 0.03 1.00 0.03 2.00 0.05 3.95 0.05 3.00 0.05 3.00II 8.85 9.75 0.73 19.50 0.20 15.50 4.00 27.75 3.00 16.43 0.03 1.00 0.03 2.00 0.05 3.95 0.05 3.00 0.05 3.00III 8.85 9.75 0.73 19.50 0.20 15.50 4.00 27.75 3.00 16.43 0.03 1.00 0.03 2.00 0.05 3.95 0.05 3.00 0.05 3.00IV 8.85 9.75 0.73 19.50 0.20 15.50 4.00 27.75 3.00 16.43 0.03 1.00 0.03 2.00 0.05 3.95 0.05 3.00 0.05 3.00
2020 I 7.25 9.25 0.73 19.50 0.20 15.50 4.00 27.75 3.00 16.43 0.03 1.00 0.03 2.00 0.05 3.95 0.05 3.00 0.05 3.00
SOURCE: Central Bank of Trinidad and Tobago.
1 Quarterly data represent the range of rates for the three (3) months of the quarter and annual data the twelve (12) months of the year.
° ± ² ³ ³ µ ² ¶ ² ³ µ
p

PeriodEnding
TABLE 27A NON-BANK FINANCIAL INSTITUTIONS: MEDIAN INTEREST RATES 1 Jan 2017
/Per cent Per Year/
Finance Companies & Merchant Banks Trust & Mortgage Finance CompaniesDeposits Deposits Real Estate Mortgage Loans
Installment1 - 2 Yr 2 - 3 Yr Loans 1 - 2 Yr 2 - 3 Yr Residential Commercial
2015 5.46 6.63 7.64 3.00 2.25 11.00 _2016 5.46 5.69 7.64 3.00 2.25 8.25 _2017 5.46 5.38 7.64 3.00 2.25 _ _2018 5.46 5.38 7.64 3.00 2.25 _ _2019 5.46 5.38 7.64 3.00 2.25 _ _
2015 I 5.46 6.63 7.64 3.00 2.25 11.00 _II 5.46 6.63 7.64 3.00 2.25 11.00 _III 5.46 6.63 7.64 3.00 2.25 11.00 _IV 5.46 5.38 7.64 3.00 2.25 11.00 _
2016 I 5.46 5.38 7.64 3.00 2.25 11.00 _II 5.46 5.38 7.64 3.00 2.25 _ _III 5.46 5.38 7.64 3.00 2.25 _ _IV 5.46 5.38 7.64 3.00 2.25 _ _
2017 I 5.46 5.38 7.64 3.00 2.25 _ _II 5.46 5.38 7.64 3.00 2.25 _ _III 5.46 5.38 7.64 3.00 2.25 _ _IV 5.46 5.38 7.64 3.00 2.25 _ _
2018 I 5.46 5.38 7.64 3.00 2.25 _ _II 5.46 5.38 7.64 3.00 2.25 _ _III 5.46 5.38 7.64 3.00 2.25 _ _IV 5.46 5.38 7.64 3.00 2.25 _ _
2019 I 5.46 5.38 7.64 3.00 2.25 _ _II 5.46 5.38 7.64 3.00 2.25 _ _III 5.46 5.38 7.64 3.00 2.25 _ _IV 5.46 5.38 7.64 3.00 2.25 _ _
2020 I 5.46 5.38 7.64 3.00 2.25 _ _
SOURCE: Central Bank of Trinidad and Tobago.
1 Quarterly data are reflective of the median rates for the three months of each quarter.
· ¹ º » º ¼ ¹ » ½ ¹ º ¼
p

PeriodEnding
INTEREST RATES
TABLE 27B NON-BANK FINANCIAL INSTITUTIONS: RANGE OF INTEREST RATES 1,2,3 Jan 2017
/Per cent/
Finance Companies & Merchant Banks Trust & Mortgage Finance CompaniesDeposits Installment Loans Deposits Real Estate Mortgage Loans
1 - 2 Yr 2 - 3 Yr 1 - 2 Yr 2 - 3 Yr Residential CommercialL H L H L H L H L H L H L H
2015 3.25 9.00 2.00 8.50 6.00 25.41 3.00 3.00 3.00 6.00 6.00 16.00 _ _2016 3.25 9.00 2.00 8.50 6.00 25.41 3.00 3.00 3.00 6.00 12.00 16.00 _ _2017 3.25 9.00 2.00 8.50 6.00 25.41 3.00 3.00 3.00 6.00 12.00 16.00 _ _2018 3.25 9.00 2.00 8.50 6.00 25.41 3.00 3.00 3.00 6.00 12.00 16.00 _ _2019 3.25 9.00 2.00 8.50 6.00 25.41 3.00 3.00 3.00 6.00 12.00 16.00 _ _
3.25 9.00 2.00 8.50 6.00 25.41 3.00 3.00 3.00 6.00 6.00 16.00 _ _II 3.25 9.00 2.00 8.50 6.00 25.41 3.00 3.00 3.00 6.00 6.00 16.00 _ _III 3.25 9.00 2.00 8.50 6.00 25.41 3.00 3.00 3.00 6.00 6.00 16.00 _ _IV 3.25 9.00 2.00 8.50 6.00 25.41 3.00 3.00 3.00 6.00 6.00 16.00 _ _
2016 I 3.25 9.00 2.00 8.50 6.00 25.41 3.00 3.00 3.00 6.00 12.00 16.00 _ _II 3.25 9.00 2.00 8.50 6.00 25.41 3.00 3.00 3.00 6.00 12.00 16.00 _ _III 3.25 9.00 2.00 8.50 6.00 25.41 3.00 3.00 3.00 6.00 12.00 16.00 _ _IV 3.25 9.00 2.00 8.50 6.00 25.41 3.00 3.00 3.00 6.00 12.00 16.00 _ _
2017 I 3.25 9.00 2.00 8.50 6.00 25.41 3.00 3.00 3.00 6.00 12.00 16.00 _ _II 3.25 9.00 2.00 8.50 6.00 25.41 3.00 3.00 3.00 6.00 12.00 16.00 _ _III 3.25 9.00 2.00 8.50 6.00 25.41 3.00 3.00 3.00 6.00 12.00 16.00 _ _IV 3.25 9.00 2.00 8.50 6.00 25.41 3.00 3.00 3.00 6.00 12.00 16.00 _ _
2018 I 3.25 9.00 2.00 8.50 6.00 25.41 3.00 3.00 3.00 6.00 12.00 16.00 _ _II 3.25 9.00 2.00 8.50 6.00 25.41 3.00 3.00 3.00 6.00 12.00 16.00 _ _III 3.25 9.00 2.00 8.50 6.00 25.41 3.00 3.00 3.00 6.00 12.00 16.00 _ _IV 3.25 9.00 2.00 8.50 6.00 25.41 3.00 3.00 3.00 6.00 12.00 16.00 _ _
2019 I 3.25 9.00 2.00 8.50 6.00 25.41 3.00 3.00 3.00 6.00 12.00 16.00 _ _II 3.25 9.00 2.00 8.50 6.00 25.41 3.00 3.00 3.00 6.00 12.00 16.00 _ _III 3.25 9.00 2.00 8.50 6.00 25.41 3.00 3.00 3.00 6.00 12.00 16.00 _ _IV 3.25 9.00 2.00 8.50 6.00 25.41 3.00 3.00 3.00 6.00 12.00 16.00 _ _
2020 I 3.25 9.00 2.00 8.50 6.00 25.41 3.00 3.00 3.00 6.00 12.00 16.00 _ _
SOURCE: Central Bank of Trinidad and Tobago.
1 Quarterly data represent the range of rates for the three (3) months of the quarter.2 These rates represent the actual rates.3 Annual figures represent the lowest low rate and the highest high rate for the year.
¾ ¿ À Á Â Á Ã À Â Ä À Á Ã2015 I
p

� � � � � � � � � � � � � � � � � � � � � � � � � � � � � � �� �� � �� ��� � �� � ��� � �� �� � � � � � � � !" � � � �� # $ � � % &�' ( & �� # )�* + # #" � # , $ � � % &� ' ( & �� # � � � " # + # #" � # , - � (� � �" . / � ! + # #" � # 01 2 3 42015
56 7 8 9: ; ; ; 7 : ; < : < < : <2016
96 ; 7 = : > < : < < : < ; 6 ? 7 8 : 82017
@6 @ 8 ? : 7 < : < < : < =6 8 7 7 : 82018
96 8 9 <: < 96 < < 7 : 9 < : < 96 ; 5 7 : =2019
86 = @ ? : 9 ; ; : 9 < : < = < < : <2015 I
? < <: < <: < < : < < : < II
9 8 ? : 5 <: < < : < < : < III
; 6 ; > @ : @ <: < < : < < : < IV
; 6 ? < <: < ; ; 7: ; < : < < : <2016 I
<: < <: < < : < 7 8 : 8 II
56 ; 7 = : > <: < < : < ; 6 ? < < : < III
<: < <: < < : < < : <
IV
; 6 < < <: < <: < < : < < : <
2017 I
=6 ? < <: < <: < < : < =6 9 7 7 : 8
II
=6 = < <: < <: < < : < < : <
III
=6 ? < <: < <: < < : < < : <
IV
=6 7 8 ? : 7 <: < < : < 5 < < : <
2018 I
; 6 = < <: < <: < < : < 96 ; 5 7 : =
II
8 ? <: < <: < < : < < : <
III
9 ? <: < 96 < < <: < < : < < : <
IV
=6 5 9 <: < 7: 9 < : < < : <
2019 I
7 9 = : 9 ; ; : 9 < : < = < < : <
II
=6 ? < <: < <: < < : < < : <
III
@ 9 5 : < <: < < : < < : <
IV
56 5 < <: < <: < < : < < : <
2020 I
=6 = ? <: < ; <6 = 9 = : 5 < : < < : <
II
86 7 ? ? : ? <: < < : < < : <A BC D EFG EH I JK L MN L I OP QR K S I S T L T L I T R P U L VPWX Y LK Z L M[ H A \ LK H ] JK L TH T P I J \H R K S I S T L T L I T R P U L VP A JP O F_ \ L I VH L I T K H QH K ] JP P I M IH a P b c L I M S ] J S I V ]Wd Y [ U M S ^ MP L I S ] ] [ H ] P Q A J L JH EP K cP K L J SP I ] L I T B J \H K A J L JH F I JH K c K S ]H ] e EP I J S I VH I J f S L U S M S J SH ] gW h M ]P S I M [ TH ] ]H [ K S J SH ] S ] ][ H T U ` J \H iP bH jP K J V L VH N L I O QK P b kl d m X m P I a LK T ]W
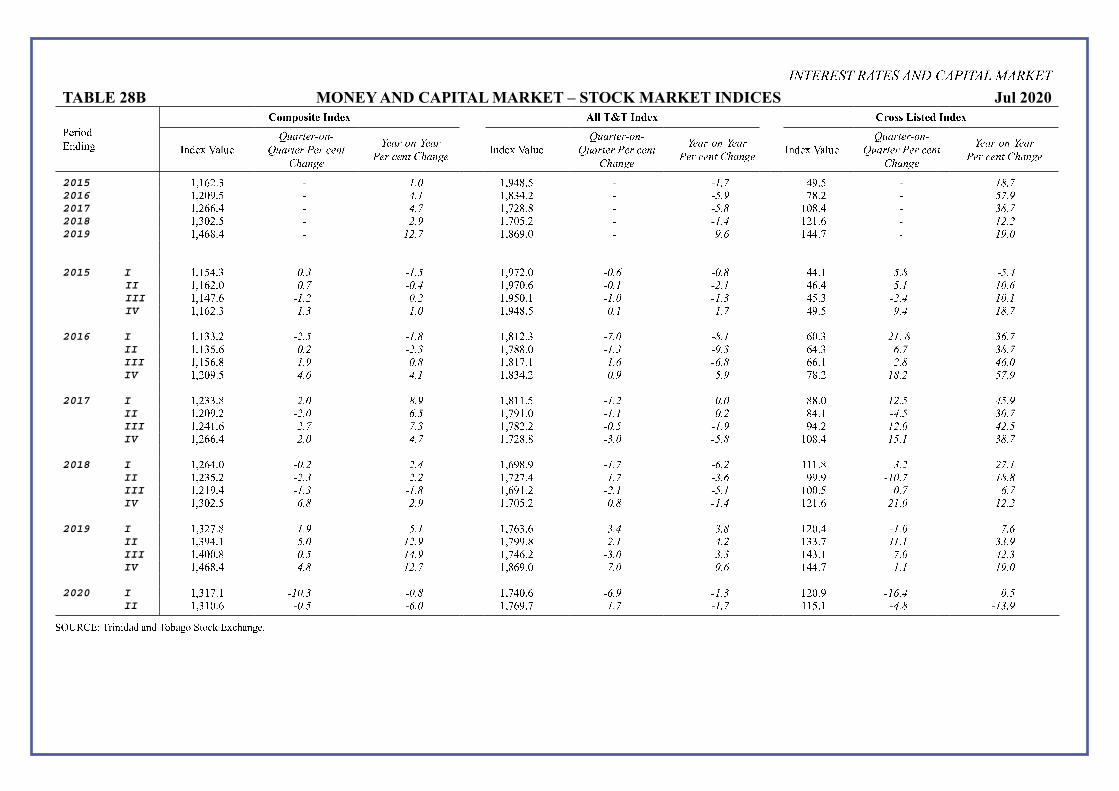
� � � � � � � � � � � � � � � � � � � � � � � � � � � � � �� ��� � �� � �� � �� � � �� �� � ! " # # $ % $ �� � ! �& � � � ' � � � � � � � !(� ��) *+ ,- � ./ 0 1 23 14 5 6 4./ 0 1 23 1 73 1 8 3 6 29 : 0 6 ;3 <3 0 14 5 6 4 <3 0 173 1 8 3 6 2 9 : 0 6 ;3 (� ��) *+ ,- � ./ 0 1 23 14 5 6 4. / 0 1 23 1 7 3 1 8 3 6 29 : 0 6 ;3 <3 0 14 5 6 4 <3 0 17 3 1 8 3 6 2 9 : 0 6 ;3 (� ��) *+ ,- � ./ 0 1 23 14 5 6 4./ 0 1 23 1 73 1 8 3 6 29 : 0 6 ;3 <3 0 14 5 6 4 <3 0 173 1 8 3 6 2 9 : 0 6 ;32015
=> = ? @A B 4 CD E = > F G H A I 4 4 CD J G F A I 4 C KD J2016
=> @ L FA I 4 MD C = > H B GA @ 4 4 ND O P H A @ 4 N JD O2017
=> @ ? ?A G 4 MD J = > P @ H A H 4 4 ND K = L H A G 4 Q KD J2018
=> B L @A I 4 RD O = > P L I A @ 4 4 CD M = @ = A ? 4 C RD R2019
=> G ? H A G 4 C RD J = > H ? F A L 4 OD S = G GA P 4 C OD E
2015 I
=> = I GA B ED Q 4 CD N = > F P @ A L 4 ED S 4 ED K G GA = ND K 4 ND M II
=> = ? @A L ED J 4 ED M = > F P LA ? 4 ED C 4 RD C G ?A G ND C C ED S III
=> = G PA ? 4 CD R ED R = > F I LA = 4 CD E 4 CD Q G I A B 4 RD M C ED C
IV
=> = ? @A B CD Q CD E = > F G H A I 4 ED C 4 CD J G F A I OD M C KD J
2016 I
=> = B B A @ 4 RD N 4 CD K = > H = @ A B 4 JD E 4 KD C ? LA B R CD K Q SD J
II
=> = B I A ? ED R 4 RD Q = > P H H A L 4 CD Q 4 OD Q ? GA B SD J Q KD J
III
=> = I ?A H CD O ED K = > H = P A = CD S 4 SD K ? ?A = RD K M SD E
IV
=> @ L FA I MD S MD C = > H B GA @ ED O 4 ND O P H A @ C KD R N JD O
2017 I
=> @ B B A H RD E KD O => H = = A I 4 CD R ED E H H A L C RD N M ND O
II
=> @ L FA @ 4 RD E SD N = > P F = A L 4 CD C ED R H GA = 4 MD N Q ED J
III
=> @ G = A ? RD J JD Q = > P H @ A @ 4 ED N 4 CD O F GA @ C RD E M RD N
IV
=> @ ? ?A G RD E MD J = > P @ H A H 4 QD E 4 ND K = L H A G C ND C Q KD J
2018 I
=> @ ? GA L 4 ED R RD M = > ? F H A F 4 CD J 4 SD R = = = A H QD R R JD C
II
=> @ B I A @ 4 RD Q RD R = > P @ P A G CD J 4 QD S F F A F 4 C ED J C KD K
III
=> @ = FA G 4 CD Q 4 CD K = > ? F = A @ 4 RD C 4 ND C = L LA I ED J SD J
IV
=> B L @A I SD K RD O = > P L I A @ ED K 4 CD M = @ = A ? R CD E C RD R
2019 I
=> B @ PA H CD O ND C = > P ? B A ? QD M QD K = @ LA G 4 CD E JD S
II
=> B F GA = ND E C RD O = > P F F A H RD C MD R = B B A P C CD C Q QD O
III
=> G L LA H ED N C MD O = > P G ?A @ 4 QD E QD Q = G B A = JD E M RD Q
IV
=> G ? H A G MD K C RD J = > H ? F A L JD E OD S = G GA P CD C C OD E
2020 I
=> B = PA = 4 C ED Q 4 ED K = > P G LA ? 4 SD O 4 CD Q = @ LA F 4 C SD M ED N
II
=> B = LA ? 4 ED N 4 SD E = > P ? F A P CD J 4 CD J = = I A = 4 MD K 4 C QD OT UV W XYZ [\ ]^ ] _` _ ` _ [a b c a Td a e f Yg e h` c ij
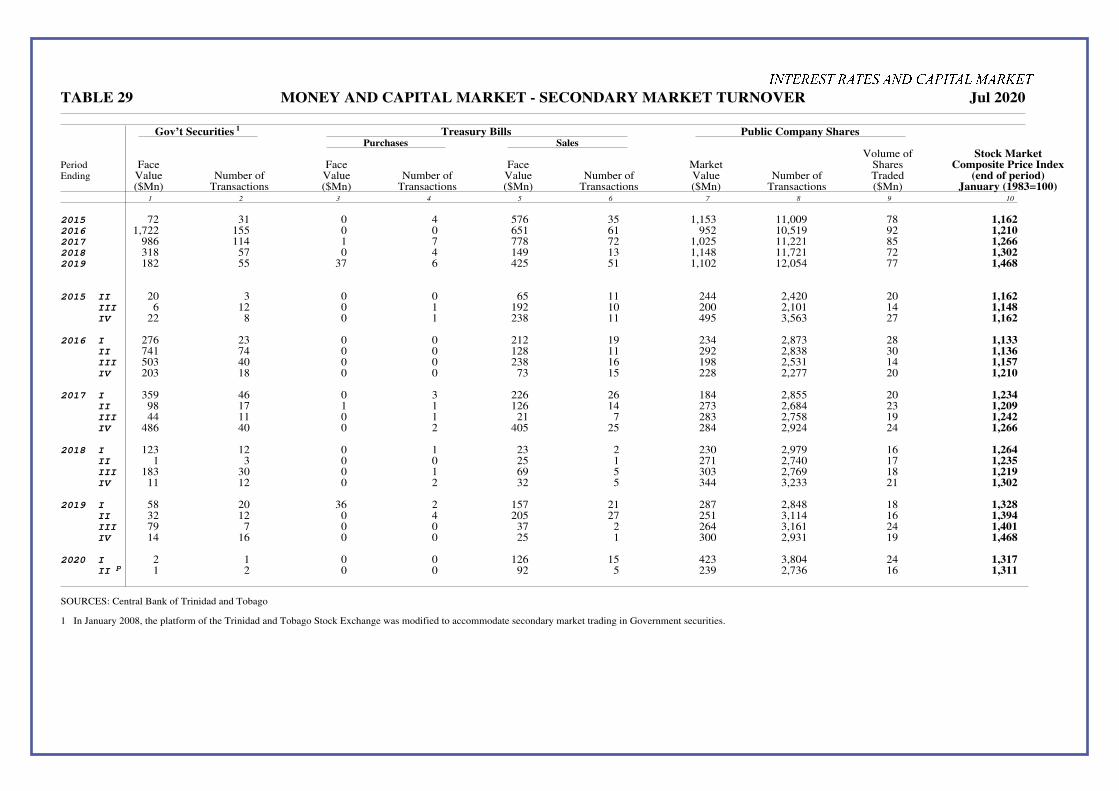
PeriodEnding
TABLE 29 MONEY AND CAPITAL MARKET - SECONDARY MARKET TURNOVER Jul 2020
Gov’t Securities 1 Treasury Bills Public Company SharesPurchases Sales
Volume of Stock MarketFace Face Face Market Shares Composite Price Index
Value Number of Value Number of Value Number of Value Number of Traded (end of period)($Mn) Transactions ($Mn) Transactions ($Mn) Transactions ($Mn) Transactions ($Mn) January (1983=100)
1 2 3 4 5 6 7 8 9 10
2015 72 31 0 4 576 35 1,153 11,009 78 1,1622016 1,722 155 0 0 651 61 952 10,519 92 1,2102017 986 114 1 7 778 72 1,025 11,221 85 1,2662018 318 57 0 4 149 13 1,148 11,721 72 1,3022019 182 55 37 6 425 51 1,102 12,054 77 1,468
2015 II 20 3 0 0 65 11 244 2,420 20 1,162
III 6 12 0 1 192 10 200 2,101 14 1,148
IV 22 8 0 1 238 11 495 3,563 27 1,162
2016 I 276 23 0 0 212 19 234 2,873 28 1,133
II 741 74 0 0 128 11 292 2,838 30 1,136
III 503 40 0 0 238 16 198 2,531 14 1,157
IV 203 18 0 0 73 15 228 2,277 20 1,210
2017 I 359 46 0 3 226 26 184 2,855 20 1,234
II 98 17 1 1 126 14 273 2,684 23 1,209
III 44 11 0 1 21 7 283 2,758 19 1,242
IV 486 40 0 2 405 25 284 2,924 24 1,266
2018 I 123 12 0 1 23 2 230 2,979 16 1,264
II 1 3 0 0 25 1 271 2,740 17 1,235
III 183 30 0 1 69 5 303 2,769 18 1,219
IV 11 12 0 2 32 5 344 3,233 21 1,302
2019 I 58 20 36 2 157 21 287 2,848 18 1,328
II 32 12 0 4 205 27 251 3,114 16 1,394
III 79 7 0 0 37 2 264 3,161 24 1,401
IV 14 16 0 0 25 1 300 2,931 19 1,468
2020 I 2 1 0 0 126 15 423 3,804 24 1,317
II p 1 2 0 0 92 5 239 2,736 16 1,311
SOURCES: Central Bank of Trinidad and Tobago
1 In January 2008, the platform of the Trinidad and Tobago Stock Exchange was modified to accommodate secondary market trading in Government securities.
� � � � � � � � � � � � � � � � � � � � � � � � � � �

� � � � � � � � � � � � � � � � � � � � � � � � � � � � � � � � � � ��� � �� ��� � �� � �� � � �� � �� � ! "� # � $� � �� � % & � � � � &' � (� � � �� � )* ' +� ,� - � � # . ' � /� � 0 . ' � �� * ' +� ,� - � � # . ' � /� � 0 . ' � �� * ' +� ,� - � � # . ' � /� � 0 . ' � ��1 2 3 4 5 6 7 8 92015
: : ;< = = >? @ : > ;< A B A ? > C @< D B ; ? = ; @< D ; >< : A :? = ; @< C : >< > ; A ? E F A E :< > B D ? ; A< B : :< > = @? > A< > C =< B C =? E > > A< = @ D ? E2016
= B E< C @ B ? C B : B< E > A ? B F A ; ;< A D >? > ; @< > = B< A E >? > ; @< : @ @< = B E ? C F > D A< > ; D ? A D< B > ;< : ; @? A A< E : =< : C >? D ;< @ > >< : C C ? :2017
B = @< > = E ? D E A A< = A =? B ; D E< B > @? C :< = B B< @ ; @? > :< : @ B< B D : ? B F A A @< B A : ? > D< E = >< = D >? @ D< C > >< > B =? @ A A @< ; > B ? @2018
;< = E A< : ; =? D ;< A C ;< ; E B ? : > A ;< E D E ? D ; A< = > >< E @ D ? ; ; A< D @ B< D C @? B D D =< D C A ? D D< : @ @< = D C ? = A< : D E< D ; E? A : = D< D ; B ? >2019
: C D< : : B ? C : : A< ; = @? > F D B< ; = ; ? : B< E B D< E > C ? = :< C ; B< C A E ? : F E D >< E B A ? D =< : B @< ; > C ? @ >< B E A< E @ B ? @ A< ; @ E< > D E ? @
2015 I
A C B< E ; A ? : ; B ;< D @ =? E E E< > @ =? A A< C C @< C = D ? = A< D C >< = A A ? D ; : C< : > ; ? D C C B< C C :? D C @ A< @ D >? = C =< C A >? E
II
A B A< : ; >? ; ; > =< = ; =? @ ; D =< A : B ? ; A< = @ B< B ; ; ? ; A< A B D< C ; =? ; D A C< A : C ? ; C B ;< : D A? : C : E< @ D :? = F ; C< ; @ =? =
III
A ; E< = : A ? > A : B< C > @? B F B @< B > B ? D A< = E A< C @ ; ? ; A< : ; B< @ : B ? E F A > C< C : E ? = B C E< = A E? @ = D :< C > D ? E A ; B< @ B D ? D
IV
A D A< D > >? C D ; >< B ; B ? B F B A< > E >? D A< > B D< @ C D ? B D< @ D B< ; E C ? E F C C C< ; A ; ? : : @ ;< D > ; ? A E ; B< A D B ? : ; B D< ; @ A ? D
2016 I
; = =< E > @? > A ; A< E C A ? D F > =< @ ; ; ? B A< D @ >< @ = >? E A< C C :< = @ D ? = F A C C< C D B ? : : A =< B ; =? C C : :< B C A? B D A =< : = D ? B
II
; > B< D D ; ? C A ; A< @ @ ; ? D F = D< = = : ? B A< D E ;< E > A? > A< D : C< ; A A ? = F A D< D B @? A : @ @< D D ; ? = B : D< @ : :? > E< A D A ? A
II
A A C< = > E ? : ; = D< : : ; ? > = ;< = C =? C A< B = =< > B >? A A< : @ A< = C D ? B F D =< ; = : ? = : E C< D D :? @ C : :< A ; C ? C D E =< ; A D ? >
IV
; > =< E B B ? = D @ :< : : E ? : F ; = D< A @ : ? D A< : A C< : B D ? ; D< @ > D< D @ E ? C F ; ; E< D A >? > ;< @ D :< > A D ? ; E @ >< E B =? C D D >< = D =? =
2017 I
; : A< A B B ? @ ; = :< > C B ? : A A< B A : ? @ A< E C @< = E @? ; A< = E E< E C A ? > E A< : ; E ? E : B B< C ; B ? @ ;< @ E @< E A =? @ F B A< A @ B ? @
II
; : E< ; ; =? A ; B E< ; C : ? > :< : C =? E A< A C E< E D :? C A< A A B< ; ; @? ; A :< = A : ? C B : =< = : :? @ : A :< ; B D ? @ F D A< > B >? @
III
A B ;< : C E ? : A @ ;< D D C ? B B @< = A A ? ; A< D B =< @ : =? E A< C ; =< ; C B ? > F ; D @< @ = ; ? E ;< @ D B< : > :? @ E C ;< C = ; ? @ A B E< D B B ? @
IV
; B :< ; @ C ? D ; = >< = E A ? = A >< > D A ? E A< A : D< C @ >? ; A< > B =< B ; : ? @ F ; : D< D ; >? B B > @< > = B ? @ E : D< @ ; =? @ > E< > C A ? @
2018 I
D @ C< D B B ? @ ; C =< : C A ? > ; > B< > D C ? = A< C C =< E B @? ; A< D ; =< C : E ? D A > @< ; B A ? B A ; D< ; B >? : ; > C< : D >? > = E< A C @? C
II
D = A< = A E ? B A C =< A E ; ? > ; @ =< D C =? > D< > @ @< : : =? A D< @ A B< = A >? A D E A< D E A ? @ ;< @ @ A< @ D :? @ B ; :< = B =? @ ; B A< D C D ? @
III
C > :< @ E >? ; C > :< A A @? B F ; > =? E >< ; D D< > ; =? : >< A : >< = E ; ? : F ; = ;< A C C ? @ ;< @ B C< D : >? @ : ; C< : B =? @ ; = :< > @ B ? @
IV
> C C< B A =? D A B B< E D >? D ; = E< @ : A ? @ A< C C D< C ; @? @ A< = = B< > C E ? C F ; ; >< : > E ? C ;< = @ @< @ ; E? E ;< @ C C< E ; @? B C > >< D @ =? :
2019 I
A D :< C = C ? A A D D< : B ; ? D C< C B D ? : A< A ; =< D E E? C A< D B =< A C =? E F ; = :< B E : ? A ;< C : =< D : E? @ : : :< ; A A? @ C : E< A E C ? @
II
A @ ;< > = C ? ; ; : D< A A E ? A B< A D E ? : A< A : D< : D :? : A< D A @< C ; A ? ; F A =< C E A ? A ;< C C @< E : @? @ ;< ; ; E< D > B ? @ > D D< > > A ? @
III
A = :< A @ B ? A D @ :< = @ B ? B F > @< > @ @? = A< @ : B< > A =? > A< = : @< @ : @? D F C : ;< = = >? @ ;< = ; E< E C B ? @ ;< ; ; >< ; C E? @ C @ D< = @ ; ? @
IV
A > D< E = @? @ A C C< D > D ? @ F ; ;< C B D ? @ A< ; E C< @ @ ; ? : A< ; A ;< = = B ? B C D< D D D ? ; A< A ; C< A @ @? @ ;< = > A< @ B ; ? @ C E D< ; ; : ? @
2020 I
D C C< E E E ? @ > B A< ; = =? @ F ; A =< D B : ? @ A< ; A B< B A ; ? = A< D : ;< C D C ? ; F A = A< E ; D ? C ;< B @ =< B E :? @ ;< D A B< D @ ; ? @ > E B< C E B ? @G HI J KLM KN O PQ R ST R O UV WX Q Y O Y Z R Z R O Z X V [ R \V]^_ O Sa ZN b [V P c X X d R O Z I G de a Pa R Sf a O Z b]g JN h Q N bN O P b f Y Q b P I O Y P G ` cN iN V W P cN I O Y P X Q a b P KV Q hV Q R P YV Oj I X K KV Q hV Q R PN f a O Z j JV k PQ Y O lI G d mX X d n_ O V iN m oQ V p P cf a O Zj JN ha [ S Y ` K RQ Y [ [N R O Lq a Y P kf a O Zj R O Zf YQ b P K Y P Yr N O b_ i iV Q PN S SN_ O V iN R O Z oQ V p P cf a O Z]s JN h Q N bN O P b G N V O Z I O Y P G ` cN iN V W P cN I O Y P X Q a b P KV Q hV Q R P YV O I X K lX X d m I G d n_ O V iN f a O Z j JV k PQ Y O lI G d m X X d n_ O V iN f a O Zj JN h a [ S Y `_ O V iN f a O Z R O Z JN ha [ S Y ` f Yt N Z_ O V iN G N a Q Y P YN b f a O Zj P cNu [N Q Q V i [ YN j v RQ Y Rj R O Z L S X a a cN f a O Z b b hV O bV Q N Z [ kf YQ b P K Y P Yr N O b u b bN Pe R O R \N iN O P w Y i Y PN Z]x JN h Q N bN O P b JV k PQ Y O lX X d m I G d ne V ON ke RQ UN Pf a O Z b R O Z JN h a [ S Y `e V ON ke RQ UN Pf a O Z]
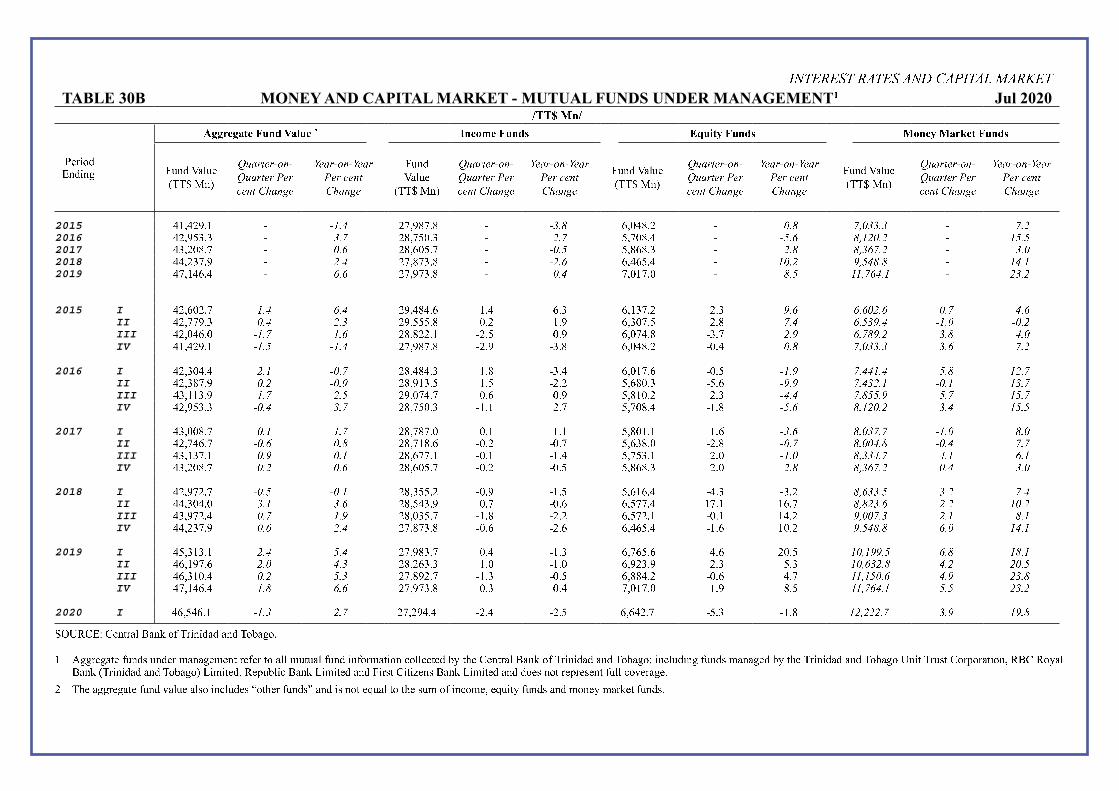
� � � � � � � � � � � � � � � � � � � � � � � � � � � � � � � �� ��� � �� ��� � �� � �� � � �� ! � "# $ % & '# � ( ) $ * + , � "# $ %- ./ # 0 !1 " # $ % - 2 + $ � 1 2 � 3 � ! "# $ %-45 � �67 85 �9: : ;< � = >? @ A BC AD E F D>? @ A BC A GC AH C F B I J @ F KC LC @ AD E F D LC @ AG C A H C F BI J @ F KC 45 � �67 85 �9: : ;< � = >? @ A BC AD E F D> ? @ A BC A G C AH C F B I J @ F KC LC @ AD E F D LC @ AGC A H C F BI J @ F KC 45 � �67 85 �9: : ;< � = >? @ A BC AD E F D>? @ A BC A GC AH C F B I J @ F KC LC @ AD E F D LC @ AGC A H C F BI J @ F KC 4 5 � �6 7 85 �9: : ; < � = > ? @ A BC AD E F D>? @ A BC A GC AH C F B I J @ F KC LC @ AD E F D LC @ AG C A H C F BI J @ F KC2015
M NO M P QR N D D ST U P VO Q W V R W D D XT Y ZO [ M W R P D \T Y ]^ \ X XT X _ ]T `2016
M PO Q a b R b D XT ] P WO V a [R b D `T ] aO V [ W R M D D cT d Y ^ S \T ` _ S cT c2017
M bO P [ W R V _ \T d P WO Z [ a R V _ D \T c aO W Z W R b _ `T Y Y ^ X d ]T ` _ XT \2018
M MO P b VR Q _ `T U P VO W V b R W _ D `T d ZO M Z a R M _ S \T e ^ c U YT Y _ S UT S2019
M VO N M ZR M _ dT d P VO Q V b R W _ \T U VO [ N VR [ _ YT c S S ^ ] d UT S _ XT `
2015 I
M PO Z [ PR V S T U dT U P QO M W MR Z N R M ZR b ZO N b VR P P R b eT d d^ d \ T d \T ] UT d
II
M PO V V QR b \T U T X P QO a a a R W [R P N R Q ZO b [ VR a P R W ]T U d^ c X eT U D S T \ D \T `
III
M PO [ M ZR [ D S T ] ST d P WO W P P R N _ PR a [R Q ZO [ V MR W _ b R V `T e d^ ] Y eT XT Y UT \
IV
M NO M P QR N D S T c D ST U P VO Q W V R W _ PR Q _ b R W ZO [ M W R P _ [R M \T Y ]^ \ X XT X XT d ]T `
2016 I
M PO b [ MR M `T S D \T ] P WO M W MR b N R W _ b R M ZO [ N VR Z _ [R a D ST e ]^ U U ST U cT Y S T ]
II
M PO b W VR Q \T ` D \T e P WO Q N b R a N R a _ P R P aO Z W [R b _ a R Z D eT e ]^ U X T S D \T S S XT ]
III
M bO N N b R Q S T ] T c P QO [ V MR V [R Z [R Q aO W N [R P P R b D UT U ]^ Y c cT e cT ] S cT ]
IV
M PO Q a b R b D \T U XT ] P WO V a [R b _ N R N P R V aO V [ W R M _ N R W D cT d Y ^ S \T XT U S cT c
2017 I
M bO [ [ W R V \T S ST ] P WO V W V R [ [R N N R N aO W [ N R N N R Z D XT d Y ^ \ X ]T ] D S T \ YT \
II
M PO V M ZR V D \T d \T Y P WO V N W R Z _ [R P _ [R V aO Z b W R [ _ P R W D \T ] Y ^ \ \ UT Y D \T U ]T ]
III
M bO N b VR N \T e \T S P WO Z V V R N _ [R N _ N R M aO V a b R N P R [ D ST \ Y ^ X X UT ] UT S dT S
IV
M bO P [ W R V \T \T d P WO Z [ a R V _ [R P _ [R a aO W Z W R b P R [ `T Y Y ^ X d ]T \T U XT \
2018 I
M PO Q V PR V D \T c D \T S P WO b a a R P _ [R Q _ N R a aO Z N ZR M _ MR b _ b R P Y ^ d X XT c XT ]T U
II
M MO b [ MR [ XT S XT d P WO a M b R Q [R V _ [R Z ZO a V VR M N V R N N ZR V Y ^ Y XT d T S \T `
III
M bO Q V PR M D \T ] ST e P WO [ b a R V _ N R W _ P R P ZO a V PR N _ [R N N MR P e ^ \ \ ]T X T S YT S
IV
M MO P b VR Q \T d T U P VO W V b R W _ [R Z _ P R Z ZO M Z a R M _ N R Z N [R P e ^ c U YT Y dT \ S UT S
2019 I
M aO b N b R N `T U cT U P VO Q W b R V [R M _ N R b ZO V Z a R Z MR Z P [R a S \ ^ S e eT c dT Y S YT S
II
M ZO N Q VR Z `T \ UT X P WO P Z b R b N R [ _ N R [ ZO Q P b R Q P R b a R b S \ ^ d X T Y UT ` \T c
III
M ZO b N [R M \T cT X P VO W Q P R V _ N R b _ [R a ZO W W MR P _ [R Z MR V S S ^ S c \T d UT e XT Y
IV
M VO N M ZR M S T Y dT d P VO Q V b R W [R b [R M VO [ N VR [ N R Q W R a S S ^ ] d UT S cT c XT `
2020 I
M ZO a M ZR N D S T X T ] P VO P Q MR M _ PR M _ P R a ZO Z M P R V _ a R b _ N R W S ^ ` T ] XT e S eT Yf g h i j �k j � � l �7 8m 7 � n � o : � �� � �7 �7 � � : � p7 �� RN q � � �� �7 l� o5 � �r 5 � �� � s7 �7 �� s� � l �� o� � l�7 8 8 s5 l57 8 o5 � � �� o� � s7 l �� � t � 8 8� t l� � pu l v� j� � l �7 8m 7 � n � o : � � � � �7 �7 � � : � p7 �� w � � t 85 � � � � o5 � �r s7 �7 �� � pu l v� : � �� � �7 �7 � � : � p7 � � h� � l : �5 r l j � � x � �7 l �� � O im j i� u7 8m 7 � n 9: � � � � �7 �7 � � : � p7 � � =y � s � l� �O i� x5 p 8 � tm 7 � ny � s � l� �7 � � 4 � �r l j � l �z � � r m 7 � ny � s � l� �7 � � �� � r � � l �� x �� r � � l o5 8 8 t �{ � �7 �� RP : v�7 � � �� �7 l� o5 � �{ 7 85 �7 8 r � � � t 85 �� r | � l v� � o5 � �r }7 � � � r � � l � ~57 8 l� l v� r 5 s � o � � t � s� O � ~5 � lu o5 � �r7 � � s� � � u s7 � n� l o5 � �r R

£ ¤ ¥ ¤ ¦ § © ª « ¤ ¬ ¦ ®°± ²³ µ ¶ ·¸ ³¹ º » » ¼ ½ ¾ ¿ ¹ ¹ À º ½ ¾ ¿ ½ Á ¹ ¿ Â Ã ¾ ¿ Ä ¿ ¹ ¹ À º ½ ¾ Å Æ Ç ÈÉ Å Æ Ç ÊÉ Å Æ Ç ËÉ Å Æ Ç ÌÍ Å Æ Ç ÎÍÃ Ã Ã Ã Ã Ã Ã Ï Ã Ã Ã Ã Ã Ã Ã Ï
»Ð Ñ Ð ÒÓ ÔÕ Ö× Ø Ø Ù Ú Û ÜÝ Ý Þ× Ú Û ß Ù Ý Ù àá Ûâ ã äå ä æ çè é ã êå ê ë æè ê ã ã å æ ì ã è ì ä å ë í ç è ã ä å ã ä ìè é ëå é ä íè é ëå î î êè ì ëå é ã ìè ê ëå í ë ìè ç ëå æ ë ã è é ëå æ ä êè äï Þ Þ ðâ ñ Ú ðò Ù Øó à Ý Ù â ã ëå ç ä îè ç éå ë í êè ê ã êå æ ë æè í ä å ã ê ëè ç ëå î ì íè æ ëå ì ã æè æ ëå í æ êè í ëå í ä ëè ä ëå ä ä æè æ ëå ã æ ìè ì ëå ë ê íè îï Þ Þ ðâ ô ã ã å æ ã ä è é îå ä ê æè æ éå æ æ ç è ì ëå ì é æè ä ëå ì ã êè ë ëå ç æ æè ç ëå æ ì ã è ì ëå ä é êè ì ëå ã ç êè ê ã å é í íè ä ëå ê ë íè çò Ù Øó àÝ Ù â ã å ã ë æè í é ç çè í é ì î è é ä ê î è ë ã í íè ã ã í éè é ã í î è î ë æ ã è í ã î æè æ ã î ã è ç ã î êè äõ Ø àö ñ Ø÷ ø ÚÝ Þ ö Ù ç ä îè ë æ ä îè ë æ ë î è î ã ê ìè ã ã æ ëè ë ã æ ìè ã ã í ìè ë ë ã ç è æ ë ã éè ê ã ç éè ç ã ç éè ëÖ Þ ö á Ù Ú â ñ Û à Þ Ú Þ ùú ö á û Þ ÷ Ù Ù â ëè ì êè ì êè ç êè ë êè ã êè ã êè ë êè é êè î êè î êè êø Ú ó Ù â Ûö Ù Ú Û ø ÚÝ Þ ö Ù ç ä çè ç æ ä ìè ç æ ë î è ä ã ê íè é ã æ ëè ã ã æ ìè ã ã í ìè ã ë ã æè æ ë ã î è ë ã ç î è ì ã ç éè ëò Ù Ý Þ Ú ð ñ Ø÷ ø ÚÝ Þ ö Ù ë í éè ë ä ë çè î í ã î è ä ç ç è í ã ã éè ä ì ç è ä ì ëè é í éè æ ì æè ê ã ã æè ì í æè ëï Þ ó Ù Ø Úö Ù Ú Û ü Ø ñ Úâ ù Ù Øâ ã éè ê í ã è î ä êè ç ìè î æè ì î è ä ã êè æ î è ã ã êè î î è ë æè êõ Ø à ó ñ Û Ù ü Ø ñ Úâ ù Ù Øâ ë ç êè ë ë í æè ê ç î ìè é æ ìè î ã ã æè í í ìè ê í ëè ç í ã è ä í ä è ë ã ê íè ç í êè ëÖ ñá à Û ñ û ÜÝ Ý Þ× Ú Û êè ê êè ë êè í êè ë êè ë ã è ç êè ç æè ã êè ã ã è ç êè ç
Âý þ ÿ Ð � Ô Õ Ö× Ø Ø Ù Ú Û ÜÝ Ý Þ× Ú Û õ ñ÷ ö Ù Ú Ûâ ã ã å í ê ã è î ã ã å ê ê ä è ç ã êå ë ì ç è í ä å ê ë æè í ëå í î î è ì ëå î é ä è ã ëå ë æ ä è ì ëå ä ç éè í ëå ë ä ä è ä ëå æ æ éè ê ëå ã î ìè êï Þ Þ ðâ ñ Ú ðò Ù Øó à Ý Ù â ã êå æ æ æè ê éå î ë ã è æ éå ç æ ä è ç ëå æ í æè í ëå ä ì ã è æ ëå æ ë ä è ì ã å î é íè ë ëå ê ê ä è ê ã å é ã êè í ëå ê ä ã è ã ã å é ì ç è ãï Þ Þ ðâ ô ìå ç ë éè ç ìå ê î îè ì íå æ ç ã è ì ã å ì ã íè î ã å ì ä éè ì ã å ì é ä è î ã å ä î êè ä ã å æ ì ëè ë ã å æ í ç è ê ã å ç î éè ë ã å ç ä î è äò Ù Øó àÝ Ù â ëå é ã æè ç ëå ì ä ëè ì äå ê é ã è î ì æ ìè ì í ä ã è ì í ë éè é ç ã ç è é ç ä êè î æ æ ç è í æ æ ã è é æ ä íè éõ Ø àö ñ Ø÷ ø ÚÝ Þ ö Ù ì ì ìè é î í íè ç ä é ä è é æ ä ã è ë ã ì ã è î ä î î è ë ë î ã è ë ë í æè æ ë ç ã è ã ä ç ëè ä ã ä íè íÖ Þ ö á Ù Ú â ñ Û à Þ Ú Þ ùú ö á û Þ ÷ Ù Ù â ã ê æè æ ë æ ã è ë ë ì î è ç í ìè î í êè ì í íè ì ì î è ã æ æè í æ ëè ã ä ìè ê ä ä è çø Ú ó Ù â Ûö Ù Ú Û ø ÚÝ Þ ö Ù í ì ä è ç í ë çè ä ã ã ç è æ ä í ä è ä ã ã ã è ê ä ë ã è ç ë ê ä è ê ë ã éè î ë ê éè ê ä ã ç è ä ã ê ä è ãò Ù Ý Þ Ú ð ñ Ø÷ ø ÚÝ Þ ö Ù ä ì éè é ä ã çè í ä ä î è ë ã ë î è é ã æ ç è í î ã è ë í íè ä é ëè ë ì ã è ì í ç è í ì ç è äï Þ ó Ù Ø Úö Ù Ú Û ü Ø ñ Úâ ù Ù Øâ ã ä è é îè ã î è ã ä è æ ä è ã ã è ä ã è ä ä è ê ëè ë ã è ä ã è äõ Ø à ó ñ Û Ù ü Ø ñ Úâ ù Ù Øâ ä í çè é ä ê ìè ç ä ä êè ã ã ë ç è ç ã æ ëè ç î êè ê í ç è ã î éè ë í éè ç í æè ë ì æè êÖ ñá à Û ñ û ÜÝ Ý Þ× Ú Û êè ê êè ê � êè í êè ê êè ê êè ê êè ê êè ê êè ê êè ê êè ê
�ý �ý � Ñ Ð ÕÖ× Ø Ø Ù Ú Û ÜÝ Ý Þ× Ú Û � ñ û ñ ÚÝ Ù ã å ì æ æè ã � é ì éè ç ã å ã é íè ã ë æ êè ç æ æ éè ë æ ä è ì í ä ìè ã ç ç ìè æ ä é æè ã � ë ìè ê ë æ ä è ëï Þ Þ ðâ ñ Ú ðò Ù Øó à Ý Ù â ëå ê é æè ç � ç í ã è ç î î ã è ã í ä ìè é ç ê ç è ê ë é êè ì ì æ æè æ í ë éè ä æ ë ä è î ã ã íè ì ë ä ã è ìï Þ Þ ðâ ô äå î î æè ç ã å ë ã çè ì ëå é é æè ê ã å ê ì ìè ç é ì êè í ì ç êè ì ã å ê é ã è ç é ã î è ç í î ç è ê ä ì ìè ã æ î î è äò Ù Øó àÝ Ù â � ã å ì î éè é � ã å ì ì ìè ë � ëå ã ã ëè é � æ ä éè ç � æ í ç è ç � æ í êè ê � ä æ ìè ã � ë î éè ë � ë í ã è ã � ë í êè æ � ë ç íè íõ Ø àö ñ Ø÷ ø ÚÝ Þ ö Ù � ë ä éè î � æ ë îè ë ä æè î � ä ë æè ã � ë éè ç � ë æ ã è ê � ã ã ä è é � æ éè ê � ä ëè ê � ã é ëè î ë ëè íÖ Þ ö á Ù Ú â ñ Û à Þ Ú Þ ùú ö á û Þ ÷ Ù Ù â � ã ê ã è ì � ë æ êè ç � ë ì î è ã � í ìè ì � í êè ì � í íè í � ì ìè é � æ ä è ì � æ ã è ä � ä íè ë � ä ä è çø Ú ó Ù â Ûö Ù Ú Û ø ÚÝ Þ ö Ù � ã ä îè ê � ã î ìè î ä ã ëè é � ë ç íè æ ä ã è ã � ã ì æè æ � ä íè ê � ç è ä éè ë � ã ç íè í ç íè ãò Ù Ý Þ Ú ð ñ Ø÷ ø ÚÝ Þ ö Ù � ã ã êè í ã êè ë ë î êè ã � ì ä è ä � ë íè ä � ç è é íè í � ë ëè î ëè æ æ éè ã � ã ã è ãï Þ ó Ù Ø Úö Ù Ú Û ü Ø ñ Úâ ù Ù Øâ çè ã ç ä è ì ë ëè æ æè æ ã è í ìè ê éè ã ç è ã î è í íè î ëè ìõ Ø à ó ñ Û Ù ü Ø ñ Úâ ù Ù Øâ � ã ã çè ì � æ ä è ç ë ç ìè î � ì ìè ì � ë ìè é � ã ëè é � ëè ç � ë ìè é � íè ä æ ëè ä � ã ä è îÖ ñá à Û ñ û ÜÝ Ý Þ× Ú Û êè ê êè ë ã è ë êè ë êè ë ã è ç êè ç æè ã êè ã ã è ç êè ç½ Ð Ô Ä Ð � � Ò � � � � ½ Ð Ô �� � �� Ò � � �� � �� ÿ¹� � � Ð � Ô ý � � ¹ ý Ó Ò Ôý � ¿ Ñ Ñ� � � Ô Õ Ç� Ë � �� Ç � Î Ë Î� � Ç� Ç Î Ë� � Å � Æ � Ë � � Î � � � È � Å Ê � Ë� Ê È Ê Ç � Ê � Î � � � � Å È � Ê Å � � � Ì� �� � ��� �� � �� !" � #$ %& � ' � ' ( ( � ( & $ ) *$+, & $ � !- . / �$ � - 0 . ( 0� �$ � $ 0 � ( ' � *+1 & 2 '- � ) !� '- - � � ( � (3 � � - � � � � '$ � $ % � 2� ) ! � 4� $ %3 / .� � �-+ 5 � � ! / � ' 4 ! 3 � � - � � � � '$ � $ % � 2� ) ! � 4� $ %3 / .� � �- '- !- $ 4$ �- � � 0 4 �� (+6 � �� � * / *$ $ (- ( � %$ � 1 7 ,89 1 7 , : 4$ .3 � '- � � - � ' . �� - ) / � 2� �� � �� !" � #$ %& � ' � ' ( ( � ( & $ ) *$+ � ;3 $ � �- � ( ' .3 $ � �- � � � � 3 $ � �� ( $ � < �" = < � � � $ �" $ � ( > ) - '-+

? @ A @ B C D E F G @ H I D B J KLM NO P Q R ST OU V W X W Y V X Z X Y Y [ \ W ] _ ab _ cb _ db _ ef _ gfV V V V V V V h V V V V V V V hWi j Zi k l m k n o p q r Wi j st u ut v m k n ow q x ut yU m k z k { m z | X { {t } k j w `~ _ d c� d w `~ e a �� _ w c c _� � w � e g� c w � a� ` g� c w � � � � c _ d� ^ w c d �� � d d� � w e c� c
W i jX { � } m� m j mt kt x U m k z k { m z |X � � i j�� �� � � � ��� � � �� �� � � � �� � � � �� � � � �� � � �� � � � �� � � �� � � �� � � � �� � � �� � � � � � � �� ���� � �� �� � ��� � � �� �� � � � �¡ ¢ �� � � £ £� £ � �� � � � �� � � �� � � � �� � �� � � �� � £ �� � £ �� � �� � � �� �� � ¤ � �� � ��� � �� � � � �� � � � �� � � �� � � �� £ �� � � �� � � �� £ � £� � � �� � � � � � �� �¥¦ � � §¦ �¦ ��� � � �� � � � � £ � � £ � � £� � � � �� � � £ £� � � � �� � � � �� � � � �� � � £ � � £ � � �� � � � £� � � � �� ���� � �� �� � ��� � � �� �� � � � �¡ ¢ �� � � � � £ � � � � �� £ � £ �� � � £ �� � � �� � � �� � � �� � � �� � � �� � � � �� � � � �� �� � ¤ �¡ � �� � � � � � � � � �� � � � � �� � � �� � � � £� � � £ �� � � � �� � � � � �� � � £ �� � � � �� � � � �� � � � �� � �� �� � � � ¨ � � � �� � � �� � � � � � � �� � �� � �� � � �� � �� � � �� � � � � � � � � �� � �� �© � ¢ �� �� � � � � � �� � � £ � �� � � � � � � � � � � � � �� � � � �� � � � � �� � � � � �� � � � �� � � �� � � � �� � � � � �� �© � ¢ � � ��� � �� � � � �� � �� � � �� � �� � �� � �� � � �� � �� � �� � �� �ª� � � �� � � �� � � � «¦ � � � � � � � � � � � � � �� � � � �� � � � � �� � � £ �� � � � � �� � � � �� � � � � �� � � � �� � �� � � � � �� �¬¦ �� � � � £ £� � � �� � � � �� � � � �� £ � �� £ � � �� � � �� � �� � � �� � � � � � � � �� �� � � � ª � � � � � �� �® �� �� � � � � � � £� � � � �� � � � �� � �� � � �� � � � � £� � � � £� � � �� � � � �� � � � �� � � �� £© � ¢ � � ® � �¦� � � � ¯ � � � �� � ¤ � � � � �� � � � �� � � � � �� � � � � � � � �� � � � £ �� � � � � �� � � � �� � � � � � � � � � � � � � �� �¯ � � ��� � ® � � � � � � �° � � �� � � � � £� � � �° � � �� � � � � � � � � � £ � � � � � � � � � � � �� � � � � �� � � � � �� � � � �� � � �� �
W i jV k { } u ui k {it x Z m z ± m | j mi �� �� � � � �� � � � � � �� � � £ �� � � � � � � � � � �� � � � �� � � � � � � � � � �� � � � � �� � � � �� £ � � � � � � �� � � �� ���� � �� �� � ��� � � �� �� � � � �¡ ¢ �� � � � � � � � � � � � �� � � � � �� � � � � �� � � � � � � £ � �� � � � � �� � £ �� � � � £� � � �� � � � �� �� � ¤ � �� � ��� � �� � � � � �� � � � �� � � � � �� � � � �� � £ �� £ � � � £� � � � �� � � � � �� � � �� � � �� � � �� �¥¦ � � §¦ �¦ �� � � � � � �� � � � � £� � �° � � �� £ � � � �� � � �� � � � �� � �� � � � �� � � � �� � � � �� � � � � �� � � � �� ���� � �� �� � ��� � � �� �� � � � �¡ ¢ �� � � �� � �� � �� � �� � �� � �� � �� � �� � �� � �� � �� �� � ¤ �¡ � �� � � � � � � � � � £� � �° � � �� £ � � � �� � � �� � � � �� � �� � � � �� � � � �� � � � �� � � � � �� � � � �� � �� �� � � � ¨ � � � �� � � �� � � � �� � �� � � �� � �� £ �� � � �� £ � �� � � � � � �� � �� £ � � � �© � ¢ � � ��� � � � � � � � � � � �� � � � � � � � � � �� � � � �� � � � �� � � � � �� � � � �� � � � �� � � � � � � � � �� � � £ �� �© � ¢ � � ��� � �� �� � �� � �� � �� � �� � �� � �� � �� � �� � �� � �� �ª� � � �� � � �� � � � «¦ � � � � £ � � � � �� � � � �� � �� � � �� £ �� £ � � �� £ � �� � � �� � � �� � � �� �¬¦ �� � � � � �� � � � �� � � � �� � £ £� £ � � �� � � � � �� � � � £� � � � �� � � � � � � � � �� � � � �� ��� �� � �� � �° « �� � �¦ � ° �� � � � �� � �� � � � � �² � �� �� � � � � � ¢ � � � � � �� � � �� � � � � � � � � � �� � � � � � � �� � �� � �� � �� � � �� �� � � � ª � � � � � �� �® �� �� � � � � � � � � � � � � � � �� � � � �� � � � � � � � � �� � � �� � � � £� � £� £ � �� � � �� �© � ¢ � � ® � �¦� � � � ¥ � � � ¤ � � � £� £ � � � � � � £ �� � � �� � � � �� � � � � �� £ � �� � � � � £� � � �� � � � £� £ � � � � � �¡ « � � � � ¨ � � �³ �� ² ¯ �² ¢ � � � � �� � �� � � �� £ £� � � � �� � � �� � �� � � �� � �� � � �� � �� �Wi j u ut u � z k l [ y m � � mt k � w ^~ e _� e w e d �� d w `~ e a d� d w c � _� � w � g �� a e �� � w g a � _ � a� c w `~ _ c e� � a _ � g w � � _� �µ ¶· ¹º» ¹¼ ½ ¾¿ À Á À ½ ÃÄ ÅÆ ¿ Ç ½ Ç È À È À ½ È Æ Ä É À ÊÄËÌ Æ Ä ¾ À ÁÍ Î À Ï ½Ä ¾ Í Ð Î È Ð¼ ¾Ä ¿ Ä Ð ½ È Ç ½ ÊËÑ Æ Ò ÇÍ ¾ À É Á¼ ÇÍ À Í ¾ À ½ È À¿ ÈÓ ¿ ¼ Í ¼ ½ ¾ À ¾ ÇÄ ½ Ä Å ¾ Ò¼ É À Á À ½ Ô¼ Ä ÅÓ À Ï Î¼ ½ ¾ÍË Õ ½ À ½ À Á Ï ¾ Ç Ô À Á Ó ¿ ¼ Í ¼ ½ ¾ À ¾ ÇÄ ½ Ä Å ¾ Ò¼ É À Á À ½ Ô¼ Ä ÅÓ À Ï Î¼ ½ ¾Í ÇÍ À ÁÍ Ä ÔÄ ½Í ¾ ¿ Ð Ô ¾¼ ÈË
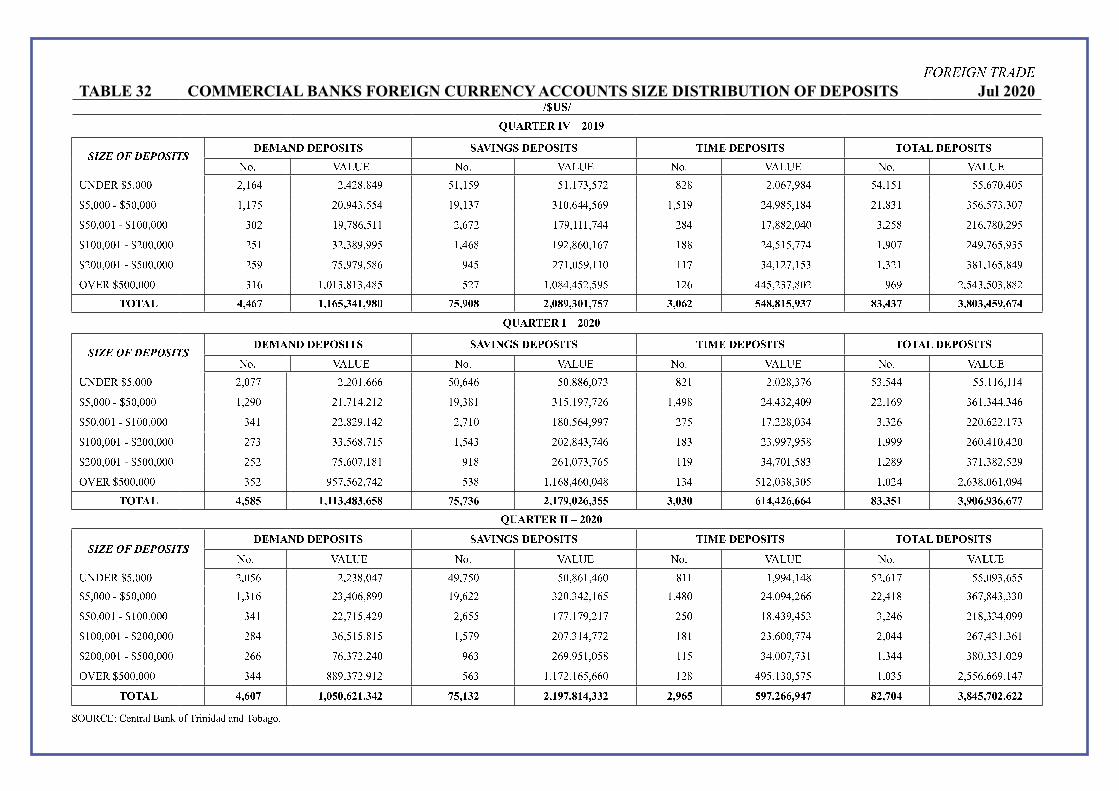
� � � � � � � � � � � � � � � � � � � � � �� � � � �� � � � � ! � " � � � # � $ � % � & $ $ � ' ( ) � � ) ) � � � & * ) $ � ' ( ) � � ) � � % � $ � ' ( ) � � ) � ( � � + $ � ' ( ) � � ),-. / 0 1 2 3 ,- . / 0 1 2 3 ,-. / 0 1 2 3 ,- . / 0 1 2 32 , 4 3 5 678 9 9 9 :8 ; < = :8 = : >8 > = ? 7 ;8 ; 7 ? 7 ;8 ; @ A8 7 @ : > : > :8 9 < @8 ? > = 7 =8 ; 7 ; 7 78 < @ 98 = 9767 8 9 9 9B 67 98 9 9 9 ;8 ; @ 7 : 98 ? = A8 7 7 = ; ?8 ; A @ A ; 98 < = =8 7 < ? ;8 7 ; ? : =8 ? > 7 8 ; > = : ;8 > A ; A 7 <8 7 @ A8 A 9 @67 98 9 9 ; B 6 ; 9 98 9 9 9 A 9 : ; ?8 @ > <8 7 ; ; :8 < @ : ; @ ?8 ; ; ;8 @ = = : > = ; @8 > > :8 9 = 9 A8 :7 > : ; <8 @ > 98 : ?76 ; 9 98 9 9 ; B 6 : 9 98 9 9 9 :7 ; A :8 A > ?8 ? ?7 ;8 = < > ; ? :8 > < 98 ; < @ ; > > : =8 7 ; 7 8 @ @ = ;8 ? 9 @ : = ?8 @ <7 8 ? A 76 : 9 98 9 9 ; B 67 9 98 9 9 9 :7 ? @7 8 ? @ ?8 7 > < ? =7 : @ ;8 97 ?8 ; ; 9 ; ; @ A =8 ; : @8 ; 7 A ;8 A : ; A > ;8 ; <7 8 > = ?C / 3 5 6 7 9 98 9 9 9 A ; < ;8 9 ; A8 > ; A8 = > 7 7 : @ ;8 9 > =8 =7 :8 7 ?7 ; : < = =7 8 : A @8 > 9 : ? < ? :8 7 = A8 7 9 A8 > > :� ( � � + DE D F G � E � F H E I D � E � J � G H E � � J � E � J � E I � � E G H G I E � F � H D J E J � H E � I G J I E D I G I E J � I E D H � E F G D� � � � � � � � � � � � �� � � � � ! � " � � � # � $ � % � & $ $ � ' ( ) � � ) ) � � � & * ) $ � ' ( ) � � ) � � % � $ � ' ( ) � � ) � ( � � + $ � ' ( ) � � ),-. / 0 1 2 3 ,- . / 0 1 2 3 ,-. / 0 1 2 3 ,- . / 0 1 2 32 , 4 3 5 678 9 9 9 :8 9 @ @ :8 : 9 ;8 < < < 7 98 < = < 7 98 > > <8 9 @ A > : ; :8 9 : >8 A @ < 7 A8 7 = = 7 78 ; ; <8 ; ; =67 8 9 9 9B 67 98 9 9 9 ;8 : ? 9 : ;8 @ ; =8 : ; : ; ?8 A > ; A ; 7 8 ; ? @8 @ : < ;8 = ? > : =8 = A :8 = 9 ? : :8 ; < ? A < ;8 A = =8 A = <67 98 9 9 ; B 6 ; 9 98 9 9 9 A = ; : :8 > : ?8 ; = : :8 @ ; 9 ; > 98 7 < =8 ? ? @ : @7 ; @8 : : >8 9 A = A8 A : < : : 98 < : :8 ; @ A6 ; 9 98 9 9 ; B 6 : 9 98 9 9 9 : @ A A A8 7 < >8 @ ; 7 ;8 7 = A : 9 :8 > = A8 @ = < ; > A : A8 ? ? @8 ? 7 > ;8 ? ? ? : < 98 = ; 98 = : 96 : 9 98 9 9 ; B 67 9 98 9 9 9 : 7 : @7 8 < 9 @8 ; > ; ? ; > : < ;8 9 @ A8 @ <7 ; ; ? A =8 @ 9 ;8 7 > A ;8 : > ? A @ ;8 A > :8 7 : ?C / 3 5 6 7 9 98 9 9 9 A 7 : ?7 @8 7 < :8 @ = : 7 A > ;8 ; < >8 = < 98 9 = > ; A = 7 ; :8 9 A >8 A 97 ;8 9 : = :8 < A >8 9 < ;8 9 ? =� ( � � + D E H J H � E � � I E D J I E F H J G H E G I F � E � G � E � � F E I H H I E � I � F � D E D � F E F F D J I E I H � I E � � FE � I F E F G G� � � � � � � � � � � � � �� � � � � ! � " � � � # � $ � % � & $ $ � ' ( ) � � ) ) � � � & * ) $ � ' ( ) � � ) � � % � $ � ' ( ) � � ) � ( � � + $ � ' ( ) � � ),- . / 0 1 2 3 ,- . / 0 1 2 3 ,-. / 0 1 2 3 ,- . / 0 1 2 32 , 4 3 5 678 9 9 9 :8 97 < :8 : A >8 9 = @ = ?8 @ 7 9 7 98 > < ;8 = < 9 > ; ; ;8 ? ? =8 ; = > 7 :8 < ; @ 7 78 9 ? A8 <7 767 8 9 9 9B 67 98 9 9 9 ;8 A ; < : A8 = 9 <8 > ? ? ; ?8 < : : A : 98 A = :8 ; <7 ;8 = > 9 : =8 9 ? =8 : < < : :8 = ; > A < @8 > = A8 A A 967 98 9 9 ; B 6 ; 9 98 9 9 9 A = ; : :8 @ ; 7 8 = : ? :8 <7 7 ; @ @8 ; @ ?8 : ; @ : 7 9 ; >8 = A ?8 =7 A A8 : = < : ; >8 A A =8 9 ? ?6 ; 9 98 9 9 ; B 6 : 9 98 9 9 9 : > = A <8 7 ; 7 8 > ; 7 ;8 7 @ ? : 9 @8 A ; =8 @ @ : ; > ; : A8 < 9 98 @ @ = :8 9 = = : < @8 = A ;8 A < ;6 : 9 98 9 9 ; B 67 9 98 9 9 9 : < < @ <8 A @ :8 : = 9 ? < A : < ?8 ? 7 ;8 97 > ; ; 7 A =8 9 9 @8 @ A ; ;8 A = = A > 98 A A ;8 9 : ?C / 3 5 6 7 9 98 9 9 9 A = = > > ?8 A @ :8 ? ; : 7 < A ;8 ; @ :8 ; <7 8 < < 9 ; : > = ?7 8 ; A 98 7 @7 ;8 9 A 7 :8 7 7 <8 < < ?8 ; = @� ( � � + D E F � G � E � H � E F � � E I D � G H E � I � � E � � GE J � D E I I � � E � F H H � GE � F F E � D G J � E G � D I E J D HE G � � E F � �K LM N OPQ OR S TU V WX V S YZ [\ U ] S ] V ^ V S ^ \ Z _ V Za
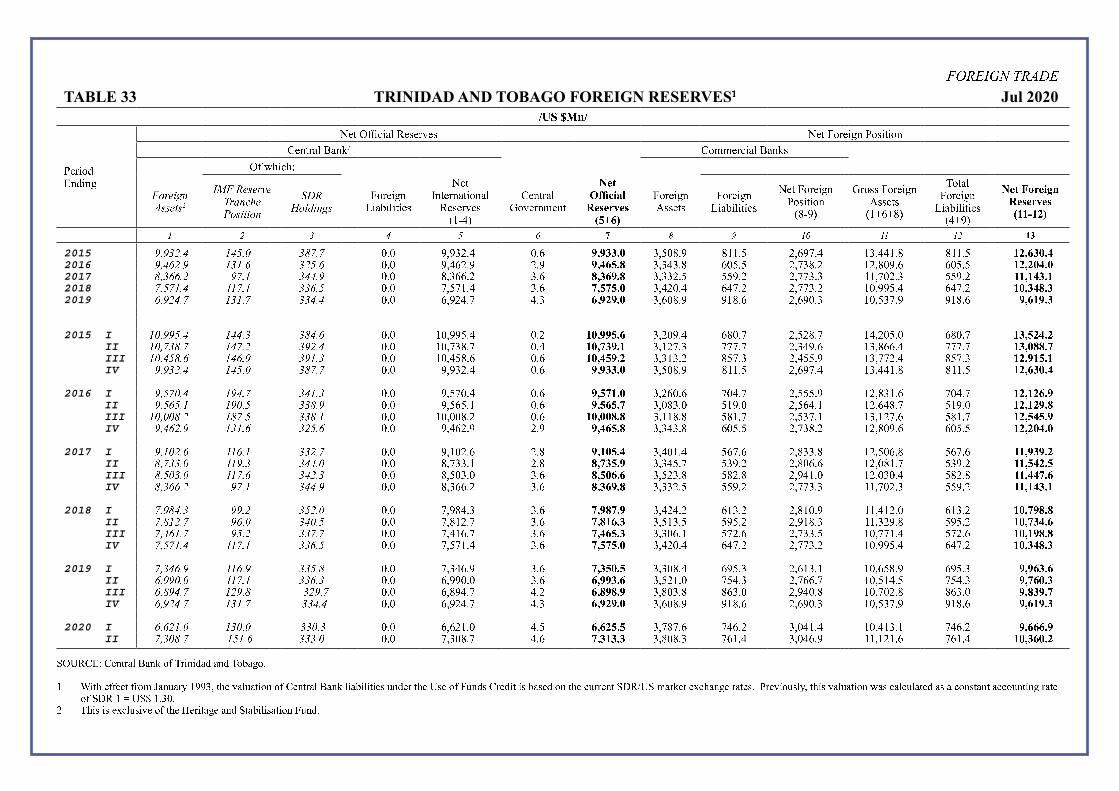
� � � � � � � � � � �� � � �� ��� � �� ��� � �� � �� � � � �� � !" � #� �$ � # �� � % � �� � �� � � # � � �� �&� � � � !' � ( ) & � * *� �� � !' � ( #� �+ , �� ,-./ 0 1 23 456 6 1 76 8 9 : . ; 16 1 0 < 1= 0 > 4 ? @ 1A / 6 2 7 2 / 4 B C ;D/ E F 2 4 3 6 % � �� � ��G � H � ! � � �� # �� �I� �� �� � �� � !" � #� �$ � #JKL M N &� � � � !O� $ � �� *� � � PQ RS T UV WX YZQ [ Q \ ]Q [_ a b % � �� � ��c # #� � # % � �� � ��G � H � ! � � �� # �� � % � �� � ��� � # � � �� �JdL e N O �� # # % � �� � ��c # #� � #JK f g fd N h� � !% � �� � ��G � H � ! � � �� #J M f e N PQ R ij \Q Wk lZQ [Q \ ]Q [m mn m o bp q r s t u v w x p y p p p q z {2015
|} | ~ �� � � � �� � ~ � �� � �� � e� e � �� M �� g �� � � �� � � � � � d � e d K K � � �� g e �� M K � � M M K � d d K K � � m o � a � �� �
2016
|} � � �� | � ~ � � � ~ � �� � �� � e� M g �� e �� e �� � a _� � � � � M � � d g � � � � �� � � d � � K �� d � e� g g � � � � m o � o � �� �
2017
�} ~ � �� � | �� � ~ � �� | �� � d � � g g� � � � g �� � a �� � � � � � �� � � � e� � �� � � � � � K K � � � �� � � � e � � m m � m � �� m
2018
�} � � � � � � � �� � ~ ~ �� � �� � �� � � K � M � � g �� _ � _� � � � M � �� M g M �� � �� � � � � � K �� e e � � M g M � � � m �� � � �� �
2019
�} | � �� � � ~ � � � ~ ~ �� � �� � g� e � M� � M� � a� � o �� � � � g � d � e e K d � g �� g e �� � K �� � � �� e e K d � g �� a m �� �
2015 I
� �} | | �� � � � �� ~ ~ � �� � �� � K �� e e � � M �� � m �� � � _� a � � � � e� M gd �� � �� � � d � � K M� � � � � � gd �� � m � � _ o �� o
II
� �} � ~ �� � � � �� � ~ | � � � �� � K �� � � d � � �� M m �� � � �� m � � K � �� � � � �� � �� � M e� g K � � d g g� M � � � � � m � � � � �� �
III
� �} � � �� � � � �� | ~ | � � ~ �� � K �� M � d � g �� g m �� � _ �� o � � � K � � � d � �� � �� M � � � e K � � � � �� M d � � � � m o � � m _� m
IV
|} | ~ �� � � � �� � ~ � �� � �� � e� e � �� M �� g �� � � �� � � � � � d � e d K K � � �� g e �� M K � � M M K � d d K K � � m o � a � �� �
2016 I
|} � � �� � � | �� � ~ � � � ~ �� � e� � � �� M �� g �� _ � m � � � � � g �� g � � M� � �� � � � � e K �� d � K � g � � M� � m o � m o a� �
II
|} � � �� � � | �� � ~ ~ �� | �� � e� � g � � K �� g �� _ a _� � � � �d � � � � K e� � �� � g M� K K �� g Md � � � K e � � m o � m o �� �
III
� �} � � �� � � � �� � ~ ~ �� � �� � K �� � � d � � �� g m �� � � �� � � � K K d � d � d K � � �� � � �� K K � � K � �� g � d K � � m o � _ � _� �
IV
|} � � �� | � ~ � � � ~ � �� � �� � e� M g �� e �� e �� � a _� � � � � M � � d g � � � � �� � � d � � K �� d � e� g g � � � � m o � o � �� �
2017 I
|} � � �� � � � �� � ~ ~ � � � �� � e� K � �� g �� d �� m � _� � � � M � K � M � g �� g �� d � � � d K �� � � g� d � g � � g m m � � � �� o
II
�} � ~ ~ � � � � |� ~ ~ � �� � �� � d � � � � � K �� d �� � � _� � � � � M � � � � � e� � �� d � g� g K �� � d K � � � � e � � m m � _ � o� _
III
�} � � ~ � � � � �� � ~ � � � ~ �� � d � � � � � � � � g �� _ � a� a � � � � � � d � d �� d �� e M K � � K �� � � �� M � d � � d m m � � � �� a
IV
�} ~ � �� � | �� � ~ � �� | �� � d � � g g� � � � g �� � a �� � � � � � �� � � � e� � �� � � � � � K K � � � �� � � � e � � m m � m � �� m
2018 I
�} | � �� ~ | |� � ~ � � � � �� � �� e d M� � � � g �� � � �� � � � M � M� � g K � � � �� d K �� e K K � M K �� � g K � � � m �� � � �� �
II
�} � � �� � | �� � ~ � �� � �� � �� d K �� � � � g �� � m a� � � � � K � � � � e � � � �� e K d � � K K � � � e� d � e � � � m �� � � �� a
III
�} � � � � � | �� � ~ ~ �� � �� � �� M K g� � � � g �� � a _� � � � � � g� K � � �� g �� � � � � � K �� � � K � M � � � � g m �� m � �� �
IV
�} � � � � � � � �� � ~ ~ �� � �� � �� � � K � M � � g �� _ � _� � � � M � �� M g M �� � �� � � � � � K �� e e � � M g M � � � m �� � � �� �
2019 I
�} ~ � �� | � � �� | ~ ~ �� � �� � �� � M g� e � � g �� � _ �� _ � � � � d � M g e � � � �� g K � � K K �� g � d � e g e � � � �� � a �� a
II
�} | | �� � � � �� � ~ ~ �� ~ �� � g� e e �� � � � g a� � � �� a � � � � K � � � � M� � �� � g g� � K �� � K M� � � � M� � �� � a �� �
III
�} � | �� � � � |� � ~ � |� � �� � g� d e M� � M� � a� � � �� � � � d � � � d d g � � � �� e M �� d K �� � � �� d d g � � � �� � � �� �
IV
�} | � �� � � ~ � � � ~ ~ �� � �� � g� e � M� � M� � a� � o �� � � � g � d � e e K d � g �� g e �� � K �� � � �� e e K d � g �� a m �� �
2020 I
�} � � � � � � ~ �� � ~ ~ �� ~ �� � g� g � K � � M� � a� a o _� _ � � � d �� g � M g� � � � � M K � M K �� M K � � K � M g� � �� a a a� �
II
�} ~ � �� � � � � � � ~ ~ ~ � � �� � �� � � d � � M� g �� � m �� � � � d � d � � � g K � M � � � M g� e K K � K � K � g � g K � M m �� � a �� o� �� � ��� �� � ¡ ¢ £¤ ¢ � ¥¦ §¨ ¡ © � © ª ¢ ª ¢ � ª ¨ ¦ « ¢ ¬¦® ¯ © ° � § §� ± §¡ ¦ ² ³ ¢ � ¢¡ µ ® ¶ ¶ ·¸ °� ¹ ¢ £ ¢ ©¦ �¦ § �� � ¡ ¢ £ ¤ ¢ � ¥ £ © ¢ « © £ © ©� º � ª� ¡ °� � º� ¦ §» � ª º � ¡ � ª © © º « ¢ º� ª ¦ � °� ± ¡ ¡ � � �¼ � ½� � ² ¢¡ ¥� � ¾ ± ° ¢ � ¬� ¡ ¢ � º ¿ ¡ � ¹ ©¦ º £ µ¸ ° © º ¹ ¢ £ ¢ ©¦ � À ¢ º ± ¢ £ ± £ ¢ � ª ¢ º ¢ ±¦ � º ¢ � ¢ ± ±¦ � © � ¬ ¡ ¢ �¦ § �¼ � ®Á � �  ® · ÃÄ ¨ ° © º © º � ¾ ± £ º © ¹� ¦ § °� Å� ¡ © ¢ ¬� ¢ � ª � ¢ « © £ © º ¢ ©¦ � » � ª

APPENDIX II
FEATURE ARTICLES

ECONOMIC BULLETIN VOLUME XXII NO. 2 86
in a timE of coVid-19:
tHE impact of ExtERnal conditions on tHE tRinidad and toBago Economy
by
Karen A. Roopnarine, Darcelle Bowrin, and Susan Ramirez1
“External shocks on small, open economies can lead to booms and busts in employment and output, balance of payments crisis, exchange rate instability, reallocation of resources,
and ‘Dutch’ disease.” (Gafar, 1996)2
This Feature Article draws heavily from Roopnarine et al. (2019) 3, who investigated the extent to which external conditions affected the growth performance of Trinidad and Tobago over the period 1971-2014. Here, we extend the analysis to include the possible impacts of COVID-19 on the Trinidad and Tobago economy. In the original paper, proxies used for external conditions included Gross Domestic Product (GDP) from Trinidad and Tobago’s largest trading partner (US), the ratio of capital inflows to CARICOM member-states as a share of their collective GDP, and crude oil prices. The paper explored how these external conditions helped to explain Trinidad and Tobago’s growth path over the past four decades. The results of the study revealed that crude oil prices have a positive significant influence on domestic GDP growth, government revenue, and domestic prices. Meanwhile, a positive shock to external financial conditions coincided with a decrease in government debt. The authors also analysed the impact of the external environment on the Trinidad and Tobago economy over two distinct periods – pre- and post-trade and financial liberalisation. It was found that the relative importance of the external variables changed over time. For instance, over the entire period under review, crude oil prices had a strong influence on all the domestic macroeconomic variables considered. However, post-liberalisation crude oil prices no longer had a statistically significant influence on domestic GDP, whereas US GDP and regional financial conditions had a positive impact on domestic output. The current COVID-19 pandemic will intensify these outcomes as it has been estimated that for 2020, the economies of the US and the Caribbean will experience deep contractions, and energy prices have plummeted. Summarily, it was found that the external environment has a sizable impact on the macroeconomic performance of the small, open economy of Trinidad and Tobago.
Trinidad and Tobago can be characterised as a small open, export-oriented economy. Like other similar economies, it is vulnerable to large business cycle swings that originate from the external environment (Gafar, 1996). The 2008 Global Financial Crisis (GFC) resulted in economic activity declining in half of all countries in the world. A decade later, the output in many countries was still well below levels that would have prevailed had growth followed its pre-crisis trend (IMF, 20184). In 2019, global growth decelerated because of weaknesses in global trade and investment, heightened uncertainty emanating from the trade war between the US and China, and lower commodity prices (CBTT, 20195). Financial markets in 2019 were volatile in the face of protectionist policies implemented particularly by the US, and capital inflows to Emerging Markets and Developing Economies (EMDEs) were subdued, reflecting increased risk aversion by investors (CBTT, 2019). The emergence and spread of the coronavirus (COVID-19) in late-December 2019 and early-January 2020 became a serious threat to global growth in 2020. On March 11, 2020, the World Health Organisation declared the outbreak a pandemic given its presence in multiple regions. Along with the human costs, the virus has affected global trade, supply and demand across many industries, upended some commodity prices
1 The authors are economists in the Research Department at the Central Bank of Trinidad and Tobago. The views expressed here are those of the authors and not necessarily those of the Central Bank of Trinidad and Tobago. Please send comments to: [email protected] and/or [email protected].
2 Gafar, J. 1996. Macroeconomic Performance and External Shocks on Small, Open Economies: The Caribbean Experience. The Journal of Developing Areas. Vol. 30, No. 3 (April) pp. 341-360.
3 Roopnarine, K., D. Bowrin, and S. Ramirez (2019). The Impact of External Conditions on a Small Open Economy: A Structural-VAR Approach for Trinidad and Tobago. Central Bank of Trinidad and Tobago Working Paper Series, WP 04/2019 (September). The full paper can be accessed here: http://www.central-bank.org.tt/sites/default/files/page-file-uploads/the-impact-of-external-conditions-on-a-small-open-economy-a-structural-var-approach-for-trinidad-and-tobago.pdf.
4 See https://www.imf.org/en/Publications/WEO/Issues/2018/09/24/world-economic-outlook-october-2018.5 See https://www.central-bank.org.tt/sites/default/files/page-file-uploads/2019-annual-economic-survey.pdf.

ECONOMIC BULLETIN VOLUME XXII NO. 2 87
and rattled financial markets (CBTT, 20206). This article quantifies the impact of these external developments on the economy of Trinidad and Tobago.
In its most recent World Economic Outlook Update (June 2020), the International Monetary Fund (IMF) downgraded almost every country’s growth forecast for 2020. Before COVID-19, the ‘new’ dynamics of the global economy7 could have potentially increased the intensity of existing vulnerabilities and given rise to new vulnerabilities. These existing (and new) vulnerabilities are very likely to come to the forefront now, as the economic impact of COVID-19 will see the global economy possibly shrinking by as much as 4.9 per cent, according to the IMF – the worst decline since the Great Depression of the 1930s.
The economic damage on the global economy is being driven largely by a fall in demand. Several industries have been heavily affected, particularly, travel and tourism (a major source of income for the Caribbean region). The majority of countries around the globe (except China), including advanced economies, are expected to contract sharply in 2020. Advanced economies are struggling with rising unemployment and low consumer confidence. Furthermore, the row between the Organisation of the Petroleum Exporting Countries (OPEC) and Russia had a dampening effect on oil prices, which was exacerbated by COVID-19. In April 2020, the price of both Brent crude and West Texas Intermediate (WTI) dipped to historic lows amid low global consumption. The price of Brent crude went below US$20 per barrel (the lowest level in 18 years), while the price of WTI on the futures market turned negative for the first time in history amid the deepest fall in demand in 25 years.
External conditions have heavily influenced Trinidad and Tobago’s medium-term growth performance, mainly because the economy is small, highly open, and commodity-export-oriented. Roopnarine et al. (2019) found that external conditions had a greater impact on Trinidad and Tobago’s macroeconomic performance over the past four decades (1971-2014) than domestic economic factors. More specifically, international commodity prices and the degree of synchronisation with major trading partners were crucial determinants of Trinidad and Tobago’s growth pattern with differing impacts in the pre and post-trade and financial liberalisation periods.
Trinidad and Tobago’s growth performance, as measured by increases in real GDP, over the last four decades (1971-2014) can be categorised into four (4) distinct periods: (i) high growth in the 1970s up until 1982; (ii) recessionary conditions in the following ten years between 1983 and 1993; (iii) fourteen years (1994-2008) of consecutive growth when the economy recovered and expanded; and (iv) then declining levels of economic activity from 2009 onwards. Given that Trinidad and Tobago has been an oil- and natural gas-exporting economy, energy price fluctuations have been mostly responsible for the country’s uneven economic performance (Figure 1). Periods of favourable macroeconomic conditions and GDP growth have coincided with high petroleum prices, while periods of subdued economic activity have occurred in a low oil price environment.
6 See https://www.central-bank.org.tt/sites/default/files/page-file-uploads/economic-bulletin-january-2020_5.pdf. 7 Some of these include: heightened geopolitical tensions, the imposition of trade tariffs on China by the US, the tightening of
financial conditions (cross-border lending has declined as large US and European banks have retreated from foreign markets), slower productivity growth, relatively low commodity prices, and the realization of a Brexit withdrawal of the United Kingdom from the European Union.
figURe 1wti oil pRices Real gdp gRowth in tRinidad and tobago

ECONOMIC BULLETIN VOLUME XXII NO. 2 88
In the post-2014 period, both crude oil and natural gas prices took a nosedive. During the years 2015-2018, WTI prices averaged US$51.91 per barrel while Henry Hub natural gas prices averaged US$2.81 per mmbtu (million British thermal units), compared with average crude oil and natural gas prices of US$93.11 per barrel and US$4.37 per mmbtu, respectively, in 2014. Meanwhile, over the same period (2015-20188), real GDP growth averaged -1.8 per cent, a sharper decline compared with the 0.9 per cent contraction recorded in 2014. According to the International Energy Agency (IEA), the pandemic will reduce global demand for oil by about 9.3 million barrels a day in 2020 from a year ago9. Brent crude oil, whose price is closer to Trinidad and Tobago’s local crude than WTI, dropped below US$20 per barrel earlier in 2020, but has since improved and in June 2020 was trading around $40 per barrel. Nonetheless, the collapse in energy prices in 2020 due to the economic fallout of COVID-19, has resulted in an anticipated TT$9.2 billion drop in government revenue during fiscal year 2019/2020. The Government of Trinidad and Tobago also estimates that domestic GDP will contract by 2.4 per cent in 202010.
While Trinidad and Tobago’s trading partners are wide-ranging and export market access is diverse, the dominant partner remains the US, followed by the Caribbean and to a lesser extent the European Community. The importance of the US as a major trading partner grew between 1997 and 2007. As the petroleum sector expanded into liquefied natural gas (LNG) production and petrochemicals, the US became a captive market for Trinidad and Tobago’s exports of LNG, ammonia, urea, and methanol. The share of LNG and chemicals exports to total exports increased as well as the share of exports to the US market. Exports to the US increased from an annual average of 40 per cent of total exports in the period 1997-2002 to 58 per cent from 2003-2007. With the downturn in the Trinidad and Tobago economy in the period 2009-2014, exports to the US fell to an average of 45 per cent.
The growth patterns for Trinidad and Tobago and the US were generally in sync over the period 1971-2014. Over this time period, the correlation between Trinidad and Tobago’s real GDP growth and US GDP growth was “very strong”, estimated at 89 per cent (Figure 2). Given the importance of the US market to Trinidad and Tobago’s exports, the volatility of US economic activity therefore has a direct bearing on the Trinidad and Tobago economy. The US became the global epicentre of the coronavirus outbreak, and the country’s lockdown measures gave rise to unprecedented levels of unemployment. The US unemployment rate peaked at 14.7 per cent in April 2020 – the highest level on record – and the IMF (June 2020) now estimates that the economy will contract by as much as 8.0 per cent in 202011.
8 The latest available annual GDP growth data for Trinidad and Tobago is 2018. 9 See https://www.iea.org/reports/oil-market-report-april-2020.10 See https://www.finance.gov.tt/wp-content/uploads/2020/06/Supplementary-Appropriation-and-Mid-Year-Review-Statement-2020.
pdf. 11 See IMF’s World Economic Outlook Update, June 2020. Available at: https://www.imf.org/en/Publications/WEO/Issues/2020/06/24/
WEOUpdateJune2020.
Source: Central Stastical Office Sources: Central Stastical Office and US Bureau of Economic Analysis
a) Export Market Access (per cent of total exports)
figURe 2exteRnal demand and tRinidad and tobago’s Real gRowth
b) Real GDP Growth Rates

ECONOMIC BULLETIN VOLUME XXII NO. 2 89
Sources: Central Statistical Office and International Monetary Fund’s Interna-tional Financial Statistics (IFS) database
figURe 3exteRnal financial condtions and Real gdp gRowth in tRinidad and tobago
The Caribbean is the second most important export market for Trinidad and Tobago. Exports to the Caribbean12 accounted for 22 per cent of total exports between 1994 and 2008. During the period 2009-2014, Trinidad and Tobago’s exports to the Caribbean declined to an average of 15 per cent of total exports. The GFC of 2008-2009 caused a slowdown in economic activity in almost all Caribbean countries. The associated weak consumer demand caused the value of Trinidad and Tobago exports to the region to be more than halved in 2009, with energy exports declining by 65 per cent and non-energy exports falling by 17 per cent. Tighter financial conditions within the region have coincided with periods of poor economic performance for Trinidad and Tobago. During the economic boom years (1994-2008), Trinidad and Tobago’s GDP growth averaged 7.1 per cent when capital flows to the region accelerated, on average, by 20.8 per cent. Then, during the period of depressed growth (2009-2014) when the country’s GDP growth averaged 0.3 per cent, capital flows to the region declined, on average, by 5.6 per cent (Figure 3).
12 These calculations included the following Caribbean countries: Jamaica, Barbados, Belize, Bahamas, ECCB except Anguilla, Haiti, and Suriname.
13 These include Antigua and Barbuda, Aruba, Bahamas, Barbados, Belize, Dominica, Grenada, Jamaica, St. Kitts and Nevis, St. Lucia, and St. Vincent and the Grenadines.
14 These include Guyana, Suriname, and Trinidad and Tobago.
For the period under study (1971-2014), external regional financial conditions and US GDP were highly correlated (0.83). Given that the US economy is expected to endure a sharp contraction in economic activity during 2020, financial flows to the region are also likely to contract. Further, as cross-border travel and tourism came to a virtual standstill and key source markets in advanced economies plunged into a deeper recession, the tourism-dependent economies of the region are likely to experience a very sharp and protracted contraction in economic activity. Despite the reopening of borders starting in June 2020 for some Caribbean countries, international tourist arrivals are expected to return to pre-crisis levels only gradually over the next three years (IMF, June 2020). In its June 2020 World Economic Outlook Update, the IMF estimated that tourism-dependent economies of the Caribbean13 would contract by 10.3 per cent in 2020. Meanwhile, the commodity-exporting economies of the region14 have been hit by the steep drop in energy prices through the loss of exports and fiscal revenues. With the Caribbean region experiencing its deepest recession in over half a century, Trinidad and Tobago’s exports to the region will undoubtedly be negatively impacted.
Using annual data for the period 1971-2014, Roopnarine et al. (2019) analysed the impact of three external variables – international commodity prices (WTI prices); external demand (US GDP); and external (regional) financial conditions – on the domestic economy of Trinidad and Tobago. The authors concluded that real domestic GDP responded positively over the medium-term to an increase in oil prices. This result was expected given that Trinidad and Tobago is a commodity exporter of energy-related products, including

ECONOMIC BULLETIN VOLUME XXII NO. 2 90
crude oil. A one-time positive shock to oil prices led to a (sustained) increase in government revenue, which continued over the medium-term. Government revenue is a key channel through which oil prices affect Trinidad and Tobago’s macroeconomy, as the government is the main receiver of oil revenues. World oil prices have substantial pass-through effects on domestic prices in Trinidad and Tobago, as a one-time increase in oil prices led to higher inflation over the medium-term. Lastly, the response of government debt to a rise in international oil prices was negative. This result was not surprising given the positive relationship between oil prices and government revenue. As oil prices increase, so too does government revenue, thus dampening the need to access debt financing. Although the country has since closed its oil refinery, the movement in oil prices is still relevant for the economy, as price changes in oil, natural gas, and petrochemicals tend to mirror each other.
Surprisingly, over the full sample period (1971-2014), a positive one-time shock to US GDP did not affect domestic output or government revenue. This outcome is in keeping with previous work by Fuentes et al. (2015) 15 who found the degree of correlation between the co-movements of GDP for the US and Trinidad and Tobago over 1950-2010 to be “low” (0.52). The measure of correlation used by Fuentes et al. (2015) was the index of concordance, which is a correlation coefficient that quantified the extent to which both economies were in the same state of either contraction or expansion. Meanwhile, domestic prices responded negatively to an increase in US real GDP. The negative pass-through effect of an increase in US GDP on domestic prices lasted for about three years until the negative impact tapers off. Government debt increased in response to a one-off increase in US GDP; however, this increase only lasted in the short-run (at most three years).
For a one-time positive shock in the regional financial conditions index16, over the full sample period, there was little to no impact on domestic output, government revenue, and domestic prices. Meanwhile, government debt decreased in response to a one-time positive shock to external financial conditions.
The authors also analysed the impact of changes in the external environment over two distinct periods – pre- and post-financial and trade liberalisation (1971-1993 versus 1994-2014) to assess if the external environment had differing impacts on the domestic economy following these structural changes. Pre-1993, a shock to crude oil prices had a significant effect on all domestic variables – for example, a one-time positive shock in crude oil prices increased domestic output, government revenue, and domestic inflation, while it led to a decrease in government debt. In comparison to the latter years, a shock to crude oil prices no longer had a significant impact on domestic output, inflation, and government debt. This result also held when the model was run replacing crude oil prices with natural gas prices.
Trinidad and Tobago first exported liquefied natural gas in May 1999, and exports would have been minimal at that time. The sale prices of Trinidad and Tobago’s LNG exports are usually negotiated based on fixed and guaranteed LNG contract prices17, whereas the model used by Roopnarine et al. (2019) included spot LNG prices. Fuentes et al. (2015) also failed to establish a long-run relationship between real domestic GDP and natural gas prices. They postulated that the relationship between natural gas prices and GDP was not straightforward. Although the country earns revenue through the export of natural gas, natural gas is also a key input in fertilisers, which the country also exports. Natural gas would, therefore, have been considered as a cost in the measurement of GDP (Fuentes et al. 2015).
15 Fuentes, J. Rodrigo, Karl Melgarejo, and Valerie Mercer-Blackman (2015, June). Understanding Economic Growth in the Caribbean Region: A Conceptual and Methodological Study. IDB Working Paper Series No. IDB-WP-595. Inter-American Development Bank Country Department Country Group.
16 The regional financial conditions index is a “quantity-based measure of capital flows to peer economies” (i.e. CARICOM member states). This Thisindex aimed to capture the capital flow push factors that are exogenous to Trinidad and Tobago and included both direct and portfolio investments to the CARICOM region excluding Trinidad and Tobago. These capital flows were aggregated to arrive at gross capital flows and was taken as a percentage of total GDP for all countries (except Trinidad and Tobago) in the year prior. See Roopnarine, Bowrin, and Ramirez (2019) pp.10 for further details.
17 See Trinidad and Tobago Gas Master Plan Final Report (September 2015), Section 9.3 pp. 9-27. Available at: http://www.energy.gov.tt/wp-content/uploads/2020/01/Trinidad-and-Tobago-gas-master-plan-2015.pdf.

ECONOMIC BULLETIN VOLUME XXII NO. 2 91
18 See here for full report: https://www.iea.org/reports/gas-2020. 19 Capelle-Blancard, G. and Adrien Desroziers (2020). The stock market and the economy: Insights from the COVID-19 crisis. VOX,
CEPR Policy Portal. Available at: https://voxeu.org/print/65854.
The result of the model run replacing crude oil prices with natural gas prices showed that a one-time positive shock to US GDP and the regional external financial conditions index had significant positive impacts on domestic output. Notably, natural gas prices are highly correlated with both US GDP and the regional external financial conditions index (0.73 and 0.91, respectively). In 2020, natural gas is expected to experience its largest demand shock on record as the COVID-19 pandemic hits an already weakened market. According to the International Energy Agency’s (IEA) Gas 2020 report (released in June 2020), global consumption of natural gas is expected to drop by twice the amount it did after the 2008-2009 GFC. Gas consumption is likely to fall by 4.0 per cent in 2020, due to the successive impacts of lower heating demand from a warmer winter, the implementation of lockdown measures in almost all countries, and the lower level of macroeconomic activity caused by COVID-19 (IEA, 2020)18. During the first five months of 2020, Henry Hub natural gas prices averaged US$1.84 mmbtu compared with an average of US$2.80 over the same period one-year prior – a year-on-year decline of 34.3 per cent. As the results of the model suggest, this negative shock to natural gas demand and prices will adversely affect Trinidad and Tobago’s GDP.
During the post-liberalisation period, a shock to crude oil prices only had a significant impact on government revenue in the short-run – government revenue increases for three years before the effect starts to lose significance and begins to decline. Although it appears that the impact of changes in oil prices loses its significance post-liberalisation, the shifting mix away from crude oil to natural gas production would have also affected Trinidad and Tobago’s GDP growth. Notably, over the period 1994 to 2014, the production of crude oil had declined by 38 per cent, while natural gas production increased by over 500 per cent over the same period.
During the pre-liberalisation years, a shock to US GDP had no significant impact on domestic GDP. On the other hand, post-liberalisation, a (positive) shock to US GDP had a significant (positive) effect on domestic output. As Trinidad and Tobago diversified its hydrocarbon sector into natural gas and petrochemicals, the US became a lucrative market for these exports. The greatest synchronisation between US real GDP growth and TT real GDP growth occurred between 1994 and 2004 (post-liberalisation years) when the share of exports to the US was the largest. Over both periods, a one-time shock to US GDP did not significantly affect government revenue while its impact on domestic inflation was significant. Meanwhile, pre-liberalisation, a shock to US GDP resulted in an increase in government debt over the medium-term, whereas there was no impact on debt during the post-liberalisation years.
External financial conditions had no impact on any of the domestic macroeconomic variables during the pre-liberalisation period. This result was the same for government revenue and domestic inflation in the post-liberalisation period. However, post-liberalisation, a positive shock to external financial conditions led to a significant positive effect on domestic output and a reduction in government debt. The impact of COVID-19 on financial markets has been varied. First, after initially ignoring the pandemic up to early-February 2020, from February 23 – March 20, 2020, stock markets reacted strongly to the increase in the number of persons infected across the globe (volatility rose as concerns about the pandemic grew). However, following interventions by governments and central banks, stock prices rebounded around the world (March 23 – April 20, 2020). Thus far, although the economic fallout of COVID-19 is expected to be harsh, credit facilities, government guarantees, lower policy interest rates, and lockdown measures appear to have mitigated the decline in stock prices. Notwithstanding this, currently during this COVID-19 crisis, the fundamental links between financial markets and economic activity “appear to be loose at best” (Capelle-Blancard and Desroziers, 202019). Given this, it is uncertain how these financial disruptions will affect the region, and by extension, the economy of Trinidad and Tobago.

ECONOMIC BULLETIN VOLUME XXII NO. 2 92
20 See IMF’s World Economic Outlook Update, June 2020. This projection refers to the simple average of prices of UK Brent, Dubai Fateh, and West Texas Intermediate (WTI) crude oil. The average price of oil per barrel was US$61.39 in 2019. The assumed oil price, based on futures markets (as of May 19, 2020), is US$36.18 in 2020. During the first five months of 2020, WTI prices averaged US$36.48 per barrel.
In general, the results indicate that shocks to the external environment have meaningful effects on domestic macroeconomic variables for Trinidad and Tobago. Notably, the relative importance of the external variables has changed over time. Pre-liberalisation, world oil prices had the most influence on domestic GDP, while post-liberalisation, US GDP and regional financial conditions have had a greater influence on domestic GDP. Further, the increased importance of the regional financial environment is highlighted in terms of its significant impact on government debt over the medium-term. The current COVID-19 pandemic will intensify these outcomes as it has been estimated that for 2020, the economies of the US and the Caribbean will experience deep contractions and for the average price of oil to fall by over 40.0 per cent20. Meanwhile, natural gas prices in 2020 so far have been down almost 35.0 per cent from the previous year. These three simultaneous external shocks (external demand, external financial conditions, and energy prices) will adversely impact the domestic economy through several channels including lower fiscal revenues, lower exports, higher government debt, and lower GDP.

ECONOMIC BULLETIN VOLUME XXII NO. 2 93
mEasuRing Economic uncERtainty in tRinidad and toBago
by
Yannick Melville and Nikkita Persad1
Economic uncertainty can be defined as a situation in which individuals and firms do not have perfect knowledge about the current state of the economy. In such an environment, economic agents tend to postpone their decisions, which can have an adverse effect on economic prospects. The presence of heightened uncertainty impedes policy calibration, increasing the probability that monetary and fiscal tools deployed to stimulate the economy may either overshoot or undershoot their targets. With a more real-time indicator of economic uncertainty, policymakers would be better placed to gauge public sentiment and incorporate these signals into the policy making process. Given domestic economic conditions and the uncertainty introduced by the COVID-19 pandemic, this Feature Article discusses the development of an index of economic uncertainty for Trinidad and Tobago by using relevant content in newspaper articles from the Trinidad and Tobago Express and the Trinidad and Tobago Guardian. The results suggest that economic uncertainty moved from “elevated” at the end of 2019 to “very high” as at June 2020.
intRoduction
The global economic outlook is the murkiest in modern history, with significant uncertainty over the macroeconomic fallout of the novel coronavirus (COVID-19) pandemic. As COVID-19 continues to spread, concerns persist about its lethality, the capacity of healthcare systems and the duration of containment strategies. The overall situation has introduced considerable uncertainty, particularly in the economic sphere. During crises, having relevant and timely data is crucial to make informed policy decisions. However, due to the highly fluid nature of the impact of the novel coronavirus, conventional economic indicators can be insufficient to effectively steer decision making primarily because of lags in data production. Higher-frequency and more granular data are needed to track pockets of vulnerability. These statistics could help decision-makers obtain a near real-time understanding of emerging issues to better target policy measures and deploy the appropriate resources.
Economic uncertainty could be defined as a situation in which individuals do not have perfect knowledge about the current state of the economy(ECB 20162). Whenever economic agents’ ability to forecast the likelihood of future events comes into question they tend to postpone decision-making to await additional and/or clearer information. However, this behaviour can complicate monetary and fiscal policy execution. For instance, despite the deployment of extraordinary measures to cushion the spread and economic impact of COVID-19 by global fiscal and monetary authorities, the International Monetary Fund’s April 2020 World Economic Outlook3 noted that the strength of the recovery in global markets will still depend on how well policymakers restore consumer and investor confidence.
Decision-makers would be better placed to assess public sentiments and their likely impact on the real sector by monitoring developments in a real-time indicator of economic uncertainty. Even so, there is much debate on the most appropriate method for capturing economic uncertainty. For instance, some researchers use the volatility in stock market returns to gauge market expectations, while others rely on forecast dispersion, media coverage and/or confidence indices. This Article discusses the development of an index of economic uncertainty for Trinidad and Tobago using newspaper articles from the Trinidad and Tobago Express and Trinidad and Tobago Guardian.4
1 The Feature Article was written by economists in the Research Department at the Central Bank of Trinidad and Tobago. The views expressed here are those of the authors and not necessarily those of the Central Bank of Trinidad and Tobago. Please send comments to [email protected] and [email protected].
2. ECB. 2016. “The Impact of Uncertainty on Activity in the Euro Area.” European Central Bank. 3 IMF. 2020. “ World Economic Outlook, April 2020: The Great Lockdown.” International Monetary Fund. 4 Trinidad and Tobago Newsday’s articles could not be included into a domestic economic policy uncertainty index as the newspaper’s
search engine does not store articles by their publication date.
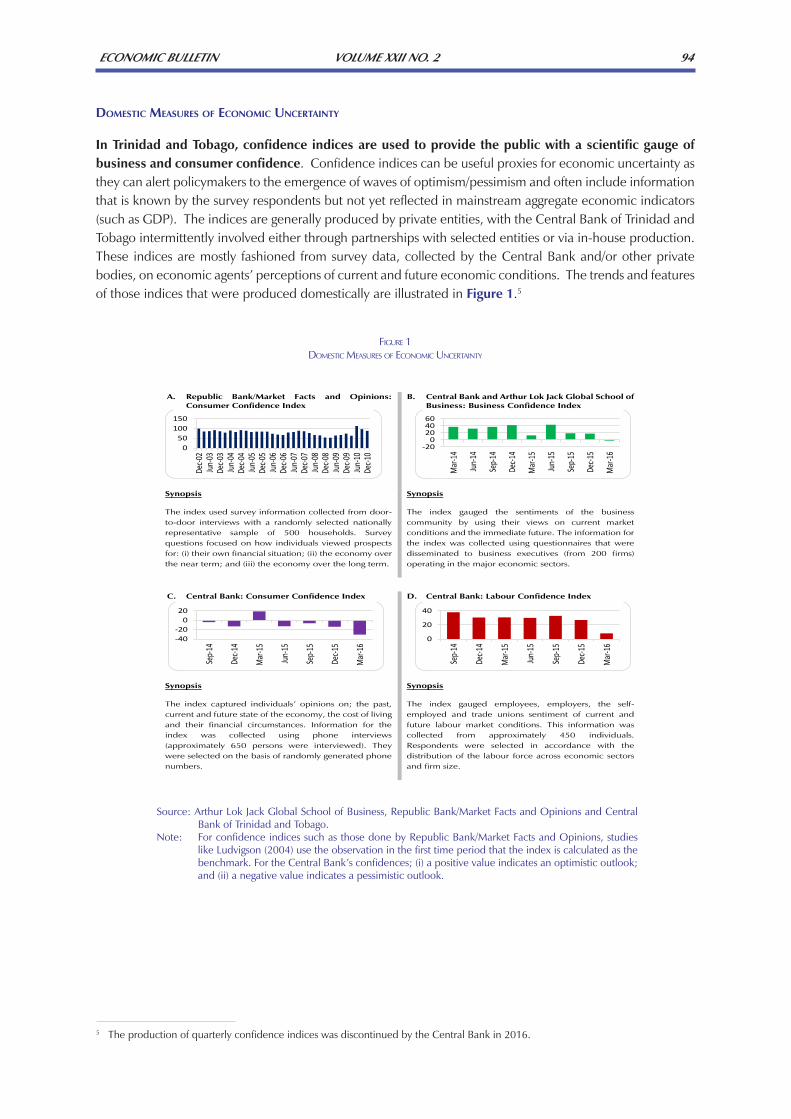
ECONOMIC BULLETIN VOLUME XXII NO. 2 94
domEstic mEasuREs of Economic uncERtainty
In Trinidad and Tobago, confidence indices are used to provide the public with a scientific gauge of business and consumer confidence. Confidence indices can be useful proxies for economic uncertainty as they can alert policymakers to the emergence of waves of optimism/pessimism and often include information that is known by the survey respondents but not yet reflected in mainstream aggregate economic indicators (such as GDP). The indices are generally produced by private entities, with the Central Bank of Trinidad and Tobago intermittently involved either through partnerships with selected entities or via in-house production. These indices are mostly fashioned from survey data, collected by the Central Bank and/or other private bodies, on economic agents’ perceptions of current and future economic conditions. The trends and features of those indices that were produced domestically are illustrated in Figure 1.5
5 The production of quarterly confidence indices was discontinued by the Central Bank in 2016.
A. Republic Bank/Market Facts and Opinions: Consumer Confidence Index
B. Central Bank and Arthur Lok Jack Global School of Business: Business Confidence Index
Synopsis
The index used survey information collected from door-to-door interviews with a randomly selected nationally representative sample of 500 households. Survey questions focused on how individuals viewed prospects for: (i) their own financial situation; (ii) the economy over the near term; and (iii) the economy over the long term.
Synopsis
The index gauged the sentiments of the business community by using their views on current market conditions and the immediate future. The information for the index was collected using questionnaires that were disseminated to business executives (from 200 firms) operating in the major economic sectors.
C. Central Bank: Consumer Confidence Index
D. Central Bank: Labour Confidence Index
Synopsis
The index captured individuals’ opinions on; the past, current and future state of the economy, the cost of living and their financial circumstances. Information for the index was collected using phone interviews (approximately 650 persons were interviewed). They were selected on the basis of randomly generated phone numbers.
Synopsis
The index gauged employees, employers, the self-employed and trade unions sentiment of current and future labour market conditions. This information was collected from approximately 450 individuals. Respondents were selected in accordance with the distribution of the labour force across economic sectors and firm size.
050
100150
Dec-0
2Jun
-03De
c-03
Jun-04
Dec-0
4Jun
-05De
c-05
Jun-06
Dec-0
6Jun
-07De
c-07
Jun-08
Dec-0
8Jun
-09De
c-09
Jun-10
Dec-1
0
-200
204060
Mar-1
4
Jun-14
Sep-1
4
Dec-1
4
Mar-1
5
Jun-15
Sep-1
5
Dec-1
5
Mar-1
6
-40-20
020
Sep-1
4
Dec-1
4
Mar-1
5
Jun-15
Sep-1
5
Dec-1
5
Mar-1
6 0
20
40
Sep-1
4
Dec-1
4
Mar-1
5
Jun-15
Sep-1
5
Dec-1
5
Mar-1
6
figURe 1domestic measURes of economic UnceRtainty
Source: Arthur Lok Jack Global School of Business, Republic Bank/Market Facts and Opinions and Central Bank of Trinidad and Tobago.
Note: For confidence indices such as those done by Republic Bank/Market Facts and Opinions, studies like Ludvigson (2004) use the observation in the first time period that the index is calculated as the benchmark. For the Central Bank’s confidences; (i) a positive value indicates an optimistic outlook; and (ii) a negative value indicates a pessimistic outlook.

ECONOMIC BULLETIN VOLUME XXII NO. 2 95
6 According to Similar Web’s website traffic checker tool, during January 2020 and February 2020 Trinidad and Tobago’s three leading newspapers recorded, on average, over 3.8 million visits a month from desktop users and mobile devices. From March 2020 to May 2020 the average visits from desktop users and mobile devices grew by 16.6 per cent (approximately 0.6 million).
7 See: Azqueta-Gavaldón, Andrés, Dominik Hirschbühl, Luca Onorante, and Lorena Saiz (2020); Saltzman, Bennett, and Julieta Yung (2018); and Tobback, Ellen, Hans Naudts, Walter Daelemans, Enric Junqué de Fortuny, and David Martens (2018).
8 Baker, Scott R, Nicholas Bloom, and Steven J Davis. 2013. “Measuring Economic Policy Uncertainty.” American Economic Association.
constRucting a mEasuRE of Economic uncERtainty
With the increasing frequency and intensity of shocks to the macro-economy such as the COVID-19 pandemic, methods based on backward-looking analyses of conventional macroeconomic variables are unlikely to effectively capture pandemic-induced impulses. The restrictions on non-essential services have disrupted data collection processes and/or dried up pertinent sources of information. For instance, the imposition of containment restrictions such as isolation and social distancing may impede surveying. However, the March 30, 2020 ‘Stay-at-Home’ Order in Trinidad and Tobago has led to a spike in at-home media consumption as more individuals are turning to newspapers for timely and trusted information on the health crisis6. This has bolstered the depth, reach and credibility of news-based indicators of economic uncertainty.
Several studies using different approaches have been conducted to leverage the vast amount of information available in newspapers7. The mass media has long been recognized as a powerful force for shaping how members of the public experience the world and view themselves. Newspapers in particular have provided a platform to convey peoples’ opinions on major societal, political, and economic developments. This coverage has the potential to influence the public’s response to these issues and events. It is against this background that Baker, Bloom and Davis (2013)8 assumed that newspaper reports on economic policy uncertainty (EPU) reflect or raise society’s awareness of developments in this area. The Baker, Bloom and Davis (2013) approach was adopted to construct a measure of economic uncertainty in Trinidad and Tobago. The methodology is summarized in Figure 2.
Find the Number of EPU
Related Newspaper
Articles Search each newspapers’ online databases for articles that include words referring to: (i) “economy” or “economic”; (ii) “uncertain” or “uncertainty”; and (iii) “policy” or “political”. Record, date and tabulate each article that meets the search criterion.
STEP 1
Find the Total Number of Newspaper
Articles Published Search each of the
leading national newspaper websites’ archives to ascertain the total number of newspaper articles published each day.
STEP 2
Normalize the Results from
Step 5
Apply a cumulative distribution function to allow the aggregated result to assume values between 0 (low economic uncertainty) and 1 (very high economic uncertainty).
STEP 6
Calculate the Frequency of EPU Related Newspaper
Divide the ‘raw number’ of EPU articles by the total number of newspaper articles published by that newspaper over that period.
STEP 3
Standardize the Results from
Step 3
Divide each observation in ‘Step 3’ by the standard deviation of the entire series.
STEP 4
Aggregate the Results
produced from Step 4
Merge the results from ‘Step 4’, for each of the leading newspapers, into a single index by taking the average of the recorded series.
STEP 5
Sources: Central Bank of Trinidad and Tobago
figURe 2estimating economic UnceRtainty in tRinidad and tobago

ECONOMIC BULLETIN VOLUME XXII NO. 2 96
REsults and analysis
The Trinidad and Tobago EPU index (EPUTT Index) was set as a combination of the average standardized frequencies of newspaper articles from the Trinidad and Tobago Express and the Trinidad and Tobago Guardian on pertinent, domestic economic developments9. To evaluate the performance of this measure of economic uncertainty, emphasis was placed on determining whether the EPUTT Index produced signals that were consistent with the domestic macro-financial environment10. Figure 3 illustrates that movements in the EPUTT Index broadly coincided with major known events. More specifically, uncertainty was ‘moderate’ in 2009 as significant policy interventions by the Government and Central Bank limited possible systemic risks from the collapse of a major financial conglomerate, the CL Financial Group. While these strategies, inter alia, helped economic uncertainty to remain ‘moderate’ in 2010, as indicated in the “Notable Developments” section of Figure 3, violent crime11 was becoming a macro-critical area of concern. I n fact, sentiments on national security worsened (economic uncertainty was ‘elevated’ in 2011 and 2012) following a limited state of emergency (in 2011) and the resignation of key officials in the police force (in 2012). The Government was able to arrest some of the slide in public confidence – 2013 ended with ‘moderate’ economic uncertainty – as several wage collective agreements were settled.
In 2014, economic uncertainty remained ‘moderate’ as business and labour markets were cautiously optimistic (Figure 1). Even so, there was a noticeable rise in the EPUTT Index at the end of 2014 as the Organization of Petroleum Exporting Countries decided to raise production quotas, effectively suppressing crude oil prices. As the slide in oil prices worsened in 201512, the Government made several budgetary adjustments to address the projected shortfall in fiscal revenues. In addition, “between September 2015 and March 2016, twenty-nine companies announced job cuts which displaced close to 3,000 workers” (CBTT 2016)13 and several employers proposed to freeze wages for 2017 – 2020. In light of the following, economic uncertainty fluctuated between ‘elevated’ and ‘high’ levels between 2015 and 2016. Even so, public sentiments improved vastly in 2017, as the energy sector benefited from increased natural gas production from two major gas projects the (Trinidad Onshore Compression Project and bpTT’s Juniper platform).
The pendulum swung again in the ensuing years. Trinidad and Tobago recorded ‘elevated’ levels of economic uncertainty in 2018 and 2019, respectively, as the Government implemented a restructuring14 exercise at Petrotrin (the largest domestic integrated oil producer) and; (ii) segments of society expressed concerns about several pieces of legislation. Sentiments worsened considerably over the first half of 2020 (economic uncertainty rose to ‘very high’ levels), when Trinidad and Tobago recorded its first case of COVID-19 (on March, 12 2020). Although Government introduced a range of containment measures to prevent community transmission, news of COVID-19 was met with several documented incidents of panic buying. To alleviate public anxieties and reinforce measures to contain the spread of COVID-19, the Government imposed a ‘Stay-at-Home’ Order, which required all non-essential businesses and schools to shut down their operations on March 30, 2020. The EPUTT Index suggests that uncertainty conditions remain ‘very high’ as the country progresses through the various stages towards normalisation.
9 This article assumes that when: there are ‘low’ levels of economic uncertainty; there are ‘moderate’ levels of economic uncertainty; there are ‘elevated’ levels of economic uncertainty; there are ‘high’ levels of economic uncertainty; or there are ‘very high’ levels of economic uncertainty.
10 While daily EPUTT Index statistics were produced, the current analysis used quarterly estimates of the index to effectively filter the signals during back-testing.
11 According to data from the Central Statistical Office, ‘reports to the police (excluding offences against traffic laws) – serious crimes’ rose by 7.8 per cent between 2008 (20,566 reports were recorded) and 2009 (20,127 reports were recorded).
12 The global price of WTI Crude ended 2015 at $US 37.2 per barrel.13 CBTT. 2016. “Economic Bulletin.” Central Bank of Trinidad and Tobago.14 Approximately, 4,800 employees were retrenched.

ECONOMIC BULLETIN VOLUME XXII NO. 2 97
Low Moderate Elevated High Very High EPUTT Index KEY
The Government and Central Bank intervened to help limit contagion risks from CL Financial.
2009 The Government; revised the Property Tax Act, issued a Homeowners Tax Credit allowance and increased senior citizen pension grants.
2010 A state of emergency was called to tackle the rise in serious crimes.
2011 The Commissioner of Police (COP) and Deputy COP resigned following growing criticism on national security.
2012 The Government settled several collective agreements across the Energy, Finance, Distribution and Transport sectors.
2013 While confidence indices suggested general confidence in the outlook of the economy, uncertainty rose in the latter half of 2014 as strong oil supply fuelled a sharp fall in oil prices.
2014 The Government supplemented the shortfall in fiscal energy revenues by; raising fuel prices, hiking corporate taxes and increasing the amount of ‘vatable’ items.
2015 29 companies
announced
downsizing
and several
employers
proposed to
freezes
wages for
2017-2020.
2016 The energy sector benefitted from two gas projects (the Trinidad Onshore Compression project and the Juniper project).
2017 The board of the state-owned oil company announced their intentions to restructure the company. Over the next few months a clear resolution strategy was outlined – and implemented – to the public.
2018
NOTABLE DEVELOPMENTS
The general public expressed their concerns on: the Unexplained Wealth Bill; changes to the Freedom of Information Act; and the demonetization of cotton 100$ bill notes.
2019 The first domestic COVID-19 case was recorded on March 12. To slow the spread of COVID-19, non-essential activates were prohibited from March 30 2020.
2020
Jun-10 Jun-09
figURe 3the QUaRteRly epUtt index
Source: Central Bank of Trinidad and TobagoNote: The colour of the in the “Notable Developments” section of Figure X gives the assessment (low’, ‘moderate’, ‘elevated’, ‘high’ or ‘very
high’) on the average level of economic uncertainty during that year.
0 0.2 0.4 0.6 0.8 1
TT
figURe 4domestic measURes of economic UnceRtainty
Source: Central Bank of Trinidad and TobagoNote: The numbers on the left hand y-axis are colour-coded to represent a; (low’,
‘moderate’, ‘elevated’, ‘high’ or ‘very high’) level of economic uncertainty.

ECONOMIC BULLETIN VOLUME XXII NO. 2 98
Shocks which increase uncertainty tend to have contractionary effects on the real sector. Figure 4 demonstrates strong counter-cyclicality between the EPUTT Index and non-energy economic activity, unemployment and inflation from 2013 to 2014. More specifically, ‘good times’ (positive economic growth rates, low unemployment and stable inflation rates) coincided largely with ‘moderate’ periods of economic uncertainty as economic booms are often characterized by waves of optimism. However, if economic underperformance is prolonged, pessimism can become entrenched and self-reinforcing, raising economic uncertainty to ‘high’ or ‘very high’ levels. This was demonstrated during March 2018 to June 2020 where – against a low inflationary environment, rising unemployment levels and sluggish non-energy sector activity – economic uncertainty rose from ‘elevated’ to ‘very high’ levels. To test the relationships between the EPUTT Index and the macro-selected economic variables, cross-correlation and granger causality statistics were conducted. While causality could not be established, it was observed that economic uncertainty has a negative correlation with economic growth, unemployment and the inflation rate. The inverse relationship between economic uncertainty and unemployment may exist because the Government tends to bolster social safety net expenditure during economic downswings.
conclusion
Although the importance of complementary, high-frequency economic indicators was recognized before the pandemic, disruptions in the collection of traditional data sets via conventional methods have made the development of such indicators more urgent. Higher-frequency data could help decision-makers obtain a more real-time understanding of the problems to better address economic challenges. In this regard, using the approach from Baker, Bloom and Davis (2013), an EPU Index was developed for Trinidad and Tobago. The results showed that the index tracks well and can be used as a leading indicator for conventional macroeconomic variables.
APPENDIX III
CALENDAR OF KEY ECONOMIC EVENTS

ECONOMIC BULLETIN VOLUME XXII NO. 2 99
calEndaR of kEy Economic EVEnts JanuaRy - JunE, 2020
Jan
8. The World’s fourth largest insurance brokerage firm, Arthur J Gallagher and Company, acquired a 60 per cent stake in Trinidad-based Caribbean insurance broker, Risk Management Services Limited (RMS). Risk Management Services provides property/casualty and employee benefits products and services to enterprises in the manufacturing, oil and energy, and service industries.
29. An Act to vary the appropriation of the sum the issue of which was authorised by the Appropriation (Financial Year 2019) Act, 2018 and varied by the Finance (Supplementary Appropriation) (Financial Year 2019) Act, 2019 was assented on this date. This Act may be cited as the Finance (Variation of Appropriation) (Financial Year 2019) Act, 2020. (Act No. 2 of 2020).
Feb
1. Phoenix Park Gas Processors Limited (PPGPL) acquired the natural gas liquids (NGL) marketing assets of Twin Eagle Liquids Marketing LLC, through its wholly owned US subsidiary, Phoenix Park Energy Marketing LLC. Twin Eagle Liquids Marketing LLC is a Houston, Texas, US based company engaged in the business of marketing, trading and transporting natural gas liquids in Canada, USA and Mexico.
3. The Prime Minister announced that Trinidad and Tobago and Venezuela rescinded their agreement to jointly exploit 10 trillion cubic feet of natural gas in the Loran Manatee field and would develop it independently instead. US sanctions on the Bolivarian Republic has led to the agreement being terminated.
5. The Energy ministry announced their receipt of a bonus US $80 million on signing new Production Sharing Contracts (PSCs) with Shell. The agreement covers Shell’s production-sharing contracts for its East Coast Marine Area (ECMA) comprising Block 5a, Block 6, Block E and Block 5c and North Coast Marine Area (NCMA) 2, in addition to its Colibri project comprising NCMA 4 and Block 22. Shell is projected to spend in excess of US $1 billion in development works over the period 2019-2021.
6. Touchstone Exploration confirmed its Cascadura-1TST1 well in Ortoire is a significant gas discovery. Average flowback rate during test periods were 5,180 barrels of oil equivalent per day (boe/d), including 26.9 million cubic feet per day of natural gas and 694 barrels per day of natural gas liquids. Touchstone has an 80 per cent working interest in Cascadura while Heritage Petroleum holds 20 per cent in this joint project.
11. Shell TT has announced a Final Investment Decision (FID) on the development of Block 5C (Barracuda) in the East Coast Marine Area (ECMA). Barracuda is a greenfield gas development. Gas from Barracuda is expected in 2021 and will supply both the domestic gas and export markets.
17. The Governments of Trinidad and Tobago (GOTT) and Barbados signed a unitisation agreement that would allow both countries to carry out seismic exploration at each other’s border and jointly operate a producing reservoir of oil and/or gas if found on the border of the two states.
18. An Act to amend the Insurance Act, 2018, was assented on this date. This Act may be cited as the Insurance (Amendment) Act, 2020 (Act No. 3 of 2020).

ECONOMIC BULLETIN VOLUME XXII NO. 2 100
March
1. The Central Bank of Trinidad and Tobago Mortgage Market Reference Rate as at March 1, 2020 remained unchanged.
5. The Ministry of Finance received US$495,000 (TT$3.37M) via a grant provided by CAF – Development Bank of Latin America. Colm Imbert, Minister of Finance and Gianpiero Leoncini, Director Representative of CAF Development Bank of Latin America signed the Non-Reimbursable Technical Cooperation agreement. The grant money goes towards the creation of a Flood Management Master Plan to address the nation’s recurrent challenges with drainage and flooding.
16. Shell TT announced a Final Investment Decision (FID) approving its Colibri project off the Northeast coast of Trinidad. The two blocks, Block 22 and NCMA-4 are held in partnership with the Heritage Petroleum Co Ltd. Colibri is expected to add a total of 43,100 barrels of oil equivalent per day or 250 million standard cubic feet of gas production per day. The Shell-operated Colibri development is co-owned with Heritage, which has a working interest of 10 per cent and 20 per cent respectively in Block 22 and NCMA-4.
17. The Central Bank of Trinidad and Tobago lowered the repo rate by 150 basis points to 3.5 per cent and reduced the reserve requirement by 3 per cent to 14 per cent.
26. An Act to amend the Heritage and Stabilisation Fund Act, Chap. 70:09, the Government Savings Bonds Act, Chap. 71:41 and the Value Added Tax Act, Chap. 75:06 was assented to on this date. This Act may be cited as the Miscellaneous Provisions (Heritage and Stabilisation Fund, Government Savings Bonds and Value Added Tax) Act, 2020. (Act No. 9 of 2020).
• Standard and Poor’s (S&P) lowered Trinidad and Tobago’s sovereign credit rating from BBB to BBB-. They said Trinidad and Tobago’s economic outlook is stable and the country’s sovereign credit rating could also be lowered.
May
4. Touchstone Exploration announced it signed a framework agreement for the sale of natural gas and gas liquids produced from the Ortoire block, onshore Trinidad. The agreement is signed with the National Gas Company of Trinidad and Tobago and Heritage Petroleum Company. Heritage and Touchstone are Joint Venture partners in the Ortoire Onshore Block and have made gas discoveries in two wells, Coho and Cascadura. The agreement aids in fostering a strategic partnership, assisting the development, sale and purchase of natural gas and natural gas liquids produced from the Ortoire Block.
22. Global rating agency, Moody’s confirmed Trinidad and Tobago’s unchanged Ba1 credit rating in the midst of the COVID-19 pandemic. However, they changed the country’s outlook to negative.
31. Republic Financial Holdings Limited (RFHL) acquired Scotiabank’s operations in the British Virgin Islands (BVI). This follows approvals from the Central Bank of Trinidad and Tobago, and The Financial Services Commission of the British Virgin Islands, as well as the execution of the General Banking License in the BVI.
Jun
1. The Central Bank of Trinidad and Tobago Mortgage Market Reference Rate as at June 1, 2020 remained unchanged.
22. The Ministry of Finance achieved a successful US$500 million Republic of Trinidad and Tobago International Bond Issue. The 10 year bond offer was launched by Credit Suisse internationally with an initial interest rate of 4.5 per cent.
26. The Central Bank of Trinidad and Tobago maintained the repo rate at 3.5 per cent.


![Pogranicze. Studia Społeczne, XXII 2013 [Borderland. Social Studies]](https://static.fdokumen.com/doc/165x107/6316667ec5ccb9e1fb03a7e2/pogranicze-studia-spoleczne-xxii-2013-borderland-social-studies.jpg)