Ethnomedicines used in Trinidad and Tobago for urinary problems and diabetes mellitus
Upload
khangminh22Category
view
4download
0
DEVELOPMENT AND VALIDATION
OF A FOOD FREQUENCY QUESTIONNAIRE
TO ASSESS THE DIET GLYCEMIC INDEX
OF ADULTS IN TRINIDAD & TOBAGO.
Vasanti Malik
A thesis submitted in conformity with the requirements
for the Degree of Master of Science
Graduate Department of Nutritional Sciences
University of Toronto
© Copyright by Vasanti Malik 2003

i+ National Library of Canada
Acquisitions and Bibliographic Services
395 Wellington Street Ottawa ON K1A ON4
Bibliotheque nationale du Canada
Acquisitions et services bibliographiques
395, rue Wellington Ottawa ON K1A ON4
Canada Canada Your tile Votre référence
Our fle Notre référence
The author has granted a non- L’auteur a accordé une licence non exclusive licence allowing the exclusive permettant a la National Library of Canada to Bibliotheque nationale du Canada de reproduce, loan, distribute or sell reproduire, préter, distribuer ou copies of this thesis in microform, vendre des copies de cette thése sous paper or electronic formats. la forme de microfiche/film, de
reproduction sur papier ou sur format électronique.
The author retams ownership of the L’auteur conserve la propriété du copyright in this thesis. Neither the droit d’auteur qui protége cette thése. thesis nor substantial extracts from it _Ni la thése ni des extraits substantiels may be printed or otherwise de celle-ci ne doivent étre imprimés reproduced without the author’s ou autrement reproduits sans son permission. autorisation.
Canada
0-612-78236-0

To my remarkable family and friends,
and Keith as these toils finally come to an end and a new chapter begins.

DEVELOPMENT AND VALIDATION OF A FOOD FREQUENCY
QUESTIONNAIRE TO ASSESS THE DIET GLYCEMIC INDEX OF ADULTS IN
TRINIDAD AND TOBAGO.
Vasanti Malik, Master of Science, 2003
Graduate Department of Nutritional Sciences, University of Toronto.
ABSTRACT
The objectives of this thesis were to develop a Food Frequency Questionnaire (FFQ)
that is able to assess diet glycemic index (GI), and compare estimates of nutrient intake with
those collected from 7-day Food records (FR) in Trinidad. 152 healthy adults completed the
FFQ either before or after the FR’s. Differences between means estimated by the FFQ and
FR’s are significant for all macronutrients except GI and cholesterol. Correlation coefficients
between the FFQ and FR data for fat, available carbohydrate, fibre and GI are; 0.50 (p<0.05),
0.40(p<0. 05), 0.25(p<0.05), and 0.25(p<0.05) respectively. The principal criterion for
validity for the FFQ is correlation coefficients > 0.5. These results show that intake assessed
by the FFQ is acceptable for measuring some nutrients but not particularly good for
measuring GI. Additional administrations of the FFQ and FR are needed to improve FFQ
precision and complete the validation process.
iT

ACKNOWLEDGEMENTS
To begin, I would like to express my utmost gratitude to Dr. Wolever for his support,
encouragement and generosity while providing me with an incredible learning experience,
which facilitated the pioneering of a body of work that is very important to me. I would like
to extend this gratitude to Dr. Ramdath, who made the field work in Trinidad possible.
I would also like to thank the members of my advisory committee; Dr.’s Eyssen and
Ward, for their valued input, guidance and support. Thank you to Dr. El Sohemy for
appraising the thesis and Dr Thompson for chairing my defence.
I am sincerely thankful to Vartouhi Jazmanji and Tamara Arenovich for their
irreplaceable counsel on biostatistics, and Keith for the outstanding technical support and
keen surveying skills.
To Curtis, Natasha, Yvonne Batson, June Holdip and the staff of the Central Statistics
Office in Trinidad, Port of Spain, I would like to thank you for your assistance in recruiting
subjects, and providing me with insight regarding the customs and culture in Trinidad. I
would also like to thank all participants of this study, without you, this work would not have
been possible.
Finally I would like to thank the departmental administrative staff for keeping me on
track and members of the Wolever lab (and Rana) for their kind words, and sound advice.
iil

TABLE OF CONTENTS
page
FN STO LON 0 Ma i
ACKNOWLEDGMENTS ............cccccec cece eee eee tence nent et eae eee Ease ee eee EE eee ene Ea aaES ii
LIST OF TABLES .......... ccc ccc cce cece cence een nen een ten E Eee ete eet e Ean EEE aE eed Vill
LIST OF FIGURES .......... cece cece cece cence ene nee n ene eee n nen ee nen e nA ene EEE bbe eee ena eee ES xiii
ABBREVIATIONS ..........cceccececece rene ee ene nee e ence tence eee ee nee ee eee eee HaEES LAER EEE GEES XIV
CHAPTER 1.
INTRODUCTION AND LITERATURE REVIEW
1.1 Introduction. ......... 0.2.0 cece eee ee cece ence eeee nest eee eneeeseeeneeennce ress 1
1.2 Literature Review ............ ccc cceccee ene eee ene eee ene eee tee ence nee naees 2
1.2.1 Diabetes Mellitus. ....... 0... cece ceee eee ee eee neee ee eeeeeenee teen ees 2
1.2.1.1 T2DM........ cece cece eee ne nee ee eee e nena eeeeeenseeeenaenees 4
1.2.2 Risk factors of T2DM.......... 00... cece cee eee eee ene eee ee eee nent eae 7
1.2.2.1 Gemnetics......... cece e cece cece erro eee neneeeenenernaees 7
1.2.2.2 ODESILY....... ice e cece eee eee ee eee e nee ee ence seat een een nae aas 9
1.2.2.3 EX€LrCiS€........ ccc cece eee ne eee e scene esee eens eeaenaeeeee ees 12
1.2.2.4 Diet... cee ce cence eee eeec ene eeeeteeeeeeeeneeneennenes 14
1.2.3 The Glycemic Index ............. ccc cece cece ence eee eeeeteeaeeeeaees 17
1.2.4 Epidemiology of T2DM in the Caribbean.......................0000 19
1.2.5 Dietary Assessment Methods.................:ccceceeeeeeeeeeeeeeeenes 22
1.2.5.1 24-hour dietary recall..............ecceeceec eee eee eee eneeeeeees 22
1.2.5.2 Diet Records.............ccc cece eecec eee ene esses eeseeeeeeee eens 24
iv

1.2.5.3 Biomarkers of diet........... 0c. ccc ccc ce ccc cceeeeeneeesseeeuns 25
1.2.5.4 Diet History............cccc cece cece eee cee ee eeteeeneeereeaees 27
1.2.5.5 FFQ oc ececccccceee cence cere ee eee eeeseneeneeeere ene eae reece 28
1.3 Study Objectives............ccccececeeeeeeeeeeeeee nena ee eneneneeeeneneneen ene eaae 36
CHAPTER 2.
MATERIALS AND METHODS
2.1 Development of FFQ........... cece cece cece eee ee eee e een ne ene e eee ene cates 36
2.1.1 Stage 1: Generation of food list.............. cc cece cece eee eee ee eee eee eeaee 36
2.1.1.1 Procedures........... cece cece cece eee eee ee eeea eee esas ene eee 36
2.1.2 Stage 2: Testing of FFQ....... ccc ce cence cee ne eee eneeneetaee ees 37
2.1.2.1 Procedures........ 0... ccececeeeee ee eee ee eee eeeeeea ceca eceeseees 37
2.1.2.2 Subjects....... cece ee eee ee cence ene eneea teeta eencas 38
2.1.2.3 Results... cece eee e eee e ee eee ee eee ene ene enn enenees 43
2.2 Validation Study. ......... cece cece ee ects ee eene eee nsec ne eeeeeene eens 43
2.2.1 PLOCEGUIES.... 0... eee ee cece tence cere nent sneer tree neta eneeeeneneeees 43
2.2.2 Subjects....... 0 cece cece eee ee eee ene eee ene eeeeneeegengeeneees 45
2.2.3 AMNALYSIS...... 0. cece ccc e cence cence nce e cence eee een ene teases eeaeeanee genase 46
2.2.3.1 Nutrient Analysis.............ccccccece cece eeeeeeeeeeeeeeeaeeeenea 46
2.2.3.2 Statistical Analysis...............cccceceeceneec eee eeeneeeeesanetees 47
CHAPTER 3.
RESULTS
3.1 Characteristics of Study Population. ................ceccceeceeeeeeeeee eens 49
3.1.1 Demographics of study participants.............. 6. ccc cc cece eee ee sea a ees 49

3.1.2 Comparison with National statistics..............ccce eee ee ee ee ese e eee nees 57
3.2. Normality of data... cece e cece eee eee renee enna 60
3.3 Nutrient Intake... cc eee eee ee ene e renee enone eee eee seneeeee 65
3.3.1 All study participants........... 0... cece cece cece eee e eee eee eenaeeeeeees 65
3.3.2 Males and Females............ ccc cece cece cece e sete eee beeen seen ones 66
3.3.3 African’s and South Asian’s...........cccseeeesceeeeeeeeeeeneneee eases ens 67
3.3.4 FFQ 1 and FFQ 2™ groups......0..ccccccceseeeccceeeseeesseeueeeeeenees 70
3.4 Association between FR’s and FFQ..............ccccceeeceeeeeeeenneneee 96
CHAPTER 4
DISCUSSION AND CONCLUSION
4.1 DISCUSSION. ...........c eee e eee ec cece eee eee e eee ee ene tees ene eeaeeeneeeaaee ener 109
4.1.1 All study participants... cece cece cee ee eee e eee ne scence ee na eas 109
4.1.2 Males and Females................cccccescee eee eeeeeeeeeneeeeteeetneeneeea 117
4.1.3 African’s and South Asian’s................ ccc cee ee cece cece nee e ence een ees 119
4.1.4 FFQ 1 and FFQ 2" groups....ccccccccccsscsscsstsssssssssesseeeeeseeeeen 122
4.2 Future directions.......... 0. cece ce cece e eee ne cece eee ee eee ene e ee eee eee e eaee 123
4.3 Conclusion..............0cc cee ece cece eee ee ence eee enna cence tee eeaeeeaeeesee eases 124
CHAPTER 5
REFERENCES.......... 0c ececeneeeeeceneeeeceneeeeeeeeeeaeeeeeeeeeeeaeneeneneeetneeneeaeeaeeaes 127
APPENDIX A __ Descriptions of Various Validation Studies and their findings............. 137
APPENDIX B = Consent forms......... 00... cece ccc e cence eee ee ene en eee nena eene ene eneenee nea enes 146
APPENDIX C FFQ and part of FR diary........... 0c cece cee ce ec enc eee ene eee eee eee een nen aeeees 149
APPENDIX D Portion sizes associated With FFQ.............ccccccceeeeeeneeeeeeeeeesseeeees 168
vi

APPENDIX E Map of an electoral district used for recruiting subjects................. seen 175
APPENDIX F Foods from the study that were added to the Nutrput database.............. 177
APPENDIX G_ All Chi-square tests.............c:eeceece eee e eee ee eee eeeeee tee e eee eneee ree tee eenes 181
APPENDIX H_ Shapiro Wilk scores, and Kurtosis and skewness values for FR and .......196
FFQ macronutrient and % macronutrient data.
APPENDIX I Frequency Distributions for macronutrients and % macronutrients ...... 211
from FR’s and FFQ’s
APPENDIX J Correlation coefficients using untransformed and transformed data........233
and Spearman rank correlations between FR’s and FFQ’s for
macronutrients and % macronutrients.
APPENDIX K_ Scatter-grams between FR and FFQ data for macronutrient and............ 248
macronutrient intake
vil

LIST OF TABLES
page
Table 2-1 oo. cece cee ce nee n ence eee eee ee ne ence een e nee eR EE EES SEE EE SDE E EEE DEE eE EEE E OEE SE EEE EH 40
FFQ testing phase: Recruitment for Administrative Divisions
0D 0) 29 C9 Al
Ethnic breakdown of Males in testing phase of FFQ
Table 2-2)... 0. ccccc ccc ce cere eee ne cee e ee eee eee ee ence eee ee eee e eens ee eee eee ne eens teers ene ene teeta 42
Ethnic Breakdown of Females in testing phase of FFQ
Table 3-1... cccc cece cece nee nen renee nee e nen Een EEE EEE EERE EEA; D EEA ED OEE EEE; E SOE CEE EEE ES 53
Gender, ethnicity and age of all subjects (counts and percentages)
Oe) 0) (RCAC: » apna 54
Completed Education Level and Occupation for Males and Females
8:15) (co (0) 55
Completed Education Level and Occupation for AF’s, SA’s and OTH’s for Female’s
Table 3-2(C).... 0... ccc ccc cece ence ence ence teen cence ence eens enna ener ene eennne sense ee eeee eens eeenneene es 56
Completed Education Level and Occupation for AF’s, SA’s and OTH’s for Male’s
Table 3-3(8)........ccceccecc enc ee ence nee ne een ene eee ne ene ee ne eee snes sees eee ea sees eeeeneeneeeeeeeennas 74
Means & Standard deviations, and Medians, & Interquartile ranges for
macronutrients from FR and FFQ data: All subjects
Table 3-3(D).... 0... cce ccc cc cece cence eee eee ne eee neces eee en ones neta ena eesenaeeaenaeeaenneeseeeneeeees 75
Means & Standard deviations, and Medians, & Interquartile ranges for
macronutrients expressed as a percentage of total energy from FR and FFQ data:
All subjects
viii

Wo) Con | 76
Means & Standard deviations, and Medians, & Interquartile ranges for
macronutrients from FR and FFQ data: Males
Table 3-4(D). 0... cc cecccc ccc ce cence nee ee erence cent nena eases esse eee neen ee eaeneeaeeaeaeeaeneeeeraeenes 77
Means & Standard deviations, and Medians, & Interquartile ranges for
macronutrients expressed as a percentage of total energy from FR and FFQ data:
Males
“Table 3-5(a).cccccccssccssscseseevesssvsesesesvevesssvsesesesessesesteveeassssestavevsreseeeateeetees 78
Means & Standard deviations, and Medians, & Interquartile ranges for
macronutrients from FR and FFQ data: Females
2) 0) (se to) (0) 79
Means & Standard deviations, and Medians, & Interquartile ranges for
macronutrients expressed as a percentage of total energy from FR and FFQ data:
Females
Table 3-6(8)...... 0... cece ccc ec ence ence eee ee eee ence nena ene eee cesses ene entenetneeeee eee teeeatenneeea 80
Means & Standard deviations, and Medians, & Interquartile ranges for
macronutrients from FR and FFQ data: AF’s
Table 3-6(b).... 2... cece cece cee ce ence e eee ence ne ene eee ne eee eee eae ee onan eeeeeeeeneenaenneegeenenenes 81
Means & Standard deviations, and Medians, & Interquartile ranges for
macronutrients expressed as a percentage of total energy from FR and FFQ data:
AF’s
1X

9010) (oa a1 €:) eee eeeS 82
Means & Standard deviations, and Medians, & Interquartile ranges for
macronutrients from FR and FFQ data: SA’s
=) 0) (on at] (2) ST 83
Means & Standard deviations, and Medians, & Interquartile ranges for
macronutrients expressed as a percentage of total energy from FR and FFQ data: SA’s
Table 3-8(8)..... 0. ccc ccece cece nee e rene eee cence eee nonce eee EE EERE EEE SEED EEE E DEED ERE SEER HERERO EEE EES 84
Anova with Duncan’s Multiple Range test for differences between SA’s and AF’s:
FR data.
8-10) Conic rs) ( 0) 85
Anova with Duncan’s Multiple Range test for differences between SA’s and AF’s:
FR data, (macronutrients expressed as a percentage of total energy).
010) Coc rk (0) ES 86
Anova with Duncan’s Multiple Range test for differences between SA’s and AF’s:
FFQ data
O10) Coane ero (9 87
Anova with Duncan’s Multiple Range test for differences between SA’s and AF’s:
FFQ data, (macronutrients expressed as a percentage of total energy) |
010) eee]: ) 88
Means & Standard deviations, and Medians, & Interquartile ranges for macronutrients
from FR and FFQ data: FFQ First group

01) 0) (cc ee) ( 0) eer 89
Means & Standard deviations, and Medians, & Interquartile ranges for macronutrients
expressed as a percentage of total energy from FR and FFQ data: FFQ First group
01 0) oan 0) (Rn 90
Means & Standard deviations, and Medians, & Interquartile ranges for macronutrients
from FR and FFQ data: FFQ Second group
8 O10) (oon 0) C0) 91
Means & Standard deviations, and Medians, & Interquartile ranges for macronutrients
expressed as a percentage of total energy from FR and FFQ data: FFQ Second group
O10) Cones 00 ¢:) enn eee 92
Anova with Duncan’s Multiple Range test for differences between FFQ First and FFQ
Second groups: FR data
002) 9) (es 0 0) 93
Anova with Duncan’s Multiple Range test for differences between FFQ First and FFQ
Second groups: FR data, (macronutrients expressed as a percentage of total energy)
8 B10) (aR a On 0) nn 94
Anova with Duncan’s Multiple Range test for differences between FFQ First and
FFQ Second groups: FFQ data.
O10) Conc res (0) cece 95
Anova with Duncan’s Multiple Range test for differences between FFQ First and FFQ
Second groups: FFQ data, (macronutrients expressed as a percentage of total energy).
Table 3-12(a)..... 0.0... eee e cence eens tittitititititiitiiustistissassasistin 99
Pearson correlation coefficients for FR vs. FFQ data: All subject’s
Xi

010) CRs 072 (0) ene 100
Pearson correlation coefficients for FR vs. FFQ data for macronutrients expressed as
a percentage of total energy: All subject’s
0) 6) (oes Os: 101
Pearson correlation coefficients for FR vs. FFQ data and Fisher Z-test for differences
between males and females
0:10) (oan Re] (>) 102
Pearson correlation coefficients for FR vs. FFQ for macronutrients expressed as a
percentage of total energy and Fisher Z-test for differences between males and females
6010) (an as 02 103
Pearson correlation coefficients (r-value) for FR vs. FFQ data and Fisher Z-test for
differences between AF’s and SA’s
0) 6) (ons 1. (0) 104
Pearson correlation coefficients for FR vs. FFQ for macronutrients expressed as a
percentage of total energy and Fisher Z-test for differences between AF’s and SA’s
Table 3-15(a). 0... cce cece cece ence eee tenet cette eens teeta eeneeeanenae eee es oreesetees beeeeees 105
Pearson correlation coefficients for FR vs. FFQ data and Fisher Z-test for differences
between FFQ First and FFQ Second groups
010) (nd Bs 0) 106
Pearson correlation coefficients for FR vs. FFQ for macronutrients expressed as a
percentage of total energy and Fisher Z-test for differences between FFQ First and FFQ
Second groups
xil

LIST OF FIGURES
Figure 1-1... ccc cece een nen ne EEE E EEE EEE EEE EERE EERE ERE E EE EEE EEE 34
Prevalence of DM in Trinidad and Tobago in 1995 and estimated prevalence for the
years 2000 and 2025.
ASD FAV he) Se 52
Breakdown of recruitment and enrolment process for FFQ validation study
Figure 3-2()........ccceec cece eee ee eee eee eee e eee e eee ne eee e ee EEE REE R EEE EEE EEE EEE E EEE E EERE EE EEE EEE 58
Study data in relation to National Statistics: Gender and Ethnicity
ION Fo4 1 oN A (0) Re 59
Study data in relation to National Statistics: Completed Education Level
FIg“ure 3-3(a).......c ccc ecc eee e cece eee ee een need EEE cE A EEE EEE EEE EE LEED SEEDED OEE E ERED SHEER EEE EE OEE 62
Frequency Distributions for fat from 7-day Food Record and FFQ data: Example of
positively skewed data that required log transformation
15s F241 1 0] (0) 63
Frequency Distributions for GI from 7-day Food Record and FFQ data: Example of
negatively skewed data that required inversion
Figure 3-3(C).......cccccececeeenceceeeeeneeneneeeeseneeeeneneneee eens eae seen eee ee ere naeneea ene en ee aess 64
Frequency Distributions for PUFA expressed as a percentage of total energy from 7-
day Food Record and FFQ data: Example of data that did not require transformation
Figure 3-4(a)..... 0... cc ecece scene cne eee c scene ee eneeeeeeeeeeee ences eneneeeneea eee enseeneen neat eg sas 107
Scatter-gram between FR’s and FFQ for fat
Figure 3-4(b). 0.0.0... ccc ccc ce cece cence ence eee ence eee ee eens enced sees nee n deca en atte ete eenee nana ees 108
Scatter-gram between FR’s and FFQ for GI
xiii

T&T
AF
SA
MI
OTH
T2DM
TIDM
CEL
FFQ
FR
FFQ 1"
FFQ 2™
GI
AvCarb
Tcarb
SFA
MFA
PUFA
P:S
SD
ANOVA
ABBREVIATIONS
Trinidad and Tobago
African’s
South Asian’s
People whose background’s are a mixture of AF and SA
People from backgrounds other than AF, SA or MI
Type 2 Diabetes Mellitus
Type 1 Diabetes Mellitus
Highest education level completed
Food Frequency questionnaire
7-day food records
People that completed the FFQ before completing FR’s
People that completed the FFQ after completing the FR’s
Glycemic index
Available carbohydrate (does not include fiber)
Total carbohydrate (includes fiber)
Saturated Fatty Acid
Monounsaturated Fatty Acid
Polyunsaturated Fatty Acid
Ratio of polyunsaturated to saturated Fatty Acid
Standard deviation
Analysis of variance
Xiv

1. INTRODUCTION AND LITERATURE REVIEW
1.1 INTRODUCTION
Over the past decade, the prevalence of Diabetes Mellitus (DM) has increased
markedly in populations which have departed from their traditional lifestyles and undergone
“Westernization”.
In Trinidad and Tobago (T&T), mortality from diabetes is higher than elsewhere in
the Caribbean, and the prevalence of type 2 diabetes mellitus (T2DM) is six times that of
Canada and the US. T&T has a multi-ethnic population, comprised of individuals from
African (AF), South Asian (SA), and mixed (MI) backgrounds, making up approximately,
40%, 40%, and 20% of the population respectively. Epidemiological studies have found that
in T&T diabetes is twice as common in SA than AF men, with a smaller difference in
women. It has been shown elsewhere that a low diet glycemic index (GJ) is associated with
reduced risk of developing diabetes.
A pilot study was conducted in T&T to estimate the nutrient intakes and diet GI of
AF’s and SA’s. Nutrient intakes were assessed by 24-hour dietary recall and showed no
difference between the two ethnic groups. AF men were found to have a lower diet GI than
SA men, while no significant difference was observed in women. Although these results are
consistent with previous data suggesting that a high diet GI increases the risk of developing
T2DM (in men), a more rigorous nutrition survey tool is needed to further assess dietary
intake in T&T. Food Frequency Questionnaires, (FFQ) have become the principal dietary
survey tool in epidemiological studies of chronic disease. In addition, they have recently
been shown to be useful in assessing dietary intake with respect to diet GI. The first objective
of this study is to therefore, develop a FFQ, which can assess diet with respect to GI in T&T

using food intake data from previously collected 24-hour dietary recalls. The second
objective is to validate the FFQ using 7-day consecutive food records on a representative
sample of the population in Trinidad.
1.2 LITERATURE REVIEW
1.2.1 Diabetes Mellitus
Diabetes Mellitus (DM) is a chronic condition that contributes significantly to the
morbidity and mortality rates of many countries around the world. In Canada it is currently
ranked as the 7” leading cause of death (Tudor-Locke et al., 2000). Owing to an increased
life expectancy of the world’s population in conjunction with a rise in various
environmental/viral and lifestyle triggers, the prevalence of DM has risen considerably over
recent years and is now a global concern (World Health Organization; World Health Report,
1999). Concomitant with the rise of prevalence in DM is an increase in associated
complications such as retinopathy, neuropathy, cardiovascular disease, stroke and kidney
disease, which often lead to increased rates of morbidity and mortality (Tudor-Locke et al.,
2000). Complications of this nature are of grave importance not only because of the reduced
quality of life they bestow, but because of the substantial economic burden treatment places
on society (Tudor-Locke et al., 2000). This is of great concern particularly for countries of
the developing world whose economies are already in a state of economic stress. It has been
estimated that the annual treatment costs in 1992 were US $287 for individuals requiring
insulin and US$103 for individuals on oral treatment (Chale et al., 1992). These costs
represent 6-12 months’ wages for a labourer in some of the poorest non-industrialized
countries of the world such as Bangladesh and parts of rural India and Africa. Poverty and

lower levels of education will almost certainly translate into worse disease (Gulliford, 1995).
A large proportion of individuals becoming diabetic in adulthood will experience its chronic
complications during their working lives. Data from Africa and India show a high prevalence
of micro- and macro-albuminuria and a more rapid progression to end-stage renal failure than
in “Western” patients (Rahlenbeck et al., 1997). In the Caribbean, a large number of surgical
cases are patients with diabetic foot problems, and many lower-limb amputees remain
debilitated (Gulliford, 1995). There are few data from non-industrialized countries on
mortality from diabetes, however a report from a tertiary referral centre in Kashmir India,
suggests a 10- year reduction in life span. Infection and chronic renal failure were found to
be the most common causes of death, unlike coronary heart disease and stroke, which are the
leading causes of death among individuals with diabetes in more industrialized countries
(Fall, 2001).
DM is a heterogeneous group of disorders of varying aetiology and pathogenesis that
is characterized by hyperglycaemia and often associated with dyslipidemia (Pickup 1991, p.
155-60). Typically, a positive diagnosis for DM is made if fasting plasma glucose is greater
than or equal to 126 mg/dL and/or 2-hour post-load glucose level is greater than or equal to
200 mg/dL (Wei et al., 1999). Common symptoms include excessive thirst, polyuria,
unexplained weight-gain or loss, polyphagia, and fatigue (Pickup 1991 p. 155-60). The main
causes of this systematic syndrome are attributed to a relative or absolute deficiency of
insulin due to pancreatic beta cell failure and/or a resistance to the action of insulin at a
cellular level (insulin resistance). Many different forms of DM are known to exist and are
categorized with respect to how insulin deficiency or resistance is acquired. The most
common forms of DM include type 2 diabetes or non-insulin-dependent diabetes mellitus

(T2DM), type 1diabetes or insulin-dependent diabetes mellitus (T1DM), and gestational
diabetes mellitus (GDM) (Groff & Gropper, 1999 p. 242). Of these, T2DM is the most
common form of DM and will be the focus of this thesis.
1.2.1.1 Type 2 Diabetes Mellitus (T2DM)
Type 2 diabetes mellitus or non-insulin-dependent diabetes mellitus (T2DM)
currently accounts for 80%-90% of all reported cases of DM (Groff & Gropper, 1999, p.
242). Epidemiological studies have shown that T2DM has a global distribution and its
prevalence varies from country to country, in different ethnic groups in the same country, and
between the same ethnic group undergoing internal or external migration (Zimmet 1982).
Prevalence rates are highest among populations that have departed from their traditional way
of life and undergone rapid economic development and modernization (Fall, 2001). The
highest prevalence rates today are found in urbanized Pacific Island populations like the
Nauru, the Pima Indians of Arizona, the Oji-Cree of Northern Ontario, and Australian
Aborigines, all of who have adopted a more “modern” lifestyle in recent years (Zimmet,
1982; Ravussin et al., 1994). High prevalence rates have also been found in individuals that
have moved internally from rural to urban centres in the same country and migrants that have
moved externally from less developed to more developed countries. Among South Asians for
example, the age-adjusted prevalence rates of T2DM are less than 5 % in rural South India,
approximately 12% in urban South India, and 15-20% in migrants living in Trinidad and
Tobago, Mauritius, Fiji, Singapore, Tanzania, The Netherlands, and the UK (Gupta et al.,
1978; McKeigue et al 1988; Sinha, 1995; Ramachandron et al., 1996; Cappuccio et al., 1997;
Burden et al., 2000; Cruickshank et al., 2001). Among Chinese, the age-adjusted prevalence

rates of self-reported T2DM range from less than 3% in rural China to 15-20 % in urban
Taiwan and Mauritius, and among populations of the African Diaspora from less than 3% in
Cameroon, to 10% in individuals of West African descent living in Jamaica, and 15% in
Jamaicans living in the UK ( Mbanya et al., 1997; Cooper et al., 1997; Zimmet et al., 1997;
Unwin et al., 1998; Chen et al; 1999; Mbanya et al., 1999). In contrast, regions with low
levels of economic development or where people adhere to traditional ways of life such as
hunting and gathering or subsistence farming, the prevalence of T2DM is lowest. Examples
are the Mapuche Indians of Chile, rural Bantu of Tanzania, and the African nation of
Mauritania. In each case, prevalence of T2DM is between 1-3% for individuals aged 30-64
years (Swai et al., 1993; Ducorps et al., 1996; Cooper et al., 1997). These comparative data
demonstrate the determining influence of changes in living conditions on the population risk
of T2DM. Data for future predictions of T2DM prevalence are consistent with the trends
shown in current prevalence data. In 1998, the World Health Organization’s diabetes
database was used to predict global rates of T2DM for the years 2000 and 2025, based on
trends in population size, age structure and urbanization (King et al., 1998). According to this
analysis, the prevalence of T2DM is expected to rise by 30% globally, from 4.0% to 5.4%
(King et al., 1998). The number of adults with diabetes will increase from 135 million in
1995 to 300 million in 2025. Although prevalence rates will remain higher in industrialized
countries, the proportional rise will be greater in less-industrialized countries (48%), and
greatest in China (68%) and India (59%) (King et al., 1998). A particular concern regarding
future predictions of T2DM prevalence lies in the emerging problem among children and
adolescents.

Type 2 diabetes mellitus has a slow and insidious onset, and is often preceded by a
long period of impaired glucose tolerance (IGT), a reversible metabolic state associated with
increased prevalence of macrovascular complications. Clinical symptoms may not present
themselves for many years, and at the time of diagnosis long-term complications have
developed in almost one fourth of patients (Dagogo-Jack et al., 1997). Long-term
complications of T2DM include the metabolic syndrome, associated with insulin resistance
and characterized by an atherogenic lipoprotein profile; glucotoxicity; macrovascular disease
including cardiovascular, cerebrovascular, and peripheral vascular diseases; and
microvascular disease including retinopathy, nephropathy, and neuropathy (Dagogo-Jack et
al., 1997).
An actual cause of type 2 diabetes has yet to be determined, however there has been
some indication that susceptibility to T2DM may have a genetic component (most likely
polygenic) in addition to various acquired factors, and its pathogenesis involves an interplay
of progressive insulin resistance and beta-cell failure (Dagogo-Jack et al., 1997), Although
T2DM may occur at any age, it usually manifests itself in individuals over the age of fifty.
T2DM is more prevalent in obese individuals with 60-90% of all T2DM developing in obese
persons. The major risk factors for T2DM are age, and various environmental factors
including obesity, physical inactivity, and diet. The major cause of mortality in T2DM is
coronary artery disease (Manson et al., 1994; Mann, 1997; McLarty, 1997).

1.2.2 Risk Factors of T2DM
1.2.2.1 Genetics
Little is known of the genetic basis of type 2 diabetes mellitus. There appears to be a
varying genetic susceptibility to diabetes amongst different ethnic groups, which is expressed
under certain environmental conditions (Abate & Chandalia, 2001). The basis for the
susceptibility is unclear but could be a result of a thrifty gene. The “thrifty genotype”
hypothesis put forth by Neel in 1962 has been proposed to explain the high frequency of
T2DM in some populations. Neel postulated that individuals with the thrifty genotype
(hereditary tendency to be overweight or obese) had an exaggerated insulin response to food,
and were therefore better able to store energy efficiently, perhaps mediated by leptin
resistance, maximizing survival during alternating bouts of feast and famine, (Zimmet et al.,
1997). It has also been suggested that the tendency to store fat centrally, a feature of South
Asian Indian populations, may have a genetic basis. Central body fat, which is more
metabolically active than peripheral fat and less likely to impede locomotion may have
evolved as a site for quick storage and mobilization during times of need (McKeigue et al.,
1992). Genetic mechanisms associated with these phenomenon include an over responsive
beta-cell (a quick insulin trigger), and a genetically determined “down regulation” of insulin
receptors in response to repeatedly high levels of circulating insulin (Zimmet, 1982; Brand-
Miller et al., 1994; Zimmet, 1995). However, present-day social and cultural phenomenon of
the “West”, which favour dietary habits such as feasting with a preference for energy-dense
processed foods as well as a sedentary lifestyle, are thought to ameliorate the selective
advantage of the thrifty gene, resulting in increased rates of T2DM in susceptible populations

(Zimmet, 1982; Brand-Miller et al., 1994; Zimmet, 1995, Lindsay 2001). To date, the search
for T2DM gene(s) has not produced any major candidate for the thrifty gene.
Despite evidence from monozygote twin studies, which show high concordance rates
of T2DM, strong familial histories and ethnic differences in T2DM prevalence, candidate
genes have only shown weak associations (Cruickshank et al., 2001). One of the most
important loci found thus far is on chromosome 2 (T2DM1) of the insulin gene. However,
mutations in the coding region have not been consistently associated with T2DM
(Rosenbloom et al., 1999; Froguel, 2001). Several large genome-wide scans for linkage have
been conducted for T2DM in many populations, the largest in Pima Indian (Hanson et al.,
1998), Finnish (Mahtani et al., 1996; Ghosh et al. 2000; Watanabe et al., 2000), French
(Vionnet et al., 2000), British (Wiltshire et al., 2001), and Mexican-American (Hanis et al.,
1996; Duggirala et al., 1999) pedigrees. Although results from these studies have found
multiple loci that show an association or linkage to T2DM, no single locus across
populations has been identified (McCarthy, 2002). Recent data have demonstrated an
association between the VNTR (variable number of tandem repeats) region of the human
insulin gene and size at birth. This may explain the epidemiological finding that small size at
birth is associated with an increased risk for T2DM later in life (Rosenbloom et al., 1999;
Lindsay, 2001). Other genetic markers include the chlorpropamide alcohol flush
phenomenon, HLA-A2 in Xhosas and Pima Indians, and HLA-B61 in Fiji Indians (Zimmet,
1982). Although candidate genes for T2DM have been identified, definition of genes that
condition risk with respect to ethnicity are still unclear. A specific cause of T2DM remains to
be determined, however it appears to be a complex, poly and multi-genic interaction between
genetic susceptibility and environmental factors (Froguel, 2001).

1.2.2.2 Obesity
To date, a growing body of evidence exists, which suggests that obesity and central
adiposity are important and independent risk factors for the development of T2DM. Many
prevalence studies have shown that there is a strong positive association between the degree
of obesity in a population and the prevalence of T2DM. Some studies have also shown that
the greater the duration of obesity the higher the risk of T2DM (Everhart et al., 1992;
Wannamethee et al., 1999), and that obesity starting in childhood is an independent risk
factor (Vanhala et al., 1998). Although many prevalence studies exist, the majority of data
discussed here will pertain to populations of African and South Asian descent since they are
the focus of this thesis. Cooper et al., found that among persons of West African descent
living in Jamaica, age-adjusted diabetes prevalence was linearly related to the degree of
obesity. Jamaican women, whose body mass index (BMI) values are 17% higher than those
of Jamaican men, were found to have twice the prevalence of T2DM (Cooper et al., 1997).
Another prevalence study, conducted by Ramachandran et al., found that in an urban
population of SA’s living in Madras India, a 40 % increase in prevalence of T2DM had
occurred over a period of 6 years from 8.2% in 1988-1989 to 11.6 % in 1994-1995. Although
there was no concomitant increase in the rate of obesity, a strong association was found
between T2DM and BMI and central adiposity in both males and females (Ramachandran et
al., 1997). In a related cross-sectional study, epidemiological data from SA’s from Madras,
India and Mexican Americans (MA), and non-Hispanic Whites (NHW) from San Antonio,
Texas were compared to determine the possible contributions of various anthropometric
measurements to the varied prevalence of T2DM in these ethnic groups (Ramachandran et
al., 1997). Results showed that BMI was associated with T2DM within all ethnic groups.

10
MA’s were found to have the highest rate of obesity (mean BMI 28.9+5.9 km/m’) compared
to NHW’s (mean BMI 26.24+5.2 kg/m’), and SA’s (mean BMI 22.3+4.4kg/m7) and the
highest prevalence of T2DM (males 19.6%; females 11.8%, p<0.001 vs. other groups)
compared to NHW’s (males 4.4%; females 5.7%) and SA’s (males 9.9%; females 5.7%).
Presence of upper body adiposity even without being overweight seemed to be an indicator
of increased insulin resistance in SA’s increasing their risk for T2DM. Similarly, Karter et
al., found that increased abdominal obesity was related to lower insulin sensitivity
independent of overall obesity in African American’s, Hispanics, and NHW’s from Oakland
and Los Angeles, California, San Antonio Texas, and the San Luis Valley, Colorado (Karter
et al., 1996). Since prospective data exclusively pertaining to chronic disease in SA and AF
populations does not exist, prospective data collected from the US will be discussed. Among
43, 581 women enrolled in the Nurses’ Health Study who in 1986 were free of diabetes and
other major chronic diseases provided waist, hip, and weight information and were followed
from 1986 to 1994 for T2DM incidence. Results indicated that BMI, WHR and waist
circumference were powerful predictors of T2DM in US women (Carey et al., 1997).
Similarly, during an 8- year follow-up of 113, 861 US women aged 30-55 years in 1976,
Colditz et al., found 873 definite cases of T2DM among women initially free from diagnosed
diabetes or any other chronic disease. Relative risk of T2DM was found to increase
continuously with BMI, and weight gain after age 18, was found to be a major determinant of
risk (Colditz et al., 1990). Results from other prospective studies such as the San Antonio
Heart Study, which followed MA’s and NHW’s for 7-8 years to evaluate secular trends in
T2DM incidence, have also shown that rising BMI is a significant contributor to the
increasing prevalence of T2DM although other factors were also found to contribute to this

11
trend (Burke et al., 1999). Evidence from experimental studies have also shown that obesity
and overweight are associated with the development of T2DM in tandem with other risk
factors such as low physical activity, and poor diet. For example, in 1997, Pan conducted a
randomized, controlled trial of diet and/or exercise in men and women with impaired glucose
tolerance living in Da Qing, China. Subjects were randomized to receive advice on diet,
exercise, both or neither (control group). During 6 years of follow-up, the incidence of
T2DM was 68% in the control group, but significantly lower (40-50%) in all three
intervention groups. Despite the fact that no main effect on mean BMI was found per se, this
study provides evidence that weight reduction in conjunction with other lifestyle
management strategies is an important factor in the prevention of T2DM (Pan et al., 1997).
Although it has been known for many years that obesity is indeed related to the development
of T2DM, neither the exact nature of this relationship nor the underlying mechanisms is fully
understood.
Generally, obesity is considered to be an excess accumulation of body fat resulting
from positive energy balance (Mogenson et al., 2000). More specifically, obesity is defined
(conventionally) as BMI >30 kg/m’. As body weight increases, insulin resistance, glucose
intolerance and the propensity to develop diabetes increase (Haffner et al., 1997).
Development of obesity is insidious and associated with elevated free fatty acid (FFA) levels
as well as with enhanced availability of glucose (hyperphagia) and insulin (Belfiore, 2000
p.46). Increased utilization of FFA as fuel (as seen in obesity) results in an enhanced
"Definition of obesity for different ethnic groups is currently a matter of some debate. Seidell has argued that
traditional BMI cut-points (used for “White populations”) may in fact be of little value for identifying Asian
individuals at high risk who constitute more than half of the world’s population. It was shown among various
ethnic groups, particularly of Asian origin that the risk of T2DM starts to increase rapidly at levels of BMI or
waist circumference well in the acceptable range of BMI or waist circumference for Europeans (Kosaka et al., 1996).

12
production of long-chain CoA or acyl-CoA (LC-CoA) in the cytosol and of acetyl-CoA in the
mitochondria. This leads to an inhibition of glucose metabolism, thereby inducing insulin
resistance, which is often followed by hyperinsulinemia (Belfiore, 2000 p. 47). Body fat
distribution is also significant in determining glucose intolerance. It has been shown that
individuals with central or abdominal obesity tend to have higher blood glucose and insulin
levels, raised plasma triacylglycerides, and reduced plasma high-density-lipoprotein (HDL)
cholesterol than individuals with peripheral obesity. Enlarged visceral adipocytes are
resistant to insulin’s antilipolytic action, and more responsive to lipolytic hormones.
Resultant elevated levels of FFA may induce insulin resistance in the liver and peripheral
tissues as discussed above (Karter et al., 1996).
1.2.2.3 Exercise
Although it is difficult to isolate activity level and study it as a single factor in
relation to diabetes prevalence and incidence, there is a growing body of evidence, which
suggests that physical inactivity is an independent risk factor for the precipitation of T2DM.
Sedentary individuals often develop obesity owing to their lack of exercise, which places
them at a greater risk for diabetes. In a thirteen year prospective study of British men, Perry
et al., found that the risk of developing diabetes was reduced by 50% in men who engaged in
moderate to vigorous physical activity (adjusted for BMI) compared to less active men (Perry
et al. 1995). Hu et al found in an eight year prospective study of 70 102 female nurses from
the Boston area initially free from chronic disease that the relative risk for developing T2DM
(after adjusting for age, smoking, alcohol use, history of hypertension, history of high
cholesterol level and BMI) was inversely related to physical activity level. Their data

13
suggests that greater physical activity level is associated with substantial reduction in risk of
T2DM, including physical activity of moderate intensity and duration (Hu et al., 1999).
Rural-urban shift and migration are often accompanied by change in levels of physical
activity, almost invariably to a more sedentary pattern (Zimmett, 1982). Epidemiological
studies in Cameroon (Cruickshank et al., 2001; Mbanya et al., 1997) and India
(Ramachandran et al., 1997) have shown that diabetes is more common in urban dwellers
than rural dwellers of the same weight. Cooper et al., found that Nigerians who are lean and
physically active have a much lower incidence of diabetes compared to the largely sedentary
population of the US (Cooper et al., 1997).
In experimental studies, exercise has been shown to improve glucose tolerance, lower
glycaemia, and increase insulin sensitivity (which results in increased peripheral use of
glucose) (Belfiore et al., 2000 p.69; Wei et al., 2000; Hayashi et al., 1997). Muscle
contraction increases the number of GLUT-4 glucose transporters translocated to muscle
cells during exercise independent of the action of insulin as well as increase muscle glycogen
utilization. Perseghin et al., found that increased glucose transport-phosphorylation and
muscle glycogen synthesis occurs after exercise in normal and insulin resistant subjects.
These phenomenon in conjunction with increased delivery of insulin to active muscle caused
by increased blood flow during exercise may be part of the mechanism for improving insulin
sensitivity by physical activity (Wei et al., 2000). In addition, physical activity has also been
shown to be inversely associated with obesity and central fat distribution (Wei et al., 2000).
Therefore, exercise may also prevent or delay the onset of T2DM, at least in part through
decreasing overall fat and/or intra-abdominal fat.

14
1.2.2.4 Diet
Diet has been thought to contribute to the development of T2DM primarily in two
ways: Firstly, through the supply of calories and resultant obesity if the level of physical
activity is low; and secondly, via the effects of specific foods (Zimmet, 1982). Prior to
industrialization, the diet of traditional or subsistence societies consisted of foods high in
fibre, starch, and vegetable protein, and low in animal protein, fat and sodium (Jenkins et al.,
1997; Brand-Miller et al., 1994). Over the past 60 years the diet of the “West” has departed
from this “traditional” regime and become characterized by intakes low in fibre and starch,
and high in refined sugar, salt, saturated fat and animal protein (Zimmet, 1982; Jenkins et al.,
1997). The “Western” diet is richer in fats and protein and includes fewer fruits, vegetables
and cereals. In addition, the increased processing and refining of food has reduced its amount
of valuable roughage and nutrient content (Zimmet 1982; Jenkins et al., 1997). The high
calorie density (calorie/weight ratio) of manufactured food in conjunction with a low fibre
intake has been postulated to delay satiety and hence contribute to a high total caloric intake
and, in turn obesity (Zimmet, 1982). These phenomenon have been shown to increase —
susceptibility to chronic disease (Daniel, 1996).
The present goal of medical nutrition therapy is to develop diets, which can be used to
prevent the onset of these diseases as well as provide successful treatment strategies (Balch et
al., 1997; Holler et al., 1997 p.137). Current nutrition therapy for T2DM aims to optimize
blood glucose and lipid control, maintain optimal body weight, and minimize hypoglycaemia
in individuals treated with insulin (Wolever et al., 1995; Aitken, 1997).
In the late 1970’s and early 1980’s, the traditional low carbohydrate recommendation
for the diabetic was revised in many centres when it was discovered that a concomitant

15
increase in saturated fat and cholesterol intake was taking place (Wolever et al., 1995). A
high fat diet is an independent risk factor for the development of insulin resistance and is
more associated with increased body weight and hence obesity than dietary carbohydrate or
energy intake (Shah et al., 1996). Epidemiological studies have also shown that diets high in
fat tend to precede the conversion to T2DM from impaired glucose tolerance and increase the
risk of developing long-term macrovascular complications such as atherosclerosis (Marshall
et al., 1994). Many diabetes associations around the world reviewed their dietary
recommendations accordingly, and began to advise a decrease in fat and increase in
carbohydrate intake (Wolever et al., 1995). High carbohydrate, fat-restricted diets have been
shown to reduce cholesterol and triacylglyceride levels as well as improve glycemic control
in diabetic subjects (Jovanovic et al., 1985; Rifkin et al., 1990; Shah et al., 1996). Current
dietary recommendations are patient-focused, and contingent on the individuals own
metabolic profile (Holler et al., 1997, p. 137; Wolever et al., 1995). The most common
dietary guidelines for diabetics include consuming 50-60% total energy from carbohydrates
and less than 30% from fats (predominately poly- and monounsaturated), and a high fibre
content (20-35 g/day) (Wolever et al., 1997). The specific role of fibre in the diet was not
recognized until the mid-1970’s when Burkitt and Trowell found that a population in rural
Uganda who consumed large quantities of fibre (50g fibre/1000Kcal) had a relatively low
incidence of diabetes (Wolever et al., 1997; Jenkins et al., 1997). An extensive body of
literature predominantly from experimental studies has subsequently shown that diets high in
both fibre and carbohydrate are able to improve blood glucose levels; decrease insulin
demands; and reduce total and LDL cholesterol, apolipoprotein B and lipid levels (Salmeron
et al., 1997; Salmeron et al., 1997; Jenkins et al., 1994). The most widely accepted definition

16
for dietary fibre is that proposed by Trowel et al., which basically asserts that it is that
portion of plant material, which is resistant to hydrolysis by the digestive enzymes in the
human small intestine (Groff et al., 1999, p. 107). Dietary fibre is often classified according
to its solubility in water. Insoluble fibres such as cellulose and lignin pass through the body
largely unchanged and are known to decrease (speed up) intestinal transit time and increase
fecal bulk. In contrast, water-soluble fibres, which include some hemicelluloses, pectin, gums
and mucilages, tend to be degraded by the commensal micro flora in the colon (Jenkins et al.,
1988). They delay gastric emptying, increase satiety, increase transit time (slower movement)
through the intestine, and decrease nutrient (e.g. glucose) absorption (Groff et al., 1999, p.
111). With respect to therapeutic effects, soluble fibres have been shown to be the most
beneficial to the diabetic. Research to date, from experimental studies have shown that rises
in postprandial glucose and insulin levels can be reduced after consuming meals rich in
viscous soluble fibres, and that diets rich in soluble fibre can lower blood lipid levels
(Jenkins et al., 1993; Salmeron et al., 1997; Salmeron et al., 1997; Wursch et al., 1997). The
satiating effects of dietary fibre may also be a useful strategy for weight loss, a matter of
concern for many diabetics. Because, many foods contain both a dietary fibre and
carbohydrate component, their individual roles have been difficult to gauge. In addition,
some food composition tables lack information pertaining to content, and few dietary
assessment tools have been designed which are able to assess fiber intake accurately and
independent of carbohydrate intake.
Carbohydrates are naturally occurring compounds found in food, which supply nearly
half of the total caloric intake for most humans (Groff et al., 1999, p. 111). They are either
“simple” and include mono- and disaccharides such as glucose and lactose, or “complex” and

17
include polysaccharides such as starch and dextrin. Complex carbohydrates are formed from
a large number of glucose molecules in either branched (amlyopectin) or straight chains
(amylose). Previously, it was believed that molecular structure and chain length of the
carbohydrate (complex verses simple) determined the rate of digestion and predicted the
glycemic response (Wolever et al., 1995). However, Wahlqvist et al., in 1978 showed that the
number of glucose units in the polysaccharide molecule had no relation to the glycemic
effects of the carbohydrate. Shortly thereafter, Crapo et al., (1981) found wide variations in
glucose responses to various starchy foods of similar macronutrient content and Jenkins et
al., showed that the effects of starch on plasma glucose varied depending on food source
among other factors. The results from these as well as many subsequent studies confirmed
that the complex verses simple classification is not a suitable determinant of the rate of
carbohydrate metabolism and cannot be used to predict glycemic response (Wolever et al.,
1995; Groff et al., 1999 p. 112). In 1981, Jenkins et al., developed the concept of the
glycemic index (GI), which serves as a classification system for foods based on their
glycemic impact (Wolever et al., 1995).
1.2.3 The Glycemic Index
It has been well documented that different foods are able to produce markedly
different blood glucose responses independent of the amount of carbohydrate they contain.
Based on this premise, the Glycemic Index (GI) was developed in order to assess and classify
the blood glucose responses to food. GI values can be used to supplement data about food
composition for diabetes diet planning and determine the physiological effects of entire diets
(Wolever et al., 1992).

18
The GI is defined as the incremental blood glucose area following a 50g available
carbohydrate portion of the test food, expressed as the percentage of the corresponding area
following a carbohydrate equivalent load of a reference food, usually white bread (Bjorck et
al., 2000). The clinical efficacy of the GI has been questioned for a number of reasons
including, variability of glycemic responses in different subjects, difficulty in ascribing GI
values to mixed meals, and different methodologies used in GI calculations. Despite these
shortcomings, many studies have clearly shown that low-GI diets are beneficial in the
management of T2DM. The glycemic index depends largely on the rate of digestion or
absorption of the carbohydrate. Low-GI foods such as whole grain products and legumes
release glucose to the blood at a slower rate than high GI foods such as potato or white bread,
and have a reduced insulin demand (Bjorck et al., 2000; Willet, 1998, p. 447). Factors, which
reduce the rate of absorption include the nature of the starch, degree of food processing,
presence of viscous fibres and antinutrients, and altered food frequency (Jenkins et al., 1995).
Much of the evidence to date comes from experimental studies. Wolever et al., showed that
reducing the blood glucose raising potential of the diet without changing macronutrient
composition improved glycemic control, lowered total serum cholesterol, LDL cholesterol
and serum triglyceride levels in type 2 diabetics (Wolever et al., 1987, 1992; Jenkins et al.,
1987, 1988). Improvements in long term glycemic control were found in T2DM subjects on
low GI diets verses high GI diets (Brand et al., 1991) and insulin secretion as measured by
24-hour urinary C-peptide levels was found to be lower in subjects on low verses high GI
diets (Jenkins et al., 1987). Dietary fibre has recently been incorporated into the body of
research examining the glycemic effects of foods. Salmeron et al found that a low cereal fibre
diet and high glycemic load” (GL) increases the risk of developing T2DM in both men and
* Glycemic load is calculated as the product of a food’s carbohydrate content and its glycemic index value.

19
women (Salmeron et al., 1997). After, adjusting for activity level, family history of diabetes,
total energy intake, and cereal fibre in the diet, they concluded that dietary GI is positively
correlated with risk of T2DM (Salmeron et al., 1997). Many epidemiological studies have
shown that diets high in saturated fats, and refined sugars, are associated with an increased
risk of developing T2DM and CHD (Rosenbloom et al., 1999; Mbanya et al., 1997;
Tsunehara et al., 1990; Jenkins et al., 1997), however few have looked specifically and
independently at the role of GJ. Liu et al., recently demonstrated that a high glycemic load
may be considered a potential risk factor for coronary artery disease in free-living women,
particularly those prone to insulin resistance (Liu et al., 2001). Understanding the
relationship between dietary GI and T2DM will be beneficial to many people around the
world, particularly those in developing countries where incidence rates are nearing epidemic
in some regions.
1.2.4 Epidemiology of T2DM in the Caribbean
During the last 30 years there has been an unprecedented epidemiological transition
in disease prevalence in many countries of the world. Malnutrition and infectious disease,
once the major causes of morbidity and mortality have been superseded by conditions such as
obesity and chronic non-communicable diseases including cardiovascular disease, cancer,
hypertension and diabetes (Sinha, 1995; Gulliford, 1996). Dietary and lifestyle changes
associated with economic development or ““Westernization” are believed to have been pivotal
in conditioning the increase in these such diseases. The Caribbean was one of the primary
regions where the importance of diabetes in developing communities was first recognized
(Gulliford, 1996). Despite a lack of information on the incidence of T2DM, prevalence data

20
suggest that similar changes in diet and lifestyle are responsible at least in part for the rise in
T2DM prevalence seen in many Caribbean nations. In 1998, a report published by King et
al., estimated that T2DM prevalence for individuals >20 and <64 years of age in Trinidad
and Tobago will increase from 4.5 % in 1995 to 4.7% in 2000 and 6.7% in 2025 (King et al.,
1998) (Figure 1-1). Mortality data have also provided some knowledge about T2DM
epidemiology in the Caribbean, however these data are not always reported so accurate
information is difficult to obtain. In 1995, Sinha reported that there was a significant increase
in the percent contribution of diabetes to total mortality in the Caribbean over the last 30
years (Sinha 1995). Shortly thereafter Gulliford, declared that T&T had the highest total
death rate and death rate due to diabetes in the Caribbean. Mortality rates from diabetes were
found to be higher in women than men in T&T, and prevalence rates increased linearly with
respect to age (Gulliford 1996; Sinha 1995). Trends regarding ethnicity were difficult to
determine since mortality analyses in T&T are not published according to ethnic group
although death certificates usually include mention of ethnicity (Gulliford, 1996).
One of the most comprehensive surveys addressing diabetes in the Caribbean was
carried out in Trinidad in 1961-62 where the ethnic composition of the population is
relatively representative of the Caribbean at large. The island is comprised of persons from
South Asian (SA), African (AF), and mixed (MI) backgrounds making up 40%, 40%, and
20% of the population respectively. These surveys indicated that T2DM prevalence was
significantly higher in the SA (2.4%) than in the AF population (1.4%) in T&T. SA men
were found to have a slightly higher but non-significant prevalence of T2DM (2.5%)
compared to SA women (2.3%), and AF women showed an almost two-fold higher
prevalence (2.1%) than AF men (1.1%) (Sinha, 1995). About fifteen years later, the St. James

21
study found a significant increase of T2DM prevalence in both ethnic groups. The prevalence
of T2DM for SA’s was still higher at approximately 20% for SA males and females, 9.6% for
AF males and 16.5% for AF females. Although T2DM prevalence was higher in SA
compared to AF females, AF females had a slightly higher prevalence of impaired glucose
tolerance (IGT) than SA females. SA men had an almost two-fold higher IGT prevalence
than AF men. These ethnic differences in T2DM prevalence are difficult to explain using a
genetic predisposition model because even within ethnic groups, prevalence rates vary from
district to district. It is possible that ethnic differences in dietary intake may provide an
alternative explanation since dietary habits between AF’s and SA’s have been known to
differ while other factors such as activity level and age are similar between the two groups
(Sinha, 1995).
The apparent decrease in utilization of complex carbohydrates such as indigenous
root tubers and vegetables and concomitant increase in total calories, most of which are from
saturated fat have been thought by some to account for the increased prevalence rates of
T2DM in T&T (Sinha, 1995). Although there appears to be a strong positive correlation,
much of the available information comes from food disappearance data, a source of data in
which the actual amount of food consumed by each ethnic group and the population taken as
a whole is not reflected accurately. According to the 1962 West Indies Nutrition Survey, the
dietary habits of the South Asians and Africans differ in some respects. For example, the
main staple foods of the South Asians were shown to be rice, flour in the form of roti, and
Irish potatoes and those of the Africans included rice, white bread, and indigenous root tubers
such as dasheen, cassava, eddoes, and white yam. In an attempt to investigate these
phenomenon, a pilot study was conducted in T&T, to determine the dietary GIs of SA’s and

22
AF’s in T&T. It was found that AF men had a lower diet GI than SA men, while intakes of
energy, fat, protein, carbohydrate and fibre did not differ significantly (Wolever et al., 2000
abstract). Since, the prevalence of diabetes in T&T was shown to be twice as common in SA
than AF males with a smaller difference in females these results are consistent with previous
data suggesting that a low dietary GI may reduce the risk of developing T2DM. However a
more thorough assessment of dietary intake is needed in T&T to fully understand this
relationship since results from the pilot study were based on 24-hour dietary recalls, which
rely on the participants memory and are affected by day-to-day variability in food intake.
Food Frequency Questionnaires, (FFQ) have become the principal dietary survey tool in
epidemiological studies of chronic disease because diet-disease links develop over long
periods of time, and FFQs allow assessment of long-term or habitual dietary intake (Teufel,
1997; Dwyer, 1999).
1.2.5 Dietary Assessment Methods
1.2.5.1 24-hour Dietary Recalls
Twenty-four-hour dietary recalls require participants to remember and report all foods
and beverages consumed over the preceding 24 hours. Recall is typically conducted by
personal interview either by a well-trained interviewer or dietician as probing questions are
often required to gather detail or specifics about dietary intake. In 1967, Campbell and
Dodds, found among groups of older individuals that respondents with interviewer probing
reported 25% higher dietary intakes that did respondents without interviewer probing.
Probing is particularly useful for collecting information about how foods are prepared, and
recovering items that may have not originally been reported such as butter on toast or snacks

23
and coffee breaks. However, interviewers should use standardized neutral probing questions
when conducting interviews to avoid leading the participant (Thompson and Byers, 1994).
Interviewers should also be aware of available foods in the environment/marketplace, and
preparation practises, including prevalent regional or ethnic foods. In order to minimize error
and increase reliability of interviewing and coding, a detailed protocol for administration of
24-hour dietary recalls, and training/retraining sessions for interviewers should be conducted
(Thompson and Byers, 1994). Duplicate collection and coding of a sample of recalls
throughout the study period and use of a computerized data base system for nutrient analysis
should also be used (Thompson and Byers, 1994). There are many advantages to using 24-
hour dietary recalls. Given that an interviewer administers the tool and records responses,
literacy of the respondent is not necessary and because the recall period is short, respondents
are usually able to recall most of their dietary intake. The average 24-hour dietary recall takes
approximately 20 minutes to complete (Thompson and Byers, 1994). Since little burden is
placed on the respondent, those who agree to participate in 24-hour dietary recalls are more
likely to be representative of the population than those who agree to keep food records or
complete FFQ’s (Thompson and Byers, 1994). In contrast to the keeping of food records,
diet recalls occur after the food has been consumed, so there is less potential for the
assessment method to interfere with dietary behaviour (Thompson and Byers, 1994). An
inherent problem with the 24-hour dietary recall method is that individuals may not report
their food consumption accurately for various reasons related to memory and/or the interview
situation. In addition, since most individual’s diets vary from day to day, it is not appropriate
to use data from a single 24-hour dietary recall to characterize an individual’s usual diet.

24
Instead, a series of recalls should be used that are conducted at different times of the year
since seasonality can influence dietary habits.
1.2.5.2 Diet Records
With the diet record approach, respondents are required to record their food and
beverage intake along with the amounts consumed over a specified number of days.
Typically 3 or 4 consecutive days are included since more than 7 consecutive days can result
in respondent fatigue, however day of the week variation in dietary intake also needs to be
considered (Thompson and Byers, 1994). The most practical application of food records
would include multiple administrations of 3-day food records, conducted at intervals that
would take into account day of the week and seasonal variation in dietary intake.
Theoretically, reporting of food intake is done at the time of consumption, however, it need
not be done on paper, since dictaphones have been used and are particularly useful for low
literacy groups (Thompson and Byers, 1994). Participants must be trained in how to record
dietary intake including the name of the food, brand name, preparation methods, recipes for
mixed dishes, and portion sizes. Contact with an administrator during the reporting period is
useful for ensuring proper completion of the records. Upon completion of the diet records, a
trained interviewer should review all entries with the respondent to clarify any ambiguities
and probe for forgotten items.
Diet records have the potential of providing quantitatively accurate information about
food items consumed during a specified recording period. For this reason, diet records are
often regarded as a “gold standard” against which other dietary assessment tools are
compared (Thompson and Byers, 1994). Because foods are recorded as they are consumed,

' 25
the problem of recall is lessened and the foods are described in more detail. In addition, the
measurement of the amounts of food consumed at each eating occasion provides more
accurate information about portion sizes than if participants were to recall the amounts of
foods eaten previously (Thompson and Byers, 1994). However, since diet record keeping
requires that participants be both motivated and literate, the utility of the method is limited in
various populations such as children, the elderly and recent immigrants, resulting in sample
selection bias. Participants may also develop habits whereby they record food intake only
once per day or at one time during the recording period (Thompson and Byers, 1994). If this
is the case, the record method approaches the 24-hour recall in terms of relying on memory
rather than on concurrent recording (Thompson and Byers, 1994). Recording dietary intake
as items are consumed can affect both the types of food chosen and the quantities consumed.
Therefore, the diet record method may alter dietary behaviours that the tool was initially
intended to measure (Thompson and Byers, 1994).
1.2.5.3 Biomarkers of Diet
Biomarkers have considerable potential in aiding the understanding of the
relationship between diet and disease or health since they can provide the link between the
consumption of specific foods and biological outcome. Laboratory analyses of blood, urine,
adipose tissue, stools, nails and hair have yielded a variety of biological markers that can be
useful for assessing diet. Biomarkers provide an accurate and objective measure of dietary
intake because they are not reliant on a subject’s memory or on the accuracy of recording in a
food record. There are two categories of biomarkers of diet: (1) those, which provide an
absolute quantitative measure of dietary intakes, such as 24-hr urinary nitrogen excretion as a

26
measure of 24-hr protein intake. Currently, only a small number of markers fall into this
group; (2) those which measure the concentration of a given factor, such as plasma vitamins,
but for which there is no time dimension to the measurement. The measure therefore
correlates with intake but does not provide an absolute measure of it. The majority of
biomarkers are of this type and are useful in categorizing individuals into relative levels of
intake (Wild et al., 2001). Other biomarkers in this category include: carotenoids,
tocopherols, ascorbic acid, vitamins Bs and B)2 and folate from blood; marine omega-3 fatty
acids, linoleic and linolenic acids from blood or adipose; and sodium, potassium, calcium and
magnesium from urine (Willett, p. 127, 1998). Biomarkers of diet are most often used in
validation studies of dietary assessment tools. The advantage of using biochemical markers
in dietary assessment is that their random errors are independent of those inherent in
questionnaire measurements and food-consumption records. The inclusion of biomarkers in
dietary validity studies increases the likelihood that the criteria of independent errors, crucial
in validity studies, are met (Kaaks, 1997). A major problem with most biomarkers studied is
that in well-fed populations there are many determinants of nutrient concentrations in
biological tissues apart from dietary intake (Thompson & Byers, 1994). Other issues of
concem include: proper analytic technique; how metabolism of a compound may alter the
validity of a marker; and difficulties that may arise when several biomarkers are available to
assess exposure to one nutrient (Crews et al., 2001). The use of biomarkers are costly and
require that samples be collected using a suitable protocol and stored under conditions that
will not result in any alteration of sample composition, or deterioration of sample quality
(Crews et al., 2001).

27
1.2.5.4 Diet History
The term “diet history” is used in many ways. Originally, as coined by Burke in 1947, the
term diet history referred to the collection of information about the frequency of intake of
various foods as well as the typical composition of meals. The diet history method,
characterizes foods in much more detail than is permissible in food frequency lists such as
preparation methods, and foods eaten in combination. The Burke diet history originally
included three elements: a detailed interview about the usual pattern of eating, a food list
asking for amount and frequency usually eaten, and a 3-day diet record (Burke, 1947). The
detailed interview (which sometimes includes a 24-hour diet recall) is the central feature of
the Burke method, with the food frequency list and diet records used as cross-checks of the
history. The original Burke diet history has rarely been reproduced since it requires a lot of
effort and expertise in capturing and coding the information collected in the interview.
However, many variations of the Burke method have been developed and are designed to
ascertain usual eating patterns over an extended period of time, including type, frequency,
and amount of foods consumed; many include a cross-check feature (Van Beresteyn et al.,
1987). More recently, the method has been automated, eliminating the need for an interview.
The major strength of the diet history method is its assessment of usual meal patterns and
details of dietary intake rather than intakes for a short period of time as in records or recalls,
or only frequency of food consumption. Details about food preparation can be helpful in
characterizing nutrient intake, as well as exposure to other factors in foods. More cognitive
support is provided for the recall process compared to other dietary intake assessment
methods, which may result in more accurate measures. However, participants are asked to
make many judgements about usual dietary intake and the amounts of foods eaten. These

28
subjective tasks may be challenging (and burdensome) for the participant. Burke cautioned
that nutrient intakes estimated from these data should be interpreted as relative rather than
absolute. All of these limitations are shared with the food frequency method. The diet history
approach, when conducted by interviewers requires trained dieticians, which could be costly.
1.2.5.5 Food Frequency Questionnaires (FFQ)
During the 1950’s, Stephanik and Trulson (1962), Heady (1961), Wiehl and Reed
(1960) and Marr (1962) developed the Food-Frequency Questionnaire (FFQ), and evaluated
their role in dietary assessment (Willett, 1998, p. 74). Stephanik and Trulson (1962) found
that a FFQ could discriminate between groups of subjects defined by ethnicity, but did not
consider that such a questionnaire could be useful in computing nutrient intakes. Interest in
FFQ’s waned during the 1970’s but greatly increased during the 1980’s and 1990’s when
substantial refinement, modification, and evaluation of FFQ methodologies took place
(Willett, 1998, p. 75).
The FFQ approach asks respondents to report their usual frequency of consumption of
each item from a list of individual foods for a specific time period. Although many
instruments collect information pertaining only to frequency (and sometimes quantity), some
enquire into methods of food preparation, and combinations of foods in meals (Thompson et
al., 1994). Semi-quantitative FFQ’s (SQFFQ) incorporate portion size questions, or specify
portion sizes as part of each question in order to estimate relative or absolute nutrient intakes.
Overall nutrient intake estimates are derived by summing over all foods the products of the
reported frequency of each food by the amount of nutrient in a specified serving of that food
(Thompson et al., 1994).

29
SQFFQ’s are the best method of dietary assessment for representing an individual’s
actual or relative food and nutrient intake over a long period of time (Rim et al., 1992).
Where single diet records or 24-dietary recall fail due to day-to-day variability, FFQ’s can
estimate usual intake without being affected by recent or transient changes in the diet
(Thompson et al., 1994). This is useful with respect to epidemiology because it is habitual
intake in the past, not random daily intake that is considered to be a determinant of disease
risk and development. In addition, FFQs are most often and best used to rank subjects into
groups based on the types of foods they eat most frequently, or on the levels of specific
nutrients consumed (Thompson et al., 1994). These classifications are useful in associating
disease risk with levels of food or nutrient intake (Salvini et al., 1989; Rimm et al., 1992;
Willett et al., 1985; Thompson et al., 1994).
FFQ’s are the most economical method of long-term dietary assessment. They do not
require much of the subjects’ time, can be self-administered, and do not require professional
interviewers. Some are also scannable, thereby reducing cost and time for data entry (Salvini
et al., 1989; Rimm et al., 1992; Thompson et al., 1994). To assess diet over the same period
of time as the FFQ, multiple dietary records (DRs), or recalls would have to be collected
from each subject, and that would be time consuming and costly. The determination of actual
intake using a FFQ however, may not be as accurate as with DRs or recalls. This could be
due to the limited number of foods listed on the instrument or difficulties with portion size
and frequency estimation (Thompson et al., 1994). The major limitation of FFQ’s is that
many details of dietary intake are not measured. Inaccuracies result from incomplete listing
of food items, from errors in frequency estimation, and from errors in estimation of usual
serving sizes (Thompson et al., 1994). In general, longer food lists overestimate intake,

30
whereas shorter lists underestimate intake (Krebs-Smith et al., 1994). Although some FFQ’s
produce estimates of population average intakes that are reasonable, different FFQ’s will
often perform in unpredictable ways in different populations, therefore the levels of nutrient
intakes estimated by FFQ’s should best be regarded as approximations (Thompson et al.,
1994). Participants have trouble recalling the average intake of certain food items especially
seasonal ones, and also have difficulty estimating usual serving size (Thompson et al., 1994).
However, frequency is believed to be a greater contributor to the variance in intake of most
foods than typical serving size which is why some epidemiologists prefer to use FFQ’s
without the additional respondent burden of reporting serving sizes (Thompson et al., 1994),
The FFQs ability to measure true dietary intake is assessed by a variety of
approaches, which is pivotal in evaluating the strength and usefulness of the survey tool.
Validity refers to the degree to which the questionnaire actually measures the aspect of the
diet that it was designed to measure. Put another way, validity is the process of assessing the
ability to measure truth (Willett, 1998, p. 101). This implies that a comparison is made with a
superior, although possibly imperfect standard. Ideally, the definitive validity study for a
FFQ would require constant, and non-invasive monitoring of the respondents food intake
over a long period of time. Since this is not possible for practical reasons, a series of DRs or
24-hour dietary recalls are generally used as a reference or “gold standard” (Thompson et al.,
1994). These types of studies are more appropriately called calibration studies because
recalls and records themselves may not represent the time period of interest, may contain
error, and may underestimate nutrient intakes by nearly 20% (Willet, 1998, p 103). Because,
DRs and 24-hour recalls do not depend on long-term memory, their error is independent of
the error implicit in FFQs (Thompson et al., 1994). The correlations between the methods for

31
most foods and nutrients are usually in the range of 0.4 to 0.7. Correlation coefficient values
(r) of r>0.8, 0.5<r<0.8, v<0.5 represent strong, moderate, and weak correlations respectively
(Abramson, 1994). Weak correlations are usually taken to indicate inaccuracy of the methods
used, and higher correlation coefficients will be characteristic of foods with increased
between-person variation, which is an important factor in determining associations with
disease (Feskanich et al., 1993). Because errors in DR’s will have a lowering effect on r-
values, correlations can be assumed to be conservative estimates of FFQ validity (Willett et
al., 1987).
Although reproducibility? is not indicative of validity, a valid method used in
epidemiological studies must be reproducible. Reproducibility coefficients are used to
compare the agreement between two identical FFQs administered at different times in similar
populations (Willet, 1998 p. 101; Feskanich et al., 1992). Assessment of the reproducibility
of a FFQ relies on the assumption that diet does not change between consecutive
administrations, and that the administrations are separated by enough time so that subjects
are not influenced by previous responses (Thompson et al., 1994). The level of
reproducibility found for a FFQ is sometimes equated with that of certain biological markers
such as serum cholesterol, blood pressure, and uric acid, which are often used as reliable
predictors of disease (Willett, 1998, p 124).
Many studies to date have found that the FFQ method shows sufficient validity and
reproducibility to make it a useful instrument for epidemiological studies (Jain et al., 1980).
The Harvard dietary Assessment form developed by Willett et al., and the Health Habits and
History Questionnaire developed by Block and coworkers at the National Cancer Institute,
° Reproducibility refers to consistency of questionnaire measurements on more than one administration to the
same individuals at different times, realizing that conditions are never identical on repeated administrations (Willett, p. 101, 1998).

32
are two instruments currently in widespread use. Both questionnaires have been validated for
their ability to assess the intake of various predictors of chronic disease, including total
energy, cholesterol, dietary fat, and calcium at the individual level (Dwyer 1999; Block et al.,
1990; Willet, 1998, p. 105; Teufel, 1997). Other validated FFQs such as those developed by
the National Centre for Health Statistics (NHANES III), International Agency for Research
on Cancer (EPIC), and the University of Hawaii (Multiethnic-minority Cohort study of Diet
and Cancer) have also been used to assess similar dietary factors. (Appendix A) lists
descriptions of various validation studies and their findings. Although total energy, and
dietary fat intakes are important to consider for diabetes risk and management, an estimation
of dietary glycemic index (GI), would be of interest since it has recently been shown that
diets with a high glycemic load and low cereal fibre content increase the risk of developing
T2DM in both men and women (Salmeron et al., 1997) and that low GI starchy foods may
be beneficial in the treatment of T2DM (Wolever et al., 1992). Very few instruments at this
time have been validated which specifically assess dietary intake with respect to GI. A
recent study however, examining the physiologic relevance of the glycemic load as a
potential risk factor for coronary heart disease documented the ability of a FFQ to
successfully assess dietary GIs and GLs relative to 4 repeated series of 7-day food records
(Liu et al., 2001). The FFQ was administered twice to 173 female participants at an interval
of one year (Willett et al., 1985). The correlation coefficient for energy-adjusted
carbohydrate intake between the FFQ and a 7-day DR was 0.73 (Willett p. 1998). The
questionnaire was found to assess individual foods high in carbohydrate content quite well.
For example, correlation coefficients were 0.71 for white bread, 0.77 for dark bread, 0.66 for
potatoes and 0.94 for yoghurt (Liu et al., 2001).

33
The ability of a FFQ to estimate diet GI could be extremely useful for identifying
specific elements of the diet, which may be contributing to the increased risk of T2DM in
populations, which are particularly susceptible. Specific dietary interventions and
management programs could subsequently be developed in these areas to promote risk
reduction and ultimately reduce T2DM development. This is of particular importance to
developing countries such as Trinidad and Tobago (T&T) where T2DM prevalence is six
times that of Canada and the US (Gulliford, 1996). Many FFQs however, are not designed to
record the frequency of food consumption in culturally diverse or ethnic populations and the
validity of these instruments in epidemiological studies (in these populations) has not been
thoroughly tested (Teufel, 1997; Mayer-Davis et al., 1999). Therefore, in order to assess diet
GI in a culturally distinct population like T&T, a novel instrument must be developed by
either generating a list from DRs or 24-hour dietary recalls collected in the population under
investigation or substantially modifying a previously validated FFQ, followed by an
exclusive validation process.
In 1998 a pilot study was conducted in T&T to estimate nutrient intakes and diet GI
of African (AF) and South Asian (SA) inhabitants of the island. Nutrient intakes were
assessed by 24-hour dietary recall. This information was used for the identification of
commonly eaten foods in T&T so that a culturally sensitive FFQ may be developed. A
survey tool that can specifically assess dietary GI and discriminate between dietary intake
across various ethnic groups is needed to permit study of the relationship between GI and
T2DM risk in susceptible individuals in T&T. The development of such a tool is the
objective of this study.

Figure 1-1
Prevalence of DM in Trinidad and Tobago in 1995 and estimated prevalence for the
years 2000 and 2025.
75-
= Z B 50 : 5° me o 20 2 83x 3 254 8 g* 3 o @
a
0.04 1995 2000 2025
Year
Mg Percentage of DM (%)
Number of people (x1000)
Adapted from King et al., 1998.
34

35
1.3 STUDY OBJECTIVES
The objectives of this study are to:
Develop a food Frequency Questionnaire (FFQ) for use in Trinidad, which is
sensitive to dietary glycemic index (GI) and ethnic differences in diet by
using a food list generated by a pilot study.
Calibrate the FFQ by comparing estimates of dietary intake for total energy
and 11 macronutrients to those obtained from 7-day consecutive food records
in Trinidad.

2. MATERIALS AND METHODS
2.1 DEVELOPMENT OF FFQ
Objective
To develop a FFQ that can be used to assess dietary GI in T&T, by using a food
list generated from 24-hour dietary recalls conducted in T&T.
2.1.1 Stage 1: Generation of food list and design of FFQ
2.1.1.1 Procedures
All methods were approved by the Human Subjects Review Committee of the
University of Toronto, and committee on ethics of the University of the West Indies,
Mount Hope, Trinidad (consent forms are shown in appendix B). A validated semi-
quantitative Food Frequency Questionnaire (FFQ) developed by the Epidemiology
Program of the Cancer Centre of Hawaii‘, University of Hawaii (Epidemiology Program;
Cancer Research Center of Hawaii: University of Hawaii, 1998) was modified using data
from a food list generated from 24-hour dietary recalls collected from 101 subjects in
T&T by Renee Issacs (Issacs, R. Masters thesis, 1999). For each food item collected from
the 24-hour dietary recalls, the percentage of energy contributed from each macronutrient
was determined using Nutriput, a computer program based on the USDA database
developed by Dr. Thomas Wolever. Foods with the highest percentage of total energy
* The University of Hawaii Questionnaire was chosen because it has been previously validated, and has a
diverse food list which contains many ethnic items as well as Western. Items specific to the Hawaiian diet
were easily removed and replaced with items specific to the Trinidadian diet as assessed by the Pilot study
and the Western items were kept since they are prevalent in the Trinidadian diet as well. Differences
between the Hawaiian FFQ and the prototype for Trinidad is the Trinidadian FFQ is interviewer
administered, longer, has different headings, and addresses portion sizes differently.
36

37
from dietary carbohydrates and items with the highest percentage of total energy were
selected for inclusion on the FFQ. Items specific to the Hawaiian diet such as jook and
ramen were removed from the University of Hawaii questionnaire and replaced with
those deemed specific to the Trinidadian diet under the headings of the 6 official food
groups of the Caribbean (Food from Animals & Alternatives; Ground Provisions;
Cereals; Legumes & Nuts; Fats & Oils; and Fruit & Vegetables). Other headings include,
“Fast Foods”, “Mixed Dishes”, “Beverages”, and “Supplements”. Sections addressing the
seasonal use of food items as well as use during religious holidays were included since it
is likely that food consumption and hence energy intake may be different at these times.
A section regarding cooking methods was also included to provide an understanding of
how food is commonly prepared.
Portion sizes were indicated on the FFQ as “S”’, “M”’, and “L” (equated to
standard portion sizes) (Pennington, J. 15" ed., 1989; Health and Welfare Canada 1992;
The American Dietetic Association, 1998; Caribbean Food and Nutrition Institute, 2001)
and corresponded to a particular calibrated photograph that was shown at the time of
questionnaire administration. For certain items on the FFQ such as milk or bread an
additional field was included for specifying the brand, form or type.
2.1.2 Stage 2: testing of FFQ
2.1.2.1 Procedures
In order to assess the appropriateness of the FFQ and identify frequently and
infrequently used items, testing of the FFQ took place from the beginning of March 2000
to the beginning of April 2000 on a convenience sample in 7 of the 12 administrative

38
divisions of T&T °. Individuals from each area were asked to assess their average use
over the past year of the items listed on the FFQ in an interviewer- administered manner.
This approach was chosen rather than a self-administered one since the rate of functional
literacy is low among some groups in the sample. Subjects also answered questions
pertaining to their age, ethnicity, health status, highest level of completed education,
occupation, and area of residence’. Ethnicity was determined by grandparental origin, and
subjects of less than 75% common genetic stock were deemed “Mixed””’.
2.1.2.2 Subjects
For each county 10 individuals were approached at their workplace or on the street,
giving a total of 50. Of these, 9 initially refused to participate due to lack of interest
(eligibility unknown). Inclusion criteria included individuals aged 18-63 years, absence
of chronic or developmental diseases, not following a special diet, sober, and a non-
pregnant or lactating status. A total of 41 individuals agreed to answer the questionnaire.
Of these, 39 were eligible, and all answered the FFQ. For each municipality 15
individuals were also approached at their workplace or on the street, giving a total of 30.
Of these, 7 initially refused to participate due to lack of time or interest (eligibility
unknown). A total of 23 individuals agreed to answer the questionnaire. Of these 22 were
eligible and all answered the FFQ. A total of 61 individuals participated in answering the
° Administrative divisions of T&T are comprised of 8 counties, 3 municipalities and 1 ward. Five counties and 2 municipalities were surveyed.
° These questions are found on the first page of the FFQ.
’ This definition of “Mixed” was used in order to keep consistent with the pilot study. “Mixed” ethnicity
refers to a combination of African and South Asian ancestry while “Other” refers to any ethnic group aside from African, South Asian or Mixed.

FFQ. Of these 32 were female, and 29 were male. Among the females, 16 were SA, 14
AF and 2 OTH’. Among the males, 17 were SA, 11 AF and 1 OTH
* Categories of Mixed and Other ethnicities were collapsed due to small number.
39

40
Table 2-1 FFQ testing phase: Recruitment for Administrative Divisions
Administrative Number Number Number Number Number Division Approached Refused Interested Eligible Participated
(“) (>) (>) (%) (>)
St. David 10 (12.5) 2 (12.5) 8 (12.5) 8 (13.11) 3 (13)
St. George 10 (12.5) 1 (6) 9 (14) 9 (15) 9 (15)
Caroni 10 (12.5) 2 (12.5) 8 (12.5) 711) 7(11)
Victoria 10 (12.5) 1 (6) 9 (14) 8 (13) 8 (13)
Mayaro 10 (12.5) 3 (19) 7(11) 7(11) 7 (11)
Port of Spain 15 (19) 3 (19) 12 (19) 12 (20) 12 (20)
San Fernando 15 (18) 4 (25) 11 (17) 10 (17) 10 (17)
Total 80 (100) 16 (100) 64 (100) 61 (100) 61 (100)

Table 2-2 (a) Ethnic breakdown of Males
Administrative SA(%) AF(%) OTH(%) Division
St. David 3 (17) 2 (18) 0
St. George 2 (12) 1 (9) 1 (100)
Caroni 3 (17) 1 (9) 0
Victoria 2 (12) 1 (9) 0
Mayaro 2 (12) 1 (9) 0
Port of Spain 2 (12) 3 (27) 0
San Fernando 3 (17) 2 (18) 0
Total 17 (100) 11 (100) 1 (100) N=29

Table 2.2 (b) Ethnic Breakdown of Females
N=32
Administrative SA(%) AF(%) OTH(%)
Division
St. David 2 (12.5) 1(7) 0
St. George 1 (6) 3 (22) 1 (50)
Caroni 2 (12.5) 1(7) 0
Victoria 3 (19) 2 (14) 0
Mayaro 2 (12.5) 2 (14) 0
Port of Spain 2 (12.5) 4 (29) 1 (50)
San Fernando 4 (25) 1 (7) 0
Total 16(100) 14(100) 2(100)
42

43
2.1.2.3 Results
In general, the FFQ was found to be comprehensive and contained a variety of food items
that represented dietary intakes of both South Asians and Africans in Trinidad.
Changes to the FFQ after testing were very few in number but did include some additions
and deletions specifically with respect to fruits and vegetables. If more than half of the
sample reported that they did not consume a particular item it was removed. In some
cases individuals reported voluntarily that certain items that they (and their community
members) consume regularly was not on the list and should be included. All changes
were noted and discussed with two local Dieticians at the University of the West Indies
Mount Hope Hospital, Trinidad’. Following the testing phase, the FFQ was ready for use
in the validation study.
2.2 VALIDATION STUDY
Objective
To validate the FFQ by comparing estimates of dietary intake, specifically dietary
glycemic index (GI) to those obtained from 7-day consecutive Food Records in T&T.
2.2.1 Procedures
Validation of the FFQ was assessed in relation to 7-day consecutive food records
(FR’s) taken as the “gold standard”. Each participant completed both an interviewer-
administered FFQ assessing diet over the past year and a 7-day food record after
” June Holdip and Yvonne Batson, Registered Dieticians at the University of the West Indies, Mount Hope Hospital.

44
receiving detailed instructions from the interviewer [FFQ and part of FR diary is shown
in (appendix C) and portion sizes associated with FFQ are shown in (appendix D)].
The FFQ was administered either the day before or the day after the food records
were completed, and the order was determined by coin-toss. Subjects were asked to
assess their use of the food items listed on the questionnaire by me the interviewer, as
well as answer questions regarding methods of food preparation, the seasonal use of food
items and dietary changes during religious holidays. Although I was given no specific
training in how to conduct an epidemiological study such as this, my Master’s training in
nutrition and independent research on how FFQ validation studies are designed (part of
my Master’s thesis) prepared me for conducting this study in part. Calibrated
photographs of various food items and common household utensils were shown to allow
for estimation of portion sizes for foods listed on the FFQ. Each interview lasted
approximately 45 minutes. Information regarding the subjects’ gender, ethnicity,
occupation, age, highest completed level of education, and health status were recorded
prior to administration of the FFQ (first page of questionnaire).
Subjects were also given a standardized booklet in which they recorded their food
and beverage intake over 7 consecutive days. All booklets came equipped with
instructions, a hand-written example and calibrated photographs of food items and
household utensils (developed by myself). Participants were given explicit instructions by
the interviewer prior to the recording period, and asked to confirm all information upon
completion of the reporting period. A phone-call or visit mid-week was provided by the
interviewer in order to answer any questions and improve compliance.

45
Households were selected from the 36 electoral districts of Tunapuna, a county
regarded as representative of the population of Trinidad with respect to ethnicity, age,
gender, and socio-economic status, by the Central Statistics Office (CSO), Port of Spain,
Trinidad'°. Maps of each district were provided by the CSO, and every 15" house on
each map was approached (see appendix E for an example of a map). If the selected
house could not be found, the next house in succession was approached. If nobody
answered the door, the day of the week and time of day was noted, and the house was re-
visited either later in the day, or on the weekend. If after three tries there was still no
response, the house was omitted and the next house was selected. Individuals were
informed about the study by myself and invited to participate.
Only one member from each household was invited to participate in the study.
Generally, the person who answered the door was recruited. In some cases, an alternate
household member was recommended to whom we either spoke at that time or who was
interviewed later if they were not home initially. All data were collected over a period of
3 months from the middle of April to the middle of June 2000.
2.2.2 Subjects
The same inclusion criteria were used as in the testing phase of the FFQ. Subjects
were included if they were 18 to 65 years of age, free of any chronic disease (to the
individual’s best knowledge), mental and/or physical handicaps, not observing a special
diet, not pregnant or lactating and not intoxicated. Two hundred and fifty-four (254)
males and females were approached to engage in the study. Of these 180 (71%) agreed to
'° Interviews with Mrs. Ali, Mrs. Mason, Mr. Chady (director), and Mr. Wall, were conducted separately by
the same investigator at the CSO in March 2000 and in each case, Tunapuna was regarded as the most
representative area of Trinidad with respect to gender, ethnicity, and socio-economic status.

46
participate, of which 152 (84%) were eligible. All eligible subjects completed the study.
Eligibility of individuals who initially refused participation is not known.
2.2.3 Analyses
2.2.3.1 Nutrient Analyses
Nutrient analyses of the data collected from the FFQ’s and 7-day Food Records
(FR) were based on the USDA database using Nutriput (computer program developed by
Dr. Thomas Wolever). Additional values were added from the Caribbean Food and
Nutrition Institutes’ (CFNI) analysis of the recipes from a popular local cookbook (Indar
et al., 1988) and other local food tables (CFNI, Food Composition Tables 2"? ed., 1998).
Novel recipes collected from the FRs were analyzed and also entered into Nutriput’s
database (appendix F). Results from the FFQ were coded using lotus 123 for Windows
spreadsheets, and a spreadsheet was made for each subject. Lotus script was used to write
macros that combined the coded results from the FFQ with the amounts of macronutrient
for 100g of each food item listed on the questionnaire (and additional items from the
Additional Seasonal Fruits and Vegetables” section), and the amount of each item in
grams according to portion size. Based on the reported frequency of use, portion size and
grams consumed per day of each food item, the average amounts of macronutrient
consumed by each individual were determined. For each subject, modifications for the
type of dairy product, sweetener, flour and fat used were made by compiling a list of all
possible answers for questions pertaining to those products (such as; skimmed milk,
whole milk, whole wheat bread, white bread, lard, shortening and butter) and the specific
items specified by each subject were fed into a corresponding spreadsheet for coding

47
using lotus script. Modifications were also made for methods of food preparation. A list
of 7 meat and poultry items, and 6 cooking methods’’ was provided at the end of the FFQ
to better assess the amounts and type of fats consumed by the subjects. An additional 5 g
of fat was factored into g/day calculation of fat if pan-frying was selected in the
“Cooking Methods” section of FFQ. If deep-frying was selected, an additional 10 g of fat
was factored into the g/day calculation of fat. The type of fat used for this calculation was
determined from the proportion of different types of fats used by a particular subject as
indicated in the “Fats & Oils” section of the FFQ. This process was repeated for each
item that was indicated as being either pan or deep-fried in the “Cooking Methods”
section of the FFQ.
2.2.3.2 Statistical Analysis
In order to validate the FFQ, the nutrient analysis of the data collected from the
FFQ, was compared with the nutrient analysis of the data collected from the 7-day food
records. Means, & standard deviations, medians & inter-quartile ranges, the Shapiro-Wilk
statistic and kurtosis & skewness values were calculated for the nutrients estimated by the
FFQ, and 7-day food records using SAS version 8.1. Normality of the data was initially
assessed by the Shapiro-Wilk statistic. If a distribution was found to be significantly
different from normal, indices of kurtosis, frequency distributions and scatter-plots were
looked at to assess the shape of data and skewness was looked at to determine if the data
were positively or negatively skewed. Kurtosis values greater than or less than 3
indicated that distributions are not normal. Kurtosis of a normal distribution is 3,
"' The 6 categories for cooking methods were collapsed into 4. Namely deep-fried, pan-fried, baked/grilled, & curried/stewed.

48
distributions that exceed that value are more peaked, and those below are flatter than a
normal distribution (Zar, 1984 p 82-83). A distribution was considered positively skewed
if the skewness value was greater than 0, and negatively skewed if less than 0. Skewness
of a perfectly symmetric distribution is 0 (Zar, 1984 p 93-95). Macronutrient distributions
that were not normally distributed were log transformed if positively skewed, and
inverted if negatively skewed. To compare macronutrient means from the FR data with
FFQ data within different gender and ethnic groups paired t-tests were done using
transformed and untransformed data. Because untransformed and transformed data were
essentially identical (except for alcohol and % alcohol, which were the only measures
that showed extreme positive skewness), analysis using untransformed data is reported
for all variables. For alcohol and % alcohol data the removal of two outliers improved the
normality of both distributions and analysis is reported with those outliers omitted. One-
way ANOVA’s with Duncan’s multiple range testing were used to compare
macronutrient means between ethnic groups and to compare nutrient intake between
individuals that completed the FFQ prior to or after completing the FR’s, stratified by
gender. Correlation coefficients were used to assess agreement between the two
instruments. Pearson correlation coefficients using untransformed as well as transformed
data, and Spearman rank correlation coefficients were calculated and compared. Pearson
correlation coefficients using untransformed data (two outliers removed from alcohol and
% alcohol data) are reported. Fisher Z-tests were conducted to compare correlation .
coefficients between males and females, AF’s and SA’s, and the FFQ 1" group and FFQ
2" group. All statistical procedures were done using SAS version 8.1 for Windows.

3. RESULTS
3.1 Characteristics of study participants
3.1.1 Demographics of participants
Two hundred and fifty-four persons were approached for recruitment in the study.
Six individuals were excluded due to age greater than 65 years and/or health status and
sixty-eight individuals choose not to participate because of lack of time and/or interest
and in two cases extreme intoxication. The majority of individuals that rejected
participation were African males, Mixed males and African females. One hundred and
eighty subjects (180) in total were recruited for participation in the study (71% response
rate). Of these, twenty-eight were excluded from analysis for incomplete food records or
failure to return them. A total of 152 subjects completed the study and provided sufficient
data for analysis'”. Fig. 3-1 shows a breakdown of the recruitment process for this study.
The study sample was composed of 92 females (60%), of which 29 (32%) were African
(AF), 48 (52%) were South Asian (SA), and 15 (16%) were of other backgrounds
(OTH)"*, and 60 men (40%), of which, 20 (33%) were AF, 30 (50%) were SA, and 10
(17%) were OTH. No statistically significant differences at the 5 % level were found
between males and females with respect to the ethnic breakdown of each group [appendix
G (G.1)]. Ethnicity, gender and age of all subjects are shown in table 3-1.
" Response rates by gender and ethnic group cannot be reported since demographic information was not taken for non-participants.
® Individuals from Mixed and Other backgrounds were pooled and included in the Other (OTH) category.
49

50
Occupation'* and highest level of completed education (CEL)’* served as
indicators of socio-economic status. No statistically significant differences at the 5 %
level were found between ethnic groups for CEL’® or occupation’ [appendix G (G.2,
G.3)]. Table 3-2(a) shows counts and percentages for CEL and occupation for the male
and female study participants exclusively. For both males and females, secondary
education was reported most often as the highest level of education completed. There
were no significant statistical differences observed between males and females with
respect to CEL [appendix G (G.4)]'*. However, it is interesting to note qualitatively that a
higher percentage of males had a tertiary education as their highest level of completed
education compared to females. Chi- square tests showed a significant difference between
males and females with respect to occupation (p<0.05) [appendix G (G.5)]. More males
identified themselves as professionals than did females, (27% and 4 % respectively),
although when the “professional” category was omitted from analysis, the difference
between males and females regarding occupation was still statistically significant at the 1
% level [appendix G (G.5.1)]. More females reported being housewives or stay-at-home
mothers (45%) compared to males that reported being househusbands or stay-at-home
fathers (3%). The difference between males and females regarding occupation was also
statistically significant when the category “housewife/househusband was omitted from
analyses but at the 5 % level rather than 1% level [appendix G (G.5.2)].
' Categories are divided into whether individuals are employed for money or not employed for money. The
former includes: unskilled labor, skilled labor, clerical work, professional work, and the latter includes
housewife/husband and other. Occupation category “other” individuals voluntarily employed by a
church/temple or mosque, including nuns, priests, sanyasins and monks; and unemployed. If retired, nature
of previous job dictated how occupation was assessed.
'S Categories include: primary, secondary and tertiary.
'® Chi square test computed with CEL category “other” omitted.
'’ Chi square test was computed with ethnic group “other” omitted.
'8 Chi-square test was computed with CEL category “other” omitted.

51
Among females, no statistically significant differences between ethnic groups
were observed for CEL” [appendix G (G.6)]. It was not possible to discern differences
between ethnic groups for CEL among males since expected counts generated by chi-
square tests were below 5, irrespective of how groups were pooled therefore results from
the chi-square analysis are not valid in this case. For occupation, no statistically
significant differences between ethnic groups were found among males or females”
[appendix G (G.7) (G.7.1)]. It is possible that differences did not reach statistical
significance because of small sample size. Despite that fact, observational differences in
CEL and occupation were shown between ethnic groups for both men and women.
Among the females, a higher proportion of SA’s had a tertiary education than AF’s and
OTH’s. It was also observed that more SA females had “other” occupations than did
females from OTH backgrounds. Among the males, more SA’s also had a tertiary
education than AF’s and OTH’s. With respect to occupation, more SA males were
employed in professional and skilled labor and fewer in unskilled labor compared to AF’s
or OTH’s [Tables 3-2 (b) and (c)].
" For females, chi-square test was computed with ethnic group “other” omitted.
°° For males and females, chi square tests were computed with “other” ethnic group omitted, occupation
categories “housewife/husband” and “other” combined, “unskilled” and “skilled” combined, and
professional and clerical combined.

52
Figure 3-1
Breakdown of recruitment and enrolment process for FFQ validation study.
254 individuals approached.
68 lack of time, interest or intoxicated
186 individuals recruited (71% response rate).
28 individuals excluded due to incomplete 7-day Food Records
6 excluded due to age/health status
152 individuals included in the study (60 % of approached).

53
Table 3-1 Gender, ethnicity and age of all subjects (counts and percentages)
| AF SA OTH Total
Males (%) 20 (13) 30(20) —-:10(7) 60 (40)
Females (%) | 29 (19) 48 (31) —-15 (10) 92 (60)
Mean age + SD | 39 + 13.0 37+13.8 43+ 13.0 39 + 13.3
n=152

Table 3-2 (a)
Completed Education Level and Occupation
for Males and Females (counts and percentages).
54
Males (%) Females (“%)
n=60 n=92
Completed Education Level
Tertiary 14 (23) 15 (16)
Secondary/Technical/Vocational 35 (58) 57 (62)
Primary/Elementary 9 (15) 20 (22)
None 0 0
Other 2 (3) 0
*Occupation
a p Professional 15 (25) 4 (4)
Clerical 12 (20) 16 (17)
Skilled Worker 17 (28) 11 (12)
| ss Unnskilled Worker 5 (8) 4 (4)
b [ Housewife/husband 2 (3) 41 (45)
Other 9 (15) 16 (17) *p<.0001 for difference between males and females with respect to occupation. See appendix G for chi-square tests. Note this difference is attenuated when housewife/husband category is removed.
“Employed for money.
> Not employed for money.

55
Table 3-2 (b) Completed Education Level and Occupation for AF’s, SA’s and
OTH?’s for Female’s (n=92) (counts and percentages).
AF (%) SA (%) OTH (%) n=29 n=48 n=15
Completed Education Level
Tertiary 4 (14) 10 (21) 1(7)
Secondary/Technical/Vocational | 20 (69) 25 (52) 12 (80)
Primary/Elementary 5 (17) 13 (27) 2 (13)
None 0 0 0
Other 0 0 0
Occupation
a pS Professional 1 (3) 3 (6) 0
Clerical 5 (17) 8 (17) 3 (20)
Skilled Worker 4 (14) 5 (10) 2 (13)
| Ss Unsskilled Worker 3 (10) 0 1 (7)
b | Housewife/husband 12 (41) 21 (44) 8 (53)
| Other 4 (14) 11 (23) 1 (7)
“Employed for money.
Not employed for money.

Table 3-2 (c)
Completed Education Level and Occupation for AF’s, SA’s and OTH’s for Male’s (n=60) (counts and percentages).
AF (%) SA (%) OTH (%) n=20 n=30 n=10
Completed Education Level
Tertiary 4 (20) 8 (27) 2 (20)
Secondary/Technical/Vocational 10 (50) 18 (60) 7 (70)
Primary/Elementary 4 (20) 4 (13) 1 (10)
None 0 0 0
Other 2 (10) 0 0
Occupation
a _ Professional 4 (20) 7 (23) 4 (40)
Clerical 5 (25) 6 (20) 1 (10)
Skilled Worker 4 (20) 11 (37) 2 (20)
| ___- Unskilled Worker 3 (15) 0 2 (20)
b [ Housewife/husband 1 (5) 1() 0
| Other 3 (15) 5 (17) 1 (10)
“Employed for money.
Not employed for money
56

57
3.1.2 Comparison with National Statistics
Figure 3-2 (a) compares the gender and ethnicity of study participants with data
from Tunapuna an area deemed representative of Trinidad with respect to ethnicity,
gender, and socio-economic status (SES) by the Central Statistics Office (CSO) in Port of
Spain, Trinidad. Although differences between study participants and reference data did
not reach statistical significance, most likely due to small sample size, the study
participants included more females then expected from the reference data, and fewer
AF’s and OTH’s and more SA’s than expected [appendix G (G.8) (G.9)].
Comparison of the study participants and the reference data from Tunapuna for
highest level of education completed (CEL) showed a statistically significant difference
between groups”’ (p<0.001) [appendix G (G.10) (G.10.1)] Figure 3-2 (b) compares study
participants and the reference data for CEL. Study participants were shown to include a
higher proportion of individuals having completed a tertiary education (19%) than the
reference data (6%). The greatest difference in CEL between the study participants and
reference data was seen in the percentage with tertiary education.
*! Chi-square tests were computed with CEL categories “primary”, “none” and “other” combined and again
with CEL categories “none” and “other” omitted.

58
Figure 3-2 (a)
Study data in relation to National Statistics: Gender and Ethnicity
70 5
60 +
50 - O Study Sample a 40 +
ercent
= 30 | m@ Reference data from Tunapuna
20 +
10 -
Values
in
M F AF SA Oth
Gender and Ethnicity

Figure 3-2 (b)
Study data in relation to National Statistics: Completed Education
Level Values
in pe
rcen
t
=>
NO
w
-
Oo oO
~
oO
o
Oo oO
oO
Oo Qo
2
! |
| !
! L
\
Primary Secondary Tertiary None/Other
Completed Education Level
59
O Study Sample
@ Tunapuna

60
3.2 Normality of data
Analyses of frequency distributions and measures of kurtosis, skewness and the
Shapiro-Wilk statistic revealed that most nutrients estimated from both the FR and FFQ
datasets were skewed and required log transformation or inversion prior to assessing
agreement in nutrient intake between the FFQ and FR’s (appendix H). Most distributions
had a statistically significant (p S$ 0.05) Shapiro-Wilk score, which indicated that most
data differed significantly from normality. The majority of these distributions were found
to have skewness values greater than zero indicating positive skewness. Negative
skewness was indicated by skewness values less than zero. In order to bring in the tail of
a positively skewed distribution the natural logarithm of each value was taken. To adjust
for negative skewness, the reciprocal of each value was taken, thereby bringing in the tail
on the left side of the distribution. Kurtosis values varied considerably between nutrient
distributions, some were greater than 3, indicating a peaked distribution and others were
less than 3 indicating flatness. It is interesting to note that kurtosis values from the FFQ
nutrient intake data are greater than those from the FR nutrient intake data for all
variables and that skewness values from the FFQ data are greater than those from the FR
for all variables except MFA. Frequency distributions for total fat intake from the FFQ
and FR data are shown in figure 3-3 (a) as an example of positively skewed data that
required log transformation”. Figure 3-3 (b) shows frequency distributions for diet GI
from the FFQ and FR datasets as an example of data, which was negatively skewed and
” Data was transformed as an exercise before analysis. Since transformed and untransformed data resulted
in similar results when paired t-tests, Pearson correlation coefficients and ANOVA’s were computed,
untransformed data is being reported for all variables. For alcohol and % alcohol data, 2 outliers were removed for analysis.

61
required inversion”’. Figure 3-3 (c), shows frequency distributions for polyunsaturated fat
expressed as a percentage of total energy (% PUFA)” from FR and FFQ data as an
example of normally distributed data that did not require transformation. Frequency
distributions for other nutrients for both FR and FFQ data are shown in (appendix J).
> Data was transformed as an exercise before analysis. Since transformed and untransformed data resulted
im similar results when paired t-tests, Pearson correlation coefficients and ANOVA’s were computed,
untransformed data is being reported for all variables. For alcohol and % alcohol data two outliers were
removed for analysis
*4 % PUFA is the only measure where both the FR and FFQ distributions were normal and did not require transformation.

Figure 3-3 (a)
Frequency Distributions for fat from 7-day Food Record and FFQ
data: Example of positively skewed data that required log
transformation.
—*-FR
—@— FFQ
Frequency
0 EAH
123 4 5 6 7 8 9 10 11 12
i
Fat
Intake ranges divided into 12 equal intervals”
62
Median values of intervals from intake
ranges for fat from FR’s and FFQ’s
Intervals of | g/day fat g/day fat
intake FR FFQ
ranges
1 16.2 22.9
2 29.1 40.6
3 42.1 58.2
4 55.1 75.9
5 68.1 93.5
6 81.0 111.2
7 93.9 128.8
8 106.9 146.5
9 119.8 164.2
10 132.8 181.9
11 145.8 199.5
12 158.7 217.1
?° Number of intervals determined automatically by Microsoft excel @freq function, Windows 2000.

63
Figure 3-3 (b) Frequency Distributions for GI from 7-day Food Record and FFQ
data: Example of negatively skewed data that required inversion. Frequency
No
on
i
0 T T T Tr T 1
123 45 67 8 9 101112 Dietary GI
6 Intake ranges divided into 12 equal ranges 2
Median values of intervals from intake
ranges for dietary GI from FR’s and FFQ’s
Intervals of GI GI
intake FR FFQ
ranges
1 67.0 66.4
2 68.8 68.5
3 70.7 70.7
4 72.5 72.8
5 74.3 75.0
6 76.2 771
7 78.0 719.3
8 79.8 81.4
9 81.7 83.6 10 83.5 85.7
11 85.3 87.9
12 87.2 90.0
°6 Number of intervals determined automatically by Microsoft excel @freq function, Windows 2000.

64
Figure 3-3(c) Frequency Distributions for PUFA expressed as a percentage of total
energy from 7-day Food Record and FFQ data: Example of data that did not require transformation.
35 —e—FR 30 —#—FFQ
>, 25 o
5 20 3
3 19
10 5
0 T T T T T T T T T T TT
12 3 4 5 6 7 8 9 10 11 12
% PUFA
Intake ranges divided into 12 equal ranges ’
Median values of intervals from intake
ranges for dietary GI from FR’s and FFQ’s
Intervals of %PUFA %PUFA
intake FR FFQ
ranges
1 3.1 2.5
2 3.9 3.3
3 4.7 42
4 5.5 5.0 5 6.3 5.9
6 71 6.7
7 7.9 7.6
8 8.7 8.4
9 9.6 9.3
10 10.3 10.1
11 11.8 11.0
12 12.0 11.8
*7 Number of intervals determined automatically by Microsoft excel @freq function, Windows 2000.

65
3.3 Nutrient Intake
3.3.1 All study participants
Means and standard deviations, and medians and inter-quartile ranges”*, for the 7-
day food record (FR) and FFQ macronutrient data are reported for the study sample in
tables 3-3 (a) and 3-3 (b). Average nutrient intake estimated by the FFQ was higher than
estimated by the FR’s for all macronutrients except cholesterol and GI [table 3-3 (a)].
With respect to data expressed as a percentage of total energy, means estimated by the
FFQ were higher for % carbohydrate, fiber g/100kcal”’, % MUFA and % alcohol, and
lower for % protein, % fat, cholesterol mg/ 1000kcal*°, and the P: S compared to means
estimated by the FR’s [table 3-3 (b)]. Paired t-tests showed that differences between
means estimated by the FFQ’s and FR’s were statistically significant at the 5 % level for
all variables except cholesterol (p=0.58), GI (p=0.14), %SFA (p=0.36), and % PUFA
(p=0.47) [tables 3-3 (a) and (b)].
Generally, if a mean is found to be larger than a corresponding median, the
distribution is most likely skewed to the right (Pagano, 1993 p. 42). For most
distributions, the mean was slightly larger than the median; however, the difference was
under 10% for most measures. Interestingly, macronutrients expressed as a percentage of
total energy exhibited different mean to median differences when compared to data
expressed in grams [tables 3-3 (a) and (b)].
The distance between the 25" and 75" percentiles of data, or the interquartile
range (IQR), is a measure of spread that gives the range covered by the middle half of the
*8 Interquartile range for each measure is represented by the first and third quartiles of the distribution. ” Fiber does not provide energy. Throughout this thesis g/fiber per 1000 kcal is reported in tables with % values of other macronutrients. .
*° Cholesterol does not provide energy. Throughout this thesis mg/cholesterol per 1000 kcal is reported in tables with % values of other macronutrients.

66
data (Moore, 1999, p. 46). IQR’s for FR and FFQ data were similar in magnitude for
most macronutrients and macronutrients expressed as a percentage of total energy [tables
3-3 (a) and (b)].
3.3.2 Males and Females
Among men (n=60), average nutrient intake estimated by the FFQ was greater
than estimated by the FR’s for all macronutrients except GI, and cholesterol [table 3-4
(a)]. For macronutrients expressed as a percentage of total energy, average nutrient intake
estimated by the FR’s was greater than estimated by the FFQ for % fat, cholesterol
mg/1000kcal, and the P:S ratio, and average nutrient intake estimated by the FFQ was
greater than estimated by the FR’s for fiber g/1000kcal, % MFA and % alcohol [table 3-
4 (b)]. Differences in means between the FR and FFQ were statistically significant at or
near the 5 % level for all variables except for cholesterol (p=0.78), alcohol (p=0.85), GI
(p=0.22), % protein (p=0.14), % carbohydrate (p=0.10), % SFA (p=0.53), and %PUFA
(p=0.94).
For women (n=92), average nutrient intake estimated by the FFQ was greater
than estimated by the FR’s for all nutrients except cholesterol and GI [table 3-5 (a)]. For
macronutrients expressed as a percentage of total energy, estimates of % protein, % fat,
cholesterol mg/1000kcal, and the P:S ratio from FR data were greater than estimated by
FFQ data, and estimates of % carbohydrate, fiber g/1000kcal, % MFA and % alcohol
from FFQ data were greater than estimated by FR data [table 3-5 9b)]. Statistically
significant differences at the 5 % level among the females for average nutrient intake
estimated by FR’s and FFQ’s were shown for all variables except for cholesterol

67
(p=0.25), GI (p=0.33), % SFA (p=0.97), and % PUFA (p=0.68). For both males and
females, means were slightly greater than corresponding medians and IQR values were
slightly higher for FFQ data compared to FR data for most measures. Macronutrients
expressed as a percentage of total energy exhibited smaller mean to median differences
than data expressed in grams for both males and females.
3.3.3 African’s and South Asian’s
With respect to the AF group, average nutrient intake estimated by the FFQ was
greater than estimated by the FR’s for all variables except cholesterol, SFA, alcohol and
GI [table 3-6 (a)]. For PUFA, nutrient intake estimated by the FFQ was slightly greater
than estimated by the FR’s, however this difference is marginal since the p-value is very
near to the 5 % level of significance. For macronutrients expressed as a percentage of
total energy, estimates of average nutrient intake for cholesterol mg/1000kcal, and the P:
S ratio from the FR’s were greater than estimated by FFQ’s. Average nutrient intake
estimated by the FFQ’s for fiber g/1000kcal and % MFA, were greater than estimated by
the FR’s [table 3-6 (b)]. Differences between means from FR and FFQ data reached
statistical significance at or near the 5 % level for all variables except for cholesterol
(p=0.68), SFA (p=0.17), PUFA (p=0.06), alcohol (p=0.12), GI (p=0.99), % protein
(p=0.58), % fat (p=0.39), % carbohydrate (p=0.36), % SFA (p=0.64), % PUFA (p=0.19),
and % alcohol (p=0.08) [tables 3-6 (a) and 3-6 (b)]. For most measures means were
slightly greater than associated median and IQR values from the FFQ data were greater
than FR data all measures except cholesterol, PUFA and GI. For macronutrients
expressed as a percentage of total energy, IQR values from FFQ data were greater than

68
IQR values from FR data for all measures except cholesterol, SFA, PUFA, and the P: S
ratio [tables 3-6 (a) and 3-6 (b)].
Among the SA’s, average nutrient intake estimated by the FFQ was greater than
estimated by the FR’s for all variables except cholesterol, and PUFA, and lower for GI
[table 3-7 (a)]. For macronutrients expressed as a percentage of total energy, estimates of
average nutrient intake for “protein, Yofat, cholesterol mg/1000kcal, %SFA, %PUFA and
the P:S ratio from FR data were greater than estimated by the FFQ. Average nutrient
intake estimated by the FFQ for % carbohydrate, fiber g/1000kcal, % MUFA and %
alcohol were greater than estimated by the FR’s [table 3-7 (b)]. Statistically significant
differences at or near the 5 % level were found for all variables except for cholesterol
(p=0.81), and PUFA (p=0.10), [tables 3-7 (a) and 3-7 (b)]. Similar to the AF’s, the SA’s
had estimates of mean nutrient intake that were greater than the corresponding median for
nearly all measures. IQR values from FFQ tended to be greater than FR data for measures
expressed in grams. For macronutrients expressed as a percentage of total energy, IQR
values from FR data are greater than values from FFQ data. Similar to the male’s and
female’s, both the AF’s and SA’s had smaller mean to median differences for
macronutrients expressed as a percentage of total energy compared to data expressed in
grams for both FR and FFQ data sets.
ANOVA’s with Duncan’s multiple range testing were conducted for SA males,
SA females, AF males and AF females in order to compare average macronutrient intake
between groups [tables 3-8 (a), (b), (c), and (d)]. For the FR data, statistically significant
differences at or near the 5 % level between groups were found for protein, fat, total
carbohydrate, available carbohydrate, energy (kcal), SFA, MFA, %MFA, %PUFA, and

69
the P:S. These differences as shown by Duncan’s multiple range testing did not appear to
follow a trend and were quite varied among different variables [tables 3-8 (a) and (b)].
Although for absolute data SA females were shown to have a lower intake of total energy
and most nutrients compared to SA males, AF females and AF males, and AF males had
a higher intake of alcohol compared to the other groups although this difference is not
statistically significant.
For the FFQ data, statistically significant differences at or near the 5 % level
between groups were found for SFA, %SFA, and the P: S ratio. For SFA, the mean for
SA males was found to be higher than the mean for SA females, but did not differ from
AF females or AF males. SFA intake for AF males, SA females, and AF females did not
differ from one another. For % SFA, no difference in gender was found between the SA’s
and AF’s, however, SA males were found to have a lower intake than AF males and AF
females, and AF males were found to have a higher intake than SA males and SA
females. The differences between groups for P: S show that SA males and females have
a higher P: S ratio than AF males and females, although the P: S ratio of SA males does
not differ from that of AF males and females [tables 3-8 (c) and (d)]. Statistically
significant differences at or near the 10 % level were found for total carbohydrate,
available carbohydrate, total energy (kcal), % protein, and % fat. SA females were found
to have lower intakes of total and available carbohydrate and energy compared to SA
males but did not differ from AF males and females. For % protein, AF males had a
higher intake than SA males, but neither differed from SA or AF females. For % fat, SA
males and females had lower intakes compared to AF females, but did not differ from AF
males.

70
3.3.4 FFQ administered before or after completing FR’s.
For the group that was given the FFQ prior to completing 7-day food records
(FFQ 1"), average nutrient intake estimated by the FFQ was greater than estimated by the
FR’s for all measures except cholesterol, and GI [(table 3-9 (a)]. With respect to percent
data, no consistent differences were observed between means estimated by the FFQ and
FR’s [table 3-9 (b)]. Statistically significant differences at or near the 5 % level between
FR and FFQ data were found for all variables except cholesterol (p=0.92), GI (p=0.35),
% protein (p=0.26), % SFA (p=0.48), and %PUFA (p=0.62) (p=0.21) [tables 3-9 (a) and
(b)]. For both FR and FFQ data sets measured in grams, means were slightly greater than
medians for essentially all macronutrients. For data expressed as a percentage of total
energy, no consistent differences were observed between means and medians for both FR
and FFQ data sets. IQR values for data in grams from the FFQ data set were greater than
IQR values from the FR data set for all measures. For data expressed as a percentage of
total energy, IQR values did not differ consistently between FFQ and FR data.
For the sample that was given the FFQ after having completed 7-day food
records (FFQ*"’), average nutrient intake estimated by the FFQ was greater than
estimated by the FR’s for all measures except cholesterol, and GI [table 3-10 (a)].
However, for macronutrients expressed as a percentage of total energy, like the FFQ’
group, there were no consistent differences and means were greater than estimated by the
FR’s for some measures, and smaller for others [table 3-10 (b). Statistically significant
differences at or near the 5 % level between macronutrient means from FR and FFQ data
were found for all measures except cholesterol (p=0.46), GI (p=0.25), %SFA (p=0.85),
“PUFA (p=0.28) and % alcohol (p= (p=0.07) [tables 3-10 (a) and (b)]. For both FR and

71
FFQ distributions means were generally greater than medians for data expressed in grams
and greater for some measures and smaller for others for data expressed as a percentage
of total energy. IQR values from FFQ data were slightly greater than IQR values from FR
data for data expressed in grams. For nutrients expressed as a percentage of total energy,
IQR values from FFQ data were larger than from FR data for some measures and smaller
for others [tables 3-10 (a) and (b)]. Both the FFQ 1 and FFQ 2"! groups were found to
have smaller mean to median differences for macronutrients expressed as a percentage of
total energy compared to data expressed in grams.
ANOVA’s with Duncan’s multiple range tests were conducted between males and
females who completed the FFQ before completing the FR’s (FFQ 1* group), and those
who completed the FFQ after completing the FR’s (FFQ Qn group) [tables 3-11 (a), (b),
(c) and (d)]. For the FR data [tables 3-11 (a) and (b)], statistically significant differences
at or near the 5 % level between groups were found for cholesterol mg/1000kcal
(p=0.01). For cholesterol mg/1000kcal, intake estimated from the FFQ1* group was
significantly greater then when estimated from the FFQ?™ group for males but not for
females. Statistically significant differences at or near the 10 % level were found for
protein (p=0.11), total carbohydrate (p=0.09), available carbohydrate (p=0.09), total
energy (p=0.09) and % alcohol (p=0.15). For protein, females from the FFQ 2™ group
were found to have a lower intake than males from the FFQ 1* group, but did not differ
significantly from any other group. For total and available carbohydrate and total energy,
females from the FFQ 2" group had lower intakes than males from the FFQ 2™ group,
but did not differ significantly from any other group. For % alcohol, intake of males from

72
the FFQ Qn group was higher than intake of females from the FFQ 1" group, but did not
differ from any other group [tables 3-11 (a) and (b)].
With respect to the FFQ data [tables 3-11 (c) and (d)], statistically significant
differences at or near the 5 % level between groups were found for protein (p=0.06),
cholesterol (p=0.02), % protein (p=0.04), and cholesterol mg/1000kcal (0.05). For
protein, males from the FFQ 1" group had a higher intake than females from the FFQ 1*
and FFQ 2" groups, but did not differ from males from the FFQ Qn group. Duncan’s
grouping showed that the cholesterol intake of males from the FFQ 1“ group was
significantly higher than all other groups. For % protein and cholesterol mg/1000kcal,
males from the FFQ’"? group had lower intakes than males from the FFQ 1* group, and
intake of females did not differ from each other or from the male groups [tables 3-11 (c)
and (d)]. It is interesting to note that the diet GI values of females from the FFQ 1“ and
FEQ 2" groups estimated from the FFQ [table 3-11 (c)] are identical. Statistically
significant differences at or near the 10 % level were found for SFA (p=0.16), alcohol
(p=0.10), % fat (p=0.18), % carbohydrate (p=0.12), and % alcohol (p=0.08). For SFA,
females from the FFQ 1“ group had a significantly lower intake than males from the FFQ
1* group, but neither differed from any other group. With respect to alcohol, females
from the FFQ 2™ group had a significantly lower intake than males from the FFQ 1
group, but neither differed from any other group. For % fat, males from the FFQ 1* group
had a higher intake than males from the FFQ 2" group, but neither differed significantly
from females from either group. For % carbohydrate, males from the FFQ 2™ group had
a higher intake than males from the FFQ 1* group, but again neither differed significantly
from females from either group. For % alcohol, males from the FFQ 1“ group had a

73
significantly higher intake than females from both the FFQ 1" and FFQ 2™ groups, but
did not differ from males from the FFQ and group.

74
Table 3-3 (a)
Means & Standard deviations, and Medians, & Interquartile ranges for
macronutrients from FR and FFQ data: All subjects (n=152).
Mean FR Mean FFQ Median FR Median FFQ “p-value
(+SD) (+SD) (IQR) (IQR)
Pro (g) 78 101 74 96 <0.01 (23) (38.0) (61 , 93) (77 , 122)
Fat (g) 71.9 87 69 81 <0.01
(28) (40) (53 , 85) (60 , 108)
Tearb (g) 230.5 342 219 321 <0.01 (81) (138) (176 , 271) (259 , 404)
AvCarb (g) 214.7 309 203 288 <0.01 (76.5) (125) (161 , 252) (230 , 359)
Energy (Kcal) 1820 2432 1778 2338 <0.01
(590) (946) (1378 , 2166) (1831 , 2837)
Fiber (g) 15.8 33 16 31 <0.01
(5.6) (14.6) (12 , 19) (25 , 40)
Chol (g) 256.7 251 244 234 0.6
(115) (121.0) (174 , 310) (170 , 314)
SFA (g) 24.6 28 23 26 <0.01 (10) (13) (18, 31) (19, 35)
MEA (g) 23.9 30 22 28 <0.01 (10.4) (14) (16, 30) (21 , 39)
PUFA (g) 16.8 19 17 17 <0.01
(7) (10) (12 , 22) (12 , 23)
"Ale (g) 0.2 0.77 0.2 0 <0.01 (0.9) (1.4) (0 , 0) (0,1)
GI 81.0 80.4 81.0 80.7 0.14 (4) (3.7) (79 , 83) (79 , 82)
"Paired t-test conducted between FR and FFQ data for macronutrient means. Differences are statistically
significance if p < 0.05. All data is untransformed.
‘ For t-tests two outliers were removed from alcohol data.

75
Table 3-3 (b)
Means & Standard deviations, and Medians, & Interquartile ranges for
macronutrients expressed as a percentage of total energy from FR and FFQ data:
All subjects (n=152).
Mean Mean FFQ Median FR Median FFQ “p-value
FR (+SD) (IQR) (IQR)
(+SD)
Pro% 18 17 17 17 <0.01
(3.6) (2.8) (15 , 20) (15 , 19)
Fat% 34 32 35 33 <0.01
(5.3) (5.7) (30, 38) (29 , 36)
Carb% 48 51 48 50 <0.01
(5.7) (7.3) (45 , 52) (46 , 55)
Fiber 9.2 13 9 13 <0.01
g/1000kcal (2.7) (4) (7.5 , 10) (11, 16)
Chol 145 105 144 108 <0.01
meg/1000kceal (55) (34) (111, 169) (86 , 125)
SFA% 12 11 12 11 0.36
(2.9) (3) (10, 14) (10, 13)
MFA% 11 12 11 12 <0.01
(2.3) (3) (9.6 , 12.7) (11.6, 14)
PUFA% 8 77 77 75 0.47
(2) (2) (6.5 , 9.3) (6.3 , 9.0)
P:S 0.9 0.7 0.2 0.7 <0.01
(0.4) (0.2) (0.6 , 1.0) (0.6 , 0.8)
TAle% 0.1 0.2 0 0 <0.01 (0.3) (0.4) (0 , 0) (0, 0)
" Paired t-test conducted between FR and FFQ data for macronutrient means. Differences are statistically significance if p < 0.05. All data is untransformed.
* For paired t-tests 2 outliers were removed from % alcohol data.

Table 3-4 (a)
Means & Standard deviations, and Medians, & Interquartile ranges for
macronutrients from FR and FFQ data: Males (n=60).
76
Mean FR Mean FFQ Median FR Median FFQ “p-value (+SD) (£SD) (IQR) (IQR)
Pro (g) 83 110 86 106 <0.01
(24) (46) (66 , 98) (78 , 128)
Fat (g) 76 93 75 90 <0.01
(30) (43) (54 , 92) (59 , 117)
Tearb (g) 247 372 253 351 <0.01 (66) (147) (197 , 289) (279 , 428)
AvCarb (g) 230 334 233 322 <0.01 (63) (141) (183 , 272 (250 , 391)
Energy (Kcal) 1944 2767 1935 2716 <0.01
(555) (1089) (1510 , 2327) (1866 , 3102)
Fiber (g) 16.3 34.5 16 31 <0.01
(5.2) (15) (13 , 20) (24 , 44)
Chol (g) 273 279 267 278 0.78 (126) (147) (185 , 344) (162 , 348)
SFA (g) 26.3 30 25.5 29 0.03
(11.2) (15) (18 , 33) (20 , 38)
MFA (g) 25.6 32.4 25 34 <0.01
(11.3) (15) (17, 32) (22 , 42)
PUFA (g) 17.2 20 17 17 0.03
(7.7) (11.4) (12 , 22) (12 , 26)
‘Ale (g) 0.4 1.1 0 0.4 0.01 (1.4) (1.7) (0, 0) (0, 1.6)
GI 81.6 80.9 81.0 81.5 0.22 (3.6) (3.4) (79 , 84) (79 , 83)
” Paired t-test conducted between FR and FFQ data for macronutrient means. Differences are statistically
significance if p < 0.05. All data is untransformed.
' For paired t-tests 2 outliers were removed from alcohol data.

77
Table 3-4 (b) Means & Standard deviations, and Medians, & Interquartile ranges for
macronutrients expressed as a percentage of total energy from FR and FFQ data:
Males (n=60).
Mean Mean FFQ Median FR Median FFQ “p-value
FR (SD) (IQR) (IQR) (+SD)
Pro™% 18 17 17 17 0.14
(3.8) (4) (15, 19) (15, 19)
Fat% 34 32 35 32 0.05
(5.9) (7) (29 , 38) (28 36)
Carb% 48 51 49 50 0.10
(5.4) (9.8) (44 , 54) (46 , 56)
Fiber 8.8 14 8.6 12.5 <0.01
g/1000kcal (2.4) (5.5) (7.3 , 10.7) (11, 15)
Chol 146 108 140 111 <0.01
mg/1000keal | (66) (41) (107 , 166) (84, 136)
SFA% 12 11.6 12 12 0.53 (3.3) (3) (10, 14) (10, 14)
MFA% 11 12 11.4 13 <0.01 (2.5) (3) (9.5, 12.6) (11, 14)
PUFA% 75 7.6 75 7A 0.95
(2.2) (2.4) (6.3 , 9.1) (6.3 , 8.6)
P:S 0.8 0.7 0.8 0.7 <0.01
(0.4) (0.2) (0.6, 1.0) (0.5 , 0.8)
FAIc% 0.2 0.3 0 0.10 0.05 (0.5) (0.7) (0, 0) (0, 0.5)
" Paired t-test conducted between FR and FFQ data for macronutrient means. Differences are statistically significance if p < 0.05. All data is untransformed.
' For paired t-tests 2 outliers were removed from % alcohol data.

Table 3-5 (a)
Means & Standard deviations, and Medians, & Interquartile ranges for
macronutrients from FR and FFQ data: Females (n=92).
78
Mean FR Mean FFQ Median FR Median FFQ “p-value
(SD) (+SD) (IQR) (QR)
Pro (g) 75 95 71 95 <0.01 (22) (31) (60 , 87) (71 , 112)
Fat (g) 70 83 66 80 <0.01
(27) (37) (53 , 83) (62 , 98)
Tcarb (g) 220 322 200 307 <0.01 (87) (128) (167, 264) (255 , 365)
AvCarb (g) 205 290 183 279 <0.01 (83) (115) (153 , 246) (229 , 334)
Energy (Kcal) 1751 2297 1669 2189 <0.01
(600) (848) (1330 , 2025) (1761 , 2689)
Fiber (g) 15.5 32 15 30.5 <0.01 (6) (14.5) (11.8, 18.6) (23 , 39)
Chol (g) 248 234 240 224 0.25
(105) (97) (173 , 295) (171 , 292)
SFA (g) 23 26 22 25 <0.01
(9.7) (11.8) (17.8 , 27.3) (18.7 , 32.5)
MFA (g) 230 29 22 28 <0.01 (9.8) (13) (16 , 28) (20 , 35)
PUFA (g) 16.6 19 15 16.8 0.02 (7) (9.7) (11.6, 20.7) (12.4 , 22.8)
Alc (g) 0.09 0.6 0 0 <0.01 (0.3) (1.1) (0, 0) (0 , 0.6)
GI 80.6 80.1 81.0 80.5 0.33 (4.1) (3.9) (78 , 83) (79 , 82)
* Paired t-test conducted between FR and FFQ data for macronutrient means. Differences are statistically
significance if p < 0.05. All data is untransformed.

79
Table 3-5 (b) Means & Standard deviations, and Medians, & Interquartile ranges for
macronutrients expressed as a percentage of total energy from FR and FFQ data:
Females (n=92).
Mean Mean FFQ Median FR Median FFQ “p-value
FR (+SD) (IQR) (IQR)
(+SD)
Pro% 18 17 17 17 <0.01 (3.5) (2.7) (16, 20) (15, 19)
Fat% 34 32 34 33 <0.01 (4.9) (5.6) (30 , 38) (30, 36)
Carb% 48 50 48 50 <0.01 (5.9) (6.4) (45 , 52) (46.5 , 54.6)
Fiber 9.5 14 9 13 <0.01
¢/1000kcal (2.8) (4) (7.6 , 10.9) (11, 16)
Chol 145 105 148 108 <0.01
mg/1000kcal (48) (33) (112 , 172) (87 , 121)
SFA% 12 11.6 11.3 11.3 0.97
(2.6) (3.0) (9.8 , 13) (9.7, 13.5)
MFA% 11 12.3 11 12.4 <0.01
(2) (2.7) (9.7 , 12.6) (10.9 , 14.2)
PUFA% 8 8 7.8 7.9 0.68
(2) (2) (6.6 , 9.4) (6.4, 9.3)
P:S 0.9 0.7 0.8 0.7 <0.01 (0.3) (0.2) (0.7 , 1.0) (0.6 , 0.8)
Ale% 0.02 0.2 0 0 <0.01
(0.08) (0.3) (0, 0) (0 , 0.2)
" Paired t-test conducted between FR and FFQ data for macronutrient means. Differences are statistically significance if p < 0.05. All data is untransformed.

80
Table 3-6 (a) Means & Standard deviations, and Medians, & Interquartile ranges for
macronutrients from FR and FFQ data: AF group (n=49).
Mean FR Mean FFQ Median FR Median FFQ “p-value (+SD) (+SD) (IQR) (IQR)
Pro (g) 82 103 80 101 <0.01 (24) (32) (67 , 94) (82 , 122)
Fat (g) 77 90 74 82 <0.01
(24) (31) (60 , 86) (68 , 108)
Tcarb (g) 247 336 239 314 <0.01 (90) (141) (188 , 281) (250 390)
AvCarb (g) 230 299 227 278 <0.01 (86) (127) (176, 265) (223 , 335)
Energy (Kcal) 1948 2424 1916 2334 <0.01
(589) (848) (1534 , 2164) (1916 , 2747)
Fiber (g) 16.9 33.4 16 31 <0.01
(6.2) (16) (13 , 20) (27 , 37)
Chol (g) 267 260 244 249 0.68
(129) (92.5) (180 , 305) (203 , 324)
SFA (g) 27 30 26 28 0.17
(9.5) (9.8) (21 , 32) (23 , 36)
MEA (g) 26 31 25 29 <0.01 (8.9) (11) (19 , 32) (23 , 40)
PUFA (g) 16.7 18.8 15 17 0.06 (7) (8.4) (12 , 21) (13 , 22)
‘Ale (g) 0.3 0.6 0 0 0.12 (1.1) (0.9) (0, 0) (0, 1.1)
GI 81 81 82 81 0.99 (4.2) (3.4) (79 , 83) (80 , 83)
" Paired t-test conducted between FR and FFQ data for macronutrient means. Differences are statistically
significance if p < 0.05. All data is untransformed.
' For paired t-tests one outlier was removed from alcohol data.

81
Table 3-6 (b) Means & Standard deviations, and Medians, & Interquartile ranges for
macronutrients expressed as a percentage of total energy from FR and FFQ data:
AF group (n=49).
Mean MeanFFQ MedianFR Median FFQ ‘p-value FR (+SD) (IQR) (IQR)
(+SD)
" Pro% 17.5 17.3 17 17 0.58 (3.5) (2.5) (15, 19) (15, 19)
Fat% 34 33.4 34 33 0.39 (4.4) (5.1) (31, 36) (30 , 37)
Carb% A8 49 49 48 0.36 (5.9) (6.3) (46 , 51) (46 , 52)
Fiber 9 13.6 8.9 13 <0.01 g/1000keal (2.2) (3.4) (7.6 , 10.6) (11, 15)
Chol 139 110 140 117 <0.01 mg/1000kceal | (51) (33) (111, 158) (90 , 133)
SFA% 12 12.4 12 12.6 0.64 (2.7) (2.4) (11, 14) (11, 14)
MFA% 11 13 11.6 13.4 <0.01 (1.9) (2.6) (10, 13) (10.8 , 15)
PUFA% 7.2 7.7 7 TA 0.19 (1.9) (1.9) (6,9) (6.7 , 8.3)
P:S 0.7 0.6 0.7 0.6 0.01 (0.3) (0.2) (0.5 , 0.9) (0.5 , 0.7)
TAle% 0.1 0.2 0 0 0.08 (0.3) (0.3) (0,0) (0, 0.3)
"Paired t-test conducted between FR and FFQ data for macronutrient means. Differences are statistically
significance if p < 0.05. All data is untransformed.
* For paired t-tests one outlier was removed from % alcohol data.

Table 3-7 (a)
Means & Standard deviations, and Medians, & Interquartile ranges for
macronutrients from FR and FFQ data: SA group (n=78).
82
Mean FR Mean FFQ Median FR Median FFQ “p-value (+SD) (+SD) (IQR) (IQR)
Pro (g) 74 101 71 94 <0.01
(21) (43) (58 , 92) (74 , 122)
Fat (g) 69 84 64 78 <0.01
(26) (42) (49 , 85) (53 , 104)
Tcarb (g) 221 342 208 318 <0.01 (69) (137) (169 , 264) (269 , 413)
AvCarb (g) 206 309 193 285 <0.01 (66) (126) (158 , 248) (233 , 373)
Energy (Kcal) 1743 2398 1701 2241 <0.01 (521) (1004) (1296 , 2071) (1752 , 2743)
Fiber (g) 15 33 15 31 <0.01
(4.8) (14) (11.5 , 17.5) (25 , 40)
Chol (g) 247 250 242 229 0.81 (97) (142) (178 , 298) (152 , 310)
SFA (g) 23 26 22 24 0.02
(9.4) (15) (16.4 , 27.8) (16.3 , 33.6)
MFA (g) 22 29 22 27 <0.01
(10) (15) (14, 28) (19.2 , 37.4)
PUFA (g) 17 19 17 17.7 0.10 (7.2) (+10.6) (12, 21) (10.8 , 23.4)
Alc (g) 0.2 0.8 0 0 <0.01 (0.9) (1.5) (0, 0) (0 , 0.9)
GI 81 80 81 80 0.03
(3.8) (3.9) (79 , 83) (78 , 81)
" Paired t-test conducted between FR and FFQ data for macronutrient means. Differences are statistically
significance if p < 0.05. All data is untransformed.

83
Table 3-7 (b) Means & Standard deviations, and Medians, & Interquartile ranges for
macronutrients expressed as a percentage of total energy from FR and FFQ data:
SA group (n=78).
Mean Mean FFQ Median FR Median FFQ "p-value
FR (+SD) (IQR) (IQR)
(+SD)
Pro% 17.8 16.8 17.5 17.2 0.01
(3.5) (3.4) (17 , 20) (15.3 , 19.2)
Fat% 34 31 34 32 <0.01 (5.5) (5.8) (30 , 39) (28 , 35)
Carb% 48 52 48 51 <0.01
(6) (7) (43 , 53) (47 , 55)
Fiber 9.3 14.3 8.5 13 <0.01 ¢/1000kcal (3) (4.8) (7,11) (11,17)
Chol 149 104 148 106 <0.01
meg/1000kcal (61) (37) (109 , 172) (86 , 122)
SFA% 11.5 10.7 11 11 <0.01 (2.9) (2.8) (9, 13) (9.3 , 12.6)
MFA% 11 11.8 11 12 <0.01 (2.4) (2.7) (9 , 13) (10.6 , 13.7)
PUFA% 8.4 7.8 8.2 7.8 0.04 (1.9) (1.9) (7 , 9.5) (6.3 , 9.4)
P:S 0.9 0.76 0.9 0.75 <0.01 (0.3) (0.2) (0.7 , 1.2) (0.6 , 0.9)
Alce% 0.1 0.24 0 0 <0.01 (0.4) (0.44) (0, 0) (0 , 0.2)
* Paired t-test conducted between FR and FFQ data for macronutrient means. Differences are statistically
significance if p < 0.05. All data is untransformed.

Table 3-8 (a)
84
Anova with Duncan’s Multiple Range test for differences between SA’s and AF’s:
FR data.
SA Males AF Males SAFemales AF Females ‘p-value
n= 30 n= 19 n= 48 n= 29
Pro (g) *99.4 * 93.2 569.4 92.4 0.02
Fat (g) "78.2 *78 611 *78 <0.01
TCarb (g) 9241 *260 208 ab 939 0.05
AvCarb (g) #>925 243 >194 a> 922 0.05
Energy (Kcal) *1937 *1992 >1621 *1918 0.01
Fiber (g) 15.9 16.9 14 16.9 0.09
Chol (g) 275 272 229 264 0.23
SFA (g) 4595.8 997.4 21 *25.8 0.01
MFA (g) *26.5 494.8 °20 *26.5 <0.01
PUFA (g) 18.8 16.5 16 16.8 0.42
TAle (g) 0.42 0.59 0.12 0.05 0.15
GI 81.9 81 80.6 80.8 0.54
" Differences are statistically significance if p < 0.05. Means with the same letter are not significantly
different. All data is untransformed.
t For AF males, one outlier was removed from alcohol data.

Table 3-8 (b) Anova with Duncan’s Multiple Range test for differences between SA’s and AF’s:
FR data, (macronutrients expressed as a percentage of total energy).
SA AF SA Females AF Females “p-value
Males Males n= 48 n= 29
n= 30 n= 19
Pro% 17.7 17 17.8 17.8 0.87
Fat% 35 32.7 33.3 35.2 0.16
Carb% 47 50 48.9 47 0.22
Fiber g/1000kcal 8.6 9 9.7 9.2 0.40
Chol mg/1000keal | 154 137 145 141 0.74
SFA% 11.8 12 11.2 12.3 0.39
MFA% *>11.6 °10.6 °10.4 *11.8 0.02
PUFA% *33 °F 78.4 ar74 0.02
P:S 250.92 -°0.77 20.97 0.75 0.02
TAle% 0.16 0.15 0.03 0.01 0.22
” Differences are statistically significance if p < 0.05. Means with the same letter are not significantly different. All data is untransformed.
* For AF males, one outlier was removed from % alcohol data.
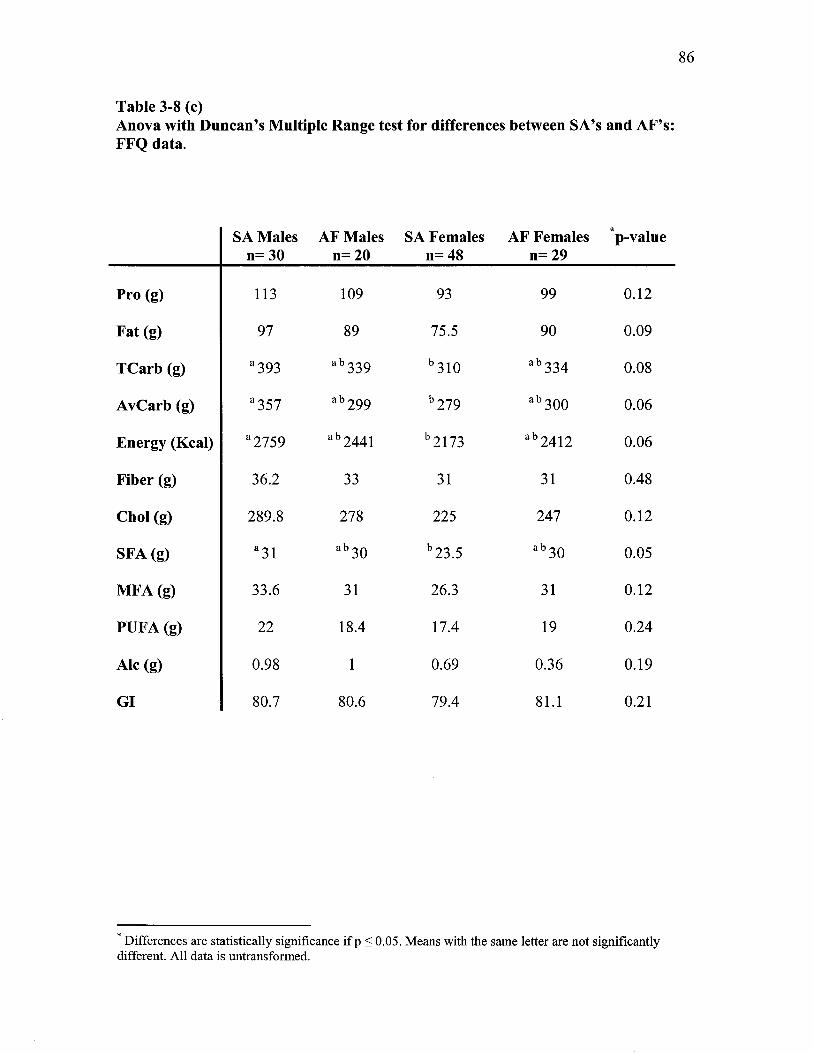
Table 3-8 (c)
Anova with Duncan’s Multiple Range test for differences between SA’s and AF’s: FFQ data.
SA Males AF Males SA Females AF Females ‘p-value n= 30 n= 20 n= 48 n= 29
Pro (g) 113 109 93 99 0.12
Fat (g) 97 89 75.5 90 0.09
TCarb (g) #393 #> 339 °310 26334 0.08
AvyCarb (g) *357 4> 999 >279 5300 0.06
Energy (Keal) | *2759 > 9441 2173 #>9412 0.06
Fiber (g) 36.2 33 31 31 0.48
Chol (g) 289.8 278 225 247 0.12
SFA (g) #31 a> 39 593.5 ab 39 0.05
MFA (g) 33.6 31 26.3 31 0.12
PUFA (g) 22 18.4 17.4 19 0.24
Alc (g) 0.98 1 0.69 0.36 0.19
GI 80.7 80.6 79.4 81.1 0.21
” Differences are statistically significance if p < 0.05. Means with the same letter are not significantly
different. All data is untransformed.

87
Table 3-8 (d) Anova with Duncan’s Multiple Range test for differences between SA’s and AF’s:
FFQ data, (macronutrients expressed as a percentage of total energy).
SA AF SA Females AF Females “p-value
Males Males n= 48 n= 29
n=30 n= 20
Pro% 16 *18 *>17.4 *>16.8 0.07
Fat% 31 ab33 531 934 0.06
Carb% 53 49 51.6 49 0.12
Fiber g/1000kcal 14 13.6 14.7 13.6 0.65
Chol mg/1000kcal | 103 115 105 107 0.64
SFA% °10.8 712.3 10.6 12.5 <0.01
MFA% 11.8 12.8 11.9 12.9 0.22
PUFA% 17 7.4 7.8 7.9 0.80
P:S #5073 -°0.63 *0.78 0.64 <0.01
Ale% 0.28 0.31 0.21 0.10 0.21
" Differences are statistically significance if p < 0.05. Means with the same letter are not significantly
different. All data is untransformed.

Table 3-9 (a)
Means & Standard deviations, and Medians, & Interquartile ranges for
macronutrients from FR and FFQ data: FFQ First group (n=75).
88
Mean FR Mean FFQ Median FR Median FFQ “Dp value
(+SD) (SD) (IQR) (IQR)
Pro (g) 80 105 80 98 <0.01 (22) (42) (64 , 96) (87 , 122)
Fat (g) 75 89 69 82 <0.01
(27) (40) (56 , 93) (66 , 107)
Tcarb (g) 235 350 227 318 <0.01 (87) (153) (164 , 284) (277 , 400)
AvCarb (g) 219 312 209 286 <0.01 (83) (143) (159 , 264) (244 , 358)
Energy (Keal) 1870 2477 1824 2443 <0.01 (603) (1032) (1377 , 2210) (1923 , 2740) :
Fiber (g) 16 34 16 31 <0.01
(6) (16) (11.7 , 20) (26 , 39)
Chol (g) 266 264 244 248 0.92 (110) (128) (198 , 319) (199 , 322)
SFA (g) 25.5 28.7 24 28 0.04
(10.3) (13.8) (18.4, 32) (20 , 36)
MFA (g) 25 30.6 22 28 <0.01 (9.5) (13.8) (17.4 , 32) (22.4 , 37.4)
PUFA (g) 17 19.7 15 17 0.02 (7.4) (10.3) (12 , 20) (12 , 23)
Alc (g) 0.11 0.86 0 0 <0.01
(0.67) (1.6) (0, 0) (0 , 0.9)
GI 80.8 80.2 81 80.7 0.35 (4) (3.8) (79 , 83) (79 , 82)
* Paired t-test conducted between FR and F FQ data for macronutrient means. Differences are statistically significance if p < 0.05. All data is untransformed.

89
Table 3-9 (b)
Means & Standard deviations, and Medians, & Interquartile ranges for
macronutrients expressed as a percentage of total energy from FR and FFQ data:
FFQ First group (n=75).
Mean Mean FFQ Median FR Median FFQ “p-value
FR (+SD) (IQR) (IQR) (+SD)
Pro% 18 17 17 17.2 0.27
(3.4) (3.2) (15, 20) (15, 19)
Fat% 34 33 34 33 0.02
(5) (6.5) (30 , 38) (29 , 35)
Carb% 48 50 48 49 0.06
(5.4) (8.9) (45 , 51) (47 , 54)
Fiber 90 14 8.7 12.6 <0.01
¢/1000kcal (2.5) (5.6) (7.3 , 10.4) (11, 16)
Chol 148 111 141 115 <0.01
mg/1000kceal (60) (42) (110, 169) (86 , 131)
SFA% 12 11.6 11.7 11.4 0.48
(3) (3) (10, 13.4) (9.9 , 14)
MFA% 11 12.5 11.6 12.5 <0.01
(2) (3) (10,13) (10.8 , 14)
PUFA% 7.8 8 7.5 7.6 0.62
(2) (2.2) (6.5 , 9.2) (6.4 , 9.3)
P:S 0.8 0.7 0.7 0.7 <0.01 (0.3) (0.2) (0.6 , 1.0) (0.6 , 0.8)
Ale% 0.04 0.30 0 0 <0.01 (0.25) (0.7) (0, 0) (0 , 0.3)
* Paired t-test conducted between FR and FFQ data for macronutrient means. Differences are statistically
significance if p < 0.05. All data is untransformed.

Table 3-10 (a) Means & Standard deviations, and Medians, & Interquartile ranges for
macronutrients from FR and FFQ data: FFQ Second group (n =77).
90
Mean FR Mean FFQ Median FR Median FFQ “p-value
(+SD) (+SD) (IQR) (IQR)
Pro (g) 76 97 74 92 <0.01
(24) (35) (60, 88) (69 , 122)
Fat (g) 69 85 68 80 <0.01 (29) (39) (45 , 81) (54, 110)
Tearb (g) 227 335 214 327 <0.01 (74) (122) (178 , 267) (246 , 421)
AvCarb (g) 211 305 201 294 <0.01 (70) (115) (164 , 251) (223 , 385)
Energy (Kcal) 1776 2386 1730 2205 <0.01
(573) (887) (1408 , 2071) (1716 , 3023)
Fiber (g) 15.5 32 15 31 <0.01 (5) (13) (12, 18) (22 , 42)
Chol (g) 249 238 240 223 0.46 (119) (112) (170 , 298) (152 , 313)
SFA (g) 23.5 27 22 15 0.06 (10.4) (12.5) (18 , 27) (18.5 , 35)
MEA (g) 23 30 22 28 <0.01
(11.2) (14) (15 , 28) (19 , 40)
PUFA (g) 16.6 19 15 17 0.04
(7.1) (11) (11, 22) (12 , 23)
FAle (g) 0.3 0.7 0 0 0.03 (0.1) (0.1) (0 , 0.6) (0, 1.1)
GI 81.2 80.6 81 80.8 0.25
(4.0) (3.7) (78 , 84) (79 , 82)
* Paired t-test conducted between FR and FFQ data for macronutrient means. Differences are statistically significance if p < 0.05. All data is untransformed.
* For paired t-tests two outliers were removed from alcohol data.

91
Table 3-10 (b)
Means & Standard deviations, and Medians, & Interquartile ranges for
macronutrients expressed as a percentage of total energy from FR and FFQ data: FFQ Second group (n=77).
Mean Mean FFQ Median FR Median FFQ "p -value
FR (+SD) (IQR) (IQR) (+SD)
Pro% 17.7 16.5 17.4 16.7 <0.01 (3.8) (3.4) (15.6, 19.3) (14.9 , 18.7)
Fat% 33.5 31 34 31 <0.01
(5.6) (6) (29 , 37) (28 , 36)
Carb% 49 52 49 51 <0.01
(6) (7) (45 , 52) (46 , 56)
Fiber 9.3 14 9 13 <0.01
¢/1000kceal (2.8) (3.5) (7.6, 9) (11, 16)
Chol 143 101 147 104 <0.01
mg/1000kcal | (50.4) (31) (112 , 172) (86 , 121)
SFA% 11.5 11.4 11.5 11.3 0.85
(2.8) (3) (9.3 , 13.8) (9.7 , 13.2)
MFA% 10.9 12 11 12.3 <0.01 (2.6) (2.8) (9,11) (10.4, 14)
PUFA% 8 7.6 7.8 74 0.28 (2.1) (2.2) (6.4 , 9.3) (6.3 , 8.8)
P:S 0.9 0.70 0.8 0.68 <0.01
(0.3) (0.21) (0.7 , 1.0) (0.5 , 0.8)
TAle% 0.1 0.2 0 0 0.07 (0.4) (0.3) (0,0) (0 , 0.3)
" Paired t-test conducted between FR and FFQ data for macronutrient means. Differences are statistically
significance if p < 0.05. All data is untransformed. ' For paired t-tests two outliers were removed from % alcohol data.

Table 3-11 (a)
Anova with Duncan’s Multiple Range test for differences between FFQ First and
FFQ Second groups: FR data.
FFQ 1" FFQ2™ FFQ1" FFQ2™ p- Males Males Females Females value
n=28 n= 31 n=47 n=45
Pro (g) *g44 874 977.8 °72 0.11
Fat (g) 75 75.6 74.3 65 0.25
TCarb (g) ab 937 2253 a> 934 >208 0.10
AvCarb (g) >920 9937 #>918 >193 0.09
Energy (Keal) | 7°1896 71960 = *°' 1855, 1646 ~=—(0.09
Fiber (g) 16.3 16.2 16 15 0.72
Chol (g) 299 246 246 250 0.19
SFA (g) 26 26.4 25 21.5 0.12
MFA (g) 25.8 25 24 21.5 0.30
PUFA (g) 16.5 17.6 17.4 15.8 0.66
TAle (g) 0.22 0.47 0.04 0.19 0.23
GI 81.2 81.9 80.6 80.7 0.43
” Differences are statistically significance if p < 0.05. Means with the same letter are not significantly
different. All data is untransformed.
* For males from the FFQ 2™ group, one outlier was removed from alcohol data.

Table 3-11 (b) Anova with Duncan’s Multiple Range test for differences between FFQ First and FFQ Second groups: FR data, (macronutrients expressed as a percentage of total
energy).
FFQ 1% FFQ2™ FFQ1* FFQ2™ ‘p-value Males Males Females Females
n=28 n= 31 n=47 n=45
Pro% 18.4 17 17.6 18.2 0.42
Fat% 34.2 33.2 34.5 33.7 0.73
Carb% 47.3 49.4 47.9 48 0.49
Fiber g/1000kcal 9 8.7 9.2 9.8 0.32
Chol mg/1000kcal *169 °126 5136 ab 155 <0.01
SFA% 11.9 11.9 11.9 11.2 0.66
MFA% 11.6 10.7 11.2 11 0.48
PUFA% 7.4 7.6 8 8.2 0.42
P:S 0.81 0.88 0.84 0.95 0.37
TAle% 9.08 *0.17 0.01 “0.04 0.15
" Differences are statistically significance if p < 0.05. Means with the same letter are not significantly
different. All data is untransformed. ' For males from the FFQ 2™ group, one outlier was removed from % alcohol data.

Table 3-11 (c) Anova with Duncan’s Multiple Range test for differences between FFQ First and
FFQ Second groups: FFQ data.
FFQ1* FFQ2™ FFQ1* FFQ2™ “p-value Males Males Females Females
n=28 n= 31 n=47 n=45
Pro (g) “118 = #1024 97.2 °o4 0.06
Fat (g) 99 86 83 83.7 0.33
TCarb (g) 378 367 332 311 0.14
AvCarb (g) 334 339.6 299 280 0.15
Energy (Kceal) 2709 2572 2338 2254 0.17
Fiber (g) 35 34.2 33.2 31.2 0.70
Chol (g) #315 243 5934 235.2 0.02
SFA (g) 233 9097.6 °26 abo7 0.16
MFA (g) 34 30.5 29 28.8 0.44
PUFA (g) 22 18.4 18.3 19.2 0.49
TAle (g) #12 aby 2b 0.6 50.5 0.10
GI 80.5 81.3 80 80 0.45
” Differences are statistically significance if p < 0.05. Means with the same letter are not significantly
different. All data is untransformed.
t For males from the FFQ 2™¢ group, one outlier was removed from alcohol data.

95
Table 3-11 (d) Anova with Duncan’s Multiple Range test for differences between FFQ First and
FFQ Second groups: FFQ data, (macronutrients expressed as a percentage of total
energy).
FFQ 1“ FFQ2™ FFQ1" FFQ2™ “p-value Males Males Females Females
n=28 n= 31 n=47 n=45
Pro% “18 15.6 abi7 apy7 0.04
Fat% *33.2 29.9 20392 4532.4 0.18
Carb% > 48.3 253.2 #506 °°50.3 0.13
Fiber g/1000kcal 14.2 13.5 14.2 13.9 0.91
Chol mg/1000keal 7121 >94.9 #>104 #>105 0.05
SFA% 12.2 10.8 11.3 11.8 0.32
MFA% 12.6 11.6 12.4 12.3 0.57
PUFA% 8.1 7 7.9 8.1 0.17
P:S 0.69 0.67 0.73 0.72 0.60
TAIce% * 0.46 *® 0.30 © 0.19 0.15 0.08
” Differences are statistically significance if p < 0.05. Means with the same letter are not significantly
different. All data is untransformed.
* For males from the FFQ 2™ group, one outlier was removed from alcohol data.

96
3.4 Association between FR and FFQ
In general, the Pearson method for assessing correlation using untransformed data
yielded slightly stronger correlations between FR’s and the FFQ than the Spearman rank
method for nonparametric data, and the Pearson method using transformed data
(appendix J). Because the differences between these methods of assessment were so
marginal, Pearson correlation coefficients using untransformed data were used for all
measures for evaluating agreement between the FR’s and FFQ’s. For alcohol and %
alcohol data 2 outliers were omitted from analysis”. Correlation coefficients varied from
0.11 for alcohol to 0.51 for fat and MFA and can be seen in [table 3-12 (a)]. Fats
[(fat=0.51), (SFA=0.47), (MFA=0.51), (PUFA=0.44)] and (Kcal=0.43) tended to
correlate better than carbohydrate [(Tcarb=0.35), (AvCarb=0.36)], fiber (0.25) and GI
(0.25). Correlation coefficients for macronutrients expressed as a percentage of total
energy were weaker with respect to fats (“% fat, %SFA, %MFA, %PUFA) compared to
gram data, but were stronger for protein, carbohydrate and fiber [table 3-12 (b)].
Correlations between the FR’s and FFQ for average nutrient intake and % nutrient intake
were statistically significant at the 5 % level for all variables.
For males* and females [tables 3-13 (a) and (b)], SA’s and AF’s™ [tables 3-14 (a)
and (b)], and FFQ 1‘ and FFQ 2"* groups [tables 3-15 (a) and (b)] fats also tended to
*? Pearson correlation coefficients using untransformed data with no outliers removed, using transformed data and Spearman rank correlation coefficients can be seen in appendix Q.
>> For males, 2 outliers were omitted from alcohol and % alcohol data. See appendix Q for correlation
coefficients for males and females using untransformed data with no outliers removed, transformed data
and Spearman rank correlations.
* For AF’s, 1 outlier was omitted from alcohol and % alcohol data. See appendix Q for correlation
coefficients for males and females using untransformed data with no outliers removed, transformed data
and Spearman rank correlations.
°° For the FFQ 2™ group, 2 outliers were removed from alcohol and % alcohol data. See appendix Q for
correlation coefficients for males and females using untransformed data with no outliers removed,
transformed data and Spearman rank correlations

97
correlate better than carbohydrates and GI, showed the weakest association between FR’s
and FFQ’s. As seen for all subjects combined, each group had weaker correlation
coefficients for % fats compared to fats measured in grams and stronger correlation
coefficients for % carbohydrate and fiber g/1000kcal compared to gram values. Males
had stronger correlations than females for total and available carbohydrate, energy,
cholesterol, MFA, cholesterol mg/1000kcal, % PUFA and the P: S ratio, though none was
statistically significant. Females had stronger correlations than males for protein, fat,
fiber, SFA, PUFA, alcohol, GI, % protein, % fat, % carbohydrate, and % alcohol though
none was statistically significant except for % protein [tables 3-13 (a) and (b)].
SA’s had stronger correlation coefficients than AF’s for every measure except
PUFA, % protein, cholesterol mg/1000kcal, and % PUFA. Fisher Z-tests showed
statistically significant differences at or near the 5 % level between SA and AF
correlation coefficients for SFA (p=0.02), fiber g/1000kcal (p=0.05) and % SFA
(p<0.01), [tables 3-14 (a) and (b)].
Correlation coefficients from subjects who completed the FFQ after the FR’s
(FFQ 2" group) were stronger than those who completed the FFQ before the FR’s (FFQ
1* group) for all measures except alcohol, fiber g/1000kcal, cholesterol mg/1000kcal, %
SFA, and % alcohol. Fisher Z-tests showed statistically significant differences between
FFQ 1“ and FFQ 2" correlation coefficients for % fat, % carbohydrate, and % MFA,
[tables 3-15 (a) and (b)].
Examples of how agreement between FR’s and FFQ’s can be demonstrated
schematically are shown by scatter plots for fat and GI in figures 3-4 (a) and (b)
respectively. Both relationships are positively associated and roughly linear, although the

plot for fat shows a stronger linear relationship and less scatter. GI has a flatter slope
than fat indicating a somewhat weaker association. Both plots have a small number of
positive and negative outliers. Scatter-plots for other macronutrient distributions can be
seen in (appendix K).
98

99
Table 3-12 (a)
Pearson correlation coefficients for
FR vs. FFQ data:
All subjects (n=152).
Correlation “p-value
coefficient
Pro (g) 0.44 <0.01
Fat (g) 0.51 <0.01
TCarb (g) 0.35 <0.01
AvCarb (g) 0.36 <0.01
Energy (Kcal) 0.43 <0.01
Fiber (g) 0.25 <0.01
Chol (g) 0.42 <0.01
SFA (g) 0.47 <0.01
MFA (g) 0.51 <0.01
PUFA (g) 0.44 <0.01
"Ale (g) 0.11 0.19
GI 0.25 <0.01
* Correlation coefficients are statistically significant if p < 0.05. All data is untransformed.
* Two outliers removed from alcohol data, see appendix R for untransformed data without outlier removed.

100
Table 3-12 (b) Pearson correlation coefficients for
FR vs. FFQ data for macronutrients expressed as a percentage of total energy:
All subjects (n=152).
Correlation “p-value
coefficient
% Pro 0.46 <0.01
% Fat 0.48 <0.01
% Carb 0.45 <0.01
Fiber g/1000kcal 0.34 <0.01
Chol mg/1000keal 0.37 <0.01
% SFA 0.39 <0.01
% MFA 0.38 <0.01
% PUFA 0.25 <0.01
P:S 0.30 <0.01
'% Ale 0.13 0.10
” Correlation coefficients are statistically significant if p < 0.05. All data is untransformed.
* Two outliers removed from % alcohol data, see appendix R for untransformed data without outlier removed.

101
Table 3-13 (a) Pearson correlation coefficients (r-value) for FR vs. FFQ data and Fisher Z-test for
differences between males (n=60) and females (n=92)
Male “p Female “p ' Fisher Z-test
r-values r-values p
Pro (g) 0.43 <0.01 0.44 <0.01 0.94
Fat (g) 0.50 <0.01 0.51 <0.01 0.94
TCarb (g) 0.37 <0.01 0.32 <0.01 0.74
AvCarb (g) 0.41 <0.01 0.33 <0.01 0.58
Energy (Keal) 0.45 <0.01 0.41 <0.01 0.77
Fiber (g) 0.25 0.06 0.26 <0.01 0.95
Chol (g) 0.47 <0.01 0.37 <0.01 0.47
SFA (g) 0.42 <0.01 0.51 <0.01 0.50
MFA (g) 0.55 <0.01 0.45 <0.01 0.43
PUFA (g) 0.41 | <0.01 0.46 <0.01 0.72
FAle (g) 0.08 0.57 0.15 0.15 0.86
GI 0.10 0.45 0.25 0.01 0.36
" Correlation coefficients for FR vs. FFQ macronutrient data are statistically significant if p < 0.05. All data is untransformed.
* Correlation coefficients between males and females for macronutrient data are significantly different from one another if p < 0.05
* For males two outliers were removed from alcohol data.

Table 3-13 (b)
102
Pearson correlation coefficients (r-value) for FR vs. FFQ for macronutrients
expressed as a percentage of total energy and Fisher Z-test for differences between
males (n=60) and females (n=92)
Male . p Female . p ' Fisher Z-test r-values r-values p
% Pro 0.19 0.14 0.59 <0.01 <0.01
% Fat 0.39 <0.01 0.45 <0.01 0.67
% Carb 0.31 0.02 0.42 <0.01 0.45
Fiber g/1000kcal 0.29 0.03 0.29 <0.01 1
Chol mg/1000kceal 0.40 <0.01 0.38 <0.01 0.89
% SFA 0.42 <0.01 0.37 <0.01 0.73
% MFA 0.42 <0.01 0.32 <0.01 0.50
% PUFA 0.15 0.25 0.14 0.1885 0.95
P:S 0.34 <0.01 0.27 <0.01 0.65
*% Ale 0.07 0.61 0.10 0.35 0.98
" Correlation coefficients for FR vs. FFQ macronutrient data are statistically significant if p < 0.05. All data
is untransformed.
* Correlation coefficients between males and females for macronutrient data are significantly different from one another if p < 0.05
? For males two outliers were removed from % alcohol data.

Table 3-14 (a)
103
Pearson correlation coefficients (r-value) for FR vs. FFQ data and Fisher Z-test for
differences between AF’s (n=49) and SA’s (n=78).
AF p SA p ' Fisher Z-test
r-values r-values p
Pro (g) 0.36 <0.01 0.48 <0.01 0.43
Fat (g) 0.39 <0.01 0.49 <0.01 0.51
TCarb (g) 0.26 0.07 0.44 <0.01 0.38
AvCarb (g) 0.27 0.06 0.44 <0.01 0.38
Energy (Kcal) 0.33 0.02 0.47 <0.01 0.37
Fiber (g) 0.12 0.42 0.39 <0.01 0.12
Chol (g) 0.39 <0.01 0.49 <0.01 0.51
SFA (g) 0.16 0.28 0.54 <0.01 0.02
MFA (g) 0.36 0.01 0.51 <0.01 0.32
PUFA (g) 0.52 <0.01 0.34 <0.01 0.23
*Ale (g) 0.03 0.84 0.19 0.1010 0.39
GI 0.06 0.70 0.30 <0.01 0.18
" Correlation coefficients for FR vs. FFQ macronutrient data are statistically significant if p <0.05. All
data is untransformed.
* Correlation coefficients between males and females for macronutrient data are significantly different from
one another if p < 0.05.
* For AF’s one outlier was removed from alcohol data.

104
Table 3-14 (b)
Pearson correlation coefficients (r-value) for FR vs. FFQ for macronutrients expressed as a percentage of total energy and Fisher Z-test for differences between AF’s (n=49) and SA’s (n=78).
AF “p SA "p ' Fisher Z-test T- r-values p
values
% Pro 0.50 <0.01 0.50 <0.01 1
% Fat 0.28 0.05 0.51 <0.01 0.13
% Carb 0.32 0.03 0.55 <0.01 0.12
Fiber g/1000kcal 0.12 0.40 0.45 <0.01 0.05
Chol mg/1000keal | 0.52 <0.01 0.35 <0.01 0.26
% SFA 0.12 0.47 0.64 <0.01 <0.01
% MFA 0.19 0.20 0.41 <0.01 0.19
% PUFA 0.23 0.11 0.12 0.29 0.54
P:S 0.21 0.15 0.39 <0.01 0.29
'% Ale 0.12 0.4 0.17 0.14 0.79
" Correlation coefficients for FR vs. FFQ macronutrient data are statistically significant if p < 0.05. All data is untransformed.
* Correlation coefficients between males and females for macronutrient data are significantly different from one another if p < 0.05.
* For AF’s one outlier was removed from % alcohol data.

105
Table 3-15 (a)
Pearson correlation coefficients (r-value) for FR vs. FFQ data and Fisher Z-test for
differences between FFQ First (n=75) and FFQ Second (n=77) groups.
FFQ 1" "p FFQ 2" “p ' Fisher Z-test r-values r-values p
Pro (g) 0.35 <0.01 0.55 <0.01 0.13
Fat (g) 0.49 <0.01 0.54 <0.01 0.68
TCarb (g) 0.29 0.01 0.45 <0.01 0.26
AvCarb (g) 0.30 <0.01 0.47 <0.01 0.22
Energy (Keal) | 0.39 <0.01 0.50 <0.01 0.40
Fiber (g) 0.25 0.03 0.27 <0.01 0.90
Chol (g) 0.38 <0.01 0.46 <0.01 0.55
SFA (g) 0.46 <0.01 0.51 <0.01 0.69
MEA (g) 0.49 <0.01 0.54 <0.01 0.68
PUFA (g) 0.43 <0.01 0.46 <0.01 0.82
FAle (g) 0.21 0.08 0.05 0.65 0.33
GI 0.13 0.25 0.35 <0.01 0.15
" Correlation coefficients for FR vs. FFQ macronutrient data are statistically significant if p < 0.05. All data is untransformed. * Correlation coefficients between males and females for macronutrient data are significantly different from one another if p < 0.05.
* For the FFQ 2™ group, 2 outliers were removed from alcohol data.

106
Table 3-15 (b)
Pearson correlation coefficients (r-value) for FR vs. FFQ for macronutrients
expressed as a percentage of total energy and Fisher Z-test for differences between FFQ First (n=75) and FFQ Second (n=77) and groups.
FR First “ _ FFQ First “p * Fisher Z-test r-values p r-values p
% Pro 0.48 <0.01 0.26 0.02 0.12
% Fat 0.55 <0.01 0.29 0.01 0.05
% Carb 0.51 <0.01 0.20 0.08 0.03
Fiber g/1000kcal 0.28 0.01 0.33 <0.01 0.74
Chol mg/1000kcal 0.37. <0.01 0.38 <0.01 0.94
% SFA 0.34 <0.01 0.46 <0.01 0.39
% MFA 0.54 <0.01 0.17 0.15 <0.01
% PUFA 0.27 0.02 0.03 0.79 0.13
P:S 0.23 0.04 0.39 <0.01 0.28
*% Ale 0.06 0.63 0.13 0.2583 0.67
" Correlation coefficients for FR vs. FFQ macronutrient data are statistically significant if p < 0.05. All data is untransformed.
* Correlation coefficients between males and females for macronutrient data are significantly different from one another if p < 0.05.
? For FFQ 2" group, 2 outliers were removed from % alcohol data.

107
Figure 3-4 (a)
FFQ versus 7-day Food Record: Fat (grams)
250 5
200 5
150 +
FFQ
100 -
50 +
0 50 100 150 200

108
Figure 3-4(b)
FFQ versus 7-day Food Record: GI
95 -
Sd 90 -
85 -
80 + FFQ
75 +
70 - °
o¢ 65 T T T T T 1
65 70 75 80 85 90 95

4. DISCUSSION AND CONCLUSIONS
4.1 Discussion
In this study, a nine-page, 149-item interviewer-administered food frequency
questionnaire (FFQ) was developed to assess dietary intake with respect to diet glycemic
index (GI) in healthy adults from various ethnic groups in Trinidad. The FFQ was
administered once and was calibrated against one series of 7-day food records (FR),
which were completed either one-day prior to or following the FFQ administration. The
primary criterion for validity for the FFQ was Pearson correlation coefficients for
macronutrients and macronutrients expressed as a percentage of total energy between the
FFQ and FR’s greater than 0.5 (p<0.05) (Willett, 1998 p. 120, 132; Dwyer, 1900; Cade et
at., 2002; Thompson & Byers, 1994). The secondary criterion for validity for the FFQ
was that means of macronutrient and percent macronutrient should not differ when
assessed from FFQ and FR by more than 5 percent of the time in a particular distribution
(Moore & McCabe, 1999, p.458).
4.1.1 All participants
The results from this study show statistically significant correlations (p<0.05)
between nutrient intakes derived from the FFQ and FR’s for all variables examined. The
agreement was strongest for fat and monounsaturated fat (MFA) intake (r=0.51) and
weakest for alcohol (r=0.11). The distributions for alcohol and alcohol expressed as a
percentage of total energy both showed extreme positive skewness, therefore two
outliers were omitted from alcohol and % alcohol data from all analyses. The Pearson
correlation coefficient for GI, (fiber and % PUFA) is 0.25, which is the weakest
109

110
correlation between FR’s and the FFQ, after alcohol and % alcohol despite the fact that
the FFQ was designed to assess diet GI in particular. A rather interesting and novel
finding shown in this study is that although agreement between the FR’s and FFQ is so
poor for GI as indicated by the weak correlation coefficient, the mean value for GI does
not differ between FR’s and the FFQ. Estimates of GI therefore do not meet the primary
criterion for validity but do meet the second criterion. It is difficult to understand why
this may be happening. It is possible that variability in the GI measure itself and how it
varies between food items is responsible for the poor correlation. It is also possible that
the poor correlation for GI may be a result of carbohydrates with different GI values
being pooled together on the FFQ compared to carbohydrates (with different GI’s) that
are actually consumed and indicated in the FR’s hence allowing actual GI values to be
captured in the FR’s.
Generally, estimates of fats from the FFQ and FR’s tended to correlate better than
carbohydrate for both absolute and percent data, which is consistent with findings of
other FFQ validation studies using a variety of calibration criterion such as FR’s, 24-hour
dietary recalls, or biochemical indicators (Mayer-Davis et al., 1999; MacIntyre et al.,
2001, Rimm et al., 1992; Block et al., 1990; Margetts et al., 1989; Jain et al., 1996). In
fact correlation coefficients for fat and MFA were the only variables that satisfied the
primary criterion for validity. In contrast, some FFQ validation studies have found that
carbohydrate correlate better than fats (Block et al., 1992; Hodge et al., 200; DeCarli et
al., 1996; Shaefer et al., 2000). The performance of various nutrients in FFQ validation
studies is most likely a function of many factors including the FFQ design, nature of the
food list, method of administration, time of year of administration, choice of calibration

111
criterion and demographics of the population being surveyed and therefore cannot be
generalized. For example, Willett et al., in 1985 found that total carbohydrate estimated
from a FFQ correlated better than total fat when correlations were done using the third
and fourth sets of diet records, however when correlations were done using the first and
second sets of diet records total fat correlated better than total carbohydrate. It is
interesting to note that in the present study, the correlation coefficients for %
carbohydrate and fiber g/1000kcal, although weaker than correlations for % fats are both
stronger than correlations for absolute carbohydrate and fiber intake respectively.
It is possible that agreement between the FFQ and FR’s was weaker than
expected, particularly for carbohydrate (and fiber and GI) because the food list on the
FFQ did not adequately represent the types of foods consumed in the population,
particularly those that comprise the carbohydrate component of the diet. In addition, more
carbohydrate- rich foods may have been reported in the FR’s compared to the foods listed
on the FFQ and as a result valuable nutrient information may have been lost when items
from the FR’s were collapsed when being coded so as to be comparable to corresponding
items on the FFQ (Willett, 1998, p. 103). It is also possible that the order in which foods
that are a large source of carbohydrate were listed on the FFQ, did not capture
carbohydrate intake effectively. The FFQ was organized according to the 6 official food
groups of the English-speaking Caribbean. Perhaps this is unrealistic for people, since
they likely do not think of their dietary intake with respect to food groups. It may be more
effective to group food items according to how they are commonly consumed, such as
rice and peas together rather than rice appearing in the “cereals” section and peas in the
“legumes & nuts” section.

112
The FFQ was designed to assess average dietary intake over the past year, and
because only one set of 7-day food records were completed, the items reported in the
diaries do not reflect average dietary intake over the same reference period as the
questionnaire, which could result in poor agreement between the two methods. A more
suitable validation process would include completion of food records at equal intervals
throughout the one- year reference period. In doing so, influences of seasonal variation in
the diet would also be addressed (Willett, 1998, p. 113, 132; Dwyer). Carbohydrate
intake and hence fiber intake and diet GI are influenced by seasonal changes especially in
Trinidad, since a large part of the diet is composed of fruits and vegetables. Glycemic
index values in particular, are influenced by levels of ripeness and post harvest changes
(Trout et al., 1993). An open-ended section on the FFQ was included so respondents
could list other seasonal fruits and vegetables consumed. A small food list was generated
from this exercise, and added to the Nutriput database, however, it is likely that many
items went unreported due to respondent fatigue (this section was at the end of the FFQ)
and inability to remember diet out of season particularly in the absence of certain cues
such as the name of the item and common serving sizes. Although, I, the interviewer am
familiar with Trinidadian culture, I am not aware of all of the seasonal fruits and
vegetables, and more particularly their slang names, and was therefore not well equipped
to probe respondents about their seasonal intake in order to improve recall. Since I was
the only interviewer, there was not enough time to conduct repeat administrations of food
records in various seasons. The population has a low level of functional literacy and a
significant amount of time was needed to give instructions for completing both the FR’s
and the FFQ. In addition, the infrastructure of some of the electoral districts that were

113
surveyed was quite poor and therefore required a great deal of travel time. Safety was
also a consideration, since it was not appropriate for a woman to be walking about in the
evening, alone or in company.
Given that the glycemic index is influenced by cooking methods (Trout et al.,
1993), it is possible that the FFQ did not adequately assess how carbohydrate- containing
foods are prepared. The FFQ did however ask the respondent to report how meat and fish
was prepared as well as the content of fat in dairy products, which may be a reason that
fats correlated better than carbohydrates with the FR’s. Another reason why agreement
between the FFQ and FR’s was weaker than anticipated, particularly for carbohydrates
may be respondent errors in frequency estimation on the FFQ. Willett reports that
frequency of food consumption is the most important determinant of between—person
variation in nutrient intakes (Willett, 1998, p. 121; Thompson & Byers, 1994). The
process of remembering how often an item is consumed is difficult especially if dietary
habits change according to the seasons, as it does in Trinidad. This may directly affect
how carbohydrate intake is reported since a large source of carbohydrates are seasonal
items. Moreover, people may simply have a better recall for fat and protein rich foods
compared to carbohydrate rich foods, since the carbohydrate component of the meal for
many are side dishes. Because FR’s do not rely on memory or estimations of frequency,
they are considered to be an appropriate tool for use in calibration studies of FFQ’s
(Willett 1998, p. 102, Thompson & Byers, 1994; Dwyer 1999). The process of
estimating portion sizes is also difficult (Willet p. 85; Thompson & Byers, 1994; Hunter
et al., 1988), but even more so in a population as socially diverse as Trinidad where
different ethnic groups may have different conventions for measuring and serving food,

114
and may have different terminologies for utensils. Assessing portion sizes was
particularly difficult for males since culturally, they shy away from conventionally
female duties such as cooking or going to the market. Since a large part of the diet is
carbohydrate-based, either rice, roti, bread (hops), or ground provisions, and seasonal
fruits and vegetables, the incorrect estimation of portion sizes will have an impact on
reported carbohydrate intake from the FFQ. For the population in Trinidad it was much
easier to estimate portion sizes in FR’s because recipes were often provided and
individuals reported consuming a proportion of the item that was prepared. Wives often
filled out FR’s for their husbands, and I probed the husbands for snack items in the
follow-up interview. Since individuals have difficulty estimating the frequency and
amounts of foods consumed on a FFQ, a tendency for over and under reporting various
items occurs.
Average nutrient intake assessed by the FFQ was found to be significantly greater
than assessed by the FR’s (p<0.05) for all variables except cholesterol, and GI for
absolute values and saturated fatty acid intake expressed as a percentage of total energy
(“%SFA) and polyunsaturated fatty acid intake expressed as a percentage of total energy
(“%PUFA). These four variables were therefore the only measures that met the secondary
criterion of validity. These findings are not consistent with other validation studies and
are likely a result of the types of foods consumed in the particular population being
surveyed.
Various validation studies have reported greater estimates of nutrient intake or
total energy assessed by FFQ’s compared to diet records (DR’s) or other calibration
methods such as 24-hour dietary recalls or biochemical indicators (DeCarli et al., 1996;

115
Jain et al., 1996; Block et al., 1992; Mayer-Davis et al., 1999°. Jackson et al., 2001; Xu
et al., 2000). The findings of the present study are for the most part consistent with these
findings. Average nutrient intake estimated by the FFQ was significantly greater than
estimated by the FR’s for all variables except cholesterol (p=0.60) and GI (p=0.14).
However, for variables expressed as a percentage of total energy, nutrient intake assessed
by the FR’s was significantly greater than estimated by the FFQ for all nutrients except %
carbohydrate (p<0.01), fiber g/1000kcal (p<0.01),% SFA (p<0.36), % MFA and % PUFA
(p=0.47) . In addition, data from nutrients expressed as a percentage of total energy
exhibited smaller mean to median differences when compared to absolute nutrient intake.
A reason for this may be because certain sources of energy are missing from the FFQ. If
the missing calories came equally from all food sources, a general underestimation of
total intake would not distort the percentage of energy from other nutrients. It is possible
that fat and protein containing food items are missing from the FFQ. People also tend to
report sources of fat selectively compared to carbohydrate sources. It is therefore
possible that sources of fat (and protein) are being underreported on the FFQ in relation
to the FR’s. In addition, it appears, that cholesterol, SFA and PUFA are being slightly
underreported on the FFQ compared to the FR’s, or that sources of these macronutrients
are missing from the FFQ, similar to total fat. It is difficult to compare these specific
findings to other validation studies since only one other study has attempted to assess GI
using a FFQ (Liu et al., 2001), and few validation studies report nutrients as a percentage
of total energy, rather they correct absolute intake for total energy using a regression
*° Nutrient estimates from FFQ greater than FR’s only for rural non-Hispanic Whites from Colorado and
Rural Hispanic Whites from Colorado. This difference was not consistent in urban non-Hispanic Whites
from Oakland or urban African American’s from Oakland.

116
model to calculate residuals (Thompson & Byers, 1994; Cade et al., 2002)°”. Liu et al
(2001) examined glycemic load (rather than diet GI) and had very good agreement
between the FFQ and multiple FR’s (means and correlations) for carbohydrate. It is
possible that this strong agreement was a result of multiple FR’s completed over the
reference period of the FFQ, thereby addressing seasonality and day-of-the-week-
variation in intake. The subjects for the validation study (Nurses from the Boston area)
have also had a lot of practice participating in dietary assessment studies, and may
therefore have been more compliant with the study protocol. Since dietary intake in
Boston does not likely differ too much from season to season, carbohydrate intake may
be more consistent throughout the year compared to a region like Trinidad where diet is
based on seasonal food items, which are largely rich in carbohydrate content. Similar to
the present study, Liu et al (2001) found that the average intake of cholesterol was also
greater when assessed by FR’s compared to the FFQ. Rimm et al., (1992) also reported
average cholesterol intake to be higher in diet records compared to a FFQ. Mayer-Davis
et al (1999) in the validation study of the multi-ethnic Insulin Resistance Atherosclerosis
Study (IRAS) did report percent data and found that some variables were greater when
assessed by the FR’s and others by the FFQ's when looking at absolute data and reversed
when looking at percent data. The specific direction of the differences is not consistent
with the present study, however it is interesting to note that the same phenomenon exists
in other validation studies.
Additional reasons for differential reporting on a FFQ may be due to social
acceptability or cultural ideals of healthy eating. Vuckovic et al., (2000), reported that
37 . . . ps . The regression model to calculate residuals is used if micronutrient values are needed because they are
not dependent on energy as macronutrients are.

117
there are two major factors that influence dietary reporting; honesty and social
acceptability. Laurence et al., in 1991 reported that items not consumed very often tend to
be over reported on FFQ’s and items consumed often tend to be underreported. Because,
the FFQ was interviewer-administered it is possible that participants felt the need to
report eating large quantities since an abundance of food is related to affluence and status
in the Trinidadian culture, although perceptions are slowly changing. Participants may
also have reported intake according to what they believed the investigator wanted to hear
which is an example of the interviewer leading the interviewee, perpetuating a sort of
desirability bias. (Cade et al., 2002; Kristal et al.). Studies by Salvini et al., (1989); Hu et
al., (1999); and Mennen et al., (2000) all report how responses to questionnaires tended to
over-represent socially desirable foods. Interestingly, Cade et al. (2002) reports that
correlation coefficients for repeatability between interviewer-administered and self-
administered FFQ’s were better for interviewer-administered for fat (0.65 vs. 0.60),
energy (0.67 vs. 0.63) and vitamin A (0.59 vs. 0.58), but worse for vitamin C (0.59 vs.
0.66), and Kristal et al., in 1997 concluded that interviewer-administered FFQ's are better
for assessing diet in minority or poorly educated groups. The choice of using an
interviewer-administered technique therefore requires careful consideration of the
benefits and drawbacks inherent in the procedure itself.
4.1.2 Males and Females
The FFQ was able to discriminate between the dietary intake of males and
females as anticipated. With respect to absolute data, similar to the study population,
significant differences between the FFQ and FR’s in mean nutrient intake were found for

118
all variables except GI, and cholesterol in both males and females, indicating that the
secondary criterion for validity was met only for these variables. For percent data, a
larger number of variables showed agreement between means (p>0.05). Males had
higher levels of intake compared to females for all absolute variables, which is expected
since men are known to consume a greater amount of energy compared to women
(Delcourt et al., 1994). Similar to all study participants, both the male and female groups
had higher estimates of nutrient intake when assessed by the FFQ compared to FR’s for
all variables except cholesterol and GI. When percent data was looked at, this trend was
attenuated and some variables were higher when assessed by FR’s compared to the FFQ
and others were lower for both male and female groups, indicating that some variables
were under being differentially reported. For males (similar to all study participants), it
appears that fat, and to a lesser extent protein and cholesterol are being underreported on
the FFQ in relation to the FR’s or that sources of fat (protein and cholesterol) are missing
from the FFQ. Carbohydrate, SFA and PUFA appear to be very slightly underreported on
the FFQ compared to the FR’s or some of these sources may be missing on the FFQ also.
For females, like with all study participants and male subjects, fat appears to be
underreported on the FFQ in relation to the FR’s or sources of fat may be missing from
the FFQ. Cholesterol appears to be slightly underreported in the FFQ compared to the
FR’s or the FFQ may be missing sources of cholesterol. SFA and PUFA were also found
to be slightly underreported on the FFQ compared to the FR’s or sources of these
macronutrients may be missing from the FFQ. The fact that fat is being underreported on
the FFQ for both males and females in addition to all study participants indicates that

119
sources of fat may be missing from the FFQ, or subjects may be apprehensive about
reporting their actual fat intakes.
As found with all study participants, correlation coefficients between FR’s and the
FFQ for both males and females were generally stronger for fats and weaker for
carbohydrate, fiber and GI. For males and females, alcohol and % alcohol had the
weakest correlations, and for females the strongest correlation was found for % protein
and for males the strongest correlation was found for fat. Correlation coefficients
between FR’s and the FFQ did not differ significantly between males and females for
absolute nutrient intake for any variable, although males showed stronger agreement for
total carbohydrate, available carbohydrate and cholesterol than did females. However, a
statistically significant difference in correlation coefficients (FR’s vs. FFQ) between
males and females was found for % protein and may be due to the fact that males had a
rather weak correlation between the FR’s and FFQ for % protein while females had a
rather strong correlation for % protein.
4.1.3 AF’s and SA’s
For both AF’s and SA’s, nutrient intake assessed by the FFQ was greater than
assessed by the FR’s for most variables, keeping consistent with findings in the study
population and males and females, indicating the differential reporting of various
nutrients in the FR’s and FFQ. For AF’s, protein and fat appeared to be slightly
underreported on the FFQ compared to FR’s or sources of protein and fat may be missing
from the FFQ. Carbohydrate, cholesterol and PUFA were found to be slightly
underreported on the FFQ compared to the FR’s, indicating that sources of these

120
macronutrients may also be missing from the FFQ. For SA’s, protein, fat and SFA
appeared to be underreported on the FFQ compared to FR’s, or sources of these
macronutrients may be missing from the FFQ. Cholesterol and PUFA were found to be
slightly underreported on the FFQ compared to the FR’s indicating that sources of these
macronutrients may also be missing from the FFQ. Interestingly, GI was found to be
significantly lower when assessed by the FFQ compared with the FR’s for SA’s, but not
for AF’s. This may signify that the FFQ might be missing items specific to the SA diet
that may impact diet GI or SA’s may be underreporting carbohydrate intake on the FFQ
in relation to the FR’s.
Differences in dietary intake between African’s (AF) and South Asians (SA) were
examined by gender. Because of small sample size, it was thought that true differences in
intake may not be apparent, however this is not the case since differences in mean
nutrient intake were detected between ethnic groups. Significant differences between
AF’s and SA’s by gender were found for most nutrients. SA females had a significantly
lower intake of protein, fat and energy compared to AF females, SA males and AF males,
and a lower intake of total and available carbohydrate compared to AF males and SA
males (total carbohydrate only). This is not surprising since it would be expected that SA
females would underreport nutrient intake due to cultural ideals of conventional beauty.
For South Asian women, the most desirable body type is small or ectomorphic,
highlighting cultural expectations of femininity (linked to frailty and submission) and the
demure role of women in South Asian culture. In addition, many SA families are wealthy
in Trinidad and offspring are often sent abroad to study. In doing so, wealthy, urban SA’s
in Trinidad have adapted Western ideals of beauty, which also promote thinness. Many

121
(SA women) have also become aware of health issues linked to being overweight, as a
result of higher education. In contrast, African women have a different perception of
beauty that may encourage the over reporting of energy. For African women in Trinidad,
a larger more robust or endomorphic body type is more acceptable. Among African’s in
Trinidad a larger body is associated with power and status. African women tend not to
study abroad as much as SA women, and have a lower rate of higher education Likewise,
males may over report dietary intake irrespective of ethnicity, since a larger body size is
associated with wealth, status, and power in Trinidad. This attitude is changing in certain
communities, particularly those with access to higher education as health issues
pertaining to lifestyle and weight are becoming global concerns. The differences in
nutrient intake between SA males, AF males, SA females and AF females, disappeared
when percent data was looked at, indicating that the different groups may be
differentially reporting various sources of energy on the FFQ or in the FR’s. It is also
possible that commonly eaten food sources for a particular group may have not been
included on the FFQ.
With respect to correlations between the FR’s and FFQ, SA’s had stronger
correlations than AF’s for all variables except PUFA, cholesterol mg/1000kcal, and %
PUFA, however the only statistically significant differences in correlations between AF’s
and SA’s were found for SFA, fiber g/1000kcal, and % SFA. For both AF’s and SA’s,
fats correlated better than carbohydrate, fiber and GI. AF’s had a particularly weak
correlation for GI (r=0.06) between the FR’s and FFQ compared to SA’s (r=0.30),
although this difference was not statistically significant. It is possible that the FFQ did
not contain relevant ethnic food sources, particularly sources of carbohydrate that would

122
influence GI. It is also possible that seasonality affects carbohydrate intake in AF’s more
so than in SA’s. If this is the case, using multiple FR’s at different times of the year
should improve agreement between the FFQ and FR’s for AF’s.
4.1.4 FFQ 1“ group compared to FFQ 2™ group.
Administration of the FFQ before or after the FR’s may affect the quality of the
data collected. The process of recording diet may alter the participant’s awareness of food
intake and thus improve accuracy in completing the questionnaire. It may also alter food
choices thus leading to biased assessment relative to the true diet (Willett, 1998, p. 102).
In order for these effects to be balanced within the study, participants either completed
the FFQ one-day before completing the FR’s (FFQ 1* group) or one-day after completing
them (FFQ and group), determined by coin-toss. This method of randomization although
crude is acceptable (Lilienfeld, D.E & Stolley, P.D., Foundations of Epidemiology, 3n4
ed., 1994, p. 183) and was appropriate for this study since computer resources in Trinidad
are limited.
Dietary intake of the two groups was examined separately and it was found that
the order of administration did not influence the findings, since differences between
gender and ethnic groups were the same as were most differences between the FR’s and
FFQ.
Out of interest, nutrient intake from FR data was compared between males from
the FFQ 1“ group, males from the FFQ 2™ group, females from the FFQ 1 group and
females from the FFQ 2™ group. Statistically significant differences between groups were
found for protein, total and available carbohydrate, energy and cholesterol] mg/1000kcal.

123
Nutrient intake from FFQ data was also compared between males from the FFQ 1*
group, males from the FFQ 2" group, females from the FFQ 1" group and females from
the FFQ 2™ group. Statistically significant differences between groups were found for
protein, cholesterol, alcohol, % protein, cholesterol mg/1000kcal and % alcohol. These
findings show that there are few and no consistent differences in nutrient intake that
result from whether the FFQ administered before or after completing FR’s.
Correlation coefficients between FR’s and the FFQ did not differ between the
FFQ 1° and FFQ 2™ groups except for % fat, % carbohydrate and % MFA indicating that
whether the FFQ was done before or after the FR’s did not matter with respect to
agreement between the two assessment methods. It is interesting to note that all
correlations for the FFQ 1 group are weaker than the FFQ an group for all variables
except for alcohol, fiber g/1000kcal, cholesterol mg/1000kcal, % SFA, the P:S ratio and
% alcohol. Similar to all study participants, and different gender and ethnic groups, fats
correlated better than carbohydrate, fiber and GI, further indicating that whether the FFQ
was administered before or after completing the FR’s did not effect the quality of the data
collected.
4.2 Future Directions
Although reproducibility is not indicative of validity, a valid method used in
epidemiological studies must be reproducible (Willett, W. Nutritional, Epidemiology, and
ed. 1998, p. 105). Reproducibility coefficients are used to compare the agreement
between two identical FFQ’s administered at different times in similar populations. Any
future work related to this study should seek to readminister the FFQ at a different time

124
of year to address seasonality as well as reproducibility. Future work should also include
repeat administrations of FR’s at different times of the year over a similar reference
period of the FFQ being calibrated. Anthropometric measures should also be taken if
possible so BMI can be calculated and underreporting and over reporting of energy can
be done. Although the population may not be receptive to participating in assessment of
biochemical indicators, doubly labeled water measures would be useful in assessing total
energy intake (although expensive), urinary nitrogen would be useful for assessing
protein intake and HbA1c would be useful in assessing long-term glycemic control. A
- more comprehensive approach to assessing portion sizes would also have great utility.
Either local food models or a larger number of calibrated photographs should be
generated for further work on the validation of this FFQ.
4.3 Conclusion
Prompted by the high prevalence rates of T2DM in T&T, and the epidemiological
finding that in T&T diabetes is twice as common in SA than AF men, with a smaller
difference in women, in 1998 a pilot study was conducted in T&T to estimate the nutrient
intakes and diet GI of AF and SA adults. The impetus behind the study was the
observation that low GI diets are beneficial in achieving long-term metabolic control in
persons with T2DM, and are associated with a reduced risk of developing T2DM. They
hypothesized that the diet GI of SA’s in T&T would be higher than that of AF’s. Nutrient
intakes were assessed by 24-hour dietary recall and indicated that AF men have a lower
diet GI than SA men while no significant difference was observed in women.

125
The primary objective of this thesis was to develop a FFQ using a food list
generated by the 24-hour dietary recalls collected in the pilot study that is able to assess
diet GI in T&T. The secondary objective was to validate the FFQ by comparing estimates
of nutrient intake for various macronutrients and diet GI to those obtained from 7-day
food records in T&T. The first criterion for validity for the FFQ was correlation
coefficients between FR’s and the FFQ for a given macronutrient or % macronutrient
over 0.5. The second criterion for validity for the FFQ was that macronutrient and %
macronutrient means should not differ when assessed from either the FFQ or FR’s more
than 5 % of the time for a particular distribution.
In general, agreement between the FFQ and FR’s was somewhat poor for most
macronutrients and % macronutrients since few variables met either sets of validity
criteria for the FFQ. However, it was found that the FFQ was more effective at assessing
fat intake compared to carbohydrate, and fiber intake and diet GI. Although this finding is
consistent with other validation studies, correlation coefficients between the FR’s and
FFQ were particularly low for diet GI despite the fact that the FFQ was developed to
assess diet GI. It is possible that weak correlations between the FR’s and FFQ for
various nutrients resulted because the FFQ was designed to assess average dietary intake
over the past year and the FR’s were completed only once, therefore, the food items
reported in the diaries do not reflect average dietary intake over the same reference period
as assessed by the FFQ. Since a large part of the diet in Trinidad is based on fruits and
vegetables, and ground provisions, it is likely that seasonal changes in sources of
carbohydrate and fiber intake and hence diet GI were not detected in the FR’s, thereby
generating poor correlations for these variables between the FR’s and FFQ. An

126
interesting and novel finding in this study is that although diet GI does not correlate well
between the FR's and FFQ, estimates of mean diet GI do not differ between the two
methods. This discordance may have arisen because the FFQ might not be very effective
in assessing diet GI compared to the FR’s because carbohydrates with different GI’s may
be pooled together on the FFQ but are listed individually in the FR’s. In conclusion,
further validation of this FFQ is needed to fully address its ability to assess dietary intake
in Trinidad, particularly with respect to sources of carbohydrate and diet GI. Diet records
need to be re-administered at different times of year, and repeatability or precision of the
FFQ needs to be addressed. Since the FFQ was able to discriminate between dietary
intakes of males and females and different ethnic groups, the discriminate validity of the
questionnaire is satisfactory, indicating that the FFQ already has some utility. Once the
validation of the FFQ is complete, it may be used in Trinidad as part of a diabetes-
screening program, so that the relationship between diet and diabetes may be further
elucidated. This will foster the development of dietary intervention programs in Trinidad
to ultimately improve the quality of life of people living with T2DM, and help ameliorate
the risk factors for developing T2DM.

5. REFERENCES
Abate, N., Chandalia, M. Ethnicity and type 2 diabetes: Focus on Asian Indians. Journal
of Diabetes and Its Complications, 2001, vol 15:320-327.
Abramson, J.H. Making sense of Data: a self-instruction manual on the interpretation of
epidemiological data, 2"! Ed. Oxford University Press, New York, 1994 p. 404.
Aitken, G. Nutrition and diabetes: putting guidelines into practice. Brit J Nurs. 1997
6;18:1035-8, 1040.
Balch, J.F., Balch, P.A. Prescription for Nutritional Healing. Avery Publishing Group,
1997. 2" Edition.
Beckles, G., Kirkwood, B., et al. High total and cardiovascular disease mortality in
adults of Indian descent in Trinidad, unexplained by major coronary risk factors. The
Lancet 1986 June 7 1298-1301.
Belfiore F., Mogensen. New Concepts in Diabetes and its Treatment. Karger, 2000.
Bjorck, I, Liljeberg, H., et al. Low glycaemic-index foods. Br J Nutr 2000;83(suppl.
1):S149-155.
Block, G. A review of validations of dietary assessment methods. American Journal of
Epidemiology, 1982, vol 115; 4: 492-505.
Block, G., Thompson, F.E., Hartman, A.M., Larkin, F.A., Guire, K.E. Comparison of two
dietary questionnaires validated against multiple dietary records collected during a I-
year period. J. Am. Diet. Assoc, 1992, 92:686-693.
Block, G., Woods, M., et al. Validation of a Self-Administered Diet History Questionnaire Using Multiple Diet Records. J Clin Epidemiol 1990:43(12):1327-35.
Brand JC, Colagiuri S, et al. Low-Glycaemic Index Foods Improve Long-Term Glycaemic Control in Type 2 diabetes. Diab Care 1991 14;2:95-101.
Brand-Miller J, Colagiuri S. The Carnivore Connection: Dietary carbohydrate in the
evolution of Type 2 diabetes. Diabetologia 1994;37:1280-6.
Burden ML, Woghiren O, Burden AC. Diabetes in African Caribbean, and Indo-Asian
ethnic minority people. Journal of the Royal College of Physicians of London Vol. 34 No. 4 July/August 2000: 343-346.
Burke, B.S., The dietary history as a tool in research. J. Am. Diet. Assoc. 23:°041-1046.
127

128
Burke, J.P., Williams, K, MS., Gaskill, S.P., Hazuda, H.P., Haffner, S.M., Stern, M.P.
Rapid Rise in the Incidence of Type 2 Diabetes from 1987 to 1996: Results from the San
Antonio Heart Study. Archives of internal Medicine, 1999, vol. 159;13:1450-1456.
Cade, J., Thompson, R., Burley, V., Warm, D. Development, validation and utilisation of
food-frequency questionnaires- a review. Public Health Nutrition, 2002, vol 54:4;567- 587.
Cappuccio, F.P., Cook, D.G., et al. Prevalence, detection, and management of
cardiovascular risk factors in different ethnic groups in south London. Heart
1997;169:555-563.
Carey, V.J., Walters, E.E., Colditz, G.A., Solomon, C.G., Willett, W.C., Rosner, B.A.,
Speizer, F.E., Manson, J.E. Body Fat distribution and risk of non-insulin-dependent diabetes mellitus in women: The Nurses Health Study. American Journal of
Epidemiology, 1997, vol. 145;7:614-619.
Caribbean Food and Nutrition Institute, Food Composition Tables: For use in the
English-speaking Caribbean, 2™ ed, CFNI press, Kingston, Jamaica, 1998.
Chale, S.S, Swai, ABM, Mujinja, PGM, McLarty, D.G. Must diabetes be a fatal disease
in Africa? Study of the costs of treatment. BJM, 1992; 304: 1215-8.
Colditz, G.A., Willett, W.C., Stampfer, M.J., Manson, J.E., Hennekens, C.H., Arky, R.A., Speizer, F.E. Weight as a risk factor for clinical diabetes in women. American journal of
Epidemiology, 1990, vol. 132;3:501-513.
Cooper, R., Rotimi, C.N., et al. Prevalence of NIDDM Among Populations of the African
Diaspora. Diab Care 1997;20(3):343-348.
Crapo P, Insel J, et al, Comparison of serum glucose, insulin and glucagons responses to
different types of complex carbohydrates in non-insulin-dependent diabetic patients. American Journal of Clinical Nutrition 1981;34: 184-190.
Crews, H., Alink, G., Anderson, R., Braesco, V., Holst, B., Maiani, G., Ovesen, L.,
Scotter, M., Solfrizzo, V., Van der Berg, R., Verhagen, H., Williamson, G. A Critical Assessment of some Biomarker approaches linked with dietary intake. British Journal of Nutrition, 2001, vol. 86: suppl 1; S5-S35.
Cruickshank JK, Cooper J, et al. Ethnic differences in fasting plasma C-peptide and insulin in relation to glucose tolerance and blood pressure. Lancet 1991;338:842-47.
Cruickshank, JK, Mbanya, JC, et al. Sick genes, sick individuals or sick populations with chronic disease? The emergence of diabetes and high blood pressure in African-origin populations. Inter. J. Epidemiology 2001;30:111-117.

129
Cruz-Vidal M, Costas R, Garcia-Palmieri MR, et al. Factors related to diabetes mellitus
in Puerto Rican men. Diabetes 1979; 28:300-307.
Dagogo-Jack S, Santiago JV. Pathophysiology of Type 2 Diabetics and Modes of Action of Therapeutic Interventions. Arch Int Med 1997 157;16:1802-17.
Daniel, Rosy. Healing Foods: How to nurture yourself and fight illness. Thorsons, 1996.
Delcourt, C., Cubeau, J., Balkau, B., Papoz, L., and the CODIAB-INSERM-ZENECA
Pharma Study Group. Limitations of the Correlation coefficient in the Validation of Diet Assessment Methods. Epidemiology 1994; 5: 518-524.
Ducorps, M., Baleynaud, S., et al. A prevalence Survey of Diabetes in Mauritania.
Diabetes Care 1996;169:761-763.
Dwyer, JT. Dietary Assessment. In: Shils ME, Olsen JA, Shike M, Ross AC, eds. Modern
nutrition in health and disease. Baltimore: Williams & Wilkins, 1999:937-59.
Everhart, J.E., Pettitt D.J., Bennett P.H., Knowler, W.C. Duration of obesity increases the
incidence of NIDDM. Diabetes 1992; 41: 235-40.
Fall, H.D., C. Non-industrialized countries and affluence. British Medical Bulletin,
2001;60:33-50.
Feskanich, D., Rimm, E.B., Giovannucci, E.L., Colditz, G.A., Stampfer, M.J., Litin, L.B.,
Willett, W.C. Reproducibility and validity of food intake measurements from a semi quantitative food frequency questionnaire. J Amer Diet Assoc 1993 93:790-96.
Froguel, P., Velho, G. Genetic determinants of Type 2 diabetes. Recent Prog. Horm. Res.2001; 56:91-105.
Groff, J.L., Gropper, $.S. Advanced Nutrition and Human Metabolism, 3" edition, Wadsworth, 1999.
Gulliford, M.C. Controlling non-insulin-dependent diabetes mellitus in developing
countries. Int J Epidemiology. 1995;24(Suppl1):S53-9.
Gulliford M.C. Epidemiological transition in Trinidad and Tobago, West Indies 1953- 1992. Int J Epidemiology.1996 25:2:357-365.
Gupta OP, Dave SH. Joshi MH. Prevalence of diabetes in India. In: Levine R, Luft R (eds) Advances in metabolic disorders, vol 9. Academic press, New York. 1978:13-28.
Haffner, S.M., Howard, G., et al., Insulin Sensitivity and Acute Insulin Response in
African-Americans, Non-Hispanic Whites, and Hispanics With NIDDM. Diabetes 1997;46;63-69.

130
Hankin, J-H., Yoshizawa, C.N., Kolonel, L.N. Reproducibility of a diet history in older
men in Hawaii. Nutr Cancer, 1990, vol. 13;3:129-40.
Harris $.B., Gittelson J., et al. The prevalence and associated risk factors in Native Canadians. Diab Care 1997 20;2:185-87.
Hayashi, T, Wojtaszewski, J.F.P., et al. Exercise regulation of glucose transport in
skeletal muscle. Am. J. Physiol. 273 (Endocrinol. Metab. 36); E1039-E1051, 1997.
Hegele, R.A. Lessons from Genetic Studies in Native Canadian Populations. Nutrition
Reviews May 1999;57(no. 5, supp! II):S43-S50.
Hegele, R.A., Ban, M.R., et al. Lipoprotein-Genotype Associations in Trinidadian
Neonates. Clinical Biochemistry 1999;32:429-37.
Holler, Harold, Pastore, Joyce-Green. Diabetes Medical Nutrition Therapy. The
American Dietetic Association/American Diabetes Association, 1997.
Hu, F.B., Rimm, E., Smith-Warner, SA., Feskanich, D., Stampfer, MJ., Ascherio, A.,
Sampson, L., Willett, WC. Reproducibility and validity of dietary patterns assessed with
a food-frequency questionnaire. The American journal of Clinical Nutrition, 1999, vol. 69: 2: 243-249,
Hu, F.B., Sigal, R.J., Rich-Edwards, J.W., Colditz, G.A., Solomom, C.G., Willett, W.C.,
Speizer, F.E., Manson, J.E. Walking compared with vigorous physical activity and risk of Type 2 diabetes in women. JAMA, OCT 20, 1000 282; 15: 1433-39.
Hunter, D.J., Sampson, L., Stampfer, M.J., Colditz, G.A., Rosner, B., Willett, W.C. Variability in portion sizes of commonly consumed foods among a population of women
in the United States. American Journal of Epidemiology, 1988, vol 127:6;1240-1249.
Indar PB, Ramesar DB, Bissessar 8S. Naparima Girls’ High School Diamond Jubilee 1912-1987: Trinidad & Tobago Recipes. Naparima Girls’ High School, 1988.
Jain, M., Howe, G.R., et al. Evaluation of a Diet History Questionnaire for Epidemiologic Studies. Am J Epidemiology 1980;111(2):212-219.
Jain, M., McLaughlin, J. Validity of Nutrient Estimates by Food Frequency
Questionnaires Based Either on Exact Frequencies or Categories. Annals of Epidemiology, 2000;10:354-360.
Jenkins, D.J.A., Jenkins, A.L., et al. Low glycemic index:lente carbohydrates and
Physiological effects of altered food frequency. Am J Clin Nutr 1994;59(suppl):706S-9S.
Jenkins, D.J.A., Josse, R.G., et al. Implications of altering the rate of carbohydrate absorption from the gastrointestinal tract. Clin Invest Med 1995;18(4):269-302.

131
Jenkins D.J.A., Wolever, T.M.S., et al. Effect on blood lipids of very high intakes of fibre
in diets low in saturated fat and cholesterol. New Eng J Med 1993;329:21-6.
Jenkins D.J.A., Wolever T.M.S., et al. Low-glycemic index diet in hyperlipidemia:use of traditional starchy foods. Am J Clin Nutr 1987;46:66-71.
Jenkins, D.J.A., Wolever, T.M.S., et al. Low-glycemic-index starchy foods in the diabetic diet. Am J Clin Nutr 1988;48:248-54.
Jenkins, D.J.A., Popovich, D.G., et al. Metabolic Effects of Non-absorbable
Carbohydrates. Scand J Gastroenterol 1997;32 (suppl. 222):10-13.
Jovanovic L, Peterson C. Nutrition and Diabetes. Alan R. liss Inc., 1985.
Kaaks, R.J. Biochemical markers as additional measurements in studies of the accuracy
of dietary questionnaire measurements: conceptual issues. Am. J. Clin. Nutr, 1997
Apr;65(4 suppl):123S-1239S.
Karter, A.J., Mayer-Davis, E.J., et al. Insulin Sensitivity and Abdominal Obesity in
African-American, Hispanic, and Non-Hispanic White Men and Women. Diabetes
1996;45:1547-1555.
King, H., Aubert, R.E., Herman, W.H. Global Burden of Diabetes, 1995-2025:
prevalence, numerical estimates, and projections. Diabetes Care, 1998: 21: 1414-1431.
Krebs-Smith, S.M. Heimendinger, J., Subar, A F., Patterson, B.H., Pivonka, E. Estimating fruit and vegetable intake using food frequency questionnaires: a comparison
of instruments. Am. J. Clin. Nutr. 1994;59:283S.
Kristal, A.R., Feng, Z., Coates, R.J., Oberman, A., George, V. Associations of Race/Ethnicity, Education, and Dietary Intervention with the Validity and Reliability of a
Food Frequency Questionnaire. American Journal of Epidemiology, 1997, vol. 146:10;856-869.
Lilienfeld, D.E., Stolley, P.D. Foundations of Epidemiology, 3™ ed. 1994, Oxford University Press, New York.
Lindsay, R.S., Bennett, P.H. Type 2 diabetes, the thrifty phenotype- an overview. British Medical Bulletin 2001; 60:21-32.
Liu, S., Manson, J.E., et al. Dietary glycemic load assessed by food-frequency
questionnaire in relation to plasma high-density-lipoprotein cholesterol and fasting
plasma triacylglycerols in postmenopausal women. Am J Clin Nutr 2001;73:560-6.

132
Ludwig, D.S. The Glycemic Index: Physiological Mechanisms Relating to Obesity,
Diabetes, and Cardiovascular Disease. JAMA, 2002, vol 287318: 2414-2423
Mann, J.I. The Role of Nutritional Modifications in the Prevention of Macro vascular Complications of Diabetes. Diabetes 1997;46 suppl. 2: $125-29.
Manson, J.E., Spelsberg, A. Primary prevention of non-insulin-dependent diabetes
mellitus. Am J Prev Med 1994 10;3:172-84.
Marshall, J.A., Hoag, S., et al. Dietary Fat Predicts Conversion From Impaired Glucose
Tolerance to NIDDM. Diab Care 1994;17(1):50-56.
Mayer-Davis, E.J., Vitolins, M.Z., et al. Validity and Reproducibility of a Food
Frequency Interview in a Multi-Cultural Epidemiologic Study. Ann Epidemiol 1999;9:314-24.
Mbanya, J.C.N., Cruickshank, J.K., et al. Standardized Comparison of Glucose
Intolerance in West African-Origin Populations of Rural and Urban Cameroon, Jamaica,
and Caribbean Migrants to Britain. Diab Care 1999;169:434-440.
Mbanya J.C.N., Ngogang, J., et al. Prevalence of NIDDM and impaired glucose
tolerance in a rural and an urban population in Cameroon. Diabetologia 1997; 40:824- 829.
McCarthy, M. Susceptibility gene discovery for common metabolic and endocrine traits.
Journal of Molecular Endocrinology 2002 28, 1-17.
McKeigue, P.M., Marmot, M.G., et al. Diabetes, hyperinsulinaemia, and coronary risk factors in Bangladeshis in East London. Br heart J 1998;60:390-6.
McLarty M. Exploiting complementary therapeutic strategies for the treatment of type 2 diabetes and prevention of its complications. Med Hyp 1997;49:143-52.
Mennen, L.I., Jackson, M., Cade, J., Mbanya, J.C., Lafay, L., Sharma, S., Walker, S.,
Chungong, S., Wilks, R., Balkau, B., Forrester, T., Cruickshank, J.K. Underreporting of
energy intake in four populations of African origin. International Journal of Obesity, 2000, vol. 24; 882-887.
Mennen L.I., Jackson, M., Sharma, S., Mbanya, J.C., Cade, J., Walker, S., Riste, M.L.,
Wilks, R., Forrester, T., Balkau, B., Cruickshank, K. Habitual diet in four populations of
African origin: a descriptive paper on nutrient intakes in rural and urban Cameroon,
Jamaica and Caribbean migrants in Britain. Public Health Nutrition, 2001, vol 4;3:765- 772.
Miller, G.J., Kirkwood, B.R., Beckles, G.L.A., et al. Adult male all-cause,
Cardiovascular and Cerebrovascular mortality in relation to ethnic group, systolic blood

133
pressure and blood glucose concentration in Trinidad, West Indies. Int J Epidemiology 1988 175;1:62-69.
Mogenson, C.E., Phillipe, P. The Changing Lifestyle in the World: Body weight and what
else? Diab Care 2000;23 (suppl 2);B1-4.
Moore, D.S., McCabe, G.P. Introduction to the Practise of Statistics, 3" ed. 1999, W.H.
Freeman and Company, New York.
Pan, X.R., Cao, H.B., Li, G.W. Effects of diet and exercise in preventing NIDDM in
people with impaired glucose tolerance; the Da Qing IGT Diabetes Study. Diabetes Care
1997; 20: 537-44.
Pearson, E.R., Hattersley, A.T. Diabetes: unrevelling the heterogeneity of non insulin dependent diabetes. Journal of the Royal College of Physicians of London, 2000, vol.
34:4:332-346.
Pennington, J. Food values of portions commonly used, 15" ed. Harper & Row, New York, NY, 1989.
Perry, I.J., Wannamethee, S.G., et al. Prospective study of risk factors for development of non-insulin dependent diabetes in middle-aged British men. BMJ. 1995;310:560-564.
Pickup, J.C., Williams, G. Textbook of Diabetes. Blackwell Scientific Publications, 1991.
Vol. 2.
Poon-King, T., Henry, M.V., Rampersad, F. Prevalence and natural history of diabetes in Trinidad. The Lancet January 27 1968;155-160.
Ramachandran, A., Snehalatha, C., et al. Rising prevalence of NIDDM in an urban
population in India. Diabetologia 1997;40:232-237.
Ramachandran, A., Snehalatha, C., et al., Risk of noninsulin dependent diabetes mellitus conferred by obesity and central adiposity in different ethnic groups: A comparative
analysis between Asian Indians, Mexican Americans and Whites. Diabetes Research and Clinical Practice 1997;36:121-125.
Rifkin, H., Porte, Jr. D. Ellenberg and Rifkin’s Diabetes Mellitus: Theory and Practice. Elsevier, 1990. Revised 3" edition.
Rimm, E.B., Giovannucci, E.L., Stampfer, M.J. et al. Reproducibility and validity of an expanded self-administered semi quantitative food frequency questionnaire among male health professionals, Amer J Epidemiology 1992 135:1114-1126.
Rosenbloom, A.L., Joe, J.R., et al. Emerging Epidemic of Type 2 Diabetes in Youth. Diab Care 1999;22:345-354.

134
Salmeron, J., Ascherio, A., et al. Dietary Fiber, Glycemic Load, and Risk of NIDDM in
Men. Diab Care 1997;20(4):545-550.
Salmeron, J., Manson, J.E., et al. Dietary Fiber, Glycemic Load, and Risk of Non-insulin-
dependent Diabetes Mellitus in Women. JAMA, Feb 12, 1997;277(6):472-477.
Salvini, S., Hunter, D.J., Sampson, L., Stampfer et al., Food-based validation of a dietary questionnaire: the effects of week-to-week variation in food consumption. Inter J Epidemiology 1989 18:858-867.
Seidell, J.C. Obesity, insulin resistance and diabetes- a worldwide epidemic. BR J. of
Nutr 2000, 83, Suppl1, S5-8.
Shah M, Garg A. High-Fat and High-carbohydrate Diets and Energy balance. Diab Care
1996 19:10:1142-50.
Sinha, D.P. Changing Patterns of Food, Nutrition and Health in the Caribbean. Nutrition Research 1995;15(6):899-938.
Subar, A.F., Thompson, F.E., Kipnis, V., Midthune, D., Hurwitz, M.P., McNutt, S., MclIntosh, A., Rosenfeld, S. Comparative Validation of the Block, Willett, and National Cancer Institute Food Frequency Questionnaires. American Journal of Epidemiology, 2001, vol. 154;12:1089-1099.
Teufel, N.I. Development of culturally competent food-frequency questionnaires. Am J
Clin Nutr 1997;65(suppl):1173S-8S.
Thompson, F.E., Byers, T. Dietary Assessment Resource Manual. American Institute of
Nutrition. J. Nutr. 1994;124(suppl):2245S-23178.
Thompson, F.E., Moler, J.E. Register of Dietary assessment calibration-validation studies: a status report. Am J Clin Nutr 1997;65(suppl):1142S-7S.
Trout, D.L., Behall, K.M., Osilesi, O. Prediction of glycemic index for starchy foods. American Journal of Clinical Nutrition, 1993, vol. 58:873-878.
Tsunehara, C.H., Leonetti, D.L., et al. Diet of second-generation Japanese-American men with and without non-insulin-dependent diabetes. Am J Clin Nutr 1990;52:731-8.
Tudor-Locke, C.E., Bell, R.C., et al. Revisiting the Role of Physical Activity and Exercise in the Treatment of Type 2 Diabetes. Can. J. App]. Physiol. 2000 256:466-91.
Van Beresteyn, E.C., Van’t Hof, M.A., Van Der Haiden-Winkeldermaat, H.J., Ten Have-
Witjes, A., Neeter, R. Evaluation of the usefulness of the cross-check dietary history method in longitudinal studies. J. Chronic Dis. 40:1051-1058.

135
Vanhala, M., Vanhala, P., Kumpusalo, E., Halonen, P., Takala, J. Relation between
obesity from childhood to adulthood and the metabolic syndrome: population based
study. BMJ. 1998; 317: 319.
Wahlavist, M.L. Nutrition and Diabetes. Austr Fam Phys 1997 26;4:384-90.
Wei, M., Schwertner, H.A., The Association Between Physical Activity, Physical Fitness,
and Type 2 Diabetes Mellitus. Comp Ther 2000 6;30:176-182.
Wild, C.P., Anderson, C., O’Brien, N.M., Wilson, L., Woods, J.A. A critical evaluation
of the application of biomarkers in epidemiological studies on diet and health. Br. J. of
Nutr. 2001; British Journal of Nutrition, 2001, vol. 86: suppl 1;S37-S53.
Willet, Walter. Nutritional Epidemiology 2" edition. Oxford Univ. press, 1998; 86suppl1:1-29.
Willett, W.C., Sampson, L., Stampfer, M.J., et al. Reproducibility and validity of a semi
quantitative food frequency questionnaire. Amer J Epidemiology 1985 122:51-65.
Wolever, T.M., Hamad, S., et al. Low dietary fibre and high protein intakes associated with newly diagnosed diabetes in a remote aboriginal community. Amer J Clin Nutr 1997
66;6:1470-74.
Wolever, T.M.S., Isaacs, R.L.C., et al. Lower Diet Glycemic Index in African than South Asian Men Abstract, 2000.
Wolever, T.M.S, Jenkins, D.J.A., et al. Beneficial effect of low-glycemic index diet in
overweight NIDDM subjects. Diab care 1992 15;4:562-4.
Wolever, T.M.S., Jenkins, D.J.A., et al. Beneficial Effect of a Low Glycemic Index Diet in Type 2 Diabetes. Diab Med 1992;9:451-8.
Wolever, T.M.S., Jenkins, D.J.A., et al. Metabolic Effects of a Low-Glycemic-Index Diet. Am Soc Clin Nutr 1987;46:968-75.
Wolever, T.M.S., Miller, J.B. Sugars and blood glucose control. AM J Clin Nutr 1995;62(suppl):212S-27S.
World Health Organization; World Health Report 1999, Chapter 2: The Double Burden;
Emerging Epidemics and Persistent Problems. http://www.who.int/whr/2001/1999/en/index.htm.
Wursch, P., Pi-Sunyer, F.X. The Role of Viscous Soluble Fibre in Metabolic Control of Diabetes- A review with special emphasis on cereals rich in B-glucan. Diab Care 1997 203;11:1774-80.

136
Zar, J.H. Biostatistical Analysis, 2" ed. Prentice Hall, Englewood Cliffs, N.J., 1984.
Zimmet, P. The pathogenesis and prevention of diabetes in adults. Diab care 1995 18;7:1050-60.
Zimmet, P. Type 2 (Non-Insulin-Dependent) Diabetes: An epidemiological overview.
Diabetologia 1982;22:399-411.

APPENDIX A
Descriptions of Various Validation Studies and their findings
137

138
soosanyea-d ‘¢O<d
[]@ 10 |
“(rorIea
sik p-¢) 14
| ‘potted soudiayay
“1a0uRs
*2) UMUILIIA IOJ
790 0} paye[ar
syuOLNU UO
0} ayerpAyoqres
snooj ‘popreut
‘suoriod "(OS
[=u) sre0A
‘(oyeIpAYORIEd IO}
[9'9 0}
[2}0} 1OF
‘spr0sey 391
pede piepurys
‘soti0saye9 €9-6¢
‘sosInU | (R861)
“Te
UOH JOF
8770) OS
O= URI |
pro ‘ES°0
= UO
‘steak p-¢ |
Aep / JO
s}os Moy
sieok ¢ ‘SOA
7Z osuodsal
6 ‘SUIS}I
OTT poraystSer
“S'¢) | 19
NOTTEM
‘yrede | “JA
[| ‘potted
souarayay “(Apnys
AjIptrea
SYJUOUI XIS
SCOT “POO}
Youd IOJ
sazis | JO}
QO6{=U) ‘(Apmus
‘syjyuou |
7 :Apms
uoneple,
uonijod ¢-7
SurAjioods Ayyiqronpordex
“(ey poyernjesunAjod
soy 9 UnIM
ATUOAA ‘sTBAIOJUT
YUOUL sojoyd
ZZ] TIM
JOY [Z[=U)
OL'O 01
JeJ payernesunouows
| ‘[OYOoTe
1OJ Bg'O
0} pooeds
spiosoy |
-¢ 1@
SOdA € -Apms
yopjoog aimjord
ased ‘TyaIspaH
‘sid 69 |
(8861) “Te
JO} yh'0)
19° O=—UReW |
Vv UlWURIIA
Joy 9¢°0
syyuour g-T |
01
Aep-7 aapom
Ayiqronpoidoy ~€9
“SUISH POoj
E47 | -¢¢
‘Wot YstUUTY |
Jo UUeld
“poyrey "(L7=U)
uosog “poyoyduos
foeyUT JUOLNU
sassy ‘uotssayoid
Yq Jaye
‘suoysenb popus-uado
2p woyeonpa
SYJWOU QT
‘sotlosayeo Aouonbaly
6 Ul
SURI OpIA
6p O=Weoul “Tato
poroysturmape ‘s]TUN
WOUMLOD UI
sozIs | ‘sIeak
ps-Oz pose |
(L861) “Te
09° 0=WeeUr “Udy
VN Odd
AC
Suoj-1e9k |
OAL 1
uoniod ‘ suioyI—
9 [ |
Uoulom pue
usp |
39 HOTTA
"PoTIeU fsoyRIUT
JUSTIN o1yroads
ssosse 0}
posn ‘(€LT=0)
Sd
BY OAT
puc HOOMIOG
‘soriosaye0 Aouonbay
uojsog ‘Apns
sjusurayddns YIM
> UTUTeYIA |
“aSOIONS IO}
[/"Q OF
6 ‘sezis
UoT)od [emnyeu
Wyesy ,Sasmmnyy
10J $10
0} ‘stuauretddns
“(syuourayddns ou)
‘yrede “sp1099y
191d "yrede
‘resns 29
uelq poppe
O861 Wo
6S |
(S861) “Te
OU YW
UMUEIIA 10}
96° |
«YW UNWYIA IO}
GY'C) syyuou
p-z |
Aep-/ Jo
sos mo
feat | ‘SOJT Z
ex Jo
sodAy ‘suiayi-[9
| -pE
pose usmoA,
| 49
HOTTA
‘ajqissod poyjour
d1oM UDAIS
(aSsueI pu)
(2[qeorjdde 51)
uostedui0s “sUOTJeSTUTUIpe
ues]
‘poyjowl uosuedwi0s
| =
s?),F,7 UsaMjaq
pue WddM4OqQ
[PAIO}UL
pue sOja
woomyag (1)
(4) squatoyja0os
=| OA
usemjoq poulseyl
ap SUOTIeIISIUTLEpE
(u)
SJUSTOL{JIO UOT
RISO
| Ayyiqronposday
[eAIOJUT uoslieduio7
Oda JO
ON
usisog OFA
uojeindog Apms
"SSUIPUL 119q)
PUL SIIPNAS
UOHEpYyeA SNOLIVA
Jo suoHdLIDsaq
T-V 94281

So'‘OSenyea-d “QC O<d
[Te 10g
,
a Sal ce
‘orreumolsonb
OJUI poyerodroour
a13M
“sp10del JoIp
sozis uoljiod
¢ Surmoys
JO JOOM
ab sojoy
‘ouajore-ejoq 299 |
«= -(79Z=U)
Teme
"JOIDISATOY IOF
Jaye SyJWOUT
“pede >
‘V ‘SIIA
Jorajsajoyo |
jo sdnoid
ormjo 19°0
0} V
WUeIIA IOJ
Qy'C 9 porojsturupe
syuUOW ¢
‘spr0sar yey
‘urajo1d Jo Jofeu
¢ wo
1661 “Te
Woy
asuer ‘dnosd
[e}0} 10,4
VN |
oleuuoTson?) yorp
Aep Lp
woyeystimupe [ |
seomos Jofew
‘suo /p |
Usuiom pure
us |
30 ULyURE “syJuOUL
¢ snoTASId
"(Qey WOT soLopes
“YW UMURIA
IOF ‘poriod
souarajay
% OF
Z79'Y 01 D
UMURITA | C/'Q
0} UIMTOTeD IOy
“ede ‘roynduros
oyuT ‘(oS=0)
sympe | (Q66T)
“Te JO}
910) py'O
= BROW |
€S'0 ‘09'0
= ROT
syyuow Z-] |
sprossy yorq
Aep 7
quuoul | SOAA
Z | pezeyuo—
jfas “sumoy
OZT pues]
SuoT yo osu
“SYyOUL € snotAaid
‘potied
*(jorajsotoyo “UINIPOS
JOJ 7/9
SoUsIAaJoY “WoIpyTyo
‘($g=u)
IO} ZOO
0} Wnissejod | 0}
syerpAYores Joy
yede |
jooyosaid Jo
jorp yensn |
wospyryo jooyosoid |
(Q66T) “Te
IO} OV'0)
8r'0 = URI |
«TPO ‘790
= UROL
Yoo
| [le981
INoY 7Z
Yoo
T SOTA
Z SSaSse
O} ‘SUIOIE
TTT jo
syuoreg |
40 JoqIory, ‘OsUel
“SUJUOUT 9
|Sv] UO
LOda1 ‘(g¢[=u)
9°0 01
$'0 OY)
UI suOTRIAIIOD
0} payse qo
“9Ip dnox3
Jorp SOI
“JeJ WO
SaLIOTLO ef
MOT B UO
sjoofqns | 3ejJ-MoT
‘(ZO [=U) Jo
yuooiad Io;
syq pue
ssasse 0}
posn OAT |
dnoss-jerp Tensp)
Odd Beemjoq
69 Q—uRSUL septs
‘suet 6
(4) | *(097=4)
-Apms :dnOIS
JOTp 1eJ-MOT
IOF “ey
‘Odd o1p
Tensn e
uo sjoofqns
AyIqiseo,y [RU],
WOT
SOLOTLO Jo
yusoI10d Oy
jo WOTeNsTUTUpe
0} sosse
01 ‘Odd
, DOTA, |
WHeoH S,usw0
My (90661)
SUC pue
OT wsenjsq
19°09 ‘eok |
soLid sp100ayy
191 “Od yors
poljipour ‘sway
96 |
4) UIOIZ
siKok O/
“Te =
ueoul :dnoss
jorp yensn
10,7 VN |
[To syuours
| Aep
pjo sys
som, |
Jo uoHeNsMMuUpe
| | (e)
:sOJq WoIOIp
omy, |
-cp pase
uowl0 py, 32 Soolg
“PoyLeUL “SoyBIUT
POOy ‘(€LI=0)
olfloads ssosse
0} pasn
mo\sog ‘Apr
‘Odd pac
PUL SY Uaemjaq
LS'Q =ueour
‘souiosayeo Aouenbary
Tyee
,SesmnN
99 0=URA
‘Odd 1
pue £199q
IO} €6'0
0} ‘yrede
“Sp1099y 191
‘yrede 6
‘sozis uoy1od
|
Qg6] Woy
sik 6S
|} (6861)
“Te
SY
wsomjoq ¢oQ=
uesyy |
Yound yny
10} p79
syjuou¢g |
Aep-/ Jo
sjas oy
reok | SOAITZ
plepuejs ‘suazI-[9
| -pe
pase Usutony |
49
TuTATeS ‘aT qIssod
poujoul
oJ0YM USAT
(adel pur)
(2[qevordde 51)
uostieduroo ‘suoleNsIUIUIpe
Ueay] ‘Poyjeur
uostieduios |
sq
useMmjoq pue
Wa9MjOq [BAIOJUI
pue sCjq
waeasjaq (1)
(1) syuatoyjooo
§=| Oy
waemjoq poueyy
3? suoTe.ysTUIUpeE
(u) SJUSTOTYJIOS
UONVIOLIO[) | Ayypiqronposdayy
[eAroqyUuy uostredu07)
OI JOON
usisog O4d
uoljeindog Apms
V xipueddy

140
Soosonyea-d “Og O<d
[1? 104
,
*(ouLeSIeuL ‘sopLieysoesouoUl
YOs OJ
Y°Q pue
sptoe Aney
JO} 130
9-N [?}0}
1OF OL'0
0} syeour
0} (syuoureyddns
‘reoX snoraaid
‘porrod (9661)
UeBIO JOJ
£¢°9 ‘OUTWUEIU)
| =) oT}
Joy yede |
s0ualajoy ‘sazis
uoyiod (ZS T=")
“Te 39
JO} p70)
Z9'0 ‘S50
=UROW 6¢'0
°89°0 =URsA
syjuoUI ¢ |
sploosy joI
Aep /
syjuOW € SOAT
Z prepueys
‘sway! OTT
USWIOM YSU
| OSTuUeIA
‘reah snoracid
"(pg=u)
‘(joIajsapoyo ‘[OIOISOTOYD
1OF “syyuoUr
‘poriod souslayay
‘posn BIULLUSE
|, WOY (S661)
JO} 6P'9
0} UIa}0I1d | 6'C
03 WIA}0Id Joy
[eIoAes spIooa1
‘yrede syjuou
sozis uoysod
prepueys SOJOQeIP
WII prezzitq
JOoJ €Z'0)
Tr'0 = BROW |
LS'0 ‘89°90
= UROW 0} Aep
T Areyrp
poysta
0@-L ‘SOAA
TZ Jo
sojoyd ‘suroyt
egy | uowom
pue uay] |
pue Airy
‘pepe | =
“(LZ [=0) uojsog
‘satiosayeo Aouonboy
|
‘Apmis dn-mojjoq
*( soSeviaacq
6 ‘SOUINOA
pue s}ySIOM
s[eUOIssazoIg (€661)
IOJ L/'0
0} SaTqejasaa
‘yaede Sp1osoy
191 ‘yrede
prepurjs 10
suoniod |
yyeoy] Wo sea
“Te 49
IO} 9F'0)
€9°0=URO
69 0=UPSTA syjuout
g-9 | Aep-/
Jo sjos
OMT, reok
| ‘SOAT
7 [emmeu
‘sumay-TET |
SL-Op pose
safe] | Yorueysoy
‘Odd ‘OSA
paZ PUB
SUC W99MNY}0q
puc PUe
Yd TOYooTe
IOF [60
OV
se] 27
OFT UMULILA
10} yO
‘SOAA oq
"Joyoore sl
Pur Ud
“yede syjuour
‘poyioda jou
sozis ‘(Lp1=") |
(€66T) “Te
pure syq
wse9MjOq [OYOO[e
IOF IO}
YOO 0} 10}
js WOOMIOq
€ Splosay
JIG ‘yede
woriod ‘parzoysrurmupe
ureds ‘sreah |
39 ousIoyy
88°0 9}
V UNUEIIA
IOJ O70
poyeinges 10F
19°0 skep
Sp | Aep—pjosjos
moj |
reok { ‘SOA
OMT FIPS
‘OAT WOH
-8TT pL-81
“TOMO
“Ue
“poyrew ‘suoysonb
pepus-uedo Auew
*(syuoutayddns ‘sollosayeo
Aouonboy ‘(LZ[ =a)
wo\sog
‘$90 <UROW
TIM) Od
6 ‘sozis
uonjod |
‘Apms dn-mojjoq
6S O=uRsy] ‘syusutetddns |
UMUTERLA IOJ
93"0 01
permmen ‘OTA
S861 s[euolssayorg
TBIM 2D
UMU}ITA IoJ
98°C 0}
(syuswa[ddns ou)
"yrede “Sp10s9y
191 yede
| “je
30 HOTTA JO
UoTsIoa | Wea Woy
sreak | (7661)
“Te
syaouro[ddns ou
wom 10}
97° |
A UEUeIIA
IO} /F'0
syquou /-9
| Aep-1
Jo sjos
OM], weak
| ‘SOAITZ
popuedxo ‘surayi-] ¢]
SL-Or pose
uo
39 VOUT
‘sIqissod poyjour
OOM
UDAIS (SUB
pur) (atqeordde
51) uostiedwoo
"sUOTJeSTUILUpe uUBvoJ]
‘PoUjJsU! UosLIedutOD
SOAT Wo99M40q
pue Wa9M10q
[PAIO]UL
pue sO
wsemjaq (4)
(2) syuotoyjooo
=| OW
usemjoq pool
3 suolyeysiuupe
(u) SJUSLOYJI09
WONe[a1107) | Ayypiqionposday
[eA1O}Uy uosteduios)
Odd JO
ON
ustsoq OAA
uorendog
Apms
Vv xipuoddy

So'osonjea-d “Q¢'Q<i
[Ie Joy ,
—
+ ci
‘orp Tensn
‘ported "(C2 UTR
ITA Oy
“syyuoul souarayoy
‘sojoyd *(JOIQ\S9TOYD
10¥ 09°
| FLO
0} Uta}01d
Joy [eI9A0s
‘yrede rea
| ‘o01m}
| «=
ozis uonod YIM
auIOs ‘UstIOM
pue (L661)
01 38} IOF
[€"0) Sp'O
= UPA |
LEO) 19°0
= BRO
0} WyuoUT |
TTese1 INOY-77
paraysturupy | “suta}l
pooj Io
soysip Lr
uo UeT] eT
“Te 39
raestd “Oey
"(S9=u) [e10}
pue Ajod
‘ouout 10}
68°0 *(soyerpAyoqies
‘A10jsIY YOIp
SIOYIOM
‘syonpoid ATep
1840 IOJ
060 1OF
730 oyIng
wo
padojaasp yedtoranur
(91661)
0} [PUT}OI
10} 970
‘sauINss] 0}
[OIA}STOYD oJ
"rea “yrede
Teak |
‘a01M} ‘omreuuonsanb
pure jeyidsoy
utedg jo
IO} y1'0)
TL'0 99'0
= UROW |
FTO) LS
= UeON
To} quo
J [[e9er1
INOY-FC pereysturupy
Aroysty 391d
ystuedg | dnoip
Oda
"(JOIO}saTOYO
‘(uot ut
snioydsoyd 10}
IOJ SL'0
“(O8=0)
€L'0 O}
WOLUOM UI
OUAJOIBD |
0} BTD}0TRD
v}9q IO}
‘yaede IeoX
snotaaid ‘pored
sioqoea} |
(4661) “Te
198
-e19q JO}
['0) Tp =UeIW
| «47Z'0)
95'0 = UROL
YUOUL |
[[@0er moy-pZ
reok | SOAAZ
QOUDIAFOY “SUIT
OG] JOoyds
YaeH |
TuueAnos}ey *(soyerpAyoqses
Joy “(ayerpAyoqies
94'0 ‘sionpoud pra
10F GL"0 IO} 68'0
‘(IZ1=¥) O}
[CUTJAI JO}
67'Q ‘SoTqejeSoa
0} FY UMULILA
JOT "yrede
syyuout ‘IeaX
snotsaid ‘potied
usTIOM (®661)
JO} 1€'0)
6S'0 ‘SS'0=
BRA |
940) 1L'0
= BROW
qyuoul |
[Jeser INOY-p7
71-9 ‘SOdA
7 sousrsjoy
“SUIS £/
| pue
Weur Yond
“Te 19
9490 ‘IeoA
snoraoid
‘porsod souarajoy
‘sojoyd Aq
poyeunse
*(9ua}01e9-eI]A9q IOF
*C) UTWURTTA SOZIS
UOIIOg “Spooy
‘(61 T=u) 18°0
‘Spooj Altep
Io} 49°90
01 | pure
sprtdiy Ioj
¢7°0 [enpratpur
Aq outos
sooAoyduis
[eUNdI JO}
670 ‘SOySTp
poxtw 0}
4 UIUTE]IA
IOy ‘pede
pue yeou
Aq podnoid
[eudsoy (4661)
“Te
JO} 710)
650 ‘vh'0
= UREA |
_49°0 99'0
= URS
quow
T [Tese1
MoYy-7 qeok
| ‘SOdA
TZ SUIOS
YM
SUIS YET
youely |
je eer]
Ue A
‘aI qissod poyjour
d19YM USATS
(asueI pur)
(atqeordde Jt)
wostedui0s "SUOTIBIISTUTLUpe
Uva
‘poyjow uostedu0s | =
sf).J.J UsaAyoq
pue Ud9MjOq
[BAIOJUL
pue sOdq
waemjeq (1)
(4) syustoyya09
=| OA
uaemjeq poyiey
a suoyeystunupe
(u) SJUSTOTJFOOS
UOTIE[ALIOD) | Ayliqionpoiday
[eAIO}UT uostedulo7
OAM JO
‘ON usisog
OAT uonerndog
Apris
V xipuoddy

(dy) sueopeury
west y
(AAHN) soit
ormedstH-uoN,
QI x
coosenqea-d ‘Qg-O<t [Te 104 ,
“Spooj [eUOTsaI
“(SMHN
29 oT} opnpout
29 soraedstp}) 0}
alreuuoysanb “did
jemny °(s, A
HN
“sormedsty 10}
[0 “yede
ArO\sTH pur
syqeH | = S.qV)
“dis ueqiy, pue
‘s,.TV 10}
0S'0 ‘S. M
HN
‘sdnorsqns SIBoA
p 0}
Z Weay onyysuy
‘(981=@) Apnis
[emu I0F
19°0 ‘SS M
HN
IO} JOyIp
jou pip
"yrede 19
‘syjeoor Arejorp |
‘suonesturupe joour)
yeuoyen |
syvylemyno-ninw |
(6661) “Te
19
ueqin Ioj
799 = URa|
| pue
‘ 79°—9 = URAy
[ 01 W
uow
|, | moy-p~Z
Fo sjas
g Z
oY} WOT PoyIpoy|
ay) WO Uso
| = sTAeq-JoAR
“payjorua a1om
Ioredoid
“s][eoor JOIp
poo} ayeuray
pure IMoy-yZ
pur uoneNstuupe
“gore Aprys
ou) Ployasnoy
jo proy
OAA pad
94} Woamgog
ur Adams
joxeU pue |
s[eur oy}
‘erpuy yNoS
SS'(0 pur
‘s][edeI JoIp
INoY asn
Poo} UO
poseq R[eIOy
Jo soseypia
-p7 pue
uoyeystunupe OAT
‘yrede “sTTB001
‘yrede 19K
| ‘Ox
porlaisturupe [ein
Ul spjoyasnoy
(8661) js]
W9OMI0q CG")
= URI]
pouiodal 10N
syyuow 7—
[| | Areyaip
moy-pz g |
suowensrarupe Z |
-IOMOTAIOJUT WORT
- 1g Og Jo
yorauy |
“Te jo
weqoyH
pepreur ‘gsodipe
AC
Ise] Joye
‘soriosaye9 Aouanboy
3 Ox wsemyoq
uoytsodu09
uaye) sorsdorq
6 ‘uotj1od
souarayor plore
orua[oul]-10 2>
yey snosurynoqns
0} poredutoo
‘(pg 1=")
ploe SI9TOUT]
“WAN
[2}0} Joy
‘sploooy sozis
uonjod WapemMsg
wo
sié 69°0
SURAT
‘Ss Iq
pue O4F
puede yotq
Aep SOHCJUT
JJ S,TLIA-]
LL-OF pose
“WsWIOM (8661)
m98MI9q TSO
‘OP O=—URII VN
SYJUOUL p-¢
-L Jo sjas
Moy |
wonensammpe [|
ye poyoorp ‘suiazI-gg
jo ojdures
wiopury “Te
419 JOM
“OSA put
94} JO}
sorouonbay "(yey
“Aepanes vondumnsuos
pooy
poyermes 10J
$70 ‘peor
oy *(jorajseToyo
Io kept]
J001J09 0}
pasn sem
‘(pOT=0) LL‘0
01 38} poyerryesundjod
IOF 69'0
01 UO
U9}e9 STROUT
‘yrede syjuou
g | oieuuonsonb
yoys Aueduioo
aouemsut ‘(QL661)
IO} Cp'O
‘Sapqejasaa | soprreyooesAjod
Joy opnpour
jou piq |
‘suoyexstummpe | ‘IesA
snotaoid ‘poued |
yeay e Woy
usui0om | “Te
Jo SeIOILT,
10} 8h'0)
09'0 ‘09'0
= URW |
LEO) €9'0
= URE
qwuoul |
Te9er IROY-PC
C | SOUSIOFOY
“SUSU BCT
pue USul
WeULtof) “Prsyos[yod
“o]qissod poyjour
SUOT]eSIUILUIpeE dIOYM
USATS (o8ueI
pure) (a,qeordde
jr) uostreduros
us0m30q uUvsP
‘poyjow uostIedulc]S
SO us0mj0q,
pue [CAIOJUL
2
pue sO,
ueemyjaq (1)
(1) syuatoyjaoo =|
Oy
usemjoq pouyoyw
suOTeSTUIUIpE (u)
SJUSTOIJJIO9 UOT
L[SHOD) |
Ayliqronpoidayy [PAIO}UT
uostedui07) Odd JOON
usisog OAT
uoneindog Apmg
V xipuoddy

143
So‘osontea-d ‘Og
Q<i [Je
104 |
“Ajaaqoodsal [¢°9
pue 19°0
‘Ord OG}
Joy 1S9q
Q10M [OPOU
peLy oy}
WOIy
SUOLIIIIOD
‘JUsUIssasse
oyeyUr uniIssejod
pure
ula}01d 104
“S[2A9] eurseyd
JO} $3°Q
PUB SPOON!
JOIP oT
‘unissejod
pue uesonm
Azeurm ‘auajo1e9
-b40q :SIOYIEWOIG
€ pue
sp10;e1
IO} 750
‘OAT OF} 10J
6€'0 JoIp poystom
Aep 919M
[OPOU! peLy
oy) Woy
aidnnu— 7 WIM
‘(L8=0) souRLy
SUOTeOII0D YUWOUIssasse
potiod 19K
{ Odd
surreduros “ayeIUI
ensn WIsyNoS
Woy
(0007)
SYRIUT OUdJOILS-v}9q
IO] VN |
be I9A0
peaidg {Japoul
spell], |
“WorNensTuTUpe |
SSOSSE 0} POUSISac
WoWIOM pue
Uap |
“ye 39
sorueq
“syoolqns ‘Odd
€[ Ul
passasse AIO}SIE{
pue sige}
o1aM 9Ua}0Ie9-219q
Teoy
stp wos
pue suajore9-eydye
poidepe oimsevour
‘umpuexoydA19 wioyI-9¢
& pue "LEQ=1
Tpesad JOIp
INoY-p7 ‘urayny
‘amadooA] SYPIUI
[ensn Surssasse
Q[SUIs 94)
pure S¢-0=I
‘OAT JO
S[OA9] WINIEg
SINSKOUT WISjT
WOII-9E 94)
‘Tp’ N=I ST[Voor
“s]Teoer TeUOTIppe
-Z & ‘Wyo sed
oy) ‘(O00
T=") W-7Z
€ 9}
JO} poarosqo
Z Paaleoal
Wat} FO
JOAO OFeJUI
SuIssosse |
vISIOSH vIUETY
UT SEM
S[DAQ] PIOTI}0Ie9
[e104 SOT
pue ‘[[eoor
301p ‘gouo |
OFA
Woy-/ 2
foyeqar soyomYo
¢] Woy
TIM
SSUIAIas o[qejodoa
pue ‘potiod
reaK |
IY-pZ & poalaool
poroysturmape a]qejasea
pur jn
poHMLIser syynpe
(0007) “Te
INI] JO
UOYLIOL09 JsosuoNS
VN |
be J9A0 peaidg
spafqns ply |
‘Joo} Agams
Worgq | ssasse
oy posnsOjq ¢ |
Ueonoury Uesty |
319 MODTUSOY
“ayeqUL UOT]
‘(€9=) SSOSSe
0} pousTsop |
elTeysny
‘“eLIO}OLA, “aBIPAYOQID
JOJ 8/0
OF “Sp10de1
pooy “poyodez
Od
BLIOIA Jo
Ul o8e
SulIEAG (0007)
V_UMUEITA OF
B70 WOY
870 VN
skep /
poysiom Aep-,
| uonenstunupe
[| plounoD
JooueD-nuy -PIFYD Jo
uoMIOA | “Te
39 OBpoH
‘a[qissod (s)poujow
suoljelsiuruUpe 919M
UdAIS (Sues
pur) (2[qeor[dde
Jr) uostieduioo
us0mjeq Uvoy]
“poyjout uostiedto0o |
~s).q usamjoq
pue [BAIS}UL
2p
pue sCjq
waemyoq (1)
(4) sjustoTJjooo
=| Op
usemyoq pouley
suolel|sIururpe (u)
SJUSTOLYZFO09 UOTP[AIIO“) |
Aypiqronpoiday [eAro}U]
uostiedwod OdJA
Jo'ON usisoq
OAT uoneindog
Apmis
V xipuoddy

144
(CAD) eseasip
Jepnosea-ATeuoI0,)
So‘osonyea-d “O¢Q<i
[]? Jog ,
omeuuorsanb Alojstpy
29
suqeH Wes
8. Jog
PoelIpoyy ‘suiayed
Aleyotp oytoods
|
“(¢/=U) sueonoury
Ayjemyyns ssasse
0} ueoloy
}npe "(Z007)
“p30 01
Sp'0 Woy
a8uey WN |
‘zeaxX vo}
dq | ‘spioocerjorp
Aep / |
‘Woyenstumupe | |
pousisop O44
Wo
BT gyeWlay
pue oye
“Te 49 WIT
“UapoMsS
ur yoyoo (TAD
"ETO =I urow
OAT j1
OD ‘syoalqns
/ p 10y IP)
VOINONW TILK
pue ¢p'Q=1
URS
sTpeooI POUTULIA}Op
O90 pue
(1s0ur9 IY-pZ
Pue S[SAd|
UA}OIeD suonequscu0s
IP)
Oldgy Woy
-b]0q eUse|d
Us8MIOq ouajores-ej9q
‘poried poyojas
ATuopues * syeool
MOY-p7 Pur
OAT j I
‘potted 1v0
RUISETY “ST]eOOI
reaX au0
& IaA0 (66=0)
UstIOM "(Z00Z)
“Te
4/9 6L'0
1 OF 0
OY
esuLY 89'0
= URIPsI
suo B A
Q
Jolp Inoy-p¢
OT |
SUOHensTUTUpe ¢
‘OdA Weart-pg
pue (96=U)
Ue | _ 39 WossueYyor
‘(€L=0) "eeurayenyy
sieok $$-7Z
“s][BOor Ul
ayeyur ATe)OTp
pose ‘epewajenr)
“poriad Areyorp
oy
SSOSSB 0}
POUSISOP jo
sonjrunum09 "C) UMMIL}IA
IOF ZO
OF yyuour
-pZ SATNIasSUOD
Odd oAneUeNnb
p Woy ‘(ZO0Z)
“Te AZI9Ud
IOJ po'9
Woy pesuey
VN [
® 19490 -uou
segy, |
woneNsturupe |
-TUIAS WO}
ZS UatHOM
puke Udy
| 39
ZaNSUIpoYy “IA
[| J0A0
peaids
“WOU IOJ
170 s[[Boor
INoYy-pZ "(saduel
¢) pue
‘Sr'0 “6r'0
pue uouIOmM
suoyds]e} 7 ‘OAT
sozis UorIod
prepur}s
IO} 8T'O
PUL SHO
‘SPO aT0M
19TTLAA pue
OHA
‘SuIay PZT
“JOPjooq ‘(10€T=")
Ajoaqoadsar OAT
HOTEM. ® 10 Od
OTA
a8ed o¢
(OHA) yoyoo
Apnys pue
OFT oT
‘OHG ey
pue OH
2aAte001 alreumoysond)
AIO}sTpy qe
s,eouewy
pure syjeoor
moy-pz Usamjaq
“Teak |
0} peztuopurl
PIC & payeo
OA |
ye SuNeq
oy} Woy
“(J007) A3ZI9UI
OJ SUOTILIALIOD
VN |
4940 peaids
spofqng |
uonensrunupe | |
poseq ATOAWTUZOO
MON, USWOM
pure UdJAl
“Te Jo
zeqns
‘a[qissod (s)poyjour
suonesstururpe o19YM
USAIS (O8uLI
pur) (ajqeorfdde
jt) =|
uostredutos us0Mj0q
uvoy] “poujeur
uostedui09
sOdqd us0mjoq
pue O44
[eAIOVUL 2
pue sO.1j
uoomjaq (J)
(4) S}USTOTZJIO9
u90M49q poyloy]
suoneysiuupe (u)
SJUSTOLYJIO9 UOTTRISLOT) |
Ayyiqronpoidayy [eAIOqU]
wostedui07 Od JOON
ustsoq OAT
uoye[ndog Apns
V xipuaddy

145
WOALTJOSI Ue
ST ULSZpreq
(va) sploy
Aney so‘osenea-d
“Q¢Q<i [[® IOy
|
“WONeIDXO ‘(STZ=U)
Ia0Ne9 TO
"€p'Q = WoNaIoxa
TOARTFOST SUTIN
‘ayeyur | Apms
sansodsorg ATeUL-OUTULSID
2 STE"
pue uoneyuest0s
MWOARTJOST Ssasse
poseq-enue,) =
‘0U09 TUNeS
‘p9'd = SUC
UWOARTZOST 0}
pousisap ‘OAT
Weep syqng
spue OAS 4/q
Vonepau0s “potiod
umnLIas ‘sp10901
‘yrede Ie9A
| saTye}HUeNb-THs
ueder oy}
Woy
(1007) “Te
WedUl “UIOZprep
104 OL 0 =uespy
| reat]
BIDAO yorp
Aep-ajdnynyy |
suoneysmmupe 7
pore)sTMUpe-J[as woulOm
pue uayAy |
49 OJOUTeUTe A
"So}eI oTTOqe}oU
[eseq “uoyejndod
09°0 pur
OS‘0 PoyeUIyss
YIM jo
soyeyuL yuoLNU
waemjeq SUTTTey
poreduios a9
pue ASioue
suTUIa}ep ‘(€Z7[=0)
SONTLA SOUL
WILMA soyeyut
ASIouy 0}
padoyaaop sreok
p/-SZ
oyerpAyoqies oy
‘syuedioyred ¢/
ut Odd eavuewuenb |
pose
usi0 ueolyy
"JOYOOTe IOF
9Q"Q 0}
sUA}OIeS LL’
0} [eUOI
10y ‘potiod |
read | IAA0
s]pesar ‘yrede
34 |
poro}sTurupe jo
suvoreuresr (1007)
-b]9q IO]
OZ'N Woy osuey
Tp Woy
asuey | swesdk
| Be IDA
INOY-pZ SAPOM],
| SUOeIsTUTUUIpe
7 -IOMOIAIONUT
o]eue,y pue
opep |
“Te 39 Uosyoer
"MSMIOM IO}
770 pue
usuT “9ud}OIRD
B}9q JO}
OC
= SONTVA-I
spI0aI pue
yeroydos0}-0 “reo
"sieak [9
JoIp jsulese
pue /7'O=UoMIOM
eurserd ‘sv.
ajs0 SnotAaid
oy} Ul
Jorp -6€
pose syueAras
2 TC Q=Uoul
OJ sonyea
[Ata}sapoyo wes
"(£661 jnoge
Suryse OJ |
[LAID poseq-uopuoT
-1 Odd pue
oyo/eucjoreo ‘ported re9h
“(€661-1661) | -1661)
‘Ppoyoder arqepeos-ourgoeur
(€Op=) syeuray
(1002) -vjoq
euseyd usamjog
VN OM1BI3SAQ
| sploseljoIp
Aep / |
Uonensturumpe |
polo sTUIUIpe-J[9S
pue(/Sp=U) oyey
| “Te
39 JowunIg
‘OSA Uf
105 pE'O-ZEO
Woy pure sxc
10} S¢'0-15'0 Woy
‘(9y1=0) posues
unissejod Arejorp
pue *sp109e1
pooy Aep
/ jOYOd
YOJION
urmissejod Areurin
u998Mj0q Z pue
(QT [=U)
proe MN Jsoued
“1102 ‘OA
OF} 1OF
670-170 oIqioose
euiseyd OJUI
WOYeSySSAu] woy
pue ‘79°90
— 95'9
Woy (p¢[=)
unIpos "yrede
"ayequL [ensn
ssosse sanoodsoig
pesuel syq
pur uasonim
“potied yuo
pue tunissejod |
your
6 “xoidde
0} pousisacy ‘poyieu
} uvedomg
oy} Woy
‘(100Z) “Te
AIeULIN IY-p7
WaeMjaq “10d
povioder 10N
6 810A
‘uo8otu Areulip)
| suoyenstmupe
7 “‘poro)STUTLIpe-J[9S
UdUIOM puke
Ua, |
39 WMOOOW
"ayqissod (s)poyjour
SUOTIeSIUTUIpE oIdYM
UDAIS (OSuBI
pur) (atqeortdde
jr) uostedui09
uaemjoq Uvay]
‘poyjout uosteduroo
| sq
uoowyjoq pue
[BAIOJUL 2p
pue sO.7a
wsemyaq (1)
(1) sJUSTIOTTJB0N
=| CAL]
ueemy9q poulsw
suoljeysturipe (u)
SJUSTOLYJSOD UOTLISUO07)
Ayyiqronpoiday [eArojuy
wostedu0,) OA JOON
usisogq OAT
uoyeindog Apms
V xipuoddy

APPENDIX B
Consent form from the Ethics Committee of the University of The West Indies and
consent form for study participants.
146

147
THE UNIVERSITY OF THE WEST INDIES
FACULTY OF MEDICAL SCIENCES - ST. AUGUSTINE
Eric Williams Medical Sciences Complex
Uriah Butler Highway
Champs Fleurs,
Trinidad and Tobago, W.I.
May 16, 2000
Dr, Dan Ramdath
Lecturer Biochemistry Unit
Dear Dr. Ramdath
Please be advised that approval has been granted by the Ethics Committee for you to
undertake the project/study entitled: Development and Validation of a Food Frequency
Questionnaire for use in Trinidad.
Sincerely,
Professor FE Feytmans
Chairman Ethics Committee
Cables: “STOMATA” PORT-OF-SPAIN Telephone: (1-868) 645-2640-9 Fax: (1-868) 663-9836

148
VOLUNTEER INFORMATION *
1. This study is being conducted by the University of the West Indies in collaboration with the University of Toronto, Department of Nutritional Sciences, Faculty of Medicine.
2. The study seeks to develop a FOOD FREQUENCY QUESTIONNAIRE (FFQ) for use in Trinidad, which may ultimately be used to further elucidate the relationship between diet and chronic disease.
3. The principal investigator for the local phase of this study is Dr. Dan Ramdath who is a Lecturer ~~ inthe Faculty of Medical Sciences, UWI, St.Augustine: eR ER - Ps
4. The main features of this study are: * To conduct interviews on a representative sample population of Trinidadians in order to
assess the suitability of the food items listed on a preliminary FFQ.
e To validate a preliminary FFQ by means of 7-day consecutive food records on a representative sampie population of Trinidadians.
In the event of any problems, queries or if further clarification is needed, please call Dr. Dan Ramdath or Vasanti Malik at: 645-2640 ext. 4641/4643; Pager. 662-3377, pager #502539
INFORMED CONSENT
1. I, the undersigned, voluntarily agree to take part in a study that aims to test and validate a preliminary FFO, in order to develop an official dietary survey tool which, may in tum be used for epidemiological studies conducted in Trinidad.
~ 2. | have been given a full explanation by the supervising investigator of the nature and purpose’ ~~ of the study, and of what | will be expected to do.
. | have been given the opportunity to question the supervising investigator on all aspects of the a. Study and 1 have understood the advice andinforma iven. ye ea
4. | agree that | will not seek to restrict the use study maybe put.
5. ! understand that | am free to withdraw from the Study at any time without the need to justify my decision.
VOLUNTEER INVESTIGATOR
WITNESS DATE

APPENDIX C
Food Frequency questionnaire and first few pages of &-day Food Record booklet.
149

150
FOOD FREQUENCY QUESTIONNAIRE
FOR USE IN
TRINIDAD
DRAFT
dd mm yy
Date: Day: 1=Sun; 2=Mon; 3=Tue;
4=Wed; 5=Thurs; 6=Fri;
7=Sat
Demographic information
Locality ED# Household # Respondent
1. Area: (1=City; 2=Urban/suburban; 3=Rural)
2.Agerange (yrs)
3. Gender (1=Male; 2=Female)
4. Race (1=AF: 2=SA; 3=MI; 4=OTH)
5. Occupation: (1=Professional; 2= Clerical; 3= Skilled worker;
4=unskilled worker; 5=Housewife; 6=Other)
6. Completed Education level: (1=Primary/Elementary; 2=Secondary/ Technical/Vocational; 3=Tertiary;
4=None; 5=Other)
7. Have you ever been told by a doctor that you have any of the following;
diabetes, heart disease, high blood pressure, cancer, high cholesterol?
8. Are you currently on any special diet?
If yes for how long?
9. Are you currently pregnant or breast feeding?

PROVISIONS | AVERAGE USE DURING THE PAST YEAR
Never or Month Week Day USUAL SERVING SIZE
hardly ever
Potato (aloo) Os OM OL
Dasheen, Os OM OL
Yam Os OM OL
Eddoes Os OM OL
Cassava/ Os OM OL
Foofoo/ meal.
Sweet Potato Os OM OL
Tannia Os OM OL
Breadfruit Os OM OL
Green Os OM OL Banana/fig
Plantain Os C1M OL
CEREALS AVERAGE USE DURING THE PAST YEAR
Never or Month Week Day USUAL SERVING SIZE hardly ever
White rice Os C] M OL
Brown rice Os OM OL
Parboiled rice Os OM OL
White bread/ Os OM OL
sandwich/french
Whole wheat Os OM CL bread/ rye
Hops/ rolls/ Os OM OL buns
Biscuits/bagels/ Os CIM OL English muffins
Other bread Os OM OL
raisin bread
Sada roti &roast Os OM OL bake Type of flour
151

CEREALS Never or Month Week Day USUAL SERVING SIZE CONT’D hardly ever
Busupshut & Os OM OL fried bake. Type of flour
Dhall purie. Os OM OL
Type of flour
Paratha roti. Os OM OL
Type of flour Pita bread Os OM OL
Type of flour
Cornmeal Os OM OL
dumplings/roti
Breakfast cereal Os OM OL Corn Flakes
Pancake, waffle, Os OM OL French toast
Cooked cereals/ OS OM OL Cream of Wheat
Pasta/macaroni Os OM OL
with out egg Noodles, with Os OM OL
egg, chow mein
CooCoo Os OM OL
Bran /high fiber Os OM OL cereals/ granola
Dumplings Os OM OL
Crackers such Os OM OL as Crix
FRUITS & AVERAGE USE DURING THE PAST YEAR
VEGETABLES _| Never or Month Week Day USUAL SERVING SIZE hardly ever
Banana/fig Os OM OL
Plum Os OM OL
Guava Os OM OL
Orange/Tangerine Os OM OL
Pawpaw (papaya) Os OM OL
152

FRUITS & Never or Month Week Day USUAL SERVING SIZE
VEGETABLES _| hardly ever CONT’D Pineapple Os OM OL
Pumpkin/squash Os OM OL
Eggplant Os OM OL Baigan/melangen Tomato OSs OM OL
Com Os OM OL
Mixed tossed Os OM OL
salad
Spinach (bhaji) Os OM OL
Okra Os OM OL
Cooked mixed Os OM OL vegetables Carrot Os OM OL
Cabbage Os OM OL
Carombola Os OM OL (five fingers)
Mushroom Os OM OL
Calaloo (plain) Os OM OL
Dried fruits Os OM OL
Cauliflower Os OM OL
Christophene Os OM OL
Sweet pepper Os OM OL
Cucumber Os OM OL
Lettuce/greens/ Os OM OL Watercress
153

FOOD FROM AVERAGE USE DURING THE PAST
ANIMALS & YEAR USUAL SERVING SIZE ALTERNATIVES | Never or Month Week Day
hardly ever
Milk alone or with Os OM OL cereal Type:
Yogurt (plain or Os OM OL fruit), (smoothie) Type:
Cheese Os OM OL Type:
Cream cheese/paste Os OM OL Type:
Chicken/turkey Os OM OL
Beef/roast & corned
beef
Os OM OL
Pork Os OM OL
Goat Os OM OL
Lamb/Mutton Os OM OL
Goat OS OM OL
Fish Os OM OL
Salted/Smoked Fish Os OM OL
Shrimp/crab or Os OM OL other shell fish Egg/egg salad Os OM OL
Luncheon meats Os OM OL
Bacon Os OM OL
Tofu/bean curd & OS OM OL meat substitutes
LEGUMES & AVERAGE USE DURING THE PAST NUTS YEAR USUAL SERVING SIZE
Never or Month Week Day
hardly ever
Pigeon peas Os OM OL
Chick peas Os OM OL (channa)
154

LEGUMES & | Never or Month Week Day USUAL SERVING SIZE NUTS hardly ever
CONT’D Red beans Os OM OL (kidney beans)
Black-eyed peas Os OM OL
Split peas /Dhall Os OM OL
Lentils Cs OM OL
Cow peas Os OM OL
Lima beans Os OM OL
Soya beans Os OM OL
Green peas Os OM OL
Bodi Os OM OL
String beans Os OM OL
Peanuts Os OM OL
Other nuts such OSs OM OL as almonds
FATS & OILS AVERAGE USE DURING THE PAST YEAR USUAL SERVING SIZE
Never or Month Week Day
hardly ever
Butter, stick Os OM OL
Type
Margarine stick Os OM OL Type
Margarine, tub Os OM OL Type
Butter , tub Os OM OL
Type
Mayonnaise, Os OM OL
salad dressing Type
Salad dressing Os OM OL Italian/ French Type
155

FATS & OILS | Never or Month Week Day USUAL SERVING SIZE CONT’D hardly ever
Oil such as Os OM CL vegetable, olive Type
Lard or ghee Os OM OL Type
Coconut OSs OM OL milk/grated
Green coconut Os C1M OL
Avocado Os OM OL (zaboca)
SNACKS, AVERAGE USE DURING THE PAST
DESSERTS & YEAR USUAL SERVING SIZE CONDIMENTS | Never or Month Week Day
hardly
ever
Sweet bread Os OM OL
Potato, corn or Os []M OL other chips
Kurma, & goolab OS OM OL
jamoon
Cake Os OM OL
Cookies, Os OM OL brownie/fruitbar
Ice Cream, or ice Os OM OL milk
Frozen yogurt or Os OM OL sherbet
Puddings or Os OM OL custard
Chocolate bars OSs OM OL
Cassava Pone Os OM OL
Barfi (Indian OSs OM OL milk sweets)
Pastry pie, Os OM OL turnovers, danish
Preserved fruits Os OM OL
156

SNACKS, Never or Month Week Day USUAL SERVING SIZE
DESSERTS & | hardly CONDIMENTS | °°" Popcorn Os OM OL
Caramel or other OSs OM OL candy
Sugar cake, Os OM OL fudge, toolum
Jam/jelly Os OM OL
Peanut butter Os OM OL
Condensed milk Os OM OL
Syrup, molasses Os OM OL
Ketchup Os OM OL
Mustard Os OM OL
Barbecue sauce OSs OM OL
Soy sauce Os OM OL
MIXED AVERAGE USE DURING THE PAST YEAR
FOODS Never or Month Week Day USUAL SERVING SIZE
hardly ever
Veg. Fried rice, Os OM OL or Spanish rice
Macaroni pie OS OM OL mac& cheese
Soup such as Os OM OL vegetable
Cream soup or Os OM OL chowder
Broth such as Os OM OL fish broth
Potato or Os OM OL macaroni salad
Pastel Os OM OL
(any type)
157

MIXED Never or Month Week Day USUAL SERVING SIZE FOODS hardly ever
CONT’D
Noodles, Chow Os C1M OL mein
Pachownie, or Os OM OL black pudding
Corn pie Os OM OL
Buljoil Os OM OL
Pelau Os OM OL
Calaloo Os OM OL (with meat)
Pasta sauce Os OM OL (with veg.)
Pasta sauce Os OiM OL (with meat)
FAST FOODS | AVERAGE USE DURING THE PAST YEAR Never or Month Week Day USUAL SERVING SIZE
hardly ever
Doubles Os OM OL
Shark & bake OSs OM OL
Sahiena/baigani/ Os OM OL Phulorie
Aloo pie Os OM OL
Cheese pie Os C1M OL
Veg pie or patty Os OM OL
Beef patty Os CM OL
Pizza Os OM OL
Hamburger Os OM OL
158

FAST FOODS Never or Month Week Day USUAL SERVING SIZE CONT’D hardly ever
Hot dog Os OM OL
Fried chicken Os OM OL
KFC
Fish or chicken Os OM OL sandwich KFC
Grilled chicken Os OM OL sandwich
French Fries Os OM OL
Onion rings Os OM OL
BEVERAGES AVERAGE USE DURING THE PAST SERVING SIZE &
YEAR PREPARATION Never or Month Week Day
hardly ever
Fruit juices Os ClM OL
Maubi Os OM OL
Tomato or Os OM OL vegetable juice
Sweet drink ° Os OM OL
Diet sweet drink Os OM OL
Light beer or Os OM OL Shandy
Regular or draft Os OM OL beer
Stout Os OM OL
White/pink Os OM OL
wine
Red wine Os OM OL
159

BEVERAGES Never or Month Week Day SERVING SIZE &
CONT’D hardly ever PREPARATION Hard liquor Os OM OL
Suppligen or Os OM OL Ensure
Coconut water Os OM OL
Peanut punch OSs OM OL
Regular tea Os OM OL
Regular coffee Os CM OL Instant/brewed
Choc milk, Os OM O milo, ovaltine,
cocoa
Decaffeinated Os OM OL coffee/tea
Cappuccino & Os OM OL other coffees
Whitener Os OM OL
Type
Sweetener Os OM OL
Type
SEASONAL AVERAGE USE DURING THE PAST USUAL SERVING SIZE FRUITS & YEARS
VEG. Never or Month Week Day
hardly ever
Mango Os OM OL
Pommecythe Os OM OL
Portugal Os OM OL
Cherries OS OM OL
Pomerac Os OM OL
Watermelon Os OM OL
160

161
SEASONAL Never or Month Week Day SERVING SIZE &
FRUITS / VEG | hardly PREPARATION CONT’D ever
Lemon/lime Os OM OL
Plum Os OM OL
Chaimet Os OM OL
Chennette Os OM OL
Sorrel Os OM OL
Sapodilla Os OM OL
Chaigtange Os [1M OL
VITAMINS & | AVERAGE USE DURING THE PAST YEAR
SUPPLEMENTS Never or Month Week Day hardly ever
Multi-vitamins
Vitamin E
Vitamin A
Vitamin C
Iron
Calcium
Folic acid
FOOD ITEM PROCESSING FREQUENCY Deep Pan- Baked/ | Grilled/ Curried Stewed Never | Month | Week | Day
fried fried Broiled | BBq’d
Chicken
Fish
Corned beef
Steak
Hamb
Hotdo
Bacon
S e
Luncheon meats
Pork
Ribs
Goat
Lamb/mutton
Tofu

162
Please list any food items, which you eat more or less or during religious holidays.
Holiday:
Time of year:
Duration:
EAT MORE Never or | Month Week Day USUAL SERVING SIZE
OF... hardly ever
OS OM OL
Os OM OL
Os OM OL
Os [1M OL
Os OM OL
EAT LESS OF... | Never or | Month Week Day USUAL SERVING SIZE hardly
ever
Os OM OL
Os OM OL
Os OM OL
Os OM OL
OS OM OL

carne
A COLLABORA TI ON BE TWEEN THE UNIVERSI TY OF THE “WES T. INDIES, - BIOCHEMISTRY ‘UNIT & THE UNIVERSITY OF TORONTO, DEPARTMENT OF NUTRI PL ONAL, SCIENCES , FACULTY OF MEDI Cr NE.

164
7 DAY FOOD RECORD
INSTRUCTIONS
Please complete this FOOD RECORD over the next 7 days.
Write down everything you eat or drink at home or away- iricluding snacks. Please write down what you eat or drink right after doing so, rather than at the end of the day or on another day.
DO NOT change what you would normally eat. We would like a complete record of exactly what you eat and drink during the next 7 days, regardless of how little or how much.
Food items, should be listed under the appropriate heading (breakfast, lunch, dinner, snack) of each day (1 through 7) in the space provided.
Be sure to include the amounts of food or drink consumed (S, M. L) during each meal using the attached photographs to help estimate portion sizes. Items in mixed dishes such as salad or sandwiches should be listed separately. You should also indicate if the items being consumed are made at home or take-out.
For items made at home please include recipes and method of food preparation.
Don’t forget to record: All beverages (coffee, tea, milk, beer, water, sweet drink) Sweets (candy, desserts) Condiments and dressings (jams, butter, gravy, ketchup, chutney, soy sauce) Vitamins
A follow ~ up telephone call or visit will be given mid-week.
Please see the following example.

165
DAY 1!- EXAMPLE
Breakfast: Eco é. ch dlom- sm call wore,
Sada cory -_ b, Cin ve, ‘el Crea \
s Cu Sorgoacd thingly en cot: —-
a C05 af ikea, with /& gar aA cl eva pata ted milk
Recipes: Fr vec eile Os About 5 pt tatee s Q onions, _
| Cbs Li 3 cloves agarchic + 1 Eiespe NAYS Cocr Aa LL
Aw XE. SE [+ a ise ope 7
Sade ondt 2 44 cis tho _L iain FE ) Ly tes Peru y <y “he vk a G ouicd es
| $e ose ots Salt i
Ye Coted e Leiba ca ¥
Lunch: Ham dad Cheese Sdoclwich A a Sites brown beend
Mocgecun &. edhe, sacs: Chey 2 alice s che clebes Wed ine”
, a ioe ha musntoclcd 4. ey cl Hint ly
L tan ut Fz ue |
Tiseck salock 2 le tdure pobiuisadn be ye lecl es 4. Pomictt::
Carrot Sucall prot Ae cies ne Ly Preach \ aa] Soucy Fisy 3 ke net
Recipes:

166
DAY 1- EXAMPLE
Dinner: Calalen Poecliaw cacao Stewed ai aon be CS | = op cA eck Eny
(whi tye cule 3 tec Le fal 7 coc lf tnt cs ch.
Broile ch plarta A. 3 pire ! Cisco ch Cine k by Sum Gil mcs Ao ct
Line chia es Gls S32 Cpe OD ack Latta to
Recipes:_( cilaloo About 12 dasheen leaves a COs OE Ce ANG st iy dik ree . 2
tables veo vy bea + re a
Ore evs pepper md VF
a be. 3!
Cidacae SS
=p CL = > thy DA?
S
2
| Oya CoN
ig Cn eS
i fun hie t € 7
Snacks: | piece Je men cake C Steve | cught | 3 Cus ea, with Se cig cd eke. sp anateel ant Ik
hg Dike, Casasd. Sas Si C Ane, nucle \ soot 2 meta, Cons 5 Hens L
Recipes: ae SS. Ca ae ae 2 aA i waned Seek ie ck } ao coe ces wt
2. tle. Ay Mev id cs bist te. , {ttc twe api dyaistueey bit Bs .
a hist 2 Cnaed — bye ie ON Sea Sena 1 fe? fe ‘¢ PM nen lig ld S il el Gat:
Ts Flu Se jt fe wed é a / ‘ 24

167
DAY 1
Breakfast:
Recipes:
TRA ORARRRRRERKORERTEREEENERAERORROME TERROR ROEM TERRA AAEM AON ERA A
Launch:
Recipes:

APPENDIX D
Portion Sizes Associated with FFQ.
168

169
PORTION SIZES FOR ITEMS LISTED ON THE FFQ
Small Medium _ Large
POT,BLD IN SKIN,W/SL >78g 136g <272g
Dasheen >75g 125g <250g
White yam >75g 125g <250g
Eddoe >75g 125g <250g
CASSAVA,RAW >50g 100g <200g
SWTPOT,BL,WO/SK,W/SL >82g 164g <328g
BREADFRUIT,RAW >55g 110g 220g
Green Banana 57g 114g <228g
PLANTAIN,CKD 38.5g 77g 154g
RICE,WHIT,CKD,ENR >51g 102g <205g
RICE,BROWN,MED,CKD >51g 102g <205g
WHTBREAD,ENR, 1-2NFDM >25g 100g 200g
WHOLEWHTBREAD,2%NFDM >25g 100g 200g
ROLLS+BUNS,PLAIN,ENR >40g 120g 240g
ROLLS,WHOLE WHEAT >40g 120g 240g
sada roti 32.59 130g 260g
Fried Bake >68g 136g <272g
Johnny bakes >32g 96g <256
paratha roti >50g 98g <196
dhal purie >73g 146g <292
CORN FLKS, KELLOGG'S >15g 30g <60g
CRM OF WHT, INST,DRY >759g 188g <376g
SPAG,ENR,CKD,W/NA >70g 140g <280g
NOODLE,EGG,ENR,CKD >80g 160g <320g
flour dumplings >70g 140g <280g
CRACKERS,SODA >14g 28g <56g
BANANA,RAW >57g 114g <228g
ORANGE,RAW,ALL VARIE >65g 131g <262g
PAPAYAS,RAW >76g 152g <304
PINEAPPLE,RAW >84g 155g <310g
SQSH,SMMR,BLD,W/SLT >45g 90g <180g
PUMPKIN,BLD,W/SALT >61g 122g <244g
EGGPLANT,BLD,W/SALT >48g 96g <192g
TOMATO,RED,RIPE,RAW 60g 120g 240g
SPINACH,BLD,W/SALT 45g 90g 180g

OKRA,BLD,W/SALT
CARROTS,RAW
CABBAGE,BLD,W/SLT
CAULIFLWR,BLD,W/SALT
CUCUMBER,RAW
LETTUCE,LOOSELEAF,RW
2% LOWFAT MILK,FLUID
YOGURTPLAIN8GPRO/80Z
CHEDDAR CHEESE
CHICK,BREASTWSK,RSTD
TURKYBRST,W/SKN,RSTD
BF,COMP,ALL,L+F,CK,Q
PORK,COMP.CUTS,LN,CK
GOAT, ROASTED
LAMB,DOM,CUBED,BRLD
Fish
boiled salt fish
SHRIMP,BLD/STMD
EGG,CHICK,WHL,HRD-CK
SALAMI,CKD,BEEF/PORK
TOFU,SLTD&FRMNT,NIGR
PIGEON PEA,CKD,W/SLT
CHICKPEA,CKD,W/SALT
BN,KDNY,RED,CKD,W/SL
COWPEA,CMN,CKD,W/SLT
PEA,SPLIT,CKD,W/SALT
LENTIL,CKD,W/SALT
PEAS,GREEN,BLD,W/SAL
BN,FRENCH,CKD,W/SALT
PNUT,ALL,DRY-RST,NO
ALMONDS, TOASTED
BUTTER UNSALTED
MARG,SFT,SFL,HYD SFL
MAYON TYPE SAL DRESS
SALAD DR.1000 ISLAND
OIL,SOYBEAN LECITHIN
FAT,LARD (PORK)
COCONUT MILK,RAW
AVOCADO,RAW,ALL VAR
sweet bread
40g
36g
37.5g
31g
>26g
28g
>122g
>113.5g
>28g
59.79
>50g
>50g
>50g
>42.5
>42.5
>43g
62.5g
>42.5
>25g
>42.5
>62g
49g
41g
44g
60g
53.5g
49.5g
40g
43g
>14g
>14g
>5g
>5g
>5g
>5g
>5g
>5g
>5g
>57.5
>45g
80g
72g
75g
62g
52g
56g
244g
227g
56g
124g
100g
100g
100g
85g
85g
85g
125g
85g
50g
85g
124g
98g
82g
88g
120g
107g
99g
80g
86g
28g
28g
15g
14.19
14g
15g
13.69
12.89
15g
115g
90g
160g
144g
<150g
<124
" <104g 112g
<488g
<454g
112g
229g
<200g
<200g
<200g
<170
<170
<170g
250g
<170
<100g
<170
<248g
196g
164g
177g
240g
214g
198g
160g
177g
<56g
<56g
<45g
<42g
<429g
<45g
<40g
<39qg
<45g
<230g
<180g
170

POTATO CHIPS
Kurma
CAKE,SPONGE,ENR
COOKIES,CHOCOLATE
16%FAT VANILA ICECRM
CANDY,MILKCHOC/PLAIN
Cas Pone
Barfi
ROLLS+BUNS,DAN.PSTRY
green mango
CARAMELS,CHOC/PLAIN
JAM,NOT CHERRY/STRWB
PNUT BUTTER,SMTH,NO
SIRUP,CORN,LIGHT+DK.
CATSUP
MUSTARD,PREP., YELLOW
BARBEQUE SAUCE,RTS
SOY SAUCE (TAMARI)
Veg fried rice
MAC+CHEES,HOME,MARG
Prvsn Sp
Fish Broth
POTATO SALAD
Veg Chowmein
Corn Pie
buljol
Pelau
Callaloo
TOM SAU,HRB+CHSE,CND
doubles
Fried Bake
SHARK,BATTRD & FRIED
sahiena
aloo pie
Cheese Pie
Chkn Pie
PIZZA W/CHEESE
HAMBURGER,REG,COND
CHICK,FRIED,LIGHTMT
CHICK FIL SAND,PLAIN
>50g
30g
>20g
>12g
>74g
>25g
>30g
>40g
>25g
>75g
>14g
>20g
>16g
>20g
>15g
>129g
>16g
>18g
>50g
>100g
>120g
>93g
>63g
>67g
>749g
>67.5g
>60g
>161g
>60g
>52.5g
>68g
>42.5g
>110g
>75g
>91g
>69g
>118.5g
>109g
>81.5g
>91g
100g
90g
45g
429
148g.
47g
60g
81g
429
150g
28g
40g
32g
40g
30g
25g
32g
36g
97g
200g
240g
187g
125g
134g
147g
135g
120g
322g
122g
105g
136g
85g
220g
150g
182g
138g
237g
218g
163g
182g
<200g
<180g
<90g
<85g
<296g
<94g
<120g
<162g
<100g
<300g
<84g
<80g
<64g
<80g
<60g
<50g
<64g
<72g
<200g
<400g
<480g
<374g
<250g
<268g
<294g
<270g
<240g
<644g
<244g
<315g
<272g
<170g
<330g
<225g
<275g
<276g
<474g
<436g
<326g
<364g
171
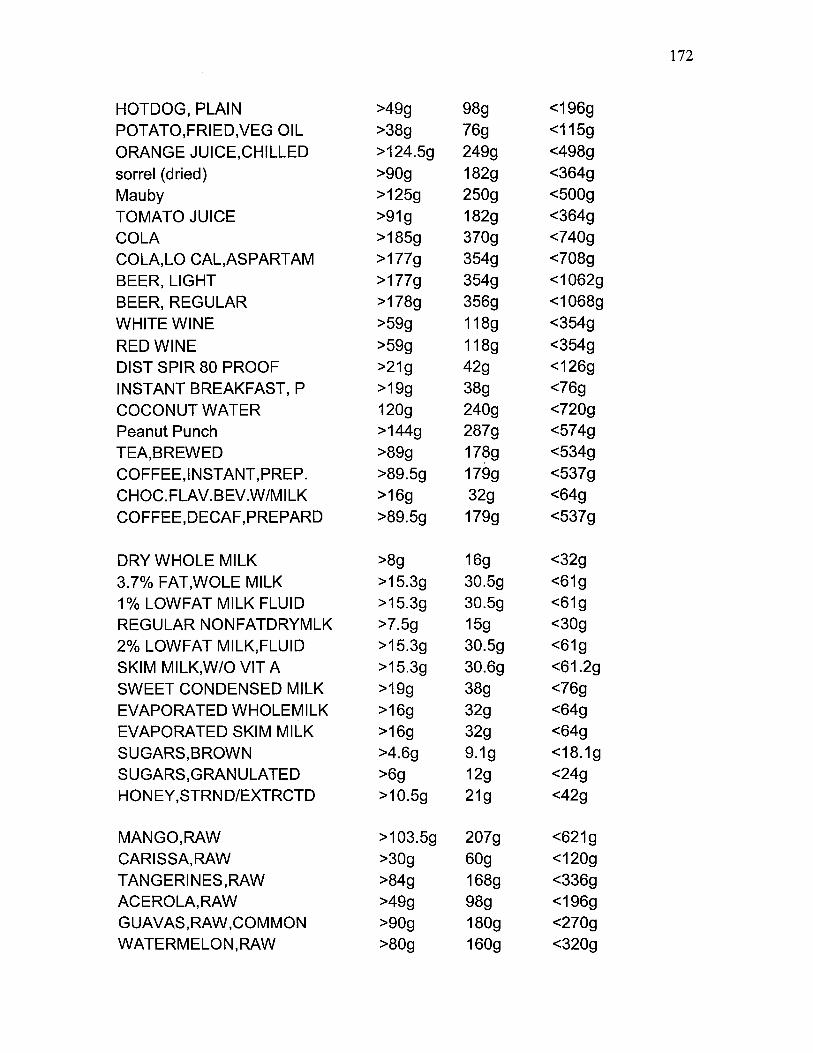
HOTDOG, PLAIN
POTATO,FRIED,VEG OIL
ORANGE JUICE,CHILLED
sorrel (dried)
Mauby
TOMATO JUICE
COLA
COLA,LO CAL,ASPARTAM
BEER, LIGHT
BEER, REGULAR
WHITE WINE
RED WINE
DIST SPIR 80 PROOF
INSTANT BREAKFAST, P
COCONUT WATER
Peanut Punch
TEA,BREWED
COFFEE,INSTANT,PREP.
CHOC.FLAV.BEV.W/MILK
COFFEE,DECAF,PREPARD
DRY WHOLE MILK
3.7% FAT,WOLE MILK
1% LOWFAT MILK FLUID
REGULAR NONFATDRYMLK
2% LOWFAT MILK,FLUID
SKIM MILK,W/O VIT A
SWEET CONDENSED MILK
EVAPORATED WHOLEMILK
EVAPORATED SKIM MILK
SUGARS,BROWN
SUGARS,GRANULATED
HONEY,STRND/EXTRCTD
MANGO,RAW
CARISSA,RAW
TANGERINES,RAW
ACEROLA,RAW
GUAVAS,RAW,COMMON
WATERMELON,RAW
>49q
>38g
>124.5g
>90g
>125g
>91g
>185g
>177g
>177g
>178g
>59qg
>59g
>21g
>199g
120g
>144g
>89g
>89.5g
>16g
>89.5g
>8g
>15.3g
>15.3g
>7.5g
>15.3g
>15.3g
>19g
>16g
>16g
>4.6g
>6g
>10.5g
>103.5g
>30g
>84g
>49g
>90g
>80g
16g
249g
182g
250g
182g
370g
354g
354g
356g
118g
118g
429
38g
240g
287g
178g
179g
32g
179g
16g
30.5g
30.5g
15g
30.5g
30.6g
38g
32g
32g
9.19
12g
21g
207g
60g
168g
98g
180g
160g
<196g
<115g
<498g
<364g
<500g
<364g
<740g
<708g
<1062g
<1068g
<354g
<354g
<126g
<76g
<720g
<574g
<534g
<537g
<64g
<537g
<32g
<61g
<61g
<30g
<61g
<61.2g
<76g
<64g
<64g
<18.1g
<24g
<42g
<621g
<120g
<336g
<196g
<270g
<320g
172

PLUMS,RAW
SAPODILLA,RAW
JAVA-PLUM,RAW
CHAYOTE,FR,BL,W/SALT
GRAPEFT,RD/WH/PK,ALL
CHERRY,SOUR,RED,RAW
APPLE,RAW,W/SKIN
GRAPES,RAW,AMER TYPE
PEARS,RAW
CARAMBOLA,RAW
CBBGE,PK-CH,BLD,W/SL
STRAWBERRIES,RAW
TAMARINDS,RAW
SUGAR-APPLE,RAW
CORIANDER,RAW
MAMMY-APPLE,RAW
MUSHROOMS,BLD,W/SLT
PEPPERS, SWEET, RAW
JACKFRUIT,RAW
RAISINS,SEEDLESS
SOURSOP,RAW
MELON,HONEYDEW,RAW
PEACH,RAW
CELERY, RAW
CORN,YEL,BOILD,W/SLT
BEETS,BLD,W/SALT
PRUNES,DRD,CKD W/SUG
BN,FRENCH,CKD,W/SALT
KIWIFRUIT,RAW,FRESH
BROCCOLI,BLD,W/SLT
SOYBEANS,SPROUTS,RAW
RADISHES,RAW
POMEGRANATES,RAW
Pommerac
Coconut jelly
Chennette
Lychee
Caimit
Pewah
>66g
>85g
>67.5g
>40g
>123g
>68g
>69g
>46g
>83g
>63.5g
>85g
>74.5g
>60g
>77.59g >2g
>50g
>39g
>25g
>50g
>50g
>112.5g
>50g
>43.5g
>40g
>419g
>42.5g
>42g
>88.5g
>76g
>39g
>18g
>22.5g
>77g
>82g
>23g
>50g
>50g
>53g
>34g
132g
170g
135g
80g
246g
136g
138g
92g
166g
127g
170g
149g
120g
155g
4g 100g
78g
50g
100g
100g
225g
100g
87g
80g
82g
85g
84g
177g
152g
78g
35g
45g
154g
164g
45g
100g
100g
105g
68g
<264g
<510g
<270g
<160g
<492g
<272g
<276g
<184g
<332g
<254g
<340g
<298g
<240g
<310g
<8g
<200g
<156g
<100g
<200g
<200g
<450g
<200g
<174g
<160g
<164g
<170g
<168g
<354g
<304g
<156g
<70g
<90g
<308g
<328g
<90g
<200g
<200g
<210g
<136g
173

Karela
Ackee
Sugar cane
kush kush
Veg. pie
Fish sand.
Decaf. tea
>30g
>60g
>23g
>45g
>79g
>79g
>89g
60g
120g
45g
90g
158g
158g
178g
<120g
<240g
<90g
<180g
<316g
<316g
<534g
174

APPENDIX E
An example of a map from an electoral district of Tunapuna: used for recruiting
subjects for validation study.
175

176
Figure E.1
Map of an electoral district from Tunapuna: used for recruiting subject’s in FFQ
validation study.
BYR verted TRU Rr
PAGE Pads BE Cato ED
Sy ta ta HA
a
| i
val
My td WA: at |
{eo PD +,
‘ i
. : , !
Sy i \ \, f Nr
. q ! \ de
i S to
| mE ! v i | : bead
{1 i | an 1 a on Eaten ate
eS sh wot t : 4 woh & Nats A ! ) “s oo
in vetted J Moon
a aca) a “ys ie j P th ‘ . '
; \ m \
Late “s weaet us
uA i v
a
=
71/00}
Eres
oa
INTY = ST GORGE
[E
rc 8
rn ne en Gt settee wc
__UNAPUNA Eo TT) Pe
eA d.. Lipide oF ‘foclenswe resem lwcrmisvenrsetanls
Moto

APPENDIX F
Food items from the validation study that were added to the Nutrput database.
177

178
List of Food items collected in the validation study and added to the Nutriput database.
Pro Fat Carb Kcal Chol SFA MFA Pro_ Gi
Fr King Fish 11.80 12.30 12.40 206.0 35.7 1.810 2.810 6940 94
Fr Fly Fish 12.00 12.60 12.40 209.0 23.5 1.850 2.870 7.020 94
Bkd Snapper 10.10 7.94 3.44 124.0 32.9 3.970 2.140 1.280 56
Cur Shrimp 18.90 6.74 1.97 142.0 156.0 1.090 1.660 3.580 57
Fr Shr Wanton 8.72 24.30 26.10 359.0 31.8 3.540 5610 13.900 93
Cur Goat 21.00 4.77 2.24 134.0 57.1 1.040 1.570 1.510 52
Cur King Fish 9.96 8.09 4.52 127.5 35.0 5.680 0.660 1.004 42
Veg Chowmein [3.05 5.04 11.56 966 0.0 0.720 1.190 2.830 63
Cur Duck 9.12 32.90 4.46 346.0 56.0 10.300 14.600 5.790 59
Std Salmon 9.45 7.21 555 126.0 244 1.370 1.830 3.440 71
Veg Callaloo 1.93 11.00 6.01 128.0 36 9.240 0.760 0.200 43
Callaloo 5.79 14.20 464 167.0 16.2 9.140 3.330 0.830 42
Fr Carite 19.30 1.53 12.10 133.0 27.8 0.300 0.280 0.580 83
Std Pork 15.50 21.30 1.94 261.0 66.0 7.590 9690 2.520 79
Kurma 4.12 10.20 60.10 345.0 19 1.800 2.720 5.140 90
Std lamb 11.50 5.61 2.90 103.0 343 1.410 1.760 1.870 56
Pig Tail Soup 10.20 16.00 8.37 218.0 57.0 5.540 7490 1.810 87
Swt Sr Pork 8.14 10.70 9.20 165.0 336 3840 4940 1.190 84
Cnut Ice Cr 5.35 17.50 20.60 252.0 32.2 12.900 3.130 0.460 47
Std Beef 11.10 13.00 5.73 189.0 39.2 4820 5.290 1.440 78
Swt Sr Chkn 6.28 0.41 13.40 91.5 146 0.100 0.090 0.110 83
Bkd King Fish 11.70 3.42 10.10 114.0 42.9 1.110 1.300 0.730 88
Cheese cake 5.39 17.70 27.90 291.0 51.2 11.000 5.130 0820 87
Garlic Shrimp 9.25 3.32 9.20 107.0 63.2 0.510 0.700 1.770 75
Shmp Fr Rice 4.02 5.11 14.00 114.0 41.8 0890 1.370 2.530 65
Orange Cake 4.93 0.31 59.90 259.0 0.0 0.050 0.030 0.120 91
Cur Beef 12.50 6.22 2.72 114.0 342 1.690 2.100 1.500 55
Cur Chataigne 2.90 19.90 14.50 243.6 0.0 13.775 1.749 2.967 28
Egplt Cass 4.13 8.30 13.50 139.0 9.1 2440 2.430 3.020 81
Otml Muf 5.27 8.50 5460 3040 3.2 1.740 2.120 4.330 89
Sawine 4.71 447 23.80 151.0 103 1.830 1.880 0.510 44
Cas Pone 2.45 8.96 31.70 210.0 55 7.240 0.930 0.190 90
Persaud 3.78 7.52 37.20 229.0 21.2 4520 2.070 0.280 82
Barfi 7.59 11.80 41.90 304.0 41.7 7.350 3.450 0.350 75
Kuchla 0.69 9.65 10.50 129.0 0.0 1.090 5.600 2.020 77
Sugar Cake 3.59 34.50 44.90 504.0 0.0 29.900 1.980 0.500 68
Mac Salad 447 10.30 9.45 143.0 97.9 1.300 5.290 3.020 74
Sea Moss 8.27 4.71 84.40 413.0 18.3 2.920 1.360 0.180 80
Crnml Dmplg 5.94 1.98 39.90 188.0 3.6 0.720 0.500 0.510 97
Cur Clfwr 1.24 211 5.70 410 00 0290 0.450 1.130 54
BBq Ribs 14.10 19.10 3.87 244.0 63.1 7.570 8640 1.810 79
Beef Patty 12.20 17.50 14.30 261.0 419 6.100 7.950 1.860 87
Lmn Chkn 11.40 7.67 8.57 145.0 23.5 1.170 2.170 3.870 80 Cur Bodi 7.46 3.67 27.90 171.0 0.0 0490 0.680 2.000 90

Cur Crab
Bnna Brd
Shep Pie
Cur Grn Fg
Cur Tannia
Std pig tail
Std Trky
Pastel
Tuna Fritter
Soursop Punch
Sancoche
Cur Peas
Cur Pork
Chnse Shrimp
Brdft Chips
Veg Striry
Cur Btrmin
Corn Pie
Std Pgn Peas
Cur Channa
Fig Punch
Souse
Cheese Puffs
Nut Balls
Mngo Chtny
Plntn Chips
Prvsn Sp
Fried Bake
Tmto Chka
Fish Broth
Fried Aloo
Bf Lasagne
Chkn Lasagne
Veg Lasagne
Chkn Pie
Cheese Pie
Veg Pie
Dhall Pie
Banana Punch
Peanut Punch
Whtgrm Muf
Std Soya
Soya Wanton
Orange Pie
Popcorn Candy
Chkn Ft Soup
Cowhd Soup
5.64
4.90
7.10
4.64
1.64
13.60
14.30
6.21
13.70
1.42
7.75
1.86
13.80
11.50
0.32
1.25
1.49
4.54
3.39
3.93
2.77
15.30
7.92
18.90
8.22
0.36
2.04
3.16
0.98
8.30
1.71
10.70
13.30
10.90
12.80
19.60
3.41
6.24
3.34
8.51
7.90
9.12
6.91
3.33
1.05
3.01
3.82
5.33
17.80
7.11
11.20
2.10
29.50
6.03
7.54
36.60
1.18
0.49
0.39
20.30
5.87
68.00
1.64
4.73
1.87
3.60
4.35
2.56
18.10
24.80
6.83
3.96
68.00
1.35
53.70
2.65
0.47
5.11
10.60
9.36
10.20
12.20
23.10
12.40
16.20
3.63
14.50
9.81
6.34
3.23
10.30
5.26
1.53
2.19
4.11
43.00
9.55
12.60
22.30
1.94
5.09
15.70
5.21
17.30
14.00
9.02
2.00
6.65
8.11
7.38
9.71
11.80
14.60
16.70
31.30
1.32
11.30
60.00
38.54
8.88
13.10
23.80
5.34
3.96
13.30
10.30
9.85
11.30
21.10
22.20
23.20
29.30
16.80
22.10
33.30
6.67
9.56
32.70
92.10
12.50
12.40
84.8
345.0
127.0
164.0
108.0
326.0
129.0
148.0
404.0
77.2
84.4
38.8
244.0
132.0
646.0
41.8
78.2
78.4
101.0
109.0
152.0
229.0
299.0
373.0
219.7
649.0
70.2
587.0
45.1
51.2
101.0
175.0
173.0
176.0
241.0
370.0
210.0
279.0
111.0
248.0
242.0
114.0
91.4
235.0
415.0
73.3
82.4
10.9
36.0
21.3
5.6
0.0
102.0
41.0
20.0
17.8
4.0
11.9
0.0
57.9
81.6
0.0
0.0
0.0
5.8
0.0
0.0
8.6
103.0
25.8
8.6
3.2
0.0
0.0
0.0
0.0
14.9
0.0
42.9
43.5
38.3
29.1
36.0
4.5
5.9
13.5
12.9
3.0
0.0
1.2
9.2
0.0
16.0
3.3
4.000
8.750
2.940
8.080
0.300
10.000
1.450
2.720
5.080
0.650
0.120
0.030
6.860
0.900
9.780
0.231
0.600
1.080
0.540
0.480
1.530
6.260
6.070
1.120
0.903
9.770
0.200
7.730
0.380
0.110
0.740
5.260
5.130
5.630
4.180
11.400
3.830
5.000
2.230
4.170
1.600
0.920
0.480
3.920
0.600
0.270
0.640
0.380
4.810
2.490
0.880
0.190
13.600
2.040
3.130
10.800
0.290
0.080
0.020
8.840
1.270
15.800
0.346
0.950
0.530
0.790
0.790
0.650
8.500
10.100
3.290
2.237
15.800
0.300
12.500
0.590
0.090
1.170
3.430
2.660
2.900
4.920
8.050
4.640
6.080
1.040
6.320
2.580
1.420
0.700
4.080
1.510
0.340
0.670
0.430
3.180
1.010
1.370
0.850
3.810
1.940
0.950
19.100
0.040
0.150
0.080
3.050
3.200
39.300
0.893
2.370
0.160
2.050
1.900
0.150
1.970
7.680
2.060
0.473
39.300
0.740
31.000
1.490
0.150
2.930
1.050
0.960
1.020
2.410
2.480
3.250
4.260
0.140
3.330
5.090
3.590
1.760
1.780
2.900
0.760
0.720
43
91
76
69
73
58
67
94
99
59
79
69
60
76
70
59
55
70
16
51
65
59
83
70
96
80
90
100
54
80
76
21
22
23
97
93
94
84
55
68
88
56
93
89
87
90
89
179

Geera Pork
Anapas
Tamarind Sce
Jalabi
Upma
Channa Pie
Pepper Shrimp
Frd Bodi
Cur Pgn Peas
Chex Mix
Std Tuna
Cur Carite
Cur Red Fish
Cur Branch Fish
Std King Fish
Std Red Fish
Std Carite
Frd Strpd Fish
Frd Herring
Frd Jashwar
Frd Branch Fish
Pommerac
Coconut jelly
Chennette
Lychee
Caimit
Pewah
Karela
Ackee
Sugar cane
kush kush
2.81
0.28
1.37
5.93
6.30
9.79
11.60
3.50
12.80
13.10
9.07
9.48
6.64
7.33
9.38
7.02
11.50
11.60
11.90
10.20
0.60
4.00
1.10
0.90
0.80
1.20
1.60
2.90
0.30 1.50
12.30 16.20
58.60
0.06
46.60
48.80
18.00
3.58
5.66
5.14
16.20
4.06
3.99
4.07
4.60
2.53
3.21
2.67
13.10
16.40
18.80
15.30
0.10
24.80
0.20
0.10
1.60
0.20
0.20
15.20
0.00
0.20
2.83 205.0 50.7 5.770 7.390
25.90
17.80
31.50
28.20
32.40
6.91
40.90
13.40
63.80
4.75
4.90
4.79
5.88
5.14
4.94
4.89
12.40
12.40
12.40
15.50
8.00
8.30
19.90
15.80
14.50
20.20
4.40
0.80
18.00
27.90
628.0
69.9
549.0
572.0
305.0
103.0
259.0
111.0
439.0
106.0
88.1
90.1
87.1
70.8
84.8
72.7
211.0
241.0
264.0
238.0
32.5
266.4
80.2
61.7
71.6
81.8
11.4
140.8
73.2
119.4
5.2
0.0
0.0
1.4
6.3
67.3
0.0
0.0
0.0
19.7
15.8
15.8
42.6
26.5
15.9
13.6
39.1
29.3
34.2
50.4
0.0
1.4
0.0
0.0
0.0
0.0
0.0
8.8
0.0
0.0
9.620
0.030
6.710
7.230
5.380
0.560
0.780
0.800
2.200
0.730
1.080
1.100
1.240
0.400
0.500
0.420
1.960
2.710
3.310
2.200
0.000
0.580
0.000
0.000
0.000
0.000
0.000
2.720
0.000
0.000
14.300
0.020
10.800
11.500
6.630
0.760
1.110
1.010
5.920
0.970
0.730
0.750
0.860
0.570
0.720
0.600
3.070
4.580
5.420
3.530
0.000
0.000
0.000
0.000
0.000
0.000
0.000
0.000
0.000
0.000
1.710
31.900
0.010
26.900
27.500
4.860
1.900
3.280
2.940
5.290
2.100
1.670
1.730
1.950
1.360
1.710
1.430
7.240
7.900
9.190
8.670
0.000
0.000
0.000
0.000
0.000
0.000
0.000
0.000
0.000
0.000
65
100
77
90
54
84
66
96
13
116
61
54
53
54
68
68
67
94
94
94
94
60
21
86
86
14
72
100
80
86
74
180

APPENDIX G
Chi square tests
G.1 Gender by ethnicity: All subjects
G.2 CEL by ethnicity: All subjects
G.3 Occupation by ethnicity: All subjects
G.4 CEL by gender: All subjects
G.5 Occupation by gender: All subjects
G.5.1 Occupation by gender (professional category omitted: All subjects
G.5.2: Occupation by gender (housewife/husband category omitted): All subjects
G.6 CEL by ethnicity: Females
G.7 Occupation by ethnicity: Males
G.7.1 Occupation by ethnicity: Females
G.8 Study data vs. reference data: Gender
G.9 Study data vs. reference data: Ethnicity
G.10 Study data vs. reference data (primary school, none and other combined): CEL
G.10.1 Study data vs. reference data (none and other omitted): CEL
181

G.l
GENDER BY ETHNICITY: ALL SUBJECTS
The FREQ Procedure
Table of SOURCE by ETHNICITY
SOURCE ETHNICITY
Frequency
Percent
Row Pct
Col Pct AF OT SA Total
FEMALE 29 15 48 92
19.08 9,87 31.58 60.53
31.52 16.30 52.17
59.18 60.00 61.54
MALE 20 10 30 60
13.16 6.58 19.74 39.47
33.33 16.67 50.00
40.82 40.00 38.46
Total 49 25 78 152
32.24 16.45 51.32 100.00
Statistics for Table of SOURCE by ETHNICITY
Statistic DF Value Prob
Chi-Square 0.0733 0.9640
Likelihood Ratio Chi-Square 0.0733 0.9640
Mantel-Haenszel Chi-Square 0.0717 0.7889
Phi Coefficient 0.0220
Contingency Coefficient 0.0220
Cramer's V 0.0220
Sample Size 152
182

G.2
CEL BY ETHNICITY ALL SUBJECTS'
Statistics for Table of SOURCE by ETHNICITY
The FREQ Procedure
Table of SOURCE by ETHNICITY
SOURCE ETHNICITY
Frequency
Percent
Row Pct
Col Pct AF SA
PRIMARY 9 17
7.20 13.60
34.62 65.38
19.15 21.79
SECONDAR 30 43
24.00 34.40
41.10 58.90
63.83 55.13
TERTIARY 8 18
6.40 14.40
30.77 69.23
17.02 23.08
Total 47 78
37.60 62.40
1
Total
26
20.80
73
58.40
26
20.80
125
00.00
Statistic DF Value Prob
Chi-Square 2 0.9960 0.6077
Likelihood Ratio Chi-Square 2 1.0077 0.6042
Mantel-Haenszel Chi-Square 1 0.0813 0.7755
Phi Coefficient 0.0893
Contingency Coefficient 0.0889
Cramer's V 0.0893
Sample Size = 125
' Ethnic group “other” ommitted
183

G.3 OCCUPATION BY ETHNICITY ALL SUBJECTS?
Statistics for Table of SOURCE by ETHNICITY
The FREQ Procedure
Table of SOURCE by ETHNICITY
SOURCE ETHNICITY
Frequency
Percent
Row Pct
Col Pct |AF SA
CLERICAL 10 13
7.87 10.24
43.48 56.52
20.41 16.67
HOUSEWIF 14 25
11.02 19.69
35.90 64.10
28.57 32.05
OTHER 6 14
4.72 11.02
30.00 70.00
12.24 17.95
PROFESSI 5 10
3.94 7.87
33.33 66.67
10.20 12.82
SKILLED 8 16
6.30 12.60
33.33 66.67
16.33 20.51
UNSKILLE 6 0
4.72 0.00
100.00 0.00
12.24 0.00
Total 49 78
38.58 61.42
Total
23
18.11
39
30.71
20
15.75
15
11.81
24
18.90
127
100.00
Statistic DF Value Prob
Chi-Square 5 10.9775 0.0518
Likelihood Ratio Chi-Square 5 12.8831 0.0245
Mantel-Haenszel Chi-Square 1 0.6059 0.4364
Phi Coefficient 0.2940
Contingency Coefficient 0.2821
Cramer's V 0.2940
Sample Size = 127
* Ethnic group “other” omitted.
184

G.4
CEL BY GENDER ALL SUBJECTS 3
The FREQ Procedure
Table of SOURCE by GENDER
SOURCE GENDER
Frequency
Percent
Row Pct
Col Pct FEMALE MALE Total
PRIMARY 20 9 29
13.33 6.00 19.33
68.97 31.03
21.74 15.52
SECONDAR 57 35 92
38.00 23.33 61.33
61.96 38.04
61.96 60.34
TERTIARY 15 14 29
10.00 9.33 19.33
51.72 48.28
16.30 24.14
Total 92 58 150
61.33 38.67 100.00
Statistics for Table of SOURCE by GENDER
Statistic DF Value Prob
Chi-Square 2 1.8565 0.3952
Likelihood Ratio Chi-Square 2 1.8513 0.3963
Mantel-Haenszel Chi-Square 1 1.8054 0.1791
Phi Coefficient 0.1112
Contingency Coefficient 0.1106
Cramer's V 0.1112
Sample Size = 150
> CEL category “other” omitted.
185

G.5 OCCUPATION BY GENDER ALL SUBJECTS
The FREQ Procedure
Table of SOURCE by GENDER
SOURCE GENDER
Frequency
Percent
Row Pct
Col Pct FEMALE |MALE
CLERICAL 16 12
10.53 7.89
57.14 42.86
17.39 20.00
HOUSEWIF 41 2
26.97 1.32
95.35 4.65
44.57 3.33
OTHER 16 9
10.53 5.92
64.00 36.00
17.39 15.00
PROFESSI 4 15
2,63 9.87
21.05 78.95
4.35 25.00
SKILLED 14 17
7.24 11.18
39.29 60.71
11.96 28.33
UNSKILLE 4 5
2.63 3.29
44.44 55.56
4.35 8.33
Total 92 60
60.53 39.47
Statistics for Table of SOURCE by GENDER
Total
28
18.42
43
28.29
25
16.45
19
12.50
28
18.42
152
100.00
Statistic DF Value Prob
Chi-Square 5 40.7375 <.0001
Likelihood Ratio Chi-Square 5 47.3951 <.0001
Mantel-Haenszel Chi-Square 1 5.3587 <.0001
Phi Coefficient 0.5177
Contingency Coefficient 0.4597
Cramer's V 0.5177
Sample Size = 152
186

G.5.1
OCCUPATION BY GENDER ALL SUBJECTS*
The FREQ Procedure
Table of SOURCE by GENDER
SOURCE GENDER
Frequency
Percent
Row Pct
Col Pct FEMALE MALE
CLERICAL 16 12
12.03 9.02
57.14 42.86
18.18 26.67
HOUSEWIF 41 2
30.83 1.50
95.35 4.65
46.59 4.44
OTHER 16 9
12.03 6.77
64.00 36.00
18.18 20.00
SKILLED 11 17
8.27 12.78
39.29 60.71
12.50 37.78
UNSKILLE 4 5
3.01 3.76
44.44 55.56
4.55 11.11
Total 88 45
66.17 33.83
Statistics for Table of SOURCE by GENDER
1
Total
28
21.05
43 32.33
25
18.80
28
21.05
133
00.00
Statistic DF Value Prob
Chi-Square 4 28.3628 <.0001
Likelihood Ratio Chi-Square 4 33.2447 <.0001
Mantel-Haenszel Chi-Square 1 8.0304 0.0046
Phi Coefficient 0.4618
Contingency Coefficient 0.4192
Cramer's V 0.4618
Sample Size = 133
“ Occupation category “professional” omitted.
187

G.5.2
OCCUPATION BY GENDER ALL SUBJECTS?
The FREQ Procedure
Table of SOURCE by GENDER
SOURCE GENDER
Frequency
Percent
Row Pct Col Pct FEMALE MALE Total
CLERICAL 16 12 28
14.68 11.01 25.69
57.14 42.86
31.37 20.69
OTHER 16 9 25
14.68 8.26 22.94
64.00 36.00
31.37 15.52
PROFESSI 4 15 19
21.05 78.95
SKILLED 11 17 28
10.09 15.60 25.69
39.29 60.71
21.57 29.31
UNSKILLE 4 5 9
3.67 4.59 8.26
44.44 55.56
7.84 8.62
Total 51 58 109
46.79 53.21 100.00
Statistics for Table of SOURCE by GENDER
Statistic DF Value Prob
Chi-Square 4 9.8879 0.0424
Likelihood Ratio Chi-Square 4 10.2998 0.0357
Mantel-Haenszel Chi-Square 1 3.3422 0.0675
Phi Coefficient 0.3012
Contingency Coefficient 0.2884
Cramer's V 0.3012
Sample Size = 109
> Occupation category “housewife/husband omitted.
188

G.6 CEL BY ETHNICITY FEMALES®
Statistics for Table of SOURCE by ETHNICITY
The FREQ Procedure
Table of SOURCE by ETHNICITY
SOURCE ETHNICITY
Frequency
Percent
Row Pct
Col Pct AF SA
PRIMARY 5 13
6.49 16.88
27.78 72.22
17.24 27.08
SECONDAR 20 25
25.97 32.47
44.44 55.56
68.97 52.08
TERTIARY 4 10
5.19 12.99
28.57 71.438
13.79 20.83
Total 29 48
37.66 62.34
{
Total
18
23.38
45
58.44
14
18.18
77
00.00
Statistic DF Value Prob
Chi-Square 2 2.1235 0.3458
Likelihood Ratio Chi-Square 2 2.1592 0.3397
Mantel-Haenszel Chi-Square 1 0.0339 0.8539
Phi Coefficient 0.1661
Contingency Coefficient 0.1638
Cramer's V 0.1661
° Ethnic group “other “ omitted.
Sample Size = 77
189

G.7
OCCUPATION BY ETHNICITY MALES’
The FREQ Procedure
Table of SOURCE by ETHNICITY
SOURCE ETHNICITY
Frequency
Percent
Row Pct
Col Pct |AF SA Total
HOUSEOTH 4 6 10
8.00 12.00 20.00
40.00 60.00
20.00 20.00
PROFCLER 9 13 22
18.00 26.00 44,00
40.91 59.09
45.00 43.33
SKILUNSK 7 11 18
14.00 22.00 36.00
38.89 61.11
35.00 36.67
Total 20 30 50
40.00 60.00 100.00
Statistics for Table of SOURCE by ETHNICITY
Statistic DF Value Prob
Chi-Square 2 0.0168 0.9916
Likelihood Ratio Chi-Square 2 0.0168 0.9916
Mantel-Haenszel Chi-Square 1 0.0061 0.9377
Phi Coefficient 0.0183
Contingency Coefficient 0.0183
Cramer's V 0.0183
Sample Size = 50
’ Ethnic group “other” omitted; occupation categories “housewife/husband” and “other” combined,
“professional” and “clerical” combined and “skilled” and “unskilled” combined.
190

G.7.1
OCCUPATION BY ETHNICITY FEMALES®
The FREQ Procedure
Table of SOURCE by ETHNICITY
SOURCE ETHNICITY
Frequency
Percent
Row Pct
Col Pct |AF SA
HOUSEOTH 16 32
20.78 41.56
33.33 66.67
55.17 66.67
PROFCLER 6 V1
7.79 14.29
35.29 64.71
s 20.69 22.92
SKILUNSK 7 5
9,09 6.49
58.33 41.67
24.14 10.42
Total 29 48
37.66 62.34
Statistics for Table of SOURCE by ETHNICITY
1
Total
48 62.34
17
22.08
12
15.58
77
00.00
Statistic DF Value Prob
Chi-Square 2 2.6077 0.2715
Likelihood Ratio Chi-Square 2 2.5271 0.2826
Mantel-Haenszel Chi-Square 1 2.0236 0.1549
Phi Coefficient 0.1840
Contingency Coefficient 0.1810
Cramer's V 0.1840
* Ethnic group “other” omitted; occupation categories “housewife/husband” and “other” combined, “professional” and “clerical” combined and “skilled” and “unskilled” combined.
Sample Size = 77
191

G.8
STUDY VS REF GENDER The FREQ Procedure
Table of SOURCE by GENDER
SOURCE GENDER
Frequency
Percent
Row Pct
Col Pct F M
REF 78 74
25.66 24.34
51.32 48.68
45.88 55.22
STUDY 92 60
30.26 19.74
60.53 39.47
54.12 44.78
Total 170 134
55.92 44.08
Statistics for Table of SOURCE by GENDER
{
Total
152
50.00
152
50.00
304
00.00
Statistic DF Value Prob
Chi-Square 1 2.6156 0.1058
Likelihood Ratio Chi-Square 1 2.6196 0.1056
Continuity Adj. Chi-Square 1 2.2553 0.1332
Mantel-Haenszel Chi-Square 1 2.6070 0.1064
Phi Coefficient 0.0928
Contingency Coefficient 0.0924
Cramer's V 0.0928
Fisher's Exact Test
Cell (1,1) Frequency (F) 78 Left-sided Pr <= F 0.0665
Right-sided Pr >= F 0.9585
Table Probability (P) 0.0250
Two-sided Pr <= P 0.1330
Sample Size = 304
192

G9 STUDY VE REF ETHNICITY
The FREQ Procedure
Table of SOURCE by ETHNICITY
SOURCE ETHNICITY
Frequency
Percent
Row Pct
Col Pct AF OT SA
REF 58 29 65
19.08 9.54 21.38
38.16 19.08 42.76
54.21 53.70 45.45
STUDY 49 25 78
16.12 8.22 25.66
32.24 16.45 51.32
45.79 46.30 54.55
Total 107 54 143
35.20 17.76 47.04
Statistics for Table of
1
193
Total
152
50.00
152
50.00
304
00.00
SOURCE by ETHNICITY
Statistic DF Value Prob
Chi- Square 2 2.2351 0.3271
Likelihood Ratio Chi-Square 2 2.2379 0.3266
Mantel-Haenszel Chi-Square 1 1.9631 0.1612
Phi Coefficient 0.0857
Contingency Coefficient 0.0854
Cramer's V 0.0857
Sample Size = 304

G.10
STUDY VS REF CEL® The FREQ Procedure
Table of SOURCE by CEL
SOURCE CEL
Frequency
Percent
Row Pct
Col Pct REF STUDY
PRINONEO 81 31
26.64 10.20
72,32 27.68
53.29 20.39
SECONDAR 65 92
21.38 30.26
41.40 58.60
42.76 60.53
TERTIARY 6 29
1.97 9.54
17.14 82.86
3.95 19.08
Total 152 152
50.00 50.00
Statistics for Table of SOURCE by CEL
1
Total
112
36.84
157
51.64
35
11.51
, 304
00.00
Statistic DF Value Prob
Chi-Square 2 42.0790 <.0001
Likelihood Ratio Chi-Square 2 44,2459 <.0001
Mantel-Haenszel Chi-Square 1 41.6597 <.0001
Phi Coefficient 0.3720
Contingency Coefficient 0.3487
Cramer's V 0.3720
9 : : . CEL categories “primary, “none” and “other” combined.
Sample Size = 304
194

G.11
STUDY VS REF CEL" The FREQ Procedure
Table of SOURCE by CEL
SOURCE CEL
Frequency
Percent
Row Pct
Col Pct REF STUDY
PRIMARY 75 29
25.34 9.80
72.12 27.88
51.37 19.33
SECONDAR 65 92
21.96 31.08
41.40 58.60
44.52 61.33
TERTIARY 6 29
2.03 9.80
17.14 82.86
4.11 19.33
Total 146 150
49.32 50.68
Statistics for Table of SOURCE by CEL
1
Total
104
35.14
157
53.04
35
11.82
296
00.00
Statistic DF Value Prob
Chi-Square 2 40.0570 <.0001
Likelihood Ratio Chi-Square 2 42.1303 <.0001
Mantel-Haenszel Chi-Square 1 39.6607 <.0001
Phi Coefficient 0.3679
Contingency Coefficient 0.3452
Cramer's V 0.3679
'° CEL categories “none” and “other” omitted.
Sample Size = 296
195

APPENDIX H
Shapiro-Wilk scores and measures of skewness and kurtosis for macronutrients estimated from FR’s and the FFQ
H.1 All subjects
H.2 Males
H.3 Females
H.4 African’s
H.5 South Asian’s
H.6 FFQ 1" group
H.7 FFQ 2™ group
196

197
Table H.1 Shapiro-Wilk scores and measures of skewness and kurtosis for macronutrients estimated
from FR’s and the FFQ for all subjects.
Shapiro-Wilk | Skewness Kurtosis Shapiro-Wilk Skewness Kurtosis (p-value) FR FR (p-value) FFQ FFQ
FR FFQ
Pro (g) 0.97 0.64 0.61 0.92 1.51 6.56 (0.0034) (<0.0001)
Fat (g) 0.96 0.80 0.77 0.93 1.11 2.11 (0.0003) (<0.0001)
Tcarb (g) 0.94 1.15 3.27 0.90 1.59 5.30 (<0.0001) (<0.0001)
AvCarb (g) 0.94 1.23 3.65 0.90 1.61 5.22 (<0.0001) (<0.0001)
Energy (Kceal) 0.95 0.96 1.81 0.92 1.37 3.87 (<0.0001) (<0.0001)
Fiber (g) 0.98 0.49 0.17 0.93 1.30 3.87 (0.0174) (<0.0001)
Chol (g) 0.93 1.23 2.99 0.92 1.42 5.75 (<0.0001) (<0.0001)
SFA (g) 0.96 0.80 0.77 0.93 1.14 2.41 (0.0002) (<0.0001)
MEA (g) 0.95 0.96 1.22 0.96 0.87 1.59 (<0.0001) (0.0002)
PUFA (g) 0.95 0.89 0.87 0.90 1.50 3.44 (<0.0001) (<0.0001)
Ale (g) 0.22 6.97 54.99 0.38 7.53 73.62 (<0.0001) (<0.0001)
GI 0.98 -0.42 0.46 0.91 -0.76 3.70 (0.0234) (<0.0001)
p-values <0.05 indicate that a distribution differs significantly from normal.

198
Table H.1.1 Shapiro-Wilk scores and measures of skewness and kurtosis for macronutrients expressed
as a percentage of total energy estimated from FR’s and the FFQ for all subjects.
Shapiro-Wilk | Skewness Kurtosis Shapiro-Wilk Skewness Kurtosis
(p-value) FR FR (p-value) FFQ FFQ
FR FFQ
Pro% 0.98 0.57 0.91 0.98 0.13 0.25 (0.0105) (0.1074)
Fat% 0.98 -0.32 1.01 0.97 -0.61 0.39 (0.0136) (0.0031)
Carb% 0.99 -0.11 0.26 0.98 0.56 0.47 (0.7637) (0.0156)
Fiber 0.95 1.06 2.42 0.93 1.09 1.57 ¢/1000kcal (<0.0001) (<0.0001)
Chol 0.94 1.17 4.42 0.97 0.18 1.82 mg/1000kcal (<0.0001) (0.0017)
SFA% 0.99 2.86 0.32 0.97 0.29 2.11
(0.4590) (0.0017)
MFA% 0.99 -0.24 0.46 0.98 -0.50 0.07 (0.7633) (0.0179)
PUFA% 0.99 0.18 -0.41 0.99 0.28 0.28 (0.3845) (0.37)
P:S 0.95 0.94 1.19 0.97 0.73 1.61
(<0.0001) (0.0015)
Ale% 0.19 7.38 61.72 0.48 5.42 42.59 (<0.0001) (<0.0001)
p-values <0.05 indicate that a distribution differs significantly from normal

199
Table H.2 Shapiro-Wilk scores and measures of skewness and kurtosis for macronutrients estimated
from FR’s and the FFQ for Males.
Shapiro-Wilk | Skewness Kurtosis Shapiro-Wilk Skewness Kurtosis (p-value) FR FR (p-value) FFQ FFQ
FR FFQ
Pro (g) 0.99 0.26 0.29 0.89 1.6 6.4
(0.85) (<0.01)
Fat (g) 0.97 0.47 0.02 0.94 0.98 1.72
(0.26) (0.006)
Tcarb (g) 0.98 —— -0.003 -0.7 0.92 1.2 2.2 (0.44) (0.0008)
AvCarb (g) 0.98 0.04 -0.7 0.93 0.97 2.06
(0.59) (0.003)
Energy (Kceal) 0.99 0.18 -0.5 0.93 1.13 2.78
(0.81) (0.003)
Fiber (g) 0.98 0.14 -0.47 0.94 0.89 0.84 (0.53) (0.009)
Chol (g) 0.95 0.97 2.05 0.91 1.34 4.77
(0.01) (0.0004)
SFA (g) 0.98 0.46 -0.008 0.93 1.07 2.24
(0.42) (0.003)
MFA (g) 0.95 0.76 0.46 0.96 0.73 1.74
(0.02) (0.05)
PUFA (g) 0.97 0.66 0.43 0.90 1.34 2.11 (0.14) (0.0001)
Ale (g) 0.32 4.5 21.9 0.41 5.62 37.28 (<0.01) (<0.01)
GI 0.98 0.06 -0.62 0.93 -0.66 3.91
(0.45) (0.002) p-values <0.05 indicate that a distribution differs significantly from normal

200
Table H.2.1 Shapiro-Wilk scores and measures of skewness and kurtosis for macronutrients expressed
as a percentage of total energy estimated from FR’s and the FFQ for Males.
Shapiro-Wilk | Skewness Kurtosis Shapiro-Wilk Skewness Kurtosis
(p-value) FR FR (p-value) FFQ FFQ
FR FFQ
Pro% 0.94 0.88 1.76 0.84 -0.20 8.36
(0.009) (<0.01)
Fat% 0.95 -0.9 1.9 0.91 0.79 5.0
(0.02) (0.0005)
Carb% 0.98 -0.3 -0.13 0.83 -2.0 11.35
(0.69) (<0.01)
Fiber 0.97 0.56 0.54 0.78 2.59 10.04
g/1000kcal (0.24) (<0.01)
Chol 0.87 1.8 5.6 0.94 0.52 2.44
mg/1000kcal (<0.01) (0.009)
SFA% 0.99 -0.08 0.08 0.95 -0.12 0.93
(0.88) (0.02)
MFA% 0.98 -0.41 0.94 0.94 0.12 2.35
(0.55) (0.009)
PUFA% 0.98 0.04 -0.58 0.93 1.07 3.23
(0.57) (0.003)
P:S 0.94 0.99 1.23 0.96 0.68 0.86 (0.005) (0.05)
Alc% 0.30 4.6 23.6 0.49 3.95 17.34
(<0.01) (<0.01) p-values <0.05 indicate that a distribution differs significantly from normal

201
Table H.3 Shapiro- Wilk scores and measures of skewness and kurtosis for macronutrients estimated
from FR’s and the FFQ for Females.
Shapiro-Wilk | Skewness Kurtosis Shapiro-Wilk Skewness Kurtosis
(p-value) FR FR (p-value) FFQ FFQ
FR FFQ
Pro (g) 0.96 0.87 1.32 0.96 0.74 1.90 (0.004) (0.009)
Fat (g) 0.94 1.03 1.74 0.93 1.15 2.53 (0.0004) (<0.01)
Tcarb (g) 0.89 1.65 4,82 0.87 1.98 9.76 (<0.01) (<0.01)
AvCarb (g) 0.88 1.74 5.36 0.87 1.96 9.61 (<0.01) (<0.01)
Energy (Keal) 0.91 1.45 3.78 0.92 1.34 4.82 (<0.01) (<0.01)
Fiber (g) 0.96 0.67 0.56 0.90 1.63 6.46 (0.01) (<0.01)
Chol (g) 0.92 1.38 4.17 0.96 0.80 2.70 (<0.01) (0.004)
SFA (g) 0.94 1.05 1.88 0.94 1.02 2.04 (0.0004) (0.0007)
MEA (g) 0.94 1.07 2.07 0.95 0.90 1.51 (0.0003) (0.002)
PUFA (g) 0.93 1.05 1.35 0.89 1.62 5.06 (0.0001) (<0.01)
Alc (g) 0.31 6.23 46.38 0.59 2.37 5.50 (<0.01) (<0.01)
GI 0.97 -0.59 0.61 0.89 -0.76 3.65
(0.04) (<0.01) p-values <0.05 indicate that a distribution differs significantly from normal

202
Table H.3.1 Shapiro-Wilk scores and measures of skewness and kurtosis for macronutrients expressed
as a percentage of total energy estimated from FR’s and the FFQ for Females.
Shapiro-Wilk | Skewness Kurtosis Shapiro-Wilk Skewness Kurtosis (p-value) FR FR (p-value) FFQ FFQ
FR FFQ
Pro% 0.99 0.31 0.26 0.97 0.54 0.92
(0.56) (0.04)
Fat% 0.98 0.34 -0.51 0.97 -0.60 0.41 (0.11) (0.04)
Carb% 0.99 -0.01 0.47 0.98 0.45 0.29 (0.70) (0.30)
Fiber 0.93 1.18 2.69 0.93 1.02 1.09 g/1000kcal (0.0002) (0.0001)
Chol 0.99 0.07 0.07 0.94 0.66 3.82 mg/1000kcal (0.68) (0.0005)
SFA% 0.98 0.53 0.51 0.96 0.72 3.17 (0.14) (0.004)
MFA% 0.99 -0.07 -0.16 0.97 -0.43 -0.32 (0.72) (0.06)
PUFA% 0.97 0.42 -0.46 0.99 0.27 0.11 (0.06) (0.66)
P:S 0.95 0.96 1.17 0.96 0.76 1.98 (0.0009) (0.01)
Ale% 0.31 6.03 43.77 0.57 2.77 8.74 (<0.01) (<0.01)
p-values <0.05 indicate that a distribution differs significantly from normal

203
Table H.4 Shapiro- Wilk scores and measures of skewness and kurtosis for macronutrients estimated
from FR’s and the FFQ for African’s.
Shapiro-Wilk | Skewness Kurtosis Shapiro-Wilk Skewness Kurtosis (p-value) FR FR (p-value) FFQ FFQ
FR FFO
Pro (g) 0.94 1.0 1.68 0.95 0.89 2.50 (0.01) (0.04)
Fat (g) 0.94 0.81 0.24 0.96 0.77 0.83 (0.01) (0.10)
Tearb (g) 0.89 1.67 5.41 0.77 2.73 11.97 (0.0002) (<0.01)
AvCarb (g) 0.88 1.77 5.94 0.77 2.77 11.9 (0.0001) (<0.01)
Energy (Keal) 0.90 1.45 3.96 0.85 2.04 8.20 (0.0006) (<0.01)
Fiber (g) 0.95 0.77 0.35 0.83 2.18 8.0 (0.05) (<0.01)
Chol (g) 0.84 1.86 4.96 0.98 0.08 0.11 (<0.01) (0.67)
SFA (g) 0.96 0.74 0.55 0.98 0.44 0.07
(0.09) (0.59)
MFA (g) 0.94 0.58 -0.63 0.97 0.51 -0.09
(0.16) (0.18)
PUFA (g) 0.89 1.17 0.93 0.92 0.95 0.33 (0.0003) (0.002)
Ale (g) 0.27 5.04 26.56 0.72 1.6 2.1 (<0.01) (<0.01)
GI 0.93 -1.06 1.86 0.86 -1.78 5.19
(0.006) (<0.01) p-values <0.05 indicate that a distribution differs significantly from normal

204
Table H.4.1
Shapiro-Wilk scores and measures of skewness and kurtosis for macronutrients expressed
as a percentage of total energy estimated from FR’s and the FFQ for African’s.
Shapiro-Wilk | Skewness Kurtosis Shapiro-Wilk Skewness Kurtosis (p-value) FR FR (p-value) FFQ FFQ
FR FFQ
Pro% 0.99 0.23 0.39 0.97 0.49 0.68 (0.85) (0.19)
Fat% 0.96 0.61 0.09 0.98 -0.31 -0.12 (0.08) (0.63)
Carb% 0.94 -0.79 0.58 0.98 0.21 0.16 (0.02) (0.58)
Fiber 0.97 0.66 0.77 0.96 0.70 0.55 ¢/1000kcal (0.21) (0.15)
Chol 0.97 0.49 0.35 0.97 -0.54 -0.21 mg/1000kcal (0.20) (0.22)
SFA% 0.96 0.48 - 0.87 0.98 -0.39 0.26 (0.14) (0.64)
MFA% 0.98 -0.29 0.06 0.98 -0.18 -0.52
(0.55) (0.62)
PUFA% 0.98 0.37 -0.35 0.96 0.65 1.20 (0.40) (0.07)
P:S 0.96 0.71 0.35 0.96 0.88 1.89
(0.07) (0.07)
Ale% 0.23 5.69 34.4 0.66 2.55 8.50 (<0.01) (<0.01)
p-values <0.05 indicate that a distribution differs significantly from normal

205
Table H.5 Shapiro-Wilk scores and measures of skewness and kurtosis for macronutrients estimated
from FR’s and the FFQ for South Asian’s.
Shapiro-Wilk | Skewness Kurtosis Shapiro-Wilk Skewness Kurtosis
(p-value) FR FR (p-value) FFQ FFQ
FR FFQ
Pro (g) 0.97 0.32 -0.74 0.87 1.88 7.73 (0.05) (<0.01)
Fat (g) 0.95 0.70 0.26 0.92 1.22 2.21 (0.004) (<0.01)
Tcarb (g) 0.97 0.63 0.22 0.92 1.24 3.34 (0.06) (0.0002)
AvCarb (g) 0.97 0.66 0.33 0.92 1.30 3.41 (0.04) (<0.01)
Energy (Kcal) 0.96 0.51 -0.50 0.91 1.47 4.03 (0.03) (<0.01)
Fiber (g) 0.98 0.18 -0.21 0.97 0.73 1.18 (0.50) (0.04)
Chol (g) 0.98 0.32 -0.03 0.89 1.67 5.79
(0.45) (<0.01)
SFA (g) 0.96 0.54 -0.26 0.90 1.43 3.00 (0.03) (<0.01)
MFA (g) 0.92 1.1 1.6 0.94 1.02 1.8 (0.0001) (0.0009)
PUFA (g) 0.94 1.0 1.50 0.89 1.41 2.74 (0.0008) (<0.01)
Alc (g) 0.29 5.0 26.4 0.61 1.95 2.76
(<0.01) (<0.01)
GI 0.98 -0.20 -0.40 0.88 -0.61 4.35
(0.14) (<0.01) p-values <0.05 indicate that a distribution differs significantly from normal

206
Table H.5.1 Shapiro-Wilk scores and measures of skewness and kurtosis for macronutrients expressed as a percentage of total energy estimated from FR’s and the FFQ for South Asian’s.
Shapiro-Wilk | Skewness Kurtosis Shapiro-Wilk Skewness Kurtosis
(p-value) FR FR (p-value) FFQ FFQ
FR FFQ
Pro% 0.99 0.20 0.23 0.90 -1.47 7.07 (0.85) (<0.01)
Fat% 0.98 -0.07 -0.45 0.94 -0.85 0.45 (0.21) (0.001)
Carb% 0.99 0.25 0.02 0.95 0.84 0.74 (0.56) (0.004)
Fiber 0.93 1.2 2.4 0.94 0.94 0.67 ¢/1000kcal (0.0006) (0.0009)
Chol 0.90 1.49 5.47 0.95 0.50 2.86 mg/1000kcal (<0.01) (0.003)
SFA% 0.98 0.39 -0.08 0.98 -0.24 -0.26 (0.47) (0.42)
MFA% 0.99 0.16 -0.22 0.95 -0.75 0.28 (0.91) (0.003)
PUFA% 0.98 0.18 -0.28 0.99 -0.01 -0.29 (0.42) (0.89)
P:S 0.95 0.67 0.16 0.95 0.92 1.44 (0.008) (0.002)
Ale% 0.23 5.67 32.23 0.62 2.03 3.51 (<0.01) (<0.01)
p-values <0.05 indicate that a distribution differs significantly from normal

207
Table H.6 Shapiro-Wilk scores and measures of skewness and kurtosis for macronutrients estimated
from FR’s and the FFQ for the FFQ 1“ group.
Shapiro-Wilk | Skewness Kurtosis Shapiro-Wilk Skewness Kurtosis (p-value) FR FR (p-value) FFQ FFQ
FR FFQ
Pro (g) 0.94 0.86 1.46 0.85 2.10 9.65 (0.002) (<0.01)
Fat (g) 0.97 0.54 -0.22 0.91 1.33 3.01 (0.05) (<0.01)
Tcarb (g) 0.90 1.42 4.49 0.83 2.08 0.87 (<0.01) (<0.01)
AvCarb (g) 0.90 1.54 5.00 0.84 1.78 6.02
(<0.01) (<0.01)
Energy (Kcal) 0.93 1.00 2.06 0.84 1.74 5.67 (0.0009) (<0.01)
Fiber (g) 0.98 0.33 -0.23 0.86 1.79 5.21 (0.34) (<0.01)
Chol (g) 0.91 1.40 3.60 0.88 1.82 8.29 (<0.01) (<0.01)
SFA (g) 0.97 0.53 -0.11 0.92 1.27 3.17 (0.09) (0.0001)
MFA (g) 0.95 0.62 -0.03 0.93 1.17 2.96 (0.009) (0.0005)
PUFA (g) 0.92 1.17 1.64 0.88 1.55 3.25 (0.0001) (<0.01)
Ale (g) 0.14 8.39 71.70 0.61 2.37 5.74 (<0.01) (<0.01)
GI 0.95 -0.71 1.65 0.88 -1.23 3.86 (0.005) (<0.01)
p-values <0.05 indicate that a distribution differs significantly from normal

Table H.6.1
Shapiro-Wilk scores and measures of skewness and kurtosis for macronutrients expressed
208
as a percentage of total energy estimated from FR’s and the FFQ for the FFQ 1* group.
Shapiro-Wilk | Skewness Kurtosis Shapiro-Wilk Skewness Kurtosis
(p-value) FR FR (p-value) FFQ FFQ
FR FFQ
Pro% 0.97 0.45 -0.34 0.88 1.83 7.23 (0.08) (<0.01)
Fat% 0.97 -0.05 0.33 0.91 0.96 5.62 (0.07) (<0.01)
Carb% 0.96 -0.63 0.29 0.82 -2.26 12.62 (0.03) (<0.01)
Fiber 0.97 0.66 0.65 0.83 2.10 6.65 g/1000kcal (0.05) (<0.01)
Chol 0.88 1.77 6.40 0.93 0.95 3.24 mg/1000kcal (<0.01) (0.0006)
SFA% 0.98 0.36 0.53 0.98 1.22 0.69 (0.45) (0.52)
MFA% 0.99 0.01 -0.10 0.97 0.32 2.20 (0.94) (0.05)
PUFA% 0.98 0.20 -0.44 0.95 1.01 2.78
(0.26) (0.005)
P:S 0.93 0.77 -0.17 0.94 1.05 2.84
(0.0009) (0.002)
Alce% 0.13 8.54 73.52 0.48 4.37 24.43 (<0.01) (<0.01)
p-values <0.05 indicate that a distribution differs significantly from normal

209
Table H.7
Shapiro-Wilk scores and measures of skewness and kurtosis for macronutrients estimated
from FR’s and the FFQ for the FFQ 2" group.
Shapiro-Wilk | Skewness Kaurtosis Shapiro-Wilk Skewness Kurtosis FR FR FR FFQ FFQ FFQ
(p-value) (p-value)
Pro (g) 0.97 0.52 0.05 0.96 0.49 -0.45
(0.1) (0.02)
Fat (g) 0.93 1.09 1.93 0.95 0.92 1.32 (0.0004) (0.003)
Tcarb (g) 0.97 0.63 0.77 0.97 0.62 0.14
(0.08) (0.06)
AvCarb (g) 0.97 0.64 0.71 0.96 0.70 0.18
(0.07) (0.01)
Energy (Kcal) 0.96 0.92 1.74 0.96 0.55 -0.39
(0.01) (0.03)
Fiber (g) 0.97 0.65 0.85 0.97 0.22 -0.81 (0.04) (0.09)
Chol (g) 0.93 1.16 2.87 0.96 0.80 1.21 (0.0004) (0.01)
SFA (g) 0.93 1.14 2.15 0.94 0.96 1.37
(0.0003) (0.002)
MFA (g) 0.91 1.28 2.20 0.97 0.62 0.52 (<0.01) (0.05)
PUFA (g) 0.96 0.55 -0.11 0.90 1.49 3.93
(0.02) (<0.01)
Alc (g) 0.38 5.54 33.90 0.31 7.14 57.36 (<0.01) (<0.01)
GI 0.98 -0.12 -0.67 0.92 -0.33 3.72
(0.21) (<0.01) p-values <0.05 indicate that a distribution differs significantly from normal

210
Table H.7.1 Shapiro-Wilk scores and measures of skewness and kurtosis for macronutrients expressed as a percentage of total energy estimated from FR’s and the FFQ for the FFQ 2nd group.
Shapiro-Wilk | Skewness Kurtosis Shapiro-Wilk Skewness Kurtosis (p-value) FR FR (p-value) FFQ FFQ
FR FFQ
Pro% 0.95 0.67 1.86 0.90 -1.41 6.36 (0.003) (<0.01)
Fat% 0.97 -0.47 1.33 0.98 -0.54 0.22 (0.09) (0.16)
Carb% 0.99 0.22 0.04 0.97 0.66 0.45 (0.89) (0.06)
Fiber 0.92 1.33 3.52 0.96 0.70 0.13 ¢/1000kcal (0.0001) (0.01)
Chol 0.99 0.13 0.02 0.97 -0.45 -0.19 mg/1000keal (0.75) (0.09)
SFA% 0.99 0.07 0.11 0.93 0.84 4.35 (0.72) (0.0007)
MFA% 0.99 -0.18 0.14 0.96 -0.60 -0.03 (0.90) (0.03)
PUFA% 0.99 0.15 -0.34 0.98 0.34 0.44 (0.93) (0.46)
P:S 0.92 1.13 2.35 0.97 0.39 0.20 (0.0001) (0.04)
Ale% 0.25 5.9 38.9 0.40 6.07 44.47 (<0.01) (<0.01)
p-values <0.05 indicate that a distribution differs significantly from normal

APPENDIX I
Frequency distributions for macronutrient and % macronutrient data from FR’s
and FFQ’s
211

Figure I.1
212
Frequency Distributions for Protein (g) from 7-day Food Record and FFQ data. oa
®
oO oO
i 4
Frequency ih
oO
f
>
N
wo
oO oO
So Qo
\ !
L L
—@— ProFR
—t— Pro FFQ
12 3 4 5 6 7 8 9 10 11 12
Protein
Intake ranges divided into 12 equal intervals’
Median values of intervals from intake
ranges for protein from FR’s and FFQ’s
Intervals of Protein Protein
intake FR FFQ
ranges
1 33.9 29.7
2 43.9 54.0
3 54.0 78.4
4 64.0 102.7
5 74.0 127.0
6 84.0 151.4
7 94.0 175.7
8 104.0 200.0
9 114.0 224.4
10 124.0 248.8 11 134.0 273.1
12 144.1 297.4
' Number of intervals determined automatically by Microsoft excel, Windows 2000.

213
Figure [.2
Frequency Distributions for Total Carbohydrate (g) from 7-day Food Record and FFQ
data.
60 -
50 + —@— Tcarb FR
fig Tcarb FFQ 40 +
30 5
Freq
uenc
y
20 5
10 - 12 3 4 5 6 7 8 9 10 11 12
Total carbohydrate
Intake ranges divided into 12 equal intervals’
Median values of intervals from intake
ranges for total carbohydrate from FR’s
and FFQ’s
Intervals of Tearb Tearb
intake FR FFQ
ranges
1 72.0 66.3
2 118.4 147.0
3 164.7 227.8
4 211.0 308.6
5 257.4 389.3
6 303.8 470.0 7 350.1 550.8
8 396.5 631.6
9 442.8 712.4
10 489.2 793.1
11 535.5 873.9
12 581.9 954.6
Number of intervals determined automatically by Microsoft excel, Windows 2000.

214
Figure [.3
Frequency Distributions for Available Carbohydrate (g) from 7-day Food Record and
FFQ data.
oa
Oo i
AA
oun
Lo
Ww
oun
14
—e— AvCarb FR
~—~t@-- AvCarb FFQ
Frequency
N
ND
om
L 1
=
= oao a
poop
T T T T T T T T
12 3 45 6 7 8 9 10 11 12
Available carbohydrate
Intake ranges divided into 12 equal intervals’
Median values of intervals from intake
ranges for total carbohydrate from FR’s
and FFQ’s
Intervals of Avecarb Avearb
intake FR FFQ
ranges
1 66.0 59.6
2 110.6 132.1
3 155.0 204.6
4 199.6 277.0
5 244.0 349.5
6 288.6 422.0
7 333.0 494.5
8 377.6 567.0 9 422.1 639.5
10 466.6 711.9
11 511.1 784.4
12 555.6 856.9
' Number of intervals determined automatically by Microsoft excel, Windows 2000.

215
Figure I.4
Frequency Distributions for Total energy (kcal) from 7-day Food Record and FFQ data.
—e— Keal FR
tia Keal FFQ
Frequency
12 3 4 5 6 7 8 9 10 11 12
Total Energy (kcal)
Intake ranges divided into 12 equal intervals’
Median values of intervals from intake
ranges for total energy from FR’s and
FFO’s
Intervals of | Totalenergy Total energy
intake FR FFQ
ranges
1 693.0 595.9
2 993.0 1103.0
3 1293.1 1610.1
4 1594.0 2117.2
5 1893.0 2624.3
6 2193.2 3131.4
7 2493.3 3638.5
8 2793.3 4145.7 9 3093.4 4652.8
10 3393.5 5159.9
11 3693.5 5667.0
12 3993.6 6174.1
' Number of intervals determined automatically by Microsoft excel, Windows 2000.

Figure 1.5
Frequency Distributions for Fiber (g) from 7-day Food Record and FFQ data.
Frequency
1
—¢e— Fiber FR
—@~— Fiber FFQ
T T T T m
23 4 5 6 7 8 9 10 11 12
Fiber
Intake ranges divided into 12 equal intervals’
216
Median values of intervals from intake
ranges for fiber from FR’s and FFQ’s
Intervals of | Fiber Fiber
intake FR FFQ
ranges
1 5.5 6.7
2 75 15.0
3 9.8 23.2
4 12.2 31.5
5 14.6 39.8
6 17.0 48.0
7 19.3 56.3
8 21.7 64.6
9 24.1 72.6 10 26.5 80.8
11 28.8 89.0
12 31.2 97.3
' Number of intervals determined automatically by Microsoft excel, Windows 2000.

Figure 1.6
217
Frequency Distributions for Cholesterol (g) from 7-day Food Record and FFQ data.
—e— Chol FR
—i— Chol FFQ
Frequency
nN
a
12 3 4 5 6 7 8 9 10 11 12
Cholesterol
Intake ranges divided into 12 equal intervals
Median values of intervals from intake
ranges for cholesterol from FR’s and
FFQ’s
Intervals of Cholesterol Cholesterol
intake FR FFQ
ranges
1 $4.7 48.0
2 110.8 120.8
3 167.0 193.6
4 223.2 266.4
5 279.3 339.2
6 335.4 412.0 7 391.6 484.8
8 447.7 557.7
9 503.9 630.5
10 560.0 703.3
11 616.2 776.1
12 672.3 848.9
‘Number of intervals determined automatically by Microsoft excel, Windows 2000.

218
Figure I.7
Frequency Distributions for Saturated Fatty Acid (SFA) (g) from 7-day Food Record and
FFQ data.
Frequency
wo #
ono
Oo =
NY
NY
W
oo
oO ©
| 1
| |
10
ze
—e— SFA FR
—@—- SFA FFQ T T T T T T T T T
12 3 45 6 7 8 9 10 11 12
SFA
Intake ranges divided into 12 equal intervals’
Median values of intervals from intake
ranges for SFA from FR’s and FFQ’s
Intervals of SFA SFA
intake FR FFQ
ranges
1 4.2 5.8
2 8.7 12.1
3 13.3 18.4
4 17.8 24.7
5 22.3 31.0
6 26.8 37.3 7 31.3 43.6
8 35.8 49.9
9 40.3 56.2
10 44.8 62.5
11 49.2 68.8
12 53.7 75.1
' Number of intervals determined automatically by Microsoft excel, Windows 2000.

Figure 1.8
219
Frequency Distributions for Monounsaturated Fatty Acid (MFA) (g) from 7-day Food
Record and FFQ data.
Frequency
NO
oS 0 + TOT TE
12 3 45 6 7 8 9 10 11 12
MFA
Intake ranges divided into 12 equal intervals’
—e— MFA FR
-—@—MFA FFQ
Median values of intervals from intake
ranges for MFA from FR’s and FFQ’s
Intervals of MFA MFA
intake FR FFQ
ranges
1 40 5.4
2 9.0 12.2
3 13.9 19.0
4 18.8 25.7
5 23.7 32.6
6 28.7 39.3
7 33.6 46.1 8 38.5 52.9
9 43.5 59.7
10 48.4 66.5
11 53.3 73.3
12 58.2 80.1
Number of intervals determined automatically by Microsoft excel, Windows 2000.

Figure I.9
220
Frequency Distributions for Polyunsaturated Fatty Acid (PUFA) (g) from 7-day Food
Record and FFQ data.
oO
Bh
A
aoa
! 1
J
—e— PUFA FR
—@— PUFA FFQ NN
w
on
Oo
L !
L
Frequency
a
10 + T T T T T
45 6 7 8 9 10 11 12
PUFA
1 2 3
Intake ranges divided into 12 equal intervals!
Median values of intervals from intake
ranges for PUFA from FR’s and FFQ’s
Intervals of | PUFA PUFA
intake FR FFQ
ranges
1 3.4 3.0
2 6.5 8.2
3 9.7 13.4
4 12.8 18.7
5 15.9 23.9
6 19.0 29.1 7 22.1 34.3
8 25.2 39.6
9 28.3 44.8
10 31.4 50.0
11 34.5 55.2
12 37.6 60.5
' Number of intervals determined automatically by Microsoft excel, Windows 2000.

221
Figure I.10(a)
Frequency Distributions for Alcohol (g) from 7-day Food Record and FFQ data.
140 -
120 -
100 +
80 - —e—Alc FR 60 - —#—Alc FFQ
40
20 -
Frequency
12 3 4 5 6 7 8 Q9 10 11 12
Alcohol
Intake ranges divided into 12 equal intervals!
Median values of intervals from intake
ranges for alcohol from FR’s and FFQ’s
Intervals of | Alcohol Alcohol
intake FR FFQ
ranges
1 0 0
2 1.0 2.2
3 2.1 4.5
4 3.2 6.7
5 4.3 8.9 6 5.3 11.2
7 6.4 13.4
8 75 15.6
9 8.5 17.9
10 9.6 20.1
11 10.7 22.3
12 11.7 24.6
' Number of intervals determined automatically by Microsoft excel, Windows 2000.

222
Figure I.10(b)
Frequency Distributions for Alcohol (g) from 7-day Food Record and FFQ data with two
outliers removed.
140 -
120 +
100 |
80 4 —e—Alc FR
60 - -—tig— Alc FFQ
Alc
FFQ
40
20 + 1 2 3 4 5 6 7 8 9 10 11 12
Aic FR
Intake ranges divided into 12 equal intervals’
Median values of intervals from intake
ranges for alcohol with two outliers
removed from FR’s and FFQ’s.
Intervals of | Alcohol Alcohol
intake FR FFQ
ranges
1 123 86
2 20 16
3 2 16
4 1 11
5 1 4
6 1 4
7 0 8 8 0 3
9 1 0
10 0 1
11 1 1
12 0 0
' Number of intervals determined automatically by Microsoft excel, Windows 2000.

Figure I.11
223
Frequency Distributions for Protein expressed as a percentage of total energy from 7-day
Food Record and FFQ data.
Frequency
1)
oO 04 TO TT TT
123 45 67 8 9
% Protein
T T T T 1
10 11 12
—e—% ProFR
-i@-—- % Pro FFQ
Intake ranges divided into 12 equal intervals’
Median values of intervals from intake
ranges for % Protein from FR’s and
FFQ’s
Intervals of % Protein % Protein
intake FR FFQ
ranges
1 8.5 11.7
2 10.3 12.8
3 12.0 13.9
4 13.9 15.0
5 15.7 16.2
6 17.5 17.3
7 19.4 18.4 8 21.2 19.6
9 23.0 20.7
10 24.8 21.8
11 26.6 23.0
12 28.4 24.0 ' Number of intervals determined automatically by Microsoft excel, Windows 2000.

224
Figure I.12
Frequency Distributions for Fat expressed as a percentage of total energy from 7-day
Food Record and FFQ data.
—e— % Fat FR
mii Yo Fat FFQ
Frequency 0 + TT TFT TO TOT
12 3 45 6 7 8 9 10 11 12
% Fat
Intake ranges divided into 12 equal intervals'
Median values of intervals from intake
ranges for % Fat from FR’s and FFQ’s
Intervals of | % Fat % Fat
intake FR FFQ
ranges
1 12.7 13.7
2 15.4 16.2
3 18.2 18.8
4 20.9 21.4
5 23.7 24.0
6 26.4 26.5
7 29.2 29.1
8 31.9 31.7 9 34.6 34.2
10 37.4 36.8
11 40.1 39.4
12 42.9 41.9
' Number of intervals determined automatically by Microsoft excel, Windows 2000.

225
Figure 1.13
Frequency Distributions for Carbohydrate expressed as a percentage of total energy from
7-day Food Record and FFQ data.
—e— % Carb FR
—~ti— % Carb FFQ
Frequency
No
oO
}
O70, T T T T T T T T T 1
12 345 6 7 8 9 10 11 12
% Carbohydrate
Intake ranges divided into 12 equal intervals’
Median values of intervals from intake
ranges for % Carbohydrate from FR’s
and FFQ’s
Intervals of % Carb. % Carb.
intake FR FFQ
ranges
1 32.4 35.5
2 35.2 38.7
3 38.0 41.8
4 40.9 45.0
5 43.8 48.1
6 46.6 $1.3 7 49.5 54.4
8 52.3 57.6
9 55.2 60.7
10 58.0 63.9
11 60.8 67.0
12 70.2 70.2
’ Number of intervals determined automatically by Microsoft excel, Windows 2000.

Figure 1.14
226
Frequency Distributions for Fiber g/1000kcal from 7-day Food Record and FFQ data.
45 -
40 -
35 +
> 30 + o —e Fiber g/1000kcal 3 25 - FR = 20 + ~@— Fiber g/1000kcal
i FFQ 15 +
10 +
5 _
0 = T T t T T T T T q T
1234567 8 9 101112
Fiber g/1000kcal
Intake ranges divided into 12 equal intervals’
Median values of intervals from intake
ranges for Fiber g/1000kcal from FR’s
and FFQ’s.
Intervals of Fiber Fiber
intake 2/1000kcal 2/1000kcal
ranges FR FFQ
1 3.8 6.3
2 5.2 8.2
3 6.7 10.1
4 8.2 12.0
5 9.7 13.9
6 11.1 15.8 7 12.6 17.7
8 14.1 19.6
9 15.6 21.5
10 17.0 23.4
11 18.5 25.3
Figure L15 12 20.0 27.2
' Number of intervals determined automatically by Microsoft excel, Windows 2000.

227
Frequency Distributions for Cholesterol mg/1000kcal from 7-day Food Record and FFQ
data. Frequency
123 45 6 7 8 9 101112
Cholesterol mg/1000kcal
FR
FFQ
Intake ranges divided into 12 equal intervals’
—— Chol mg/1000kcal
~@-- Chol mg/1000kcal
Median values of intervals from intake
ranges for Cholesterol mg/1000kcal
' Number of intervals determined automatically by Microsoft excel, Windows 2000.
from FR’s and FFQ’s.
. Intervals of Chol. Chol.
intake mg/1000kcal mg/1000kcal
ranges FR FFQ
1 31.0 23.9
2 64.6 43.3
3 98.1 62.6
4 131.7 82.0
5 165.2 101.4
6 198.8 120.7
7 232.3 140.0
8 265.9 159.4
9 299.5 178.8 10 333.0 198.2
11 366.6 217.5
12 400.1 236.9

228
Figure 1.16
Frequency Distributions for Saturated Fatty Acid (SFA) expressed as a percentage of
total energy from 7-day Food Record and FFQ data. is
o ]
NO
@©
©
no
ao
L 1
!
—eo— % SFA FR
it Yo SFA FFQ
Frequency
= N
ao
I L
10 +
0-5 Tw T 7 T
123 45 67 8 9 10 11 12
% SFA
Intake ranges divided into 12 equal intervals’
Median values of intervals from intake
ranges for % SFA from FR’s and FFQ’s.
Intervals of % SFA % SFA
intake FR FFQ
ranges
1 3.4 3.7
2 4.8 5.2
3 6.1 6.8
4 75 8.3
5 8.9 9.9
6 10.2 11.5
7 11.6 13.0 8 13.0 14.6
9 14.4 16.2
10 15.7 17.8
11 17.1 19.3
12 18.5 20.9
' Number of intervals determined automatically by Microsoft excel, Windows 2000.

229
Figure I.17
Frequency Distributions for Monounsaturated Fatty Acid (MFA) expressed as a percentage of total energy from 7-day Food Record and FFQ data.
35 -
30 -
25 |
5 20 —e—% MFA FR 5 15 4 tit Y MFA FFQ
49. 5.
0 | ee 12 345 6 7 8 9 10 11 12
% MFA
Intake ranges divided into 12 equal intervals’
Median values of intervals from intake
ranges for % MFA from FR’s and FFQ’s.
Intervals of % MFA % MFA
intake FR FFQ
ranges
1 3.1 4.0
2 4.3 5.0
3 5.4 6.0
4 6.6 7.0
5 7.8 8.0
6 8.9 9.0
7 10.1 10.0
8 11.3 11.0 9 12.4 12.0
10 13.6 13.0
11 14.8 14.0
12 15.9 15.0
' Number of intervals determined automatically by Microsoft excel, Windows 2000.

Figure 1.18
Frequency Distributions for the P:S ratio from 7-day Food Record and FFQ data. NO
©
WwW nao
a
©
l L
! j
—e—P:S FR
—@—P:S FFQ
Frequency
=
N
a
©
| i
10 - 12 3 4 5 6 7 8 9 10 11 12
P:S
Intake ranges divided into 12 equal intervals’
230
Median values of intervals from intake
ranges for the P:S from FR’s and FFQ’s.
Intervals of | P:S P:S
intake FR FFQ
ranges
1 0.19 0.15
2 0.36 0.27
3 0.53 0.39
4 0.69 0.51
5 0.86 0.64
6 1.0 0.76
7 1.2 0.88 8 1.4 0.99
9 1.5 1.12
10 1.7 1.24
11 1.9 1.36
12 2.0 1.48
‘Number of intervals determined automatically by Microsoft excel, Windows 2000.

231
Figure I.19(a)
Frequency Distributions for Alcohol expressed as a percentage of total energy from 7-day
Food Record and FFQ data.
140 -
120 +
100 -
80 + —e—% Alc FR
60 + ttt % Alc FFQ
40 -
20 +
Frequency
12 3 45 67 8 9 10 11 12
% Alcohol
Intake ranges divided into 12 equal intervals!
Median values of intervals from intake
ranges for % Alcohol from FR’s and
FFQ’s.
Intervals of % Alcohol % Alcohol
intake FR FFQ
ranges
1 0 0
2 0.41 0.46
3 0.81 0.92
4 1.22 1.38
5 1.63 1.84
6 2.04 2.30
7 2.45 2.77 8 2.86 3.23
9 3.27 3.69
10 3.68 4.15
11 4.09 4.62
12 4.50 5.08
1 Number of intervals determined automatically by Microsoft excel, Windows 2000.

Figure I.19(b)
232
Frequency Distributions for Alcohol expressed as a percentage of total energy with two
outliers removed from 7-day Food Record and FFQ data .
140 5
120
100 -
% Alc
FFQ
40
20 + 12 3 4 5 6 7 8 9 10 11 12
% Alc FR
Intake ranges divided into 12 equal intervals!
80 - —~e—% Alc FR
60 4 —@—% Alc FFQ
Median values of intervals from intake
ranges for % Alcohol with two outliers
removed from FR’s and FFQ’s.
Intervals of
intake
ranges
Ceram
tk WN =
% Alcohol
FR
126 19
eocoococooorror
' Number of intervals determined automatically by Microsoft excel, Windows 2000.
% Alcohol
FFQ
86 13 18
ma We
KS AN
BB ~]

APPENDIX J
Pearson correlation coefficients for transformed and untransformed nutrient intake
values, and Spearman rank correlation coefficients for nutrient intake values for FR
vs. FFQ data.
J.1 All subjects
J.2 Males
J.3 Females
J.4 African’s
J.5 South Asian’s
J.6 FFQ 1* group
J.7 FEQ 2™ group
233

234
Table J.1
Pearson correlation coefficients for transformed and untransformed nutrient intake
values, and Spearman rank correlation coefficients for nutrient intake values for FR vs.
FFQ data: All subjects.
Pearson p- Pearson p- Spearman p-
untransfor value transformed value rank value
med
Pro (g) 0.44 <.0001 0.49 <.0001 0.49 <.0001
Fat (g) 0.51 <.0001 0.56 <.0001 0.52 <.0001
Tcarb (g) 0.35 <.0001 0.43 <.0001 0.38 <.0001
AvCarb (g) 0.36 <.0001 0.43 <.0001 0.38 <.0001
Energy (Keal) 0.43 <.0001 0.48 <,0001 0.46 <.0001
Fiber (g) | 0.25 <.0001 0.26 0.0011 0.25 0.0018
Chol (g) 0.42 <.0001 0.57 <.0001 0.45 <.0001
SFA (g) 0.47 <.0001 0.53 <.0001 0.53 <.0001
MFA (g) 0.51 <.0001 0.55 <.0001 0.49 <.0001
PUFA (g) 0.44 <.0001 0.49 <.0001 0.47 <.0001
Alc (g) 0.10 0.2335 0.65 0.2335 0.10 0.2379
GI 0.25 0.0021 0.23 0.0047 0.22 0.0058 p-values <0.05 indicate statistically significant correlation between FR’s and the FFQ.

235
Table J.1.1 Pearson correlation coefficients for transformed and untransformed nutrient intake values
expressed as a percentage of total energy, and Spearman rank correlation coefficients for
percent nutrient intake values for FR vs. FFQ data: All subjects.
Pearson p- Pearson p- Spearman p- untransformed value transformed value rank value
Pro% 0.46 <.0001 0.48 <.0001 0.45 <.0001
Fat% 0.48 <.0001 0.43 <.0001 0.47 <.0001
Carb% 0.45 <.0001 0.46 <.0001 0.45 <.0001
Fiber ¢/1000kcal 0.34 <.0001 0.34 <.0001 0.32 <.0001
Chol mg/1000kcal 0.37 <.0001 0.53 <.0001 0.36 <.0001
SFA% 0.39 <.0001 0.43 <.0001 0.45 <.0001
MFA% 0.38 <.0001 0.38 <.0001 0.35 <.0001
PUFA% 0.25 0.0019 0.25 0.0019 0.21 0.0096
P:S 0.30 0.0001 0.26 0.0011 0.27 0.0007
Ale% 0.19 0.0213 0.75 0.0018 0.10 0.2447
p-values <0.05 indicate statistically significant correlation between FR’s and the FFQ.

Table J.2
Pearson correlation coefficients for transformed and untransformed nutrient intake
236
values, and Spearman rank correlation coefficients for nutrient intake values for FR vs.
FFQ data: Males.
Pearson p- Pearson p- Spearman p-
untransformed value transformed value rank value
Pro (g) 0.43 0.0007 0.49 <.0001 0.48 <,0001
Fat (g) 0.50 <.0001 0.54 <.0001 0.51 <.0001
Tcarb (g) 0.37 0.0035 0.40 0.0013 0.39 0.0021
AvCarb (g) 0.41 0.0012 0.41 0.0012 0.41 0.0010
Energy (Kceal) 0.45 0.0003 0.50 <.0001 0.46 0.0002
Fiber (g) 0.25 0.0565 0.25 0.0579 0.23 0.07
Chol (g) 0.47 0.0002 0.68 <.0001 0.56 <,0001
SFA (g) 0.42 0.0009 0.48 0.0001 0.48 0.0001
MFA (g) 0.55 <.0001 0.63 <.0001 0.55 <.0001
PUFA (g) 0.41 0.0011 0.50 <.0001 0.48 0.0001
Alc (g) 0.06 0.6391 0.83 0.0392 0.003 0.9801
GI 0.10 0.4533 0.16 0.2334 0.17 0.1936 p-values <0.05 indicate statistically significant correlation between FR’s and the FFQ.

237
Table J.2.1 Pearson correlation coefficients for transformed and untransformed nutrient intake values
expressed as a percentage of total energy, and Spearman rank correlation coefficients for
percent nutrient intake values for FR vs. FFQ data: Males.
Pearson p- Pearson p- Spearman p-
untransformed value transformed value _ rank value
Pro% 0.19 0.1366 0.17 0.1886 0.28 0.0280
Fat% 0.39 0.0018 0.42 0.0008 0.42 0.0008
Carb% 0.31 0.0154 0.45 0.0004 0.43 0.0007
Fiber ¢/1000kcal 0.29 0.0253 0.31 0.0165 0.26 0.0408
Chol mg/1000kcal 0.40 0.0016 0.56 <.0001 0.46 0.0002
SFA% 0.42 0.0008 0.45 0.0003 0.39 0.0019
MFA% 0.42 0.0007 0.42 0.0007 0.34 0.0079
PUFA% 0.15 0.2506 0.20 0.1291 0.22 0.0972
P:S 0.34 0.0082 0.34 0.0073 0.29 0.0223
Ale% 0.13 0.3195 0.87 0.0256 0.05 0.7076
p-values <0.05 indicate statistically significant correlation between FR’s and the FFQ.

238
Table J.3
Pearson correlation coefficients for transformed and untransformed nutrient intake
values, and Spearman rank correlation coefficients for nutrient intake values for FR vs. FFQ data: Females.
Pearson p-value Pearson p-value Spearman p-
untransformed transformed rank value
Pro (g) 0.44 <.0001 0.45 <.0001 0.46 <.0001
Fat (g) 0.51 <.0001 0.53 <.0001 0.52 <.0001
Tcarb (g) 0.32 0.0018 0.42 <.0001 0.36 0.0004
AvCarb (g) 0.33 0.0014 0.43 <,0001 0.37 0.0003
Energy (Kcal) 0.41 <.0001 0.47 <.0001 0.44 <.0001
Fiber (g) 0.26 <.0001 0.31 0.0025 0.28 0.0068
Chol (g) 0.37 0.0003 0.49 <.0001 0.32 0.0019
SFA (g) 0.51 <.0001 0.53 <.0001 0.55 <.0001
MFA (g) 0.45 <.0001 0.48 <.0001 0.44 <.0001
PUFA (g) 0.46 <.0001 0.49 <.0001 0.46 <.0001
Ale (g) 0.15 0.1547 0.30 0.4816 0.15 0.1555
GI 0.25 0.0148 0.24 0.0233 0.22 0.0318 p-values <0.05 indicate statistically significant correlation between FR’s and the FFQ.

239
Table J.3.1 Pearson correlation coefficients for transformed and untransformed nutrient intake values expressed as a percentage of total energy, and Spearman rank correlation coefficients for
percent nutrient intake values for FR vs. FFQ data: Females.
Pearson p- Pearson p- Spearman p-
untransformed value transformed value rank value
Pro% 0.59 <.0001 0.60 <.0001 0.52 <.0001
Fat% 0.45 <.0001 0.40 <.0001 0.44 <.0001
Carb% 0.42 <.0001 0.43 <.0001 0.41 <.0001
Fiber g/1000kcal 0.29 0.0045 0.30 0.0033 0.32 0.0020
Chol mg/1000kcal 0.38 0.0002 0.45 <.0001 0.33 0.0014
SFA% 0.37 0.0003 0.42 <.0001 0.46 <.0001
MFA% 0.32 0.0018 0.31 0.0027 0.33 0.0016
PUFA% 0.14 0.1885 0.13 0.2299 0.12 0.2676
P:S 0.27 0.0090 0.22 0.0358 0.22 0.0369
Ale% 0.10 0.3498 0.53 0.1723 0.13 0.2045
p-values <0.05 indicate statistically significant correlation between FR’s and the FFQ.

Table J.4
Pearson correlation coefficients for transformed and untransformed nutrient intake
240
values, and Spearman rank correlation coefficients for nutrient intake values for FR vs.
FFQ data: African’s.
Pearson p- Pearson p- Spearman . p-
untransformed value transformed value rank value
Pro (g) 0.36 0.0101 0.45 0.0013 0.39 0.0060
Fat (g) 0.39 0.0052 0.40 0.0046 0.29 0.0430
Tearb (g) 0.26 0.0746 0.27 0.0632 0.24 0.0989
AvCarb (g) 0.27 0.0627 0.27 0.0588 0.21 0.1487
Energy (Kceal) 0.33 0.0219 0.35 0.0140 0.31 0.0284
Fiber (g) 0.12 0.4240 0.133 0.3616 0.11 0.4311
Chol (g) 0.39 0.0060 0.47 0.0007 0.36 0.0122
SFA (g) 0.16 0.2854 0.16 0.2854 0.17 0.2433
MEA (g) 0.36 0.0105 0.37 0.0087 0.34 0.0160
PUFA (g) 0.52 0.0001 0.47 0.0006 0.38 0.0064
Ale (g) 0.41 0.0035 0.52 0.3692 0.19 0.1794
GI 0.06 0.7014 0.05 0.7318 0.10 0.5045 p-values <0.05 indicate statistically significant correlation between FR’s and the FFQ.

241
Table J.4.1 Pearson correlation coefficients for transformed and untransformed nutrient intake values expressed as a percentage of total energy, and Spearman rank correlation coefficients for
percent nutrient intake values for FR vs. FFQ data: African’s.
Pearson p- Pearson p- Spearman p-
untransformed value transformed value rank value
Pro% 0.50 0.0002 0.51 0.0002 0.49 0.0003
Fat% 0.28 0.0525 0.28 0.0525 0.32 0.0245
Carb% 0.32 0.0272 0.26 0.0723 0.36 0.0117
Fiber ¢/1000kcal 0.12 0.3979 0.15 0.3089 0.17 0.2520
Chol mg/1000kcal 0.52 0.0001 0.51 0.0002 0.59 <.0001
SFA% 0.12 0.4702 0.11 0.4475 0.09 0.5346
MFA% 0.19 0.2023 0.24 0.1000 0.21 0.1478
PUFA% 0.23 0.1149 0.23 0.1149 0.14 0.3519
P:S 0.21 0.1543 0.16 0.2747 0.18 0.2052
Ale% 0.64 <.0001 0.94 0.0566 0.19 0.1964 p-values <0.05 indicate statistically significant correlation between FR’s and the FFQ.

Table J.5
Pearson correlation coefficients for transformed and untransformed nutrient intake
242
values, and Spearman rank correlation coefficients for nutrient intake values for FR vs.
FFQ data: South Asian’s.
Pearson p- Pearson p- Spearman p-
untransformed value transformed value _ rank value
Pro (g) 0.48 <.0001 0.48 <.0001 0.49 <.0001
Fat (g) 0.49 <.0001 0.52 <.0001 0.54 <,0001
Tcarb (g) 0.44 <.0001 0.50 <.0001 0.49 <.0001
AvCarb (g) 0.44 <.0001 0.51 <.0001 0.49 <.0001
Energy (Keal) 0.47 <.0001 0.49 <,0001 0.50 <.0001
Fiber (g) 0.39 0.0005 0.35 0.0018 0.34 0.0020
Chol (g) 0.49 <.0001 0.56 <.0001 0.52 <.0001
SFA (g) 0.54 <.0001 0.56 <.0001 0.61 <.0001
MEA (g) 0.51 <.0001 0.51 <.0001 0.50 <,0001
PUFA (g) 0.34 0.0020 0.39 0.0004 0.40 0.0003
Alec (g) 0.19 0.1010 0.50 0.2501 0.05 0.6837
GI 0.30 0.0080 0.29 0.0091 0.26 0.0212 p-values <0.05 indicate statistically significant correlation between FR’s and the FFQ.

243
Table J.5.1 Pearson correlation coefficients for transformed and untransformed nutrient intake values expressed as a percentage of total energy, and Spearman rank correlation coefficients for
percent nutrient intake values for FR vs. FFQ data: South Asian’s.
Pearson p- Pearson p- Spearman p-
untransformed value transformed value rank value
Pro% 0.50 <.0001 0.53 <.0001 0.48 <.0001
Fat% 0.51 <.0001 0.42 0.0001 0.54 <.0001
Carb% 0.55 <.0001 0.57 <.0001 0.54 <.0001
Fiber g/1000kcal 0.45 <.0001 0.46 <.0001 0.45 <.0001
Chol mg/1000kcal 0.35 0.0019 0.55 <.0001 0.34 0.0020
SFA% 0.64 <.0001 0.64 <.0001 0.65 <.0001
MFA% 0.41 0.0002 0.38 0.0005 0.44 <.0001
PUFA% 0.12 0.29 0.12 0.2893 0.08 0.4812
P:S 0.39 0.0004 0.38 0.0006 0.37 0.0008
Alc% 0.17 0.1411 0.65 0.1114 0.05 0.6533 p-values <0.05 indicate statistically significant correlation between FR’s and the FFQ.

244
Table J.6
Pearson correlation coefficients for transformed and untransformed nutrient intake
values, and Spearman rank correlation coefficients for nutrient intake values for FR vs. FFQ data: FFQ1* group.
Pearson p- Pearson p-value Spearman p- untransformed value _ transformed rank value
Pro (g) 0.35 0.0022 0.38 0.0007 0.38 0.0008
Fat (g) 0.49 <.0001 0.48 <,0001 0.48 <.0001
Tcarb (g) 0.29 0.0127 0.36 0.0014 0.32 0.0052
AvCarb (g) 0.30 0.0080 0.35 0.0021 0.32 0.0046
Energy (Kcal) 0.39 0.0005 0.44 <.0001 0.44 <.0001
Fiber (g) 0.25 0.0318 0.25 0.0309 0.21 0.0755
Chol (g) 0.38 0.0008 0.55 <.0001 0.38 0.0007
SFA (g) 0.46 <.0001 0.48 <.0001 0.50 <.0001
MFA (g) 0.49 <.0001 0.44 <.0001 0.38 0.0007
PUFA (g) 0.43 0.0001 0.44 <.0001 0.47 <.0001
Alc (g) 0.21 0.0768 0.92 0.0789 0.05 0.6641
GI 0.13 0.2483 0.14 0.2417 0.11 0.3557 p-values <0.05 indicate statistically significant correlation between FR’s and the FFQ.

245
Table J.6.1 Pearson correlation coefficients for transformed and untransformed nutrient intake values
expressed as a percentage of total energy, and Spearman rank correlation coefficients for
percent nutrient intake values for FR vs. FFQ data: FFQ 1* group.
Pearson p- Pearson p- Spearman p-
untransformed value transformed value _ rank value
Pro% 0.26 0.0226 0.30 0.0081 0.33 0.0037
Fat% 0.29 0.0107 0.32 0.0048 0.37 0.0012
Carb% 0.20 0.0811 0.28 0.0139 0.35 0.0020
Fiber ¢/1000kcal 0.33 0.0033 0.38 0.0007 0.39 0.0006
Chol mg/1000kceal 0.38 0.0007 0.56 <.0001 0.45 <.0001
SFA% 0.46 <.0001 0.46 <.0001 0.46 <.0001
MFA% 0.17 0.1553 0.17 0.1553 0.14 0.2403
PUFA% 0.03 0.7932 0.07 0.5511 0.06 0.5841
P:S 0.39 0.0005 0.37 0.0011 0.35 0.0022
Alce% 0.13 0.2583 0.93 0.0669 0.03 0.7806 p-values <0.05 indicate statistically significant correlation between FR’s and the FFQ.

Table J.7
Pearson correlation coefficients for transformed and untransformed nutrient intake
246
values, and Spearman rank correlation coefficients for nutrient intake values for FR vs.
FFQ data: FFQ 2™ group.
Pearson p- Pearson p- Spearman p-
untransformed value transformed value rank value
Pro (g) 0.55 <.0001 0.56 <.0001 0.59 <.0001
Fat (g) 0.54 <.0001 0.62 <.0001 0.59 <.0001
Tcarb (g) 0.45 <.0001 0.47 <.0001 0.47 <.0001
AvCarb (g) 0.47 <.0001 0.48 <.0001 0.48 <,0001
Energy (Keal) 0.50 <.0001 0.54 <.0001 0.56 <.0001
Fiber (g) 0.27 0.0171 0.27 0.0171 0.33 0.0035
Chol (g) 0.46 <.0001 0.60 <.0001 0.52 <.0001
SFA (g) 0.51 <.0001 0.58 <.0001 0.59 <.0001
MFA (g) 0.54 <.0001 0.64 <.0001 0.62 <.0001
PUFA (g) 0.46 <.0001 0.55 <.0001 0.51 <.0001
Alec (g) 0.07 0.5347 0.60 0.0497 0.12 0.2908
GI 0.35 0.0020 0.35 0.0020 0.32 0.0048 p-values <0.05 indicate statistically significant correlation between FR’s and the FFQ.

247
Table J.7.1 Pearson correlation coefficients for transformed and untransformed nutrient intake values
expressed as a percentage of total energy, and Spearman rank correlation coefficients for
percent nutrient intake values for FR vs. FFQ data: FFQ and group.
Pearson p- Pearson p- Spearman p-
untransformed value transformed value _ rank value
Pro% 0.48 <.0001 0.44 <.0001 0.52 <.0001
Fat% 0.55 <.0001 0.49 <.0001 0.49 <.0001
Carb% 0.51 <.0001 0.52 <.0001 0.48 <.0001
Fiber g/1000kcal 0.28 0.0139 0.28 0.0135 0.27 0.0180
Chol mg/1000kcal 0.37 0.0009 0.37 0.0009 0.28 0.0136
SFA% 0.34 0.0026 0.40 0.0003 0.44 <,0001
MFA% 0.54 <.0001 0.54 <.0001 0.50 <,0001
PUFA% 0.27 0.0176 0.27 0.0176 0.26 0.0204
P:S 0.23 0.0402 0.23 0.0410 0.24 0.0331
Alc% 0.18 0.1250 0.71 0.0215 0.14 0.2188 p-values <0.05 indicate statistically significant correlation between FR’s and the FFQ.

APPENDIX K
Scatter-grams between FR’s and FFQ’s for macronutrient and % macronutrient
data
248

Figure K.1 FFQ versus 7-day Food Record: Protein (g).
FFQ
Prot
ein
350 +
300 -
250 +
200 +
150 +
100 -
50 +
249
Figure K.2
FFQ versus 7-day Food Record: Total Carbohydrate (g)
FFQ
Total
Carboh
ydra
te
1200 -
1000 -
800 -
600 +
400 -
200 -
50 100 150 200
FR Protein
100 200 300 400 500 600 700
FR Total Carbohydrate

250
Figure K.3
FFQ versus 7-day Food Record: Available Carbohydrate (g).
1000 -
900 +
800 -
700 +
600 -
500 +
400 -
300 +
200 -
100 -
0 T 7 T T T T 1
0 100 200 300 400 500 600 700
FR Available Carbohydrate
FFQ Available
Carbohydrate
Figure K.4
FFQ versus 7-day Food Record: Total Energy (kcal).
8000 -
7000 +
y a
a eo
6 eo
6 5
6 |
I
4000 -
3000 +
FFQ
Tota
l En
erg
2000 -
1000 +
T 7 r
0 1000 2000 3000 4000 5000 6000
FR Total Energy

Figure K.5
FFQ versus 7-day Food Record: Fiber (g).
120 -
S
100 +
_ 805 .
2 %e iL 60 + °° ° S o eo ¢, o 3
° eo re AO - eee oeo*.? ?. ¢ o
4 ° “o wengee sf .
20 + of o% oe °S o °
oo *% ¢ i
0 T T T T T T T 7
0 5 10 15 20 25 30 35 40
FR Fiber
Figure K.6
FFQ versus 7-day Food Record: Cholesterol (g).
FFQ Ch
oles
tero
l
FR Cholesterol
251

252
Figure K.7
FFQ versus 7-day Food Record: Saturated Fatty Acid (SFA) (g).
FFQ SFA
th oO
0 10 20 30 40 50 60 70
Figure K.8
FFQ versus 7-day Food Record: Mono-unsaturated Fatty Acid (MFA) (g).
100 - 90 - 80 - ° 70 - 60 - 50 - 40 - 30 - 20 - 10 - 0 . |
0 10 20 30 40 50 60 70 FR MFA
FFQ
MFA

Figure K.9
FFQ versus 7-day Food Record: Poly-unsaturated Fatty Acid (PUFA) (g)
FFQ
PUFA
70 5
60 +
50 +
40 -
30 |
20 +
10 -
Figure K.10 (a)
FFQ versus 7-day Food Record: Alcohol (g)
FFQ Al
coho
l
30 5
25 +
20 +
10 20 30 40 50
yw rN wT T T 4 T T T 1
2 4 6 8 10 12 14
FR Alcohol
253

Figure K.10 (b)
254
FFQ versus 7-day Food Record: Alcohol (g) with two outliers removed.
FFQ
Figure K.11
FR Alcohol
FFQ versus 7-day Food Record: Protein expressed as a percentage of total energy.
30 -
25 +
20 +
15 +
FFQ
% Pr
otei
n
10 -
T T T T T
10 15 20 25 30 35
FR % Protein

255
Figure K.12
FFQ versus 7-day Food Record: Fat expressed as a percentage of total energy.
50 -
45 +
40 +
35 +
30 +
25 +
20 +
15 -
10 5
54
0 1
0 10 20 30 40 50
FR % Fat
FFQ
% Fa
t
Figure K.13
FFQ versus 7-day Food Record: Carbohydrate expressed as a percentage of total energy.
80 -
70 -
60 -
50 -
40 -
30 +
FFQ
% Carbohydrate
20 +
10 5 0 T T T T T T 1
0 10 20 30 40 50 60 70
FR % Carbohydrate

256
Figure K.14 FFQ versus 7-day Food Record: Fiber g/1000kcal
35 5
30 +
25 4
20 +
15 4
FFQ
% Fiber
L 10
FR Fiber g/1000kcal
Figure K.15
FFQ versus 7-day Food Record: Cholesterol mg/1000kcal
300 +
250 + °
200 |
150 +
100 +
FFQ %
Cholesterol
50 +
FR Cholesterol mg/1000kcal

Figure K.16
257
FFQ versus 7-day Food Record: Saturated Fatty Acid (SFA) expressed as a percentage of total energy.
FFQ
% SFA
Figure K.17
30 -
25 +
20 |
15 +
10 -
FR % SFA
FFQ versus 7-day Food Record: Mono-unsaturated Fatty Acid (MFA) expressed as a percentage of total energy.
FFQ
% MFA
5 10 15 20
FR %MFA

Figure K.18
258
FFQ versus 7-day Food Record: Poly-unsaturated Fatty Acid (PUFA) expressed as a percentage of total energy.
16 -
14 4 °
* 6 12 4 . *~6 oe
< o o ° u 10 - ° We ee ‘ °
oO 8. oh Fo 8%
3 eS be ON ° o wu 64 oe toy © oe °
4 - *o, 4 $ ° +
2 4
0 T 7 T T T 1
0 2 4 6 8 10 14
FR % PUFA
Figure K.19
FFQ versus 7-day Food Record: Ratio between Poly-unsaturated Fatty Acid (PUFA) and Saturated Fatty Acid (SFA).
FFQ
P:S
1.8 5
1.6 5
1.4 4
1.2 4
14
0.8 5
0.6 -
0.4 5
0.2 4

259
Figure K.20(a)
FFQ versus 7-day Food Record: Alcohol expressed as a percentage of total energy. FFQ
% Alcohol
FR % Alcohol
Figure K.20(b)
FFQ versus 7-day Food Record: Alcohol expressed as a percentage of total energy with
two outliers removed.
0 0.5 1 1.5 2 2.5
FR % Alcohol
oO
¢
Copyright © 2022 FDOKUMEN