
Theventhiran_Pirashanth_ _201911_MAS_thesis.pdf - TSpace
83
Development of a Functional Electrical Stimulation Rowing System and Coaching Application by Pirashanth Theventhiran A thesis submitted in conformity with the requirements for the degree of Masters' of Applied Sciences Graduate Department of Institute of Biomaterials and Biomedical Engineering University of Toronto © Copyright by Pirashanth Theventhiran 2019
-
Upload
khangminh22 -
Category
Documents
-
view
1 -
download
0
Transcript of Theventhiran_Pirashanth_ _201911_MAS_thesis.pdf - TSpace

Development of a Functional Electrical Stimulation Rowing System and Coaching Application
by
Pirashanth Theventhiran
A thesis submitted in conformity with the requirements for the degree of Masters' of Applied Sciences
Graduate Department of Institute of Biomaterials and Biomedical Engineering University of Toronto
© Copyright by Pirashanth Theventhiran 2019

ii
Development of a Functional Electrical Stimulation Rowing
System and Coaching Application
Pirashanth Theventhiran
Masters’ of Applied Sciences
Graduate Department of Institute of Biomaterials and Biomedical Engineering
University of Toronto
2019
Abstract
Functional electrical stimulation (FES) involves electrically stimulating paralyzed muscle to
contract and has been integrated into rehabilitation exercises for individuals with spinal cord
injury (SCI). Unlike other exercises, FES-rowing requires many training sessions for beginners
to learn the appropriate timing of administering FES to their legs through a manual push button,
required for performing the exercise with correct technique. Therefore, the purpose of this study
was to develop a coaching system to instruct new rowers on the optimal timing for administering
FES.
We analyzed the temporal and spatial differences between leg muscle activation onset in relation
to seat and handle position peaks in 10 able-bodied individuals on a custom-modified FES-
rowing ergometer. We identified a target range of seat positions at which to administer FES.
Based on this result, we developed and validated a coaching app in 7 individuals, which was
shown to improve relative timing of manual button press.

iii
Acknowledgments
I would like to thank my supervisor, Dr. Kei Masani, for his guidance, advice, patience, support
and understanding. I would like to thank my committee members, Dr. Jose Zariffa, Dr. Tilak
Dutta, and Dr. David Frost for their counsel. I would like to thank Dr. Brian Andrews for
providing the back rest and shank support for the FES-rowing system. I would like to thank
Abdolazim Rashidi and Vera Zivanovic for their support with the hardware and ethics
submissions. I would like to thank my lab mates and friends, Gongkai Ye, Dr. Hikaru
Yokoyama, Dr. Kento Nakagawa, Jae Lee, Martha Garcia, Katherine Chan, Angela Yoo, Kai-
Lon Fok, Derrick Lim, Emerson Grabke, Megan Kamachi, Thomas Nguyen, Nethangi Udugama,
Sadaf Rai, Antony Cai, Tishani Sritharan, Sai Vemula, Ryan Koh, Ileana Co, and Nila Wu for
always being there when I needed them. I would like to thank my parents, Sivasothy
Theventhiran and Theventhiran Varithamby and brother, Bremyan Theventhiran for their
sacrifices and encouragement. I would like to thank my cousins, Dr. Karthiha Raveenthiran,
Anujan Raveenthiran, Gabilan Sivapatham, Gobinaath Sivapatham, Gajanee Sivapatham, and
Umaseh Sivanaesan for motivating me and lifting me up. Every single person played a pivotal
role in my journey, thank you!

iv
Table of Contents
Acknowledgments.......................................................................................................................... iii
Table of Contents ........................................................................................................................... iv
List of Figures ............................................................................................................................... vii
Introduction .................................................................................................................................1
Literature Review: .......................................................................................................................3
2.1 Benefits of FES-rowing .......................................................................................................3
2.1.1 Cardiovascular Benefits ...........................................................................................3
2.1.2 Musculoskeletal Benefits .........................................................................................3
2.1.3 Bone Density Benefits .............................................................................................4
2.2 Rowing Technique ...............................................................................................................4
2.2.1 Symmetric Force Production & Leg Length ............................................................5
2.2.2 Lower Back Strain: Lumbar Extension....................................................................5
2.2.3 Sequential muscle activation patterns (Legs, Trunk, Arms): ...................................6
2.3 Disparities in Leg Muscle Activation During Rowing ........................................................7
2.3.1 Effect of Auditory Cues ...........................................................................................8
2.3.2 Effect of controlled stroke rate ................................................................................9
2.4 FES During Rowing ...........................................................................................................10
2.5 Coaching and Feedback Systems for Rowing ...................................................................12
2.5.1 Auditory vs. Visual Feedback ................................................................................12
2.5.2 Frequency of feedback ...........................................................................................12
2.6 Summary ............................................................................................................................13
Research Objectives & Hypothesis ...........................................................................................15
Hardware: Development of FES-Rowing System ....................................................................16
4.1 Custom footplates, back and shank support .......................................................................16
4.2 Mounting Position Sensors ................................................................................................17

v
4.3 Force Sensor Calibration....................................................................................................19
4.4 Position Sensor Calibration................................................................................................20
4.5 Other Modifications on FES-rowing Ergometer ................................................................22
Experiment 1: Determine Timing of Leg Muscle Activation in Able-Bodied Rowers ............24
5.1 Introduction ........................................................................................................................24
5.2 Methodology ......................................................................................................................25
5.2.1 Participants .............................................................................................................25
5.2.2 Experimental Design ..............................................................................................26
5.2.3 Data Analysis .........................................................................................................28
5.3 Results: ...............................................................................................................................30
5.3.1 Leg Muscles Activation Patterns ...........................................................................30
5.3.2 Determining Optimal Timing of Stimulation ........................................................32
5.4 Discussion: .........................................................................................................................37
5.4.1 Leg Muscle Activation Patterns: ............................................................................37
5.4.2 Temporal Differences Between Kinematic Events and VL Onset: .......................39
5.4.3 Spatial Difference Between Kinematic Events and VL Onset: .............................40
5.4.4 Influence of Metronome: .......................................................................................41
5.4.5 Identifying the Target Seat Position Range for Manual Button Press: ..................42
Software: Development of a Coaching System to Instruct Users on the Optimal Timing to
Administer Stimulation for FES-rowing. ..................................................................................44
6.1 Appropriate Timing for Manual Button Pressing ..............................................................44
6.2 FES-Rowing with Coaching System .................................................................................44
6.3 Feedback Modality for GUI of Coaching System .............................................................45
6.4 Delays ................................................................................................................................47
Experiment 2: Testing and Validation of Coaching System .....................................................48
7.1 Introduction: .......................................................................................................................48

vi
7.2 Methodology ......................................................................................................................49
7.2.1 Participants:............................................................................................................49
7.2.2 Protocol: .................................................................................................................49
7.2.3 Data Analysis .........................................................................................................51
7.3 Results: ...............................................................................................................................51
7.3.1 Effect of Coaching System on Seat Position During Button Press ........................51
7.3.2 Effect of Coaching System on Timing of Button Press .........................................53
7.4 Discussion: .........................................................................................................................57
7.4.1 Summary and Explanation of Main Findings ........................................................57
7.4.2 Coaching Significantly Influences Timing of Button Press for FES. ....................57
7.4.3 Coaching does not significantly influence seat position during button press for
applying FES. .........................................................................................................58
7.4.4 Relate the findings to similar studies .....................................................................59
7.4.5 Implications for Testing in Individuals with SCI ..................................................60
7.4.6 Alternate Explanations for Findings ......................................................................60
7.4.7 Visual and Auditory Feedback Systems: ...............................................................60
7.4.8 Limitations .............................................................................................................61
7.4.9 Suggestions for Further Research ..........................................................................62
Conclusions ...............................................................................................................................63
References .................................................................................................................................64
Appendix: Closed Loop Automatic Stimulator Option ............................................................70
10.1 Introduction: .......................................................................................................................70
10.2 Rationale for Seat Position Based Controllers Rather than Time Dependent
Controllers..........................................................................................................................71
10.3 Testing and Validity of Automatic Stimulator ...................................................................72
10.4 Benefits of Closed Loop Stimulator ..................................................................................73
10.5 Drawbacks of Closed Loop Stimulator ..............................................................................74

vii
List of Figures
Figure 1. Handle and foot force distributions between AB and SCI throughout one stroke [5].
Able-bodied individuals initiate the rowing stroke with their legs (peak of dotted line), while leg
forces are delayed in individuals with spinal cord injury [5]. Cited and modified from [5]. ......... 7
Figure 2. Vastus lateralis muscle activation after normalization and averaging from 13
individuals during the drive (left) and recovery (right) phase. The x-axis is percent of rowing
stroke, and y-axis is the percent of maximal EMG activity. Cited and modified from [20]. ........ 8
Figure 3: A collection of stimulation parameters from 28 FES-rowing articles demonstrating the
stimulator used, target muscles, frequency chosen, maximum intensity level and pulse width. A
pulse width of 450 us, a frequency of 40 Hz or 50 Hz, and a maximum intensity up to 115 mA
was most commonly used as a threshold when the muscle fatigued. ........................................... 11
Figure 4. Modified Rowing Ergometer with Sensors. The modified rowing ergometer for
individuals with SCI includes a back rest and shank support. This was instrumented with position
and force sensors for data collection. Position sensors were used to determine the handle and seat
position. Force sensors were used to determine the handle and foot forces. ................................ 16
Figure 5. Custom footplates. The first picture displays the outer casing of the footplate enclosing
the sensors. The second picture displays the normal force sensor (GS1240-250 Kg-SS), and the
final picture displays the setup for the shear force sensor (SML-300; Interface). Cited and
modified from [43]. ....................................................................................................................... 17
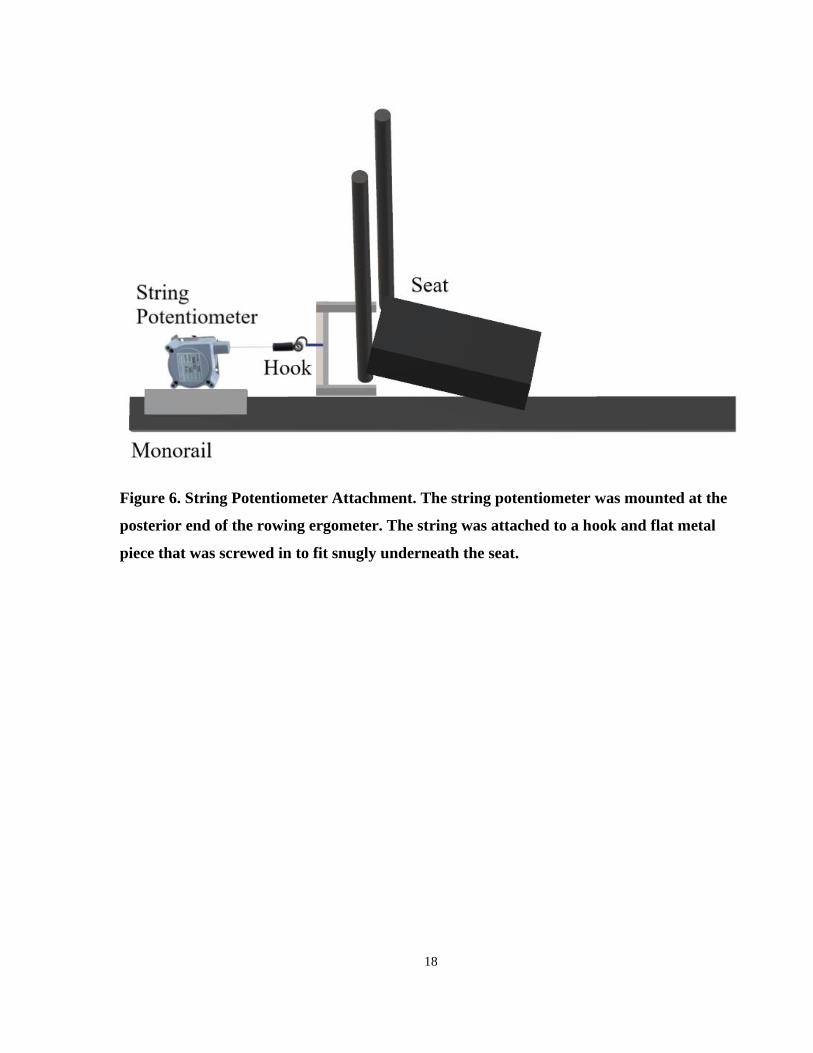
Figure 6. String Potentiometer Attachment. The string potentiometer was mounted at the
posterior end of the rowing ergometer. The string was attached to a hook and flat metal piece that
was screwed in to fit snugly underneath the seat. ......................................................................... 18
Figure 7. Calibration results from sensors in custom built footplates: 2 normal force (top and
bottom left) and 2 shear force sensors (top and bottom right). Each of these plots show the linear
relationship between voltage and force......................................................................................... 19
Figure 8. Calibration of string potentiometer sensors using motion capture. Voltage reading
converted to distance (red) is overlaid with the distance determined by motion capture (blue). . 21

viii
Figure 9. Modified rowing ergometer with back support, spring and force and position sensors.23
Figure 10. Leg muscle EMG patterns, handle and seat position, and foot and handle force in a
typical rower during 1 stroke cycle. Solid line indicates average, and dotted lines indicate
standard deviation after 30 strokes were normalized and averaged. Electromyograms from
Rectus Femoris (RF), Vastus Lateralis (VL), Vastus Medialis (VM), Biceps Femoris (BF), Soleus
(SOL), Medial Gastroc. (MG), Lateral Gastroc. (LG), Tibialis Anterior (TA). Kinematic and
kinetic data such as Seat Position (SP), Handle Position (HP), Foot Force (FF), Handle Force
(HF). .............................................................................................................................................. 31
Figure 11. The timing difference (seconds) between various kinematic events (posterior seat
position, posterior handle position, anterior handle and seat position) and VL onset across 4
different trials. Dark orange bar indicates preferred stroke rate, with a metronome. Light orange
bar indicates preferred stroke rate without a metronome. Dark green bar indicates 30 stroke rate
with a metronome. Light green bar indicates 30 stroke rate without a metronome. ..................... 32
Figure 12. Vastus lateralis EMG (red), seat position (green), and handle position (blue) during
one sample strokes across 1.75 seconds. Vertical colored lines show EMG onset (red), the
anterior kinematic events are shown by the green seat trough and blue handle trough, and the
posterior kinematic events are shown by the green seat peak and blue handle peak. ................... 34
Figure 13. The average seat and handle position during VL onset from 10 participants are shown
in the graphs above for each trial type. ......................................................................................... 36
Figure 14. Sensor data is used to provide real time feedback on the optimal timing of button
press to administer FES to the legs, which sends a signal to the electrical stimulation and
activates the quadriceps for knee extension during the drive phase. Releasing the button when the
seat reaches the posterior end of the ergometer will cause stimulation to the hamstrings only for
the recovery phase......................................................................................................................... 45
Figure 15. The coaching system interface provides real time feedback on manual button press for
administering FES, average power per stroke and stroke rate. A second window provides power
output feedback for the duration of a single stroke. ...................................................................... 46

ix
Figure 16. Effect of Coaching System on Seat Position During Button Press in a Typical Subject.
The graphs show the seat position during every single button press in no coaching (blue) and
coaching (orange) trial respectively. Dotted line shows the acceptable target seat position range
of administering FES based on experiment 1. .............................................................................. 52
Figure 17. Seat position during button press in 7 subjects in no coaching (blue) and coaching
conditions (orange). Seat position values were not normally distributed so they are displayed as a
box plot. ........................................................................................................................................ 53
Figure 18. Effect of Coaching System on Timing of Button Press in a Typical Subject. Graphs
show timing of button press relative to the anterior most seat position (time diff. of zero sec;
vertical black bar) in no coaching (blue) and coaching (orange) condition respectively. Positive
timing difference values indicate the correct button presses which happened prior to anterior seat
peak. Negative values indicate incorrect/delayed button presses. ................................................ 55
Figure 19. Timing difference between button press and seat peak in 7 subjects. Positive timing
difference values indicate correct button presses that occurred before the seat reached the
anterior peak. Negative time difference values indicate incorrect button presses that occurs after
the seat passed the anterior peak. .................................................................................................. 56
Figure 20. Closed loop automatic stimulator. The computer reads the position of the seat at a
sample rate of 200 Hz. It sends a signal to the electrical stimulator to administer FES to the
appropriate muscle when the seat reaches a target seat position. For example, when the seat
reaches the target anterior-most position, it stimulates the quadriceps for knee extension during
the drive phase. When the seat reaches the target posterior-most seat position, it stimulates
hamstrings for knee flexion during the recovery phase. ............................................................... 71
Figure 21. The seat position at the moment of stimulation was recorded across 30 consecutive
strokes in 5 subjects. The target seat position for administering stimulation was based on the seat
position during leg muscle activation as determined by the results from Experiment 1. ............. 72
Figure 22. The timing difference between button press and seat position peak was calculated
across 30 consecutive strokes in 5 subjects. The positive difference values indicate that the
stimulation occurred around 0.3 seconds before the seat reached the anterior most position. ..... 73

1
Introduction
Spinal cord injuries (SCI) affect around 500,000 individuals per year around the world
[1]. These individuals often experience a deterioration in their cardiovascular and
musculoskeletal system due to physical inactivity after injury [1]–[7]. There are several aerobic
exercises that aim to counter-act these comorbidities and decrease the risk of cardiovascular
disease and fractures due to low bone mineral density [1]–[3], [6], [8], [9]. However, individuals
with a higher level of injury had paralysis of a greater amount of muscle mass which
significantly restricts an individual’s aerobic capacity[1]. This prevents them from exercising at
the high intensities necessary for reducing cardiovascular risk [1]–[3]. For example, arm-crank
ergometry for the upper limbs of individuals with incomplete paraplegia does not engage enough
muscle mass to induce sufficient aerobic demand [1]. The next progression was incorporating the
paralyzed leg muscles into rehabilitation exercises, which elicits higher aerobic demand.
Functional electrical stimulation (FES) induces artificial contractions in paralyzed muscle using
an electric current. FES of leg muscles allows for engagement of greater muscle mass and has
been used to promote cardiovascular health in individuals with SCI, by use of various exercises
[1], [2]. FES-cycling exercise is the most popular, nevertheless it has been shown that the
exercise intensity during FES cycling tend not to meet the aerobic demand for reducing
cardiovascular risk. Consequently, hybrid FES exercises may be the key. Hybrid FES exercises
involve voluntary movement of the upper limbs coupled with FES to the quadriceps and
hamstrings to engage the lower limbs [1]–[3]. For example, hybrid FES-cycling involves the
coupling of FES cycling with arm-crank ergometry. Hybrid FES exercises have shown greater
aerobic demand measured by peak oxygen consumption (26.5 – 35.7 mL/kg/min) relative to
other clinical exercises (i.e. arms only:15.7 mL/kg/min or FES-cycling: 14.3 mL/kg/min
exercises) [1]–[4], [10]. Another form of hybrid FES-exercise, known as FES-rowing, emerged
with modifications to standard ergometers to enable individuals with SCI to perform this full
body exercise [10]. In FES-rowing, the arms and legs are engaged in a coordinated manner, with
a plethora of additional benefits including the activation of the lower limb muscle pump for
venous return, cardiac hypertrophy, reduced leptin and glucose levels in the blood,

2
improvements in bone density, and greater muscle mass [1]–[3], [6], [8], [9], [11]. Thus, FES-
rowing is one of ideal exercises improving the cardiovascular health in individuals with SCI.
Although hybrid FES-cycling is relatively easy to learn, FES-rowing is a complex full body
exercise; individuals with spinal cord injury require many training sessions to obtain sufficient
skill and learn the timing of administering FES to their lower limbs to perform the movement
correctly[12]. Able-bodied individuals rely more on and initiate the rowing stroke with their
legs, but individuals with SCI may initiate the rowing stroke with their arms leading to low force
production and minimal involvement of the legs [5]. This is a critical issue because improper
FES timing to the legs impairs coordination between upper and lower limbs, which prevents the
individual from receiving the benefits of this exercise [5].

3
Literature Review:
2.1 Benefits of FES-rowing
2.1.1 Cardiovascular Benefits
The limb paralysis resulting from SCI can inhibit individuals from achieving the high exercise
intensities that are necessary for counteracting cardiovascular disease [1]. Therefore, it is
necessary that the individual’s rehabilitation plan involves exercises with high aerobic demand
[1]. There are a plethora of studies comparing the cardiovascular benefits of FES-rowing relative
to other clinical exercises in individuals with SCI [1]–[3], [10], [13]–[15]. An early study
compared 1) arms only rowing, 2) legs only stimulation, and 3) the hybrid exercise combination:
both arms-rowing and legs-stimulation. The combined arms-rowing and leg-stim was shown to
have the greatest increases in oxygen uptake (VO2 of 16.38 nm ml/kg/min: 83% of maximum).
These studies demonstrated that a coordinated full body exercise combining arms-rowing and
legs-stimulation had increased oxygen consumption because of greater muscle mass involved in
the FES-rowing exercise [2]. Invoking greater muscle mass is useful for aerobic training to
reduce cardiovascular disease. Furthermore, hybrid training is superior to arms-only exercises
because targeting the legs reduces venous pooling [3]. These benefits are greater in individuals
with higher level injuries. They have greater paralyzed muscle mass and lower initial aerobic
capacities; thus, they experience a greater relative increase in aerobic capacity. For example, an
individual with a C5 injury doubled their peak aerobic capacity but an individual with a T4
injury only experienced a 20% increase [3].
Cardiac structure and function were also altered after SCI individuals underwent FES-rowing
training. Five SCI individuals who consistently participated in FES-rowing had cardiac structure
and function that was similar to able-bodied individuals. Ultrasound (echocardiogram) analysis
demonstrated improvement in cardiac wall thickness during diastole after FES-training, which
may indicate cardiac hypertrophy [7].
2.1.2 Musculoskeletal Benefits
Spinal cord injury results in a muscle fiber shift from type I (slow twitch, endurance) towards
type II fibers (fast, anaerobic, highly fatigable) within weeks after SCI possibly due to

4
inactivity[16]. However, several studies have shown increases in muscle cross sectional area,
changes in the myosin heavy chains expressed, and improvements in capillary density after FES
training [16].
2.1.3 Bone Density Benefits
Spinal cord injury often results a decrease in physical activity, which causes a decrease in
bone mineral density in the femur and tibia leading to fractures [6], [8], [9]. Counteracting this
loss of bone can be partially accomplished by exercise involving loads of 1.5 times the
individual’s body weight [6]. One study demonstrated that one FES-rowing trained participant
had higher trabecular bone mineral density than expected in chronic SCI individuals[8].
Therefore, this exercise provided joint contact forces above the necessary threshold for
preventing this loss of trabecular bone density [8]. Another article established a stress threshold
value which would result in remodeling of the tibia during FES-rowing [6]. Specifically,
Gibbons used positive quantitative computed topography (p-QCT) analysis to assess bone
mineral density in one participant’s ultradistal tibia, who had been training with FES-rowing for
over 2 years [9]. This participant’s bone mineral density was within the range of able bodied
individuals (within 0.57 s.d.) and far above SCI individuals (1.66 s.d. away from able bodied).
Therefore, the loading during FES-rowing has been shown to prevent the bone mineral density
loss normally seen in SCI individuals [8], [9].
Safety considerations are essential for developing an exercise in the spinal cord injury
population. 3D stress analysis demonstrated where the loading stress was applied on the tibia
and it was revealed that there were not unsafe levels of stress applied [6]. Studies across several
years also reveal that there have not been any skeletal issues or fracture risk reported across
sample sizes of over 20 participants emphasizing that this is a safe exercise with bone related
benefits [8].
2.2 Rowing Technique
There are several factors that contribute to optimal rowing technique including sequential muscle
activation patterns, symmetric force production, safe lumbar extension and knee joint angles.

5
Cerne (2013) compared rowing technique between three groups of participants: non-rowers,
junior rowers, and elite rowers [17]. It was found that elite rowers had more consistent technique
irrespective of the stroke rate [17]. To elaborate, in elite rowers, the stroke length was not
dependent on stroke rate and was consistent at all stroke rates [17]. Stroke length of junior
rowers and non-rowers were only consistent at same stroke rate. Elite rowers had a normalized
stroke length (stroke length / height) target of 0.83, junior rowers had normalized stroke length
of 0.87, and non-rowers had shortest stroke length due to lack of trunk inclination, knee flexion
at drive phase, and lack of pulling handle to abdomen [17]. This study emphasizes that 1) good
rowing technique is classified by consistency to some extent, and 2) requires the handle to be
pull to the abdomen. Therefore, when conducting experiments, it will be essential to monitor
rowing consistency and recommend that individuals pull the handle to their abdomen.
2.2.1 Symmetric Force Production & Leg Length
Even within the same participant, Greene (2009) showed that variation in the shank length to
thigh length ratio between each leg can result in altered timing and force production [18]. For
example, individuals with shorter shank length had earlier power generation relative to those
with a longer shank [18]. Furthermore, individuals with shorter shank length had greater lumbar
extension during the drive phase and decreased rotation of the pelvic segment to compensate, but
ultimately had similar performance as longer shank individuals [18]. In this study, these
variations in timing did not affect overall power output. However, it highlights the idea that
anthropomorphic variability can alter muscle activation timing during rowing. This is an
important consideration for determining the optimal timing for administering stimulation to the
legs during FES-rowing.
2.2.2 Lower Back Strain: Lumbar Extension
Greene’s (2009) study demonstrated that shorter shank length resulted in earlier power
generation due to greater lumbar extension [18]. However, greater lumbar extension and knee
flexion angles during rowing puts individuals at a greater risk of injury [18]. Therefore, even
though 14 elite rowers have demonstrated variations in rowing technique to maximize force
production, there may be trade-offs resulting in overuse injury. In a population involving
individuals with spinal cord injury, it is important to prioritize safety over force output or

6
performance. The modified rowing ergometer used in this thesis study is equipped with a back
rest and shoulder straps to prevent excessive lumbar extension and flexion.
2.2.3 Sequential muscle activation patterns (Legs, Trunk, Arms):
Sequential muscle activation is an important consideration during rowing. There are variations in
upper and lower limb coordination between AB and SCI FES-rowers. Firstly, AB rowers
initiated the stroke with arms and legs concurrently [5]. Accurately timed knee extension allows
the seat to move posteriorly followed by the handle pull, allowing for a synchronization of the
force generation [5]. Therefore, AB rowers demonstrated greater oxygen consumption, and
double the mechanical efficiency (work over oxygen consumption) [5].
However, individuals with incomplete SCI are more reliant on their arms for force generation. In
individuals with SCI, the drive phase was incorrectly initiated by the arms and the knee
extension occurred afterwards as shown in the figure below [5]. Since the knee extension was
delayed, the seat was in the anterior position for a longer duration of the stroke [5]. SCI
individuals also had low foot force, which was approximately 10% of their body weight,
regardless of stimulation intensity used and a faster stroke rate with a shorter drive phase [5].
Thus, they had lower oxygen consumption and less external work, which limits the potential
benefits [5]. Importantly, the delayed knee extension (i.e. improper technique) may result in
buckling of the knees during handle pull which would impair the individual’s ability to complete
the drive phase during the rowing exercise. When developing the coaching system, it will be
imperative to monitor seat position and encourage individuals to focus on initiating the drive
phase with the legs to prevent the knees from buckling.

7
2.3 Disparities in Leg Muscle Activation During Rowing
The rowing exercise is a complex movement that demands full body coordination[19]. Previous
studies have investigated the muscle activation patterns during rowing in order to understand the
timing of muscle activation, investigate fatigue, or compare various rowing ergometers [19]–
[21]. Electromyography and kinematic studies on standard rowing ergometers for use in able-
bodied individuals have been shown that specific regions of the spine (lumbar L3 - sacral S1) are
more vulnerable to soft tissue injury since this region shows the most movement during the
rowing action[21]. Our modified rowing ergometer has a back rest with shoulder straps, shank
support, a spring for facilitating the recovery phase, and minor modifications to reduce
movement of the spine in individuals with spinal cord injury [4]. These modifications may result
in alterations in the leg muscle activation patterns. Even various brands and types of standard
rowing ergometers have shown differences in thoracic and leg muscle activation patterns[20].
Therefore, it is important to consider the influence of the modified rowing ergometer on leg
muscle activation patterns.
Firstly, in order to determine the optimal timing of administering stimulation to the legs, it would
be useful to explore the leg muscle activation patterns in able-bodied individuals. The leg muscle
activation patterns on standard ergometers (slide-based and stationary ergometers) have shown
that the vastus lateralis muscles were active during the drive phase [20]. One interesting feature
Figure 1. Handle and foot force distributions between AB and SCI throughout one stroke
[5]. Able-bodied individuals initiate the rowing stroke with their legs (peak of dotted line),
while leg forces are delayed in individuals with spinal cord injury [5]. Cited and modified
from [5].
8
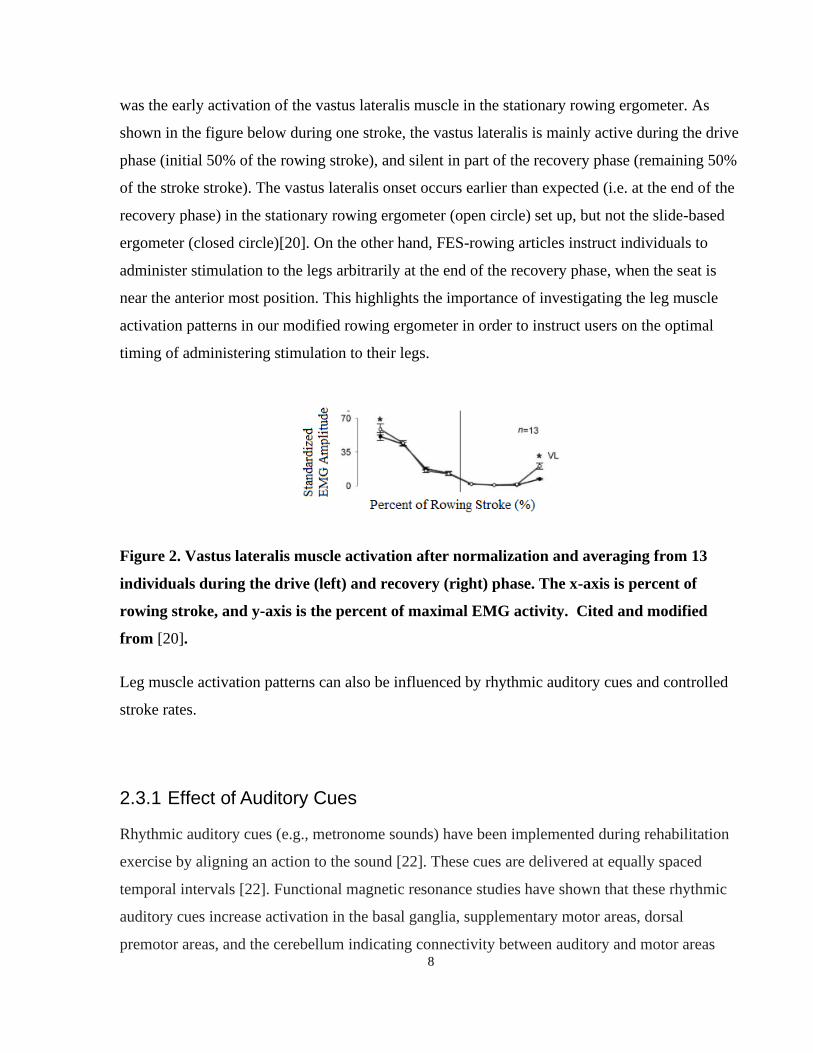
was the early activation of the vastus lateralis muscle in the stationary rowing ergometer. As
shown in the figure below during one stroke, the vastus lateralis is mainly active during the drive
phase (initial 50% of the rowing stroke), and silent in part of the recovery phase (remaining 50%
of the stroke stroke). The vastus lateralis onset occurs earlier than expected (i.e. at the end of the
recovery phase) in the stationary rowing ergometer (open circle) set up, but not the slide-based
ergometer (closed circle)[20]. On the other hand, FES-rowing articles instruct individuals to
administer stimulation to the legs arbitrarily at the end of the recovery phase, when the seat is
near the anterior most position. This highlights the importance of investigating the leg muscle
activation patterns in our modified rowing ergometer in order to instruct users on the optimal
timing of administering stimulation to their legs.
Figure 2. Vastus lateralis muscle activation after normalization and averaging from 13
individuals during the drive (left) and recovery (right) phase. The x-axis is percent of
rowing stroke, and y-axis is the percent of maximal EMG activity. Cited and modified
from [20].
Leg muscle activation patterns can also be influenced by rhythmic auditory cues and controlled
stroke rates.
2.3.1 Effect of Auditory Cues
Rhythmic auditory cues (e.g., metronome sounds) have been implemented during rehabilitation
exercise by aligning an action to the sound [22]. These cues are delivered at equally spaced
temporal intervals [22]. Functional magnetic resonance studies have shown that these rhythmic
auditory cues increase activation in the basal ganglia, supplementary motor areas, dorsal
premotor areas, and the cerebellum indicating connectivity between auditory and motor areas

9
[22]–[25]. A meta-analysis also showed that auditory cues had higher basal ganglia activation in
a finger tapping task relative to visual or no cued tapping tasks [22], [26]. Furthermore, auditory
cues have been shown to reduce movement variability in individuals with Parkinson’s disease
(who have degradation of dopamine neurons in the substantia nigra) [27], [28]. Individuals with
spinal cord injury demonstrated issues with intralimb coordination shown by altered hip and
knee angles during gait relative to able-bodied individuals [29]. The sensory impairment
associated with spinal cord injury can also impair motor behavior and inter-limb coordination
[30], [31]. Given the connectivity between auditory and motor areas, the addition of an auditory
cue may help with timing and/or movement coordination during rowing.
2.3.2 Effect of controlled stroke rate
There is a discrepancy regarding recommended stroke rates for FES-rowing. Stroke rate is
important because it may influence the power generated and technique during rowing. In rowing,
increases in stroke rate occur by reducing the time spent in the recovery phase[32]. In other
sports, such as swimming, if stroke continues to increase beyond an optimal level, the
swimmer’s velocity begins to decrease[32]. One study has shown that increasing stroke rate
generally resulted in increasing work output in sub-elite athletes [32]. However, they only tested
stroke rates of up to 40 strokes per minute[32]. Discussions with elite rowers recommended
relatively slow cadences of around 24 strokes/min. During preliminary testing on our modified
rowing ergometer in non-rowers, we observed that power output was relatively subjective to the
individual’s level of effort; it was possible for individuals to have greater work output during
slower stroke rates, or lower work output during faster stroke rates. This may also be due to
deterioration of rowing technique at faster stroke rates in non-rowers. Our modified FES-rowing
ergometer has shoulder straps and back rest which restricts lumbar flexion, shortening the stroke
length[4]. With a shorter stroke length, individuals naturally row at faster stroke rates. To
support this claim, one study has shown that there are discrepancies in the preferred stroke rate
between able-bodied individuals and individuals with spinal cord injury[5]. Higher stroke rates
and variability of stroke rates were observed in FES-rowing relative to able-bodied rowing (FES-
rowing: 36 ± 6; AB rowing: 25 ± 3, p < 0.01) [5]. Therefore, before the development of the
coaching system, it is important to investigate the effect of controlled versus preferred stroke
rates in order to determine if this will influence button press timing.

10
2.4 FES During Rowing
The rowing exercise is a complex motion involving coordination of both upper and lower limbs.
Wheeler (2002) split the rowing stroke into three phases: the drive phase, the pull phase and the
return phase [33]. The drive phase consists of knee extension. Next, the pull phase consists of
handle pull by the arms, while the legs remain maximally extended. In some articles, the pull
phase is considered part of the end of the drive phase. Finally, the return phase consists of
pushing the arms forward, and flexing the knee to return to the anterior most position on the
rowing ergometer [33].
In order to produce this sequence of movements using functional electrical stimulation: 1) The
quadriceps are stimulated for knee extension to signal the end of the return phase and initiate the
drive phase. 2) The quadriceps are continually stimulated through-out the drive phase, and
during the pull phase. 3) Finally, the hamstrings are stimulated for knee flexion during the return
phase. The return phase is also assisted by a spring in this FES-system [33]. Next, it is important
to consider the parameters of stimulation during FES-rowing.
A literature review of 28 FES-rowing articles was conducted, and the most commonly used
stimulation parameters of FES-rowing studies are summarized in Figure 3 to determine what
stimulation parameters should be used during FES-rowing. Firstly, the four-channel stimulator
was preferred over the two-channel stimulator. The four-channel stimulator targeted the
quadriceps during knee extension and the hamstrings during knee flexion. The stimulation was
self-administered through a manual switch (or switches) found on the handle. The quadriceps
were stimulated for extension when the button was pressed, and the hamstrings were stimulated
for flexion when the button was released. In some cases, stimulation to the hamstrings and
quadriceps were controlled by separate switches. Figure 3 demonstrates that the most commonly
used stimulation parameters for FES-rowing were a pulse width of 450 us, a frequency of 40 or
50 Hz, maximal stimulation intensity of 115 mA, and a four-channel stimulator targeting both
quadriceps and hamstrings muscles.

11
Figure 3: A collection of stimulation parameters from 28 FES-rowing articles demonstrating the stimulator
used, target muscles, frequency chosen, maximum intensity level and pulse width. A pulse width of 450 us, a
frequency of 40 Hz or 50 Hz, and a maximum intensity up to 115 mA was most commonly used as a threshold
when the muscle fatigued.
There are a variety of methods used to administer stimulation including manual stimulators (push
buttons) and automatic stimulators (PD, PID controllers, fuzzy logic controllers) [33]–[36].
However, most studies resorted to manual self-administration of FES for several reasons. The
primary reason is preference and comfort: the participant would be able to stop the stimulation
immediately or choose not to stimulate if they so wished[4][37]. Also, they would be able to
selectively control the duration of stimulation and minimize the electrical stimulation
needed[4][37]. This is important because automatic stimulation systems administer FES for the

12
whole duration of the drive phase, which is unnecessary discomfort, results in quicker muscle
fatigue and does not feel natural for the participants[37].
2.5 Coaching and Feedback Systems for Rowing
Coaching systems have used auditory or visual feedback systems to hasten learning in complex
motor exercises. The optimal response to feedback is based on modality of feedback provided
and the frequency/ amount of feedback (i.e. user may become overwhelmed).
2.5.1 Auditory vs. Visual Feedback
Visual feedback has been shown to aid learning of complex tasks during the early phases of
motor skill acquisition. Auditory feedback can also provide a lot of information to the user: In
visually impaired elite para-rowers, acoustic feedback on boat speed was shown to improve boat
speed and acceleration [38]. In a more complex method of auditory feedback, auditory
movement sonification involves matching the movement error to the pitch or volume of the
auditory feedback (i.e. the greater the error, the louder the auditory feedback). This form of
auditory sonification was developed for a rowing-type movement, but its usefulness has not been
explored [38]. These studies show that auditory feedback can improve rowing performance and
communicate a plethora of information.
Furthermore, the combination of different modalities of feedback may improve motor learning.
For example, Sigrist et al., (2014) compared multimodal types of feedback to assess whether
they improved learning [39]. Specifically, they compared audiovisual feedback, visuo-haptic
feedback, and visual feedback only and demonstrated that all groups were able to decrease
movement error, but audiovisual feedback significantly improved learning relative to the other
modalities [39].
Therefore, integrating both visual and auditory feedback into the coaching system for
administering FES to the legs may accelerate learning.
2.5.2 Frequency of feedback
Anderson et al. (2005) and Bardy et al. (2013) examined real-time visual feedback interventions
for teaching and improving performance in novice rowers[40][41]. Anderson et al. (2005)
13
explored three different frequencies of visual feedback interventions (detailed real-time
feedback, summary feedback and no feedback) to investigate their effects on rowing
performance and consistency[40]. They showed that detailed real-time feedback improved
rowing performance and consistency relative to summary feedback and no feedback[40].
Furthermore, summary feedback was shown to improve rowing consistency relative to no
feedback[40]. However, there were no significant differences in rowing performance between
summary feedback and no feedback[40]. Bardy et al. (2013) investigated whether virtual reality
technology could teach energy-management strategies to novice rowers[41]. The virtual reality
coaching group was compared to a control group that underwent a generic coaching procedure
instructed by an elite rower[41]. The virtual reality coaching group showed an increase in rowing
performance relative to the control group[41]. These studies highlight that 1) detailed real time
feedback can improve performance relative to summary and no feedback, 2) teaching new skills
to novice rowers through game-related feedback systems may accelerate learning. By applying
the findings from these studies: developing a real-time visual feedback coaching system to
instruct novice rowers on the optimal timing of administering FES to their legs may accelerate
learning (i.e. reduce the number of sessions required for individuals to learn FES timing).
In many FES-rowing studies, individuals with spinal cord injury often take many sessions to
learn the optimal timing of administering stimulation. Reducing the number of sessions required
for individuals to learn FES timing is important because accelerating their learning of the rowing
exercise will allow them to train at the higher intensities necessary for cardiovascular benefits.
Improving the level of fitness and reducing cardiovascular risk in individuals with spinal cord
injury can have profound implications in their quality of life and autonomy.
2.6 Summary
It is important for new rowers to learn proper timing of leg muscle activation to perform the
exercise correctly, maximize musculoskeletal and cardiovascular benefits and to prevent injuries
while muscle patterns are still being developed. However, previous groups stimulate the legs
arbitrarily and have not developed a target range to guide the timing of leg extension during
FES-rowing. Previous groups developed and tested automatic controllers (PD, PID, fuzzy logic
controllers) to administer FES based on the anterior most seat position. However, many groups
14
reverted to manual stimulators through a push button due to patient preference and in order to
maximize the voluntary contribution toward the exercise [4], [34]–[36]. Furthermore,
maximizing voluntary contribution using a manual push button is potentially superior to motor
based systems because it may promote neural plasticity and accelerate learning of complex
motor behaviors.
While Draghici (2017) studied two-dimensional rowing biomechanics of rowing using string
potentiometers to estimate the handle and seat position [5], it is necessary to investigate the leg
muscle activation patterns relative the seat position in order to determine the optimal timing of
administering FES to the legs. Optimal timing of leg muscle activation during the rowing
exercise is essential for performing the drive phase of the rowing stroke: the drive of the legs
should be linked to the subsequent handle pull[42]. Optimal timing of leg muscle activation may
also maximize force output, counteract muscle atrophy and improve cardiovascular function [5],
[13]. To elaborate, AB rowers perform the rowing action in a coordinated manner by extending
the legs and pulling the handle shortly after [5]. In contrast, SCI rowers initiate the rowing action
with their arms, followed by a brief delay before knee extension using FES [5]. Other studies
investigating rowing technique and communication with elite rowers has also highlighted the
importance of initiating the drive phase with knee extension first, followed by handle pull to
prevent the seat from moving anteriorly during the drive phase, in the case of weaker leg
muscles. These differences in the biomechanics of rowing result in decreased work output and
prevent individuals with SCI from performing the drive phase of the rowing exercise [5], [42].
The rowing action is a complex movement that requires proper technique to perform the
movement correctly, maximize force production and enhance the cardiovascular and
musculoskeletal benefits, while preventing injuries. Given that FES-rowing has a slow learning
curve, it often takes several sessions (approximately 13±7) for an SCI individual to become
accustomed to the movement and perform at a level with sufficient aerobic demand for reducing
cardiovascular risks [2]–[8]. Furthermore, implementing a coaching system with multimodal
real-time feedback may accelerate learning of button press timing. Therefore, individuals need to
be properly instructed on the timing of a manual switch initiating electrical stimulation to the
legs to perform the rowing movement effectively [5], [42].

15
Research Objectives & Hypothesis
Objective: The aim of this thesis study was to design a coaching system to instruct users on the
optimal timing of FES-induced knee extension.
Specific Aims: The specific aims of this study were to: (1) modify a rowing ergometer to enable
individuals with spinal cord injury to perform FES-rowing; (2) determine the optimal FES timing
based on the timing of leg muscle activation relative to kinematic events in able-bodied
individuals; (3) develop a coaching system to instruct users on the optimal timing of
administering FES to their legs using a manual switch; (4) test the coaching system to assess
whether it improves timing of button press with and without the coaching system’s guidance in 7
able-bodied individuals.
Hypothesis 1: The administration of FES to the legs should be directly correlated to seat position.
Knee extension should be induced by FES before the seat is at the anterior-most position.
Accordingly, knee flexion should be induced by FES when the seat is at the posterior-most
position.
Hypothesis 2: The coaching system will help improve the timing of manual button press that
administers FES to the legs to allow the user to effectively produce the rowing stroke.
16
Hardware: Development of FES-Rowing System
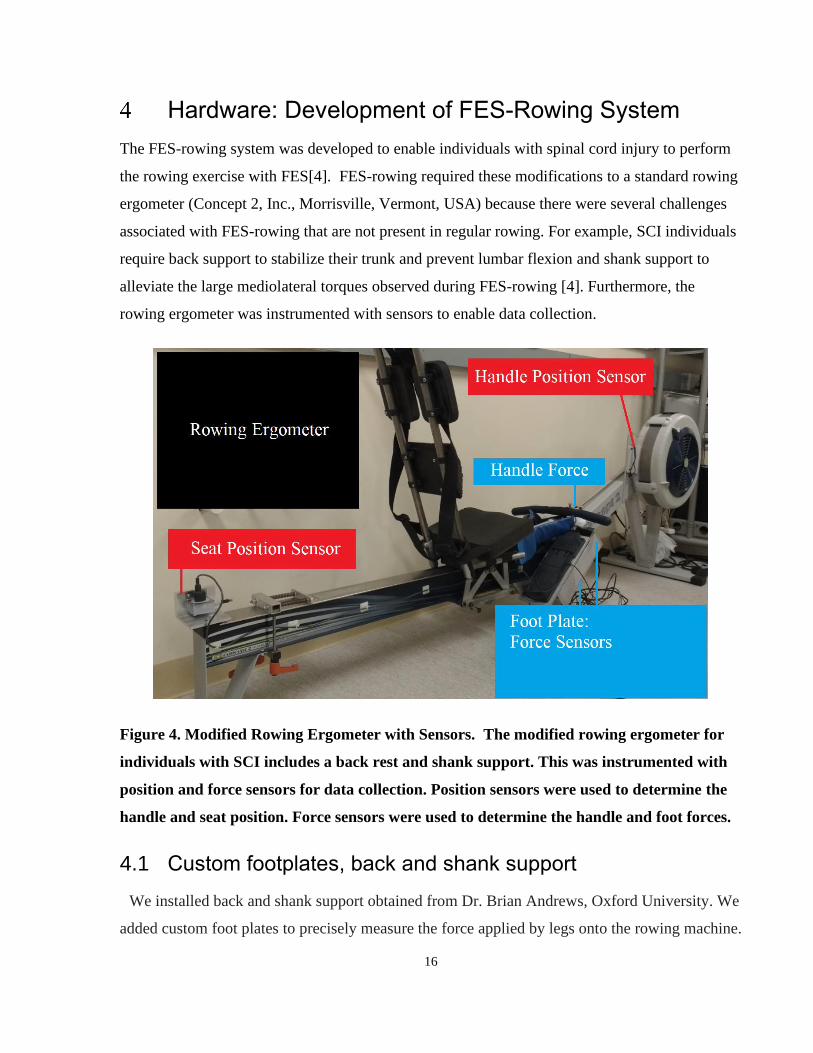
The FES-rowing system was developed to enable individuals with spinal cord injury to perform
the rowing exercise with FES[4]. FES-rowing required these modifications to a standard rowing
ergometer (Concept 2, Inc., Morrisville, Vermont, USA) because there were several challenges
associated with FES-rowing that are not present in regular rowing. For example, SCI individuals
require back support to stabilize their trunk and prevent lumbar flexion and shank support to
alleviate the large mediolateral torques observed during FES-rowing [4]. Furthermore, the
rowing ergometer was instrumented with sensors to enable data collection.
Figure 4. Modified Rowing Ergometer with Sensors. The modified rowing ergometer for
individuals with SCI includes a back rest and shank support. This was instrumented with
position and force sensors for data collection. Position sensors were used to determine the
handle and seat position. Force sensors were used to determine the handle and foot forces.
4.1 Custom footplates, back and shank support
We installed back and shank support obtained from Dr. Brian Andrews, Oxford University. We
added custom foot plates to precisely measure the force applied by legs onto the rowing machine.

17
The custom foot plates were initially designed and built by Travis Van Belle et al as his
undergraduate summer research[43]. Each footplate consists of one shear force and one normal
force sensor (GS1240-250 and SML-300, Interface Advanced Force Measurement Durham
Instruments, Arizona, USA).
Figure 5. Custom footplates. The first picture displays the outer casing of the footplate
enclosing the sensors. The second picture displays the normal force sensor (GS1240-250
Kg-SS), and the final picture displays the setup for the shear force sensor (SML-300;
Interface). Cited and modified from [43].
A few modifications were made to the custom-built footplates. Firstly, the normal force sensor
was attached directly to the metal base, which restricted the necessary deflection of the load cell.
This impaired its ability to measure the heavy loads expected from the legs during the rowing
exercise. Therefore, 1) washers were added above and below the sensor to ensure the sensor had
enough space to deflect for heavier loads and 2) the coarse and fine gain settings were adjusted
in the amplifier.
4.2 Mounting Position Sensors
The position sensors were mounted in order to accurately capture the distance travelled by the
handle and seat during rowing. For handle position, the string potentiometer (Measurement
Specialties, Durham Instruments, Arizona, USA) was mounted near the flywheel, so the string
was parallel to the handle chain[4]. For seat position, the string potentiometer (Measurement
Specialties, Durham Instruments, Arizona, USA) was mounted at the posterior end of the
ergometer and attached to the back of the seat using a small hook[4].
18
Figure 6. String Potentiometer Attachment. The string potentiometer was mounted at the
posterior end of the rowing ergometer. The string was attached to a hook and flat metal
piece that was screwed in to fit snugly underneath the seat.

19
4.3 Force Sensor Calibration
The rowing ergometer was custom mounted with force and position sensors that had to be
calibrated to ensure proper functioning. The force sensors convert a compressive or tension force
into a proportional electrical signal.
Figure 7. Calibration results from sensors in custom built footplates: 2 normal force (top
and bottom left) and 2 shear force sensors (top and bottom right). Each of these plots show
the linear relationship between voltage and force.
In each footplate, there was 1 normal force and 1 shear force sensor. The sensors output a
voltage reading when they experience force. Therefore, in order to calibrate them, weights (25,
50, 75, 100 lbs) were placed on the surface and the voltage readings were recorded. The
equations that define the relationship between the voltage and weight can be used to convert the
voltage reading back into a force reading. All four sensors demonstrated a linear relationship
between voltage and force.

20
The following equations were used to calculate the force exerted based on the output voltage
from the sensors.
Shear Force Sensor Equations:
𝐹𝑜𝑟𝑐𝑒 = 𝑉𝑜𝑙𝑡𝑎𝑔𝑒 ∗ ((−20 ∗ 4.44822)/(2^16 ∗ 0.0415)))
𝐹𝑜𝑟𝑐𝑒 = 𝑉𝑜𝑙𝑡𝑎𝑔𝑒 ∗ ((−20 ∗ 4.44822)/(2^16 ∗ 0.0411)))
Normal Force Sensor Equations:
𝐹𝑜𝑟𝑐𝑒 = 𝑉𝑜𝑙𝑡𝑎𝑔𝑒 ∗ ((−20 ∗ 4.44822)/(2^16 ∗ 0.011)))
𝐹𝑜𝑟𝑐𝑒 = 𝑉𝑜𝑙𝑡𝑎𝑔𝑒 ∗ ((−20 ∗ 4.44822)/(2^16 ∗ 0.0417)))
4.4 Position Sensor Calibration
The position sensors converted the linear position into a proportional electrical signal. The cable
was spring loaded to maintain tension and prevent sagging or deflection.
In order to calibrate the position sensors, the voltage reading was compared to the position
determined using a motion capture system (six infrared cameras: Rapter-E, Motion Analysis
Corp, Santa Rosa, USA). The position sensors in this set up were used to measure handle and
seat position during rowing.

21
Figure 8. Calibration of string potentiometer sensors using motion capture. Voltage
reading converted to distance (red) is overlaid with the distance determined by motion
capture (blue).
As shown in Figure 8, after determining the coefficient to convert the voltage (V) into position
(mm), this derived position value (red line) was compared to the actual string length (blue line)
as determined by motion capture. As the seat was moved back and forth, we can see slight
deviations at the extremities. Root mean square error of 38 mm.
The abrupt change in direction during rowing could be responsible for the deviations seen at the
extremities and during the initial 1-2 second period. The motion capture markers were placed at
1) the tip of the string potentiometer and 2) the contact point of the string potentiometer and the
seat. Therefore, during abrupt changes in direction, the string may have some slack, increasing
the actual length of the cable, while the distance between the seat and string potentiometer as
determined by motion capture remains constant.
Position Sensor Equations:
𝐻𝑎𝑛𝑑𝑙𝑒 𝑃𝑜𝑠𝑖𝑡𝑖𝑜𝑛 (𝑚𝑚) =𝑉𝑜𝑙𝑡𝑎𝑔𝑒
15.911;
𝑺𝒆𝒂𝒕 𝑷𝒐𝒔𝒊𝒕𝒊𝒐𝒏 (𝒎𝒎) = 𝑽𝒐𝒍𝒕𝒂𝒈𝒆 ∗ (𝟏𝟎/𝟎. 𝟎𝟕𝟔𝟗).∗ (𝟐𝟎
𝟐𝟏𝟔) ;

22
4.5 Other Modifications on FES-rowing Ergometer
Other rowing ergometers have been developed for individuals with spinal cord injury to address
some issues seen during FES-rowing[4]. For individuals with spinal cord injury, one limiting
factor is that the knee flexion resulting from hamstring stimulation may be insufficient to
complete the reset / recovery phase of the rowing stroke [4]. One study reported that they had a
physiotherapist present to physically push the rower back to the front after each stroke to help
them reset [4]. Techniques used to alleviate this issue include 1) administering stimulation to the
hamstrings, 2) mounting a spring at the posterior position of the ergometer, and 3) raising the
incline of the posterior end of the rowing ergometer[4].
The most common practice involves administering stimulation to the hamstrings coupled with
the spring at the posterior position[4]. Proper rowing technique involves the drive phase and the
recovery phase. The individual begins the rowing stroke with their elbows extended and knees
flexed. Firstly, the drive phase consists of 1) knee extension to move the seat backwards, 2)
followed by elbow flexion for handle pull. Following this motion, the recovery phase consists of
1) elbow extension/reset handle and 2) knee flexion for returning to the initial starting
position[15]. The drawback of this posterior spring-mounted set-up means that once knee
extension is complete, the rower must slightly resist the spring to complete the handle pull,
before being pushed forward to reset. Furthermore, the spring is mounted on the monorail which
limits the maximum range that the seat can travel[4].
One example involves an inclined system to raise the posterior end (the monorail) of the rowing
ergometer by around 4 degrees [4]. The raised posterior end uses gravity to its advantage, as the
rower will slide down and forward to reset / return to the anterior most position. Drawbacks to
this system include a higher necessary knee extension force to push upwards against the incline
during the drive phase. This system does not require a spring.
When comparing both rowing ergometer-setups, the spring set up is more suitable for naïve FES-
rowers since they likely would have insufficient leg strength to drive against the inclined system.
Furthermore, the spring can be adjusted for each individual to maximize the seat’s range of
motion and account for anthropomorphic differences in thigh and shank length. For the following

23
experiments, the rowing ergometer was used with a spring and hamstring stimulation to aid with
the recovery phase as shown in Figure 9.
Figure 9. Modified rowing ergometer with back support, spring and force and position
sensors.

24
Experiment 1: Determine Timing of Leg Muscle Activation in Able-Bodied Rowers
5.1 Introduction
Previous studies have investigated the muscle activation patterns on stationary and dynamic
rowing ergometers in order to explore how the timing of muscle activation is altered by different
types of ergometers [20]. EMG and kinematic studies in able-bodied individuals on standard
ergometers have highlighted that the lumbar and sacral regions (L3-S1) of the spine showed
higher movement during the rowing action, which may increase the risk of soft tissue injury in
this area[21]. Another study showed that vastus lateralis activation for knee extension occurred
earlier in the stationary ergometer relative to the dynamic ergometer [20]. The rowing ergometer
for FES-rowing used in our experiment has several modifications which may influence the leg
muscle activation patterns. Therefore, understanding the timing of leg muscle activation on the
modified FES-rowing ergometer will help determine the optimal range of FES timing for
coaching system.
One idea to improve consistency during a periodic movement is to use rhythmic auditory cues
(RACs), which are sounds at regularly spaced time intervals[22]. They can be used with
rehabilitation exercises by aligning an action to the sound [22]. RACs have been used in
individuals with Parkinson’s disease to reduce movement variability [27][28]. Functional
magnetic resonance imaging studies have shown that RACs increase activation in the basal
ganglia relative to visually cued or uncued conditions during a finger tapping task[22], [25].
Individuals with spinal cord injury have also demonstrated altered motor behaviors and interlimb
coordination possibly due to sensory impairment [29]–[31]. Therefore, the addition of a
metronome may improve timing and rowing consistency in individuals with spinal cord injury.
When considering timing and consistency, the stroke rate selected for rowing will influence the
time spent in each phase of rowing, the power generated and rowing technique[42]. In general, as
with other sports, increasing the cadence or number of cycles per minute results in greater work
output in athlete[32]. However, a swimming study highlighted that there are trade-offs:
swimming velocity may decrease at high stroke rates beyond an optimal range [32]. The FES-
rowing ergometer restricts lumbar flexion and stroke length, which results in higher than normal

25
stroke rates. Furthermore, able-bodied rowing has a cadence of around 25 ± 3 strokes per minute,
while FES-rowing has a cadence around 36 ± 6 strokes per minute[5]. Therefore, it will be
important to investigate whether controlling the stroke rate influences the timing of leg muscle
activation.
Understanding the leg muscle activation timing in able-bodied individuals may help develop a
coaching system that instructs users on the recommended range at which to administer electrical
stimulation. Furthermore, understanding the influence of auditory cues and controlled stroke
rates on the timing of button press will help us make decisions on which factors influence button
press timing and tailor the coaching system accordingly.
5.2 Methodology
5.2.1 Participants
Ten (n=10) able-bodied individuals volunteered for the study with no history of neurological
disorders. Their rowing expertise ranged from individuals with no rowing experience to one
varsity rowing athlete. All were instructed in proper rowing technique prior to participation in
the experiment. Participants were recruited to Lyndhurst Rehabilitation Center through posters,
email and by telephone. Participants signed a consent form detailing the experimental protocol
and set up. These documents were reviewed by the Research Ethics Board at Toronto
Rehabilitation Institute before commencing the experiment.
This study was approved by Research Ethics Board of the University Health Network. Each
participant visited Lyndhurst Rehabilitation Center once for two hours to participate in the
following experiment outlined below.

26
5.2.2 Experimental Design
Protocol Overview:
1. Setup with electromyography on bilateral leg muscles.
a. Resting electromyography
b. Maximum voluntary contractions
2. Warm-up and familiarization.
3. Rowing tests:
a. Maximal work output test: 10 hardest strokes *.
b. Preferred stroke rate test *.
4. Four randomized trials of rowing with metronome and stroke rate conditions at 50% of
max work output:
a. 30 strokes/min rate, no metronome *.
b. 30 strokes/min rate, metronome *.
c. Preferred strokes/min rate, no metronome *.
d. Preferred strokes/min rate, metronome *.
*Each trial lasts two minutes in duration. Participants took two to five minutes of rest in between
trials. Muscle activation patterns, kinematic and kinetic data were collected as outlined in the
following paragraphs.
Electromyogram (EMG) were measured using an EMG amplifier (Bagnoli, Delsys Inc., USA).
Raw electromyography data were collected at 2k Hz sampling rate using a 16-bit resolution;
amplitude range of 10V. After removing the mean from the raw EMG data, it was full wave
rectified, and then filtered. A 2nd order 10 Hz low pass Butterworth filter was selected to obtain
the envelope of the EMG signal given that one movement cycle is approximately 2 seconds or
0.5 Hz. Zero-phase digital filtering was conducted by using the filtfilt function in MATLAB to
process the data in the forward and reverse directions as this is important to account for delays
when calculating muscle onset timing. Electrodes were placed on bilateral leg muscles (rectus
femoris, vastus lateralis and medialis, biceps femoris, medial and lateral gastrocnemius, soleus
and tibialis anterior muscles). Ground electrodes were placed on the patella. The electrodes were
taped and wrapped to the leg to prevent them from shifting during the rowing trials.

27
Previous studies often only collected muscle activation data from one side since they assumed
symmetric leg muscle activation patterns during rowing exercise. This is a viable assumption if
individuals are athletes or have previous rowing experience as they are likely to exhibit high
symmetry. Preliminary testing on the rowing ergometer with able-bodied novice rowers showed
that the electromyography recordings did not necessarily display a high degree of symmetry in
all subjects as determined by Pearson’s Correlation. Therefore, in the analyses, the
electromyography from both legs was averaged to account for slight asymmetry.
While the participant was seated comfortable on a chair, EMG were collected during resting in
order to establish a baseline. EMG during the maximum voluntary contraction was also
determined for each muscle as follows. The participant was seated, and maximally contracted the
corresponding muscle for 5 seconds, while the researcher manually resisted against the
movement. 10% of the maximal EMG activity during maximal voluntary contraction was used to
determine the muscle activation onset during rowing for each stroke.
All rowing trials were conducted on a rowing ergometer (Concept 2, Inc., Morrisville, Vermont,
USA) with back support, shoulder straps, shank straps, and mounted force and position sensors.
As mentioned in the hardware section, the back support and shoulder straps acted to prevent
hyperextension and flexion of the lumbar spine respectively.
The shank straps exist to ensure that leg muscle force is directed primarily in the sagittal plane.
This feature is for individuals with spinal cord injury to ensure that FES induced knee extension
occurs in the sagittal plane. When this experiment was conducted in able-bodied individuals, the
shank straps, shoulder straps and back rest were used in order to represent the leg muscle
activation patterns expected during FES-rowing.
The force data was collected from custom built foot plates which contain both normal and shear
force sensors (Interface Advanced Force Measurement Durham Instruments, Arizona, USA). The
seat and handle position data were collected from string potentiometers (Measurement Specialties,
Durham Instruments, Arizona, USA) mounted to FES-rowing system to measure handle and seat
position. The analog signals from the sensors were collected using a data acquisition system with
a sampling frequency of 2000 Hz (PowerLab 16SP, Cortex and LabChart, ADInstruments, Inc.,

28
Colorado Springs, CO, USA). The force data was also filtered by a 10 Hz low pass filter since
each movement cycle during rowing lasts around 2 seconds or 0.5 Hz.
The participant performed 5 to 10 minutes of warm-up and familiarization on the modified
rowing ergometer.
Participants were instructed to perform their ten hardest strokes for the maximal power output
test. The work output during these strokes were recorded using the Concept II performance
monitor. For the following trials, individuals performed at around 50% of their maximum power
output.
The preferred stroke rate test was conducted at 50% of maximum power output for 1 minute.
Four trials of rowing lasting two minutes each were conducted. Two trials were conducted at the
individual’s preferred stroke rate, with and without the metronome. Two trials were conducted at
a controlled stroke rate of 30 strokes/min, with and without the metronome. The order of the
trials was randomized among participants, to account for the learning and/ or fatigue effects in
novice rowers. Participants took rest for 2 minutes after each trial to minimize the influence of
fatigue or the order of the trails.
The preferred stroke rate and controlled stroke rates were conducted in order to determine the
effect of controlling the stroke rate. Furthermore, a controlled stroke rate at 30 strokes per minute
may not be suitable for all participants. For example, anthropomorphic differences such as
shorter limb length may result in smaller stroke length and thus higher stroke rates[18].
The auditory cue / metronome provided periodic sounds to help individuals keep pace at their
preferred and controlled stroke rates.
5.2.3 Data Analysis
5.2.3.1 Leg Muscle Activation Patterns
After obtaining the raw EMG signal, the mean was removed, full wave rectified, and filtered.
EMG signal was full wave rectified to remove any negative values. A 2nd order low pass
Butterworth filter at 10 Hz was applied to the EMG signal to obtain an envelope since each

29
movement cycle was two seconds or 0.5 Hz. Next, in order to normalize each rowing stroke
from 0% to 100% of the movement, each stroke cycle was segmented based on the anterior-most
seat position. Each stroke cycle was down sampled from roughly 3000 points to 1000 points in
order to normalize. The ensemble average and standard deviations were calculated for all
aforementioned leg muscles for each subject. The first and last five strokes were excluded from
the analyses due to anomalies in the data since individuals were adjusting their positions or
catching their rhythm.
5.2.3.2 Electromyography Onset Threshold
In order to determine the threshold value for EMG onset during rowing, 10% of EMG
amplitude during maximum voluntary contraction was calculated for each muscle of each
participant. Since EMG was collected bilaterally, the average EMG signal and onset threshold of
the left and right muscles were used.
5.2.3.3 Temporal Difference Calculation Between Kinematic Events (Seat Position & Handle Position) and Vastus Lateralis Onset:
The kinematic events of interest include the 1) anterior handle position, 2) posterior
handle position, 3) anterior seat position, and 4) posterior seat position. The timing differences
between the kinematic events (anterior and posterior, seat and handle positions) relative to VL
muscle onset were calculated.
The quadricep muscles (rectus femoris RF, vastus laterialis RF, vastus medialis VM) are active
for knee extension during the drive phase. VL was selected as the muscle of interest because it is
solely used for knee extension while the RF occasionally had two peaks since it is active for both
knee extension and hip flexion[44]. Furthermore, one article compared the envelope of the RF
and VL muscles. The RF peak corresponding to knee extension during the drive phase is only
apparent at high exercise intensities of around 95% of VO2 peak. However, the VL EMG signal
had only one peak due to its singular role for knee extension. Secondly, the shape of the VL
EMG envelope and number of peaks were not influenced by exercised intensity[44]. Given that
the rectus femoris onset was harder to determine due to the periodic occurrence of the double

30
peak (dual role as knee extension and hip flexor), the vastus lateralis onset time was chosen to
guide the timing of the manual button for administering FES [45].
For each two-minute rowing trial, the sensor and EMG data were segmented based on stroke
cycle as defined by the anterior most seat position peak. The anterior most seat position peak
signals the beginning of the stroke’s drive phase. 30 consecutive strokes from the middle of the
trial was used for the analyses. Muscle onset was marked as the part of the EMG envelope that
exceeded 10% of the EMG value from maximum voluntary contraction.
The kinematic events of interest (i.e. peaks of seat and handle position) were determined using
the findpeaks function in MATLAB. The time difference between the muscle onset and the
kinematic events of interest were calculated for each stroke.
5.2.3.4 Spatial Difference Calculation Between Kinematic Events and Vastus Lateralis Onset
The seat and/or handle position during VL onset can be used to guide the application of electrical
stimulation. For each stroke, the seat and handle position during the onset of VL EMG was
calculated relative to the anterior most seat and handle position (zero). Based on 30 consecutive
strokes, the mean and S.D. of seat and handle positions during VL onset for each trial was
calculated.
5.3 Results:
5.3.1 Leg Muscles Activation Patterns
Figure 10 demonstrates that the quadricep muscles (rectus femoris, vastus lateralis, vastus
medialis) were active during the drive phase (first 50% of the rowing stroke) for knee extension.
The hamstring muscles (biceps femoris) were active for knee flexion during the recovery phase.
The tibialis anterior was active for ankle dorsiflexion during the recovery phase (last 50% of the
rowing stroke). The remaining shank muscles appear to be active during the drive phase in this
participant, but displayed high standard deviation which may be attributed to our modified
rowing ergometer set up as the shanks are strapped in. Foot force peaks earlier than handle force
demonstrating expected sequential muscle activation patterns (initiate with legs and follow up
with arms).

31
Figure 10. Leg muscle EMG patterns, handle and seat position, and foot and handle force
in a typical rower during 1 stroke cycle. Solid line indicates average, and dotted lines
indicate standard deviation after 30 strokes were normalized and averaged.
Electromyograms from Rectus Femoris (RF), Vastus Lateralis (VL), Vastus Medialis (VM),
Biceps Femoris (BF), Soleus (SOL), Medial Gastroc. (MG), Lateral Gastroc. (LG), Tibialis
Anterior (TA). Kinematic and kinetic data such as Seat Position (SP), Handle Position
(HP), Foot Force (FF), Handle Force (HF).

32
5.3.2 Determining Optimal Timing of Stimulation
There were two types of analyses or calculations conducted to determine the optimal timing of
stimulation: 1) Temporal Difference Analyses 2) Spatial Difference Analyses.
5.3.2.1 Temporal Difference Between Kinematic Events (Seat Position and Handle Position) and Vastus Lateralis Onset.
First, we looked at the timing difference between each kinematic event and leg muscle activation
onset. The kinematic events of interest include the 1) posterior-most seat position, 2) posterior-
most handle position, 3) anterior-most seat position, and 4) anterior-most handle position based
on each participant’s range of motion. The average timing difference between each kinematic
event and the VL onset for each stroke was calculated for each trial per participant (i.e. one
timing difference value representing the average of 30 consecutive strokes was calculated for
each trial per participant). Then, the average timing difference across 10 participants are
displayed in Figure 11.
Figure 11. The timing difference (seconds) between various kinematic events (posterior seat
position, posterior handle position, anterior handle and seat position) and VL onset across
4 different trials. Dark orange bar indicates preferred stroke rate, with a metronome. Light
orange bar indicates preferred stroke rate without a metronome. Dark green bar indicates
30 stroke rate with a metronome. Light green bar indicates 30 stroke rate without a
metronome.

33
First, the timing difference between seat position (anterior and posterior) and VL onset in 10
subjects across 4 trials is shown in the two left-most graphs of Figure 11. The average time
difference between anterior seat position and VL onset in 30 stroke rate, no metronome trial was
1.692 ± 0.176 seconds, 30 stroke rate, metronome trial was 1.736 ± 0.265 seconds, preferred
stroke rate, no metronome trial was 1.662 ± 0.145 seconds, preferred stroke rate, metronome trial
was 1.553 ± 0.262 seconds. The mean across all 4 trials was 1.661 ± 0.078 seconds.
The average time difference between posterior seat position and VL onset in 30 stroke rate, no
metronome trial was 0.901± 0.159 seconds, 30 stroke rate, metronome trial was 0.917 ± 0.189
seconds, preferred stroke rate, no metronome trial was 0.857 ± 0.114 seconds, preferred stroke
rate, metronome trial was 0.769 ± 0.225 seconds. The mean across all 4 trials was 0.861 ± 0.066
seconds.
Next, the timing difference between handle position (anterior and posterior) and VL onset in 10
subjects across 4 trials is shown in the two right-most graphs of Figure 10. The average time
difference between anterior handle position and VL onset in 30 stroke rate, no metronome trial
was 1.715 ± 0.147 seconds, 30 stroke rate, metronome trial was 1.773 ± 0.162 seconds, preferred
stroke rate, no metronome trial was 1.675± 0.071 seconds, preferred stroke rate, metronome trial
was 1.638 ± 0.185 seconds. The mean across all 4 trials was 1.700 ± 0.058 seconds.
The average time difference between posterior handle position and VL onset in 30 stroke rate, no
metronome trial was 0.807 ± 0.158 seconds, 30 stroke rate, metronome trial was 0.843 ± 0.180
seconds, preferred stroke rate, no metronome trial was 0.794 ± 0.111 seconds, preferred stroke
rate, metronome trial was 0.685 ± 0.223 seconds. The mean across all 4 trials was 0.782 ± 0.069
seconds.
There were no significant differences between conditions (non-parametric, paired/repeated
measures, Wilcoxon Signed Rank Test).
Figure 11 shows similar average timing differences between VL onset and anterior kinematic
events (seat and handle positions: 1.661 seconds and 1.700 seconds respectively). However,
when considering posterior kinematic events, the posterior seat position occurs first followed by
the posterior handle position. This is because in order to perform the rowing action, the
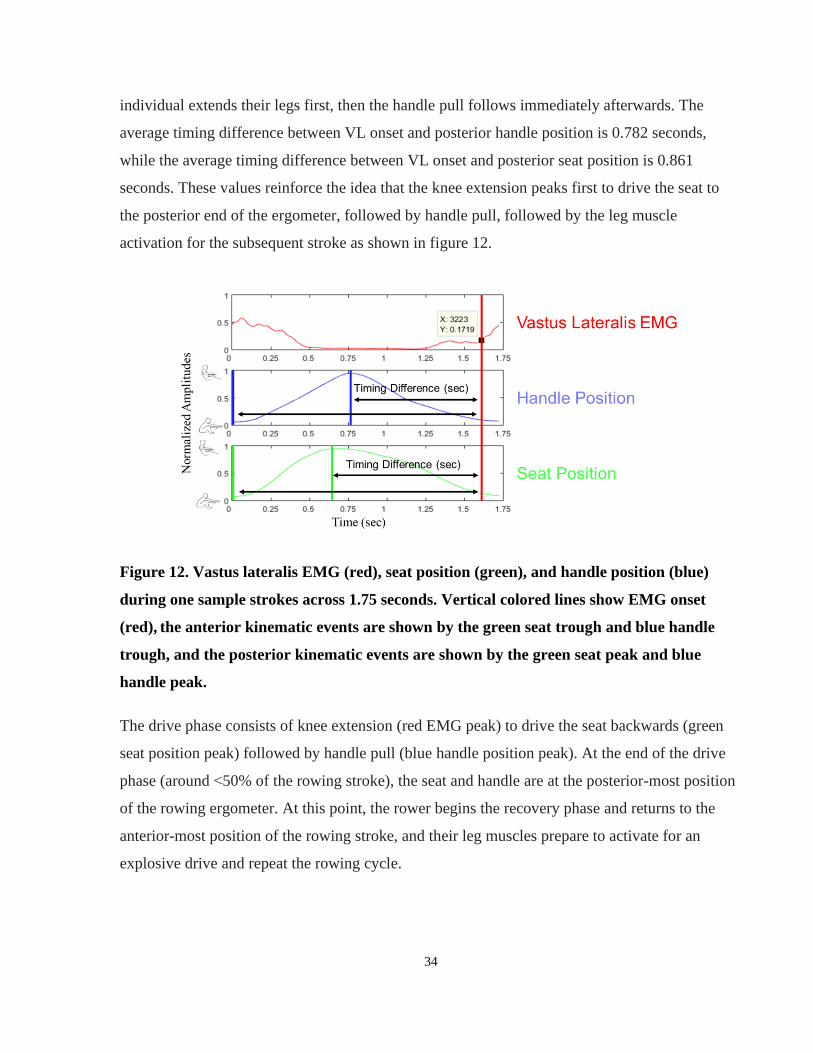
34
individual extends their legs first, then the handle pull follows immediately afterwards. The
average timing difference between VL onset and posterior handle position is 0.782 seconds,
while the average timing difference between VL onset and posterior seat position is 0.861
seconds. These values reinforce the idea that the knee extension peaks first to drive the seat to
the posterior end of the ergometer, followed by handle pull, followed by the leg muscle
activation for the subsequent stroke as shown in figure 12.
Figure 12. Vastus lateralis EMG (red), seat position (green), and handle position (blue)
during one sample strokes across 1.75 seconds. Vertical colored lines show EMG onset
(red), the anterior kinematic events are shown by the green seat trough and blue handle
trough, and the posterior kinematic events are shown by the green seat peak and blue
handle peak.
The drive phase consists of knee extension (red EMG peak) to drive the seat backwards (green
seat position peak) followed by handle pull (blue handle position peak). At the end of the drive
phase (around <50% of the rowing stroke), the seat and handle are at the posterior-most position
of the rowing ergometer. At this point, the rower begins the recovery phase and returns to the
anterior-most position of the rowing stroke, and their leg muscles prepare to activate for an
explosive drive and repeat the rowing cycle.

35
It is important to note that there were large individual differences in timing differences likely due
to anthropometric differences such as shank to thigh ratios [18] and relative time spent in drive
versus recovery [44].
The addition of a metronome increased the standard deviation in all cases. However, comparison
using Wilcoxon Signed Rank test revealed no significant differences in the standard deviation
between trials.
Exercising at a controlled stroke rate (30 strokes/min) resulted in a slightly higher timing
difference relative preferred stroke rate. However, these differences were not significant as
determined by the Wilcoxon Signed Rank Test (non-parametric, paired/repeated measures).
Furthermore, the standard deviations of the timing difference between the kinematic events and
VL onsets did not have a significant difference. These standard deviations of timing differences
between kinematic events and VL onset are likely due to variations in VL onsets of up to 10% of
the movement cycle, that were also seen in other studies involving cyclical movements such as
walking and cycling [46]. This is due to small changes in the way the body performs the periodic
movement or slight alterations in the intensity and pattern of muscle activations during multiple
strokes [46].
These results show that the addition of a metronome, or controlling the stroke rate, or the
interaction (both metronome and controlled stroke rate) did not significantly affect the timing
difference between kinematic events and VL onset.

36
5.3.2.2 Spatial Difference Between Kinematic Events and VL Onset
Figure 13. The average seat and handle position during VL onset from 10 participants are
shown in the graphs above for each trial type.
30 consecutive strokes were used from each trial for each participant. The spatial difference
between the mean seat/handle position during VL onset relative to the anterior most seat/handle
position from 10 participants are shown above for each trial. Given that the anterior most
seat/handle position was set to zero for each stroke, taking the average seat/handle position
during VL onset is equivalent.
The average seat position during VL onset in the 30 stroke rate, no metronome trial was 80.8 ±
38.2 mm, 30 stroke rate, metronome trial was 66.7 ± 38.3 mm, preferred stroke rate, no
metronome trial was 112 ± 30.6 mm, preferred stroke rate, metronome trial was 112 ± 38.5 mm.
The mean across all 4 trials was 93.2 ± 23.2 mm.
The average handle position during VL onset in the 30 stroke rate, no metronome trial was 110 ±
51.0 mm, 30 stroke rate, metronome trial was 80.1 ± 48.1 mm, preferred stroke rate, no
metronome trial was 137 ± 38.1 mm, preferred stroke rate, metronome trial was 136.7 ± 48.3
mm. The mean across all 4 trials was 116 ± 27.2 mm.
37
There was no significant difference between conditions based on Wilcoxon Sign Rank Test (non-
parametric, paired/repeated measures). Therefore, regardless of the condition chosen for the
rowing exercise (i.e. controlled stroke rates or metronome), there is no significant difference in
seat or handle position during VL onset.
5.4 Discussion:
This experiment was conducted to determine the leg muscle activation patterns during rowing in
able-bodied individuals. The timing of leg muscle activations was used to develop a coaching
system which guides the administration of FES to the legs in SCI individuals at the optimal time.
5.4.1 Leg Muscle Activation Patterns:
Our results demonstrated that the quadriceps were activate for knee extension during the drive
phase of the rowing stroke. Biceps femoris was activate for knee flexion during the recovery
phase. The tibialis anterior was active for ankle dorsiflexion during the recovery phase.
5.4.1.1 EMG activations in rowing studies: difficulty determining RF onset
In Neil et al., (2014)’s study, comparing leg muscle activation patterns on standard rowing
ergometers and on-water rowing, they also demonstrated quadricep muscle activation during the
drive phase[44]. However, they showed that exercise intensity influences the shape of the rectus
femoris envelope [44]. The rectus femoris occasionally has two peaks because it demonstrates
activity during 1) the drive phase for knee extension and 2) initiation of the recovery phase for
hip flexion. Even though we are primarily interested in stimulating the rectus femoris for knee
extension, this first peak is more prominent only at high exercise intensities (95% of VO2 peak)
which is likely not achievable by individuals with spinal cord injury. The vastus lateralis
demonstrated one peak for its role in knee extension and the shape of the EMG envelope was not
largely affected by exercise intensity. The double peak in rectus femoris activity relative to the
single peak in vastus lateralis muscles were also shown in a similar study [45]. On our modified
rowing ergometer, we also saw the occurrence of a double peak in rectus femoris activity, while
the vastus lateralis activity had one peak. Given that the rectus femoris onset was harder to
determine due to the periodic occurrence of the double peak (dual role as knee extension and hip

38
flexor), we chose to use the vastus lateralis onset time to guide the timing of the manual button
for administering FES.
5.4.1.2 Biceps Femoris EMG activation patterns
In our study, the BF was probably active for knee flexion during the recovery phase. However,
some EMG rowing studies conducted on standard ergometers demonstrated BF activity in phase
with VL for stabilization [44], [45]. However, 13 out of 15 FES-rowing studies chose to
stimulate the BF or hamstrings for knee flexion during the recovery phase (as shown in section
Stimulation Parameters), because the recovery phase is especially challenging for individuals
with spinal cord injury[4]. Some studies had a researcher or physiotherapist physically pushing
the individual’s seat to aid with recovery[4]. Other design methods to help the individual recover
(return to the initial anterior position) includes the addition of a spring mounted at the back of the
ergometer and raising the back of the ergometer at a 4-degree incline [4], [33],[47].
Our modified ergometer has a spring mounted on the back, which would reduce the need for BF
activation during the recovery phase. The inter-subject differences in BF activity patterns seen
across other EMG rowing studies may be attributed to different types or modifications to the
ergometers[20].
Even though the biceps femoris may be active during both phases, we chose to mirror other
articles and our results from experiment 1, and stimulate the BF only for recovery since this
FES-rowing system is most useful for individuals with spinal cord injury. Stimulation during
both phases may contribute to early fatigue onset; stimulation during only the drive phase would
not solve the problem of recovery that many FES-rowing studies have reported[4].
The tibialis anterior (TA) muscle was active for ankle dorsiflexion during the recovery phase.
However, on our modified ergometer, the shank is strapped in rather than the foot. Therefore, the
activation of the TA for ankle dorsiflexion on our modified rowing is smaller. The contribution
of the TA is also smaller relative to larger muscle groups (quadriceps and hamstrings).

39
5.4.2 Temporal Differences Between Kinematic Events and VL Onset:
Our results showed that average timing differences between VL onset and anterior
kinematic events were relatively similar (i.e. anterior handle and anterior seat position were
similar) because the anterior seat and handle peaks occur closely in time. Furthermore, the
posterior handle position has a sharper peak and occurs after posterior seat position so the timing
differences between these kinematic events and VL onset were similar but not always
overlapping to the same degree as shown in Figure 12.
It is important to note that timing differences across subjects was not consistent, which made it
difficult to determine the optimal timing difference for administering FES. These differences in
the mean timing difference of each individual may be attributed to anthropomorphic differences
and drive to recovery ratios [18]. For example, one study showed that shorter individuals with
smaller shank to thigh ratios had earlier power generation[18]. Furthermore, some individuals
may have a long, slow recovery phase, while others prefer shorter recovery phases. Therefore,
applying stimulation based on temporal differences may not be inclusive of different rowing
strategies.
5.4.2.1 Standard Deviation:
A low standard deviation is important for determining the optimal timing of administering
stimulation because it shows consistent rowing pattern. The standard deviations in timing
differences are primarily caused by variations in EMG onset times. The EMG onset times appear
at similar instants during cyclical periodic movements but variations of around 10% of the
movement cycle are possible because the untrained individual does not produce a perfectly
cyclic movement [46]. The timing difference from each stroke were calculated from over 30
strokes from each individual, because using only the ensemble average EMG envelope has been
shown to be unreliable since it results in loss of information [46].
Previous studies have shown that individuals may have drive to recovery ratios between 0.9 and
1.7, but the optimal drive to recovery ratio was estimated to be around 1.0 [44]. Furthermore, on
standard ergometers, the drive phase changes based on the stroke rate [44]. The drive phase
during a slower stroke rate is around 33% of the rowing stroke, while the drive phase during a
faster stroke rate was around 44% of the rowing stroke. Even though these studies were

40
conducted on standard ergometers, the change in drive to recovery ratio based on stroke rate
reflects that individuals increase the relative time spent in the drive phase at faster stroke rates
[44]. We had controlled stroke rate trials at a constant 30 strokes/min to address this problem, but
the ranges of timing differences were still inconsistent across participants. This highlights the
weakness of using time dependent features to guide FES-timing: it does not account for
individual variability and forces individuals to complete the phase within a restricted time
interval.
5.4.3 Spatial Difference Between Kinematic Events and VL Onset:
Previous literature allowed participants to arbitrarily administer FES to the legs when the seat
was around the anterior most position of the rowing machine[37][4]. However, our results
showed that VL activation occurs slightly earlier than the anterior most seat position.
Furthermore, determining the optimal time to administer FES based on the temporal difference
between the posterior peak of handle or seat position and VL muscle onset were inadequate. This
is because temporal differences were highly variable across participants and forced the individual
to complete the rowing phases in a restricted time interval. Furthermore, relying on temporal
differences does not account for fatigue or weak muscles often seen in individuals with spinal
cord injury. Therefore, we chose to administer FES based on spatial difference data rather than
temporal difference data. Unlike previous FES-rowing articles, we demonstrated that VL
activation occurs before the end of the recovery phase for a braking effect as shown in our results
and EMG rowing studies on standard stationary ergometers [45].
The seat and handle position during VL muscle onset were at the anterior most position of the
individual’s range of motion. Handle position had slightly larger variability than seat position,
but handle position also has a larger range or distance of travel. The seat travels a maximum
range of 600 mm during the drive phase and 600mm during the recovery phase since the rowing
ergometer has a spring and a stopper which limit the range of motion. The handle travels
approximately 1000 mm during the drive phase and 1000mm during the recovery phase, but this
stroke length is also subjective and based on the participant’s anthropomorphic
characteristics[18]. Other groups that have developed automatic controllers have used seat
position or handle position or both to guide the timing of FES[36]. In our case, the target

41
population involves individuals with incomplete spinal cord injury who seek to improve function
in their legs. Thus, we chose to focus on seat position, which is directly related to knee angle and
leg function, would fall in line with their goals [35].
5.4.4 Influence of Metronome:
Our results showed that the addition of the metronome increased average standard deviation in
all trials, but this was not a significant difference. This implies that the addition of a metronome
did not improve movement variability (i.e. consistency of rowing pattern). Other studies showed
that the addition of an auditory cue increased activation in motor areas (basal ganglia,
supplementary motor areas, dorsal premotor areas, cerebellum) [22]–[24], decreased movement
variability in individuals with Parkinson’s Disease [28] and increased basal ganglia activation in
a finger tapping task relative to visual and no cues [26]. This is contradictory to our findings
since we did not see a significant difference in the temporal or spatial differences between
kinematic events and VL onset, or even in the standard deviation with the addition of a
metronome.
Even though we did not see a significant difference with the addition of a metronome. Some
explanations for increased variability in the metronome trials include the increased cognitive
load due to the novelty aspect of metronome-rowing. The able-bodied rowers in the experiment
were familiar with regular rowing but were not previously exposed to metronome-based rowing
training. Therefore, the addition of the metronome may have a negative impact initially due to
the increased cognitive load of coordinating their body to an auditory cue. Perhaps long-term use
of the metronome may decrease timing difference variability, even if first-time exposure to the
metronome increases variability. To test this, a longer interventional study comparing two
groups, with and without metronome may reveal the benefits of adding the metronome.
In this regard, one study in able-bodied individuals demonstrated that long term learning benefits
of auditory cues were not seen during a wrist flexion task [22]. However, when the metronome
was paired with motor evoked potentials, it caused increases in cortico-motor excitability
(possibly related to increased plasticity) relative to the uncued movement [48]. Therefore, even if
the metronome alone did not show benefits in our results, pairing the electrical stimulation with a
metronome may decrease variability and increase plasticity.

42
The influence of the metronome is also dependent on the type of movement performed. One
study showed that the addition of a metronome did not increase brain activation during a dance
step-like movement. During the uncued movement, there were increases in putamen activation
due to the cognitive attention on self-pacing [49].
Previous literature shows that the metronome has differing effects in various neurological
disorders as well. During gait, even though the metronome decreased movement variability in
Parkinson’s Disease [28], it caused attentional deficits in individuals with Huntington’s Disease,
and impairment in executive function in individuals with Alzheimer’s Disease, which is not
characterized as a movement disorder [50].
Ultimately, pairing the metronome with electrical stimulation in spinal cord injured individuals
may decrease variability and increase plasticity. In our results, the metronome may have
increased variability in the rowing trials due to attentional or executive function impairments or
increased cognitive load or due to the novelty aspect[22]. Although the metronome may be
beneficial for individuals with spinal cord injury with distorted interlimb coordination [29]–[31],
it may be difficult for individuals to coordinate their movement with multiple stimuli (visual
feedback and auditory cues).
5.4.5 Identifying the Target Seat Position Range for Manual Button Press:
Our results show that VL activation begins slightly before the end of the recovery phase, i.e.
before individuals reach the anterior most seat position. Thus, the coaching system should ensure
that the VL muscle activation occurs prior to anterior most seat position, within a target range.
EMG studies on standard stationary rowing ergometers also reinforce the idea that VL muscle
activation should happen earlier in order to brake against the forward motion during the end of
the recovery phase and stabilize the rower on the stationary ergometer [45]. Accordingly, we
observed a similar pattern on our modified FES-rowing ergometer with back and shank support.
In the spatial difference results section, we showed that on our modified ergometer, the vastus
lateralis activation is initiated when the seat and handle are 93.2 ± 23.2 mm and 116.2 ± 27.2 mm
from the anterior most position of the individual’s range of motion based on one mean value
from each of the 10 subjects. However, the standard deviation range did not encompass the wide

43
inter-subject variability seen during rowing. Therefore, in order to determine the target seat
position range for administering FES, all the strokes were pooled and the global mean and global
1 S.D. of the seat positions during VL onset were calculated to be 96.5 mm ± 93.3 mm. This
target seat position range was able to encompass the wide range of seat positions demonstrated
by participants due to anthropomorphic variability. Furthermore, subsequent preliminary testing
involving FES-rowing with manual button press showed that able-bodied individuals tend to
button press prior to the anterior most position within this target range: 1.0 global S.D. of the
global mean. Therefore, this target seat position range was selected for the subsequent
development and testing of the coaching system.

44
Software: Development of a Coaching System to Instruct Users on the Optimal Timing to Administer Stimulation for FES-rowing.
6.1 Appropriate Timing for Manual Button Pressing
The coaching system was developed to instruct naïve FES-rowers on the optimal timing to press
the manual push button to administer FES to the legs. Based on the results in the previous
chapter, the appropriate timing of FES manual button was determined to be 96.5 ± 93.3 mm
based on the global mean and standard deviation of seat positions from all the pooled strokes.
This target range was implemented in the software we developed, which was written in Python
(Python Software Foundation, Python Language Reference, Version 3.5).
6.2 FES-Rowing with Coaching System
The coaching system was run on a laptop (Dell Inspiron 7559, Texas, USA) and displayed in front
of the individual on the modified rowing machine as shown in Figure 14. As outlined in the
hardware section, there are force and position sensors (Durham Instruments, Arizona, USA)
mounted on the FES-rowing ergometer. A manual push button was mounted on the handle to send
a signal to the electrical stimulator (Compex Motion 2, Compex Motion SA, Switzerland) and
subsequently produce a contraction in the leg muscles.
The coaching system monitors the sensor data at a sampling frequency of 200 Hz through the data
acquisition system (USB-6002 Multifunction I/O Device, National Instruments, South Portland,
ME, USA), and displays the seat position, button press timing, stroke rate and power output in real
time. Based on this sensor data, the primary function of the coaching system is to provide real time
feedback and instruct the user on the optimal time to press the manual push button based on the
target seat position range determined from experiment 1. Once the user presses the button, a signal
is sent to the electrical stimulator to produce a contraction via FES in the quadriceps for knee
extension to perform the drive phase of the rowing stroke. Releasing the button at the end of the
drive phase, stimulates the hamstring muscles for knee flexion to perform the recovery phase. This
recovery phase is facilitated by the spring since the hamstring stimulation is often insufficient to
result in adequate knee flexion[4].

45
Figure 14. Sensor data is used to provide real time feedback on the optimal timing of button
press to administer FES to the legs, which sends a signal to the electrical stimulation and
activates the quadriceps for knee extension during the drive phase. Releasing the button
when the seat reaches the posterior end of the ergometer will cause stimulation to the
hamstrings only for the recovery phase.
6.3 Feedback Modality for GUI of Coaching System
Next, we considered different types of feedback for instruction of FES timing. The integration of
auditory and visual feedback has been shown to be accelerate learning in a rowing task compared
to visual only and visuo-haptic feedback[39]. Therefore, the coaching system provides auditory
and visual real time feedback on whether the stimulation was administered within the
recommended range. A specific noise is emitted for correct button presses and a different noise is
emitted for incorrect button presses. Furthermore, the score is displayed and increased during
correct button press, while misses are increased during incorrect button presses.
In the coaching system interface shown in Figure 14, the blue seat transverses across the grey bar
at the bottom and displays the seat position in real time. Extrinsic feedback such as displaying

46
the seat position, rather than solely relying on intrinsic feedback such as proprioceptive
information, might be beneficial for individuals with SCI who may have lack of afferent sensory
input.
In terms of visual feedback, the FES symbol turns yellow when the participant is within 2
standard deviations of the optimal range of seat positions to instruct participants to get ready to
apply FES. The FES symbol turns green when the participant is within 1 S.D. of the mean to
instruct participants to press the button and administer FES to their legs. For each participant, the
target seat position range for FES administration will be modified based on their range of motion
to account for anthropometric variability. Thus, the optimal target range is 96.5 ± 93.3 mm from
each individual’s anterior most seat position.
Figure 15. The coaching system interface provides real time feedback on manual button
press for administering FES, average power per stroke and stroke rate. A second window
provides power output feedback for the duration of a single stroke.
The stroke rate is displayed to allow individuals to develop a consistent rowing pattern. The
stroke rate was calculated by 60 seconds divided by the duration of the current stroke (sec). The
duration of each stroke was calculated by comparing the time stamps of the beginning of each
rowing cycle defined as the anterior-most position of the seat. Our modified ergometer has
47
shoulder straps and back support which aims to minimize lumbar flexion and extension and thus
decreases the stroke length. A small stroke length requires higher stroke rates in order to produce
similar work output to a standard rowing ergometer. Furthermore, FES-rowing studies with back
supports report that individuals row at higher stroke rates relative to standard rowing studies [5].
Therefore, based on user preference, monitoring and maintaining a constant stroke rate may be
useful for developing a consistent pattern of button press timing in some individuals.
The average power output feedback is useful for individuals to track their power over time and
meet a set target/goal. The average power output in the drive phase is based on the (force (N) *
distance of handle travelled(m)) / time spent in drive phase (sec).
6.4 Delays
When developing the coaching system, it was important to consider the delays in the system.
The coaching system has a wide target range for FES timing which accounts for the delays in the
system. First, there may be a reaction time delays to the visual feedback presented. The FES
symbol turns yellow to instruct the user to get ready, before turning green to instruct the user to
apply FES. This allows the individual to anticipate FES timing and minimize this reaction time
delay. Second, there will be a small electromechanical delay, between when the FES is triggered,
and the muscle contraction is produced. Previous research investigating electromechanical delays
in the quadricep muscles after electrical stimulation have demonstrated minimal delays of 17.2
ms in able-bodied individuals [51]. The target range of seat positions at which to administer
stimulation is 96.5 ± 93.3 mm, which allows for a total 186 mm range for individuals to button
press. During the end of recovery phase, when the user is expected to apply FES, the seat is
moving slowly, so these minor delays will not drastically impact the individual’s ability to button
press within this wide target range.
Ultimately, the coaching system provides audiovisual feedback to instruct users on the optimal
timing of administering FES for knee extension via a manual push button. The power and stroke
rate feedback are supplementary features. Next, it was important to investigate the effect of the
coaching system on button press timing.

48
Experiment 2: Testing and Validation of Coaching System
7.1 Introduction:
Individuals with spinal cord injury experience a decline in their cardiovascular and
musculoskeletal systems due to paralysis of their limbs[1]. This can be counteracted by several
rehabilitation exercises including functional electrical stimulation (FES) rowing [14]. FES-
rowing involves voluntary movement of the upper limbs with FES applied to the legs. However,
FES-rowing is a complex movement and previous studies have shown that it takes 13 ± 7
sessions for individuals to learn the optimal timing of pressing the button for FES [5]. Therefore,
we developed a coaching system to instruct users on the optimal timing to administer FES to
their legs through a manual push button.
The optimal timing to administer FES can be delivered to the user through visual or
auditory feedback. One study comparing various types of multimodal feedback demonstrated
that audiovisual feedback significantly improved learning relative to visuo-haptic and visual
feedback only [39]. Therefore, the combination of both visual and auditory feedback in the
coaching system may accelerate learning of FES timing.
When considering the frequency of feedback, there is the option of providing summary
feedback at the end of the exercise or real time feedback. In specifically rowing studies,
Anderson et al. (2005) showed that real-time visual feedback improved rowing performance and
consistency relative to summary feedback and no feedback conditions. Therefore, in the
coaching system, implementing real time feedback after every button press may be more useful
for learning FES timing.
Given that naïve FES-rowers often require many sessions to learn the optimal timing of
administering FES to the legs, providing real time audiovisual feedback on the appropriate range
of seat positions for administering FES may accelerate learning of manual button press
timing[5].

49
7.2 Methodology
7.2.1 Participants:
7 young non-elite able-bodied individuals participated in this experiment.
7.2.2 Protocol:
• Part A: Warm-up
• Part B: Determine maximum tolerable intensities of quadriceps and hamstrings for
administering FES
• Part C: Randomized A-B Protocol
• A: FES-rowing without coaching system
• B: FES-rowing with coaching system
First, the participants conducted a warm-up trial on the rowing ergometer. The maximum and
minimum seat positions during rowing for each subject was recorded to calibrate the limits of
coaching system. This was followed by determining the maximum tolerable intensity of
stimulation for each of the target muscles (quadriceps and hamstrings). 70% of the maximum
tolerable intensity was used during the subsequent FES-rowing trials. Each trial lasted 2 minutes
in duration, followed by 2 minutes of rest.
The adhesive gel electrodes (5 cm x 9 cm) used for FES were placed on the quadricep and
hamstring muscles. For each muscle, the cathode was placed proximally over the primary motor
point, while the anode was placed distally. Rectangular biphasic pulses were delivered to each
muscle using a programmable 4-channel electrical stimulator (Compex Motion 2, Compex SA,
Switzerland) to determine the maximal tolerable intensity. For each participant, the intensity of
stimulation began at 0 mA and increased at 1 mA intervals until the maximum tolerable intensity
was reached for each muscle. 70% of the maximum tolerable intensity was used for each muscle.
Based on the results from experiment 1, only the quadriceps were stimulated during the drive
phase and only the hamstrings were stimulated during the recovery phase. The stimulation
parameters were 40 Hz frequency, 400 us pulse width based on the most common parameters
determined from FES-rowing articles [4] .

50
Similar to the first experiment, all rowing trials were conducted on a modified rowing ergometer
(Concept 2, Inc., Morrisville, Vermont, USA) with back support, shoulder straps, shank straps,
and mounted force and position sensors for data collection.
The force data was collected from custom built foot plates which contain both normal and shear
force sensors (Interface Advanced Force Measurement Durham Instruments, Arizona, USA). The
seat and handle position data were collected from string potentiometers mounted to FES-rowing
system to measure handle and seat position (Measurement Specialties Durham Instruments,
Arizona, USA). The analog signals from the sensors were collected using a data acquisition system
with a sampling frequency of 2000 Hz (PowerLab 16SP, Cortex and LabChart, ADInstruments,
Inc., Colorado Springs, CO, USA).
The manual push button is used to trigger the electrical stimulation to the legs. Holding down the
button sends a voltage signal to the electrical stimulator (Compex Motion 2, Compex Motion,
Switzerland) activates the quadriceps, and releasing the button opens the circuit which results in
hamstring stimulation.
The previous chapter outlined the set-up and features of the coaching system. In brief, the sensor
data is read through the 16-bit data acquisition system (USB-6002 Multifunction I/O Device,
National Instruments, South Portland, ME, USA) at a sampling frequency of 200 Hz. A laptop
(Dell Inspiron 7559, Texas, USA) running the coaching system presented audiovisual feedback to
instruct users on the optimal FES timing through a manual push button based on the target seat
position range determined from experiment 1. When the user holds down the push button, the
electrical stimulator administers FES to the quadricep muscles to execute the drive phase. They
receive auditory feedback on whether they administered FES within the target seat position range.
When the user releases the button, the electrical stimulator administers FES to the hamstring
muscles to execute the recovery phase.
Simultaneously, the time stamp of the button press and the seat position during button press is
recorded in the coaching system. This allows us to determine if the time of button press and seat
position during button press are influenced by the feedback provided by the coaching system.

51
7.2.3 Data Analysis
Timing of button press: First, at the moment of button press for FES to the legs, a signal is sent
to the laptop that records the time stamp of the button press. Second, the time index of the
anterior most seat position peak (i.e. the start of the drive phase) was also determined. Then, the
timing difference between button press and the anterior most seat position was computed for 30
consecutive strokes in the middle of the two-minute rowing trial. This was done for both no
coaching and coaching conditions, in the 7 able-bodied participants. Each individual completed
the no coaching and coaching trial, so the data was paired. The timing data was not normally
distributed, so the median values from each no coaching and coaching condition per participant
were compared using the Wilcoxon Signed Rank Test (paired, non-parametric test).
Seat position during button press: Similarly, at the moment of button press, the laptop records the
seat position during the button press. 30 consecutive strokes from the middle of the two-minute
rowing trial was used. These analyses were repeated for each of the 7 able-bodied participants in
the no coaching and coaching conditions. The seat position during button press was not normally
distributed as well, and one median value from each no coaching and coaching condition per
subject were compared using the Wilcoxon Signed Rank Test.
7.3 Results:
7.3.1 Effect of Coaching System on Seat Position During Button Press
First, the absolute seat position during button press was compared in the no coaching relative to
the coaching trial in a typical individual. The seat position during button press did not follow a
normal distribution, so the median values of seat position during button press in either trial were
compared. In this typical individual, the median seat position in the no coaching trial was 0.71
metres, while the median seat position in the coaching trial was 0.65 metres from the posterior
end of the ergometer. In Figure 16, the graphs depict the seat position (m) during every single
button press in no coaching and coaching conditions. The results show that all button presses
happen within the target range of seat positions as determined by the global mean and global
S.D. of seat positions during VL onset from the results of experiment 1.

52
Figure 16. Effect of Coaching System on Seat Position During Button Press in a Typical
Subject. The graphs show the seat position during every single button press in no coaching
(blue) and coaching (orange) trial respectively. Dotted line shows the acceptable target seat
position range of administering FES based on experiment 1.
Next, the group data was analyzed to assess if there was a significant difference between
conditions. The mean, standard deviation and median of seat position during button press and
was calculated for each of the 7 participants in the coaching and no coaching condition. For each
participant, one trial consisted of around 40 to 60 button presses. After removing the first and last
few strokes or corresponding button presses, 30 consecutive seat position values during button
press were selected from each participant. Given that the spatial data were paired and not
normally distributed, one median value from each condition per participant were used in the

53
Wilcoxon Signed Rank Test comparing the seat position during press in no coaching and
coaching conditions.
Figure 17. Seat position during button press in 7 subjects in no coaching (blue) and
coaching conditions (orange). Seat position values were not normally distributed so they
are displayed as a box plot.
The coaching system encourages users to press the button at earlier, smaller seat position values,
based on the target seat position range determined from experiment 1. But, the Wilcoxon Signed
Rank Test on the group data of 7 subjects revealed that there was no significant difference
between no coaching and coaching conditions (p=0.375). Secondly, only looking at absolute seat
position is insufficient because it does not reveal if button press happens earlier or later than seat
peak. In some cases, individuals appear to button press in the appropriate range of seat positions,
but in reality, they press the button after they rebound off the anterior stopper. Therefore, it is
important to consider the timing of button press relative to the timing at the anterior most seat
position to ensure that button press is not delayed.
7.3.2 Effect of Coaching System on Timing of Button Press
Solely analyzing the seat position during button press is insufficient to determine if button press
is occurring in a pattern that matches able-bodied leg muscle activation. This is because able-
bodied individuals activate their legs prior to reaching the anterior most position of the ergometer

54
during the recovery for a braking effect as described in the results from experiment 1. In
preliminary testing of the coaching system in able-bodied individuals, it was observed that the
timing of button press sometimes occurs after the individual has reached the anterior-most
position, i.e. after they have finished the recovery phase. Delayed button pressing causes the
individual to rebound off the anterior barrier and permits the knees to flex at an unsafe and
extreme angle[52], [53].
Therefore, the coaching system encourages individuals to button press before the seat reaches the
anterior most position. In order to check whether the button press occurs before the seat reaches
the anterior most position, the timing difference between seat peak and button press is shown in
the graphs below. The zero value on the y-axis represents the anterior most seat peak. Positive
timing difference values indicate that the button press happened earlier than the seat peak.
Negative timing difference values indicate that the button press was delayed and happened after
the seat peak. In this individual, the results show that 10 button presses without the coaching
system were delayed (negative timing difference values). However, with the coaching system,
none of the button presses were delayed (all positive timing difference values). This matches the
way that leg muscle activation patterns from able-bodied individuals occurs before the anterior
most seat position peak as shown by experiment 1.

55
Figure 18. Effect of Coaching System on Timing of Button Press in a Typical Subject.
Graphs show timing of button press relative to the anterior most seat position (time diff. of
zero sec; vertical black bar) in no coaching (blue) and coaching (orange) condition
respectively. Positive timing difference values indicate the correct button presses which
happened prior to anterior seat peak. Negative values indicate incorrect/delayed button
presses.
The mean, standard deviation and median of timing of button press and was calculated for each
participant in the coaching and no coaching trial. Given that the timing data were not normally
distributed, one median values from each condition per subject were used in the Wilcoxon
Signed Rank Test comparing the timing during button press in no coaching and coaching trials
for 7 able-bodied subjects.

56
The time difference between button press and anterior most seat position peak in 7 able-bodied
subjects is shown in Figure 19. A timing difference of zero indicates the anterior most seat
position (i.e. the beginning of the stroke). Similar to Figure 18, positive time difference values
indicate correct button presses and negative time difference values indicate incorrect button
presses. In the no coaching condition, there are many negative timing difference values,
indicating that few individuals were consistently delayed in button pressing. In the coaching
condition, the button presses occurred prior to reaching the anterior most seat position peak. The
Wilcoxon Signed Rank test revealed that there was a significant difference in the timing
difference between button press and anterior-most seat position peak in the no coaching vs.
coaching condition (p = 0.0469).
Figure 19. Timing difference between button press and seat peak in 7 subjects. Positive
timing difference values indicate correct button presses that occurred before the seat
reached the anterior peak. Negative time difference values indicate incorrect button
presses that occurs after the seat passed the anterior peak.
7.3.2.1 Summary of Results
There was no significant difference between absolute seat position during button press (p =
0.3750). However, the main result is that there was a significant difference in button press timing
between coaching and no coaching trials (p = 0.0469).

57
7.4 Discussion:
7.4.1 Summary and Explanation of Main Findings
Using the developed the coaching system based on the leg muscle activation patterns from able-
bodied individuals, we tested and investigated whether the coaching system would affect button
press timing.
The main findings of the current experiment include the following: 1) coaching significantly
influences the timing of a button press for administering FES, 2) coaching does not significantly
influence the seat position during button press.
7.4.2 Coaching Significantly Influences Timing of Button Press for FES.
Firstly, the results showed that coaching system can influence the timing of the button press.
Without the coaching system, individuals pressed the button arbitrarily when the seat was near
the anterior most position of the ergometer to stimulate their quadriceps and produce knee
extension during the drive phase. Previous studies in FES-rowing with manual push buttons also
instructed rowers to press the button arbitrarily when the seat was approximately at the anterior
most position [4]. As shown in our results without the coaching system, many of the button
presses were delayed and occurred after the seat position reached the anterior most position.
However, the coaching system monitors the seat position and instructs users to press the button
prior to reaching the anterior most seat position peak based on the results from experiment 1. In
the trial with the coaching system, at both the individual and group level, we can see that
individuals pressed the button prior to reaching the seat position peak (shown by positive timing
difference between seat peak and button press).
These results are important because it shows that the timing of button press can be altered with
only one two-minute trial of coaching in novice or non-rowers. Prior studies have claimed that it
takes individuals with spinal cord injury around 13 ± 7 sessions to learn the timing of button
press [5]. The stark difference demonstrates that the coaching system 1) has the potential to
influence button press timing and 2) may demonstrate observable changes with only one two-
minute trial.

58
Using the coaching system to ensure that button press occurs before the seat reaches the peak is
essential because otherwise the individual will activate their leg muscles too late and will
rebound off the anterior stopper. The leg muscles must activate prior to the seat reaching the
anterior most position in order to successfully brake against the forward movement and prevent
this rebound motion off the anterior stopper[45]. Secondly, if the individual does not brake, their
knees will flex to an extreme angle. When the individual subsequently loads the knees with
compressive forces to initiate the drive phase, while in this vulnerable position (maximally
flexed knee angle), it may lead to injury[52], [53]. Although, elite rowers may want to travel to
the anterior-most seat position to maximize the stroke length and power output, the target of the
coaching system is for individuals with spinal cord injury, so it is important to prioritize safety
over performance.
7.4.3 Coaching does not significantly influence seat position during button press for applying FES.
In the individual participant’s data, the seat position during button press during the no coaching
and coaching conditions both look very similar. The coaching system instructs users to
administer stimulation based on the target seat position range (global mean ± 1 S.D.) during leg
muscle activation in able-bodied individuals as determined from experiment #1. In both the no
coaching and coaching conditions, all the seat position values seem to fall within this expected
seat position range. Wilcoxon Signed Rank Test on the group data suggest that there is no
significant difference in seat position during button press in no coaching or coaching conditions
(p = 0.3750).
An alternate explanation is that these results may be due to low sample size because in the box
plot, we can see that coaching may slightly influence individuals to button press at smaller seat
position values. Since the seat position sensor is mounted at the posterior end of the ergometer,
smaller seat position values imply that the individual is closer to the posterior end. Therefore,
even though there was no statistical difference in seat position during button press between
conditions, a higher sample size may reveal that coaching influences individuals to button press
at smaller seat position values (i.e. further away from the anterior end and at safer knee angles).

59
These results are important because they reveal that only analyzing absolute seat position is
insufficient in determining whether the individual stimulated at the appropriate time to mimic
able-bodied leg muscle activation patterns as determined by Experiment 1. This is because
individuals tended to stimulate after reaching the anterior-most seat position, and only comparing
seat position would not be able to easily detect these mistakes.
Furthermore, the implications of these results suggest that coaching feedback systems that rely
on only seat position would be lacking. One way to combat this issue is to analyze the timing of
button press to ensure that it happens prior to the seat peak. A more feasible method, which was
used in the current coaching system, is to ensure that the seat is moving forward. If the seat is
still moving forward during button press, this guarantees that the individual is still finishing the
recovery phase and has not yet reached the anterior most seat position. On the other hand, if the
individual presses the button after the anterior seat position peak, the seat will be moving
backwards, and the coaching system can notify the user of an incorrect button press.
7.4.4 Relate the findings to similar studies
An early study by Page et al. (2003) involved the development of a training system to provide
real time biomechanics feedback (kinematic and kinetic data) for rowers[54]. They had
instrumented an ergometer with a load cell at the handle and a series of string potentiometers to
determine the handle and seat positions. The system provided real time feedback on the kinetics
and kinematics using a stick figure animation[54]. This study demonstrated that it was possible
to provide real time biomechanical visual feedback to rowers. Alternatively, our coaching system
is targeted for individuals with incomplete spinal cord injury and is instrumented with several
load cells underneath the foot plates. Displaying foot force may be more clinically applicable for
individuals with spinal cord injury as it can allow them to keep track of foot force improvements
over time.
More modern studies have shown that virtual reality can also be used to accelerate learning,
modify energy management and improve rowing performance in 7 novice rowers exercising on
an indoor rowing ergometer in 8 training sessions [41]. These studies have shown that
gamification and visual feedback systems have the potential to modify energy management
strategies and improve rowing performance in able-bodied individuals. Comparatively, our

60
results showed that the addition of a coaching system could improve timing of button press in
only one two-minute training trial. The discrepancy in number of sessions required to master a
specific skill may be based on the complexity of a skill. Our coaching system accepted a wide
range of acceptable seat positions at which the individual could press the button for FES-induced
knee extension. The wide range and relative ease of skill may explain the fewer number of
sessions required to learn the button press timing.
7.4.5 Implications for Testing in Individuals with SCI
Furthermore, when testing our coaching system in individuals with spinal cord injury, it may
take several sessions for them to learn the target range at which to button press for FES due to
lack of interlimb coordination, lack of finger control, decreased aerobic capacity, and rapid
muscle fatigue due to atrophy[37]. Previous studies have shown that it requires 13 ± 7 sessions
for individuals to naturally learn the proper timing[5][12]. Even though the coaching system was
able to instruct novice able-bodied rowers on the timing of button presses relatively quickly in
our study, it will likely require multiple sessions for individuals with spinal cord injury to learn
to button press at an appropriate time to produce this complex movement.
7.4.6 Alternate Explanations for Findings
It is unlikely that individuals may have learned the proper timing of administering stimulation
through practice or the order of trials because the trial order was randomized. Furthermore,
without the coaching system, most of the participants pressed the button to administer
stimulation arbitrarily: both earlier and later than seat position peak.
One participant had similar results in both no coaching and coaching conditions. This may be
due to the novelty, lack of familiarization with the coaching system or the complex rowing
movement. If the user felt overwhelmed by the amount of feedback, this could impair
performance as well.
7.4.7 Visual and Auditory Feedback Systems:
Previous research demonstrated that feedback has the potential to accelerate learning in various
tasks[55]. However, it is important to regulate the amount of feedback provided to prevent
cognitive overload [55]. The literature is controversial about the optimal method and modality of

61
delivering feedback, but this is possibly due to the differences in the complexities of tasks
studied (i.e. rowing a is relatively complex task that requires coordination of the upper and lower
limbs, while wrist flexion tasks are examples of simpler tasks)[55]. Multimodal feedback is
encouraged in many studies to enhance complex motor learning[55]. It is also recommended that
the amount of feedback provided could be tailored to the individual’s level of experience and
personal preferences[55].
7.4.8 Limitations
Some participants had a lower threshold for pain, so they were not able to achieve a full
involuntary contraction. They reported that part of the rowing movement was indeed voluntary.
This is difficult to address because able-bodied individuals are likely to have some voluntary
contribution, but more exposure to FES may enable them to tolerate higher current intensity and
produce a contraction that is largely involuntary.
On the other hand, subject 7 reported that administering FES using a push button successfully
initiated the contraction, even if the remaining component of the knee extension was voluntary.
For the purposes of this experiment, we investigated whether the coaching system can influence
the timing of button press. Therefore, even if the whole contraction is not voluntary, it is
important and useful that the FES button press successfully initiates the contraction. This allows
us to modify the initiation of the contraction in individuals with spinal cord injury, who likely
would be able to tolerate higher intensities of stimulation due to decreased sensory perception. In
individuals with spinal cord injury who experience denervation, this FES-rowing exercise may
not be suitable. Multiple sessions of FES may improve the contraction response to FES.
Another limitation is the broad range of rowing experience. One individual had never rowed
before, so they had trouble coordinating button presses and rowing technique. Therefore, in the
beginning, an automatic stimulator might be useful for them to get an idea of the movement, and
then progress to the manual stimulator once they are comfortable performing the movement.
Finally, it is important to note that the FES-rowing literature does not address or account for
early leg muscle activation seen on modified ergometers. Previous studies involving
electromyography of the legs in able-bodied individuals supported the results from Experiment

62
#1 demonstrating that leg muscle activation onset occurs before the anterior most seat position
peak. However, only a few FES-rowing studies have considered the requirement of braking by
early leg muscle activation to counteract the forward motion at the end of the recovery
phase[20], [42]. One possible explanation for the lack of literature on early leg muscle activation
in FES-rowing is that in individuals with SCI, the recovery phase may be slow since their
hamstring muscles are weaker, which may imply that there is less of a requirement for braking,
i.e. the individual may naturally stop before they hit the anterior most stopper, and thus prevent
themselves from going to extreme knee angles. However, this is unlikely to be seen in our
custom FES-rowing setup, since the spring mounted at the posterior end would facilitate the
recovery phase and increase the braking required.
7.4.9 Suggestions for Further Research
There are a plethora of studies investigating the influence of feedback on improving a skill or
performance. The modality of feedback (visual, auditory, haptic, multimodal), the time window
that the feedback is provided in (duration and delay of feedback), the complexity of the task, the
skill level of the individual, and many other factors can affect the improvement due to
feedback[56]. In order to accelerate learning, the coaching system should be intuitive to use,
provide important information as feedback without overwhelming the user, increase user
engagement and volitional input.
Furthermore, the current coaching system has been developed such that the target range at which
to administer stimulation can be altered. Personalizing the recommended range of seat positions
at which to administer stimulation could be beneficial due to anthropomorphic variability (i.e.
variability in shank to thigh ratio or limb length).
Future testing in individuals with spinal cord injury may reveal design or accessibility
modifications such as larger text or providing auditory-sonification feedback (the degree of error
is related to the pitch of the auditory feedback; ex. worse mistakes result in a higher pitches /
tones of auditory feedback)[39]. For individuals with spinal cord injury, external spinal fixation
using a rod and straps may also help prevent soft issue injury in the lumbar and sacral region of
the spine[21].

63
Conclusions
Spinal cord injury results in compromised cardiovascular and musculoskeletal systems due to
limb paralysis and inactivity[1]. FES-rowing is a complex movement that aims to counteract the
comorbidities associated with spinal cord injury by incorporating paralyzed leg muscles using
electrical stimulation. Other studies in FES-rowing state that participants arbitrarily button press
to administer stimulation to the legs when the seat is near the anterior most position. Thus, it
takes many sessions for individuals to learn the timing of button press to administer FES to the
legs and consequently receive the benefits of the exercise[5]. Therefore, it was necessary to
identify the timing at which to administer FES, develop a coaching system to instruct new rowers
on the optimal FES timing, and subsequently test the coaching system.
First, we instrumented a rowing ergometer with sensors for data collection and minor
modifications to stabilize individuals with SCI on the rowing ergometer. In order to identify the
optimal timing of administering FES, our first experiment investigated the timing of leg muscle
activation patterns in able-bodied individuals on our modified ergometer. The quadriceps were
active slightly prior to the drive phase for a braking effect, and the hamstring muscles were
active during the recovery phase. Based on the timing of leg muscle activation onset from
experiment 1, we developed a coaching system in Python to instruct users on the optimal timing
range of manual button press using visual and auditory feedback. Individuals should administer
stimulation to their legs at the target range of 96.5 ± 93.3 mm before the seat reaches the anterior
most position (i.e. before the end of the recovery phase). This is important to induce a braking
effect and prevent extreme knee flexion which may result in injury[52]. In experiment 2, we
showed that there was a significant difference in FES button press timing between no coaching
and coaching conditions in able-bodied individuals. The developed coaching system guided users
to administer FES to their legs prior to the anterior-most seat position peak. Future studies in
FES-rowing involving individuals with spinal cord injury can use the coaching system to
accelerate learning of FES timing enabling them to receive the benefits of the FES-rowing
exercise.

64
References
[1] J. W. Morgan, E. Ferrazzani, J. A. Taylor, and X. I. Vivodtzev, “Augmenting exercise
capacity with noninvasive ventilation in high-level spinal cord injury,” J Appl Physiol,
vol. 124, pp. 1294–1296, 2018.
[2] J. A. Taylor, G. Picard, and J. J. Widrick, “Aerobic Capacity With Hybrid FES Rowing in
Spinal Cord Injury: Comparison With Arms-Only Exercise and Preliminary Findings With
Regular Training,” PM R, vol. 3, pp. 817–824, 2011.
[3] R. F. Shaffer, G. Picard, and J. Andrew Taylor, “Relationship of Spinal Cord Injury Level
and Duration to Peak Aerobic Capacity with Arms-Only and Hybrid FES-Rowing.”
[4] B. Andrews, R. Gibbons, and G. Wheeler, “Development of Functional Electrical
Stimulation Rowing: The Rowstim Series,” Artif. Organs, vol. 41, no. 11, pp. E203–E212,
Nov. 2017.
[5] A. E. Draghici, G. Picard, J. A. Taylor, and S. J. Shefelbine, “Assessing kinematics and
kinetics of functional electrical stimulation rowing,” J. Biomech., vol. 53, pp. 120–126,
2017.
[6] B. Universita di Padova. Dipartimento di Scienze Biomediche., J. Ludwig Boltzmann
Institut fur Elektrostimulation und Physikalische Rehabilitation., M. Armengol, R.
Gibbons, W. Holderbaum, and W. Harwin, European journal of translational myology.,
vol. 26, no. 4. Unipress, 2016.
[7] R. Gibbons, C. Stock, B. Andrews, A. Gall, and R. Shave, “The effect of FES-rowing
training on cardiac structure and function: pilot studies in people with spinal cord injury,”
2016.
[8] R. Gibbons, I. Mccarthy, A. Gall, C. Stock, J. Shippen, and B. Andrews, “Can FES-
rowing mediate bone mineral density in SCI: a pilot study,” vol. 52, 2014.
[9] R. S. Gibbons, G. S. Beaupre, and G. J. Kazakia, “FES-rowing attenuates bone loss
following spinal cord injury as assessed by HR-pQCT,” Spinal Cord Ser. Cases, vol. 2,

65
no. 1, p. 15041, Dec. 2016.
[10] J. Verellen, Y. Vanlandewijck, B. Andrews, and G. D. Wheeler, “Cardiorespiratory
responses during arm ergometry, functional electrical stimulation cycling, and two hybrid
exercise conditions in spinal cord injured.”
[11] J. Y. Jeon, D. Hettinga, R. D. Steadward, G. D. Wheeler, G. Bell, and V. Harber,
“Reduced Plasma Glucose and Leptin After 12 Weeks of Functional Electrical
Stimulation–Rowing Exercise Training in Spinal Cord Injury Patients,” YAPMR, vol. 91,
pp. 1957–1959, 2010.
[12] R. Gibbons, R. Shave, A. Gall, and B. Andrews, “FES-rowing in tetraplegia: a preliminary
report,” vol. 52, 2014.
[13] G. M. Davis, N. A. Hamzaid, and C. Fornusek, “Cardiorespiratory, Metabolic, and
Biomechanical Responses During Functional Electrical Stimulation Leg Exercise: Health
and Fitness Benefits,” Artif. Organs, vol. 32, no. 8, pp. 625–629, Aug. 2008.
[14] D. M. Hettinga and B. J. Andrews, “Oxygen consumption during functional electrical
stimulation-assisted exercise in persons with spinal cord injury: implications for fitness
and health.,” Sports Med., vol. 38, no. 10, pp. 825–38, 2008.
[15] G. D. Wheeler et al., “Functional Electric Stimulation–Assisted Rowing: Increasing
Cardiovascular Fitness Through Functional Electric Stimulation Rowing Training in
Persons With Spinal Cord Injury.”
[16] R. M. Crameri, A. Weston, M. Climstein, G. M. Davis, and J. R. Sutton, “Effects of
electrical stimulation-induced leg training on skeletal muscle adaptability in spinal cord
injury,” Scand. J. Med. Sci. Sport., vol. 12, no. 5, pp. 316–322, 2002.
[17] T. Černe, R. Kamnik, B. Vesnicer, J. Žganec Gros, and M. Munih, “Differences between
elite, junior and non-rowers in kinematic and kinetic parameters during ergometer
rowing,” Hum. Mov. Sci., 2013.
[18] A. J. Greene, P. J. Sinclair, M. H. Dickson, F. Colloud, and R. M. Smith, “Relative shank

66
to thigh length is associated with different mechanisms of power production during elite
male ergometer rowing,” Sport. Biomech., 2009.
[19] R. C. H. So, M. A. Tse, and S. C. W. Wong, “APPLICATION OF SURFACE
ELECTROMYOGRAPHY IN ASSESSING MUSCLE RECRUITMENT PATTERNS IN
A SIX-MINUTE CONTINUOUS ROWING EFFORT,” 2007.
[20] A. Vinther et al., “Slide-based ergometer rowing: Effects on force production and
neuromuscular activity,” Scand. J. Med. Sci. Sport., 2013.
[21] C. L. Pollock, T. R. Jenkyn, I. C. Jones, T. D. Ivanova, and S. J. Garland,
“Electromyography and kinematics of the trunk during rowing in elite female rowers,”
Med. Sci. Sports Exerc., 2009.
[22] R. S. Schaefer, “Auditory rhythmic cueing in movement rehabilitation: Findings and
possible mechanisms,” Philos. Trans. R. Soc. B Biol. Sci., vol. 369, no. 1658, 2014.
[23] J. A. Grahn and J. B. Rowe, “Feeling the beat: Premotor and striatal interactions in
musicians and nonmusicians during beat perception,” J. Neurosci., vol. 29, no. 23, pp.
7540–7548, 2009.
[24] J. L. Chen, V. B. Penhune, and R. J. Zatorre, “Listening to musical rhythms recruits motor
regions of the brain,” Cereb. Cortex, vol. 18, no. 12, pp. 2844–2854, 2008.
[25] Graghn, “Rythm in Motor Areas of the Brain,” Mit, pp. 893–906, 2007.
[26] S. T. Witt, A. R. Laird, and M. E. Meyerand, “Functional neuroimaging correlates of
finger-tapping task variations: An ALE meta-analysis,” Neuroimage, vol. 42, no. 1, pp.
343–356, 2008.
[27] T. Yoshida, K. Masani, K. Zabjek, R. Chen, and M. R. Popovic, “Dynamic cortical
participation during bilateral, cyclical ankle movements: Effects of aging,” Sci. Rep., vol.
7, no. February, pp. 1–11, 2017.
[28] J. M. Hausdorff, J. Lowenthal, T. Herman, L. Gruendlinger, C. Peretz, and N. Giladi,

67
“Rhythmic auditory stimulation modulates gait variability in Parkinson’s disease,” Eur. J.
Neurosci., vol. 26, no. 8, pp. 2369–2375, 2007.
[29] L. Awai and A. Curt, “Intralimb coordination as a sensitive indicator of motor-control
impairment after spinal cord injury,” Front. Hum. Neurosci., vol. 8, no. MAR, pp. 1–8,
2014.
[30] R. Courtemanche, N. Teasdale, P. Boucher, M. Fleury, Y. Lajoie, and C. Bard, “Gait
problems in diabetic neuropathic patients,” Arch. Phys. Med. Rehabil., vol. 77, no. 9, pp.
849–855, 1996.
[31] B. Manor and L. Li, “Characteristics of functional gait among people with and without
peripheral neuropathy,” Gait Posture, vol. 30, no. 2, pp. 253–256, 2009.
[32] S. Held, T. Siebert, and L. Donath, “Changes in mechanical power output in rowing by
varying stroke rate and gearing,” Eur. J. Sport Sci., vol. 0, no. 0, pp. 1–9, 2019.
[33] R. Davoodi, B. J. Andrews, G. D. Wheeler, and R. Lederer, “Development of an Indoor
Rowing Machine With Manual FES Controller for Total Body Exercise in Paraplegia,”
IEEE Trans. NEURAL Syst. Rehabil. Eng., vol. 10, no. 3, 2002.
[34] R. Davoodi and B. J. Andrews, “Fuzzy Logic Control of FES Rowing Exercise in
Paraplegia,” IEEE Trans. Biomed. Eng., vol. 51, no. 3, pp. 541–543, Mar. 2004.
[35] \ R Davoodi and I. B. J. Andrews, “Switching curve control of functional electrical
stimulation assisted rowing exercise in paraplegia,” Med. Biol. Eng. Comput, vol. 41, pp.
183–189, 2003.
[36] R. Davoodi, B. J. Andrews, and G. D. Wheeler, “Automatic Finite State Control of FES-
Assisted Indoor Rowing Exercise after Spinal Cord Injury,” Neuromodulation Technol.
Neural Interface, vol. 5, no. 4, pp. 248–255, Oct. 2002.
[37] R. Davoodi, B. J. Andrews, and G. D. Wheeler, “Manual and automatic control of FES-
assisted indoor rowing exercise,” Annu. Int. Conf. IEEE Eng. Med. Biol. - Proc., vol. 3,
no. January, pp. 2377–2378, 2002.
68
[38] N. Schaffert and K. Mattes, “Effects of acoustic feedback training in elite-standard Para-
Rowing,” J. Sports Sci., vol. 33, no. 4, pp. 411–418, 2015.
[39] R. Sigrist, G. Rauter, L. Marchal-Crespo, R. Riener, and P. Wolf, “Sonification and haptic
feedback in addition to visual feedback enhances complex motor task learning,” Exp.
Brain Res., vol. 233, no. 3, pp. 909–925, 2014.
[40] R. Anderson, A. Harrison, and G. M. Lyons, “Rowing: Accelerometry based feedback can
it improve movement consistency and performance in Rowing?,” Sport. Biomech., vol. 4,
no. 2, pp. 179–195, 2005.
[41] C. P. Hoffmann, A. Filippeschi, E. Ruffaldi, and B. G. Bardy, “Energy management using
virtual reality improves 2000-m rowing performance,” J. Sports Sci., vol. 32, no. 6, pp.
501–509, 2014.
[42] S. E. Halliday, A. B. Zavatsky, and K. Hase, “Can Functional Electric Stimulation–
Assisted Rowing Reproduce a Race-Winning Rowing Stroke?”
[43] T. Van, “Instrumentation of a Rowing Ergometer : Footplate Design,” p. 17, 2017.
[44] N. Fleming, B. Donne, and N. Mahony, “A comparison of electromyography and stroke
kinematics during ergometer and on-water rowing,” J. Sports Sci., vol. 32, no. 12, pp.
1127–1138, 2014.
[45] N. Jongerius, P. B. J. Willems, and H. H. C. M. Savelberg, “Different inertial properties
between static and dynamic rowing ergometers cause acute adaptations in coordination
patterns,” Cogent Med., vol. 5, no. 1, pp. 1–10, 2018.
[46] D. Špulák, R. Čmejla, R. Bačáková, B. Kračmar, L. Satrapová, and P. Novotný, “Muscle
activity detection in electromyograms recorded during periodic movements,” Comput.
Biol. Med., vol. 47, no. 1, pp. 93–103, 2014.
[47] K. Miyawaki, T. Iwami, G. Obinata, Y. Shimada, T. Matsunaga, and M. Sato,
“Development of FES-Rowing Machine,” in 2007 29th Annual International Conference
of the IEEE Engineering in Medicine and Biology Society, 2007, vol. 2007, pp. 2768–

69
2771.
[48] S. J. Ackerley, C. M. Stinear, and W. D. Byblow, “Promoting use-dependent plasticity
with externally-paced training,” Clin. Neurophysiol., vol. 122, no. 12, pp. 2462–2468,
2011.
[49] A. Toyomura, M. Shibata, and S. Kuriki, “Self-paced and externally triggered rhythmical
lower limb movements: A functional MRI study,” Neurosci. Lett., vol. 516, no. 1, pp. 39–
44, 2012.
[50] T. IJmker and C. J. C. Lamoth, “Gait and cognition: The relationship between gait
stability and variability with executive function in persons with and without dementia,”
Gait Posture, vol. 35, no. 1, pp. 126–130, 2012.
[51] S. Zhou, D. L. Lawson, W. E. Morrison, and I. Fairweather, “Electromechanical delay in
isometric muscle contractions evoked by voluntary, reflex and electrical stimulation,” Eur.
J. Appl. Physiol. Occup. Physiol., vol. 70, no. 2, pp. 138–145, 1995.
[52] T. M. Hosea and J. A. Hannafin, “Rowing Injuries,” Sports Health, vol. 4, no. 3, pp. 236–
245, 2012.
[53] J. S. Rumball, C. M. Lebrun, S. R. Di Ciacca, and K. Orlando, “Rowing Injuries: Live,”
Sport. Med. , vol. 35, no. 6, p. p537 19p, 2005.
[54] P. N. Page and D. A. Hawkins, “A real-time biomechanical feedback system for training
rowers,” Sport. Eng., vol. 6, no. 2, pp. 67–79, 2003.
[55] R. Sigrist et al., “and Haptic Feedback in Learning a Complex Rowing-Type Task,” vol.
45, no. September 2014, pp. 37–41, 2013.
[56] R. H. Wang, A. Mihailidis, T. Dutta, and G. R. Fernie, “Usability testing of multimodal
feedback interface and simulated collision-avoidance power wheelchair for long-term-care
home residents with cognitive impairments,” J. Rehabil. Res. Dev., vol. 48, no. 7, pp.
801–821, 2011.

70
Appendix: Closed Loop Automatic Stimulator Option
10.1 Introduction:
There are two main types of stimulators used for FES-rowing that are prevalent in the literature.
The manual stimulator involves pressing a button or a switch to administer electrical stimulation
to the legs. Automatic controllers also exist that deliver stimulation based on handle or seat
position.
We developed an automatic stimulator to administer stimulation to the quadriceps during the
drive phase and to the hamstrings during the recovery phase. This is based on the muscle
activation patterns from various papers and Experiment 1. The seat position data is monitored
constantly, and electrical stimulation to the appropriate muscle is provided accordingly. Just
before the seat reaches the anterior most target position on the ergometer, this indicates the start
of the drive phase and the laptop outputs a signal to the DAQ and then the Compex stimulator to
administer FES to the quadriceps. Once the seat reaches the target posterior-most position on the
ergometer, it indicates the start of the recovery phase and the laptop outputs a signal to the DAQ
and then the Compex to administer FES to the hamstrings.
Even though the DAQ is able to sample at 200 Hz, the python code is only able to update every
30 ms and is a limiting factor. However, for the purposes of this experiment a sampling rate
around 33 Hz is not detrimental to the system and was not noticeable by participants. Also, one
stroke rate is around 2 seconds in duration, and the optimal range of recommended seat positions
for administering stimulation encompasses at least 5 sensor readings.
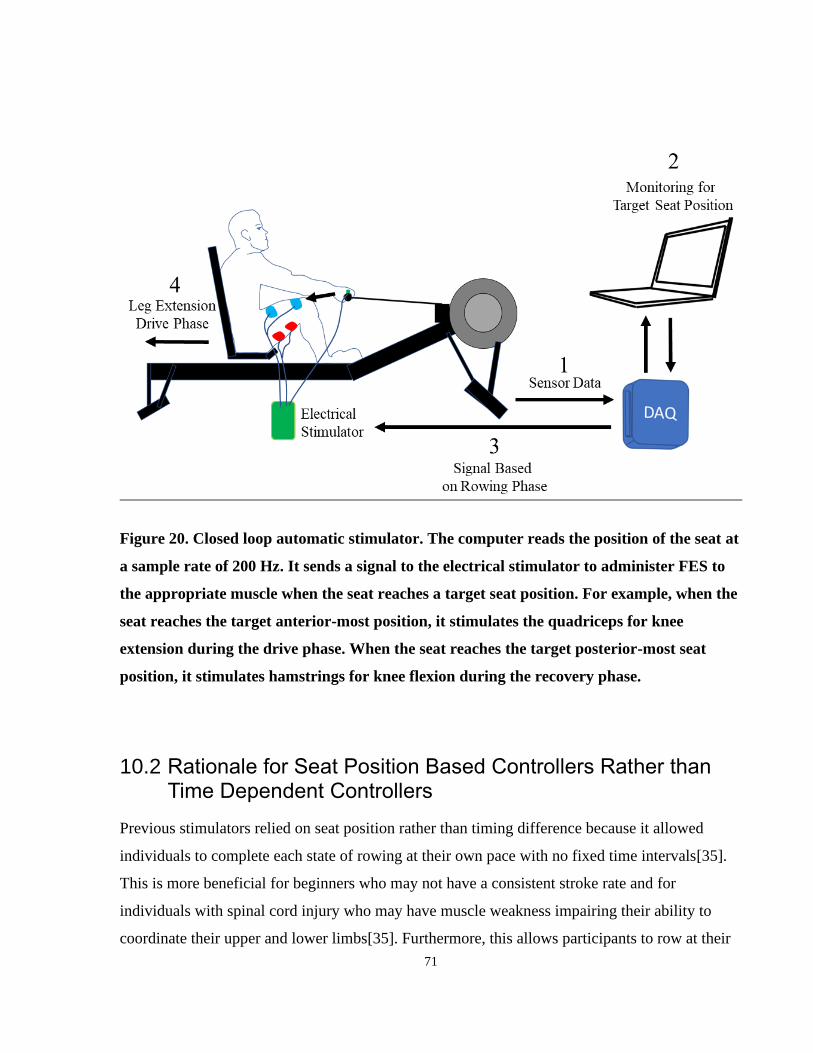
71
Figure 20. Closed loop automatic stimulator. The computer reads the position of the seat at
a sample rate of 200 Hz. It sends a signal to the electrical stimulator to administer FES to
the appropriate muscle when the seat reaches a target seat position. For example, when the
seat reaches the target anterior-most position, it stimulates the quadriceps for knee
extension during the drive phase. When the seat reaches the target posterior-most seat
position, it stimulates hamstrings for knee flexion during the recovery phase.
10.2 Rationale for Seat Position Based Controllers Rather than Time Dependent Controllers
Previous stimulators relied on seat position rather than timing difference because it allowed
individuals to complete each state of rowing at their own pace with no fixed time intervals[35].
This is more beneficial for beginners who may not have a consistent stroke rate and for
individuals with spinal cord injury who may have muscle weakness impairing their ability to
coordinate their upper and lower limbs[35]. Furthermore, this allows participants to row at their

72
preferred stroke rate, and to adjust their stroke rate during the trial in case they are fatigued.
Therefore, the current automatic stimulator administers electrical stimulation based on seat
position.
The graphs below show the validation of the automatic stimulator in 5 able-bodied individuals
across a two-minute FES rowing trial. When the individual reaches the target anterior and
posterior seat positions, the stimulation switches to either quadriceps or hamstrings respectively.
These target seat positions were calibrated based on the individual’s range of motion[35]. As
shown in the graphs below, the seat positions at the moment of stimulation was constant because
it was initiated by the computer. The timing of stimulation was also constant because individuals
were rowing at a constant stroke rate.
10.3 Testing and Validity of Automatic Stimulator
Figure 21. The seat position at the moment of stimulation was recorded across 30
consecutive strokes in 5 subjects. The target seat position for administering stimulation was
based on the seat position during leg muscle activation as determined by the results from
Experiment 1.
0
0.1
0.2
0.3
0.4
0.5
0.6
0.7
0.8
0 1 2 3 4 5 6
Sea
t P
osi
tion (
m)
Subject
Seat Position At Moment of Stimulation

73
Figure 22. The timing difference between button press and seat position peak was
calculated across 30 consecutive strokes in 5 subjects. The positive difference values
indicate that the stimulation occurred around 0.3 seconds before the seat reached the
anterior most position.
The graphs displaying seat position at the moment of stimulation and the timing difference both
show that the automatic closed-loop stimulator can allow individuals to perform FES-rowing in a
consistent manner.
10.4 Benefits of Closed Loop Stimulator
The benefits of the closed loop stimulator option improve accessibility of the FES-rowing
machine for individuals 1) who had difficulty with manual button press due to lack of voluntary
control or 2) who had trouble coordinating the button press for knee extension at the correct
time[37]. The system reads the seat position and administers stimulation to the appropriate
muscles. It stimulates the quadriceps for knee extension (drive phase) just before the seat reaches
the target anterior most position and stimulates the hamstrings for knee flexion (recovery phase)
when the seat reaches the target posterior most position. These targets are determined based on
each individual’s range of motion.
-0.5
-0.3
-0.1
0.1
0.3
0.5
0 1 2 3 4 5 6
Tim
ing D
iffe
rence
(se
c)
Subject
Timing Difference

74
10.5 Drawbacks of Closed Loop Stimulator
The drawbacks of this closed loop system are that it decreases the voluntary contribution of the
individual (the manual button press) and requires less attention. Button pressing requires
concentration in order to learn the optimal timing, and this voluntary contribution may be
important for maximizing the CNS plasticity during rowing. Anecdotal evidence from some
articles claim that individuals may prefer to use manual button pressing systems because it
allows for better control of the stimulation [33], [37], [47]. The automatic controllers felt like
individuals were being jerked back and forth [33], [37], [47]. Therefore, the coaching system was
developed to instruct individuals on the timing of initiating a manual switch.