cjb-2020-0140.pdf - TSpace
28
Draft Variation of phytochemistry, morphology and population structure in Trillium govanianum (Melanthiaceae) Journal: Botany Manuscript ID cjb-2020-0140.R1 Manuscript Type: Article Date Submitted by the Author: 19-May-2021 Complete List of Authors: Chauhan, Harsh; Kumaun University, Department of Botany Gallacher, David ; The University of Sydney, School of Life and Environmental Sciences Bisht, Anil; Kumaun University, Department of Botany Bhatt, Indra; G.B. Pant National Institute of Himalayan Environment Bhatt, Arvind; Chinese Academy of Science, Lushan Botanical Garden Dhyani, Praveen; G.B. Pant National Institute of Himalayan Environment Kewlani, Pushpa; G.B. Pant National Institute of Himalayan Environment Keyword: Adaptation, Anthropogenic pressure, Conservation, High altitude medicinal plant, Natural variations Is the invited manuscript for consideration in a Special Issue? : Not applicable (regular submission) © The Author(s) or their Institution(s) Botany
-
Upload
khangminh22 -
Category
Documents
-
view
0 -
download
0
Transcript of cjb-2020-0140.pdf - TSpace

Draft
Variation of phytochemistry, morphology and population structure in Trillium govanianum (Melanthiaceae)
Journal: Botany
Manuscript ID cjb-2020-0140.R1
Manuscript Type: Article
Date Submitted by the Author: 19-May-2021
Complete List of Authors: Chauhan, Harsh; Kumaun University, Department of BotanyGallacher, David ; The University of Sydney, School of Life and Environmental SciencesBisht, Anil; Kumaun University, Department of BotanyBhatt, Indra; G.B. Pant National Institute of Himalayan EnvironmentBhatt, Arvind; Chinese Academy of Science, Lushan Botanical GardenDhyani, Praveen; G.B. Pant National Institute of Himalayan EnvironmentKewlani, Pushpa; G.B. Pant National Institute of Himalayan Environment
Keyword: Adaptation, Anthropogenic pressure, Conservation, High altitude medicinal plant, Natural variations
Is the invited manuscript for consideration in a Special
Issue? :Not applicable (regular submission)
© The Author(s) or their Institution(s)
Botany

Draft
1 Variation of phytochemistry, morphology and population structure in Trillium govanianum 2 (Melanthiaceae)
3
4
5
6
7 Harsh Kumar Chauhan1,2*, David Gallacher3, Anil Kumar Bisht1, Indra Dutt Bhatt2, Arvind 8 Bhatt4, Praveen Dhyani2ψ, Pushpa Kewlani2
9
10
11
12
13
14 1Department of Botany, D.S.B. Campus, Kumaun University, Nainital, India-263001
15 2G.B. Pant National Institute of Himalayan Environment, Kosi-Katarmal, Almora, India-263643
16 3School of Life and Environmental Sciences, The University of Sydney, Narrabri, NSW,
17 Australia-2390
18 4Lushan Botanical Garden, Chinese Academy of Science, Lushan, Jiujiang, Jiangxi, China-
19 332900
20 ψPresent Address: Department of Biotechnology, Kumaun University, Bhimtal-Nainital, India-
21 263136
22
23
24 *Corresponding author. Tel.: +91 9557916395; E-mail addresses:
Page 1 of 27
© The Author(s) or their Institution(s)
Botany

Draft
26 Abstract
27 As habitats change, species with higher intraspecific variation have more resources to adapt.
28 Medicinal plants of the Himalayas are increasingly threatened by climate change and other
29 anthropogenic influences. Intraspecific variation within and among 17 populations of the high-
30 altitude herb Trillium govanianum was studied as an indicator of adaptability. Variation in
31 nineteen traits of population structure, morphology and phytochemistry were assessed across
32 habitats that varied in altitude (2452-3432 m), aspect, latitude (30.1-31.7 N) and arboreal
33 community. Morphology and population structure were conserved among populations but varied
34 among regions. Populations in the lower altitude mixed forests of Tirthan Valley produced
35 smaller rhizomes but larger plant densities, such that plant biomass per m2 was conserved.
36 Phytochemistry varied among regions and populations within regions, indicating significant
37 variation among habitats. Above-ground morphology of the species masks considerable
38 variations in below-ground morphology and phytochemistry. The observed variations can help
39 the species to adapt the changing environmental conditions by provoking a functional response.
40
41 Keywords: Adaptation; Anthropogenic pressure; Conservation; High altitude medicinal plant;
42 Natural variations
43 1. Introduction
44 The rate at which species adapt to new or changing environments is dependent on their
45 phenotypic plasticity and genetic variation (Fox et al. 2019). Species with a more flexible
46 phenotype and a broad genetic base have more resources to adapt, and therefore more resilience
47 to changing conditions (Forsman 2015). The heterogeneous topography of the Himalayan region
48 provides microenvironments of temperature, humidity and exposure (Sigdel et al. 2018) which
49 have produced enormous plant diversity (Salick et al. 2009). The Indian Himalayas harbors more
50 than 8,000 angiosperm species, of which 1,748 are sufficiently novel to be valued in traditional
51 medicine (Samant et al. 1998, Singh and Hajra 1996). Many microhabitats are geographically
52 separated from similar microhabitats, which facilitate the emergence of distinctive populations
53 within the species adapted to them (Pescador et al. 2015). These populations might have
Page 2 of 27
© The Author(s) or their Institution(s)
Botany

Draft
54 developed distinct gene pools, or may exhibit phenotypic variation in response to differences in
55 habitat.
56 Morphological variation may be linked to differences in season, altitude, species
57 association, nutrients, and anthropogenic pressures (Albert et al. 2010, Parmesan and Hanley
58 2015, Pescador et al. 2015). Polygonatum verticillatum exhibits declining leaf number, above-
59 and below-ground fresh weight, and below ground dry weight with increasing altitude (Suyal et
60 al. 2020). Synthesis of phenols, flavonoids, tannins, and antioxidants may also be related to
61 specific environment gradients (Penuelas and Llusia 1997, Kefeli et al. 2003, Bhatt et al. 2013).
62 Adverse conditions stimulate the synthesis of free radicals, which cause oxidative stress and
63 impact plant structure and function. The association between phytochemistry and environment
64 has been reported for several medicinal plants. For example, podophyllotoxin variation
65 in Podophyllum hexandrum was associated with altitude, temperature, rainfall, humidity and soil
66 pH (Alam et al. 2008, 2009). Chlorogenic acid of Eucommia ulmoides increased with sunshine
67 and altitude, and decreased with temperature (Dong et al. 2011). Antioxidant activity
68 in Polygonatum verticillatum increased with altitude (Suyal et al. 2020).
69 Wild populations of Trillium govanianum Wall. ex D. Don appear in temperate and
70 subalpine regions of the Himalayas, in shady, cold, moist habitats with thick humus (Chauhan et
71 al. 2018). Wild populations have declined from unregulated gathering (Ahmed and Akhtar 2016,
72 Chauhan et al. 2020a), which is an economically important activity for Himalayan residents
73 (Chauhan et al. 2018). Populations may also be affected by climate change, deforestation, and
74 livestock grazing or trampling (Chauhan et al. 2019). Several changes such as phenological shift,
75 change in distribution, range shift, physiology and growth in wild species have been linked to
76 increased CO2 concentration, warming climate and changing precipitation (Parmesan and Hanley
77 2015).
78 The aim of the present study was to evaluate phenotypic variation of phytochemistry,
79 morphology, and population structure within and among populations of three Indian Himalayan
80 regions. This research will provide insight into the potential resilience of the species to continued
81 habitat changes. It will also provide baseline data for future studies that may look at changes in
82 phenotypic expression over time, or of gene pool variation among populations. Knowledge of
83 phenotypic variation by population will also inform germplasm collection if ex situ propagation
84 becomes viable.
Page 3 of 27
© The Author(s) or their Institution(s)
Botany

Draft
85 2. Material and methods
86 2.1. Species description
87 The centre of Trillium govanianum diversity is North-West Himalaya (Chauhan and Bisht 2020),
88 and its natural range extends across the Himalayan range of Afghanistan, Bhutan, China (Tibet),
89 India, Nepal and Pakistan (Fukuda 2001, Roskov et al. 2018). Populations are restricted to cold,
90 shady habitats within temperate and sub-alpine forests at altitudes of 2400-3500 m (Polunin and
91 Stainton 1984). The species is listed as endangered by the IUCN (Chauhan and Bisht 2020).
92 Trillium govanianum is a perennial rhizomatous herb with a 15-20 cm tall stem that bears
93 one or three broadly ovate, acute, stalked leaves. Like other Trillium species, it passes through
94 three distinct phenophases, 1-leaf vegetative, 3-leaf vegetative and 3-leaf reproductive (see
95 Chauhan et al. 2018). Flowers are small with six yellow basifixed stamens and a whorl of each
96 petal and sepals. Fruit is a red berry containing multiple seeds. The voucher specimen is
97 deposited to the Botanical Survey of India, Dehradun (Accession No. 115223). Individuals
98 emerge annually in early spring following snowmelt and flower from May to June. Berries
99 mature in July-August at low altitude and September-October at higher altitudes. Asexual
100 reproduction is rare in the genus (Ohara 1989, Kubota et al. 2008), and there has been little
101 success in ex-situ propagation (Chauhan et al. 2020b).
102 The species is a rich source of antioxidants (Kundra et al. 2020) and is among the most
103 traded species of the region (Khan et al. 2016). Rhizomes are gathered for the steroidal
104 compounds Govanoside A, Borassoside E, Pennogenin, Diosgenin, 20-hydroxyecysone, 5, 20-
105 dihydroxyecdysone and govanic acid (Rahman et al. 2017), and used to treat dysentery, wounds,
106 skin boils, inflammation, sepsis, menstrual and sexual disorders (Pant and Samant 2010,
107 Chauhan and Bisht 2020, Chauhan et al 2020a, 2020b).
108
109 2.2. Study area
110 Within the Indian Himalayas, the species is most common in Jammu and Kashmir, Himachal
111 Pradesh, and Uttarakhand (Chauhan et al. 2018). A total of 17 populations of T.
112 govanianum were studied from three regions of Himachal Pradesh and Uttarakhand (Table 1),
113 selected with assistance from local plant gatherers to represent the range of habitats. Among the
114 three regions, Tunghnath and Munsiyari were selected from Uttarakhand and Tirthan Valley
Page 4 of 27
© The Author(s) or their Institution(s)
Botany

Draft
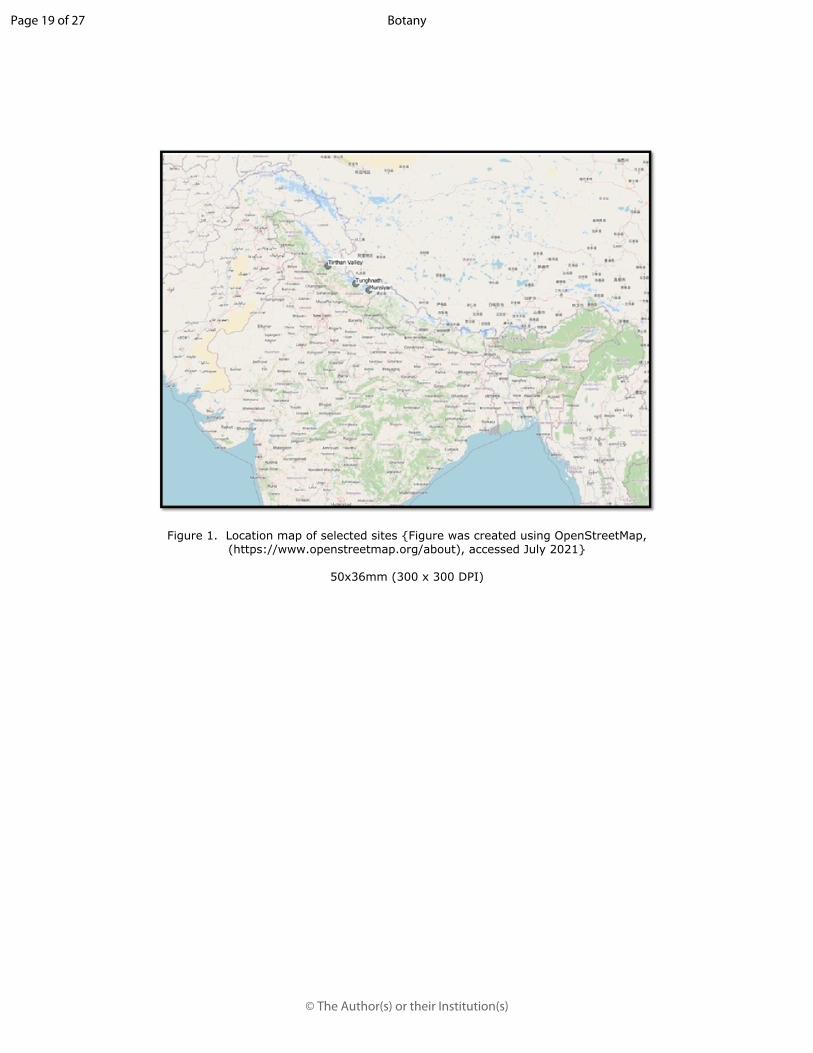
115 from Himachal Pradesh (Figure 1). Populations varied in altitude, latitude, arboreal community,
116 and aspect but the influence of these variables could not be assessed in isolation.
117 Aspect significantly affects habitats since all regions are north of the Tropic of Cancer.
118 Thus, north-facing slopes have lower average sunlight penetration throughout the year. Tirthan
119 Valley (Himachal Pradesh; high latitude, low altitude) has temperate mixed-species forest
120 habitats, and T. govanianum populations occur on aspects facing all cardinal points. Both
121 Munsiyari and Tunghnath (Uttarakhand) have Rhododendron forest habitats with T.
122 govanianum populations on north-facing aspects only. Munsiyari is low latitude, mid to high
123 altitude, while Tunghnath is mid-latitude, high altitude. Selected T. govanianum populations
124 were separated by at least 500 m and usually also by a geographic boundary, and thus were
125 considered distinct populations (Osunkoya 1999). Commercial gathering is affecting population
126 distributions in Munsiyari and Tirthan Valley but is not reported from Tunghnath (Chauhan et al.
127 2018).
128
129 2.3. Population and morphology
130 Number of 1- and 3-leaf plants was counted in twenty 1m2 plots in each of three 100 m2
131 replicates of each population. Replicate were selected visually within the natural growing area of
132 each selected population. In four study sites (Taati, Base Khalli, Tunghnath 2 and Tunghnath 3)
133 just one replicate was assessed due to the small size of these populations. From these data,
134 density (number of 1-leaf and number of 3-leaf plants per plot), age ratio (number of 1-leaf
135 plants/number of 3-leaf plants) and frequency (proportion of plots with at least one 1-leaf plant,
136 repeated for 3-leaf plants) were calculated. These data have been presented previously (Chauhan
137 et al. 2018).
138 Five 3-leaf vegetative plants aged 11-15 years were removed from each population for
139 morphological analysis. Age was estimated from the number of internodes on the rhizome
140 (Hanzawa and Kalisz 1993) and rejected individuals were replanted in situ. This age range was
141 chosen to enable comparison among populations while minimizing disturbance to natural
142 populations. Plants at the reproductive stage were not used because they were unavailable at
143 some of the more disturbed populations of Tirthan Valley. Each plant was washed by immersing
144 in water and stirring thoroughly and then placed in the shade until dry. Morphological
145 measurements included shoot length from plant base to a leaf node, leaf area (graph paper
Page 5 of 27
© The Author(s) or their Institution(s)
Botany

Draft
146 method; Jugran et al. 2013), fresh biomass of aboveground (shoot, leaf) and belowground (root,
147 rhizome) components, number of roots, length of the longest root, and rhizome maximum length
148 and diameter. Morphological measurements including fresh biomass were made in the field. Dry
149 biomass was not included because fungal contamination could not be prevented from samples
150 that were collected several days’ travel from a laboratory. Species’ biomass per square meter was
151 estimated for each population by multiplying the average plant biomass for each population by
152 the average plant (1- and 3-leaf) density.
153
154 2.4. Phytochemistry
155 Five rhizomes were collected from each population, washed in distilled water, dried in a hot-air
156 oven at 40°C until they reached a constant mass, then ground to a fine powder. Solutions of 0.5 g
157 rhizome powder and 50 ml 80% (v/v) methanol were gently stirred for 12 hours, sonicated at
158 22°C for 10 minutes, and centrifuged at 10000 rpm for 15 minutes. The supernatant was filtered
159 and stored at -20°C until analysis.
160 Phenolic content was determined using Folin–Ciocalteu’s colorimetric method (Singleton
161 and Rossi 1965, Rawat et al. 2016). The extract (0.5 ml) diluted with distilled water (4.5 ml) was
162 mixed with Folin Ciocalteu’s reagent (0.5 ml) and allowed to stand for reaction (5 min). The
163 mixture was neutralized by 1% sodium carbonate (5 ml) and incubated in dark for 90 min at
164 22±1°C. The absorbance of the resultant blue color was measured at 765 nm using UV–Vis
165 spectrophotometer (U-2001, Hitachi, Japan). Quantification of total phenols was based on the
166 standard curve of gallic acid prepared in 80% (v/v) methanol and results were expressed in mg
167 gallic acid equivalent (GAE) per 100 grams dry weight (GAE/100g).
168 Flavonoids in the extract were determined by aluminium chloride calorimetric method
169 (Chang et al. 2002). 0.50 ml of methanolic extract of the sample was diluted with 1.50 ml of
170 distilled water and 0.50 ml of 10% (w/v) aluminium chloride added along with 0.10 ml of 1M
171 potassium acetate and 2.80 ml of distilled water. This mixture was incubated at room
172 temperature for 30 min. The absorbance of the resulting reaction mixture was measured at 415
173 nm UV-VIS spectrophotometer. Quantification was based on the standard curve of quercetin
174 prepared in 80% methanol, results were expressed in mg quercetin equivalent per 100 gram of
175 dry weight (QE/100g).
Page 6 of 27
© The Author(s) or their Institution(s)
Botany

Draft
176 Tannin content was estimated following Nwinuka et al. (2005). The methanol extract of
177 the rhizomes was added to Folin-Dennis reagent (0.5 ml) and saturated with Sodium carbonate
178 (1ml). The solution was diluted up to 10 ml with distilled water. The solution was kept at room
179 temperature (25 °C) for 20 minutes. The absorbance by solution was measured at 700 nm. The
180 quantification of tannin content was based on the standard curve of tannic acid prepared in 80%
181 (v/v) methanol and results were expressed in mg tannic acid equivalent (TAE) per 100 grams dry
182 weight (TAE/100g).
183 Antioxidant activity was determined using three in vitro methods: ABTS (2,2'-azino-bis
184 3-ethylbenzothiazoline-6-sulfonic acid) radical scavenging activity assay (Cai et al., 2004),
185 DPPH (2,2-diphenyl-1-picryl-hydrazyl-hydrate) free radical scavenging assay (Brand-Williams
186 et al. 1995), and FRAP (ferric reducing antioxidant power) assay (Faria et al. 2005). ABTS assay
187 as described by Cai et al. (2004) was used for the measurement of the antioxidant activity. ABTS
188 (7.0 μM) and potassium persulphate (2.45 μM) were added for the production of ABTS cation in
189 an amber-colored bottle. The bottle was kept in dark for (16 h, 22±1ºC). The solution was diluted
190 with 80% (v/v) ethanol till an absorbance of 0.700± 0.05 at 734 nm is obtained. Sample analysis
191 was performed by adding 0.10 ml of methanolic extract with 3.90 ml of this diluted ABTS
192 solution. The resulted solution was mixed and allowed to stand for 6 min in dark at 23ºC.
193 Absorbance was recorded at 734 nm using UV-VIS spectrophotometer. Samples were diluted
194 with 80% (v/v) methanol to obtain 20-80% reduction in absorbance at 734 nm with respect to the
195 blank.
196 Antioxidant activity by DPPH assay was analysed following Brand-William et al. (1995)
197 with minor modifications. 400 μM DPPH, 0.2M MES buffer (pH 6.0) and 20% (v/v) ethanol was
198 added for the DPPH cation preparation. The prepared DPPH cation solution (2.7 ml) was mixed
199 with 0.9 ml sample extract and kept in dark at room temperature for 20 minutes. Absorbance was
200 taken at 520 nm by UV-VIS spectrophotometer. Results were expressed in millimole (mM)
201 ascorbic acid equivalent (AAE)/100g of the sample on a dry weight basis.
202 FRAP assay was performed following Faria et al. (2005) with few modifications. FRAP
203 reagent was prepared by adding 300 mM acetate buffer (10 vol); 10 mM 2, 4, 6-tri-2-pyridyl-1,
204 3, 5-triazin (TPTZ) in 40 mM HCl (1 vol); 20 mM ferric chloride (1 vol). The mixture was pre-
205 warmed at 37 °C and 3.0 ml of the mixture was added to 0.1 ml methanolic extract and kept at
206 37 °C for 8 minutes. Absorbance was recorded at 593 nm. A blank sample was prepared by
Page 7 of 27
© The Author(s) or their Institution(s)
Botany

Draft
207 ascorbic acid and results were expressed in mM ascorbic acid equivalent (AAE)/100 g dry
208 weight.
209
210 2.5. Data analysis
211 Variability in phytochemistry, morphology and population structure of T. govanianum across
212 populations located in different altitudes, latitude and habitat factors of region, arboreal
213 community and aspect was assessed using analysis of variance in which populations were nested
214 within the factor, using IBM SPSS v23. Means and pairwise comparisons of significance were
215 recorded for significant factors. Altitude was assessed using Pearson’s correlation coefficient for
216 each region individually and combined. The Bonferroni correction was applied across inter-and
217 intra-factor effects for each factor, and across pairwise comparisons for each factor. Hence
218 α=0.05/x, where x=38 for region, arboreal community and aspect and their nested populations,
219 x=19 for altitude (all regions); for pairwise comparisons among regions, x = 42, arboreal
220 communities, x = 39, and aspect groups, x = 30; for correlations of altitude within each region, x
221 = 57.
222 3. Results
223 Most phytochemical variables exhibited strong differences between the high altitude regions of
224 Munsiyari and Tunghnath and between Rhododendron dominant and pure Rhododendron forests
225 (Figure 2 and 3). Almost all variables exhibited spatial influences on phytochemistry at both the
226 intra- and interregional scales. Altitude did not affect the phytochemistry within regions (Table
227 5).
228 Phenol concentration was higher in Tirthan Valley than the other regions and was not
229 significantly affected by factors separating the higher altitude populations (Figure 2). Flavonoid
230 concentration was highest in the partially north-facing pure Rhododendron forests of Munsiyari
231 (Figure 3 and 4), and lowest in the south-facing populations of Tirthan Valley (Figure 2 and 4).
232 Tannin concentration was highest in the partially north-facing populations of Munsiyari (Figure
233 2 and 4), and lowest in the mostly north-facing Rhododendron dominant forests of Tunghnath.
234 ABTS concentration was lowest in the Rhododendron dominant forests (Figure 3). DPPH
235 concentration was highest in the south-facing populations of Tirthan Valley and lowest in
Page 8 of 27
© The Author(s) or their Institution(s)
Botany

Draft
236 Munsiyari (Figure 2 and 4). FRAP concentration was substantially lower in the mostly north-
237 facing Rhododendron dominant forests of Tunghnath.
238 All root morphology variables other than fresh biomass were smaller in Tirthan Valley
239 but there was no difference among populations (Figure 2). Hence, roots were shorter and fewer
240 and rhizomes were smaller, but root mass was constant (Table 2). In the other regions, there was
241 no difference among Rhododendron dominant and pure Rhododendron forests (Table 3) nor
242 between populations of different aspects (Table 4). Leaf area, population age ratio, and fresh
243 biomass of both shoots and roots were strongly conserved across all factors (Tables 2-5). Shoot
244 length was also highly conserved, differing among the regions of Tirthan Valley and Munsiyari
245 but not among any other factors. Plant biomass per square meter was also strongly conserved
246 across all factors, although the power of this test was much lower. Therefore a non-destructive
247 observation of above-ground morphology of individual plants would suggest the minimal
248 variation among populations.
249 Density of both 1- and 3-leaf plants was lower in Munsiyari than other regions, though
250 the age ratio of populations was constant (Figure 2). Regions differentiated populations by plant
251 density variables more than arboreal community (Table 3) or aspect (Table 4), but altitude was
252 positively correlated with plant density within the lower altitude region of Tirthan Valley (Table
253 5). Frequency was greatest in the mixed species forests of Tirthan Valley for both 1- and 3- leaf
254 plants (Table 2, 3).
255 4. Discussion
256 Plant species demonstrate enormous diversity in eco-physiological and functional traits at local,
257 regional and global scales, linked to climatic and environmental variation (Ackerly et al. 2000).
258 The present study revealed significant phytochemical variation among regions and populations
259 within regions. This type of variation is to be expected, due to different habitats causing different
260 phenotypic expression, or of isolated populations developing distinct gene pools. Such variation
261 among populations has been observed in other Himalayan medicinal plants (Suyal et al. 2020).
262 Phenols are normally produced in response to environmental stress (Klepacka et al. 2011)
263 indicating that populations varied in their exposure to stresses such as pathogens, insect or
264 vertebrate herbivory, or sunlight exposure. Flavonoids also are produced in response to
Page 9 of 27
© The Author(s) or their Institution(s)
Botany

Draft
265 environmental cues (Kefeli et al. 2003). T. govanianum has a patchy distribution, limited to cold,
266 shaded and moist habitat (Chauhan et al. 2018). Patchy distribution and geographical barriers
267 accelerate genetic differences increasing the adaptability to specific habitat (Rawat et al. 2018).
268 Differences in root morphology and population structure are likely attributable to
269 regional characteristics other than those investigated. Above-ground morphology and biomass
270 per square meter were highly conserved among populations both within and among regions. Root
271 morphology and population structure varied among regions but not within them, other than a
272 decline in plant density at the lower range of altitudes. The similar root morphology and
273 population structure among populations of a region might indicate gene flow among populations
274 is much stronger than among regions. Thus, we speculate that the species might exhibit adaptive
275 genetic diversity among regions (Buckley et al. 2010, Ishizuka et al. 2020). The spatially
276 separated populations among regions differ climatically and edaphically, which could promote
277 variation in these traits.
278 The shorter roots and smaller rhizomes of Tirthan Valley had the same fresh biomass as
279 roots from other regions. These lower-altitude mixed forests contained an abundant layer of
280 humus and leaf litter due to the higher proportion of broad-leaved trees. T. govanianum roots
281 may have been shallower and thicker because nutrients were closer to the surface. Higher
282 humus/carbon and root associations normally result in increased biomass and growth of sub-
283 alpine and alpine species (Callaway et al. 2002, North et al. 2005). It is not known why plants
284 put resources into thicker, shorter roots rather than rhizomes in this region, but this may be
285 related to a longer growing season at these lower altitudes. Higher altitude was correlated with
286 greater resource allocation to roots, and particularly rhizomes (Ma et al. 2010). Species’ fitness
287 generally declines with altitude, correlating with lower temperature and a shorter growing season
288 (Korner 2003). Rhizome size is significant for the regional economy since gathered rhizomes are
289 sold on a dry-weight basis (Chauhan et al. 2018, 2020a) and the amount of active constituents is
290 assumed to be proportional to weight (Jugran et al. 2013). The larger rhizomes of Munsiyari and
291 Tunghnath could reflect that these regions are more suitable for T. govanianum. Tirthan valley
292 populations have been more heavily disturbed by medicinal plant gatherers (Chauhan et al. 2018)
293 hence morphological differences may also reflect a recovering population. Selective removal by
294 gatherers can also reduce genetic diversity (Cruse-Sanders et al. 2005).
Page 10 of 27
© The Author(s) or their Institution(s)
Botany

Draft
295 Results of this study indicate that there were sufficient environmental differences among
296 populations to invoke a population-specific phytochemical response. Causes of such variations
297 can be attributed either to the genetic character of source populations, growing season,
298 developmental stages of plants, light intensity, altitude of plant origin or microclimatic condition
299 of the area (Jugran et al. 2016a). Plant secondary metabolite accumulation is usually greater at
300 higher altitudes (Spitaler et al. 2008, Rawat et al. 2011, Jugran et al. 2013) where plants are
301 exposed to more extreme environmental stresses, such as ultraviolet light and temperature
302 (Rainwater et al. 1996). Increasing light intensity in glass house is reported to increase total
303 phenols, flavonoids and antioxidant activities in Zingiber officinale (Ghasemzadeh et al. 2010).
304 Latitude of the plant origin is found to influence the tannin and glycyrrhizin content in
305 Glycyrrhiza glabra (Oloumi and Hassibi 2011). Growth stages in Hedycium spicatum were
306 found to influence phenolic and antioxidant activities (Rawat et al. 2011). Phytochemical
307 diversity in Valeriana jatamansi was found to vary across altitude and among different habitat
308 (Jugran et al. 2016a). Moreover, several other Himalayans medicinal plants such as Habenaria
309 intermedia, Roscoea procera, Valeriana jatamansi (Rawat et al. 2016) and Paeonia emodi
310 (Jugran et al. 2016b) and many more have shown considerable variations in the phytochemical
311 diversity among different environmental gradient. This study did not find a relationship with
312 altitude when regional differences were considered, but found significant variation among
313 arboreal communities and aspects within regions.
314 The present study demonstrated that in T. govanianum above-ground morphology masks
315 considerable variations in below-ground morphology and phytochemistry. It is difficult to predict
316 whether the observed variations are due to genetic adaptation or phenotypic plasticity. Although
317 the species is limited to a very specific habitat class, it does appear that the observed variations
318 can provoke a functional response to changing environmental conditions for adaptation.
319
320 Acknowledgements
321 We are thankful to the Head of the Department of Botany, D.S.B. Campus, Kumaun University,
322 Nainital and the Director of G.B. Pant National Institute of Himalayan Environment, Kosi-
323 Katarmal, Almora for providing the necessary facilities to complete this work. This work was
Page 11 of 27
© The Author(s) or their Institution(s)
Botany

Draft
324 financially supported by the University Grants Commission, New Delhi, India under the UGC-
325 BSR scheme to H.K. Chauhan (Grant No. F.7-318/2011 BSR).
326
327 References
328 Ackerly, D.D., Dudley, S.A., Sultan, S.E., Schmitt, J., Coleman, J.S., Linder, C.R., and
329 Lechowicz, M.J. 2000. The evolution of plant ecophysiological traits: recent advances
330 and future directions: new research addresses natural selection, genetic constraints, and
331 the adaptive evolution of plant ecophysiological traits. Bioscience. 50: 979-995.
332 Ahmed, M.J., and Akhtar, T. 2016. Indigenous knowledge of the use of medicinal plants in
333 Bheri, Muzaffarabad, Azad Kashmir, Pakistan. European Journal of Integrative
334 Medicine. 8: 560-569.
335 Alam, A., Gulati, P., Aswini, K.G., Gyan, P.M. and Pradeep, K.N. 2009. Assessment of genetic
336 diversity among Podophyllum hexandrum genotypes of Northwestern Himalayan region
337 for podophyllotoxin production. Indian Journal of Biotechnology. 8: 391–399.
338 Alam, A., Naik, P.K., Gulati, P., Gulati, A.K., and Mishra, G.P. 2008. Characterization of
339 genetic structure of Podophyllum hexandrum populations, an endangered medicinal herb
340 of Northwestern Himalaya, using ISSR-PCR markers and its relatedness with
341 podophyllotoxin content. African Journal of Biotechnology. 7: 1028–1040.
342 Albert, C.H., Thuiller, W., Yoccoz, N.G., Soudant, A., Boucher, F., Saccone, P. and Lavorel, S.
343 2010. Intraspecific functional variability: extent, structure and sources of
344 variation. Journal of Ecology. 98: 604-613.
345 Bhatt, I.D., Rawat, S., and Rawal, R.S. 2013. Antioxidants in medicinal plants. In: Chandra S.,
346 Lata S., Varma A. (eds), Biotechnology for medicinal plants. Springer, Berlin,
347 Heidelberg. pp. 295–326.
348 Brand-Williams, W., Cuvelier, M.E., and Berset, C.L.W.T. 1995. Use of a free radical method
349 to evaluate antioxidant activity. LWT-Food Science and Technology. 28: 25-30.
350 Buckley, Y.M., Ramula, S., Blomberg, S.P., Burns, J.H., Crone, E.E., Ehrlén, J., and Wardle, G.
351 M. 2010. Causes and consequences of variation in plant population growth rate: a
352 synthesis of matrix population models in a phylogenetic context. Ecology Letters. 13:
353 1182-1197.
Page 12 of 27
© The Author(s) or their Institution(s)
Botany

Draft
354 Cai, Y., Luo, Q., Sun, M., and Corke, H. 2004. Antioxidant activity and phenolic compounds of
355 112 traditional Chinese medicinal plants associated with anticancer. Life Science. 74:
356 2157-2184.
357 Callaway, R.M., Brooker, R.W., Choler, P., Kikvidze, Z., Lortie, C.J., Michalet, R., Paolini, L.,
358 Pugnaire, F.I., Newingham, B., Aschehoug, E.T., and Armas, C. 2002. Positive
359 interactions among alpine plants increase with stress. Nature. 417: 844.
360 Chang, C.C., Yang, M.H., Wen, H.M., and Chern, J.C. 2002. Estimation of total flavonoid
361 content in propolis by two complementary colorimetric methods. Journal of Food Drug
362 Analysis. 10: 178-182.
363 Chauhan, H.K. and Bisht, A.K. 2020. Trillium govanianum. The IUCN Red List of Threatened
364 Species 2020: e. T175804005A176257695.
365 Chauhan, H.K., Bhatt, I.D., and Bisht A.K. 2020a. Biology, Uses and Conservation of Trillium
366 govanianum. In: Roy N., Roychoudhury S., Nautiyal S., Agarwal, S., Baksi S. (eds),
367 Socio-economic and Eco-biological Dimension in Resource use and Conservation,
368 Environmental Science and Engineering. Springer Nature, Switzerland. pp 235-247.
369 Chauhan, H.K., Bisht, A.K., Bhatt, I.D., and Bhatt, A. 2020b. Protocol for vegetative
370 propagation of Trillium govanianum Wall ex D. Don. Journal of Applied Research on
371 Medicinal and Aromatic Plants 16 (2020): 100233.
372 Chauhan, H.K., Bisht, A.K., Bhatt, I.D., Bhatt, A., and Gallacher, D. 2019. Trillium–toward
373 Sustainable Utilization of a Biologically Distinct Genus Valued for Traditional Medicine.
374 The Botanical Review. 85: 252-272.
375 Chauhan, H.K., Bisht, A.K., Bhatt, I.D., Bhatt, A., Gallacher, D., and Santo, A. 2018. Population
376 change of Trillium govanianum (Melanthiaceae) amid altered indigenous harvesting
377 practices in the Indian Himalayas. Journal of Ethnopharmacology. 213: 302-310.
378 Cruse-Sanders, J.M., Hamrick, J.L., and Ahumada, J.A. 2005. Consequences of harvesting for
379 genetic diversity in American ginseng (Panax quinquefolius L.): a simulation
380 study. Biodiversity and Conservation. 14: 493-504.
381 Dong, J., Ma, X., Wei, Q., Peng, S. and Zhang, S. 2011. Effects of growing location on the
382 contents of secondary metabolites in the leaves of four selected superior clones of
383 Eucommia ulmoides. Industrial Crops and Products. 34: 1607-1614.
Page 13 of 27
© The Author(s) or their Institution(s)
Botany

Draft
384 Faria, A., Oliveira, J., Neves, P., Gameiro, P., Santos-Buelga, C., de Freitas, V., and Mateus, N.
385 2005. Antioxidant properties of prepared blueberry (Vaccinium myrtillus)
386 extracts. Journal of Agricultural and Food Chemistry. 53: 6896-6902.
387 Forsman, A. 2015. Rethinking phenotypic plasticity and its consequences for individuals,
388 populations and species. Heredity 115(4): 276-284.
389 Fox, R.J., Donelson, J.M., Schunter, C., Ravasi, T. and Gaitán-Espitia, J.D. 2019. Beyond buying
390 time: the role of plasticity in phenotypic adaptation to rapid environmental change.
391 Philosophical Transactions of the Royal Society B. 374: 20180174.
392 Fukuda, I., 2001. The origin and evolution in Trillium 1. The origin of the Himalayan Trillium
393 govanianum. Cytologia. 66: 105-111.
394 Ghasemzadeh, A., Jaafar, H.Z., Rahmat, A., Wahab, P.E.M. and Halim, M.R.A. 2010. Effect of
395 different light intensities on total phenolics and flavonoids synthesis and anti-oxidant
396 activities in young ginger varieties (Zingiber officinale Roscoe). International Journal of
397 Molecular Sciences 11: 3885-3897.
398 Hanzawa, F.M., and Kalisz, S. 1993. The relationship between age, size, and reproduction in
399 Trillium grandiflorum (Liliaceae). American Journal of Botany. 80: 405-410.
400 Ishizuka, W., Hikosaka, K., Ito, M., and Morinaga, S.I. 2020. Temperature-related cline in the
401 root mass fraction in East Asian wild radish along the Japanese archipelago. Breeding
402 science. 70:321–30.
403 Jugran, A.K. Bhatt, I.D., Rawal, R.S, Nandi, S.K., and Pande, V. 2013. Patterns of
404 morphological and genetic diversity of Valeriana jatamansi Jones in different habitats
405 and altitudinal range of West Himalaya, India. Flora. 208:13-21.
406 Jugran, A.K., Bahukhandi, A., Dhyani, P., Bhatt, I.D., Rawal, R.S. and Nandi, S.K. 2016a.
407 Impact of altitudes and habitats on valerenic acid, total phenolics, flavonoids, tannins,
408 and antioxidant activity of Valeriana jatamansi. Applied Biochemistry and
409 Biotechnology. 179: 911-926.
410 Jugran, A.K., Chaudhary, W.Y., Bahukhandi, A., Bhatt, I.D., Rawal, R.S. and Dhyani, P.P.,
411 2016b. Effect of processing and storage methods on the nutritional, anti-nutritional, and
412 anti-oxidant properties of Paeonia emodi, wall. ex. royle. Applied Biochemistry and
413 Biotechnology. 180: 322-337.
Page 14 of 27
© The Author(s) or their Institution(s)
Botany

Draft
414 Kefeli, V.I., Kalevitch, M.V., and Borsari, B. 2003. Phenolic cycle in plants and environment.
415 Journal of Cell Molecular Biology. 2: 13-18.
416 Khan, K.M., Nahar, L., Al‐Groshi, A., Zavoianu, A.G., Evans, A., Dempster, N.M., Wansi, J.D.,
417 Ismail, F.M., Mannan, A. and Sarker, S.D. 2016. Cytotoxicity of the roots of Trillium
418 govanianum against breast (MCF7), liver (HepG2), lung (A549) and urinary bladder
419 (EJ138) carcinoma cells. Phytotherapy Research 30: 1716-1720.
420 Klepacka, J., Gujska, E., and Michalak, J. 2011. Phenolic compounds as cultivar-and variety-
421 distinguishing factors in some plant products. Plant Foods for Human Nutrition. 66: 64-
422 69.
423 Korner, C. 2003. Alpine Plant Life: Functional Plant Ecology of High Mountain Ecosystems,
424 Springer-Verlag Berlin Heidelberg, New York, USA.
425 Kubota, S., Kameyama, Y., Hirao, A.S. and Ohara, M. 2008. Adaptive significance of
426 self‐fertilization in a hermaphroditic perennial, Trillium camschatcense
427 (Melanthiaceae). American Journal of Botany 95: 482-489.
428 Kundra, R., Samant, S.S. and Sharma, R.K. 2020. Assessment of Antioxidant Potential of
429 Trillium govanianum Wall. ex D. Don, a Critically Endangered Medicinal Plant of
430 Northwestern Indian Himalaya. Proceedings of the National Academy of Sciences, India
431 Section B: Biological Sciences 90: 95-101.
432 Ma, W., Shi, P., Li, W., He, Y., Zhang, X., Shen, Z., and Chai, S. 2010. Changes in individual
433 plant traits and biomass allocation in alpine meadow with elevation variation on the
434 Qinghai-Tibetan Plateau. Science China Life Science. 53: 1142-1151.
435 North, M., Oakley, B., Fiegener, R., Gray, A., and Barbour, M. 2005. Influence of light and soil
436 moisture on Sierran mixed-conifer understory communities. Plant Ecology. 177: 13-24.
437 Nwinuka, N.M., Ibeh, G.O., and Ekeke, G.I. 2005. Proximate composition and levels of some
438 toxicants in four commonly consumed spices. Journal of Applied Sciences and
439 Environmental Management. 9: 150–155.
440 Ohara, M. 1989. Life history evolution in the genus Trillium. Plant Species Biology. 4: 1-28.
441 Oloumi, H. and Hassibi, N. 2011. Study the correlation between some climate parameters and
442 the content of phenolic compounds in roots of Glycyrrhiza glabra. Journal of Medicinal
443 Plants Research. 5: 6011-6016.
Page 15 of 27
© The Author(s) or their Institution(s)
Botany

Draft
444 Osunkoya, O.O. 1999. Population structure and breeding biology in relation to conservation in
445 the dioecious Gardenia actinocarpa (Rubiaceae)–a rare shrub of North Queensland
446 rainforest. Biological Conservation. 88: 347-359.
447 Pant, S. and Samant, S.S. 2010. Ethnobotanical observations in the Mornaula reserve forest of
448 Komoun, West Himalaya, India. Ethnobotanical Leaflets. 14: 193-217.
449 Parmesan, C. and Hanley, M.E. 2015. Plants and climate change: complexities and
450 surprises. Annals of Botany. 116: 849-864.
451 Penuelas, J. and Llusia, J. 1997. Effects of carbon dioxide, water supply, and seasonality on
452 terpene content and emission by Rosmarinus officinalis. Journal of Chemical
453 Ecology. 23: 979-993.
454 Pescador, D.S., de Bello, F., Valladares, F. and Escudero, A. 2015. Plant trait variation along an
455 altitudinal gradient in mediterranean high mountain grasslands: controlling the species
456 turnover effect. PLoS One 10(3): e0118876.
457 Polunin, O., and Stainton, A. 1984. Flowers of the Himalaya, Oxford University Press, New
458 Delhi, India.
459 Rahman, S.U., Ismail, M., Khurram, M., Ullah, I., Rabbi, F. and Iriti, M. 2017. Bioactive
460 steroids and saponins of the genus Trillium. Molecules. 22: 2156.
461 Rainwater, D.T., Gossetp, D.R., Millhollon, E.P., Hanna, H.Y., Banks, S.W., and Lucas, M.C.
462 (1996). The relationship between yield and the antioxidant defense system in tomatoes
463 grown under heat stress. Free Radical Research. 25: 421-435.
464 Rawat, S., Jugran, A. K., Bahukhandi, A., Bahuguna, A., Bhatt, I. D., Rawal, R. S. and Dhar, U.
465 2016. Anti-oxidant and anti-microbial properties of some ethno-therapeutically important
466 medicinal plants of Indian Himalayan Region. 3 Biotech. 6: 154.
467 Rawat, S., Jugran, A., Giri, L., Bhatt, I. D. and Rawal, R.S. 2011. Assessment of antioxidant
468 properties in fruits of Myrica esculenta: a popular wild edible species in Indian
469 Himalayan region. Evidence-Based Complementary and Alternative Medicines. 2011: 1-
470 8.
471 Rawat, S., Jugran, A.K., Bhatt, I.D. and Rawal, R.S., 2018. Influence of the growth phenophases
472 on the phenolic composition and anti-oxidant properties of Roscoea procera Wall. in
473 western Himalaya. Journal of Food Science and Technology 55: 578-585.
Page 16 of 27
© The Author(s) or their Institution(s)
Botany

Draft
474 Roskov, Y., Abucay, L., Orrell, T., Nicolson, D., Bailly, N., Kirk, P.M., Bourgoin, T., DeWalt,
475 R.E., Decock, W., DeWever, A., Nieukerken, E., Zarucchi, J., Penev, L. (Eds.), Species
476 2000 & ITIS Catalogue of Life, Naturalis, Leiden, the Netherlands 28th March 2018.
477 Digital resource at ISSN 2405–8858. www.catalogueoflife.org/col
478 Salick, J., Fang, Z., and Byg, A. 2009. Eastern Himalayan alpine plant ecology, Tibetan
479 ethnobotany, and climate change. Global Environmental Change. 19: 147-155.
480 Samant, S.S., Dhar, U. and Palni, L.M.S. 1998. Medicinal Plants of Indian Himalaya: Diversity
481 Distribution Potential Values. Gyanodaya Prakasan, Nainital.
482 Sigdel, S.R., Wang, Y., Camarero, J.J., Zhu, H., Liang, E., and Peñuelas, J. 2018.
483 Moisture‐mediated responsiveness of treeline shifts to global warming in the
484 Himalayas. Global Change Biology. 24: 5549-5559.
485 Singh, D.K. and Hajra, P.K. 1996. Floristic diversity. In: Gujral, G.S., Sharma, V. (Eds.),
486 Changing Perspectives of Biodiversity Status in the Himalaya. British Council Division,
487 New Delhi, India, pp. 23-38.
488 Singleton, V.L., and Rossi J.A. 1965. Colorimetry of total phenolics with phosphomolybdic-
489 phosphotungstic acid reagents. American Journal of Enology and Viticulture. 16: 144-
490 158.
491 Spitaler, R., Winkler, A., Lins, I., Yanar, S., Stuppner, H., and Zidorn, C. 2008. Altitudinal
492 variation of phenolic contents in flowering heads of Arnica montana cv. ARBO: a 3-year
493 comparison. Journal of Chemical Ecology. 34: 369-375.
494 Suyal, R., Rawat, S., Rawal, R.S. and Bhatt, I.D. 2019. Variability in morphology,
495 phytochemicals, and antioxidants in Polygonatum verticillatum (L.) All. populations
496 under different altitudes and habitat conditions in Western Himalaya,
497 India. Environmental Monitoring and Assessment. 191: 1-18.
498
499
500
501
502
503
504
Page 17 of 27
© The Author(s) or their Institution(s)
Botany

Draft
505 Figure legends
506 Figure 1 Location map of selected sites {Figure was created using OpenStreetMap, 507 (https://www.openstreetmap.org/about), accessed July 2021}
508 Figure 2 Influence of region on populations of Trillium govanianum in the Indian Himalayas
509 Figure 3 Influence of arboreal community on Trillium govanianum in the Indian Himalayas
510 Figure 4 Influence of aspect on Trillium govanianum in the Indian Himalayas
Page 18 of 27
© The Author(s) or their Institution(s)
Botany
Draft
Figure 1. Location map of selected sites {Figure was created using OpenStreetMap, (https://www.openstreetmap.org/about), accessed July 2021}
50x36mm (300 x 300 DPI)
Page 19 of 27
© The Author(s) or their Institution(s)
Botany

Draft
Figure 2. Influence of region on populations of Trillium govanianum in the Indian Himalayas
100x108mm (300 x 300 DPI)
Page 20 of 27
© The Author(s) or their Institution(s)
Botany

Draft
Figure 3. Influence of arboreal community on Trillium govanianum in the Indian Himalayas
100x108mm (300 x 300 DPI)
Page 21 of 27
© The Author(s) or their Institution(s)
Botany

Draft
Figure 4. Influence of aspect on Trillium govanianum in the Indian Himalayas
108x110mm (300 x 300 DPI)
Page 22 of 27
© The Author(s) or their Institution(s)
Botany

Draft
Table 1. Classification of studied Trillium govanianum populations
Region Population Altitude (m above sea level)
Aspect Aspect group
Arboreal community Tree species other than Rhododendron spp.
Devri 2452 NW N facingGaraha Thach 2465 NE N facingPurcha 2550 SW S facingTalai 2585 NW N facingGurku Thach 2623 WNW N facingBasu 2625 SE S facingMiruti Bahal 2648 ESE S facing
Tirthan Valley
Northernlatitude
HimachalPradesh
Kamarat Thach 2655 NW N facing
Mixed species Quercus spp., Abies pindrow, Juglans regia, Cedrus deodara, Picea smithiana, Betula utilis, Juniperus indica, Salix spp.
Martoli Thor 2924 NW N most Qurecus spp., BambusoideaeTaati 3068 W N part Qurecus spp., Betula spp. Base Khalli 3340 NNE N most
Rhododendron dominant
Betula spp.Bhujani 3371 ENE N part
Munsiyari
Southernlatitude
UttarakhandKhaliya Top 3432 ENE N part
Pure Rhododendron None
Tunghnath 1 3250 NW N mostTunghnath 2 3266 WNW N partTunghnath 3 3306 NE N most
Rhododendron dominant
Abies spp.Tunghnath
Central latitude
Uttarakhand Tunghnath 4 3319 NE N most Pure Rhododendron None
Page 23 of 27
© The Author(s) or their Institution(s)
Botany

Draft
Table 2. Influence of region on observations of 17 populations of Trillium govanianum in the Indian Himalayas, using analysis of variance with populations nested within regions. ns denotes P>0.05, ns* denotes 0.05>P> α, where α=0.0013 for the variation source and 0.0012 for pairwise comparisons.
Variation source (P) Region(Mean ± SE) Pairwise comparisons (P)
Variable Region PopulationTirthan Valley Munsiyari Tunghnath
Tir Valley / Muns.
Munsiyari / Tunghnath
Tir Valley / Tunghnath
Population structure1-leaf density (plants m-2) 1.2x10⁻¹² 1.3x10⁻¹⁰ 4.0 ± 0.1 2.2 ± 0.2 3.1 ± 0.2 1.6x10⁻¹² ns* ns*3-leaf density (plants m-2) 2.1x10-20 ns* 2.9 ± 0.1 2.0 ± 0.2 3.0 ± 0.2 4.7x10-05 3.3x10-04 nsAge ratio ns ns1-leaf frequency (%1m2 plots) 1.7x10-07 ns 83.5 ± 2.5 55.3 ± 4.2 49.0 ± 4.9 1.2x10-05 ns 3.1x10-06
3-leaf frequency (%1m2 plots) 4.3x10-07 ns* 81.9 ± 2.4 57.3 ± 4.1 48.3 ± 4.8 6.0x10-05 ns 3.8x10-06
Shoot morphologyShoot length (mm) 1.2x10-03 ns* 147.3 ± 4.5 119.2 ± 5.7 139.3 ± 6.4 8.3x10-04 ns nsLeaf area (mm2) ns nsFresh biomass (g) ns ns
Root morphologyRoot length (mm) 9.0x10⁻¹⁰ ns 75.9 ± 3.5 101.9 ± 4.5 120.4 ± 5 6.1x10-05 ns* 1.3x10-09
Root number per plant 4.2x10-05 ns 11.7 ± 0.6 14.9 ± 0.8 16.9 ± 0.9 ns* ns 5.8x10-05
Rhizome length (mm) 2.6x10-06 ns 18.4 ± 1.1 27.6 ± 1.3 24.3 ± 1.5 2.5x10-06 ns ns*Rhizome diameter (mm) 1.4x10-04 ns 7.0 ± 0.2 8.7 ± 0.3 8.0 ± 0.3 1.0x10-04 ns nsFresh biomass (g) ns ns
PhytochemistryPhenols (mg / 100g DW) 1.1 x10⁻¹² 5.9 x10-08 235.6 ± 4.0 175.4 ± 5.0 167.8 ± 5.6 1.5 x10⁻¹⁰ ns 4.4 x10⁻¹¹
Flavonoids (mg / 100g DW) 1.6 x10⁻²¹ 2.2 x10⁻¹³ 233.6 ± 5.5 438.3 ± 6.9 312.7 ± 7.8 6.7 x10⁻²² 2.4 x10⁻¹³ 3.1 x10-09
Tannins (mg / 100g DW) 1.8 x10⁻¹⁷ 9.4 x10⁻¹⁴ 355.9 ± 5.3 422.2 ± 6.7 249.7 ± 7.5 1.6 x10-08 8.6 x10⁻¹⁸ 8.0 x10⁻¹³
Antioxidants (mM / 100g DW) – ABTS ns 9.1 x10-04
– DPPH 1.8E x10-
104.4 x10⁻¹² 2.85 ± 0.01 2.73 ± 0.01 2.79 ± 0.01 1.0 x10⁻¹⁰ 1.1 x10-03 1.8 x10-04
– FRAP 7.8E x10-
131.4 x10⁻¹³ 9.6 ± 0.3 9.9 ± 0.3 4.5 ± 0.4 ns 1.1 x10⁻¹¹ 4.2 x10⁻¹²
Page 24 of 27
© The Author(s) or their Institution(s)
Botany

Draft
Table 3. Influence of arboreal community on observations of 17 populations of Trillium govanianum in the Indian Himalayas, using analysis of variance with populations nested within arboreal community types. ns denotes P>0.05, ns* denotes 0.05>P>0.0013.
Variation source (P) Arboreal community (Mean ± SE) Pairwise comparisons (P)
VariableArboreal
community PopulationMixed species
Rhododendron dominant
Pure Rhododendron
Mixed / dominant
Dominant / pure
Mixed / pure
Population structure1-leaf density (plants m-2) 2.1x10⁻¹¹ 3.6x10⁻¹² 4.0 ± 0.1 2.7 ± 0.2 2.5 ± 0.2 2.4x10-06 ns 4.4x10-09
3-leaf density (plants m-2) ns* 8.0x10-21
Age ratio ns ns1-leaf frequency (% 1m2 plots) 1.5x10-07 ns 83.5 ± 2.5 52.0 ± 4.6 52.9 ± 4.3 6.7x10-06 ns 4.1x10-06
3-leaf frequency (% 1m2 plots) 4.6x10-07 ns* 81.9 ± 2.4 53.0 ± 4.5 53.7 ± 4.2 1.7x10-05 ns 1.0x10-05
Shoot morphologyShoot length (mm) ns* ns*Leaf area (mm2) ns nsFresh biomass (g) ns* ns
Root morphologyRoot length (mm) 7.4x10-09 ns* 75.9 ± 3.5 109.3 ± 4.5 111.1 ± 5 4.1x10-07 ns 6.5x10-07
Root number per plant 7.7x10-05 ns 11.7 ± 0.6 15.3 ± 0.8 16.4 ± 0.9 ns* ns 2.5x10-04
Rhizome length (mm) 6.6x10-06 ns* 18.4 ± 1.1 25.8 ± 1.3 26.6 ± 1.5 1.5x10-04 ns 8.8x10-05
Rhizome diameter (mm) 2.3x10-04 ns 7.0 ± 0.2 8.6 ± 0.3 8.1 ± 0.3 2.6x10-04 ns ns*Fresh biomass (g) ns* ns
PhytochemistryPhenols (mg / 100g DW) 6.6 x10⁻¹³ 9.4 x10-08 235.6 ± 4.0 164.0 ± 5.0 182.1 ± 5.6 1.6 x10⁻¹² ns 1.3 x10-08
Flavonoids (mg / 100g DW) 7.2 x10⁻²⁰ 2.4 x10⁻¹⁵ 233.6 ± 5.5 356.6 ± 6.9 414.9 ± 7.8 4.2 x10⁻¹⁵ 8.7 x10-06 3.0 x10⁻¹⁹
Tannins (mg / 100g DW) 7.6 x10-08 2.8 x10⁻¹⁷ 355.9 ± 5.3 312.8 ± 6.7 386.4 ± 7.5 4.8 x10-05 5.8 x10-08 ns*Antioxidants (mM / 100g DW) – ABTS 4.4 x10-04 ns* 41.7 ± 1.8 32.1 ± 2.3 46.4 ± 2.5 ns* 5.1 x10-04 ns – DPPH 3.3 x10⁻¹⁰ 3.4 x10⁻¹² 2.85 ± 0.01 2.74 ± 0.01 2.79 ± 0.01 2.4 x10-10 ns* 6.1 x10-05
– FRAP 6.0 x10⁻¹³ 1.6 x10⁻¹³ 9.6 ± 0.3 5.1 ± 0.3 10.5 ± 0.4 1.4 x10⁻¹¹ 7.9 x10⁻¹² ns
Page 25 of 27
© The Author(s) or their Institution(s)
Botany

Draft
Table 4. Influence of aspect on observations of 17 populations of Trillium govanianum in the Indian Himalayas, using analysis of variance with populations nested within aspect groups. ns denotes P>0.05, ns* denotes 0.05>P> α, where α=0.0013 for the variation source and 0.0017 for pairwise comparisons.
Variation source (P) Aspect groups(Mean ± SE) Pairwise comparisons (P)Low altitude High altitude
VariableAspect group Population S facing N facing N part N most
Low : High altitude
S : N facing
N part : N most
Population structure1-leaf density (plants m-2) 4.3 x10⁻¹² 9.9 x10⁻¹¹ 4.48 ± 0.20 3.70 ± 0.16 2.39 ± 0.25 2.75 ± 0.21 4.9 x10-04 ns* ns3-leaf density (plants m-2) ns* 6.8 x10-21
Age ratio ns ns1-leaf frequency (% 1m2 plots) 1.6 x10-07 ns 86.0 ± 4.0 82 ± 3.0 62 ± 5.0 45 ± 4.0 ns* ns ns3-leaf frequency (% 1m2 plots) 2.4 x10-07 ns* 86.0 ± 4.0 80 ± 3.0 65 ± 5.0 44 ± 4.0 ns* ns ns*
Shoot morphologyShoot length (mm) ns ns*Leaf area (mm2) ns nsFresh biomass (g) ns ns
Root morphologyRoot length (mm) 1.6 x10-08 ns* 75.3 ± 5.6 70.6 ± 5.1 105.8 ± 5.9 111.9 ± 4.3 5.6 x10-04 ns nsRoot number per plant ns* nsRhizome length (mm) 7.8 x10-04 ns 18.1 ± 1.7 18.9 ± 1.6 26.2 ± 1.8 24.9 ± 1.3 ns* ns nsRhizome diameter (mm) ns* nsFresh biomass (g) ns ns
PhytochemistryPhenols (mg / 100g DW) 4.0 x10⁻¹³ 5.3 x10-07 255.6 ± 6.5 223.6 ± 5.0 186.6 ± 5.6 160.4 ± 5.0 3.2 x10-05 ns* ns*Flavonoids (mg / 100g DW) 2.3 x10⁻²⁰ 2.4 x10⁻¹⁴ 183.2 ± 9.0 263.9 ± 6.9 426.4 ± 7.8 347.4 ± 6.9 9.3 x10⁻¹⁰ 1.9 x10-07 4.9 x10-08
Tannins (mg / 100g DW) 1.1 x10⁻¹² 2.6 x10⁻¹⁶ 378.1 ± 8.7 342.6 ± 6.7 411.9 ± 7.5 292.4 ± 6.7 ns* ns* 7.7 x10⁻¹³
Antioxidants (mM / 100g DW) – ABTS ns* ns* – DPPH 9.1 x10⁻¹² 2.2 x10⁻¹¹ 2.93 ± 0.01 2.81 ± 0.01 2.76 ± 0.01 2.76 ± 0.01 ns* 1.1 x10-07 ns – FRAP 4.5 x10⁻¹² 6.6 x10⁻¹⁴ 10.8 ± 0.4 8.83 ± 0.34 10.2 ± 0.4 5.31 ± 0.34 ns ns* 1.7 x10⁻¹⁰
Page 26 of 27
© The Author(s) or their Institution(s)
Botany

Draft
Table 5. Influence of altitude on observations of 17 populations of Trillium govanianum in the Indian Himalayas, using Pearson’s Correlation Coefficient (r) for each region separately and combined. ns denotes P>0.05, ns* denotes 0.05>P> α, where α=0.0013 for all regions, and 0.0009 for within regions.
All regions Tirthan Valley Munsiyari TunghnathVariable P r P r P PPopulation structure
1-leaf density (plants m-2) 2.7 x10-07 -0.17 5.9 x10-07 0.23 ns ns3-leaf density (plants m-2) ns 2.7 x10⁻¹² 0.31 ns* ns*Age ratio ns ns ns ns1-leaf frequency (% 1m2 plots) 2.4 x10-06 -0.65 ns ns ns3-leaf frequency (% 1m2 plots) ns* ns* ns* ns
Shoot morphology Shoot length (mm) ns* ns ns nsLeaf area (mm2) ns ns ns* nsFresh biomass (g) ns ns ns ns
Root morphology Root length (mm) 6.4 x10-08 0.55 ns ns nsRoot number per plant 4.1 x10-05 0.43 ns ns nsRhizome length (mm) 9.8 x10-06 0.46 ns ns nsRhizome diameter (mm) ns* ns ns nsFresh biomass (g) ns ns ns ns
Phytochemistry Phenols (mg / 100g DW) 3.8 x10-07 -0.64 ns ns nsFlavonoids (mg / 100g DW) 3.9 x10-06 0.60 ns* ns nsTannins (mg / 100g DW) ns ns ns nsAntioxidants (mM / 100g DW) – ABTS ns ns ns ns – DPPH 1.2 x10-03 -0.44 ns* ns ns – FRAP ns ns ns ns
Page 27 of 27
© The Author(s) or their Institution(s)
Botany