
Jul-Sep 2016 - Magicbricks.com
37
-
Upload
khangminh22 -
Category
Documents
-
view
1 -
download
0
Transcript of Jul-Sep 2016 - Magicbricks.com


FOREWORDMild tapering of inflation and a normal monsoon finally paved the way for lowering of REPO rate by 25 basis points, taking it to its lowest level in the last 5 years. The continued fall in both imports and exports, coupled with tepid investment demand has led RBI to pass on the cut. The Y-o-Y GDP growth rate also slowed down from 7.9% in the JFM quarter to 7.1% this quarter. The expected rise in oil prices from next year is also a major concern for the economy, which imports most of the oil it needs. High NPAs in the banking sector and construction delays in infrastructure and real estate also remain as major concerns.
However, the economy remains strong despite headwinds facing the world economy and geopolitical turmoil across Asia and Europe. The Manufacturing Purchasing Managers’ Index (PMI) is still above 52 level and GDP growth forecasts till 2020 by various multilateral agencies, remain above 7%. The lowering of Repo rate is expected to bring down both project finance as well as home loan costs, lowering the overall cost of buying a house.
The inevitable implementation of Real Estate Regulation and Development (RERA) Act, 2016 has led developers to hasten the delivery of their projects. This trend was clearly evident in the quarterly average prices data of Under Construction (UC) vs Ready-to-Move-in (RM) stock, where the premium commanded by RM properties came down due to increase in RM stock, as a portion of UC projects were delivered over the quarter.
RERA is a step in the right direction but will bear fruit only in 2-3 years, and till then the Indian real estate sector remains in turbulent waters, and its health can only be gauged through inferential means like pricing and inflation in the sector.
Price, as an end-product of interaction between the underlying demand and supply elements, incorporates all the sector related imperfections like delays and surge/dearth of transactions. Its trend also serves as a guidance to fiscal decision making by the government and RBI and investment decision making by private equity funds and retail home buyers.
Real estate in every city is heterogeneous and each locality and project can be mapped to different budget segments and geographies. Each budget segment and geography corresponds to a certain share of supply and consumer preference in the market.
Towards this end, Magicbricks presents a holistic price Index for each of the 14 major cities in India. The City Index reflects the price movement across localities, geographies and budget segments in the city. This bottom-up approach helps to identify factors affecting demand-supply dynamics of the city.
Analysis of City Indices over a 3-year period shows that Navi Mumbai had the highest gain of 18%, while New Delhi continued to face tough market with a 21% decline.
Regionally, Western India performed the best with 8.9% average gain, followed by South with 7.6% increment. North India saw an average decline of 7.4%, while Kolkata had the same average price as eleven quarters ago. It is important to note that any gains made are eroded when benchmarked against inflation in economy, in the study period.
Another important sign of our times is the 8% premium commanded by the Ready-to-Move-in (RM) properties over the Under Construction (UC) properties at a pan-India level. This ratio was at 5.1% eleven quarters ago and is a reflection of the falling consumer confidence in timely delivery of projects.
These are changing times and we would love to hear from you. Do write to us at [email protected] and share yours views on this report and how we could make PropIndex even better.
Sudhir Pai CEO, Magicbricks.com

METHODOLOGYRealistic price discovery has been the biggest problem area in the Indian real estate market. As consumers and industry struggle to arrive at a realistic benchmark pricing to assess the true value of their individual units, Magicbricks, as the largest repository of residential property listings, brings you the trusted Indian Apartment Price Index in a new and easy to use format. Mirroring the Indian Real Estate scenario, this price index presents an animated representation of the real estate market.
Magicbricks publishes the quarter-on-quarter inflation and deflation trends of the residential real estate prices in India. It collects real estate demand-supply data on a daily basis for more than 100 cities in India, of which, the fourteen top cities are selected for computing the National Property Price Index.
The National Property Price Index and its constituent indices are subjected to a series of stringent steps.
Each quarter, Magicbricks measures the individual property level price changes, which are then aggregated at the locality level. While comparing the average pricing figures for the current quarter and comparing with the previous one, quarterly price changes are calculated. These price changes are further aggregated at the city level and even further at an all-India level.
As the top receiver and aggregator of residential demand, Magicbricks’ data provides consumers with realistic benchmarks to the assess true property pricing. Where demand exceeds supply, consumers have no chance of negotiating values.
However, where demand is far lower than supply, buyers can look for more options and therefore, negotiate
pricing. If, on the other hand, you are a seller looking for benchmark pricing, you will effect the fastest sale if your asking values are close to the buyer’s paying power.
There are various co-relations of demand and the overall real estate market as well as its future potential. Not only is demand a preceding indicator to supply, it is also a fairly good indicator of actual transaction activity in the region.
We have aggregated the 14 cities covered under the report into various localities. While calculating the city level property pricing indicator, we have applied demand as weight to each locality. This weight is equal to the locality’s share of the demand being contributed to the city’s total demand. As a consequence, the locality receiving higher demand for residential units will be given a higher weightage. Following that, each city’s price movement is calculated by aggregating the price movements of individual localities, according to their individual weightages.
In terms of checks and balances towards making the data and analysis more robust and objective, we have made sure that superfluous information does not deviate the desired results. Hence, we have applied checks and balances at the locality level listing data collection and aggregation.
A statistical technique called “Inter-Quartile Range” (IQR) has been used to ensure that unintentional input deviations of house size and price figures, which may distort the actual value of the house and corrupt the analysis, are addressed. The technique aims to remove the outlier data sets, while securing the correct values.
The Interquartile Range technique works through measuring variability of each data set, while dividing the data set into quartiles. The technique measures the value of data points on the first and third quartiles of the data and calculates the difference between the two.
This range, called ‘IQR’, gives the effective extent of data set, while removing the first 25% and the last 25%. Subsequently, a test is applied to each of the values in the data set. If a particular data lies within an IQR of the first and third quartile values, then that data is considered part of the data set, otherwise not. The set of listing values of each locality are statistically cleaned.
Magicbricks, on an average, covers more than 500 localities for Tier-I cities of India. Yet for the sake of analysis, we take only those localities where the recipient demand is at least 0.05% of the city’s total demand. Only localities with at least 50 actively traded properties have been included in the analysis. Following that process, we shortlisted various localities which in some sense, impact the pricing dynamics of the city.
We then calculate the average prices of the city for the quarter, while applying demand weights to the average prices of each locality. These average prices at the city level are further aggregated to the final outcome of the ‘National Price Index’.
The difference in Under Construction and Ready-to-Move-in property has been assessed and included in the report. Rental yield and affordability too has been addressed for the top 10 localities by supply in every city. These are critical tools which well used can help with realistic price discovery.

GLOSSARY & DEFINITIONS1. City Property Index :This is a composite index which is a function of supply of properties as well as
the average capital appreciation/drop in various localities of the city in the quarter. The City Index is the weighted average of the average rate per square foot in that locality and the supply of properties from that locality. Localities with higher supply of properties will have a bigger impact on the Index.
2. Price trend basis budget segments: To better understand the city’s price trend, the localities have been divided into budget segments basis their capital value (Rs/sq ft). We have tracked the weighted average price for each budget segment for a 2+ year period from quarter ending September 2013 to quarter ending September 2016.
Subsequently, the movement of the localities in each price segment is mapped to derive respective short term and long term price change trends. The number of budget segments vary according to the city characteristics.
3. Zone wise distribution of localities: The various localities in the cities are all geographically divided into five key regions: Northern, Southern, Eastern, Western and Central. The localities are analyzed at the local zonal level to better understand the effect of the various drivers of price and demand, which are active mostly at the zonal level rather than at the city level.
4. Zone wise distribution of property budget segments: To better understand how each of the city zones contribute to the city’s supply, and how they are able to provide housing at various price points, the supply is distributed into budget segments across various geographic zones. For instance, if a zone has most of its supply in the premium budget segment, then it naturally becomes a premium destination within the city. The price changes within the various budget segments are also analyzed at the zonal level to go to the depths of the price changes across the city and to easily contribute the price changes to local factors.
5. Capital Value Tables (given in Annexures): This shows the actual range of prices within which properties are available in each locality in the quarter. Prices are shown in Rupees per square foot basis, these are the prevailing rates for properties in each locality.
6. Price trend – Top 10 localities by consumer preference: This section presents the price trend of the Top 10 localities in the city by consumer preference. These localities have the highest consumer focus and assessment of price trend in these localities assists in understanding the prevalent and future price trend in the city.
7. Price trend basis construction status: This Index looks at the movement in prices of Under Construction (UC) and Ready-to-Move-in (RM) properties across localities in the city. It is a weighted price index where weight is assigned to each locality basis its share in the consumer preference in the city.

What is the PropIndex?
The PropIndex gives you locality-wise property values in two forms – as locality price ranges for sale and rent in the annexure to every city with additional information on whether it has gone up or down in the quarter, and what is the rental yield in that locality. These prices are based on the listed prices of properties for sale or rent on the website www.magicbricks.com. This helps you to understand the average locality price ranges and to assess whether the price of the property for sale or rent that you are assessing, lies within the average price ranges in the locality. In a market where data or information is hard to come by, this data helps you to assess whether you are being quoted rational values for the property you are considering.
Why do I get locality sale and rent prices and how do I use them?
When you buy a property you must know what the average locality prices are. When you buy property directly from the developer, the price per sq ft is the value you pay. Then there are additional preferred location charges (PLC) such as vastu related, view related or floor related. When you buy from the secondary market or from an individual seller, the price is determined basis a notional value of the property. The sale values in the PropIndex help you to establish the price you should demand if you are a seller or what you should pay if you are a buyer. Rental values, similarly, are the average values that are listed on the website. They serve as benchmarks of the expected rental prices in the locality.
What is rental yield and why is it significant?
If you pay a certain price for a property, there is an amount you earn per annum as rent. When the rental income is expressed as a percentage of the property value, it is rental yield. It is a good yardstick to compute which property to select as a Buy to Let investment.
Why is it called a Property Index and not Property values?
Magicbricks has a very large number of listings. The number per locality depends on market conditions and how many consumers or brokers or developers choose to post their properties for sale or rent. When we are computing values at the locality or city levels we do not want any one locality to skew the index value of the city. As a result when any one or more localities have more than usual or less than usual number of listings, using the ratio of price to number of listings helps to even out unusual spikes or troughs in the data. This gives you unbiased city or locality averages.
How do I use an index number?
Magicbricks Index was computed first in 2011. The values in the year 2011 have been used as the base value and is assumed to be 100. When the value is below that
base number, the index is said to have fallen. When it is more than that number, the index is said to have gone up. This gives users like you, who are interested in property markets, an idea of how the property market in your city has performed vis-à-vis other cities. When the economic conditions are good and the builder is actively developing and the consumer is actively buying, the index value rises above 100. When markets are flat due to lack of economic activity and therefore developer and consumer disinterest, the index values remain at 100 or drop below that.
Very high index values shows a lot of investor activity and therefore severe peaking of property values. As an end user you should avoid buying when there is intense buying and speculative activity. That however, is a good time for you to sell as high property prices will give you good returns on your investment. When the index value comes down dramatically, the chances are that you will not get good returns as a seller. But if you find the property that you like in this cycle, it is a good time to negotiate the best values and buy as the chances are that there will be fewer buyers in the market. Since the PropIndex is now 5-years old, a look at how the index values have moved over the years gives you a good idea of how the market has performed in different quarters. If you are interested in how property markets have performed across a period of time, the PropIndex values give you a fair idea of the movement.
Do I get any specific Advice that helps my property decisions?
Magicbricks has a team of data scientists and researchers who are constantly studying the property markets and values to get the trends. In the past two quarters, for instance, they have noticed that ready-to-move-in property has been significantly more expensive than under construction property. This probably indicates that consumers do not want to buy property that is not complete and has chances of delayed delivery and prefer to spend more to buy property that they can purchase and move into. This is useful to you as a buyer and alerts you to general trends of other buyers.
What is the editorial and how is it useful to me?
The editorial team of Magicbricks constantly assesses the property market developments and factors such as infrastructure announcements and transport corridor development, to figure out how they can impact values of residential real estate in your city. In each edition of PropIndex they assess what all has happened in the quarter and how it will impact the value of the property that you are interested in. This analysis gives you an idea of the issues you should consider when buying property in that city.
How do I use the different sections of the PropIndex?
The key takeaways are useful in getting an overview of the property market in your city. The geographical distribution of localities allows you to assess in which areas property is available for sale. The distribution of properties by capital value allows you to freeze the price segment where you are likely to get the type of property you are looking for. The budget wise price change helps to compute how the price range that you are looking for has been performing. If values have been rising in your budget of interest you may have to hurry up with your property decision if you are an end user. If it has dropped, figure out if there is a problem in that category. This exercise has been done for each part of the city. The price trend by construction basis tells you which the best stage is at which you should enter the property market. The price changes basis construction status takes this analysis a step forward. Read it carefully and you will be able to assess exactly when you should enter the market as a buyer and as an investor.
What is the Corridor of Growth?
Magicbricks has figured that the bulk of new property in any city is developed along a few transport corridors leading out of the city. These have been identified and studied for stock, price rise, current status, future potential and its physical and social infrastructure such as water, power, sewerage and drainage facilities, transport links, schools, colleges, hospitals and entertainment centres in the vicinity. Advice has been given on the basis of rental and buyer’s demand, the best configurations to buy – 2, 3 and 4BHK, past and future estimated price trends and also how it figures in the master plan of the city. News updates of each corridor allows you to understand the drivers of those corridors.
HOW TO USE THE PROPINDEX
Jayashree Kurup, Head content

In line with general lack of activity in the residential market, the National Property Index remained stagnant at the same level
as in the last quarter, with prices falling by a marginal 0.12%. This is in continuation of the inactivity seen in the last many quarters.
NPI is the weighted average of consumer preference share of 14 cities and their individual City Index value.
On a quarterly level, South was the only region which inched up substantially in terms of prices from the last quarter while North fell the most. Although it cannot be said with certainty that prices have hit rock bottom and will not fall any further, any downward movement, going forward, will be restricted.
On a three year scale, Western India has done better than all other regions, with its cities having 8.9% price increment, on an average.
The worst performer was the North region, where prices fell by more than 7% in the last three years. The second best gains were witnessed in Southern India, where prices moved up by 7.6% over the same period.
In terms of historical price change, Navi Mumbai was the best performer with a significant 18% increment over the last three years, followed by Hyderabad and Pune, which had a 10% gain each. Thane stood fourth with a 9% gain, while Bengaluru and Ahmedabad had a 7% gain each. Next were Mumbai and Chennai with a 5% gain each.
Gains of lower than 5% were witnessed only in the North and Eastern regions, with Noida and Greater Noida showing the maximum gain in Delhi-NCR of just 4% each. Both, Gurgaon from Delhi-NCR and Kolkata from the Eastern region, had the same price in the Jul-Sep
2016 quarter, as three years ago. Only two of the top 14 cities considered for PropIndex saw a price decline in the last three years and both belonged to Delhi-NCR. While prices in Ghaziabad fell by 6%, New Delhi performed the worst, with a whopping 21% fall in prices.
In terms of quarterly change, Hyderabad performed the best with a 2.8% increase over the last quarter, followed by Bengaluru at 2.0% and Navi Mumbai at 1.2%. Overall, the Southern region was the best performer, with Chennai also giving a 0.7% price increment and standing fourth in the top 14 cities.
In terms of worst performers, four cities saw price drop, with the highest drop in Greater Noida of 1.7%, followed by Noida witnessing a drop of 1.2%. Mumbai and New Delhi were the other two cities noting a price drop, amounting to 0.8% and 0.7%, respectively.
VOL 6, ISSUE 2; JUL-SEP, FY 2016-17 propindex.magicbricks.com
[Jul-Sep 2016]

[Buyers looking for an exit]
The realty sector in India has been tepid for the past few years with low transaction volumes and stagnant price level. Weak
economic scenario, perceived high price level and lack of consumer confidence in the developers with respect to project completion led to transaction volumes reducing drastically.
Magicbricks research shows that consumers are willing to pay more for Ready-to-Move-in (RM) options as compared to under-construction (UC) properties. They’re willing to pay a premium on completed projects rather than expose themselves to delivery risk. Project delay leads to consumers having to bear additional financial burden of paying rent over and above applicable home loan instalments for an extended period. All this has made consumers wary of putting money in Under-Construction projects.
This is reflected in the price differential between Under Construction (UC) and Ready-to-Move-in (RM) properties. Magicbricks tracks the weighted average price for UC and RM properties on a pan-India basis covering 14 cities. It compares the 3 year trend from Sep 2013 to Sep 2016 where Sept 2013 has been taken as the base. It also shows the premium (discount) of RM properties over UC properties.
Our national level index for tracking prices of RM and UC properties shows that at a pan India level, RM properties command an average 8% premium over UC properties. This level of premium for RM properties has held for the last three quarters.
Analysis of actively traded properties on Magicbricks shows that when it comes to RM properties, an overwhelming number of options are in the resale segment. At a pan-
India level, 69% of RM properties are in the resale bracket while balance 31% are offers of fresh booking or ‘New Properties’. The graph gives the share of resale and new properties for each of the 14 cities analysed.
The predominance of resale options under RM properties category indicates that many buyers who had made purchase from an investment perspective are looking to exit their investment. With end-users looking for RM options to protect themselves from project completion risk, it is likely that many investors with RM properties see this as the best opportunity to liquidate their asset(s).
Most of the investors looking to exit at this point are unlikely to make any gains. In many cases, when the return is indexed to inflation, the return might actually be negative. This is because the prices have either been stagnant or have seen insignificant increment over the last few years. The following graph shows percentage change in the City Price Index for 14 cities from Sep 2013 to Sep 2016.
As is evident from the graph, the weighted average price across most cities has seen marginal increment over the last three years. In case of cities like Delhi and Ghaziabad, the price levels have declined. In all other cases, when the price increment is indexed to inflation, there is an implicit price decline.
Regional wise analysis of the ratio of ‘New’ and ‘Resale’ options under RM segment shows that
propindex.magicbricks.com VOL6, ISSUE 2; JUL-SEP, FY 2016-1702

markets which historically had high investor to end-user ratio have corresponding higher percentage of ‘Resale’ options in this segment.
Major North Indian markets like Gurgaon and Noida, which have seen large scale residential development, have 80% or higher ‘resale’ options in the RM segment. Similarly, all Western Indian cities have a high share of such options in the RM category. Opposite phenomenon was seen in case of all South Indian cities – Bengaluru, Chennai and Hyderabad. These markets have had high end-user participation and this reflects in the ratio of ‘New’ and ‘Resale’ options. Both these options have almost equal share in the RM segment in these cities.
These statistics also indicate that supply in markets with high ‘resale’ versus ‘new’ options in the RM category was in excess to demand at the given price points.
Market ImpactPresence of a large number of resale options puts pressure on the market in multiple ways:
l First, these resale options add to the unsold inventory available with developers, thereby exacerbating an already difficult scenario
l Large number of resale options in Ready-to-Move-in projects take the demand away
from Under-Construction projects. One set of inventory is getting sold multiple times while another set with the developers remains unsold. This is adding to delay in completion of projects as developers are not keen to complete projects where unsold inventory is on a higher side
l In the prevailing market scenario, large resale inventory also impacts the price level in a project as well as overall market. Price quote in the resale market is lower than the builder’s price and this impacts saleability of the unsold inventory with the developer. Further, the developer cannot increase the price and out-price his inventory vis-à-vis resale options
l New project launches also have to be sensitive to the prevailing price in the resale segment in their price segment
ConclusionIdeally, transaction activity in the resale segment gives depth to the primary segment. It allows investors to book profit and unlock their capital. However, in the present scenario where transaction activity is low and consumers are looking for Ready-to-Move-in options, the resale segment is likely to do better than the primary market and continue to put pressure on the primary market.
Given the large percentage of resale properties available in the market, this situation is likely to persist in short to medium term.
VOL6, ISSUE 2; JUL-SEP, FY 2016-17 propindex.magicbricks.com03

HYDERABAD propindex.magicbricks.com VOL6, ISSUE 2; JUL-SEP, FY 2016-1704
[PROPINDEX - HYDERABAD][Key Takeaways]
Hyderabad maintains its positive vibe
The quarter started on a good note. The advent of technology giants namely Google and Apple into Hyderabad’s real
estate has increased expectations. Demand for commercial office space is now being expected to remain strong with a probable upward momentum in 2016-17 boosting the number of leasing transactions.
Hyderabad is expected to see addition of nearly 16 million sq ft of new office supply over the next three years, mostly in the suburban and peripheral locations. The projected takers are IT majors, followed by the banking/financial services, pharmaceuticals and outsourcing sectors. Emerging sectors include e-commerce and bio-technology. The development of office realty leads to residential development. With increasing job opportunities, people
will migrate from other parts of the state and country to reside in areas housing these conglomerates, thus boosting the segment.
Similarly, the ‘Global Business City’ tag is expected to trigger property prices in the coming months. The expectation was flagged off when Tim Cook, chief executive officer of Apple Inc visited the city. MNCs such as Google, Amazon, Synchrony Financial, etc also intend to set-up or expand their business which in turn will further add impetus to the price rise.
August also donned a positive outlook. MAUD minister, KT Rama Rao mentioned that 13 growth corridors along the 158-km long ORR will aid in the overall real estate development. Industry and technology special zones and developed social infrastructure would be a
permanent characteristic along each corridor which will lure buyers and investors from within city limits as well as outside.
The state government’s plan to take up a 290-km RRR project, a few kilometres from the existing ORR would decongest the city and connect all areas to the city core.
In a bid to boost revenue, the GHMC is planning to take up re-assessment of various residential buildings and trade licence applications. Government buildings will also fall under its radar. The body will target official buildings (state and centre) to collect tax which has been estimated to the tune of Rs 180 crore.
If this streak continues, Hyderabad will witness a consecutive good performing quarter this year as well.
Magicbricks Bureau
EDITORIAL
The City Index saw an increase of 3% from the Apr-Jun 2016 quarter. The Jul-Sep 2016 quarter had more localities with price increment than price decrease
At least 69% localities saw an average price increase of 3.4%, pushing up the Apr-Jun 2016 Index value by slightly more than 3%. The balance 31% localities saw price drop of 3.6%, pushing down the Apr-Jun 2016 Index marginally
Price movement across all the budget segments have been positive in Hyderabad. The price increment varies from low of 0% in the below Rs 3,000 per sq ft budget segment to high of 5% in the above Rs 6,000 per sq ft budget segment
Higher the budget, higher has been the increment in the Jul-Sep 2016 quarter and this increases as we go from less than Rs 3,000 per sq ft to over Rs 6,000 per sq ft
On an average, prices in the West zone, which accounts for substantial share of consumer preference and supply in the secondary market, saw 2.5% increment. Important high consumer preference localities in this zone like Manikonda, Gachibowli and Kondapur had positive movement
Localities in the East zone had a subdued quarter with negligible overall price increase. Important locality like Sainikpuri witnessed a marginal increment
Localities in the Central zone had an average increment of 1% while those in the North zone rose by 1.2%
Analysis across 26 localities shows that average price of RM properties was marginally more than the average price of UC properties. This represents the reverse of price trend over the last five quarters where UC properties were more expensive than RM properties
The average difference in prices between UC and RM properties has decreased by almost 400 basis points between Apr-Jun 2015 to Jul-Sep 2016. While the weighted average price of RM properties was Rs 3,668 per sq ft that of UC properties was Rs 3,642 per sq ft

VOL6, ISSUE 2; JUL-SEP, FY 2016-17 propindex.magicbricks.com HYDERABAD05
Properties distribution by capital value (Rs/sq ft)Apr-Jun 2016 to Jul-Sep 2016
The graph shows the distribution of actively traded properties by their capital values. It shows that entry level budget segments are dominant
The lower budget segment of below Rs 3,000-4,000 per sq ft cumulatively accounts for 52% share of supply in the secondary market. It also constitutes more than 70% of consumer preference
This makes Hyderabad the most price conservative market amongst the major cities of South India
The mid budget segment (Rs 4,000-5,000 per sq ft) is the second largest budget segment by supply but its share of consumer preference is less than 20%. The higher budget segment beyond this has only 21% share of supply
The market movement is governed by price and transaction dynamics in the lower budget segments
The map shows the geographical spread of localities considered for calculating the City Price Index. These localities have been grouped together to understand the zone wise price trend in the city
Hyderabad has grown primarily in the western direction. The establishment of IT/ITeS office space clusters in this zone served both as a catalyst and a demand driver. This zone has seen tremendous residential development as well as organized retail and hospitality projects
Madhapur and Hitec City were the initial centres of development. Gachibowli and its surrounding localities evolved later as larger commercial and residential hubs
Localities to the North, North-West and South-West of the Madhapur-Gachibowli belt have also seen large scale residential development
Overall, the West zone accounts for more than 50% share of consumer preference in the city
Geographical distribution of localitiesWestern Hyderabad dominates the development landscape

HYDERABAD propindex.magicbricks.com VOL6, ISSUE 2; JUL-SEP, FY 2016-1706
The City Index for Hyderabad reflects price movement across 26 prominent localities. These localities have been chosen using the twin criterion of share in the overall consumer preference in Hyderabad as well as share of actively traded properties. The weight assigned
to each locality is its share of consumer preference in the city. This makes for a comprehensive Index which covers localities with high consumer preference as well as high number of actively traded properties in the secondary market
The City Index saw a rise from Apr-Jun 2016 quarter. The Jul-Sep 2016 quarter had more localities with price increment than decline. At least 69% localities saw an average price increase of 3.4%, pushing up the Apr-Jun 2016 Index by slightly more than 3%. The balance 31% localities saw price drop of 3.6%, pushing down the Apr-Jun 2016 Index marginally leading to the City Index witnessing 3% increase in the Jul-Sep 2016 quarter
Geographical spread of the budget segments show that except in the lowest and highest segments, the West zone accounts for most of the actively traded properties in the secondary market
North Hyderabad has bulk of properties in the below Rs 3,000 per sq ft budget while the Central zone dominates in the top price bracket
Analysis of budget-wise distribution of properties within a zone shows that properties in the West zone are predominantly in the Rs 4,000-5,000 per sq ft budget segment (64%) while the Rs 3,000-4,000 per sq ft segment comes second with 36% share
In the North zone, having high consumer preference localities like Kukatpally, the lower budget segments of below Rs 3,000 per sq ft and the Rs 3,000-4,000 per sq ft price brackets form the dominant supply
[CITY INDEX]Jul-Sep 2013 to Jul-Sep 2016

VOL6, ISSUE 2; JUL-SEP, FY 2016-17 propindex.magicbricks.com HYDERABAD07
Budget wise price changeApr-Jun 2016 to Jul-Sep 2016
Price movement across all the budget segments have been positive. The price rise varies from low of 0% in the below Rs 3,000 per sq ft segment to high of 5% in the above Rs 6,000 per sq ft budget. This shows that the Jul-Sep 2016 quarter was eventful for Hyderabad
Higher the budget, higher has been the increment in the quarter and increases as we go from below Rs 3,000 per sq ft to over Rs 6,000 per sq ft
Price movement across zones:
East East zone is home to options in the
lowest budget segment of below Rs 3,000 per sq ft. Average price increment in this budget segment in the zone was minimal but positive
Sainikpuri and Uppal are the two major localities in this zone. While Sainikpuri witnessed price increment, Uppal saw a decline in prices
North In the lowest budget segment of below
Rs 3,000 per sq ft, North Hyderabad saw a marginal decline as against the city average price increment in this segment
Other budget segments in the zone saw price increment in line with overall market trend. In the Rs 3,000-4,000 per sq ft segment, high demand localities like Miyapur saw a 1.6% price increment
The highest price increase of 5% was in the Rs 5,000-6,000 per sq ft bracket. This was higher than the city average price increase in this bracket. Kukatpally Housing Board Colony in this budget segment is the major locality and saw a price increment of 5%
West All the budget segments in this zone,
which account for most of consumer demand in the city, saw price gain
Geographic and budget wise price changeApr-Jun 2016 to Jul-Sep 2016

HYDERABAD propindex.magicbricks.com VOL6, ISSUE 2; JUL-SEP, FY 2016-1708
High demand localities like Manikonda and Nallagandla in the Rs 3,000-4,000 per sq ft bracket saw about 5% and 4% price increment, respectively
Gachibowli, one of the two IT/ITeS hubs of the city and also home to residential development in the premium segment, witnessed price increase of 4.2%
Kondapur, another high consumer preference locality in the Rs 4,000-5,000 per sq ft segment and situated across the old-Mumbai Highway from Gachibowli, also witnessed 3.1% increment in prices
Centre Except the Rs 3,000-4,000 per sq ft price
bracket which saw a decline, price trend in the segments of the Central zone mirrored the market level price trend
The highest price rise was in the premium over Rs 6,000 per sq ft bracket where Banjara Hills saw a rise of 5%
Price change – Top localities by consumer preferenceApr-Jun 2016 to Jul-Sep 2016
Price trend basis construction statusJul-Sep 2013 to Jul-Sep 2016
VOL6, ISSUE 2; JUL-SEP, FY 2016-17 propindex.magicbricks.com HYDERABAD09
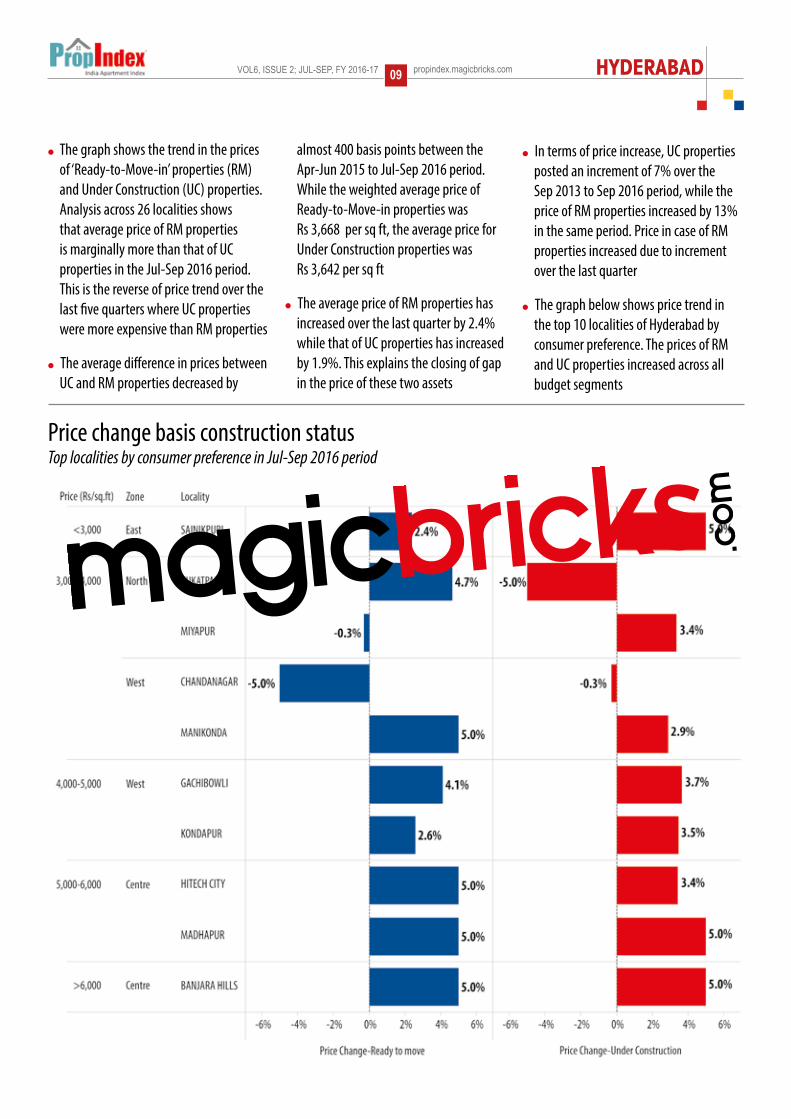
Price change basis construction status Top localities by consumer preference in Jul-Sep 2016 period
The graph shows the trend in the prices of ‘Ready-to-Move-in’ properties (RM) and Under Construction (UC) properties. Analysis across 26 localities shows that average price of RM properties is marginally more than that of UC properties in the Jul-Sep 2016 period. This is the reverse of price trend over the last five quarters where UC properties were more expensive than RM properties
The average difference in prices between UC and RM properties decreased by
almost 400 basis points between the Apr-Jun 2015 to Jul-Sep 2016 period. While the weighted average price of Ready-to-Move-in properties was Rs 3,668 per sq ft, the average price for Under Construction properties was Rs 3,642 per sq ft
The average price of RM properties has increased over the last quarter by 2.4% while that of UC properties has increased by 1.9%. This explains the closing of gap in the price of these two assets
In terms of price increase, UC properties posted an increment of 7% over the Sep 2013 to Sep 2016 period, while the price of RM properties increased by 13% in the same period. Price in case of RM properties increased due to increment over the last quarter
The graph below shows price trend in the top 10 localities of Hyderabad by consumer preference. The prices of RM and UC properties increased across all budget segments

HYDERABAD propindex.magicbricks.com VOL6, ISSUE 2; JUL-SEP, FY 2016-1710
Capital values
Ameerpet 3437-5232 10000-16000 3.7%Banjara Hills 5229-8448 12000-21000 3.00%Begumpet 3415-5856 10000-16000 3.6%Chandanagar 2706-4222 9000-14000 4.4%Gachibowli 3039-5162 10000-17000 4.00%Hafeezpet 2988-4296 9000-14000 3.8%Himayath Nagar 4020-6733 11000-17000 4.3%Hitech City 4141-6254 11000-18000 3.6%Jubilee Hills 4726-6885 12000-21000 3.7%Kondapur 3289-5060 11000-17000 4.00%Kukatpally 2682-4596 11000-17000 4.7%Madhapur 4109-6249 12000-21000 3.9%Madinaguda 2907-4116 9000-13000 3.9%Manikonda 2388-3976 9000-14000 4.4%Miyapur 2086-3552 8000-13000 4.6%Nallagandla 3377-5240 9000-16000 3.6%Sainikpuri 2203-3269 7000-10000 3.7%Secunderabad 2367-4198 6000-10000 2.8%
LOCALITY CAPITAL RENTAL YIELD


Corridor Description and RatingAreas Included: Narsinghi, Manikonda, Financial District, Gacchibowli, Nallagandla, Tellapur, Kokapet, Appa junction, Alkapur Township, Puppalaguda
Fig 1: Map of the corridor
G A C H I B O W L I

Introduction: The Gachibowli Corridor is the most significant development zone of Hyderabad as it accounts for most of the development in the IT/ITES office space and residential segment. It is also home to leading educational institutes like the Indian School of Business (ISB), Indian Institute of Information Technology (IIIT) and the Maulana Azad National Urdu University. The campus of the University of Hyderabad is also situated nearby. The corridor is spread across a large geographical area. Considering Gachibowli as the center of the corridor, it is spread across a radius of approximately 10-km towards north-west and south of Gachibowli.
Development Pattern: The core area of the corridor is Gachibowli and adjoining Nanakramguda which constitutes one of the two major IT/ITES office clusters in the city. Apart from the IT/ITES office buildings, it also has many large captive campuses of leading MNCs in the IT/ITES and other domains. The area has considerable residential development which caters to requirement of staying close to workplaces. It is well connected to other parts of Hyderabad through public transport. A branch of the Outer Ring Road (ORR) extends towards Gachibowli and connects to the international airport at Shamshabad and other localities off the ORR.
From this core area, the development has radiated outwards in two major directions. This is because land availability in the core area is limited
and expensive. Larger and cheaper land parcels are available in areas to the north-west and south and consequently, development shifted to these areas. Cheaper land price also translates into relatively less expensive residential units for buyers.
One direction of development is towards the north-west along the Old Mumbai Highway with Nallagandla and Tellapur being the center of development. Emergence of IT/ITES development in Gachibowli led to demand for residential options and associated support retail facilities. This demand was captured by the Chandanagar–Lingampally area, an established residential hub which grew further. Development from this zone subsequently spilled over to Nallagandla and then to Tellapur which offered scope for development of larger residential projects due to availability of large land parcels.
Development here is primarily along existing roads in the zone like the Kanchi-Gachibowli Road, Nallagandla-Tellapur Road and Tellapur Road (from Tellapur towards Gachibowli). Apartments, residential plots and villa projects are available in this zone.
Second growth axis is towards the southward direction. This covers localities like Manikonda, Narsingi and Kokapet and extends up to Appa Junction. While Manikonda is located to the east of Gachibowli-Nanakramguda, Kokapet and Narsingi are towards the south.
Residential development in Manikonda consists mainly of low rise
independent houses. New multi-storey apartment projects and gated colonies have come up along the road from Nanakramguda Junction to Khothaguda Cross Road.
Kokapet is situated to the west of the ORR which separates it from Nanakramguda in the north and Narsingi in the east. The main access at present to this zone from ORR is at Narsingi Junction. Most of the residential projects in the zone are located on the Gandipet Road and Golden Mile Road where the Gandipet Road is the main access road from the zone to the ORR.
Narsingi is located to the east of Kokapet and ORR. The northern part of this zone is contiguous with Manikonda. The new development in the zone is towards north and along the Langar House Road which runs in the east-west direction and connects the zone to the ORR.
Both these zones have a mix of apartments and villa projects along with plotted residential development.
Master Plan: While all the zones in the corridor follow development control regulations as per the Hyderabad Metropolitan Development Authority (HMDA) guidelines, some part falls under the Greater Hyderabad Municipal Corporation (GHMC) while other areas are outside the same.
Gachibowli-Nanakramguda, Manikonda, Nallagandla and Tellapur fall under the GHMC limits. Most of the land in these zones is under the R1 Residential Zone of the HMDA Master Plan. This is the most flexible
Corridor of growth (COG)13
About the Corridor
Properties available in the corridor
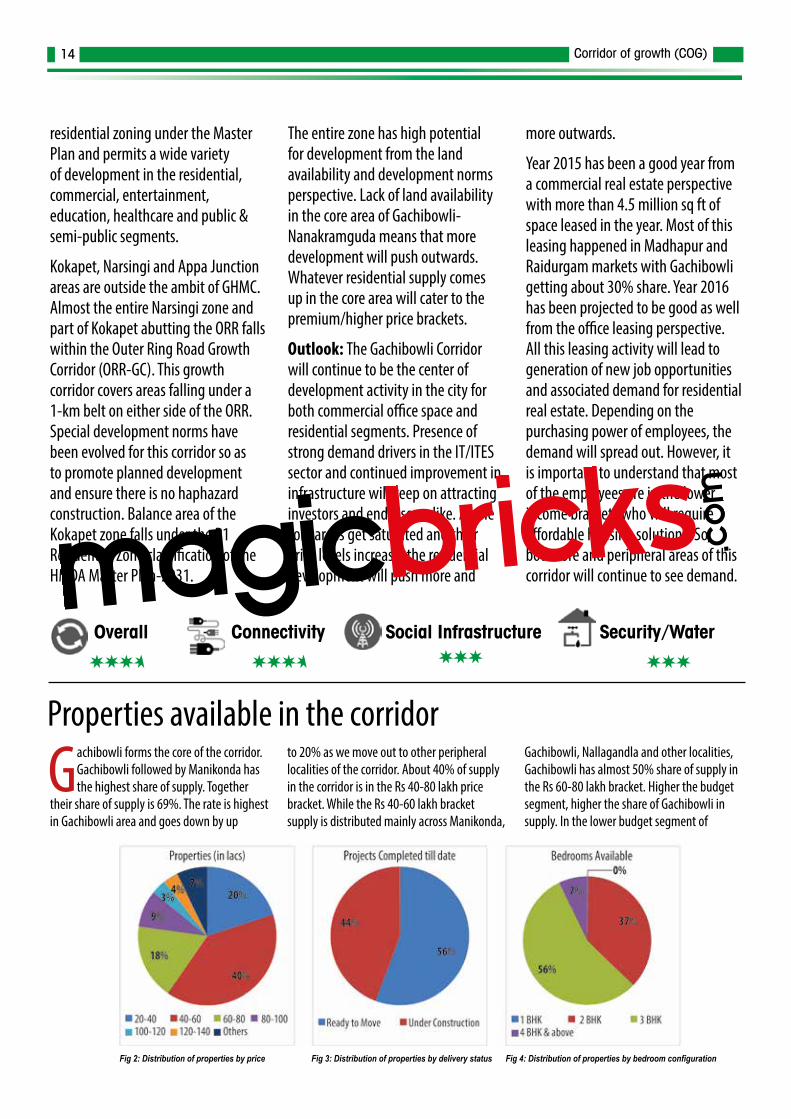
Gachibowli forms the core of the corridor. Gachibowli followed by Manikonda has the highest share of supply. Together
their share of supply is 69%. The rate is highest in Gachibowli area and goes down by up
to 20% as we move out to other peripheral localities of the corridor. About 40% of supply in the corridor is in the Rs 40-80 lakh price bracket. While the Rs 40-60 lakh bracket supply is distributed mainly across Manikonda,
Gachibowli, Nallagandla and other localities, Gachibowli has almost 50% share of supply in the Rs 60-80 lakh bracket. Higher the budget segment, higher the share of Gachibowli in supply. In the lower budget segment of
Overall Connectivity Social Infrastructure Security/Water
Fig 2: Distribution of properties by price Fig 3: Distribution of properties by delivery status Fig 4: Distribution of properties by bedroom configuration
residential zoning under the Master Plan and permits a wide variety of development in the residential, commercial, entertainment, education, healthcare and public & semi-public segments.
Kokapet, Narsingi and Appa Junction areas are outside the ambit of GHMC. Almost the entire Narsingi zone and part of Kokapet abutting the ORR falls within the Outer Ring Road Growth Corridor (ORR-GC). This growth corridor covers areas falling under a 1-km belt on either side of the ORR. Special development norms have been evolved for this corridor so as to promote planned development and ensure there is no haphazard construction. Balance area of the Kokapet zone falls under the R1 Residential Zone classification of the HMDA Master Plan-2031.
The entire zone has high potential for development from the land availability and development norms perspective. Lack of land availability in the core area of Gachibowli-Nanakramguda means that more development will push outwards. Whatever residential supply comes up in the core area will cater to the premium/higher price brackets.
Outlook: The Gachibowli Corridor will continue to be the center of development activity in the city for both commercial office space and residential segments. Presence of strong demand drivers in the IT/ITES sector and continued improvement in infrastructure will keep on attracting investors and end-users alike. As the core areas get saturated and their price levels increase, the residential development will push more and
more outwards.
Year 2015 has been a good year from a commercial real estate perspective with more than 4.5 million sq ft of space leased in the year. Most of this leasing happened in Madhapur and Raidurgam markets with Gachibowli getting about 30% share. Year 2016 has been projected to be good as well from the office leasing perspective. All this leasing activity will lead to generation of new job opportunities and associated demand for residential real estate. Depending on the purchasing power of employees, the demand will spread out. However, it is important to understand that most of the employees are in the lower income brackets who will require affordable housing solutions. So, both core and peripheral areas of this corridor will continue to see demand.
Corridor of growth (COG)14

Corridor of growth (COG)15
Rental demand is overwhelmingly concentrated in Gachibowli and Manikonda because these are closest
to IT/ITES office space clusters. These office clusters are located not only in Gachibowli but
in other localities towards east. The area also has well developed support infrastructure. Rental demand in Nallagandla is more linked to its proximity to Serilingampally and Chandanagar areas. Other localities are
situated at some distance from office space hubs and lack a demand driver which can create rental demand. Support infrastructure in these localities is also yet to evolve completely.
Rs 20-40 lakh, Manikonda has most of the supply followed by Nallagandla. Most localities in the corridor offer maximum options in the Rs 20-60 lakh price bracket.
The 3BHK is the dominant format across almost all localities in the corridor. About 34% of these are available in the Rs 40-60 lakh budget; Rs 60 lakh-Rs 1crore accounts
for further 42% share of the 3BHK supply. Similarly, 54% of the 2BHK options are available in the Rs 40-60 lakh segment. About 38% of the 2BHK options are in the Rs 20-40 lakh price bracket. The corridor is witnessing considerable development activity and options are equally available in under-construction and ready-to-move-in projects.
Sales Price Covered Area ( Lacs) (Sq.ft)
1 BHK 15-30 500-700
2 BHK 25-65 1000-1400
3 BHK 35-170 1350-3000
4 BHK and Above 68-250 2500-4200
Best sectors to invest in a home Based on rental demand in sectors
Table 1: Sizes and prices of flats available for various room configurations
Based on home buying demand in sectors
Fig 5: Top 10 localities by consumer for renting a house
Fig 6: Top 10 localities by consumer for buying a house
Best bedroom configurations to buy Preferred buying and renting options
Buying Renting Total (BHKs) Total (BHKs)
1 BHK 0% 2%
2 BHK 37% 33%
3 BHK 56% 58%
4 BHK and Above 7% 7%
Table 2: Demand distribution for buying and renting
Gachibowli and Manikonda have a major share (61%) of demand in the corridor. The reason for high demand is the same
as that for rental demand – proximity to work place and presence of support infrastructure.
Gachibowli has the highest share inspite of being the most expensive locality in the corridor. This shows that consumers put high emphasis on the habitability aspect. Demand for Appa Junction is a spill-over from localities
towards the east Chevella Road. Other localities lack support infrastructure and are situated at some distance from office space hubs.
Consumers prefer the 3BHK format in the corridor. About 38% consumers are looking for the 3BHK format in the Rs
40-60 lakh bracket followed by 28% demand in the Rs 60-80 lakh budget segment.
The 2BHK format is the second most preferred with bulk (54%) of the demand in the
Rs 40-60 lakh segment. The overlapping demand for 2 and 3BHK units in the same budget segment is because consumers are willing to opt for smaller sized apartments (2BHK) at a higher price to stay in their preferred locality (Gachibowli).
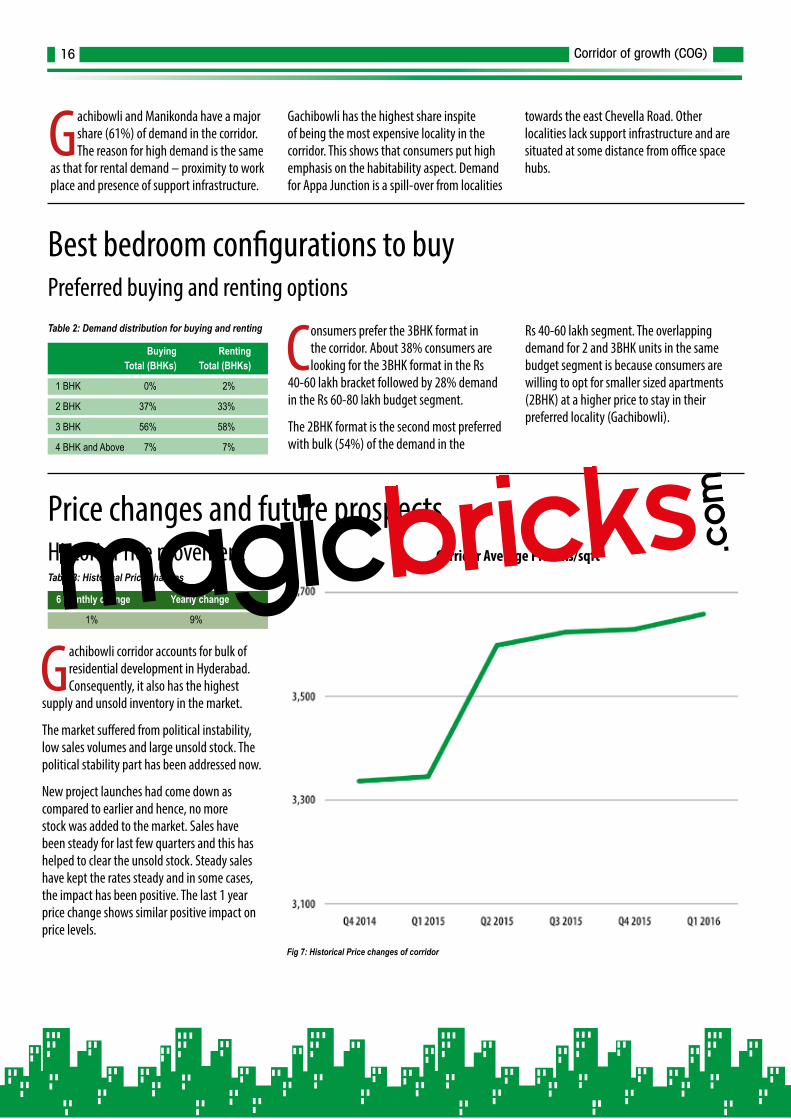
Price changes and future prospects Historic Price movement Table 3: Historical Price changes
Gachibowli corridor accounts for bulk of residential development in Hyderabad. Consequently, it also has the highest
supply and unsold inventory in the market.
The market suffered from political instability, low sales volumes and large unsold stock. The political stability part has been addressed now.
New project launches had come down as compared to earlier and hence, no more stock was added to the market. Sales have been steady for last few quarters and this has helped to clear the unsold stock. Steady sales have kept the rates steady and in some cases, the impact has been positive. The last 1 year price change shows similar positive impact on price levels.
Fig 7: Historical Price changes of corridor
6 monthly change Yearly change
1% 9%
Corridor Average Price Rs/sqft
Corridor of growth (COG)16

Price movement for top localities by Consumer Preference
The price movement in the top localities by consumer preference shows the slight shift in price level basis improved market conditions. While the percentage price change over the quarter
is higher than average price change, the positive trend is in-line with market scenario over last one year.
Gachibowli and Manikonda account for most of development activity as well as consumer demand within the corridor. And they offer mix of ready-to-move and under construction properties. Any positive change in the corridor will be reflected first in these markets. Except for Nallagandla, price change in other localities is continuation of positive trend over last few quarters.
Fig 8: Price changes in top localities by consumer demand
Master Plan
Gachibowli-Nanakramguda, Manikonda, Nallagandla and Tellapur fall under the Greater Hyderabad
Municipal Corporation (GHMC) limits while Kokapet, Narsingi and Appa Junction areas are outside the ambit of GHMC. Most of the land in the localities under GHMC
falls under the R1 Residential Zone of the HMDA Master Plan. This is the most flexible residential zoning under the Master Plan which permits a wide variety of development. Narsingi and part of Kokapet, abutting the ORR, falls within the Outer Ring Road Growth Corridor (ORR-GC). This
covers areas falling under a 1-km belt on either side of the ORR and come with special development guidelines.
The entire zone has high potential for development from the land availability and development norms perspective.
Fig 9: Land use of various localities in the corridor
RESIDENTIAL
COMMERCIAL
PUBLIC AND SEMI-PUBLIC
MANUFACTURING
MULTIPLE USE ZONE
SPECIAL DEVELOPMENT ZONE
OPEN SPACES BUFFER
(around water bodies)
FOREST ZONE
BIO CONSERVATION ZONE
Corridor of growth (COG)17

Gachibowli is witnessing more home buyers
Gachibowli has good connectivity to the other parts of Hyderabad. It is one destination in the city that is located on the developed suburbs of Rangareddy district. It lies in the North-West of Hyderabad and is a software hub due to the presence of large IT giants. It is only 5-km from Hitec City, one of the major IT hubs in Hyderabad. The social infrastructure has grown immensely over the years. As Hitec city is nearby, people prefer this location for residence. Several places of interests are easily available such as shopping malls, schools, hospitals, grocery stores, restaurants and many ATMs. There is demand for builder floor apartments as well in the locality but property buyers prefer multi-storey apartments due to space and luxurious facilities.
n Source: The Times of India
Gachibowli offers a plethora of housing options
Gachibowli is a major software hub in Hyderabad, second only to Hi Tech city in terms of real estate development driven by growth in the IT and ITeS industry. It houses some of the big names in the software and BPO industry such as Google, Amazon, Infosys and Dupont. Apart from IT giants, large names in the banking and financial services sector such as ICICI, United Bank of Switzerland, Franklin Templeton Investments, have their offices in Gachibowli. Most of the apartments available in Gachibowli are in 2BHK, 3BHK and 4BHK format. One can easily find both ready-to-move-in and under construction properties available here.
n Source: The Times of India
Gachibowli’s lifestyle quotient wins hearts
The location of the house plays a significant role while making the best property choice. The right property location can define the kind of lifestyle and routine an individual may have. A few years back, the factors considered to choose a house were the basic amenities around like the markets, schools and hospitals. However, with the changing times, the lifestyle of a buyer and the innovation of a builder have brought in some more factors. Gachibowli has become a preferred destination for most of the commercial outlets as well.
n Source: The Times of India
Why Tellapur is a good investment hub
Tellapur is in the development stage and is fast gaining importance in Hyderabad’s real estate as several gated communities are underway in the area. There are many upcoming projects developing in the region. Located in Medak district, its proximity to the IT hub and business districts makes the area a good investment option. The area offers mid range and high end housing options. The area mostly houses people from the IT sector, BHEL, professionals working in Patencheru and Financial District, colleges and international schools.
n Source: The Times of India
IN NEWS
Infrastructure UpdatesHyderabad Metro: Corridor-3 (Nagole-Shilparamam) of Phase-1 of the Hyderabad Metro will terminate at Hitec City. It is
expected that this line will be extended to cover Gachibowli as well. However, the timeline for its implementation is not clear
at present. The connectivity will help the residence of the corridor and reduce the travel time and traffic congestion.
Corridor of growth (COG)18

Corridor Description and RatingAreas Included: Miyapur, Chandanagar, Nizampet and Bachupally
Fig 1: Map of the corridor
M I YA P U R

Introduction
The Miyapur Corridor represents the north-westward expansion of Hyderabad along and off the National Highway-9 (NH-9) which is more popularly known as the Mumbai Highway. It consists of mixed-use and residential localities like Miyapur, Chandanagar, Bachupally and Nizampet. While Chandanagar and Miyapur are located along NH-9, Nizampet is situated at some depth from it while Bachupally is farthest out and beyond Nizampet. Chandanagar, Miyapur and Nizampet are established residential cum commercial areas while Bachupally is an upcoming destination.
The corridor has evolved as the development pushed outwards from the core IT/ITeS offices and residential hubs of Madhapur and Gachibowli. The first phase of this outward shift was towards Kukatpally/Kukatpally Housing Board and Hafeezpet. Spill-over demand from these areas for less expensive residential options (purchase as well as rental) was captured by development in the Miyapur Corridor. The capital value drops as distance from the IT/ITeS corridor increases in the north/north-west direction.
Apart from the IT/ITeS sector, the corridor also benefits from the presence of government and private sector manufacturing units. Bharat Heavy Electrical Limited (BHEL), a leading Public Sector Undertaking (PSU) is located west of Chandanagar. There is a large industrial area located in the north-west of the corridor known as the Industrial Development Area Bollaram (IDA Bollaram). It extends from Bollaram Road up to Outer Ring Road (ORR). Dr Reddy’s Laboratories has a manufacturing unit in this zone. Coca Cola India also has a bottling plant off the same road.
In case of Bachupally, demand drivers exist towards the north of the locality as well. There are pharmaceutical manufacturing units across the Jawaharlal Nehru Outer Ring Road as well as IT establishments within a 6-7 km radius.
This corridor is part of the overall growth corridor of the city as it expands north-westwards from multiple nodes.
Present Status
Development in the corridor is happening along and off existing roads. In Chandanagar, development is off the NH-9 while in Miyapur it is off NH-9 and along the Miyapur-Bollaram Road. Bachupally is further down this road. Similarly, development in Nizampet is off the Nizampet Road which touches Bollaram Road in the north and NH-9 in the south.
The corridor has a mix of apartments and plotted development. Bachupally has more plotted development options because of availability of land in the area. About 65% supply in the re-sale segment in the corridor is of multi-storey apartments followed by builder-floors/independent floors. The 2BHK format dominates across property types with a saleable area of 1000-1200 sq ft. This accounts for 61% supply in the re-sale segment with 3BHK units having 35% share. The 3BHK units are bigger in size with an average saleable area of 1500 sq ft.
Miyapur, Chandanagar and Nizampet are amongst the top 10 localities by consumer preference in the city when it comes to purchase of a residential property. Similarly, in terms of consumers looking for rental options, Miyapur is again amongst the top 10 localities of Hyderabad.
In terms of price level, the corridor caters to consumer preference in the lower price bracket. More than 60% of supply in the
corridor in the re-sale segment is within the Rs 20-40 lakh bracket. A further 29% is in the Rs 40-60 lakh segment. Together, the Rs 20-60 lakh segment accounts for 91% supply in the re-sale segment. Evaluation of consumer preference in the corridor shows that almost the same percentage of consumers are looking for options within the Rs 20-60 lakh segment. This highlights the price sensitive nature of demand in the market.
The average price level in the market is Rs 3,000 per sq ft. Miyapur and Chandanagar have options in the Rs 3,200-3,400 per sq ft price range, while capital values in Nizampet and Bachupally are on the lower side. The price level in these localities is in the Rs 2,400-2,600 per sq ft range.
In line with general market trend, the price level in the corridor has been stagnant for some time. The overall price increment in all the localities of the corridor has been under 10% for the last two years.
Infrastructure
The major infrastructure project in the corridor is the development of the Metro node at Miyapur. The Miyapur-LB Nagar Metro route is being developed as Corridor-1 with a distance of about 30 km. Miyapur to SR Nagar and SR Nagar to LB Nagar are referred to as Stage-2 and Stage-5, under the overall work plan of the Hyderabad Metro Rail network.
As per latest information, Phase-1 comprising of Nagole to Mettuguda (Stage-1) and Miyapur-SR Nagar (Stage-2), will become operational in the first week of June 2016. Operationalization of this line will build connectivity to the corridor with other residential and commercial areas of Hyderabad.
The state government has announced plans for extending the Phase-1 of the
Corridor of growth (COG)20
About the Corridor

Properties available in the corridor
The corridor offers relatively less expensive options for consumers as compared to localities which are closer
to IT/ITES office hubs. Within the corridor, Miyapur and Chandanagar are established
localities with higher capital values (Rs/sq ft). Bachupally and Nizampet come next. This price differential impacts the budget and BHK format wise spread of options.
More than 50% supply is within Rs 20-40 lakh bracket. A further 35% is in the Rs 40-60 lakh segment. Together, they account for 89% supply. This highlights the price sensitive nature of the market. Most of the supply in
Overall Connectivity Social Infrastructure Security/Water
Fig 2: Distribution of properties by price Fig 3: Distribution of properties by delivery status Fig 4: Distribution of properties by bedroom configuration
Corridor of growth (COG)21
Hyderabad Metro. From the corridors perspective, the metro line is expected to be extended by a further 13 km from Miyapur to BHEL and Patancheru. The timeline for implementation of this segment has not been declared.
An Inter-City Bus Terminal (ICBT) is also planned to be developed at Miyapur. However, the development timeline for the same is not clear at present as the proposal is awaiting some clearances.
The corridor has faced water supply problem in the summer season when due to low water level in the reservoirs, water supply was erratic coupled with low pressure in the government water supply network. Residents had to take recourse to purchasing water from private vendors.
However, Hyderabad Metropolitan Water Supply and Sewerage Board (HMWS&SB) is working on a plan to improve the pipeline work in Serilingampally Circle. This will improve the water supply of the corridor.
Social Infrastructure
Most of the corridor is served by well evolved social and support infrastructure. The whole area along the NH-9 in the corridor is an established market with commercial and retail joints. A number of local and international schools are operational along with colleges offering graduate/post graduate education.
Outlook
The political uncertainty which had persisted for a couple of years had a negative impact on the realty market of Hyderabad. Political stability is likely to give a push to the market. This stems from the fact that many large infrastructure projects which had been stuck will finally be started and their implementation will have a positive impact on the market.
The IT/ITeS segment is a strong demand driver for realty in the corridor as well as in other areas. Recent trends show
that leasing of office space by IT/ITeS companies in Hyderabad has picked-up. Vacancy level in the office space segment is at a historically low as the office space take-up increased in 2014 and 2015. An important point to understand here is that most of the employee base of the IT/ITeS companies is young and in the lower income level (relative to industry salary levels). Such employees seek affordable rentals and purchase options. The Miyapur Corridor with its competitive price level, is perfectly placed to address this demand.
However, the price level is not expected to see major gains as this would put the market out of reach for people who form the consumer base for the corridor.
Overall, the corridor offers good residential options to consumers looking for affordable homes in a well-established area with good connectivity and social infrastructure.

Rental demand in the corridor emanates from buyers looking for residential options close to IT/ITeS office hubs in
Madhapur and Gachibowli but cannot afford the options in localities which are close to
them. Miyapur ranks high because of its location on National Highway-9 (NH-9) and presence of support infrastructure. It is easily accessible from different areas. Between Nizampet and Chandanagar, the former scores
in terms of lower rentals while the latter is a well-established locality. Bachupally is still evolving and suffers from last mile connectivity and hence, the lower demand.
the Rs 20-40 lakh segment is in Nizampet and Miyapur localities. Miyapur, followed by Chandanagar and Nizampet, accounts for bulk of supply in the Rs 40-60 lakh bracket.
In a price sensitive market, the smaller 2BHK format with an average size of 1150 sq ft dominates the supply; its small size helps a consumer to keep acquisition cost low. Most of
the supply in the 2BHK format is in the Rs 20-40 lakh price bracket wherein Nizampet leads with the highest share of 2BHK options. The 3BHK is the second most preferred category and most of it is concentrated in Miyapur. In budget terms, 60% of 3BHK options are in the Rs 40-60 lakh price bracket with almost 75% being in the 1300-1700 sq ft size range.
Sales Price Covered Area ( Lacs) (Sq.ft)
1 BHK 15-30 510-950
2 BHK 20-50 950-1250
3 BHK 35-80 1350-2200
4 and Above 82-100 2500-4000
Best sectors to invest in a home Based on rental demand in sectors
Table 1: Sizes and prices of flats available for various room configurations
Based on home buying demand in sectors
Fig 5: Top localities by consumer for renting a house
Fig 6: Top localities by consumer for buying a house
Corridor of growth (COG)22

Best bedroom configurations to buy Preferred buying and renting options
Buying Renting Total (BHKs) Total (BHKs)
1 BHK 1% 1%
2 BHK 60% 56%
3 BHK 37% 43%
4 BHK and Above 2% 0%
Table 2: Demand distribution for buying and renting
Miyapur is the most preferred locality as it offers the best infrastructure as well as connectivity. It also has options
across a wide price range from Rs 20-40 lakh to Rs 1-1.2 crore. This gives flexibility to the
consumers to choose as per their budget. Though, most consumers are looking for 3BHK options in Miyapur. Most consumers in Chandanagar are looking for 2BHK format in the Rs 20-60 lakh price bracket. Demand
for 3BHK units is mainly in the Rs 40-60 lakh budget. More than 60% demand in Nizampet is in the Rs 20-40 lakh segment and for the 2BHK format.
Consumers prefer the 2BHK format in the corridor from both house purchase as well as rent perspective. It has more than
50% share of consumer preference as rent or purchase options. This can be explained by the fact that relatively smaller size of the 2BHK apartments helps a buyer to keep the overall purchase cost on the lower side. About 84% of
consumer preference in the 2BHK segment is in the Rs 20-40 lakh segment followed by the Rs 40-60 lakh bracket with only 16% share. Almost 65% of 2BHK availability is in the 950-1200 sq ft range and this gives flexibility to consumers to choose and buy. In the Rs 40-60 lakh bracket, 73% demand is for 3BHK segment while the rest is for 2BHK formats.
Price changes and future prospects Historic Price movement
6 monthly change Yearly change
1% 4%
Table 3: Historical Price changes
The price trend over last few quarters in the corridor reflects the overall slow market conditions. The price has been flat
and has not seen any change over 6 months or 1 year.
Miyapur Corridor caters to a price sensitive demand-segment which is looking for affordable homes. The purchasing ability of this segment is effected more by slow economic conditions.
The sale had declined in the corridor leading to over-supply. But sale over last few quarters has been steady.
And price level in some localities in the corridor has seen marginal improvement. But overall price level is expected to remain flat or see marginal increase. Fig 7: Historical Price changes of corridor
Corridor Average Price Rs/sqft
Corridor of growth (COG)23

Most of the localities in the corridor fall under the R1 residential land use plan. This is the most flexible land use
zoning under the Hyderabad Metropolitan Development Authority (HMDA) Master Plan. Development of all types of residential,
retail, support retail, healthcare, education, entertainment, public and semi-public are permitted in this zone.
The area around Miyapur Metro Station has been earmarked as a Multiple-Use Zone which
will be used for Transit-Oriented Development (TOD). Permissible land use in this zone is residential, commercial, public & semi-public, recreational and peri-urban
Price movement for top localities by Consumer Preference
The price change in top localities by consumer demand over last quarter has varied across the localities. The price change varied from max of 3% to minimum of -3%. Miyapur, Gajularamaram
and Pragathi Nagar continued the marginal price increment which they have witnessed over last few quarters. Price trend in Nizampet has been positive for last few quarters.
The present price drop could’ve happened by way of correction. The average price in previous quarter had reached a level which was highest over last few years and was not sustainable. Same is the case with Chandanagar. Next few quarters will show whether the recent trend hold
Fig 8: Price changes in top localities by consumer demand
Master Plan
Fig 9: Land use of various localities in the corridor
RESIDENTIAL
COMMERCIAL
PUBLIC AND SEMI-PUBLIC
MANUFACTURING
MULTIPLE USE ZONE
SPECIAL DEVELOPMENT ZONE
OPEN SPACES BUFFER
(around water bodies)
FOREST ZONE
BIO CONSERVATION ZONE
Corridor of growth (COG)24
Miyapur: Affordable and cosmopolitan residential
Miyapur is considered to be a cosmopolitan hub as new malls, shopping complexes and recreational facilities are coming up. The area is developed and is a good place to reside. Majority of property types in Miyapur are multi-storey apartments, which comprises the overall consumer’s preference. Miyapur is an area that provides both facilities and budget that attract home buyers. The locality is based very close to Hitec City. For this reason, the area is a preferred choice for potential investment.
n Source: The Times of India
Why should you invest in Chandanagar?
Chandanagar in Secunderabad became news when it was shortlisted as one of the localities which would see significant commercial establishments in the coming year. Chandanagar is well-connected via the Multi-Modal Transport System (MMTS) to other parts of the city. The South Central Railway is also a popular mode of transport among residents. The upcoming metro line will also boost the transport options of the area. The neighbouring localities include Hitec City, Gachibowli, Lingampally and Miyapur. It is strategically located on the Mumbai Highway. The property prices of Chandanagar are not very high.
n Source: Magicbricks Bureau
Where to buy an affordable house in Hyderabad?
Miyapur is an affordable locality. The area is one of Hyderabad’s busiest places. LB Nagar in Miyapur is a high-density traffic corridor. It has IT, pharmaceutical, apparel companies and other industrial development areas. Miyapur, a part of the Greater Hyderabad Municipal Corporation (GHMC), is strategically located at NH-9 (Pune-Hyderabad-Machillipatam Highway). The area enjoys proximity to IT hubs such as Hitec City (8 km) and Gachibowli (15 km). The Outer Ring Road (ORR) is also easily accessible from the locality. This makes commuting easy and here the property prices are quite reasonable.
n Source: Magicbricks Bureau
Smart tech may revive Hyderabad’s real estate
The development of smart technology in the real estate industry will help to revive Hyderabad’s sluggish market. Smart cities are defined by extensive use of technology to make life simpler and more comfortable. They are the solutions to problems that residents of Indian cities face due to improper planning and maintenance. Areas like Miyapur will be benefit from such a move. The most available property types in this locality are 2-3BHK units.
n Source: The Times of India
IN NEWS
Infrastructure UpdatesHyderabad Metro
Miyapur is the last terminal on the Green Line of the Hyderabad Metro project which connects Miyapur in north-west of the city with LB Nagar in the south-east. It passes through the core areas of the city and connects them with
Miyapur. Part of this Green Line from Miyapur to SR Nagar (11.9 k) is to become operational soon.
Hyderabad Metro – Corridor Extension
The government is proposing to extend the reach of Corridor-1 of the Hyderabad Metro
which presently terminates at Miyapur in the corridor. The new metro route will improve the connectivity to the corridor and help the local people immensely. The route will be extended by another 13 km and connect with BHEL and Patancheru towards west and north-west.
Corridor of growth (COG)25


DON’T SPECULATE! CALCULATE ACCURATE PROPERTY PRICE.
I N T R O D U C I N G
PropWorth
1.8 Cr
78 Lac
70 Lac
85 Lac
80 Lac
52 Lac 65 Lac
75 Lac
90 Lac
To know your PropWorth, give a missed call on 92060-72848
For the �rst time in India, magicbricks brings to you a tool to calculate accurate property prices- Propworth! It uses smart algorithms and data science techniques, riding on the vast underlying data of magicbricks to estimate the property price. Thus, allowing you to determine the ongoing rates of apartments and localities across the country.

CONTACT USl Post your feedback to -
propindex @timesgroup.com
l Join our discussion forum at - openhouse.magicbricks.com
l For business enquiries - [email protected]
l You may also share your opinion with #PropIndex on our Twitter handle @magicbricks or connect with us on Facebook at www.facebook.com/magicbricksTOI
D I S C L A I M E R
Every effort has been made to make this Index as complete and as accurate as possible. MagicBricks accepts no responsibility for inaccuracies in the information/data contained in this book. It shall have neither liability nor responsibility to any person or entity with respect to any loss or damage
caused, or alleged to have been caused, directly or indirectly, by the information contained in this book. The information/data in this book is subject to change from time to time due to market condition.
PROPINDEX TEAMl Content & Research:
E Jayashree Kurup, Subodh Kumar, Rohit Vats, Devendra Lohmor, Bhawna Mongia, Namrata Ekka, Renu Arya, Preeti Sharma, Puneet Kukreja & Bikash Kumar
l Layout Design: Harsha Khattar


![arXiv:2007.09368v1 [cs.SI] 18 Jul 2020](https://static.fdokumen.com/doc/165x107/631b4985ea099a89a5074476/arxiv200709368v1-cssi-18-jul-2020.jpg)


