Judgemental adjustment of initial forecasts: Its effectiveness and biases
20
Journal of Behauioral Decision Making, Vol. 8, 149-168, (1995) Judgemental Adjustment of Initial Forecasts: Its Effectiveness and Biases JOA SANG LIM AND MARCUS O‘CONNOR The University of New South Wales, Australia ABSTRACT Managers are often required to integrate their own forecasts with statistical fore- casts. The studies reported in this paper examine the efficacy of allowing people to adjust their own forecasts in the light of statistical forecasts that are provided to them. Three experimental studies varied the reliability of the statistical forecasts and examined the performance of people over time. Issues of the form of the feedback and the use of decision support were also examined. The results unequivo- cally suggest that the effectiveness of judgemental adjustment depended on the statistical model’s reliability and seasonality of time series. However, people had considerable difficulty placing less weight on their own forecasts (compared to the statistical forecasts) and this behaviour became more pronounced over time. Even provision of decision support did not improve performance at the task. KEY WORDS judgemental forecasting; learning; judgemental adjustment Product or service forecasting is one of the most pervasive tasks in business. Most businesses need to estimate the level of activity in a future period, often for production planning or inventory management. Studies have shown that human judgement is the strongly preferred method of forecasting (Dalrymple, 1987; Mentzer and Cox, 1984). There are a number of reasons why this may be so. First, people often feel more comfortable with their own judgement (Langer, 1975).This is especially true for crucial decisions, of which product forecasting may be one. Second, in real-life product forecasting, extra-model information (e.g. information about competitors, inventory or production problems) assumes considerable importance (Edmundson et al. 1988). This additional information often increases forecast accuracy substantially (Sanders and Ritz- man, 1992). Finally, with real-life time series, judgemental eyeballing has performed comparably with the best statistical approaches (Lawrence et al. 1985). However, one of the ubiquitous developments in computer-based information systems is the rise of integrated inventory and production scheduling systems (MRP 11) which are designed around the provision of statistical forecasts for large numbers of product items. A typical product forecasting system utilizes statistical time-series forecasting models to provide tentative forecasts, with decision makers subsequently adjusting those forecasts in the light of their own judgements and other extra- model information. However, for ‘key’ or important products, judgements are often made about likely sales levels before adjustments are made for the output of the statistical models. This paper recognizes CCC 0894-3257/95/030149-20 Q 1995 by John Wiley & Sons, Ltd. Receiued 14 March 1994 Accepted 21 January 1995
Transcript of Judgemental adjustment of initial forecasts: Its effectiveness and biases
Journal of Behauioral Decision Making, Vol. 8, 149-168, (1995)
Judgemental Adjustment of Initial Forecasts: Its Effectiveness and Biases
JOA SANG LIM AND MARCUS O‘CONNOR The University of New South Wales, Australia
ABSTRACT
Managers are often required to integrate their own forecasts with statistical fore- casts. The studies reported in this paper examine the efficacy of allowing people to adjust their own forecasts in the light of statistical forecasts that are provided to them. Three experimental studies varied the reliability of the statistical forecasts and examined the performance of people over time. Issues of the form of the feedback and the use of decision support were also examined. The results unequivo- cally suggest that the effectiveness of judgemental adjustment depended on the statistical model’s reliability and seasonality of time series. However, people had considerable difficulty placing less weight on their own forecasts (compared to the statistical forecasts) and this behaviour became more pronounced over time. Even provision of decision support did not improve performance at the task.
KEY WORDS judgemental forecasting; learning; judgemental adjustment
Product or service forecasting is one of the most pervasive tasks in business. Most businesses need t o estimate the level of activity in a future period, often for production planning or inventory management. Studies have shown that human judgement is the strongly preferred method of forecasting (Dalrymple, 1987; Mentzer and Cox, 1984).
There are a number of reasons why this may be so. First, people often feel more comfortable with their own judgement (Langer, 1975). This is especially true for crucial decisions, of which product forecasting may be one. Second, in real-life product forecasting, extra-model information (e.g. information about competitors, inventory or production problems) assumes considerable importance (Edmundson et al. 1988). This additional information often increases forecast accuracy substantially (Sanders and Ritz- man, 1992). Finally, with real-life time series, judgemental eyeballing has performed comparably with the best statistical approaches (Lawrence et al. 1985).
However, one of the ubiquitous developments in computer-based information systems is the rise of integrated inventory and production scheduling systems (MRP 11) which are designed around the provision of statistical forecasts for large numbers of product items. A typical product forecasting system utilizes statistical time-series forecasting models to provide tentative forecasts, with decision makers subsequently adjusting those forecasts in the light of their own judgements and other extra- model information. However, for ‘key’ or important products, judgements are often made about likely sales levels before adjustments are made for the output of the statistical models. This paper recognizes
CCC 0894-3257/95/030149-20 Q 1995 by John Wiley & Sons, Ltd.
Receiued 14 March 1994 Accepted 21 January 1995
I50 Journal of Behavioral Decision Making Vol. 8, Iss. No. 3
the desirability of including human judgement in forecasting, and also appreciates that, given the large number of product items often at issue, statistical forecasting approaches are often needed.
We examine the efficacy of permitting people to adjust their initial forecasts after the forecasting system has provided a statistical forecast. Controlled laboratory-based experiments investigate (1) whether people are able to effectively integrate the information contained in the statistical forecast and (2) how they learn to adjust their behaviour over time. This issue is of great importance to the design of Forecasting Support Systems (FSS), since they assume that people are able to integrate effectively such information into the final forecasts.
LITERATURE REVIEW ON JUDGEMENTAL ADJUSTMENT
Despite sceptical views about the role of human judgement in decision making (Dawes and Corrigan, 1974; Jungermann, 1986; Kleinmuntz, 1990; Meehl, 1954), most business organizations adopt a judgemental approach as their primary method of forecasting (Dalrymple, 1987; Mentzer and Cox, 1984; Rothe, 1978). The challenge for the designers of FSS is to combine the stability and consistency of statistical approaches with the preference and need for human judgement.
A combination of statistical and judgemental approaches to forecasting has been shown to improve accuracy significantly over the individual forecasts - either statistical or judgemental (Blattberg and Hoch, 1990; Lawrence et al., 1986; Lob0 and Nair, 1990). This combination mode can take the form of either mechanical approaches (e.g. simple averaging) or an adjustment of statistical forecasts by people (Mahmoud, 1989). Recent developments in computer software (especially MRP I1 systems) have increased the emphasis on judgemental adjustment of statistical forecasts. With these systems, sales forecasts are produced automatically. The task of marketing management for these systems is then to adjust these forecasts in the light of relevant marketing and other non-time-series information. Thus many organizations are currently adopting the procedure of adjusting the forecasts of computer-based statistical methods (Lawrence er al., 1993). Often these systems adopt different approaches for key (i.e. important to the success of the organization) and non-key products (Edmundson er al. 1988). For the latter, statistical forecasts are often accepted as the final forecasts (Mathews and Diamantopoulos, 1992). On the other hand, for key products there is a strong role for judgement.
Often the forecasting systems emphasize the need for judgement by adopting a three-stage approach: an initial judgemental forecast, followed by a consideration of statistical forecasts, and finally a revision of the initial estimate. The important question is whether people are good at the task of adjusting initial forecasts after the consideration of statistical forecasts. This is a cognitive task and highlights the need to understand the cognitive process and the biases involved (Hogarth and Makridakis, 198 1). Mahmoud (1989, p. 599) points out that ‘it is not clear exactly how managers combine their forecasts, which kinds of forecasts or techniques they combine and when managers obtain most benefit from combining’. In line with this, this paper focuses on two aspects of judgemental adjustment: its effectiveness and the adjustment behaviour.
There have been a number of empirical studies during the last decade on the effectiveness of judgemental adjustment to statistical forecasts, and the results have been mixed. Some have cautioned against routine judgemental adjustment to objective forecasts (Armstrong, 1986; Carbone el al., 1983; Willemain, 1991). On the other hand, intuitive adjustment has recently been reported as contributing to accuracy (Mathews and Diamantopoulos, 1986,1989; McNees, 1990; Sanders, 1992; Wolfe and Flores, 1990). As a guide to the prevailing controversy as to the quality of judgemental adjustment, two factors seem crucial: (1) the reliability of the statistical forecasts (Willemain, 1989) from which adjustment is made and (2) the characteristics of time series (Sanders, 1992). The latter studies, while not undertaken in controlled conditions, used real data and also stressed the importance of the adjustment process.

Joa Sang Lim and Marcus O’Connor Judgemental Adjustment: Ejfectiveness and Biases 1 5 1
Recently, Goodwin and Wright (1993, p. 153) highlighted the need to examine the process of judge- mental adjustment (see also Ashton, 1990, p. 160). Furthermore, the pattern of learning about the reliability of the statistical forecasts over time has not been investigated. The research described here varies the reliability of the statistical forecasts and investigates the way people place weights on them over time. It also examines the competing theories of judgemental adjustment: conservatism (Phillips and Edwards, 1966; Tversky and Kahneman, 1974) and excessiveness (Schum, 1980). With some exceptions (Bamber, 1983; Joyce and Biddle, 1981), there is a solid body of evidence that people often simply adopt the anchoring-adjustment heuristic in time series tasks (Andreassen and Kraus, 1990; Lawrence and O’Connor, 1992; Remus and Kottoeman, 1992) and other contexts as well (Ashton and Ashton, 1988; Tversky and Kahneman, 1974; Wright and Anderson, 1989). This study investigates the efficacy of adjustment of initial judgemental forecasts in the light of statistical forecasts and the learning that occurs after various forms of outcome feedback and decision aids.
RESEARCH QUESTIONS
The three experiments reported in this paper were designed to explore the issues discussed above. The main research questions were:
(1)
(2)
Is the efficacy of judgemental adjustment contingent on the reliability’ of statistical models and the characteristics of the time series? Does the anchoring-adjustment heuristic (Tversky and Kahneman, 1974) describe the behaviour of people in revising their initial forecasts in the light of additional information?
Prior literature suggest positive answers to both questions. We also examine these issues over time. Even if initially people do not perform well at the task, are they capable of improving over time? We report on three experiments undertaken to examine the above questions.
EXPERIMENT 1
Research design and time series To investigate the aforementioned issues, a laboratory-based initial experiment was employed for its high controllability over the variables we wished to examine. Experiment 1 was conducted as a three-factor (reliability, seasonality and block) design with repeated measures on the block factor. The first factor, the reliability of the statistical forecast (the forecast provided to the subjects), consisted of two levels: (1) high and (2) low reliability. There were two levels of seasonality* (present and not), and three levels of blocks. The high-reliable statistical forecast was the dumped exponential smoothing forecast (Gardner and McKenzie, 1985) while the low-reliable forecast was the naive forecast (merely the previous actual value of the series). The exponential smoothing method was chosen in the light of results of a well-known forecasting competition, the so-called M-competition (Makridakis et al., 1982). The naive method was chosen as the benchmark. There were five seasonal and five non-seasonal series used. These series were taken from the M-competition database of real-life time series, examples of which are contained in the Appendix. Care was taken to ensure that the time series did not contain any major discontinuities, in either the history or the validation data. Each subject was required to forecast
I The term ‘reliability’ refers to forecast accuracy. * Seasonality occurs when a regular and consistent pattern occurs each year in the time series.

152 Journal of Behavioral Decision Making Vol. 8, Iss. No. 3
two time series, one seasonal and one non-seasonal. For each series, the subject produced a one-step- ahead forecast, and they did this for 30 iterations. To determine whether there was any change in improvement over time, these iterations were segmented into three equal-time blocks due to parsimony (O’Brien and Kaiser, 1985). The task was expressed as sales forecasting and the nature of the series and the time period to which the series related were not provided (Lawrence et al., 1986). This was chosen to eliminate any label effects (Goodwin and Wright, 1993) that may induce forecasts that are not related to the patterns in the time series.
RESEARCH SUBJECTS AND EXPERIMENTAL PROCEDURE
Subjects The subjects were 64 postgraduate students enrolled in an advanced post-graduate subject in forecasting at the University of New South Wales in Sydney, Australia. They had recently completed 5 weeks of instruction in forecasting techniques, including exponential smoothing. They were (arguably) aware of the relative accuracy of the damped exponential smoothing and naive methods. At the time of undertaking the experiment, they were familiar with both judgemental and statistical methods. Most of them were part-time students with full-time employment in business. They were encouraged to partici- pate by the teacher, the second author. There were ‘winner-takes-all’ monetary incentives of AS50 for each experimental treatment. Casual observation of the subjects indicated they were strongly motivated by this incentive.
Experimental procedure Subjects were first briefed about the task instrument and the prize money. They used a mouse-interfaced task instrument which produced line-graphs of past data, allowed user-friendly graphical interface, and provided graphical outcome feedback every trial on the error of both the subjects’ judgemental forecast and the statistical forecast. An illustration of the task instrument is contained in the Appendix. Subjects were required to forecast two time series, one seasonal and one non-seasonal. For each series, a forecast for the next data point was produced, and this was repeated for 30 iterations. Thus, there were 30 one-step-ahead forecasts for each time series. At each iteration subjects first produced an initial forecast. The statistical forecast was then revealed to them. They were then required to produce a revised forecast. In this way, there were two judgemental forecasts (one initial and one revised) and a statistical forecast. As the subjects produced the forecasts for the next iteration, they were able to clearly see their final forecast, the statistical forecast, and the actual value for the previous iteration, which were clearly differentiated by different colours on the screen. All forecasts were made by using the mouse, and subjects could change their forecasts before ‘locking them in’ for their final decision.
The damped exponential smoothed forecasts were produced using the methodology outlined by Gardner and McKenzie (1 985). The seasonal series were deseasonalized first and then reseasonalized after the (deseasonalized) forecasts were produced in accordance with standard exponential smoothing procedures (Makridakis et al., 1983).
ANALYSIS METHODOLOGY
Forecast accuracy was measured in terms of Absolute Percentage Error (APE), calculated as APE = 100*]Forecast - Actual] / Actual, because of its academic popularity (Cabone and Armstrong, 1982)
Jm Sang Lim and Marcus O'Connor Judgemental Adjustment: Effectiveness and Biases 1 53
and robustness (Armstrong and Collopy, 1992).3 Since the effect of revision can best be understood by the degree of improvement over the criterion, improvement (IMP) was measured as follows:
where APEinitia, (APErevised) represents the Absolute Percentage Error of the initial (revised) judge- mental forecast. Thus IMP represents the improvement in accuracy of the revised forecast over the initial forecast after the statistical forecast has been provided. This measures allows an assessment of the extent to which people are able to discern the reliability of the statistical forecast and integrate it appropriately into their revised forecast. Prior to statistical analysis, raw data were examined to search for outlier^.^ A 1 -between (reliability), 2-within (seasonality and blocks) ANOVA was then performed. Polynomial trend analysis was performed for time blocks. ANOVA assumptions were not tested because ANOVA is known to be robust against the violations of these assumptions when the group sizes are equal (Huck et al., 1974). Previous literature suggests that the adjustment process can be modelled by a linear regression model (Kleinmuntz, 1990). To understand the adjustment behaviour, the model-ofman (Hammond et al., 1975) was constructed by regressing two cues - the initial forecast and the statistical forecast - against the final forecast using step-wise regression.
RESULTS
Manipulation checks Reliability was successfully manipulated as intended across experimental conditions. The damped exponential smoothed forecast (MAPEdamPed = 11.84) was significantly more accurate than the naive forecast (MAPEnaiVe = 21.70) (F(1,60) = 24.63, p < 0.0005) and significantly more accurate than the initial judgemental forecast (MAPEinitiar = 21.20). The initial judgemental forecasts were not signifi- cantly more accurate than the naive forecast (p = 0.316).
Reliability effect Exhibit 1 reveals that the subjects benefited from their revision by 3.55% overall. IMP was significantly greater when the initial forecast was adjusted from the high-reliable statistical forecast (6.20) than from the low-reliable statistical forecast (0.89) (F(1,60) = 2 9 . 9 5 , ~ < 0.0005). It is interesting to note that the beneficial effect of revision was also evident when a low-reliability naive forecast was provided. Post-hoc paired t-tests showed that the final forecast was more accurate than the initial forecast even when the naive forecast was provided (t(1919) = 2.93, p = 0.003). This suggests that some of the benefit from revision might have come from simple judgemental averaging (Clemen, 1989). Analysis of frequencies corroborates that adjustment based on the damped forecast led more frequently to positive IMP (20.1%) than did it from the naive forecast (8.2%). About 59% of all observations were not adjusted at all.
Seasonality effect There was a seasonality effect on IMP (F(1,60) = 21.80, p < 0.0005). IMP was greater for the seasonal series (5.95) than for the non-seasonal (1.14). As we will see, people were initially inaccurate for the seasonal series but were able to improve by revision, more than they did for the non-seasonal series.
The mean APE is hereafter referred to as MAPE. Only one outlier was found (Cook's distance = 3.41 7 , p < 0.02). I t was in the statisticallnaive group and was replaced by the value
of its preceding observation.
154 Journal of Behavioral Decision Making Vol. 8, Iss. No. 3
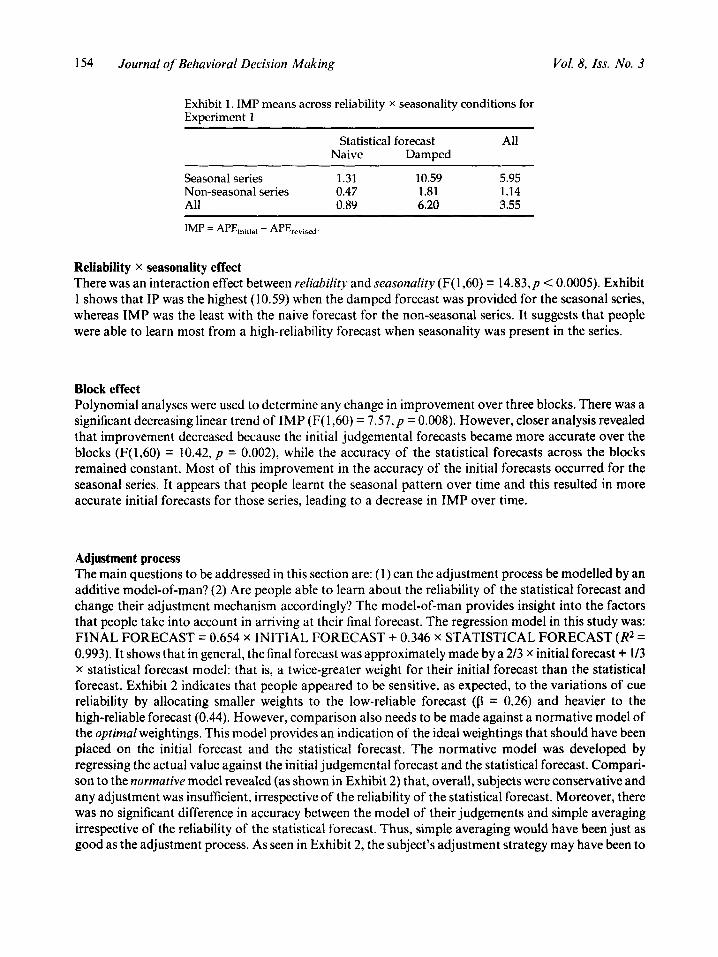
Exhibit 1. IMP means across reliability x seasonality conditions for Experiment 1
Statistical forecast All Naive Damped
Seasonal series 1.31 10.59 5.95 Non-seasonal series 0.47 1.81 1.14 All 0.89 6.20 3.55
Reliability X seasonality effect There was an interaction effect between reliability and seasonality (F( 1,60) = 14.83 ,~ < 0.0005). Exhibit 1 shows that IP was the highest (10.59) when the damped forecast was provided for the seasonal series, whereas IMP was the least with the naive forecast for the non-seasonal series. It suggests that people were able to learn most from a high-reliability forecast when seasonality was present in the series.
Block effect Polynomial analyses were used to determine any change in improvement over three blocks. There was a significant decreasing linear trend of IMP (F( 1,60) = 7 . 5 7 , ~ = 0.008). However, closer analysis revealed that improvement decreased because the initial judgemental forecasts became more accurate over the blocks (F(1,60) = 10.42, p = 0.002), while the accuracy of the statistical forecasts across the blocks remained constant. Most of this improvement in the accuracy of the initial forecasts occurred for the seasonal series. It appears that people learnt the seasonal pattern over time and this resulted in more accurate initial forecasts for those series, leading to a decrease in IMP over time.
Adjustment process The main questions to be addressed in this section are: (1) can the adjustment process be modelled by an additive model-of-man? (2) Are people able to learn about the reliability of the statistical forecast and change their adjustment mechanism accordingly? The model-of-man provides insight into the factors that people take into account in arriving at their final forecast. The regression model in this study was: FINAL FORECAST = 0.654 x INITIAL FORECAST + 0.346 x STATISTICAL FORECAST (R2 = 0.993). It shows that in general, the final forecast was approximately made by a 2/3 x initial forecast + 1/3 X statistical forecast model: that is, a twice-greater weight for their initial forecast than the statistical forecast. Exhibit 2 indicates that people appeared to be sensitive, as expected, to the variations of cue reliability by allocating smaller weights to the low-reliable forecast (p = 0.26) and heavier to the high-reliable forecast (0.44). However, comparison also needs to be made against a normative model of the optimal weightings. This model provides an indication of the ideal weightings that should have been placed on the initial forecast and the statistical forecast. The normative model was developed by regressing the actual value against the initial judgemental forecast and the statistical forecast. Compari- son to the normative model revealed (as shown in Exhibit 2) that, overall, subjects were conservative and any adjustment was insufficient, irrespective of the reliability of the statistical forecast. Moreover, there was no significant difference in accuracy between the model of their judgements and simple averaging irrespective of the reliability of the statistical forecast. Thus, simple averaging would have been just as good as the adjustment process. As seen in Exhibit 2, the subject’s adjustment strategy may have been to
Joa Sang Lim and Marcus O'Connor Judgemental Adjustment: Effectiveness and Biases 155
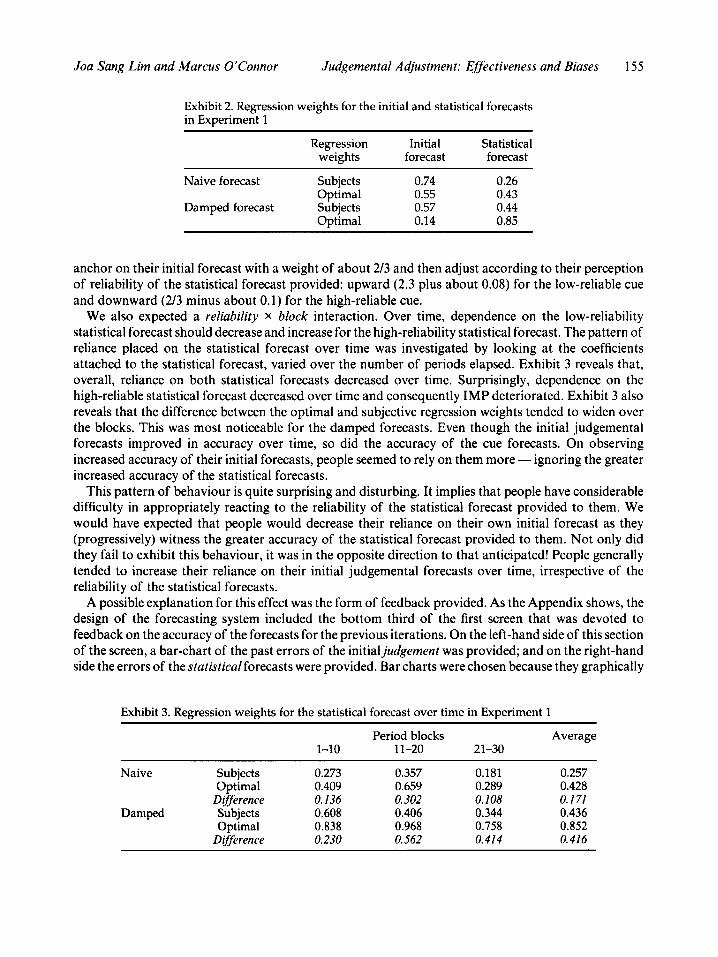
Exhibit 2. Regression weights for the initial and statistical forecasts in Experiment 1
Regression Initial Statistical weights forecast forecast
Naive forecast Subjects 0.74 0.26 Optimal 0.55 0.43
Optimal 0.14 0.85 Damped forecast Subjects 0.57 0.44
anchor on their initial forecast with a weight of about 213 and then adjust according to their perception of reliability of the statistical forecast provided: upward (2 .3 plus about 0.08) for the low-reliable cue and downward (2 /3 minus about 0.1) for the high-reliable cue.
We also expected a reliability x block interaction. Over time, dependence on the low-reliability statistical forecast should decrease and increase for the high-reliability statistical forecast. The pattern of reliance placed on the statistical forecast over time was investigated by looking at the coefficients attached to the statistical forecast, varied over the number of periods elapsed. Exhibit 3 reveals that, overall, reliance on both statistical forecasts decreased over time. Surprisingly, dependence on the high-reliable statistical forecast decreased over time and consequently IMP deteriorated. Exhibit 3 also reveals that the difference between the optimal and subjective regression weights tended to widen over the blocks. This was most noticeable for the damped forecasts. Even though the initial judgemental forecasts improved in accuracy over time, so did the accuracy of the cue forecasts. On observing increased accuracy of their initial forecasts, people seemed to rely on them more - ignoring the greater increased accuracy of the statistical forecasts.
This pattern of behaviour is quite surprising and disturbing. It implies that people have considerable difficulty in appropriately reacting to the reliability of the statistical forecast provided to them. We would have expected that people would decrease their reliance on their own initial forecast as they (progressively) witness the greater accuracy of the statistical forecast provided to them. Not only did they fail to exhibit this behaviour, it was in the opposite direction to that anticipated! People generally tended to increase their reliance on their initial judgemental forecasts over time, irrespective of the reliability of the statistical forecasts.
A possible explanation for this effect was the form of feedback provided. As the Appendix shows, the design of the forecasting system included the bottom third of the first screen that was devoted to feedback on the accuracy of the forecasts for the previous iterations. On the left-hand side of this section of the screen, a bar-chart of the past errors of the initialjudgement was provided; and on the right-hand side the errors of the statistical forecasts were provided. Bar charts were chosen because they graphically
Exhibit 3. Regression weights for the statistical forecast over time in Experiment 1
Period blocks Average 1-10 11-20 21-30
Naive Subjects 0.273 0.357 0.181 0.257 Optimal 0.409 0.659 0.289 0.428
Difference 0.136 0.302 0.108 0. I71 Damped Subjects 0.608 0.406 0.344 0.436
Optimal 0.838 0.968 0.758 0.852 Difference 0.230 0.562 0.414 0.416
156 Journal of Behavioral Decision Making Vol. 8, Iss. No. 3
illustrate past errors and (arguably) provide a more effective form of feedback (Jarvenpaa and Dickson, 1988). In addition to the bar charts, statistics of MAPEs were also provided. At a glance, one could determine both graphically and numerically the accuracy of the judgemental forecasts in comparison to that of the statistical forecasts. However, the depressing results of this study prompted a further study to change the way the feedback was represented.
EXPERIMENT 2
The second experiment focused on the effectiveness of the outcome feedback provided. In the first experiment, the bottom of the screen contained bar charts and statistics of the forecast error for all iterations performed up to that stage. The results of the first experiment indicated that subjects took little notice of the feedback as to their forecast accuracy compared with that of the statistical model. The second experiment forced all subjects to consider an additional screen where only outcome feedback was displayed. If subjects in the first experiment tended to ignore the bottom of the screen, they would surely take greater notice of the outcome feedback by explicitly examining the second screen.
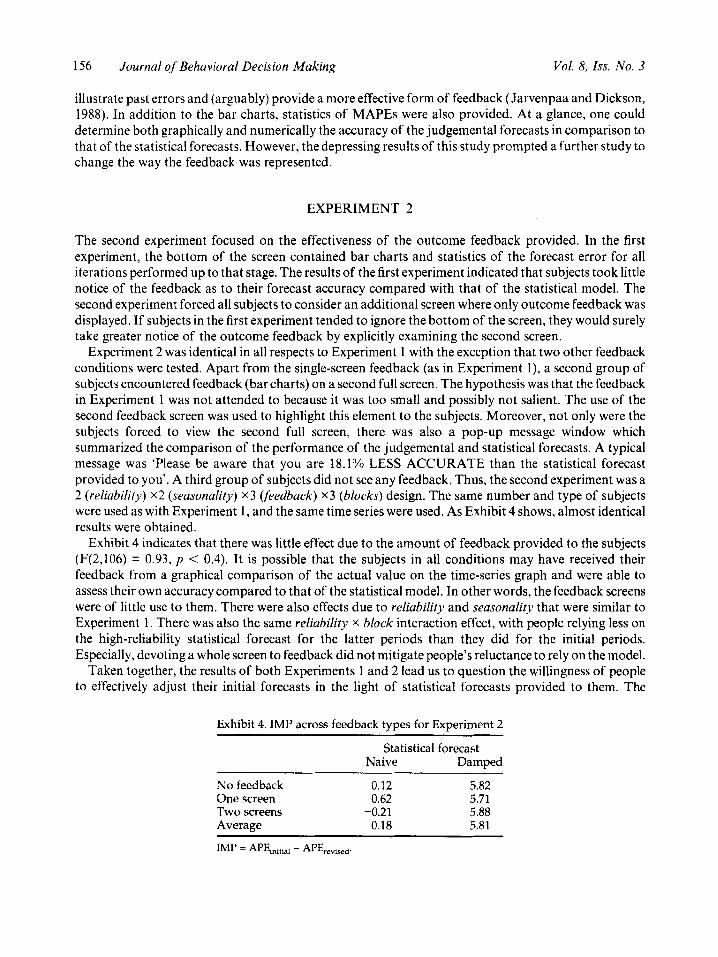
Experiment 2 was identical in all respects to Experiment 1 with the exception that two other feedback conditions were tested. Apart from the single-screen feedback (as in Experiment I), a second group of subjects encountered feedback (bar charts) on a second full screen. The hypothesis was that the feedback in Experiment 1 was not attended to because it was too small and possibly not salient. The use of the second feedback screen was used to highlight this element to the subjects. Moreover, not only were the subjects forced to view the second full screen, there was also a pop-up message window which summarized the comparison of the performance of the judgemental and statistical forecasts. A typical message was ‘Please be aware that you are 18.1% LESS ACCURATE than the statistical forecast provided to you’. A third group of subjects did not see any feedback. Thus, the second experiment was a 2 (reliability) x2 (seasonality) x3 (feedback) x3 (blocks) design. The same number and type of subjects were used as with Experiment 1, and the same time series were used. As Exhibit 4 shows, almost identical results were obtained.
Exhibit 4 indicates that there was little effect due to the amount of feedback provided to the subjects (F(2,106) = 0.93, p < 0.4). It is possible that the subjects in all conditions may have received their feedback from a graphical comparison of the actual value on the time-series graph and were able to assess their own accuracy compared to that of the statistical model. In other words, the feedback screens were of little use to them. There were also effects due to reliability and seasonality that were similar to Experiment 1. There was also the same reliability x block interaction effect, with people relying less on the high-reliability statistical forecast for the latter periods than they did for the initial periods. Especially, devoting a whole screen to feedback did not mitigate people’s reluctance to rely on the model.
Taken together, the results of both Experiments 1 and 2 lead us to question the willingness of people to effectively adjust their initial forecasts in the light of statistical forecasts provided to them. The
Exhibit 4. IMP across feedback types for Experiment 2
Statistical forecast Naive Damped
No feedback 0.12 5.82 One screen 0.62 5.71 Two screens -0.21 5.88 Average 0.18 5.81 IMP = APEinitial - APErevised.
Joa Sang Lim and Marcus O’Connor Judgemental Adjustment: Effectiveness and Biases 157
subjects were able to differentiate between the reliability of the statistical cues provided. But the weighting they placed on the statistical forecast was far from optimal, favouring their own initial judgement. The results suggest that the feedback people use may be contained in the time series itself, and not the provision of graphical feedback mechanisms.
Why do people disregard a forecast more accurate than their own? Why do they still favour their initial forecast even after having observed a more reliable forecast over time? The results of Experiment 2 lead us to rule out the possibility that the inappropriate design of graphical feedback is accountable for people’s flawed behaviour in judgemental adjustment. Now, we move our attention from an attempt to attribute cognitive biases fromfaulty tasks tofaulty judges (Fischhoff, 1982). Two reasons are addressed in an additional experiment:
(1) Such disappointing results might have been obtained because people were unable to discriminate sufficiently between the reliability of their own and the statistical forecast. Perhaps they needed a forecast that was highly accurate. Although they were capable of correctly discerning the reliability of the statistical forecast, people might have had a problem in aggregating the statistical forecast with the initial forecast. Will it be more accurate if forecasters estimate the weightings of their own and the statistical forecasts and the forecast systems combine them mechanically?
(2)
EXPERIMENT 3
To investigate these proportions, Experiment 3 was conducted. The design was identical to the other two experiments, except for two factors. First, there were three levels of reliability of the statistical forecasts included. In addition to the naive and damped statistical forecasts, a more reliable third forecast was provided. It was derived by taking the average of the damped forecast and the actual value (the AVGE forecast in Exhibit 5) . This was then the high-reliability condition. So, people were assigned to one of three statistical forecast conditions - low-, medium-, and high-reliability conditions. A constant ignoring of the reference model which is more accurate than people’s judgment has been documented in non-time series task settings (Arkes et al., 1986; Ashton, 1990; Dawes et al., 1989; Peterson and Pitz, 1986). Arkes et al. (1986) found that overcoming this tendency was not easy unless they were explicitly told that ‘people who try to do better than [the model] . . . actually do a lot worse. So just follow [the model]’ (p. 97). One of the reasons which may hinder learning at the task would be that people are overconfident about themselves and try to beat the decision aid (Arkes et af . , 1986; see Dawes et al., 1989). Ashton (1990, p. 163) also pointed out this flawed cognitive mechanism about self-efficacy: ‘. . . a tendency to overestimate one’s own ability and the poor relation between self-assessments of ability and actual performance could contribute to subjects’ reluctance to rely heavily on decision aids.’ Indeed, people may think even random errors predictable (Einhorn, 1980), even though consistently 100% accurate forecasts do not exist! The accuracy of the model was 70% in Arkes et af . (1 986) and only 50% in Ashton (1990). This might have led people to believe that there was still ‘room for some improvement’ (Arkes et al., 1986, p. 94). The present study provides a very accurate forecast to re-examine the conservative behaviour as found in Experiment 1 and 2.
Second, a decision aid was provided to some of the people. Remember from the first two experiments that the model-ofman regression model revealed that people placed too much weight on their initial judgements. A possible explanation for this finding is that people had difficulty in combining the statistical forecast and their own judgement. There is a considerable body of evidence that combining information is a particular problem that people face. The decision-making literature is replete with discussion of the difficulties (for a review, see Kleinmuntz, 1990). The problem of combination could be
158 Journal of Behavioral Decision Making Vol. 8, Iss. No. 3
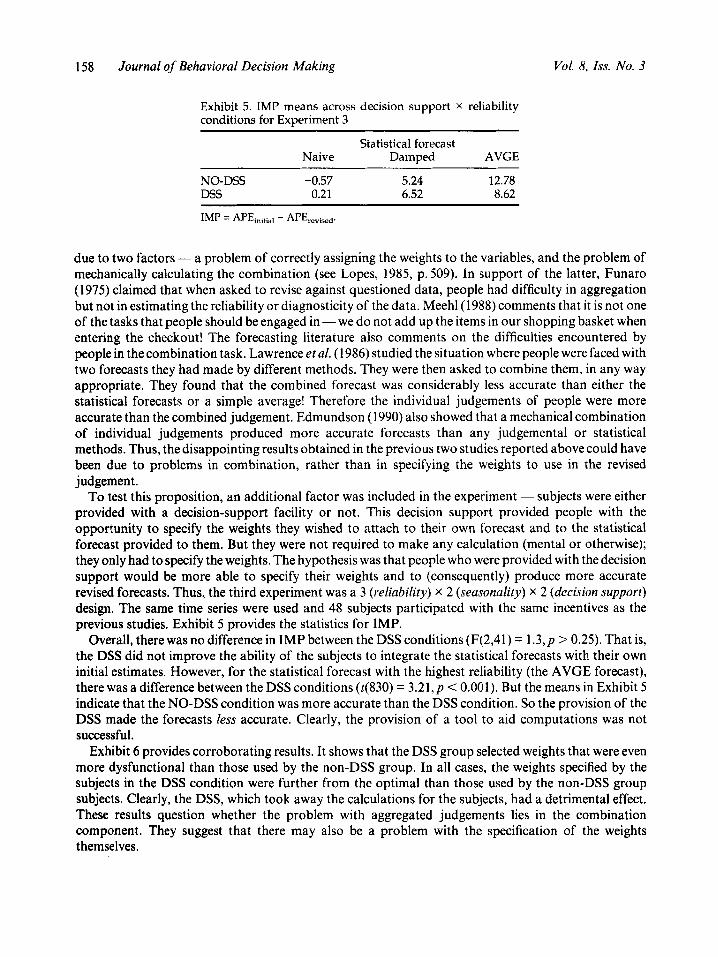
Exhibit 5. IMP means across decision support x reliability conditions for Experiment 3
Statistical forecast Naive Damped AVGE
NO-DSS -0.57 5.24 12.78 DSS 0.21 6.52 8.62
due to two factors - a problem of correctly assigning the weights to the variables, and the problem of mechanically calculating the combination (see Lopes, 1985, p. 509). In support of the latter, Funaro (1975) claimed that when asked to revise against questioned data, people had difficulty in aggregation but not in estimating the reliability or diagnosticity of the data. Meehl(l988) comments that it is not one of the tasks that people should be engaged in - we do not add up the items in our shopping basket when entering the checkout! The forecasting literature also comments on the difficulties encountered by people in the combination task. Lawrence etal. (1986) studied the situation where people were faced with two forecasts they had made by different methods. They were then asked to combine them, in any way appropriate. They found that the combined forecast was considerably less accurate than either the statistical forecasts or a simple average! Therefore the individual judgements of people were more accurate than the combined judgement. Edmundson (1 990) also showed that a mechanical combination of individual judgements produced more accurate forecasts than any judgemental or statistical methods. Thus, the disappointing results obtained in the previous two studies reported above could have been due to problems in combination, rather than in specifying the weights to use in the revised judgement.
To test this proposition, an additional factor was included in the experiment - subjects were either provided with a decision-support facility or not. This decision support provided people with the opportunity to specify the weights they wished to attach to their own forecast and to the statistical forecast provided to them. But they were not required to make any calculation (mental or otherwise); they only had to specify the weights. The hypothesis was that people who were provided with the decision support would be more able to specify their weights and to (consequently) produce more accurate revised forecasts. Thus, the third experiment was a 3 (vefiability) x 2 (seasonality) x 2 (decision support) design. The same time series were used and 48 subjects participated with the same incentives as the previous studies. Exhibit 5 provides the statistics for IMP.
Overall, there was no difference in IMP between the DSS conditions (F(2,41) = 1 . 3 , ~ > 0.25). That is, the DSS did not improve the ability of the subjects to integrate the statistical forecasts with their own initial estimates. However, for the statistical forecast with the highest reliability (the AVGE forecast), there was a difference between the DSS conditions ((830) = 3 . 2 1 , ~ < 0.001). But the means in Exhibit 5 indicate that the NO-DSS condition was more accurate than the DSS condition. So the provision of the DSS made the forecasts less accurate. Clearly, the provision of a tool to aid computations was not successful.
Exhibit 6 provides corroborating results. It shows that the DSS group selected weights that were even more dysfunctional than those used by the non-DSS group. In all cases, the weights specified by the subjects in the DSS condition were further from the optimal than those used by the non-DSS group subjects. Clearly, the DSS, which took away the calculations for the subjects, had a detrimental effect. These results question whether the problem with aggregated judgements lies in the combination component. They suggest that there may also be a problem with the specification of the weights themselves.
Joa Sang Lim and Marcus O’Connor Judgemental Adjustment: Effectiveness and Biases 1 59
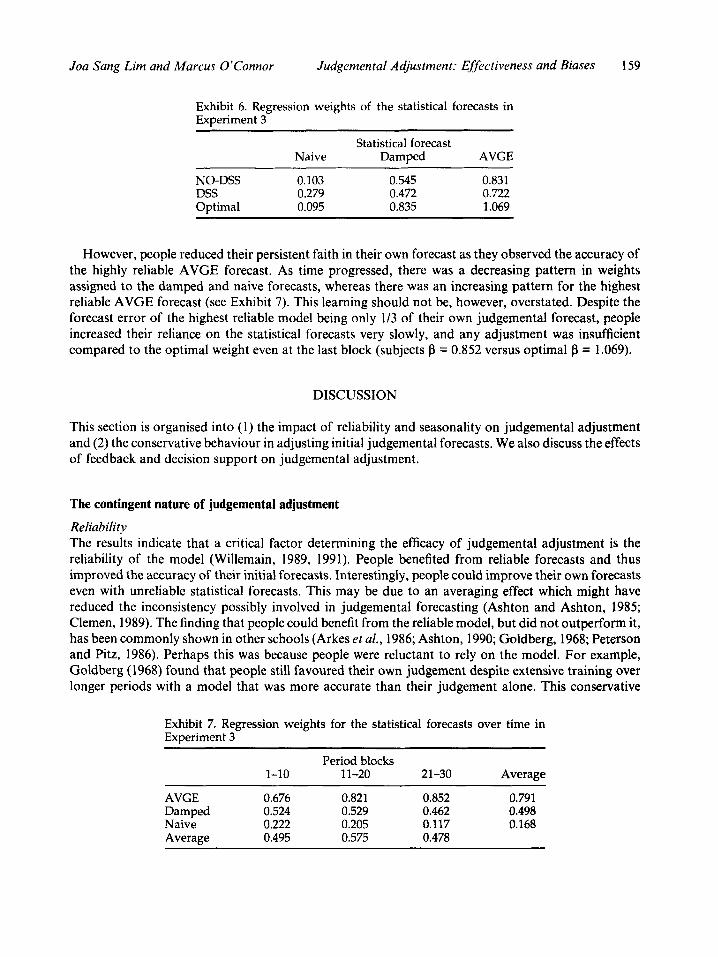
Exhibit 6. Regression weights of the statistical forecasts in Experiment 3
Statistical forecast Naive Damped AVGE
NO-DSS 0.103 0.545 0.831 DSS 0.279 0.472 0.722 Optimal 0.095 0.835 1.069
However, people reduced their persistent faith in their own forecast as they observed the accuracy of the highly reliable AVGE forecast. As time progressed, there was a decreasing pattern in weights assigned to the damped and naive forecasts, whereas there was an increasing pattern for the highest reliable AVGE forecast (see Exhibit 7). This learning should not be, however, overstated. Despite the forecast error of the highest reliable model being only 1/3 of their own judgemental forecast, people increased their reliance on the statistical forecasts very slowly, and any adjustment was insufficient compared to the optimal weight even at the last block (subjects p = 0.852 versus optimal p = 1.069).
DISCUSSION
This section is organised into (1) the impact of reliability and seasonality on judgemental adjustment and (2) the conservative behaviour in adjusting initial judgemental forecasts. We also discuss the effects of feedback and decision support on judgemental adjustment.
The contingent nature of judgemental adjustment
Reliability The results indicate that a critical factor determining the efficacy of judgemental adjustment is the reliability of the model (Willemain, 1989, 1991). People benefited from reliable forecasts and thus improved the accuracy of their initial forecasts. Interestingly, people could improve their own forecasts even with unreliable statistical forecasts. This may be due to an averaging effect which might have reduced the inconsistency possibly involved in judgemental forecasting (Ashton and Ashton, 1985; Clemen, 1989). The finding that people could benefit from the reliable model, but did not outperform it, has been commonly shown in other schools (Arkes et al., 1986; Ashton, 1990; Goldberg, 1968; Peterson and Pitz, 1986). Perhaps this was because people were reluctant to rely on the model. For example, Goldberg (1968) found that people still favoured their own judgement despite extensive training over longer periods with a model that was more accurate than their judgement alone. This conservative
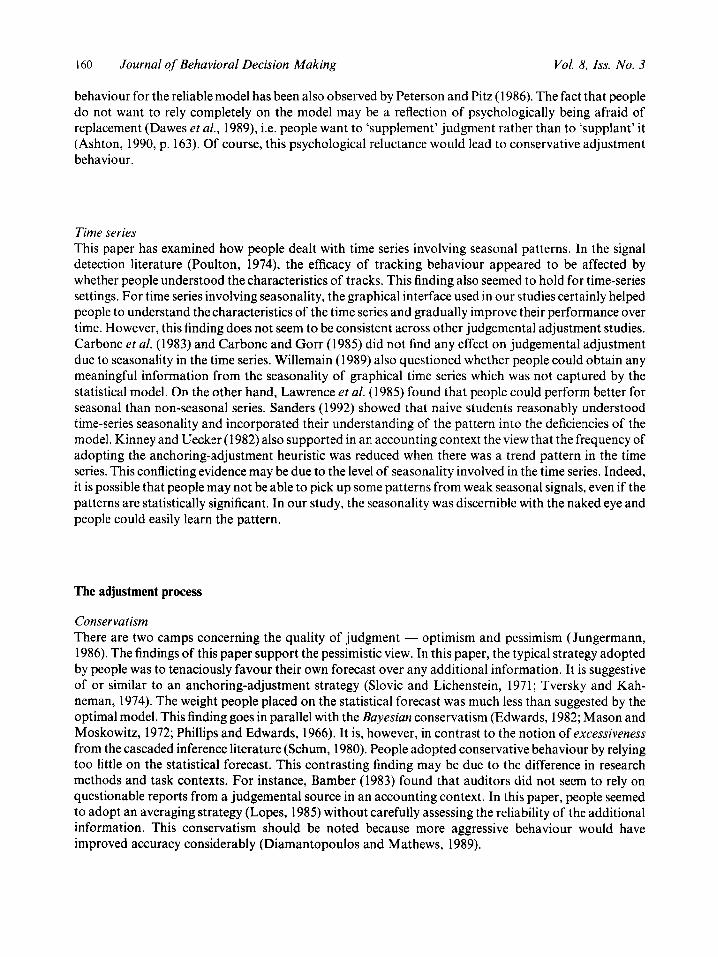
Exhibit 7. Regression weights for the statistical forecasts over time in Experiment 3
Period blocks 1-10 11-20 21-30 Average
~ ~ ~~ ~~~ ~ ~
AVGE 0.676 0.821 0.852 0.791 Damped 0.524 0.529 0.462 0.498 Naive 0.222 0.205 0.117 0.168 Average 0.495 0.575 0.478
160 Journal of Behavioral Decision Making Vol. 8, Iss. No. 3
behaviour for the reliable model has been also observed by Peterson and Pitz (1986). The fact that people do not want to rely completely on the model may be a reflection of psychologically being afraid of replacement (Dawes et al., 1989), i.e. people want to ‘supplement’ judgment rather than to ‘supplant’ it (Ashton, 1990, p. 163). Of course, this psychological reluctance would lead to conservative adjustment behaviour .
Time series This paper has examined how people dealt with time series involving seasonal patterns. In the signal detection literature (Poulton, 1974), the efficacy of tracking behaviour appeared to be affected by whether people understood the characteristics of tracks. This finding also seemed to hold for time-series settings. For time series involving seasonality, the graphical interface used in our studies certainly helped people to understand the characteristics of the time series and gradually improve their performance over time. However, this finding does not seem to be consistent across other judgemental adjustment studies. Carbone et al. (1983) and Carbone and Gorr (1 985) did not find any effect on judgemental adjustment due to seasonality in the time series. Willemain (1 989) also questioned whether people could obtain any meaningful information from the seasonality of graphical time series which was not captured by the statistical model. OP the other hand, Lawrence et al. (1985) found that people could perform better for seasonal than non-seasonal series. Sanders (1992) showed that naive students reasonably understood time-series seasonality and incorporated their understanding of the pattern into the deficiencies of the model. Kinney and Uecker (1 982) also supported in an accounting context the view that the frequency of adopting the anchoring-adjustment heuristic was reduced when there was a trend pattern in the time series. This conflicting evidence may be due to the level of seasonality involved in the time series. Indeed, it is possible that people may not be able to pick up some patterns from weak seasonal signals, even if the patterns are statistically significant. In our study, the seasonality was discernible with the naked eye and people could easily learn the pattern.
The adjustment process
Conser va t ism There are two camps concerning the quality of judgment - optimism and pessimism (Jungermann, 1986). The findings of this paper support the pessimistic view. In this paper, the typical strategy adopted by people was to tenaciously favour their own forecast over any additional information. It is suggestive of or similar to an anchoring-adjustment strategy (Slovic and Lichenstein, 1971; Tversky and Kah- neman, 1974). The weight people placed on the statistical forecast was much less than suggested by the optimal model. This finding goes in parallel with the Bayesian conservatism (Edwards, 1982; Mason and Moskowitz, 1972; Phillips and Edwards, 1966). It is, however, in contrast to the notion of excessiveness from the cascaded inference literature (Schum, 1980). People adopted conservative behaviour by relying too little on the statistical forecast. This contrasting finding may be due to the difference in research methods and task contexts. For instance, Bamber (1983) found that auditors did not seem to rely on questionable reports from a judgemental source in an accounting context. In this paper, people seemed to adopt an averaging strategy (Lopes, 1985) without carefully assessing the reliability of the additional information. This conservatism should be noted because more aggressive behaviour would have improved accuracy considerably (Diamantopoulos and Mathews, 1989).

Joa Sang Lim and Marcus O’Connor Judgemental Adjustment: ESfectiveness and Biases 16 1
Feedback Feedback has been emphasized as a learning tool (Hammond, 1971) and is quite commonly featured in any FSS. Surprisingly, enough, however, few adjustment studies examined its utility for learning in time-series settings. The studies reported here cast doubt on the efficacy of the feedback mechanism in the FSS. It is disturbing that people did not learn the task from the feedback presented over time and their conservative behaviour was persistent. Several reasons may be advanced. First, it is uncertain whether people used it (Ashton, 1981; p. 57). It was enlarged in Experiment 2 to catch people’s attention. People were also required to look at the message about the comparative accuracy between their forecast error and that of the statistical model. The enlarged feedback was, however, of little value. Although the feedback was made more salient, subjects still could have ignored it. Second, the feedback might have been ineffective in overcoming their conservatism ( e g Hammond et al., 1973). We provided the graphical bar chart feedback, arguably the most efficient tool for allowing subjects to monitor their performance as compared to that of the statistical forecasts. The graphical feedback seemed to be effective initially but ended up being less useful. Third, feedback might have initiated a stressful situation, especially in the presence of a high standard (Ashton, 1990). The negative feedback that revealed the inferior forecast performance of people over the good forecast (e.g. a damped forecast) might have triggered ‘a search for more effective alternative behaviours’ (Taylor et ai., 1984, p. 106) as opposed to simply accepting the forecast of the statistical model. This trial-and-error approach would certainly harm decision consistency and, thus, lead to a deterioration in forecast accuracy (Arkes et al., 1986). Fourth, people might have been overconfident about their ability (Ashton, 1990) and felt that they could get all information they wanted from the time-series information itself. This erroneous perception might have led people to disregard or reinterpret negative feedback, and this might have made it difficult for them to learn from experience (Einhorn, 1980) Taken together, feedback was not a simple mechan- ism and seemed to involve more complex cognitive processes (Ilgen et al., 1979).
Misperception and misaggregation Changing forms of feedback was ineffective in mitigating against the conservative behaviour. So the results found in Experiment 3 drive us to conclude thatfaulty judges might be more responsible for it (Fischhoff, 1982). We speculated that the cause of this inappropriate adjustment strategy was due to either (1) a problem in discerning the reliability of statistical forecasts (misperception) or (2) a problem in aggregating the statistical forecast with the initial judgemental forecast (misaggregation). In pointing out the problem of misaggregation, Edwards (1982; p. 359) stated that ‘men perceive each datum accurately and are well aware of its individual diagnostic meaning, but are unable to combine its diagnostic meaning well with the diagnostic meaning of other data when revising their opinions’. Thus, those with the aggregation DSS should perform better than those without, mainly due to reduced mental load in combining the statistical forecast with their own forecast. The DSS group could also focus on estimating the diagnosticity of statistical forecasts more carefully without worrying about aggregation. On the contrary, it was found that people with the decision aid for aggregation did not perform better than the subjects in the NO-DSS condition. This suggests that misperception would be the major source of an error (Schmitt, 1978). If misperception is the major source of conservatism, unequal subjective weighting must be avoided wherever possible. Empirical studies on the judge’s weighting ability are mixed (see Reilly and Doherty, 1992). In time-series settings, a general conclusion is that mechanical combination of subjective weights did not perform very well and simple averaging is suggested (Law- rence et a/., 1986).
The findings of this paper should be generalized with caution. First, we employed model-of-man analyses to examine the cognitive process in time series judgemental adjustment. Although this method is unobtrusive and robust (see Brehmer and Brehmer, 1988; Kleinmuntz, 1990), process tracing
162 Journal of Behavioral Decision Making Vol. 8, Iss. No. 3
techniques (for a review, see Todd and Benbasat, 1987) may provide deeper insight into the adjustment behaviour. Given the empirical evidence (Diamantopoulos and Mathews, 1989) that managers differ from each other in the way the adjustment is made, these techniques may be useful in understanding individualized judgments (Benbasat and Dexter, 1982), offsetting the limitations described in this paper by pooling the data across people. Second, we know that judgemental adjustment is often made in a context where political and organizational issues often override its effectiveness. Additional insight may be obtained by studying the adjustment process in business. Field studies may be useful to explore these issues (Goodwin and Wright, 1993).
CONCLUSIONS
This study has focused on the way in which people integrate statistical forecasts provided to them with their own forecasts. Increasing use of forecasting systems with statistical support for extrapolation (Dalrymple, 1987) highlights the need to understand the way this integration takes place. The study has shown that, while people are able to discriminate between the reliability of the statistical forecasts, there is still an extremely strong tendency to place too much faith in one’s own forecast rather than that of the statistical forecast. Moreover, people do not seem to learn - in fact, they got worse over time. They did not respond in any useful fashion to graphical feedback that would arguably have led to improvement at the task over time. Even the salience of the feedback - devoting a separate screen to the feedback- had little effect. A plausible explanation is that people have difficulty with the process of combination, either the setting of the weights for the two forecasts or the mechanics of the combination. The third study reported above suggests that the problem is not so much with the mechanics of combination (although considerable evidence in the past suggests this), but there may also be problems associated with actually specifying the weights themselves. Thus, the suggestion that people only have problems with the arithmetic and not with the weighting system appears incorrect. A system providing decision support actually produced less accurate forecasts.
Overall, this study lends further support to the proposition that people should not be permitted to adopt any role in the combination process. Simple mechanical averaging would have been much preferable.
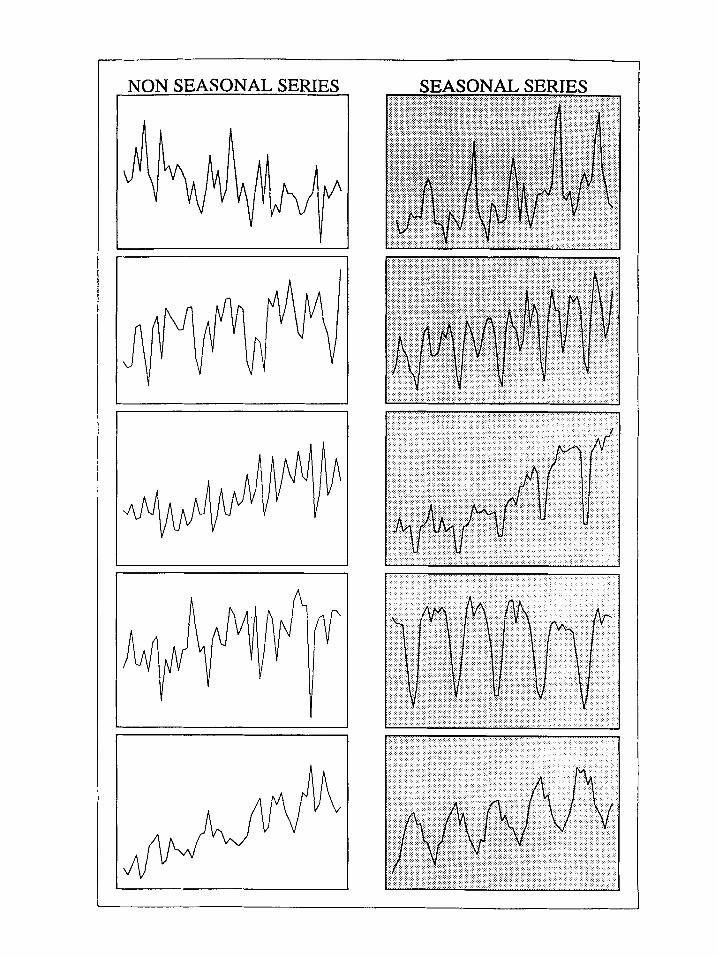
APPENDIX
The following graphs are examples (both seasonal and non seasonal) of the time series used in the Experiments.

164 Journal of Behavioral Decision Making Vol. 8, Iss. No. 3
The following illustrates the task instrument screen used by the subjects in the Experiments. It shows the screen was composed of a time-series window (where the subject observed the past data and statistical forecasts and recorded their own forecasts), the interface window (where the subject adjusted their forecast and recorded the final decision) and the feedback window (where outcome feedback was provided on the accuracy of their final forecast and the statistical forecast).

-
.... C . . .
4
i
166 Journal of Behavioral Decision Making Vol. 8, Zss. No. 3
REFEKENCES
Andreassen, P. B. and Kraus, S. J. ‘Judgemental extrapolation and the salience of change’, JournalojForecasting, 9
Arkes, H. R., Dawes, R. M. and Christensen, C. ‘Factors influencing the use of a decision rule in a probabilistic
Armstrong, J. S . ‘The Ombudsman: research on forecasting: a quarter century review 196&1984‘, Interfaces, 16, 1
Armstrong, J. S. and Collopy, F. ‘The selection of error measures for generalising about forecasting methods:
Ashton, A. H. and Ashton, R. H. ‘Aggregating subjective forecasts: some empirical results’, Management Science,
(1990), 347-72.
task’, Organizational Behavior and Human Decision Processes, 37 (1986), 93-1 10.
(1986), 89-109.
empirical comparisons’, International Journal of Forecasting, 8, 1 (1992), 69-80.
31, 12 (1985), 1499-1508. Ashton, A. H. and Ashton, R. H. ‘Sequential belief revision in auditing’, The Accounting Review, LXII, 4 (1988),
6234 1. Ashton, R. H. ‘A descriptive study of information evaluation’, Journal of Accounting Research, 19,1(1981), 42-61. Ashton, R. H. ‘Pressure and performance in accounting decision settings: paradoxical effects of incentives,
feedback, and justification’, Journal of Accounting Research, 28 (1990), 148-80. Bamber, E. M. ‘Expert judgment in the audit team: a source reliability approach’, Journal of Accounting Research,
21,2 (1983), 39U12 . Benbasat, I. and Dexter, A. S. ‘Individual differences in the use of decision support aids’, Journal of Accounting
Research, 20, 1 (1982), 1-1 1. Blattberg, R. C. and Hoch, S. J. ‘Database models and managerial intuition - 50% model + 50% manager’,
Management Science, 36,8 (1990), 887-99. Brehmer, A. and Brehmer, B. ‘What have we learned about human judgment from thirty years of policy capturing?’
in Brehmer, B. and Joyce, C . R. B. (eds), Human Judgment: The SJT View (pp. 75-1 14), Amsterdam: Elsevier Science Publishers BV (North-Holland), 1988.
Carbone, R. and Armstrong, J. S. ‘Evaluation of forecasting methods - results of a survey of academicians and practitioners’, Journal of Forecasting, 1 2( 1982), 21 5-1 7.
Carbone, R., Anderson, A., Corriveau, Y. and Corson, P. P. ‘Comparing for different time series methods the value of technical expertise, individualised analysis, and judgemental adjustment’, Management Science, 29,s (1983), 559-66.
Carbone, R. and Gorr, W. L. ‘Accuracy of judgemental forecasting of time series’, Decision Sciences, 16 (1985),
Clement, R. ‘Combining forecasts: a review and annotated bibliography’, International Journal of Forecasting, 5
Dalrymple, D. J. ‘Sales forecasting practices: results from a United States survey’, International Journal of
Dawes, R. M. and Corrigan, B. ‘Linear models in decision making’, Psychological Bulletin, 81, 2 (1974), 95-106. Dawes, R. M., Faust, D. and Meehl, P. E. ‘Clinical versus actuarial judgment’, Science, 243, March (1989), 1668-73. Diamantopoulos, A. and Mathews, B. ‘Factors affecting the nature and effectiveness of subjective revision in sales
Edmundson, R. ‘decomposition: a strategy for judgemental forecasting’, Journal of Forecasting, 4 (1990), 305-14. Edmundson, B., Lawrence, M. and O’Connor, M. ‘The use of non-time series information in sales forecasting: a
case study’, Journal of Forecasting, 7 (1988), 201-1 1. Edwards, W. ‘Conservatism in human information processing’, in Kahneman, D., Slovic, P. and Tversky, A. (eds),
Judgment under Uncertainty: Heuristics and Biases, (pp. 359-69) New York: Cambridge University Press, 1982. Einhorn, H. J. ‘Learning from experience and suboptimal rules in decision making’, in Wallsten, T. S. (ed.),
Cognitive Processes in Choice and Decision Behavior (pp. 1-20) Hillsdale, NJ. Lawrence Erlbaum Associates, 1980.
Fischhoff, B. ‘Debiasing’, in Kahneman, D., Slovic, P. and Tversky, A. (eds), Judgment under Uncertainty: Heuristics and Biases (pp. 422-44), New York: Cambridge University Press, 1982.
Funaro, J. F. ‘An empirical analysis of five descriptive models for cascaded inference’, Organisational Rehaviour and Human Decision Processes, 14 (1973, 186206.
Gardner, E. S., Jr and McKenzie, E. ‘Forecasting trends in time series’, Management Science, 31, 10 (1985), 123746.
Goldberg, L. R. ‘Simple models or simple processes? Some research on clinical judgement’, American Psychologist, 23, 7 (1968), 483-96.
153-60.
(1989), 559-83.
Forecasting, 3 (1987), 379-91.
forecasting: an empirical study’, Managerial and Decision Economics, 10 (1989), 51-9.
Joa Sang Lim and Marcus O’Connor Judgemental Adjustment: Effectiveness and Biases 167
Goodwin, P. and Wright, G . ‘Improving judgemental time series forecasting: a review of the guidance provided by
Hammond, K. R. ‘Computer graphics as an aid to learning’, Science, 172,3986 (1971), 1903-8. Hammond, K. R., Stewart, T. R., Brehmer, B. and Steinmann, D. 0. ‘Social judgment theory’, in Kaplan, M. F. and
Schwartz, S . (eds), Human Judgment and Decision Processes, (pp. 271-3 12), New York: Academic Press, 1975. Hammond, K. R., Summers, D. A. and Deane, D. H. ‘Negative effects of outcome-feedback in multiple-cue
probability learning’, Organizational Behavior and Human Performance, 9 (1973), 30-34. Hogarth, R. M. and Makridakis, S. ‘Forecasting and planning: an evaluation’, Management Science, 27,2 (1981),
Huck, S. W., Cormier, W. H. and Bounds, W. G., Jr. Reading Statistics and Research, New York: Harper & Row,
Ilgen, D. R., Fisher, C. D. and Taylor, M. S. ‘Consequences of individual feedback on behavior in organizations’,
Jarvenpaa, S. L. and Dickson, G. W. ‘Graphics and managerial decision making: research based guidelines’,
Joyce, E. J. and Biddle, G. C. ‘Anchoring and adjustment in probabilistic inference in auditing’, Journal of
Jungermann, H. ‘The two camps on rationality’, in Arkes, H. R. and Hammond, K. R. (eds), Judgement and
Kinney, W. R., Jr and Uecker, W. C. ‘Mitigating the consequences of anchoring in auditor judgements’, The
Kleinmuntz, B. ‘Why we still use our heads instead of formulas: toward an integrative approach’, Psychological
Langer, E. ‘The illusion of control’, Journal of Personality and Social Psychology, 32 (1979, 31 1-28. Lawrence, M. J., Edmundson, R. H. and O’Connor, M. J. ‘An examination of the accuracy of judgemental
extrapolation of time series’, International Journal of Forecasting, 1 (1989, 25-35. Lawrence, M. J., Edmundson, R. H. and O’Connor, M. J. ‘The accuracy of combining judgemental and statistical
forecasts’, Management Science, 32, 12 (1986), 1521-32. Lawrence, M. J., Edmundson, R. H. and O’Connor, M. J. ‘Sales forecasting practices in consumer products
organisation’, Working Paper, School of Information Systems, The University of New South Wales, Australia, (1993).
research’, International Journal of Forecasting, 9 (1993), 147-61.
1 15-37.
1974.
Journal of Applied Psychology, 64,4 (1979), 349-71.
Communications of the ACM, 31,6 (1988), 764-74.
Accounting Research, 19, 1 (1981), 12M5.
Decision Making (pp. 62741), Cambridge: Cambridge University Press, 1986.
Accounting Review, LVII, 1 (1982), 55-69.
Bulletin, 107, 3 (1990), 296310.
. , Lawrence, M. J. and O’Connor, M. J. ‘Exploring judgemental forecasting’, International Journalof Forecasting, 8
(1992) 15-26. Lobo, G. J. and Nair, R. D. ‘Combining judgemental and statistical forecasts: an application to earnings forecasts’,
Lopes, L. L. ‘Averaging rules and adjustment processes in Bayesian inference’, Bulletin of the Psychonomic Society, Decision Science, 2 (1 990), 44660.
23,6 (1985), 509-12. Mahmoud, E. ‘Combining forecasts: some managerial issues’, International Journal of Forecasting, 5 (1 989),
599-600. Makridakis, S., Anderson, A., Carbone, R., Fildes, R., Hibon, M., Lewandowski, R., Newton, J., Parzen, E. and
Winkler, R. ‘The accuracy of extrapolation (time-series) methods: results of a forecasting competition’, Journal of Forecasting, 1 (1982), 1 11-53.
Makridakis, S., Wheelwright, S. and McGee, V. Forecasting : Methods and Applications, 2nd edition, New York: Wiley, 1983.
Mason, R. 0. and Moskowitz, H. ‘Conservatism in information processing: implications for management infor- mation systems’, Decision Science, 3, 4 (1972), 35-55.
Mathews, B. P. and Diamantopoulos, A. ‘Managerial intervention in forecasting: an empirical investigation of forecast manipulation’, International Journal of Research in Marketing, 3 (1986), 3-10.
Mathews, B. P. and Diamantopoulos, A. ‘Judgmental revision of sales forecasts: a longitudinal extension’, Journal of Forecasting, 8 (1989), 12940.
Mathews, B. P. and Diamantopoulos, A. ‘Judgemental revision of sales forecasts: the relative performance of judgementally revised versus non-revised forecasts’, Journal of Forecasting, 11 (1 992), 569-76.
McNees, S. K. ‘The role of judgement in macroeconomic forecasting accuracy’, International Journal of Fore- casting, 6. 3 (1990), 287-99.
Meehl, P. E. Clinical versus Statistical Prediction: A Theoretical Analysis anda Review of the Evidence, Minneapolis: University of Minnesota Press, 1954.
Meehl, P. ‘Causes and effects of my disturbing little book’, Journal of Personality Assessment, 50 (1988), 370-75.
168 Vol. 8, Iss. No. 3
Mentzer, J. T. and Cox, J. E. ‘Familiarity, application, and performance of sales forecasting techniques’, Journal of
O’Brien, R. G., and Kaiser, M. K. ‘MANOVA method for analysing repeated measures designs: an extensive
Peterson, D. K. and Pitz, G. F. ‘Effect of input from a mechanical model on clinical judgment’, Journal of Applied
Phillips, L. D. and Edwards, W. ‘Conservatism in a simple probability inference task’, Journal of Experimental
Poulton, E. C. Tracking Skill and Manual Control, New York: Academic Press, 1974. Reilly, B. A. and Doherty, M. E. ‘The assessment of self-insight in judgment policies’, Organizational Behavior and
Human Decision Processes, 53 (1992), 285-309. Remus, W. and Kotteman, J. ‘Anchor-and-adjustment behavior in a dynamic decision environment’, Working
Paper, University of Hawaii, 1992. Rothe, J. T. ‘Effectiveness of sales forecasting methods’, Industrial Marketing Management, 7 (1978), 114-
18. Sanders, N. R. ‘Accuracy of judgemental forecasts: a comparison’, OMEGA: The International Journal of
Management Science, 20, 3 (1992), 353-64. Sanders, N. R. and Ritzman, L. P. ‘The need for contextual and technical knowledge in judgemental forecasting’,
Journal of Behavioural Decision Making, 5 (1992), 39-52. Schmitt, N. ‘Comparison of subjective and objective weighting strategies in changing task situations’, Organiz-
ational Behavior and Human Performance, 21 (1978), 171-188. Schum, D. ‘Current developments in research in cascaded inference processes’, in Wallsten, T. S. (ed.), Cognitive
Processes in Choice and Decision Behavior, (pp. 179-210), Hillsdale, NJ: Lawrence Erlbaum Associates, 1980. Slovic, P. and Lichtenstein, S. ‘Comparison of Bayesian and regression approaches to the study of information
processing in judgment’, Organizational Behaviour and Human Performance, 6 (197l), 649-744. Taylor, M. S., Fisher, C. D. and Ilgen, D. R. ‘Individuals’ reactions to performance feedback in organizations: a
control theory perspective’, in Rowland, K. M. and Ferris, G. R. (eds), Research in Personnel and Human Resources Management, 2 (pp. 81-124), JAI Press, Greenwich, Conn. 1984.
Todd, P. and Benbasat, I. ‘Process tracing methods in decision support systems research: exploring the black box’, MIS Quarterly, December (1987), 493-5 12.
Tversky, A. and Kahneman, D. ‘Judgment under uncertainty: heuristics and biases’, Science, 185 (1974), 1124-31. Willemain, T. R. ‘Graphical adjustment of statistical forecasts’, International Journal of Forecasting, 5 (1989)
Willemain, T. R. The effort of graphical adjustment on forecast accuracy’, International Journal of Forecasting, 7
Journal of Behavioral Decision Making
Forecasting, 3, 1 (1984), 27-36.
primer’, Psychological Bulletin, 97, 2 (1983, 316-33.
Psychology, 71, 1 (1986), 163-7.
Psychology, 72, 3 (1966), 346-54.
179-85.
(1991), 1514. Wolfe, C. and Flores, B. ‘Judgemental adjustment of earnings forecasts’, Journal of Forecasting, 9 (l990), 389-405. Wright, W. F. and Anderson, U. ‘Effects of situation familiarity and financial incentives on use of the anchoring
and adjustment heuristic for probability assessment’, Organizational Behavior and Human Decision Processes, 44 (1989), 68-82.
Authors’ address: Joa Sang Lim and Marcus O’Connor, School of Information Systems, The University of New South Wales, PO Box 1, Kensington, NSW 2033, Australia.