Psychophysiological effects of habitual caffeine consumption
Upload
khangminh22Category
view
1download
0
i
The influence of cognitive biases on
psychophysiological vulnerability to stress
Katherine Elizabeth Randall
A thesis submitted for the degree of Doctor of Philosophy
University of East Anglia, Norwich
Norwich Medical School
November, 2012
This copy of the thesis has been supplied on condition that anyone who consults it is
understood to recognise that its copyright rests with the author and that use of any
information derived there from must be in accordance with current UK Copyright Law. In
addition, any quotation or extract must include full attribution.
brought to you by COREView metadata, citation and similar papers at core.ac.uk
provided by University of East Anglia digital repository

ii
Declaration of Contribution of Work
Studies one, five, and six were designed by Katherine Randall (with guidance from
supervisors). Studies two and three were collaboratively designed by Katherine Randall and
Dr Bristow (Anglia Ruskin University). Study four was collaboratively designed by
Katherine Randall, Dr Bristow (Anglia Ruskin University), and Drs Dunn and Brodbeck
(Cognition and Brain Sciences Unit, Cambridge).
Data collection for studies one, two, five, and six was carried out exclusively by Katherine
Randall. Data was collected for study three by Lauren Barrett (undergraduate), with guidance
from Katherine Randall and supervision by Dr Bristow. For study four, data collection was
started (17 participants of which 5 were excluded from analysis) by Charlie Powell
(undergraduate) and completed by Katherine Randall (74 participants of which 5 were
excluded from analysis).
Studies one, two, four, five, and six were financed by Wellcome Trust Project Grant 074073,
which was awarded to Drs Mackintosh, Hoppitt, and Bristow. Study three was financed by
Anglia Ruskin University. Studies one, three, four, and five were based at Anglia Ruskin
University, Cambridge. Studies two and six were based at the University of East Anglia,
Norwich.
All saliva assaying was conducted by Katherine Randall at the Tissue Analysis Laboratory,
Anglia Ruskin University, Cambridge. All database compilation and statistical analysis was
conducted by Katherine Randall.

iii
Acknowledgements
I would like to thank my supervisors, Dr Laura Hoppitt, Dr Laura Jobson, and Dr Bundy
Mackintosh, for all their help and direction over the last four years. Thank-you for sticking by
me throughout the ups and downs.
Thank-you to the Tissue Analysis Laboratory; to Dr Bristow and Katy Parker for introducing
me to the World of Spit, and to Flexo (I and II) for enabling (largely) hassle-free saliva
analysis. I am grateful to Anglia Ruskin University, especially the Psychology department,
for being so accommodating and allowing me access to their students. Massive thanks are, of
course, extended to all the participants who gave up their time to help out in my research; for
their patience, energy, and interest.
I owe thanks to my family for their blind support and encouragement throughout my PhD.
Particular recognition is given to my Mum and Dad for providing me with all the
opportunities in life that have enabled me to achieve this.
Lastly, but by no means least, I want to acknowledge and thank my better half. Matt, as
always, you have been my rock. Your countless efforts to keep me grounded, restore my
sanity, and motivate me to the end have been second to none. Thank you for all you have
done and continue to do to support me.
“If you’re not failing every now and again, it’s a sign you’re not doing anything very
innovative.” - Woody Allen

iv
Abstract
Individuals who disproportionately attend to negative aspects of a situation (attention bias),
or who unduly interpret ambiguity in a negative manner (interpretive bias) report more
psychological ill-effects of stress than those with balanced or positively-skewed
inclinations. Cognitive Bias Modification (CBM) techniques improve maladaptive biases
through implicitly-based association learning, with induced positive biases buffering the
future perception of stress. Six experimental studies investigated the next stage of this link
to bolster and significantly enhance the clinical potential of CBM; how natural and
modified biases influence the biological response to acute stress. Studies 1-3 established
reliable protocols associated with using laboratory stress tasks and measuring salivary
stress biomarkers. Studies 4-5 investigated links between natural and trained biases on
psychological and biological stress responses. Study 6 tested the immediate robustness of
CBM training. While psychological and physiological stress responses were initiated,
attentional biases were not found to moderate acute biological stress responses.
Conversely, interpretive biases were related to the recovery from the acute stress and
positive interpretive training led to a faster biological recovery from acute stress in high
test-anxious individuals relative to sham training. However, neither bias was found to
moderate the psychological response to stress. Further, evidence emerged to caution a
more selective use of CBM. Positive interpretive training led to a more negative bias and
slower physiological recovery to stress in individuals with low trait anxiety or inherent
positive biases. From these results, information processing biases are proposed to have less
influence on genuinely stressful events but, instead, govern the extent to which
unthreatening situations are perceived as stressful. Consequently, negative biases are
hypothesised to cause unnecessary and excessive perceptions of stress, resulting in chronic
hyper-activity. Combined CBM-A/I tools are recommended to jointly realign maladaptive
biases, enabling an effective, efficient, but transitory physiological response to real stress.

v
List of Contents
1.0 CHAPTER ONE - INTRODUCTION................................................................................. 1
1.1 Overview .......................................................................................................................... 1
1.2 Stress ................................................................................................................................ 2
1.2.1 Conceptualising Stress .............................................................................................. 2
1.2.2 Physiological Response to Stress .............................................................................. 4
1.2.3 Capturing the Physiological Stress Response ........................................................... 5
1.2.4 The Perception of Stress ......................................................................................... 10
1.3 Cognitive Biases ............................................................................................................ 11
1.3.1 Attention Biases and Anxiety ................................................................................. 11
1.3.2 Interpretive Biases and Anxiety .............................................................................. 13
1.3.3 Model of Cognitive Bias ......................................................................................... 14
1.3.4 Cognitive Bias and the Physiological Stress Response .......................................... 16
1.4 Cognitive Bias Modification .......................................................................................... 18
1.4.1 The Potential of Bias Modification ......................................................................... 21
1.4.2 CBM and the Physiological Stress Response ......................................................... 22
1.5 Focus and Rationale for this Thesis ............................................................................... 24
2.0 CHAPTER TWO – SALIVA STORAGE AND ANALYSIS ........................................... 27
2.1 Tissue Analysis Laboratory ....................................................................................... 27
2.2 Sample Preparation .................................................................................................... 27
2.3 Cortisol Assay ............................................................................................................ 27
2.4 Alpha Amylase Assay ................................................................................................ 28

vi
2.5 Flow Rate ................................................................................................................... 29
2.6 Storage and Destruction of Samples .......................................................................... 29
3.0 CHAPTER THREE: STUDY ONE – On being rejected: Psychological and physiological
responses to an acute social rejection task ............................................................................... 30
3.1 Method ........................................................................................................................... 36
3.1.1 Design ..................................................................................................................... 36
3.1.2 Participants .............................................................................................................. 36
3.1.3 Materials ................................................................................................................. 39
3.1.4 Saliva Collection and Analysis ............................................................................... 45
3.1.5 Procedure ................................................................................................................ 46
3.1.6 Data Analysis Plan .................................................................................................. 48
3.2 Results ............................................................................................................................ 49
3.2.1 Data Exploration ..................................................................................................... 49
3.2.2 Participant Characteristics ...................................................................................... 49
3.2.3 Self-Reported Stress................................................................................................ 50
3.2.4 VAS......................................................................................................................... 53
3.2.5 Cortisol .................................................................................................................... 56
3.2.6 Alpha Amylase and Flow Rate ............................................................................... 57
3.3 Discussion ...................................................................................................................... 60
4.0 CHAPTER FOUR: STUDY TWO – Investigating the need for a practice sample in
salivary biomarker research ..................................................................................................... 68
4.1 Method ........................................................................................................................... 74
4.1.1 Design ..................................................................................................................... 74

vii
4.1.2 Participants .............................................................................................................. 74
4.1.3 Materials ................................................................................................................. 76
4.1.4 Procedure ................................................................................................................ 77
4.1.5 Data Analysis Plan .................................................................................................. 78
4.2 Results ............................................................................................................................ 80
4.2.1 Data Exploration ..................................................................................................... 80
4.2.2 Participant Characteristics ...................................................................................... 80
4.2.3 Changes in Mood .................................................................................................... 82
4.2.4 Hypothesis 1: Saliva Flow ...................................................................................... 84
4.2.5 Hypotheses 2 and 3: Alpha Amylase ...................................................................... 86
4.2.6 Hypothesis 4: Cortisol............................................................................................. 87
4.3 Discussion ...................................................................................................................... 89
5.0 CHAPTER FIVE: STUDY THREE – Saliva collection techniques: Comparing passive
drool with collection via an oral swab ..................................................................................... 93
5.1 Method ........................................................................................................................... 99
5.1.1 Design ..................................................................................................................... 99
5.1.2 Participants .............................................................................................................. 99
5.1.3 Materials ............................................................................................................... 101
5.1.4 Procedure .............................................................................................................. 102
5.1.5 Data Analysis Plan ................................................................................................ 103
5.2 Results .......................................................................................................................... 104
5.2.1 Data Exploration ................................................................................................... 104

viii
5.2.2 Participant Characteristics .................................................................................... 104
5.2.3 Changes in Mood .................................................................................................. 106
5.2.4 Hypothesis One ..................................................................................................... 107
5.2.5 Hypothesis Two .................................................................................................... 108
5.3 Discussion .................................................................................................................... 111
6.0 CHAPTER SIX: STUDY FOUR – The OCam study: An investigation into the predictive
capacity for natural cognitive biases to determine psychophysiological reactions to an
ostracism stressor ................................................................................................................... 115
6.1 Method ......................................................................................................................... 124
6.1.1 Design ................................................................................................................... 124
6.1.2 Participants ............................................................................................................ 124
6.1.3 Materials ............................................................................................................... 126
6.1.4 Procedure .............................................................................................................. 133
6.1.5 Data Analysis Plan ................................................................................................ 134
6.2 Results .......................................................................................................................... 137
6.2.1 Data Exploration ................................................................................................... 137
6.2.2 Participant Characteristics .................................................................................... 137
6.2.3 Baseline Sample .................................................................................................... 139
6.2.4 Creating Bias Index Scores ................................................................................... 140
6.2.5 Hypothesis One ..................................................................................................... 141
6.2.6 Hypothesis Two .................................................................................................... 145
6.3 Discussion .................................................................................................................... 152

ix
7.0 CHAPTER SEVEN: STUDY FIVE – An investigation into the influence of CBM-I
training on the psychophysiological effects of acute stress ................................................... 157
7.1 Method ......................................................................................................................... 163
7.1.1 Design ................................................................................................................... 163
7.1.2 Participants ............................................................................................................ 165
7.1.3 Materials ............................................................................................................... 165
7.1.4 Procedure .............................................................................................................. 170
7.1.5 Data Analysis Plan ................................................................................................ 171
7.2 Results .......................................................................................................................... 173
7.2.1 Data Exploration ................................................................................................... 173
7.2.2 Participant Characteristics .................................................................................... 173
7.2.3 Interpretive Bias .................................................................................................... 174
7.2.4 Psychological Response to Stressor and CBM-I .................................................. 175
7.2.5 Physiological Response to Stressor and CBM-I ................................................... 180
7.3 Discussion .................................................................................................................... 188
8.0 CHAPTER EIGHT: STUDY SIX – Testing the immediate robustness of a single session
of CBM training ..................................................................................................................... 193
8.1 STUDY 6A – CBM-A ................................................................................................ 199
8.1.1 Method .................................................................................................................. 199
8.1.1.1 Design ............................................................................................................. 199
8.1.1.2 Participants ...................................................................................................... 199
8.1.1.3 Materials ......................................................................................................... 200
8.1.1.4 Procedure ........................................................................................................ 202

x
8.1.1.5 Data Analysis Plan .......................................................................................... 203
8.1.2 Results ................................................................................................................... 204
8.1.2.1 Participant Characteristics .............................................................................. 204
8.1.2.2 Data Cleaning.................................................................................................. 204
8.1.2.3 Training Effects .............................................................................................. 205
8.1.2.4 Post-hoc Group Allocation ............................................................................. 206
8.2 STUDY 6B – CBM-I .................................................................................................. 211
8.2.1 Method .................................................................................................................. 211
8.2.1.1 Design ............................................................................................................. 211
8.2.1.2 Participants ...................................................................................................... 211
8.2.1.3 Materials ......................................................................................................... 212
8.2.1.4 Procedure ........................................................................................................ 214
8.2.1.5 Data Analysis Plan .......................................................................................... 214
8.2.2 Results ................................................................................................................... 215
8.2.2.1 Participant Characteristics .............................................................................. 215
8.2.2.2 Data Cleaning.................................................................................................. 215
8.2.2.3 Training Effects .............................................................................................. 216
8.2.2.4 Post-hoc Group Allocation ............................................................................. 218
8.3 Discussion .................................................................................................................... 222
9.0 CHAPTER NINE – GENERAL DISCUSSION............................................................. 227
9.1 Summary of Studies ..................................................................................................... 228
9.2 Physiological Responses to Stressor Tasks ................................................................. 234

xi
9.2.1 Task selection........................................................................................................ 234
9.2.2 Sample collection points. ...................................................................................... 239
9.3 Bias and the Stress Response ....................................................................................... 243
9.3.1 Attentional bias. .................................................................................................... 244
9.3.2 Interpretive bias. ................................................................................................... 246
9.4 Clinical Potential of CBM Methods ............................................................................ 249
9.5 Limitations and Future Research ................................................................................. 250
9.5.1 Stages of attention. ................................................................................................ 250
9.5.2 Inconsistent findings. ............................................................................................ 252
9.5.3 Stigmatising the stress response............................................................................ 254
9.5.4 Response or recovery? .......................................................................................... 255
9.5.5 Control group. ....................................................................................................... 257
9.5.6 Single measure dependence. ................................................................................. 258
9.5.7 Gender. .................................................................................................................. 259
9.5.8 Trend exploration. ................................................................................................. 261
9.6 Conclusion ................................................................................................................... 261
References .............................................................................................................................. 264
APPENDIX I – In-House sAA Assay Development ............................................................. 298
APPENDIX II - Study 4: Attention Bias Test Stimuli .......................................................... 308
APPENDIX III - Study 4: Interpretive Bias Test Stimuli...................................................... 311
APPENDIX IV – Study 4: OCam scripts .............................................................................. 319
APPENDIX V – Study 5: CBM-I Training Stimuli .............................................................. 323
APPENDIX VI – Study 5: Interpretive Bias Test Stimuli ..................................................... 337

xii
APPENDIX VII – Study 6A: CBM-A Stimuli ...................................................................... 344
APPENDIX VIII – Study 6B: CBM-I Stimuli ...................................................................... 346

xiii
List of Tables
Table 1 Participant characteristics ............................................................................... 51
Table 2 Total reported stress over time ......................................................................... 52
Table 3 Mean cortisol data (µg/dl) ................................................................................ 56
Table 4 Mean sAA activity and secretion ...................................................................... 58
Table 5 The relationship between sAA and saliva flow changes over time ................... 59
Table 6 Participant trait characteristics ........................................................................ 81
Table 7 Descriptive data for reported positive and negative affect over time ............... 84
Table 8 Mean sAA secretion (U/min) and variation ..................................................... 87
Table 9 Descriptive data of participant trait characteristics ........................................ 105
Table 10 Correlation coefficients for measures assayed through samples collected via
passive drool or SOS techniques ......................................................................
109
Table 11 Means and standard deviations for participant trait and entry state
characteristics ...................................................................................................
138
Table 12 Mean (and SD) comparisons for baselines 1-2 and statistical output .............. 139
Table 13 The relationship between primary need subscales and social manipulation ... 144
Table 14 The relationship between primary need subscales and social manipulation ... 145
Table 15 Summary of regression analyses testing moderating effects of group
allocation and attentional bias .........................................................................
147
Table 16 Summary of regression analyses testing effects of group allocation and
interpretive bias ................................................................................................
148
Table 17 Summary of regression analyses testing moderating effects of group
allocation and interpretive bias ........................................................................
150
Table 18 Mean data for participant trait measures ......................................................... 174

xiv
Table 19 Mean (µg/dL) and variance of cortisol concentration throughout the study ... 180
Table 20 Descriptive data for participants across the study ........................................... 204
Table 21 Mean (and SD) Attentional Bias Index scores for Tests 1, 2, and 3 ................. 206
Table 22 Descriptive data for participants across the study ........................................... 215
Table 23 The difference between IBI scores over time according to homograph
familiarity ..........................................................................................................
217
Table 24 Intra-assay precision performance data ........................................................... 307
Table 25 Practice words for attention bias test ............................................................... 308
Table 26 Buffer words for attention bias test ................................................................... 308
Table 27 Attention bias test 1 wordlist ............................................................................ 309
Table 28 Attention bias test 2 wordlist ............................................................................ 310
Table 29 CBM-A word pairs, list 1 .................................................................................. 344
Table 30 CBM-A word pairs, list 2 .................................................................................. 344
Table 31 CBM-A word pairs, list 3 .................................................................................. 345
Table 32 CBM-A word pairs, list 4 .................................................................................. 345
Table 33 CBM-I association words, list 1 ....................................................................... 346
Table 34 CBM-I association words, list 2 ....................................................................... 347
Table 35 CBM-I association words, list 3 ....................................................................... 348
Table 36 CBM-I association words, list 4 ....................................................................... 349
Table 37 CBM-I association words, list 5 ....................................................................... 350
Table 38 CBM-I association words, list 6 ....................................................................... 351

xv
List of Figures
Figure 1. Overview of Study 1’s experimental design ........................................... 38
Figure 2. Mean stress scores and variation (SE). SM = Social manipulation ........ 52
Figure 3. Mean mood self-ratings (with standard error) for optimism (a),
happiness (b), distress (c), and tension (d). A higher score indicates
more intense feelings of the measure ......................................................
55
Figure 4. Time x condition group interaction on mean cortisol concentration ...... 57
Figure 5. Overview of Study 2’s experimental design ........................................... 75
Figure 6. The time x gender interaction for reported stress (SACL) in participants
who did not practice giving saliva .......................................
83
Figure 7. Mean unlogged flow rate changes over time for male participants only
split by condition (a) and for females only split by condition (b) ...........
86
Figure 8. Mean cortisol concentration change across time according to condition 88
Figure 9. Overview of Study 3’s experimental design ........................................... 100
Figure 10. The significant collection method x gender interaction for flow rate ..... 107
Figure 11. Overview of Study 4’s experimental design ........................................... 125
Figure 12. The starting scene of a neutral O-Cam video with a male virtual
researcher ................................................................................................
130
Figure 13. Change in reported rejection throughout the study ................................. 143
Figure 14. Overview of Study 5’s experimental design ........................................... 164
Figure 15. Mean (and SE) reported stress throughout the study (collapsed across
conditions) ...............................................................................................
176
Figure 16. Mean (and SE) reported stress throughout the study according to test
anxiety score ...........................................................................................
178
Figure 17. Mean (and SE) negative affect throughout the study (collapsed across
conditions) ...............................................................................................
179
Figure 18. Demonstrating the significant three-way interaction (time x condition x
test anxiety) for cortisol concentration .................................................
181
Figure 19. Mean change (and standard error) in cortisol concentration between
time points 1-2 for low test anxious participants ....................................
182
Figure 20. Mean change (and standard error) in cortisol concentration between
time points 1-2 for high test anxious participants ...................................
183

xvi
Figure 21. Mean change (and standard error) in cortisol concentration between
time points 4-5 for high test anxious participants ...................................
185
Figure 22. Changes in sAA secretion over the study (collapsed across conditions) 186
Figure 23. Overview of Study 6A’s experimental design ....................................... 200
Figure 24. Mean change (and SE) in ABI score in participants starting with a
positive bias .............................................................................................
208
Figure 25. Mean change (and SE) in ABI score in participants starting with a
negative bias ............................................................................................
209
Figure 26. Overview of Study 6B’s experimental design ......................................... 212
Figure 27. Mean change (and SE) in IBI scores in all participants .......................... 217
Figure 28. Mean IBI score change (and SE) in participants starting with a positive
bias ...........................................................................................................
219
Figure 29. Mean IBI score change (and SE) in participants starting with a negative
bias ...........................................................................................................
220
Figure 30. A flow chart showing the structure of samples and cortisol reactivity
throughout Study 5 ..................................................................................
235
Figure 31. sAA reactivity over Study 4 .................................................................... 237
Figure 32. Cortisol reactivity throughout Study 4 .................................................... 239
Figure 33. Flow chart to show stressor / saliva sample structure ............................. 240
Figure 34. Comparison of a cuvette with an MTP .................................................... 300
Figure 35. An illustration of the custom plate with four v-bottom troughs .............. 301
Figure 36. An illustration of the high and low control positioning across the intra-
assay precision test plate .........................................................................
306

xvii
List of Abbreviations
Bias-related
ABI Attentional bias index
CBM Cognitive bias modification
CBM-A Attentional bias modification
CBM-I Interpretive bias modification
IBI
Interpretive bias index
Psychological Disorders
GAD Generalised Anxiety Disorder
MDD Major Depressive Disorder
PTSD Post Traumatic Stress Disorder
SAD
Social Anxiety Disorder
General
CAT Cognitive ability tests (refers to a stressor task in Chapter 7)
CBSU Cognition and Brain Sciences Unit
H-TA High test anxious (refers to a participant group in Chapter 7)
L-TA Low test anxious (refers to a participant group in Chapter 7)
NA Negative affect
NHS National Health Service
OCam Ostracism Camera (refers to a stressor task in Chapter 6)
PA Positive affect
SM Social manipulation (refers to a stressor paradigm in Chapters 3 and 6)
SOS Salimetrics oral swab
TAL Tissue Analysis Laboratory

xviii
TES Threat Evaluation System
TMB
Tetramethylbenzidine
Questionnaires
A-RSQ (Adult) Rejection Sensitivity Questionnaire
DASS Depression Anxiety Stress Scale
FNE Fear of Negative Evaluation
GHQ General Health Questionnaire
IPIP International Personality Item Pool
ISEL Interpersonal Support Evaluation List
ISS Interpersonal Sensitivity Scale
PANAS Positive and Negative Affect Scale
PSS Perceived Stress Scale
SACL Stress Arousal Check List
SADS Social Avoidance and Distress Scale
STAI State Trait Anxiety Inventory
TAI Test Anxiety Inventory
TAS Test Anxiety Scale
TMAS Taylor Manifest Anxiety Scale
VAS
Visual Analogue Scales
Stress/physiology-related
ACTH Adrenocorticotrophic hormone
ANS Autonomic nervous system
CAR Cortisol awakening response
CRF Corticotrophin-releasing factor
GAS General adaptation syndrome

xix
HPA Hypothalamic-pituitary-adrenal
IgA Immunoglobulin A
sAA Salivary alpha amylase
SAM
Sympathetic-adrenal-medullary
Stressor tasks
MIST Montreal Imaging Stress Test
TMCT Trier Mental Challenge Test
TSST
Trier Social Stress Test
Units of measurement
µl Microlitres
M Molar
ml/min Millilitres per minute (flow rate)
ms Milliseconds
nm Nanometres
RPM Revolutions per minute
U/min Units per minute (alpha amylase secretion)
U/ml Units per millilitre (alpha amylase activity)
µg/dl Micrograms per decilitre (cortisol concentration)

CHAPTER ONE
1
1.0 CHAPTER ONE
INTRODUCTION
1.1 Overview
Over the last 25 years, much attention has been dedicated to the relationship between
cognitive biases and anxiety. This journey started by researchers noting a positive correlation
between cognitive bias and anxiety, with tendencies to focus predominantly on negative
aspects of a situation or interpreting ambiguity principally in a negative manner being
associated with higher levels of anxiety (e.g. MacLeod, Mathews, & Tata, 1986, Butler &
Mathews, 1983, respectively). In an effort to explore the issue of causation, researchers
developed computerised programmes that successfully modified natural attentional and
interpretive biases (MacLeod, Rutherford, Campbell, Ebsworthy, & Holker, 2002, Grey &
Mathews, 2000, respectively). These researchers found that training individuals towards a
more positive or negative bias led to changes in anxiety vulnerability to subsequent stressful
events (e.g. Wilson, MacLeod, Mathews, & Rutherford, 2006). Since then, the field has been
flooded with studies replicating these effects in different contexts (e.g. study venue, method
of delivery, see Beard 2011 for a review), and has recently demonstrated its potential in
clinical settings (e.g. Schmidt, Richey, Buckner, & Timpano, 2009).
Before these cognitive bias modification (CBM) methods can be introduced as
standalone clinical tools, there remains certain largely blank areas of investigation. One such
area concerns the extent to which the anxiety-bias relationship exists on a biological level,
that is, whether threat biases affect our physiological stress systems in the same manner as
our psychological stress systems. It seems logical to assume that cognitive biases do on some
level predict how individuals respond on both a psychological and physiological scale,
though there is currently little data to conclude this either way. As over-active biological

CHAPTER ONE
2
systems have been linked to adverse mental and physical health, finding a method of
reducing this activity (i.e. through bias modification) could further the clinical potential of
CBM. The overall objective of the research in this thesis is to explore the link between
attentional and interpretive biases and psychophysiological vulnerability to acute stress. This
objective shall be addressed by monitoring responses from the two main stress pathways
(hypothalamic-pituitary-adrenal and sympathetic axes) and investigating the influence of
natural and trained cognitive biases on psychological and physiological stress responses to
acute stress paradigms.
This introductory chapter will discuss the concept of physiological stress, including
perception and response. Literature on attentional and interpretive cognitive biases will then
be presented, which will cover knowledge of links between cognitive biases and anxiety,
recent efforts aimed at establishing a link between cognitive biases and psychophysiological
stress, and the potential for CBM to modify emotional and physiological vulnerability to
stress. Finally, specific aims and hypotheses of the thesis shall be presented.
1.2 Stress
1.2.1 Conceptualising Stress
The concept of ‘stress’ is nowadays a well represented and familiar topic in the
media, in health and lifestyle recommendations, and in routine everyday conversations. Due
to its constant use, the term has become somewhat ambiguous in meaning. In modern science
the term ‘stress’ is commonly used to refer to external forces (e.g. an environmental factor
such as an exam), internal states (e.g. feeling tense), or physical responses (i.e. how the body
reacts).

CHAPTER ONE
3
Selye (1936) was amongst the first to operationalise the concept of stress in a
psychological sense and defined it as “the nonspecific response of the body to any demand
made upon it” (p. 32). Selye argued that every individual exhibited a non-specific three stage
physiological response to every challenge, which he termed the general adaptation syndrome
(GAS; Selye, 1976). Following the perception of stress, individuals enter the first stage,
alarm, during which an organism initiates a physiological response. This stage is similar to
Cannon’s (1929) fight or flight theory, with physiological activation serving to prepare the
body with energy to either contest the stressor (fight) or flee the threat (flight). A key aspect
of this alarm phase is that the response to demand is generic across organisms and situations,
positive or negative, a point which has received considerable criticism over the years (e.g.
McEwen, 2005). Where stressors persist, organisms enter the second stage of Selye’s GAS
model; coping and resistance. During this stage Selye postulated that internal systems adapt
to the stressor to reduce its impact. While the initial effects of the stressor reduce or disappear
during this stage, the organism is more susceptible to other stressors. As these coping
capacities are finite, where an individual’s ability to cope is exceeded by the persistence or
amplification of the stressor the third stage, exhaustion, occurs. During this stage, the initial
effects of the stressor reappear due to a depleted capacity to counter them, leading to illness
and possibly death.
Of principal importance in Selye’s (1976) GAS model was the concept of maintaining
a homeostatic balance. While stage one - the physiological response to acute stress – is still
thought to be valid, the secondary stages have been subjected to reinterpretation over the
years. For example, McEwen (2005; McEwen & Wingfield, 2003) distinguished between the
terms homeostasis, a balance of physiological variables (e.g. temperature) that are essential
for life, and allostasis, the process of resuming homeostatic balance. McEwen claimed that
stage 1 of Selye’s model represented an initial allostatic effort which, if sustained, resulted in

CHAPTER ONE
4
an allostatic state (stage 2 of GAS). Allostatic states consisted of physiological and
behavioural changes aimed at restoring homeostasis. Failure to fulfil this aim ultimately
resulted in allostatic load or overload (stage 3 of GAS). This final reinterpreted stage presents
the largest disparity to Selye’s model as, while stage 3 of the GAS was always considered
harmful, McEwen noted that this stage resulted in the collective effects of allostatic states
that could either be adaptive or maladaptive. For example, allostatic loads (adaptive) might
be illustrated by an animal that has gained considerable body weight prior to hibernation.
Alternatively allostatic overloads (maladaptive) might arise following random environmental
extremes (e.g. natural disasters) which leaves an organism susceptible to disease.
1.2.2 Physiological Response to Stress
While Selye documented various physiological changes in each stage of the GAS
model, many have since been outdated and so have not been noted here. At present, it is a
generally agreed upon notion that individuals exhibit a physiological reaction to an event
perceived as stressful and that, as Selye postulated, this is a non-specific reaction. This acute
physiological response consists of a dual activation of two key stress systems; the
sympathetic-adrenal-medullary (SAM) and hypothalamic-pituitary-adrenal (HPA) axes (e.g.
Charmandari, Tsigos, & Chrousos, 2005; Yang & Glaser, 2002). The SAM axis forms part of
the autonomic nervous system (ANS), which is controlled by the hypothalamus and is
responsible for regulating a range of physiological activity, such as heart rate, digestion, and
blood pressure. The ANS is comprised of the sympathetic and parasympathetic branches,
which generally work together in an antagonistic manner with parasympathetic dominance
during times of rest. SAM activation provides a relatively immediate effect, commonly
referred to as the ‘fight or flight’ response (Cannon, 1929), during which there is a more
dominant sympathetic tone. Contemporary understanding of Cannon’s work argues that
sympathetic arousal serves to redirect energy to systems that might be most useful to combat

CHAPTER ONE
5
the challenge, such as increased blood flow to muscles rather than digestive tracts, and
increased heart rate (Galosy, Clarke, Vasko, & Crawford, 1981). On encountering a high
level of stress, HPA activation occurs involving a sequence of hormonal changes.
Corticotrophin-releasing factor (CRF) is secreted from the paraventricular nucleus of the
hypothalamus stimulating the release of adrenocorticotrophic hormone (ACTH) from the
anterior pituitary gland. ACTH travels through the blood to the adrenal glands, directing the
release of glucocorticoids, such as cortisol. A major function of cortisol is to act on reserves
of glucose (glycogen) to release the stored energy (Clow, 2001). The HPA complex operates
on a negative feedback loop, during which the released glucocorticoids act back on the first
stages of the hormonal transmission to suppress the further release of CRF and ACTH.
This thesis is concerned with capturing acute psychological and physiological
responses to stress. The literature so far introduced has related to the physiological stress
response. Prior to considering the subjective role of stress perception, such as cognitive
buffers and individual differences that place an individual at a greater or lessened risk of
eliciting a physiological stress response, it is important to first discuss how the physiological
response will be represented.
1.2.3 Capturing the Physiological Stress Response
Cortisol. As an end product of HPA activation, cortisol has become the hormone that
is most frequently studied in the assessment of the physiological stress response. Following
secretion, cortisol circulates throughout the body in the bloodstream. After a 15 minute delay,
free cortisol (that which remains physiologically active rather than being bound to proteins)
enters the saliva through the cellular membranes (Aardal-Eriksson, Karlberg, & Holm, 1998).
For researchers, salivary cortisol provides a practical, less costly, and minimally-invasive
mode of measurement relative to serum cortisol, and shares a stronger correlation with serum

CHAPTER ONE
6
ACTH (Aardal-Eriksson et al., 1998). For this reason, salivary cortisol arguably provides a
better indicator of HPA activation compared with serum cortisol.
Levels of cortisol in the circulatory system (excluding exogenous activation) are
regulated by diurnal rhythms (Kirschbaum & Hellhammer, 1989). Typically, cortisol levels
significantly rise after awakening (Horrocks et al., 1990) to a peak approximately 30-45
minutes after waking (Pruessner et al., 1997). This profile, commonly known as the cortisol
awakening response (CAR), is present from very young infancy (under one years of age; de
Weerth, Zijl, & Buitelaar, 2003) and is thought to remain stable over time (Pruessner et al.,
1997), though can be affected by stress. For example, Kunz-Ebrecht, Kirschbaum, Marmot,
and Steptoe (2004) found evidence of a larger CAR (i.e. greater release of cortisol) in
participants on workdays compared to weekend days. This was not found to be linked to time
of awakening, which has previously been considered as an influential factor (e.g. Kudielka &
Kirschbaum, 2003). Instead, Kunz-Ebrecht et al. proposed the differences to be due to
occupational demands experienced on workdays, during which participants reported
significantly greater levels of stress and significantly poorer mood. This conclusion linking
stress to the CAR is shared among many eminent researchers within the field (e.g. Pruessner,
Hellhammer, Pruessner, & Lupien, 2003; Schlotz, Hellhammer, Schulz, & Stone, 2004;
Wust, Federenko, Hellhammer, & Kirschbaum, 2000). Following the initial rise, cortisol
levels gradually decline for the remainder of the day (Edwards, Evans, Hucklebridge, &
Clow, 2001).
Studies focusing on changes in cortisol to infer HPA activation in biobehavioural
research typically place saliva collection points prior to a procedure (e.g. an acute stress task)
and at several time points following the task. The first collection point acts as a baseline
measure against which subsequent samples are compared to monitor change over time.
Increases in cortisol have been documented following a range of laboratory stressors, such as

CHAPTER ONE
7
forced exposure to unpleasant graphic stimuli (e.g. Nejtek, 2002; Takai et al., 2004), extreme
temperatures (e.g. al’Absi, Petersen, & Wittmers, 2002; Andreano & Cahill, 2006), social
rejection (e.g. Blackhart, Eckel, & Tice, 2007; Stroud, Salovey, & Epel, 2002), and the Trier
Social Stress Test (TSST; Kirschbaum, Pirke, & Hellhammer, 1993), which is a task that is
specifically tailored to combine various stressful elements (e.g. Fiocco, Joober, & Lupien,
2007; Schommer, Hellhammer, & Kirschbaum, 2003).
Factors that affect cortisol levels include (although are not limited to) caffeine (e.g.
Lovallo et al., 2005), nicotine (e.g. Stalke et al., 1992), alcohol (e.g. Badrick et al., 2008), and
strenuous physical exercise (e.g. Usui et al., 2011). Certain traits, such as personality or traits
linked with personality (e.g. aggression), have also been shown to influence cortisol release
(e.g. Oswald et al., 2006; Pruessner et al., 1997). For this reason, where possible, such factors
should be controlled or measured in laboratory studies.
Alpha Amylase. Only relatively recently, salivary alpha amylase (sAA) has started to
receive attention as a possible indicator of sympathetic activation. Though it’s primary
function is to aid the digestive process (Baum, 1993), this enzyme has been found to mirror
stress-induced changes in noradrenaline following sympathetic activation (Chatterton,
Vogelson, Lu, Ellman, & Hudgens, 1996; Rohleder, Nater, Wolf, Ehlert, & Kirschbaum,
2004). However, while there is a general consensus that sAA increases following a range of
acute stressor tasks (e.g. Allwood, Handwerger, Kivlighan, Granger, & Stroud, 2011; Bosch
et al., 1996; Nater et al., 2005, 2006; Rohleder et al., 2004; van Stegeren, Wolf, & Kindt,
2008; Wetherell et al., 2006), more recent research suggests that the relationship between
sAA and noradrenaline is not as analogous as first envisaged. For example, Nater et al.
(2006) identified increases in both variables following the induction of stress (using the
TSST), though additionally noted that correlations between the two parameters were not
statistically significant. Similar findings have been demonstrated by Wetherell et al..

CHAPTER ONE
8
Alternatively, studies have demonstrated significant correlations between sAA reactivity and
other measures of sympathetic activation, such as skin conductance (El-Sheikh, Erath,
Buckhalt, Granger, & Miza, 2008) and aspects of cardiovascular reactivity (Nater et al.,
2006). In light of this and the robust findings of stress-induced increases in sAA, current
opinion within the field considers sAA to reflect sympathetic activation more generally rather
than noradrenaline specifically.
Prior to literature indicating the potential of sAA, there was no established reliable
method of monitoring sympathetic activation from a saliva sample as the transfer of
noradrenaline itself into saliva takes approximately 60 minutes, which makes it near
impossible to accurately map any stress-induced variation (Kennedy, Dillon, Mills, &
Ziegler, 2001). While it was possible to assess noradrenaline activity through serum samples,
the invasive nature of the collection procedure acted as a potential confound to researchers.
Since its introduction, sAA has quickly emerged as a popular choice for researchers
investigating the area of stress primarily as it enables assessment of the two major
physiological stress response systems (the SAM and the HPA axes) reliably through one
parameter (e.g. Engert et al., 2011; Granger et al., 2007).
Produced in the acinar cells of the parotid saliva gland, one of the three major glands
responsible for the production and secretion of saliva (Humphrey & Williamson, 2001), a
potential confound in the measurement of sAA concerns whether its concentration in saliva is
influenced by changes in flow rate. Being flow rate dependent implies that changes in the rate
at which saliva is secreted leads to direct changes in the levels of enzymes and hormones
found within saliva. This matter is important in consideration of the fact that, while
noradrenaline increases follow sympathetic activation, flow rate is governed predominantly
by parasympathetic command (Anderson et al., 1984; Garrett, 1987). Therefore, without
clarification of this relationship, it would not be possible to determine whether changes in

CHAPTER ONE
9
sAA concentration reflect a sympathetic or parasympathetic response thereby limiting the
enzymes biomarker potential. While initial investigation into the matter suggests that the two
are independent (e.g. Rohleder, Wolf, Maldonado, & Kirschbaum, 2006), more recent
exploration suggests otherwise. For example, Beltzer et al. (2010) identified a significant
inverse relationship between sAA activity and flow rate. This demonstrates that the two
variables might be linked. Owing to the matter not being fully resolved, current specialist
advice recommends controlling for saliva flow as a potential confound when measuring sAA
(Salimetrics LLC, 2012).
The natural activity of sAA is subject to circadian variation in a manner that appears
in direct opposition with cortisol rhythms (Ghiciuc et al., 2011). Nater, Rohleder, Schlotz,
Ehlert, and Kirschbaum (2007) first profiled the diurnal patterns of the enzyme in 76
participants (group composed of a mixed gender), and documented a steep fall in activity
within the first 30 minutes of waking, followed by a general increase in activity over the day.
As with cortisol, Nater et al. established significant links between reported chronic stress and
the awakening response of sAA; higher levels of chronic stress were associated with greater
levels of sAA. This pattern has also been documented in groups of participants who
experience the chronic stress of PTSD. Upon awakening, Thoma, Joksimovic, Kirschbaum,
Wolf, and Rohleder (2012) noted increases in sAA in PTSD sufferers rather than the typical
decrease exhibited by healthy controls.
Several additional exogenous factors are known to exert an acute influence on sAA
and, thus, need to be controlled in research. These include nicotine (e.g. Zappacosta et al.,
2002), caffeine (e.g. Bishop, Walker, Scanlon, Richards, & Rogers, 2006), alcohol (e.g.
Enberg, Alho, Loimaranta, & Lenander-Lumikari, 2001), exercise (e.g. Chatterton et al.,
1996), and, as would be expected due to its supportive role in digestion, food intake (e.g.
Messenger, Clifford, & Morgan, 2003).

CHAPTER ONE
10
1.2.4 The Perception of Stress
Studies that measure the physiological response to acute stress paradigms often do so
to discern subjective factors that influence an individual’s perception of (and, thus, their
response to) stress. While Selye (1976) remains broadly correct in his notion of a non-
specific response, he gave no consideration to individual differences that make an individual
more or less vulnerable to the ill-effects of stress. As such, he assumed that every organism
responds to every environmental challenge in the same manner. This conjecture holds the
organism as a passive, almost robotic, entity in the process of being stressed.
More recent transactional models of stress focus almost exclusively on these
subjective factors that serve to mediate vulnerability to stress. For example, Lazarus and
Folkman (1984) highlight appraisal and coping strategies as key factors in determining what
situations evoke a stress response, and the extent of that response. On detecting threat,
individuals are suggested to undergo a primary appraisal of potential challenges in which
personal risk is calculated, prior to a secondary appraisal in which individuals evaluate their
capacity to manage the challenge. Similarly, Cox and Mackay’s (1981) transactional model
claims that stress occurs as a result of perceived demands exceeding an individual’s
perceived capacity to manage them. Since stress models have emerged that emphasise the
role of the individual in determining subjective sensitivity to stress, much effort has been
invested into identifying cognitive mediators of stress. For example, the perception of control
over certain aspects of a potentially stressful situation has been shown to have a buffering
effect on the development of depressive symptomology in adolescents (Deardorff, Gonzales,
& Sandler, 2003). Another factor that has received steadily increasing amounts of interest
over the past decade as a possible mediator to stress surrounds the notion that certain internal
cognitive biases dictate the extent to which individuals preferentially divide their information
processing resources in the face of ambiguity.

CHAPTER ONE
11
1.3 Cognitive Biases
The term cognitive bias was first used by Zajonc (1960; Zajonc & Burnstein, 1965) to
refer to automatic assumptions made based on incomplete information. This early meaning of
the term appears to have held, though it was not until much later that efforts were made to
investigate the effects of these biases on emotions. In 1979 Teasdale and Fogarty found that,
following positive or negative mood induction, participants recalled memories that were
analogous to their current mood (i.e. positive or negative in content) significantly quicker
than those that conflicted with their current mood (e.g. a positive memory following negative
mood induction). Teasdale and Fogarty proposed that these findings were due to a recall bias,
in which current mood rendered memories of a corresponding nature to be more accessible
while incongruous memories were less accessible. Mathews and Bradley (1983) additionally
found that mood induction tended to influence reporting of depressive episodes, with
negative mood induction being linked to a higher volume and more severe symptomology
recall. These studies led to the comparison of individuals who differed in their levels of trait
anxiety to investigate whether similar patterns of response were found.
1.3.1 Attention Biases and Anxiety
In 1986, MacLeod, Mathews, and Tata developed a task designed to objectively
measure the extent to which individuals attend to positive and negative materials. The visual
probe task involves two words being simultaneously presented for a short time on screen
above and below a central fixation point. One word denotes a negative meaning while the
other is neutral or positive in meaning. Typically, after 500 milliseconds the words disappear
and a probe (e.g. a left or right facing arrow) appears in the spatial location of one of the
words. Participants are required to respond to the probe (e.g. identify the direction the arrow
points). This procedure continues for a number of trials. Individuals who are generally faster

CHAPTER ONE
12
to respond to probes that are positioned in the prior location of negative words relative to
positive words are argued to have a negative bias, as their attention was automatically drawn
to the more negative of the stimulus enabling them a identify the probe quicker. MacLeod et
al. found a clear distinction for individuals who had been referred for training in anxiety
management to preferentially focus their attention towards negative words. Alternatively
matched control participants with more typical levels of anxiety displayed a preference
towards neutral words.
Variants of the visual probe task have been frequently employed in studies
investigating attention biases, with the links between negative attentional bias and anxiety
being replicated in many different samples and settings. Bradley, Hogg, White, Groom, and
de Bono (1999) demonstrated this effect in a clinically anxious sample. Using the visual
probe method, individuals suffering from generalised anxiety disorder (GAD) were found to
disproportionately attend to pictures of faces that displayed negative emotions over neutral
faces. The link between anxiety and attention has also been demonstrated in more specific
phobias. For example, Lavy, van den Hout, and Arntz (1993) found a significantly higher
tendency for spider-phobic participants to attend to words relating to spiders relative to
generally negative words or neutral words. This link between anxiety and attention appears
very robust in the published literature, with only a handful of studies having been included
here. To give an idea of the breadth of this finding, Bar-Haim, Lamy, Pergamin, Bakermans-
Kranenburg, and van IJzendoorn (2007) reviewed 172 studies that looked at this link and
concluded that the association between anxiety and attention was indeed reliable.
In a study that significantly progressed the authenticity of the cognitive bias’ proposed
influence, MacLeod and Hagan (1992) demonstrated a potential for attentional bias to act as a
predictor for subsequent emotional distress following a stressful event. Higher anxiety was
matched with a negative attentional bias for female participants awaiting a cervical screening.

CHAPTER ONE
13
For participants who subsequently received a cervical pathology diagnosis, preconscious
attention to threat was also found to significantly predict the intensity of their emotional
response. This effect has since been replicated by van den Hout, Tenney, Huygens,
Merkelbach, and Kindt (1995), who showed the effect in a group of participants not currently
undergoing a high degree of stress.
1.3.2 Interpretive Biases and Anxiety
Following on from the early research investigating recall bias and mood, Butler and
Mathews (1983) focused on the encoding phase rather than the recall phase of information
processing. They found that anxious individuals tended to interpret ambiguous materials in a
more threatening manner than less anxious individuals. Further, high anxiety was linked with
a propensity for focusing more on threatening than non-threatening material. In parallel to
work investigating attentional biases, researchers also set out to investigate the link between
biased interpretive cognitions and anxiety. Using a similarly simple yet effective technique as
that used to investigate attentional bias, Mathews, Richards, and Eysenck (1989) established
similar anxiety-bias effects dependent on how individuals interpreted emotional ambiguity.
To achieve this, Mathews et al. superset a series of homophones – words with both positive
and negative connotations (e.g. bury/berry) – into a list of words matched in terms of
familiarity and length characteristics. Participants were presented the word list in an auditory
fashion and were required to write down the word they heard. While all participants showed a
preference for the threatening interpretations, there was a clear difference in interpretive bias
between high and low anxious groups. Participants who had been referred for anxiety
management training (i.e. the high anxiety group) reported the threatening interpretation of
homophones significantly more frequently than matched control participants.

CHAPTER ONE
14
An alternative manner of measuring biases of interpretation involves presenting
participants with an emotionally ambiguous sentence and requiring them to either solve the
final word of the sentence (e.g. Hirsch & Mathews, 1997) or read a subsequent sentence that
related to each meaning (positive and negative) respectively (e.g. MacLeod & Cohen 1993).
For example, a statement might read “The doctor examined little Emily’s growth” (MacLeod
& Cohen, 1993). Participants would then be presented with the sentences “Her height had
changed since her last visit” (positive) or “Her tumour had changed since her last visit”
(negative). Importantly, the two sentences differ only in terms of the disambiguation word
(height or tumour). A faster reading speed in reading negatively valenced endings would
therefore be attributed to a negative interpretive bias, as the meaning would be more
congruent with the reader’s understanding of the scenario.
Using the methods described above (or similar) researchers have, again, repeatedly
shown evidence to support the existence of anxiety-dependent interpretive biases. For
example, Hazlett-Stevens and Borkovec (2004) demonstrated a tendency for participants with
GAD to automatically associate ambiguous homographs (words that have multiple meanings
though are spelt the same, e.g. batter) with their negative meaning relative to non-anxious
participants. Alternatively, Stopa and Clark (2000) showed that participants with social
phobia interpreted ambiguous scenarios that depicted social situations significantly more
negatively that control participants. As with attentional biases, therefore, it seems the effects
are well-documented and appear relatively robust.
1.3.3 Model of Cognitive Bias
Developments in the field of cognitive biases have largely been based on empirical
evidence rather than being derived through theoretical models. Of the models that do exist
(e.g. Ӧhman, 1993; Wells & Mathews, 1994; Williams, Watts, MacLeod, & Mathews, 1997),

CHAPTER ONE
15
one stands out for its attempts to explain biased information processing both in attention and
interpretation using one model. Mathews and Mackintosh (1998) posited that individuals
possess a Threat Evaluation System (TES), which serves to reinforce/abate certain features of
a situation that compete for processing resources. Critically, the features need to differ in
terms of whether they do or do not represent any threat. Consider, for example, an emotional
Stroop task (e-Stroop; Gotlib & McCann, 1984), in which participants are required to
determine the colour of a printed word. As a modification to the original Stroop task (Stroop,
1935), the printed words contained within an e-Stroop task are emotionally valenced.
According to Mathews and Mackintosh’s model, when faced with such a trial, several aspects
of the stimuli are processed in parallel (e.g. colour of word, word identification, meaning of
word). In such an instance these features are devoted attention based on various factors, such
as personal significance, conscious effort, or primed inclinations. The TES further prioritises
these competing attributes to determine which receives the limited attentional resources.
Those that match the encoded system are given a higher priority relative to incompatible
cues. Further, Mathews and Mackintosh theorised that activation from the TES was positively
correlated with anxiety. Musa, Lépine, Clark, Mansell, and Ehlers (2003) found support for
this by demonstrating how individuals high in anxiety showed a poorer performance in
naming the colour of the threat-related word on the e-Stroop relative to low anxious
individuals. This can be explained by a larger interference from the TES assigning attention
to threat-related features (i.e. meaning of the word) at the expense of the non-threat features
(i.e. colour).
By incorporating an element of conscious and effortful control into their model that is
capable, to a point, of overriding interference from the TES, Mathews and Mackintosh’s
model accounts for why not every potential threat dominates processing resources. From an
evolutionary perspective, the TES provides a necessary manner of attending and responding

CHAPTER ONE
16
to danger. All individuals will allocate information processing resources to threat cues when
they represent a severe enough danger. Biases in information processing start to develop as a
result of repeated interactions between competing attributes and a tendency for the TES to
dominate processing resources. For example, individuals who are more responsive to threat
cues will, over time, develop a wider portfolio of threat representations and conditioned
responses. Consequently, these processing biases can leave individuals vulnerable towards
further anxiety as future threat cues are consistently given precedence even when they might
only represent a relatively mild threat.
1.3.4 Cognitive Bias and the Physiological Stress Response
Although the relationship between cognitive biases and emotional stress (e.g. anxiety)
has been well documented and appears robust, considerably less research has investigated the
link between bias and physiological stress. It would seem reasonable to assume that cognitive
biases might influence the extent to which individuals physically respond to stress by altering
their perception of and, thus, response to it. As negative biases have been matched with
higher levels of anxiety relative to positive biases (e.g. MacLeod, Mathews, & Tata, 1986;
Mathews, Richards, & Eysenck, 1989), it is plausible to expect that negative biases might
also be more closely linked to states of physiological hyper-arousal, in which stress systems
are overworked, that are associated with high/clinical levels of anxiety (e.g. Mantella et al.,
2008) relative to positive biases.
To explore the link between cognitive biases and the physiological stress response,
Fox, Cahill, and Zougkou (2010) adopted a visual probe task to test attentional biases. As a
slight alteration to the convention use of this task, male participants were required to respond
to a probe appearing in the spatial vicinity of a previously displayed picture (rather than
emotive word). Pictures were selected for their arousing content (either positive, negative, or

CHAPTER ONE
17
neutral) and were presented for either 14 milliseconds or 300 milliseconds before being
masked by a random reconstruction of the picture which was displayed until a total time of
500 milliseconds had passed. Four months after the initial test of attention bias, participants
were exposed to an acute laboratory public speaking stressor in which they were instructed to
give a short (5 minute) speech on the necessity of statistics in psychology. A further four
months later, participants were required to repeat this process, this time with the topic relating
to their perceived preparations for their impending exams. Fox et al. found that a
preconscious attention bias (i.e. in trials where the picture was displayed for just 14
milliseconds) to negative stimulus was predictive of cortisol reactivity on both acute stressor
tasks. Considering the 8 month delay between initial bias measurement and subsequent
stressor exposure, this finding appears to demonstrate a clear and stable link between bias and
physiological reactivity.
These results are similar to those of van Honk et al. (2000) who showed that
preconscious attentional biases towards negative pictoral stimuli was associated with
significant cortisol increases to the task. However, van Honk et al. also noted a similar
significant association when the pictoral stimuli were presented within conscious threshold.
Further, though not directly measuring interpretive biases per se, Gaab, Rohleder, Nater, and
Ehlert (2005) have demonstrated the predictive power of cognitive appraisal processes for
predicting cortisol responses to the TSST. Gaab et al.’s study suggests that the manners in
which an individual perceives a situation (i.e. as threatening/non-threatening) directly
influences their response to it.
Dandeneau, Baldwin, Baccus, Sakellaropoulo, and Pruessner (2007) have
demonstrated a link between interpretive bias and physiological vulnerability to stress.
Interpretive bias was measured using a modified visual probe task that used pictures of faces
that either portrayed a positive or negative expression. Stress was induced using the Montreal

CHAPTER ONE
18
Imaging Stress Task (MIST; Dedovic et al., 2005), a combined stressor derived from the
Trier Mental Challenge Test (TMCT; Kirschbaum, 1991) in which participants have to solve
mental arithmetic problems (academic element) within a set time whilst receiving criticising
feedback from the researcher (social element). Results showed a significantly positive
relationship between bias and responses to the MIST; participants who produced a greater
cortisol response also demonstrated a significant attentional bias towards negative faces.
1.4 Cognitive Bias Modification
The findings discussed above demonstrate a clear cognitive bias for individuals who
are more susceptible to anxiety to both attend to and interpret ambiguity in an overly
threatening manner. However these studies predominately used correlation designs. As one of
the first studies to address the issue of causation, MacLeod, Rutherford, Campbell,
Ebsworthy, and Holker (2002) used a modified version of their dot-probe task which served
to train rather than test attentional bias. Rather than positioning the probe behind both the
positive and negative words equally, it was consistently placed behind either the neutral or
negative word. This alteration was designed to encourage participants to develop an implicit
rule in which they learnt to automatically attend to stimuli of a certain valence (i.e. neutral or
negative) when both were presented. Indeed, participants were subsequently found to be
faster at responding to target probes when the location of the probe matched their training
condition. Further, MacLeod et al. found that this training affected individual vulnerability to
subsequent stress. Participants who were assigned to the attend-negative condition were
found to respond to a greater extent to a combined laboratory stressor relative to those in the
attend-neutral condition. The stressor consisted of an anagram task (academic challenge),
which participants completed whilst being videotaped. Participants were informed that the
videos might then be used for later class demonstrations to illustrate particularly good or bad
performance (socio-evaluative element). The significance of this finding is further

CHAPTER ONE
19
underscored by that fact that the two groups showed no difference in their response to the
same stressor prior to the attention training procedure.
The finding that it was possible to experimentally manipulate an individual’s
cognitive bias enabled researchers to examine the relationship between cognitive bias and
anxiety by investigating the issue of causation. Understandably, clarification of this issue held
a great deal of appeal to supporters of the field, who proposed the potential clinical
importance of their work. In 2000, Grey and Mathews further extended the field by
developing a laboratory technique that successfully trained participants towards a more
negative interpretive bias. This was achieved by forcing the participant to repeatedly generate
negative meanings of a series of homographs. Homographs are words that have two meanings
despite the same spelling. Grey and Mathews selected a series of homographs for which one
meaning was unpleasant while the other was neutral. For example, the word “batter” could
refer to an uncooked mixture (neutral) or to the process of hurting someone (negative).
Motivated by the research in the area of attentional bias, Wilson, MacLeod, Mathews,
and Rutherford (2006) sought to replicate similar emotional vulnerability patterns using a
training programme aimed at interpretive biases. Participants were trained to automatically
associate ambiguity in a positive/neutral or negative manner (depending on their condition)
using homograph training (Grey & Mathews, 2000). Participants then underwent a stressor in
which they watched video clips that portrayed footage of emergency rescues. As Grey and
Mathews had found, the interpretive training was found to be effective in modifying
individuals’ bias. Further, and corresponding to findings relating to attentional biases, this
training appeared to successfully moderate emotional responses to the stressor. Participants
who had received positive training reported significantly smaller increases in anxiety
following the stressor relative to negatively trained participants.

CHAPTER ONE
20
Coinciding with the development of homograph training, another method emerged
that followed on from the ambiguous scenarios interpretive test (Hirsch & Mathews, 1997).
Mathews and Mackintosh (2000) developed an ambiguous scenarios training task, which
worked by presenting participants with a series of descriptions of situations. The situations
presented a relatively ambiguous setting to encourage participants’ natural biases to start
operating. However, the final sentence of the scenario was presented in a manner that
resolved the situation either in a positive or negative manner. Mathews and Mackintosh
demonstrated the success of this technique by successfully training participants toward a
more positive or negative bias.
Using the ambiguous scenarios training, Mackintosh, Mathews, Yiend, Ridgeway,
and Cook (2006) continued down the route of demonstrating the positive effects of modifying
cognitive biases. Participants received training directed at improving or worsening their
biased interpretations of ambiguity. The following day, participants completed a task that was
designed to measure their biased interpretations. This included participants reading 10
descriptions of scenarios that contained an element of ambiguity. For example, a situation
could involve sitting waiting for your doctor to read out some test results and noticing the
doctor chatting to a colleague holding your file. After the 10 scenarios have been presented,
participants are required to recall them in turn and rate four sentences according to their
recollection of how the scenario was presented. One sentence referred to a real positive
interpretation (e.g. the doctor is saying the tests are normal), one a positive foil (e.g. the
doctor is pointing out your impressive fitness rating), one a negative real interpretation (e.g.
the results describe bad news), and one a negative foil (e.g. the doctor is making fun of your
chart). Participants were found to show biased interpretations in line with their previous
training condition. Further, subsequent exposure to a stressor (watching a graphic accident
video) again revealed the buffering effects of positive interpretive training.

CHAPTER ONE
21
1.4.1 The Potential of Bias Modification
With further developments in the area, the effects of cognitive bias modification
(CBM) training have been found to endure over a 24 hour period (Yiend, Mackintosh, &
Mathews, 2005), endure changes in testing environments (Mackintosh, Mathews, Yiend,
Ridgeway, & Cook, 2006) and generalise to new domains (from social to academic anxiety;
Salemink, van den Hout, & Kindt, 2010). In response to these advances, researchers have
been quick to start investigating the applied potential of CBM. For example, the finding that
training can effectively alter cognitive bias has been reproduced repeatedly (e.g. Salemink,
van den Hout, & Kindt, 2009; Steinman & Teachman, 2010). Moreover, bias modification
methods appear effective in significantly reducing anxiety in clinical populations, including
populations suffering from generalised anxiety disorder (GAD; Amir, Beard, Burns, &
Bomyea, 2009), generalised social phobia (Amir, Beard, Taylor et al., 2009), major
depressive disorder (MDD; Joorman, Hertel, LeMoult, & Gotlib, 2009), and social anxiety
disorder (SAD; Schmidt, Richey, Buckner, & Timpano, 2009).
Following the volume of articles demonstrating its potential, attempts have also been
made to explore the utility of these training programmes outside of the laboratory in a home
environment. Blackwell and Holmes (2010) adopted a home-based training paradigm in
which participants who were currently experiencing a major depressive episode were
instructed to imagine themselves in a series of scenarios that were presented in an auditory
fashion. The scenarios remained ambiguous until the end of the paragraph, after which they
consistently resolved into a positive outcome. Participants listened to 64 scenarios on a daily
basis for five consecutive days. Results showed improvements in over half of the sample
(seven participants), with improvements persisting over a two week period. See, MacLeod,
and Bridle (2009) have also revealed encouraging findings with their home-based attention
modification programme using a real-life stressor. Singaporean participants completed visual

CHAPTER ONE
22
probe training everyday for 15 days prior to relocating to Australia to continue tertiary
education. Participants who received positively valenced training reported significantly less
anxiety arising from the stressful life event relative to participants in the no training group.
These studies provide a particularly persuasive argument for the potential of CBM as, prior to
this study, findings had largely been laboratory-based. By demonstrating external validity
with an easy-to-access programme, Blackwell and Holmes and See et al. significantly
advanced the field in its drive towards clinical application.
1.4.2 CBM and the Physiological Stress Response
More recently, interest has progressed onto investigations into the relationship
between cognitive biases and the physiological stress response. In consideration of the fact
that many psychopathological disorders develop from a hypersensitive tendency towards
stress, research into methods designed to augment the manners in which participants respond
to stress seems an area worthy of attention. Dandeneau, Baldwin, Baccus, Sakellaropoulo,
and Pruessner (2007) argued that attentional processes are significantly involved in
perception of and response to stress. Using a group of telemarketers, an occupation in which
workers regularly encounter the stressful experience of rejection, Dandeneau et al.
(experiment 3b) tested this proposition. Participants were required to complete attention
modification training for five consecutive days. Training consisted of a series of trials in
which participants had to locate a head shot photo of a person expressing a positive emotion
(e.g. smiling) in a 4x4 matrix of head shot photos of people expressing negative emotions
(e.g. frowning or scowling). Scowling faces were designed to represent rejection which, as
previously mentioned, featured heavily within participants’ job roles. Results indicated that
participants who completed the find-the-smile training released significantly less cortisol over
a working day and had significantly lower peak cortisol reactivity relative to participants in
the comparison condition, who had completed a control find-the-five-petaled-flower (in a 4x4

CHAPTER ONE
23
matrix of seven-petaled flowers) task. This study provided the first account of a potential link
between CBM and psychophysiological vulnerability to stress. However, although the study
used a natural stressor, there was no baseline measurement of physiological activity against
which to compare the observed training effects.
To date, there are no existing studies that have focused on the influence of biased
cognitions on sAA. However, research conducted by Schartau, Dalgleish, and Dunn (2009)
suggests there is a potential for such a link to exist. Schartau et al. utilised a slightly different
form of re-training cognitive biases that focused on reappraising the negative interpretations
based on four general themes. Participants were required to practice this method of re-
appraisal whilst watching distressing films (training group) or watch the films without
practicing any form of emotion regulation (comparison group). Participants in the training
group showed a reduced electrodermal response (a marker of sympathetic activation) in
response to an ensuing distressing film relative to participants in the comparison condition.
This study demonstrates that it is possible to modify the sympathetic physiological impact of
stress by changing how individuals interpret the situation. Therefore, as a measure of
sympathetic activation, sAA should also be sensitive to such modifications.
Summary
The evidence presented above outlines a robust relationship between cognitive biases
(natural or trained) and emotional vulnerability to stress. Negative biases are linked with
greater anxiety both in normal and clinical samples, while positive biases are matched with
lower levels of anxiety. Further, training is effective in modifying the ways in which
individuals attend to and interpret threat. Generally, individuals who are trained towards a
more positive way of processing information appear more resilient on a psychological scale
to subsequent episodes of acute stress. Alternatively, training directed towards a poorer bias

CHAPTER ONE
24
leads to greater negative impact of ensuing stressful episodes. So far, these findings present
an organised account of influences underlying subjective psychological susceptibility to
stress, though few studies have sought to reproduce the effects on a biological scale. As such,
little is known as to whether reducing the propensity to psychologically perceive threat
through CBM will incur any improvements to health associated with over-active
physiological stress systems. Studies that have started to investigate this have documented
positive findings, though considerable further research is necessary to understand the
influences and implications of information processing biases on a physiological scale.
1.5 Focus and Rationale for this Thesis
Increasingly greater numbers of the population appear to be negatively influenced by
stress to a point where it disrupts their daily lives. For example, a national Labour Force
Survey found that 35% of all work-related sickness was attributed to “stress” in 2010/11,
with an estimated 5.4 million days work lost (Health and Safety Executive, 2011). As
discussed in this chapter, the perception of stress has been found to negatively impact natural
physiological rhythms. For example, chronic stress has been associated with a high release
but blunted diurnal profile of cortisol (e.g. Miller, Chen, & Zhou, 2007; Tseng, Iosif, &
Seritan, 2011). While acute cortisol release serves to provide a temporary solution to
challenges by, for example, liberating stored reserves of energy (Clow, 2001), chronically
elevated levels have been linked to an increased risk of cardiovascular disease (Whitworth,
Williamson, Mangos, & Kelly, 2005), type-II diabetes (Dallman, 2010), and poorer immune
defences (McEwen, 2000). Further, various forms of psychopathology are known to be linked
to an overactive biological stress system (e.g. Plotsky, Owens, & Nemeroff, 1998; Pruessner,
Hellhammer, Pruessner, & Lupien, 2003; Vreeburg et al., 2009). In light of this, there is a
clear rationale for attempts to be made to try and identify simple and effective methods of
reducing the impact of daily stress.

CHAPTER ONE
25
Cognitive biases appear to share an undeniable link to how people respond to their
surrounding world. People who seem to predominantly decipher their environment in a
negative manner seem more at risk of suffering the psychological ill-effects of stress, such as
increased anxiety. Alternatively, less sensitivity to threat appears to act as a buffer to the
psychological manifestations of stress. The research discussed above has demonstrated
promise for CBM methods to change habitual information processing biases. However, to
date the literature linking information processing biases to perceived stress has relied too
heavily on self-report measures of changes in emotion, which expose findings to criticism of
reporting biases. One way of validating this research is to identify similar effects on a
biological basis. Research that has started to investigate this has identified a tentative link
between the ways in which individuals physiologically respond to stress and their biased
cognitions. However, to date there are only a handful of studies dedicated to this cause.
Further, this link appears disproportionately supported by research that focuses on biases in
attention. The aim of this thesis is to explore this association further focusing both on biases
in attention and interpretation. Studies will endeavour to isolate robust links between
attentional and interpretive biases and an individual’s sensitivity to acute stress. Further,
efforts will be made to investigate the effects of CBM on the physiological stress response.
Ultimately, this thesis aims to validate the existence of an authentic link between information
processing biases and the psychophysiological stress response using objective (physiological)
and subjective (psychological) measures of stress, and to further CBMs potential as a clinical
tool.
The next chapter will outline principles and methods involved in assessing biological
stress markers in saliva. Following on from this, chapters will be dedicated to six
experimental studies that aim to establish reliable designs (Studies 1-3), which can be put to

CHAPTER ONE
26
use to explore the relationship between naturally occurring and modified cognitive biases and
the psychophysiological stress response (Studies 4-6).

CHAPTER TWO
27
2.0 CHAPTER TWO
Saliva Storage and Analysis
2.1 Tissue Analysis Laboratory
The Tissue Analysis Laboratory (TAL) is based at Anglia Ruskin University,
Cambridge, and was the site of all saliva analysis presented in this thesis. The TAL has
standardised techniques for assaying cortisol levels but, at the time of initial collaboration,
had no established method of assaying sAA. In parallel to the studies presented in this thesis,
work was conducted to develop and test an in-house sAA assay protocol for use in the TAL
(see Appendix I for further details involved in this process).
2.2 Sample Preparation
Samples are always frozen at -80°C immediately after the study session until analysis.
On the day of analysis, samples are removed from the freezer and defrosted in a biosafety
class II cabinet. Once fully defrosted, samples are spun in a centrifuge at 1500RCF for 15
minutes. If using Salimetrics Oral Swabs (SOS), the insert and swab are then removed and
placed in 2% Virkon for disinfection prior to disposal.
2.3 Cortisol Assay
Principle. This competitive immunoassay uses a microtitre plate that had been pre-
coated with monoclonal antibodies to cortisol. This produces binding sites that are sought by
cortisol in the sample (or standards or controls, which are regulated to act as assay controls)
and known amounts of cortisol linked to conjugate (horseradish peroxidise) in competition.
Following an incubation phase, excess conjugate and unbound sample cortisol are washed
away before a substrate is added to the wells, resulting in the well developing a blue colour.
After a specified amount of time, the reaction is stopped by the addition of acid to the well.

CHAPTER TWO
28
The resulting yellowish colour intensity is inversely proportional to the amount of cortisol
present in the sample.
Method. This assay is based on a protocol designed by Salimetrics LLC (USA). All
work is done with the assistance of a Tecan Freedom 150/8 or an Evo 2 liquid handler. After
preparation, 25µl of sample, standards (to give an accurate assay range), or controls (to give a
zero or saturated reading) is added to the appropriate well in duplicate. Following this, 200µl
of 1:1600 diluted conjugate solution is added to the well. The plate is then shaken for 5
minutes and heated to room temperature for an additional 55 minutes. The plate is then
washed 4 times in wash buffer using either a Tecan Columbus or Hydroflex plate washer. A
tetramethylbenzidine (TMB) substrate (200µl) is then added to each well before the plate is
again shaken for 5 minutes at 500rpm and the heated to room temperature in a light-
controlled (i.e. dark) environment for a further 25 minutes. After this, 50µl stop solution (1M
sulphuric and 8M acetic acid) is introduced to the well. Plates are shaken for a further 3
minutes at 500rpm before being read at 450nm using an Infinite or Sunrise plate reader.
2.4 Alpha Amylase Assay
Principle. This assay is used for the kinetic measurement of sAA. The method
employs the use of the substrate 2-chloro-p-nitrophenol, which is linked with maltotriose
(Pointe Scientific). Together, these react with sAA resulting in a yellow coloured product that
can be measured spectophotometrically. The rate of this reaction is directly proportional to
the amount of sAA present, thereby producing a way of quantifying the enzyme.
Method. This assay is completed using a robotic assistance to pipette saliva samples
and diluent into the well, but the second stage is manual with the aid of a multi-channel
pipette. To start, via robotic aid, samples are diluted to 1:200 ratio by first diluting 1:10, then
1:10 again. Following dilution, 8µl diluted saliva sample (or control) is added to the

CHAPTER TWO
29
appropriate wells of a microtitre plate. Manually, 320µl preheated (to 45°C) substrate is then
added to each well using a 1ml multichannel pipette1. The plate is then shaken immediately
whilst being heated to 37°C before the optical density is read at 405nm using an Infinite or
Sunrise plate reader exactly one minute after the substrate was added. The plate is shaken and
incubated as before, before being read a final time at the three minute marker. The difference
between the two readings is then multiplied by a conversion factor to account for the dilution
phase, resulting in a measure of sAA (U/ml).
2.5 Flow Rate
Flow rate is measured in terms of ml/minute, and can be measured gravimetrically by
assuming 1ml saliva weighs 1g (Chicharro, Lucia, Perez, Vacquero, & Urena, 1998).
Dividing the delta of the sample tubes (pre- and post-sample) by the number of minutes the
sample was taken over gives a ml/minute calculation. Flow rate can be multiplied by analyte
concentration measures (e.g. sAA) to give a measure of analyte output over time (secretion).
2.6 Storage and Destruction of Samples
After assaying, samples are re-frozen at -80°C until all analysis has been completed
after which they are disposed of. Samples undergo centrifugation each time they are thawed
for the purposes of assaying. Every effort is made to keep the amount of freeze-thaw cycles
to a minimum in order to preserve the sample quality as advised by Granger, Swartz, Booth,
Curran, and Zakaria (1999). Once analysis is complete, samples are autoclaved at 131°C for
purposes of sterilisation before being incinerated.
1 This is a crucial part of the assay owing to its acute time-sensitive nature. The multichannel pipette is capable of aspirating enough substrate to dispense over three columns per time, which enables rapid coverage of the plate.

CHAPTER THREE
30
3.0 CHAPTER THREE: STUDY ONE
On being rejected: Psychological and physiological responses to an acute social rejection task

CHAPTER THREE
31
Prior to introducing a measure of cognitive bias or attempting to modify cognitive
biases within the studies reported in this thesis, it seemed pertinent to firstly establish a
reliable stressor that could be used to demonstrate the effects of naturally occurring or
modified interpretive or attentional bias on an individual’s vulnerability to stress. Therefore,
the overall objective of this first study was to develop a reliable laboratory stressor that could
be used in the subsequent studies of this thesis.
Since the development of the Trier Social Stress Test (TSST; Kirschbaum, Pirke, &
Hellhammer, 1993) a general consensus has emerged among researchers in the field for
cortisol to be an appropriate biomarker to reflect HPA responses to stress paradigms (e.g.
Buchanan, al’Absi, & Lovallo, 1999; Cacioppo et al., 2000; Ellenbogen, Schwartzman,
Stewart, & Walker, 2002; Gaab et al., 2002; Pruessner, Hellhammer, & Kirschbaum, 1999).
Whilst the literature is laden with studies employing stressor tasks that aim to induce changes
in stress-related physiology, there remains a large inconsistency between those that achieve
this and those that either fail to observe any difference or in some cases even observe the
complete opposite. Dickerson and Kemeny (2004) conducted a meta-analysis of 208 such
studies and concluded that task-related increases in cortisol were most prominent and reliable
when the stressor included three key elements; where individuals felt they were being judged
by others (socio-evaluation), where the participant had little or no control over the situation
(uncontrollable), and when participants were motivated to perform well (motivation).
Tasks developed to challenge achievement/academic ability pose an understandably
stressful situation. For example, such tasks test an individual’s mental capacity and can
incorporate elements of failure, which provides an unpleasant sensation. In terms of
conforming to Dickerson and Kemeny’s (2004) three key principles, these tasks tend to
include aspects of uncontrollability (e.g. difficulty of task) and motivation (i.e. not wanting to
fail), but do not consistently include a social evaluative element. Alternatively, psychosocial

CHAPTER THREE
32
stressors additionally threaten an individual’s sense of belonging and, thus, contain the third
socio-evaluative factor. The need to belong has long been stressed as a basic yet essential
requirement. Indeed, Maslow (1943) held it among the top five of the most fundamental
satisfactions (Kune, 1992), and Baumeister and Leary (1995) claim that regular interpersonal
interaction is key to maintaining a healthy emotional and cognitive status. A stressor that
features the denial of this sense of belonging amongst society (e.g. social rejection) could be
argued to contain all three of Dickerson and Kemeny’s (2004) elements. Humans crave social
acceptance (motivation), which can be achieved following successful interactions with others.
All social interaction likely contains evaluation and uncontrollability; an individual’s reaction
to us is largely determined by them according to a subjective set of norms and expectations,
and is therefore uncontrollable. The present study shall therefore opt to develop a laboratory-
based social stressor in an attempt to deliver a reliable psychological and biological stress
response.
Tasks that induce the perception of social rejection have proved successful in eliciting
robust physiological responses. For example, Stroud, Salovey, and Epel (2002) developed a
social rejection stressor that involved participants being gradually excluded from two
interactions with confederate researchers through both verbal and non-verbal cues. Stroud et
al. found significant increases in cortisol in response to this social rejection task, but only in
female participants. Alternatively, male participants produced a significant cortisol response
to academic stressors (mental and verbal tasks), to which female participants appeared less
(physiologically) affected. Gender is a factor known to influence cortisol response (e.g.
Kirschbaum, Kudielka, Gaab, Schommer, & Hellhammer, 1999; Kirschbaum, Wust, &
Hellhammer, 1992), therefore this pattern of response is not completely unexpected. Indeed,
Stroud et al. referred to Taylor et al.’s (2000) tend and befriend hypothesis to account for the
observed differences. This theory reasons that females adopt a defence that is more likely to

CHAPTER THREE
33
aid their stereotyped nurturing and social roles, whereas males are motivated by Cannon’s
(1929) more traditional ‘fight or flight’ response. Research has since provided empirical
support for this theory, with evidence suggesting females demonstrate coping strategies that
are more evocative of Taylor et al.’s theory. For example, Turton & Campbell (2005)
identified that females were more inclined to cope using strategies associated with the tend
and befriend theory (e.g. turn to friends for advice) than through fight or flight (e.g. using
aggression). Consequently, females might be more sensitive to interpersonal challenges (e.g.
social rejection) while males might respond more to instrumental challenges (e.g. intelligence
tests). Aside from these influences of gender, Stroud et al. were successful in demonstrating
the effectiveness of a social rejection laboratory stressor.
In keeping with the theme of social rejection, Blackhart, Eckel, and Tice (2007)
developed an alternative social rejection task that obviated the need for confederate
researchers as was necessary in Stroud et al.’s (2002) study. Blackhart et al.’s task required
participants to take part in group (4-6 participants) ice-breaker discussions before being
informed they would need to select a partner to work with on a group task. Participants were
instructed not to choose anyone they knew or were friends with, and were asked to give two
options of partners whom they considered they might work well with. Participants were then
divided into individual rooms and, after a short delay, each told that they had to complete the
ensuing task alone either because no-one had chosen to work with them (social rejection),
everyone had chosen to work with them which could not logistically be managed (social
inclusion), or due to an administrative error in assigning them a group (control). Results
showed a significant increase in cortisol following social rejection, matched with reduced
positive affect and increased negative affect. Interestingly, however, no gender effects were
observed in their study.

CHAPTER THREE
34
Given the wealth of literature detailing the difficulties in inducing a physiological
stress response using a laboratory stressor (see Dickerson & Kemeny, 2004), the purpose of
the current study was to replicate the methodology and findings of Blackhart et al. (2007).
Specifically, this study aimed to use a social rejection stressor to produce a robust increase in
cortisol, and to investigate whether a reliable stress-induced change in sAA could be evoked
using this specific paradigm. However, several modifications were made to Blackhart et al.’s
protocol in the current study. First, in Blackhart et al. participants were instructed to not rate
people they knew or were familiar with. This might have somewhat stalled rejected
participant’s responses as they were, in effect, being rejected by people to whom they had no
existing connection; a point that the authors themselves note. For this reason, the current
study omitted the instruction to only rate participants to whom they had no affiliation in a bid
to augment any feelings of rejection. Second, Blackhart et al.’s protocol required each
participant to rate just two other participants. In the current study, participants were provided
with a space to rate all but one of the other participants in the group. So, for example, a group
of 6 participants were asked to rate 4 people in terms of whom they would prefer to work
with; thus forcing just one person to remain unrated. This amendment was implemented to
intensify negative emotions as working alone through rejection in the current study would
imply the participant has remained unrated by every other participant rather than simply not
being rated as one of two options. Third, in line with Stroud et al.’s (2002) finding that social
stressors were more effective for female participants, the current study was conducted using
female participants only regardless of the lack of such findings in Blackhart et al.’s study.
It was hypothesised in the current study that increases in cortisol and sAA, in addition
to a worsening of emotional state (e.g. reported stress) would occur following social
rejection. Alternatively, social inclusion was hypothesised not to influence cortisol, sAA, or
emotional state. In addition to measures of state emotion (e.g. reported happiness, stress,

CHAPTER THREE
35
etc.), trait measures of factors known to influence physiological activity (e.g. personality)
were measured. The reasons behind these measures were two-fold. Firstly, comparisons could
be made between groups (social rejection, social inclusion) to ensure successful
randomisation of potentially influential factors. Second, completion of the questionnaires
served to pass time between saliva samples. These measures were not analysed in terms of
how they influenced psychophysiological responses to the task, but were analysed for
between group differences. No between group differences were hypothesised.

CHAPTER THREE
36
3.1 Method
3.1.1 Design
The study adopted a mixed factorial design with group (social rejection, social
inclusion) as a between subjects factor and time point (5 measures) as a within subjects factor
(see Figure 1). Time points were 15 minutes into the study (baseline 1), 25 minutes into the
study immediately before the social manipulation (baseline 2), and 10, 20, and 30 minutes
after the social manipulation (SM +10, SM +20, and SM +30, respectively). At each time
point, saliva samples (dependent variable) were collected to access physiological reactivity to
the social manipulation. Self-reported measures of mood (dependent variables: reported
stress, optimism, happiness, tenseness, and distress) were also taken at each time point.
Measures of chronic depression, stress, trait anxiety, personality and interpersonal support
were taken once during the study to assess participant characteristics and potential influences
on stress vulnerability.
3.1.2 Participants
Ninety nine female undergraduates from Anglia Ruskin University expressed an
interest in the study and were screened using the Spielberger Trait Anxiety Inventory (STAI;
Spielberger, Gorsuch, Lushene, Vagg, & Jacobs, 1983). Of these, 73 responders who scored
below 50 on the scale were formally invited to take part in the study2. Thirty nine
participants3 between the ages of 18 and 42 years old (M = 22.12, SD = 4.09) accepted the
2 This screening procedure was implemented as required by Anglia Ruskin University’s Faculty Research Ethics Panel as a precaution to prevent people with clinical levels of anxiety from being included in the study. 3 A power calculation was initially conducted using the conservative assumpion of a small effect size (d = .25), which determined that optimal statistical power (.95) would be achieved with 64 participants in each condition (G*Power 3; Faul, Erdfelder, Lang, & Buchner, 2007). For practical reasons it was not possible to recruit such large sample sizes for all the studies contained within this thesis, given time and financial constraints. Whilst the power is not ideal, sample sizes in the studies contained within this thesis are comparable to those in the published literature (e.g. Dandeneau, Baldwin, Baccus, Sakellaropoulo & Pruessner, 2007; MacLeod, Rutherford, Campbell, Ebsworthy, & Holker, 2002; Stroud, Salovey, & Epel, 2002). It is recognised that recruiting a smaller sample increases the risk of incorrectly rejecting the experimental hypothesis.

CHAPTER THREE
37
invitation and were randomly assigned to one of two conditions: social rejection (age M =
22.78, SD = 5.15) or social acceptance (age M = 21.43, SD = 2.50). As a group, state anxiety
averaged 42.91 (SD = 9.53), with socially rejected participants averaging 41.88 (SD = 9.76)
and socially included participants averaging 43.88 (SD = 9.51).

CHAPTER THREE
38
Pre-task questionnaire pack
Saliva collection instructions followed by sample 1 and
mood questionnaires 1
Group chat
Sample and mood questionnaires 2
Split into individual rooms – provide ratings of other
participants for group task
Receive feedback – social rejection
Receive feedback – social acceptance
Complete ‘group task’ alone
Sample and mood questionnaires 3
Sample and mood questionnaires 4
Sample and mood questionnaires 5
Post task questionnaires
Figure 1. Overview of Study 1’s experimental design

CHAPTER THREE
39
3.1.3 Materials
Psychological measures. Prior to giving their first saliva sample, participants
completed a questionnaire asking about several aspects of compliance (e.g. when they last ate
or drank) to confirm adherence to instructions given relating to the hours leading up to
participating in the study. Participants were also asked questions relating to their health
behaviour (e.g. how much alcohol they had consumed in the previous week), their oral and
overall health and details regarding any medication they were currently taking. This was to
collect background data that could be used with retrospect to help identify and justify
outliers.
Stress-arousal checklist. Each time participants gave a saliva sample, they completed
a copy of the Stress-Arousal Checklist (SACL; Mackay, Cox, Burrows, & Lazzerini, 1978),
which is based on a two-dimensional model of mood. One dimension (stress) focuses on
feelings of pleasantness or unpleasantness, while the other dimension (arousal) is based on
feelings of alertness or drowsiness. The 34-item scale includes both positive and negative
mood-describing adjectives that focus either on stress (18 items) or arousal (14 items). For
example, “cheerful” (positive stress item), “tense” (negative stress item), “energetic”
(positive arousal item), and “sluggish” (negative arousal item). For each item, individuals
must select a response on a four-point scale ranging from 1 (definitely) to 4 (not at all)
according to how accurately the adjective describes how they are feeling at that specific
moment in time. Items that apply to the individual (where the adjective has received a score
of 1 (definitely) or 2 (slightly)) are recoded as a 1, while items that do not apply to the
individual (those that have received a score of 3 (unsure) or 4 (not at all)) are recoded as a 0.
Overall stress scores are calculated by totalling the recoded positive stress items that have
received a score of 1 (e.g. where an individual has said they are feeling slightly or definitely
tense) with the recoded negative stress items that have received a score of 0 (e.g. where an

CHAPTER THREE
40
individual has said they are unsure or do not feel cheerful). Overall arousal scores are
calculated in the same way using the relevant positive and negative arousal items. Cronbach’s
alpha has been typically reported as between .80-.90 for both scales, with the stress scale
invariably being slightly higher (e.g. Lau & Morse, 2005; O’Connor, Cobb, & O’Connor,
2003)4.
Visual analogue scales. After completing each SACL, participants completed four
visual analogue scales (VAS; Aitken, 1969; Bond & Lader, 1974) to assess fluctuations in
mood over time during the study. Each of these VAS consisted of a 10cm line, with terminals
labelled pessimistic to optimistic, depressed to happy, distressed to not distressed, and tense
to relaxed. Participants were asked to place a cross along the line according to how they felt
at that moment, which was converted to a score out of 100 by multiplying the length along
the line (in cm) by 10.
Post-task questionnaire battery. Depression Anxiety Stress Scale (DASS). The DASS
(Lovibond & Lovibond, 1995a; 1995b) was developed to provide a greater understanding of
the emotions and underlying constructs of the terms generally described as depression (e.g.
pessimistic, lacking in motivation), anxiety (e.g. panicky, awareness of a pounding heart) and
stress (e.g. easily irritable, intolerant of change). Internal consistency for all three subscales is
high (Cronbach’s alpha = .88, .82, and .90, respectively) with a total scale α consistency of
.93 (Henry & Crawford, 2005). Though originally a 42-item scale, a shortened version
containing 21 items is commonly used in research with 7 items dedicated to each of the three
subscales. Items apply to experiences over the previous week, for example “I felt that life was
meaningless” (depression), “I felt I was close to panic” (anxiety), and “I tended to over-react
to situations” (stress). Individuals are required to rate the extent to which each statement was
4 This scale has been used here and in future studies contained within this thesis to measure stress, therefore only the stress dimension is considered in analysis.

CHAPTER THREE
41
relevant to them on a four point scale ranging from 0 (Did not apply to me at all), to 3
(Applied to me very much, or most of the time). Scores can be determined for each subscale
by summing the responses for each item. Alternatively a total score can be attained by
summing the subscales, which provides an indicator of general negative symptomology.
General Health Questionnaire (GHQ). The GHQ (Goldberg, 1972; Goldberg &
Williams, 1988) is a popular measure of psychological distress used in research and assesses
participants on four dimensions of mental wellbeing; depression, anxiety, somatic symptoms
and social withdrawal. Although the GHQ is available as a 12-item, 28-item, 30-item or 60-
item, the GHQ-28 is most commonly used and, hence, was used in this study. GHQ scores
frequently correlate highly with additional measures of psychological distress or well-being
(Jackson, 2007) suggesting concurrent validity. Internal consistency is good both for the
whole scale (Cronbach’s α =.90) or individual subscales (between .71 - .85; Vallejo, Jordán,
Díaz, Comeche, & Ortega, 2007). The GHQ applies to a person’s experiences over the past
few weeks. Examples of items on the GHQ-28 scale include “Have you recently lost much
sleep over worry?”, and “Have you recently been satisfied with the way you’ve carried out
your tasks?”. Items are resolved by four possible answers, ranging from 0 (not at all) to 3
(much more than usual) (or those equivalent). Responses can be summed to give totals for the
four subscales or an aggregate total.
Perceived Stress Scale (PSS). The PSS (Cohen, Kamarck, & Mermelstein, 1983) is
available as a 4-item, 10-item, or 14-item scale and is used to give a measure of an
individual’s perception of stress over the preceding one month. In the current study the 10-
item scale was used, as this version is considered to have superior sensitivity to psychometric
distinction compared to the alternate versions (e.g. Cohen & Williamson, 1988; Lesage,
Berjot, & Deschamps, 2012). The scale was designed to assess how uncontrollable,
unpredictable and overloading an individual considers their life to be. Internal consistency for

CHAPTER THREE
42
the 4-item version is relatively low at Cronbach alpha = .60, while the 10-item version has
been reported to have adequate consistency (Cronbach alpha = .78) (Cohen & Williamson,
1988). Individuals are required to rate how often they have felt a certain way. For example,
“In the last month, how often have you felt you were effectively coping with important
changes that were occurring in your life?” or “In the last month, how often have you felt that
difficulties were piling up so high that you could not overcome them?”. Responses are scored
from 0 (never) to 4 (very often). Scores on the 10-item scale range from 0 to 40, and are
obtained by reversing the seven positive items (i.e. where a high score indicates a desirable
option) and summing the ratings.
Personality Inventory. Due to findings of a relationship between personality and
cortisol reactions to stressors (e.g. Oswald et al., 2006), personality was included as a trait
measure. The personality inventory used was taken from the International Personality Item
Pool (IPIP; Goldberg et al., 2006). Similar to the Costa and McCrae’s (1992) five factor
model, the personality inventory measures five independent subscales, namely extraversion
(e.g. “I talk to a lot of different people at parties”), agreeableness (e.g. “I sympathise with
others’ feelings”), conscientiousness (e.g. “I am exacting in my work”), emotional stability
(e.g. “I am relaxed most of the time”), and intellect (e.g. “I am quick to understand things”).
The five subscales each have good internal reliability, with Cronbach’s alpha coefficients of
.87, .82, .79, .86, and .84, respectively. Each subscale consists of 10 items including positive
and negative phrases that individuals have to rate according to how accurately the statements
reflect their own behaviour on a five-point scale ranging from 1 (very inaccurate) to 5 (very
accurate). Negative items (e.g. for extraversion, the item “I have little to say”) are reverse
scored before a total for each of the five subscales can be attained by summing the relevant
responses.

CHAPTER THREE
43
Spielberger Trait Anxiety Inventory (STAI-T). Described as the “...definitive
instrument for measuring anxiety in adults...” (Mind Garden, 2010, “State-Trait Anxiety
Inventory for Adults”, para. 1), the STAI (Spielberger, Gorsuch, Lushene, Vagg, & Jacobs,
1983) is divided into items measuring transitory anxiety (state) and more stable chronic
anxiety (trait). Each subscale has 20 dedicated items that are measured on a four point Likert
scale ranging (on the trait items) from 1 (almost never) to 4 (almost always). Examples of
items measuring trait anxiety include, “I [generally] feel inadequate”, and “I am [generally] a
steady person”. State anxiety or trait anxiety scores can be calculated by summing participant
responses, with some items needing to be reverse scored. The scale has been found to share
high positive correlations (>.70) to other anxiety scales, for example, the Anxiety Scale
Questionnaire and Manifest Anxiety Scale (Spielberger, Reheiser, Ritterband, Sydeman, &
Unger, 1995). Spielberger, Gorsuch, and Lurshene (1970) also demonstrated good test-retest
reliability for both subscales (trait: r = .76 for females, r = .84 for males; state: r = .92 for
females, r = .83 for males), although there is a general acceptance that state anxiety scores
tend to be slightly higher at second measurement.
Interpersonal Support Evaluation List (ISEL). The ISEL (Cohen & Hoberman, 1983)
was designed to measure the perceived availability of social support, which has been posited
to act as a form of protection to stress-induced pathology when perceived stress is high. The
scale measures four independent subscales, namely tangible, belonging, self-esteem, and
appraisal, and can generate a broad overall rating of potential social resources available. The
40-item scale is made up of an equal number of positive statements such as “There are
several people that I trust to help solve my problems”, and negative statements such as “In
general, people do not have much confidence in me”. Individuals are required to rate how
relevant each statement is to them on a four-point scale ranging from 0 (definitely false) to 3
(definitely true). Scores for negative items are reversed before the scores are summed to give

CHAPTER THREE
44
either an overall total or subscale total value, where a high score indicates a high level of
potential social support. The ISEL demonstrates good reliability, with test-retest reportings of
.87 (r = .71-.87 for the individual subscales) and internal consistency α ranging from .77-.86
(Cohen & Hoberman, 1983).
Stressor
Stress was manipulated by attempting to induce feelings of either social rejection
(stress group) or social inclusion (comparison group). Prior to the induction of these feelings,
participants chatted with each other informally for approximately 5 minutes. Participants
were informed that this period was designed to relax them and to enable them to get an idea
of who they might prefer to work with later in the study. Participants were then divided into
individual rooms and asked to select a partner for an upcoming group exercise by providing
ratings of their fellow participants. Ratings were instructed to be based on who they would
prefer to work with and who might best respect and fairly consider their opinion. Space was
provided on the rating sheet for participants to rate all but one of their fellow participants.
After collecting the slips, the researcher entered each individual room and informed
the participant that there had been a problem with the group allocation. Participants were
either informed that every person had requested to work with them as their primary preferred
option, therefore, they could not be fairly assigned a group (social inclusion), or that they
remained unrated and so could not be assigned a group (social rejection). Regardless of their
condition, all participants completed the ensuing ‘group’ task alone; the difference being in
whether they were led to believe this was due to them being too popular or too unpopular to
be assigned a group.

CHAPTER THREE
45
“Group Task”
Participants were instructed to complete a group exercise which they were informed
was designed to investigate how group dynamics interact with individual mood and
physiology. This task was actually a filler task, completed (alone) once people had been
socially rejected or accepted in order to uphold the illusion and allow participants to ruminate
on their respective social manipulation. The task was designed and delivered using Microsoft
PowerPoint software. Photographic headshots of males and females were individually
presented in the middle of a computer screen for six seconds each. A coloured screen was
then displayed for a further five seconds, during which participants were instructed to make a
“group” decision indicating on a Likert scale how friendly they thought the person was likely
to be based on the photo alone. A total of 48 photos were presented in this sequence.
3.1.4 Saliva Collection and Analysis
Saliva was collected five times over the duration of the study via a passive drool
technique into a 2ml cryovial tube (Greiner Bio-One Ltd, UK). For this, participants were
instructed to clear their mouths by swallowing, then position their head forward with their
chin tilted towards their chest for a 90-second period to allow saliva to accumulate at the
front of their mouths. This was then transferred to the appropriate, individually labelled,
cryovial tube with the assistance of a short section of straw. This procedure was repeated into
the same tube to constitute one sample.
The first two collections were directed and timed by the researcher. The instructions
and timing for the final three collections was inbuilt into the group task programme. After the
last photo presentation, the task instructed the participant to find the corresponding cryovial
for the third saliva sample (the instructions were designed for a group audience). Upon
clicking the mouse, a 90-second period was timed for the first half of a sample. This was

CHAPTER THREE
46
followed by a screen asking the participant to deposit the saliva into the tube before clicking
the mouse again to time a further 90-second period. The following screens were timed to
enable the fourth and fifth samples to be taken at 10 minute intervals.
Samples were frozen at -80°C until required for assaying. Samples were analysed for
levels of cortisol and sAA. More detailed information on these procedures can be found
elsewhere (see Chapter two).
3.1.5 Procedure
Ethical approval was obtained from Anglia Ruskin University Faculty Research
Ethics Subcommittee. Participants were instructed not to eat, drink (other than water), or
smoke for 30 minutes prior to the study, and to refrain from vigorous exercise for 90 minutes
preceding the study. Participants in groups of 3-5 were met by the researcher in a lecture
room. They were issued with a participant information sheet and given time to read it and ask
questions prior to signing a study consent form. Participants were asked to drink a cup of
mineral water to rinse their mouths of any food debris. Following this, participants completed
a pre-task questionnaire which included questions relating to health behaviour, oral hygiene,
and general health. Ten minutes after taking the drink, participants were issued with
instructions on how to give a saliva sample based on the passive drool method described
above. Participants then gave their first saliva sample, after which they completed the SACL
and four VAS based on their current feelings and emotions. Participants were then
encouraged to chat freely as a group without the presence of the researcher (once a dialogue
was established).
Ten minutes after their first sample, participants provided their second saliva sample
using the same procedure as before. Again, at this point, they completed some questionnaires
(SACL and the four VAS). Participants were then given instructions on how the group task

CHAPTER THREE
47
would commence, that they were to be presented with still images of faces which they were
to rate in their group by selecting a number on a Likert scale depending on how kind (or
mean) they thought that person was likely to be based on the still image alone. They were
told that each member of the group was to ensure they had the same rating. Participants were
then instructed how to choose their groups before being separated into individual rooms.
Participants were required to provide ratings of their peers according to who they would
prefer to work with and were then issued with information concurrent with their condition
(see Stressor section above).
Participants remained in their individual rooms for the remainder of the session. After
completing the “group” task (ten minutes after the social manipulation), participants gave a
third saliva sample and completed a third SACL and four VAS. They were then instructed to
start completing the post-task questionnaire battery, which was designed to measure aspects
of their personality, general and perceived health, and interpersonal support. Ten minutes
after the third sample, participants were instructed to give their fourth sample and complete a
fourth SACL and four VAS. They then returned to the questionnaire battery for a period of
ten minutes before being asked to give their fifth and final saliva sample, and complete their
final SACL and four VAS.
Participants were given debrief sheets in their individual rooms, explaining the
underlying nature of the study, before being debriefed as a group in the same room as they
started. The debrief was conducted in this manner to prevent any unnecessary embarrassment
from returning to a group they might have believed had recently rejected them. Once
questions and concerns had been addressed, participants were paid £8 to compensate them for
their time.

CHAPTER THREE
48
3.1.6 Data Analysis Plan
Prior to testing the study hypothesis, the data was explored to ensure it met the
assumptions of parametric testing. Data from trait questionnaires was also explored briefly to
check for potential group differences. To test the study hypothesis regarding changes over
time and influence of social manipulation, a series of repeated measures ANOVAs were
conducted on the relevant dependant variables (e.g. reported stress, cortisol, etc), with time as
a within subjects factor and group as the between subjects factor. Main effects of time are
reported though not necessarily explored where they are qualified by time x group
interactions. For ease of clarity, group main effects are largely not reported unless significant
or relevant to the point of note. Where appropriate, a-priori and post-hoc testing was carried
out via paired t-tests to isolate significant interactions. Corrected alpha levels (Bonferroni)
were calculated and are reported.

CHAPTER THREE
49
3.2 Results
3.2.1 Data Exploration
All data was explored for outliers and to check the data met the assumptions for
parametric testing. All data obtained by saliva analysis (sAA activity, sAA secretion, cortisol
concentration and flow rate) included several outliers and showed positive skewing, and was
therefore log transformed, which successfully normalised the distribution (Nicolson, 2008).
All analyses were conducted using logged data, however descriptive and graphical
representation of the means and measures of variation are presented using unlogged data.
A series of 2 (group; reject, accept) x 2 (time; baseline, baseline 2) repeated measures
ANOVAs were conducted in the initial analysis of the data and revealed an apparent
difference in the physiological data between the first two samples; baseline 1 and baseline 2
(taken approximately 10 minutes apart). Looking more specifically at these two sample
points, flow rate was found to significantly increase, F(1, 37) = 10.53, p = .002, ηp2 = .22,
from an average of .24mls/min (SD = .15) to an average of .32mls/min (SD = .16). There was
no main effect of time on cortisol concentrations, F(1, 34) = .02, p = .89, ηp2 < .001, while
sAA activity, F(1, 29) = 12.00, p = .002, ηp2 = .29, and secretion, F(1, 29) = 35.40, p < .001,
ηp2 = .55, both considerably increased. No significant group main effects or time x group
interactions were observed for any of the above findings (all F values < 1). For this reason,
future analyses are conducted using the second of the two samples as a baseline measure;
hereafter referred to as baseline 2.
3.2.2 Participant Characteristics
There were no significant differences between the two groups according to mean self-
reported levels of trait depression, stress, trait anxiety or any of the personality subscales (see

CHAPTER THREE
50
Table 1). Participants in the social inclusion group reported having significantly more overall
functional interpersonal support compared to socially rejected participants. Broken down into
the four subscales, perceived self esteem and appraisal showed no significant differences
between the two groups, while a sense of belonging and tangible support were found to
approach significance.
3.2.3 Self-Reported Stress
Exploring the hypothesis that social rejection would lead to an acute increase in stress,
a 2 (condition; rejection, inclusion) x 3 (time; baseline 2, 10 minutes after social
manipulation, 20 minutes after social manipulation) repeated measures ANOVA was
conducted on the self-report stress data from the SACL. There was a significant time main
effect, F(1.67, 61.78) = 5.44, p = .01, ηp2 = 0.13 (Greenhouse-Geisser reporting). Further
investigation identified a significant rise in reported stress between baseline 2 and 10 minutes
after the social manipulation, regardless of participants’ condition, t(38) = -2.85, p = .01, d =
.41 (Bonferroni corrected alpha = 0.025). As can be seen from Table 2, participants do appear
to start recovering from this increase in stress, although the difference (decrease between 10
and 20 minutes after SM) remained just above the corrected level of significance, t(38) =
2.23, p = .03, d = .29.

CHAPTER THREE
51
Table 1
Participant characteristics
Social rejection Social inclusion
Questionnaire Factor / Subscale Mean SD Mean SD p value
STAI Trait anxiety 41.64 10.65 44.38 9.60 .55
DASS Depression
Anxiety
Stress
Total
5.45
5.36
7.27
36.18
7.22
4.61
6.40
34.62
5.06
4.06
7.94
34.13
4.81
2.86
4.37
21.31
.78
.56
.93
.80
GHQ Distress 98.18 27.13 99.81 22.96 .65
PSS – 10 Stress 18.55 4.87 18.31 6.60 .99
Personality Extraversion
Emotional stability
Conscientiousness
Agreeableness
Intellect / Openness
31.45
28.64
33.64
33.27
34.09
1.21
3.14
3.17
4.24
3.65
26.81
26.81
32.25
33.50
33.00
3.05
3.39
3.13
2.92
4.40
.16
.30
.12
.77
.66
ISEL Appraisal
Tangible
Self esteem
Belonging
Total
23.13
21.53
19.53
21.47
85.67
6.83
5.14
5.28
5.88
20.59
26.33
24.44
20.78
24.83
96.39
3.90
3.78
3.95
4.59
14.08
.10
.05
.35
.08
.02
Note: STAI – State trait anxiety inventory, DASS = Depression Anxiety Stress Scale, GHQ =
General Health Questionnaire, PSS = Perceived Stress Scale, ISEL = Interpersonal Support
Evaluation List.

CHAPTER THREE
52
Table 2
Total reported stress over time
Mean Reported Stress
(N = 39)
SD
Baseline 2 3.00 4.01
Social manipulation + 10 minutes 4.64 3.92
Social manipulation + 20 minutes 3.38 4.62
Mean stress scores did appear to show a higher peak in response to social rejection
than to social inclusion (see Figure 2). However, contrary to the hypothesis, the time x group
interaction was not found to be statistically significant, F(1.67, 61.78) = 0.83, p = .42, ηp2 =
.02.
Figure 2. Mean stress scores and variation (SE). SM = Social manipulation.
1
2
3
4
5
6
Baseline 2 SM + 10 minutes SM + 20 minutes
Me
an
se
lf-r
ep
ort
ed
str
ess
Social Rejection
Social Inclusion

CHAPTER THREE
53
3.2.4 VAS
A 2 (condition; rejection, inclusion) x 3 (time; baseline 2, 10 minutes post-social
manipulation, 20 minutes post-social manipulation) repeated measures ANOVA was
conducted on each of the VAS to assess the acute effects of the social manipulation. No
significant main effect of time on reported optimism was found, F(2, 72) = .30, p = .74, ηp2 =
0.01, though a significant time x condition interaction was found, F(2, 72) = 5.58, p = .01, ηp2
= 0.13. Upon further investigation, participants who were socially rejected were found to
report significantly less optimism immediately after the social manipulation, t(19) = 2.88, p =
.01, d = .31 (Bonferroni corrected α = 0.0125), whereas participants who were socially
included showed no change in reported optimism before or after the social manipulation,
t(18) = -1.44, p = .17, d = .18 (see Figure 3a). No significant differences were found in self-
reported levels of optimism from 10 to 20 minutes after the social manipulation for either
group (social rejection p = .43; social inclusion p = .89).
For self-reported levels of happiness (see Figure 3b) a significant main effect of time
was revealed, F(1.68, 60.29) = 3.68, p = .04, ηp2 = 0.09, with a trend time x group interaction
also emerging suggesting different levels of happiness according to whether participants had
been socially rejected or included, F(1.68, 60.29) = 2.81, p = .08, ηp2 = 0.07. Post-hoc
analysis of the main effect of time illustrated a significant decrease in levels of self-reported
happiness for all participants following the social manipulation phase, t(38) = 2.60, p = .01, d
= .29 (Bonferroni corrected α = 0.03). There was no change in self-reported happiness from
10 to 20 minutes after the social manipulation (p = .09). A-priori investigations of the trend
interaction identified a decrease in self-reported happiness immediately following social
rejection that fell just short of the revised alpha level, t(19) = 2.53, p = .02, d = .49
(Bonferroni corrected α = 0.01), from an average reporting of 71.75% (SD = 24.02) to
58.75% (SD = 28.46). There was no significant difference in reported happiness from 10 to

CHAPTER THREE
54
20 minutes after the social manipulation, t(19) = -1.64, p = .12, d = .15. Participants who had
been socially included showed no significant change in their reported levels of happiness
(baseline 2 – SM + 10 minutes p = .35; SM + 10 minutes – SM + 20 minutes p = .45).
No significant main effect or interaction was identified for self-reported levels of
distress (all p values > .24; see Figure 3c). A significant time main effect was found for self-
reported tension, F(2, 72) = 3.43, p = .04, ηp2 = 0.09, though the time x group interaction was
not significant, F(2, 72) = 0.50, p = .61, ηp2 = 0.01. Further investigation of the main effect,
using a Bonferroni corrected alpha (0.025), found no significant change in overall reported
tension immediately after the social manipulation (p = .47) but a significant increased relaxed
state 20 minutes after the social manipulation, t(37) = -2.89, p = .01, d = .25 (see Figure 3d).

CHAPTER THREE
55
Summary of Psychological Response
Contrary to the hypothesis, stress was found to significantly increase following the
social manipulation in all participants. As expected, for the social rejection group, self-
reported optimism and levels of happiness were both found to decrease following the social
manipulation task. For the social inclusion group self-reported optimism and happiness did
not differ significantly pre- and post- social manipulation. There was no significant variation
in reported levels of distress in either condition, which opposes the hypothesis. Furthermore,
levels of tension did not differ significantly pre- and post-social manipulation but were
Figure 3. Mean mood self-ratings (with standard error) for optimism (a), happiness (b),
distress (c), and tension (d). A higher score indicates more intense feelings of the measure
15
20
25
30
35
40
45
50
Baseline 2 SM + 10
minutes
SM + 20
minutes
Me
an
re
po
rte
d t
en
sio
n
Social Rejection Social Inclusion
50
55
60
65
70
75
80
Baseline 2 SM + 10
minutes
SM + 20
minutes
Me
an
re
po
rte
d o
pti
mis
m
50
55
60
65
70
75
80
Baseline 2 SM + 10
minutes
SM + 20
minutes
Me
an
re
po
rte
d h
ap
pin
ess
15
20
25
30
35
40
45
50
Baseline 2 SM + 10
minutes
SM + 20
minutes
Me
an
re
po
rte
d d
istr
ess
(a) (b)
(c) (d)

CHAPTER THREE
56
significantly lower 20 minutes post-manipulation than 10 minutes post-manipulation. Overall
these findings do not support the hypothesis that social rejection alone would lead to a
significantly more negative psychological state, as only the VAS measures of optimism and
happiness show changes in the expected manner.
3.2.5 Cortisol
A 2 (condition; rejection, inclusion) x 4 (time; baseline 2, 10, 20, and 30 minutes after
the social manipulation) repeated measures ANOVA was conducted to determine the
influence of social manipulation on cortisol reactivity. A significant main effect of time, F(3,
93) = 21.39, p < .001, ηp2 = .41, and a significant time x group interaction was found, F(3,
93) = 3.43, p = .02, ηp2 = .10 (see Table 3).
Table 3
Mean cortisol data (µg/dl)
Baseline 2 SM + 10
minutes
SM + 20
minutes
SM + 30
minutes
Social
rejection
Mean
SE
0.10
0.06
0.09
0.05
0.08
0.05
0.07
0.04
Social
inclusion
Mean
SE
0.11
0.06
0.09
0.04
0.09
0.04
0.09
0.03
Further investigation of the significant interaction revealed a general pattern of
decreasing cortisol concentration for socially rejected participants. Specifically there was a
significant decrease between baseline 2 and 10 minutes after the social manipulation, t(19) =
2.71, p = .014, d = .20 (Bonferroni correct α = .017). There was also a trend decrease between
10 – 20, t(18) = 1.96, p = .07, d = .21, and 20 – 30, t(17) = 1.97, p = .07, d = 21, minutes after
the social manipulation. Additionally, when comparing the difference between the first
sample (baseline 2) and final sample (SM + 30 mins), it was found that there was a

CHAPTER THREE
57
significant decrease in cortisol levels in this group, t(18) = 5.61, p < .001, d = .59 (see Figure
4). In contrast, for the socially included group, this decrease appeared evident initially
between the baseline 2 and SM + 10 mins samples, t(15) = 3.96, p = .001, d = .39, and then
there was no significant change between either 10 – 20 minutes or 20 – 30 minutes after the
social inclusion (p = .56, p = .72 respectively).
Figure 4. Time x condition group interaction on mean cortisol concentration
3.2.6 Alpha Amylase and Flow Rate
A 2 (condition; rejection, inclusion) x 3 (time; baseline 2, and 10 and 20 minutes after
the social manipulation) repeated measures ANOVA was conducted to determine any acute
effect of SM on sAA activity. A significant main effect of time was found, F(1.66, 51.44) =
6.82, p < .001 ηp2 = 0.18, however there was no significant time x group interaction, F(1.66,
51.44) = .27, p = .77 ηp2 = 0.01. Upon further investigation of the time main effect, sAA
0.06
0.07
0.08
0.09
0.1
0.11
0.12
0.13
Baseline 2 SM + 10
minutes
SM + 20
minutes
SM + 30
minutes
Me
an
un
log
ge
d c
ort
iso
l (µ
g/d
l)
Social rejection
Social Inclusion

CHAPTER THREE
58
activity significantly decreased between baseline 2 and 10 minutes after the SM, t(33) = 3.09,
p < .001, d = .39 (Bonferroni corrected α = 0.025). There was no significant change in sAA
activity from 10 to 20 minutes after the social manipulation, t(34) = -.64, p = .53, d = .05 (see
Table 4).
In keeping with current advice (e.g. Salimetrics, 2012) when measuring biomarkers
that are potentially dependent on saliva flow, sAA secretion (output over time) and saliva
flow were calculated and were analysed in the same manner as sAA activity. Interestingly,
for sAA secretion rate, there was no significant main effect of time, F(1.53, 47.43) = .73, p
= .43, ηp2 = 0.03. Social manipulation was also not found to significantly interact with sAA
secretion over time, F(1.53, 47.43) = .13, p =.83, ηp2 = 0.19 (see Table 4).
Table 4
Mean sAA activity and secretion
Baseline 2 SM + 10 minutes
SM + 20 minutes
Activity (U/ml)
Mean
SD
75.22
59.70
55.82
50.20
57.85
54.37
Secretion (U/min)
Mean
SD
24.51
20.67
21.37
21.49
21.95
18.63
Note. SM = Social manipulation.
For flow rate, a significant time main effect was found, F(1.52, 54.54) = 8.62, p
<.001, ηp2 = 0.19. No significant time x group interaction was identified, F(1.52, 54.54) =
2.76, p = .09, ηp2 = 0.07. Post-hoc testing of the main effect revealed that saliva flow
appeared to follow the exact opposite pattern as sAA activity, with a significant increase
between baseline 2 and 10 minutes post SM, t(38) = -2.68, p = .01, d = .36 (Bonferroni

CHAPTER THREE
59
corrected α = 0.025), which was maintained at 20 minutes post-social manipulation, t(37) = -
.07, p = .95, d = .01 (see Table 5).
Table 5
The relationship between sAA and saliva flow changes over time
TIMEPOINT COMPARISON
Baseline – SM + 10
minutes
SM + 10 minutes – SM +
20 minutes
sAA activity p = .004
Significant DECREASE
p = .53
No change
Flow rate p = .011
Significant INCREASE
p = .95
No change
sAA secretion p = .19
No change
p = .25
No change
Summary of Physiological Response
Cortisol was found to decrease generally throughout the study, which was more
prominent in participants who experienced social rejection. sAA activity appeared to
significantly decrease following the social manipulation phase for all participants, while flow
rate showed the opposite pattern and significantly increased. There was no change in sAA
secretion. None of these findings support the hypothesis for a greater physiological activation
in response to social rejection.
Note. SM = Social manipulation

CHAPTER THREE
60
3.3 Discussion
This study aimed to establish a stressor task that was successful in eliciting a reliable
physiological and psychological response, marked by an increase in reported stress and
increases in sAA and cortisol. VAS measured changes in emotion due to the stressor. In line
with the hypothesis, social rejection was successful at decreasing reported levels of optimism
and happiness. However, there was no effect on reported tension or distress. The SACL
measured changes in stress in response to the social manipulation and, in contrast to the
hypothesis, reported stress was found to increase in all participants following the social
manipulation regardless of condition. Levels of cortisol concentration were found to decrease
after social rejection but not social inclusion, thereby failing to support the hypothesis which
had predicted an increase in cortisol following social rejection. Whilst there was a significant
decrease in sAA activity following social manipulation generally, there was also a significant
increase in flow rate in an exactly opposite manner and no change in sAA secretion rate, none
of which supported the experimental hypotheses.
According to data collected using VAS, social rejection was partially successful in
inducing a negative state. However, it is worth noting that all four measures of mood
(optimism, happiness, distress, and tension) shared significant positive correlations at all time
points throughout the study (weakest correlation: r (39) = .45, p < .01; strongest correlation: r
(38) = .92, p < .001). Considering that a higher value indicated a more intense feeling of
emotion, it is initially surprising to observe a positive relationship between all of these
variables when two depict positive mood states (optimism, happiness) and two depict
negative mood states (distress, tension). However, these scales are rudimentary in their
method of measurement – requiring participants simply to place a cross along a continuum
line to indicate their current state – and allow participants to choose their own baseline. For
this reason, it is only natural that great variation will be introduced as individuals

CHAPTER THREE
61
systematically endorse higher or lower numbers using this scale. Whilst the validity might be
questionable, a within-subjects design might still be able to usefully apply these measures to
monitor individual change over time. Alternatively, interpretations drawn in a between-
subjects study (such as the present study) would be contaminated by such radical inter-
variation and so would be unreliable. Future studies within this thesis are therefore advised to
adopt more standardised measures of mood.
The lack of any significant effects of social rejection on reported stress above and
beyond that of social inclusion opposes the findings of Blackhart, Eckel, and Tice (2007).
These results are surprising given that the methodology was based on what Blackhart et al.
claim to be a commonly used protocol. Further, Blackhart et al. applied some stipulations to
the rating process preventing participants from rating any person with whom they had some
form of social affiliation. They proceeded to note in their discussion that lifting this limitation
might lead to stronger effects of social rejection as there would be an increased personal
significance of being rejected by people they had an existing relationship with. Therefore, the
current study should arguably have intensified any feelings of rejection as there were no such
stipulations regarding precisely whom participants could or could not rate. However, it
remains possible that such an attempt to further reinforce rejected feelings failed on two
instances. Firstly, participants signed up to the study independently, with groups largely
consisting of people who were not existing friends (though data was not collected to monitor
this). Therefore, whilst the occasional instance of friends appearing to reject friends occurred,
to a large extent the ratings were made between unfamiliar people as in Blackhart et al.’s
study. Second, in instances where friends did appear to reject friends (in apparent favour of
unfamiliar people), it is possible that participants started to see through the deception and so
became disengaged rather than feel excluded. As no measure of manipulation scepticism was
taken before debriefing participants, it is difficult to know definitively whether participants

CHAPTER THREE
62
were entirely persuaded of their social manipulation condition, though post-debrief
conversations failed to highlight any specific area of concern. Future research might try to
avoid such limitations by including some check on manipulation impression to assess
whether participants were successfully influenced.
Alternatively, the rise in reported stress across both socially rejected and accepted
participants could result from the nuances of social anxiety. While traditional models of
social anxiety posit that it is driven by a fear of negative social judgement (Clark & Wells,
1995), recent attempts to further understand the concept have additionally considered the role
of positive evaluation. For example, Weeks, Heimberg, Rodebaugh, and Norton (2008) have
shown high correlations between a fear of positive evaluation and measures of social anxiety.
Therefore, in the present study, perhaps simply the reception of social feedback was
sufficient in producing an increase in perceived stress in the more socially anxious
participants. As a measure of social anxiety or fear of positive/negative evaluation was not
taken in this study, such a hypothesis is conjecture at the present time. However, it is worth
noting at this point that in spite of a significant increase being observed, reported stress levels
remained relatively low throughout the study giving the impression that participants were not
particularly stressed by the experience. For this reason the above hypothesis seems unlikely
to hold true in this instance though remains an interesting consideration for future studies. In
further support of this assumption, the present study only recruited participants who scored
below 50 on the STAI; a request made by the ethics committee. Blackhart et al. (2007)
included no such limitations. It is likely that, in abiding by ethical stipulations, the present
study inadvertently selectively recruited a sample who were less sensitive to anxiety-
provoking situations. In future situations where the sample is restricted in such a manner, the
impact of social rejection might be more effective if exposure is made in a more public
environment, with more of an audience presence. For example, Dickerson, Mycek, and

CHAPTER THREE
63
Zaldivar (2008) found that participants who took part in a stressful task (delivering a speech)
in front of a judging audience, where the prospect of social evaluation is apparent, showed a
significant increase in cortisol relative to when the speech was given to an empty room.
The current study found a decrease in sAA activity in response to both social rejection
and social acceptance. This finding is unexpected given that the current understanding
suggests that levels of sAA would be expected to increase in response to an acutely stressful
event (e.g. Bosch et al., 1996). However, reported stress was found to increase in response to
both manipulations therefore it is possible to present a post-hoc rationalisation of this finding.
For example, while there are presently no studies that focus specifically on the effects of
social rejection as a type of stressor on sAA, the results do provide partial support for studies
focusing on the influence of social stressors on other aspects of the ANS. For example,
Gunther Moor, Crone, and van der Molen (2010) present findings on heart-rate variability
following social rejection that in part draw a parallel to the patterns of general sAA activity in
the current study. Gunther Moor et al. claimed that unexpected rejection specifically serves to
increase feelings of being hurt, which disrupts the autonomic balance in favour of
parasympathetic control, thereby leading to a decrease in heart rate. In support of this theory,
Heilman et al. (2008) also found a decrease in heart rate in children exposed to a social
challenge which remained absent when exposure was to a physical challenge. The self-report
data in the current study showed an increase in stress resulting from the social manipulation
element generally (i.e. regardless of whether this involved social rejection or acceptance). It
is possible, then, that the decrease in sAA activity seen generally in all participants, in
addition to an increase in flow rate which is regulated through parasympathetic activation,
could be a result of the social manipulation factor and so could serve to support Gunther
Moor et al.’s propositions further.

CHAPTER THREE
64
The fact that socially rejected participants do not show effects above and beyond
socially accepted participants should, however, not be overlooked. It remains possible that
this absence of any social rejection specific effects on sAA activity (and reported stress)
could be explained further through the methodological pitfalls in the study. While not
measuring sAA, Blackhart et al.’s (2007) study collected a saliva sample and measured mood
immediately after the social manipulation element, whereas the current design specified that
participants wait approximately 8 minutes to complete the ‘group’ task before the next saliva
sample and measurement of stress. As participants had only recently given their baseline
measure at the time of the social manipulation, it was considered unwise to repeat the process
too quickly for fear that participants would realise the deception. The additional time was
also intended to allow participants to ruminate on their respective conditions, with the desired
and expected outcome being an amplified feeling of rejection or acceptance (as in Zoccola,
Dickerson, & Zaldivar, 2008). However, without a measure immediately following the social
manipulation, it is possible that rejected participants specifically did show a transient
decrease in sAA activity (to support Gunther Moor et al.’s, 2010, finding), and possibly an
increase in reported stress, but that these had recovered within the time gap before the next
measurement. This is especially likely considering the fact that participants who might
arguably be stronger ruminators of failure, i.e. those who had scored above 50 on the STAI,
were excluded from the sample group on ethical grounds. The included sample may,
therefore, have been more resilient and so have demonstrated a form of mood repair within
the 10-minute interval. Future research should therefore always endeavour to position saliva
samples and mood measures as closely to the stressor as possible.
The patterns of response relating to sAA should be interpreted with a degree of
caution. The secretion rate of sAA remained unchanged throughout the study, whereas the
flow rate of saliva was found to increase. At present, sAA is thought to be independent of

CHAPTER THREE
65
flow rate (Rohleder, Wolf, Maldonado, & Kirschbaum, 2006). However, the argument is far
from resolved (see Beltzer et al., 2010) and current advice recommends researchers
additionally calculate flow rate when assessing sAA in saliva as a control measure
(Salimetrics, 2012). It is possible that the observed changes in sAA activity are a derivative
of increased flow rate due, in essence, to the analyte becoming more dilute. For this reason,
there can be little confidence in extrapolating such findings beyond the scope of this research
study until future research on social stressors has further investigated the source of this
pattern of response.
The finding related to cortisol patterns is unexpected as it opposes Blackhart et al.’s
(2007) study and the present study’s hypothesis. Blackhart et al. found a decrease in cortisol
following social acceptance but not social rejection. Blackhart et al. posited that the failure
for socially rejected participants’ cortisol levels to show the same decrease as participants
who were in a control condition or who were socially accepted provided evidence for the
stressor being effective by interfering with the natural decline in cortisol levels over time
through diurnal variation (e.g. Buchanan, Kern, Allen, Tranel, & Kirschbaum, 2004).
Participants who experienced social rejection in this study responded with a decrease in their
levels of cortisol, unlike participants who experienced social acceptance whose cortisol levels
remained unchanged. Applying the same notion to the current findings would imply that the
process of being socially accepted was sufficient to elicit a cortisol response, whilst the
decrease in socially rejected participant’s cortisol levels was simply a response to natural
rhythms. Alternatively, this finding could be interpreted as the stressor being unsuccessful in
eliciting a reliable physiological effect, which is supported by the general tendency for
laboratory stressors to be largely ineffective in this manner (Dickerson & Kemeny, 2004).
The finding that the condition which was designed to be a comparison group, social
inclusion, has in this instance appeared to result in an increase in cortisol is confusing. Aside

CHAPTER THREE
66
from the differences listed above between the present study and Blackhart et al.’s (2007)
study, it is unlikely that methodological differences between the two studies are accountable
for the discrepancy, as both were conducted over approximately the same length of time in
the late afternoon, when cortisol cycles should be less susceptible to circadian fluctuations
(Schmidt-Reinwald et al., 1999). In addition to social rejection and social inclusion,
Blackhart et al. included a control condition in which participants were informed they had
accidentally been assigned to the wrong group and were supposed to complete the “group
task” alone. This was different to either of the social manipulation conditions as the reasons
behind completing the task alone were inferred as being due to an administrative error rather
than positive or negative social evaluation. While Blackhart et al. found no physiological
difference between the control and social acceptance condition (hence why here only one was
chosen), it is possible that the social inclusion condition failed to act as an appropriate control
condition in the present study. However, assuming this to be the case, one would still not
expect social inclusion (i.e. positive social evaluation) to lead to increases in cortisol; a stress
hormone.
Of critical importance, while not directly related to the study aims or hypothesis, is
the finding of a disparity between the first two saliva samples in terms of their overall volume
and analyte concentrations. Specifically, flow rate and sAA activity and secretion all
increased significantly from baseline 1 to 2, while cortisol concentration was unaffected. This
difference is particularly curious in consideration of the fact that just 10 minutes separated the
two samples during which participants were chatting as a group, a process initially included
to ease participants into the session. While these differences may have occurred due to the
effects of interacting within a social environment, it is also possible that they are a result of
participants becoming accustomed to the process of donating saliva. This explanation would
also account for the lack of any change in cortisol, which is known to be independent of flow

CHAPTER THREE
67
rate. If confirmed, this interpretation might put into question certain conclusions drawn in
many studies where, for example, authors attribute (false) changes in biomarkers to
psychological interventions. This is especially important given the propensity for the first
sample to additionally act as a single baseline. For this reason, before continuing
investigating social rejection, cognitive bias and stress further, Study 2 will be dedicated to
resolving some of the methodological issues surrounding the collection of saliva for use in
biobehavioural research. Specifically, Study 2 will focus on the need for an acclimatisation or
‘practice’ sample, which will aid future studies contained within this research and the general
field by providing evidence as to whether a practice sample should be implemented into
research protocols that focus on the acute effects of stress or other manifestations as standard.
To summarise, the present study failed to establish a reliable stressor, that is, one that
elicits a resolute psychological and physiological reaction. This aim therefore requires further
attention and shall be addressed again in Study 4. There is a potential for the present results to
infer partial support for researchers claiming the effects of social stressors (such as social
rejection) lead to parasympathetic autonomic command. However, this assumes that
decreases in sAA activity were not corrupted here by increases in flow rate. This issue will be
further addressed in Studies 2 and 3, which will look at the methodological practicalities of
using saliva in research.

CHAPTER FOUR
68
4.0 CHAPTER FOUR: STUDY TWO
Investigating the need for a practice sample in salivary biomarker research

CHAPTER FOUR
69
The discovery that saliva could act as a biological window, giving snapshot accounts
of internal processes in a more convenient and socially permissible way than serum or urine
collection, has led to an abundance of studies focusing on how the body physiologically
responds to the external environment around them. Early research investigating the
physiological effects of stress in the social world has focused mainly on responding levels of
cortisol in saliva (e.g. Hellhammer, Heib, Hubert, & Rolf, 1985). As previously discussed,
cortisol is released by the adrenal glands following hypothalamic pituitary adrenal (HPA)
activation and travels through the blood into saliva via passive diffusion (Vining, McGinley,
& Symons, 1983). More recently, sAA has also received considerable interest in stress-
related research owing to its close relationship with noradrenaline and consequent potential as
a proxy for sympathetic activation (e.g. Chatterton, Vogelsong, Lu, Ellman, & Hudgens,
1996; Nater et al., 2005). The finding that salivary sAA increases following periods of acute
stress has since been replicated numerous times and appears relatively robust (e.g. Bosch et
al. 1996; Chatterton et al., 1996; Nater et al., 2005; Rohleder, Nater, Wolf, Ehlert, &
Kirschbaum, 2004). Prior to this, there was no way of reliably measuring sympathetic
activation through salivary biomarkers.
By having biomarkers that represent the two key biological stress responses (HPA and
SAM), research is better able to reliably capture the multi-faceted dynamics of the
physiological response to stress. However, while convenient, relying solely on one parameter
(i.e. saliva) to infer changes to much broader physiological systems increases the risk of
misinterpreting the meaning of data. Specifically, changes in analytes might be incorrectly
attributed to physiological changes when, in fact, they are brought about due to confounding
factors. This study investigates one such potential confound; whether or not practice samples
should be implemented into research as standard procedure.

CHAPTER FOUR
70
Several factors are known to influence one or both of the key stress-related salivary
biomarkers (i.e. cortisol and sAA), and thus need to be considered by researchers when
designing experiments and interpreting findings. For example, both biomarkers are governed
by natural diurnal rhythms (Kirschbaum & Hellhammer, 1989; Nater, Rohleder, Schlotz,
Ehlert, & Kirschbaum, 2007), which researchers must be sensitive to in their experimental
design. Additional factors include (but are not restricted to) gender (Kirschbaum, Kudielka,
Gaab, Schommer, & Hellhammer, 1999; Kirschbaum, Wust, & Hellhammer, 1992), age
(Chahal & Drake, 2007; Strahler, Mueller, Rosenloecher, Kirschbaum, & Rohleder, 2010),
exercise exhaustion (Gilman, Thornton, Miller, & Biersner, 1979; Kirschbaum &
Hellhammer, 1994), smoking habits (Kirschbaum, Wust, & Strasburger, 1992; Weiner, Levy,
Khankin, & Reznick, 2008), and flow rate dependency (Vining, McGinley, & Symons,
1983). Evidence from our laboratory and Study 1 has led to a potential additional confound
worth concern; practice effects.
In Study 1 there was a general tendency for participants’ initial samples to
considerably differ to their subsequent samples, with initial samples tending to be smaller in
volume. Assuming both biomarkers are independent of changes in flow rate, meaning that
changes in the volume of saliva bear no impact on the concentration of the analyte, this
observation should not merit further concern. However, while there is a general
understanding that cortisol is independent of changes in flow rate (Kirschbaum &
Hellhammer, 1994), there is less consistency in the argument regarding sAA. Supposing that
sAA activity is reliant on saliva flow, changes in flow rate could bring about apparent
changes in sAA without direct ANS input. In terms of the observation regarding the flow rate
of a participant’s first sample, such dependence would deem the first measure of sAA as
unreliable. This study could therefore provide important evidence for future
recommendations of good practice for researchers using salivary biomarkers to measure acute

CHAPTER FOUR
71
effects of interventions, such as stress. Further, many studies use the initial sample as a
baseline measure against which to compare any post-intervention measures to. If this study is
successful in reproducing data to suggest that the first sample might be unreliable, then it is
possible that previous interpretations of any changes in biomarkers in response to particular
stress/relaxation interventions, specifically those that might be reliant on flow rate, might also
be erroneous.
The relationship between sAA and flow rate has been empirically investigated. Early
research on unconscious rats discovered that sympathetic activation of the ANS led to a low
flow rate of saliva that was richly dense with sAA (Anderson et al., 1984). Alternatively,
parasympathetic activation resulted in the opposite pattern; high flow rate containing low
amounts of sAA (Asking, 1985). The authors concluded that these findings implied that the
release of sAA was influenced by ANS control. However it is possible, instead, that changes
in flow rate accounted for or contributed towards the increased or reduced percentage of sAA
within a sample. More recently, Rohleder, Wolf, Maldonado, and Kirschbaum (2006)
conducted an investigation into the flow/sAA relationship. Male participants underwent a
well-known stress test (TSST; Kirschbaum, Pirke, & Hellhammer, 1993) and a control task
on consecutive days. Saliva was collected using either the passive drool technique (as was
employed in Study 1) or using a Salivette; a cotton swab that absorbs saliva. Rohleder and
colleagues noted an increase in flow rate in response to the TSST when saliva was collected
using the passive drool method only. In the same group, sAA activity and secretion also
increased in response to the TSST, which Rohleder et al. took as evidence that the two
measures (flow rate and sAA) were independent. This interpretation was reached because a
dependent relationship would result in opposing patterns of response, as was documented
following the psychological intervention in Study 1. Consequently, the observed
increase/decrease in sAA would have been a result of diluted/stronger concentrations within

CHAPTER FOUR
72
the volume of saliva. As both sAA activity and saliva flow increased following the social
stressor in Rohleder et al.’s study, the two variables do appear in this instance to be
independent.
While there has been a general tendency for researchers to take Rohleder et al.’s
(2006) findings as evidence that the matter has been resolved (e.g. DeCaro, 2008), others
argue that there is insufficient evidence to conclude the debate with any confidence. For
example, in their own review on the uses and practicalities of sAA, Rohleder and Nater
(2009) continuously refer to flow rate as a potential confound of sAA. Further, current
specialist advice (e.g. Salimetrics, 2012) continues to recommend that flow rate should be
measured when analysing samples for sAA, thereby suggesting the claim is not entirely
assured.
The purpose of the present study is to ascertain whether there is a need to implement a
practice sample(s) as standard in research that measures biomarkers that are potentially
sensitive to changes in flow rate. Practice samples would be necessary if flow rate is found to
be significantly lower in the initial samples, relative to subsequent samples. These aims will
be addressed by recruiting participants who have not previously given saliva samples for
purposes of research who will receive instructions on how to give a saliva sample. Two
groups of participants will then practice the passive drool method of saliva donation (either
once or three times), and one group will not practice. Participants will then give four saliva
samples using the same method. Salivary biomarkers (flow rate, cortisol concentration, and
sAA activity and secretion rate) will be compared over time to determine whether (a) the
initial sample from participants who have not practiced the technique is smaller in volume
relative to subsequent samples of that group and, if so, whether (b) providing one or three
opportunities to practice the technique eradicates this.

CHAPTER FOUR
73
It is hypothesised that participants who have no practice sample will show
considerable changes in the volume of their four samples; specifically an increase in saliva
flow between their first and second samples. Second, despite Rohleder et al.’s (2006) study
suggesting otherwise, sAA activity is expected to show a significant decrease between the
first two samples in participants who have not practiced the technique. Third, sAA secretion,
the calculation of which should correct for changes in saliva flow, is predicted to remain
stable during these time points in this sample group. Fourth, based on it being independent of
saliva flow, cortisol concentration is predicted to show no change as a result of variation in
saliva flow. Finally, participants who have either one or three chances to practice are
predicted to show no change in cortisol, saliva flow, or sAA activity or secretion across their
four samples.

CHAPTER FOUR
74
4.1 Method
4.1.1 Design
This study employed a 3 (condition) x 4 (sampling time points) mixed factorial design
(see Figure 5). The independent between-subjects variable was condition assignment: no
practice, 1 practice sample, or 3 practice samples. All participants were then required to give
four saliva samples (within subjects independent variable), each separated by 10 minutes.
Mood was measured at four time points throughout the study and trait measures were taken
once to assess potential influences. The dependent variables were flow rate, cortisol
concentration, sAA activity and secretion rate, self reported stress, positive and negative
affect, and reported optimism, happiness, distress, and tension.
4.1.2 Participants
Staff and students from the University of East Anglia were sent details of the study
via email. Those interested in taking part were invited to contact the researcher to receive
more detailed information. Sixty-three participants (35 females, 28 males) aged between 19
and 53 years (M = 27.74, SD = 8.88) took part in the study and were randomly assigned to
one of three conditions, including a no-practice condition (n =22), one practice sample
condition (n =21), and three practice samples condition (n =20). Sessions were run in groups
with all participants in one group being in the same condition. Sessions were assigned a
condition by alternating between the three conditions (i.e. group 1, group 2, group 3, group 1,
group 2, etc). Participants booked into sessions according to their personal availability
without prior knowledge of which condition had been assigned to that session. Participants
reported having no experience of giving saliva for the purposes of research.

CHAPTER FOUR
75
Mood-based questionnaires
Saliva collection instructions
for passive drool
Practice x0
Mood-based questionnaires
Drink
Trait questionnaire pack
Saliva sample 1
Saliva sample 2
Saliva sample 3
Saliva sample 4
Trait questionnaire pack
Practice x3 Practice x1
Mood-based questionnaires
Mood-based questionnaires
10-minute intervals
Figure 5. Overview of Study 2’s experimental design

CHAPTER FOUR
76
4.1.3 Materials
Psychometric measures. State assessment. Participants completed a series of state-
based questionnaires at four time points throughout the study, consisting of the Stress-
Arousal Checklist (SACL; Mackay, Cox, Burrows, & Lazzerini, 1978), four visual analogue
scales measuring levels of optimism, happiness, distress, and tension (see Study 1 for more
details on these scales), and the Positive and Negative Affect Scale (PANAS; Watson, Clark,
& Tellegen, 1988). The PANAS was designed by Watson et al. to measure two dominant
features of emotion; positive affect and negative affect. The scale is composed of 20
adjectives that participants are required to rate on a five-point scale according to their current
state. Importantly, these adjectives were chosen due to their independent reference to either
positive or negative affect. For example, the term irritable describes a degree of negative
affect but has a near-zero loading to positive affect. Similarly, enthusiastic might describe a
state of positive affect but would rarely be used to refer to negative affect. The scale has been
shown to have good internal consistency (PA α = .83-.90; NA α = .85-.90) (Watson et al.,
1988). The scale is considered to be relatively robust to demographic variables, though
Crawford and Henry (2004) noted gender differences. Females reported significantly more
negative affect than males, while males reported significantly higher positive affect than
females (Crawford & Henry, 2004).
Psychological measures. To fill time between samples and also measure factors that
have the potential to influence salivary analytes, participants completed a questionnaire pack
consisting of the General Health Questionnaire (GHQ; Goldberg, 1972; Goldberg &
Williams, 1988), Perceived Stress Scale (PSS; Cohen, Kamarck, & Mermelstein, 1983),
Depression Anxiety Stress Scale (DASS; Lovibond & Lovibond, 1995b), a personality
inventory (Goldberg et al., 2006), and the Interpersonal Support Evaluation List (ISEL;
Cohen & Hoberman, 1983). Study 1 contains further description on each of these scales.

CHAPTER FOUR
77
Participants were not required to fully complete this booklet and the data is not referred to in
the analysis other than to report participant characteristics where sufficient data exists.
Saliva collection and analysis. Saliva samples were passively collected into 3ml
cryovial tubes (Greiner Bio-One Ltd, UK). Samples were frozen at -80°C until required for
analysis. Flow rate was determined gravimetrically and samples were assayed for levels of
cortisol and sAA (see Chapter two for further details of these procedures).
4.1.4 Procedure
Ethical approval was granted by the Faculty of Health Research Ethics Committee,
University of East Anglia. Participants received £8 for their effort and time. All testing
sessions were run on weekdays between the hours of 12 – 3pm on campus at the University
of East Anglia psychology testing laboratories. Participants were instructed not to eat, drink
(other than water) or smoke for 30 minutes prior to the study, and to abstain from undertaking
vigorous exercise for 90 minutes prior to participation. On entry to the session, participants
were first given information sheets and consent forms before being verbally briefed on the
study procedure. Once participants had consented, they completed the first set of
questionnaires designed to measure state mood factors. Participants were then given
instructions on how to give a saliva sample. The researcher explained the sample tracking
procedure, which consisted of writing down unique tube barcode details on a sheet each time
a sample was given. Participants were informed that the sample was taken over a 3-minute
period, which would be broken down into two 90-second samples. Before each sample,
participants were informed they would be asked to clear their mouths by swallowing before
sitting with their head tilted forwards to allow any saliva in their mouths to pool at the front.
Participants were informed that after a timed 90 second period they would be asked to deposit
any saliva through a piece of straw into a cryovial tube. Participants were informed that this

CHAPTER FOUR
78
procedure would be repeated a second time into the same tube, through the same straw piece,
to complete one sample. Participants were also reassured that they were not expected to fill
the tubes and advised not to be concerned about how much saliva they produced compared to
other people, as saliva flow rate varies considerably among people. Following the instruction
period, two conditions had an opportunity to practice how to give saliva; one condition had
one opportunity and one condition had three opportunities. The remaining condition received
these instructions but had no opportunity to practice.
Participants then completed the second state assessment before receiving a small
drink of still bottled mineral water to clear their mouths of debris and help optimise the
quality of the future samples. To prevent the drink influencing the future samples,
participants waited 10 minutes before giving another sample. During this time, participants
completed the trait questionnaire pack (see Psychometric Analysis). Before starting the saliva
donation, participants were asked to complete a third state assessment. In all conditions,
participants then each gave four samples, which were separated by 10 minutes each during
which they returned to completing the trait questionnaire pack. Each sample was taken using
the exact procedure that was instructed earlier. Just before the last samples, participants
completed a final state assessment. Before leaving, participants were offered some anti-
bacterial hand gel and an opportunity to ask any questions or raise any concerns regarding the
study.
4.1.5 Data Analysis Plan
Data was explored to check it met the assumptions for parametric testing. Data from
trait questionnaires was explored briefly to monitor between-group differences. Data from the
state questionnaires was explored to monitor changes in mood throughout the study. To test
the study hypothesis, a series of repeated measures ANOVAs were conducted on the relevant

CHAPTER FOUR
79
dependant variable data (e.g. reported stress, flow rate, etc), with time as a within subjects
factor and group as a between subjects factor. Given gender has been found to also influence
salivary biomarkers (e.g. van Stegeren, Wolf, & Kindt, 2008), gender was considered post-
hoc to be a potential source of interest and so was included along with condition as a between
subjects factor in ANOVAs looking at the effects of having an opportunity to practice giving
saliva via the passive drool method. Main effects of time are reported though not necessarily
explored where they are qualified by time x group or three-way interactions. For ease of
clarity, gender and group main effects, gender x time interactions, and gender by group
interactions are largely not reported unless significant or relevant to the point of note. Where
appropriate, paired t-tests were used to investigate a priori and post-hoc comparisons.
Bonferroni corrected alpha levels are reported.

CHAPTER FOUR
80
4.2 Results
4.2.1 Data Exploration
The data was explored for outliers and to check it met the parametric assumptions for
testing. To successfully normalise the salivary data, which showed a general tendency to be
positively skewed and showed platykurtic distribution, all flow rate, cortisol concentration,
and sAA activity and secretion data were log transformed. All analyses were conducted using
logged data, however descriptive and graphical representation of the means and measures of
variation are presented using unlogged data.
4.2.2 Participant Characteristics
A univariate ANOVA revealed no significant difference in age across the three
conditions, F(2, 55) = .95, p = .39, ηp2 = .03, or across gender, F(1, 55) = .86, p = .40, ηp
2 =
.02. Mean levels of self-reported stress (measured by the SACL) on entry to the study were
2.65 (SD = 3.13), with no significant difference being found between conditions, F(2, 57) =
.92, p = .41, ηp2 = .03, or gender, F(1, 57) = 1.40, p = .24, ηp
2 = .02. Chi-squared analyses
revealed that the gender ratio was not significantly different across the three conditions, χ2 (2,
N = 63) = 1.96, p = .38.
A series of univariate ANOVAs were run on the trait measures taken from
questionnaires that revealed no significant main effects of condition or significant condition x
gender interactions (see Table 6). A trend main effect of gender was found for the personality
subscale agreeableness, F(1, 56) = 3.60, p = .06, ηp2 = .06, with females (M = 41.06, SD =
5.22) scoring higher than males (M = 38.29, SD = 5.89). This finding was not considered to
be of detrimental effect to future analysis. Instead, the finding further justified the inclusion
of gender as a potential confound in analyses.

CHAPTER FOUR
81
Table 6
Participant trait characteristics
Overall (all
participants)
Main effect Gender x
condition
interaction Condition Gender
Scale Factor N Mean SD p value p value p value
GHQ Distress 63 46.33 11.52 .31 .33 .64
PSS-10 Stress 63 21.98 3.39 .74 .16 .79
ISEL Interpersonal
support
63 89.90 16.52 .39 .22 .68
Personality Extraversion 62 31.71 7.36 .94 .41 .56
Agreeableness 62 39.81 5.66 .94 .06 .30
Conscientiousness 60 34.68 6.20 .96 .23 .61
Emotional
stability
61 30.93 7.80 .52 .41 .42
Intellect 63 37.33 5.52 .39 .95 .32
DASS Depression 63 4.25 3.83 .52 .10 .58
Anxiety 63 3.94 3.65 .19 .25 .54
Stress 63 6.97 4.48 .92 .82 .86
Total 63 30.32 19.55 .47 .74 .72
Note: GHQ = General Health Questionnaire; PSS = Perceived Stress Scale; ISEL =
Interpersonal Support Evaluation Checklist; DASS = Depression Anxiety Stress Scale.

CHAPTER FOUR
82
4.2.3 Changes in Mood
A 2 (between subjects; gender) x 4 (within subjects; time point) x 3 (between
subjects; condition) repeated measures ANOVA was run on the reported state stress (from the
SACL). No significant main effect of time was identified, F(3, 171) = .16, p = .93, ηp2 < .001,
and there was no significant time x condition interaction, F(6, 171) = .32, p = .93, ηp2 = .01.
While there were no significant main effects of condition or gender, and no significant time x
gender or gender x condition interactions (all F values < 1), a significant three-way
interaction emerged, F(6, 171) = 2.29, p = .04, ηp2 = .07. To explore this, 2 (between subjects;
gender) x 4 (within subjects; time) repeated measures ANOVAs were run on data split by
condition. For participants who practiced the technique either once or three times, there was
no significant main effect of time or significant time x gender interaction (all p values > .15).
No significant main effect of time, F(3, 60) = .39, p = .76, ηp2 = .02, or gender, F(1, 20) = .60,
p = .45, ηp2 = .03, was found for the no practice condition though a significant time x gender
interaction was revealed, F(3, 60) = 2.85, p = .05, ηp2 = .13 (see Figure 6). Efforts were made
to investigate this interaction further by running repeated measures ANOVAs on female and
male participants within this condition separately, and by running univariate ANOVAs
comparing male and female stress scores within this condition at each time point, but no
further significant findings emerged (all p values > .11).

CHAPTER FOUR
83
Figure 6. The time x gender interaction for reported stress (SACL) in participants who did
not practice giving saliva.
A 2 (gender) x 3 (condition) x 4 (time) repeated measures ANOVA was conducted on
reported positive affect, taken from the PANAS. A significant main effect of time was
identified, F(1.83, 93.50) = 11.86, p < .001, ηp2 = .19 (Greenhouse Geisser corrected). Post-
hoc analysis of the main effect of time on change in positive affect was conducted using
paired t-tests (see Table 7). A significant decrease in positive affect was identified from time
points 1-2, t(58) = 3.07, p = .003, d = .20 (Bonferroni corrected α = .017), and 3-4, t(60) =
2.63, p = .011, d = .14, with a trend decrease being revealed from time points 2-3, t(60) =
2.35, p = .022, d = .12. Comparison of the first and fourth time points revealed the largest
decrease, from a mean of 27.81 (SD = 7.40) to a mean of 23.74 (SD = 9.51), suggesting
generally that positive affect decreased throughout the study. No significant interactions or
main effect of gender was identified (all p values > .11). A similar ANOVA was run on the
reported negative affect data separately (see Table 7). No significant time, gender, or
condition main effects, or significant interactions were revealed (all p values > .20).
0
1
2
3
4
5
6
1 2 3 4
Me
an
re
po
rte
d s
tre
ss
Saliva sample time point
Male
Female

CHAPTER FOUR
84
Table 7
Descriptive data for reported positive and negative affect over time
N Time points
1 2 3 4
Positive affect
57 Mean 27.81 26.30 25.05 23.74
SD 7.40 8.42 9.26 9.51
Negative affect
57 Mean 12.61 12.05 11.88 11.70
SD 3.75 3.42 3.11 2.88
4.2.4 Hypothesis 1: Saliva Flow
A 2 (gender) x 3 (condition) x 4 (sample time points) repeated measures ANOVA was
conducted that revealed a significant main effect of time on saliva flow rate, F(2.21, 121.68)
= 6.65, p = .001, ηp2 = .11 (Greenhouse Geisser corrected). No significant condition x time
interaction, F(4.43, 121.68) = 1.24, p = .30, ηp2 = .04, but a significant three way interaction
between time, condition, and gender was found, F(4.43, 121.68) = 3.03, p = .02, ηp2 = .01.
In order to further explore the significant three way interaction, 3 (condition) x 4
(sample time points) repeated measures ANOVAs were run on male and female participant
data separately. For male participants, a significant main effect of time on flow rate was
revealed, F(3, 75) = 3.12, p = .03, ηp2 = .11, but no significant main effect of group, F(2, 25)
= .44, p = .65, ηp2 = .03, or time x group interaction, F(6, 75) = 1.22, p = .31, ηp
2 = .01, was
found (see Figure 7a). Paired t-tests were carried out but failed to reveal any significant
change in flow rate over time (samples 1-2 p = .08, samples 2-3 p = .53, samples 3-4 p = .51;
Bonferroni corrected α = .0167). For female participants, a significant main effect of time on
flow rate was identified, F(2.03, 61.02) = 4.63, p = .01, ηp2 = .13 (Greenhouse Geisser

CHAPTER FOUR
85
corrected), that was qualified by a significant time x condition interaction, F(4.07, 61.02) =
2.90, p = .03, ηp2 = .16 (see Figure 7b). To further explore the significant interaction, repeated
measures ANOVAs were conducted on female flow rate data from each condition
individually5. Female participants who had practiced the technique either one, F(3, 39) = .95,
p = .42, ηp2 = .07, or three times, F(1.13, 9.04) = 1.17, p = .32, ηp
2 = .13 (Greenhouse Geisser
corrected), showed no significant change over time in flow rate. Female participants who had
not practiced the technique showed a main effect of time, F(1.26, 11.35) = 4.41, p = .05, ηp2 =
.33. Paired t-tests found a trend increase in flow rate between samples 1-2 in this subgroup,
t(10) = -2.03, p = .07, d = .66 (Bonferroni corrected α = .017), followed by no change in flow
rate between samples 2-3, t(11) = .64, p = .54, d = .12, or 3-4, t(10) = .63, p = .54, d = .10.
To conclude, results appear to partially support the hypothesis regarding the influence
of having a practice sample on changes in flow rate. Specifically, females who had no
practice sample tended to have more variability in flow rate, with further investigation
appearing to support the hypothesis; that an increase in flow rate would be evident between
the first two samples for this condition. Female participants who had practiced giving a
sample (either once or three times) showed no significant variability in their flow rate.
5 It is worth noting that as gender did not form part of the primary hypothesis, sample sizes in this further exploration are small: Female no practice group = 10, female 1 practice group = 14, female 3 practice group = 9.

CHAPTER FOUR
86
Figure 7. Mean unlogged flow rate changes over time for male participants only split by
condition (a) and for females only split by condition (b).
4.2.5 Hypotheses 2 and 3: Alpha Amylase
Hypothesis 2: Activity. A 2 (gender) x 3 (condition) x 4 (sample time points)
repeated measures ANOVA showed no significant main effect of time on sAA activity, F(3,
147) = .67, p = .57, ηp2 = .01, and no significant time x group interaction, F(6, 147) = 1.113, p
= .35, ηp2 = .04.
Hypothesis 3: Secretion. A 2 (gender) x 3 (condition) x 4 (sample time points)
repeated measures ANOVA showed a significant main effect of time on sAA secretion, F(3,
147) = 3.70, p = .02, ηp2 = .07 but no significant time x group interaction, F(6, 147) = 1.66, p
= .13, ηp2 = .06. Paired t-tests were conducted to further investigate the significant main effect
of time (see Table 8) and revealed a trend increase in secretion between samples 1-2, t(54) = -
2.09, p = .04, d = .18 (Bonferroni corrected α = .017). No significant changes were revealed
thereafter (samples 2-3, t(57) = .15, p = .88, d = .01, samples 3-4, t(57) = -.29, p = .77, d =
.03).
0.05
0.1
0.15
0.2
0.25
0.3
0.35
0.4
0.45
0.5
1 2 3 4
Fe
ma
le -
me
an
flo
w r
ate
(m
l/m
in)
Time points
0.05
0.1
0.15
0.2
0.25
0.3
0.35
0.4
0.45
0.5
1 2 3 4
Ma
le -
me
an
flo
w r
ate
(m
l/m
in)
Time points
(a) (b)

CHAPTER FOUR
87
Table 8
Mean sAA secretion (U/min) and variation
Sample time points
1 2 3 4
Mean
SD
9.15
7.91
9.89
6.80
9.53
6.16
10.04
6.94
To conclude, sAA activity appeared to remain relatively stable while sAA secretion
appeared more variable over time. This did not support the hypothesis, which claimed that
sAA activity would mirror changes in flow rate whilst secretion would remain stable.
4.2.6 Hypothesis 4: Cortisol
A 2 (gender) x 3 (condition) x 4 (time point) repeated measures ANOVA was run on
participants’ cortisol data, revealing a significant main effect of time on change in cortisol
concentration, F(2.32, 113.54) = 11.03, p < .001, ηp2 = .18 (Greenhouse Geisser corrected),
which was qualified by a significant time x condition interaction, F(4.63, 113.54) = 2.48, p =
.04, ηp2 = .09 (see Figure 8). A non-significant trend time x gender interaction was observed,
F(2.32, 113.54) = 2.40, p = .09, ηp2 = .05, but there was no significant three way interaction6,
F(4.63, 113.54) = .92, p = .47, ηp2 = .04.
Investigation into the significant time x condition interaction was conducted by
selecting data from each condition separately and running repeated measures ANOVAs. For
participants who had no practice sample, F(3, 51) = 7.85, p < .001, ηp2 = .32, and one practice
sample, F(1.67, 31.87) = 5.08, p = .02, ηp2 = .21 (Greenhouse Geisser corrected), a significant
6 The trend time x gender interaction was not explored further due to no significant three-way interaction being found. This meant that, while male and female participants’ cortisol levels differed at different points across the study, this was not dependent on their condition and thus not of direct interest to the study aims.

CHAPTER FOUR
88
1.05
1.15
1.25
1.35
1.45
1.55
1.65
1 2 3 4
Me
an
un
log
ge
d c
ort
iso
l (μ
g/d
l)
Time points
No practice
1 x practice
3 x practice
main effect of time on cortisol concentration was identified. No significant main effect of
time on cortisol concentration was observed in participants who had practiced three times,
F(3, 48) = 1.73, p = .17, ηp2 = .10. For the no practice group, paired t-tests revealed no
change in cortisol between samples 1-2, t(18) = -.13, p = .90, d = .02, or 2-3, t(18) = -1.27, p
= .22, d = .18, followed by a trend increase between samples 3-4, t(18) = -2.13, p = .05, d =
.33 (Bonferroni corrected α = .017). For the one practice group, a trend increase was
identified between samples 1-2, t(19) = -1.88, p = .08, d = .23, followed by no change in
cortisol between samples 2-3, t(20) = -1.29, p = .21, d = .14, or 3-4, t(20) = -1.02, p = .32, d =
.09 (Bonferroni corrected α = .017).
Figure 8. Mean cortisol concentration change across time according to condition
In sum, there was a main effect of time on cortisol concentration which, upon further
investigation, appeared to indicate an overall increase in cortisol concentration. This failed to
support the hypothesis, which predicted no change in cortisol concentration.

CHAPTER FOUR
89
4.3 Discussion
Samples from participants who were not presented with the opportunity to practice
giving saliva using the passive drool method were hypothesised to show considerable
differences between their first and second (non-practice) samples. Specifically, rate of saliva
flow and levels of sAA activity were predicted to significantly increase and decrease
respectively. Investigation of a significant three-way (time x condition x gender) interaction
provided tentative support for the hypothesis in flow rate. Evidence of patterns in the
predicted direction was found in female (but not male) participants who did not practice the
technique. There was no evidence of change in sAA activity over time, or any time x
condition interaction or three-way interaction, which failed to support the hypothesis in light
of the findings in flow rate. There was a main effect of time of sAA secretion though no time
x group interaction. This supports the hypothesis, which predicted no condition-dependent
variation. Contrary to the hypothesis, a time x condition interaction was found for cortisol
concentration. Cortisol appeared to generally increase across the study, though this was found
not to be significant in participants who had practiced giving saliva three times.
While the increase in cortisol concentration across the study appeared to be limited to
participants who had not practiced giving saliva or who had practiced once, further
consultation of the means might offer a potential reason for this. When inspecting Figure 8,
mean cortisol concentration appears to increase in all conditions from samples 1-3, though
there appears to be a decline in concentration between samples 3-4 for participants who have
had three practice samples. In hindsight, this fourth sample could be considered as
superfluous, as the hypothesis related more to the first and second samples. Samples 3 and 4
were included to monitor the after effects of any significant changes found between samples
1 and 2. As cortisol concentration appears to increase between samples 1-3 in the three
practice condition, it is proposed that the significant time x condition interaction that is

CHAPTER FOUR
90
documented in the results section is more the result of an anomaly rather than evidence of
practice effects in cortisol.
The finding that females specifically seem to be more sensitive to changes in flow rate
when they are not afforded any chance to practice the passive drool technique could suggest
that the effects are due to participants needing time to become more comfortable with the
procedure rather than them learning to use the method correctly with practice. This notion
seems likely in consideration of the fact that females have been shown to exhibit a greater
physiological stress response to stressors that include an element of social threat compared to
males (e.g. Salvador, 2005; Stroud, Salovey, & Epel, 2002). This is thought to be owing to
their comparatively greater evolutionary social role (Taylor et al., 2000) and the tendency for
women to define themselves through their social relationships relative to men who focus
more on their independent achievements (Cross & Madson, 1997). Saliva flow is currently
understood to be regulated through the ANS (Garrett, 1987), with parasympathetic
dominance leading to increases in flow rate and sympathetic dominance linked with
decreases in flow rate. Consequently, it could be argued that female participants found the
experience of giving saliva samples in a public setting more embarrassing or felt a minor
degree of stress relative to male participants. This could have led to the patterns evidenced in
the present study following temporary sympathetic command.
In a bid to either confirm or dispute the above argument, it would seem wise to refer
to the patterns of response in reported stress or positive or negative affect across the study
generally. However, these measurements were not designed to assess the reaction to specific
events in the current study, such as the process of giving a first sample for females who had
no prior experience, and as such were not ideally placed to capture such a response. For
example, while the third mood measurement might provide an accurate baseline for this sub-
sample by being positioned just before the first saliva sample, the fourth measurement of

CHAPTER FOUR
91
mood is not taken until just before the fourth and final saliva sample, by which time any acute
effects would arguably have diminished. Therefore it seems that the lack of change in the self
report data might not be reason to discard the interpretation. However, supposing that females
who had not practiced the method did show variability in their flow rate owing to getting
used to the social situation, one might reasonably expect some fluctuations in sAA during this
period due to its current standing as a marker for sympathetic activity. Conversely, the results
document no significant change in sAA activity or secretion between samples 1-2 in this sub-
sample, which could provide a counter argument to this theory. Future research might seek to
address this issue through improved positioning of the mood measures to capture any subtle
or significant changes in state reflection.
The absence of any condition-dependent changes in sAA secretion when condition-
dependent changes in flow rate were present supported the hypothesis. This is explained by
the fact that secretion rate (sometimes referred to as output) accounts for changes in flow rate
in its calculation and so is often considered in addition to measures of sAA activity.
However, the absence of a change in sAA activity as a direct result of changes in flow rate
completely opposes the experimental hypothesis, which was based on findings from Study 1.
Indeed, the findings of the present study support work by Rohleder, Wolf, Maldonado, and
Kirschbaum (2006), who posit that sAA activity is independent of flow rate. It should be
noted, though, that the flow rate patterns of response in the present study were found in a
sample consisting of just 10 participants, which significantly reduces the statistical power of
the analysis. Further research using larger sample sizes of females and males is recommended
before drawing any firm conclusions regarding the relationship between flow rate and sAA.
For the purpose of future research within the span of this thesis, the inconclusive findings
should lead future studies including saliva samples to err on the side of caution and include a

CHAPTER FOUR
92
sample dedicated purely to the purpose of practicing the method of saliva donation, unless
published research or specialist advice recommends otherwise.
In conclusion, the present study appeared to unearth some interesting findings
suggesting that research using female participants might benefit from introducing a practice
sample as standard to provide reliable flow rate data. Contrary to expectations and the
findings of Study 1, sAA activity was not found to oppositely mirror changes in flow rate,
which could be taken to suggest either that the two are independent of each other or that the
flow rate data is indeed fallible due to its small sample size. As predicted, the opportunity to
practice did not influence variability in either cortisol or sAA secretion. This finding suggests
that the implementation of a practice sample as standard would have no bearing on these two
measures specifically. Taken together, these findings do not completely clarify the utility of a
practice sample, with some data demonstrating its necessity and some data suggesting it to be
an irrelevant factor. It therefore seems prudent that future studies contained within this thesis
should endeavour to incorporate a practice sample, as standard procedure for accurate and
reliable saliva collection. However, for application outside of the scope of this thesis, more
research is needed to further address this issue in light of the small sub-sample within which
this pattern emerged.

CHAPTER FIVE
93
5.0 CHAPTER FIVE: STUDY THREE
Saliva collection techniques: Comparing passive drool with collection via an oral swab

CHAPTER FIVE
94
The findings of Study 1 highlighted some practical concerns relating to obtaining
accurate and reliable measures of saliva for the assessment of biological markers of acute
stress. Specifically, the first two samples that participants donated showed great variation in
terms of sample volume and analyte levels. Study 2 explored these issues by investigating the
necessity of providing participants with an opportunity to practice the collection method
(passive drool) prior to collecting a baseline sample. Results from Study 2 suggested a gender
bias, with samples from female participants showing evidence intimating that a practice
sample would be beneficial. Alternatively, this pattern was absent in samples taken from
male participants. Prior to continuing with further work aimed at establishing the link
between cognitive biases and the stress response, Study 3 pursued an alternate line of interest
with the aim of producing a standard procedure for saliva collection for the remaining studies
within this thesis. Specifically, the present study compared two common methods of
collecting saliva; passive drool (as employed in Studies 1 and 2) and using a commercially
available absorbent insert, a Salimetrics Oral Swab (SOS; Salimetrics LLC, USA).
The SOS is a relatively new device for researchers, with manufacturers claiming it to
be an interference-free (for the majority of analytes) inert insert that produces a clear and
workable sample (Salimetrics, 2011). Whereas the passive drool method of saliva collection
requires participants to donate “whole” saliva (i.e. not gland specific) directly into a tube, the
SOS insert is placed in the mouth and absorbs saliva present. For this reason, saliva collection
using an SOS enables researchers to target specific glands known to release dense amounts of
certain analytes. For example, placement of the swab adjacent to the parotid gland would be
advisable for targeting sAA.
The SOS additionally works as a filter, as the swab retains the majority of the sample
debris meaning that sample expressed from the swab during centrifugation is clear and
workable. This permits smaller volumes to be utilised with a greater degree of accuracy,

CHAPTER FIVE
95
resulting in fewer samples having to be discarded owing to low volume. In a practical sense,
this ability to artificially filter the saliva has the potential to dramatically improve the utility
of a sample when compared to saliva collected using the passive drool technique, which is
commonly cloudy or contains obvious debris, such as phlegm, prior to centrifugation. For
saliva collected through passive drool, the process of centrifugation pellets sample debris at
the bottom of the tube leaving a clear workable sample at the top. This procedure successfully
produces a readily utilisable sample providing the original sample volume is sufficiently
large. Difficulties can be encountered when samples contain only a small volume. This is
because there is a smaller range for error between the clean and “dirty” divisions of the
sample, which increases the chance of encountering pipetting errors such as aspirating some
of the sample debris. Due to such reliability issues, passive drool samples with particularly
small volumes are often discarded.
The arguments above imply that collecting saliva using a SOS provides a sample of
superior functional quality relative to using the passive drool method. Further, saliva donation
using an absorbent swab has been shown to be preferable from a participant’s perspective
over being told to ‘drool’ or ‘spit’ into a tube (Strazdins et al., 2005). However, it is far
costlier to use and some researchers maintain cautious reservations about its use owing to
past errors. For example, a similar aid to the SOS is a cotton swab commonly referred to as a
Salivette (Sarstedt, Germany). The Salivette has been used by many researchers to collect
saliva to quantify levels of cortisol amongst other biomarkers. Only relatively recently,
research has provided evidence suggesting that Salivettes directly interfere with the sample to
produce a biased result (e.g. Bristow, Cook, Edwards, & Veerapen, in prep). Essentially, the
post-centrifugation workable sample has been found to be slightly altered compared to the
original sample that was collected from the participant’s mouth, insinuating that the swab
somehow interferes with certain analytes. There is evidence to suggest that this suspicion

CHAPTER FIVE
96
emerged some time ago. For example, Aufricht et al. (1992) observed a reduction in the
recovery of a salivary immune marker, Immunoglobulin-A (IgA), following the use of
Salivettes relative to using the spitting method (which is a form of passive drool in which
participants are required to rapidly expectorate, or spit, samples into a tube). Regarding other
analytes, it appears this bias was either not necessarily present or, more ominously, less
predictable. For example, Shirtcliff, Granger, Schwartz, and Curran (2001) collected saliva
samples from participants using the passive drool method. The sample was then divided, with
half passed through a Salivette and half left as a control sample. While the results showed
evidence of a Salivette-induced interference in a number of analytes, including testosterone,
IgA, and progesterone, they concluded that cortisol was unaffected by the collection method.
However, Strazdins et al. opposed this conclusion by finding significantly reduced levels of
cortisol concentration following the use of Salivettes as a collection device compared to
passive drool. Again focusing on the measurement of IgA, Bristow et al. present four
experiments demonstrating a severe and unsystematic bias caused by Salivettes which further
posit that the bias seems to be proportional to the volume of the sample, with smaller
volumes leading to greater errors.
An additional key concern regarding the use of SOS to collect saliva relates to
whether or not the insert stimulates saliva flow. Standard guidelines for the previously used
Salivettes recommended that participants chew on the swab during saliva collection. This
process would artificially stimulate saliva flow by mimicking gustatory movements of the
jaw (Humphrey & Williamson, 2001), which would typically result in an increase in saliva
flow from the glands that are most involved in the digestive process; the parotid glands in the
cheek. Indeed, Humphrey and Williamson found that the relative contribution from the
parotid gland to overall saliva composition increased from approximately 20% under resting
or unstimulated conditions to over 50% following stimulation in this manner. As previously

CHAPTER FIVE
97
discussed (see Study 2), the debate concerning sAA’s independence to saliva flow has yet to
be concluded, though Rohleder, Wolf, Maldonado, and Kirschbaum (2006) claim that sAA is
independent of flow rate. However, as it is primarily an enzyme involved in the breakdown of
food (Schenkels, Veerman, & Nieuw Amerongen, 1995), sAA is synthesised in the acinar
cells of the parotid gland. Therefore, specific activation of this gland (e.g. through chewing a
swab) would arguably lead to a large increase in the secretion of sAA. For this reason, Bosch,
Veerman, de Geus, and Proctor (2011), oral biologists, suggest that the collection saliva with
the aid of swabs for the measurement of such analytes is inadvisable due to the sample being
unrepresentative of the whole picture and, hence, possibly invalid. However, Salimetrics
(2011) disagree and claim that reliable levels of sAA can be collected (in addition to other
analytes) using the SOS providing the swab is placed and held under the tongue. This would
target absorption of saliva secreted more from the sublingual major salivary gland, which
would arguably be less subject to this digestive bias. Additionally, by keeping the jaw still
during the collection, Salimetrics claim that the parotid glands should not be artificially
activated therefore avoiding the bias that Bosch et al. suggest.
The present study aims to devise a standard method of saliva collection for use in the
remaining studies within this thesis. To achieve this, samples collected using the passive
drool technique will be compared with samples collected with the aid of the SOS in terms of
flow rate, cortisol concentration, and sAA activity and secretion. In consideration of the
findings from Study 2 regarding the need for a practice sample, participants will practice both
methods before giving one respective sample per method. When giving a saliva sample using
the SOS, participants will place the swab under their tongue and keep it there for two
minutes, which is the advised time to prevent the swab from becoming entirely saturated with
saliva as this would make any saliva flow calculation (and, subsequently, sAA secretion
calculation) inaccurate. As the present study aims to sample the same type of saliva (i.e.

CHAPTER FIVE
98
unstimulated), it is hypothesised that (1) there will be no difference (and no influence by
gender) between the two methods of saliva collection on saliva flow, cortisol concentration,
or sAA activity or secretion. Further, and for the same reasons, it is hypothesised that (2)
significant positive correlations will emerge between the two methods for each of the
physiological dependent variables listed above.

CHAPTER FIVE
99
5.1 Method
5.1.1 Design
The study was a 2 x 2 x 2 mixed factorial design, with saliva collection method (SOS
or polypropylene cryovial) as a within participants factor and order of method (i.e. which
technique was used first) and gender (male or female) as between participants factors (see
Figure 9). Participants were given a practice sample for each method and were required to
give one sample using each method. Mood was measured at three time points throughout the
study and psychological trait measures were assessed once to monitor potential influences
and confounds. The dependent variables from the scales measuring state well-being were self
reported stress, positive and negative affect, optimism, happiness, distress, and tension. From
the saliva samples, the dependent variables were flow rate, cortisol concentration, and sAA
activity and secretion rate.
5.1.2 Participants
Sixty four volunteers (35 females, 24 males and 5 unspecified) aged 18-59 years were
recruited from an undergraduate and staff population at Anglia Ruskin University,
Cambridge, via an email advertisement and posters displayed across the campus. The order
by which participants used each method to give a sample was determined by which session
they took part in. Participants booked into sessions based on their availability, with each
session alternating which technique was used first.

CHAPTER FIVE
100
Mood-based questionnaires
Saliva collection instructions
for passive drool
Practice sample – passive drool
Drink
Trait questionnaire pack
Mood-based questionnaires
Saliva collection instructions
for SOS
Practice sample – SOS
Drink
Sample – SOS Sample – passive drool
Practice sample – SOS
Practice sample – passive drool
Drink Drink
Trait questionnaire pack (continued)
Sample – passive drool
Sample – SOS
Mood-based questionnaires
Saliva collection instructions
for passive drool
Saliva collection instructions
for SOS
Figure 9. Overview of Study 3’s experimental design

CHAPTER FIVE
101
5.1.3 Materials
Saliva collection. Saliva was collected using an absorbent SOS or into a cryovial via
passive drool. Details on saliva analysis procedure can be found in Chapter two.
SOS collection. Each participant had one opportunity to practice and then gave one
sample using a SOS (Salimetrics LLC, US). The SOS is made from an inert food grade
material, and so is safe if oral consumption were to occur. Participants were told to clear their
mouths by swallowing before placing the swab under the tongue for a period of precisely two
minutes (timed). Following this, swabs were placed into a storage tube and stored at -80ºC
until analysis.
Cryovial collection. Each participant had one opportunity to practice and then gave
one sample using a passive drool technique into a cryovial tube (Greiner Bio-One Ltd, UK).
Participants were told to clear their mouths by swallowing before sitting with their head tilted
forwards to allow any saliva in the mouth to pool at the front for a period of precisely 90
seconds (timed). Following this, participants were instructed to deposit pooled saliva into a
cryovial tube with the aid of a piece of straw. This process was repeated using the same tube
and straw piece to produce one sample. The piece of straw was then discarded while the
cryovial was stored at -80ºC until analysis.
Psychological measures. Mood measures. Participants completed a series of state
questionnaires three times throughout the study (see Studies 1 and 2 for more details on each
of these scales): upon entry (baseline), and following each of the two (non-practice) saliva
samples. The questionnaires included the Stress Arousal Checklist (SACL; Mackay, Cox,
Burrows, & Lazzerini, 1978), Positive and Negative Affect Scale (PANAS; Watson, Clark, &
Tellegen, 1988), and four VAS with terminals labelled depressed to happy, pessimistic to
optimistic, distressed to not distressed, and tense to relaxed.

CHAPTER FIVE
102
Character measures. Participants additionally completed a questionnaire pack
containing questions related to health behaviour (e.g. amount of alcohol consumed over the
previous week), compliance with instructions given relating to the hours leading up to the
study session (e.g. time last ate/drank/smoke), the General Health Questionnaire (GHQ-28;
Goldberg, 1972; Goldberg & Williams, 1988), Perceived Stress Scale (PSS-10; Cohen,
Kamarck, & Mermelstein, 1983), Interpersonal Support Evaluation List (ISEL; Cohen &
Hoberman, 1983), a personality inventory (Goldberg et al., 2006), and the Depression
Anxiety Stress Scale (DASS; Lovibond & Lovibond, 1995b). Details of all of these
questionnaires are outlined in Study 1.
5.1.4 Procedure
The study was approved by Anglia Ruskin University’s Research Ethics
Subcommittee. Participants were asked to refrain from eating, drinking (other than water),
and smoking for 30 minutes prior to the study, and to abstain from undertaking vigorous
exercise for 90 minutes prior to the start. After giving written informed consent, participants
completed a set of the mood measures. Participants were then given instructions detailing one
method of giving a saliva sample (either using a SOS swab or via passive drooling into a
cryovial). Participants practiced the procedure for one of the techniques before receiving a
drink of mineral water to clear their mouth of any debris. Participants then waited 10 minutes
to enable the salivary glands to normalise during which they started to complete the character
questionnaire pack. After 10 minutes had elapsed, participants gave one saliva sample using
the method previously practiced. Following this, participants completed a second set of mood
measures. Participants then repeated the above procedure using the remaining method of
saliva sampling (either using a SOS swab or via passive drooling into a cryovial).
Specifically, participants received instructions on the technique before having a practice
sample. They then were issued with a drink of bottled mineral water, before waiting 10

CHAPTER FIVE
103
minutes (working again on the questionnaire pack). Participants then gave a second saliva
sample, using the second technique. Participants completed a third and final set of mood
measures before being thanked and paid £5 for their effort and time.
5.1.5 Data Analysis Plan
Data was explored prior to analyses to ensure it met the assumptions of parametric
testing. Participant characteristics from the trait questionnaires were compared between
groups to determine whether successful randomisation had occurred. Data from the state
questionnaires was investigated to monitor changes in mood over the study. Repeated
measures ANOVAs with time as a within-subjects factor were used to test the first
hypothesis. In light of the findings from Study 2 and others suggesting gender to be a
potentially confounding variable in salivary biomarker analyses (e.g. van Stegeren, Wolf, &
Kindt, 2008) gender was entered along with condition (the order of collection technique) as
between-subjects variables. Main effects of technique are reported and explored. For ease of
clarity, gender and condition (order) main effects, technique x condition, technique x gender,
and condition x gender interactions, and three-way (technique x condition x gender)
interactions are largely not reported unless significant or relevant to the point of note. Where
appropriate, paired t-tests were conducted to investigate a priori or post-hoc rationalisations.
Hypothesis two was investigated using bivariate correlations to investigate the relationships
between the two methods.

CHAPTER FIVE
104
5.2 Results
5.2.1 Data Exploration
Three participants’ data were removed and excluded from all analysis on the basis of
being largely incomplete. All variables were explored to check they conformed to the
assumptions of parametric testing. All physiological variables (flow rate, cortisol
concentration, and sAA activity and secretion) were log transformed to achieve normal
distribution. All analyses were conducted using logged data, however descriptive and
graphical representation of the means and measures of variation are presented using unlogged
data.
5.2.2 Participant Characteristics
There was no significant difference between the number of males and females
assigned to each order condition (which technique they used first), χ2 (1, N = 59) = .73, p =
.39. Univariate ANOVAs were carried out on participants characteristic data (see Table 9). A
main effect of gender was found for the DASS stress subscale, F(1, 38) = 4.70, p = .04, ηp2 =
.11, and the personality variables extroversion, F(1, 42) = 5.63, p = .02, ηp2 = .12, and
conscientiousness, F(1, 42) = 9.01, p < .01, ηp2 = .18. Females scored significantly higher on
the conscientiousness (M = 37.00, SD = 6.40) and DASS stress (M = 14.76, SD = 8.94) scales
relative to males (conscientiousness M = 31.18, SD = 5.07; DASS stress M = 9.54, SD =
6.98). Alternatively, males were significantly more extrovert (M = 37.71, SD = 8.42) than
females (M = 30.97, SD = 7.00). A significant main effect of order of technique (condition)
was found for the personality subscales extroversion, F(1, 42) = 4.40, p = .04, ηp2 = .10, and
intellect, F(1, 42) = 4.05, p = .05, ηp2 = .09. As a group, participants who used the cryovial
method to give saliva first scored significantly higher on both scales (extroversion M = 35.75,

CHAPTER FIVE
105
SD = 9.40; intellect M = 44.08, SD = 6.33) relative to those who used the SOS method first
(extroversion M = 30.95, SD = 5.76; intellect M = 40.68, SD = 6.20).
Table 9
Descriptive data of participant trait characteristics
Scale
Characteristic
N
Overall (all
participants)
Main effect
Condition
x Gender
interaction
Order of
technique
(condition)
Gender
Mean SD p value p value p value
GHQ-28 Distress 59 20.15 10.36 .62 .39 .67
PSS-10 Stress 53 24.47 6.70 .19 .45 .70
ISEL Interpersonal
support
56 82.63 19.73 .61 .42 .52
DASS Depression 42 7.67 8.78 .14 .40 .25
Anxiety 42 6.95 5.75 .95 .81 .98
Stress 42 13.14 8.65 .13 .04 .66
Personality Extroversion 46 33.46 8.16 .04 .02 .11
Agreeableness 47 39.21 4.91 .79 .31 .11
Conscientiousness 46 34.85 6.53 .79 .005 .99
Emotional
stability
44 28.30 6.44 .95 .41 .17
Intellect 46 42.46 6.43 .05 .12 .15
Note: GHQ = General Health Questionnaire; PSS = Perceived Stress Scale; ISEL =
Interpersonal Support Evaluation Checklist; DASS = Depression Anxiety Stress Scale.

CHAPTER FIVE
106
5.2.3 Changes in Mood
A 3 (time point) x 2 (order) x 2 (gender) repeated measures ANOVA was run
individually on reported stress (SACL), positive affect, negative affect (PANAS), and the
four visual analogue scale measures (optimism, happiness, distress, and tension). A
significant main effect of time was identified for stress, F(1.40, 77.15) = 5.45, p = .01, ηp2 =
.09 (Greenhouse-Geisser corrected), optimism, F(2, 102) = 4.14, p = .02, ηp2 = .08, and
happiness, F(1.58, 80.41) = 5.48, p = .01, ηp2 = .10. Further investigations of these main
effects revealed a significant decrease in reported stress between the first two measures, t(60)
= 3.07, p = .003, d = .27 (Bonferroni corrected α = .0167) from an average reporting of 5.03
(SD = 4.75) to 3.70 (SD = 4.94). There was no significant change in reported stress between
the final two measures, t(60) = .13, p = .90, d = .01. For optimism, there was no significant
change between measures 1 – 2, t(57) = -.47, p = .64, d = .04, or 2 – 3, t(56) = -2.25, p = .03,
d = .15, but revealed an overall significant increase in reported optimism between measures 1
– 3, t(56) = -2.71, p < .01, d = .21, from an average reporting of 6.94 (SD = 2.20) to 7.41 (SD
= 2.31). Similarly, for happiness ratings, there was no change between the measures 1 – 2,
t(57) = -2.11, p = .04, d = .13, or 2 – 3, t(56) = -1.84, p = .07, d = .12, but an overall
significant increase over the study period as ascertained by the significant increase from
measure 1 – 3, t(56) = -2.98, p < .01, d = .27, from an average reporting of 6.89 (SD = 2.40)
to 7.51 (SD = 2.18).
While no significant main effects of time emerged for positive or negative affect (both
F values < 1), a significant main effect of gender was found for positive affect, F(1, 46) =
4.59, p < .05, ηp2 = .09, and a trend effect found for negative affect, F(1, 44) = 3.39, p = .07,
ηp2 = .07. Males participants reported higher positive affect (M = 31.62, SD = 8.18) and
negative affect (M = 15.30, SD = 5.95) relative to female participants (positive affect M =

CHAPTER FIVE
107
26.25, SD = 9.71; negative affect M = 12.85, SD = 3.98). No significant main effects or
interactions were present in the VAS distress or tension scales.
5.2.4 Hypothesis One
Flow rate. A 2 (collection method) x 2 (order) x 2 (gender) repeated measures
ANOVA revealed no significant main effect of collection method, F(1, 55) = .07, p = .79, ηp2
= .001. A significant collection method x gender interaction was identified, F(1, 55) = 4.46, p
= .04, ηp2 = .08 (see Figure 10). To investigate this interaction, repeated measures ANOVAs
were run on male and female data separately, using collection method as a within subjects
factor. No significant main effect of collection technique was found for female participants,
F(1, 34) = 1.98, p = .17, ηp2 = .06, or male participants, F(1, 23) = 2.31, p = .14, ηp
2 = .09.
Univariate ANOVAs were also conducted on flow rate data from SOS and cryovial methods
separately with gender as a between subjects factor. No significant main effect of gender was
found for flow rate collected either through SOS, F(1, 57) = 1.32, p = .26, ηp2 = .02, or
cryovial, F(1, 57) = 1.51, p = .22, ηp2 = .03, techniques.
Figure 10. The significant collection method x gender interaction for flow rate.
0.6
0.7
0.8
0.9
1
1.1
Cryovial SOS
Flo
w r
ate
(m
ls/m
in)
Collection method
Female
Male

CHAPTER FIVE
108
Cortisol. A 2 (collection method) x 2 (order) x 2 (gender) repeated measures
ANOVA revealed a significant main effect of collection method on cortisol, F(1, 53) = 8.71,
p = .005, ηp2 = .14. Cortisol concentration was found to be significantly higher when saliva
was collected via SOS insert (M = .24µg/dl, SD = .42) relative to when collected into a
cryovial (M = .16µg/dl, SD = .11). A significant main effect of gender was also identified,
F(1, 53) = 12.49, p = .001, ηp2 = .19, with males producing more cortisol (M = .29µg/dl, SD =
.37) relative to females (M = .13µg/dl, SD = .08).
Alpha amylase. A 2 (collection method) x 2 (order) x 2 (gender) repeated measures
ANOVA was conducted on sAA activity and secretion data separately. No significant main
effects of technique or order, technique x order, technique x gender, order x gender
interactions, or three-way interactions were found (all p values > .12). No main effect of
gender was found for sAA activity, F(1, 47) = .94, p = .34, ηp2 = .02, though a trend main
effect of gender was found for sAA secretion rate, F(1, 47) = 3.04, p = .09, ηp2 = .06, with
males showing a slightly higher rate of secretion relative to females.
5.2.5 Hypothesis Two
Flow rate. A Pearson’s correlation revealed a significant positive relationship
between flow rate when measured by passive drool and flow rate when measured by SOS,
r(61) = .29, p = .03.
Cortisol. A significant positive relationship was found between cortisol concentration
measured through passive drool and cortisol concentration measured through SOS, r(59) =
.78, p < .001.
Alpha amylase. Person’s correlation identified significant positive relationships
between the two collection methods in terms of both concentration, r(53) = .83, p < .001, and

CHAPTER FIVE
109
secretion, r(53) = .70, p < .001. Further, a significant positive relationship was observed
between concentration and secretion data for both cryovial, r(55) = .89, p < .001, and SOS,
r(53) = .90, p < .001, methods.
General. While significant positive relationships were identified between the two
collection techniques for the measures noted above, the correlation coefficients differed
significantly between flow rate and the salivary biomarkers (see Table 10).
Table 10
Correlation coefficients for measures assayed through samples collected via passive drool or
SOS techniques
Cortisol
sAA
Concentration Secretion
Flow rate z = 4.04, p = .001 z = 4.57, p < .001 z = 2.93, p < .01
Cortisol z = -.64, p = .52 z = .98, p = .33
sAA activity z = 1.58, p = .11
Summary
Participants reported no change in their positive or negative affect, distress, or tension
across the study, whilst a decrease in state stress was identified from the beginning to the
middle of the study alongside a general increase in happiness and optimism. The technique
used to collect saliva did not appear to significantly affect measurements of sAA activity or
secretion, whilst higher levels of cortisol concentration were found when participants
collected saliva using the SOS insert relative to using a cryovial. Males were found to report

CHAPTER FIVE
110
significantly higher levels of affect (both positive and negative) and were shown to release
significantly higher amounts of cortisol and secrete slightly (trend) more sAA. Significant
positive correlations were identified for all of the salivary biomarkers when investigating the
relationships between the two collection methods, though z scores indicated that the
correlations for flow rate were significantly different from correlations for cortisol or sAA
(activity or secretion).

CHAPTER FIVE
111
5.3 Discussion
The finding of no significant main effect of collection method in addition to
significantly positive correlations between the two techniques for both sAA activity and
secretion support the study’s two hypotheses. Flow rate also showed no significant main
effect of collection method. However, a significant gender x collection method interaction
emerged for flow rate. Further investigation failed to clarify this interaction. Regardless of
this, a significant positive relationship was identified for flow rate when examining the
relationship between the two methods, thus supporting hypothesis two. In contrast to
hypothesis one, a significant main effect of technique revealed a significantly higher level of
cortisol concentration in samples collected using SOS relative to passive drool samples.
However, a significant positive relationship still emerged for cortisol concentration between
the two techniques.
Using a male sample, Rohleder, Wolf, Maldonado, and Kirschbaum (2006) reported a
significantly higher volume of saliva being collected using the passive drool method
compared to using SOS. Perhaps, then, the finding of a significant interaction between
collection method and gender on flow rate should not be completely unexpected. Indeed, this
interpretation would support the graphical representation of the interaction (Figure 10), which
shows that males produce higher volumes of saliva using the cryovial relative to the SOS.
However, comprehensive further investigation showed that neither the gender (i.e. cryovial
vs. SOS comparison for either male or female participants) nor technique (i.e. female vs.
male comparison for either cryovial or SOS) comparison was independently significant.
Therefore, it is suggested that the significant interaction emerged only when all data is
considered together due to opposite but very slight patterns of response. It is suggested, also,
that the significant interaction might also account for the weaker relationship between the two
techniques for flow rate (r = .29) compared to the rest of the comparative correlations

CHAPTER FIVE
112
(cortisol: r = 78; sAA activity: r = .83; sAA secretion r = .70) and, consequently, for the
significantly different correlation coefficients between flow rate compared with other
biomarkers.
It is interesting that, while a significant interaction between gender and collection
method on flow rate emerged, no such variability was found in the sAA activity data. This
can potentially be considered to provide inadvertent support for Rohleder et al.’s (2006)
proposition that sAA is independent to flow rate. If proved to be accurate, such an inference
would serve to quell the concerns of Bosch, Veerman, de Geus, and Proctor (2011) regarding
the stimulation of flow rate when collecting saliva using absorbent swabs. However, it must
again be noted that the origin of the significant interaction in the flow rate data was not
successfully isolated; therefore at this stage such conjecture must be drawn with caution. For
this reason, and until there is further clarification on the matter, future research should
continue to include efforts to collect unstimulated saliva and monitor interference by flow
rate.
Since the debate regarding the relationship between sAA and flow rate seems far from
settled, it is unsurprising that studies tend to opt to report the output (secretion) measure. In
the current study, a highly significant correlation was found between sAA activity and
secretion for each of the collection methods (cryovial r = .89; SOS r = .90). For both these
reasons, future studies within this thesis will focus solely on the secretion measure and omit
reporting details relating to flow rate and sAA activity unless preliminary investigations
unearth particularly interesting or contradictory results.
The finding that cortisol concentration is significantly higher in saliva collected
through SOS compared to saliva collected with the passive drool method is unanticipated.
Prior research investigating the influence of a cotton swab (Salivette or a dental roll) found

CHAPTER FIVE
113
cortisol to be one of the few analytes unaffected by collection method (Shirtcliff, Granger,
Schwartz, & Curran, 2001). However, the strong positive relationship between cortisol
assessed through the two collection methods (r = .78) suggests that both methods should be
reliable in ascertaining individual responses to, for example, a stressful procedure assuming
the collection method remains constant throughout the study. Cortisol enters the saliva from
the bloodstream by diffusing through the cellular membranes rather than being released into
the saliva through the salivary glands, like sAA (Vining, McGinley, & Symons, 1983). By
being positioned under the tongue, as recommended by the manufacturer to be the prime
location for the collection of salivary cortisol, there is maximum contact with areas of cellular
membrane within the mouth so perhaps it seems logical that cortisol concentration is higher
using this method relative to when ‘whole’ saliva is collected through passive drool.
In sum, it seems that the use of SOS to collect saliva has little to no interference on
physiological biomarkers of the stress response relative to the more established passive drool.
Salimetrics (2011) claim their product to be the industry standard in saliva collection. Here,
we have found that cortisol is found at greater levels when measured in saliva that was taken
using SOS relative to passive drool though the potential reasons, largely relating to
positioning of the swab in the mouth, have been discussed. Of practical significance, samples
that have been expressed from SOS tend to be much easier to work with relative to passively
drooled saliva. Further, expressed samples contain less mucins, which can make saliva
stringy and appear tacky. As mentioned earlier, this method does also enable a far more
optimised utility based on sample volume, which is always going to be a significant attraction
for researchers. For these reasons future studies included in this research will aim to collect
saliva with the aid of SOS rather than through passive drool. As there is no research
investigating whether this method requires a practice sample, and to prevent straying too
much from the thesis’ primary research question, future studies in this thesis will always give

CHAPTER FIVE
114
participants a practice sample prior to the collection of any baseline saliva. The main reason
for this is due to the argument presented in Study 2, which claimed that practice effects might
be caused by social embarrassment rather than them completing the process incorrectly,
therefore the same argument might hold true with SOS collection.

CHAPTER SIX
115
6.0 CHAPTER SIX: STUDY FOUR
The OCam study: An investigation into the predictive capacity for natural cognitive biases to
determine psychophysiological reactions to an ostracism stressor

CHAPTER SIX
116
Incorporating the findings from Studies 1-3, this study aims to further address one of
the main areas of investigation of this thesis; looking at the influence of naturally occurring
cognitive biases on the psychophysiological stress response. Study 1 aimed to elicit a
physiological stress response to a social rejection laboratory stressor based on a previous
study that had successfully utilised the task (Blackhart, Eckel, & Tice, 2007). However,
cortisol was found to decrease in response to social rejection, and sAA activity was found to
decrease following both social rejection and the comparison condition, social inclusion. It
was argued that the sAA patterns of response might be unreliable owing to an opposite
response being found in flow rate and an absence of any change in sAA secretion. The
limited literature generally suggests that sAA activity is independent of flow rate (Rohleder,
Wolf, Maldonado, & Kirschbaum, 2006). However, the patterns of response (i.e. sAA
activity and flow rate) made it difficult to distinguish what effects were due to the social
manipulation and what were due to limitations associated with collection methods.
As this research is using saliva samples as the only index of physiological responses
to laboratory stressors and cognitive bias, it is clearly of high importance that samples are of
a reliable nature. For this reason, Studies 2 and 3 explored some basic principles surrounding
the process of collecting saliva samples in research studies; whether research protocols
should stipulate that participants practice the method of saliva donation prior to providing a
baseline sample (Study 2), and which of two commonly used collection methods seemed to
relay the most reliable and readily utilised sample (Study 3). Results from Study 2 were
inconclusive, with some interesting patterns of response suggesting that research that
employs female participants specifically might benefit from providing a practice sample.
Study 3 demonstrated that giving a sample either through a passive drool method or with the
aid of an absorbent swab (Salimetrics Oral Swab) yield similar results. Although cortisol was
found in greater amounts in SOS samples, this was thought to be due to the location of the

CHAPTER SIX
117
swab within the mouth being more optimal for absorption of cortisol-rich saliva. In spite of
this difference, significant correlations were still found between the two methods for cortisol
concentration and sAA activity and secretion. Further, all sAA activity was found to have a
highly significant relationship with sAA secretion, which led to the decision to focus only on
output (or secretion) data for future analysis.
In contrast to the findings of Study 1, Zadro, Williams, and Richardson’s (2004) work
into social rejection suggests that the mere insinuation of rejection should be sufficient in
producing a powerful emotional response. In line with early theories (e.g. Kune, 1992), such
intimations do seem to suggest that people have somehow become evolved to be sensitively
attuned to the prospect of social rejection. Williams (1997, 2001) and Williams and Zadro
(2005) proposed a need-threat model of social rejection or ostracism that focused on the
fulfilment of four basic needs; the senses of belonging, feeling in control, maintaining self-
esteem, and satisfaction of having a meaningful existence. When these needs are threatened
in a short-term manner, Williams proposed that individuals tend to change their behaviour in
a direct effort to restore fulfilment. For example, Williams and Sommer (1997) found that
acute rejection led to female participants working harder on ensuing group tasks relative to
participants who did not experience rejection. Alternatively, Williams, Cheung, and Choi
(2000) noted that rejected participants became submissive to group judgements that were
deemed incorrect. Both these findings can be interpreted as reasonable prosocial attempts to
gain favourable evaluation in an attempt to replenish satisfaction of the threatened needs.
Again, this appears to suggest that, in spite of the failed efforts of Study 1, the area of social
exclusion does appear to still show great potential for acting as a stressor, as people seem
responsive to it (when successfully implied).
In a review of the recent literature on social rejection, Williams (2007) noted the
tendency for researchers to refer to the concepts of rejection, exclusion, and ostracism

CHAPTER SIX
118
interchangeably. While no attempts have been made to empirically compare the differences
between how these concepts affect an individual, it is possible to partially separate them
based on their methods of induction. For example, Williams speculated that ostracism is more
of an implicit notion whereby actions and behaviour infer intentions, with the impression of
ostracism often developing over time rather than being an immediately obvious entity. An
example of a popular laboratory ostracism paradigm is the participation in a computer game,
Cyberball (Williams et al., 2000), during which participants are informed they are playing
with either two computer or two human players. Participants are told to randomly throw and
catch a virtual ball between their group. Ostracised participants are passed the ball very few
times after which they are virtually ignored by the remaining “participants”. The aim of this
action is to induce feelings of being ‘left out’ even though no person has specifically declared
any preference away from them. Alternatively, Williams claimed social rejection and
exclusion refer to situations of isolation following an interaction. While social rejection is
thought to occur following explicit information that communicates intentions to exclude
someone, social exclusion does not necessarily follow from these explicit declarations
(Twenge, Baumeister, Tice, & Stucke, 2001). For example, social rejection might refer to a
group of friends telling a person they are not invited to a social occasion. Alternatively, social
exclusion would refer to the excluded person simply not being informed of the event.
According to Williams’ (2007) classification, Blackhart et al.’s (2007) task (and the
task used in Study 1) used a social rejection paradigm, during which participants received
feedback following a ‘get-acquainted’ session that specifically stated that no other participant
wanted to work with them on an upcoming task. While both could occur during everyday life,
for example by being turned down for a job (social rejection) or being ignored by a loved one
following an argument (ostracism), it seems that incidences of ostracism might generally be
more personal (e.g. giving a loved one the “silent treatment”). Further, ostracism is argued to

CHAPTER SIX
119
occur in a more public setting relative to exclusion and rejection. Therefore, in consideration
of the recommendations made in Study 1 regarding the need for a more public feel to the
manipulation of stress, the current study will proceed to adopt an ostracism paradigm to
induce stress.
Online ostracism paradigms, such as Cyberball, do seem to have successfully induced
the desired psychological response in several studies (e.g. Zoller, Maroof, Weik, & Deinzer,
2010; Williams et al., 2000; Zadro, Boland, & Richardson, 2006) and would arguably present
more of a public feel to the social manipulation. However, the task still relies heavily on the
perception of ostracism through either feedback or the behaviour of an inanimate object that
participants are told is being controlled via another person. In consideration of the difficulty
in finding a task considered to be stressful enough to elicit a cortisol response (e.g. Dickerson
& Kemeny, 2004), it seems prudent to ensure the task used in the present study is both as
believable and effective as possible.
Several studies have used a more public setting to induce ostracism through the use of
confederates who act as participants and proceed to ostracise the real participant in much the
same way as in the online environments (e.g. Stroud, Salovey, & Epel, 2002). Such an
arrangement does serve to create a highly ecologically valid environment and one that is
more readily credible. However the use of confederates is not without its shortcomings,
primarily requiring a lot of time and effort (and money to compensate confederate’s time) but
also reducing the degree of control over keeping each experience the same.
Recent work by Goodacre and Zadro (2010) has sought to overcome the inadequacies
mentioned above and combine the advantages of ostracism by using “real” people while
maintaining the control that standardised tasks offer. This has been achieved through the
development of a simulated online web chat task where participants think they are talking in

CHAPTER SIX
120
real time but are actually talking to pre-recorded videos of two confederate participants and a
confederate researcher acting in a certain way. This task, termed the Ostracism-Camera
(OCam), manages to capture both the face-to-face complexities that typical online tasks
neglect whilst exposing participants to a more reliable and controlled task. The task begins by
the (real) researcher using an artificial connection page to appear to link in to the web
conference, which serves to create the illusion of real-time interaction. Based on specifically
rehearsed timings, the (real) researcher then recites a script to appear to be involved in a
dialogue with the other (pre-recorded) researcher. For example, the researchers appear to
discuss the volume of the conference and, seemingly on request, the (pre-recorded)
participants change their positions slightly. The (real and pre-recorded) participants are then
instructed that each will deliver a two minute prepared speech relating to light and positive
topics, such as hobbies. Each of the pre-recorded confederates present a talk followed by the
real participant. Three variants of the video exist, which differ only in their apparent reaction
to the (real) participant’s presentation. In one version, a neutral video, confederate
participants appear to sit politely but do not react in any overly positive or negative manner.
An alternate, social ostracism, video features the confederate participants appear to disengage
during the (real) participant’s speech and chat amongst themselves, seeming to completely
ignore the participant. The third version is aimed towards social inclusion, during which the
confederate participants display positive behaviour, such as nodding, smiling, and leaning in
towards the camera during the (real) participant’s speech.
As the original task was developed in Australia (Goodacre & Zadro, 2010), an
English version based on the same scripts was developed and tested at the Cognition and
Brain Sciences Unit, Cambridge, by Drs. Dunn and Brodbeck. This version was used in the
present study and is slightly adapted from the Australian original following a pilot study
revealing English audiences to be largely doubtful of the original videos’ authenticity. The

CHAPTER SIX
121
actor’s responses were considered a little theatrical and so facial expressions and social cues
were toned down slightly. For example, in the original ostracism video, at the turn of the
genuine participant to present a pre-prepared speech, the confederate participants
immediately disengaged and started a conversation between themselves. In the modified
version, the confederate participants appeared to pay some attention for 30 seconds before
appearing to disengage from the speech. Critically, while the behaviour of the confederates
was changed to appear more believable, the manipulation remained as effective as it had been
with an Australian audience.
In contrast to Goodacre and Zadro’s (2010) original study, which categorised
participants into either an ostracism or inclusion group after which participants took part in
only one staged conference, the present study required participants to take part in two staged
conferences; a neutral conference followed by either an inclusion or ostracism conference.
This modification to the original procedure was made in consideration of the stressful nature
of presenting in front of a group. Indeed, this type of task is often used in isolation as a form
of stressor (e.g. the TSST; Kirschbaum, Pirke, & Hellhammer, 1993). Through this
amendment, it was hoped that the stress induced by social ostracism could be determined
over and above the stress induced merely by presenting a speech in front of an audience.
Study 1 set out to establish a stressor paradigm that was capable of eliciting reliable
physiological responses. This was thought to be a necessary measure prior to introducing a
measure of bias to investigate the relationship further. However, evidence has recently
surfaced that suggests this might not be the optimal method of pursuing such an investigation.
Fox, Cahill, and Zougkou (2010) showed how an individual’s natural attentional bias was
influential in their subsequent response to a stressor task. Specifically, individuals with a
more negative attentional bias were found to be more susceptible to suffering the ill-effects of
stress, such as anxiety. Moreover, the predictive power of these biases was found to provide a

CHAPTER SIX
122
better indication than more typically considered markers, such as trait anxiety or neuroticism
(Fox et al., 2010). With these findings in mind, a more practical manner of investigating the
relationship between bias and psychophysiological vulnerability to stress seems to include a
measure of bias regardless of whether or not a reliable stress paradigm has been established.
Critically, Fox et al. further imply that failing to account for bias might create unexplained
noise in stress-response data. Applying these findings to Study 1 might provide a reasonable
explanation for the absence of any effects of the social rejection task; noise in the data.
Alternatively, in consideration of the robust link between anxiety and bias strength (for a
review, see Ouimet, Gawronski, & Dozois, 2009), and recalling the fact that highly anxious
individuals were excluded from Study 1, it might be reasonable to assume that the sample
from Study 1 did not have a strong negative bias. Therefore, it is possible that the participant
sample was somewhat resilient to the effects of social rejection.
A range of studies have demonstrated that cognitive bias does appear to afford some
degree of stress resilience. These studies tend to adopt one of two designs; (1) mapping
natural bias to prospective reactions to stressful events (e.g. Pury, 2002; MacLeod & Hagan,
1992; van den Hout, Tenny, Huygens, Merckelbach, & Kindt, 1995), or (2) manipulating bias
through CBM techniques and measuring subsequent responses to stressors (e.g. See,
MacLeod, & Bridle, 2009; Wilson, MacLeod, Mathews & Rutherford, 2006). Whilst
promising, the literature to date has heavily relied on measures of subjective self-report to
assess these influences. For this reason, it remained difficult to rule out the presence of
demand effects. However, with positive effects of CBM having recently been shown using
double-blind placebo-controlled studies (e.g. Amir et al., 2009; Schmidt, Richey, Buckner, &
Timpano, 2009), these alternate attributions can start to be discarded. This is further
strengthened by studies that show the effects using physiological markers for stress (e.g.
Dandeneau, Baldwin, Baccus, Sakellaropoulo, & Pruessner, 2007; Fox et al., 2010). In

CHAPTER SIX
123
acknowledgement of this, the present study included tests of attentional and interpretive bias
prior to the OCam conferences. These measures were designed to assess the predictive
capacity of bias on emotional and physiological reactivity to stress in line with Fox et al.’s
work.
The overall objective of Study 4 is to induce a biological and psychological response
to stress using a social ostracism task, and measure the capacity for natural attentional and
interpretive cognitive biases to predict the magnitude of physiological (primary aim) and
psychological (secondary aim) responses. It is hypothesised that the process of being
ostracised (relative to social inclusion) will lead to a significantly higher reporting of feelings
of rejection and a significant reduction in the fulfilment of primary needs. Group allocation
and bias measures are hypothesised to significantly predict changes in stress, positive and
negative affect, cortisol concentration, and sAA secretion following OCam 2 (the socially
manipulative video). Specifically, participants undergoing social ostracism are predicted to
show a significant psychological and physiological stress response (e.g. increased reporting
of stress, increases in cortisol). This response is hypothesised to be moderated by cognitive
bias, with stronger negative biases linked with a larger stress response. Finally, this bias-
stress response relationship is only predicted to be evident in participants currently
undergoing stress, and is therefore predicted to be entirely absent in participants assigned to
the social inclusion condition.

CHAPTER SIX
124
6.1 Method
6.1.1 Design
This study adopted a regressional design. Interpretive or attentional bias (within
subjects; continuous variable) was entered with group (between subjects; dichotomous
variable: ostracism, inclusion) to predict reactivity in dependent variables. The dependent
variables were participants’ levels of cortisol concentration, sAA secretion rate, reported
stress, reported positive affect, and reported negative affect. Measures of social anxiety,
rejection sensitivity, trait depression and anxiety, chronic stress and distress, and personality
were also taken to assess potential confounding influences on ostracism and stress
vulnerability (see Figure 11).
6.1.2 Participants
Staff and students from Anglia Ruskin University were sent details of the study via an
all-staff/student email system. Only female participants were recruited in keeping with Study
1 on the basis that social stressors show evidence of being more effective for females (e.g.
Stroud, Salovey, & Epel, 2002) and in light of findings from Study 2 that suggests differential
physiological patterns between male and female participants. Those interested in taking part
contacted the researcher via email to receive further detailed information. Ninety-one
participants aged between 18 and 48 years (M = 24.00, SD = 6.57) were chosen following
screening for high anxiety using the Spielberger Trait Anxiety inventory (Spielberger,
Gorsuch, Lushene, Vagg, & Jacobs, 1983; cut off at 60). As a group, mean participant levels
of trait anxiety were 39.31 (SD = 9.01). All participants reported being fluent in English, as
specified by inclusion criteria.

CHAPTER SIX
125
Saliva collection instructions and practice using SOS
Attentional and interpretive bias test 1
Trait questionnaire pack 1
OCam 1 - neutral
OCam briefing and preparation time
Practice presentation
OCam 2 – social inclusion OCam 2 – social ostracism
(Sample and mood-based questionnaires 2)
(Sample and mood-based questionnaires 4)
(Sample and mood-based questionnaires 3)
Attentional and interpretive bias test 2
(Sample and mood-based questionnaires 5)
Trait questionnaire pack 2
(Sample and mood-based questionnaires 1)
30 minutes
Figure 11. Overview of Study 4’s experimental design

CHAPTER SIX
126
6.1.3 Materials
Psychological measures. Trait questionnaire pack one. Participants completed the
Depression Anxiety Stress Scale (DASS; Lovibond & Lovibond, 1995b) and Positive and
Negative Affect Scale (PANAS-trait; Watson, Clark, & Tellegen, 1988). Further details of
these scales can be found in Studies 1 and 2 respectively.
Fear of Negative Evaluation Scale (FNE; Watson & Friend, 1969). The FNE was
designed by Watson and Friend (1969) to measure cognitive symptoms of social anxiety. The
scale consists of 30 self-report items for which participants indicate how characteristic each
item is of them on a forced choice (true/false) basis. Examples of items include “If someone
is evaluating me I tend to expect the worst” and “Other people’s opinions of me do not
bother me”. Scores on the FNE have been shown to correlate well with alternate measures of
social anxiety, such as the Taylor Manifest Anxiety Scale (TMAS; Taylor, 1953) (Watson &
Friend, 1969). Responses that indicate social anxiety (e.g. I do expect the worst of someone
who evaluates me, or implying that other people’s opinions do bother me) are summed to
produce a score out of 30. It has been suggested that a score lower than 12 indicates someone
low in social anxiety, and scores above 21 indicate high social anxiety (Watson & Friend,
1969). The authors also report good test-retest reliability (.78-.94), and internal consistency
(α = .94-.98).
Adult Rejection Sensitivity Questionnaire (A-RSQ; Downey & Feldman, 1996). The
A-RSQ is composed of nine hypothetical interpersonal situations that relate to significant
others, for which rejection remains a potential outcome. For each scenario, participants are
required to rate on separate 6-point Likert scales a) how much anxiety would be caused by
the situation and b) how likely they think the situation would resolve itself in rejection. For
example, a scenario might be “You ask your parents or other family members to come to an

CHAPTER SIX
127
occasion important to you”, for which participants have to provide a rating for the statements
“How concerned or anxious would you be over whether or not they would want to come?”
from 1 (very unconcerned) to 6 (very concerned), and “I would expect that they would want
to come” from 1 (very unlikely) to 6 (very likely). Rejection sensitivity scores are calculated
by multiplying reported anxiety together with reported rejection likelihood and then
averaging the nine outcomes. The scale demonstrates good internal consistency (α = .86;
Berenson et al., 2009), good test-retest reliability (r = .83) and correlates well with the Social
Avoidance and Distress Scale (SADS; Watson & Friend, 1969) (r =.41) and the Interpersonal
Sensitivity Scale (ISS; Boyce & Parker, 1989) (r = .48) (Downey & Feldman, 1996).
State questionnaire pack. Each time participants gave a saliva sample they completed
the Positive and Negative Affect Scale (PANAS-state; Watson, Clark, & Tellegen, 1988) and
the Stress Arousal Checklist (SACL; Mackay, Cox, Burrows, & Lazzerini, 1978) as outlined
in Studies 1 and 2 respectively. As with previous research (e.g. Downey & Feldman, 1996),
five adjectives that depict emotions brought about by ostracism were added in a random
fashion to the 20-item PANAS-state list. These were: discouraged, unaccepted, rejected,
hurt, and disliked. After both videos, at saliva sample time points 3 and 4, participants
additionally completed a 12-item scale designed to assess the impact of feelings of ostracism
on four primary need measures (feelings of belonging, self-esteem, meaningful existence, and
control; Williams et al., 2002). These items have been used in previous studies investigating
social exclusion (e.g. Gonsalkorale & Williams, 2007; Williams, Cheung, & Choi, 2000;
Zadro, Williams, & Richardson, 2004).
Trait questionnaire pack two. This pack included a questionnaire consisting of
demographic and health-related questions detailing age, alcoholic consumption, time last
eaten/drank, recent ill-health, medication, and oral health. Five free-response questions were
also included in the pack designed to aid the cover story, which were: “How easy did you feel

CHAPTER SIX
128
it was to form new relationships in the web-chat?”, “What do you feel are the positives and
negatives about interacting online?”, “In your opinion, how does interacting online compare
to interacting face-to-face?”, “What were your impressions of the individuals in the web-
chat?”, and “Do you think that the online nature of the chats affected these impressions?”.
Other questionnaires in this pack included the General Health Questionnaire (GHQ-28;
Goldberg, 1972; Goldberg & Williams, 1988), the Perceived Stress Scale (PSS-10; Cohen,
Kamarck, & Mermelstein, 1983) and a personality questionnaire derived from the
International Personality Item Pool (Goldberg et al., 2006), details of which can be found in
Study 1.
Manipulation check questionnaire. At the end of the study, before the debrief,
participants completed a brief questionnaire asking them questions about how they perceived
the study. This, in addition to the five questions asked in the second questionnaire pack, was
designed to measure whether participants had noticed any hidden agenda in the study, and
served to identify possible exclusions.
Saliva collection. Samples were taken at six different intervals (including a practice)
during each session. Participants completed a practice sample soon after arrival into the
study. Two baseline samples (Samples 1 and 2) were collected as a considerable amount of
time (approximately 50 minutes) that had passed between them both, allowing participants’
entering state to be assessed but also as a representative baseline measure. These samples
were taken after participants finished the first questionnaire pack and after participants had
finished the first of the attentional and interpretive bias tasks. Samples 3 and 4 were collected
after each of the OCam videos, and sample 5 was collected 30 minutes after the second
OCam video.

CHAPTER SIX
129
For each sample, participants were asked to place a swab (SOS, Salimetrics LLC, US)
underneath their tongue for a period of two minutes. Participants were instructed to swallow
to clear their mouth of saliva and debris before placing the swab in their mouth and were
asked not to chew on or suck the swab. Samples were tracked through the study using a
tracking sheet that noted unique barcode details of each tube. Samples were stored at -80°C
until required for analysis, and were assayed for levels of sAA and cortisol. Details of the
analysis procedures are included elsewhere (see Chapter two).
O-Cam videos. Participants were informed that they would be taking part in two web
conference chats with other groups of participants at the University of East Anglia, Norwich.
Instructions stated that each conference would consist of three participants in total and that
each participant would be required to give a two-minute presentation on any topic that was of
a positive or neutral nature. Participants were provided with a short list of ideas of topics to
talk about (e.g. recent holidays, career hopes, hobbies, etc.), and given time (approximately 5
minutes) to organise some notes and practice with the researcher before the conference
began.
In reality, during this part of the study participants watched pre-recorded videos of
actors who appeared to be participating in the task. The videos were recorded at the
Cognition and Brain Sciences Unit (CBSU) in Cambridge, and were used with permission of
the creators (Drs. Dunn and Brodbeck). Videos were integrated into Visual Basic software,
which included an imitation connection screen to aid in the illusion of chatting via an internet
connection. At the beginning of each of the two videos, the researcher appeared to share a
brief chat with the actor-researcher on the video (actually spoken off a script according to
strictly rehearsed timings) to further convince participants of the videos seemingly live nature
(see Figure 12). After this staged introduction, the researcher left the room and the participant
sat through each of the other two actor’s (one male, one female) 2 minute presentations

CHAPTER SIX
130
before giving one herself. The first video appeared to be stopped by the (real) researcher
entering the room and cancelling the connection. Again, this was faked, with the researcher
actually pressing a inconsequential key sequence on a QWERTY keyboard in time with the
video running time expiring.
Figure 12. The starting scene of a neutral O-Cam video with a male virtual researcher.
For the second of the videos, participants either watched a video designed to make them
feel socially ostracised or socially included. During the social ostracism video, the participant
sat through the actors’ (one male, one female) presentations (totalling around four minutes) as
before but when it came to their own two-minute talk the actors were seen to tire of the
participant and start to talk amongst themselves. In contrast, during the social inclusion video,
the actors changed their body language to appear to show great interest in the participant’s
presentation (for example, by leaning in and smiling/nodding lots). Both videos ended with
the (actor) researcher entering the room (in the video) to inform everyone that time had

CHAPTER SIX
131
expired. In the social inclusion video, the actors proceeded to give positive feedback about
the task and the participant.
Bias tests. Interpretive bias. To test interpretive bias, participants completed the
recognition test (Mathews & Mackintosh, 2000) that was presented on a computer screen
using E-Prime software (Schneider, Eschman, & Zuccolotto, 2002). Participants were
presented with 10 scenarios that were preceded by a title and were presented one line at a
time. Each scenario remained relatively ambiguous in terms of whether it portrayed a
positive or a negative situation. For example, “Changing the return date on your coach
ticket” (title) “You bought a coach ticket a while ago to visit a friend.” “You now would like
to stay an extra day with them but are unsure about the company policies.” “You ring the
customer service number to change the return date.” “You can tell by the operator’s tone of
voice what they think about your request.” After each scenario, participants have to answer a
simple yes/no comprehension question to ensure they had properly understood the situation,
e.g. “Have you decided to change the date of your return coach ticket?”. After the tenth
scenario, participants were required to recall the scenarios through presentation of the title
alone, and rate four sentences according to how similar they were to their interpreted
recollection of the situation. The four sentences consist of one positive interpretation (e.g.
“The operator seems friendly and sympathetic to your needs”), one negative interpretation
(e.g. “The operator seems annoyed by your request”), one positive foil interpretation (e.g.
“The operator politely asks you whether you would like to take advantage of a special
offer” ), and one negative foil interpretation (e.g. “The operator says that the coach you have
booked has been cancelled”). Foil interpretations were included as a control measure to test
whether participants specifically recalled the target-related interpretation or just a generally
positive or negative situation.

CHAPTER SIX
132
Attentional bias. To measure attentional bias, participants were required to complete a
visual probe task (Macleod, Mathews, & Tata, 1986), which included a series of trials for
which participants had to respond to probes that were displayed behind neutrally or
negatively valenced words. Negative words were related to general (e.g. “inadequate”) or
sensation (e.g. “ashamed”) meanings. Each trial started with a fixation cross being displayed
in the middle of the computer screen. After 500ms, this disappeared and was replaced by two
words above and below where the fixation cross had been. One of the words was always
neutral in valence whilst the other was always negatively valenced. After 500ms, the two
words disappeared and an arrow head target probe was displayed in place of one of the two
words. Participants were required to indicate whether the arrowhead was pointing to the left
(“<” ) or the right (“>” ) by pressing either the z or the m letter key on a QWERTY keyboard
(which are located on the bottom left and right hand of the keyboard respectively).
The task was presented on a computer using E-Prime Software (Schneider et al., 2002),
and was composed of 8 practice trials and 160 test trials split into three sections (54 trials, 53
trials, 53 trials). Between each section participants were given a break, the duration of which
they decided. Two buffer trials preceded each of the three sections, which were not included
in the analysis. A list containing 20 words was repeated 8 times so that every possible probe-
word/word-location combination was used twice (i.e. probe behind neutral word at top of
screen and bottom of screen, and probe behind negative word at top of screen and bottom of
screen).
Condition assignment. Participants were sorted into conditions (ostracism, inclusion)
using a counterbalancing technique. Both the ostracism and the social inclusion conditions
had two possible orders of OCam presentation: video 1 with a male researcher followed by
video 2 with a female researcher, or video 1 with a female researcher followed by video 2

CHAPTER SIX
133
with a male researcher. Participants were assigned a condition according to the following
four-session schedule on a first come first served basis:
1. Neutral video 1 with a female researcher followed by social inclusion
video 2 with a male researcher
2. Neutral video 1 with a male researcher followed by social inclusion
video 2 with a female researcher
3. Neutral video 1 with a female researcher followed by social ostracism
video 2 with a male researcher
4. Neutral video 1 with a male researcher followed by social ostracism
video 2 with a female researcher
The male and female actor-researchers worked with a fixed (but different to each other)
set of male and female actor-participants, both sets of which were used to socially reject or
socially include the participant according to the counterbalancing schedule above.
6.1.4 Procedure
Ethical approval was obtained from the Research Ethics Subcommittee, Anglia
Ruskin University. All testing sessions were run on weekdays between the hours of 10am-
6pm on-campus at Anglia Ruskin University in Cambridge. Sessions lasted 2-2.5 hours and
participants were recompensed with £12 for their effort and time. Participants were instructed
not to eat, drink (other than water), or smoke for 30 minutes leading up to the study, and not
to undertake vigorous exercise for 90 minutes prior to the study. Participants were first given
an information sheet before being verbally briefed on the study and asked to sign a consent
form. Participants were then given instructions on how to give a saliva sample and were
afforded one practice. Following this, participants were asked to complete the first

CHAPTER SIX
134
questionnaire pack (trait questionnaire pack one) before giving their first non-practice
sample. During the two minutes taken to give a sample, participants completed the first
copies of the state questionnaires. Following this, participants completed an attentional and
interpretive bias task and then gave their second sample and completed a second series of
state questionnaires. Participants then received a briefing detailing the nature of the live web
conferences (videos) before spending a couple of minutes gathering notes about what they
wanted to say. Once prepared, participants were timed for two minutes performing a practice
presentation with the researcher before moving on to the two web conference videos. After
each video, participants gave a saliva sample and completed the state questionnaires. Next,
participants completed a second attentional and interpretive bias tests (a filler task), and the
second questionnaire pack (trait questionnaire pack two), before giving their final saliva
sample. Participants then completed the manipulation check questionnaire before being fully
verbally debriefed and given a written debrief sheet. Following debrief, participants were
asked to re-consent to their data being used in this study. Participants were paid and offered
the opportunity to take part in a positive mood induction task, which involved noting down
three positive life events/experiences that had or were happening to the participant whilst
listening to a favoured piece of music.
6.1.5 Data Analysis Plan
Hypothesis 1. To assess the effects of the web-conference task (OCam 1 - neutral)
and whether the social manipulation element (social ostracism vs. social inclusion; OCam 2)
had been successful, a series of repeated measure ANOVAs were conducted on reported
levels of rejection (as measured through the added adjectives on the PANAS), and the
measures of primary needs (belonging, control, self-esteem, and meaningful existence).

CHAPTER SIX
135
Hypothesis 2. To test the main hypotheses regarding the influence of cognitive bias
on the psychological and physiological effects of ostracism as induced through the O-Cam, a
series of moderated regression analyses were performed. Dependent variables were
percentage change scores for reported stress (as measured through the SACL), positive and
negative affect (as measured through the PANAS), sAA secretion, and cortisol concentration.
Percentage change scores were calculated by taking the two measures of interest, for example
reported stress at baseline 2 (SACL 2) and reported stress following the second O-Cam video
(SACL 4), and conducting the following calculation:
((SACL 4 – SACL 2) / SACL 2) x 100
The calculation of percentage change in preference to a delta change score thus
produced a measure that was relative to the former measure, which enabled all scores to be
included regardless of their initial deviation from the group mean. For acute measures
(reported stress, positive and negative affect, and sAA secretion) change scores focused on
variation between measures 2-3 (response to the task), 2-4 and 3-4 (response to the social
manipulation), and 4-5 (recovery). For cortisol, which takes longer for responses to become
apparent (e.g. Kirschbaum et al., 1993), change scores were computed between measures 2-5,
3-5, and 4-5 to capture any response to the social manipulation.
These percentage change scores were then entered (separately) as dependent variables
into moderated regression analyses with the dichotomous variable (condition: ostracism,
inclusion) and the continuous bias score variable (interpretive bias 1 or attentional bias 1)
entered as predictors (step 1). A second step (step 2) included an additional interaction term,
which was the computed combination of the relevant bias score (as used in step 1) and
condition. This was included in regressions that investigated responses to ostracism to
investigate whether any predictive capacities of bias were dependent the presence/absence of

CHAPTER SIX
136
stress. To reduce multicollinearity, the continuous variables (attentional bias 1 and
interpretive bias 1) were mean-centred prior to computing the interaction terms (Aiken &
West, 1991; Holmbeck, 2002). Significant interaction terms were followed up using the
process of simple slope analysis (Holmbeck, 2002).

CHAPTER SIX
137
6.2 Results
6.2.1 Data Exploration
Ten participants’ data were removed from the analysis, six for expressing suspicion
about the deceptive element to the study (live web interaction), three who experienced
technical difficulties during the session (e.g. the software being non-responsive), and one due
to insufficient understanding of the English language. Of the remaining 81 participants, 40
were in the social ostracism group and 41 participants were in the socially included group.
The data was explored for outliers and to check it met the assumptions for parametric testing.
Log transformations were calculated for all data obtained by saliva analysis (sAA secretion
and cortisol concentration), as it was found to include several outliers and showed positive
skewing. This action was successful in its attempts to normalise the distribution of the data.
All analyses were conducted using logged data, however descriptive and graphical
representation of the means and measures of variation are presented using unlogged data.
6.2.2 Participant Characteristics
Univariate ANOVAs revealed no significant difference between the social inclusion
and social ostracism groups on the FNE, RSQ, GHQ-28, PSS-10, DASS (including all three
subscales and aggregate score), or STAI-trait (see Table 11). The two groups also did not
differ significantly in terms of entry levels of state stress and negative affect (state and trait).
However, trait positive affect was found to be higher for the ostracism group than the social
inclusion group. Additionally, participants in the ostracism group reported having
significantly higher state positive affect than participants in the social inclusion group on
entry to the study (at baseline 1; see Table 11). However, these effects were not apparent at
baseline 2, F(1, 77) = .21, p = .65, ηp2 < .001 (ostracism condition: M = 27.63, SD = 7.67;

CHAPTER SIX
138
inclusion condition: M = 26.76, SD = 9.16), which was used as the primary baseline
comparison point (see below).
Table 11
Means and standard deviations for participant trait and entry state characteristics
Social ostracism Social inclusion
F value
p value Mean SD Mean SD
FNE Social anxiety 6.03 4.00 6.51 4.56 .26 .61
RSQ Rejection
sensitivity
8.84 3.28 9.21 3.38 .25 .62
DASS Depression,
anxiety and
stress (aggregate)
23.78 15.41 26.77 16.73 .65 .42
GHQ Distress 46.05 8.69 48.94 11.08 .77 .39
PSS-10 Chronic stress 16.33 4.82 17.18 5.29 .49 .49
STAI Trait anxiety 38.60 7.60 39.59 10.31 .24 .63
PANAS
(trait)
Trait positive
affect
36.63 6.45 33.85 5.54 4.19 .04
PANAS
(trait)
Trait negative
affect
18.97 6.10 20.00 7.07 .47 .50
SACL Entry state stress 2.85 3.07 3.76 3.30 1.64 .21
PANAS
(state)
Entry state
positive affect
31.47 7.60 27.66 8.21 4.58 .04
PANAS
(state)
Entry state
negative affect
13.50 4.64 13.60 4.40 .01 .92

CHAPTER SIX
139
6.2.3 Baseline Sample
A series of 2 (group: social ostracism, social inclusion) x 2 (time of sample: baseline
1, baseline 2) repeated measures ANOVAs revealed that there were no significant main
effects of time (all p values > .10; see Table 12) or group (all p values > .12; see Table 12)
between the first and second baseline samples for sAA secretion, feelings of rejection, or
reported stress. For these variables, there was also found to be no significant interaction
between time and group allocation (all p values > .14; see Table 12).
Table 12
Mean (and SD) comparisons for baselines 1-2 and statistical output
Baseline 1 Baseline 2
Mean SD Mean SD Time Main Effect
Group Main Effect
Group x Time Interaction
F p F p F p
Cortisol (µg/dl) .21 .16 .18 .12 15.39 <.001 .05 .83 .13 .72
sAA secretion
(U/min)
14.72 21.20 15.18 17.56 2.80 .10 .20 .65 .27 .61
Reported stress
(SACL)
3.31 3.20 3.62 3.67 .82 .37 2.44 .12 .21 .65
Reported
rejection
(PANAS)
6.38 4.30 5.63 1.52 2.55 .11 .90 .35 .77 .38
Reported positive
affect (PANAS)
29.49 8.10 27.18 8.43 27.46 <.001 1.72 .19 10.54 .002
Reported negative
affect (PANAS)
13.55 4.49 12.81 3.96 4.06 .05 .20 .65 .65 .42

CHAPTER SIX
140
As can be seen in Table 12, there was a significant main effect of sample time on
cortisol concentration; cortisol samples were significantly higher at Baseline 1 relative to
Baseline 2. However, there was no significant main effect of condition and no significant
interaction between group allocation and time of sample. A significant time main effect was
also found for positive and negative affect; levels of both significantly decreased between
Baseline 1 and Baseline 2 (see Table 12). No significant main effect of group was revealed
for either positive or negative affect. While no significant time x group interaction was
identified for negative affect, a significant time x group interaction was identified for positive
affect. Further investigation, in the form of post-hoc paired t-tests, revealed that for the social
ostracism group levels of positive affect fell significantly from a mean of 31.47 (SD = 7.60)
to 27.63 (SD = 7.67), t(37) = 5.50, p < .001, d = .50. For participants in the social inclusion
group, there was no significant change in reported positive affect, t(40) = 1.55, p = .13, d =
.10 (Baseline 1: M = 27.66, SD = 8.21; Baseline 2: M = 26.76, SD = 9.16).
Univariate ANOVAs showed no significant main effect of condition on cortisol, sAA
secretion, or reported stress, rejection, positive affect and negative affect at baseline 2. In
light of this, and due to it being a better representation owing to the closer proximity in time,
baseline 2 (sample 2) was selected as the most suitable baseline sample to compare against
successive samples.
6.2.4 Creating Bias Index Scores
Interpretive bias index (IBI) scores. Prior to calculating an IBI score, a series of
paired t-tests were conducted to distinguish whether participants successfully discriminated
between target and foil sentences during the recognition task. Results revealed that
participants consistently rated target positive items (M = 2.19, SD = .47) higher with regards
to their recollection of how the sentence matched the original scenario relative to positive foil

CHAPTER SIX
141
items (M = 1.58, SD = .49), t(80) = -15.19, p < .001, d = 1.26. Similarly, participants were
found to rate negative target items significantly higher (M = 2.27, SD = .51) in comparison to
negative foil items (M = 1.40, SD = .34), t(80) = -17.31, p < .001, d = 2.02. This confirmed
that participants were correctly recalling interpretations of the scenario, rather than making
generalised positive or negative associations.
To produce an overall IBI score, individual target ratings for the negative
interpretations of sentences were subtracted from target ratings for the positive interpretations
of sentences. The resulting IBI score represented an individual’s overall tendency to make
positive or negative interpretations of ambiguous scenarios (i.e. their natural interpretive
bias), with a higher score representing a more positive bias and a more negative score
indicating a more negative bias.
Attentional bias index (ABI) scores. Prior to calculating an ABI score, incorrect
trials and trials for which participants took less than 200ms or longer than 2000ms to
complete were removed from the analysis (as in MacLeod, Rutherford, Campbell,
Ebsworthy, & Holker, 2002). This extraction consisted of 2.38% of the total available test
data. To produced a single useable attentional bias index score, median time (milliseconds)
taken to respond to probes displayed behind the neutral words was subtracted from median
time (milliseconds) taken to respond to probes displayed behind the negative words. A higher
resulting score indicated a more positive bias, whilst a lower number indicated a more
negative bias.
6.2.5 Hypothesis One
Social rejection. A 2 (condition: social ostracism, social inclusion) x 4 (time point:
baseline 2, post OCam 1, post OCam 2, and 30 minutes post OCam 2) repeated measures
ANOVA was conducted on reported rejection (from PANAS adjectives). A significant main

CHAPTER SIX
142
effect of time was identified, F(1.65, 126.88) = 28.50, p < .001, ηp2 = .27 (Greenhouse
Geisser adjusted), that was qualified by a significant interaction between time and condition,
F(1.65, 126.88) = 36.09, p < .001, ηp2 = .32. Post-hoc investigation (Bonferroni corrected α =
.017) of the main effect revealed no change from Baseline 2 until after OCam 1, t(79) = .38, p
= .71, d = .03, a significant increase between the two OCam videos, t(79) = -4.77, p < .001, d
= .70, followed by a significant decrease from OCam 2 until 30 minutes later, t(78) = 4.57, p
< .001, d = .55. As expected, when exploring the interaction, a significant increase in reported
rejection was identified only in socially rejected participants immediately after watching the
socially rejecting OCam video, t(38) = -6.44, p < .001, d = 1.38. In this group, reported
rejection was then found to significantly decrease after 30 minutes from watching the second
OCam video, t(38) = 6.07, p < .001, d = 1.06. No other comparisons approached statistical
significance in either the social ostracism or social inclusion condition (see Figure 13).
Further, univariate ANOVAs showed no significant main effect of condition on reported
rejection at baseline 2, after (neutral) OCam 1, or 30 minutes after OCam 2 (all p values >
.24). After OCam 2, a significant main effect of condition was evident, F(1, 79) = 42.23, p <
.001, ηp2 = .35.

CHAPTER SIX
143
Figure 13. Change in reported rejection throughout the study.
Primary needs. A 2 (between subjects; group: social ostracism, social inclusion) x 2
(within subjects; time point: after [neutral] OCam video 1, after [socially manipulating]
OCam video 2) repeated measures ANOVA was conducted on the aggregate scores of the
four primary needs variables. While no main effect of time was revealed, F(1, 71) = 2.88, p =
.09, ηp2 = .04, a significant interaction was identified between group and time, F(1, 71) =
45.09, p < .001, ηp2 = .39.
Post-hoc testing (Bonferroni corrected α = .03) revealed that participants who were
socially rejected reported a significant decrease in overall primary needs fulfilment, t(36) = -
5.75, p < .001, d = 1.23. Conversely, participants in the social inclusion condition reported a
significant increase in primary needs fulfilment, t(35) = 3.69, p = .001, d = .69. Table 13
shows the output of these analyses when run on the subgroups of the primary needs variables.
As can be seen, the fulfilment of needs associated with belonging, self-esteem, and having a
4
5
6
7
8
9
10
11
Baseline 2 After Ocam 1
(neutral)
After Ocam 2 30 minutes
after Ocam 2
Re
po
rte
d r
eje
ctio
n
Social rejection
Social inclusion

CHAPTER SIX
144
meaningful existence all appear to be affected by social ostracism in the hypothesised
manner. The need for control, alternatively, is not affected by the social manipulation7.
Table 13
The relationship between primary need subscales and social manipulation
Belonging Self-esteem Meaningful
existence
Control
REPEATED MEASURES ANOVA
Main effect of
time
F(1, 74) = 15.49** F(1, 74) = .02 F(1, 75) = 10.48* F(1, 76) = .08
Interaction
with social
manipulation
F(1, 74) = 71.32, ** F(1, 74) = 35.86** F(1, 75) = 45.95** F(1, 76) = 3.27
* p < .01 ** p < .001
PAIRED T-TESTS
Ostracism
only
t(37) = -7.00* t(37) = -3.78* t(38) = -5.57*
Reduced levels of
belonging
Reduced levels of self-
esteem
Reduced levels of
meaningful existence
N/A
Inclusion only t(37) = 4.83* t(37) = 5.00* t(37) = 4.25*
Increased levels of
belonging
Increased levels of self-
esteem
Increased levels of
meaningful existence
N/A
* p < .013 (Bonferroni corrected alpha)
Summary. As hypothesised, reported rejection was significantly greater in response
to social ostracism relative to social inclusion. Ostracism additionally led to a reduced
7 This finding was supported by univariate ANOVAs conducted on the aggregate and individual subscale scores comparing the influence of condition prior to and after OCam 2. For all scales there was no main effect of condition at measure 1 (all p values > .17), but for the aggregate scale and belonging, self-esteem, and meaningful existence subscales there was a significant main effect of condition (in the predicted direction) at measure 2 (all p values < .001). No main effect was apparent for the control subscale at measure 2 (p = .16).

CHAPTER SIX
145
fulfilment of individual primary needs, specifically the subscales related to belonging, self-
esteem, and having a meaningful existence. Alternatively, in relation to the need to have
control, there was no support for the hypothesis.
6.2.6 Hypothesis Two
Attentional Bias. Response to neutral task (OCam 1). Prior to the moderated
regression, simple linear regression analyses were conducted to confirm whether random
allocation to groups (ostracism, social inclusion) had been successful. Results found that
group allocation and attentional bias did not significant predict changes in sAA secretion,
positive affect, or negative affect between measures 2-3 (baseline 2 and after OCam 1; see
Table 14). Attentional bias did emerge as a significant unique predictor of changes in
negative affect between measures 2 and 3 (p = .04). The absence of predictive capacities of
group allocation at this stage confirms that random allocation to conditions took place as, at
this point in the study, there were no differences in protocol between the two conditions.
Table 14
Summary of regression analyses testing effects of group allocation and attentional bias.
Model
R2
Group allocation Attentional bias
B SE B SE
A Stress change 2-3 .001 -.03 .53 .004 .02
Positive affect
change
2-3 .03 -.02 .06 -.003 .002
Negative affect
change
2-3 .06 -.03 .05 -.003* .002
sAA change 2-3 .01 .61 .93 .001 .03
Note. A = Response to task

CHAPTER SIX
146
Response to social manipulation. A series of moderated regressions were conducted
to assess the predictive capacity of group allocation and cognitive bias on psychological and
physiological responses to ostracism/social inclusion. Step 2 further assessed the importance
of being in a current state of stress in observing these effects. A significant proportion of the
variance in reported stress, positive affect, and negative affect between measures 3-4 (post
OCam 1; post OCam 2) and 2-4 (baseline 2; post OCam 2) was accounted for by group
allocation and attentional bias on Step 1 (see Table 15). However, for all models, group
allocation was found to be the only significant predictor. Additionally, the interaction terms
(group x attentional bias; step 2) did not emerge as a significant predictor for any of the
dependent variables. No significant amount of variation in sAA secretion (measures 3-4 or 2-
4) or cortisol (measures 2-5, 3-5, or 4-5) was explained by group allocation, attentional bias
or the interaction term (group allocation x group).
Recovery. A series of moderated regressions were conducted as above to focus on
recovery from the task. Group allocation and attentional bias (step 1) accounted for a
significant amount of variance in reported stress, positive affect, and negative affect between
measures 4-5 (post OCam 2; 30 minutes later), though group allocation emerged as the only
significant predictor. Group allocation and attentional bias failed to account for any
significant variation in sAA secretion between samples 4-5. No interaction terms (step 2)
were significant (see Table 15).

CHAPTER SIX
147
Table 15
Summary of regression analyses testing moderating effects of group allocation and
attentional bias.
Model
Step 1 Step 2
R2
Group allocation
Attentional bias ∆�
�
Interaction term (group x bias)
B SE B SE B SE
B Stress
change
3-4 .18** 1.46*** .39 .003 .01 .01 .02 .02
2-4 .19** 1.73*** .47 -.004 .02 .02 -.04 .03
Positive
affect
change
3-4 .31*** -.24*** .04 .001 .001 .001 .001 .003
2-4 .23*** -.28*** .06 .000 .002 .001 -.001 .004
Negative
affect
change
3-4 .26*** .29*** .06 .002 .002 .001 .001 .004
2-4 .19*** .28*** .07 -.002 .002 .01 -.004 .004
sAA
change
3-4 .05 -.37 .28 .01 .01 .02 -.02 .02
2-4 .01 .15 .46 .01 .01 .002 .01 .03
Cortisol
change
2-5 .04 .10 .10 .003 .003 .001 .002 .01
3-5 .03 .000 .08 -.003 .002 .01 .004 .005
4-5 .05 .04 .06 -.003 .002 .000 .001 .004
C Stress
change
4-5 .12* -.59** .19 .000 .01 .003 -.01 .01
Positive
affect
change
4-5 .13** .14** .05 .002 .002 .02 .004 .003
Negative
affect
change
4-5 .17** -.15*** .04 .000 .001 .001 .001 .003
sAA
change
4-5 .005 .15 .32 -.004 .01 .004 .01 .02
Note. B = Response to social manipulation, C = Recovery; * p < .05, ** p < .01, *** p <
.001.

CHAPTER SIX
148
Interpretive Bias. Response to neutral task (OCam 1). Prior to the moderated
regressions, simple linear regression analyses were conducted to determine the effects of
participating in the neutral task and to ensure successful random group allocation had taken
place. Group allocation and interpretive bias were not found to account for any significant
amount of the variance in positive affect, negative affect, or sAA secretion between measures
2-3 (baseline 2; post OCam 1). While the model was not found to be significant for variation
in stress, interpretive bias did emerge as a near-significant predictor (p = .05; see Table 16).
The absence of any predictive power of group allocation confirms that random group
allocation took place.
Table 16
Summary of regression analyses testing effects of group allocation and interpretive bias.
Model
R2
Group allocation Interpretive bias
B SE B SE
A Stress change 2-3 .06 .06 .52 .94 * 1 .47
Positive affect
change
2-3 .01 -.02 .06 -.05 .06
Negative affect
change
2-3 .01 -.04 .05 -.003 .05
sAA change 2-3 .01 .59 .93 .32 .80
Note. A = Response to task. *1 p = .052.
Response to social manipulation. Moderated regressions were conducted to
determine the predictive capacity of group allocation and cognitive bias. Step 2 assessed
whether considering an individual’s current state (i.e. stressed or not stressed) was necessary
in observing these effects. A significant amount of variance in stress, positive affect, and

CHAPTER SIX
149
negative affect between measures 3-4 and 2-4 was accounted for by group allocation and
interpretive bias (step 1; see Table 17). However, group allocation emerged as the only
significant predictor in all models. No significant amount of variance in these models was
explained by the interaction terms (group x interpretive bias; step 2). No significant amount
of variance in sAA secretion (measure 3-4 or 4-5) or cortisol (measures 2-5, 3-5, or 4-5) was
explained by group allocation, interpretive bias, or the interaction term.
Recovery. In step 1, a significant amount of variation in stress, positive affect, and
negative affect between samples 4-5 was accounted for by group allocation and interpretive
bias, though in all instances group allocation emerged as the only unique significant
predictor. While group allocation and interpretive bias (step 1) were not found to account for
a significant amount of variation in sAA secretion between samples 4-5, interpretive bias did
emerge as a trend unique predictor (p = .08). No interaction terms (group x interpretive bias;
step 2) were found to account for a significant amount of variance in any of the recovery
models.

CHAPTER SIX
150
Table 17
Summary of regression analyses testing moderating effects of group allocation and
interpretive bias.
Model
Step 1 Step 2
R2
Group allocation
Interpretive bias
∆�
�
Interaction term (group x bias)
B SE B SE B SE B Stress
change
3-4 .19** 1.44*** .39 .41 .34 .03 1.04 .70
2-4 .20** 1.76*** .46 .47 .42 .001 -.26 .86
Positive
affect
change
3-4 .30*** -.24*** .04 -.004 .04 .004 .05 .08
2-4 .23*** -.28*** .06 -.05 .05 .01 .10 .11
Negative
affect
change
3-4 .25*** .30*** .06 -.02 .06 .005 -.08 .11
2-4 .18*** .28*** .07 -.02 .06 .01 .14 .13
sAA
change
3-4 .02 -.36 .29 .07 .25 .02 .59 .51
2-4 .004 .16 .46 -.15 .41 .003 .38 .83
Cortisol
change
2-5 .02 .11 .10 .04 .09 .01 .17 .20
3-5 .000 -.01 .08 .01 .07 .02 .14 .15
4-5 .01 .04 .06 .02 .05 .01 -.08 .11
C Stress
change
4-5 .13** -.60** .19 .18 .17 .03 -.49 .34
Positive
affect
change
4-5 .11* .14** .05 .03 .04 .02 -.12 .09
Negative
affect
change
4-5 .18** -.15*** .04 .03 .04 .003 -.04 .07
sAA
change
4-5 .05 .14 .31 -.49 * 1 .27 .000 .03 .56
Note. B = Response to social manipulation, C = Recovery; *1 p = .08, * p < .05, ** p < .01,
*** p < .001.

CHAPTER SIX
151
Summary
Group allocation was found to be a significant predictor for variation in reported
stress, positive affect, and negative affect between measures 3 (post OCam 1) – 4 (post
OCam 2) and 2 (baseline 2) – 4, as well as for variation in these variables between measures
4 – 5 (30 minutes post OCam 2). There were no significant predictors of cortisol or sAA
secretion between these time points, though interpretive bias was found to be a trend
predictor of variation in sAA secretion between time points 4-5. Group allocation was not
found to be a significant predictor of changes in dependent variables between time points 2-3,
though attentional bias was found to significantly predict variation in negative affect and
interpretive bias was found to be a near significant predictor of changes in stress during this
time.

CHAPTER SIX
152
6.3 Discussion
As predicted, participation in a simulated online chat that was staged to induce the
sensation of being ostracised successfully produced a subjective stressful response.
Ostracised participants reported a significant increase in feelings of rejection and
significantly less fulfilled primary needs compared to a simulated online chat that promoted
feelings of social inclusion. Specifically, ostracised participants reported significantly less
fulfilment of primary needs associated with belonging, self-esteem, and having a meaningful
existence while the subgroup of needs associated with being in control was unaffected.
Allocation to either a social ostracism or social inclusion condition significantly predicted
variation in psychological measures; reported stress and positive and negative affect.
However group allocation failed to predict any changes in the physiological measures,
thereby suggesting that ostracism was ineffective in producing significant changes in cortisol
and sAA. Further, attentional bias did not significantly predict any physiological changes
during the study. However, attentional bias did significantly predict changes in negative
affect from baseline 2 until after OCam 1 (taken to represent a response to participating in the
task). Interpretive bias emerged as a trend predictor of changes in stress from baseline 2 to
after OCam 1 (response to the task), and for changes in sAA between the final two samples
(recovery from the stressor/task).
Weeks, Heimberg, Rodebaugh, and Norton (2008) argued that social anxiety is
composed of a general fear of evaluation (i.e. a fear of both negative and positive evaluation).
While positive evaluation fears were not measured in this study, negative evaluation fears
were using the Fear of Negative Evaluation scale (Watson & Friend, 1969). This construct
was not found to significantly vary by condition. Though the two concepts are thought to
exist independently, they have been shown to share a strong positive correlation in an
undergraduate sample (Weeks et al., 2008; Weeks, Heimberg, & Rodebaugh, 2008). It is

CHAPTER SIX
153
therefore assumed that social anxiety did not act as a confounding factor to responses of
ostracism or inclusion in this study.
As with Study 1, the stressor task in the present study (being ostracised) did not elicit
any physiological stress response. However, unlike Study 1, here the task was successful in
producing an acute psychological response on standardised measures, specifically increases
in stress, negative affect, and feelings of rejection and decreases in positive affect and self-
reported fulfilment of primary needs. It seems, therefore, that there is some inconsistency
between how participants report feeling and their physiological response. In order to further
examine this disparity, it seems worth considering how people responded to earlier aspects of
the study. As mentioned previously, this task does appear to contain elements of the TSST,
notably self presentation in front of an (assumed) audience. In a meta-analyses of 208 studies
that aimed to induce a physiological (cortisol) response, Dickerson and Kemeny (2004)
concluded that three elements were necessary in order to produce a task-induced
physiological response; uncontrollability, motivation to succeed, and threat to the social self.
The intended stressor (ostracism) aspect of this study was thought to contain these aspects.
Motivation was represented through an individual’s natural desire to belong (Baumeister &
Leary, 1995), while uncontrollability was illustrated by forcing participants to continue
talking for two minutes to an audience (the self-presentation aspect of which contained a
potentially socio-evaluative and personal element). However, while the self-presentation
aspect might have been considered uncontrollable, Williams et al.’s (2002) fundamental need
for control was not found to be significantly affected by the perception of ostracism. Perhaps,
then, it could be argued that the first OCam video (neutral response) acted as the stressful
task over and above actually being rejected. From a participant’s perspective, for example,
the first task would still include an element of social evaluation. Post-hoc analysis conducted
between baseline 2 and OCam 1 appeared to support this proposition. In all participants, both

CHAPTER SIX
154
reported stress, t(80) = -2.62, p = .01, d = .30, and sAA secretion, t(74) = -5.30, p < .001, d =
.50, increased significantly, which suggests that participating in the task itself (i.e. self-
presentation to an audience) proved stressful.
The suggested reinterpretation of the stressor discussed above could have
considerable ramifications in terms of explaining the apparent discrepancy between
physiological and psychological responses to social ostracism. For instance, condition
allocation, and therefore social ostracism, failed to predict any changes in sAA in response to
the second, socially manipulative, OCam task. It remains possible that the significant rise in
sAA secretion in response to the task (i.e. OCam 1) alone acted as a mask to any response to
the social ostracism element which, if combined with a neutral non-stressor task, might have
been more apparent.
By coincidence, while proving disadvantageous in one outlook, these post hoc
findings relating to the effects of the task itself do prove useful when considering another
viewpoint. For instance, initial analysis had suggested there had been no physiological
response. However, retrospectively finding a significant rise in sAA secretion in response to
the task means that changes between the final two samples represented a real recovery from
stress. Accordingly, any associations linked to this recovery phase appear instantly more
significant. Interpretive bias was found to be a trend predictor of changes in sAA during this
time, with a stronger negative bias being indicative of a slower return to baseline. While not
appearing influential in physiological responses to stress, these results suggest that
interpretive bias might instead determine an individual’s success in recovering from a
stressful event.
Partial support for the above argument is given by recent findings from Baert, Casier,
and De Raedt (2011), who were able to link the effects of attention modification training to

CHAPTER SIX
155
an individual’s physiological recovery from, rather than their response to, stress. Participants
who received attention modification training for six days prior to a mock interview showed a
significantly faster recovery of heart rate variability compared with participants who
completed a control version of the training. While researchers typically focus solely on the
stress response, perhaps consideration of both response to and recovery from a stressor might
provide a better framework in determining resistance/resilience to stress. Indeed, the
Perseverative Cognition hypothesis (Brosschot, Gerin, & Thayer, 2006) argues that it is this
capacity to recover from a stressor that serves as a better predictor for stress-related ailments,
such as poor health, rather that the magnitude of the initial response.
The absence of significant findings relating to the predictive power of attentional bias
is surprising, given that this bias has received considerably more interest in the literature than
interpretive bias. Several studies have documented attentional bias as a correlate of an
individual’s cortisol response to a stressful event (e.g. Dandeneau, Baldwin, Baccus,
Sakellaropoulo, & Pruessner, 2007; Pilgrim, Marin, & Lupien, 2010). Fox, Cahill, and
Zougkou (2010) extend this with findings that showed how hyper-vigilance to threat
predicted cortisol response to stress above and beyond the predictive power of more
conventionally considered trait factors, such as anxiety, neuroticism, and extraversion. It is
worth noting, though, that the above studies tailored tests of attention to match the genre of
stress included. For example, to measure attention, Pilgrim et al. employed a visual probe
task that contained words that were specifically selected for their ability to convey emotions
depicted with social evaluation. For the stress task, the authors then used a modified version
of the TSST that included self-presentation. The current study aimed to measure the influence
of a more general measure of attention, with emotive words that pertained to either a
generally negative (e.g. negligent) or negative sensation (e.g. suffocating) category.
Alternatively, the categories included in the interpretive bias test related more to social

CHAPTER SIX
156
interaction and performance, which might explain both the disparate findings between the
two measures of bias included in the present study and also the relationship between
attentional bias observed in the present and previous studies.
Three main points can be concluded from the findings of the present study. First,
social ostracism created using the OCam paradigm appeared to successfully act as an acute
psychological stressor. However, confounding aspects of the task (self-presentation) possibly
concealed evidence of ostracism being an acute physiological stressor. For this reason, it
would seem unwise to continue with this task in its current form (i.e. with a “neutral” then
ostracising video). Second, as argued in a recent paper (Mackintosh, Mathews, Eckstein, &
Hoppitt, in prep), it seems that there is a necessity to match bias test material with similar
concepts that might be included in the emotional appraisal of the stress task in order for any
influences to become visible. Finally, drawing on findings concerning data from interpretive
bias tests (which did correspond more to the domain of the stressor), the data suggests that
natural biases might additionally play a role in an individual’s ability to recover from a
stressful event. This implies that future research should consider both response and recovery
changes and suggests the relationship between bias and stress vulnerability might not be as
clear cut as previously assumed. The next logical step in this research (Study 5) will address
the influence of bias training on the stress response/recovery process.

CHAPTER SEVEN
157
7.0 CHAPTER SEVEN: STUDY FIVE
An investigation into the influence of CBM-I training on the psychophysiological effects of
acute stress

CHAPTER SEVEN
158
There now exists a well established causal link between cognitive bias and anxiety; an
individual’s inclination to disproportionately focus on threatening material and interpret
ambiguity in an overly threatening manner can determine their susceptibility to various
anxieties (for a review, see Beard, 2011). The manners in which these biases operate on a
physiological level, however, are less well understood. A handful of researchers have started
to explore this area, with findings demonstrating influences in the expected direction. For
example, Fox, Cahill, and Zougkou (2010) have shown how individuals’ unconscious
tendency to selectively attend to threatening material determined cortisol responses to acute
laboratory stressors delivered four and eight months later. Dandeneau, Baldwin, Baccus,
Sakellaropoulo, and Pruessner (2007, experiment 1) also found a significant positive link
between cortisol responses to a stressor (rejection task) and attention bias on a visual probe
task. Here, cortisol output was greater in participants who were faster to respond to probes
that were placed behind pictures of angry or rejecting expressions. In this thesis, Study 4
failed to replicate the suggested links presented above, as changes in cortisol following an
acute stressor were not found to be explained by natural biases in attention and interpretation.
However, interpretive bias was found to influence the recovery rate of sAA, which has
previously not been explored. The present study aims to further the current literature by
investigating the influence of positive CBM-I training on the psychological and physiological
stress response.
At present, one study exists that explores the influence of bias training on the
physiological stress response. Dandeneau et al. (2007, experiment 3b) created a novel bias
training program that required participants to locate a picture of a face that depicted a
neutral/happy emotion from a 4x4 matrix of faces, of which the remaining 15 pictures
depicted angry/rejecting expressions. Compared with a control condition, participants who
completed the ‘find the happy face’ training daily for one week had significantly lower levels

CHAPTER SEVEN
159
of cortisol and significantly smaller peak cortisol responses over the working day, thereby
indicating they had been less affected by the social stress associated with their jobs
(telemarketing).
Though in its infancy, the highlighted research offers a great deal of promise for
researchers in the field. However, to date, only two studies have investigated the influence of
naturally occurring interpretive biases on the physiological stress response. In Study 4,
interpretive bias was not found to significantly predict physiological (or psychological)
reactions to a social ostracism paradigm. Interestingly, however, the measure was indicative
of changes in sAA (though not cortisol) after the stressor, implicating a potential influence of
interpretive bias on recovery success following stress rather than at the initial response stage.
Concurrent with the efforts presented in this thesis aimed at establishing a link between
cognitive biases and the stress response, a collaborative investigation explored this link
focusing on performance-related stress (Hoppitt, Mackintosh, Randall, & Bristow, under
review). Interpretive bias to emotionally ambiguous vignettes was measured using the
recognition test. Participants were then exposed to either a stressor or control task in a group
setting. The stressor required participants to complete a series of computer tasks that they
were told formed a cognitive ability test. The three tasks were presented in a set order and
consisted of a number and general memory test and a series of anagrams. Participants were
informed the test had been designed so that “average” students performed well, when actually
the tests were set to a high level of difficulty to induce feelings of failure. For the control
condition, participants were presented with the same instructions and tasks but with the
difficulty set at an easy and unchallenging level. Though no main effects of the stressor were
evident on the physiological stress response, findings demonstrated a clear link between
interpretive bias and the stress response. Participants in the stress condition with a more

CHAPTER SEVEN
160
negative bias (following a median split) were found to have significantly greater cortisol and
sAA responses to the task relative to those with a more positive bias.
Though considerably more research is needed to replicate these findings and clarify
any conflicting findings, preliminary research suggests that bias might play a seminal role in
how people respond to a stressful event. One possible cause of the discrepancies in the two
studies mentioned above could be due to the type of stimuli used in the bias tests/training. For
example, in Study 4 (of the present thesis) attention bias was not found to significantly
predict any physiological changes in response to a social ostracism challenge. It was noted,
however, that the content of the test word lists did not match that of the stressor, with the test
stimuli corresponding to generally negative or negative sensation categories while the
stressor characterised a social evaluative stressor. Dandeneau et al. (2007, experiment 3a)
report similar domain-specific effects in a study during which participants completed an
online ‘find the happy face’ training exercise for five days prior to a final exam. Each day,
training was followed by participants answering three questions relating to their appraisal of
their exam anxiety. While the training was successful in reducing their anxiety specifically
relating to the exam, it had no influence on general levels of stress or anxiety over the
training days.
In studies where clear bias effects are evident (e.g. Pilgrim, Marin, & Lupien, 2010),
the bias test and stressful challenge tend to encompass similar domains (e.g. social stress).
Mackintosh, Mathews, Eckstein, and Hoppitt (in prep) explored these specificity patterns by
training participants toward a more positive bias with material that either matched or differed
in content to an ensuing stressful task. Findings showed that training effects were only
apparent in the response to the stressor when the training was more tailored to the task. These
findings imply that biases function at a domain-specific level. This issue has received
considerable attention within the field (e.g. Salemink, van den Hout, & Kindt, 2010), though

CHAPTER SEVEN
161
at present findings are often contradictory. Therefore, as this is not an issue that is to be
addressed here, for the purpose of the present study bias training/test material will be tailored
specifically to match themes evident in the stressful task.
The main objective of the present study is to investigate the influence of interpretive
bias training on the psychological and physiological response to a stressful event. In light of
the specificity arguments presented above, and considering no clear bias-stress response links
were identified in Study 4, the present study will adopt the more successful stressor paradigm
employed in Hoppitt et al. (under review). A further justification for implementing the
imitation cognitive ability stressor tasks in the current study arises from the fact that an
interpretive training programme has already been adapted to contain test-related material
which matches the stressor task. Further, research from our laboratory has demonstrated that
the training is successful in modifying emotional responses to the imitation cognitive ability
tasks (Mackintosh et al., in prep). This study therefore aims to advance Mackintosh et al.’s
study by exploring physiological responses to the paradigm.
As the stressor task has been standardised elsewhere (Hoppitt et al., under review), the
present study will not include a control task; all participants will complete the same version
of the task. Prior to this, participants will receive CBM-I training that relates specifically to
test/examination anxiety. Training will either encourage participants to interpret test-related
ambiguous scenarios in a positive manner (positive training) or will draw on the positive and
negative interpretations of the scenarios equally (sham training). It is hypothesised, firstly,
that participants will find the task emotionally stressful, which will be evidenced by a
significant rise in levels of reported stress and negative affect, as well as significant decreases
in positive affect. As no main effect of the task on physiological activation was identified in
Hoppitt et al., cortisol concentration and sAA output are not predicted to change in response
to the task here. However, the direction of CBM-I training is predicted to influence the

CHAPTER SEVEN
162
magnitude of participants’ responses to the task, with positive training leading to a smaller
response than sham training. This effect is expected to be evident in both psychological and
physiological variables.

CHAPTER SEVEN
163
7.1 Method
7.1.1 Design
A 2 (between subjects; group: positive training, sham training) x 5 (within subjects;
time of saliva samples and mood measurement: baseline 1 and 2, post-stressor, and 20 and 30
minutes post-stressor) mixed model design was used (see Figure 14). Dependent variables,
cortisol concentration, sAA secretion, reported stress, and positive and negative affect, were
measured at five time points. Dependent variables, state anxiety, reported optimism,
happiness, tension, and distress, were measured before and after the stressor. Measures of
chronic stress and distress, test anxiety, and trait anxiety were also taken to assess potential
influences on participants’ vulnerability to stress. Interpretive bias was assessed following
CBM-I training (sham or positive) to assess impact of training. Stress was induced through a
pseudo cognitive ability test.

CHAPTER SEVEN
164
Saliva collection instructions and practice using SOS
Positive CBM-I training
Trait questionnaire pack
Pre-stressor STAI and VAS
Interpretive bias test
Stressor
“Cognitive ability” tests x 3
(Sample and mood-based questionnaires 2)
(Sample and mood-based questionnaires 4)
(Sample and mood-based questionnaires 3)
(Sample and mood-based questionnaires 5)
(Sample and mood-based questionnaires 1)
20 minutes
Drink
Sham CBM-I training
Post-stressor STAI and VAS
Drink
Drink
Drink
Drink
Drink
10 minutes
Time filled watching Planet Earth DVD
Figure 14. Overview of Study 5’s experimental design

CHAPTER SEVEN
165
7.1.2 Participants
Participants were female students from Anglia Ruskin University, Cambridge, who
were aged between 18 and 45 (M = 21.14, SD = 5.11) and reported having English as their
first or chosen language. Participants were recruited via an advertisement email, posters
displayed around the campus, or from the researcher entering lectures to verbally advertise
the study. Students were invited to contact the researcher via email to complete a screening
questionnaire (STAI-trait; Spielberger, Gorsuch, Lushene, Vagg, & Jacobs, 1983). One
hundred and twenty six students who scored below 60 on the STAI-trait8 were invited to
participate in the study, of which 83 accepted (group STAI-trait M = 37.16, SD = 9.57).
Owing to recruitment techniques, 92.77% of the participant population were from the Faculty
of Science and Technology. Of that majority, 68.83% participants studied psychology as
either a single or combined honours pathway (55.84% single, 12.99% combined), of which
62.26% were first years, 28.30% were second years, 7.55% were third years, and 1.89%
unspecified.
7.1.3 Materials
Questionnaires. Participants completed the GHQ-28, PSS-10, and STAI-trait (as
outlined in Study 1). Participants additionally completed the Test-Anxiety Inventory (TAI;
Spielberger, 1980), which is a 20-item questionnaire designed to quantify vulnerability to
situation-specific anxiety as well as proneness to become emotional and worry in response to
taking a test. Participants are required to rate each item according to how they would
generally relate to such a situation on a four-point Likert scale ranging from 1 (Almost never),
to 4 (Almost always). Items vary according to whether they refer to anxiety experienced prior
to, during, or after an examination. An example of an item on the TAI is “Even when I’m
8 Specified as an ethical requirement.

CHAPTER SEVEN
166
well prepared for a test, I feel very nervous about it” . Responses to items are reversed where
necessary and then summed to give an overall measure of test anxiety out of a possible 80
(minimal score of 20). Separate scores for worry and emotionality can also be calculated.
Scores from the TAI have been shown to correlate well with alternate measures of test
anxiety, such as the Test Anxiety Scale (TAS; Sarason, 1978) (Spielberger, 1980), and the
scale also demonstrates good internal consistency (α = .92 - .96; Spielberger, 1980).
Each time participants gave a saliva sample, they completed the SACL and PANAS
(details of which can be found in Studies 1 and 2 respectively). Participants additionally
completed the STAI-state and VAS measuring optimism, happiness, distress, and tension (see
Study 1 for more details on these scales) prior to and immediately after completing the
pseudo intelligence test (stressor).
Saliva collection. Participants were issued with instructions on how to give a saliva
sample with the use of Salimetrics Oral Swabs (SOS); to passively hold the swab under their
tongue for 2 minutes without chewing or sucking it. Excluding the practice sample,
participants gave five samples during the study: as an initial baseline approximately 25-30
minutes into the study, a second baseline approximately 75-85 minutes into the study,
immediately after the stressor, and 20 and 30 minutes after the stressor. Two baseline samples
were taken in consideration of the substantial period of time that had elapsed between the
start of the study and the stressor (approximately 120-125 minutes). The third sample was
aimed at capturing any immediate sAA response, whilst samples 4 and 5 were aimed at
capturing recovered sAA levels and initial cortisol response. Samples were stored in locked
freezers at -80°C following the session until needed for analysis, and were analysed for levels
of sAA and cortisol. Further details of the assaying procedure can be found in Chapter two.

CHAPTER SEVEN
167
Interpretive bias training and testing. Interpretive bias training (CBM-I). A
computerised training programme was delivered with the assistance of E-Prime software
(Schneider, Eschman, & Zuccolotto, 2002). After receiving instructions and having a chance
to practice, participants were presented with 70 scenarios that were presented in seven blocks
separated by short breaks. Each scenario was presented one sentence at a time (with no title),
and depicted a situation that remained ambiguous as to whether it was positive or negative in
nature until the final word which was presented as a word fragment for the participants to
solve. In the positive training condition, each scenario was consistently resolved into a
positive situation, for example, “As you work at each new example in a test you find you are
not able to solve them in the time given. You assume that you should be able to do the tasks
and the time allowed has therefore been carefully chosen so as to be i-p-ss-b—(impossible)”.
Alternatively, in the sham training condition this contingency was not apparent and scenarios
resolved into a positive and negative situation (e.g. the negative ending of the previous
scenario would end with the word fragment “e-ou-h (enough)”) with equal frequency. After
each scenario, participants were required to answer a simple comprehension question to
further impress the positive, negative, or neutral element to the scenario. For example, the
comprehension question relating to the above scenario would be “Do you think you should
finish in the time?” with the correct answer (yes or no) corresponding to the prior resolved
meaning (i.e. positive of negative) of the situation. During each of the seven blocks
participants were additionally presented with two filler scenarios that depicted a neutral
situation, e.g. “You attend a schooldays reunion at your old college and meet up with lots of
people you have not seen for some time. You speak to lots of old friends and then decide to
get a drink. You go to the bar and when you return you find that some of your friends are
dancing to loud mu-ic (music)”.

CHAPTER SEVEN
168
Bias test. Participants completed an interpretive bias test similar to the one outlined in
Study 4. While the participant’s task remained the same, for the encoding phase 20 titled
scenarios were presented to participants that described situations of being judged either
through a test (test anxiety) or by people you would be trying to impress (social anxiety). For
example, “The job interview. You applied for a job in a company you’d really like to work in.
You are invited to an interview, where you answer the questions as well as you can.
Reflecting later, you think that the quality of your answers decided the ou-com- (outcome)”.
As in Study 4, participants were presented with a simple comprehension question after each
scenario, for example “Did you think about your answers later?”. Again, after all 20
scenarios had been presented, participants were required to recall each scenario on seeing the
title alone and rate four sentences according to their recollection of the initial description. As
before, the four sentences included a positive foil (e.g. “You think it was a good thing you did
not take the job”), a negative foil (e.g. “You think your poor reference must have made a bad
impression”), a positive target (e.g. “You think that your astute answers led to you being
offered the job”), and a negative target (e.g. “You think that your poor answers lost you the
job” ) interpretation.
Stressor. Stress was induced using an existing paradigm that has been developed and
tested (Hoppitt, Mackintosh, Randall, & Bristow, under review; Mackintosh, Mathews,
Eckstein, & Hoppitt, in prep). The method encompasses three difficult computerised
cognitive tasks and employs an anticipatory task evaluation. Participants were informed that
they would be completing three different computer tasks that measured cognitive ability or
intelligence (named Intelligence 1, Intelligence 2, and Intelligence 3). They were further
informed that the tasks were specifically designed so that an undergraduate considered to be
average in competence should be able to complete the tasks without too much difficulty and
that this had been confirmed by recent piloting of the tasks on undergraduates from a nearby

CHAPTER SEVEN
169
university (University of Cambridge). Participants were informed that performance scores
would be automatically transmitted to a laptop set up at the front of the room, which the
researcher would compile into an (non-anonymous) table that would be displayed on a large
screen following the task to allow participants to see how they compared against their fellow
peers in the room. Participants were also informed that, time allowing, those scoring at the
top and bottom of the performance table would be asked to reflect publicly on aspects of the
task they found particularly easy or challenging. Participants were given 10 minutes to
complete the tasks, with time warnings given at the half way point and when two minutes
were remaining.
In actual fact, the tasks did not measure intelligence per se, had not been piloted on
University of Cambridge undergraduates, were set to be very difficult, and no scores were
automatically transferred. These misleading instructions were given to encourage motivation
to a good performance, followed by feelings of failure and socio-evaluative threat. For the
first task (Intelligence 1), participants were given two minutes to memorise a series of three
digit numbers before being asked to recall them backwards, so 321 would need to be recalled
as 123. The second task (Intelligence 2) involved participants being given two minutes to
learn a series of 14 statements dictating rules governing fictional creatures, such “all phrups
eat soists” and “knanges are phrups”. Participants were then asked to identify a series of
correct phrases out of three options to accurately reflect these rules. For the third and final
task, participants were set a series of difficult anagrams to solve, e.g. “raobtomh
(bathroom)”. For each anagram, participants were given a 30 seconds countdown in the
corner of the screen before automatically moving on to the next one. This final task
(Intelligence 3) included a total of 51 anagrams, with the intention of preventing any
participant from completing the three tasks in the set 10 minutes to further induce feelings of
failure.

CHAPTER SEVEN
170
7.1.4 Procedure
Ethical approval was obtained from the NHS Research Ethics Committee. Study
sessions were run in groups of up to 11 participants on Anglia Ruskin University campus.
Each session started at 1pm on weekdays and weekends and took three hours to complete.
Participants were issued with an honorarium of either £20 or 3 research credits (for
psychology students). Participants were asked to refrain from eating, drinking (other than
water), and smoking for 30 minutes prior to the study, and to abstain from undertaking
vigorous exercise for 90 minutes prior to the start. On entry, participants were given
information sheets and verbally briefed on the study prior to signing consent forms. To start,
participants were taken through the process of giving a saliva sample, including information
on sample tracking, before giving practice sample. After this and each subsequent sample,
participants were given a cup of mineral water to rehydrate them and optimise successive
sample quality. Participants then completed the trait questionnaire pack (titled Questionnaire
Pack 1), which included the GHQ-28, TAI, STAI, and PSS-10. The first (non-practice)
sample was then given, during which participants completed the SACL and PANAS.
Participants then completed the CBM-I training (named Computer task 1). Participants
completed either a positive or a sham training exercise according to their participant number
which was assigned on entry to the study on a first come first served basis. All even
participant numbers received positive training, while all odd participant numbers received
sham training. Participants were given 45 minutes to complete this task, after which the
researcher moved the group on to give a second sample and second set of SACL and PANAS
scales. After this, participants completed an interpretive bias test (labelled Computer task 2).
Participants then completed the STAI-state and VAS prior to receiving instructions for and
completing the ‘Cognitive ability’ tasks (CATs). Following the 10 minute limit for the CATs,
participants were instructed to stop and switch off their computer screens before completing a

CHAPTER SEVEN
171
second set of STAI-state and VAS. Participants then gave their third sample and completed
the SACL and PANAS. At this point the researcher informed the group that there had been a
technical error meaning that not all data had been transferred successfully therefore, in
consideration of fairness, the performance evaluation stage would be skipped. While waiting
for time to elapse before the final two samples, participants sat and watched a Planet Earth
DVD (seasonal forests). After the fifth sample, participants were verbally debriefed and given
a written summary of the debrief form, both of which revealed all deception and detailed the
aims of the study. After this, participants were asked to sign a re-consent form, in
acknowledgement of the masked elements to the study when they initially gave consent.
Participants were finally thanked and recompensed for the study.
7.1.5 Data Analysis Plan
Data was explored to ensure it met the assumptions of parametric testing. Participant
characteristics were compared between groups to monitor any potential confounds. To test
the study hypotheses, repeated measures ANOVAs were conducted on the relevant dependant
variables (e.g. reported stress, cortisol concentration, etc) with time as a within-subjects
factor. In line with the findings from Hoppitt, Mackintosh, Randall, & Bristow (under
review), the influence of test anxiety was included in all analyses that tested the effects of the
stressor and the influence of CBM-I. Owing to a small subsample of participants who
underwent the stressful task (N = 20), test anxiety was originally considered only as a
covariate in Hoppitt et al.. By recruiting more participants and using a within-subjects design
in terms of the stressor task, the present study was able to subject the data to a median split to
produce a relative high and low test anxiety sample. This post-hoc split was entered into the
ANOVA as an independent variable with condition (positive or sham training) as the other
independent variable. Main effects of time are reported though not necessarily explored
where they were qualified by time x condition interactions. For ease of clarity, main effects

CHAPTER SEVEN
172
of group or test anxiety, time x test anxiety and group x test anxiety interactions, and three-
way (time x group x test anxiety) are largely not reported unless significant or relevant to the
point of note. Where appropriate, a priori and post-hoc testing was conducted using paired t-
tests with Bonferroni corrected alpha levels.

CHAPTER SEVEN
173
7.2 Results
7.2.1 Data Exploration
Ten participants’ data were removed from all analysis due to the participants not
completing the CBM-I training within the set 45-minute period. One additional participant’s
data was removed owing to them rushing through the computer tasks and questionnaires. Of
the 72 sets of data included in the analysis, 36 participants were in the positive training
condition and 36 participants were in the sham training condition.
Cortisol concentration and sAA secretion data were subjected to log transformation to
successfully normalise the distribution of the data. All analyses were conducted using logged
data, however graphical representation of the means and measures of variation are presented
using unlogged data.
7.2.2 Participant Characteristics
Separate univariate ANOVAs revealed no significant difference between participants
in the positive and sham training conditions with regards to their trait questionnaire measures
(see Table 18).

CHAPTER SEVEN
174
Table 18
Mean data for participant trait measures
Measure
Scale
Positive
training
Sham
training
F
value
p
value Mean SD Mean SD
Test anxiety TAI 38.56 13.22 42.89 14.28 1.79 .19
Trait anxiety STAI 37.31 9.47 37.24 10.21 .001 .97
Distress GHQ-28 46.44 8.75 45.51 10.64 .16 .69
Perceived stress PSS-10 16.23 5.99 15.37 6.44 .33 .57
7.2.3 Interpretive Bias
Data from the CBM-I training was not analysed other than for accuracy. Participants
ranged from 70.24 – 96.43% in their overall ability to correctly answer comprehension
questions (M = 85.37%, SD = 6.08). A univariate ANOVA identified a significant main effect
of condition allocation on accuracy of comprehension questions, F(1, 70) = 4.01, p < .05, ηp2
= .05, with participants allocated to positive training scoring significantly higher (M =
86.77%, SD = 6.30) relative to participants in the sham training condition (M = 83.96%, SD =
5.59).
An interpretive bias index (IBI) score was calculated from the interpretive bias test
data in the same manner as discussed in Study 4. First, paired t-tests were conducted to
distinguish whether participants successfully discriminated between target and foil sentences
during the recognition task. Results revealed that participants consistently rated target
positive items (M = 2.87, SD = .38) significantly higher with regards to their recollection of

CHAPTER SEVEN
175
how the sentence matched the original scenario relative to positive foil items (M = 1.85, SD =
.34), t(71) = -19.85, p < .001, d = 2.83. Participants similarly rated negative target items (M =
2.25, SD = .39) significantly higher in comparison to negative foil items (M = 1.49, SD =
.37), t(71) = -19.83, p < .001, d = 1.99. Negative target ratings of sentences were then
subtracted from positive target ratings of sentences to produce an overall IBI score. A higher
score indicated a more positive interpretive bias, with lower scores signifying a stronger
negative interpretive bias.
A univariate ANOVA was conducted on IBI scores, using condition as a within-
subjects variable, to determine whether training had been successful. As hypothesised, IBI
scores were significantly higher in the positive training group (M = .77, SD = .59) relative to
the sham training group (M = .48, SD = .46), F(1, 70) = 5.38, p = .02, ηp2 = .07. As
interpretive bias was measured after the CBM-I training, this result is taken to indicate that
training had been successful in improving interpretive bias (positive training) while not
affecting interpretive bias (sham training).
7.2.4 Psychological Response to Stressor and CBM-I
State anxiety. A 2 (condition: positive training, sham training) x 2 (test anxiety split:
high, low) x 2 (time of measurement: pre-stress, post-stress) repeated measures ANOVA
revealed a significant main effect of time, F(1, 49) = 93.73, p < .001, ηp2 = .66. State anxiety
was found to significantly increase from an average of 36.28 (SD = 8.84) to 47.60 (SD =
10.37). There was also a significant main effect of test anxiety, F(1, 49) = 8.44, p = .01, ηp2 =
.15, with high test-anxious individuals reporting significantly higher levels of state anxiety
(M = 45.52, SD = 9.28) relative to low text-anxious individuals (M = 38.83, SD = 8.15).
There was no significant main effect of group, F(1, 49) = 1.34, p = .25, ηp2 = .03, and no
interactions were found to be significant (all p values > .12).

CHAPTER SEVEN
176
1
2
3
4
5
6
7
8
9
Baseline Post-CBM Post-stressor Stressor
+20 minutes
Stressor
+ 30 minutes
Re
po
rte
d s
tre
ss (
SA
CL)
Reported stress. A 2 (condition) x 2 (test anxiety split) x 5 (time points: baseline,
post-CBM, post-stressor, stressor + 20 minutes, and stressor + 30 minutes) repeated measures
ANOVA showed a significant effect of time on stress (as measured through the SACL),
F(3.04, 200.67) = 44.20, p < .001, ηp2 = .40 (Greenhouse-Geisser). Paired t-tests were used
to investigate the significant time main effect (see Figure 15). There was no change in
reported stress between time points 1-2, t(71) = -.10, p = .92, d = .01. A significant increase
in stress was found between time points 2-3, t(71) = -8.94, p < .001, d = 1.16, followed by a
significant decrease between time points 3-4, t(71) = 9.45, p < .001, d = 1.16. A further trend
decrease in reported stress emerged between time points 4-5, t(71) = 2.02, p = .05, d =.17,
from an average of 2.61 (SD = 3.63) to 2.04 (SD = 3.06).
Figure 15. Mean (and SE) reported stress throughout the study (collapsed across conditions)
A significant main effect of test anxiety was also revealed, F(1, 66) = 44.20, p < .001,
ηp2 = .40, with high test anxious individuals reporting significantly more stress (M = 5.03, SD
= 4.16) than low test anxious individuals (M = 2.34, SD = 2.75). There was also a trend main
effect of group, F(1, 66) = 3.66, p = .06, ηp2 = .05, with participants who completed positive

CHAPTER SEVEN
177
training reporting more stress overall (M = 4.32, SD = 3.94) than participants who completed
sham training (M = 3.06, SD = 2.97).
There was no significant time x condition interaction, F(3.04, 200.67) = .38, p = .77,
ηp2 = .01, and no significant three-way interaction, F(3.04, 200.67) = .26, p = .86, ηp
2 = .004.
A trend time x test anxiety split interaction emerged, F(3.04, 200.67) = 2.31, p = .08, ηp2 =
.03. Exploration of this time x test anxiety trend was carried out by running repeated
measures ANOVAs on data from high and low test anxious participants separately. For both
high test-anxious (H-TA), F(3.28, 111.47) = 28.20, p < .001, ηp2 = .45, and low test-anxious
(L-TA) individuals, F(2.20, 74.81) = 20.19, p < .001, ηp2 = .37, a significant main effect of
time was identified. Paired t-tests showed no significant change in reported stress between
time points 1-2 for either high, t(34) = .48, p = .64, d = .09, or low, t(34) = -.92, p = .37, d =
.14, test anxious individuals. A significant increase in reported stress was found between time
points 2-3 for both sub samples, H-TA: t(34) = -7.48, p < .001, d = 1.44, L-TA: t(34) = -5.04,
p < .001, d = .95, followed by a significant decrease between samples 3-4, H-TA: t(34) =
7.36, p < .001, d = 1.29, L-TA: t(34) = 5.65, p < .001, d = 1.12. Participants low in test
anxiety showed no difference in reported stress from time points 4-5, t(34) = .36, p = .72, d =
.04, while high test anxious participants showed a trend decrease, t(34) = 2.09, p = .04, d =
.28 (see Figure 16). From Figure 16, and considering the significant main effect of test
anxiety, it seems that the trend interaction between time and test anxiety split emerged from
high test anxious individuals appearing to be slightly more responsive to the stressor relative
to low test anxious individuals. To support this claim statistically, univariate ANOVAs were
conducted with percentage change scores as the dependent variable and test anxiety split as
the between subjects variable. There was no main effect of test anxiety on stress change
scores between measures 1-2, 3-4, or 4-5 (all F values < 1). A trend main effect of test
anxiety was found for stress change between measures 2-3, F(1, 47) = 3.01, p = .09, ηp2 =

CHAPTER SEVEN
178
.06, with H-TA participants reporting a greater change (M = 3.69%, SD = 4.40) relative to L-
TA participants (M = 1.81, SD = 2.64).
Figure 16. Mean (and SE) reported stress throughout the study according to test anxiety score
Positive affect. A 2 (condition) x 2 (test anxiety split) x 5 (time points) repeated
measures ANOVA revealed a significant main effect of time on positive affect as measured
through the PANAS, F(2.84, 184.32) = 12.68, p < .001, ηp2 = .16 (Greenhouse-Geisser).
Paired t-tests were used to investigate the significant main effect. A significant decrease in
positive affect was found between time points 1-2, t(71) = 6.12, p < .001, d = .52, from an
average of 23.68 (SD = 6.87) to 20.24 (SD = 6.49). No significant change in positive affect
was found between time points 2-3, 3-4, or 4-5 (all p values > .09). No other main effects or
interactions were found to be significant (all p values > .15)
Negative affect. A 2 (condition) x 2 (test anxiety split) x 5 (time points) repeated
measures ANOVA revealed a significant main effect of time on negative affect as measured
0
2
4
6
8
10
12
Baseline Post-CBM Post-stressor Stressor
+20 minutes
Stressor
+ 30 minutes
Re
po
rte
d s
tre
ss (
SA
CL)
High test anxious
Low test anxious

CHAPTER SEVEN
179
through the PANAS, F(2.59, 168.59) = 20.95, p < .001, ηp2 = .24. Paired t-tests investigated
the significant main effect of time (see Figure 17), revealing no change between time points
1-2, t(71) = -.84, p = .40, d = .11. A significant rise in negative affect was identified between
time points 2-3, t(70) = -5.08, p < .001, d = .64, followed by a significant decrease between
time points 3-4, t(70) = 7.01, p < .001, d = .65, and 4-5, t(71) = 2.67, p = .01, d = .15.
Figure 17. Mean (and SE) negative affect throughout the study (collapsed across conditions)
A significant main effect of test anxiety was also revealed, F(1, 65) = 8.40, p = .01,
ηp2 = .11, with H-TA participants reporting significantly more negative affect (M = 13.78, SD
= 4.73) relative to L-TA individuals (M = 11.39, SD = 2.49). Further, a trend time x test
anxiety interaction was found, F(2.59, 168.59) = 2.31, p = .09, ηp2 = .03.9 No other main
effects or interactions were significant (all p values > .16).
Psychological response summary. State anxiety, reported stress and negative affect
all respond as hypothesised to the stressor, showing an acute increase. Reported stress and
negative affect appear to recover quickly from the response. Following a decrease after
completing CBM, there is no change in positive affect throughout the study. Participants who
9 Upon further investigation, this trend showed the same patterns as was found in the stress data. This trend is suggested to be caused by the significant main effect of group, hence further investigations are not reported.
10
11
12
13
14
15
16
17
Baseline Post-CBM Post-stressor Stressor
+20 minutes
Stressor
+ 30 minutes
Ne
ga
tiv
e a
ffe
ct (
PA
NA
S)

CHAPTER SEVEN
180
have high test anxiety reported significantly more anxiety, stress, and negative affect overall.
CBM-I training appeared to exert no influence to emotional responses to the stressor task.
7.2.5 Physiological Response to Stressor and CBM-I
Cortisol concentration. A 2 (condition: positive, sham training) x 2 (test anxiety
split: high, low) x 5 (time points: baseline, post-CBM, post-stressor, stressor + 20 minutes,
stressor + 30 minutes) repeated measures ANOVA was conducted with cortisol concentration
as the dependent variable. A significant time main effect was revealed (see Table 19), F(2.21,
121.75) = 59.65, p < .001, ηp2 = .52 (Greenhouse Geisser). Paired t-tests revealed a
significant decrease in cortisol between samples 1-2, t(64) = 10.75, p < .001, d = .66, and 2-3,
t(66) = 3.50, p = .001, d = .26, and a trend decrease between samples 4-5, t(63) = 1.99, p =
.05, d = .11. No change was observed between samples 3-4, t(64) = .11, p = .92, d = .01.
Table 19
Mean (µg/dL) and variance of cortisol concentration throughout the study
Baseline Post-CBM
Post-stressor
Stressor + 20 minutes
Stressor + 30 minutes
Mean
SD
.22
.19
.15
.09
.12
.06
.12
.06
.12
.06
No significant main effect of test anxiety was identified, F(1, 55) = .34, p = .56, ηp2 =
.01, though a trend condition main effect emerged, F(1, 55) = 3.01, p = .09, ηp2 = .05, with
participants in the sham training group showing slightly higher levels of overall cortisol (M =
.15µg/dL, SD = .07) compared with participants in the positive training group (M = .14µg/dL,
SD = .11). No significant time x condition interaction, F(2.21, 121.75) = .37, p = .71, ηp2 =

CHAPTER SEVEN
181
.01, or time x test anxiety split interaction, F(2.21, 121.75) = 1.81, p = .16, ηp2 = .03, was
identified, though a significant three-way time x condition x test anxiety interaction emerged,
F(2.21, 121.75) = 3.21, p = .04, ηp2 = .06 (see Figure 18).
Figure 18. Demonstrating the significant three-way interaction (time x condition x test
anxiety) for cortisol concentration.
To explore the three-way interaction, a series of 2 (condition) x 2 (test anxiety split) x
2 (time points) repeated measures ANOVAs were conducted with cortisol data comparing
time points 1-2, 2-3, 3-4, and 4-5 (separately) as the dependent variable (see Table 19 or
Figure 18 for a reminder of time points). A significant main effect of time was identified
between time points 1-2 (baseline – post-CBM), F(1, 59) = 151.79, p < .001, ηp2 = .72, which
0.07
0.12
0.17
0.22
0.27
0.32
Baseline Post-CBM Post-stressor Stressor + 20
minutes
Stressor + 30
minutes
Co
rtis
ol
con
cen
tra
tio
n (
µg
/dL)
Positive training / Low test anxious Positive training / High test anxious
Sham training / Low test anxious Sham training / High test anxious

CHAPTER SEVEN
182
was qualified by a significant three-way time x condition x test anxiety interaction, F(1, 59) =
12.79, p = .001, ηp2 = .18.
To explore the three-way interaction separate repeated measures ANOVAs were
conducted on high and low test anxious participants’ data individually, using condition (sham
training, positive training) as a between subjects factor and time point (1-2) as a within
subjects factor. For low test anxious individuals, there was a significant main effect of time
on cortisol concentration, F(1, 28) = 93.74, p < .001, ηp2 = .77, which was qualified by a
trend time x condition interaction, F(1, 28) = 3.05, p = .09, ηp2 = .10 (see Figure 19). Paired
t-tests showed a significant decrease in low test anxious participants who experienced both
positive, t(17) = 7.38, p < .001, d = .60, and sham training, t(11) = 6.17, p < .001, d = 1.64,
though Figure 19 seems to show a marginally steeper decrease for low test anxious
participants who receive sham training.
Figure 19. Mean change (and standard error) in cortisol concentration between time points 1-
2 for low test anxious participants.
0.1
0.15
0.2
0.25
0.3
Baseline Post-CBM
Co
rtis
ol
con
cen
tra
tio
n (
µg
/dL)
Positive training
Sham training

CHAPTER SEVEN
183
For high test anxious participants, a significant main effect of time on cortisol
concentration was found between time points 1-2, F(1, 31) = 61.00, p < .001, ηp2 = .66,
which was qualified by a significant time x condition, F(1, 31) = 10.90, p = .002, ηp2 = .26.
Paired t-tests revealed a significant decrease in cortisol for high test anxious individuals who
received either positive, t(11) = 7.77, p < .001, d = .66, or sham training, t(20) = 3.55, p =
.002, d = .45, though Figure 20 suggests a steeper decrease in cortisol in high test anxious
individuals who received positive training.
Figure 20. Mean change (and standard error) in cortisol concentration between time points 1-
2 for high test anxious participants
A significant main effect of time was identified between time points 2-3 (post-CBM –
post-stressor), F(1, 61) = 8.66, p = .01, ηp2 = .12, evidencing a decrease in cortisol from a
mean of .15µg/dL (SD = .11) to .13µg/dL (SD = .07). However, no significant main effect of
time was found between time points 3-4 (post-stressor – stressor + 20 minutes), F(1, 59) =
.02, p = .90, ηp2 < .001. No further significant main effects or interactions were found
between either of these time point comparisons (all p values > .15).
0.1
0.15
0.2
0.25
0.3
0.35
Baseline Post-CBM
Co
rtis
ol
con
cen
tra
tio
n (
µg
/dL)
Positive training
Sham training

CHAPTER SEVEN
184
A significant main effect of time was found between time points 4-5 (stressor + 20
minutes – stressor + 30 minutes), F(1, 58) = 5.77, p = .02, ηp2 = .09, which was qualified by
a significant three-way time x condition x test anxiety interaction, F(1, 58) = 5.85, p = .02,
ηp2 = .09. To explore this three-way interaction separate repeated measures ANOVA were
conducted on high or low test anxious participants’ data, using condition as a between-
subjects factor and time as a within-subjects factor.
For low test anxious participants, there was no significant main effect of time, F(1,
29) = 2.65, p = .12, ηp2 = .08, or condition, F(1, 29) = .80, p = .38, ηp
2 = .03, nor any
significant time x condition interaction, F(1, 29) = 2.37, p = .14, ηp2 = .08. For high test
anxious participants, a trend main effect of time on cortisol concentration was identified
between time points 4-5, F(1, 29) = 3.18, p = .09, ηp2 = .10, which was further qualified by a
trend time x condition interaction, F(1, 29) = 3.49, p = .07, ηp2 = .11. Post-hoc investigations
using paired t-tests support the visual interpretation (see Figure 21). High anxious
participants who received positive training show a trend decrease in cortisol concentration,
t(11) = 2.15, p = .06, d = .34 (Bonferroni corrected α = .03), whereas high anxious
participants who received sham training show no change in cortisol concentrations between
these time points, t(18) = -.07, p = .94, d = .01.

CHAPTER SEVEN
185
Figure 21. Mean change (and standard error) in cortisol concentration between time points 4-
5 for high test anxious participants
Cortisol summary. In support of the hypothesis, findings showed no significant main
effect of time in response to the stressor. In contrast to the hypothesis, no time x condition
interaction was observed, implying that CBM-I training had no effect on cortisol response to
the stressor. However, some interesting patterns emerge relating to condition assignment and
test anxiety. Participants high in test anxiety differed in their cortisol response between the
last two samples during the recovery phase, with the positive training group showing a
decrease in cortisol while the sham training group showed no change in cortisol.
Alpha amylase secretion. A 2 (condition: positive, sham training) x 2 (test anxiety
split: low, high) x 5 (time points: baseline, post-CBM, post-stressor, and 20 and 30 minutes
post-stressor) repeated measures ANOVA was conducted on sAA secretion data. A
significant main effect of time was identified, F(4, 188) = 3.38, p = .02, ηp2 = .07 (see Figure
22), which was qualified by a trend three-way time x condition x test anxiety interaction, F(4,
188) = 2.09, p = .08, ηp2 = .04.
0.07
0.09
0.11
0.13
0.15
Stressor
+ 20 minutes
Stressor
+ 30 minutes
Co
rtis
ol
con
cen
tra
tio
n (
µg
/dL)
Positive training
Sham training

CHAPTER SEVEN
186
Figure 22. Changes in sAA secretion over the study (collapsed across conditions)
To explore the significant main effect of time and trend three-way interaction, a series
of 2 (condition) x 2 (test anxiety split) x 2 (time points) repeated measures ANOVAs were
conducted with comparing time points 1-2 (baseline – post-CBM), 2-3 (post-CBM – post-
stressor), 3-4 (post-stressor – 20 minutes post-stressor), and 4-5 (20 – 30 minutes post-
stressor).
For time points 1-2, a significant main effect of time was found, F(1, 57) = 5.88, p =
.02, ηp2 = .10, showing a significant increase in sAA secretion from an average of
18.85U/min (SD = 24.57) to 23.54U/min (SD = 22.18). No other significant main effects or
interactions emerged (all p values > .10). No significant main effects or interactions were
identified between time points 2-3 (all p values > .10).
Between time points 3-4, a main effect of time was identified, F(1, 54) = 10.00, p =
.003, ηp2 = .16, showing a significant decrease in secretion from an average of 26.72U/min
(SD = 29.78) to 21.73U/min (SD = 25.59). No other significant main effects or interactions
were found (all p values > .30). Between time points 4-5, no significant main effects of time,
15
20
25
30
35
Baseline Post-CBM Post-stressor 20 minutes
post-stressor
30 minutes
post-stressor
Alp
ha
am
yla
se s
ecr
eti
on
(U
/min
)

CHAPTER SEVEN
187
condition, or test anxiety, nor any significant time x condition/test anxiety or condition x test
anxiety interactions were found (all p values > .14). However, a significant three-way
interaction between time, condition, and test anxiety split was identified, F(1, 51) = 5.43, p =
.02, ηp2 = .10. To further explore this, separate repeated measures ANOVAs were run on sAA
secretion data from low and high test anxious individuals using condition as a between-
subjects factor and time as a within-subjects factor. For high test anxious individuals, no
significant main effects or interactions were revealed (all p values > .56). For low test
anxious individuals, there was no significant main effect of time, F(1, 26) = .02, p = .89, ηp2
= .001, or condition, F(1, 26) = 1.14, p = .30, ηp2 = .04, though a significant time x condition
interaction was identified, F(1, 26) = 8.22, p = .01, ηp2 = .24. Paired t-tests revealed no
significant difference between the two time points for low test anxious individuals who
received sham training, t(10) = 1.51, p = .16, d = .33. However a significant increase in sAA
secretion was identified between the time points in low test anxious individuals who received
positive training, t(16) = -2.80, p = .013, d = .34, from an average of 14.24U/min (SD =
16.69) to 16.68U/min (SD = 13.78).
Alpha amylase secretion summary. No change in sAA secretion was observed
between samples 2-3 following the stressor, which supports the hypothesis. However no time
x condition interaction was revealed, which fails to support the hypothesis. These findings
suggest that CBM-I training has no effect on sAA response to stress. The secretion rate of
sAA significantly increased following CBM-I training and decreased 20 minutes after the
stressor. For low anxious individuals who had received positive CBM training, a further
significant increase was found between 20 and 30 minutes after the stressor.

CHAPTER SEVEN
188
7.3 Discussion
The hypothesis that positive CBM-I training would lead to reduced emotional and
physiological vulnerability to stress was largely not supported. Condition allocation (sham or
positive training) had no influence on psychological or physiological responses to the
imitation cognitive ability tasks. However, in line with the predicted response, there was a
trend for higher levels of cortisol and significantly greater levels of reported stress overall in
participants who received sham training as opposed to positive training.
Though not forming part of the initial hypothesis, the data suggests that the process of
completing a single session of CBM-I training influenced psychological state. Positive affect
was found to decrease significantly over the 45-minute training period. Cortisol was also
found to decrease during this time, while sAA was found to increase, however these
physiological patterns are likely due to the natural diurnal variations that would be expected
in the afternoon (Kirschbaum & Hellhammer, 1989; Nater, Rohleder, Schlotz, Ehlert, &
Kirschbaum, 2007). Condition allocation was not shown to interact with the decrease in
positive affect, suggesting the changes occurred in response to completing the task rather than
training content (i.e. positive or sham). This finding implies that completing CBM-I training
led to short-term negative psychological effects. However, no increases in negative affect or
stress were observed, suggesting that while positive mood might have been decreased,
negative mood was not increased. This is an important finding in terms of participants’
willingness to complete such training in a real life setting. In a pilot study, Brosan, Hoppitt,
Shelfer, Sillence, and Mackintosh (2011) collected information regarding the acceptability of
both CBM-A and CBM-I training procedures. CBM-A was perceived by some as “boring”,
while CBM-I was seen as more helpful in making participants (who were clinically anxious)
more aware of their negative thinking styles. However, participants in Brosan et al.’s study
were given prior information alerting them to the fact that the tasks were designed to

CHAPTER SEVEN
189
(positively) change their thinking styles. Therefore, compliance might possibly have been
greater in their sample (N = 12), as completion of the tasks had some implied personal
benefit. In the present study, however, participants were not informed that the tasks were
designed to modify cognitions, therefore they might have viewed it more similarly to the
CBM-A training (i.e. repetitive and without purpose). Taken together, these findings
demonstrate that participants appear to require some motivation to complete the tasks, either
through payment (present study) or perceived psychological benefits (Brosan et al.’s study),
though the momentary effects on mood can be quite different. Supposing CBM training is
considered boring, compliance regarding training frequency in a clinical setting is likely to be
significantly reduced in people who struggle to maintain motivation as a side-effect of their
condition (e.g. people suffering from depression). Therefore future research might look to
address these issues by making training sessions shorter or more varied.
The finding that CBM-I training failed to amend psychological responses to an acute
laboratory stressor is surprising given the amount of literature that has documented such a
response (e.g. Mackintosh, Mathews, Yiend, Ridgeway, & Cook, 2006; Yiend, Mackintosh,
& Mathews, 2005). However, it is important to note that the majority of previous studies
isolating such an effect have included a negative training condition whereas the current study
employed the use of sham training. Consequently, the differences between the two groups
might have been somewhat muted compared to two conditions that train in entirely opposite
directions. The use of sham training in preference to negative training was justified through
ethical considerations. Prior research has confirmed that negative training is successful in
training a more negative bias (e.g. Mathews & Mackintosh, 2000). As the enduring effects of
even a single session of CBM are being recognised (e.g. Mackintosh et al., 2006), it seems
ethically irresponsible to continue using negative training in research. In acknowledgement of
the absence of training effects being apparent when comparing positive with sham training,

CHAPTER SEVEN
190
future research might seek to resolve these ethical concerns in other manners. For example,
the use of negative training might be more acceptable assuming efforts are made to
extinguish any enduring effects (e.g. subsequent delivery of positive training).
Similar to the findings of Study 4, evidence emerged to suggest that interpretive bias
training might be linked more with how participants recover from acute episodes of stress,
rather than the extent of their initial response. However, in the current study these patterns
were dependent on trait levels of test anxiety. Participants who had high levels of test anxiety
and who completed positive CBM-I training were found to show a trend decrease in cortisol
between the final two samples. Alternatively, this decrease was absent from high anxious
participants in the sham training group and from all low anxious individuals. These findings
might be interpreted to suggest that positive training aided recovery from the stressor, but
only when participants reported high levels of test anxiety. At the same time, participants
with low levels of test anxiety who received positive training showed a significant increase in
sAA secretion between these final two samples. While sAA secretion was shown to recover
from the stressor between the previous two samples, this finding might still signal some
interference in recovery. Taken together, this suggests that high test anxious participants
recovered quicker following positive training while low test anxious individuals recovered
more successfully following sham training.
To date no study has investigated the physiological effects in response to stress
following interpretive bias training. The only published study that has investigated CBM-A
and the physiological stress response provides evidence to suggest that positively-trained
attentional biases lead to a reduced physiological reaction to stress (Dandeneau, Baldwin,
Baccus, Sakellaropoulo, & Pruessner, 2007). This ties in with the few published studies that
have looked at natural attentional biases and the physiological stress response (e.g. Fox,
Cahill, & Zougkou, 2010), who have also documented influences in terms of initial response.

CHAPTER SEVEN
191
However, while evidence from Study 4 and that presented here implicate interpretive biases
in the recovery stage following stress, it is not possible to state that attentional bias does not
additionally influence in this stage. Study 4 failed to find evidence of any influences of
attentional bias, however Fox et al. only monitored the initial response stage to stress without
including a recovery/follow-up measure. Further, it is possible to interpret Dandeneau et al.’s
results as evidence either for a reduced response or a quicker recovery (or both). Dandeneau
et al. took measurements of cortisol throughout the working day to assess any shift in general
levels of work stress. Their finding of reduced overall cortisol following CBM-A training
might therefore indicate either a reduced initial response to stressors or an improved
recovery. Consequently, either explanation would result in the observed overall lower levels
of cortisol. In terms of the method’s clinical potential, both helping to reduce the initial
propensity to engage with negative stimuli and encouraging effective recovery from instances
of stress should logically produce beneficial outcomes. Nevertheless, further research should
aim to provide a clearer understanding of the areas of influence in which bias training might
be effective.
An obvious limitation to the current study is the absence of any measure of
interpretive bias prior to the training. This was an intentional omission in light of the already
lengthy time commitment required from participants. A univariate ANOVA on IBI scores
showed that, following CBM-I training, participants in the positive training condition had a
significantly more positive interpretive bias compared to sham-trained participants. This was
taken to indicate that training had been successful, especially considering the finding of no
significant differences between conditions in trait measures of general or test specific anxiety.
However, it is recognised that this deduction can only ever be supposed and not conclusively
drawn without a baseline measure against which to compare. Therefore, while this
assumption is still held, a future study aiming to further explore the interpretations drawn

CHAPTER SEVEN
192
here might be advised to alter the design to incorporate a baseline bias measure. This might
reasonably lead to the study being conducted over a number of sessions to avoid fatigue
effects.
To summarise, the present study successfully adopted a stressful task to investigate
the influences of training an interpretive bias on the psychological and physiological stress
response. While no evidence emerged to support previous findings of CBM-I training
reducing emotional vulnerability to stress, there was further indication to support previous
suggestions that interpretive biases influence how efficiently people recover (on a
physiological scale) from stressful events. Further research is necessary to clarify interactions
that emerged implicating trait anxiety (specific to the test) in this relationship. Of practical
significance, research is also recommended to investigate methods of making the training
more enjoyable to optimise the chances of people opting to complete the tasks without
obvious forms of compensation.

CHAPTER EIGHT
193
8.0 CHAPTER EIGHT: STUDY SIX
Testing the immediate robustness of a single session of CBM training

CHAPTER EIGHT
194
Overview
Findings from Study 4 indicate a tentative link between an individual’s cognitive bias
and aspects of their physiological response to acute stress. Specifically, interpretive bias was
found to predict recovery of sAA secretion following participation in an online simulated live
web chat. Furthermore, Study 5 demonstrated the impact of training participants toward a
more positive bias on the physiological response to a stressor. Participants who received
positive CBM-I training showed trend lower levels of cortisol over the study relative to
participants who completed sham training. Further, an interaction between trait test anxiety
and training emerged. Participants with higher levels of test anxiety appeared to show
improved recovery from a stressful episode following positive CBM-I training. Alternatively,
low test anxious participants were argued to recover better following sham training. The
findings from these studies do appear to provide tentative evidence supporting the role of
cognitive bias in the physiological stress response. However, it is difficult to draw general
conclusions relating to the actual utility of CBM procedures in real life based on these
findings. For example, little can be said regarding the longevity of the training effects other
than to say that an individual’s response to a stressor appears to be influenced by training
when the stressor is presented immediately after training. A review of the literature suggests
that comparatively less attention has been given to researching factors, such as longevity,
relative to the amount of time spent exploring the potential of CBM in different populations
and situations. Given the apparent importance of cognitive bias in the stress response, this
study seeks to conclude the experimental research in this thesis by investigating the ease with
which interpretive and attentional biases are induced and their robustness in the face of
adversity.

CHAPTER EIGHT
195
Introduction
In 1986 MacLeod, Mathews, and Tata documented what we now consider to be the
characteristic inverse relationship between anxiety and bias, where participants who have a
more negative attentional bias (i.e. those who preferentially attend to threatening stimuli over
positive stimuli) typically have higher levels of anxiety than participants with a more neutral
or positive bias. Other pioneering studies were able to demonstrate that modifying either
attentional or interpretive biases had consequential effects on anxiety levels (e.g. Grey &
Mathews, 2000; MacLeod, Rutherford, Campbell, Ebsworthy, & Holker, 2002; Mathews,
Richards, & Eysenck, 1989). Following these influential initial studies, the focal point of
research in this area appears to have rapidly progressed onto more complex explorations,
such as investigating the effectiveness of CBM in a range of clinical disorders. For example,
we now know that CBM methods are effective in improving negative biases (by making them
more positive) in normal, high and clinically anxious samples (e.g. Amir, Weber, Beard,
Bomyea, & Taylor, 2008; See, MacLeod, & Bridle, 2009; Schmidt, Richey, Buckner, &
Timpano, 2009). Indeed, one study focusing on individuals with Generalised Anxiety
Disorder found that 50% of participants who had completed eight sessions of CBM-A over a
four week period no longer met the diagnostic criteria for the disorder, relative to 13% of
participants in the control condition (Amir, Beard, Burns, & Bomyea, 2009).
Research interests are also increasingly focusing on how modifying biases can change
individuals’ physiological responses to stress. For example, Dandeneau, Baldwin, Pruessner,
Baccus, and Sakellaropoulo (2007) showed how completion of an attentional modification
procedure once a day for five days resulted in decreased levels of cortisol in a group of
telemarketers, relative to those who completed a control task. Findings from work presented
in this thesis (Studies 4 and 5) additionally support the notion of a relationship between both
natural and trained biases on how individuals physiologically respond to stressful aspects of

CHAPTER EIGHT
196
their environment. Both studies, for example, provided evidence to suggest that interpretive
biases might influence physiological recovery success following a stressor, which seems
consistent with recent research investigating the role of bias training on the physiological
stress response (Baert, Casier, & De Raedt, 2011). Such findings are important both for their
theoretical and clinical significance, by enabling a better understanding of the effects of
natural and manipulated biases which, ultimately, might lead to the development of a clinical
tool. It seems, therefore, that the experimental designs and concepts are expanding at an
exponential rate in attempts to understand biases and explore the potential of associated
training techniques.
In the excitement of exploring the potential of these techniques, certain important
considerations relating to the validity and reliability of the methods appear to have either
been overlooked or only modestly investigated. For example, the method most commonly
used to test an interpretive bias, the recognition test, has only very recently been validated as
an appropriate manipulation check (Salemink & van den Hout, 2010a). As another example
of a basic yet necessary investigation, Yiend, Mackintosh, and Mathews (2005) only
relatively recently demonstrated how the effects of a single training session endure over a 24-
hour period. Mackintosh, Mathews, Yiend, Ridgeway, and Cook (2006) extended this by
finding that the effects of training were maintained despite changes between training and
testing phase contexts (testing room and modality of presentation). This was a critical finding
in furthering the technique’s clinical potential because it suggests that the effects of CBM
could generalise outside the laboratory. Furthermore these researchers showed how, on the
second day, preserved training effects were strong enough to influence responses to a stressor
task to a level that would be expected had the stressor been exposed immediately after initial
CBM training. The effects of multiple sessions of CBM have also been investigated, with

CHAPTER EIGHT
197
evidence suggesting that following four sessions of training the effects endure for one week
(Mathews, Ridgeway, Cook, & Yiend, 2007).
A further important point that appears to have been initially overlooked is whether
fluctuations in mood interferes with inferred training effects. It is surprising that this issue has
only recently been addressed, given that critics of the field commonly refer to this as a major
weakness of the area. Salemink and van den Hout (2010b) explored this question and found
interpretive bias modification to be independent to changes in mood. In support of this
conclusion, research that starts to identify physiological changes following CBM are also
increasingly able to rule out the presence of such demand effects in addition to obtaining a
better command of the breadth of the training’s promise.
These types of studies, while relatively basic and to some extent logically assumed,
remain necessary in order to justify the investment of resources into the development of CBM
as a readily accessible clinical tool. The current study aims to focus on a still largely
neglected issue; investigating the robustness of a single session of CBM training. This issue
is essential in order to assess the durability of training for methodological reasons, such as
how best to structure training sessions. Furthermore, the results of this study will also provide
insight into the potential longevity of the wide ranging effects of CBM training, such as how
long the protective effects (both psychologically and physiologically) might be evident for.
It is currently known that, for individuals suffering from Social Anxiety Disorder,
clinical improvements following attentional bias training are maintained at a 4-month follow
up (Schmidt et al., 2009). For unselected participants, it is known that the effects of a single
session of CBM can last at least 24 hours (Yiend et al., 2005). However, no direct attempts
have been made to extinguish the effects of training during the time between training and
testing a bias in these studies. It is therefore possible that the effects of training remain

CHAPTER EIGHT
198
apparent when tested at a later date because there have been few opportunities that challenge
the training during this interluding time. This is especially likely for Yiend et al.’s study, due
to the relatively short interval (24-hours) between training and testing a bias.
The current study will therefore expose a freshly trained bias to an equal amount of
untraining10 with the aim of determining how impervious newly trained biases are. Study 6a
will focus on attentional bias and Study 6b will focus on interpretive bias. For both
experiments, participants will complete three bias tests; one for a baseline measure, one
immediately after training, and one immediately after ‘untraining’. It is hypothesised, firstly,
that training will be effective in both experiments, which will be evidenced by a significant
increase in bias index scores (attentional or interpretive) from test 1 to test 2 indicating a
more positive bias. Secondly, the effects of training are predicted to generalise from training
material to new material, which will be evidenced by increases in positive bias index scores
in both old and new test stimuli at test 2. Thirdly, from the current literature that shows a
persistence of training effects up to 4 months following initial training, it is hypothesised that
untraining will be ineffective in extinguishing training effects, which will be evidenced by no
change in bias index scores (attentional or interpretive) for either stimuli type (old or new)
from test 2 to test 3.
10 It is acknowledged that this ‘untraining’ phase has a purpose of testing a freshly trained bias, rather than specifically aiming to extinguish a bias with directed counter training. For ease of expression, ‘untraining’ has been selected for reference to this stage.

CHAPTER EIGHT
199
8.1 STUDY 6A
8.1.1 Method
8.1.1.1 Design
This study utilised a repeated measures design, with one independent variable being
the time of CBM test (pre-training, post-training, and post-untraining) (see Figure 23). The
dependent variable was the participant’s reaction time to respond to targets presented behind
either negatively valenced or neutral words, which was condensed to a single attentional bias
index (ABI) score. To calculate ABI scores, median reaction time (in milliseconds) to
respond to probes behind positive words was subtracted from median reaction time to
respond to probes placed behind negative words. The resulting index score provided a
measure of attentional bias that represented a continuous variable, with a more positive score
indicating a more positive bias and vice versa. This method was adapted from Macleod et al.
(1986), and is a common technique used in more recent research.
8.1.1.2 Participants
Participants (N = 39; 28 females) consisted of staff and students at the University of
East Anglia, who were recruited through bulletin email advertisements, departmental and
university-wide website advertisements, and study posters placed across the campus. The
sample was aged between 18 and 60 and mean trait anxiety levels of the sample was 44.32
(SD = 10.12).

CHAPTER EIGHT
200
8.1.1.3 Materials
CBM-A test/train program. The CBM-A test/train program was carried out on a
Windows computer with the aid of E-Prime software (Schneider, Eschman, & Zuccolotto,
2002). The program consisted of (a) an initial attentional bias test (a visual probe task;
Macleod, Mathews, & Tata, 1986), followed by (b) a positive attentional bias training phase
(adapted from MacLeod et al., 2002), (c) a second bias test, (d) an ‘untraining’ phase, and (e)
a final bias test. In its entirety, the program took approximately 30 minutes to complete. Each
bias test consisted of 96 trials, whilst training and untraining phases consisted of 192 trials
each. There were six scheduled breaks throughout the program, the length of which was
determined by the participant.
Trait and mood-based questionnaires 1
Attentional bias test 2
Attentional bias test 1
Bias extinguishing phase
All integrated into one program
Positive CBM-A training
Attentional bias test 3
Trait and mood-based questionnaires 2
Figure 23. Overview of Study 6A’s experimental design

CHAPTER EIGHT
201
For each trial participants had to respond to a target on a computer screen.
Participants were initially presented with a fixation point in the centre of the screen, a “+”
symbol, which then disappeared and was replaced by two words, one above and one below
the location of the original fixation point. One of the words was always semantically
neutral/positive whilst the other was always negative, although the positioning of the two
words (either above or below the fixation point) was randomly selected by E-Prime. Both
words disappeared after 500ms and either one or two dots (the target) appeared in the place of
one of the words. Participants were required to identify whether there were one (“.”) or two
(“..”) dots present by pressing the z key or the m key on the keyboard, which were labelled as
“1” and “2” respectively. For the bias tests and untraining trials the dots were positioned
behind the positive and the negative words with equal frequency. However for the training
trials the dots were always positioned behind the neutral/positive word.
Each CBM test/train program was counterbalanced using four word lists that were
matched in terms of emotionality rating. Each list contained 12 words. Word lists were
rotated so that every word list was used both to train and untrain a bias and test a bias for
different participants. This counterbalancing technique completed a full rotation after every
eighth participant. Participants were assigned numbers according to their entry to the study on
a first come first served basis. This number determined which CBM test/train program the
participant would be presented with according to the counterbalancing schedule described
above. The computer program started with test one, for which participants were presented
with 100% unseen word pairs. This was followed by the training phase, which was made up
of words used in the first test (50%) and words from a new unseen list (50%). The second test
then consisted of half of the word pairs from test 1 and half words from a so-far unseen list.
The untraining phase used exactly the same words as in the training phase but in a different

CHAPTER EIGHT
202
order. Finally, test 3 was similar to test 2, with the same 50% of words sourced from test 1
and half unseen words.
Questionnaires. Both before and after completing the CBM test/train computer
program, participants completed the State Trait Anxiety Inventory (STAI; Spielberger,
Gorsuch, Lushene, Vagg, & Jacobs, 1983), and the Positive and Negative Affect Scale
(PANAS; Watson et al., 1988). Both of these measures are described in Studies 1 and 2
respectively.
8.1.1.4 Procedure
Ethical approval was obtained from the School of Social Work and Psychology Ethics
Committee at the University of East Anglia. Participants were paid £6 to recompense their
time. Each session was run in groups of up to 15 participants in a computer laboratory on
campus, where each participant could sit at an individual computer desk. Participants were
welcomed into the study and issued with an information sheet which they were asked to read
through. Once any questions were answered, and a consent form signed, the researcher read
through an outline of the study in view of the fact that, once started, participants would most
likely work through the session at different paces. Participants were asked to start by
completing the first three questionnaires in their booklet, before completing the computer
task. Participants were told that the computer task consisted of written instructions and a few
practice trials before the main task, and were informed of the probable time taken to complete
the task in total. After completing the computer task, participants were asked to complete the
final three questionnaires and then alert the researcher that they had finished the study. The
researcher then collected their paperwork and issued them with a debriefing sheet and £6
compensation for their time and effort. Participants were permitted to leave the room once
they had finished, with overall session time ranging from between 35 and 45 minutes.

CHAPTER EIGHT
203
8.1.1.5 Data Analysis Plan
Data was explored to check it met the assumptions for parametric testing. Repeated
measures ANOVAs were used to monitor changes in mood throughout the study. To test the
study hypothesis, a series of repeated measures ANOVAs were conducted on bias test index
data. Post-hoc testing was carried out using paired t-tests with Bonferroni correction where
appropriate.

CHAPTER EIGHT
204
8.1.2 Results
8.1.2.1 Participant Characteristics
Neither trait, F(1, 35) = 1.32, p = .26, ηp2 = .04, nor state anxiety, F(1, 32) = .13, p =
.73, ηp2 < .01, was found to change throughout the study. Negative affect was also found not
to change significantly, F(1, 38) = 1.08, p = .31, ηp2 = .03. However positive affect was found
to significantly decrease over time, F(1, 38) = 48.83, p < .001, ηp2 = .56 (see Table 20).
Table 20
Descriptive data for participants across the study
Time 1 Time 2
Mean SD Mean SD
Trait anxiety
State anxiety
Positive affect
Negative affect
44.22
37.15
30.18
14.49
10.26
10.49
6.31
5.51
43.69
37.67
25.49
13.85
11.33
8.29
8.59
3.54
8.1.2.2 Data Cleaning
Individual trials for which participants failed to correctly identify the probe were
removed from analysis (3.77% total data: test 1 = 4.27%, test 2 = 3.22%, test 3 = 3.81%), as
were trials with a reaction time of less than 200 milliseconds or greater than 2000
milliseconds (a further 0.20% total data: test 1 = 0.28%, test 2 = 0.55%, test 3 = 0.28%) in
line with previous research (e.g. MacLeod et al., 2002; Koster, Crombez, Verschuere, & De
Houwer, 2004). Overall, this meant 3.97% of the total data was removed from analysis (test
1: 4.54%, test 2: 3.28%, test 3: 4.08%).

CHAPTER EIGHT
205
8.1.2.3 Training Effects
A one-way repeated measures ANOVA was run with time (test 1: pre-training using
ABI scores from all words; test 2: post-training using ABI scores from ‘old’ words11 only;
test 3: post-untraining using ABI scores from old words only) as a within subjects variable.
There was no significant main effect of time, F(2, 76) = .58, p = .57, ηp2 = .02, thus
suggesting the training was ineffective in improving ABI scores (see Table 21). A repeated
measures ANOVA was conducted with time (test 1: pre-training, all words; test 2: post-
training, ‘new’ words; test 3: post-untraining, new words) as a within subjects factor to check
whether training had been effective in improving ABI scores for previously unseen word
pairs. Again, no significant main effect of time was found, F(2, 76) = .53, p = .59, ηp2 = .01.
This second finding is logical, given that training was found to be unsuccessful in making
participants quicker to respond to probes that are placed behind positive words (which would
be indicated by a higher positive ABI score) for ‘old’ words, that were used during test 1 and
training. As this indicates that the training was ineffective, it would therefore be unlikely that
effects of training would be seen to generalise to ‘new’ word pairs that had not previously
been used in test or training trials.
11‘Old’ word pairs are words that have been presented to the participants before during training/untraining. ‘New’ words will forthwith refer to word pairs that have not previously appeared in the training/untraining and, as such, are novel to the participant. ‘All’ words will forthwith refer to a combination of ‘new’ and ‘old’ words within a word list.

CHAPTER EIGHT
206
Table 21
Mean (and SD) Attentional Bias Index scores for Tests 1, 2, and 3
Test 1 Test 2 Test 3
All word pairs Mean
SD
-4.64
17.73
-2.19
23.86
.53
19.15
Old word pairs Mean
SD
-0.71
32.20
2.62
33.65
New word pairs Mean
SD
-9.71
51.26
-1.95
21.91
Note. Lower numbers indicate a more negative bias and higher numbers indicate a more
positive bias.
In a recent study, Amir, Taylor, and Donohue (2011) found that baseline measures of
attention bias were predictive of how receptive individuals were to an attention modification
program. Participants who started with a more negative attention bias were found to be more
responsive to training and were found to show better improvements in generalised social
phobia symptomology. For this reason, it was decided to further look at the range of baseline
(test 1: pre-training) bias scores before drawing any firm conclusions regarding the efficacy
of CBM-A training.
8.1.2.4 Post-hoc Group Allocation
In the sample as a whole, bias scores ranged from -40.5 to 36.5 with a median score of
-4.50 (M = -4.64, SD = 17.73). Due to the broad range of natural ABI scores, and in light of
Amir et al.’s (2011) finding, it was decided to retrospectively divide participants into positive
and negative bias conditions based on a median split. Following this division, 20 participants

CHAPTER EIGHT
207
were placed in the negative bias condition and 19 participants were placed in the positive bias
condition12.
There was no difference between the two groups in terms of trait anxiety, F(1, 38) =
.23, p = .64, ηp2 = .01, positive affect, F(1, 39) = 1.30, p = .26, ηp
2 = .03, or negative affect,
F(1, 39) = .59, p = .45, ηp2 = .02, on entry to the study. There was also found to be no
influence of condition allocation on change in these variables throughout the study (all p
values > .13). Participants with a negative bias were, however, found to have significantly
higher levels of state anxiety on entrance to the study, F(1, 35) = 5.85, p = .02, ηp2 = .15. This
was considered not to warrant cause for concern in light of the fact (as mentioned previously)
that there was no change in state anxiety throughout the study, F(1, 31) = .10, p = .75, ηp2 =
.003, and no significant interaction between the two conditions and state anxiety throughout
the study, F(1, 31) = .10, p = .75, ηp2 = .003.
Effect and robustness of training. A 2 (group: positive, negative starting bias) x 3
(test 1: pre-training using all words; test 2: post-training using old words [previously used in
test/training/untraining] only; test 3: post-untraining using old words) repeated measures
ANOVA was conducted to determine whether post-hoc group allocation influenced training
success. Whilst no main effect was identified in overall bias change over time, F(2, 74) = .56,
p = .57, ηp2 = .02, a significant interaction between group (whether participants started with a
more positive or a negative ABI score) and time was found, F(2, 74) = 5.24, p = .007, ηp2 =
.12.
For participants starting with a positive bias, post-hoc testing in the form of paired t-
tests was conducted between tests 1-2, 2-3, and 1-3. Comparison of tests 1-2 examined
whether training had been effective, while comparison of tests 2-3 and 1-3 investigated
12 It is acknowledged that this ‘positive’ and ‘negative’ starting bias is specifically relative to the overall range of the group, rather than a generic classification.

CHAPTER EIGHT
208
whether any effects of training endured the period of untraining. No significant change in
ABI scores was found between tests 1-2, 2-3, or 1-3 for old (previously exposed), new (not
previously used) words, or all (old and new) words (all p values > .10). However, a trend
level of significance was observed between tests 1-2 when looking at all words, t(18) = 2.36,
p = .03, d = .79 (Bonferroni corrected α = .017). As illustrated in Figure 24, and in line with
Amir et al.’s (2011) findings, this trend appears to show a less positive and more negative
bias following the positive CBM-A training.
Figure 24. Mean change (and SE) in ABI score in participants starting with a positive bias
The same series of paired t-tests was conducted on ABI score data from participants
who entered the study with a negative bias. In this sample, training was found to be
successful in inducing a more positive bias when comparing all words at test 1 with old
words at test 2, t(19) = -3.44, p = .003, d = 1.19 (Bonferroni corrected α = .0167), improving
mean ABI scores from -18.45 (SD = 11.06) to 3.65 (SD = 23.78). The same effect was also
evident when looking at all words at test 1 versus all words at test 2 t(19) = -4.10, p = .001, d
= 1.40, improving mean ABI scores from -18.45 (SD = 11.06) to 2.40 (SD = 17.92). This
finding suggests that, considered together, training appears to successfully generalise onto
-30
-25
-20
-15
-10
-5
0
5
10
15
Test 1 Test 2 Test 3
Att
en
tio
na
l B
ias
Ind
ex
Sco
re
All words
Old words
New words

CHAPTER EIGHT
209
both old and new word pairs. The difference between all and new words at tests 1-2 was only
found to approach significance in consideration of the Bonferroni correction, t(19) = -2.23, p
= .038, d = .71, which implies that the training effects were stronger for word pairs that
participants had been previously exposed to relative to novel word pairs. However, when
comparing ABI scores using all-old, all-new, and all-all word pairs at tests 1-3, a significant
difference was found between all comparisons (all p values < .016). Furthermore, the lack of
any significant change between any of the three word type combinations from tests 2-3 (all p
values > .26) suggests that such improvements in ABI scores are further maintained at test 3
and so appear to survive untraining (see Figure 25).
Figure 25. Mean change (and SE) in ABI score in participants starting with a negative bias
Summary
When considered as one group, there was no effect of CBM-A training. This was
counter to what was hypothesised. However, once retrospectively divided according to a
median split of entering ABI scores, CBM-A training had the hypothesised significantly
positive effect on participants who started with a more negative bias, which was maintained
-30
-25
-20
-15
-10
-5
0
5
10
15
Test 1 Test 2 Test 3
Att
en
tio
na
l B
ias
Ind
ex
Sco
re
All words
Old words
New words

CHAPTER EIGHT
210
after untraining. Alternatively, and in contrast to the hypothesis, participants starting with a
more positive bias showed no CBM-A training effect.

CHAPTER EIGHT
211
8.2 STUDY 6B
8.2.1 Method
8.2.1.1 Design
This study employed a repeated measures design as all participants completed the
same test/train procedure (see Figure 26). Participants completed three CBM-I tests
throughout the session, pre-training, post-training, and post-untraining (independent
variable). The dependent variable was the reaction time taken to solve negatively valenced or
neutral associate word fragments, which was condensed into a single interpretive bias index
(IBI) score. This was calculated in the same manner as for attentional bias index in Study 6a,
by subtracting reaction time taken by participants to indicate they could solve the positive
word fragment from that taken to respond to negative word fragments in the same respect.
For the resulting IBI score, a larger positive number represents a stronger positive bias and a
lower negative number represents a stronger negative bias.
8.2.1.2 Participants
Forty participants, composed of staff and students at the University of East Anglia,
were recruited through the same techniques as used in Study 6a. All participants (27 females)
were aged between 18 and 60. Participants entered the study with levels of trait anxiety
averaging 33.03 (SD = 9.25).

CHAPTER EIGHT
212
8.2.1.3 Materials
CBM-I test/train program. As in Study 6a, the program was delivered with the aid
of E-Prime software (Schneider, Eschman, & Zuccolotto, 2002) and consisted of (a) a
baseline interpretive bias test (adapted from Grey & Mathews, 2000, using words from
French & Richards, 1992) followed by (b) a positive interpretive bias training phase, (c) a
second test, (d) untraining phase, and (e) final test. In total, participants took approximately
30 minutes to complete the program. Each bias test consisted of 32 trials, while training and
untraining consisted of 64 trials, and the program consisted of several scheduled breaks.
For each trial, participants had to solve a word fragment that appeared after a clue
word on the computer screen. Participants were instructed to use the clue word to help them
Figure 26. Overview of Study 6B’s experimental design
Trait and mood-based questionnaires 1
Interpretive bias test 2
Interpretive bias test 1
Bias extinguishing phase
All integrated into one program
Positive CBM-I training
Interpretive bias test 3
Trait and mood-based questionnaires 2

CHAPTER EIGHT
213
solve the word fragment. Each clue word was an emotional homograph; a word that has
multiple meanings depending on the context within which it is used. All homographs were
selected for having both strong neutral and an alternative strong negative interpretation. For
example, the word “arms” might refer to the upper body limb (neutral) or to the process of
equipping a person with weapons (negative). The clue homograph remained on screen whilst
participants tried to solve the word fragment. Participants were told the clue word was
designed to help them resolve the word fragment, though were not explicitly informed that all
clue words were homographs. Participants were required to press the spacebar on the
keyboard once they had resolved the word fragment, and were then instructed to locate and
press the letter key that represented the first missing letter of the word fragment. For bias
tests and untraining, positive and negative interpretations of homograph clue words were
drawn on an equal amount of times. However, for positive bias training, the word fragment
was consistently resolved into the positive associated meaning.
Each test/train program was composed of six word lists, each with 16 words that
additionally had four possible positive and four possible negative associated word fragments,
so that all word lists were used both as training and testing material. Each word list was
matched in terms of emotionality ratings and word lists were counterbalanced across
participants. As with Study 6a, participants were assigned numbers (which determined their
counterbalanced rotation) on a first come first served basis.
For each participant, the first test was composed using 100% unseen clue words
drawn from two of the six word lists. The positive training phase used 50% old (previously
seen) clue words and 50% new words from two more word lists. The second bias test used
50% clue words from test 1 and 50% previously unseen words from the fifth list. Untraining
used the same clue words that were used in positive training, though this time drawing on
both positive and negative associations of the homograph. Finally, the third test used the

CHAPTER EIGHT
214
same 50% clue words that were used in the first two tests, and 50% new clue words from a
final word list. Where a clue word was used more than once in the different phases of the
program (for example, in tests 1, 2, and 3) different associate word fragments were used each
time that were not necessarily of the same valence as on the previous occasion.
Questionnaires. As in Study 6a, participants completed the STAI and the PANAS
both before and after completing the CBM test/train program. Further details on these scales
can be found in Studies 1 and 2 respectively.
8.2.1.4 Procedure
Ethical approval was obtained from the School of Social Work and Psychology Ethics
Committee at the University of East Anglia. Participants were recompensed with £6 for their
time and effort. The procedure was primarily the same as in Study 6a, with the exception that
the interpretive CBM test/train program being used in place of the program aimed at testing
and training an attentional cognitive bias. As with Study 6a, participants were able to leave
once they had finished the set procedure, which was typically after 35 – 45 minutes.
8.2.1.5 Data Analysis Plan
Data was explored and analysed in the same manner as in Study 6a.

CHAPTER EIGHT
215
8.2.2 Results
8.2.2.1 Participant Characteristics
As a group, state anxiety increased significantly throughout the study, F(1, 38) = 5.10,
p = .03, ηp2 = .12 (see Table 22). Positive affect significantly decreased over time, F(1, 39) =
18.12, p < .001, ηp2 = .32. Neither trait anxiety nor negative affect changed significantly over
the duration of the study (both p values >.20).
Table 22
Descriptive data for participants across the study
Measure 1 Measure 2
Mean SD Mean SD
Trait anxiety
State anxiety
Positive affect
Negative affect
40.89
33.03
32.50
13.45
9.33
9.25
7.40
3.35
40.21
35.80
29.25
13.08
9.73
9.03
8.60
3.06
8.2.2.2 Data Cleaning
Prior to the calculation of IBI scores, incorrect trials were removed from the analysis
(comprising 15.5% data: 17.8% from test 1, 17.5% from test 2, and 11.2% from test 3).
Filters were set on the remaining data to remove extraneous data, which consisted of trials
taking less than 200 milliseconds (0.5% data: 1.0% from test 1, 0.4% from test 2, and 0.3%
from test 3) or more than 6000 milliseconds (a further 1.9% data: 2.8% from test 1, 1.8%
from test 2, and 1.1% from test 3) in accordance with similar action taken by Grey and

CHAPTER EIGHT
216
Mathews (2000). Overall, 17.5% data was removed due to the aforementioned reasons,
comprising 20.9% from test 1, 19.3% from test 2, and 12.3% from test 3.
8.2.2.3 Training Effects
To test the efficacy of training, a repeated measures ANOVA was run using time of
interpretive bias test (test 1: pre-training using all homographs; test 2: post-training using
previously seen ‘old’ homographs13; test 3: post-untraining using old homographs) as a
within subjects factor. A significant main effect of time was found, F(2, 78) = 16.03, p <
.001, ηp2 = .29, which indicated that training might have been effective in training a more
positive bias.
Paired t-tests were carried out to further investigate the main effect. As can be seen
from Table 23, looking at comparisons between tests 1 and 2, training appeared effective
when comparing either all homographs or old homographs at test 2 but not when using new
homographs at test 2. This suggests that, while training is effective, the effects have not
completely generalised to new stimuli. Comparing tests 2-3, when looking at new
homographs for both tests there is no significant change, suggesting that training effects
remain absent in these homographs. Significant decreases in IBI scores are evident when
looking at either all-all or old-old homographs for tests 2-3, which implies that the effects of
training did not endure untraining. This is supported by the fact that comparisons between IBI
scores at test 1 (all homographs) and tests 3 (all, old, or new homographs) show no
significant difference (see Figure 27).
13 As with Study 6a, ‘old’ homographs refers to those that have previously been used in tests or training/untraining, ‘new’ homographs refers to those that have not been used in previous tests or training/untraining, and ‘all’ refers to both ‘old’ and ‘new’ combined.

CHAPTER EIGHT
217
Table 23
The difference between IBI scores over time according to homograph familiarity
Test 2 (post-training) Test 3 (post-untraining)
All Old New All Old New
t p t p t p t p t p t P
Test 1
Test 3
All
All
Old
New
-3.41
3.82
.002
<.001
-5.16
3.78
<.001
.001
-.60
2.26
.55
.03
.11 .91 -1.80 .08 1.61 .12
Note. All, Old, and New refers to the word lists that the homographs originated from.
Bonferroni corrected α = .017.
Figure 27. Mean change (and SE) in IBI scores in all participants
-400
-300
-200
-100
0
100
200
300
400
500
Test 1 Test 2 Test 3
Inte
rpre
tiv
e B
ias
Ind
ex
Sco
re
All homographs
Old homographs
New homographs

CHAPTER EIGHT
218
8.2.2.4 Post-hoc Group Allocation
In an attempt to replicate the results from Study 6a using attentional bias training, a
decision was made to split participants retrospectively into conditions based on their starting
bias; those starting with a more positive bias (any score above the median of -14.56) and
those starting with a more negative bias (any score under -14.56). There was no difference
between the two conditions in terms of entry state anxiety, F(1, 37) = .18, p = .67, ηp2 = .01,
trait anxiety, F(1, 37) = .07, p = .80, ηp2 < .01, positive affect, F(1, 38) = 1.05, p = .31, ηp
2 =
.03, or negative affect, F(1, 38) = 1.29, p = .26, ηp2 = .03. There was no significant interaction
between condition allocation and change in state anxiety (p = .23) or negative affect (p = .94).
However the interactions were approaching significance for change in trait anxiety (p = .08)
and positive affect (p = .06). Further analysis revealed no significant change in trait anxiety
for participants starting with a negative or positive IBI score (both p values > .12). For
participants starting with a positive bias, positive affect significantly decreased from a mean
of 33.70 (SD = 7.50) to 29.00 (SD = 8.98), F(1, 19) = 17.70, p <.001, ηp2 = .48. There was no
change in positive affect for participants starting with a negative bias, F(1, 19) = 3.51, p =
.08, ηp2 = .16.
Training effects following group allocation. A 2 (between-subjects factor; group:
more positive starting bias or more negative starting bias) x 3 (within-subjects factor; time of
CBM-I test: pre-training using all homographs, post-training using old homographs, and post-
untraining using old homographs) mixed model ANOVA was conducted. As before, there
was a significant main effect of time on change in IBI score14, F(2, 76) = 10.68, p <.001, ηp2
= .23. A significant time x group interaction was also identified, F(2, 76) = 13.27, p <.001,
14 Main effects are not further discussed here as they remain the same as before, see ‘Training effects’ subsection of this results section.

CHAPTER EIGHT
219
ηp2 = .26. The same statistical tests were run using new homographs at tests 2 and 3, and all
homographs at tests 2 and 3, with the same results (all p values <.01).
For participants starting with a positive bias, further investigation in the form of
paired t-tests revealed no significant change in IBI scores between test 1 and 2, when
focusing on all, new, or old homographs at test 2 (all p values > .14). A significant decrease
in IBI score was identified from tests 2 – 3 when focused on ‘all’ homographs, t(19) = 3.33, p
= .004, d = .88 (Bonferroni corrected α = .017), and old homographs, t(19) = 3.35, p = .003,
d = .94. This suggests that the positive CBM-I training led to participants showing a
reduction in IBI scores, indicating there were adverse effects of training. When focusing on
the difference in IBI scores on new homographs at test 2-3, the corrected significance level
was not reached, t(19) = 2.32, p = .03, d = .54. A significant decrease was also identified
when comparing IBI scores obtained at test 1 with those obtained at test 3 for every word list
(all p values < .017; see Figure 28).
Figure 28. Mean IBI score change (and SE) in participants starting with a positive bias
-400
-300
-200
-100
0
100
200
300
400
500
Test 1 Test 2 Test 3
Inte
rpre
tiv
e B
ias
Ind
ex
Sco
re
All homographs
Old homographs
New homographs

CHAPTER EIGHT
220
Alternatively, for participants starting with a negative bias, further analysis revealed a
significant increase in IBI score from tests 1-2 when looking at old, t(19) = -6.89, p < .001, d
= 1.94, new, t(19) = -2.66, p = .016, d = .96, or all, t(19) = -6.99, p < .001, d = 2.17,
homographs at test 2. This indicated that training had the expected effect of improving IBI
scores. There was no significant change between any of the word lists from test 2 – 3 (all p
values > .05). A significant improvement in IBI scores at test 3 compared with test 1 for old
homographs, t(19) = -6.12, p < .001, d = 2.16, and ‘all’ homographs, t(19) = -3.31, p = .004,
d = 1.20 was found. However no change was observed between the two tests for new
homographs, t(19) = -.90, p = .38, d = .31 (see Figure 29).
Figure 29. Mean IBI score change (and SE) in participants starting with a negative bias
Summary
When considered as one group, training appeared to be effective when looking at all
or old homographs at test 2. However there were no training effects for new homographs at
test 2, suggesting that the training had not generalised fully. Further, the training effects for
all and old homographs appeared to extinguish following untraining. A post-hoc split
according to starting interpretive bias (more positive or more negative) revealed some
-400
-300
-200
-100
0
100
200
300
400
500
Test 1 Test 2 Test 3
Inte
rpre
tiv
e B
ias
Ind
ex
Sco
re
All homographs
Old homographs
New homographs

CHAPTER EIGHT
221
potential negative effects of training when participants started with a positive bias.
Participants starting with a negative bias, alternatively, appeared to benefit from training with
the effects enduring untraining.

CHAPTER EIGHT
222
8.3 Discussion
This study sought to identify whether an acute period of ‘untraining’, that is, a series
of trials that mimicked training in structure and length but had no contingency between the
positive emotive word (CBM-A) or homograph interpretation (CBM-I) and the target (CBM-
A: dot probe; CBM-I: associated word fragment), had any effect on a freshly positive-trained
bias. For attentional bias, initial analysis suggested that the hypothesis was not supported.
Results indicated that training had been ineffective, as there was no increase in ABI scores
either on trials that included word pairs that had been previously seen (old) or those that were
new (new). In consideration of findings from a recent study suggesting that an individual’s
initial bias was able to moderate their receptiveness to training (Amir, Taylor, & Donohue,
2011), the data was subjected to a post-hoc median split.
In line with Amir et al. (2011), CBM-A training was found to be ineffective in
participants who had started with a stronger positive bias relative to the group. Further,
indications from the mean and a trend effect suggested that training was starting to have
adverse effects, as ABI scores were lower at the second (post-training) attentional bias test in
this sub-group. Alternatively, participants who had a relative negative starting bias showed
significant increases in ABI scores between tests 1 and 2, and no change between tests 2 and
3, which is taken to signify that training was effective and that the effects endured untraining.
When considered as one group, participants who underwent CBM-I training did
partially appear to show predicted effects of training, as interpretive bias index scores
significantly increased from tests 1 – 2 when looking at homographs that participants had
been previously exposed to (old) or all homographs (all) at test 2. There were no significant
effects of training when looking solely at homographs that were new to the participant at test
2 (new), suggesting that the effects were not strong enough to generalise to new material.

CHAPTER EIGHT
223
Further, the training effects found in old and all homographs at test 2 appeared to be
extinguished by untraining by test 3.
Again exploring notions stemming from Amir et al.’s (2011) findings, the sample
from experiment 6b was also subjected to a median split based on starting bias. Results
supported findings from Study 6a, as participants starting with a (relative) negative bias
showed positive effects of training that were maintained through the period of untraining
while participants starting with a (relative) positive bias showed no effects of training.
Further, this subgroup showed significant decreases in IBI scores between tests 2-3 and 1-3,
suggesting that the procedure may adversely affect interpretive bias.
The post-hoc median split findings from both experiments support Amir et al.’s
(2011) study and posit that a participant’s natural bias should be considered before rendering
them suitable for CBM training. Evidence of these patterns of response are of critical
importance, as it has previously been unprecedented to conceive of a notion that there would
be situations for which CBM might not be suitable or individuals for whom CBM training
might have an adverse affect. The results from the two experiments presented here, in
addition to those from Amir et al., suggest that CBM might be less a case of generic help and
more a directed cause for repair where damage exists.
It is acknowledged that participants in the current studies were categorised as having a
more positive or a more negative starting bias according to a median split of bias index scores
in each of the study samples. It remains possible that there might be some common cut-off
according to bias index scores, above which training would always be ineffective or
negatively effective. It seems plausible, at least, that there exists some looser form of class
determining suitability according to bias index score, which might better define who would
be best suited to CBM. It is further likely that the absence of these patterns of response in

CHAPTER EIGHT
224
previous work demonstrating the potential of CBM in a clinical setting (e.g. Amir et al.,
2009) can be attributed to the participant sample that was recruited. For example, Amir et al.
focused on participants who had been diagnosed with generalised social phobia
symptomology. In consideration of the strong inverse link between anxiety and cognitive bias
(e.g. Eysenck, MacLeod, & Mathews, 1987), it is likely that such a sample would have
naturally all had strong negative biases. For this reason all participants might arguably have
inadvertently fallen below this theoretical threshold of suitability and so would all have been
receptive to the positive effects of CBM training.
It is possible to cautiously apply some of the logic assembled from the present
findings to the results of Study 5. In Study 5, which was conducted before the present two
experiments and before the publication of Amir et al.’s (2011) study, there was no
consideration made to natural bias and individual suitability to CBM-I training; all
participants received either sham or positive CBM-I training. Following training, participants
then completed an interpretive bias test to check whether training had been successful.
Statistical testing did confirm this, with participants in the positive CBM-I training group
having a significantly more positive bias than participants in the sham CBM-I training group.
However, though statistically significant, the effect size was small (.07). This could arguably
be due to the finding from the present experiments that participants do not all respond to
training in a uniform manner. For example, by training all participants regardless of their
starting bias, some participants (who had a starting negative bias) might have been more
receptive to positive CBM-I training while others (who had a starting positive bias) might
have been less receptive to positive CBM-I training.
Results from Study 5 suggested that participants who reported high levels of test
anxiety showed an improved cortisol recovery to the test stressor following positive CBM-I
training relative to sham CBM-I training. Alternatively, participants who reported low test

CHAPTER EIGHT
225
anxiety who received positive CBM-I training showed poorer sAA recovery to a test stressor
relative to low test anxiety individuals who received sham CBM-I training. In hindsight, it is
possible to cautiously assume that those individuals who had high test anxiety might
plausibly also have had a naturally occurring stronger negative bias relative to those who had
low test anxiety. In line with the current experimental findings, it could therefore be proposed
that those participants who had a stronger negative bias (inferred from having higher test
anxiety) were more suited to the positive CBM-I training group than those who had a
stronger positive bias (inferred from having lower test anxiety). Further, those with a stronger
positive bias (low test anxiety) appear more suited to the sham CBM-I training group than
those with a stronger negative bias (high test anxiety).
The present study adopted a fairly rudimentary methodology with regards to the
positioning of the untraining period immediately after the training period. Future research
might seek to investigate a larger timeline of the enduring effects of training. For example,
participants might undergo a more intense schedule of CBM training on one day, week, or
month followed by a similarly intense session of untraining the next. Alternatively, studies
might look to interchange daily episodes of training/untraining a bias to determine whether
any accumulating effects of training are able to develop when training sessions are
interrupted. This might help researchers to better understand the individual features that make
training successful, which could serve to strengthen the impact of training in terms of its
clinical potential by improving guidelines relating to CBM training. Further, it would be
worthwhile to include measures of stress physiology in future more long-term research, to
investigate the influences on psychophysiology.
In conclusion, the present study has found evidence to suggest that CBM training
might not be generically suited to all but more specifically suited to those who need it. For
individuals to whom training is suitable, one session of either attentional or interpretive

CHAPTER EIGHT
226
training was found to be successful in improving bias with the effects generalising to new
material. These effects were found to be robust enough to endure a session of untraining that
was presented immediately afterwards. For individuals to whom training appears unsuitable,
evidence emerged to suggest that positive training might adversely affect bias. These results
seem promising in terms of the methods’ potential for the use in a clinical setting, although
caution should be issued to future research studies that use a control group who are
considered to have ‘normal’ levels of anxiety. Further research is needed to understand the
nature both of who might be suited to CBM and also of the conditions under which CBM
might be most effective. As a clinical tool, the current study does support the broad literature
suggesting its potential, though much work is needed prior to its release as an alternative to
more conventional therapies.

CHAPTER NINE
227
9.0 CHAPTER NINE
GENERAL DISCUSSION
Previous research had found evidence for a relationship between cognitive bias and
the perception of stress. However, there has been little systematic attempt made to understand
whether cognitive biases also relate to the biological response to stress. If, as hypothesised,
the biological response to stress is linked to cognitive bias then biases hold the potential to
predict both an individual’s feelings about stress and also the manners in which the brain
communicates stress to the body. This has potentially profound implications for the long term
health of individuals with negative biases.
In view of the critical importance of reliably measuring the biological response, two
studies (Studies 2 and 3) researched the optimal methods and practices of collecting saliva
samples. The results of these two studies highlighted gender differences and fed into the
studies that examined the relationship between bias and the physiological stress response.
Studies investigating the bias/stress response relationship (Studies 1, 4, and 5)
encountered unexpected difficulties in eliciting psychological and biological stress responses.
Where a stress response was induced, there was limited evidence to support previous research
demonstrating a robust link between attentional bias and emotional vulnerability to stress
(Study 4), and no suggestion of influences on a biological scale. Similarly, interpretive biases
were not shown to strongly moderate psychological responses to acute challenges (Study 4),
and positive CBM-I training did not serve to buffer subsequent exposure to stressors (Study
5). However, interpretive biases did appear to moderate the biological recovery process, and
positive CBM-I training was found to lead to a more efficient biological recovery following
acute stress relative to sham training in high test-anxious individuals. Importantly, for both
CBM-I and CBM-A, evidence emerged to suggest that training techniques might in some

CHAPTER NINE
228
instances lead to negative effects. For participants who had low levels of trait anxiety (Study
5) or a natural positive bias (Study 6), positive training appeared to lead to a slower
biological recovery to stress and either no change or a significant decrease in bias index
scores.
These findings will be discussed in terms of their original contribution to the field, the
implications of such findings regarding the clinical potential of CBM techniques, limitations
of the research, and directions for future research. Prior to this, studies will be briefly
summarised to remind the reader of their individual aims and outcomes.
9.1 Summary of Studies
Study one. With the aim of establishing a reliable social rejection stressor paradigm,
this study adopted a protocol that was adapted from Blackhart, Eckel and Tice (2007), who
reported a significant cortisol response. Social rejection was induced in female participants
by making them believe that no person in a group (up to 4 individuals) wanted to partner
them for a group exercise. The study did not show evidence of an ANS physiological stress
response, with no change being found in the rate at which sAA is secreted. Further, social
rejection appeared to lead to a significant decrease in cortisol concentration relative to the
comparison (social inclusion) condition. Psychological variables also largely showed no
significant change in response to the intended stressor. Participants in the social rejection
group reported no change in their perceived stress (as indexed by the SACL). Measured
through a visual analogue scale, reported optimism and happiness were found to decrease
following social rejection, though reported levels of tension and distress remained
unchanged. Overall, the study was unsuccessful in its aims to replicate a biological and
psychological stress response using Blackhart et al.’s social rejection paradigm.

CHAPTER NINE
229
Study two. This study was developed in response to observing some odd
physiological patterns in Study 1, specifically finding consistent and unexpected changes
between the salivary flow rate and analyte levels in the first two saliva samples. Study 2
examined whether a practice saliva sample was necessary to increase the validity and
reliability of the first ‘real’ sample given, which often forms all or part of the crucial baseline
analyte data. Two groups of participants practiced saliva donation using the passive drool
technique (once or three times), and one group were afforded no practice sample. Participants
then all gave four saliva samples, from which flow rate was calculated and assays conducted
to determine levels of cortisol and sAA. As predicted, cortisol was unaffected by whether or
not participants had practiced the technique. A significant main effect of time was identified
for variation in flow rate, with an increase in sample volume being found between samples
one and two. This main effect was further qualified by a significant three way interaction
between flow rate, group allocation, and gender. Exploratory investigations revealed the
hypothesised “practice effect” in female participants who had not practiced the technique,
evidenced by a significant increase in flow rate between the first two samples. This effect
remained absent in samples from female participants who had practiced the collection method
either once or three times, and in males entirely. There was no evidence of any practice
effects in sAA activity, which was unexpected given the observed findings in flow rate, and,
as expected, no change in sAA output. Overall, Study 2 found evidence to suggest that, to err
on the side of caution, research protocols that recruit female participants and collect saliva
would benefit from implementing practice samples.
Study three. In a bid to establish an optimal procedure for saliva collection, Study 3
sought to compare two common methods used in biobehavioural research to collect saliva;
passive drool into a cryovial and collection using a Salimetrics Oral Swab (SOS). Participants
gave a sample using both methods (counterbalanced). No significant difference was found in

CHAPTER NINE
230
flow rate or sAA activity or secretion between the two methods. Cortisol was found in
significantly increased amounts when samples were collected using the SOS relative to the
passive drool method. Even so, significant correlations were found between the two methods
for flow rate, cortisol, and sAA activity and secretion. Further, drawing on the practical
concerns associated with working with saliva, the absorbent swab from the SOS acted as a
filter for sample debris, resulting in a cleaner sample. This significantly enhanced the utility
of low volume samples, which can otherwise be deemed unusable. Taken together, these
findings led to a decision to favour saliva collection through SOS absorption relative to
passive drool.
Study four. Adopting the methods and procedures developed in Studies 2 and 3,
Study 4 examined the predictive capacities of natural interpretive and attentional biases on
psychophysiological responses to an acute stressor (social ostracism) task. Implementing
some recommendations arising from Study 1, Study 4 adopted an alternate stressor design in
which participants were unexpectedly ignored during a 2 minute presentation of a
neutral/positive topic to two (confederate) participants via a video conference link.
Conferences were in fact artificial, with pre-recorded videos replacing real-time interactions.
Participants took part in two of these staged interactions. During the first one, confederates
assumed a neutral role, whilst in the second they acted in a way to induce positive or negative
reactions. Positive reactions were induced through smiling, leaning in to the camera, and
nodding. Negative reactions were induced by disengaging from the participant’s presentation
and whispering between themselves. Interpretive and attentional bias was measured prior to
the stressor, and was used to try and predict variation in psychological and physiological
measures.
Indices of psychological well-being indicated the task was stressful, with an increase
in feelings of social rejection (from specific items embedded in the PANAS) and state anxiety

CHAPTER NINE
231
(STAI-s), as well as a reduced fulfilment of primary needs. Condition allocation (social
ostracism, social inclusion) was found to significantly predict variation in psychological
measure; stress (SACL), and positive and negative affect (PANAS). However, condition
allocation did not predict changes in cortisol or sAA secretion. Attentional bias was identified
as a trend predictor for changes in negative affect (PANAS) in response to the process of self-
presentation (OCam 1 - neutral), though was not predictive of other psychological or
physiological responses to the task, and held no predictive power for responses to social
ostracism or recovery. Interpretive bias emerged as a near significant predictor for variation
in reported stress (SACL) in response to the task (OCam 1 - neutral), and was also found to
be a trend predictor for variation in negative affect in socially included participants only.
While interpretive bias was not found to predict psychological or physiological responses to
social rejection, it did appear to be a trend predictor of sAA recovery to the process of self-
presentation.
Overall, Study 4 found little evidence to support existing literature that suggests a
robust link between attentional and interpretive biases and emotional vulnerability, and did
not replicate recent investigations on the physiological stress system and bias that have
documented responses to the same effect. Of interest, however, interpretive bias was here
found to influence recovery from acute stress.
Study five. Study 5 explored the effects of CBM-I on the psychophysiological stress
response. A decision was made to use a stressor task that had been developed in parallel to
the research presented in this thesis that focused on performance stress. Justification for this
change in direction arose from the fact that the new paradigm had successfully been shown to
act as an acute stressor, had been used to demonstrate clear links between bias and the stress
response, and was sensitive to CBM-I techniques. Participants completed a session of CBM-I
training using ambiguous vignettes (70 scenarios). Participants then completed a recognition

CHAPTER NINE
232
test before taking part in the stressor, which incorporated academic and social themes. In
groups of up to 12, participants were instructed to complete three short computer tests, and
received deceptive information specifying the nature of the tests (that they measured
intelligence) and difficulty (that participants should not encounter problems in completing the
tasks). The three programs were designed to be extremely challenging. Participants were also
informed that their performance would be displayed publicly at the front of the room and that
they might have to comment on their score should they perform particularly well or poorly.
Questionnaire measures (SACL, PANAS, and STAI-s) appeared to confirm that the
task was acutely stressful, though no significant interaction was found between changes in
these psychological measures over time and CBM-I condition (sham or positive training). As
in Study 4, this finding appeared to contradict previous studies that have documented a
reduced psychological vulnerability to stress following CBM-I training. Test anxiety
appeared to influence psychological responses to the stressor, with higher test anxiety being
associated with a larger psychological response relative to lower test anxiety. Cortisol
appeared unaffected by the stressor, though again test anxiety was found to significantly
interact with reactivity. A significant decrease in cortisol was identified following CBM-I
training, which appeared steeper for low anxious individuals when they were in the sham
training group and for high anxious individuals when they were in the positive training group.
Further, high anxious individuals showed a faster cortisol recovery from the stressor only
when they had received positive CBM training as opposed to sham training. Alternatively,
sAA was found to significantly increase following CBM training, remain unchanged
following the stressor (though changes were in the predicted direction), and then recover
following the stressor. As with cortisol, test anxiety appeared to also influence recovery in
sAA following the stressor, with low test-anxious individuals who received positive training
showed a blunted recovery relative to low anxious individuals who completed sham training.

CHAPTER NINE
233
These findings allude to suggestions that prior anxiety might mediate the relationship
between bias and the stress response and, consequently, might also determine suitability of
CBM training.
Study six. In two experiments, Study 6 tested the immediate robustness of trained
attentional (dot probe training; Study 6a) and interpretive (homograph training; Study 6b)
biases. Both experiments shared the same experimental design. Participants completed a
single session of positive training (CBM-A or CBM-I) before completing an “untraining”
session, which was composed in exactly the same format but without the training
contingency. For example, in CBM-A training, the probe was consistently placed behind the
positive word whereas probes in the untraining session were placed behind positive or
negative words with equal frequency. Alternatively, CBM-I training consisted of constantly
drawing on the neutral interpretation of the homograph, whereas untraining drew both on
neutral and negative meanings with equal frequency.
Following an unexpected initial absence of training effects in Study 6a, and in
consideration of recently published findings, participants were allocated into retrospective
groups according to a median split of the sample’s baseline bias measures. Following this, a
significant interaction between group and bias was identified. Training was found to be
effective in participants who were allocated to the negative bias group (i.e. those with a
baseline bias that was lower than the median score). Further, in this sub-sample, the process
of untraining was found to bear no influence on these improvements. Alternatively,
participants allocated to the positive bias group (i.e. those with a baseline bias score higher
than the median) showed no effects of training or untraining. In an attempt to directly
compare the effects of CBM training between studies, participants in Study 6b were
retrospectively allocated into positive and negative starting bias groups in the same fashion.
This revealed exactly the same findings, with participants in the negative starting bias group

CHAPTER NINE
234
showing significant training effects that survived untraining while no training effects were
present in the positive starting bias group. Further, in this latter sub-sample, biases were
found to become significantly more negative following the untraining session. This study is
the first to demonstrate negative effects of a positive CBM training, and suggests that the
techniques might be suited only to people who might reasonably benefit from them.
9.2 Physiological Responses to Stressor Tasks
Following initial analysis, none of the stressor tasks employed in the studies presented
here (Studies 1, 4, and 5) appeared to successfully elicit a physiological stress response.
While Study 1 additionally showed no evidence of changes on standardised stress
questionnaires, Studies 4 and 5 did induce feelings of rejection (Study 4), as well as stress,
anxiety, and negative affect (Studies 4 and 5). Even with these significant psychological
changes, certainly in Study 5 there appeared to be a distinct absence of any clear shifts in
cortisol and sAA. To explore reasons behind these apparent contradictions, task selection and
timings of sample collections will be discussed in turn.
9.2.1 Task selection. Study one. The lack of a response both on a psychological and
physiological scale following the social rejection task employed in Study 1 brings about the
conclusion that the task per se may have been at fault. In spite of the care taken to research
appropriate stressor tasks, there are several grounds that, with hindsight, are argued to
significantly contribute to the overall unsuccessful employment of this task (see Study 1:
Discussion). As an example, the delivery of the stressful aspect of this task involved the
researcher informing the participant that they had not been selected by any of their peers for
the group exercise. This entire discourse, including the researcher entering the room,
providing the information, and setting the participant up on the group task alone, took no
longer than a couple of minutes. The purpose of subsequently actually completing the group

CHAPTER NINE
235
exercise (alone) was two-fold, both to enable participants time to ruminate on their rejection,
which has been found to intensify cortisol reactivity (Zoccola, Dickerson, & Zaldivar, 2008),
and to follow through on the original study brief. It is possible, instead, that the information
was received and the group exercise then provided a useful distraction from the participant’s
brief embarrassment of being rejected by the group. In sum, while the task contained both
elements of a socio-evaluative and uncontrollable nature, it did so with insufficient intensity
and consequently was unsuccessful in acting as an acute stressor.
Study five. Study 5 was successful in significantly eliciting a psychological stress
response, yet apparently did not stimulate any significant physiological response. In
consideration of the fact that this task employed all aspects of Dickerson and Kemeny’s
(2004) three key factors it is likely that, in this circumstance, alternative reasons underlie the
absence of changes in sAA (see Sample collection points below). Alternatively, there is an
argument to suggest that cortisol did respond to the acute stressor task.
Figure 30. A flow chart showing the structure of samples and cortisol reactivity throughout
Study 5.
SAMPLE 1 SAMPLE 2 SAMPLE 3 SAMPLE 4 SAMPLE 5
Cortisol reactivity
Time difference between samples
Time difference between samples
Decrease No change
Decrease Decrease
52 mins
10 mins
20 mins
44 mins
Baseline Post-CBM Immediately post-stressor
20 minutes post-stressor
30 minutes post-stressor
Cortisol reactivity

CHAPTER NINE
236
As shown in Figure 30, cortisol was found to decrease generally across the study with
the exception of between samples 3 and 4, which represented the 20 minutes following the
end of the stressor. Adopting Blackhart, Eckel, and Tice’s (2007) justification, this pattern
could be interpreted as cortisol’s natural diurnal decline being interrupted through external
activation. This would imply that, by cortisol holding constant, individuals were actually
displaying a HPA response. However, this interpretation must be drawn with caution as there
is no control comparison group that did not complete the stressor task therefore this must
remain only a possible interpretation and future studies would be necessary to test this
possibility further. Furthermore, if authentic, the effects appear quite transitory, as a decrease
in cortisol is evident just 10 minutes later (at sample 5). Though speculative, this inference is
supported by the changes in psychological state (e.g. reported stress, etc.) and would further
support the argued masked sympathetic (sAA) effects of the task (see Sample collection
points below).
Study four. Arguably the task used to induce stress in Study 4 did induce a significant
sympathetic response albeit not as intended. A regressional design was adopted to analyse the
data in Study 4, to most appropriately address the main research question regarding the
predictive capacities of natural attentional and interpretive bias. For this reason, ANOVAs
were not conducted to directly assess the physiological impact of the social ostracism task
alone. Addressing that topic retrospectively, a 2 (condition: social ostracism, social inclusion)
x 4 (time point: baseline 2, post-OCam 1, post-OCam 2, and 30 minutes post-OCam 2)
repeated measures ANOVA reveals a significant change in sAA secretion over time, F(3,
201) = 11.42, p < .001, ηp2 = .15, that is not qualified by any significant interaction by
condition, F(3, 201) = 1.13, p = .34, ηp2 = .02. Though this result is unexpected (specifically,
finding a main effect that is not qualified by a significant interaction), further investigation
demonstrates a significant increase in sAA only following the first (neutral) OCam, t(74) = -

CHAPTER NINE
237
5.30, p < .001, d = .50. At this stage, participants have experienced exactly the same study
protocol, hence the absence of any interaction by condition is understandable. There is no
significant change in sAA between the two OCam videos (the second of which contained the
social manipulative element), t(72) = 1.60, p = .12, d = .16, however following OCam 2 there
is a significant drop in sAA, t(71) = 2.83, p = .01, d = .28 (see Figure 31).
Figure 31. sAA reactivity over Study 4.
The above findings imply that, while public negative evaluation failed to activate the
sympathetic stress response, the act of self-presentation (i.e. merely participating in the
OCam video tasks) was successful in doing so. Perhaps this finding further indicates that,
while acute stressor tasks are advised to contain the opportunity for social evaluation, this is
necessary only as a potential outcome rather than an actual one. This speculation is supported
by Brosschot, Gerin, and Thayer’s (2006) perseveration cognition hypothesis, in which a
large degree of physiological activation is argued to be due to thinking about stress. Put
another way, and drawing on a famous quote from Shakespeare, “There is nothing either
good or bad, but thinking makes it so”.
13
16
19
22
25
28
Baseline 2 Post-Ocam 1 Post-Ocam 2 + 30 minutes
Alp
ha
am
yla
se s
ecr
eti
on
(U
/min
)

CHAPTER NINE
238
Turning to the cortisol response, a 2 (condition: social ostracism, social inclusion) x 4
(time point: baseline 2, post-OCam 1, post-OCam 2, and 20 minutes post-OCam 2) repeated
measures ANOVA also showed a significant main effect of time, F(2.27, 106.45) = 5.41, p <
.01, ηp2 = .10 (Greenhouse Geisser corrected), with no significant interaction by condition,
F(2.27, 106.45) = .35, p = .73, ηp2 = .01. Explored further, cortisol was found to remain
unchanged between samples 2-3 (baseline 2 – post-OCam 1), t(59) = 1.37, p = .18, d = .10,
and 3-4 (post-OCam 1 – post OCam 2), t(54) = -1.01, p = .32, d = .05, before showing a
significant decrease between samples 4-5 (post OCam 2 – 20 minutes after post OCam 2),
t(55) = 3.74, p < .001, d = .21. Recalling the finding of a significant decrease in cortisol
between samples 1 (baseline 1) and 2 (baseline 2), this finding appears to corroborate the
suggestion that the act of social presentation acted as a sole acute stressor. Again drawing on
cortisol’s natural decline throughout the day (e.g. Buchanan, Kern, Allen, Tranel, &
Kirschbaum, 2004), the noted decreases in cortisol between samples 1-2 and 4-5 could
indicate an uninterrupted natural rhythm (see Figure 32). During the 20 minutes between
samples 2-3, and the 10 minutes between samples 3-4 (30 minutes in total), cortisol levels
remain unchanged. During this time, participants were preparing for and taking part in the
self-presentation tasks. Arguably, this could again be interpreted as a disturbance of the
diurnal rhythm caused by exogenous activation of the HPA axis. As with sAA patterns of
response the evidence suggests that, while actual social rejection was unsuccessful in
inducing any physiological activation, the mere possibility of socio-evaluation embedded in
the act of self-presentation succeeded in doing so.

CHAPTER NINE
239
Figure 32. Cortisol reactivity throughout Study 4.
9.2.2 Sample collection points. As sAA is released almost instantly following neural
and cellular changes (see Nater & Rohleder, 2009, for a review), changes in response to an
acute stressor would be expected imminently. Alternatively, cortisol is the end-product of a
cascade of hormonal changes and therefore, with the transfer time from serum into saliva,
stress-induced changes are normally subject to a 10-20 minute post-stressor delay
(Kirschbaum & Hellhammer, 1989). While researchers typically position the sample
collection points in accordance with these considerations (see Figure 33 for an illustration of
the designs used in the studies presented in this thesis), it is possible that mistiming collection
points risks inadvertently missing peak changes. The likelihood of this occurring for sAA
mounts as the time taken to complete the stressor task increases. However, in consideration of
the difficulty in eliciting cortisol responses through laboratory stress procedures (Dickerson
& Kemeny, 2004), researchers intending on measuring both ANS and HPA responses to a
single challenge are presented with the dilemma of finely balancing optimal conditions to
observe changes in both systems.
0.125
0.145
0.165
0.185
0.205
Baseline 1 Baseline 2 Post-Ocam 1 Post-Ocam 2 + 30 minutes
Co
rtis
ol
con
cen
tra
tio
n (
µg
/dL)

CHAPTER NINE
240
Figure 33. Flow chart to show stressor / saliva sample structure.
Certainly in Study 5, which consisted of a 10 minute stressor, it is likely that the
sample taken immediately after the task failed to capture the peak sAA response due to the
reasons discussed above. This is supported by the fact that the secretion rate was found to
increase following the stressor, though was not found to be significant. As a further
unintentional confound in documenting the stress-induced change in sAA in Study 5,
secretion rate was found to increase between the first two samples of the study (sample 1:
baseline; sample 2: post-CBM training; see Figure 22 below, reproduced from Study 5).
Approximate time elapsed since stressor onset
Stressor onset Stressor duration
Post-stressor sample 3
Post-stressor sample 1
Post-stressor sample 2
Study 1: Social rejection through exclusion from
group task
Study 4: Self presentation (OCam
1) with ostracism (OCam 2)
Study 5: Academic and
social evaluative challenge
1 – 10 minutes
10 minutes 20 minutes 30 minutes
5 minutes (per
conference)
OCam 1 – 5 minutes
OCam 1 – 15 minutes
OCam 2 – 5 minutes
OCam 1 – 45 minutes
OCam 2 – 35 minutes
10 minutes 10 minutes 30 minutes 40 minutes

CHAPTER NINE
241
Figure 22. Changes in alpha amylase secretion over the study (collapsed across conditions).
Reproduced from Study 5.
The increase in sAA evidenced between the first two samples presents two problems
as, firstly, the ensuing (non-significant) increase between samples 2-3 could be attributed
either to participation in the stressor or could have carried over from the previous cause.
Second, it removes the existence of a reliable pre-stress measure of sAA. As sample 1
(baseline) was taken after a practice sample, at approximately 25-30 minutes into the study, it
is arguably an accurate and reliable baseline measure. However, the rise in sAA documented
between the first two samples rules out the use of sample 1 as an appropriate baseline against
which to compare stress-related changes in sAA. Alternatively, sample 2 is not an ideal pre-
stress measure either as it now contains the inherent inflation in sAA. With hindsight it is
possible to argue that these factors probably substantially contributed to not finding a
significant increase in sAA following the stressor.
Summary. Though none of the tasks employed in Studies 1, 4, or 5 were successful
in eliciting an increase in cortisol, arguments presented above indicate that Studies 4 and 5
may have managed to activate the physiological stress response systems in the desired
manner to some extent. As is evident, using salivary biomarkers to measure physiological
15
20
25
30
35
Baseline Post-CBM Post-stressor 20 minutes
post-stressor
30 minutes
post-stressor
Alp
ha
am
yla
se s
ecr
eti
on
(U
/min
)

CHAPTER NINE
242
changes to acute stressors presents a challenge in itself. Where possible, future studies using
salivary biomarkers are recommended to adopt a simple design where participants are not
required to complete several different tasks sequentially on the same day. In Study 5, this was
proposed to interfere with accurately documenting stress-related changes in sAA. Further,
sample collection points need to be carefully positioned in the design of the study to prevent
peak reactivity being missed, which is not always an easy feat (e.g. Study 1).
Though the tasks used in Studies 4 and 5 appear to have elicited activation of the
physiological stress response systems to a certain degree, they are clearly not as effective as
some of the more established procedures. For example, the Trier Social Stress Test
(Kirschbaum, Pirke, & Hellhammer, 1993) appears to be the most reliable of the popular
choices of acute stressors due to its apparent capacity to consistently evoke increases in
cortisol regardless of typically confounding factors such as diurnal variation (e.g. Kudielka,
Schommer, Hellhammer, & Kirschbaum, 2004). In their meta-analysis, Dickerson and
Kemeny (2004) argue that this is due to the task including elements of uncontrollability,
socio-evaluation, and being personally relevant. However, the results from Study 4 suggest
that the perception of these factors might be more essential than their actual occurrence.
Participation in the self-presentation aspect of the OCam paradigm was sufficient to elicit
increases in sAA and cortisol, while actual ostracism only served to worsen reported
psychological states and had no effect on physiological responses. To an extent, the actual
rejection aspect could be argued to have reduced the impact of uncontrollability, as it forces
the move from a “What happens if they don’t like me?” to a “They don’t like me, how will I
cope?” mentality.
Compared with more continuous methods of measuring physiological response, such
as continuous blood sampling to capture HPA activation or heart rate or electrodermal
tracking to monitor ANS activation, saliva does provide a practical and minimally invasive

CHAPTER NINE
243
alternative. However, this thesis has documented some problems associated with collecting
accurate and reliable samples. Through applying the recommendations noted in Studies 2 and
3, specifically using secretion rate calculations of sAA for the purposes of analyses,
consistent implementation of a practice sample, and collecting samples with the aid of a
swab, no further problems were encountered in Studies 4 and 5. Therefore, with such
cautions heeded, saliva is still recommended to be the most suitable option for investigations
into biobehavioural stress research.
At this point it is noteworthy to consider the reasons for employing stressor tasks in
terms of the scope of this thesis. The primary aim of this thesis was to investigate the
relationship between cognitive biases (natural or modified) and the psychophysiological
stress response. Of the limited range of studies that also address this subject using similar
strategies, not all have observed significant increases in stress biomarkers following a “stress
task” (e.g. Hoppitt, Mackintosh, Randall, & Bristow, under review). Nevertheless, interesting
results have been noted in spite of this absence suggesting that the much anticipated main
effects of task are not necessary in such investigations. Even so, the absences of main effects
might explain why no influences of bias were evident at the initial response stage. Future
research might seek to investigate this outstanding question using the TSST which, though
expensive and time-consuming to conduct, has been commonly shown to elicit cortisol
responses.
9.3 Bias and the Stress Response
Study 4 measured the predictive capacity of interpretive and attentional cognitive
biases on the psychological and physiological response to an acute stressor, while Study 5
explored the influence of a single session of CBM-I on the psychological and biological
effects of acute stress. Whereas previous studies have shown evidence of more positive biases

CHAPTER NINE
244
(either natural or through bias modification training) being consistently associated with a
reduced psychological impact of an acute stressor (see Beard, 2011, for a review), the studies
presented within this thesis found only limited support for this link. Further, initial
interpretations of the findings from the research presented in this thesis demonstrated a lack
of generalisation of bias influences in terms of physiological reactivity to stress. However,
further consideration of similar literature reveals justification for some findings and exciting
innovations for others.
9.3.1 Attentional bias. In Study 4 attentional bias was found to serve as an
independent predictor of changes in negative affect in response to participation on the first
OCam task. This task was found to act as a stressor, with significant increases in reported
negative affect and stress. However, attentional bias was not found to significantly predict
changes in reported stress or positive affect during this time, nor was it found to predict
changes in any of these variables following the second OCam task. These findings therefore
provide only limited support for previous research that demonstrates a robust link between
biased attentional processes and psychological vulnerability to stress. Of further interest,
attentional bias was not found to significantly predict changes in sAA or cortisol during this
time. As evidence presented in earlier sections of this discussion suggests, both measures of
physiological activity are argued to have responded to the self-presentation aspect of the
OCam. Therefore the data suggests that attention biases do not significantly influence an
individual’s physiological response to stress.
These findings are partially supported by Fox, Cahill, and Zougkou (2010), who
found pre-existing attentional biases to be predictive of subsequent cortisol response to acute
stressors presented either 4 or 8 months later only when measures of attentional bias included
masked stimuli. Masked stimuli were presented on screen for just 14 milliseconds, and
therefore remained outside the bracket of conscious awareness. Alternatively, stimuli that

CHAPTER NINE
245
were unmasked (300 millisecond presentation period) were not found to significantly predict
cortisol responses to either acute stressors. Fox et al. argue that their findings demonstrate
evidence that early stage (i.e. preconscious) processing biases are more influential in
predisposing vulnerability to anxieties relative to later stage conscious biases. As Study 4
included only unmasked stimuli, the absence of any predictive powers of attentional bias
could be seen as support for Fox et al.’s supposition.
Koster, Baert, Bockstaele, and De Raedt (2010) explored the potential for CBM-A
training (dot-probe) to influence early (unconscious) and late (conscious) stages of processing
biases. Participants were found to show no effects of training when training stimuli were
masked, with presentation controlled at either 30 milliseconds or 100 milliseconds. When
stimuli were unmasked (500 millisecond presentation), participants showed the typical
changes in bias following training, with a reduced attention bias to threatening materials
following positive training but not control (sham) training. This replicated findings by
MacLeod, Rutherford, Campbell, Ebsworthy, and Holker (2002; Experiment 1), who also
found CBM-A to be ineffective when stimuli were presented outside of conscious awareness
(20 milliseconds).
While proving effective in attentional bias modification, under Fox et al.’s notion
(with support from Study 4 findings) that only early (preconscious) attentional biases are
influential in predicting individuals’ physiological vulnerability to acute stress, one might
expect typical attentional bias modification procedures (that work within conscious
awareness) to be ineffective in reducing the physiological impact of stressors. However, in
the only published study to date of its kind, Dandeneau, Baldwin, Baccus, Sakellaropoulo,
and Pruessner (2007) do identify a potential for unmasked (and therefore conscious)
attentional bias modification to affect physiological stress. Using a slightly different method
to the conventional dot-probe task, participants were required to complete trials in which they

CHAPTER NINE
246
located a still image of a face showing a neutral expression amongst a 4x4 matrix of photos
of people looking angry. Participants were a group of telemarketers, who experience a high
degree of occupational stress associated with making cold calls, such as continuous rejection.
Following a five day training period, participants who completed this find-the-happy-face (as
opposed to a find-the-flower control task) released significantly less cortisol over the final
working day (the assumed stressful event). Despite the authors referring to their training as
targeting early stages of attention, the method forces participants to make a conscious
decision and so would likely be classified by both Fox et al. (2010) and Koster et al. (2010)
as being directed towards later stages of attention. As such, and according to Fox et al.’s
hypothesis, the training should not have been effective in reducing physiological activation.
However, it could be argued that Dandeneau et al.’s training technique operated by
encouraging a rapid conscious disengagement from threat cues, as participants were required
to find the single neutral facial expression amongst the remaining 15 unhappy facial
expressions. Therefore, with the source of stress associated with working as a telemarketer
originating from the potential for rejection resulting from making cold-calls, this type of
training seems perfectly tailored for such a sample group for two reasons. In addition to
promoting active disengagement from such rejection, the training might act almost as a fixed
reinforcement schedule as participants would learn that eventually they would always find the
neutral face in the 4x4 matrix. This could arguably transfer onto an individual’s appraisal of
cold-call success and amend their method of coping with rejection.
9.3.2 Interpretive bias. In Study 4, interpretive bias emerged as a significant
independent predictor of changes in reported stress following participation on the self-
presentation (OCam 1) task, though not of changes in reported positive or negative affect.
Again, this only partially supports existing literature that claims a link between biased
cognitions and stress vulnerability. No finding emerged suggesting interpretive biases

CHAPTER NINE
247
influenced changes in sAA or cortisol during this time. Interestingly, however, interpretive
bias did emerge as a trend predictor of sAA change between the final two samples. As
discussed earlier, during this time a significant reduction in sAA secretion was found that
indicates a recovery period from the acutely stressful experience of self-presentation. This
finding therefore hints that, while attentional biases might be associated with initial reactivity
to a stressor, interpretive biases might alternatively influence how fast individuals recover
from acute periods of stress.
Study 5 then investigated the effects of a single session of CBM-I (vignettes-based
training) on the psychological and biological response to an acute stressor. While a decrease
in cortisol was found following the CBM-I training, this has since been argued to be resulting
from the natural diurnal decline in cortisol (e.g. Buchanan, Kern, Allen, Tranel, &
Kirschbaum, 2004). Training was not found to influence individuals’ physiological responses
to the stressor, though participants who completed sham training relative to a positive training
programme had trend higher levels of cortisol and significantly greater amounts of reported
stress throughout the study. This suggests that positive CBM-I training might have some
general soothing effects on stress activation. Further, some interesting patterns emerged that
again indicated an influence of interpretive bias on recovery from stress. Of note, this pattern
additionally depended on subjective test anxiety (recalling the relevant fact that the stressor
task was test-based). Following a median split, participants low in test anxiety exhibited no
change in cortisol between samples 4-5, while participants high in test anxiety showed a
significant decrease in cortisol following positive CBM-I training but not following sham
training. Further, while there was no change in sAA secretion between these time points in
individuals high in test anxiety, low test anxious individuals showed a significant increase in
sAA secretion following positive training but no change following sham training. Though

CHAPTER NINE
248
initially perplexing, the findings of Study 6 goes some way to clarifying reasons behind these
responses.
Participants in Study 6 with a stronger negative interpretive bias (following a median
split of entering bias scores) were found to respond in the expected manner to a single session
of positively valenced homograph-based CBM-I training; training was effective, which was
evidenced by a significant improvement in bias. Alternatively, participants with a stronger
positive bias were found to show no effects of training, with bias scores remaining
unchanged. Further, following repeated exposure to training material without any
probe/valence contingency (a phase of the study designed to test the robustness of freshly
trained biases), participants who had started with a more positive bias showed a decline
(becoming more negative) in bias scores. In contrast, the bias of participants who had
benefitted from training (those starting with a relative negative bias) appeared unaffected by
this untraining period. Applying these findings to the patterns of response in Study 5
highlights some interesting and clinically relevant points.
In consideration of the strong link between anxiety and interpretive bias (e.g. Beard &
Amir, 2009), it is plausible to assume that participants in Study 5 who scored highly on
measures of test anxiety might also possess a tendency to disproportionately interpret
ambiguity in a negative manner (i.e. have a negative interpretive bias). In light of the findings
of Study 6 that imply that CBM procedures might only be suitable for participants who would
directly benefit from them (i.e. those with a negative bias), the observed interactions between
test anxiety and physiological activation appear more logical. Participants higher in test
anxiety (and so arguably with stronger negatively biased interpretations of ambiguity)
showed an improved recovery to stress when they received positive CBM-I training relative
to sham CBM-I training. Alternatively, participants lower in test anxiety (arguably those with
a stronger natural positive interpretive bias) recovered better from acute stress when they

CHAPTER NINE
249
received sham training and, further, showed evidence of a poorer recovery time following
positive training.
9.4 Clinical Potential of CBM Methods
Although not directly exploring the relationship between bias and the
psychophysiological stress response in clinical samples, the present findings can be applied to
the clinical potential of the development of CBM treatment tools. Many clinical disorders are
characterised by hyper-arousal and hyper-vigilance to threat. For example, a predominant
feature of generalised anxiety disorder (GAD) is an excessive tendency to worry (e.g.
Gosselin & Laberge, 2003). In physiological terms, the chronic stress associated with such
propensities is linked with individuals being less able to exhibit a sympathetic response to
episodes of acute stress (Fisher, Granger, & Newman, 2010). Further, Fisher et al. found that
higher baseline levels of sAA in participants with GAD were predictive of a smaller
sympathetic reactivity relative to lower baseline levels. Taken together, these findings
indicate a general dysregulation of ANS activity that is characterised by a chronic
hyperactivity leading to reduced reactivity potential.
While experimental research has demonstrated a clinical potential in treating GAD by
retraining attentional biases (e.g. Amir, Beard, Burns, & Bomyea, 2009), these investigations
have so far focused only on (conscious) attentional biases and have also not yet considered
the effects of any associated physiological activation. Results from Studies 4 and 5 indicate a
potential for interpretive biases to moderate subjective recovery from stress. If authentic,
these findings would significantly advance the potential for CBM-I procedures in a clinical
setting. For example, effective recovery following episodes of stress might serve to break the
chronic hyper-activity cycle associated with anxiety disorders and restore the reactivity
potential much in the same way that relieving pressure from an elastic band restores its

CHAPTER NINE
250
capacity to stretch again in the future. This might further reduce the risk of stress-related
physiological ailments linked with chronic hyper-arousal, such as a build up of
atherosclerotic plaque in the arteries caused by excess cortisol (e.g. Dekker et al., 2008) that
can significantly elevate the risk of cardiovascular disease.
Of additional significance in applying CBM techniques to a clinical research setting, the
findings of Studies 5 and 6 imply that CBM methods are not suitable for all populations. For
those suitable to the techniques, the effects appear robust following exposure to immediate
efforts to out-train it. Alternatively, participants who logically would not have benefitted
from positively-valenced CBM training appeared in some instances to respond adversely to
its forced exposure. This second point is more relevant to the development of CBM
techniques only where studies employ control comparison groups, to uphold ethical
responsibilities linked with protecting the well-being of research participants.
9.5 Limitations and Future Research
9.5.1 Stages of attention. The research presented and discussed here suggests that
there remain some inconsistencies in the documented literature investigating the relationship
between biased cognitions and the psychophysiological stress response. For example,
evidence suggests that attentional biases are only capable of predicting physiological
responses to acute stressors when they exist outside of an individual’s conscious awareness
(Fox, Cahill, & Zougkou, 2010). As most attentional bias modification procedures operate at
a level within conscious awareness, arguably these methods would be ineffective in
modifying an individual’s physiological vulnerability to acute stress. However, Dandeneau,
Baldwin, Baccus, Sakallarpoulo, and Pruessner (2007) have demonstrated the beneficial
effects of such procedures thereby directly contradicting the assumptions of Fox et al..
Further, while no studies exist that investigate the effects of masked attentional bias

CHAPTER NINE
251
modification procedures on the physiological stress response, research has shown it to be
ineffective at modifying attentional biases and psychological responses using this method
(Koster, Baert, Bockstaele, & De Raedt, 2010; MacLeod, Rutherford, Campbell, Ebsworthy,
& Holker, 2002). Clearly a deeper understanding is needed to clarify such discrepancies,
which might further illuminate reasons behind the inconsistent successes of CBM methods in
different clinical samples.
Currently it is understood that highly anxious individuals display a vigilance-
avoidance pattern towards threat, which is characterised by a disproportionate attention
towards threat during the early stages of information processing followed by threat-avoidance
in the later stages (Bar-Haim, Lamy, Pergamin, Bakermans-Kranenburg, & van IJzendoorn,
2007; Koster, Verschuere, Crombez, & Van Damme, 2005). Most studies using dot-probe
modification tasks claim that the procedures target early information processing stages to
retrain the propensity to automatically focus attention on threatening stimuli. If true, the basis
by which training works is entirely understandable. Indeed, the methods have been shown in
a number of cases to reduce clinical levels of anxiety (e.g. Amir et al., 2009; Schmidt,
Richey, Bucker, & Timpano, 2009). However, Koster et al. (2010) claim this not to be the
case, instead proposing that typical attention modification methods work on later stages of
attention. Further, Koster et al. suggest this to be a contributing factor in explaining why the
potential of CBM has not been as prominent in reducing phobia-specific anxieties. According
to fear theorists (e.g. Foa & Kozak, 1986), phobic participants need to consciously attend to
the phobia-related stimuli in order to habituate to it. Koster et al. claim that using typical (in
their opinion late stage) attentional training methods therefore only serves to reaffirm their
existing patterns of response which maintains their fear and, consequently, their phobia fails
to improve.

CHAPTER NINE
252
Alternatively, it is possible that typical attentional bias modification procedures do in
fact target early (though not preconscious) stages of attention. That is to say, the stimuli are
presented within the bracket of conscious awareness, but the association between trained
contingencies remains implicit. Assuming this is true, the reasons behind the less evidenced
beneficial effects of CBM in phobias could be attributed to the constructs that underlie these
more specific fears. For example, Van Bockstaele et al. (2011) argue that CBM methods are
more suitable to disorders that are featured by broader rather than specific threats. Phobias
are associated with significantly larger physiological responses upon exposure to related
threats relative to individuals suffering from other clinical anxiety disorders, such as SAD or
GAD (Lang & McTeague, 2009). Van Bockstaele et al. therefore propose that CBM methods
successfully retrain anxieties but, in their current format, will remain ineffective in retraining
more specific fears.
Clearly considerably more exploration of the topic is necessary before the principles
that underpin CBM-A are fully understood. Specifically, it would be useful to understand
which stages of attention (preconscious, early, or late) are currently targeted by CBM-A, in
addition to discovering which stages might best be targeted to promote lasting positive
changes.
9.5.2 Inconsistent findings. In Study 4, interpretive bias was found only to predict
changes in self-reported stress following self-presentation, while attentional bias was found
only to predict changes in reported negative affect during this time. On initial interpretation,
this appears to largely contradict the general consensus of published research that
demonstrates a clear and robust link between cognitive biases and psychological stress
vulnerability. However, generally both measures of bias have previously been compared
against reported anxiety in prior literature (e.g. Fox, Cahill, & Zougkou, 2010; MacLeod,
Rutherford, Campbell, Ebsworthy, & Holker, 2002; Wilson, MacLeod, Mathews, &

CHAPTER NINE
253
Rutherford, 2006). Therefore, a possible alternative explanation drawn from the research
presented here might suggest that, while both measures influence the overall perception of
stress, they work on specific aspects of the multifaceted process. Naturally, future research
might seek to explore this further. If this alternative hypothesis is upheld, a future goal of
future CBM research might consequently be to develop tailored treatment tools according to
specific subjective needs.
While Study 5 found no influence of CBM-I on psychological experience following
an acute stressor, direct comparison between study designs adopted here and those used in
previous studies might clarify potential reasons for the observed discrepancies. Early studies
that supposedly demonstrate the potential of CBM on acute stress vulnerability could be
criticised for their choice of “stressor” tasks used. For instance, while unpleasant, watching
footage of an accident would arguably not lead to an increased state of stress in the majority
of people. Indeed, in two studies that used such a task, one found no main effect of time (pre-
vs. post-task) on reported anxiety (Mackintosh, Mathews, Yiend, Ridgeway, & Cook, 2006)
while the other found only a trend effect (p < .10; Wilson, MacLeod, Mathews, &
Rutherford, 2006). Alternatively, the task employed in Study 5 led to clear and significant
increases in reported stress, anxiety, and negative affect (all p values < .001; all effect sizes >
.64). It is possible, therefore, that the earlier tasks brought about more subtle changes in
psychological state, which a single session of CBM was more able to influence. Further,
where studies have more recently demonstrated the potential of CBM either in clinical
samples (Amir et al., 2009; Beard, Weisberg, & Amir, 2011; Brosan, Hoppitt, Shelfer,
Sillence, & Mackintosh, 2011; Schmidt, Richey, Buckner, & Timpano, 2009) or outside of
the laboratory using real-life stressors (Dandeneau, Baldwin, Pruessner, Baccus, &
Sakellaropoulo, 2007; See, MacLeod, & Bridle, 2009), they have typically done so using
multiple sessions of CBM training. For this reason, relationships between psychological

CHAPTER NINE
254
vulnerability to stress and CBM (as well as stronger relationships with physiological stress)
in Study 5 might have emerged following a more rigorous CBM training schedule.
9.5.3 Stigmatising the stress response. It appears to be assumed that in order for
CBM methods to be considered effective, they would lead to a reduced physiological
response to acute stressors. However, just as authors involved in the early investigations into
the relationship between cognitive bias and anxiety vulnerability cautioned readers not to
assume causality, so too should we take necessary precautions in labelling “good” and “bad”
stress responses. As discussed at the beginning of this thesis the physiological stress response
is, in its most basic form, designed to aid the body in times of stress. Recent research has
shown that exogenous cortisol administration serves to decrease preconscious attention to
threat (Putman, Hermans, Koppeschaar, can Schijndel, & van Honk, 2007; Putman, Hermans,
& van Honk, 2010), which illustrates a certain acute anxiolytic-like effect of cortisol. Where
the stress system operates on a normal level, it makes sense that acute increases in cortisol
serve to redirect attention from threat to enable the organism to fight or flight, rather than
stand rigid with fear.
Where the stress response system operates with a dysfunctional rhythm, this finding
might also account for how clinical anxiety disorders are maintained. As previously noted,
individual’s suffering from anxiety disorders often display a blunted physiological reactivity
potential (e.g. Fisher, Granger, & Newman, 2010). Assuming that cortisol does exert some
transient protective properties over attention to threatening stimuli, the absence of an acute
physiological response might therefore serve to prolong attention to threat rather than reduce
it. Consequently, in this instance, CBM techniques might serve as an effective strategy to
realign biased cognitions and restore healthy levels of physiological activation. Needless to
say, such a hypothesis would need considerable further investigation, though brings to light
the potentially complex relationship between emotive, cognitive, and physiological defences.

CHAPTER NINE
255
9.5.4 Response or recovery? In the literature that investigates the effects of CBM on
anxiety and stress vulnerability, it is typical for researchers to solely classify stress
vulnerability in terms of how an individual responds to a stressful event. For example, See,
MacLeod, and Bridle (2009) implemented a home-based attention training programme
involving 15 days of training prior to individuals relocating to an alternate country to study
(stressful life event). State anxiety was measured prior to the training and on the move day,
with results indicating that participants who had received positive training (relative to a
control programme) reported significantly smaller increases in anxiety arising from the
transition. The structure of this study design is typical in that researchers include a baseline
measure of stress (or anxiety, etc.) and measure immediate responses to a stressor, but fail to
include any follow-up measures indicating how efficiently individuals recover from these
stressful events. Even in studies measuring responses to more acute laboratory stressors, there
is a notable lack of focus on recovery (e.g. MacLeod, Rutherford, Campbell, Ebsworthy, &
Holker, 2002; Salemink, van den Hout, & Kindt (2009).
In Studies 4 and 5, interpretive bias (either natural or trained) appeared to exert some
influence on an individual’s capacity to recover from acute episodes of stress. Stronger
positive biases were associated with a faster physiological recovery to stress-related
activation relative to stronger negative biases. While studies exist that compare the
psychological responses to acute stressors with interpretive biases, the present research is
original in its inclusion of physiological measures of stress. Therefore, while not reproducing
findings to show CBM-I training leading to attenuated psychological responses to stressors
(Study 5), the research does substantially contribute to the current literature by offering an
explanation into how biased cognitions might operate synergistically to disrupt internal
harmonisation.

CHAPTER NINE
256
Just as Lazarus (1991) identified two stages of appraisal, so too could there exist two
similar stages of interpretive bias; one involved with the initial judgement of threat, and a
second involved with the coping potential and recovery from stress activation. Both stages of
interpretive bias could function together with attentional biases to dictate an individual’s
overall response to threat. For example, with attentional biases governing how frequently
threat is detected and primary stages of interpretive biases determining the extent of an
individual’s initial response (as noted already in the literature), secondary stages of
interpretive bias could then be involved in an individual’s recovery success (as noted in
Studies 4 and 5). Participants with stronger positive secondary biases might reappraise the
threat, and commence the process of recovery, while individuals with stronger negative
biases might ruminate on the stress or their response to it, thereby extending its effect and
delaying recovery. This theory ties in with the Perseverative Cognition Hypothesis
(Brosschot, Gerin, & Thayer, 2006), which assumes that “thinking about” or lingering on
stress can serve to prolong its impact through anticipatory effects and delayed recovery. This
extended response, if repeated regularly, could seriously disrupt homeostatic balance by
overloading a system that was originally designed to provide an immediate but temporary
solution. In other words, the stress response tap is being left turned on. Further tentative
evidence for this might be taken from the finding that participants who received positive
CBM-I training were found to release significantly less cortisol over the entirety of Study 5
relative to participants receiving sham training.
Assuming that interpretive bias does contribute to this prolonged activation there is
the potential for CBM-I methods, which have to date largely been sidelined in clinical
investigations for CBM-A targeted treatment, to greatly assist in rebalancing these
overloaded systems. Moreover, a combination treatment that targets both an overactive
inclination towards threat in addition to a healthier recovery from stressful episodes might

CHAPTER NINE
257
provide an even stronger treatment tool. Two recent studies have provided the first insight
into this collective approach, with results demonstrating its success in clinical settings (Beard,
Weisberg, & Amir, 2011; Brosan, Hoppitt, Shelfer, Sillence, & Mackintosh, 2011). The
current results support the use of CBM-I methods, either alone or integrated with CBM-A
training, and further encourage consideration of recovery abilities as a worthwhile aim of
these treatment tools.
9.5.5 Control group. In the between-subjects design of Studies 1 and 4, efforts were
made to include one experimental and one control condition. The social nature of the
experimental condition in both studies (social rejection/ostracism) made it difficult to include
a neutral reference condition, therefore both control conditions instead formed comparison
conditions that were more reflective of non-rejection/non-ostracism (i.e.
acceptance/inclusion). Blackhart, Eckel, and Tice’s (2007) original design (which Study 1
was based on) did include a control condition, where participants were not assigned a group
due to an administrative error rather than through being rejected or accepted. However, there
was no significant difference between the control and the acceptance group in terms of
positive or negative affect or cortisol responses to the task (Blackhart et al., 2007). For the
purpose of Study 1, in light of this finding, an acceptance group was favoured over the
administrative control group due to the procedure being more similar to the experimental
condition (i.e. both received social feedback).
By using comparison conditions that encompassed acceptance/inclusion it is possible
that fear of positive evaluation, which has been discussed in Studies 1 and 4 (Discussion),
acted as a confounding factor. For this reason it must be recognised that, while the
conclusions drawn from these studies remain valid in the contexts in which they were
reached, the effects cannot exclusively be attributed to either one condition. Study 1 has since
been concluded as unsuccessful in its overall aims, therefore this finding does not further

CHAPTER NINE
258
impact on any outcomes. For Study 4, the most interesting findings related to participants
responding generally to the self-presentation aspect (a within-subjects factor) rather than the
social manipulation (a between-subjects factor), therefore this point does not significantly
detract from the original and interesting findings that have been revealed. Nevertheless, a
design that includes an authentic control condition remains the ideal standard to provide
substantial clarity in attributing intervention effects.
9.5.6 Single measure dependence. One potentially significant limitation of the
studies contained within this thesis is in the reliance on solitary methods of measurement
taken to represent key constructs. This was first observed in Study 1, where it was suggested
that the method of saliva collection might be producing inaccurate and unreliable data.
Studies 2 and 3 sought to overcome this in as timely as manner as possible without deviating
from the main objectives of the thesis, and enabled the implementation of a best-practice
methodology for Studies 4 and 5.
Alternatively, the methods used to measure interpretive and attentional bias and to
train interpretive biases have not here been further investigated. It is important to note that
that while the methods used were chosen for justifiable reasons, they are not without their
limitations. In particular, the dot-probe task method of measuring biased attention has been
criticised as having poor test-retest reliability in non-clinical populations. Schmukle (2005)
explored this concept in a student population over a one-week period, with word pairs
relating to physical (e.g. tumour) or social (e.g. failure) threat. Test-retest reliability across
the week interval was not significant, while internal consistency was found to be very poor at
first measurement for all word pair combinations (α = .00) and at second measurement for
social threat word pairs and for physical and social threat word pairs combined (α = .00). For
physical threat word pairs at the second measurement point, Cronbach’s α = .06. The finding
of both internal inconsistency and unstable reliability led Schmukle to conclude that the dot-

CHAPTER NINE
259
probe task was an unreliable measure of bias index differentiation in this cohort. While this
appears to support the unexpected absence of links between attentional bias and
psychophysiological responses to stress in the non-clinical population in Study 4, that is not a
reason to blindly accept the supposition. Indeed, certain limitations of Schmukle’s
methodology could account for the weak findings. For example, Cronbach’s α was calculated
by dividing each of the 64 trials into groups of 4 (16 groups) and computing an α score based
on the ABI scores of these groups. Conventionally, ABI scores are derived from mean scores
of all trials to account for factors such as target-probe placement, therefore it could be argued
that splitting trials by group without controlling for these factors invites error and fabricated
variability. Second, while Schmukle describes the sample as non-clinical, there is no
descriptive data showing mean or range trait anxiety score of the group despite this being a
factor known to influence attention bias (e.g. Mogg, Bradley, & Hallowell, 1994). Further,
while studies that demonstrate the efficacy of CBM-A do suggest some stability of attention
bias, it is possible that biases in attention might also incorporate a state-like element that is
dependent on factors such as mood and alertness and environmental factors. If so, two
measures of bias taken a week apart might not be expected to share a particularly strong
correlation. Finally, while this point in itself is interesting, for the purpose of this thesis it
only relates to Study 4 and arguably not the interesting patterns that emerged in Study 6
regarding sensitivity to CBM training. This is owing to the fact that Schmukle’s study only
investigated the reliability of the task as a bias measurement tool (i.e. without CBM training),
consequently the effects cannot flippantly be generalised without further investigation.
9.5.7 Gender. As a noteworthy limitation in the external validity of this thesis,
Studies 1, 4, and 5 only recruited female participants. Gender was controlled in this manner
in recognition of the differing responses to acute stress procedures (e.g., Stroud, Salovey, &
Epel, 2002) and in consideration of findings from Study 2, which suggested that females

CHAPTER NINE
260
might respond differently to the process of giving saliva samples for the purposes of research.
These control measures were introduced in an attempt to reduce the amount of noise in the
data and promote a clearer understanding of the patterns of response. However Study 6,
which included both male and female participants, found that CBM procedures might not be
suitable for all individuals regardless of gender. This implies there to be certain aspects of the
relationship that might hold true for both genders. Naturally, further attempts to understand
the relationship between biased cognitions and the stress response should devote time and
effort into exploring the similarities and differences between genders.
As part of a self-report questionnaire measuring adherence to specific instructions
relating to study involvement, participants were required to record any medication they were
currently taking in all studies that included saliva sampling. One objective of this was to
capture patterns of oral contraception use. Hormonal contraception has been shown to
significantly influence levels of cortisol by changing binding practices, which results in
more/less free cortisol (which is measureable in saliva) being present (Granger, Hibel,
Fortunato, & Kapelewski, 2009). Further, use of hormonal contraception has recently been
linked to a reduced cortisol response following a psychosocial stress task (Roche, King,
Cohoon, & Lovallo, 2013).
Given the target population it seemed unfeasible to exclusively recruit non-
contraceptive users. It was initially hoped that monitoring oral contraceptive use would afford
understanding as to its statistical influence. However, the data collected for this purpose in
the present studies is likely to be unreliable owing to extremely low reporting which, in a
female undergraduate population, is highly unexpected (see Huber & Ersek, 2009). It is
argued that, in this instance, the question was misphrased thereby leading to the majority of
participants reporting only use of medication that is out of the ordinary in normal routines
(e.g. antibiotics, psychopharmacological medications, or medications for chronic poor

CHAPTER NINE
261
health), rather than an exhaustive list of any medication. This appears to have been an
unfortunate oversight and, as such, cannot be ruled out as an influencing factor in participant
responses though it is hoped that the random allocation procedure that was adopted in all
studies might at least have improved chances of equally weighted conditions.
9.5.8 Trend exploration. Throughout this thesis, trend interactions and main effects
have often been explored where they relate to a-priori hypotheses. This has been completed
in consideration of the accepted flexible license that accompanies a doctoral thesis compared
to studies that are written exclusively for the purpose of publication. Where studies within
this thesis have been independently prepared for peer review, a more formal approach has
been adopted in line with standard scientific practice.
9.6 Conclusion
The findings of this thesis assist the field by helping shape our understanding of the
processes by which cognitive biases operate and their limitations, the manners in which
clinical tools might realign maladaptive tendencies, and by suggesting fruitful avenues for
further research. Studies presented within this thesis did not document a robust link between
cognitive biases and emotional vulnerability to stress, and attentional bias showed no
relationship with physiological responses to stress. One possible explanation for not
documenting such links is that the studies presented here successfully induced ‘real’ feelings
of stress; overwhelming subjective capacity to cope with perceived demands. It is possible
that, at this level, cognitive biases have less of an influence on when a stress response is
initiated. This proposition is supported by the fact that, where previous studies have
succeeded in documenting the bias/emotion vulnerability link using ‘stress’ tasks, they have
induced only superficial representations of threat. As such, people who perceive threat
everywhere (i.e. through having a negative bias) produce a stress response comparable to a

CHAPTER NINE
262
‘real’ stressor, while individuals with a more positive bias correctly deem the situation as
benign. Further support for this notion arises from published studies that have effectively
demonstrated the potential for one session of CBM to act as a cognitive buffer to the future
perception of stress, which are also argued to have done so using a superficial stressor. In
contrast, Study 5 failed to clearly show this link though was found to induce ‘real’ feelings of
stress. Where ‘real’ stress has been successfully linked to trained biases previously, either
using clinical samples or real-life stressors, studies have consistently implemented a more
intense CBM training program involving multiple CBM sessions.
It is proposed that cognitive biases might influence initial vulnerability to stress by
governing what situations are perceived as stressful. The stress response is primarily an
adaptive process responsible for providing temporary relief to real threat. However, where
biases become too negative, it is argued that individuals consistently perceive threat where
none is present leading to excessive and unnecessary psychological and physiological
activation. The resulting hyper-anxious state would thereby increase the risk to developing
clinical disorders, while hyper-stimulation of the physiological stress systems would expose
an individual to associated health-related risks, such as high blood pressure and future
cardiovascular disease. Nevertheless, it should be noted that two independent studies
presented in this thesis suggest that interpretive biases are involved in the recovery from such
an episode of stress. This could imply that, following the establishment of a stress response,
biases then operate on the magnitude of a response. The theory proposed in this thesis
presents one possible account for the observed findings. In light of the extremely limited
number of studies that investigate the influence of biases on the biological stress response,
this theory would require significant further testing. Research might, for example, usefully be
directed towards comparing predictive capacities of biases on the stress response to
threatening and non-threatening situations to better understand the potential of this concept.

CHAPTER NINE
263
While the literature to date has considered CBM methods in terms of their ability to
generally reduce emotional vulnerability, the research in this thesis can be argued to support a
broader view of bias. Accordingly, under this notion, CBM might work by realigning
maladaptive biases so that a stress response is triggered only for genuinely threatening events,
rather than to benign events or to stopping it completely. If a lion appears in your path, failing
to attend to it or failing to construe it as an imminent threat will probably result in negative
consequences. Alternatively, failing to elicit appropriate escape responses due to an over-
active (and thus exhausted) stress system will likely lead to an equally disastrous outcome.
By rebalancing cognitions so that threats are only perceived when they present an actual
danger, stress responses are acute and effective, and recovery following the episode is rapid
and efficient, the physiological response can remain an adaptive process allowing you to do it
all again the next time a lion crosses your path.

REFERENCES
264
References
Aardal-Eriksson, E., Karlberg, B. E., & Holm, A. C. (1998). Salivary cortisol: An alternative
to serum cortisol determinations in dynamic function tests. Clinical Chemistry and
Laboratory Medicine, 36(4), 215-222. doi:110.1515/CCLM.1998.037
Aiken, L. S., & West, S. G. (1991). Multiple regression: Testing and interpreting
interactions. Newbury Park, CA: Sage.
Aitken, R. C. B. (1969). Measurement of feelings using visual analogue scales. Proceedings
of the Royal Society of Medicine-London, 62(10), 989.
Al’Absi, M., Petersen, K. L., & Wittmers, L. E. (2002). Adrenocortical and hemodynamic
predictors of pain perception in men and women. Pain, 96(1-2), 197-204.
doi:10.1016-S0304-3959(01)00447-X
Allwood, M. A., Handwerger, K., Kivlighan, K. T., Granger, D. A., & Stroud, L. R. (2011).
Direct and moderating links of salivary alpha-amylase and cortisol stress-reactivity to
youth behavioral and emotional adjustment. Biological Psychology, 88(1), 57-64.
doi:10.1016-j.biopsycho.2011.06.008
Amir, N., Beard, C., Burns, M., & Bomyea, J. (2009). Attention modification program in
individuals with generalized anxiety disorder. Journal of Abnormal Psychology,
118(1), 28-33. doi:10.1037-a0012589
Amir, N., Beard, C., Taylor, C. T., Klumpp, H., Elias, J., Burns, M., & Chen, X. (2009).
Attention training in individuals with generalized social phobia: A randomised
controlled trial. Journal of Consulting and Clinical Psychology, 77(5), 961-973.
doi:10.1037/a0016685

REFERENCES
265
Amir, N., Taylor, C. T., & Donohue, M. C. (2011). Predictors of response to an attention
modification program in generalized social phobia. Journal of Consulting and
Clinical Psychology, 79(4), 533-541. doi:10.1037/a0023808
Amir, N., Weber, G., Beard, C., Bomyea, J., & Taylor, C. T. (2008). The effect of a single-
session attention modification program on response to a public-speaking challenge in
socially anxious individuals. Journal of Abnormal Psychology, 117(4), 860-868.
doi:10.1037/a0013445
Anderson, L. C., Garret, J. R., Johnson, D. A., Kauffman, D. L., Keller, P. J., & Thulin, A.
(1984). Influence of circulating catecholamines on protein secretion into rat parotid-
saliva during parasympathetic stimulation. Journal of Psychology-London, 352, 163.
Andreano, J. M., & Cahill, L. (2006). Glucocorticoid release and memory consolidation in
men and women. Psychological Science, 17(6), 466-470. doi:10.111/j.1467-
9280.2006.01729.x
Asking, B. (1985). Sympathetic-stimulation of amylase secretion during a parasympathetic
background activity in the rat parotid-gland. Acta Physiologica Scandinavica, 124(4),
535-542. doi:10.1111/j.1748-1716-1985.tb00045.x
Aufricht, C., Tenner, W., Salzer, H. R., Khoss, A. E., Wurst, E., & Herkner, K. (1992).
Salivary IgA concentration is influenced by the saliva collection method. European
Journal of Clinical Chemistry and Clinical Biochemistry, 30 (2), 81-83.
Badrick, E., Bobak, M., Britton, A., Kirschbaum, C., Marmot, M., & Kumari, M. (2008). The
relationship between alcohol consumption and cortisol secretion in an aging cohort.
Journal of Clinical Endocrinology and Metabolism, 93(3), 750-757.
doi:10.1210/jc.2007-0737

REFERENCES
266
Baert, S., Koster, E. H. W., & De Raedt, R. (2011). Modification of information-processing
biases in emotional disorders: Clinically relevant developments in experimental
psychopathology. International Journal of Cognitive Therapy, 4(2), 208-222.
Bar-Haim, Y., Lamy, D., Pergamin, L., Bakermans-Kranenburg, M. J., & van IJzendoorn, M.
H. (2007). Threat-related attentional bias in anxious and nonanxious individuals: A
meta-analytic study. Psychological Bulletin, 133(1), 1-24. doi:10.1037/0033-
2909.133.1.1
Baum, B. J. (1993). Principles of saliva secretion. Annals of the New York Academy of
Sciences, 694, 17-23
Baumeister, R. F., & Leary, M. R. (1995). The need to belong – Desire for interpersonal
attachments as a fundamental human-motivation. Psychological Bulletin, 117(3), 497-
529. doi:10.1037/0033-2909.117.3.497
Beard, C. (2011). Cognitive bias modification for anxiety: Current evidence and future
directions. Expert Review of Neurotherapeutics, 11(2), 299-311.
doi:10.1586/ERN.10.194
Beard, C., & Amir, N. (2009). Interpretation in social anxiety: When meaning precedes
ambiguity. Cognitive Therapy and Research, 33(4), 406-415. doi:10.1007/s10608-
009-9235-0
Beard, C., Weisberg, R. B., & Amir, N. (2011). Combined cognitive bias modification
treatment for social anxiety disorder: A pilot trial. Depression and Anxiety, 28(11),
981-988. doi:10.1002/da.20873
Beltzer, E. K., Fortunato, C. K., Guaderrama, M. M., Peckins, M. K., Garramone, B. M., &
Granger, D. A. (2010). Salivary flow and alpha amylase: Collection technique,

REFERENCES
267
duration, and oral fluid type. Physiology and Behavior, 101(2), 289-296.
doi:10.1016/j.physbeh.2010.05.016
Berenson, K. R., Gyurak, A., Ayduk, O., Downey, G., Garner, M. J., Mogg, K., Bradley, B.
P., & Pine, D. S. (2009). Rejection sensitivity and disruption of attention by social
threat cues. Journal of Research in Personality, 43(6), 1064-1072.
doi:10.1016/j.jrp.2009.07.007
Bishop, N. C., Walker, G. J., Scanlon, G. A., Richards, S., & Rogers, E. (2006). Salivary IgA
responses to prolonged intensive exercise following caffeine ingestion. Medicine and
Science in Sports and Exercise, 38(3), 513-519.
doi:10.1249/01.mss.0000187412.47477.ee
Blackhart, G. C., Eckel, L. A., & Tice, D. M. (2007). Salivary cortisol in response to acute
social rejection and acceptance by peers. Biological Psychology, 75(3), 267-276.
doi:10.1016/j.biopsycho.2007.03.005
Blackwell, S. E., & Holmes, E. A. (2010). Modifying interpretation and imagination in
clinical depression: A single case series using cognitive bias modification. Applied
Cognitive Psychology, 24(3), 338-350. doi:10.1002/acp.1680
Bond, A., & Lader, M. (1974). Use of analog scales in rating subjective feelings. British
Journal of Medical Psychology, 47, 211-218.
Bosch, J. A., Brand, H. S., Ligtenberg, T. J. M., Bermond, B., Hoogstraten, J., & Amerongen,
A. V. N. (1996). Psychological stress as a determinant of protein levels and salivary-
induced aggregation of streptococcus gordonii in human whole saliva. Psychosomatic
Medicine, 58(4), 374-382.

REFERENCES
268
Bosch, J. A., Veerman, E. C. I., de Geus, E. J., & Proctor, G. B. (2011). Alpha-amylase as a
reliable and convenient measure of sympathetic activity: Don’t start salivating just
yet! Psychoneuroendocrinology, 36(4), 449-453. doi:10.1016/j.psyneuen.2010.12.019
Boyce, P., & Parker, G. (1989). Development of a scale to measure interpersonal sensitivity.
Australian and New Zealand Journal of Psychiatry, 23(3), 341-351.
Bradley, B. P., Hogg, K., White, J., Groom, C., & de Bono, J. (1999). Attentional bias for
emotional faces in generalized anxiety disorder. British Journal of Clinical
Psychology, 38, 267-278. doi:10.1348/014466599162845
Bristow, M., Cook, R., Edwards, M., & Veerapen, S. Measurement bias in the assessment of
mucosal immunity: Implication for stress research. Manuscript in preparation for
publication.
Brosan, L., Hoppitt, L., Shelfer, L., Sillence, A., & Mackintosh, B. (2011). Cognitive bias
modification for attention and interpretation reduces trait and state anxiety in anxious
patients referred to an out-patient service: Results from a pilot study. Journal of
Behavior Therapy and Experimental Psychiatry, 42(3), 258-264.
doi:10.1016/j.btep.2010.12.006
Brosschot, J. F., Gerin, W., & Thayer, J. F. (2006). The perseveration cognition hypothesis:
A review of worry, prolonged stress-related physiological activation and health.
Journal of Psychosomatic Research, 60(2), 113-124.
doi:10.1016/j.jpsychores.2005.06.074
Buchanan, T. W., al’Absi, M., Lovallo, W. R. (1999). Cortisol fluctuate with increases and
decreases in negative affect. Psychoneuroendocrinology, 24(2), 227-241.
doi:10.1016/S0306-4530(98)00078-X

REFERENCES
269
Buchanan, T. W., Kern, S., Allen, J. S., Tranel, D., & Kirschbaum, C. (2004). Circadian
variation of cortisol after hippocampal damage in humans. Biological Psychiatry,
56(9), 651-656. doi:10.1016/j.biopsych.2004.08.014
Butler, G., & Mathews, A. (1983). Cognitive-processes in anxiety. Advances in Behaviour
Research and Therapy, 5(1), 51-62. doi:10.1016/0146-6402(83)90015-2
Cacioppo, J. T., Ernst, J. M., Burleson, M. H., McClintock, M. K., Malarkey, W. B.
Hawkley, L. C., Kowalewski, R. B., Paulsen, A., Hobson, J. A., Hugdahl, K., Spiegel,
D., & Berntson, G. G. (2000). Lonely traits and concomitant physiological processes:
The MacArthur social neuroscience studies. International Journal of
Psychophysiology, 35(2-3), 143-154. doi:10.1016/S0167-8760(99)00049-5
Cannon, W. B. (1929). Bodily changes in pain, hunger, fear, and rage. New York: Reinhold.
Chahal, H. S., & Drake, W. M. (2007). The endocrine system and ageing. Journal of
Pathology, 211(2), 173-180. doi:10.1002/path.2110
Charmandari, E., Tsigos, C., & Chrousos, G. (2005). Endocrinology of the stress response.
Annual Review of Physiology, 67, 259-284.
doi:10.1146/annurev.physiol.67.040403.120816
Chatterton, R. T., Vogelsong, K. M., Lu, Y. C., Ellman, A. B., & Hudgens, G. A. (1996).
Salivary alpha-amylase as a measure of endogenous adrenergic activity. Clinical
Physiology, 16(4), 433-448. doi:10.1111/j.1475-097X.1996.tb00731.x
Chicharro, J. L., Lucia, A., Perez, M., Vaquero, A. F., & Urena, R. (1998). Saliva
composition and exercise. Sports Medicine, 26(1), 17-27. doi:10.2165/00007256-
199826010-00002
REFERENCES
270
Clark, D. M., & Wells, A. (1995). A cognitive model of social phobia. In R. Heimberg, M.
Liebowitz, D. Hope, & F. Schneider (Eds.), Social phobia: Diagnosis, assessment and
treatment. (pp. 69-93). New York: Guilford Press.
Clow, A. (2001). The physiology of stress. In F. Jones, & J. Bright (Eds.), Stress: Myth,
theory and research (pp. 47-61). Essex: Pearson Education Limited.
Cohen, S., & Hoberman, H. M. (1983). Positive events and social supports as buffers of life
change stress. Journal of Applied Social Psychology, 13(2), 99-125.
doi:10.1111/j.1559-1816.1983.tb02325.x
Cohen, S., Kamarck, T., & Mermelstein, R. (1983). A global measure of perceived stress.
Journal of Health and Social Behaviour, 24(4), 385-396. doi:10.2307/2136404
Cohen, S., & Williamson, G. M. (1988). Perceived stress in a probability sample of the
United-States. Social Psychology of Health, 31-67.
Costa, P. T., & McCrae, R. R. (1992). The 5-factor model of personality and its relevance to
personality-disorders. Journal of Personality Disorders, 6(4), 343-359.
Cox, T., & Mackay, C. J. (1981). A transactional approach to occupational stress. In E. N.
Corlett, & J. Richardson (Eds.), Stress, work design and productivity (pp. 210-259).
Chichester: Wiley & Sons.
Crawford, J. R., & Henry, J. D. (2004). The positive and negative affect schedule (PANAS):
Construct validity, measurement properties and normative data in a large non-clinical
sample. British Journal of Clinical Psychology, 43, 245-265.
doi:10.1348/0144665031752934

REFERENCES
271
Cross, S. E., & Madson, L. (1997). Models of the self: Self-construals and gender.
Psychological Bulletin, 122(1), 5-37. doi:10.1037/0033-2909.122.1.5
Dallman, M. R. (2010). Stress-induced obesity and the emotional nervous system. Trends in
Endocrinology and Metabolism, 21 (3), 156-165. doi: 10.1016/j.tem.2009.10.004
Dandeneau, S. D., Baldwin, M. W., Baccus, J. R., Sakallaropoulo, M., & Pruessner, J. C.
(2007). Cutting stress of at the pass: Reducing vigilance and responsiveness to social
threat by manipulating attention. Journal of Personality and Social Psychology, 93(4),
651-666. doi:10.1037/0022-3514.93.4.651
Deardorff, J., Gonzales, N. A., & Sandler, I. N. (2003). Control beliefs as a mediator of the
relation between stress and depressive symptoms among inner-city adolescents.
Journal of Abnormal Child Psychology, 31 (2), 205-217. doi:
10.1023/A:1022582410183
DeCaro, J. A. (2008). Methodological considerations in the use of salivary alpha-amylase as
a stress marker in field research. American Journal of Human Biology, 20(5), 617-
619. doi:10.1002/ajhb.20795
Dedovic, K., Renwick, R., Mahani, N. K., Engert, V., Lupien, S. J., & Pruessner, J. C.
(2005). The Montreal Imaging Stress Task: Using functional imaging to investigate
the effects of perceiving and processing psychosocial stress in the human brain.
Journal of Psychiatry and Neuroscience, 30(5), 319-325.
Dekker, M. J. H. J., Koper, J. W., van Aken, M. O., Pols, H. A. P., Hofman, A., de Jong, F.
H., Kirschbaum, C., Witteman, J. C. M., Lamberts, S. W. J., & Tiemeier, H. (2008).
Salivary cortisol is related to atherosclerosis of carotid arteries. Journal of Clinical
Endocrinology and Metabolism, 93 (10), 3741-3747. doi: 10.1210/jc.2008-0496

REFERENCES
272
De Weerth, C., Zijl, R. H., & Buitelaar, J. K. (2003). Development of cortisol circadian
rhythm in infancy. Early Human Development, 73(1-2), 39-52. doi:10.1016/S0378-
3782(03)00074-4
Dickerson, S. S., & Kemeny, M. E. (2004). Acute stressors and cortisol responses: A
theoretical integration and synthesis of laboratory research. Psychological Bulletin,
130(3), 335-391. doi:10.1037/0033-2909.130.3.355
Dickerson, S. S., Mycek, P. J., & Zaldivar, F. (2008). Negative social evaluation, but not
mere social presence, elicits cortisol responses to a laboratory stressor task. Health
Psychology, 27(1), 116-121. doi:10.1037/0278-6133.27.1.116
Downey, G., & Feldman, S. I. (1996). Implications of rejection sensitivity for intimate
relationships. Journal of Personality and Social Psychology, 70(6), 1327-1343.
doi:10.1037//0022-3514.70.6.1327
Edwards, S., Evans, P., Hucklebridge, F., & Clow, A., (2001). Association between time of
awakening and diurnal cortisol secretory activity. Psychoneuroendocrinology, 26(6),
613-622. doi:10.1016/S0306-4530(01)00015-4
Ellenbogen, M. A., Schwartzman, A. E., Stewart, J., & Walker, C. D. (2002). Stress and
selective attention: The interplay of mood, cortisol levels, and emotional information
processing. Psychophysiology, 39(6), 723-732. doi:10.1017-S0048577202010739
El-Sheikh, M., Erath, S. A., Buckhalt, J. A., Granger, D. A., & Miza, J. (2008). Cortisol and
children’s adjustment: The moderating role of sympathetic nervous system activity.
Journal of Abnormal Child Psychology, 36 (4), 601-611. doi: 10-1007/s10802-007-
9204-6

REFERENCES
273
Enberg, N., Alho, H., Loimaranta, V., & Lenander-Lumikari, M. (2001). Saliva flow rate and
salivary composition during acute alcohol consumption. Journal of Dental Research,
80(4), 1302-1302.
Engert, V., Vogel, S., Efanov, S. I., Duchesne, A., Corbo, V., Ali, N., & Pruessner, J. C.
(2011). Investigation into the cross-correlation of salivary cortisol and alpha-amylase
responses to psychological stress. Psychoneuroendocrinology, 36(9), 1294-1302.
doi:10.1016/j.psyneuen.2011.02.018
Eysenck, M. W., MacLeod, C., & Mathews, A. (1987). Cognitive-functioning and anxiety.
Psychological Research-Psychologische Forschung, 49(2-3), 189-195.
doi:10.1007/BF00308686
Faul, F., Erdfelder, E., Lang, A. -G., & Buchner, A. (2007). G*Power 3: A flexible statistical
power analysis program for the social, behavioral, and biomedical sciences. Behavior
Research Methods, 39, 175-191.
Fiocco, A. J., Joober, R., & Lupien, S. J. (2007). Education modulates cortisol reactivity to
the Trier Social Stress Test in middle-aged adults. Psychoneuroendocrinology, 32(8-
10), 1158-1163. doi:10.1016/j.psychoneun.2007.08.008
Fisher, A. J., Granger, D. A., & Newman, M. G. (2010). Sympathetic arousal moderates self-
reported physiological arousal symptoms at baseline and physiological flexibility in
response to a stressor in generalized anxiety disorder. Biological Psychology, 83(3),
191-200. doi:10.1016/j.biopsycho.2009.12.007
Foa, E. B., & Kozak, M. J. (1986). Emotional processing of fear – Exposure to corrective
information. Psychological Bulletin, 99(1), 20-35. doi:10.1037//0033-2909.99.1.20

REFERENCES
274
Fox, E., Cahill, S., & Zougkou, K. (2010). Preconscious processing biases predict emotional
reactivity to stress. Biological Psychology, 67(4), 371-377.
doi.10.1016/j.biopsych.2009.11.0.18
French, C. C., & Richards, A. (1992). Word-association norms for a set of threat neutral
homographs. Cognition and Emotion, 6(1), 65-87. doi:10.1080/02699939208411058
Gaab, J., Huster, D., Peisen, R., Engert, V., Heitz, V., Schad, T., Schurmeyer, T. H., &
Ehlert, U. (2002). Hypothalamic-pituitary-adrenal axis reactivity in chronic fatigue
syndrome and health under psychological, physiological, pharmacological
stimulation. Psychosomatic Medicine, 64(6), 951-962.
doi:10.1097/01.PSY.0000038937.67401.61
Gaab, J., Rohleder, N., Nater, U. M., & Ehlert, U. (2005). Psychological determinants of the
cortisol stress response: The role of anticipatory cognitive appraisal.
Psychoneuroendocrinology, 30(6), 599-610. doi:10.1016/j.psyneuen.2005.02.001
Galosy, R. A., Clarke, L. K., Vasko, M. R., & Crawford, I. L. (1981). Neurophysiology and
neuropharmacology of cardiovascular regulation and stress. Neuroscience and
Biobehavioral Reviews, 5 (1), 137-175. doi: 10.1016/0149-7634(81)90040-3
Garrett, J. R. (1987). The proper role of nerves in salivary secretion – A review. Journal of
Dental Research, 66(2), 387-397. doi:10.1177/00220345870660020201
Ghiciuc, C. M., Cozma-Dima, C. L., Pasquali, V., Renzi, P., Simeoni, S., Lupusoru, C. E., &
Patacchioli, F. R. (2011). Awakening responses and diurnal fluctuations of salivary
cortisol, DHEA-S and alpha-amylase in healthy male subjects. Neuroendocrinology
Letters, 32 (4), 475-480.

REFERENCES
275
Gilman, S., Thornton, R., Miller, D., & Biersner, R. (1979). Effects of exercise stress on
parotid-gland secretion. Hormone and Metabolic Research, 11(7), 454-454.
Goldberg, L. R., Johnson, J. A., Eber, H. W., Hogan, R., Ashton, M. C., Cloninger, C. R., &
Gough, H. C. (2006). The International Personality Item Pool and the future of public-
domain personality measures. Journal of Research in Personality, 40(1), 84-96.
doi:10.1016/j.jrp.2005.08.007
Goldberg, P. (1972). The detection of psychiatric illness by questionnaire. Oxford: Oxford
University Press.
Goldberg, P., & Williams, P. (1988). A user’s guide to the General Health Questionnaire.
Windsor: Nfer-Nelson.
Gonsalkorale, K, & Williams, K. D. (2007). The KKK won’t let me play: Ostracism even by
a despised outgroup hurts. European Journal of Social Psychology, 37(6), 1176-1186.
doi:10.1002/ejsp.392
Goodacre, R., & Zadro, L. (2010). O-Cam: A new paradigm for investigating the effects of
ostracism. Behavior Research Methods, 42(3), 768-774. doi:10.3758/BRM.42.3.768
Gosselin, P., & Laberge, B. (2003). Etiological factors of generalized anxiety disorder.
Encephale-Revue de Psychiatrie Clinique Biologique et Therapeutique, 29(4), 351-
361.
Gotlib, I. H., & McCann, C. D. (1984). Construct accessibility and depression – An
examination of cognitive and affective factors. Journal of Personality and Social
Psychology, 47(2), 427-439. doi:10.1037/0022-3514.47.2.427

REFERENCES
276
Granger, D. A., Hibel, L. C., Fortunato, C. K., & Kapelewski, C. H. (2009). Medication
effects of salivary cortisol: Tactics and strategy to minimize impact on behavioral and
developmental science. Psychoneuroendocrinology, 34, 1437-1448.
Granger, D. A., Kivlighan, K. T., Fortunato, C., Harmon, A. G., Hibel, L. C., Schwartz, E. B.,
& Whembolua, G. L. (2007). Integration of salivary biomarkers into developmental
and behaviorally-oriented research: Problems and solutions for collecting specimens.
Physiology and Behavior, 92(4), 583-590. doi:10.1016/j.physbeh.2007.05.004
Granger, D. A. Schwartz, E. B. Booth, A., Curran, M., & Zakaria, D. (1999). Assessing
dehydroepiandrosterone in saliva: A simple radioimmunoassay for use in studies of
children, adolescents and adults. Psychoneuroendocrinology, 24(5), 567-579.
doi:10.1016/S0306-4530(99)00013-X
Grey, S., & Mathews, A. (2000). Effects of training on interpretation of emotional ambiguity.
Quarterly Journal of Experimental Psychology Section A-Human Experimental
Psychology, 53(4), 1143-1162. doi:10.1080/02724980050156335
Gunther Moor, B., Crone, E. A., van der Molen, M. W. (2010). The heartbrake of social
rejection: Heart rate deceleration in response to unexpected peer rejection.
Psychological Science, 21(9), 1326-1333.
Hazlett-Stevens, H., & Borkovec, T. D. (2004). Interpretive cues and ambiguity in
generalized anxiety disorder. Behaviour Research and Therapy, 42 (8), 881-892. doi:
10.1016/S0005-7967(03)00204-3
Health and Safety Executive. (2011). Stress and psychological disorders. Retrieved from
http://www.hse.gov.uk/statistics/causdis/stress/stress.pdf

REFERENCES
277
Heilman, K. J., Bal, E., Bazhenova, O. V., Sorokin, Y., Perlman, S. B., Hanley, M. C., &
Porges, S. W. (2008). Physiological responses to social and physical challenges in
children: Quantifying mechanisms supporting social engagement and mobilization
behaviors. Developmental Psychobiology, 50(2), 171-182. doi:10.1002/dev.20257
Hellhammer, D. H., Heib, C., Hubert, W., & Rolf, L. (1985). Relationships between salivary
cortisol release and behavioural coping under examination stress. IRCS Medical
Science-Biochemistry, 13(12), 1179-1180.
Henry, J. D., & Crawford, J. R. (2005). The short-form version of the Depression Anxiety
Stress-Scale (DASS-21): Construct validity and normative data in a large non-clinical
sample. British Journal of Clinical Psychology, 44, 227-239.
doi:10.1348/014466505X29657
Hirsch, C., & Mathews, A. (1997). Interpretative inferences when reading about emotional
events. Behaviour Research and Therapy, 35(12), 1123-1132. doi:10.1016/S0005-
7967(97)00069-7
Holmbeck, G. N. (2002). Post-hoc probing of significant moderational and meditational
effects in studies of pediatric populations. Journal of Pediatric Psychology, 27(1), 87-
96. doi:10.1093/jpepsy/27.1.87
Hoppitt, L., Mackintosh, B., Randall, K., & Bristow, M. The effect of threat-related
interpretive bias on cortisol reactivity. Manuscript in preparation for publication.
Horrocks, P. M., Jones, A. F., Ratcliffe, W. A., Holder, G., White, A., Holder, R., Ratcliffe, J.
G., & London, D. R. (1990). Patterns of ACTH and cortisol pulsatility over 24 hours
in normal males and females. Clinical Endocrinology, 32(1), 127-134.
doi:10.1111/j.1365-2265.1990.tb03758.x

REFERENCES
278
Huber, L. R., & Ersek, J. L. (2009). Contraceptive use among sexually active university
students. Journal of Women’s Health, 18(7), 1063-1070. doi:10.1089/jwh.2008.1131
Humphrey, S. P., & Williamson, R. T. (2001). A review of saliva: Normal composition, flow,
and function. Journal of Prosthetic Dentistry, 85(2), 162-169.
doi:10.1067/mpr.2001.113778
Jackson, C. (2007). The General Health Questionnaire. Occupational Medicine-Oxford,
57(1), 79. doi:10.1093/occmed/kql169
Joorman, J., Hertel, P. T., LeMoult, J., & Gotlib, I. H. (2009). Training forgetting of negative
material in depression. Journal of Abnormal Psychology, 118(1), 34-43.
doi:10.1037/a0013794
Kennedy, B., Dillon, E., Mills, P. J., & Ziegler, M. G. (2001). Catecholamines in human
saliva. Life Sciences, 69(1), 87-99. doi:10.1016/S0024-3205(01)01111-0
Kirschbaum, C. (1991). Cortisolmessung im speichel: Eine methode der biologischen
psychologie. Bern: Huber.
Kirschbaum, C., & Hellhammer, D. H. (1989). Salivary cortisol in psychobiological research
– An overview. Neuropsychobiology, 22(3), 150-169. doi:10.1159/000118611
Kirschbaum, C., & Hallhammer, D. H. (1994). Salivary cortisol in psychoneuroendocrine
research – Recent developments and applications. Psychoneuroendocrinology, 19(4),
313-333. doi:10.1016/0306-4530(94)90013-2
Kirschbaum, C., Kudielka, B. M., Gaab, J., Schommer, N. C., & Hellhammer, D. H. (1999).
Impact of gender, menstrual cycle phase, and oral contraceptives on the activity of the
hypothalamus-pituitary-adrenal axis. Psychosomatic Medicine, 61(2), 154-162.

REFERENCES
279
Kirschbaum, C., Pirke, K. M., & Hellhammer, D. H. (1993). The Trier Social Stress Test – A
tool for investigating psychobiological stress responses in a laboratory setting.
Neuropsychobiology, 28(1-2), 76-81. doi:10.1159/000119004
Kirschbaum, C., Wust, S., & Hellhammer, D. (1992). Consistent sex-differences in cortisol
responses to psychological stress. Psychosomatic Medicine, 54(6), 648-657.
Kirschbaum, C., Wust, S., & Strasburger, C. J. (1992). Normal cigarette-smoking increases
free cortisol in habitual smokers. Life Sciences, 50(6), 435-442. doi:10.1016/0024-
3205(92)90378-3
Koster, E. H. W., Baert, S., Bockstaele, M., & De Raedt, R. (2010). Attentional retraining
procedures: Manipulating early or late components of attentional bias? Emotion,
10(2), 230-236. doi:10.1037/a0018424
Koster, E. H. W., Crombez, G., Verschuere, B., & De Houwer, J. (2004). Selective attention
to threat in the dot probe paradigm: Differentiating vigilance and difficulty to
disengage. Behaviour Research and Therapy, 42(10), 1183-1192.
doi:10.1016/j.brat.2003.08.001
Koster, E. H. W., Verschuere, B., Crombez, G., & Van Damme, S. (2005). Time-course of
attention for threatening pictures in high and low trait anxiety. Behaviour Research
and Therapy, 43(8), 1087-1098. doi:10.1016/j.brat.2004.08.004
Kudielka, B. M., & Kirschbaum, C. (2003). Awakening cortisol responses are influenced by
health status and awakening time but not by menstrual cycle phase.
Psychoneuroendocrinology, 28 (1), 35-47. doi:10.1016/S0306-4530(02)00008-2
Kudielka, B. M., Schommer, N. C., Hellhammer, D. H., & Kirschbaum, C. (2004). Acute
HPA axis responses, heart rate, and mood changes to psychosocial stress (TSST) in

REFERENCES
280
humans at different times of day. Psychoneuroendocrinology, 29(8), 983-992.
doi:10.1016/j.psyneuen.2003.08.009
Kune, N. (1992). The need to belong: Rediscovering Maslow’s hierarchy of needs. In R. A.
Villa, J. S. Thousand, W. Stainback, & S. Stainback (Eds.), Restructuring for caring
and effective education: An administrative guide to creating heterogeneous schools
(pp. 58-72), Baltimore, MD: Paul H. Brookes.
Kunz-Ebrecht, S. R., Kirschbaum, C., Marmot, M., & Steptoe, A. (2004). Differences in
cortisol awakening response on work days and weekends in women and men from the
Whitehall II cohort. Psychoneuroendocrinology, 29 (4), 516-528. doi:
10.1016/S0306-4530(03)00072-6
Lang, P. J., & McTeague, L. M. (2009). The anxiety disorder spectrum: Fear imagery,
physiological reactivity, and differential diagnosis. Anxiety Stress and Coping, 22(1),
5-25. doi:10.1080/10615800802478247
Lau, R., & Morse, C. (2005). Evaluating parental stress experiences following preterm birth.
In K. V. Oxington (Ed.), Stress and health: New research (pp. 103-123). Victoria,
Canada: Nova Science.
Lavy, E., Van Den Hout, M., & Arntz, A. (1993). Attentional bias and spider phobia –
Conceptual and clinical issues. Behaviour Research and Therapy, 31(1), 17-24.
doi:10.1016/0005-7967(93)90038-V
Lazarus, R. S. (1991). Progress on a cognitive motivational relational theory of emotion.
American Psychologist, 46(8), 819-834. doi:10.1037//0003-066X.46.8.819
Lazarus, R. S., & Folkman, S. (1984). Stress, appraisal, and coping. New York: Springer.

REFERENCES
281
Lesage, F. X., Berjot, S., Deschamps, F. (2012). Psychometric properties of the French
versions of the Perceived Stress Scale. International Journal of Occupational
Medicine and Environmental Health, 25 (2), 178-184. doi: 10.2478/S13382-012-
0024-8
Lovallo, W. R., Whitsett, T. L., Al’Absi, M., Sung, B. H., Vincent, A. S., & Wilson, M. F.
(2005). Caffeine stimulation of cortisol secretion across the waking hours in relation
to caffeine intake levels. Psychosomatic Medicine, 67(5), 734-739.
doi:10.1097/01.psy.0000181270.20036.06
Lovibond, P. F., & Lovibond, S. H. (1995a). The structure of negative emotional states –
Comparison of the Depression Anxiety Stress Scales (DASS) with the Beck
Depression and Anxiety Inventories. Behaviours Research and Therapy, 33(3), 335-
343. doi:10.1016/0005-7967(94)00075-U
Lovibond, S. H., & Lovibond, P. F. (1995b). Manual for the Depression Anxiety Stress
Scales (2nd ed.). Sydney, Australia: Psychology Foundation.
Mackay, C., Cox, T., Burrows, G., & Lazzerini, T. (1978). Inventory for measurement of
self-reported stress and arousal. British Journal of Social and Clinical Psychology, 17,
283-284.
Mackintosh, B., Mathews, A., Eckstein, D., & Hoppitt, L. Specificity effects in the
modification of interpretation bias. Manuscript in preparation for publication.
Mackintosh, B., Mathews, A., Yiend, J., Ridgeway, V., & Cook, E. (2006). Induced biases in
emotional interpretation influence stress vulnerability and endure despite changes in
context. Behavior Therapy, 37(3), 209-222. doi:10.1016/j.beth.2006.03.001

REFERENCES
282
MacLeod, C., & Cohen, I. L. (1993). Anxiety and the interpretation of ambiguity – A text
comprehension study. Journal of Abnormal Psychology, 102(2), 238-247.
doi:10.1037//0021-843X.102.2.238
MacLeod, C., & Hagan, R. (1992). Individual-differences in the selective processing of
threatening information, and emotional responses to a stressful life event. Behaviour
Research and Therapy, 20(2), 151-161.
MacLeod, C., Mathews, A., & Tata, P. (1986). Attentional bias in emotional disorders.
Journal of Abnormal Psychology, 95(1), 15-20. doi:10.1037//0021-843X.95.1.15
MacLeod, C, Rutherford, E., Campbell, L., Ebsworthy, G., & Holker, L. (2002). Selective
attention and emotional vulnerability: Assessing the causal basis of their association
through the experimental manipulation of attentional bias. Journal of Abnormal
Psychology, 111(1), 107-123. doi:10.1037//0021-843X.111.1.107
Mantella, R. C., Butters, M. A., Amico, J. A., Muzumdar, S., Rollman, B. L., Begley, A. E.,
Reynolds, C. F., & Lenze, E. J. (2008). Salivary cortisol is associated with diagnosis
and severity of late-life generalised anxiety disorder. Psychoneuroendocrinology, 33
(6), 773-781. doi: 10.1016/j.psyneuen.2008.03.002
Maslow, A. H. (1943). Conflict, frustration, and the theory of threat. Journal of Abnormal
and Social Psychology, 38, 81-86.
Mathews, A., & Bradley, B. (1983). Mood and the self-reference bias in recall. Behaviour
Research and Therapy, 21(3), 233-239. doi:10.1016/0005-7967(83)90204-8
Mathews, A., & Mackintosh, B. (1998). A cognitive model of selective processing in anxiety.
Cognitive Therapy and Research, 22(6), 539-560. doi:10.1023/A.1018738019346

REFERENCES
283
Mathews, A., & Mackintosh, B. (2000). Induced emotional interpretation bias and anxiety.
Journal of Abnormal Psychology, 109(4), 602-615. doi:10.1037/0021-
843X.109.4.602
Mathews, A., Richards, A., & Eysenck, M. (1989). Interpretation of homophones related to
threat in anxiety-states. Journal of Abnormal Psychology, 98(1), 31-34.
doi:10.1037/0021-843X.98.1.31
Mathews, A., Ridgeway, V., Cook, E., & Yiend, J. (2007). Inducing a benign interpretational
bias reduces trait anxiety. Journal of Behavior Therapy and Experimental Psychiatry,
38(2), 225-236. doi:10.1016-j.jbtep.2006.10.011
McEwen, B. S. (2000). The neurobiology of stress: From serendipity to clinical relevance.
Brain Research, 886 (1-2), 172-189. doi: 10.1016/S00006-8993(00)02950-4
McEwen, B. S. (2005). Stressed or stressed out: What is the difference? Journal of Psychiatry
and Neuroscience, 30(5), 315-318.
McEwen, B. S., & Wingfield, J. C. (2003). The concept of allostasis in biology and
biomedicine. Hormones and Behavior, 43(1), 2-15. doi:10.1016/S0018-
506X(02)0024-7
Messenger, B., Clifford, M. N., & Morgan, L. M. (2003). Glucose-dependent insulinotropic
polypeptide and insulin-like immunoreactivity in saliva following sham-fed and
swallowed meals. Journal of Endocrinology, 117(3), 407-412.
doi:10.1677/joe.0.1770407
Miller, G. E., Chen, E., & Zhou, E. S. (2007). If it goes up, must it come down? Chronic
stress and the hypothalamic-pituitary-adrenocortical axis in humans. Psychological
Bulletin, 133 (1), 25-45. doi: 10.1037/0033-2909.133.1.25

REFERENCES
284
Mind Garden, Inc. (2010). State-Trait Anxiety Inventory for Adults. Retrieved from
http://www.mindgarden.com/products/staisad.htm
Mogg, K., Bradley, B. P., & Hallowell, N. (1994). Attentional bias to threat: Roles of trait
anxiety, stressful events and awareness. Quarterly Journal of Experimental
Psychology, 47, 841-864.
Musa, C., Lepine, J. P., Clark, D. M., Mansell, W., & Ehlers, A. (2003). Selective attention in
social phobia and the moderating effect of a concurrent depressive disorder.
Behaviour Research and Therapy, 41(9), 1043-1054. doi:10.1016/S0005-
7967(02)00212-7
Nater, U. M., La Marca, R., Florin, L., Moses, A., Langhans, W., Koller, M. M., & Ehlert, U.
(2006). Stress-induced changes in human salivary alpha-amylase activity –
Associations with adrenergic activity. Psychoneuroendocrinology, 31(1), 49-58.
doi:10.1016/j.psyneuen.2005.05.010
Nater, U. M. & Rohleder, N. (2009). Salivary alpha-amylase as a non-invasive biomarker for
the sympathetic nervous system: Current state of research.
Psychoneuroendocrinology, 34(4), 486-496. doi:10.1016/j.psyneuen.2009.01.014
Nater, U. M., Rohleder, N., Gaab, J., Berger, S., Jud, A., Kirschbaum, C., & Ehlert, U.
(2005). Human salivary alpha-amylase reactivity in a psychosocial stress paradigm.
International Journal of Psychophysiology, 55(3), 333-342.
doi:10.1016/j.ijpsycho.2004.09.009
Nater, U. M., Rohleder, N., Schlotz, W., Ehlert, U., & Kirschbaum, C. (2007). Determinants
of the diurnal course of salivary alpha-amylase. Psychoneuroendocrinology, 32(4),
392-401. doi:10.1016/j.psyneuen.2007.02.007

REFERENCES
285
Nejtek, V. A. (2002). High and low emotion events influence emotional stress perceptions
and are associated with salivary cortisol response changes in a consecutive stress
paradigm. Psychoneuroendocrinology, 27(3), 337-352. doi:10.1016/S0306-
4530(01)00055-5
Nicolson, N. A. (2008). Measurement of cortisol. In L. J. Luecken, & L. C. Gallo (Eds.),
Handbook of physiological research methods in health psychology (pp 37-74). Los
Angeles: Sage.
O’Connor, D. B., Cobb, J., & O’Connor, R. C. (2003). Religiosity, stress and psychological
distress: No evidence for an association among undergraduate students. Personality
and Individual Differences, 34(2), 211-217. doi:10.1016/S0191-8869(02)00035-1
Ӧhman, A. (1993). Fear and anxiety as emotional phenomena. In M. Lewis, & J. Haviland
(Eds.), Handbook of emotions (pp. 511-536). New York: Guilford Press.
Oswald, L. M., Zandi, P., Nestadt, G., Potash, J. B., Kalaydijan, A. E., & Wand, G. S. (2006).
Relationship between cortisol responses to stress and personality.
Neuropsychopharmacology, 31(7), 1583-1591. doi:10.1038/sj.npp.1301012
Ouimet, A. J., Gawronski, B., & Dozois, D. J. A. (2009). Cognitive vulnerability to anxiety:
A review and an integrative model. Clinical Psychology Review, 29(6), 459-470.
doi:10.1016/j.cpr.2009.05.004
Pilgrim, K., Marin, M. F., & Lupien, S. J. (2010). Attentional orienting toward social stress
stimuli predicts increased cortisol responsivity to psychosocial stress irrespective of
the early socioeconomic status. Psychoneuroendocrinology, 35(4), 588-595.
doi:10.1016/j.psyneuen.2009.09.015

REFERENCES
286
Plotsky, P. M., Owens, M. J., & Nemeroff, C. B. (1998). Psychoneuroendocrinology of
depression: Hypothalamic-pituitary-adrenal axis. Psychiatric Clinics of North
America, 21 (2), 293-307. doi: 10.1016/S0193-953X(05)70006-X
Pruessner, J. C., Gaab, J., Hallhammer, D. H., Lintz, D., Schommer, N., & Kirschbaum, C.
(1997). Increasing correlations between personality traits and cortisol stress responses
obtained by data aggregation. Psychoneuroendocrinology, 22(8), 615-625.
doi:10.1016/S0306-4530(97)00072-3
Pruessner, J. C., Hellhammer, D. H., & Kirschbaum, C. (1999). Low self-esteem, induced
failure and the adrenocortical stress response. Personality and Individual Differences,
27(3), 477-489. doi:10.1016/S0191-8869(98)00256-6
Pruessner, M., Hellhammer, D. H., Pruessner, J. C., & Lupien, S. J. (2003). Self-reported
depressive symptoms and stress levels in healthy young men: Associations with the
cortisol response to awakening. Psychosomatic Medicine, 65 (1), 92-99. doi:
10.1097/01.PSY.0000040950.22044.10
Pury, C. L. S. (2002). Information-processing predictors of emotional response to stress.
Cognition and Emotion, 16(5), 667-683. Doi:10.1080/02699930143000400
Putman, P., Hermans, E. J., Koppeschaar, H., Van Schijndel, A., & Van Honk, J. (2007). A
single administration of cortisol acutely reduces preconscious attention for fear in
anxious young men. Psychoneuroendocrinology, 32(7), 793-802.
doi:10.1016/j.psyneuen.2007.05.009
Putman, P., Hermans, E. J., & Van Honk, J. (2010). Cortisol administration acutely reduces
threat-selective spatial attention in healthy young men. Physiology and Behavior,
99(3), 294-300. doi:10.1016/j.phybeh.2009.11.006

REFERENCES
287
Roche, D. J., King, A. C., Cohoon, A. J., & Lovallo, W. R. (2013). Hormonal contraceptive
use diminishes salivary cortisol response to psychosocial stress and naltrexone in
healthy women. Pharmacology, Biochemistry, and Behavior, 109, 84-90.
doi:10.1016/j.pbb.2013.05.007
Rohleder, N., & Nater, U. M. (2009). Determinants of salivary alpha-amylase in humans and
methodological considerations. Psychoneuroendocrinology, 34(4), 469-485.
doi:10.1016/j.psyneuen.20008.12.004
Rohleder, N., Nater, U. M., Wolf, J. M., Ehlert, U., & Kirschbaum, C. (2004). Psychosocial
stress-induced activation of salivary alpha-amylase – An indicator of sympathetic
activity? Biobehavioral Stress Response: Protective and Damaging Effects, 1032,
258-263. doi:10.1196/annals.1314.033
Rohleder, N., Wolf, J. M., Maldonado, E. F., & Kirschbaum, C. (2006). The psychosocial
stress-induced increase in salivary alpha-amylase is independent of saliva flow rate.
Psychophysiology, 43(6), 645-652. doi:10.1111/j.1469-8986.2006.00457.x
Salemink, E., & van den Hout, M. (2010a). Validation of the “recognition task” used in the
training of interpretation biases. Journal of Behavior Therapy and Experimental
Psychiatry, 41(2), 140-144. doi:10.1016/j.jbtep.2009.11.006
Salemink, E., & van den Hout, M. (2010b). Trained interpretive bias survives mood change.
Journal of Behavior Therapy and Experimental Psychiatry, 41(3), 310-315.
doi:10.1016/j.jbtep.2010.02.010
Salemink, E., van den Hout, M., & Kindt, M. (2009). Effects of positive interpretive bias
modification in highly anxious individuals. Journal of Anxiety Disorders, 23(5), 676-
683. doi:10.1016/j.janxdis.2009.02.006

REFERENCES
288
Salemink, E., van den Hout, M., & Kindt, M. (2010). Generalisation of modified interpretive
bias across tasks and domains. Cognition and Emotion, 24(3), 453-464.
doi:10.1080/02699930802692053
Salimetrics, LLC. (2011). Saliva collection and handling advice (2nd edition). Retrieved
from http://www.salimetrics.com/assets/documents/spit-tips/publications/Saliva%20
Collection%20Handbook.pdf
Salimetrics, LLC. (2012). Correcting salivary α-amylase activity for flow rate. Retrieved
from http://www.salimetrics.com/assets/documents/spit-tips/publications/Correcting
%20Alpha-Amylase%20Activity%20for%20Flow%20Rate.pdf
Salvador, A. (2005). Coping with competitive situations in human. Neuroscience and
Biobehavioral Reviews, 29(1), 195-205. doi:10.1016/j.neubiorev.2004.07.004
Sarason, I. G. (1978). The Test Anxiety Scale: Concept and research. In C. D. Spielberger, &
I. G. Sarason ((Eds.), Stress and anxiety (pp. 193-216). Washington DC: Hemisphere.
Schartau, P. E. S., Dalgleish, T., & Dunn, B. D. (2009). Seeing the bigger picture: Training in
perspective broadening reduces self-reported affect and psychophysiological response
to distressing films and autobiographical memories. Journal of Abnormal Psychology,
118(1), 15-27. doi:10.1037/a0012906
Schenkels, L. C. P. M., Veerman, E. C. I., & Nieuw Amerongen, A. V. N. (1995).
Biochemical-composition of human saliva in relation to other mucosal fluids. Critical
Reviews in Oral Biology and Medicine, 6 (2), 161-175. doi:
10.1177/10454411950060020501
Schlotz, W., Hellhammer, J., Schultz, P., & Stone, A. A. (2004). Perceived work overload
and chronic worrying predict weekend-weekday differences in the cortisol awakening

REFERENCES
289
response. Psychosomatic Medicine, 66 (2), 207-214. doi:
10.1097/01.psy.0000116715.78238.56
Schmidt, N. B., Richey, J. A., Buckner, J. D., & Timpano, K. R. (2009). Attention training
for generalized social anxiety disorder. Journal of Abnormal Psychology, 118(1), 5-
14. doi:10.1037/a0013643
Schmidt-Reinwald, A., Pruessner, J. C., Hellhammer, D. H., Federenko, I., Rohleder, N.,
Schumeyer, T. H., & Kirschbaum, C. (1999). The cortisol response to awakening in
relation to different challenge tests and a 12-hour cortisol rhythm. Life Sciences,
64(18), 1653-1660. doi:10.1016/S0024-3205(99)00103-4
Schmukle, S. C. (2005). Unreliability of the dot probe task. European Journal of Personality,
19, 595-605. doi:10.1002/per.554
Schneider, W., Eschman, A., & Zuccolotto, A. (2002). E-Prime user’s guide. Pittsburgh:
Psychology Software Tools, Inc.
Schommer, N. C., Hellhammer, D. H., & Kirschbaum, C. (2003). Dissociation between
reactivity of the hypothalamus-pituitary-adrenal axis and the sympathetic-adrenal-
medullary system to repeated psychosocial stress. Psychosomatic Medicine, 65(3),
450-460. doi:10.1097/01.PSY.0000035721.12441.17
See, J., MacLeod, C., & Bridle, R. (2009). The reduction of anxiety vulnerability through the
modification of attentional bias: A real-world study using a home-based cognitive
bias modification procedure. Journal of Abnormal Psychology, 118(1), 65-75.
doi:10.1037/a0014377
Selye, H. (1936). A syndrome produced by diverse nocuous agents. Nature, 138, 32.

REFERENCES
290
Selye, H. (1976). Stress in health and disease. Reading, MA: Butterworth’s.
Shirtcliff, E. A., Granger, D. A., Schwartz, E., & Curran, M. J. (2001). Use of salivary
biomarkers in biobehavioral research: Cotton-based sample collection methods can
interfere with salivary immunoassay results. Psychoneuroendocrinology, 26(2), 165-
173. doi:10.1016/S0306-4530(00)00042-1
Spielberger, C. D. (1980). Test Anxiety Inventory. Palo Alto, CA: Consulting Psychologists
Press.
Spielberger, C. D., Gorsuch, R., & Lushene, P. R. (1970). Manual for the State-Trait Anxiety
Inventory. Palo Alto, CA: Consulting Psychologists Press.
Spielberger, C. D., Gorsuch, R., Lushene, P. R., Vagg, P. R., & Jacobs, G. A. (1983). Manual
for the State-Trait Anxiety Inventory (Form Y). Palo Alto, CA: MindGarden.
Spielberger, C. D., Reheiser, E. C., Ritterband, L. M., Sydeman, S. J., & Unger, K. K. (1995).
Assessment of emotional states and personality traits: Measuring psychological vital
signs. In J. N. Butcher (Ed.), Clinical personality assessment: Practical approaches
(pp. 42-58). New York: Oxford University Press.
Stalke, J., Hader, O., Bahr, V., Hensen, J., Scherer, G., & Oelkers, W. (1992). The role of
vasopressin in the nicotine-induced stimulation of ACTH and cortisol in men. Clinical
Investigator, 70(3-4), 218-223.
Steinman, S. A., & Teachman, B. A. (2010). Modifying interpretations among individuals
high in anxiety sensitivity. Journal of Anxiety Disorders, 24(1), 71-78.
doi:10.1016/j.janxdis.2009.08.008

REFERENCES
291
Stopa, L., & Clark, D. M. (2000). Social phobia and interpretation of social event. Behaviour
Research and Therapy, 38(3), 273-283. doi:10.1016/S0005-7967(99)00043-1
Strahler, J., Mueller, A., Rosenloecher, F., Kirschbaum, C., & Rohleder, N. (2010). Salivary
alpha-amylase stress reactivity across different age groups. Psychophysiology, 47(3),
587-595. doi:10.1111/j.1469-8986.2009.00957.x
Strazdins, L., Meyerkort, S., Brent, V., D’Souza, R. M., Broom, D. H., & Kyd, J. M. (2005).
Impact of saliva collection methods on sIgA and cortisol assays and acceptability to
participants. Journal of Immunological Methods, 307(1-2), 167-171.
doi:10.1016/j.jim.2005.09.010
Street, H. V., & Close, J. R. (1956). Determination of amylase activity in biological fluids.
Clinica Chimica Acta, 1(3), 256-268. doi:10.1016-0009-8981(56)90072-9
Stroop, J. R. (1935). Studies of interference in serial verbal reactions. Journal of
Experimental Psychology, 18, 643-662.
Stroud, L. R., Salovey, P., & Epel, E. S. (2002). Sex differences in stress responses: Social
rejection versus achievement stress. Biological Psychiatry, 52(4), 318-327.
doi:10.1016-S0006-3223(02)01333-1
Takai, N., Yamaguchi, M., Aragaki, T., Eto, K., Uchihashi, K., & Nishikawa, Y. (2004).
Effect of psychological stress on the salivary cortisol and amylase levels in healthy
young adults. Archives of Oral Biology, 49(12), 963-968.
doi:10.1016/j.archoralbio.2004.06.007
Taylor, J. A. (1953). A personality scale of manifest anxiety. Journal of Abnormal and Social
Psychology, 48(2), 285-290. doi:10.1037/h0056264

REFERENCES
292
Taylor, S. E., Klein, L. C., Lewis, B. P., Gruenewald, T. L., Gurung, R. A. R., & Updegaff, J.
A. (2000). Biobehavioral responses to stress in females: Tend-and-befriend, not fight-
or-flight. Psychological Review, 107(3), 411-429. doi:10.1037/0033-295X.107.3.411
Teasdale, J. D., & Fogarty, S. J. (1979). Differential effects of induced mood on retrieval of
pleasant and unpleasant events from episodic memory. Journal of Abnormal
Psychology, 88(3), 248-257. doi:10.1037//0021-843X.88.3.248
Thoma, M. V., Joksimovic, L., Kirschbaum, C., Wolf, J. M., & Rohleder, N. (2012). Altered
salivary alpha-amylase awakening response in Bosnian War refugees with
posttraumatic stress disorder. Psychoneuroendocrinology, 37 (6), 810-817. doi:
10.1016/j.psyneuen.2001.09.013
Tseng, T., Iosif, A. M., & Seritan, A. L. (2011). Stress effects: A study of salivary cortisol
levels in third-year medical students. Stress and Health, 27 (5), 436-440. doi:
10.1002/smi.1377
Turton, S., & Campbell, C. (2005). Tend and befriend versus fight or flight: Gender
differences in behavioral response to stress among university students. Journal of
Applied Biobehavioral Research, 10(4), 209-232.
Twenge, J. M., Baumeister, R. F., Tice, D. M., & Stucke, T. S. (2001). If you can’t join them,
beat them: Effects of social exclusion on aggressive behavior. Journal of Personality
and Social Psychology, 81(6), 1058-1069. doi:10.1037/0022-3514.81.6.1058
Usui, T., Yoshikawa, T., Ueda, S. Y., Katsura, Y., Orita, K., & Fujimoto, S. (2011). Effects
of acute prolonged strenuous exercise on the salivary stress markers and inflammatory
cytokines. Japanese Journal of Physical Fitness and Sports Medicine, 60(3), 295-304.

REFERENCES
293
Vallejo, M. A., Jordán, C. M., Díaz, M. I., Comeche, M. I., & Ortega, J. (2007).
Psychological assessment via the internet: A reliability and validity study of online
(vs paper-and-pencil) versions of the General Health Questionnaire-28 (GHQ-28) and
the Symptoms Check-List-90-Revised (SCL-90-R). Journal of Medical Internet
Research, 9(1), e2. doi:10.2196/jmir39313e2
Van Bockstaele, B., Verschuere, B., Koster, E. H. W., Tibboel, H., De Houwer, J. &
Crombez, G. (2011). Effects of attention training on self-reported, implicit,
physiological and behavioural measures of spider fear. Journal of Behavior Therapy
and Experimental Psychiatry, 42(2), 211-218. doi:10.1016/j.jbtep.2010.12.004
Van den Hout, M., Tenney, N., Huygens, K., Merckelbach, H., & Kindt, M. (1995).
Responding to subliminal threat cues is related to trait anxiety and emotional
vulnerability – A successful replication of MacLeod and Hagan (1992). Behaviour
Research and Therapy, 33(4), 451-454. doi:10.1016/0005-7967(94)00062-O
Van Honk, J., Tuiten, A., van den Hout, M., Koppeschaar, H., Thijssen, J., de Haan, E., &
Verbaten, R. (2000). Conscious and preconscious selective attention to social threat:
Difference neuroendocrine response patterns. Psychoneuroendocrinology, 25(6), 577-
591. doi:10.1016/S0306-4530(00)00011-1
Van Stegeren, A. H., Wolf, O. T., & Kindt, M. (2008). Salivary alpha amylase and cortisol
responses to different stress tasks: Impact of sex. International Journal of
Psychophysiology, 69(1), 33-40. doi:10.1016/j.ijpsycho.2008.02.008
Vining, R. F., McGinley, R. A., & Symons, R. G. (1983). Hormones in saliva – Mode of
entry and consequent implications for clinical interpretation. Clinical Chemistry,
29(10), 1752-1756.

REFERENCES
294
Vreeburg, S. A., Hoogendijk, W. J. G., van Pelt, J., DeRijk, R. H., Verhagen, J. C. M., van
Dyck, R., Smit, J. H., Zitman, F. G., & Penninx, B. W. J. H. (2009). Major depressive
disorder and hypothalamic-pituitary-adrenal axis activity results from a large cohort
study. Archives of General Psychiatry, 66 (6), 617-626. doi:
10.1001/srchgenpsychiatry.2009.50
Watson, D., & Friend, R. (1969). Measurement of social-evaluative anxiety. Journal of
Consulting and Clinical Psychology, 33(4), 448. doi:10.1037/h0027806
Watson, D., Clark, L. A., & Tellegen, A. (1988). Development and validation of brief
measures of positive and negative affect – the PANAS scales. Journal of Personality
and Social Psychology, 54(6), 1063-1070. doi:10.1037/0022-3514.54.6.1063
Weeks, J. W., Heimberg, R. G., & Rodebaugh, T. L. (2008). The fear of positive evaluation
scale: Assessing a proposed cognitive component of social anxiety. Journal of Anxiety
Disorders, 22(1), 44-55.
Weeks, J. W., Heimberg, R. G., Rodebaugh, T. L., & Norton, P. J. (2008). Exploring the
relationship between fear of positive evaluation and social anxiety. Journal of Anxiety
Disorders, 22, 386-400. doi:10.1016/j.janxdis.2007.04.009
Weiner, D., Levy, Y., Khankin, E. V., & Reznick, A. Z. (2008). Inhibition of salivary
amylase activity by cigarette smoke aldehydes. Journal of Physiology and
Pharmacology, 59, 727-737.
Wells, A., & Mathews, G. (1994). Attentions and emotion: A clinical perspective. Hove, UK:
Erlbaum.
Wetherell, M. A., Crown, A. L., Lightman, S. L., Miles, J. N. V., Kaye, J., & Vedhara, K.
(2006). The four-dimensional stress test: Psychological, sympathetic-adrenal-

REFERENCES
295
medullary, parasympathetic and hypothalamic-pituitary-adrenal responses following
inhalation of 35% CO2. Psychoneuroendocrinology, 31 (6), 736-747. doi:
10.1016/j.psyneuen.2006.02.005
Whitworth, J. A., Williamson, P. M., Mangos, G., & Kelly, J. J. (2005). Cardiovascular
consequences of cortisol excess. Vascular Health and Risk Management, 1 (4), 291-
299. doi: 10.2147/vhrm.2005.1.4.291
Williams, K. D. (1997). Social ostracism. In R. Kowalski (Ed.), Aversive interpersonal
behaviors (pp. 133-170). New York: Plenum.
Williams, K. D. (2001). Ostracism: The power of silence. New York: Guilford.
Williams, K. D. (2007). Ostracism. Annual Review of Psychology, 58, 425-452.
Doi:10.1146/annurev.psych.58.110405.085641
Williams, K. D., Cheung, C. K. T., & Choi, W. (2000). Cyberostracism: Effects of being
ignored over the internet. Journal of Personality and Social Psychology, 79(5), 748-
762. doi:10.1037/0022-3514.79.5.748
Williams, K. D., Govan, C. L., Croker, V., Tynan, D., Cruickshank, M., & Lam, A. (2002).
Investigations into differences between social- and cyberostracism. Group Dynamics
– Theory Research and Practice, 6 (1), 65-77. doi: 10.1037//1089-2699.6.1.65
Williams, K. D., & Sommer, K. L. (1997). Social ostracism by co-workers: Does rejection
lead to loafing or compensation? Personality and Social Psychology Bulletin, 23(7),
693-706. doi:10.1177/0146167297237003
Williams, K. D., & Zadro, L. (2005). Ostracism: The indiscriminate early detection system.
In K. D. Williams, J. P. Forgas, & W. Von Hippel (Eds.), The social outcast:

REFERENCES
296
Ostracism, social exclusion, rejection, and bullying (pp. 19-34). New York:
Psychology Press.
Williams, J. M., Watts, F. N., MacLeod, C., & Mathews, A. (1997). Cognitive psychology
and emotional disorders. (2nd edition) Chichester, UK: John Wiley & Sons.
Wilson, E. J., MacLeod, C., Mathews, A., & Rutherford, E. M. (2006). The causal role of
interpretive bias in anxiety reactivity. Journal of Abnormal Psychology, 115(1), 103-
111. doi:10.1037/0021-843X.115.1.103
Wohlgemuth, J. (1908). Ueber eine neue method zur quantitativen Bestimmung des
diastatischen ferments. Biochemische Zeitschrift, 9, 1-9.
Wust, S., Federenko, I., Hellhammer, D. H., & Kirschbaum, C. (2000). Genetic factors,
perceived chronic stress, and the free cortisol response to awakening.
Psychoneuroendocrinology, 25 (7), 707-720. doi: 10.1016/S0306-4530(00)00021-4
Yang, E. V., & Glaser, R. (2002). Stress-induced immunomodulation and the implications for
health. International Immunopharmacology, 2 (2-3), 315-324. doi: 10.1016/S1567-
5769(01)00182-5
Yiend, J., Mackintosh, B., & Mathews, A. (2005). Enduring consequences of experimentally
induced biases in interpretation. Behaviour Research and Therapy, 43(6), 779-797.
doi:10.1016/j.brat.2004.06.007
Zadro, L., Boland, C., & Richardson, R. (2006). How long does it last? The persistence of the
effects of ostracism in the socially anxious. Journal of Experimental Social
Psychology, 42(5), 692-697. doi:10.1016/j.jesp.2005.10.007

REFERENCES
297
Zadro, L., Williams, K. D., & Richardson, R. (2004). How low can you go? Ostracism by a
computer is sufficient to lower self-reported levels of belonging, control, self-esteem,
and meaningful existence. Journal of Experimental Social Psychology, 40(4), 560-
567. doi:10.1016/j.jesp.2003.11.006
Zajonc, R. B. (1960). The concepts of balance, congruity, and dissonance. Public Opinion
Quarterly, 24(2), 280-296. doi:10.1086/266949
Zajonc, R. B., & Burnstein, E. (1965). The learning of balanced and unbalanced social-
structures. Journal of Personality, 33(2), 153-163. doi:10.1111/j.1467-
6494.1965.tb01378.x
Zappacosta, B., Persichilli, S., Mordente, A., Minucci, A., Lazzaro, D., Meucci, E., &
Giardina, B. (2002). Inhibition of salivary enzymes by cigarette smoke and the
protective role of gluthathione. Human and Experimental Toxicology, 21(1), 7-11.
doi:10.1191/0960327102ht202oa
Zoccola, P. M., Dickerson, S. S., & Zaldivar, F. P. (2008). Rumination and cortisol responses
to laboratory stressors. Psychosomatic Medicine, 70(6), 661-667.
doi:10.1097/PSY.0b013e31817bbc77
Zoller, C., Maroof, P., Weik, U., & Deinzer, R. (2010). No effect of social exclusion on
salivary cortisol secretion in women in a randomised controlled study.
Psychoneuroendocrinology, 35(9), 1294-1298. doi:10.1016/j.psyneuen.2010.02.019

APPENDIX I
298
APPENDIX I – In-House sAA Assay Development
Quantifying Alpha Amylase
The process of quantifying levels of alpha amylase was originally designed for
purposes of diagnostics, with specific reference to pancreatitis. Early methods, such as the
iodometric method (Wohlegemuth, 1908) and the amyloclastic method (Street & Close,
1956), which focus on measuring the disappearance of a substrate, have since been outdated
with much simpler and more reliable methodology. A more recent method involves
measuring alpha amylase through a chromogenic assay, which employs the use of the
substrate 2-chloro-p-nitrophenol, which is linked with maltotriose. Together, these react with
alpha-amylase resulting in a yellow coloured product that can be measured
spectrophotometrically.
Similar to endpoint assays, such as an enzyme-linked immunosorbent assay (ELISA),
the enzymatic reaction of amylase with the substrate is initially very fast before reaching a
saturation point, which all samples achieve. However, unlike endpoint assays, due to the fact
that the rate of change in optical density (colour) is directly proportional to amylase activity
(Pointe Scientific, US), it is possible simply to infer concentration by measuring the early
changes in the reaction. This prevents the need for standard measures to be assayed alongside
unknown samples to correct any concentration inference as are necessary with ELISAs,
which makes for ease of concentration calculation and a higher throughput by affording more
available testing space on the microplate.
Many of the existing methods are based around using a cuvette spectrophotometer to
measure the change in colour in the sample. Drawing on knowledge from existing
commercial kits (e.g. Salimetrics LLC, USA), our aim was to establish an assay suitable for
our research laboratory’s microplate (MTP) system allowing many samples to be analysed

APPENDIX I
299
simultaneously. A second aim was to adapt the assay so that it could be automated by a Tecan
Genesis Freedom (150/8) liquid handler.
Light Path
To measure the rate of the reaction between the substrate and alpha amylase, a
spectrophotometer measures the intensity of the coloured by-product. For this, a spectrometer
beams light through the sample well, a route referred to as the light path. As it passes
through, some of the light becomes absorbed depending on the concentration of the analyte.
The light is then diffracted into a spectrum, the optical density (OD) of which is measured at
specific wavelengths by a photometer. Once absorbance per minute has been calculated using
the delta OD (the difference between the first and second measurements), the following
formula can be applied to obtain alpha amylase units per litre:
Abs. per minute x total volume x 1000
MMA x sample volume x light path
One key issue concerning our adaptation of this assay was the intention for it to be
MTP-based and most MTP wells are relatively wide (thereby producing a shorter light path).
As OD is proportional to light path, a longer light path would afford the assay sensitivity in
detecting lower concentrations of alpha amylase. After reviewing the available options, a
decision was made to use Greiner MTPs (clear, sterile, F-bottom polystyrene options;
category number 655 161) as they seemed to best solve the problem above owing to their
relatively narrow wells. However, this alone did not solve the problem entirely as it became
To convert from U/ml to U/L
Millimolar absorptivity of
2-chloro-p-nitrophenol
The distance travelled
through the sample

APPENDIX I
300
difficult to accurately measure the light path. This problem has not typically been
encountered in previous use of the assay for purposes of clinical testing as diagnostic testing
largely use cuvettes. As shown in Figure 34, cuvettes are typically singular with a fixed width
of 1cm. When measured spectrophotometrically, this allows the light to travel horizontally
through the cuvette with a known light path of 1cm. As MTPs have multiple wells arranged
in columns and rows, the light path has to travel vertically through each well, and the light
path is therefore related to the dimensions of the well and the amount of liquid present in
each well.
The problem of measuring a vertical light path was further complicated by trying to
account for any meniscus in the fluid. To overcome this challenge well dimensions, including
the total possible volume, was ascertained from the MTP manufacturer prior to
deconstructing an MTP and measuring the light path at the lowest point of the meniscus using
10x magnification for accuracy. The spectrophotometer was then set to read OD through the
centre of the well to ensure the beam travelled through our measured light path.
1 2 3 4 5 6 7 8 9 10 11 12 A B C D E F G H
1cm
LP L P
CUVETTE MTP
Figure 34. Comparison of a cuvette with an MTP. Note: LP = light path

APPENDIX I
301
Substrate Temperature Regulation
Conceptually, this assay is linked to fine temperature regulation. When the substrate is
initially introduced to the sample, it must be heated to 37°C for optimal reaction. It is
possible to source a water bath that is dedicated to heating to and maintaining specific
temperatures in reagent troughs. While this provides an ideal solution, it is a costly one.
Theoretically, an alternate solution would be to use an MTP-shaped bath to hold the reagent,
which could then be heated in incubators designed to hold MTPs. Indeed, certain
commercially available kits advise this (cf. Salimetrics LLC, USA). However their adaptation
of this is too malleable and fragile for the mechanical assistance. Therefore, in a bid to
simplify the procedure and also reduce wastage, a decision was made to customise a reagent
plate (still based on the dimensions of a normal MTP plate) with four deep troughs capable of
holding solution for three columns of the assay MTP, each with a v-bottom to minimise
substrate waste (see Figure 35). This would enable us to use multi-shooting pipetting,
whereby the liquid handler (LiHa) aspirates enough solution for 3 columns at a time to save
time washing and re-aspirating the solution.
Figure 35. An illustration of the custom plate with four v-bottom troughs

APPENDIX I
302
As the LiHa has 8 tips that can work independently or simultaneously it is much faster
than a human at pipetting. The robotic arm (RoMa) that moves plates around the deck follows
set co-ordinated movements which makes it reliably replicable for each stage of the assay but
can also make it much slower and less direct at moving plates around the deck compared to a
human. Furthermore, it was necessary to amend the RoMa speed to avoid unnecessary
disturbance of the substrate in the relatively exposed 4 troughs. As a result, the extra time for
the heated reagent plate to be carefully transferred from the incubator to the deck caused a
significant loss in temperature. The incubator was therefore set to overheat the substrate
initially to 45°C (rather than 37°C) to account for this loss in temperature. As a further
precaution, the assay MTP was also preheated prior to use to 39°C.
Pipetting
Small volumes. Whilst accuracy (i.e. actually pipetting the set volume) is obviously
important, it is often considered more important to be precise. Precision involves being
consistently reproducible and is measured as a coefficient of variation (CV) which is simply
the averaged standard deviation of a number of events and is expressed as a percentage. The
assay requires pipetting of 8µl diluted samples or known levels of alpha amylase (henceforth
referred to as controls). Pipetting such small volumes demands both skill and focus and is
notorious for producing unacceptably high CVs (above 15%). To aid pipetting, a human
might use a tip touch technique, which involves holding the pipette tip to the side of the well
after dispensing the solution to effectively wipe the tip clean. The LiHa is able to imitate
humans in this way and observations demonstrate that all the tips do make contact with the
appropriate wells. However early tests resulted in high CVs thereby suggesting the technique
was not achieving adequate precision. Alternatively, a high velocity ejection method was
opted for, whereby the samples are aspirated out of the tips at high speed followed by a quick
stop which serves to break off any liquid clean from the tip.

APPENDIX I
303
Warm substrate. As previously discussed, with this kinetic assay it is crucial to
capture the early stages of the reaction to determine the change in OD and, consequently,
alpha amylase activity. As the LiHa undergoes a time-consuming rigorous tip-washing phase
between each aspiration/dispense cycle to prevent sample contamination, it was calculated
that the MTP would have to be read 12 times (once per column) in the spectrophotometer to
ensure no sample achieved saturation before the second read. However, as the fixed tips have
a capacity to hold 1ml liquid, and with the customised reagent plate holding enough solution
for three columns, it should theoretically be possible to operate multi-shot pipetting whereby
enough solution (3 x 320µl) could be aspirated and pipetted into three columns of the MTP at
a time before having to return to the wash station. If successful, this routine would cut down
our assay MTP reads three-fold from 12 to 4, which would substantially lessen overall
running time as the reagent plate needed to be painstakingly returned to the incubator during
spectrophotometer reads. However, during early trials it was noticed that during the process
of aspiration for multi-shot pipetting, the reagent was cooling significantly. This was
concluded to be due to the 960µl substrate being drawn into the tip lines, which were cold,
meaning that (a) substrate was entering the sample well at less than 37°C, and (b) that the
third column of each cycle had the most temperature loss resulting in observed drifts between
the three columns. For this reason, a decision was made to revert back to single column
pipetting and reads. As an additional measure, a tip-warming cycle was added where 320µl
pre-heated substrate was aspirated and dispensed back into the trough once. This was
practised once before each use of the reagent.
Final Assay Protocol
Method. Saliva samples are diluted 1:200 (to a readable range) in isotonic saline and
mixed. Diluted samples and high and low controls (Clinical controls 1 and 2, category
numbers C7590-50 and C7591-50 respectively, Pointe Scientific, US) are pipetted (8µl) into

APPENDIX I
304
the appropriate wells of a pre-incubated MTP (60 minutes at 39˚C). 320µl assay substrate
(Liquid amylase reagent, CNPG3, category number A7564, Pointe Scientific, US) is added to
one column from a pre-incubated MTP trough (60 minutes at 45˚C). The substrate plate is
returned to the incubation pod before the assay MTP enters a plate reader (Tecan Infinite
F200 microplate reader). The assay MTP is heated at 37˚C and shaken, and the relevant
column is read spectrophotometrically at +1 minute and +3 minutes at 405nm (620nm
reference read). The process is repeated until all 12 columns of the assay MTP have been
covered.
Recent Additions
Although the process described above was entirely automated, it felt necessary to
make part of the assay manual. Despite the lack of human involvement, the automated
process took a considerable time to assay one plate owing to the manner with which the
scripts were managed. The Tecan Genesis Freedom (150/8) liquid handler is controlled by
two processes. Gemini is a piece of software containing the assay scripts and so is very
precise, and is responsible for the dilution and pipetting stages. Alternatively, the flexible
assay composer and task scheduler (FACTS) is a control centre responsible for scheduling
the various processes and works to a more ambiguous timing agenda with occasional
deliberate pauses, which is less suited to the final aspects of this assay where timing is
crucial. The assay was therefore amended so that sample dilution and pipetting (controlled by
Gemini) remained an automated process, but the introduction of the reagent and placement
into the spectrophotometer was changed to become a manual (human) task. Reagent substrate
was heated in an external incubator (still overheated). To pipette the reagent into all wells in
an efficient manner, an electronic 1200µl capacity multichannel pipette (Biohit F1200,
Category number 613-4113, Jencons) was used. The aspiration capacity of this pipette
afforded one aspiration per trough of the reagent plate, to dispense over three columns of the

APPENDIX I
305
microplate each time. Tips were discarded after every third column (every trough of the
reagent plate; four times per whole plate). Tips were still warmed through with one aspirate-
dispense cycle as described before. This modification was found to be much faster, meaning
that in the time that the robotic system had taken to measure one run (1 column), a researcher
could measure an entire plate at once without the drift observed before owing to loss of heat
in the substrate.
Precision Performance
Intra-assay precision. The intra-assay precision was determined by running the same
samples down one column and then replicating that column with the same samples in the
same row position across the remainder of the plate. High and low controls were used as test
samples to additionally test that the plate remained within the assay range. Going down one
column, high and low controls were placed in duplicate so that both the high and the low
control had 4 representative samples down each column, each being replicated 12 times
across the plate (see Figure 36).

APPENDIX I
306
Figure 36. An illustration of the high and low control positioning across the intra-assay
precision test plate
As can be seen from Table 24, the test produced good reliability, with all CV’s below
the generically accepted 15%.
Inter-assay precision. Data obtained from two runs using the same 80 samples but
positioned in different and random locations each time was used to determine the inter-assay
precision performance. The bottom row (H) was reserved for a constant control sample to
check for drift across the plate, and high and low controls were assayed in duplicate in the
final two rows to check the plate remained within assay range. Sample CV’s averaged at
12.17 (SD = 10.84), again providing appropriate evidence of test-retest reliability of the
assay. Statistically, the two plates were significantly related, r(80) = .98, p<.001, although the
second plate did produce statistically higher results, t(79) = -3.14, p = .002.
1 2 3 4 5 6 7 8 9 10 11 12
A HIGH CONTROL
B HIGH CONTROL
C LOW CONTROL
D LOW CONTROL
E HIGH CONTROL
F HIGH CONTROL
G LOW CONTROL
H LOW CONTROL

APPENDIX I
307
Table 24.
Intra-assay precision performance data
N Mean (U/ml)
Standard deviation (U/ml)
Coefficient of variance (%)
HIGH CONTROL
Across column A
Across column E
12
12
480.28
489.01
24.33
21.78
5.06
4.45
Down row 1
Down row 6
Down row 12
4
4
4
455.90
477.41
498.13
13.05
9.76
15.03
2.86
2.04
3.02
TOTAL 48 480.73 22.00 4.58
LOW CONTROL
Across column C
Across column G
12
12
69.73
66.73
3.02
2.86
4.33
4.28
Down row 1
Down row 6
Down row 12
4
4
4
64.12
66.86
71.16
2.55
1.50
2.02
3.98
2.24
2.84
TOTAL 48 68.45 3.35 4.89
NB. Not all rows and columns are displayed in the table, just a representative sample. However ‘total’
refers to every possible high/low sample on the plate
Summary
To conclude, the existing assay protocol was successfully adapted to operate under
specified conditions using a partially automated process. Several hurdles were overcome
relating to automated pipetting accuracy at low volumes, the particularly sensitive nature of
the assay, and efficiency to produce a reliable and useable assay with a high throughput
potential.
307
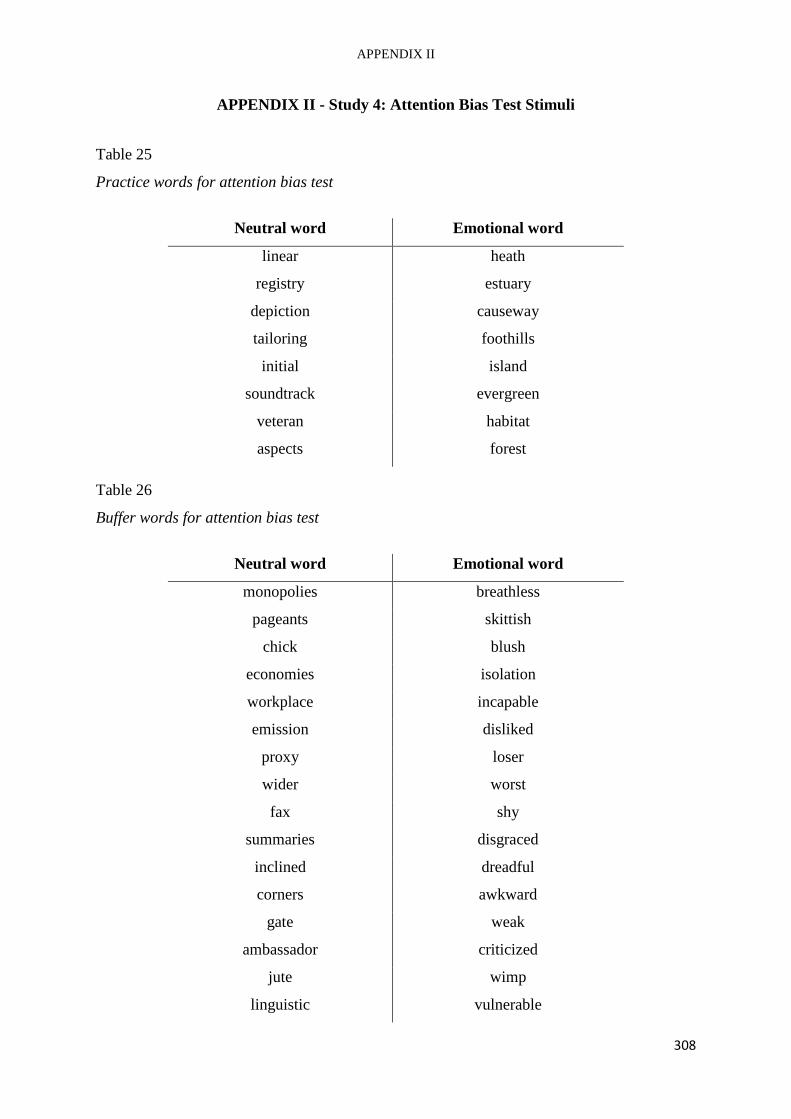
APPENDIX II
308
APPENDIX II - Study 4: Attention Bias Test Stimuli
Table 25
Practice words for attention bias test
Neutral word Emotional word
linear heath
registry estuary
depiction causeway
tailoring foothills
initial island
soundtrack evergreen
veteran habitat
aspects forest
Table 26
Buffer words for attention bias test
Neutral word Emotional word
monopolies breathless
pageants skittish
chick blush
economies isolation
workplace incapable
emission disliked
proxy loser
wider worst
fax shy
summaries disgraced
inclined dreadful
corners awkward
gate weak
ambassador criticized
jute wimp
linguistic vulnerable

APPENDIX II
309
Table 27
Attention bias test 1 wordlist
Word Pair Emotional word Neutral word Emotional wor d category
1 useless lending general
2 unwelcome presenter general
3 pathetic loading general
4 failure clothes general
5 ignored raising general
6 uptight doorman general
7 mistaken theology general
8 feeble pumped general
9 smothering conductive general
10 boring employ general
11 nervous painted sensation
12 vomiting infinity sensation
13 anguish jackets sensation
14 suffocating repetitions sensation
15 pain mass sensation
16 squeamish lamplight sensation
17 dizzy foyer sensation
18 lightheaded exfoliating sensation
19 shudder coconut sensation
20 tense grows sensation

APPENDIX II
310
Table 28
Attention bias test 2 wordlist
Word Pair Emotional word Neutral word Emotional wor d category
1 inferior advocate general
2 mocked orbits general
3 despised baseball general
4 inadequate electrical general
5 abandoned conducted general
6 inept towed general
7 unstable surveyor general
8 ridiculous quantities general
9 stupid occurs general
10 apprehensive multilateral general
11 convulsion excavators sensation
12 embarrassed transmission sensation
13 intimidated discounting sensation
14 panic canal sensation
15 ashamed gradual sensation
16 tremble rallied sensation
17 sweating allocate sensation
18 hysterical marginally sensation
19 restless rigorous sensation
20 flustered veritable sensation

APPENDIX III
311
APPENDIX III - Study 4: Interpretive Bias Test Stimuli
Test 1 Scenarios, Comprehension Questions, and Recognition Statements
1) Category: Social interaction
Title: The local pub
Scenario: You are invited for a night out at a local pub, although you don't know
any of the regulars very well. As you approach the door you can hear noisy conversation,
but as you enter the room it becomes quiet.
Comprehension question: Do you know most of the people at the pub?
Negative foil: As you enter the room someone asks you why you are there
Negative target: As you enter the room everyone stops and stares at you
Positive foil: As you enter the room someone greets you warmly
Positive target: As you enter the room the regulars stop their conversation and look over
welcomingly
2) Category: Social interaction
Title: Your wedding
Scenario: You have invited some friends you have not seen for a while to your wedding
and are awaiting their confirmation. You receive a card from one of them saying that
unfortunately she will not be able to come, making you wonder about the turn out.
Comprehension question: Are you only inviting close family to your wedding?
Negative foil: Wondering about the turn out, you worry that the wedding invitations
might get lost in the post
Negative target: Wondering about the turn out, you think that not many of the old friends
you invited will come to your wedding
Positive foil: Wondering about the turn out, you get excited about starting to organise
your table plan.
Positive target: Wondering about the turn out, you think that many of the old friends you
invited will come to your wedding
3) Category: Social interaction
Title: Changing the return date on your coach ticket
Scenario: You bought a coach ticket a while ago to visit a friend. You now would like to
stay an extra day with them but are unsure about the company policies. You ring the

APPENDIX III
312
customer services number to change the return date. You can tell by the operator's tone of
voice what they think about your request.
Comprehension question: Have you decided to change the date of your return coach
ticket?
Negative foil: The operator says that the coach you have booked has been cancelled
Negative target: The operator seems annoyed by your request
Positive foil: The operator politely asks you whether you would like to take advantage of
a special offer
Positive target: The operator seems friendly and sympathetic to your needs
4) Category: Social interaction
Title: The new sunglasses
Scenario: You have just bought some sunglasses that were on offer. You spent quite a
long time to choose one pair as you generally do not wear glasses. When you arrive at a
barbecue with your sunglasses on you notice quite a few people looking at you.
Comprehension question: Have you bought the most expensive pair of sunglasses?
Negative foil: Somebody comments that they saw those sunglasses cheaper in another
shop
Negative target: People stare at you, thinking your sunglasses are not to their taste
Positive foil: Somebody comments that you have good taste and they would like to go
shopping with you
Positive target: People look at your sunglasses, thinking how stylish they are
5) Category: Performance
Title: The first aid refresher
Scenario: You participate on a first aid refresher course at work. The instructor asks a
question and no one in the group volunteers an answer, so he looks directly at you. You
offer a reply, thinking about how your answer must be sounding to the others.
Comprehension question: Was the refresher course at your workplace?
Negative foil: You answer the question, realising you are irritated by this teaching style
Negative target: You answer the question, thinking how ignorant you may seem
Positive foil: You answer the question, pleased that you have such an interesting teacher
Positive target: You answer the question, thinking that the others may be quite impressed
6) Category: Performance
Title: Art club reunion

APPENDIX III
313
Scenario: You are at the yearly art club reunion and this is the first year you are
presenting your work to people interested in art. When you finish your presentation you
see some art critics near your painting and overhear what they are saying about your talk.
Comprehension question: Did you give a talk to some art critics?
Negative foil: You overhear some art critics saying that the art club lacks any skilled
artists
Negative target: You overhear some art critics saying that your talk was somewhat
lacking
Positive foil: You overhear some art critics saying they would like to buy one of your
paintings
Positive target: You overhear some art critics complementing your talk
7) Category: Performance
Title: The group task
Scenario: You have been given a team group task as part of a selection process for an
important job position. The task is difficult but you speak up with ways that perhaps
could solve the task. When everyone turns to look at you, you can feel your pulse racing.
Comprehension question: Was the group task part of a company team-building event?
Negative foil: When everyone turns to look at you, you notice that they are all much
better dressed than you are
Negative target: When everyone turns to look at you, you feel nervous about explaining
your idea
Positive foil: When everyone turns to look at you, the interviewer comments he is
delighted that somebody has had an idea
Positive target: When everyone turns to look at you, you are excited about explaining
your idea
8) Category: Performance
Title: Your puppy
Scenario: You are walking your puppy on the lead but it is showing too much
excitement when seeing other dogs in the street. It has just tried to jump at someone
walking their dog and they turn to say something to you.
Comprehension question: Are you walking your puppy on a lead?
Negative foil: The dog-walker says she was recently bitten by her dog
Negative target: The dog-walker turns angrily to say that you should have more control
over your puppy

APPENDIX III
314
Positive foil: The dog-walker approaches your puppy from the other side of the path and
says she loves that breed
Positive target: The dog-walker stops to say how nice it is to see such a friendly puppy
9) Category: Performance
Title: Writing an important report
Scenario: You are at work writing an important report when a colleague with a senior
position comes into the office. You can see they are behind your back looking at your
work and you are wondering what they are thinking.
Comprehension question: Did a colleague come in to your office?
Negative foil: Your colleague sees over your shoulder that you are checking your
personal email instead of writing the report
Negative target: You imagine your colleague thinks you have not written very much of
the report so far
Positive foil: Your colleague brings you a cup of coffee and tells you that you deserve a
break from writing the report
Positive target: You imagine that your colleague is impressed by how much of the report
you have written so far
10) Category: Performance
Title: Bowling with colleagues
Scenario: You are bowling with your new colleagues from work. Your team is slightly
behind and all eyes are on you when you take your turn. You throw the ball and feel it
slide from your fingers. As you walk back to your seat you can see your team's facial
expressions change.
Comprehension question: Was your team slightly ahead when you stood up to take your
turn?
Negative foil: When you walk back to your seat, you overhear your colleagues
complaining that they are bored
Negative target: When you walk back to your seat, your colleagues look disappointed by
your performance
Positive foil: When you walk back to your seat, your colleagues tell you that your team
has won
Positive target: When you walk back to your seat, your colleagues look impressed by
your throw

APPENDIX III
315
Test 2 Scenarios, Comprehension Questions, and Recognition Statements
1) Category: Social interaction
Title: The house-warming party
Scenario: Your new neighbour invites you to their house-warming party. You arrive to
find many other guests whom you do not know. You try talking to some of them and by
their reactions you see how they find your conversation.
Comprehension question: Was the party at a relative's house?
Negative foil: You don't know anyone there and everyone ignores you completely
Negative target: You talk to some guests but they think what you say is boring
Positive foil: You meet many guests whom you know and enjoy talking to them
Positive target: You talk to some guests and can tell that they find you interesting
2) Category: Social interaction
Title: Shopping in the city
Scenario: You are going shopping for the weekend in the city where an old friend you
haven't seen for years lives. You'd like to suggest to meet up but are unsure as it is very
short notice. You give them a call and their phone rings for a while. When they eventually
pick up the phone and you start to talk you feel butterflies in your stomach.
Comprehension question: Are you going to be doing some shopping over the weekend?
Negative foil: As you ask your friend about meeting up, they rudely interrupt
Negative target: As you ask your friend about meeting up, you are nervous because you
expect they will say no
Positive foil: Your friend suggests you have a picnic together
Positive target: You are excited about asking to meet your friend and think they would
like to see you
3) Category: Social interaction
Title: Dinner in a restaurant
Scenario: You have ordered an elaborate dish with a creamy French sauce. When they
serve you the dish the sauce looks to you all curdled. You hesitate whether to call the
waiter as they look busy but in the end you tell them and their reaction is unexpected.
Comprehension question: Was your dinner served with an Italian tomato sauce?
Negative foil: When you called him over, the waiter was arguing with another customer
Negative target: The waiter is irritated by your comments and tells you the sauce is meant
to be that way

APPENDIX III
316
Positive foil: All of the waiting staff in the restaurant are well-dressed and friendly
Positive target: The waiter is very apologetic about the sauce and goes to the kitchen to
find you an alternative dish
4) Category: Performance
Title: Photos of your flat
Scenario: You have placed some pictures of your refurbished flat that is on sale on the
web after someone who seemed interested requested a look. You are now looking through
messages and are taken aback by the thread some people have posted.
Comprehension question: Have you placed some photos on the web of your car?
Negative foil: You are surprised that nobody has commented on the pictures on the
website
Negative target: You are surprised to find many negative comments about your flat
Positive foil: You are surprised that a good friend has posted a message on your website
Positive target: You are surprised by all the positive comments about your flat
5) Category: Performance
Title: School staff meeting
Scenario: You have just started organising after-school activities as part of your teacher
training. In a school staff meeting with your senior colleagues it is now your turn to
propose an activity. You quickly say the first idea that comes to mind which prompts a lot
of remarks.
Comprehension question: Were there senior colleagues at the staff meeting?
Negative foil: Your colleagues remark that they are concerned about your teaching style
Negative target: Your colleagues remark that your proposed activity is inappropriate
Positive foil: Your colleagues remark that you have been doing very well in your training
so far
Positive target: Your colleagues remark that your proposed activity will be fun and
popular with the children
6) Category: Performance
Title: The wedding reception
Scenario: Your friend asks you to give a speech at her wedding reception. You prepare
some remarks and when the time comes get to your feet. As you speak, you notice some
people in the audience start to laugh.
Comprehension question: Did you stand up to speak?
Negative foil: As you speak, some people in the audience start to yawn in boredom

APPENDIX III
317
Negative target: As you speak, people in the audience find your efforts laughable
Positive foil: As you speak, people in the audience applaud your comments
Positive target: As you speak, people in the audience laugh appreciatively
7) Category: Performance
Title: Scout camp
Scenario: You are an adult helper at a large scout camp. On the first week you are placed
with a group of people you barely know to organise the talent show. In the spur of the
moment you decide to give some input. Everyone's eyes turn to look at you while
someone in the group tells you their opinion.
Comprehension question: Did you choose who was in your group?
Negative foil: When everyone turns to look at you, you notice that some of the other
helpers look unwell
Negative target: Someone in the group criticises your idea for the talent show
Positive foil: When everyone turns to look at you, you notice how friendly and energetic
they seem
Positive target: Someone in the group tells you they like your idea for the talent show
8) Category: Performance
Title: In the supermarket
Scenario: You are in the supermarket doing the shopping with your young child. You are
at the cashier point queuing up when they start jumping around and laughing. You hear
the cashier make a comment about your child to their colleague as you pack the bags
which makes you think about your parenting.
Comprehension question: Did you bring your child shopping with you?
Negative foil: Your child knocks over a basket of shopping and the cashier looks angry
Negative target: The cashier comments to their colleague that your child is badly behaved
and that you should control your child better
Positive foil: Your child helps you with the packing and tells you they like shopping with
you
Positive target: The cashier comments to their colleague that your child is very happy and
that you are obviously a good parent
9) Category: Performance
Title: A report for your new manager
Scenario: You are working with a manager that you have never worked with before. You
are writing a report for them and have been putting in a lot of effort. Your manager emails

APPENDIX III
318
you some thoughts on your report and when you read it you are surprised that they have
made so many comments.
Comprehension question: Did your manager telephone you to tell you their thoughts?
Negative foil: Your new manager is not pleased with how you are organising your time
Negative target: You see some comments from your new manager suggesting that your
work leaves a lot of room for improvement
Positive foil: Your new manager is very satisfied with your motivation and efficiency
Positive target: You see from the comments that your new manager is acknowledging the
excellent work you have been doing
10) Category: Performance
Title: The online course
Scenario: You enrolled on an online course to get a professional qualification. You have
been studying for the final test which is in two days time in quite a relaxed way. To have
a sense of how your revision is going you and other coursemates try an online sample test
and you realise how your revision strategy was.
Comprehension question: Is the final test in two days time?
Negative foil: You cannot access the online sample test because there is a problem with
your computer
Negative target: The results of the online sample test show that your revision strategy was
unsatisfactory
Positive foil: You are very pleased with the online course and decide to recommend it to a
friend
Positive target: You do well in the online sample test showing that your revision strategy
was very good

APPENDIX IV
319
APPENDIX IV – Study 4: OCam scripts
Directions are in brackets. Researcher refers to the part of the actual researcher (KR/CP), and
colleague refers to the confederate researcher on the videos. Participant 1 and 2 (videoed)
already say in front of the camera.
Neutral Video
Colleague: Hi
Experimenter: Hi, can you hear me OK?
Colleague: No, not really, I’ll turn up the volume.
Experimenter: OK (pause) Is that better?
Colleague: Yes.
(Directed at Participants 1 & 2 only) Ok, I have already explained the
details of what you will be doing today, but the experimenter will quickly
run through it again with you now.
(Look at camera) I’ll leave you to it. (Walks off camera)
Experimenter: OK, thanks. (To Participants 1 & 2) Could you move in a bit, please, you’re
a bit off camera?
Participant 1
& 2:
(Both move chairs closer to the monitor and both look at the camera)
Experimenter: As you all know we are not using your names for confidentiality reasons, so
you have all been assigned a number. So you are participant 1, you are
participant 2 and you are participant 3 (Gesturing to the participants)
Participant 1
& 2:
(Both smile and wave) Hi
Experimenter: (Run through the instructions for the study) To ensure everybody is given the
same instructions during the study, I am going to read the experimental
statement to you once more. As you all know this experiment aims to
analyse how communicating through web-chats affects the development of
new social ties and impression formation during a brief and very structured
interaction. You have all prepared some points to share. Participant 1 will go
first, then participant 2, then participant 3. (Gestures to participants in turn)
You all need to consider your thoughts and feelings during the conference, as

APPENDIX IV
320
you’ll each be asked questions on this later. You will each have a turn to
talk. You are not to ask questions, just listen to what each has to say. If you
wish to comment on what someone else has said, you may do so during your
turn to talk. When you have finished say “that’s all”, then the next person
can start their turn. I know that it could be a bit boring taking part in two
web-chats in a row, but please try not to get distracted and do concentrate on
the web-chat while the others are talking. Ok, I’ll leave you for about 5
minutes to give you some privacy. Participant 1, you can start when I leave.
(Leaves the room)
(Total time to give instructions is 1 minute 5 seconds)
Participant 1: (Scratches face 5 seconds before they are about to begin talking = sign for
researcher that they are about to start your talk) Ok... (begin talking for
approximately 1.5 minutes, select a topic) ...That is all.
Participant 2: (Talks for about 1.5 min select a topic. At the end says the
following) Well that’s all I can think of.
Experimental Subjects turn to talk.
Participant 1
& 2:
(Both to smile and nod sometimes, as if engaged by listening to someone
talk. Look directly into the camera with occasional glances away etc.)
Experimenter (After 1.5 minutes of the experimental subject talking) Ok, that’s fine. Thank
you very much. I am going to cancel the conference connection now. The
three of you can start the questionnaires, which should come up on the
screen. (Appears to cancel connection.)
Ostracism video
Colleague: Hi
Experimenter: Hi, how’s everything going?
Colleague: Yes, everything’s going really well at the moment. (Walks off camera)
Experimenter: Oh good... (interrupted by Participant 2 coughing) ...Oh dear, are you OK?
Participant 2: (Nods) Yes, I’m fine thanks.
Experimenter: Ok, so let’s start the next web-chat. We keep the same numbers for this
conference. So you are participant 1, you are participant two and you are
participant three (Gestures to the participants)
Participant 1 (Both smile and wave) Hi

APPENDIX IV
321
& 2:
Experimenter: OK, great, I’ll leave you to it. Participant 1 you can start when I leave
(Leaves the room)
Participant 1: (Wait 5 seconds, then talks for approximately 1.5 minutes on selected topic)
That is all.
Participant 2: (Talks for approximately 1.5 minutes on selected topic) Well that’s all I can
think of.
Experimental Subjects turn to talk.
Participant 1
& 2:
(Look directly into the camera smile and nod, as if engaged by listening to
Participant 3 with occasional glances away etc.
After 25 seconds participant 2 starts to look away, looks slightly bored.
After 30 seconds (from start) participant 1 starts to look away, looks bored.
After 35 seconds participant 2 asks a question to participant 1 in a low
voice, participant 1 nods shortly to participant 2 and focuses again on the
real participant.
After 45 seconds participant 1 starts a separate conversation with
participant 2 by asking a question which refers to what participant 1 said)
(Continue conversation until colleague interrupts)
Experimenter (After 1.5 minutes of the experimental subject talking) Ok, that’s great, I’ll
just stop you there and then you can complete your next questionnaires
(appears to cancel connection)
Inclusion Video
Experimenter: Hi, are you ready for us?
Colleague: Yep, we’re ready to start, over to you (Walks off camera.)
Experimenter: OK, great, so we’ll keep the same numbers for this conference. So you are
participant one, you are participant two and you are participant three
(gestures to the participants)
Participant 1
& 2:
(Both smile and wave) Hi
Experimenter: OK, I’ll leave you to it. Participant 1 you can start when I leave
(Leaves the room)
Participant 1: (Wait 5 seconds, then talks for approximately 1.5 minutes on selected topic)

APPENDIX IV
322
That is all.
Participant 2: (Talks for approximately 1.5 minutes on selected topic) Well that’s all I can
think of.
Experimental Subjects turn to talk.
Participant 1
& 2:
(Both smile and nod more than in the neutral condition, as if engaged by
listening to Participant 3 talk. Look directly into the camera with occasional
glances away etc. Both are more friendly and attentive than in the neutral
condition)
Colleague: (After 1.5 minutes of the experimental subject talking) Ok, time is up, this
was the last web-chat. Thanks for participating. (Asking informally) What do
you think of this conference-system?
Participant 1: It was interesting to do, and good to talk to Participant 3 (Gestures to
camera) who seems really down to Earth and I think we’d get on.
Participant 2: (First looks at Participant 1, nodding, then to Participant 3, smiling and
nodding) Yes, it was quite nice. I also think we’d get on well.
Colleague: OK, good, well I’ll cancel the connection and then you can all start your next
questionnaires. (Video ends.)
Experimenter: (After a little time has passed, re-enters the room.)

APPENDIX V
323
APPENDIX V – Study 5: CBM-I Training Stimuli
All participants were presented with the same scenarios. Positive CBM-I always drew on the
positive resolution of the scenario, while sham CBM-I drew an equal amount of times on the
positive and negative interpretations. Positive disambiguations of the scenarios below are
presented first, followed by the negative alternative.
CBM-I Scenarios
1) Scenario: You are taking a mock driving test and your instructor takes you on a difficult
route. You think that you might have made a number of mistakes and at the end your
instructor tells you that had it been for real you would have failed. When you ask others
who had the same instructor you find out they were all told they would have f - - l – d
(failed) / s u - - e - d - d (succeeded)
Comprehension question: Did you do just as well as the other students?
2) Scenario: You are taking a test and find it very difficult. When the results come out you
find out that you scored under 50%. You ask your fellow students how they did and find
out that everyone else’s mark was l - w - - (lower) / h - - h - r (higher)
Comprehension question: Was your mark higher than the other students?
3) Scenario: You overhear a radio programme about performance on a test you completed
recently, but not very successfully. An eminent academic explains that new test
techniques are a better way of testing students' ability and a student of average ability
should expect to get most of the questions w r - - g (wrong) / c - r r - - t (correct)
Comprehension question: Did you do as well as you would have expected to do?
4) Scenario: You are playing party games with your friend's children as it is their birthday.
They play a game where they have to remember lots of things in their head at once. You
take part but quickly realise that you are finding the game quite hard. You stop playing
and help to tidy up. For you, not being able to remember the items is
i n c o - s - q - - n t - a l (inconsequential) / w o - - y - n g (worrying)
Comprehension question: Does it bother you that you cannot remember the items?
5) Scenario: You are taking part in paintballing as part of a team building exercise at work.
Everytime you start a new game you get shot straight away. Thinking that you could well
be the worst on your team makes you feel like l - - g h - - g (laughing) / c r - - n g (crying)
Comprehension question: Does being the worse on your team upset you?

APPENDIX V
324
6) Scenario: Some friends of yours encourage you to join them in taking the exam which
determines your ability to join the civil service. The questions are all very abstract and
challenging and you find out that you had a low score. They know how this will make
you feel given that your own career interests lie e l - e w - e r e (elsewhere) / t - e r e
(there)
Comprehension question: Does it matter that you didn't do well on the test?
7) Scenario: You are comparing notes about your children with your brother and he says that
his children are doing rather better at sport than yours. You realise that one reason is that
your children do not attend extra evening coaching which means that they are less
p r - s s - r – d (pressured) / a d - - n c - d (advanced)
Comprehension question: Do you think that more coaching would improve things for
your children?
8) Scenario: You are attending a viewing of new abstract paintings, and overhear the person
who runs the gallery explain why they are important. You feel you don't understand the
paintings and decide that the person talking is trying to show how clever they are. You
think that compared to them you are quite k n - - l e d g - - b – e (knowledgeable) /
i n f - r i - r (inferior)
Comprehension question: Do you know quite a lot about art?
9) Scenario: You have a series of reasoning tasks to do and are then given a challenging one.
You concentrate hard but it is still very difficult and when you finish you know you didn’t
get many correct. Later it is explained that the test assessed your r e - o - v e (resolve) /
i n t - l l - g - - c - (intelligence)
Comprehension question: Was your score an important part of the test?
10) Scenario: At your evening class, you are given a task to complete for the next week. You
finish it early and ask the tutor for his opinion. He says the work is good, apart from
missing a section. You feel that he will think you are l e a - - i – g (learning) / c - r e l - - s
(careless)
Comprehension question: Was your tutor pleased with the quality of work on your paper?
11) Scenario: As you struggle to solve even a few of the items in a test, you recall a previous
occasion when you also found the tasks nearly impossible. On that occasion, afterwards
you had compared notes and found that compared with you, others were considerably
more c h a - - e - g – d (challenged) / c l - v - r (clever)
Comprehension question: Did you do better than the others on the previous occasion?

APPENDIX V
325
12) Scenario: A friend suggests that the two of you join an evening class on creative writing.
At the early stages the teacher finds lots of points to suggest improvement in your work
and you are asked to discuss these points in class. You are all beginners together but you
think the others will find your mistakes r e - s s u r - - g (reassuring) / g l a - - n g (glaring)
Comprehension question: Did you think other people would be superior?
13) Scenario: You are attending a session where you are being taught the difficulties of
creating a good test of cognitive ability. The lecturer explains how it is necessary to try
out the test on a range of people to get the correct level of difficulty. To make sure that a
wide range of abilities can be assessed it might be necessary to include a number of tasks
that most people find quite p - - b l - m - t – c (problematic) / s - - p l e (simple)
Comprehension question: Are some of the tasks intended to be quite easy?
14) Scenario: You receive an essay back from your tutor and you got a much lower grade
than you expected. She tells you that on this occasion she deliberately set a task that you
would find h a - - (hard) / u n d e - - n d - - g (undemanding)
Comprehension question: Did your tutor expect you to find it difficult?
15) Scenario: You are goal keeper for your local pub football team. You save some of the
goals but let a number in. At the end of the game the score is 6-5 to y - - (you) / t - e m
(them)
Comprehension question: Did you win the game despite your mistakes?
16) Scenario: You are at a party at the house of a neighbour who is very keen on general
knowledge games. He insists that you take part in a new game that he likes. You can
answer only a few of the questions and feel a bit embarrassed. Then you think back to the
ones you answered and feel quite p r o - - (proud) / i - n o r - n t (ignorant)
Comprehension question: Did you end up feeling pleased about being able to answer a
few the questions?
17) Scenario: You are visiting your bank to check on your account. You have added up all the
transactions in your recent statement and think that there has been an error. When the
clerk goes over the items with you it is clear that the mistake is t - e i r – (theirs) / y - - r s
(yours)
Comprehension question: Did you make a mistake adding up the transactions?
18) Scenario: You take night school classes in order to get a GCSE in German. Before the
final exam you went to Germany for a couple of weeks with the idea of brushing up on
your skills. When you get the exam results you find out that you just passed even though
you spent all of your time in Germany r e - - x i n – (relaxing) / r e - - s i n - (revising)

APPENDIX V
326
Comprehension question: Did you expect to do better in the exams?
19) Scenario: You apply for a job and are asked to take part in some tests as part of the
recruitment process. It is very important and you try your hardest but you find the
different tasks very difficult. At the end their feedback makes you think that this exercise
revealed your w - l l p - w – r (willpower) / f - a w - (flaws)
Comprehension question: Was the exercise making an assessment of your intellectual
ability?
20) Scenario: You are playing a solo as part of a concert. As you are playing you know you
are making some mistakes. At the end you think back to the bits that you played well and
feel p l - - s – d (pleased) / a s h - m - d (ashamed)
Comprehension question: Do you feel happy when you think about the bits you played
well?
21) Scenario: Together with some colleagues you are given a new job to do at work. You
think you have some idea how to do it, but when you try it on your own nothing works
out right. Feeling stupid you ask your colleagues and discover that compared to you they
are c l - - l - s s (clueless) / k n o - l - - g e a b - e (knowledgeable)
Comprehension question: Were the others just as confused as you?
22) Scenario: You know that you have answered very few questions correctly in the test you
have just taken. As you think about other people doing the same test you guess that they
will think that compared to them you are rather b e - t - - (better) / a - f - l (awful)
Comprehension question: Will the others doing the test approve of your results?
23) Scenario: At a party you overhear two teachers talking about class exercises they have
recently set. One explains that in the first session he gives new groups an almost
impossible test, and reads their scores aloud to allow them to compare the results. He then
leads a discussion and uses this feedback to encourage them to treat the results as a j o – e
(joke) / j o - t (jolt)
Comprehension question: Are the results of the test important?
24) Scenario: You meet some old friends and begin discussing your current ambitions. At
college, you had all met with same the career advisor who set you a series of tests to
assess your aptitude for different jobs. Thinking back to how well you did on these tests,
and your subsequent career choice, makes you realise that your scores on each one were
clearly i r r - l - v - n t (irrelevant) / s i g - - - i c a - t (significant)
Comprehension question: Were your scores on the tests important?

APPENDIX V
327
25) Scenario: You are socialising with your partner’s family and their nephew makes
everyone join in with a game he is keen on. You are generally not at all efficient and get
an extremely low score. From the expression on the others’ faces you see that getting a
higher score for this game might make them think you were rather a g - - k (geek) / s t - -
(star)
Comprehension question: Did you want to get a high score on the game?
26) Scenario: A group of colleagues invite you to a social evening with a quiz as part of the
entertainment. You are part of a team but cannot answer all but one or two questions.
Afterwards when they discuss how successful it was they comment on the specialist
questions that were asked. You can see that your correct answers were v - t – l (vital) /
i n s - f f - c - e - t (insufficient)
Comprehension question: Were your friends pleased with your performance?
27) Scenario: You are playing pool after work. You are offered a game with someone you
have not met before and thinking that you are rather good you start to play. You manage
to pot a couple of balls before you lose and then find out that the person you were playing
against was a p r - f - s s - - n – l (professional) / b - g - n - e r (beginner)
Comprehension question: Would you have expected to win the game?
28) Scenario: You are reading a self help book about how to impress at work. One of the
chapters is about coping with setback. You try to implement the suggested strategy as
you read that you should now imagine making errors in an important task. As you think
about this situation you find your mind is filled with a feeling of c a - - (calm) / i n a - e q
u - - y (inadequacy)
Comprehension question: Do you feel relaxed?
29) Scenario: A colleague asks you to organise a rota for coffee making duties. As you pin it
up, several people complain about the way in which you have designed it. You reflect on
their comments and conclude that your organisational skills are probably f i - - (fine) /
s l - - p y (sloppy)
Comprehension question: Are you satisfied with your organisational skills?
30) Scenario: Your orchestra asks you to play a solo at the next concert. You practice a few
times until you feel ready to play it with the orchestra. At the first rehearsal you make a
mistake. The conductor will think that your work is p r o - i s - - g (promising) / r - s h - d
(rushed)
Comprehension question: Did you feel disappointed with your performance?

APPENDIX V
328
31) Scenario: You have signed up for a study in which you are asked to complete some tests
of ability. As you read the instructions and begin the first task you realise that it is
difficult, although it is clearly designed so that someone of average ability should find
most of the examples t - i c k – (tricky) / s t r - - g h t f - - w - - d (straightforward)
Comprehension question: Is the task designed so that the examples are easy?
32) Scenario: You are trying out a memory puzzle in a magazine you are reading. At the end
you did not get many answers correct. You read to the end of the article, and it explains
that the difficulty has been set so that on most items someone of your general ability
would be m - s t - k – n (mistaken) / r - - h t (right)
Comprehension question: Did you make more mistakes than would be expected?
33) Scenario: You are being assessed for promotion at work and have a tough interview to go
through. After each answer you are told what you should have said and get the impression
that you are failing. At the end you are told the questions were deliberately challenging
and that your promotion has been a - - e p t - d (accepted) / d e - - i n e d (declined)
Comprehension question: Was your impression about failing wrong?
34) Scenario: You are at a party and one of the games being organised is a trivia quiz. You
feel obliged to join in, but do not know the answers to any of the questions you were
asked. You think that the questions were mostly about things that are interesting to people
who are relatively u n - n t e l l - g - - t (unintelligent) / s - - r t (smart)
Comprehension question: Did you care about not knowing the quiz answers?
35) Scenario: You are curious about joining MENSA, the society for people who score highly
on intelligence tests. You take their test and are told that your score was not high enough
to be accepted. Thinking about it you realise that people who eventually join must be very
c o n c - - t – d (conceited) / i n s - - r a t i - n a l (inspirational)
Comprehension question: Are you unhappy about not being accepted?
36) Scenario: You join a tennis club and before long, you are asked to play in a doubles
match, even though you are very nervous. You lose and afterwards you discuss your
performance with your partner. They focus on the shots that you played w – l (well) /
s h - d d - l y (shoddily)
Comprehension question: Did they focus on your good performance?
37) Scenario: You have gone on a skiing holiday with friends. You take part in a downhill
race with the other 10 students in your class. You finished sixth even though you had
spent more time than anyone else p a r - y - n g (partying) / p r - c t i - i - g (practicing)
Comprehension question: Were you relatively pleased with your position?

APPENDIX V
329
38) Scenario: You are devising a short course for teachers. You plan to set a really difficult
test early in the course to encourage them think about the emotional responses to such
tests in their future students. When you explain how the test was designed as a teaching
tool you emphasise that its actual capacity to estimate ability is really n - g l - g - b l e
(negligible) / a c c - r - t - (accurate)
Comprehension question: Is it a good test of ability?
39) Scenario: Reflecting one day, you look back at achievements and disappointments that
you have experienced during your life. Overall, your main feeling about life so far is one
of s - t i - f a c - - - n (satisfaction) / r - g r e - (regret)
Comprehension question: Are you generally happy about the events experienced in your
life?
40) Scenario: Your bathroom looks rather dingy and so you decide to put new tiles up. You
are not experienced and when you look closely they are not all straight. In the end, you
look at your work and decide that your efforts were w - - t h - h i – e (worthwhile) /
f - t - l e (futile)
Comprehension question: Did your efforts improve the look of the room?
41) Scenario: As you work at each new example in a test you find you are not able to solve
them in the time given. You assume that you should be able to do the tasks and the time
allowed has therefore been carefully chosen so as to be i - p - s s - b - - (impossible) /
e - o u - h (enough)
Comprehension question: Do you think you should finish in the time?
42) Scenario: You are given a modern test of intelligence, with separate sections to assess
different abilities. You work through trying your hardest but find the tasks very difficult.
At the end of the session the assessor suggests that someone from your background
should expect to get only about 10% of these items a - - u r a t – (accurate) / w - - n g
(wrong)
Comprehension question: Were you expected to get most of the items wrong?
43) Scenario: You are set to work on a test that has two components. Each element is fairly
easy by itself but you have to do both together. It is surprisingly difficult to solve
anything when you have so little time to think and you make many mistakes. You think
that this number of mistakes is not s - - p r - s - n g (surprising) / n - - m - l (normal)
Comprehension question: Do you think you were worse than others at this test?

APPENDIX V
330
44) Scenario: You have a go at an online game that your friend says is really fun. You start
playing but don’t seem to get a very high score. You think that this is because you find
the game too t r - v - - l (trivial) / c - - p l i - a t - d (complicated)
Comprehension question: Was the game too difficult for you?
45) Scenario: On holiday, one evening your family group is persuaded to take part in a team
quiz somewhat against your better judgement. With your low score you earn the loser's
prize; a mug for each team member. Compared with the ornate winner's trophy you think
that being given mugs will be really u - e f – l (useful) / e m - a - r a - s - n g
(embarrassing)
Comprehension question: Are you glad that you were given the mug?
46) Scenario: Generally when you take part in cognitive ability tests you feel you do
reasonably well. This time, you can hardly solve any items. You hear that you are being
directly compared with another group of people who have done much better. Their
success is down to their having much more specific and extensive t - - t i o n (tuition) /
a b - l - t - (ability)
Comprehension question: Are the other group more intelligent than you?
47) Scenario: You are feeling rather tired and decide to have a go at a crossword in the paper.
You try for a while but cannot make sense of any of the clues. In the end you give up
thinking that in order to do well at something like this you would need to be more a - e r t
(alert) / i n - e - l i - - n t (intelligent)
Comprehension question: Did you think you weren't clever enough to solve the clues?
48) Scenario: You take part in a research task and are surprised at your score at the end. It is
explained that the task was designed to so that this score would reflect your ability on the
subset of the scale measuring an aspect of ‘performance’. Your responses at the end of
this part of the test assesses whether you have good ability to deal with task f - - l u r –
(failure) / s w - t c h - - g (switching)
Comprehension question: Was this testing your ability to deal with disappointment?
49) Scenario: After trying the first few questions in a test task you realise that most of these
items stretch your ability. As you tackle the ones that follow you feel d - t - r m - n – d
(determined) / d e m o - - l - s - d (demoralised)
Comprehension question: Are you looking forward to tackling the next items?
50) Scenario: The morning of your first appraisal with your new boss has arrived. She has a
reputation for going over fine details of other people's work. She points out some of your

APPENDIX V
331
mistakes and weaknesses and you think she will follow this up with other comments that
are more c - - p l e - - - t a r y (complementary) / c r i - i c - l (critical)
Comprehension question: Does your new boss have anything nice to say about your
work?
51) Scenario: As you work through the examples in a test you have been set, you find it hard
to keep all the details in mind to answer the questions. Then you think about your
performance in this type of test and you realise your achievements compared with other
people will be very r - - s o n - b l e (reasonable) / f - - b l - (feeble)
Comprehension question: Do you think you are performing worse than most others on
this test?
52) Scenario: You have taken an exam as part of an evening course and don't feel you did
well. At the next class the grades are on the notice-board and everyone is looking at
them. As you compare your grades you realise everyone else did w - - s – (worse) /
b e - - e - (better)
Comprehension question: Did you do better than everyone else?
53) Scenario: As part of an intelligence test you have to solve word encryption codes.
Although you expected to do more, at the end of the time you have solved only one. You
conclude that a higher score is more u n - s - a l (unusual) / u - u a l (usual)
Comprehension question: Do you think your score is lower than expected on this test?
54) Scenario: You decide to attend an exam preparation class for the course you are studying.
The presenter explains that because the test has been arranged to provide questions to
suite a range of ability, in order to pass, students in this class would need to correctly
answer a f - - (few) / l - - (lot)
Comprehension question: Do you need to answer most questions correctly to pass?
55) Scenario: Your boss asks you to do a job at work. You finish it before the deadline,
although he finds some mistakes in it. You are new to the job and feel that your boss will
think you are p - - g r - s s - n g (progressing) / n e g - - g e - t (negligent)
Comprehension question: Is your boss satisfied with you?
56) Scenario: You are asked to attend for an interview procedure at a recruitment centre with
many others. You complete several written tests and receive feedback. You got very few
questions correct and you answered the most important items c - - r e c t - - (correctly) /
i m - r - p - r l y (improperly)
Comprehension question: Do you think your performance was good enough on the
important questions?

APPENDIX V
332
57) Scenario: You are playing a game of cricket with friends and it is your turn to bat. You
manage to hit a few balls before you are out. You think that the shots you missed were a
result of overall poor b o - l - n g (bowling) / p e r - o r - a n c e (performance)
Comprehension question: Did you blame yourself for not doing well at cricket?
58) Scenario: You are taking a music exam and have to do a sight-reading test. As you try and
play you realise that it is not easy and you make some mistakes. After you finish the
examiner tells you that the level of difficulty of the piece you were asked to play was
deliberately chosen to be d i - - i c u – t (difficult) / e a - - (easy)
Comprehension question: Were you expected to play well?
59) Scenario: You are short-listed for a job that you really want and after an interview you are
asked to take some aptitude tests. Afterwards you are given feedback on your answers
and are told they are nearly all wrong. You guess that they were testing your reactions to
stress when you are later told you have been s u - - e s - f – l (successful) /
u n s u - - e s - f u l (unsuccessful)
Comprehension question: Did you handle the stressful interview acceptably?
60) Scenario: You are meeting an old friend that you haven't seen for years. As you think of
how your life has progressed since you last saw them you wonder if they will think that
compared with them your ups and downs add up to a life that has been quite
f - l f - l l i – g (fulfilling) / u n i n - e r - s t - - g (uninteresting)
Comprehension question: Do you think your friend will think you have had a good life?
61) Scenario: As a member of the fundraising team at a local school, you are asked to
organise a bazaar. You do your best although there is little time and you don't think that
you have done a very good job. When you get feedback you hear that compared to last
year it was s u - e r - - r (superior) / w - - s e (worse)
Comprehension question: Did people prefer last year’s bazaar?
62) Scenario: You are persuaded to join a quiz team in a tournament. You are told that most
of the questions will be asked to individuals in specialist rounds. The first game is hard
and you don’t get many of your questions right. Afterwards you hear the others talking
about you, they are saying that compared to them they think you did o - - y (okay) /
b - d - y (badly)
Comprehension question: Are the other members of the team pleased with how you
performed?
63) Scenario: You enrol on a course to learn to administer intelligence tests. Working through
some items in an example test you find that after the first few examples you cannot solve

APPENDIX V
333
any more questions. Later on you are handed a manual for the test and look up what your
score indicates. Your final score is listed as showing an ability level that is
h - - h (high) / l - - (low)
Comprehension question: Does the task indicate that your intelligence is low?
64) Scenario: You have a go at doing the mental puzzles in your newspaper and find them
surprisingly difficult. You are surprised because you think that you have very many good
qualities and think that being good at solving this sort of puzzle is relatively
u n i - p o - t - - t (unimportant) / i - p o - t - n t (important)
Comprehension question: Does it bother you that you are finding the puzzles difficult?
65) Scenario: You decide to sign up for a residential 'learning for fun' course. You choose
woodworking and first of all everyone is given a test to reveal their existing expertise.
You cannot do many of the tasks set so you are allocated to a group with others who are
less able. You notice how the other groups progress and conclude your group is finding it
more f - - (fun) / t o u - - (tough)
Comprehension question: Is your group enjoying the week?
66) Scenario: You try to help your friend's son with GCSE maths. You can’t answer any of
the questions and think back to how you did when you took the exams. Quickly you
realise that you cannot help because the skills you had were quite d i f - e r - - t (different)
/ w - - k (weak)
Comprehension question: Are the skills you have too feeble?
67) Scenario: You decide to have a go at some online crosswords. Quickly you realise that
you are not very good and cannot work out any of the clues, just as you decide to stop
playing you see that the ability level was set to e x - - r t (expert) / n o - - c e (novice)
Comprehension question: Are you concerned that you cannot solve any of the clues?
68) Scenario: In quite a long task you are required to attempt a number of items but many of
them seem impossible. When you finish you are told that the session was designed to test
a particular attribute. The items are deliberately difficult but to achieve well on this
attribute, you need to show evidence of mental r - s i l - e - c e (resilience) /
i m - r o v - m e n t (improvement)
Comprehension question: Was this a test of your determination?
69) Scenario: Your friend is very keen on skating and persuades you to try it out. At the rink
you put on the skates and step on the ice. You glide forward, slowly at first, then faster,
your feet don't seem to obey you instructions. As you continue you start to feel e - c i t – d
(excited) / d - z z - (dizzy)

APPENDIX V
334
Comprehension question: Do you feel well?
70) Scenario: You are on a long journey and suddenly traffic comes to a halt. The road is
closed and you have to make a detour. After only a few minutes you realize you must
have made a wrong turn and there are no more diversion signs. You find yourself winding
through a maze of small roads concluding that taking this route has turned out to be very
b - - u - i f – l (beautiful) / s t r - s s - - l (stressful)
Comprehension question: Did you enjoy driving through country roads?
Neutral Scenarios (embedded into positive training)
1) Scenario: An acquaintance calls to ask you for some advice about a relationship problem.
The conversation soon drifts onto other things and before you realise the time, you find
that you have spent most of the afternoon t - - k i n – (talking)
Comprehension question: Did you speak with your friend in the evening?
2) Scenario: You and a friend decide to join an evening class in pottery. When you
arrive on the first night, you discover that the class is held in a converted barn.
Because it was chilly outside you think you should have brought a s w - a t e –
(sweater)
Comprehension question: Is the class held in a converted barn?
3) Scenario: You arrange to visit a friend who lives some distance away and plan to travel
by coach. When you get on, the coach is fairly empty and so you take a double seat at the
front. After several hours of travel you start to feel s - e - p y (sleepy)
Comprehension question: Did you sit in the back of the bus on your trip?
4) Scenario: A friend calls you up to suggest that you meet up for dinner one evening. You
arrive at the restaurant and are quickly seated. The waiter hands you a menu and as you
read it you notice that you are feeling quite h - n g - y (hungry)
Comprehension question: Were you eating with a friend?
5) Scenario: One day at work, your boss rings through and tells you that a colleague is
retiring at the end of the month. As this was someone that everyone knew very well, he
suggests that you could get together with others in your office and organise a p - - t y
(party)
Comprehension question: Is one of your work colleagues leaving soon?
6) Scenario: You decide to take up jogging and plan to go out every morning before work.
On the first morning, you get up early and put on your tracksuit and then head off for
your first run. You decide to start by alternating short bursts of running with some

APPENDIX V
335
w a - k - n g (walking)
Comprehension question: Did you go for a jog after work?
7) Scenario: You finish work early so that you can go to a local firm of solicitors to collect
some papers for your boss. When you get to the offices, you report to reception. You
explain to the secretary who you are. She asks you to take a seat in the l - - n g e (lounge)
Comprehension question: Did you speak to the secretary before you collected the papers?
8) Scenario: You attend a schooldays reunion at your old college and meet up with lots of
people you have not seen for some time. You speak to lots of old friends and then decide
to get a drink. You go to the bar and when you return you find that some of your friends
are dancing to loud m u - i c (music)
Comprehension question: Was the music quiet?
9) Scenario: You inherit an old dining table and chairs and decide to restore them to their
former glory. You spend hours in the garage working on them. When you have finished
working on them, you bring them into the h o u - - (house)
Comprehension question: Did you buy and old dining set?
10) Scenario: It is almost time for your town's spring festival. A friend of yours is on the
committee and asks if you would be prepared to help out with the barbecue in the park.
You hope that on that day it will be s u - - y (sunny)
Comprehension question: Does your town hold the festival in spring?
11) Scenario: It is your partner's birthday soon and you want to do something special. You
put a lot of thought into what to do and after much discussion, you decide on a weekend
break to Paris. You book the tickets online immediately, and print out the
c o - f - r m a t - o n (confirmation)
Comprehension question: Will you be travelling for a week long holiday on your partner's
birthday?
12) Scenario: Your firm organises a bowling trip as an annual social event. Because you are a
new employee and have not been at this firm for very long this will be your first trip.
Every year the trip is popular and because many people were going everyone travelled by
c o a - - (coach)
Comprehension question: Did your firm organise a bowling trip?
13) Scenario: Your new neighbours have just moved in last week. Your neighbours ask if you
would like to go round for a drink the following evening. When you arrive, there are other
people there who you do not know and you soon find yourself being i - t r - d - c – d
(introduced)

APPENDIX V
336
Comprehension question: Did you have to wait for others to arrive?
14) Scenario: Last year you decided you wanted to take up another hobby. You became a
member of a hockey club and now regularly play for the second team on Saturday
afternoons. One week, the captain tells you that there is to be an extra midweek m a - c h
(match)
Comprehension question: Do you play hockey on the second team?

APPENDIX VI
337
APPENDIX VI – Study 5: Interpretive Bias Test Stimuli
1) Category: Test
Title: The Fundraising Quiz
Scenario: You are attending a fundraising quiz evening with lots of teams taking part. In
one round you have some unusual puzzles to complete. Your team is having little success
and as you look around to try and see how rival teams are doing you think you can tell
what the relative scores for this round will b – (be)
Comprehension question: Do you have to complete some unusual puzzles?
Positive target: You look round and see that no-one else can do any of the puzzles
Negative target: You look round and see that everyone else can do the puzzles
Positive foil: You look round and contemplate what an enjoyable event this is
Negative foil: You look round and see people from the other teams are looking back at
you crossly
2) Category: Test
Title: The Ten Minute Warning
Scenario: The warning is given that there are ten minutes left before the end of a long
and draining three hour exam. As you check through your answers you think that the
exam has been a lot harder than you had expected. You then hand your paper in and
reflect on how you think you did in comparison to the other s t - d - n t – (students)
Comprehension question: Were you in a one hour exam?
Positive target: You hand your paper in and think that you did well in comparison to other
students
Negative target: You hand your paper in and think that you did badly in comparison to
other students
Positive foil: You hand your paper in and feel pleased that you have finished all your
exams
Negative foil: You hand your paper in and you were disappointed that you didn't finish in
time
3) Category: Social
Title: The joke
Scenario: You are with a group of new friends, on your way to an open air concert. You
decide to tell a joke you heard recently. Everyone looks at you as you start telling the
joke, and you see their expressions change when you get to the punch l - n e (line)

APPENDIX VI
338
Comprehension question: Did you hear the joke you told quite recently?
Positive target: When you get to the end you see everyone starting to laugh
Negative target: When you get to the punch line everyone looks confused
Positive foil: When you get to the end you receive several compliments
Negative foil: When you start telling your joke someone interrupts you
4) Category: Social
Title: The private view
Scenario: Your neighbour invites you to a private exhibition of his art. You arrive to find
many other guests whom you do not know. You try talking to some of them, and can see
how interested they are in your c - - v e r - - t i – n (conversation)
Comprehension question: Was the private view at a relative's house?
Positive target: You talk to some guests and can tell that they find you interesting
Negative target: You talk to some guests but they think what you say is boring
Positive foil: You meet many guests whom you know and enjoy talking to them
Negative foil: You don't know anyone there and everyone ignores you completely
5) Category: Test
Title: The Bioengineering Exam
Scenario: You have chosen a difficult subject for one of your options. You have done
some coursework but 50% of your assessment is an exam with a series of short answers,
chemical formulae and definitions. There are lots of questions and so you go through as
fast as you can to find some you can answer. You’ve been told the pass mark for the
exam so by the end think you can guess how well you have d - - e (done)
Comprehension question: Have you chosen an easy subject for one of your options?
Positive target: After the exam you think you have enough correct answers to pass
Negative target: After the exam you think you do not have enough correct answers to pass
Positive foil: After the exam you know your high coursework mark already ensures a pass
Negative foil: After the exam you know your poor coursework already means that you
will fail
6) Category: Social
Title: Your birthday
Scenario: It is your birthday and you wake up looking forward to your day. You wonder
how many friends will send you a birthday card. However, you have to go to work as
usual, and by the time you leave, no cards have a r r - v – d (arrived)
Comprehension question: Did you have to go to work on your birthday?

APPENDIX VI
339
Positive target: You have to leave for work before the postman brings your mail
Negative target: You leave for work realising that no one has sent you a card
Positive foil: You leave for work feeling pleased with the cards you have received
Negative foil: You leave for work knowing that it is going to be a stressful day
7) Category: Social
Title: Meeting a friend
Scenario: In the street, you bump into an old friend you haven't seen for a long time. She
is too busy to stop, so you arrange to meet later in a bar. You arrive a little late but the bar
is empty and a few minutes later she is still not t h - - e (there)
Comprehension question: Was anyone else in the bar?
Positive target: You arrange to meet a friend in a bar but your friend is late
Negative target: You arrange to meet in a bar but your friend stands you up
Positive foil: You are busy but your friend insists on meeting you in a bar
Negative foil: Your friend tells you that she does not want to meet you
8) Category: Test
Title: The Spanish Exam
Scenario: You are learning Spanish and are encouraged to take an exam to see how you
do. The exam is quite difficult and you don't understand a lot of the questions so cannot
answer them. Thinking back to the few questions that you did manage to answer you
review your progress so f – r (far)
Comprehension question: Are you learning Italian?
Positive target: The think that your progress is sufficient to pass the Spanish exam
Negative target: You think that your progress is not sufficient to pass the Spanish exam
Positive foil: You think that you are glad that you decided to start learning Spanish
Negative foil: You think that starting to learn Spanish was probably a bad idea
9) Category: Social
Title: The job interview
Scenario: You applied for a job in a company you'd really like to work in. You are invited
to an interview, where you answer the questions as well as you can. Reflecting later, you
think that the quality of your answers decided the o u - c o m – (outcome)
Comprehension question: Did you think about your answers later?
Positive target: You think that your astute answers led to you being offered the job
Negative target: You think that your poor answers lost you the job
Positive foil: You think it was a good thing you did not take the job

APPENDIX VI
340
Negative foil: You think your poor reference must have made a bad impression
10) Category: Social
Title: The bus ride
Scenario: You get on a bus and find an empty seat next to one that has a rip in it. At the
next stop several people get on that you vaguely recognise, but they sit together and the
seat next to you remains v - c a – t (vacant)
Comprehension question: Were the people who got on strangers to you?
Positive target: The seat next to you remains empty because it looks damaged
Negative target: The seat next to you is empty because no one wants to sit with you
Positive foil: The person in the seat next to you talks to you in a friendly way
Negative foil: The person in the seat next to you makes a rip in the fabric
11) Category: Test
Title: The Intelligence Test
Scenario: You browse through a book in the library which has some examples of
questions set to join a new society for those with above average intelligence. You try a
few but they are really hard and your success rate is very low. As you already know your
own intelligence level you think about the accuracy with which this test estimates
i n t - l l - g - - c e (intelligence)
Comprehension question: Are you in a library?
Positive target: You think that the test does not estimate intelligence very well
Negative target: You think that the test estimates intelligence well
Positive foil: You think that the test is quite enjoyable to complete
Negative foil: You think that the test is quite irritating to complete
12) Category: Test
Title: The Challenge at Work
Scenario: You are set a really difficult challenge at work. You are really determined and
so you persevere with the work even though you are finding it almost impossible. When
you go home that night you reflect on what your boss probably thinks of your a b - l - - y
(ability)
Comprehension question: Are you set a challenge at college?
Positive target: You reflect that your boss probably thinks you are a hard-working
employee
Negative target: You reflect that your boss probably thinks you are not very good at your
job

APPENDIX VI
341
Positive foil: You reflect that you are lucky to have such a nice boss
Negative foil: You reflect that your boss probably finds your personality disagreeable test
13) Category: Social
Title: Your first painting
Scenario: You've taken up painting as a hobby, and have just finished your first picture.
You hang it on the wall when a group of friends visit. Later you overhear your friends
making remarks that make clear their opinion of your t - l - n t (talent)
Comprehension question: Did you leave the painting on an easel?
Positive target: You overhear some friends saying how much they liked your painting
Negative target: You overhear some friends making critical remarks about your picture
Positive foil: You overhear some complimentary remarks about your good taste
Negative foil: You overhear some friends making fun of something you just said
14) Category: Test
Title: The Job Interview
Scenario: You have passed the interview stage of a new job but now must do a battery of
tests with others applying for different posts with this company. You progress through
memory, logic and maths problems, some easy and then some very difficult versions. At
the end you can tell you did not get many correct on some tasks. As you leave you reflect
on how you think you performed on the most relevant q u - s t - - n s (questions)
Comprehension question: Do you have to do a battery of tests?
Positive target: You reflect that you probably performed well on the most relevant
questions
Negative target: You reflect that you probably performed poorly on the most relevant
questions
Positive foil: You reflect that the interviewers made encouraging comments as you left
the room
Negative foil: You reflect that the interviewers made discouraging comments as you left
the room
15) Category: Test
Title: University Challenge
Scenario: You have responded to an advert to join the team for "University Challenge".
To select members you all come together and try to answer a series of questions. As you
work through them you struggle with some, definitely get some correct and are unsure

APPENDIX VI
342
about others. Judging by the answers of the others and the expressions of the selectors
you have a good idea who will be c - o s – n (chosen)
Comprehension question: Did you respond to an advert for "Mastermind"?
Positive target: The selectors make their choice and you are included in the team
Negative target: The selectors make their choice and you are excluded from the team
Positive foil: The selectors make their choice and there is happy chatter as the team is
announced
Negative foil: The selectors make their choice and there is a depressed air as the team is
announced
16) Category: Test
Title: The Computer Class
Scenario: You are taking a computer class that involves a test. As you work through the
test items you have been set you find them hard to answer and give up on many of them.
You worry if this reflects on your lack of ability. Talking later to the other people who
took the same test you find out how they all d – d (did)
Comprehension question: Are you taking a computer class?
Positive target: You find out that other people found the test very difficult
Negative target: You find out that other people found the test quite easy
Positive foil: You find out that you are invited to a sociable get-together after the test
Negative foil: You find out that no-one wants to talk to you after the test has finished
17) Category: Social
Title: The first aid refresher
Scenario: You participate on a first aid refresher course at work. The instructor asks a
question and no one in the group volunteers an answer, so he looks directly at you. You
offer a reply, thinking about how your answer must be sounding to the o t h - - s (others)
Comprehension question: Was the refresher course organized by a local charity?
Positive target: You answer the question, thinking that the others may be quite impressed
Negative target: You answer the question, thinking how ignorant you may seem
Positive foil: You answer the question, pleased that you have such an interesting teacher
Negative foil: You answer the question, realising you are irritated by this teaching style
18) Category: Social
Title: The local club

APPENDIX VI
343
Scenario: You are invited for a night out at a local club, although you don't know any of
the members very well. As you approach the door you can hear loud music and noisy
conversation, but as you enter the room it is quiet for a m - m - n t (moment)
Comprehension question: Do you know most of the club members?
Positive target: As you enter the room the music stops for a moment
Negative target: As you enter the room everyone stops and stares at you
Positive foil: As you enter the room someone greets you warmly
Negative foil: As you enter the room someone asks you why you are there
19) Category: Test
Title: The Practical Driving Test
Scenario: While taking a driving test you make an error when parking. You continue with
the other manoeuvres and consider how much credit the examiner will give for your good
driving in the rest of the test. At the end of the test you are told the outcome which is
much as you p r e - - c t – d (predicted)
Comprehension question: Did you continue with the other manoeuvres?
Positive target: You finish the driving test and the examiner says you have passed
Negative target: You finish the driving test and the examiner says you have failed
Positive foil: You finish the driving test and the examiner praises your driving skills
Negative foil: You finish the driving test and the examiner is rude about your driving
ability
20) Category: Social
Title: The wedding reception
Scenario: Your friend asks you to give a speech at her wedding reception. You prepare
some remarks and when the time comes, get to your feet. As you speak, you notice some
people in the audience start to l - - g h (laugh)
Comprehension question: Did you stand up to speak?
Positive target: As you speak, people in the audience laugh appreciatively
Negative target: As you speak, people in the audience find your efforts laughable
Positive foil: As you speak, people in the audience applaud your comments
Negative foil: As you speak, some people in the audience start to yawn in boredom

APPENDIX VII
344
APPENDIX VII – Study 6A: CBM-A Stimuli
Table 29
CBM-A word pairs, list 1
Word Pair Emotional word Neutral word Emotional wor d category
1 unpopular countless general
2 mistaken theology general
3 squeamish lamplight sensation
4 jittery pervade sensation
5 anguish jackets sensation
6 dizzy foyer sensation
7 excluded imperial general
8 shiver pearls sensation
9 uptight doorman general
10 useless lending general
11 shudder coconut sensation
12 distraught camouflage sensation
Table 30
CBM-A word pairs, list 2
Word Pair Emotional word Neutral word Emotional wor d category
1 nervous painted sensation
2 vomiting infinity sensation
3 boring employ general
4 tremor dusted sensation
5 imperfect resonance general
6 shunned oratory general
7 pathetic loading general
8 upset cycle sensation
9 pain mass sensation
10 scorned revolve general
11 frail Poses sensation
12 lightheaded exfoliating sensation

APPENDIX VII
345
Table 31
CBM-A word pairs, list 3
Word Pair Emotional word Neutral word Emotional wor d category
1 unsettled facsimile sensation
2 shaking estates sensation
3 embarrassed transmission sensation
4 coward piping general
5 sweating allocate sensation
6 intimidated discounting sensation
7 selfish lorries general
8 stupid occurs general
9 unfriendly immaterial general
10 inferior advocate general
11 restless rigorous sensation
12 alone stood sensation
Table 32
CBM-A word pairs, list 4
Word Pair Emotional word Neutral word Emotional wor d category
1 negligent certified general
2 unstable surveyor general
3 flustered veritable sensation
4 twitchy coolant sensation
5 mocked orbits general
6 tremble rallied sensation
7 panic canal sensation
8 inadequate electrical general
9 shame craft sensation
10 faint habits sensation
11 abandoned conducted general
12 overwrought divergences general

APPENDIX VIII
346
APPENDIX VIII – Study 6B: CBM-I Stimuli Table 33 CBM-I association words, list 1
Homograph
Prime
Negative Fragment Resolution Neutral Fragment Resolution
1 2 3 4 1 2 3 4
Batter bruise mistreat abuse violence pudding pancake fried fish
Beat slapping smash strike impact rhythm accent tempo drumming
Blow misfortune setback calamity trauma respire puff inhale exhale
Execute electrocute behead hanged shoot accomplish achieve effect complete
Hit smite slap concussion whack popular success favourite winner
Institution psychiatric hysterical deluded psychotic traditional wedding ritual marriage
Lie cheat untrue deceive truth relax recline laze mattress
Mean unkind horrible stingy cruel propose expect intention intend
Ram collide crash accident barge ewes paddock horns sheep
Rattle fluster unnerve disturb confuse shake noisy jangle instrument
Scan diagnosis clinic medical hospital peruse scrutinise survey study
Sharp blade razor pointed stab acute shrewd keen clever
Shot killed gunned blast wounded whisky beverage vodka spirits
Stalk pursue stealth hunted creep flower plant leafy branch
State plight situation panic predicament affirm pronounce declare assert
Wound laceration flesh lesion suture tight wrapped twine bundle

APPENDIX VIII
347
Table 34 CBM-I association words, list 2
Homograph
Prime
Negative Fragment Resolution Neutral Fragment Resolution
1 2 3 4 1 2 3 4
Abort unborn babies foetus pregnant schedule timetable cancel agenda
Brood mope obsess sulk worry chicks litter eggs newborn
Capital corporal punishment hanged offense expenditure investment assets income
Chill frightening fearsome afraid terror brisk freezing frost wintry
Crank eccentric misfit weirdo oddball engine shaft wheel axle
Fit epileptic spasm seizure uncontrollable athletic exercise well strong
Frame innocent implicate incriminate evidence border casing enclose outline
Growth lump radiation tumour malignant height enlarge shrink increase
Incense aggravate fury inflame provoke smell fragrance scent odour
Parting farewell separating going leaving haircut brushing hair hairstyle
Quiver shudder timid scared palpitate archer quill bow bowman
Row debate fight argument shouting column houses queue series
Sack retrench employment unemployed redundant container bag cloth carry
Terminal untreatable illness virus disease aeroplane airport depot station
Wake ritual death respects vigil yawn arise asleep morning
Wrench anguish dislocated strain ankle spanner screwdriver mechanic unbolt

APPENDIX VIII
348
Table 35 CBM-I association words, list 3
Homograph
Prime
Negative Fragment Resolution Neutral Fragment Resolution
1 2 3 4 1 2 3 4
Arresting apprehend seize capture catch gorgeous stunning spectacular attractive
Bitter vicious resentful hostile spiteful vinegary flavour acrid tart
Charge accusation blame allegation indictment price credit expensive account
Chop knife whacked severed hacked barbeque butcher steak hamburger
Committed asylum uncontrollable breakdown psychiatrist pledged dedicated worker engaged
Cross complaining fuming annoyed vexed church priest holy religion
Crush massacre crumble destroy defeat strawberry blend squash pineapple
Gag hostage bonds muffle muzzle prank laugh funny witty
Hamper restrict frustrate impede obstruct picnic basket christmas sandwiches
Hang neck noose strangle suicide raincoat jacket coat clothing
Low unfair underhanded backstabbing sneaky tiny squat small short
Punch clout knuckles boxing knock refreshment beverage liquor juice
Shaken frightened tremulous upset agitated whirl cocktail martini stirred
Tramp pauper homeless vagrant despondent trundle walk stamp trudge
Undertaking mortuary burial coffin funeral enterprise venture endeavour mission
Will inheritance solicitor testament testimony want power determination purpose

APPENDIX VIII
349
Table 36 CBM-I association words, list 4
Homograph
Prime
Negative Fragment Resolution Neutral Fragment Resolution
1 2 3 4 1 2 3 4
Badger bother pester torment irritate mole bat fox burrow
Bark hound growl dog yapping plants foliage undergrowth tree
Bit chew teeth tooth snap fragment little piece crumb
Block obstacle deter obstruction prevent cement concrete brick metal
Body cadaver carcass corpse remains shape physique person form
Cane headmaster smack teacher school stem wicker furniture fronds
Decline frailty sickness degeneration senility invitation refuse offer accept
Die expire perish deceased demise gamble game cast numbers
Fine legal payment infringement parking miniscule small grain granular
Nuts madman mental unbalanced crazy peanuts almonds brazil hazel
Plot against secretive connive conspire scenario storyline narrative story
Pound injure wallop pulverize thump ounce kilogram heavy scales
Ruin career bankrupt reputation impoverish ancient archaeology castle historical
Shady character dishonest dodgy suspicious cloudy sunny cool dark
Sink immersed float ferry ship washing kitchen bathroom dishes
Sour displeased unpleasant dissatisfied unhappy oranges fruit taste lemons

APPENDIX VIII
350
Table 37 CBM-I association words, list 5
Homograph
Prime
Negative Fragment Resolution Neutral Fragment Resolution
1 2 3 4 1 2 3 4
Bars restrain criminal chains shackles beers tavern drinks alcohol
Booking police arrest fined warden theatre cinema reservation seats
Bound captive confined hostage tight gallop bounce skip sprint
Box biff match injured scuffle lid canister storage case
Cell jail warden guard prison biology amoeba germ microscopic
Critical dangerous condition dying deathly important essential crucial key
Dressing treatment gauze hospital bandage clothed fashion robing gown
Graze scrape blood scratch knee horses cattle meadow cows
Infectious contagious epidemic plague influenza laughter enjoyment merriment enthusiasm
Maroon stranded shipwreck isolated helpless purple brown colour reddish
Mug attack thief robbery assail tankard flagon teacup vessel
Rank repellent putrid offensive repulsive soldier corporal general military
Revolution overthrow communism insurrection anarchy gyration revolving turning rotation
Slice slash dissect cleave impale turkey plateful portion bowlful
Stern tough firm frown harsh cruise captain galley yacht
Twisted deranged perverted cruel strange string contorted round coiled

APPENDIX VIII
351
Table 38 CBM-I association words, list 6
Homograph
Prime
Negative Fragment Resolution Neutral Fragment Resolution
1 2 3 4 1 2 3 4
Appeal verdict plead lawful conviction likeable enticing intense sexual
Arms guns pistols shotguns rifles legs stretch length shoulders
Bind problem perplexity crisis dilemma connect fasten attach tie
Blind sight eyes spectacles seeing cover shade window curtain
Cracked demented madness paranoid insane china ceramic porcelain saucer
Late morgue cremation grieve buried punctual early arrival delayed
Mine ammunition explode warhead fuse belonging yours possession ours
Odd weird bizarre peculiar unusual amount uneven digit integer
Petrified horrified fearful freaked aghast hardened solidified fossilised granite
Shell mortar cannon missile grenade beach oyster fishes seaside
Strained worry headache angst anxiety separate drain sifter sieved
Striking hitting force cuffing pummelling resemblance pretty extraordinary dazzling
Stump hobble mutilate maimed cripple oaken lumber timber root
Temper outrage tantrum furore annoy soothe moderate mitigate soften
Tense stressed relaxed nervous anxious future past present grammar
Vault tomb underground cavern chamber jump hurdle upwards launch
Copyright © 2022 FDOKUMEN