Journal Paper Format - CiteSeerX
10
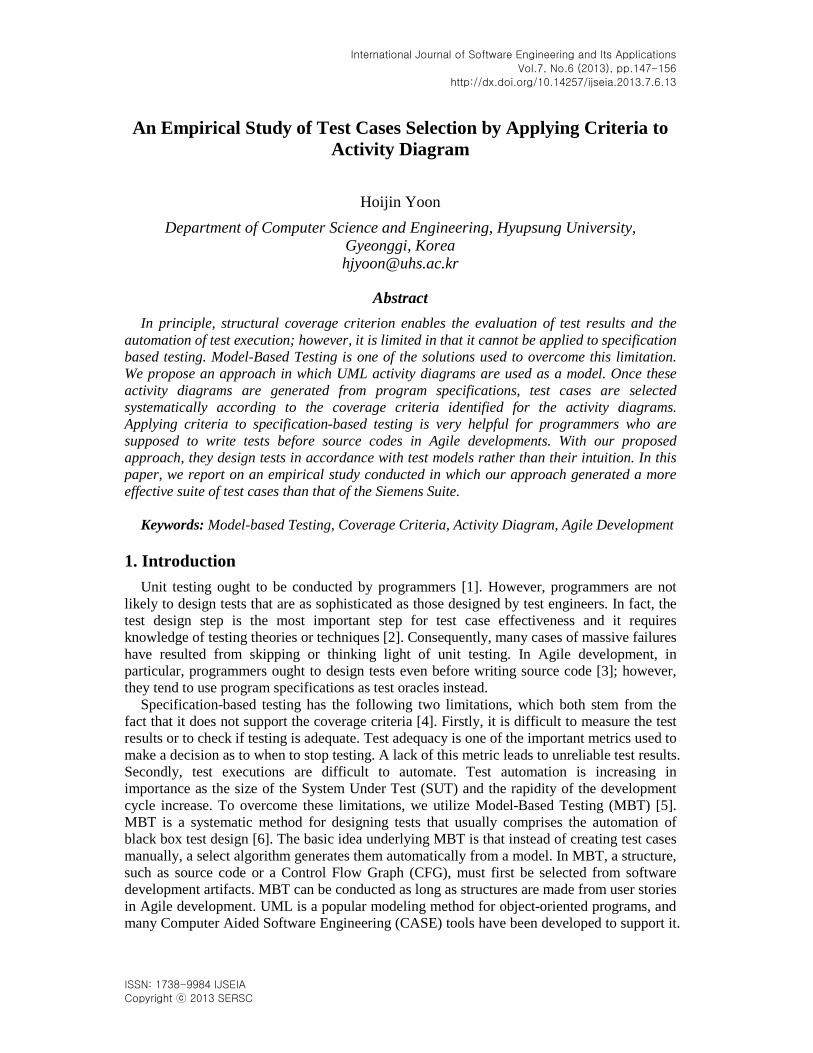
International Journal of Software Engineering and Its Applications Vol.7, No.6 (2013), pp.147-156 http://dx.doi.org/10.14257/ijseia.2013.7.6.13 ISSN: 1738-9984 IJSEIA Copyright ⓒ 2013 SERSC An Empirical Study of Test Cases Selection by Applying Criteria to Activity Diagram Hoijin Yoon Department of Computer Science and Engineering, Hyupsung University, Gyeonggi, Korea [email protected] Abstract In principle, structural coverage criterion enables the evaluation of test results and the automation of test execution; however, it is limited in that it cannot be applied to specification based testing. Model-Based Testing is one of the solutions used to overcome this limitation. We propose an approach in which UML activity diagrams are used as a model. Once these activity diagrams are generated from program specifications, test cases are selected systematically according to the coverage criteria identified for the activity diagrams. Applying criteria to specification-based testing is very helpful for programmers who are supposed to write tests before source codes in Agile developments. With our proposed approach, they design tests in accordance with test models rather than their intuition. In this paper, we report on an empirical study conducted in which our approach generated a more effective suite of test cases than that of the Siemens Suite. Keywords: Model-based Testing, Coverage Criteria, Activity Diagram, Agile Development 1. Introduction Unit testing ought to be conducted by programmers [1]. However, programmers are not likely to design tests that are as sophisticated as those designed by test engineers. In fact, the test design step is the most important step for test case effectiveness and it requires knowledge of testing theories or techniques [2]. Consequently, many cases of massive failures have resulted from skipping or thinking light of unit testing. In Agile development, in particular, programmers ought to design tests even before writing source code [3]; however, they tend to use program specifications as test oracles instead. Specification-based testing has the following two limitations, which both stem from the fact that it does not support the coverage criteria [4]. Firstly, it is difficult to measure the test results or to check if testing is adequate. Test adequacy is one of the important metrics used to make a decision as to when to stop testing. A lack of this metric leads to unreliable test results. Secondly, test executions are difficult to automate. Test automation is increasing in importance as the size of the System Under Test (SUT) and the rapidity of the development cycle increase. To overcome these limitations, we utilize Model-Based Testing (MBT) [5]. MBT is a systematic method for designing tests that usually comprises the automation of black box test design [6]. The basic idea underlying MBT is that instead of creating test cases manually, a select algorithm generates them automatically from a model. In MBT, a structure, such as source code or a Control Flow Graph (CFG), must first be selected from software development artifacts. MBT can be conducted as long as structures are made from user stories in Agile development. UML is a popular modeling method for object-oriented programs, and many Computer Aided Software Engineering (CASE) tools have been developed to support it.
-
Upload
khangminh22 -
Category
Documents
-
view
0 -
download
0
Transcript of Journal Paper Format - CiteSeerX
International Journal of Software Engineering and Its Applications
Vol.7, No.6 (2013), pp.147-156
http://dx.doi.org/10.14257/ijseia.2013.7.6.13
ISSN: 1738-9984 IJSEIA
Copyright ⓒ 2013 SERSC
An Empirical Study of Test Cases Selection by Applying Criteria to Activity Diagram
Hoijin Yoon Department of Computer Science and Engineering, Hyupsung University,
Gyeonggi, Korea [email protected]
Abstract In principle, structural coverage criterion enables the evaluation of test results and the
automation of test execution; however, it is limited in that it cannot be applied to specification based testing. Model-Based Testing is one of the solutions used to overcome this limitation. We propose an approach in which UML activity diagrams are used as a model. Once these activity diagrams are generated from program specifications, test cases are selected systematically according to the coverage criteria identified for the activity diagrams. Applying criteria to specification-based testing is very helpful for programmers who are supposed to write tests before source codes in Agile developments. With our proposed approach, they design tests in accordance with test models rather than their intuition. In this paper, we report on an empirical study conducted in which our approach generated a more effective suite of test cases than that of the Siemens Suite.
Keywords: Model-based Testing, Coverage Criteria, Activity Diagram, Agile Development 1. Introduction
Unit testing ought to be conducted by programmers [1]. However, programmers are not likely to design tests that are as sophisticated as those designed by test engineers. In fact, the test design step is the most important step for test case effectiveness and it requires knowledge of testing theories or techniques [2]. Consequently, many cases of massive failures have resulted from skipping or thinking light of unit testing. In Agile development, in particular, programmers ought to design tests even before writing source code [3]; however, they tend to use program specifications as test oracles instead.
Specification-based testing has the following two limitations, which both stem from the fact that it does not support the coverage criteria [4]. Firstly, it is difficult to measure the test results or to check if testing is adequate. Test adequacy is one of the important metrics used to make a decision as to when to stop testing. A lack of this metric leads to unreliable test results. Secondly, test executions are difficult to automate. Test automation is increasing in importance as the size of the System Under Test (SUT) and the rapidity of the development cycle increase. To overcome these limitations, we utilize Model-Based Testing (MBT) [5]. MBT is a systematic method for designing tests that usually comprises the automation of black box test design [6]. The basic idea underlying MBT is that instead of creating test cases manually, a select algorithm generates them automatically from a model. In MBT, a structure, such as source code or a Control Flow Graph (CFG), must first be selected from software development artifacts. MBT can be conducted as long as structures are made from user stories in Agile development. UML is a popular modeling method for object-oriented programs, and many Computer Aided Software Engineering (CASE) tools have been developed to support it.

International Journal of Software Engineering and Its Applications
Vol.7, No.6 (2013)
148 Copyright ⓒ 2013 SERSC
We use UML activity diagrams as a model and define the coverage criteria for the activity diagram in our proposed approach.
In this paper, we report on an empirical study that shows how many faults our test suite detects compared to the Siemens Suite, which is provided by the Software Infrastructure Repository (SIR) [7]. In the empirical study, we designed a set of test cases using our proposed approach and tested 41 faulty versions of one of the Siemens programs using them. We also simultaneously tested the same 41 faulty versions using the 1608 test cases included in the Siemens Suite in order to confirm the efficacy of our approach. The remainder of this paper is organized as follows. In Section 2, MBT and UML activity diagrams are introduced. Section 3 explains our proposed test design method, and Section 4 analyzes our empirical study. We conclude this paper in Section 5 by looking at threats to the validity of the empirical study. 2. Related Work
In this section, we introduce MBT, which our approach is based on, and Activity diagram, which we use as a model to design tests. 2.1. Model-based Testing
MBT dates back to the 1970s, when people started using finite state machines for testing [8]. The idea of MBT dubbed specification-based testing. Since then related to a process of test generation from various kinds of models by application of a number of sophisticated methods [9]. Several authors[6, 10, 11, 12] define MBT as testing in which test cases are derived in their entirety or in part from a model that describes some aspects of the system under test (SUT). Recent emphasis on model-based and test-centered development methodologies like TDD have led to a strong increased interest in the subject both in the academic field and in industry [5].
Figure 1. The Process of Model-Based Testing [5]
Figure 1 shows a generic process of MBT. First, a model is built from requirements. This model is called test model to differentiate from a model built during development process. Test models are supposed to be independent to development models. That way, the errors in the development model are not propagated into the generated tests. Second, test selection criteria are chosen to generate tests so that is produces a good test suite. Third, test selection criteria are then transformed into test cases requirements, which are supposed to satisfy to cover the criterion. And fourth, once the model and the test cases are defined, a set of test cases is generated. Fifth, once the test suite has been generated, the test cases are run. Test execution may be manual or may be automated by a test execution environment such as xUnit.

International Journal of Software Engineering and Its Applications
Vol.7, No.6 (2013)
Copyright ⓒ 2013 SERSC 149
2.2. Activity Diagram
Activity diagrams are used to model the behavior is a business process independent of objects. In many ways, activity diagrams can be viewed as sophisticated data flow diagrams that are used in conjunction with structured analysis. However, unlike data flow diagrams, activity diagrams include notation that addresses the modeling of parallel, concurrent activities and complex decision processes [13].
There are several research works based on UML activity diagrams. Kundo[14] convers activity diagrams to activity graphs that were represented as a new model in his paper. He analyzed the flow structures presented in activity graphs so that it shows the activity graph’s strength. Eshuis [15] presents a translation procedure from UML activity diagrams to the input language of NUSMW. However the translation is used to verify the consistency of a UML activity diagram and a set of class diagrams. Guelfi et al., [16] provide a formal definition of syntax and semantics for UML activity diagrams endowed with time aspects. They outline the translation from the semantics into the PROMELA, which is a language of the SPIN model checker. Das et al., [17] propose a method to deal with timing verification of UML activity diagram models. We use the activity diagram that UML 2.0 defines, and explains its coverage criteria. The criteria are analyzed through an empirical study. 3. Coverage Criteria 3.1. Coverage Criteria for Activity Diagrams
In this section, we define coverage criteria that will apply to the activity diagram for designing tests. Coverage Criteria is defined as Definition 1[2], where a test requirement is a specific element of a software artifact that a test case must satisfy or cover.
Definition 1. Coverage Criterion: A coverage criterion is a rule or collection of rules that impose test requirements on a test set.
We need coverage criteria for activity diagrams to select an effective set of tests from the entire set of possible inputs and their expected outputs. The activity diagrams normally don’t have many loops, and most loops they do contain are tightly bounded or determinate. It is also very rare to see a complicated predicate that contains multiple clauses. And data flow coverage criteria are not applicable since there are no obvious data definition-use pairs in activity diagrams. It can be said that the two criteria that are most obviously applicable to a graph representing program specifications such as use case descriptions or scenarios are node coverage and edge coverage [2]. Test case values are derived from interpreting the nodes and predicates as inputs to the software.
Node coverage is variously called statement coverage, block coverage, and state coverage. It is implemented in many commercial testing tools, most often in the form of statement coverage. So is another common criterion of edge coverage, usually implemented as branch coverage. And edge coverage subsumes node coverage [18]. It means that a set of the test paths covered by edge coverage includes one by node coverage. 3.2. Test Paths by Edge Coverage
As explained in 3.1, two coverage criteria are considered, and we apply these two criteria to an activity diagram. Figure 2 is the activity diagram representing requirements of Traffic Conflict Avoidance System (TCAS), and it was drawn in StarUML 5.0.

International Journal of Software Engineering and Its Applications
Vol.7, No.6 (2013)
150 Copyright ⓒ 2013 SERSC
Figure 2. Activity Diagram of TCAS
In the next step, the criteria are applies to the activity diagram for designing tests. A good tool automates this step. This tool takes activity diagrams as input and we only click the button named the criterion we want to apply. The tool generates test paths satisfying the criterion automatically. It automates many popular graph coverage criteria. The information of the activity as input of the tool is a set of edges. The edge is represented in a pair of its connected nodes. The result of this step is a list of test paths that the criterion selects.
The result of the activity diagram of Figure 2 is a set of five test paths. These five paths cover the edges of the graph. Node coverage was also applied by pushing the button named “node coverage” in the tool, and it gave 4 test paths excluding one of edge coverage. Since edge coverage requires more tests than node coverage with considering subsumption relation, we prefer edge coverage in this paper. To reach 100% coverage of edges, the 5 test paths should be executed. It means that test data traveling all the test paths should be available. But, one of the paths is infeasible because the edge (9,10) is not reachable. In this case, the edge coverage is measured as (4/5) *100. It is 80% edge coverage. Test data traveling the other paths but the infeasible path are selected by test engineers. TCAS takes 12 different values as input data. We selected the values that make the control travel the 4 test paths, and we figure out that 35 test data are traveling 4 test paths. 4. Empirical Study
In Section 3, we explained our coverage criteria and gave examples. The strategy is based on activity diagrams representing program specifications. To demonstrate that our approach to selecting test cases gives effective test results, an empirical assessment is needed. We conducted such an empirical study. Figure 3 outlines the procedure followed.
Figure 3. Flow of the Empirical Study

International Journal of Software Engineering and Its Applications
Vol.7, No.6 (2013)
Copyright ⓒ 2013 SERSC 151
The subject of our experiment was a Traffic Conflict Avoidance System (TCAS), which decides the direction in which an airplane travels. As seen in Figure 3, we simultaneously applied the set of test cases in our approach and the set of 1608 test cases provided by SIR to 41 faulty versions of TCAS. According to SIR, third party experts developed the faulty versions, so there was no bias and objectivity was guaranteed. On obtaining the output of each test input, we evaluated how many faults each set of test cases detected. 4.1. Traffic Conflict Avoidance System (TCAS)
TCAS is an aircraft collision avoidance system included in the Siemens programs [7]. The researchers at Siemens sought to study the effectiveness of their coverage criteria at detecting faults. Therefore, they created faulty versions of the seven base programs by manually seeding those programs with faults, usually by modifying a single line of code in the program. Their goal was to introduce faults that were as realistic as possible, based on their experience with real programs. Ten subjects performed the fault seeding, working “mostly without knowledge of each other's work” [7]. The result of this effort was between seven and forty-one versions of each base program, each containing a single fault.
For each base program, the researchers at Siemens created a large test pool containing possible test cases for the program. First, they created an initial suite of black-box test cases “according to good testing practices, based on the tester's understanding of the program's functionality and knowledge of special values and boundary points that are easily observable in the code” [19], using the category partition method and the Siemens Test Specification Language tool [20, 21]. Then, they augmented this suite with manually created, white-box test cases to ensure that each executable statement, edge, and definition-use pair in the base program, or its control flow graph, was executed by at least thirty test cases. To obtain meaningful results using the seeded versions of the programs, the researchers retained only faults that were “neither too easy nor too hard to detect” [6]; they retained those faults detectable by at most 350 and at least three test cases from the test pool associated with each program.
TCAS is developed in C. The software implements an airplane collision avoidance decision algorithm that requires twelve integers as input data. The output of TCAS is one of three numbers representing a command for an airplane: 0 represents an UNRESOLVED state, 1 represents UPWARD state, and 2 represents DOWNWARD state. Siemens’ testing solution provides a shell script to execute 1608 test cases automatically. The 1608 test cases are saved in a test pool, as mentioned above. We employed forty-one faulty versions of the program. 4.2. Test Execution with TC
The activity diagram in Figure 1 depicted TCAS’s requirements. To the activity diagram, we applied the Edge coverage criterion rather than Node coverage, as mentioned in Section 3.2. Five test paths covered all the edges of the graph but one was infeasible. The reachable four feasible test paths needed to be traversed to satisfy Edge coverage. To cover the paths, we defined pairs of appropriate input data and their expected output. The input data consisted of twelve different numbers. We eventually defined 35 test cases (described in the APPENDIX) to cover the edges and traverse the paths. The empty cells signify that any value is okay and that they have no effect on the flow of the paths. We applied the 35 test cases in our set of test cases and the data in the test execution phase.
By way of comparison, in the experiment, we used the original set of test cases provided by SIR. SIR has 1608 test cases, which we split into 46 separate groups, so that 35 test cases were assigned to each group (because the number of test cases in our approach is 35). SIR’s

International Journal of Software Engineering and Its Applications
Vol.7, No.6 (2013)
152 Copyright ⓒ 2013 SERSC
test cases are written in shell script files, and so they are easy to run automatically under Born Again Shell (Bash). We also wrote our 35 test cases in a shell script file. Our test execution scripts are shown in Table 1. We executed the test cases by running these scripts in Ubuntu 11.10 with an Intel Core i7 processor.
The Siemens team created faulty versions of each base program by seeding individual faults into the code. The faults are mostly changes to single lines of code, but a few involve multiple changes. Many of the faults take the form of simple mutations or missing code. Creating N faulty versions from the same base program has significant benefits: the understanding gained from studying the code applies to all N versions, and the work involved in generating the test pools applies to all the versions. Perhaps most significantly, the existence of the (presumed correct) base version supplies us with an oracle to check the results of test cases executed on the faulty versions.
Table 1. Test Scripts used to Run the Test Cases
4.3. Performance Evaluation
We evaluated the result of testing with our set of test cases by comparing it with the results obtained using the 46 sets of test cases provided by SIR. Group 0 represents our set of test cases, while the other groups represent the 1608 Siemens test cases. Each group comprised exactly 35 test cases. We tabulated the number of faulty versions differentiated by each group of test cases. The results are displayed in the second table in the APPENDIX. We also defined two measurements: the number of faults detected and the mutant score. The results of evaluations done using these two measurements for each group are also displayed in the second table in the APPENDIX. Study 1: Number of Faults Detected by Test Cases
We evaluated the result of executing the test cases by counting the number of faulty versions detected. The bar chart in Figure 4 shows the number of faults detected according to group. Our set of test cases, group 0, detected 26 faults, while the other groups detected a lower number of faults. Our group even detected two more faults than group 34, which detected the highest number of faults among the SIR original groups.
Script name Description
tc.sh Runs 35 test cases selected from Activity Diagram. >> bash tc.sh tcas.exe expected
run_m.sh Tests 41 faulty versions with 35 of our test cases. >> bash run_m.sh
g*.sh
Runs 35 test cases from each group of the original test cases provided by SIR.
* is a wild card that signifies the ID number of the group. >> bash g1.sh tcas.exe expected
run_1608.sh Tests 41 faulty versions with 46 groups of test cases. >> bash run_1608.sh
comp.sh Compares the real outputs to the expected outputs, and measures mutant scores.
>> bash comp.sh

International Journal of Software Engineering and Its Applications
Vol.7, No.6 (2013)
Copyright ⓒ 2013 SERSC 153
Figure 4. Number of Faults Detected by each Group of Test Cases
Study2:Mutation score
We also calculated the mutation score, which originates from Mutation Analysis—a method used to evaluate the adequacy of test case suites—for each group of test cases. The goal of test cases is to kill the mutants by causing them to produce different outputs. More formally, given a mutant m for an original program P and a test t, t is said to kill m if and only if the output of t on P is different from the output of t on m. The percentage of mutants killed is called the mutation score. As the faulty versions of a program are mutants, the percentage of the number of faults detected to the total number of faults is the mutation score. The mutation scores of all groups were calculated and are listed in the third column of the second table in the APPENDIX. Figure 5 is a bar chart of those scores. The higher the mutation score is, the stronger the set of test cases. Group 0 scored 0.63, while the other groups all had lower scores.
Figure 5. Mutation Score for each Group of Test Cases
5. Conclusion
In this paper, we proposed a method of designing test cases with program specifications that overcomes the nonsupport for coverage criteria limitation of specification-based testing. Without coverage criteria, it is difficult to evaluate testing results. Our proposed method adopts MBT with activity diagrams as a model and defines coverage criteria for activity diagrams. We also explained why programmers ought to conduct specification-based testing especially in Agile development.
To evaluate the efficacy of our proposed approach, we conducted an empirical study that we reported on in this paper. In the study, we used TCAS of the Siemens Suite, which originates from SIR, as the subject. We tested TCAS with 47 different sets of test cases, inclusive of one set made using our approach. To execute the test data automatically, we
International Journal of Software Engineering and Its Applications
Vol.7, No.6 (2013)
154 Copyright ⓒ 2013 SERSC
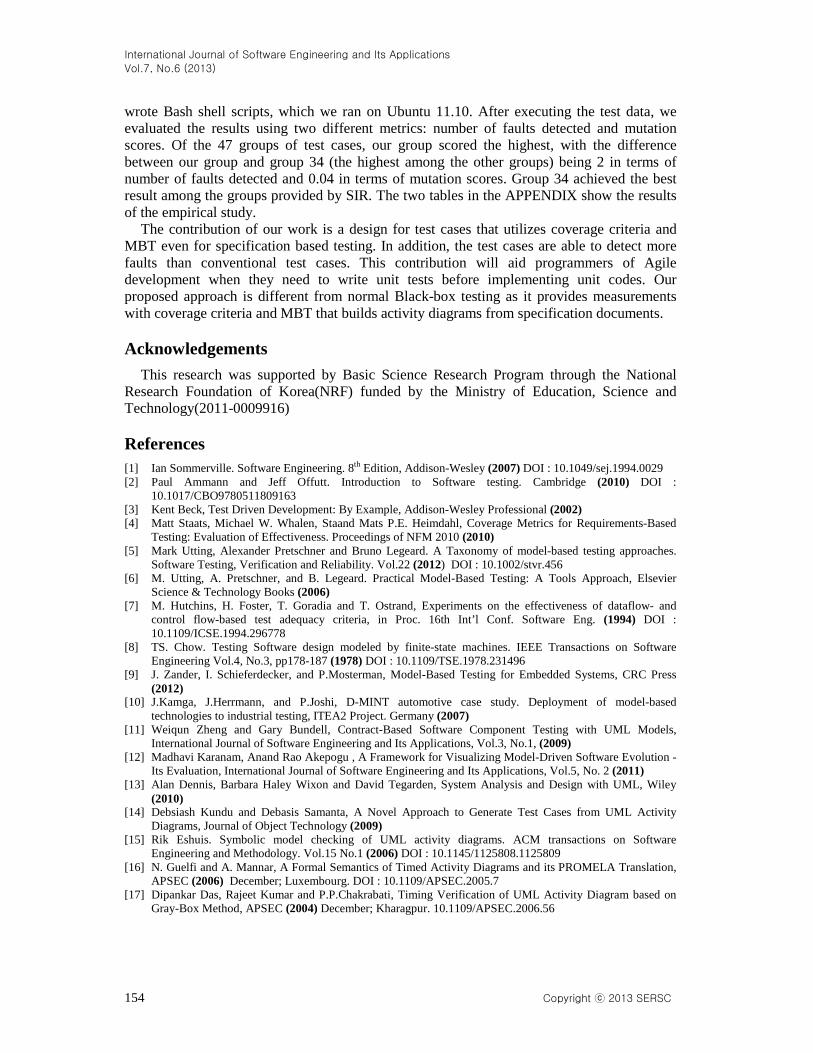
wrote Bash shell scripts, which we ran on Ubuntu 11.10. After executing the test data, we evaluated the results using two different metrics: number of faults detected and mutation scores. Of the 47 groups of test cases, our group scored the highest, with the difference between our group and group 34 (the highest among the other groups) being 2 in terms of number of faults detected and 0.04 in terms of mutation scores. Group 34 achieved the best result among the groups provided by SIR. The two tables in the APPENDIX show the results of the empirical study.
The contribution of our work is a design for test cases that utilizes coverage criteria and MBT even for specification based testing. In addition, the test cases are able to detect more faults than conventional test cases. This contribution will aid programmers of Agile development when they need to write unit tests before implementing unit codes. Our proposed approach is different from normal Black-box testing as it provides measurements with coverage criteria and MBT that builds activity diagrams from specification documents. Acknowledgements
This research was supported by Basic Science Research Program through the National Research Foundation of Korea(NRF) funded by the Ministry of Education, Science and Technology(2011-0009916) References [1] Ian Sommerville. Software Engineering. 8th Edition, Addison-Wesley (2007) DOI : 10.1049/sej.1994.0029 [2] Paul Ammann and Jeff Offutt. Introduction to Software testing. Cambridge (2010) DOI :
10.1017/CBO9780511809163 [3] Kent Beck, Test Driven Development: By Example, Addison-Wesley Professional (2002) [4] Matt Staats, Michael W. Whalen, Staand Mats P.E. Heimdahl, Coverage Metrics for Requirements-Based
Testing: Evaluation of Effectiveness. Proceedings of NFM 2010 (2010) [5] Mark Utting, Alexander Pretschner and Bruno Legeard. A Taxonomy of model-based testing approaches.
Software Testing, Verification and Reliability. Vol.22 (2012) DOI : 10.1002/stvr.456 [6] M. Utting, A. Pretschner, and B. Legeard. Practical Model-Based Testing: A Tools Approach, Elsevier
Science & Technology Books (2006) [7] M. Hutchins, H. Foster, T. Goradia and T. Ostrand, Experiments on the effectiveness of dataflow- and
control flow-based test adequacy criteria, in Proc. 16th Int’l Conf. Software Eng. (1994) DOI : 10.1109/ICSE.1994.296778
[8] TS. Chow. Testing Software design modeled by finite-state machines. IEEE Transactions on Software Engineering Vol.4, No.3, pp178-187 (1978) DOI : 10.1109/TSE.1978.231496
[9] J. Zander, I. Schieferdecker, and P.Mosterman, Model-Based Testing for Embedded Systems, CRC Press (2012)
[10] J.Kamga, J.Herrmann, and P.Joshi, D-MINT automotive case study. Deployment of model-based technologies to industrial testing, ITEA2 Project. Germany (2007)
[11] Weiqun Zheng and Gary Bundell, Contract-Based Software Component Testing with UML Models, International Journal of Software Engineering and Its Applications, Vol.3, No.1, (2009)
[12] Madhavi Karanam, Anand Rao Akepogu , A Framework for Visualizing Model-Driven Software Evolution - Its Evaluation, International Journal of Software Engineering and Its Applications, Vol.5, No. 2 (2011)
[13] Alan Dennis, Barbara Haley Wixon and David Tegarden, System Analysis and Design with UML, Wiley (2010)
[14] Debsiash Kundu and Debasis Samanta, A Novel Approach to Generate Test Cases from UML Activity Diagrams, Journal of Object Technology (2009)
[15] Rik Eshuis. Symbolic model checking of UML activity diagrams. ACM transactions on Software Engineering and Methodology. Vol.15 No.1 (2006) DOI : 10.1145/1125808.1125809
[16] N. Guelfi and A. Mannar, A Formal Semantics of Timed Activity Diagrams and its PROMELA Translation, APSEC (2006) December; Luxembourg. DOI : 10.1109/APSEC.2005.7
[17] Dipankar Das, Rajeet Kumar and P.P.Chakrabati, Timing Verification of UML Activity Diagram based on Gray-Box Method, APSEC (2004) December; Kharagpur. 10.1109/APSEC.2006.56

International Journal of Software Engineering and Its Applications
Vol.7, No.6 (2013)
Copyright ⓒ 2013 SERSC 155
[18] S. Rapps and E.J.Weyuker. Selecting Software Test Data Using Data Flow Information. IEEE Transactions on Software Engineering. April (1985) DOI : 10.1109/TSE.1985.232226
[19] G. Rothermel, R. Untch, C. Chu, and M. Harrold, Prioritizing Test Cases for Regression Testing, IEEE Trans on Software Engineering, Vo. 27, No. 10 (2001) DOI : 10.1109/32.962562
[20] M. Balcer, W. Hasling, and T. Ostrand, Automatic Generation of Test Scripts from Formal Test Specifications, In Proc. Third Symp. Software Testing, Analysis, and Verification (1989) DOI : 10.1145/75309.75332
[21] T.J. Ostrand and M.J. Balcer, The Category-Partition Method for Specifying and Generating Functional Tests, ACM Communication, Vol.31, No.6 (1988) DOI : 10.1145/62959.62964
Appendix
TC 1 2 3 4 5 6 7 8 9 10 11 12
1 0 0 1
2 601 1 900 600 901 0 300 399 2 1
3 601 1 900 600 901 1 400 499 2 1
4 601 1 900 600 901 2 540 639 2 1
5 601 1 900 600 901 3 640 739 2 16 601 1 900 600 901 0 400 399 2 07 601 1 900 600 901 1 500 499 2 08 601 1 900 600 901 2 640 639 2 09 601 1 900 600 901 3 740 739 2 0
10 601 1 1 900 600 901 0 300 399 0 1 111 601 1 1 900 600 901 1 400 499 0 1 112 601 1 1 900 600 901 2 540 639 0 1 113 601 1 1 900 600 901 3 640 739 0 1 114 601 1 1 900 600 901 0 400 399 0 1 015 601 1 1 900 600 901 1 500 499 0 1 016 601 1 1 900 600 901 2 640 639 0 1 017 601 1 1 900 600 901 3 740 739 0 1 0
18 601 1 901 600 900 0 400 500 2 1
19 601 1 901 600 900 1 500 600 2 120 601 1 901 600 900 2 640 740 2 121 601 1 901 600 900 3 740 840 2 122 601 1 901 600 900 0 400 400 2 023 601 1 901 600 900 1 500 500 2 024 601 1 901 600 900 2 640 640 2 025 601 1 901 600 900 3 740 740 2 026 601 1 1 901 600 900 0 400 400 0 1 127 601 1 1 901 600 900 1 500 500 0 1 128 601 1 1 901 600 900 2 640 640 0 1 129 601 1 1 901 600 900 3 740 740 0 1 130 601 1 1 901 600 900 0 400 400 0 1 031 601 1 1 901 600 900 1 500 500 0 1 032 601 1 1 901 600 900 2 640 640 0 1 033 601 1 1 901 600 900 3 740 740 0 1 0
34 601 1 1 900 600 900 0 300 399 0 1 1
35 601 1 900 600 900 0 300 399 2 1
TC_groupThe number offaults detected
mutant score
0 26 0.631 19 0.462 7 0.173 13 0.324 8 0.205 22 0.546 14 0.347 12 0.298 6 0.159 19 0.4610 20 0.4911 5 0.1212 7 0.1713 10 0.2414 9 0.2215 18 0.4416 22 0.5417 18 0.4418 16 0.3919 19 0.4620 10 0.2421 16 0.3922 6 0.1523 10 0.2424 20 0.4925 18 0.4426 22 0.5427 15 0.3728 10 0.2429 17 0.4130 12 0.2931 10 0.2432 9 0.2233 5 0.1234 24 0.5935 13 0.3236 14 0.3437 12 0.2938 11 0.2739 14 0.3440 5 0.1241 8 0.2042 11 0.2743 6 0.1544 5 0.1245 14 0.3446 2 0.05

International Journal of Software Engineering and Its Applications
Vol.7, No.6 (2013)
156 Copyright ⓒ 2013 SERSC
Author
Hoijin Yoon, received the B.S. and M.S. degrees in Computer Science and Engineering from Ewha Womans University in 1993 and 1998, respectively. She also received her Ph.D in 2004. from the same university, Ewha. Her dissertation was on the subject of software component testing. After graduation, she worked at Georgia Institute of Technology as a visiting scholar and then at Ewha Womans University as a full-time lecturer. She has been teaching at Hyupsung University since 2007. She is interested in software testing, service oriented architecture, and testing in Agile Development.