
John Walden PhD Thesis Final Draft reduced A.pdf
119
Dissertation submitted to the Combined Faculty of Natural Sciences and Mathematics of the Ruperto Carola University Heidelberg, Germany for the degree of Doctor of Natural Sciences Presented by: MSc John Brevoort Walden Born in: New York City, USA Oral examination: May 4 th , 2020
-
Upload
khangminh22 -
Category
Documents
-
view
1 -
download
0
Transcript of John Walden PhD Thesis Final Draft reduced A.pdf

Dissertation submitted to the
Combined Faculty of Natural Sciences and Mathematics of the Ruperto Carola University Heidelberg, Germany
for the degree of Doctor of Natural Sciences
Presented by: MSc John Brevoort Walden
Born in: New York City, USA
Oral examination: May 4th, 2020

UNRAVELING THE MYSTERIES OF THE PLANT CELL WALL:
A CHARACTERIZATION OF THREE NOVEL PROTEINS
RELATED TO CELL WALL SIGNALING
Referees: Prof. Dr. Karin Schumacher
Dr. Sebastian Wolf

Table of Contents
Summary ............................................................................................................................... 6 Zusammenfassung ............................................................................................................... 7 Introduction .......................................................................................................................... 8 Chapter 1 ............................................................................................................................ 11
Introduction ................................................................................................................... 11 Results ............................................................................................................................ 14
Initial confirmation of T-DNA pskl1 mutant line homozygosity proves successful .. 14 Initial observations of pskl1 mutants finds potential root length phenotype .............. 16 pskl1 mutants show phenotype of increased metaxylem cell number ........................ 19 CRISPR/Cas9 successfully used to create new pskl1 mutants ................................... 21 CRISPR generated pskl1 mutants confirm increased metaxylem phenotype ............. 23 Experiment with rlp44,pskl1 double mutant suggests PSKL1 is epistatic to RLP44 .. 28
Discussion ....................................................................................................................... 30
Chapter 2 ............................................................................................................................ 33
Introduction ................................................................................................................... 33 Results ............................................................................................................................ 35
Candidate genes responsible for RLP44OX suppression identified ............................. 35 Mutant lines for candidate genes generated ................................................................ 39 CRISPR mutants for line RRE 24.1 appear to show phenotypic suppression ............ 39 Fluorescent microscopy rules out gene silencing as explanation ................................ 41 Allelism test supports f-box/rni like as RLP44ox phenotype suppressor .................... 43 F-Box/RNI Like appears to be expressed in the cytosol .............................................. 44
Discussion ....................................................................................................................... 46
Chapter 3 ............................................................................................................................ 49
Introduction ................................................................................................................... 49 Results ............................................................................................................................ 51
rlp46 mutant lines successfully generated using CRISPR/Cas9 system ..................... 51 No obvious rlp46 growth phenotype observed ........................................................... 52 Possible NaCl stress resistance phenotype observed .................................................. 54 Elicitor response suggest RLP46 plays a role in plant immunity ............................... 58

RLP46 is localized to the plasma membrane .............................................................. 68 RLP46:GFPox does not strongly impact FRK1 and NHL10 gene expression levels . 70 RLP46:GFPOX lines show increased NaCl sensitivity ................................................ 73 RLP46:GFPOX-1 also has mildly increased resistance to elicitor induced growth inhibition ..................................................................................................................... 78 Western Blot suggest RLP46 associates with SOBIR1 .............................................. 79
Discussion ....................................................................................................................... 84
Discussion ........................................................................................................................... 87 Methods .............................................................................................................................. 88
Seed Sterilization Technique ...................................................................................... 88 Plant Cultivation Techniques ...................................................................................... 88 Plant Crossing ............................................................................................................. 89 Seed Harvest ............................................................................................................... 89 gDNA Extraction ........................................................................................................ 90 RNA Extraction ........................................................................................................... 90 cDNA Generation ....................................................................................................... 90 Polymerase Chain Reaction ........................................................................................ 91 Real Time Quantitative Polymerase Chain Reaction (RT-qPCR) .............................. 91 Bulked Segregant Analysis ......................................................................................... 92 Imaging of Plant Rosettes ........................................................................................... 92 Scanning Plant Growth Plates for Root Measurement: .............................................. 92 Scanning Plant Hypocotyls for Measurement: ............................................................ 92 Measuring Root Length: ............................................................................................. 92 Counting Lateral Roots ............................................................................................... 93 Measuring Hypocotyl Length: .................................................................................... 93 Basic Fuchsine Staining .............................................................................................. 93 Counting metaxylem cell number ............................................................................... 93 Agrobacterium Leaf Infiltration: ................................................................................. 93 Agrobacterium Floral Dip ........................................................................................... 94 Protein Extraction: ...................................................................................................... 94 Co-Immunoprecipitation (Co-IP): ............................................................................... 95 PAGE: ......................................................................................................................... 95 Western Blot: .............................................................................................................. 96 Confocal Laser Scanner Microscopy: ......................................................................... 96 GreenGate Cloning: .................................................................................................... 97 Bacteria Cultivation: ................................................................................................... 98

Transformation of E. coli: ........................................................................................... 98 Transformation of A. tumefaciens ............................................................................... 98 GeneJet Gel Extraction Kit: ........................................................................................ 99 GenEluteÔ Plasmid Miniprep Kit: ............................................................................. 99 Plasmid Miniprep: ....................................................................................................... 99 TECAN Plate Reader: ............................................................................................... 100 DNA Sequencing: ..................................................................................................... 100 Primer Design, Gene Analysis and Sequencing Data Analysis: ............................... 101 Agarose Gel Electrophoresis: .................................................................................... 101 Genotyping: ............................................................................................................... 101 Measurement of DNA or RNA Concentration using Nana-Drop: ............................ 101 T-DNA Genotyping: ................................................................................................. 101 Root Length Abiotic Stress Phenotype Experimental Setup: ................................... 102 Drought Tolerance Experiments ............................................................................... 102 Generation of CRISPR Mutants: ............................................................................... 102 ROS Bust Experiment: .............................................................................................. 103 Normalization of Root Length Data: ........................................................................ 104 Plate Growth Inhibition Experiment: ........................................................................ 104 Data Analysis Using RStudio ................................................................................... 105 FIJI (ImageJ) ............................................................................................................. 105 Elicitor RT-qPCR Gene Impact Experiment ............................................................ 105
References ........................................................................................................................ 107 Appendix ........................................................................................................................... 114 Acknowledgments ............................................................................................................. 119

6
Summary The field of plant cell wall signaling is one that has seen tremendous growth in the last few decades. One result of this has been the identification of many uncharacterized proteins putatively involved in the cell wall signaling network. This thesis outlines the initial characterization of three previously unstudied genes of interest in the model organism Arabidopsis thaliana which are loosely tied together by their apparent links, either directly or indirectly, with cell wall signaling. The first gene investigated, named PHYTOSULFOKINE LIKE 1 (PSKL1), is what seems to be a potential preproprotein with possible links to Phytosulfokine (PSK) singling and RECEPTOR-LIKE-PROTEIN 44 (RLP44). PSKL1 was found to contain two of the YIYTQ amino acid motifs found in PSK genes and to affect vascular cell identity. This was shown by an increase in the average number of metaxylem cells in the roots of pskl1 mutant seedlings, a phenotype that was rescued back to wildtype by exogenous PSK treatment. The inverse of this phenotypic trend was observed in a mutant line where both PSK motifs in the gene remained intact, suggesting that PSKL1 might function as more than a possible source of mature PSK’s. The second gene investigated is a member of the F-Box/RNI Like family. This gene was identified in a forward genetic screen looking for suppressors of the RLP44ox phenotype, where it emerged as the most likely candidate for a Brassinosteroid (BR) signaling independent RLP44ox suppressor. Generation of a f-box/rni like line in the RLP44ox background using the CRISPR/Cas9 system recapitulated the suppression phenotype, supporting its role as the causative mutant gene in the original forward genetic screen. Use of a F-Box/RNI Like:RFP line showed F-Box/RNI Like to be localized to the cytosol and a lack of colocalization with RLP44:GFP, suggesting that it doesn’t directly associate with RLP44. The third gene investigated is a receptor like protein named RECEPTOR-LIKE-PROTEIN 46 (RLP46), which has a high degree of genetic conservation throughout the plant kingdom. Available data showed highest RLP46 expression in mature root tissue, and a strong upregulation of expression upon exposure to the elicitor elf18, suggesting RLP46 might have a role in plant innate immune response. The CRISPR/Cas9 system was used to generate a rlp46 mutant line which was tested for biotic and abiotic stress phenotypes. rlp46 at first showed a possible NaCl resistance phenotype, but repetitions of the experiment gave conflicting results. There was however a subtle but consistent phenotype of resistance to elicitor induced growth inhibition in the rlp46 line. Co-immunoprecipitation and Western Blot showed evidence for an association between RLP46 and SUPPRESSOR-OF-BIR 1 (SOBIR1), providing a strong clue for how RLP46 might interact with the plant immune response signaling network. The experiments outlined in this thesis proved successful in characterizing these three proteins and provide a firm foundation for future research.

7
Zusammenfassung Das Feld der Pflanzenzellwandsignale ist in den letzten Jahrzehnten enorm gewachsen. Das führte zur Identifizierung vieler bislang nicht charakterisierter Proteine, die mutmaßlich am Signalnetzwerk der Zellwand beteiligt sind. In dieser Dissertation werden drei bisher nicht untersuchte Gene des Modellorganismus Arabidopsis thaliana charakterisiert, die durch ihre scheinbar direkten oder indirekten Verbindungen mit der Signalübertragung an der Zellwand lose miteinander verbunden sind. Das erste hier untersuchte Gen, PHYTOSULFOKINE LIKE 1 (PSKL1), scheint ein potenzielles Preproprotein mit möglichen Verbindungen zu Phytosulfokine (PSK) -Einzelprodukten und RECEPTOR-LIKE-PROTEIN 44 (RLP44) zu sein. PSKL1 enthält zwei der in PSK-Genen gefundenen YIYTQ-Aminosäuremotive, was darauf schließen lässt, dass es die Identität der Gefäßzellen beeinflusst. Eine Zunahme der durchschnittlichen Anzahl von Metaxylemzellen in den Wurzeln von pskl1-mutierten Keimlingen, ein Phänotyp, der durch exogene PSK-Behandlung in den Wildtyp zurückgeführt wurde, bestätigt diese Vermutung. Die Umkehrung dieses phänotypischen Trends wurde in einer Mutante beobachtet, in der beide PSK Motive im Gen intakt blieben, was darauf hindeutet, dass PSKL1 zusätzlich zu seiner potentiellen Rolle als Quelle für reife PSKs noch weitere Funktionen haben könnte. Das zweite untersuchte Gen ist ein Mitglied der F-Box/RNI Like-Familie. Dieses Gen wurde in einem genetischen Vorwärtsscreening auf der Suche nach Suppressoren des RLP44ox-Phänotyps identifiziert, wobei es sich als wahrscheinlichster Kandidat für einen Brassinosteroid (BR)-Signal-unabhängigen RLP44ox-Suppressor erwies. Die Erzeugung einer f-Box/rni-like Linie im RLP44ox-Hintergrund unter Verwendung des CRISPR/Cas9-Systems immitierte den Suppressionsphänotyp und untermauerte seine Rolle als ursächliches mutiertes Gen im ursprünglichen genetischen Vorwärtsscreening. Die Verwendung einer F-Box/RNI-Like:RFP-Linie zeigte, dass F-Box/RNI-Like im Cytosol lokalisiert war und dass die Co-Lokalisierung mit RLP44:GFP fehlte, was darauf hindeutet, dass es nicht direkt mit RLP44 assoziiert. Das dritte untersuchte Gen ist RECEPTOR-LIKE-PROTEIN 46 (RLP46), ein Rezeptor-like Protein, das im gesamten Pflanzenreich einen hohen Grad an genetischer Konservierung aufweist. Die höchste RLP46-Expression wurde in reifem Wurzelgewebe gemessen, mit starker Hochregulierung der Expression bei Exposition gegenüber dem Elicitor elf18, was darauf hindeutet, dass RLP46 eine Rolle bei der angeborenen Immunantwort der Pflanze spielt. Das CRISPR/Cas9-System wurde verwendet, um eine rlp46-Mutantenlinie zu erzeugen, die auf biotische und abiotische Stressphänotypen getestet wurde. rlp46 zeigte zunächst einen möglichen NaCl-Resistenz-Phänotyp, aber Wiederholungen des Experiments ergaben widersprüchliche Ergebnisse. Es gab jedoch einen subtilen, aber konsistenten Phänotyp der Resistenz gegen durch Auslöser induzierte Wachstumshemmung in der rlp46-Linie. Co-Immunpräzipitation und Western Blot zeigten Hinweise auf eine Assoziation zwischen RLP46 und SUPPRESSOR-OF-BIR 1 (SOBIR1), was einen starken Hinweis darauf liefert, wie RLP46 mit dem Signalnetzwerk der pflanzlichen Immunantwort interagieren könnte. Diese Arbeit beschreibt die erfolgreiche Charakterisierung dieser drei Proteine, und bildet eine fundierte Basis für weitere Forschung.

8
Introduction The ability to interact with its surroundings is a function critical for any living organism,
and one that has been a constant evolutionary driving force throughout the history of life.
The practical results of this necessity can be seen all around. It is found on a macro scale in
the many examples of complex sensory organs possessed by animals, and on a micro scale
in the myriad collections of different sensory proteins deployed by cells. An example of the
latter can be found in the rich and diverse families of leucine-rich repeat receptor-like
kinases (LRR-RLK’s) and receptor-like proteins (RLP’s). These two related families are
comprised of membrane bound proteins possessing both cytoplasmic domains, such as the
kinase domains of the LRR-RLK’s, and extracellular domains, such as leucine-rich repeats
(Shiu and Bleecker, 2001). In fact, LRR-RLK’s get their name from these repeating leucine-
rich extracellular domains, domains that are often found in RLP’s as well (Wang et al.,
2008). These extracellular domains are highly variable, and allow for the perception and
binding of different ligands, which results in conformational changes in the receptor protein
often promoting heterodimerization and, in the case of RLK’s, kinase domain activation
(Hohmann et al., 2017; Santiago et al., 2013). This in turn allows for the propagation of
external signals or stimuli into the signaling network of the cell, which often leads to
immediate protein dependent responses and transcriptional changes (He et al., 2018;
Hohmann et al., 2017). Two LRR-RLK’s that illustrate this well are the proteins
BRASSINOSTEROID-INSENSITIVE 1 (BRI1) and PHYTOSULFOKINE-RECEPTOR 1
(PSKR1). BRI1 is an excellent example of external perception of a ligand leading directly
to transcriptional changes in the cell. In this case the perception of a brassinosteroid (BR)
ligand, such as Brassinolide (BL), leads to BRI1’s heterodimerization with BRI1-
ASSOCIATED-KINASE 1 (BAK1), which activates BRI1’s kinase domain causing
phosphorylation of BRI1-SUPPRESSOR 1 (BSU1), subsequent degradation of
BRASSINOSTEROID-INSENSITIVE 2 (BIN2), and ultimate translocation of the
transcription factor BRASSINAZOLE-RESISTANT 1 (BZR1) to the nucleus (Li and
Chory, 1997; Nam and Li, 2002; Li et al., 2002; Li and Nam, 2002; Wang et al., 2002; Yin
et al., 2002). This portion of the BR signaling pathway, which leads to cellular responses by

9
directly causing transcriptional changes (Chaiwanon and Wang, 2015; Sun et al., 2010; Yu
et al., 2011), can be contrasted with that of PSKR1, where part of the signaling response
operates independent of transcriptional alterations. Here the perception of another ligand, in
this case Phytosulfokine (PSK), causes heterodimerization of PSKR1 with BAK1 (Sauter,
2015; Amano et al., 2007; Matsubayashi et al., 2002, 2006; Wang et al., 2015a), and the
formation of a membrane complex with the H+-ATPases AHA1 and AHA2 as well as the
protein CYCLIC-NUCLEOTIDE-GATED-CHANNEL 17 (CNGC17), which is itself
activated by the cGMP generated downstream of the complex. The influx of cations into the
cell in conjunction with the acidification of the apoplast that results from the creation of this
complex leads to an elongation of the cell (Ladwig et al., 2015), and is an example of a
cellular response that is not directly reliant on transcriptional changes. These 2 examples,
BRI1 and PSKR1, are just 2 from the over 200 currently identified LRR-RLK’s in
Arabidopsis thaliana (Shiu and Bleecker, 2001, 2003), and as such it is no surprise that the
field of plant signaling proteins is one that has experienced rapid growth in the past few
decades. With the advent of DNA sequencing and genome comparison it has become
increasingly clear that evolution has provided plants with an amazingly large and diverse
assortment of sensor and receptor proteins (Shiu and Bleecker, 2003). These sensors and
receptors are critical to the plant cell’s ability to perceive its environment and respond
accordingly (Hohmann et al., 2017). Whether it’s facilitating the perception of
brassinosteroids and phytosulfokines, detecting pathogens, responding to environmental
stimuli, perceiving critical nutrients, or monitoring the internal cellular environment, these
diverse protein families provide the communication infrastructure that allows a plant cell to
coordinate all of its disparate parts. Understandably, the pace of identification of these genes
far outstrips their characterization, as a single genomic analysis can yield dozens if not
hundreds of new potential genes of interest while the characterization of a single gene
routinely last years. The result of this mismatch in pacing is a vast sea of potentially
interesting but as yet uncharacterized genes. This thesis attempts to plumb the depths of a
small corner of this ocean by reporting the initial characterization of three previously
unstudied genes of interest. The experiments outlined in the following three chapters cover
three distinct genes from the model organism Arabidopsis thaliana that are loosely tied

10
together by their apparent links, either directly or indirectly, with cell wall signaling. The
first reported upon is what seems to be a potential preproprotein with probable links to
Phytosulfokine singling, the second is a F-Box/RNI Like family gene identified in a forward
genetic screen, and the third is a receptor like protein with a high degree of genetic
conservation throughout the plant kingdom. Over the course of the experiments outlined
below an initial characterization emerges for each of the three, one that can serve as a solid
foundation for future research.

11
Chapter 1
Introduction
Chapter one pertains to the initial observations of the previously uncharacterized protein
PHYTOSULFOKINE LIKE 1 (PSKL1) (AT2G22942). Ever since the discovery of
Phytosulfokines (PSKs) in Asparagus officinalis L. by Matsubayashi and Sakagami (1996),
PSK’s have shown themselves to be a critical component of the plant cell signaling network,
with links to cell elongation and immune response (Igarashi et al., 2012; Ladwig et al., 2015;
Sauter, 2015; Amano et al., 2007; Matsubayashi et al., 2006; Kutschmar et al., 2009). They
were originally discovered when they were revealed to be the key active ingredient
responsible for allowing the plant cell culture proliferation at lower cell densities observed
in conditioned media (Matsubayashi and Sakagami, 1996). Subsequent studies went on to
determine that phytosulfokines are critical for plant cell culture trans-differentiation into
treachery elements and that the active element is a five amino acid long peptide with the
sequence YIYTQ with sulfation of the two tyrosine residues (Matsubayashi and Sakagami,
1996). The active PSK pentapeptide is the product of posttranslational modifications of the
larger PSK preproprotein (Yang et al., 2001; Lorbiecke and Sauter, 2002). These
preproproteins are derived from gene families found across all higher plants (Sauter, 2015).
In the model organism Arabidopsis thaliana, the PSK gene family contains 6 genes with
varying expression and distribution patterns (Lorbiecke and Sauter, 2002; Sauter, 2015), all
of which contain the PSK YIYTQ motif with the exception of PSK6 which has a YIYTH
motif. PSK6 appears to be only marginally expressed however, if at all, as evidenced by the
RNA-Seq data available (Klepikova et al., 2016), data which is further supported by older
experiments showing an absence of cDNA’s and Expressed Sequence Tags (EST’s)
(Lorbiecke and Sauter, 2002). After translation, the PSK preproprotein undergoes sulfation
in the trans-Golgi network by the enzyme TYROSYLPROTEIN-SULFOTRANSFERASE
(TPST), which is localized there (Komori et al., 2009). After being modified, PSK is
subsequently exported to the apoplast (Lorbiecke and Sauter, 2002; Komori et al., 2009). In
the apoplast, PSK is cleaved by the subtilase protein AtSBT1.1 (Srivastava et al., 2008),

12
though there is a lack of certainty whether other enzymes contribute to the production of the
final mature peptide. Now a mature peptide in the apoplast, PSK is perceived by leucine-
rich repeat receptor-like kinases (LRR-RLK’s), which in A. thaliana are the LRR-RLK’s
PHYTOSULFOKINE-RECEPTOR 1 and PHYTOSULFOKINE-RECEPTOR 2 (PSKR1
and PSKR2) which are located at the plasma membrane (Matsubayashi et al., 2002, 2006)(.
PSK interacts with PSKR1 and PSKR2 by binding to the island domains of the LRR regions
of the proteins (Matsubayashi et al., 2002). This perception of the PSK ligand by PSKR1
and PSKR2 begins the PSK signaling cascades which are responsible for a number of plant
responses involving both growth (through cell elongation) and pathogen defense (Igarashi
et al., 2012; Ladwig et al., 2015; Sauter, 2015; Amano et al., 2007; Matsubayashi et al.,
2006). In the case of PSKR1, perception of PSK promotes the formation of a protein
complex with BRI1-ASSOCIATED-KINASE 1 (BAK1) and the plasma membrane-
localized H+-ATPases AHA1 and AHA2, leading to the downstream generation of cGMP
and the consequent activation of CYCLIC-NUCLEOTIDE-GATED-CHANNEL 17
(CNGC17), which is also present in the complex (Ladwig et al., 2015). This leads to an
influx of cations into the cell and acidification of the apoplast, resulting in cell elongation
(Ladwig et al., 2015). This process is very similar to the Brassinosteroid (BR) signal
pathway with Brassinolide (BL) and the LRR-RLK BRASSINOSTEROID-INSENSITIVE
1 (BRI1), which also interacts with BAK1 and AHA1, resulting in cell wall acidification
and elongation (Caesar et al., 2011). As such, it seems likely that there is a degree of
crosstalk occurring between these two pathways, and recent studies have indeed identified
at least one protein facilitating this exchange of information, a protein by the name of
RECEPTOR-LIKE-PROTEIN 44 (RLP44) (Holzwart et al., 2018). RLP44 seems to serve
as a scaffold for the interactions of LRR-RLK’s such as BRI1, BAK1, and PSKR1
(Holzwart et al., 2018), as well as conveying information about the state of the plant cell
wall into the plant signaling network (Wolf et al., 2014; Holzwart, 2018). In addition to this,
RLP44 determines vascular cell fate in a PSK dependent manner (Holzwart et al., 2018).
The exact nature of RLP44’s interaction with PSK signaling is not entirely known, though
is seems to involve PSK signaling in the procambial cells, where both RLP44 and PSK are
expressed (Brady et al., 2007). From this uncertainty, the protein PSKL1 emerges as a
13
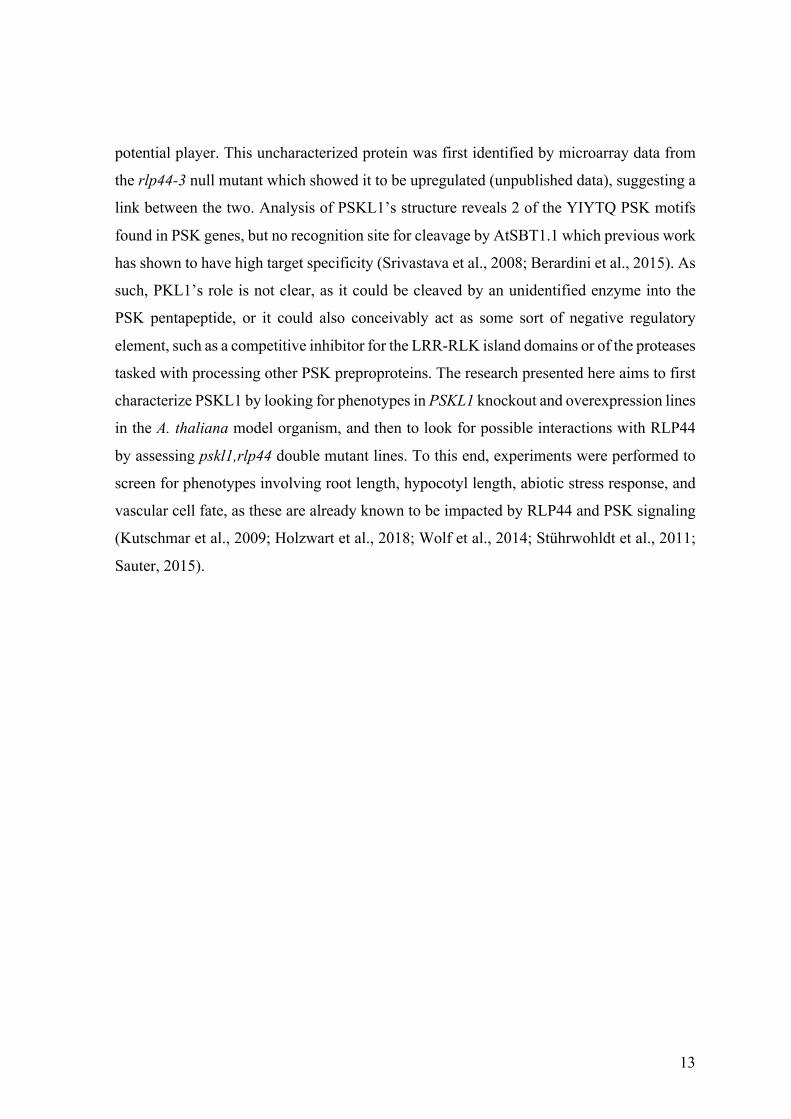
potential player. This uncharacterized protein was first identified by microarray data from
the rlp44-3 null mutant which showed it to be upregulated (unpublished data), suggesting a
link between the two. Analysis of PSKL1’s structure reveals 2 of the YIYTQ PSK motifs
found in PSK genes, but no recognition site for cleavage by AtSBT1.1 which previous work
has shown to have high target specificity (Srivastava et al., 2008; Berardini et al., 2015). As
such, PKL1’s role is not clear, as it could be cleaved by an unidentified enzyme into the
PSK pentapeptide, or it could also conceivably act as some sort of negative regulatory
element, such as a competitive inhibitor for the LRR-RLK island domains or of the proteases
tasked with processing other PSK preproproteins. The research presented here aims to first
characterize PSKL1 by looking for phenotypes in PSKL1 knockout and overexpression lines
in the A. thaliana model organism, and then to look for possible interactions with RLP44
by assessing pskl1,rlp44 double mutant lines. To this end, experiments were performed to
screen for phenotypes involving root length, hypocotyl length, abiotic stress response, and
vascular cell fate, as these are already known to be impacted by RLP44 and PSK signaling
(Kutschmar et al., 2009; Holzwart et al., 2018; Wolf et al., 2014; Stührwohldt et al., 2011;
Sauter, 2015).
14
Results
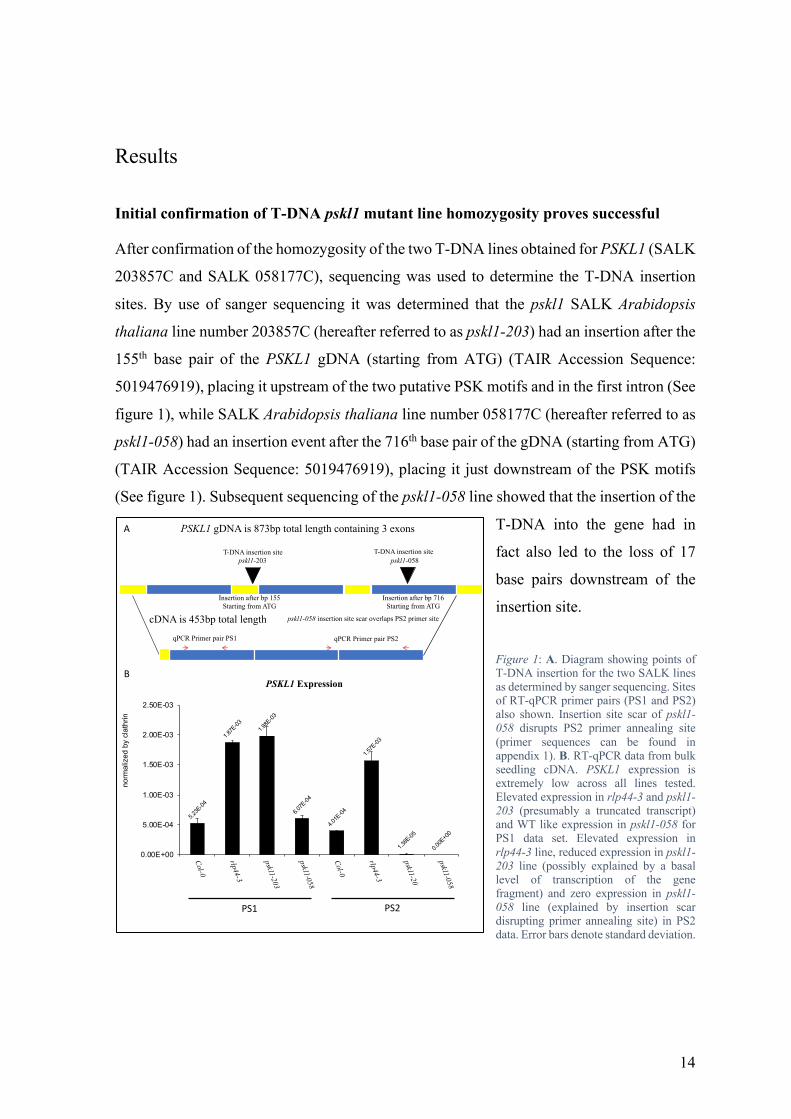
Initial confirmation of T-DNA pskl1 mutant line homozygosity proves successful
After confirmation of the homozygosity of the two T-DNA lines obtained for PSKL1 (SALK
203857C and SALK 058177C), sequencing was used to determine the T-DNA insertion
sites. By use of sanger sequencing it was determined that the pskl1 SALK Arabidopsis
thaliana line number 203857C (hereafter referred to as pskl1-203) had an insertion after the
155th base pair of the PSKL1 gDNA (starting from ATG) (TAIR Accession Sequence:
5019476919), placing it upstream of the two putative PSK motifs and in the first intron (See
figure 1), while SALK Arabidopsis thaliana line number 058177C (hereafter referred to as
pskl1-058) had an insertion event after the 716th base pair of the gDNA (starting from ATG)
(TAIR Accession Sequence: 5019476919), placing it just downstream of the PSK motifs
(See figure 1). Subsequent sequencing of the pskl1-058 line showed that the insertion of the
T-DNA into the gene had in
fact also led to the loss of 17
base pairs downstream of the
insertion site.
Figure 1: A. Diagram showing points of T-DNA insertion for the two SALK lines as determined by sanger sequencing. Sites of RT-qPCR primer pairs (PS1 and PS2) also shown. Insertion site scar of pskl1-058 disrupts PS2 primer annealing site (primer sequences can be found in appendix 1). B. RT-qPCR data from bulk seedling cDNA. PSKL1 expression is extremely low across all lines tested. Elevated expression in rlp44-3 and pskl1-203 (presumably a truncated transcript) and WT like expression in pskl1-058 for PS1 data set. Elevated expression in rlp44-3 line, reduced expression in pskl1-203 line (possibly explained by a basal level of transcription of the gene fragment) and zero expression in pskl1-058 line (explained by insertion scar disrupting primer annealing site) in PS2 data. Error bars denote standard deviation.
pskl1-203 pskl1-058
PSKL1 gDNA is 873bp total length containing 3 exons
cDNA is 453bp total length
Insertion after bp 155Starting from ATG
Insertion after bp 716Starting from ATG
qPCR Primer pair PS1 qPCR Primer pair PS2
T-DNA insertion site T-DNA insertion site
pskl1-058 insertion site scar overlaps PS2 primer site
5.23E
-04
1.87E
-031.9
8E-03
6.07E
-04
4.01E
-04
1.57E
-03
1.38E
-05
0.00E
+00
0.00E+00
5.00E-04
1.00E-03
1.50E-03
2.00E-03
2.50E-03
Col-0 (PS1)
rlp44-3 (PS1)
pskl1-203 (PS1)
pskl1-058 (PS1)
Col-0 (PS2)
rlp44-3 (PS2)
pskl1-203 (PS2)
pskl1-058 (PS2)
norm
aliz
ed b
y cl
athr
in
PSKL1 Expression
PS1 PS2
A
B

15
In order to assess the impact of these T-DNA insertions on the expression of the PSKL1
gene, RT-qPCR was performed using two primer sets (hereafter referred to as PS1 and PS2)
which were upstream and downstream of the pskl1-203 insertion site, and upstream and
overlapping with the stretch of DNA damaged by the pskl1-058 insertion site (primers can
be found in appendix 1). Col-0, pskl1-203, pskl1-058, and rlp44-3 seedlings were harvested
for RNA extraction and cDNA preparation, the rlp44-3 line being included due to the
previously reported elevation in PSKL1 expression observed in it (unpublished data).
Analysis of the RT-qPCR data revealed several interesting results. First and foremost of
these is that expression of the PSKL1 gene is extremely low across all lines, including
wildtype. While it is possible that expression is more elevated during a different
developmental stage of the plant, the data shown here indicates that seedlings have low
expression of the PSKL1 gene. The elevation in PSKL1 expression reported previously in
the rlp44-3 genetic background (unpublished data) was confirmed. The pskl1-203 line PS1
data showed elevated expression of what presumably was a truncated transcript not
containing any PSK motifs, while the PS2 data showed reduced expression. The presence
of some cDNA containing the PS2 sequence in the pskl1-203 line, despite the presence of a
T-DNA insertion upstream of it, can potentially be explained by a basal level of transcription
of the gene fragment still occurring despite the presence of the T-DNA insert. The
theoretical low-level production of this gene fragment transcript containing the DNA
sequence for the PS2 transcript would then be weakly detected by the RT-qPCR assay. The
results for pskl1-058 show roughly wildtype expression levels in the PS1 data, despite the
disruption of the third exon by the T-DNA insertion site which is located downstream of the
annealing site for the primers (see figure 1), and no expression in the PS2 data, which makes
sense due to the insertion scar disrupting the sequence where the primer would anneal (see
figure 1), giving a potential false negative. This RT-qPCR data, taken together with the
sequencing results, confirmed that the mutant lines pskl1-203 and pskl1-058 contain
homozygous mutations affecting the PSKL1 gene.

16
Initial observations of pskl1 mutants finds potential root length phenotype
With the T-DNA lines confirmed, side by side growth comparisons were performed to look
for phenotypic differences in rosette, hypocotyl length, and root length. Plants were
germinated and grown on Phyto-Agar plates for 10 days and then transferred to soil and
allowed to grow for 14 days before imaging.
Figure 2: A. thaliana rosettes grown in parallel under controlled long day growth conditions. No obvious phenotypic differences between pskl1 mutants and WT were observed. Images taken 24 DAG. Plants germinated on Phyto-Agar plates and allowed to grow for 10 days, then transferred to soil and allowed to grow for 14 days before imaging.
Observations of rosettes grown in controlled long day conditions did not reveal any obvious
phenotypes. This was also the case when measuring hypocotyl lengths of etiolated seedlings
4 days after germination,
which likewise showed no
significant difference
between the pskl1 mutants
and WT.
Figure 3: A. Boxplot of seedling root length 5 days after germination. Data combined from 2 iterations of experiment. Both pskl1 mutants showed a small but significant increase in root length compared to WT (0.0003 and 0.0001 p values respectively). Student T-Test
(homoscedastic). N of 65 for Col-0, 80 for pskl1-203, and 75 for pskl1-058. Error bars denote standard deviation. B. Boxplot of hypocotyl length in etiolated seedlings 4 days after germination. Data combined from 2 iterations of experiment. No significant difference was observed between mutant lines and WT. N of 17 for Col-0, 30 for pskl1-203, and 29 for pskl1-058. Error bars denote standard deviation.
Col-0 pskl1-058pskl1-203
Col
−0
pskl
1−20
3
pskl
1−05
8
0
5
10
15
20
Root Length 5DAG
Roo
t len
gth
(mm
)
*** ***
Col
−0
pskl
1−20
3
pskl
1−05
8
0
5
10
15
Hypocotyl Length 4DAG
Hyp
ocot
yl le
ngth
(mm
)
A B
Col-0 pskl1-203 pskl1-058 Col-0 pskl1-203 pskl1-058

17
Interestingly, analysis of 5 day old seedling root length did show a phenotype of a small but
significant increase in root length for the pskl1 mutants as compared to WT. With no
observed phenotypic differences in rosette or hypocotyl length, and with a potential
phenotype for root length, the mutants were next tested for abiotic stress induced root length
phenotypes. Plants were grown on Phyto agar plates containing either mannitol, sucrose, or
NaCl at various concentrations, which served as a source of abiotic stress. 5 Day old
seedling root lengths were then compared.

18
A
Col−0
Con
trol 1
% S
ucro
seCo
l−0 2
5 m
M N
aCl
Col−0
50
mM
NaC
lCo
l−0 7
5 m
M N
aCl
Col−0
100
mM
NaC
lCo
l−0 1
50 m
M N
aCl:
Col−0
50
mM
Man
n:Co
l−0 1
00 m
M M
ann:
Col−0
150
mM
Man
n:Co
l−0 4
.5%
Suc
:Co
l−0 5
.0%
Suc
:Co
l−0 5
.5%
Suc
:Co
l−0 6
.0%
Suc
:Co
l−0 6
.5%
Suc
:ps
kl1−2
03 C
ontro
l 1%
Suc
rose
pskl1
−203
25
mM
NaC
lps
kl1−2
03 5
0 m
M N
aCl
pskl1
−203
75
mM
NaC
lps
kl1−2
03 1
00 m
M N
aCl
pskl1
−203
150
mM
NaC
l:ps
kl1−2
03 5
0 m
M M
ann:
pskl1
−203
100
mM
Man
n:ps
kl1−2
03 1
50 m
M M
ann:
pskl1
−203
4.5
% S
uc:
pskl1
−203
5.0
% S
uc:
pskl1
−203
5.5
% S
uc:
pskl1
−203
6.0
% S
uc:
pskl1
−203
6.5
% S
uc:
pskl1
−058
Con
trol 1
% S
ucro
seps
kl1−0
58 2
5 m
M N
aCl
pskl1
−058
50
mM
NaC
lps
kl1−0
58 7
5 m
M N
aCl
pskl1
−058
100
mM
NaC
lps
kl1−0
58 1
50 m
M N
aCl:
pskl1
−058
50
mM
Man
n:ps
kl1−0
58 1
00 m
M M
ann:
pskl1
−058
150
mM
Man
n:ps
kl1−0
58 4
.5%
Suc
:ps
kl1−0
58 5
.0%
Suc
:ps
kl1−0
58 5
.5%
Suc
:ps
kl1−0
58 6
.0%
Suc
:ps
kl1−0
58 6
.5%
Suc
:
0
5
10
15
20
NaCl Abiotic Stress Root Length 7DAT 12DAG
Root
leng
th n
orm
alize
d to
cont
rol m
ean
(per
cent
)
Col−0
Con
trol 1
% S
ucro
seCo
l−0 2
5 m
M N
aCl
Col−0
50
mM
NaC
lCo
l−0 7
5 m
M N
aCl
Col−0
100
mM
NaC
lCo
l−0 1
50 m
M N
aCl
Col−0
50
mM
Man
nCo
l−0 1
00 m
M M
ann
Col−0
150
mM
Man
nCo
l−0 4
.5%
Suc
Col−0
5.0
% S
ucCo
l−0 5
.5%
Suc
Col−0
6.0
% S
ucCo
l−0 6
.5%
Suc
pskl1
−203
Con
trol 1
% S
ucro
seps
kl1−2
03 2
5 m
M N
aCl
pskl1
−203
50
mM
NaC
lps
kl1−2
03 7
5 m
M N
aCl
pskl1
−203
100
mM
NaC
lps
kl1−2
03 1
50 m
M N
aCl
pskl1
−203
50
mM
Man
nps
kl1−2
03 1
00 m
M M
ann
pskl1
−203
150
mM
Man
nps
kl1−2
03 4
.5%
Suc
pskl1
−203
5.0
% S
ucps
kl1−2
03 5
.5%
Suc
pskl1
−203
6.0
% S
ucps
kl1−2
03 6
.5%
Suc
pskl1
−058
Con
trol 1
% S
ucro
seps
kl1−0
58 2
5 m
M N
aCl
pskl1
−058
50
mM
NaC
lps
kl1−0
58 7
5 m
M N
aCl
pskl1
−058
100
mM
NaC
lps
kl1−0
58 1
50 m
M N
aCl
pskl1
−058
50
mM
Man
nps
kl1−0
58 1
00 m
M M
ann
pskl1
−058
150
mM
Man
nps
kl1−0
58 4
.5%
Suc
pskl1
−058
5.0
% S
ucps
kl1−0
58 5
.5%
Suc
pskl1
−058
6.0
% S
ucps
kl1−0
58 6
.5%
Suc
0
5
10
15
20
NaCl Abiotic Stress Root Length 7DAT 12DAG
Root
leng
th n
orm
alize
d to
cont
rol m
ean
(per
cent
)
B
Col-0 pskl1-203 pskl1-058
25 50 75 100
NaCl (mM)
Mann. (mM)
Sucrose (percent)
150
1% Suc. C
ontrol 100
150
50 4.5%
5.0%
6.0%
5.5%
6.5% 25 50 75 100
NaCl (mM)
Mann. (mM)
Sucrose (percent)
150
1% Su
c. Con
trol 100
150
50 4.5%
5.0%
6.0%
5.5%
6.5% 25 50 75 100
NaCl (mM)
Mann. (mM)
Sucrose (percent)
150
1% Suc. C
ontrol 100
150
50 4.5%
5.0%
6.0%
5.5%
6.5%
Col-0 pskl1-203 pskl1-058
25 50 75 100
NaCl (mM)
Mann. (mM)
Sucrose (percent)
150
1% Su
c. Con
trol 100
150
50 4.5%
5.0%
6.0%
5.5%
6.5% 25 50 75 100
NaCl (mM)
Mann. (mM)
Sucrose (percent)
150
1% Suc. C
ontrol 100
150
50 4.5%
5.0%
6.0%
5.5%
6.5% 25 50 75 100
NaCl (mM)
Mann. (mM)
Sucrose (percent)
150
1% Suc. C
ontrol 100
150
50 4.5%
5.0%
6.0%
5.5%
6.5%

19
Figure 4: A. Boxplot of seedling root length 5 days after germination. Plants grown on Phyto-Agar plates containing abiotic stressors. Small increase in pskl1 mutant root lengths still apparent, however large variability in samples undermines result. N of 65, 26, 21, 23, 18, 17, 18, 26, 18, 22, 23, 15, 23, 21, 80, 29, 30, 29, 28, 29, 28, 29, 29, 33, 29, 15, 29, 26, 75, 28, 28, 30, 28, 28, 30, 29, 30, 30, 29, 15, 29, 27 respectively. Data combined from 2 iterations of experiment. Error bars denote standard deviation. B. Same experimental data normalized to percent growth relative to the control treatment for the plant line. No immediately obvious pskl1 mutant phenotypes for abiotic stress responses observed. Data combined from 2 iterations of experiment. Error bars denote standard deviation.
Upon completing the experiment, review of the data showed a great deal of variation in root
length in the sample populations, however the trend of a small overall increase in pskl1
mutant root length appeared to persist. Further analysis of the data after normalization led
to the conclusion that there were no immediately obvious abiotic stress phenotypes for either
of the pskl1 mutant lines.
pskl1 mutants show phenotype of increased metaxylem cell number
The next set of experiments were designed to search for possible pskl1 phenotypes related
to PSK signaling, as well as test for a potential role for PSKL1 in the interaction between
RLP44 and PSKR1 signaling (Holzwart et al., 2018). Analysis of Previous results had
shown RLP44 to have an impact on metaxylem cell number in A. thaliana seedling roots
(Holzwart et al., 2018). Therefore, metaxylem cell numbers were counted in 6 day old
seedlings using basic fuchsine staining with fluorescent microscopy, paying close attention
for the presence of metaxylem cells outside of the normally linear xylem axis.
Figure 5:Fluorescent microscopy image showing basic fuchsine stained root metaxylem tissue of 6 day old Col-0 seedlings. Example on left shows 3 central metaxylem cells and 2 protoxylem cells (one on each end), while the example on the right shows 4 central metaxylem cells and 2 protoxylem cells (one on each end).
In addition, plants were grown on media with and without
PSK, as the production of PSK’s is a possible, though not
certain, result of PSKL1 expression.

20
Figure 6:Graph showing percent breakdown of average metaxylem cell number in roots of 6 day old seedlings grown on Phyto Agar plates with or without PSK (1 µM). pskl1-058 +PSK treatment showed a significant increase in average metaxylem cell number as compared to both Col-0 treatments (Homoscedastic Student T-Test p values of 0.001 and 0.003 respectively), while pskl1-203 -PSK treatment showed a significant increase in average metaxylem cell number as compared to both Col-0 treatments (Homoscedastic Student T-Test p values of 0.004 and 0.012 respectively). Data combined from 6 iterations of experiment. N of 119, 99, 103, 88, 110, and 94 respectively.
Counting metaxylem cell numbers yielded some interesting results. The pskl1 lines did not
show an increased level of out of axis metaxylem cell events, but both lines did show a
significant increase in the average number of metaxylem cells. Both lines showed a response
to PSK treatment, which contrasted with the apparent PSK insensitivity of the Col-0 WT,
but surprisingly the PSK response trend was inverted between the two lines (see figure 6).
This could be the result of the presence of two functional PSK motifs in the pskl1-058 line
as opposed to the zero in the pskl1-203 line (see figure 1), however experiments testing this
hypothesis were not pursued. PSK effects on pskl1 mutant root lengths were also measured.
0%10%20%30%40%50%60%70%80%90%
100%
-PSK_Col-0
+PSK_Col-0
-PSK_pskl1-058
+PSK_pskl1-058
-PSK_pskl1-203
+PSK_pskl1-203
Average Metaxylem Cell Number 6DAG
5
4
3
2
Col-0 pskl1-058 pskl1-203
** **
PSK - + - + - +

21
Figure 7: Boxplot showing root length for plantlets grown on Phyto-Agar plates either with or without PSK (1 µM) present in the media. pskl1 mutant lines show a significant difference in their response to PSK treatment as compared to the WT control (p value of 0.002 and 6.1x10⁻⁶ respectively), however only pskl1-058 showed a significant response to PSK (p value of 4.8x10⁻⁵), which contradicts literary sources on Col-0 response (Kutschmar et al., 2009). Absence of a significant difference between all three PSK negative treatments undermines the previously observed phenotype of increased root length in the pskl1 mutants, though this experiment’s use of 6 DAG seedlings is a possible explanation. Statistical significance calculated using Tukey HSD test (see appendix 6 for complete results). N of 94, 93, 60, 77, 58, and 81 respectively. Data combined from 3 iterations of experiment. Error bars denote standard deviation.
The results from measuring
root lengths showed a
significant difference between
the PSK response of the pskl1
mutant lines when compared to WT, though only pskl1-058 showed a significant difference
from its own PSK negative sample group. It should be noted that the lack of a Col-0 response
to PSK contradicts previous findings (Kutschmar et al., 2009), which undermines these
results. Also, the absence of a significant difference between all three PSK negative
treatments undermines the previously observed phenotype of increased root length in the
pskl1 mutants. It is possible of course that this phenotype is only present in 5 DAG
seedlings, and therefore the sample group of 6 DAG seedlings used in this experiment does
not exhibit it.
CRISPR/Cas9 successfully used to create new pskl1 mutants
Since the 2 pskl1 T-DNA mutant lines appeared to be giving conflicting results with regards
to the newly identified metaxylem phenotype, it seemed prudent to generated new pskl1
Col
−0 −
PSK
Col
−0 +
PSK
pskl
1−20
3 −P
SK
pskl
1−20
3 +P
SK
pskl
1−05
8 −P
SK
pskl
1−05
8 +P
SK
0
5
10
15
20
PSK Effect on Root Length 6DAG
Roo
t len
gth
(mm
)
Col-0 pskl1-203 pskl1-058
PSK - + - + - +
*****
***

22
mutants in order to confirm that the mutations in the PSKL1 gene found in the T-DNA lines
were in fact responsible for the observed mutant phenotype. Therefore, new mutant lines
were generated using CRISPR/Cas9 with the goal of using them to further explore the role
of PSKL1, the end result being the generation of 2 new mutant lines with different mutations
in the PSKL1 gene. Both mutations lead to premature stop codons that should result in a
truncated protein, resulting in one mutant containing only one of the PSK motifs, and a
second containing no PSK motifs (see figure 8). The first mutant line was given the name
Cpskl1-20 and the second the name Cpskl1-62 and Cpskl1-68 (two separately derived lines
that ended up having the same mutation). Overexpression lines were also generated using
the GreenGate system (see methods section), resulting in 3 p35S promotor driven PSKL1OX lines. These 3 lines were given the names PSKL1OX-27, PSKL1OX-42, and PSKL1OX-48.
These new lines were then confirmed with sequencing and RT-qPCR.
Figure 8: A. Comparison of protein sequences of both CRISPR/Cas9 derived pskl1 mutants with that of WT. Putative PSK motifs highlighted in green. B. RT-qPCR data from bulk seedling cDNA showing PSKL1 expression levels across newly generated mutant lines. Overexpression lines show extremely elevated PSKL1 expression relative to WT, while the CRISPR pskl1 mutants show expression levels similar to WT and rlp44-3. PS1 RT-qPCR primers used. Error bars denote standard deviation.
0.010
4
73.07
38
50.76
72
79.18
18
0.015
00.0
150
0.009
70.0
092
0.0000
10.0000
20.000030.0000
40.0000
50.0000
60.0000
70.000080.0000
90.0000
Col-0
PSKL1ox-27
PSKL1ox-42
PSKL1ox-48
rlp44-3
Cpskl1-20
Cpskl1-62
Cpskl1-68
norm
aliz
ed b
y cl
athr
in
PSKL1 Expression Levels
PSKL1: MSKINILIVAAVLLSSVVLASVARPDSTLQSKSTEIEKNCETDECLMKTTSDAHLDYIYTQ Mutant1: MSKINILIVAAVLLSSVVLASVARPDSTLQSKSTEIEKNCETDECLMKTTSDAHLDYIYTQ Mutant2: MSKINILIVAAVLLSSVVLASVARPDSTLQSKFNGDREEL*-------------------- NPPPRAPKEMETKCETEECLMKTTSDAHLDYIYTQTHPPKPHAFKVNP* NPPPSCT*----------------------------------------- ------------------------------------------------- AB

23
The RT-qPCR results showed high expression of PSKL1 in the overexpression lines relative
to WT, and expression levels similar to WT and rlp44-3 in the CRISPR derived pskl1
mutants. These results confirmed that the new PSKL1 lines were now ready for use in
experiments.
CRISPR generated pskl1 mutants confirm increased metaxylem phenotype
The newly derived PSKL1 lines were tested for root length phenotypes and for PSK
responsiveness.
Figure 9: Boxplot showing average root length 5 days after germination. Col-0, PSKL1OX-48, Cpskl1-62, and Cpskl1-68 showed significant responses to exogenous PSK (1 µM) treatment (T-Test (homoscedastic) p value of 1.20x10⁻⁴, 3.60x10⁻³, 1.59x10⁻⁴, and 3.96x10⁻⁶ respectively). Both the Cpskl1-20 PSK positive and negative sample groups differed significantly from the Col-0 PSK negative treatment (T-Test p value of 6.24x10⁻⁶ and 2.66x10⁻⁴ respectively). The PSKL1OX lines showed differing phenotypes of exogenous PSK resistance and root length, suggesting that other factors besides PSKL1 expression were probably at work. The two zero PSK motif lines (Cpskl1-62 and Cpskl1-68) behaved similar to WT, and the single PSK motif line (Cpskl1-20) showed PSK resistance and increased root length. Data combined from 3 iterations of experiment. N of 121, 54, 137, 49, 98, 33, 133, 54, 105, 48, 115, 55, 112, and 50 respectively. Error bars denote standard deviation.
The results of these
experiments testing
PSK’s effects on root
length showed the expected Col-0 response of a statistically significant increase in root
length (Kutschmar et al., 2009), a result the zero PSK motif mutants Cpskl1-62 and Cpskl1-
T0 C
ol−0
T1 C
ol−0
T0 P
SKL1
ox−2
7
T1 P
SKL1
ox−2
7
T0 P
SKL1
ox−4
2
T1 P
SKL1
ox−4
2
T0 P
SKL1
ox−4
8
T1 P
SKL1
ox−4
8
T0 C
pskl
1−20
T1 C
pskl
1−20
T0 C
pskl
1−62
T1 C
pskl
1−62
T0 C
pskl
1−68
T1 C
pskl
1−68
0
5
10
15
PSK Effect on Root Length 5DAG
Roo
t len
gth
(mm
)
****** *****
PSK +- +- +- +- +- +- +-
******
24
68 also shared. Interestingly, the 1 PSK motif mutant Cpskl1-20 showed resistance to PSK
treatment, and still possessed the increased root growth phenotype seen in the T-DNA
mutants, a result that could possibly be explained by a still functional remaining PSK motif.
The PSKL1 overexpression line results were very mixed, with line PSKL1OX-27 showing
increased root length and PSK resistance, line PSKL1OX-42 showing no increase in root
length and PSK resistance, and line PSKL1OX-48 showing no increase in root length and
PSK responsiveness. Since the RT-qPCR results suggest that the PSKL1 transcripts should
be in extreme excess in all 3 overexpression lines as compared to WT, the conflicting results
suggest that some other unknown factor might be responsible for the observed discrepancies
between lines. That said, testing PSK’s effects on metaxylem cell number in 6 day old
seedlings did yield interesting results. All lines with the exception of Cpskl1-20, PSKL1OX-
42, and PSKL1OX-48 showed a statistically significant response to PSK treatment (while not
found significant by homoscedastic student T-Test, PSKL1OX-48 did seem to have a subtle
response to PSK treatment), which was in contrast to the apparent PSK insensitivity of the
Col-0 WT control. The results from the PSKL1OX lines were not consistent, with differences
in average metaxylem cell number observed between the lines for both exogenous PSK
positive and negative treatments. Interestingly, many lines did show a significant divergence
from the WT samples receiving the same treatment, however, since the RT-qPCR results
indicated that all 3 PSKL1OX lines have PSKL1 transcripts in excess, the lack of a consistent
phenotype across all the PSKL1OX lines suggests that PSKL1 expression levels might not be
responsible for the observed results in these experiments. Analysis of the of the CRISPR
generated pskl1 lines yielded more consistent results. All lines, with the exception of
Cpskl1-20 showed a response to PSK treatment. Also, the increased average metaxylem cell
number and return to wildtype levels with exogenous PSK treatment seen in the zero PSK
motif pskl1-203 mutant was replicated in the zero PSK motif mutants Cpskl1-62 and Cpskl1-
68. The double PSK motif mutant pskl1-058’s trend of WT average metaxylem cell number
in PSK negative treatments, and increased average metaxylem cell number when treated
with exogenous PSK, was paralleled by the single PSK motif mutant Cpskl1-20, though it
started with a higher average metaxylem cell number in the PSK negative treatments than
the pskl1-058 line. When compared directly with the Col-0 WT samples, all of the

25
CRISPR/Cas9 derived pskl1 lines showed a significant increase in average metaxylem cell
number in the PSK negative treatments. This phenotype was once again rescued upon
exogenous PSK treatment for the zero PSK motif mutant lines, and generated or exacerbated
in the double/single PSK motif mutant lines.

26
Figure 10: Data combined from 8 iterations of experiment for pskl1-058, pskl1-203, and Col-0 lines, and 2 iterations for all other lines. See Table 1 for all n values and average metaxylem percent breakdowns for each line. All graphs show percent breakdown of average metaxylem cell number in roots of 6 day old seedlings grown on Phyto Agar plates with or without exogenous PSK (1 µM) treatment. A. Cpskl1-20 and PSKL1OX-42 showed WT PSK insensitivity, while all other lines showed significant responses to PSK treatment, except PSKL1OX-48 who’s response fell short of statistical significance (Student T-Test (homoscedastic) p values of 0.036, 0.045, 0.049, 0.048, and 0.049 respectively). B. PSKL1OX lines showed mixed phenotypes and PSK responses, while PSKL1OX-27 and PSKL1OX-42 showed a significant difference
0%10%20%30%40%50%60%70%80%90%
100%
Average Root Metaxylem Cell Number 6DAG2 3 4 5
Col-0pskl1-058 pskl1-203Cpskl1-20 Cpskl1-62 Cpskl1-68
PSK - +
PSKL1ox-27 PSKL1ox-42 PSKL1ox-48
- + - + - + - + - + - + - + - +
* * * * *
0%10%20%30%40%50%60%70%80%90%
100%
Average Root Metaxylem Cell Number 6DAG2 3 4 5
Col-0 PSKL1ox-27PSK - +
PSKL1ox-42 PSKL1ox-48- + - + - +
********
0%10%20%30%40%50%60%70%80%90%
100%
Average Root Metaxylem Cell Number 6DAG2 3 4 5
Col-0pskl1-058 pskl1-203Cpskl1-20 Cpskl1-62 Cpskl1-68PSK - + - + - + - + - + - +
* * * *
0%10%20%30%40%50%60%70%80%90%
100%
Average Root Metaxylem Cell Number 6DAG2 3 4 5
Col-0 pskl1-058 pskl1-203Cpskl1-20 Cpskl1-62 Cpskl1-68PSK - - - - - -
***
*****
0%10%20%30%40%50%60%70%80%90%
100%
Average Root Metaxylem Cell Number 6DAG2 3 4 5
Col-0 pskl1-058 pskl1-203Cpskl1-20 Cpskl1-62 Cpskl1-68PSK + + + + + +
****
A
B C
D E

27
from the WT control on PSK negative media (Student T-Test (homoscedastic) p values of 0.011 and 0.007 respectively), and lines PSKL1OX-27 and PSKL1OX-42 showed a significant difference from the WT control on PSK positive media (Student T-Test (homoscedastic) p values of 2.14x10⁻⁴ and 0.024 respectively). The lack of a consistent phenotype from the PSKL1OX lines suggests that alterative factors might be responsible besides PSKL1 over expression. C. All pskl1 lines
showed a significant response to exogenous PSK treatment, except Cpskl1-20 who’s response fell short of statistical significance (Student T-Test (homoscedastic) p values of 0.036, 0.045, 0.049, and 0.048 respectively), which contrasted with the PSK insensitivity of the Col-0 control samples. All zero PSK motif mutants (pskl1-203, Cpskl1-62, and Cpskl1-68) showed a similar phenotype of increased average metaxylem cell number which was rescued back to WT levels by exogenous PSK treatment. The double/single PSK motif mutant lines (pskl1-058 and Cpskl1-20) seemed to show a similar trend of increased average metaxylem cell number when grown with exogenous PSK, but with the Cpskl1-20 line having a higher starting average number of metaxylem cells. D. All lines showed a significant increase in the average root metaxylem cell number with the exception of line pskl1-058 (Student T-Test (homoscedastic) p values of 0.019, 1.56x10⁻³, 2.57x10⁻³, and 6.56x10⁻⁵ respectively) when compared to WT controls. E. The double/single PSK motif lines (pskl1-058 and Cpskl1-20) showed a significant increase in the average root metaxylem cell number as compared to WT (Student T-Test (homoscedastic) p value of 5.06x10⁻³ and 7.34x10⁻³ respectively), while the zero PSK motif mutant lines (pskl1-203, Cpskl1-62, and Cpskl1-68) were rescued back to WT levels by exogenous PSK treatment.
Table 1: Table containing average metaxylem cell numbers for data used in figure 10. Data combined from 8 iterations of experiment for pskl1-058, pskl1-203, and Col-0 lines, and 2 iterations for all other lines. Exogenous PSK treatment, n values, and percent breakdown of average metaxylem cell numbers shown.
Reviewing all the data, these very
interesting results hints at some sort of
dual role for the PSKL1 peptide, since the
rescue by exogenous PSK treatment would
suggest PSKL1 could act as a PSK source, while the inverse phenotype shown by the
double/single PSK motif mutants hints at a different, potentially even regulatory role for the
PSKL1 protein.
Line n PSK 2 3 4 5
pskl1-058 110 - 2.7 60.9 31.8 4.5
pskl1-058 94 + 0.0 45.7 53.2 1.1
Cpskl1-20 43 - 0.0 48.8 51.2 0.0
Cpskl1-20 22 + 0.0 31.8 68.2 0.0
pskl1-203 103 - 1.0 47.6 50.5 1.0
pskl1-203 88 + 0.0 63.6 36.4 0.0
Cpskl1-62 46 - 0.0 43.5 56.5 0.0
Cpskl1-62 25 + 0.0 68.0 32.0 0.0
Cpskl1-68 48 - 0.0 35.4 64.6 0.0
Cpskl1-68 22 + 4.5 59.1 31.8 4.5
Col-0 157 - 2.5 65.6 31.2 0.6
Col-0 119 + 1.7 63.9 32.8 1.7
PSKL1ox-27 45 - 2.2 44.4 51.1 2.2
PSKL1ox-27 20 + 0.0 25.0 65.0 10.0
PSKL1ox-42 39 - 0.0 48.7 46.2 5.1
PSKL1ox-42 22 + 0.0 40.9 54.5 4.5
PSKL1ox-48 35 - 0.0 71.4 28.6 0.0
PSKL1ox-48 25 + 0.0 48.0 48.0 4.0
Percent Average Root Metaxylem Cell Number 6DAG

28
Experiment with rlp44,pskl1 double mutant suggests PSKL1 is epistatic to RLP44
Since the elevated expression of PSKL1 in the rlp44-3 mutant line (unpublished data)
suggests some sort of interaction between PSKL1 and RLP44, rlp44-3 and Cpskl1-68 were
crossed to create an rlp44,pskl1 double mutant. This newly derived line was first compared
side by side with rlp44-3, Cpskl1-68, and Col-0 controls to look for any additive phenotypes
in the plant rosettes.
Figure 11: A. thaliana rosettes grown in parallel under controlled long day growth conditions. No obvious phenotypic differences between any of the lines were observed. Images taken 25 DAG. Plants germinated on Phyto-Agar plates and allowed to grow for 3 days, then transferred to soil and allowed to grow for 22 days before imaging
Col-0 rlp44-3Cpskl1-68rlp44,pskl1

29
Analysis of the rosettes of the 4 lines did not yield any obvious phenotypes. The rlp44,pskl1
double mutant line was then tested for phenotypes in the average number of root metaxylem
cells. As before, 6 day old seedlings were stained with basic fuchsine and the number of
root metaxylem cells counted.
Figure 12: Graph showing percent breakdown of average metaxylem cell number in roots of 6 day old seedlings grown on Phyto Agar plates. Cpskl1-68 seemed to show an increase in average root metaxylem cell numbers compared to WT (consistent with previous experiments), while rlp44-3 showed WT metaxylem cell numbers. The rlp44,pskl1 double mutant seemed to emulate the Cpskl1-68 trend of increased average root metaxylem cell numbers, suggesting that PSKL1 is epistatic to RLP44. Observations weren’t statistically significant using
Student T-Test (homoscedastic). This is likely the result of the small sample size of this experiment. Data collected from 1 experimental iteration. N of 24, 24, 24, and 24. See Table 2 for all n values and average metaxylem percent breakdowns for each line.
The experiment seemed to show that the rlp44-3 mutant had average root metaxylem cell
numbers similar to WT, in contrast to the established literature (Holzwart et al., 2018), while
the Cpskl1-68 and rlp44,pskl1 mutants seemed to show a small increase in average root
metaxylem cell numbers compared to WT, though it should be noted that with the small
sample size of this experiment, these observations weren’t statistically significant using a
Homoscedastic Student T-Test and should be considered preliminary. Table 2: Table containing average metaxylem cell number for data used in figure 12. Data collected from 1 experimental iteration. N values and percent breakdown of average metaxylem cell numbers shown.
Taking this data into consideration with the
previous results, the experiment does seem to
suggest that PSKL1 is epistatic to RLP44, though
given cursory nature of the experiment and the
deviation of the rlp44-3 result from the published
literature (Holzwart et al., 2018), these results
should not be viewed as conclusive.
0%10%20%30%40%50%60%70%80%90%
100%
Average Root Metaxylem Cell Number 6DAG2 3 4 5
Col-0 Cpskl1-68 rlp44,pskl1 rlp44-3
Line n 2 3 4 5
Col-0 24 0 58.3 41.7 0
Cpskl1-68 24 0 45.8 50 4.2
rlp44,pskl1 24 0 45.8 54.2 0
rlp44-3 24 0 62 38 0
Percent Average Root Metaxylem Cell Number 6DAG

30
Discussion
While many of the experiments performed using PSKL1 knockout and overexpression
mutants to assess hypocotyl length, root length, and abiotic stress response yielded
inconclusive or mixed results, there was one trend that consistently emerged, that of PSKL1
playing a role in the determination of metaxylem cell number. Across the experiments
performed with the T-DNA and CRISPR derived pskl1 mutants, the pskl1 lines containing
no PSK motifs consistently had a phenotype of higher average metaxylem cell numbers than
the WT controls, and this mutant phenotype was also consistently rescued back to WT by
exogenous application of PSK. This is similar to the trend for rlp44-3 (Holzwart et al.,
2018), which when taken into consideration with the RT-qPCR results showing elevated
PSKL1 expression in the rlp44-3 mutant background (unpublished data), argues for PSKL1
playing a role in RLP44’s PSK dependent regulation of vascular cell fate. These results
become more interesting and nuanced when reviewing the trends for the other pskl1 mutant
lines. The T-DNA mutant line pskl1-058 showed the opposite trend to that of the zero PSK
motif pskl1 mutants, with WT metaxylem cell numbers that were significantly increased by
exogenous PSK treatment. This could potentially be explained by the location of the T-DNA
insertion at the very tail end of gene. Sequencing shows that both PSK motifs are unaffected
in the mutant, and furthermore, the RT-qPCR data shows WT levels of PSKL1 transcripts
in the pskl1-058 line. It is therefore quite possible that the modified PSKL1 transcript is still
functional enough to result in WT metaxylem cell numbers. The response to exogenous PSK
treatment is harder to explain, but it is conceivable that the location of the T-DNA insertion
disrupts a regulatory region or recognition site in 3’UTR of the mature transcript or at the
tail end of the putative preproprotein. This hypothetically could interact with the signal
cascade caused by the perception of exogenous PSK, leading to the observed phenotype.
This line of reasoning could also then explain the phenotype observed in the Cpskl1-20
mutant line. The presence of the 1 remaining PSK motif could theoretically cause the
average metaxylem cell number to fall between that of the 2 PSK motif WT and the zero
PSK motif mutants, while the absence of the hypothetical regulatory element in the C
terminal end or 3’UTR would cause the same trend of increased metaxylem cell number

31
upon exogenous PSK treatment seen in the pskl1-058 mutant line. This is of course a
completely speculative line of reasoning as at this time it is not even clear whether PSKL1
is processed into mature PSK pentapeptides or if it functions in some other capacity. In this
regard it was unfortunate that analysis of the PSKL1ox mutants failed to elucidate the role
of PSKL1 more, as a consistent trend from overexpression lines could have provided more
insight into the role of PSKL1. While the RT-qPCR data showed PSKL1 expression levels
vastly in excess of the WT controls, the phenotypic manifestations of the lines were not
consistent. While all 3 lines seemed to respond to exogenous PSK treatment with at least
some increase in the number of metaxylem cells, a result similar to the observations for
pskl1-058 and Cpskl1-20, PSKL1ox-42 put this trend in doubt by being borderline resistant
to exogenous PSK. This combined with the varying levels of metaxylem cell number on
PSK free media makes it difficult to draw any strong conclusions from experiments using
the PSKL1ox lines. This lack of consistent results was true for many of the other experiments
of this study, such as with the effects of PSKL1 on root length. Several of the experiments
failed to show an increase in root length for Col-0 plants grown on PSK containing media,
immediately making the results suspect due to their divergence with the established
literature on the topic (Kutschmar et al., 2009), while others showed variations within the
same PSKL1 mutant lines between experiments. As far as testing for direct interactions
between RLP44 and PSKL1, the preliminary experiments with the rlp44,pskl1 double
mutant line seemed to show PSKL1 to be epistatic to RLP44 in affecting vascular cell
identity. It should of course be noted again that these results are preliminary and that the
seemingly WT average root metaxylem cell numbers in the rlp44-3 mutants deviates from
previously reported results (Holzwart et al., 2018). With regards to possible future research,
the repetition of the metaxylem experiments with the rlp44,pskl1 double mutant would be a
logical place to begin, as this would help to better characterize the apparent interaction
between the two genes. In addition to that, PSKL1 rescue lines would help confirm PSKL1’s
role in determining vascular cell fate, and Co-immunoprecipitation of PSKL1 coupled with
mass-spectroscopy could be used to begin the search for possible interaction partners. That
being said, and taking all of the experiments above into consideration, an initial portrait of
PSKL1 does emerge. PSKL1 appears to be a gene with very low-level or time specific

32
expression levels that does nonetheless affects vascular cell identity, most likely through
some sort of interaction with RLP44. Whether it accomplishes this by being a source for
mature PSK pentapeptides or through other means remains to be discovered by future work.

33
Chapter 2
Introduction
In chapter 2 we shift the focus of our inquiry directly to RLP44. RLP44 was first discovered
in a forward genetic screen using Ethyl methanesulfonate (EMS) on a transgenic A. thaliana
line ectopically expressing PECTIN-METHYLESTERASE-INHIBITOR (PMEI). PMEIox
causes modifications to the plant cell wall which result in the activation of the BR signaling
pathway and a distinctive root-waving phenotype. A forward genetic screen of a PMEIox
A. thaliana line using EMS generated several suppressors of the PMEIox phenotype, and
the responsible mutations were subsequently identified to be present in either the BRI1 or
RLP44 genes (Wolf et al., 2012, 2014). BR signaling is usually activated by the binding of
BRI1 with a ligand, such as BL, which promotes heterodimerization with BAK1 (Nam and
Li, 2002; Li et al., 2002) and subsequently results in negative regulation of
BRASSINOSTEROID-INSENSITIVE 2 (BIN2) (Li and Nam, 2002). This negative
regulation of BIN2 prevents it from phosphorylating BRASSINAZOLE-RESISTANT 1
(BZR1) and BRI1-EMS-SUPPRESSOR 1 (BES1)/BZR2, which in turn allows them to
translocate to the nuclease where they function as transcription factors (Wang et al., 2002;
Yin et al., 2002; Chaiwanon and Wang, 2015; Sun et al., 2010; Yu et al., 2011). As such it
was not immediately clear at the time how modifications to cell wall pectin would activate
BR signaling. Subsequent experiments answered this question by showing that the other
PMEIox phenotype suppressing mutant gene identified, RLP44, interacts with pectate
(Holzwart, 2018) and is responsible for conveying this information about the state of the
cell wall to the BR signaling pathway. It was also subsequently determined that RLP44
forms a complex with BRI1 and BAK1, and that it functions in facilitating crosstalk between
the BR and PSK signaling pathways (Wolf et al., 2014; Holzwart et al., 2018). It was also
observed that the overexpression of RLP44 creates a distinctive phenotype very similar to
BRI1 overexpression, that of elongated petioles and narrow leaf blades. Interestingly, the
RLP44ox line does not exhibit the BL hypersensitivity displayed by the BRI1ox line (Wolf
et al., 2014), indicating that RLP44 is not a direct part of the BR signaling cascade. This

34
could possibly be explained by RLP44 acting as a scaffold for bringing BRI1 and BAK1
together, a function that would not be dramatically altered by an overabundance of BL
ligands (Holzwart et al., 2018). With this in mind, another forward genetic screen using
EMS was performed, this time in the RLP44ox genetic background. This screen resulted in
a number of potential RLP44ox suppressor mutants. The putative suppressor lines were
tested for BL and PPZ (a compound that inhibits the BR signaling pathway)(Hartwig et al.,
2012) insensitivity or hypersensitivity, as mutations effecting the BR signaling pathway
were of less interest (Garnelo Gómez, 2017) due to the role of BR signaling in the
manifestation of the RLP44ox phenotype having already been established (Wolf et al., 2014;
Holzwart et al., 2018). After this process, 4 putative suppressor lines showing no BR
signaling hypersensitivity or insensitivity remained. It is at this point that the work of this
study began. Using these 4 putative suppressor lines, this study hoped to first identify the
gene mutations responsible for the observed suppression of the RLP44ox phenotype,
confirm them through the use of targeted mutation using the CRISPR/Cas9 system, and then
test them for interactions with RLP44. This experimental pipeline would then ideally lead
to the identification of a RLP44 interaction partner acting independent of the BR signaling
pathway or a factor modifying the cell wall in such a way as to affect RLP44’s interaction
with it. This pipeline proved successful, as the results outlined below will show. Two
candidate mutations were identified, though interestingly the two affected proteins turned
out to most likely be involved in the ubiquitination pathway as opposed to the other options
outlined above. One was a predicted F-Box protein and the other a predicted Ubiquitin-
protein ligase (UPL), meaning that both should be involved in the substrate specificity of
the E3 ubiquitin ligase pathway, the F-Box protein as a component of the SCF complex and
the UPL as an E3 ubiquitin ligase (Bai et al., 1996; Pickart, 2001; Zheng and Shabek, 2017).
Since E3 ubiquitin ligases facilitate the transfer of ubiquitin from the E2 ubiquitin-
conjugating enzyme to the correct ubiquitination target (Pickart, 2001; Zheng and Shabek,
2017), and as protein turnover is a known component of plant cell wall signaling (Bu et al.,
2009; Stone, 2014), one can see how these two candidate genes could impact the RLP44ox
phenotype.

35
Results
Candidate genes responsible for RLP44OX suppression identified
Already having A. thaliana RLP44:RFPOX genetic background EMS mutant lines showing
suppression of the RLP44:RFPOX phenotype (see figure 13), as outlined in the introduction
of this chapter, the first step was to identify where in the genomes of the EMS mutant lines
the responsible suppressing gene or genes might be located.
Figure 13: Comparison of 24 day old A. thaliana rosettes from RLP44OX, Col-0, and EMS derived RRE lines. RLP44:RFPOX mutant phenotype of elongated petioles and narrow leaf blades clearly visible. RRE lines have same genetic background as RLP44OX line shown.
Bulked Segregant Analysis (BSA) was performed on 2 of the EMS mutant lines (RRE 24.1
and RRE 38.6) with the hopes of finding the chromosome region that contained the
responsible mutation.
Col-0RLP44ox RRE 38.6RRE 24.1RRE 9.2

36
Figure 14:Diagram outlining Bulked Segregant Analysis (BSA) experimental procedure and analysis.
F2 seeds from previously performed crosses of RRE 24.1 and Landsberg (Ler), as well as
RRE 38.6 and Ler, were grown and analyzed for the segregating phenotype of suppression
of the RLP44:RFPOX phenotype. Tissue and seeds were harvested from Plants identified as
having this suppression phenotype and gDNA was extracted for BSA. The BSA PCR results
of pooled gDNA were analyzed via agarose gel electrophoresis to look for genomic regions
only comprised of Col-0 DNA, as this would be a strong indication that this stretch of the
genome houses the responsible mutation.
Plant LinesLER
Wild TypeCol-0Mutant
X
F1
Chromosomes
F2
Plants with mutant phenotype selected
for analysis
X
Mutant gene of interest
PCR target sites
Extracted gDNA fromselected F2 plants combined
into bulk DNA sample
PCR primers targetingdifferent chromosome regions
allow genome mapping
Primer pairs producing only Col-0length bands show genomicposition of mutant gene
Col-0 bandLER band
Chromosome regions targeted for PCRProduce products of different lengths
In Col-0 and LER ecotypes
PCR Gel-Electrophoresis
Col-0 band only
Bulked Segregant Analysis

37
Figure 15: BSA analysis of EMS derived lines RRE 24.1 and RRE 38.6. 25 primer pairs used (BSA primers 1-25 from left to right, see appendix 1). C stands for bands from the Col-0 genetic background and L stands for bands from the Landsberg genetic background. While some bands seemed to be enriched for Col-0, the results were not conclusive enough to definitively locate the mutant genes responsible for the suppression of the RLP44ox phenotype. That said, the results for the RRE 38.6 line show stronger Col-0 bands on chromosome 5, suggesting the mutation might be located there.
Unfortunately, the BSA experiment did not yield a definitive answer as to the genomic
location or locations of the responsible EMS mutation or mutations. While some areas of
the genome did seem enriched for Col-0 DNA, such as in chromosome 5, it was not strong
enough to be definitive. That being said, it did suggest that the responsible mutation in the
RRE 38.6 line could be located on chromosome 5. As a result of this uncertainty however,
a new plan was pursued to identify the responsible mutation. Previously performed Next
Generation Sequencing (NGS) data had been collected from several of the lines derived
from the original EMS mutant screen (Garnelo Gómez, 2017), and analysis of the NGS data
had identified several mutations (see table 3) to be present in the RRE lines, all of which
were located on chromosome 5 in lines RRE 24.1 and RRE 38.6, supporting the BSA data.
Bulked Segregant Analysis Results
RRE 24.1
RRE 38.6
Chromosome 1 Chromosome 2 Chromosome 3 Chromosome 4 Chromosome 5
C
L
C
L
L
C
C
L
L
C
C
L
C
LL
C
C
L
L
C
C
LC
L
C
L
C
LL
C
L
C C
L
C
L
L
C C
L
C
L
C
L
C
L
C
L
C
L
L
C
C
L
L
C
C
L
C
LL
C
C
L
L
C
C
LC
L
C
L
C
LL
C
L
C C
L
C
L
L
C C
L
C
L
C
L
C
L
C
L

38
Table 3: Table showing list of NGS detected mutations in RRE lines that were deemed to be of potential interest (Garnelo Gómez, 2017).
These identified mutations were then analyzed to determine which were the best candidates
to pursue. This was done by selecting for mutations present in exons or very near to splice
sites within introns. Candidates with synonymous or silent mutations were ruled out as well
as intron mutations not near the splice site. This analysis yielded several candidate genes,
though the RRE 11.1 line was not pursued as both mutations appeared synonymous in
addition to the fact that the CPD gene impacts Brassinosteroid signaling (Szekeres et al.,
1996) which is already known to suppress the RLP44:RFPOX phenotype (Wolf et al., 2014)
and was therefore not of interest in this study. The GRF zinc finger gene (AT5G13920) was
also excluded as the NGS detected mutation could not be confirmed by Sanger sequencing.
This process yielded 6 candidate genes spread across 3 of the RRE EMS derived lines (see
Table 4).
Line: Gene ID: Gene: Mutation: Gene Location: Amino acid Effect:
RRE 9.2 AT3G04490 Exportin-4 protein C-T Intron -RRE 9.2 AT3G05280 Yip1 family protein C-T Exon R to R
RRE 9.2 AT3G14010 CID4 G-A Exon A to T
RRE 11.1 AT5G05690 CPD G-A Exon K to K
RRE 11.1 AT5G09890 Protein kinase G-A Exon K to K
RRE 24.3 AT5G02880 UPL4 Ub-prot ligase G-A Exon G to E
RRE 24.3 AT5G02910 F-box/RNI like G-A Exon E to K
RRE 24.3 AT5G04170EF-hand family
protein C-T Exon S to S
RRE 38.6 AT5G04630 CYP77A9 C-T Exon L to F
RRE 38.6 AT5G07050 UMAMIT9 G-A Exon G to S
RRE 38.6 AT5G13580 ABCG6 C-T Exon R to C
RRE 38.6 AT5G13920GRF zinc finger / Zinc
knuckle protein G-A Exon G to D
RRE 38.6 AT5G16210HEAT repeat-
containing protein G-A Exon R to R
NGS Detected Mutations in RRE Lines

39
Mutant lines for candidate genes generated
With this data, the next step was to generate knockout mutant lines of these genes in the
RLP44:RFPOX genetic background using CRISPR/Cas9 and test for phenotypic
suppression. Table 4: Table showing CRISPR/Cas9 generated mutant lines. Targeted gene, nature of mutation, effect of mutation, and associated RRE line shown. gDNA refers to TAIR Accession Sequences 4010723200, 4515110747, 3707920, 4515110841, 1005037771, and 1005038049 respectively (Berardini et al., 2015).
After the mutant lines were generated and confirmed homozygous, the Cas9 genes were
segregated out of the lines. This was important as the CRISPR/Cas9 cassette used had a
p35S promotor in it which frequently led to false positive results due to silencing of the
p35S driven RLP44:RFPOX gene.
CRISPR mutants for line RRE 24.1 appear to show phenotypic suppression
With mutant lines successfully generated, the next step was to test for suppression of the
RLP44:RFPOX phenotype and to compare it with the original EMS screen suppression lines.
Associated RRE Line: Gene: Mutation: Mutation Effect:
RRE 9.2 CID4A deleted gDNA 1302 starting
from ATGFrameshift leading to premature
stop codon
RRE 24.1 UPL432 bases deleted after gDNA
2338 starting from ATGFrameshift leading to premature
stop codon
RRE 24.1 Fbox/RNI LikeT deleted gDNA 69 starting from
ATGFrameshift leading to premature
stop codon
RRE 38.6 UMAMIT9A insert after gDNA 1429
starting from ATGFrameshift leading to premature
stop codon
RRE 38.6 CYP77A9A insert after gDNA 970 starting
from ATGFrameshift leading to premature
stop codon
RRE 38.6 ABCG6T insert after gDNA 750 starting
from ATGFrameshift leading to premature
stop codon
CRISPR/Cas9 Generated Mutant Lines
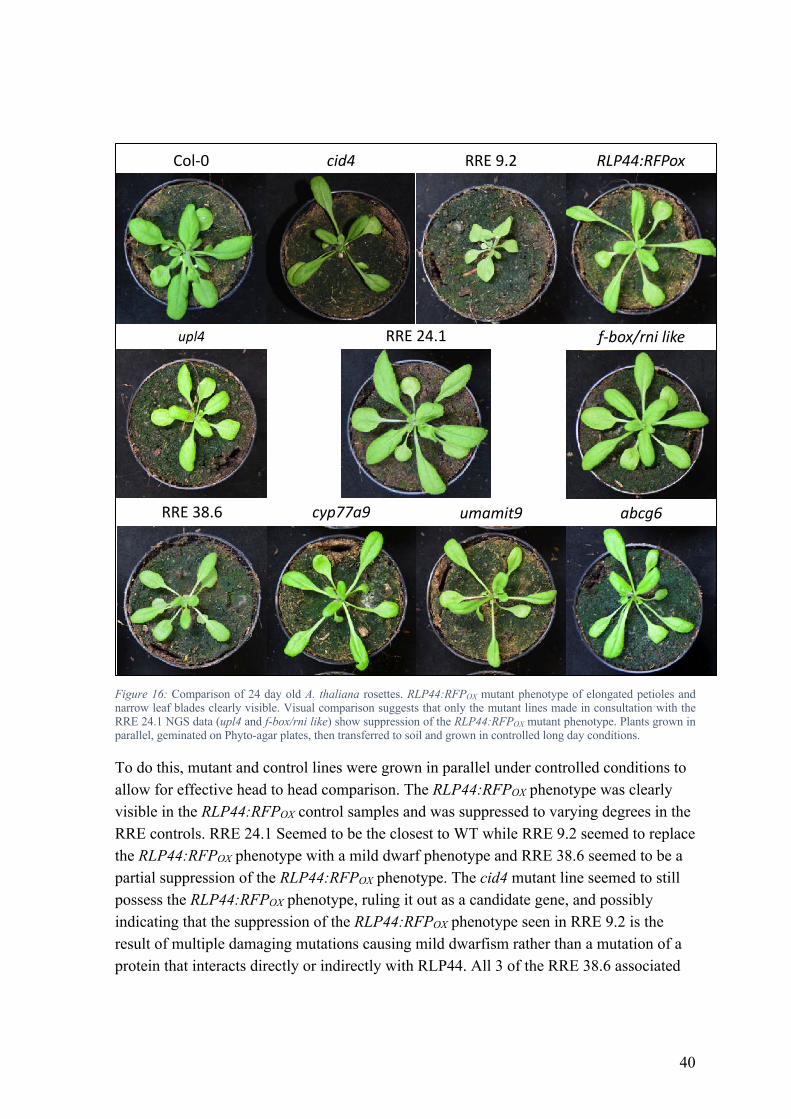
40
Figure 16: Comparison of 24 day old A. thaliana rosettes. RLP44:RFPOX mutant phenotype of elongated petioles and narrow leaf blades clearly visible. Visual comparison suggests that only the mutant lines made in consultation with the RRE 24.1 NGS data (upl4 and f-box/rni like) show suppression of the RLP44:RFPOX mutant phenotype. Plants grown in parallel, geminated on Phyto-agar plates, then transferred to soil and grown in controlled long day conditions.
To do this, mutant and control lines were grown in parallel under controlled conditions to allow for effective head to head comparison. The RLP44:RFPOX phenotype was clearly visible in the RLP44:RFPOX control samples and was suppressed to varying degrees in the RRE controls. RRE 24.1 Seemed to be the closest to WT while RRE 9.2 seemed to replace the RLP44:RFPOX phenotype with a mild dwarf phenotype and RRE 38.6 seemed to be a partial suppression of the RLP44:RFPOX phenotype. The cid4 mutant line seemed to still possess the RLP44:RFPOX phenotype, ruling it out as a candidate gene, and possibly indicating that the suppression of the RLP44:RFPOX phenotype seen in RRE 9.2 is the result of multiple damaging mutations causing mild dwarfism rather than a mutation of a protein that interacts directly or indirectly with RLP44. All 3 of the RRE 38.6 associated
cid4
f-box/rni likeupl4
umamit9 abcg6cyp77a9
Col-0 RLP44:RFPox
RRE 38.6
RRE 24.1
RRE 9.2

41
mutant lines (cyp77a9, umamit9, and abcg6) did not show suppression of the RLP44:RFPOX phenotype, ruling them out as candidate genes. The lack of RLP44:RFPOX phenotypic suppression in the mutant lines and the seemingly partial RLP44:RFPOX phenotype suppression in the RRE 38.6 line suggest that either the NGS data failed to find the responsible mutation, or that perhaps RRE 38.6 was a false positive result from the EMS screen. In contrast to the other mutant lines, both of the RRE 24.1 associated mutant lines (upl4 and f-box/rni like) seemed to show suppression of the RLP44:RFPOX phenotype. This is problematic as well due to the fact that the chances of having 2 EMS derived RLP44:RFPOX phenotype suppressing mutations in the same line, while not impossible, is extremely unlikely. That being said, both upl4 and f-box/rni like did consistently show RLP44:RFPOX phenotypic suppression during several iterations of the experiment.
Fluorescent microscopy rules out gene silencing as explanation
Given the frequent occurrence of RLP44:RFP gene silencing, and consequent false positive
for RLP44:RFPOX phenotypic suppression, observed during the generation of the
CRISPR/Cas9 derived mutant lines, the RLP44:RFP overexpression needed to be confirmed
in the candidate lines. Fortunately, the RFP tag of the overexpressed RLP44 protein made
this a straightforward task.

42
Figure 17: Fluorescent microscopy images of A. thaliana leaf disks from 26 day old CRISPR derived mutant plants with RLP44:RFPOX genetic background as well as image of Col-0 negative control. RFP channel shown. All lines with the exception of Col-0 showed RLP44:RFP expression levels similar to that of the RLP44:RFPox positive control, suggesting that gene silencing is not the cause of the observed suppression of the RLP44:RFPOX phenotype in the f-box/rni like, and upl4 mutant lines. Leaf disks collected from plants in figure 16.
Fluorescent microscopy of leaf disks from upl4 and f-box/rni like mutant plants consistently
showed RFP fluorescence to a degree similar to the RLP44:RFPOX controls, ruling out gene
silencing as an explanation for the observed RLP44:RFPOX phenotypic suppression. Taken
together, this made a strong case that one or both of the RRE 24.1 associated mutant lines
(upl4 and f-box/rni like) is a direct or indirect interaction partner of RLP44.
cid4
f-box/rni likeupl4
umamit9 abcg6cyp77a9
Col-0 RLP44:RFPox
RRE 38.6
RRE 24.1
RRE 9.2

43
Allelism test supports f-box/rni like as RLP44ox phenotype suppressor
In order to further support the role of f-box/rni like as a suppressor of the RLP44ox
phenotype, an allelism test was performed. The f-box/rni like T-DNA line (SALK 01956)
was acquired, and after being confirmed homozygous, crossed with the CRISPR f-box/rni
like mutant, which as stated earlier has a RLP44:RFPOX genetic background, meaning that
the F1 plants would be heterozygous for the RLP44 overexpression gene and therefore
should exhibit the RLP44:RFPOX phenotype. The F1 plants from this cross were then
examined for continued suppression of the RLP44ox phenotype, as this would suggest that
the f-box/rni like mutation is in fact responsible for the observed phenotypic suppression
due to the fact that any other mutation would be heterozygous in the F1 generation which
would lead to expression of the RLP44ox phenotype since previous research had determined
the unidentified EMS suppressing mutations to be recessive (Garnelo Gómez, 2017).
Figure 18: Comparison of 29 day old A. thaliana rosettes. RLP44:RFPOX mutant phenotype of elongated petioles and narrow leaf blades clearly visible in RLP44:RFPOX control. CRISPR f-box/rni like T-DNA cross F1’s maintain suppression of the RLP44ox phenotype, supporting the role of f-box/rni like as the causative mutation, but CRISPR f-box/rni like Col-0 negative control cross also shows suppression of the RLP44ox phenotype in the F1 generation undermining result. All lines are either homozygous or heterozygous for the RLP44:RFPox transgene except the Col-0 WT control.
The results of the
allelism test proved
to be positive but suspect. The CRISPR f-box/rni like T-DNA cross F1 plants did maintain
their suppression of the RLP44ox phenotype, supporting the role of f-box/rni like as the
Col-0RLP44ox
f-box/rni like(RLP44ox genetic background)
XSALK 01956
(F1)
RRE 24.1
f-box/rni like(RLP44ox genetic background)
XCol-0(F1)
f-box/rni like(RLP44ox genetic background)

44
causative mutation, but the negative control of CRISPR f-box/rni like crossed with Col-0
also showed suppression of the RLP44ox phenotype in the F1 generation, which
undermined the results. One potential explanation was that crossing had led to the silencing
of the RLP44:RFPox gene, however fluorescent microscopy eliminated this possibility as
RFP fluorescence was still observed. There is of course also the possibility that the f-box/rni
like mutation is in fact dominant, but this seems unlikely given the extreme disruption of
the gene in this CRISPR derived mutant. Therefore, in summation the allelism test supports
the case for the f-box/rni like mutation being responsible for the observed suppression of the
RLP44ox phenotype but the lack of a satisfactory explanation for the suppression observed
in the negative control throws these results into doubt.
F-Box/RNI Like appears to be expressed in the cytosol
With F-Box/RNI Like appearing to be the strongest candidate for the responsible suppressing
gene, its predicted expression pattern was assessed using BAR eFP Browser. The limited
data available on BAR eFP Browser for F-Box/RNI Like predicted that it is widely expressed
throughout the plant, such as in the root, leaves, and petioles (Klepikova et al., 2016), which
means it would theoretically be present in the correct plant tissues to interact with RLP44
signaling and facilitate the RLP44ox mutant phenotype. Therefore, in order to further
explore the role of the F-Box/RNI Like gene, a F-Box/RNI Like:RFPOX, RLP44:GFPOX
transgenic line was created.
Figure 19: Fluorescent microscopy images of area adjacent to apical meristem in 4 day old seedlings expressing F-Box/RNI Like:RFPOX in a RLP44:GFPOX genetic background as well as image of Col-0 negative control. RFP channel shown in red, GFP in white. F-Box/RNI Like:RFP protein seemed to be expressed in the cytosol as well as possibly in the vacuole
Col-0Negative Control
F-Box/RNI Like:RFPRLP46:GFP

45
Analysis of the line at the seedling stage 4 days after germination via fluorescent microscopy
yielded some interesting results. The F-Box/RNI Like:RFP protein seemed to be localized
to the cytosol (which would make sense for what is predicted to be a F-Box protein) (Bai et
al., 1996; Zheng and Shabek, 2017; Kuroda et al., 2012; Berardini et al., 2015) as well as
possibly in the vacuole, though this was probably sequestered free RFP. Looking at GFP
and RFP fluorescence simultaneously, there was no apparent co-localization of
fluorescence, suggesting that any interaction is not direct. It should be noted that while RFP
fluorescence is a strong indicator of the presence of the F-Box/RNI Like protein in this line,
it is possible that the F-Box/RNI Like protein was quickly degraded leaving behind only the
RFP. Since we did not directly test for the presence of the F-Box/RNI Like protein in this
study, this prospect can’t be ruled out. Interestingly, the RFP fluorescence was strongest
near the shoot apical meristem, and absent in the root. This is strange as the promotor driving
the F-Box/RNI Like:RFP expression in this line is a UBQ10 (Ubiquitin-10) promotor and
therefore should be expressed throughout the entire plant.

46
Discussion
Reflecting on the experiments performed over the course of the RLP44ox suppression
screen we are confronted with mixed results. The absence of an identified causative gene
for the lines RRE 9.2 and RRE 38.6 is unfortunate. Whether this was the result of a failure
in analyzing the NGS data, the initial selection of candidate genes, or the original
phenotyping of the putative suppressor mutant is not completely clear, though it does seem
to point to problems with the phenotyping of lines, or an inconsistent presentation of
phenotypes in different generations due to varying degrees of gene silencing. It is of course
also possible that the suppression causing point mutation resulted in a still partially
functional protein in the original RRE line, a condition that which would not have been
replicated in the CRISPR derived mutant. Plant signaling networks often have a degree of
redundancy and the loss of one signaling protein can prompt the up regulation or down
regulation of other components to compensate (Lempe et al., 2013; El-Brolosy and Stainier,
2017). Additionally, proteins can continue to serve as scaffolds for larger complexes even
if they themselves have lost all or part of their functionality (Kung and Jura, 2016; Gurevich
and Gurevich, 2015). It is therefore conceivable that the original point mutations in the RRE
lines, which resulted in changes to single amino acid residues, caused the suppression of the
RLP44ox phenotype in a manner that the CRISPR derived mutants would not recapitulate,
as all the CRISPR mutant confirmation lines created were most likely null mutants resulting
from early stop codons. This hypothesis would in theory be possible to test, as single
nucleotide base editors are becoming more wide spread. As such, a mutant line could be
created containing the exact mutation reported by the NGS data, which would definitively
prove if the detected point mutation was indeed responsible for the observed phenotypic
suppression. Contrasting with the negative results of RRE 9.2 and RRE 38.6, RRE 24.1 had
the problem of yielding two causative gene candidates, both of which are predicted to be
involved in the E3 ubiquitin ligase pathway. CRISPR derived mutants for the F-Box/RNI
Like and UPL4 genes both seemed to recapitulate the suppression of the RLP44ox
phenotype observed in the RRE 24.1 line. This is a problematic result given the fact that the
odds of the occurrence of two EMS derived point mutations that suppress the RLP44ox

47
phenotype in the same individual genome is incredibly unlikely. In this regard, it is
unfortunate that the F-Box/RNI Like allelism test yielded mixed results, as secondary
confirmation would have been very useful in affirming the identity of at least one of the
putative suppressor genes. That being said, while the likelihood of such a double mutation
is extremely unlikely it is not impossible, and a similar argument can be made for how both
these mutant proteins could cause the observed RLP44ox phenotypic suppression. Both F-
Box/RNI Like and UPL4 will presumably be involved with the ubiquitination pathway, the
former as a part of the SCF complex and the latter as a ubiquitin E3 ligase (Bai et al., 1996;
Pickart, 2001; Zheng and Shabek, 2017). Since target specificity is so critical for these types
of proteins in bringing E2 ubiquitin-conjugating enzyme into proximity with the correct
target of ubiquitination (Zheng and Shabek, 2017), changes to single amino-acid residues,
like those reported in the NGS data, could very easily cause them to lose their target
specificity. Taking these results into consideration, 3 possibilities emerge. 1: Both genes are
indeed responsible, and are operating in the same signaling pathway. 2: Both genes are
responsible, and are operating in different signaling pathways. And 3: One or both of the
suppressing lines is a false positive. If option one or two is indeed the case, then a rescue
mutant of the CRISPR derived suppressor mutants should confirm the role of F-Box/RNI
Like and UPL4. After this point, comparison of RNAseq data as well as looking for co-
localization of fluorescent tagged proteins could provide a clearer answer as to whether F-
Box/RNI Like and UPL4 function together or separately. In addition, Co-IP coupled with
mass spectrometry would also be an excellent method to help identify the potential targets
of F-Box/RNI Like and UPL4 and see if they do indeed fit into the web of RLP44 signaling.
With this in mind, and looking at the preliminary data for the tagged F-Box/RNI Like:RFP
lines, we arrive at a few interesting conclusions. While the lack of fluorescence in the roots
of the seedlings assayed is curious given the use of a constitutive promotor in the line, we
do observe RFP fluorescence in the cytosol as well as in the vacuole, though the latter could
simply be sequestered cleaved RFP. We also don’t seem to observe colocalization with
RLP44:GFP, though this it perhaps not surprising given the latter’s localization to the
plasma membrane. Taking all of these results together then in consultation with the
limitations of the data collected, this study does make a successful and strong case for the

48
roles of F-Box/RNI Like and UPL4 in helping facilitate the phenotypic expression of
RLP44ox. While more work remains to be done to finally and conclusively confirm them,
it is clear that they are without a doubt two strong candidate genes deserving of future
research.

49
Chapter 3
Introduction
Chapter 3 outlines the initial characterizations of RECEPTOR-LIKE-PROTEIN 46
(RLP46). RLP’s are a family of 57 genes in A. thaliana, and are similar to Receptor Like
Kinases with regards to their localization to the plasma membrane and LRR extracellular
domains. However, they differ in their lack of a functioning kinase domain (Shiu and
Bleecker, 2001, 2003; Wang et al., 2008; Fritz-Laylin et al., 2005). RLP’s have been shown
to be important players in the network of signaling proteins found at the plasma membrane
due to their interactions with extracellular compounds (such as ligands), RLK’s, and other
RLP’s (He et al., 2018). A particularly well-known example of this is RECEPTOR-LIKE-
PROTEIN 10 (RLP10) with is also known as CLAVATA 2, a protein that helps maintain
the Stem Cell niche by perceiving CLE ligands and interacting with RLK’s (Jeong et al.,
1999; Fiers et al., 2005). Current studies continue to affirm the high importance of RLP’s
and often showcase their ability to interact with a variety of other proteins, sometimes
simultaneously (He et al., 2018). The recent publication showing RLP44’s interaction with
both BAK1 and PSKR1 is an excellent example of this (Holzwart et al., 2018). RLP’s are
not solely linked to responding to developmental cues however, but have been shown to
play a role in abiotic stress responses (Wu et al., 2016) as well as to be critical components
of the plant immune system (Jamieson et al., 2018). This importance to plant immunity is
shown by the innate immune response, where perception of a microbe-associated molecular
pattern (MAMP) by pattern recognition receptors (PRR’s) leads to activation of the plant’s
innate immune system (Tena et al., 2011). This immune response is characterized by a rapid
release of reactive oxygen species, the aptly named ROS burst response, as well as further
propagation of the signal, leading to modifications in the cell’s gene expression patters, for
example in the gene FLG22-INDUCED RECEPTOR-LIKE KINASE 1 (FRK1) (Asai et al.,
2002), and to further immune responses (Tena et al., 2011). This signaling requires a
complex cross talk between receptor proteins, which is facilitated by the formation of
heterodimers and protein complexes (He et al., 2018; Tena et al., 2011). Two proteins

50
involved in this immune related signal interplay are SUPPRESSOR-OF-BIR1 (SOBIR1)
and BAK1 (Zhang et al., 2013; Liebrand et al., 2013; Burgh et al., 2019), which help convey
the signals that are initiated by the binding of ligands to proteins like FLAGELLIN-
SENSING 2 (FLS2) and EF-TU-RECEPTOR (EFR) (Zipfel et al., 2004, 2006). Taken
together then, it is clear that RLP’s help plant cells modulate their responses the both
external and internal stimuli (Wang et al., 2008). Despite the increasingly clear importance
of the RLP gene family, many of the genes remain uncharacterized, and RLP46 is no
exception. Notwithstanding this dearth of knowledge, there are a few things known about
RLP46 currently. It appears to be highly evolutionarily conserved (Augustin, 2015; Wang
et al., 2008; Fritz-Laylin et al., 2005), to be expressed in mature xylem and procambium in
seedlings as well as throughout the entire mature plate to a lesser extent (Klepikova et al.,
2016), and it is strongly upregulated by the binding of EFR with the peptide ligand elf18
(Zipfel et al., 2006). Using these initial clues as a road map, this study aimed to perform an
initial characterization of RLP46, looking for the possible connection to development hinted
at by the evolutionarily conserved nature of the gene, for any possible role in abiotic stress
responses, and for the possible link between RLP46 and plant immune responses suggested
by the elevation of RLP46 expression after elf18 perception.

51
Results
rlp46 mutant lines successfully generated using CRISPR/Cas9 system
The first step in the study of RLP46 was to generate a rlp46 mutant line. This was done
using CRISPR/Cas9. A Bi-allelic mutant was generated and the two mutations allowed to
segregate into homozygous lines. The CRISPR/Cas9 cassette was then allowed to segregate
out of the lines as well. The end result was two rlp46 mutants derived from the same original
bi-allelic line which were given the names Crlp46-1 and Crlp46-2.
Figure 20: A. Diagram showing points of mutation in CRISPR derived lines as determined by sanger sequencing. gDNA refers to TAIR Accession Sequence 2137299. B. Comparison of RLP46 protein sequences of both CRISPR/Cas9 derived rlp46 mutants with that of WT.
These two lines have
homozygous deletions of 4
and 23 base pairs
respectively (see figure 20)
which cause frameshifts that
lead to premature stop
codons which should result in
extremely truncated RLP46
proteins. Given the
extremely truncated nature of
the RLP46 protein in the two
rlp46 mutants, it seemed
likely that these lines would
function as null mutants, though of course there are instances of truncated receptor proteins
behaving as dominant-negative mutations, such as in the case of the ERECTA gene (Shpak
bp 445-448 deleted starting from ATG
RLP46 gDNA is 2779bp total length containing 2 exons
RLP46 cDNA is 2695bp total length
Crlp46-1 mutation site
A
B
bp 427-449 deleted starting from ATGCrlp46-2 mutation site
RLP46: MSKQCLLSCFLFFCFFIPQLSFSCPQDQRQSLLEFKNLLIHNIKDNYTAFEELGTWRPNSD Crlp46-1: MSKQCLLSCFLFFCFFIPQLSFSCPQDQRQSLLEFKNLLIHNIKDNYTAFEELGTWRPNSD Crlp46-2: MSKQCLLSCFLFFCFFIPQLSFSCPQDQRQSLLEFKNLLIHNIKDNYTAFEELGTWRPNSD CCKWLRVTCNASSPSKEVIDLNLFLLIPPGLVSSSILRPILRINSLVGLDVSFNNIQGEIPGYAFVNLT CCKWLRVTCNASSPSKEVIDLNLFLLIPPGLVSSSILRPILRINSLVGLDVSFNNIQGEIPGYAFVNLT CCKWLRVTCNASSPSKEVIDLNLFLLIPPGLVSSSILRPILRINSLVGLDVSFNNIQGEIPGYAFVNLT SLISLDMCCNRFNGSIPHELFSLTNLQRLDLSRNVIGGTLSGDIKELKNLQELILDENLIGGAIPSEIGS SLISLDMCCNRFNGSIPHCSP* SLISLDMCCNRFVLLDKSSAS* LVELLTLTLRQNMFNSSIPSSVSRLTKLKTIDLQNNFLSSKIPDDIGNLVNLSTLSLSMNKLSGGIPSS IHNLKNLETLQLENNNGLSGEIPAAWLFGLQKLKVLRLEGNNKLQWNNNGYVFPQFKLTHLSLRS CGLEGNIPDWLKNQTALVYLDLSINRLEGRFPKWLADLKIRNITLSDNRLTGSLPPNLFQRPSLYYL VLSRNNFSGQIPDTIGESQVMVLMLSENNFSGSVPKSITKIPFLKLLDLSKNRLSGEFPRFRPESYLE WLDISSNEFSGDVPAYFGGSTSMLLMSQNNFSGEFPQNFRNLSYLIRLDLHDNKISGTVASLISQLS SSVEVLSLRNNSLKGSIPEGISNLTSLKVLDLSENNLDGYLPSSLGNLTCMIKSPEPSAMTIRPYFSSY TDIPNIERLIEIESEDIFSLVVNWKNSKQVLFDRNFYLYTLLDLSKNKLHGEIPTSLGNLKSLKVLNL SNNEFSGLIPQSFGDLEKVESLDLSHNNLTGEIPKTLSKLSELNTLDLRNNKLKGRIPESPQLDRLNN PNIYANNSGICGMQIQVPCFPTQTKQPAEEKEEEDKEEEETIFSWNAAAIGCSCGFLIAVVFMSYNE LWK*

52
et al., 2003). However, given the termination of the RLP46 protein well within its predicted
LRR domains (Berardini et al., 2015) this seemed unlikely.
No obvious rlp46 growth phenotype observed
With two rlp46 mutants generated, the next step was to look for any obvious growth
phenotypes.
Figure 21: Comparison of Col-0 and rlp46 A. thaliana rosettes. Images taken 26 days after germination. No obvious growth phenotypes observed in rlp46 mutants compared to Col-0 WT.
Head to head comparison
of rlp46 mutant plants with
Col-0 WT plants did not reveal any obvious growth phenotypes. Plants were then tested for
any possible drought tolerance phenotype, as there was existing data suggesting a role for
RLP46 in plant stress responses (Klepikova et al., 2016). Col-0 and Crlp46-1 were grown
in single pots under short day conditions (to prevent bolting) until 24 days after germination,
after which watering was discontinued. 38 days after germination, plants were top watered
with 10 mL each to assess their ability to recover from the initial drought stress. After this,
the plants were given no water until the end of the experiment at 42 days after germination
to test for any phenotypic differences in stress induced drought tolerance.
Crlp46-1 Crlp46-2Col-0
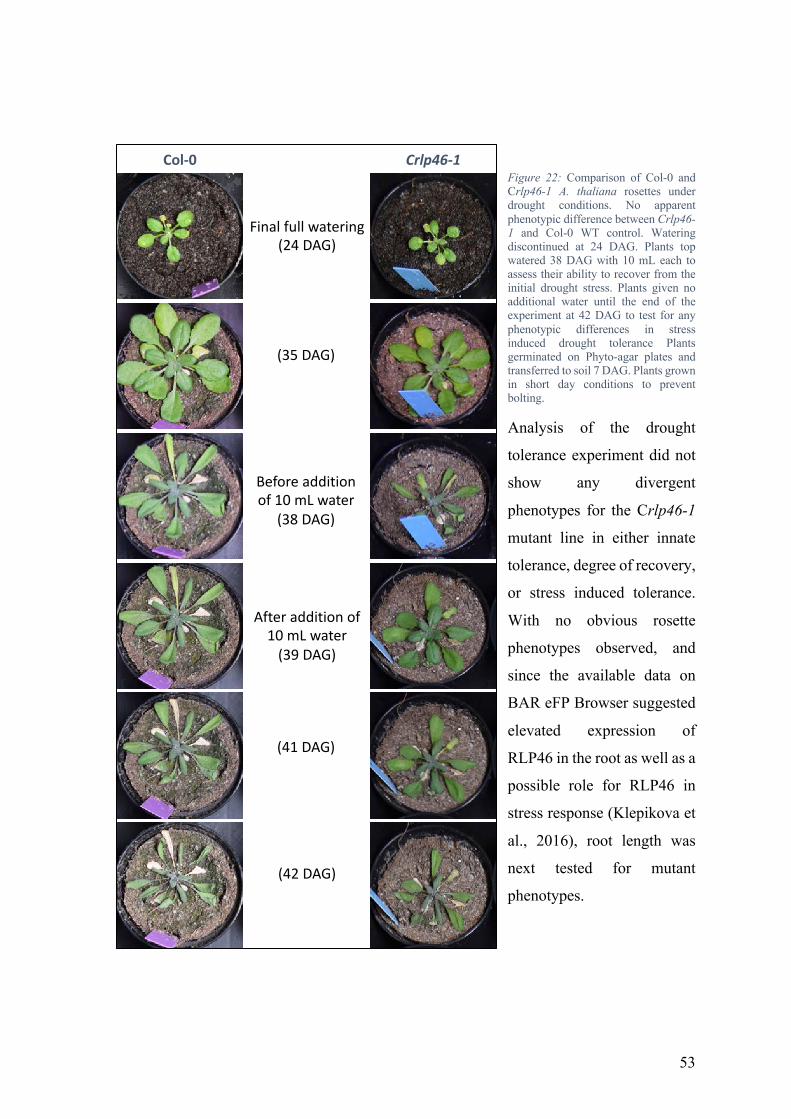
53
Figure 22: Comparison of Col-0 and Crlp46-1 A. thaliana rosettes under drought conditions. No apparent phenotypic difference between Crlp46-1 and Col-0 WT control. Watering discontinued at 24 DAG. Plants top watered 38 DAG with 10 mL each to assess their ability to recover from the initial drought stress. Plants given no additional water until the end of the experiment at 42 DAG to test for any phenotypic differences in stress induced drought tolerance Plants germinated on Phyto-agar plates and transferred to soil 7 DAG. Plants grown in short day conditions to prevent bolting.
Analysis of the drought
tolerance experiment did not
show any divergent
phenotypes for the Crlp46-1
mutant line in either innate
tolerance, degree of recovery,
or stress induced tolerance.
With no obvious rosette
phenotypes observed, and
since the available data on
BAR eFP Browser suggested
elevated expression of
RLP46 in the root as well as a
possible role for RLP46 in
stress response (Klepikova et
al., 2016), root length was
next tested for mutant
phenotypes.
Crlp46-1Col-0
Final full watering(24 DAG)
(35 DAG)
Before addition of 10 mL water
(38 DAG)
After addition of 10 mL water(39 DAG)
(41 DAG)
(42 DAG)
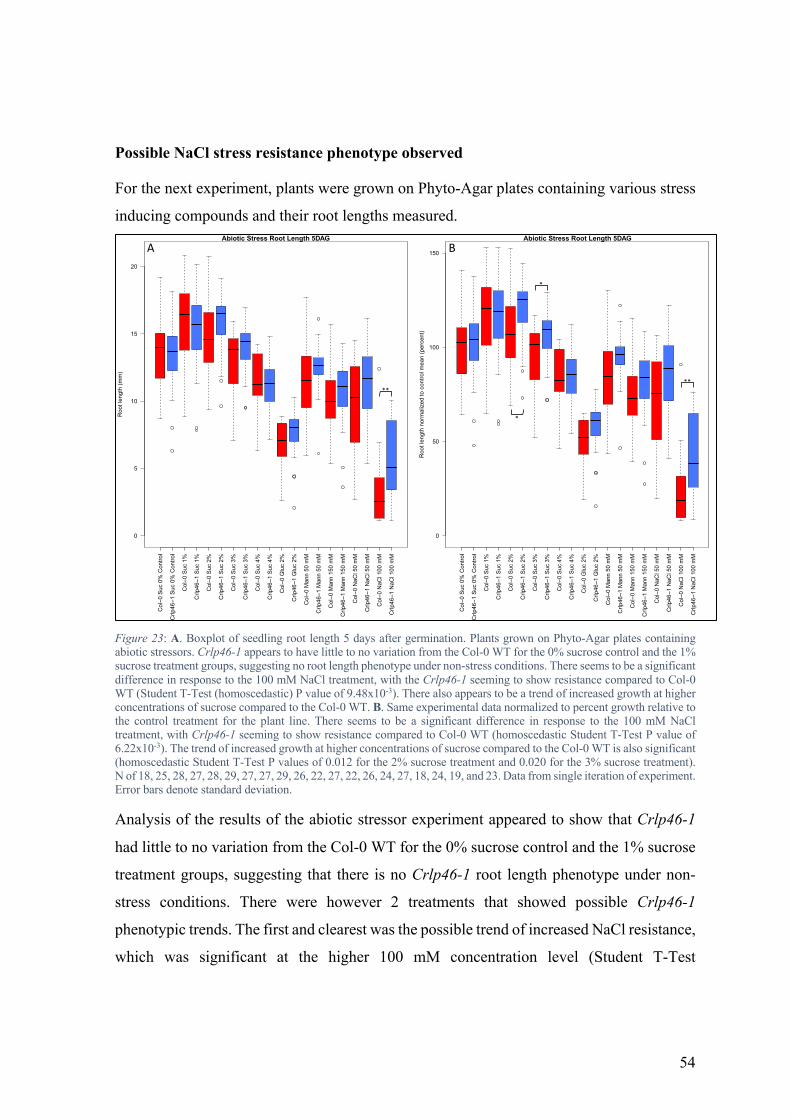
54
Possible NaCl stress resistance phenotype observed
For the next experiment, plants were grown on Phyto-Agar plates containing various stress
inducing compounds and their root lengths measured.
Figure 23: A. Boxplot of seedling root length 5 days after germination. Plants grown on Phyto-Agar plates containing abiotic stressors. Crlp46-1 appears to have little to no variation from the Col-0 WT for the 0% sucrose control and the 1% sucrose treatment groups, suggesting no root length phenotype under non-stress conditions. There seems to be a significant difference in response to the 100 mM NaCl treatment, with the Crlp46-1 seeming to show resistance compared to Col-0 WT (Student T-Test (homoscedastic) P value of 9.48x10⁻³). There also appears to be a trend of increased growth at higher concentrations of sucrose compared to the Col-0 WT. B. Same experimental data normalized to percent growth relative to the control treatment for the plant line. There seems to be a significant difference in response to the 100 mM NaCl treatment, with Crlp46-1 seeming to show resistance compared to Col-0 WT (homoscedastic Student T-Test P value of 6.22x10⁻³). The trend of increased growth at higher concentrations of sucrose compared to the Col-0 WT is also significant (homoscedastic Student T-Test P values of 0.012 for the 2% sucrose treatment and 0.020 for the 3% sucrose treatment). N of 18, 25, 28, 27, 28, 29, 27, 27, 29, 26, 22, 27, 22, 26, 24, 27, 18, 24, 19, and 23. Data from single iteration of experiment. Error bars denote standard deviation.
Analysis of the results of the abiotic stressor experiment appeared to show that Crlp46-1
had little to no variation from the Col-0 WT for the 0% sucrose control and the 1% sucrose
treatment groups, suggesting that there is no Crlp46-1 root length phenotype under non-
stress conditions. There were however 2 treatments that showed possible Crlp46-1
phenotypic trends. The first and clearest was the possible trend of increased NaCl resistance,
which was significant at the higher 100 mM concentration level (Student T-Test
Col
0 Su
c 0%
Con
trol
Crlp
461
Suc
0% C
ontro
l
Col
0 Su
c 1%
Crlp
461
Suc
1%
Col
0 Su
c 2%
Crlp
461
Suc
2%
Col
0 Su
c 3%
Crlp
461
Suc
3%
Col
0 Su
c 4%
Crlp
461
Suc
4%
Col
0 G
luc
2%
Crlp
461
Glu
c 2%
Col
0 M
ann
50 m
M
Crlp
461
Man
n 50
mM
Col
0 M
ann
150
mM
Crlp
461
Man
n 15
0 m
M
Col
0 N
aCl 5
0 m
M
Crlp
461
NaC
l 50
mM
Col
0 N
aCl 1
00 m
M
Crlp
461
NaC
l 100
mM
0
5
10
15
20
Abiotic Stress Root Length 5DAG
Roo
t len
gth
(mm
)
**
Col
0 Su
c 0%
Con
trol
Crlp
461
Suc
0% C
ontro
l
Col
0 Su
c 1%
Crlp
461
Suc
1%
Col
0 Su
c 2%
Crlp
461
Suc
2%
Col
0 Su
c 3%
Crlp
461
Suc
3%
Col
0 Su
c 4%
Crlp
461
Suc
4%
Col
0 G
luc
2%
Crlp
461
Glu
c 2%
Col
0 M
ann
50 m
M
Crlp
461
Man
n 50
mM
Col
0 M
ann
150
mM
Crlp
461
Man
n 15
0 m
M
Col
0 N
aCl 5
0 m
M
Crlp
461
NaC
l 50
mM
Col
0 N
aCl 1
00 m
M
Crlp
461
NaC
l 100
mM
0
50
100
150
Abiotic Stress Root Length 5DAG
Roo
t len
gth
norm
aliz
ed to
con
trol m
ean
(per
cent
)
**
*
*
A B

55
(homoscedastic) P value of 9.48x10⁻³), while the second was a potential trend of increased
growth at higher concentrations of sucrose. Normalization of the data further supported the
initial conclusions of the experiment. The NaCl resistance phenotype was more pronounced,
and the increased growth compared to the Col-0 WT in response to higher concentrations
of sucrose became significant for the 2% and 3% sample groups. Due to these promising
initial results, it was determined that the NaCl resistance phenotype should be better
characterize, therefore a similar abiotic stress experiment was performed using more
gradations of NaCl concentrations.
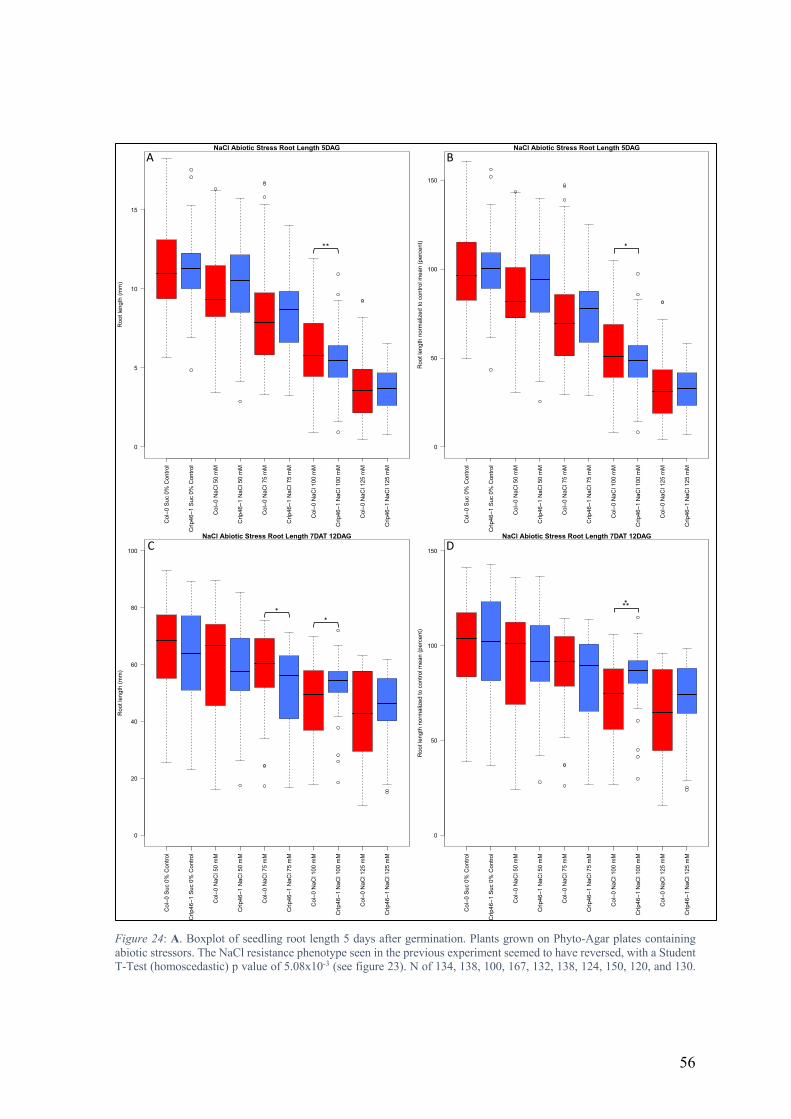
56
Figure 24: A. Boxplot of seedling root length 5 days after germination. Plants grown on Phyto-Agar plates containing abiotic stressors. The NaCl resistance phenotype seen in the previous experiment seemed to have reversed, with a Student T-Test (homoscedastic) p value of 5.08x10⁻³ (see figure 23). N of 134, 138, 100, 167, 132, 138, 124, 150, 120, and 130.
Col
0 Su
c 0%
Con
trol
Crlp
461
Suc
0% C
ontro
l
Col
0 N
aCl 5
0 m
M
Crlp
461
NaC
l 50
mM
Col
0 N
aCl 7
5 m
M
Crlp
461
NaC
l 75
mM
Col
0 N
aCl 1
00 m
M
Crlp
461
NaC
l 100
mM
Col
0 N
aCl 1
25 m
M
Crlp
461
NaC
l 125
mM
0
5
10
15
NaCl Abiotic Stress Root Length 5DAG
Roo
t len
gth
(mm
)
**
Col
0 Su
c 0%
Con
trol
Crlp
461
Suc
0% C
ontro
l
Col
0 N
aCl 5
0 m
M
Crlp
461
NaC
l 50
mM
Col
0 N
aCl 7
5 m
M
Crlp
461
NaC
l 75
mM
Col
0 N
aCl 1
00 m
M
Crlp
461
NaC
l 100
mM
Col
0 N
aCl 1
25 m
M
Crlp
461
NaC
l 125
mM
0
50
100
150
NaCl Abiotic Stress Root Length 5DAG
Roo
t len
gth
norm
aliz
ed to
con
trol m
ean
(per
cent
)
*
Col
0 Su
c 0%
Con
trol
Crlp
461
Suc
0% C
ontro
l
Col
0 N
aCl 5
0 m
M
Crlp
461
NaC
l 50
mM
Col
0 N
aCl 7
5 m
M
Crlp
461
NaC
l 75
mM
Col
0 N
aCl 1
00 m
M
Crlp
461
NaC
l 100
mM
Col
0 N
aCl 1
25 m
M
Crlp
461
NaC
l 125
mM
0
20
40
60
80
100
NaCl Abiotic Stress Root Length 7DAT 12DAG
Roo
t len
gth
(mm
)
**
Col
0 Su
c 0%
Con
trol
Crlp
461
Suc
0% C
ontro
l
Col
0 N
aCl 5
0 m
M
Crlp
461
NaC
l 50
mM
Col
0 N
aCl 7
5 m
M
Crlp
461
NaC
l 75
mM
Col
0 N
aCl 1
00 m
M
Crlp
461
NaC
l 100
mM
Col
0 N
aCl 1
25 m
M
Crlp
461
NaC
l 125
mM
0
50
100
150
NaCl Abiotic Stress Root Length 7DAT 12DAG
Roo
t len
gth
norm
aliz
ed to
con
trol m
ean
(per
cent
)
***
A B
C D

57
Error bars denote standard deviation. Data from 2 iterations of experiment. B. Boxplot of normalized seedling root length data 5 days after germination. Plants grown on Phyto-Agar plates containing abiotic stressors. The reversed NaCl resistance phenotype had reduced significance in the normalized data (homoscedastic Student T-Test p value of 0.011). The 50 mM group was borderline insignificant for the original trend (homoscedastic Student T-Test p value of 0.066) N of 134, 138, 100, 167, 132, 138, 124, 150, 120, and 130. Error bars denote standard deviation. Data from 2 iterations of experiment. C. Boxplot of seedling root length 7 days after seedling transfer and 12 days after germination. Plants grown on Phyto-Agar plates and then transferred by toothpick to plates containing abiotic stressors. Crlp46-1 seemed to be less resistant to NaCl at the 75 mM concentration (homoscedastic Student T-Test p value of 0.017) and more resistant at the 100 mM NaCl concentration (homoscedastic Student T-Test p value of 0.011). N of 57, 60, 52, 60, 54, 55, 52, 57, 52, and 58 respectively. Error bars denote standard deviation. Data from 2 iterations of experiment. D. Boxplot of normalized seedling root length data collected 7 days after seedling transfer and 12 days after germination. Plants grown on Phyto-Agar plates and then transferred by toothpick to plates containing abiotic stressors. After normalization, only the increased NaCl resistance in Crlp46-1 at 100 mM remained significant (homoscedastic Student T-Test p value of 2.06x10⁻⁴), supporting the original observation of an increased NaCl resistance phenotype in the Crlp46-1 line. N of 57, 60, 52, 60, 54, 55, 52, 57, 52, and 58 respectively. Error bars denote standard deviation. Data from 2 iterations of experiment.
Plants were once again germinated on Phyto-agar plates and root length measured 5 days
after germination. In this case seeds were dispersed over the plates rather than places by
tooth pick. This was done in order to prevent them from becoming buried in the media as
this might adversely affect their growth or germination. This experiment was performed in
2 iterations. The results from this second round of abiotic stress experiments greatly
undermined those the previous experiment, as in this iteration the original trend of increased
NaCl stress resistance seemed to reverse its self in the 100 mM concentration treatment
sample, while still appearing to remain at lower NaCl concentrations. Normalization of the
data did not drastically impact the results either. The significance of the 100 mM NaCl
treatment group result was reduced to a p value of 0.011 (homoscedastic Student T-Test)
and the 50 mM group became borderline insignificant (homoscedastic Student T-Test p
value of 0.066). These conflicting results raised serious questions about the original
observation, so in order to control for other unaccounted for variables, such as the possibility
that the abiotic stress was impacting the germination of the seeds differently, or that the
placement method of the seeds had an impact, the root length experiment was repeated with
the modification that all plants were germinated on control treatment plates and then
transferred to the stressor containing plates at 5 days after germination. These plants were
then allowed to grow for 7 days before their root lengths were measured. Analysis of the
results collected across 2 iterations of this version of the experiment gave the seemingly
conflicting results of an apparent increase in Crlp46-1 sensitivity to NaCl at lower
concentrations coupled with an increase in NaCl resistance at higher concentrations. This
was very odd as this contrasted with the results seen in the previous experiment where the

58
seedlings were not transferred (see figure 24). This trend of increased Crlp46-1 sensitivity
to NaCl at 50 mM followed by increased resistance at the higher NaCl concentrations of
100 mM and 125 mM continued to persist after normalization of the data. Crlp46-1 showed
significantly increased resistance in the 100 mM treatment group with a p value of 2.06x10-
4 (homoscedastic Student T-Test), however the results from the other abiotic stress
experiments mean these results must be viewed with a degree of skepticism. They do
however point to a possible role for RLP46 in NaCl abiotic stress responses, an exciting
possibility that should certainly be pursued in future studies.
Elicitor response suggest RLP46 plays a role in plant immunity
Since the publicly available data shows elevated RLP46 expression in A. thaliana plants
exposed to the elicitor elf18 (Zipfel et al., 2006), rlp46 mutants were tested for phenotypes
in plant immune response. To this end, the rlp46 mutant lines were tested for phenotypes in
the plant ROS burst immune response. The A. thaliana lines Col-0, Crlp46-1, Crlp46-2,
pskr1-3 (a mutant line with elevated immune responses) (Igarashi et al., 2012), and bak1-
5,bkk1-1 (a mutant line with elicitor insensitivity) (Roux et al., 2011) were used in the first
round of the experiment. Leaf disks were collected from the youngest fully mature leaves
of plants 20-40 days after germination and elicitor induced ROS burst measured using a
plate reader, with sample wells showing no ROS burst response being excluded from the
final average (with the exception of bak1-5,bkk1-1 samples).

59
Figure 25: A. Graph showing average elf18 induced ROS burst for leaf disk sample groups as detected by plate reader using chemiluminescence. Results from sample wells showing no ROS burst response not included with exception of bak1-5,bkk1-1 samples. There appeared to be no significant deviation from the Col-0 WT in either the timing or the magnitude of the elf18 induced ROS burst responses. Error bars denote standard error. N of 45, 57, 55, 35, and 20 for Col-0, Crlp46-2, Crlp46-1, pskr1-3, and bak1-5,bkk1-1 respectively. Data from 2 iterations of experiment. B. Graph showing average flg22 induced ROS burst for leaf disk sample groups as detected by plate reader using chemiluminescence. Results from sample wells showing no ROS burst response not included. There appeared to be no significant deviation from the Col-0 WT in either the timing or the magnitude of the flg22 induced ROS burst response. Error bars denote standard error. N of 29 and 26 for Col-0 and Crlp46-1 respectively. Data from 1 iteration of experiment.
0
5000
10000
15000
20000
25000
30000
350000 60 120
180
240
300
360
420
480
540
600
660
720
780
840
900
960
1020
1080
1140
1200
1260
1320
1380
1440
Luminescence (RUs
)
Time (s)
ROS burst after expousure to elf18
Col-0
Crlp46-2
Crlp46-1
pskr1-3
bak1-5,bkk1-1
0
50000
100000
150000
200000
250000
300000
350000
0 63 126
189
252
315
378
441
504
567
630
693
756
819
882
945
1008
1071
1134
1197
1260
1323
1386
1449
1512
1575
1638
1701
1764
1827
Luminescence (RUs
)
Time (s)
ROS burst after exposure to flg22
Col-0
Crlp46-1
A
B

60
Analysis of the results showed no phenotype in the timing or magnitude of the ROS bust in
any of the lines, with the exception of the bak1-5,bkk1-1 negative control. This suggests that
RLP46 is not involved with the ROS burst immune response. This experiment was repeated
using Col-0 and Crlp46-1 with the elicitor flg22. This variation of the experiment also
showed no conclusive differences in the ROS burst phenotype between Crlp46-1 and the
Col-0 WT. The results of these two experiments make a strong case that RLP46 is not
involved in the ROS burst pathway or that its role is redundant. Crlp46-1 was next tested
for mutant phenotypes in elicitor induced transcriptional changes. The plant lines Col-0 and
Crlp46-1 were germinated on Phyto-Agar plates and transferred to liquid media at 5 days
after germination, where they were then exposed to elf18 for 1 hour before being frozen in
liquid nitrogen and used for RNA extraction. RT-qPCR was then performed to assess the
changes in expression levels of the plant immune response associated genes FRK1 and
NHL10 (Asai et al., 2002; Segonzac et al., 2014) (for primer list see appendix 1).
Figure 26: A. RT-qPCR data from bulk seedling cDNA. Plants exposed to elicitor containing liquid media for 1 hour before RNA extraction. All samples showed increased FRK1 expression upon exposure to elf18 elicitor. Crlp46-1 line seemed to have roughly WT levels of FRK1 expression in both the control and elf18 treated groups. All sample groups contained 3 biological replicates. Error bars denote standard deviation. B. RT-qPCR data from same bulk seedling cDNA. All samples showed increased NHL10 expression upon exposure to elicitor. Crlp46-1 line seemed to have roughly WT levels of NHL10 expression in both the control and elf18 treated groups. All sample groups contained 3 biological replicates. Error bars denote standard deviation.
Analysis of the experimental results clearly showed increased expression in FRK1 and
NHL10 after exposure to the elicitor elf18, but the rlp46 mutation did not seem to have any
effect on the observed expression levels. Therefore, having ruled out rapid immune response
phenotypes, the Crlp46-1 mutant line was tested for phenotypes in elicitor induced growth
inhibition (Gómez-Gómez and Boller, 2000; Zipfel et al., 2006; Igarashi et al., 2012). For
the first iteration of this set of experiments elicitor induced growth inhibition of plants
grown on Phyto-agar plates was tested. In addition, lateral root number was also recorded
0.037
2
0.081
1
0.060
4
0.089
0
0.056
0
0.056
3
2.683
9
2.756
8
2.617
4
2.150
0 2.8
820
1.970
2
0.0000 0.5000 1.0000 1.5000 2.0000 2.5000 3.0000 3.5000
CC1
CC2
CC3
rC1
rC2
rC3
CE1
CE2
CE3
rE1
rE2
rE3
norm
aliz
ed b
y cl
athr
in
FRK1 Expression Levels
Col-0 Crlp46-1 Crlp46-1elf18
Col-0
Sample-- - - - - + + + + + +21 3 1 2 3 1 2 3 1 2 3
0.015
5
0.017
1
0.022
0
0.020
2
0.013
8
0.016
2
0.153
6
0.115
0 0.130
1
0.125
4 0.138
6 0.1
511
0.0000 0.0200 0.0400 0.0600 0.0800 0.1000 0.1200 0.1400 0.1600 0.1800
CC1
CC2
CC3
rC1
rC2
rC3
CE1
CE2
CE3
rE1
rE2
rE3
norm
aliz
ed b
y cl
athr
in
NHL10 Expression Levels
Col-0 Crlp46-1 Crlp46-1elf18
Col-0
Sample-- - - - - + + + + + +21 3 1 2 3 1 2 3 1 2 3
A B

61
as the available data on BAR eFP Browser predicted RLP46 expression in the root
(Klepikova et al., 2016).
Figure 27: A. Boxplot of seedling root length 14 days after germination. Plants grown on Phyto-Agar plates containing elicitors. Both Crlp46-1 and Col-0 WT control showed mild growth reduction on elicitor containing plates. There did not seem to be any significant deviation in phenotype between the two lines. N of 26, 29, 29, 33, 33, and 34 respectively. Data from 3 iterations of experiment. B. Boxplot of seedling lateral root number 14 days after germination from same experiment. Both Crlp46-1 and Col-0 WT control showed mild reduction of lateral root number on elicitor containing plates, however this was simply a result of shorter average root lengths, as the ratio of lateral roots per unit of root length was unchanged (see table 5). There did not seem to be any significant deviation in phenotype between the two lines. N of 38, 42, 42, 43, 43, and 44 respectively. Data from 3 iterations of experiment.
Analysis of plant root growth inhibition on Phyto-agar plates containing elicitors did not
yield any obvious phenotypes. It should also be noted that the observed growth inhibition
seemed very mild for the amount of elicitor present in the media (Igarashi et al., 2012),
suggesting that Phyto-agar plates might not be an effective means for delivering the elicitor
induced biotic stress to the plants. Analyzing the lateral roots portion of the results did not
show any significant variation between the Crlp46-1 mutant line and the Col-0 WT control
for the elf18, or the flg22 treatments either. Furthermore, comparing the ratios of lateral
roots per millimeter of root showed that there was in fact very little variation across all of
the plant lines and treatment groups.
Col
0 C
ontro
l
Crlp
461
Con
trol
Col
0 10
nM
elf1
8
Crlp
461
10 n
M e
lf18
Col
0 10
nM
flg2
2
Crlp
461
10 n
M fl
g22
0
10
20
30
40
50
Elicitor Biotic Stress Root Length 14DAG
Roo
t Len
gth
(mm
)
Col
0 C
ontro
l
Crlp
461
Con
trol
Col
0 10
nM
elf1
8
Crlp
461
10 n
M e
lf18
Col
0 10
nM
flg2
2
Crlp
461
10 n
M fl
g22
0
5
10
15
20
25
Elicitor Biotic Stress Lateral Root Number 14DAG
Aver
age
Late
ral R
oot N
umbe
r
A B

62
Table 5: Table showing average root length, lateral root number, sample number, and lateral root per millimeter ratio of experimental data from Phyto-agar plate elicitor experiments (see figure 27). Data from 3 iterations of experiment.
Given these results, and the apparent ineffectiveness of using Phyto-agar plates to
administer elicitor induced stress, the next set of experiments exposed the plants to elicitors
via liquid media. Plants were germinated on Phyto-Agar plates and then individual plants
were transferred to liquid media containing wells of 48 well plates 4 days after germination.
After 10 days of growth in liquid media (14 days after germination), fresh weights were
measured.
Line: Elicitor Treatment:
Average root length (mm):
Root Length Sample Number
(n):
Average Lateral Root Number:
Lateral Root Sample Number
(n):
Average Lateral Root Per mm Root Length:
Col-0 Control 42.7 26 17.6 38 0.41
Crlp46-1 Control 43.1 29 18.1 42 0.42
Col-0 10 nM elf18 34.8 29 13.4 42 0.38
Crlp46-1 10 nM elf18 33.4 33 12.2 43 0.36
Col-0 10 nM flg22 34.5 33 13.3 43 0.39
Crlp46-1 10 nM flg22 32.9 34 13.5 44 0.41

63
Figure 28: A. Boxplot of average plant fresh weight after 10 days in liquid media and 14 days after germination. All lines showed expected growth inhibition in response to elf18 elicitor containing growth media, with the pskr1-3 positive control mutant showing the expected hyper sensitivity (Igarashi et al., 2012). Both rlp46 mutant lines seemed to show significant
Col
−0 0
nM e
lf18
Col
−0 1
nM e
lf18
Col
−0 1
0nM
elf1
8
Col
−0 1
00nM
elf1
8
pskr
1−3
0nM
elf1
8
pskr
1−3
1nM
elf1
8
pskr
1−3
10nM
elf1
8
pskr
1−3
100n
M e
lf18
Crlp
46−1
0nM
elf1
8
Crlp
46−1
1nM
elf1
8
Crlp
46−1
10n
M e
lf18
Crlp
46−1
100
nM e
lf18
Crlp
46−2
0nM
elf1
8
Crlp
46−2
1nM
elf1
8
Crlp
46−2
10n
M e
lf18
Crlp
46−2
100
nM e
lf18
0
50
100
150
Average elf18 Induced Growth Inhibition
Plan
t fre
sh w
eigh
t nor
mal
ized
to c
ontro
l mea
n (p
erce
nt)
Col-0 pskr1-3 Crlp46-1nM elf18
Crlp46-20 1 10 100 0 1 10 100 0 1 10 100 0 1 10 100
**
***
*****
***
**
*
Col
−0 0
nM e
lf18
Col
−0 1
nM e
lf18
Col
−0 1
0nM
elf1
8
Col
−0 1
00nM
elf1
8
pskr
1−3
0nM
elf1
8
pskr
1−3
1nM
elf1
8
pskr
1−3
10nM
elf1
8
pskr
1−3
100n
M e
lf18
Crlp
46−1
0nM
elf1
8
Crlp
46−1
1nM
elf1
8
Crlp
46−1
10n
M e
lf18
Crlp
46−1
100
nM e
lf18
Crlp
46−2
0nM
elf1
8
Crlp
46−2
1nM
elf1
8
Crlp
46−2
10n
M e
lf18
Crlp
46−2
100
nM e
lf18
0
50
100
150
Average flg22 Induced Growth Inhibition
Plan
t fre
sh w
eigh
t nor
mal
ized
to c
ontro
l mea
n (p
erce
nt)
Col-0 pskr1-3 Crlp46-1nM flg22
Crlp46-20 1 10 100 0 1 10 100 0 1 10 100 0 1 10 100
******
***
**
Col
−0 0
nM e
lf18
Col
−0 1
nM e
lf18
Col
−0 1
0nM
elf1
8
Col
−0 1
00nM
elf1
8
pskr
1−3
0nM
elf1
8
pskr
1−3
1nM
elf1
8
pskr
1−3
10nM
elf1
8
pskr
1−3
100n
M e
lf18
Crlp
46−1
0nM
elf1
8
Crlp
46−1
1nM
elf1
8
Crlp
46−1
10n
M e
lf18
Crlp
46−1
100
nM e
lf18
Crlp
46−2
0nM
elf1
8
Crlp
46−2
1nM
elf1
8
Crlp
46−2
10n
M e
lf18
Crlp
46−2
100
nM e
lf18
0
5
10
15
20
25
30
Average flg22 Induced Growth Inhibition
Plan
t fre
sh w
eigh
t (m
g)
Col-0 pskr1-3 Crlp46-1nM flg22
Crlp46-20 1 10 100 0 1 10 100 0 1 10 100 0 1 10 100
******
***
***
*
Col
−0 0
nM e
lf18
Col
−0 1
nM e
lf18
Col
−0 1
0nM
elf1
8
Col
−0 1
00nM
elf1
8
pskr
1−3
0nM
elf1
8
pskr
1−3
1nM
elf1
8
pskr
1−3
10nM
elf1
8
pskr
1−3
100n
M e
lf18
Crlp
46−1
0nM
elf1
8
Crlp
46−1
1nM
elf1
8
Crlp
46−1
10n
M e
lf18
Crlp
46−1
100
nM e
lf18
Crlp
46−2
0nM
elf1
8
Crlp
46−2
1nM
elf1
8
Crlp
46−2
10n
M e
lf18
Crlp
46−2
100
nM e
lf18
0
10
20
30
40
50
Average elf18 Induced Growth Inhibition
Plan
t fre
sh w
eigh
t (m
g)
Col-0 pskr1-3 Crlp46-1nM elf18
Crlp46-20 1 10 100 0 1 10 100 0 1 10 100 0 1 10 100
***
***
***
***
***
***
****
*
*
A B
C D

64
resistance to elicitor induced growth inhibition. Stars denote significant divergence from the Col-0 WT with the same elicitor treatment. N and P values shown in table 6. Data from 4 iterations of experiment. B. Data from section A normalized to 0 nM control treatment of same plant line. Both rlp46 mutant lines seemed to show significant resistance to elicitor induced growth inhibition. Stars denote significant divergence from the Col-0 WT with the same elicitor treatment. N and P values shown in table 6. C. Boxplot of average plant fresh weight after 10 days in liquid media and 14 days after germination. All lines showed expected growth inhibition in response to flg22 elicitor containing growth media, with the pskr1-3 positive control mutant showing the expected hyper sensitivity (Igarashi et al., 2012). Only the 10 nM Crlp46-1 samples seemed to show significant resistance to flg22 elicitor induced growth inhibition. Stars denote significant divergence from the Col-0 WT with the same elicitor treatment. N and P values shown in table 7. Data from 4 iterations of experiment. D. Data from section C normalized to 0 nM control treatment of same plant line. Only the 10 nM Crlp46-1 samples seemed to show significant resistance to flg22 elicitor induced growth inhibition. Stars denote significant divergence from the Col-0 WT with the same elicitor treatment. N and P values shown in table 7. Data from 4 iterations of experiment.
The experiments with liquid media containing elicitors proved to be much more effective at
causing growth inhibition in the samples. All lines showed the expected response to elf18
elicitor containing media of reduced growth, and the pskr1-3 mutant showed the expected
hypersensitivity to elicitor exposure (Igarashi et al., 2012). Interestingly, both rlp46 mutants
seemed to show significant resistance to elicitor induced growth inhibition, supporting the
hypothesis that RLP46 has a role in the plant immune response. Normalization of the data
reduced the strength of the rlp46 elf18 elicitor resistance results, however there did still
seem to be a significant trend across the two rlp46 mutant lines.

65
Table 6: Table showing average fresh weight, growth normalized to 0 nM control, sample number, and homoscedastic Student T-Test p values for significance between line and Col-0 control with same elf18 treatment for both fresh weight and normalized data used in figure 28 sections A and B. Data from 4 iterations of experiment.
Having tentative evidence for rlp46 resistance to elf18 induced growth inhibition, the lines
were then tested for resistance to the elicitor flg22, as this would elucidate whether the
observed rlp46 response was elf18 specific. The expected plant response to flg22 elicitor
containing media of reduced growth was observed again, as well as the pskr1-3 mutant’s
expected hypersensitivity to elicitor exposure (Igarashi et al., 2012). Interestingly, the rlp46
mutants appeared to not deviate as strongly from their Col-0 WT control treatment
counterparts, with the exception of the Crlp46-1 10 nM treatment group, seeming to
indicated that the rlp46 mutant response in more strongly induced by elf18 than flg22.
Normalization of the data yielded the same results but did strengthen the significance of the
Crlp46-1 10 nM treatment group resistance phenotype.
Line: elf18 Treatment (nM):
Average Fresh Weight (mg):
Normalized Growth (percent):
Sample Number (n):
T-Test p Value Fresh Weight:
T-Test p Value Normalized Growth:
Col-0 0 31.08 100 48 1 1
pskr1-3 0 23.94 100 48 8.17E-09 1
Crlp46-1 0 33.38 100 48 0.055 1
Crlp46-2 0 32.20 100 48 0.322 1
Col-0 1 12.92 41.6 48 1 1
pskr1-3 1 6.26 26.1 48 1.45E-11 2.76E-06
Crlp46-1 1 15.96 47.8 48 0.005 0.061
Crlp46-2 1 16.64 51.7 48 0.002 0.006
Col-0 10 3.99 12.8 48 1 1
pskr1-3 10 1.86 7.8 48 1.52E-06 6.86E-04
Crlp46-1 10 6.12 18.3 48 1.82E-04 1.61E-03
Crlp46-2 10 5.67 17.6 48 0.0106 0.020
Col-0 100 1.04 3.4 48 1 1
pskr1-3 100 0.63 2.6 48 2.26E-09 1.84E-03
Crlp46-1 100 1.78 5.3 48 4.77E-05 2.61E-04
Crlp46-2 100 1.25 3.9 48 0.0710 0.142

66
Table 7: Table showing average fresh weight, growth normalized to 0 nM control, sample number, and homoscedastic Student T-Test p values for significance between line and Col-0 control with same flg22 treatment for both fresh weight and normalized data used in figure 28 sections C and D. Data from 4 iterations of experiment.
These experiments seemed to show that the rlp46 mutants have a mild but consistent
resistance to elicitor induced growth inhibition (around 8 percent on average for the elf18
treatments). There was however a great deal of variability in the results data (not uncommon
for growth inhibition experiments), so a new round of growth inhibition experiments was
performed using a more robust experimental set up. As before, plants were germinated on
Phyto-Agar plates, but then groups of 30 seedlings were placed in Erlenmeyer flasks
containing 25 mL liquid media, grown in shaking growth chambers, and then growth
inhibition assessed via dry mass of the bulked plantlets. This new set up mitigated, but did
not eliminate the observed variability.
Line: flg22 Treatment (nM):
Average Fresh Weight (mg):
Normalized Growth (percent):
Sample Number (n):
T-Test p Value Fresh Weight:
T-Test p Value Normalized Growth:
Col-0 0 19.88 100 48 1 1
pskr1-3 0 11.86 100 48 9.38E-15 1
Crlp46-1 0 18.95 100 48 0.391 1
Crlp46-2 0 19.25 100 48 0.509 1
Col-0 1 12.72 64.0 48 1 1
pskr1-3 1 6.06 51.1 48 3.16E-12 0.006
Crlp46-1 1 13.10 69.1 48 0.697 0.303
Crlp46-2 1 13.01 67.6 48 0.756 0.439
Col-0 10 6.17 31.0 48 1 1
pskr1-3 10 3.61 30.4 48 6.08E-05 0.857
Crlp46-1 10 8.57 45.2 48 0.020 0.008
Crlp46-2 10 6.66 34.6 48 0.477 0.310
Col-0 100 4.26 21.4 48 1 1
pskr1-3 100 2.61 22.0 48 2.51E-04 0.819
Crlp46-1 100 4.82 25.4 48 0.265 0.122
Crlp46-2 100 4.33 22.5 48 0.875 0.642

67
Figure 29: A. Boxplot of average plant dry weight after 7 days in liquid media and 11-12 days after germination. All lines showed expected the growth inhibition in response to elicitor containing growth media (Igarashi et al., 2012). Crlp46-1 samples seemed to show mild resistance to elicitor induced growth inhibition as compared to the Col-0 WT samples. Stars denote significant divergence from the Col-0 WT with the same elicitor treatment. N of 13, 13, 13, 13, 8, and 8 respectively. Data from 3 iterations of experiment for elf18 samples and 2 iterations of experiment for flg22 samples. Exact values shown in table 8. B. Normalization of same data All lines showed the expected growth inhibition in response to elicitor containing growth media (Igarashi et al., 2012). Crlp46-1 samples seemed to show mild resistance to elicitor induced growth inhibition as compared to the Col-0 WT samples. Stars denote significant divergence from the Col-0 WT with the same elicitor treatment. N of 13, 13, 13, 13, 8, and 8 respectively. Data from 3 iterations of experiment for elf18 samples and 2 iterations of experiment for flg22 samples. Exact values shown in table 8.
Analysis of the flask growth inhibition experiments supported the single plant experiment
results, though interestingly in this iteration the rlp46 elicitor resistance phenotype seemed
to extend to flg22 as well. Normalization of the data further supported the trend of mild
rlp46 resistance to elicitor induced growth inhibition. The results also suggested that the
rlp46 elicitor resistance phenotype is not elf18 specific, but also applies to flg22 as well,
with the Crlp46-1 mutant showing on average a subtle resistance to both elf18 and flg22 of
around 5% and 7% respectively across the course of all experiments.
Col
0 C
ontro
l
Crlp
461
Con
trol
Col
0 1
nM e
lf18
Crlp
461
1 nM
elf1
8
Col
0 1
nM fl
g22
Crlp
461
1 nM
eflg
22
0
20
40
60
80
100
Average Elicitor Induced Growth Inhibition
Plan
t dry
wei
ght (
mg)
Col
0 C
ontro
l
Crlp
461
Con
trol
Col
0 1
nM e
lf18
Crlp
461
1 nM
elf1
8
Col
0 1
nM fl
g22
Crlp
461
1 nM
flg2
2
0
20
40
60
80
100
120
Average Elicitor Induced Growth Inhibition
Plan
t dry
wei
ght n
orm
aliz
ed to
con
trol m
ean
(per
cent
)
A B

68
Table 8: Table showing average dry weight, growth normalized to 0 nM control, plant per sample number, and n values for each treatment group. Data applies to flask growth inhibition experiments shown in figure 29. Data from 3 iterations of experiment for elf18 samples and 2 iterations of experiment for flg22 samples.
These results further support the idea that RLP46 could play a role in the propagation of
elicitor induced plant immune responses, as evidenced by the phenotype of mild rlp46
resistance to elicitor induced growth inhibition.
RLP46 is localized to the plasma membrane
The next step in the analysis of RLP46 was to create overexpression and fluorescently
tagged lines in order to determine RLP46’s localization and if there were any phenotypes
associated with RLP46 overexpression. The GreenGate cloning system (Lampropoulos et
al., 2013) was used to create a vector containing the RLP46 gene fused with GFP driven by
the UBQ10 promotor. This new plasmid was first tested through transient expression in N.
benthamiana leaves and subsequent fluorescent microscopy of leaf disks.
Line: Elicitor Treatment: Average Dry Weight (mg):
Normalized Growth (percent): Plants Per Sample: Sample Number (n):
Col-0 Control 79.6 100 30 13
Crlp46-1 Control 77.3 100 30 13
Col-0 1 nM elf18 45.8 57.6 30 13
Crlp46-1 1 nM elf18 48.3 62.5 30 13
Col-0 1 nM flg22 43.2 54.2 30 8
Crlp46-1 1 nM flg22 47.8 61.9 30 8

69
Figure 30:Fluorescent microscopy images showing RLP46:GFP fluorescence in leaf pavement cells transiently expressing the protein. RLP46:GFP appears to be localized to the plasma membrane of the cells examined. Untransformed negative control N. benthamiana leaf tissues cells shown for reference.
Fluorescent microscopy showed that the RLP46:GFP protein construct was being expressed
successfully, and that it appeared to be localized to the plasma membrane of the N.
benthamiana epidermal leaf tissue cells observed. Having confirmed the functionality of the
RLP46:GFP plasmid vector, two transgenic A. thaliana lines were then generated. Both
these lines contained the same DNA coding sequence for a GFP tagged RLP46 protein
driven by the UBQ10 promotor, but differed in their genetic backgrounds, one being in the
Col-0 background (hereafter referred to as RLP46:GFPOX-1), and the other in the Crlp46-1
genetic background (hereafter referred to as RLP46:GFPOX-2). Fluorescent microscopy of
the T1 plant that yielded the RLP46:GFPOX-2 line confirmed the expression of RLP46:GFP,
which once again seemed to be localized to the plasma membrane. However overall
expression levels seemed to be low for a UBQ10 constitutive promotor, though this could
have been due to these leaves being from a T1 plant that had been exposed to selective
media.
RLP46:GFP Fluorescence RLP46:GFP Fluorescence Negative Control Fluorescence

70
Figure 31: Fluorescent microscopy images showing RLP46:GFP fluorescence in leaf pavement cells of transformed A. thaliana T1 plant 27 days after germination. RLP46:GFP appeared to be localized to the plasma membrane of the cells examined. RLP46:GFP expression seemed low for a UBQ10 constitutive promotor but was still present. This could have been due to these leaves being from a T1 plant that had been exposed to selective media.
RLP46:GFPox does not strongly
impact FRK1 and NHL10 gene
expression levels
After confirmation of the presence of
the gene through PCR, sequencing
(primers can be found in appendix
1), and microscopy, RLP46:GFP expression levels were tested through RT-qPCR. This
analysis was combined with a repeat of the experiment outlined in figure 26, where the
impact of elicitors on the plant immune system related genes FRK1 and NHL10 were
measured using RT-qPCR. As before, plantlets were germinated on Phyto-Agar plates and
transferred to liquid media where they were then exposed to either elf18 or flg22 for 1 hour
before being frozen in liquid nitrogen and used for RNA extraction. For this experiment, the
plant lines Col-0, Crlp46-1, RLP46:GFPOX-1, and RLP46:GFPOX-2 were tested for
expression of RLP46, FRK1, and NHL10 via RT-qPCR.
RLP46:GFP Fluorescence

71
0.015
30.0
241
0.031
7
0.011
70.0
197
0.022
8
0.297
4
0.222
40.2
602 0.3
645
0.604
7
0.338
3
0.00000.10000.20000.30000.40000.50000.60000.7000
Col-0 conCol-0 elf18Col-0 flg22rlp46 conrlp46 elf18rlp46 flg22RLP46ox…RLP46ox…RLP46ox…RLP46ox…RLP46ox…RLP46ox…
norm
aliz
ed b
y cl
athr
in
RLP46 Expression Levels
Col-0 Crlp46-1 RLP46:GFPox-2elf18
RLP46:GFPox-1
flg22+- - - + - - + - - + --- + - - + - - + - - +
0.009
60.1
464
0.178
6
0.010
40.1
320
0.178
0
0.008
1
0.220
9
0.179
4
0.007
2
0.589
8
0.243
1
0.00000.10000.20000.30000.40000.50000.60000.7000
Col-0 conCol-0 elf18Col-0 flg22rlp46 conrlp46 elf18rlp46 flg22RLP46ox…RLP46ox…RLP46ox…RLP46ox…RLP46ox…RLP46ox…
norm
aliz
ed b
y cl
athr
in
FRK1 Expression Levels
Col-0 Crlp46-1 RLP46:GFPox-2elf18
RLP46:GFPox-1
flg22+- - - + - - + - - + --- + - - + - - + - - +
0.046
00.0
769
0.117
9
0.078
7
0.033
4
0.086
0
0.044
9
0.082
6
0.067
3
0.047
4
0.089
6 0.101
2
0.00000.02000.04000.06000.08000.10000.12000.1400
Col-0 conCol-0 elf18Col-0 flg22rlp46 conrlp46 elf18rlp46 flg22RLP46ox…RLP46ox…RLP46ox…RLP46ox…RLP46ox…RLP46ox…
norm
aliz
ed b
y cl
athr
in
NHL10 Expression Levels
Col-0 Crlp46-1 RLP46:GFPox-2elf18
RLP46:GFPox-1
flg22+- - - + - - + - - + --- + - - + - - + - - +
A
B
C

72
Figure 32: RT-qPCR data from bulk seedling cDNA. Plants exposed to elicitor containing liquid media for 1 hour before RNA extraction. Error bars denote standard deviation. A. Col-0 samples showed increased RLP46 expression upon exposure to elicitors. Crlp46-1 line also showed increased RLP46 expression upon exposure to elicitors as well as basal expression of a presumably non-functional rlp46 transcript. RLP46:GFPOX lines showed elevated RLP46:GFP transcript levels and mixed responses to elicitor exposure. B. All samples showed increased FRK1 expression upon exposure to elicitors. Crlp46-1 line showed WT levels of FRK1 expression across treatments. RLP46:GFPOX lines showed elevated FRK1 transcript levels in elf18 treatment samples, and RLP46:GFPOX-2 showed higher flg22 induced FRK1 expression. C. All samples showed mildly increased NHL10 expression upon exposure to elicitors except for Crlp46-1 elf18 treatment sample. Crlp46-1showed above WT NHL10 expression levels, which decrease upon elf18 exposure, and were below WT upon flg22 exposure. RLP46:GFPOX lines showed WT NHL10 expression levels that increased to slightly above WT levels upon elf18 exposure, and slightly below WT levels upon flg22 exposure.
Analysis of the RLP46 expression data showed that RLP46 expression seemed to be elevated
by both elf18 exposure (supporting the literature on the topic) (Zipfel et al., 2006) as well
as by flg22 exposure. The Crlp46-1 line seemed to still have a degree of rlp46 expression,
presumably of a non-functional mutant rlp46 transcript, and to also have expression levels
elevated by exposure to elicitors. In addition, both RLP46:GFPOX lines showed high
expression of the RLP46:GFP transcript, though their responses to elicitor exposure were
mixed. This is not necessarily a surprise as UBQ10 promotors were used in these lines,
meaning that any promotor-controlled regulation of the WT RLP46 gene would be diluted
out by the overexpressing transgenic RLP46 genes. Analysis of the plant immune response
related gene FRK1 yielded some very interesting results. All plant line controls showed a
similar level of expression of the FRK1 transcript. The Crlp46-1 and RLP46:GFPOX lines
seemed to have a similar FRK1 expression pattern as Col-0 for all treatments with the
exception of the RLP46:GFPOX-2 elf18 treatment which showed higher expression levels.
This is an interesting result, as it suggests that RLP46 could play a role in magnifying plant
immune responses to elicitors, though of course the absence of a similar result in the
RLP46:GFPOX-1 elf18 treatment casts doubt on this result. In contrast to the FRK1 RT-
qPCR data, the NHL10 results were less clear. The Col-0 and RLP46:GFPOX lines showed
mild increases in NHL10 expression upon exposure to elicitors, with all RLP46:GFPOX line
responses being the same as WT with the one exception of the RLP46:GFPOX-1 flg22
treatment sample. The Crlp46-1 showed higher than WT NHL10 expression in the control
treatment, and lower than WT for the elicitor treatments. This result was in contrast to the
data from the previous iteration of this experiment (see figure 26), and the FRK1 data from
the same experiment (see figure 32), causing this result to carry less weight. Taken together

73
then, these results seemed to suggest that RLP46 is not of central importance to the
activation of immune defense related genes.
RLP46:GFPOX lines show increased NaCl sensitivity
The RLP46OX lines were then tested for NaCl abiotic stress responses by repeating the
previous NaCl stress experiments performed on the rlp46 lines.

74
Figure 33: A. Boxplot of average plant root length 5 days after germination. Both rlp46 and RLP46ox mutants seemed to have higher overall growth rates compared to the Col-0 WT. This trend only reversed in the 125 mM NaCl treatment groups. Stars denote significant divergence from the Col-0 WT with the same NaCl treatment. N and P values shown in
Col
0 Su
c 0%
Con
trol
Crlp
461
Suc
0% C
ontro
l
RLP
46:G
FPox
1 Su
c. 0
% C
ontro
l
RLP
46:G
FPox
2 Su
c. 0
% C
ontro
l
Col
0 N
aCl 5
0 m
M
Crlp
461
NaC
l 50
mM
RLP
46:G
FPox
1 N
aCl 5
0 m
M
RLP
46:G
FPox
2 N
aCl 5
0 m
M
Col
0 N
aCl 7
5 m
M
Crlp
461
NaC
l 75
mM
RLP
46:G
FPox
1 N
aCl 7
5 m
M
RLP
46:G
FPox
2 N
aCl 7
5 m
M
Col
0 N
aCl 1
00 m
M
Crlp
461
NaC
l 100
mM
RLP
46:G
FPox
1 N
aCl 1
00 m
M
RLP
46:G
FPox
2 N
aCl 1
00 m
M
Col
0 N
aCl 1
25 m
M
Crlp
461
NaC
l 125
mM
RLP
46:G
FPox
1 N
aCl 1
25 m
M
RLP
46:G
FPox
2 N
aCl 1
25 m
M
0
5
10
15
NaCl Abiotic Stress Root Length 5DAG
Roo
t len
gth
(mm
)
******
*****
***
*****
***
***
**
Col
0 Su
c 0%
Con
trol
Crlp
461
Suc
0% C
ontro
l
RLP
46:G
FPox
1 Su
c. 0
% C
ontro
l
RLP
46:G
FPox
2 Su
c. 0
% C
ontro
l
Col
0 N
aCl 5
0 m
M
Crlp
461
NaC
l 50
mM
RLP
46:G
FPox
1 N
aCl 5
0 m
M
RLP
46:G
FPox
2 N
aCl 5
0 m
M
Col
0 N
aCl 7
5 m
M
Crlp
461
NaC
l 75
mM
RLP
46:G
FPox
1 N
aCl 7
5 m
M
RLP
46:G
FPox
2 N
aCl 7
5 m
M
Col
0 N
aCl 1
00 m
M
Crlp
461
NaC
l 100
mM
RLP
46:G
FPox
1 N
aCl 1
00 m
M
RLP
46:G
FPox
2 N
aCl 1
00 m
M
Col
0 N
aCl 1
25 m
M
Crlp
461
NaC
l 125
mM
RLP
46:G
FPox
1 N
aCl 1
25 m
M
RLP
46:G
FPox
2 N
aCl 1
25 m
M
0
50
100
150
200
NaCl Abiotic Stress Root Length 5DAG
Roo
t len
gth
norm
aliz
ed to
con
trol m
ean
(per
cent
)
*
***
***
***
Col
0 Su
c 0%
Con
trol
Crlp
461
Suc
0% C
ontro
l
RLP
46:G
FPox
1 Su
c. 0
% C
ontro
l
RLP
46:G
FPox
2 Su
c. 0
% C
ontro
l
Col
0 N
aCl 5
0 m
M
Crlp
461
NaC
l 50
mM
RLP
46:G
FPox
1 N
aCl 5
0 m
M
RLP
46:G
FPox
2 N
aCl 5
0 m
M
Col
0 N
aCl 7
5 m
M
Crlp
461
NaC
l 75
mM
RLP
46:G
FPox
1 N
aCl 7
5 m
M
RLP
46:G
FPox
2 N
aCl 7
5 m
M
Col
0 N
aCl 1
00 m
M
Crlp
461
NaC
l 100
mM
RLP
46:G
FPox
1 N
aCl 1
00 m
M
RLP
46:G
FPox
2 N
aCl 1
00 m
M
Col
0 N
aCl 1
25 m
M
Crlp
461
NaC
l 125
mM
RLP
46:G
FPox
1 N
aCl 1
25 m
M
RLP
46:G
FPox
2 N
aCl 1
25 m
M
0
10
20
30
40
50
60
NaCl Abiotic Stress Root Length 9DAT 14DAG
Roo
t len
gth
(mm
)
**
Col
0 Su
c 0%
Con
trol
Crlp
461
Suc
0% C
ontro
l
RLP
46:G
FPox
1 Su
c. 0
% C
ontro
l
RLP
46:G
FPox
2 Su
c. 0
% C
ontro
l
Col
0 N
aCl 5
0 m
M
Crlp
461
NaC
l 50
mM
RLP
46:G
FPox
1 N
aCl 5
0 m
M
RLP
46:G
FPox
2 N
aCl 5
0 m
M
Col
0 N
aCl 7
5 m
M
Crlp
461
NaC
l 75
mM
RLP
46:G
FPox
1 N
aCl 7
5 m
M
RLP
46:G
FPox
2 N
aCl 7
5 m
M
Col
0 N
aCl 1
00 m
M
Crlp
461
NaC
l 100
mM
RLP
46:G
FPox
1 N
aCl 1
00 m
M
RLP
46:G
FPox
2 N
aCl 1
00 m
M
Col
0 N
aCl 1
25 m
M
Crlp
461
NaC
l 125
mM
RLP
46:G
FPox
1 N
aCl 1
25 m
M
RLP
46:G
FPox
2 N
aCl 1
25 m
M
0
50
100
150
NaCl Abiotic Stress Root Length 9DAT 14DAG
Roo
t len
gth
norm
aliz
ed to
con
trol m
ean
(per
cent
)
*
*
*
A B
C D

75
table 9. Data from 1 iteration of experiment. B. Boxplot of normalized average plant root length 5 days after germination. Both rlp46 and RLP46ox mutants seemed to be more sensitive to NaCl stress at higher concentrations compared to the Col-0 WT, conflicting with earlier results for Crlp46-1. Stars denote significant divergence from the Col-0 WT with the same NaCl treatment. N and P values shown in table 9. Data from 1 iteration of experiment. C. Boxplot of seedling root length 9 days after seedling transfer and 12 days after germination. Plants grown on Phyto-Agar plates and then transferred by toothpick to plates containing abiotic stressors. Both rlp46 and RLP46ox mutants seemed to have higher overall growth rates compared to the Col-0 WT except perhaps for Crlp46-1 at the 50 mM and 100 mM concentrations. Stars denote significant divergence from the Col-0 WT with the same NaCl treatment. Small sample size (n of 9) may explain lack of statistically significant divergence from WT for most lines. N and P values shown in table 10. Data from 1 iteration of experiment. D. Boxplot of normalized seedling root length 9 days after seedling transfer and 12 days after germination. Plants grown on Phyto-Agar plates and then transferred by toothpick to plates containing abiotic stressors. Both rlp46 and RLP46ox mutants seemed to show increased NaCl sensitivity across all treatments, conflicting with previous results. Stars denote significant divergence from the Col-0 WT with the same NaCl treatment. Small sample size (n of 9) may explain lack of statistically significant divergence from WT for most lines. N and P values shown in table 10. Data from 1 iteration of experiment.
Analysis of the results seemed to show that both rlp46 and RLP46ox mutants had
significantly higher overall growth rates compared to the Col-0 WT controls except at the
highest NaCl treatment concentration of 125 mM. This conflicted with earlier results for
rlp46 mutants. Normalization of the data showed no divergence in NaCl stress responses,
with the possible exception of RLP46:GFPOX-2, however at the 125 mM NaCl concentration
all of the mutant lines showed increased sensitivity to NaCl stress compared to the Col-0
WT. This conflicted with the previous Crlp46-1 results, throwing them into question.

76
Table 9: Table showing NaCl concentration, average root length, growth normalized to 0 mM control, sample number, and homoscedastic Student T-Test p values for significance between line and Col-0 control with same NaCl treatment for both root length and normalized data used in figures 33 sections A and B. Data from 1 iteration of experiment.
Analysis of the data from the seedling transfer portion of the experiments yielded some
interesting results that seemed to contradict the results from the previous experiment. Both
rlp46 and RLP46ox mutants seemed to have higher overall growth rates compared to the
Col-0 WT except perhaps for Crlp46-1 at the 50 mM and 100 mM concentrations. However,
only the RLP46:GFPOX-2 control group diverged significantly from the Col-0 WT of the
same treatment. This could be explained by the small sample size (n of 9) of this experiment.
Line:NaCl
Concentration mM:
Root Length:Normalized
Growth (Percent):Sample Number
(n):T-Test p Value Root Length:
T-Test p Value Normalized Growth:
Col-0 0 5.76 100 46 1 1
Crlp46-1 0 6.60 100 59 5.28E-03 1
RLP46:GFPox-1 0 7.28 100 60 2.30E-07 1
RLP46:GFPox-2 0 8.55 100 57 6.13E-17 1
Col-0 50 7.48 129.9 48 1 1
Crlp46-1 50 7.98 120.9 50 0.172 0.130
RLP46:GFPox-1 50 8.87 121.9 52 8.18E-05 0.132
RLP46:GFPox-2 50 10.02 117.1 44 3.33E-11 0.013
Col-0 75 5.41 93.9 39 1 1
Crlp46-1 75 6.32 95.8 51 5.59E-03 0.716
RLP46:GFPox-1 75 6.48 89.1 48 5.19E-04 0.319
RLP46:GFPox-2 75 7.35 85.9 42 2.47E-05 0.189
Col-0 100 3.84 66.7 39 1 1
Crlp46-1 100 4.22 64.0 34 0.203 0.563
RLP46:GFPox-1 100 4.60 63.2 44 4.38E-03 0.376
RLP46:GFPox-2 100 4.65 54.3 40 0.016 0.008
Col-0 125 3.56 61.8 43 1 1
Crlp46-1 125 3.50 53.1 44 0.824 0.028
RLP46:GFPox-1 125 3.23 44.4 48 0.177 7.10E-06
RLP46:GFPox-2 125 2.84 33.2 31 2.145E-03 4.92E-12

77
Normalization of the data yielded the surprising results that both rlp46 and RLP46ox mutants
seemed to show increased NaCl sensitivity across all treatments. This conflicted with
previous results, though given the small sample size of this experiment (n of 9) perhaps this
resulted from other unaccounted for factors. Table 10: Table showing NaCl concentration, average root length, growth normalized to 0 mM control, sample number, and homoscedastic Student T-Test p values for significance between line and Col-0 control with same NaCl treatment for both root length and normalized data used in figure 33 sections C and D. Data from 1 iteration of experiment.
Line:NaCl
Concentration mM:
Root Length:Normalized
Growth (Percent):Sample Number
(n):T-Test p Value Root Length:
T-Test p Value Normalized Growth:
Col-0 0 34.42 100 9 1 1
Crlp46-1 0 39.54 100 9 0.246 1
RLP46:GFPox-1 0 40.47 100 9 0.246 1
RLP46:GFPox-2 0 48.56 100 9 6.84E-03 1
Col-0 50 47.35 137.6 9 1 1
Crlp46-1 50 43.47 109.9 9 0.388 0.031
RLP46:GFPox-1 50 45.18 111.6 9 0.734 0.125
RLP46:GFPox-2 50 54.51 112.3 9 0.067 0.014
Col-0 75 41.84 121.5 9 1 1
Crlp46-1 75 43.37 109.7 9 0.622 0.185
RLP46:GFPox-1 75 44.79 110.7 9 0.498 0.348
RLP46:GFPox-2 75 49.15 101.2 9 0.084 0.053
Col-0 100 37.72 109.6 9 1 1
Crlp46-1 100 34.15 86.4 9 0.489 0.108
RLP46:GFPox-1 100 39.95 98.7 9 0.594 0.356
RLP46:GFPox-2 100 39.30 80.9 9 0.798 0.063
Col-0 125 29.93 87.0 9 1 1
Crlp46-1 125 31.86 80.6 9 0.484 0.405
RLP46:GFPox-1 125 32.81 81.1 9 0.443 0.550
RLP46:GFPox-2 125 33.44 68.9 9 0.308 0.041

78
RLP46:GFPOX-1 also has mildly increased resistance to elicitor induced growth
inhibition
To test if RLP46ox also has an impact on elicitor induced growth inhibition, elicitor
experiments using flasks were repeated using the RLP46:GFPOX-1 line, with the one
modification that 20 plants were placed in each flask as opposed to the 30 of previous
iterations.
Figure 34: A. Boxplot of average plant dry weight after 7 days in liquid media and 12 days after germination. All lines showed expected growth inhibition in response to elicitor containing growth media (Igarashi et al., 2012). Both Crlp46-1 and RLP46:GFPOX-1 samples seemed to show mild resistance to elicitor induced growth inhibition as compared to the Col-0 WT samples. N of 6, 4, 6, 6, 5, 5, 5,4, and 3 respectively. Exact values shown in table 11. Data from 2 iterations of experiment. B. Boxplot of normalized data from same experiments. Both Crlp46-1 and RLP46:GFPOX-1 samples seemed to show mild resistance to elicitor induced growth inhibition as compared to the Col-0 WT samples, though the elf18 resistance was not as pronounced in the RLP46:GFPOX-1 samples. N of 6, 4, 6, 6, 5, 5, 5,4, and 3 respectively. Exact values shown in table 11. Data from 2 iterations of experiment.
Interestingly, both the Crlp46-1 and RLP46:GFPOX-1 samples seemed to show mild
resistance to elicitor induced growth inhibition as compared to the Col-0 WT samples,
though the small sample size of these experimental iterations should be taken into
consideration. Normalization of the data further supported the trend of mildly increased
resistance to elicitor induced growth inhibition in both the Crlp46-1 and RLP46:GFPOX-1
Col
0 C
ontro
l
Crlp
461
Con
trol
RLP
46:G
FPox
1 C
ontro
l
Col
0 1
nM e
lf18
Crlp
461
1 nM
elf1
8
RLP
46:G
FPox
1 1
nM e
lf18
Col
0 1
nM fl
g22
Crlp
461
1 nM
flg2
2
RLP
46:G
FPox
1 1
nM fl
g22
0
10
20
30
40
50
60
70
Average Elicitor Induced Growth Inhibition
Plan
t dry
wei
ght (
mg)
Col
0 C
ontro
l
Crlp
461
Con
trol
RLP
46:G
FPox
1 C
ontro
l
Col
0 1
nM e
lf18
Crlp
461
1 nM
elf1
8
RLP
46:G
FPox
1 1
nM e
lf18
Col
0 1
nM fl
g22
Crlp
461
1 nM
flg2
2
RLP
46:G
FPox
1 1
nM fl
g22
0
20
40
60
80
100
120
Average Elicitor Induced Growth Inhibition
Plan
t dry
wei
ght n
orm
aliz
ed to
con
trol m
ean
(per
cent
)
A B

79
samples as compared to the Col-0 WT controls. Interestingly, the elicitor resistance was not
as strong in the RLP46:GFPOX-1 line for the elf18 treatment samples as compared to the
flg22 treatment samples, perhaps hinting at a more specific interaction between RLP46 and
elf18 as suggested by previous studies (Zipfel et al., 2006). Table 11:Table showing sample treatment, average dry weight, normalized growth, number of plants per sample, and sample treatment n for figure 34. Data from 2 iterations of experiment.
All in all, the results of the experiments with RLP46:GFPOX-1 and RLP46:GFPOX-2
undermined the previous NaCl resistance results and supported the elicitor resistance
results, and while having the observed growth inhibition resistance trend of the
overexpression mutant be similar to the phenotype of the putative null mutant is counter
intuitive, it is not outside of the realm of possibility given the buffered nature of the plant
immune signaling network (Hillmer et al., 2017) as well as the multifaceted interactions in
signaling protein complexes.
Western Blot suggest RLP46 associates with SOBIR1
Given the experimental results suggesting that RLP46 interacts with the plant immune
response, as well as its apparent localization to the plasma membrane, experiments testing
for common Receptor Like Protein interaction partners were performed. SOBIR1 is known
to interact with many receptor proteins involved with plant immune responses, making it an
obvious candidate. BAK1 was also selected as it interacts with a number of receptor proteins
Line: Elicitor Treatment: Average Dry Weight (mg):
Normalized Growth (percent): Plants Per Sample: Sample Number (n):
Col-0 Control 51.7 100 20 6
Crlp46-1 Control 57.1 100 20 4
RLP46:GFPox-1 Control 59.3 100 20 6
Col-0 1 nM elf18 22.8 44.1 20 6
Crlp46-1 1 nM elf18 30.0 52.6 20 5
RLP46:GFPox-1 1 nM elf18 28.1 47.4 20 5
Col-0 1 nM flg22 28.5 55.1 20 5
Crlp46-1 1 nM flg22 44.6 78.2 20 4
RLP46:GFPox-1 1 nM flg22 52.6 88.7 20 3

80
also involved with immune signaling, such as PSKR1 (Wang et al., 2015a; Zhang et al.,
2013; Liebrand et al., 2013; Burgh et al., 2019). Fluorescent microscopy was used to
confirm transient expression of the GFP fused protein constructs in N. benthamiana leaf
disks, and then a protein extraction was performed on tissue from the same leaves used for
the microscopy check.
Figure 35: Fluorescent microscopy images showing RLP46:GFP fluorescence in N. benthamiana leaf pavement cells transiently expressing RLP46:GFP and SOBIR1:HAx3. Image shows GFP and bright field channels. RLP46:GFP appeared to be localized to the plasma membrane of the cells examined.
Co-Immunoprecipitation was then used to test for associations between RLP46 and SOBIR1
or BAK1 in transiently expressing N. benthamiana plants and the results assessed via PAGE
and Western Blot. Two PAGE and Western Blots were performed using the products of the
same Co-IP experiment.
Bright Field GFP Fluorescence

81
RLP46:GFP RLP44:GFP GFP:LTI6B
40kDa55kDa
70kDa
α-HA
100kDa
130kDa
170kDa
α-GFPα-GFP α-GFP
α-HA α-HA
35kDa
40kDa55kDa
70kDa100kDa
130kDa
170kDa
35kDa
40kDa55kDa
70kDa
100kDa
130kDa
170kDa
35kDa
40kDa55kDa
70kDa
100kDa
130kDa
170kDa
40kDa55kDa
70kDa
100kDa
130kDa
170kDa
40kDa55kDa
70kDa100kDa
130kDa170kDa
35kDa
SOBIR1:HA BAK1:HACo-IP Co-IP
SOBIR1:HA BAK1:HAInput Input
SOBIR1:HA BAK1:HACo-IP Co-IP
SOBIR1:HA BAK1:HAInput Input
SOBIR1:HA BAK1:HACo-IP Co-IP
SOBIR1:HA BAK1:HAInput Input
SOBIR1:HA BAK1:HACo-IP Co-IP
SOBIR1:HA BAK1:HAInput Input
SOBIR1:HA BAK1:HACo-IP Co-IP
SOBIR1:HA BAK1:HAInput Input
SOBIR1:HA BAK1:HACo-IP Co-IP
SOBIR1:HA BAK1:HAInput Input
RLP46:GFP RLP44:GFP GFP:LTI6B
α-HAα-GFP α-HA α-HA40kDa55kDa
70kDa
100kDa
130kDa
170kDa
40kDa55kDa
70kDa
100kDa
130kDa
170kDa
40kDa55kDa
70kDa
100kDa
130kDa
170kDa
40kDa55kDa
70kDa100kDa
130kDa170kDa
35kDa
SOBIR1:HA BAK1:HACo-IP Co-IP
SOBIR1:HA BAK1:HAInput Input
SOBIR1:HA BAK1:HACo-IP Co-IP
SOBIR1:HA BAK1:HAInput Input
SOBIR1:HA BAK1:HACo-IP Co-IP
SOBIR1:HA BAK1:HAInput Input
SOBIR1:HA BAK1:HACo-IP Co-IP
SOBIR1:HA BAK1:HAInput Input
RLP46:GFP
40kDa55kDa
70kDa
100kDa
130kDa
170kDa
35kDa
α-GFP
Co-IP InputRLP46:GFP RLP44:GFP GFP:LTI6B RLP46:GFP RLP44:GFP GFP:LTI6BSOBIR1:HA BAK1:HA SOBIR1:HA BAK1:HA SOBIR1:HA BAK1:HA SOBIR1:HA BAK1:HA SOBIR1:HA BAK1:HA SOBIR1:HA BAK1:HA
70kDa
100kDa
130kDa
170kDa
α-GFP
RLP46:GFP RLP44:GFP GFP:LTI6BSOBIR1:HA BAK1:HA SOBIR1:HA BAK1:HA SOBIR1:HA BAK1:HA
40kDa55kDa
70kDa
100kDa
130kDa
170kDa
35kDa
α-HA
RLP46:GFP RLP44:GFP GFP:LTI6BSOBIR1:HA BAK1:HA SOBIR1:HA BAK1:HA SOBIR1:HA BAK1:HA
RLP46:GFP RLP44:GFP GFP:LTI6BSOBIR1:HA BAK1:HA SOBIR1:HA BAK1:HA SOBIR1:HA BAK1:HA
Co-IP Input
Input
A
B
C D

82
Figure 36: A. Chemiluminescence image of Western Blot. Co-IP and input samples divided across 3 PAGE gels, transferred to membrane using Western Blot and then divided with scissors for incubation in either a-GFP or a-HA primary antibodies. Results for a-GFP blots showed strong bands in the RLP44 positive control and the LTI6B negative control in the CO-IP samples. The a-HA blot results showed the expected association between RLP44 and SOBIR1 or BAK1, the expected lack of association between LTI6B and SOBIR1 or BAK1, and seemed to suggest an association between RLP46 and SOBIR1. This was evidenced by the faint band around the expected size of ~74 KDa as well as the band present significantly above the 170 KDa ladder mark. Lack of bands in all input samples addressed in section D. Expected protein sizes found in table 12. Uncropped image can be found in appendix 2. B. Chemiluminescence image of same Western Blot from section A with longer imaging time. Co-IP and input samples divided across 3 PAGE gels, transferred to membrane using Western Blot and then divided with scissors for incubation in either a-GFP or a-HA primary antibodies. Results for a-GFP blots showed strong bands in the RLP44 positive control and the LTI6B negative control in the CO-IP samples. The a-HA blot results showed the expected association between RLP44 and SOBIR1 or BAK1, the expected lack of association between LTI6B and SOBIR1 or BAK1, and seemed to suggest an association between RLP46 and SOBIR1. This was evidenced by the faint band around the expected size of ~74 KDa as well as the band present significantly above the 170 KDa ladder mark. Lack of bands in all input samples addressed in section D. Expected protein sizes found in table 12. Uncropped image can be found in appendix 3. C. Chemiluminescence image of Western Blot incubated in a-GFP primary antibody. Results showed strong bands in the RLP44 positive control and the LTI6B negative control in the CO-IP samples but not in the Input samples. Presumably they were present but below the detection threshold of this assay. Band sizes were consistent with RLP44:GFP, GFP:LTI6B, and free GFP. Co-IP and input samples same as used for other sections. Expected protein sizes found in table 12. Uncropped image can be found in appendix 4. D. Chemiluminescence image of top half of Western Blot from section C incubated in a-GFP primary antibody as well was Western Blot with Input samples incubated with a-HA primary antibody. Results showed bands in the RLP44 Co-IP and Input positive control samples as well as in the RLP46 samples. It should be noted that the band in the RLP46 sample was higher on the gel then expected based on the size of the RLP46 gene, though this is not unheard of as post translational modifications can affect migration on the gel (Shi et al., 2012). The a-HA results seemed to show the SOBIR1:HAx3 and the BAK1:HAx3 constructs to be present in all Input samples. Co-IP and input samples same as used for other sections. Expected protein sizes found in table 12. Uncropped image can be found in appendix 5.
Table 12:Table showing expected KDa values based on literature for proteins appearing in figure 36 (Berardini et al., 2015).
Analysis of the Western Blots yielded
some interesting conclusions. The
results shown in figure 36 seemed to
indicated that the collected N.
benthamiana leaf samples were in fact
transiently expressing the RLP46:GFP, RLP44:GFP. GFP:LTI6B, SOBIR1:HAx3, and
BAK1:HAx3 proteins. This was evidenced by proteins of the roughly expected size being
detected in the Western Blots (expected protein sizes can be found in table 12). Interestingly,
there were bands present indicating proteins of much larger size than anticipated, though of
course some proteins are known to migrate on gels differently than their size alone would
predict (Shi et al., 2012; de Jong et al., 1978). It is interesting that this phenomenon seemed
to mostly occur within the SOBIR1:HA samples with the one possible exception of the
Protein: Expected Length:RLP46 91 KDaRLP44 30 KDaGFP 27 KDa
SOBIR1 71 KDaBAK1 74 KDa3xHA 3 KDaLTI6B 6 KDa

83
RLP44:GFP with BAK1:HAx3 sample group, though it is definitely also possible that this
was the result of sample bleeding into the neighboring lane. Analysis of the Western Blot
from the second PAGE performed on the samples (see figure 36 section A) yielded some
exciting preliminary results. Both the RLP44 and LTI6B positive and negative controls
showed the expected results with regards to association with SOBIR1 and BAK1 while
RLP46 appeared to associate with SOBIR1, as evidenced by the band around the expected
size of ~74 KDa as well as the band present significantly above the 170 KDa ladder mark,
a band also present in the RLP44 positive control. There appeared to be no band in the
RLP46 with BAK1 sample, suggesting that these two proteins do not associate. It should be
noted that the lack of bands in all of the input samples did undermine these results, but their
detection in the second Western Blot performed on the same samples mitigated these doubts.
Taken together then, the results of the Western Blots provided good preliminary evidence
for the association between the RLP46 and SOBIR1 proteins, which supports the larger
narrative of our results which suggests RLP46 plays a role in plant immune response.

84
Discussion
Upon reviewing the results of the experiments involving the previously uncharacterized
protein RLP46, we are presented with a strong case for it having a role in plant immune
response. While the results for abiotic stressors seemed to be inconclusive in the end, the
evidence for RLP46 having a role in plant pathogen response was much more compelling.
Building upon the starting point of upregulation in response to elf18 perception (Zipfel et
al., 2006), several experiments showed a link between RLP46 and elicitor responses,
seemingly with a subtle distinction between flg22 and elf18. This link seemed to not be
related to the plant’s initial rapid immune response, as assessment of the ROS burst
experiments seemed to show that the loss of the RLP46 gene did not affect the timing or
degree of the ROS burst response. This was shown by the trends of rlp46 mutants remaining
comparably similar to that of the Col-0 WT. It is of course possible that there is in fact a
subtle effect on the ROS burst immune response, but that the sensitivity of the experimental
assay was not high enough to detect it. That being said, it seems more likely that RLP46
could play a supporting role in the activation of immune pathways leading to secondary
metabolite production and consequent reduced growth. This idea is buttressed by the
apparently WT ROS burst pattern of the pskr1-3 mutant line despite its widely reported
hyperimmune response to elicitors (Igarashi et al., 2012). Furthermore, PSKR1 could serve
as a good mirror example of an LRR-RLK with several functions whose loss increases the
severity of the plant’s growth inhibition response to elicitor treatment (Igarashi et al., 2012),
while in contrast the loss of RLP46 seems to subtly reduce it. In the case of the rlp46
mutants, there seemed to be little difference in the reduction of immune response between
the elicitors flg22 and elf18, with both showing a reduction in growth inhibition ranging
from roughly five to ten percent in different elicitor concentrations and experimental setups.
Unfortunately, this subtilty probably also led to the lack of a detectable impact on FRK1
and NHL10 expression levels in the rlp46 mutants. This lack of clarity was however partially
mitigated by the experiments using the RLP46:GFPox lines. These experiments, though
preliminary, seemed to show the RLP46ox line having an increased response to elf18
treatment, as evidenced by the increased expression of FRK1 and to a lesser extent the

85
growth inhibition data, while seeming to have a response to flg22 that was similar to the
rlp46 mutant. This observation, if confirmed, could suggest that RLP46 does indeed possess
a degree of specificity for elf18, either directly or through its interaction partners, while its
impact on flg22 singling could theoretically derive from being a component of the larger
plant elicitor immune response network. Additionally, the difference between the two
responses could be further masked by the buffered nature of the plant immune signaling
network reported in other studies (Hillmer et al., 2017). This would also create a possible
explanation for the apparent contradiction in the experimental results shown by the
RLP46ox lines in that the extra copies of RLP46 could disrupt the balance of an elicitor
perception response membrane complex, but this disruption would be overcome in the case
of elf18 exposure due to the higher number of receptors for that particular elicitor. The
results from the Co-IP and Western Blot experiments in conjunction with the fluorescent
microscopy of RLP46:GFP lend some credence to this hypothesis. We know from the
microscopy results that RLP46 does indeed seem to be localized to the plasma membrane,
as expected for a receptor like protein (Wang et al., 2008; Jamieson et al., 2018; Shiu and
Bleecker, 2001, 2003), and a potential association partner in SOBIR1 was identified by the
Co-IP results. The role of SOBIR1 as a potential association partner also fits nicely into the
narrative of RLP46 being a component of the plant’s immune responses to elicitor
perception. This is due to SOBIR1’s role in promoting a stronger immune response (Zhang
et al., 2013; Liebrand et al., 2013; Burgh et al., 2019), the effectiveness of which could
logically be impeded by the loss of an association partner, like perhaps RLP46. It should
also be noted that the experiments performed in this study may not have been ideal for
testing for RLP46 related phenotypes, as the currently available RLP46 expression data
shows it to be expressed mostly in mature vascular tissue (Klepikova et al., 2016). Since
none of the experiments performed directly tested vascular immune response it is possible
that the subtle rlp46 phenotypes observed would have been much stronger had the plants
been directly tested for immune responses to vascular pathogens. As such, future
experiments could begin by testing the susceptibility of rlp46 and RLP46ox mutants to
vascular pathogens like Fusarium or Xylella fastidiosa (bacterial pathogens probably
making more sense given RLP46’s apparent link to efl18), and by using microscopy to

86
directly test the roots for phenotypes in elicitor induced ROS burst and Ca2+ flux. These
experiments would go a long way to determining if RLP46 has a role in modulating vascular
tissue specific immune responses and in explaining the subtlety of the rlp46 immune
phenotypes observed in this study. That being said, and viewing all of the results for RLP46
as a whole, we arrive at the interesting but by no means definitive conclusion that RLP46 is
yet another of the many RLP’s located at the plasma membrane which convey vital
information about the external environment of the plant cell into the internal protein
signaling network. With regards to its specific function, it seems to be involved with the
plant’s PAMP sensing innate immune system, and be more closely, but not exclusively,
associated with the elf18 activated component of it. Furthermore, it appears to associate in
some way with the immune response stimulating protein SOBIR1, though whether directly
or as part of a larger complex is not known. In summation then, this study succeeded in an
initial characterization of the RLP46 protein while also laying the groundwork for future
studies investigating RLP46’s role in plant innate immune response.

87
Discussion Taken together, the analyses performed over the course of this thesis proved successful in
providing an initial characterization of the three proteins of interest selected for study.
PSKL1 was shown to have a role in determining metaxylem cell number, F-Box/RNI-Like
to be somehow related to the expression of the RLP44ox phenotype, and RLP46 was shown
to likely play a role in plant immune response. The results provide in this thesis combined
with the scientific tools created to collect them, provide a clear starting point for future
research on any of the three proteins studied, and while their exact roles in the plant cell
remain unknown, the work in this thesis has established a scientific basecamp for future
exploration. Taking a step back from the focus of this thesis to assess the state of the research
field at large, it is clear that the plant cell wall and the complex web of signaling and
communication it serves as a backdrop for remain an exciting and dynamic field of study.
This ocean of scientific unknowns continues to reveal mysteries faster than the combined
efforts of researchers can resolve them, and will no doubt serve as a wellspring of scientific
knowledge for years to come. This thesis pushed against this vast unknown, adding one
more paving stone to the road towards knowledge, and with any luck will serve as the
foundation for many more stones to come.

88
Methods
Seed Sterilization Technique
Seeds of A. thaliana were placed in 1.5 mL or 2 mL Eppendorf tubes and mixed with
between 0.5 mL and 1.5 mL of sterilization solution [70% EtOH, 0.05% Triton X100
(vol/vol)] depending on seed volume. After waiting (at least 40 seconds but ideally not
longer than 5 minutes) the seeds were washed using a 99% EtOH solution and then dried in
a sterile hood by either pipetting the mix of EtOH and seeds onto filter paper, or by pipetting
off the excess EtOH and allowing the seeds to dry in the open tube.
Plant Cultivation Techniques
Medias used: ½ Murashige-Skooog (MS) media used with 0-0.9% Phyto-Agar, 0-6.5%
Sucrose, 0-150 mM Mannitol, 0-2% Glucose, 0-150 mM NaCl, 0-1 µM PSK, 0-100 nM
elf18, and 0-100 nM flg22. Media pH of 5.8 adjusted with HCl and KOH. Media then
autoclaved and any necessary antibiotics added after as per experimental requirements.
Plant Growth: Square Greiner plates used to contain desired media, and seeds then sown on
it under sterile conditions in sterile hood. Sterile seeds either taped out from 1.5 mL
Eppendorf tubes onto plate or placed using sterile toothpick. Plates sealed with Millipore
sterile surgical tape. Seeds then stratified for 2-3 days in dark at 4° C.
Plates containing seeds for experiments with light growth conditions then placed either
horizontally or vertically, depending on media and experiment, in growth chambers or grow
room with long day or short day conditions (16 hours light, 8 hours dark for long day and 8
hours light, 16 hours dark for short day, 100-150 µE light intensity in growth chamber and
5xPhilips Green power LED production module deep red/blue 120 LD [415 µmol/sec at
distance of 40 cm] in grow rooms, 60-70% humidity, and 22-23° C).
Dark grown seedlings were placed in illuminated growth chamber for 6 hours and then
wrapped in aluminum foil and returned to growth chamber.
Hygromycin B selection plates were placed horizontally in growth chamber, and covered
with single sheet of paper for first 5 days and then uncovered after.

89
Seeds were also sown directly on soil when needed.
Plantlets transferred to soil earliest 5 days after germination, and then placed in long day or
short day grow room (16 hours light, 8 hours dark for long day and 8 hours light, 16 hours
dark for short day, 5xPhilips Green power LED production module deep red/blue 120 LD
(415 µmol/sec at distance of 40 cm), 65% humidity, and 23° C) depending on experiment.
Tray containing plant pots covered with clear plastic lid to maintain humidity for at least 1
day, but no longer than 7. Lid then removed. Plants watered as needed.
Plants for seedling transfer experiments sown as normal on Phyto-agar plates and stratified
for 2-3 days in dark at 4° C. Plates then placed in long day growth chamber vertically and
allowed to grow for 5 days. After 5 days, seedlings transferred one at a time using sterile
toothpicks in sterile hood from germination plate to experiment plate containing abiotic
stressors. Plates then resealed with Millipore sterile surgical tape and placed vertically back
in growth chamber.
Plant Crossing
Plants for crosses grown until bolting stage. Inflorescence of female in cross allowed to
mature to just prior to opening of flowers. Then, using forceps, axillary buds removed and
all flowers that are too old or young in primary inflorescence also removed leaving 3 flowers
of the proper age for crossing. Anthers, sepals, and petals then removed. Female flowers
now ready for crossing. Then took anthers from mature flowers from male plant and used
them to pollinate the flower of the female plant. Cross now performed. Silique allowed to
mature and then F1 seeds collected.
Seed Harvest
Plants staked and bagged after bolting. Breathable plastic bag used and twisty tied at base.
Plants moved to drying room after first siliques fully matured until plants fully dried and
matured. Siliques then opened by kneading, then sieved and placed into paper storage
packets.

90
gDNA Extraction
Tissue Homogenization by Hand: Plant material harvested and put in 1.5 mL Eppendorf
tubes. 200 µL of gDNA extraction buffer added and them tissue ground by hand using small
plastic pestle.
Tissue Homogenization by bead-mill: Plant material harvested and put in 2 mL Eppendorf
tubes, then glass bead added and tubes frozen in liquid nitrogen. Tubes then placed in -80°
C chilled bead-mill sample rack and homogenized using bead-mill (TissueLyser II,
RETSCH, QIAGEN) with a setting of 30 Hz for 30 seconds.
gDNA Extraction: 200 µL of gDNA extraction buffer added to samples if not done already,
and then samples centrifuged at max speed at room temperature for 10 minutes. 150 µL of
supernatant transferred to new 1.5 mL Eppendorf Tube and then 150 µL Isopropanol added
and then mixed. Sample centrifuged for 10 minutes at room temperature again. Supernatant
removed, being careful not to disturb DNA pellet. 0.5-1.0 mL 70% EtOH added to wash
pellet, and then sample centrifuged again for 10 minutes at room temperature. Supernatant
removed being careful not to disturb DNA pellet. Pellet then allowed to airdry for 5 minutes
or until dry. Then added 50 µL low TE buffer. Samples stored at 4° C.
gDNA Extraction Buffer: 150 mM Tris (pH 8), 250 mM NaCl, 25 mM EDTA, 0.5% SDS.
Low TE Buffer: 10 mM Tris HCl, 0.1 mM EDTA, pH 8.
RNA Extraction
RNA extractions performed using Universal RNA Purification Kit from Roboklon GmbH.
Followed protocol provided by kit titled ‘Plant Tissue RNA Purification Protocol’ and
included the optional step of the on-column DNase digestion.
cDNA Generation
cDNA generation performed using the protocol included with the AMV Reverse
Transcriptase Native kit from Roboklon GmbH.

91
Polymerase Chain Reaction
Real Time Quantitative Polymerase Chain Reaction (RT-qPCR)
Taq PCR Taq PCR Q5 PCR Q5 PCR Colony PCR Colony PCRReaction Component: Volume (µL): Reaction Component: Volume (µL): Reaction Component: Volume (µL):
10X PCR Buffer 2.5 5X PCR Buffer 10 10X PCR Buffer 2.5dNTP solution (10 mM) 0.5 dNTP solution (10 mM) 1 dNTP solution (10 mM) 0.5Fwd Primer (10 µM) 0.25 Fwd Primer (10 µM) 0.5 Fwd Primer (10 µM) 0.25Rev Primer (10 µM) 0.25 Rev Primer (10 µM) 0.5 Rev Primer (10 µM) 0.25
DNA Template (1 ng-1 µg) 1.5 DNA Template (1 ng-1 µg) 3 DNA Template (1 ng-1 µg) ColonyTaq-Polymerase 0.25 Q5-Polymerase 0.5 Taq-Polymerase 0.25
ddH2O 19.75 ddH2O 34.5 ddH2O 21.25Final Volume 25 Final Volume 50 Final Volume 25
Thermo-Cycler ProgramProgram Step: Temperature: Time: Temperature: Time: Temperature: Time:
Initial Denaturation 95° C 2' 98° C 2' 95° C 5'Denaturation 95° C 30'' 95° C 30'' 95° C 30''Annealing 52-58° C 30-45'' 52-58° C 30-45'' 52-58° C 30-45''Elongation 72° C 1'/kb 72° C 30''/kb 72° C 1'/kb
Final Elongation 72° C 5' 72° C 5' 72° C 5'Pause 16° C ∞ 16° C ∞ 16° C ∞
Taq PCR Q5 PCR Colony PCR (Taq)
Steps Repeated X 30-35
Reaction Component: Volume (µL):10X PCR Buffer 1.5
dNTP solution (10 mM) 0.3Fwd Primer (5 µM) 1Rev Primer (5 µM) 1
DNA Template (1 ng-1 µg) 2Jump Start Polymerase 0.3
ddH2O 8.6SYBR® Green (1:400) 0.3
Final Volume 15
Thermo-Cycler ProgramProgram Step: Temperature: Time:
Hold 95° C 6'Denaturation 95° C 30''Annealing 59° C 20''Elongation 72° C 30''
RT-qPCR
Steps Repeated
X 45
Melt55° C - 95° C by 1° steps
90'' wait at first step and 5'' each step after

92
RT-qPCR performed using a Rotor-Gene Q thermo-cycler using Run Wizard Advanced
software and 0.1 mL 4-Strip Rotor-Gene® Style Tubes and Caps.
Bulked Segregant Analysis
See figure 14. List of primers used can be found in appendix 1.
Imaging of Plant Rosettes
Digital images of plant rosettes captured using a D3300 Nikon Digital Camera using a
Tamron Aspherical LD XR DiII SP lens (AF 17-50mm f/2.8 [IF] φ67 A16).
Scanning Plant Growth Plates for Root Measurement:
After plantlets on Phyto-Agar plates reached desired days post germination, plates were
scanned using RICOH MP C2503 photocopy machine, and images stored as TIFF files for
subsequent analysis. Plates scanned face up on scanner with a black background cover on
top.
Scanning Plant Hypocotyls for Measurement:
After plantlets on covered Phyto-Agar plates reached desired days post germination, they
were transferred to an empty square Greiner plates and scanned using RICOH MP C2503
photocopy machine and images stored as TIFF files for subsequent analysis. Plates scanned
face up on scanner with a black background cover on top.
Measuring Root Length
Image files form scanned plates analyzed using FIJI image analysis software (ImageJ open
source software version: 2.0.0-rc-43/1.51k). 120 mm width of plates used to calibrate
measurements, and then root traced with segmented line tool and measured, or Simple
Neurite Tracer Plugin used to measure length.
Channel: Source: Detector: Gain:Green 470 nm 510nm 10 of 10Yellow 530 nm 555 nm 7 of 10

93
Counting Lateral Roots
Image files form scanned plates analyzed using FIJI image analysis software (ImageJ open
source software version: 2.0.0-rc-43/1.51k), and then lateral root number counted.
Measuring Hypocotyl Length
Image files form scanned plates analyzed using FIJI image analysis software (ImageJ open
source software version: 2.0.0-rc-43/1.51k). 120 mm width of plates used to calibrate
measurements, and then root traced with segmented line tool and measured, or Simple
Neurite Tracer Plugin used to measure length.
Basic Fuchsine Staining
6 day old plantlets placed in 100 µm Nylon Cell Strainers in 6 well plates containing 10%
NaOH (w/v) solution. Plate sealed with laboratory tape and left on laboratory benchtop
overnight. NaOH removed and then plantlets stained with 0.01% basic fuchsine (dissolved
in H2O) solution for at least 5 minutes. Basic fuchsine removed and plantlets destained with
70% ethanol solution for 10 minutes. Ethanol removed and 50% glycerol solution added to
plantlets. Plantlets then stored at 4° C (can be stored in this state almost indefinitely) until
being mounted on slides in 50% glycerol for analysis via laser microscopy.
Counting metaxylem cell number
Basic fuchsine stained plantlets analyzed with fluorescent confocal microscopy using a 514
nm laser for excitation. Z stack of plantlet xylem cells in the stele imaged at the top of the
root near the hypocotyl. Z stack then analyzed to count the number of metaxylem and
protoxylem cells.
Agrobacterium Leaf Infiltration
Agrobacterium cultures grown overnight at 28° C in shaking incubator in 20 mL of LB-
media containing appropriate selective antibiotics in Erlenmeyer flasks. Cultures spun down
in 50 mL Falcon tubes at 3000 rpm for 30 minutes. Supernatant discarded and pellet washed

94
with 1 mL of tap water which is then removed. Pellet then resuspended in 5-10 mL of tap
water and agitated for 1 to 3 hours at 28° C in shaking incubator. Measured OD600 and
volume adjusted with tap water to a final OD600 of 1. Cultures mixed together when
necessary and then injected in N. benthamiana leaves using a syringe with no needle. Leaves
were first perforated using a syringe needle. Plants then left on lab bench in flat with
transparent greenhouse growth cover overnight, and then transferred to growth chamber (16
hours light, 8 hours dark, 100-150 µE light intensity, 60-70% humidity, 22-23° C) or
greenhouse and left overnight. Leaf disks collected and then analyzed when applicable, and
then 1 gram of transformed leaf material collected and frozen in liquid nitrogen for later
protein extraction.
Agrobacterium Floral Dip
Cultures of Agrobacterium grown overnight at 28° C in shaking incubator in 12 mL cell
culture tubes. Cultures spun down in two to four 2 mL Eppendorf tubes at 3000 rpm for 10
minutes. Supernatant discarded and pellet washed with 1 mL of tap water which was then
removed. Pellet then resuspended in 1.9 mL of dipping solution. A. thaliana flowers then
exposed to solution thorough either dipping the flower into the tube, placing droplets of
solution on flower with a syringe, or pouring the solution onto flowers held in gloved hand.
Plants covered and moved out of direct light for 1 day and then returned to growth chamber.
Mature seeds collected and then sown on selective media to identify successfully
transformed plantlets.
Dipping solution: 0.002% Murashige-Skooog (MS), 2.5 mM MES buffer (pH adjusted to
5.7), 10% sucrose, and 0.05% Silwet L-77.
Protein Extraction
Frozen leaf tissue samples ground to powder under liquid nitrogen using a mortar and pestle
(used 1 gram of leaf tissue when possible). Added 2 mL of ice chilled protein extraction
buffer to ground leaf tissue powder and continued grinding until mix had melted enough to
be pipetted into 2 mL Eppendorf tube which was done using a cut tip 1 mL micropipette.
Tubes then moved to end over end mixer at 4° C for 15-30 minutes. Samples then spun-

95
down in temperature-controlled tabletop centrifuge set to 4° C for 15 minutes, then
supernatant transferred to new 2 mL Eppendorf tube and spun again at 4° C for 15 minutes.
Supernatant then transferred to new Eppendorf tube and was ready for immediate
experimental use, or for storage at -20° C.
Protein Extraction Buffer: 1% IGEPAL® (Sigma-Aldrich), 50 mM Tris-HCl pH 7.5, 150
mM NaCl, 10% Glycerol, 5 mM DTT, and 1:100 (vol/vol) protease inhibitor mix (Sigma-
Aldrich).
Co-Immunoprecipitation (Co-IP)
All solutions and samples kept on ice or in 4° C cold room. Equilibrated 20 µL trap-beads
(GFP-trap or RFP-trap e.g.) by adding to 1 mL of protein extraction buffer (using a cut tip
200 µL micropipette) and then centrifuging at minimum speed (e.g. 500rpm) for 2 minutes,
and then removing the supernatant. 60 µL of extracted protein solution placed in new
Eppendorf tube and set aside on ice as Input sample. The remainder of the extracted protein
solution then added to equilibrated trap-beads and then put on end over end mixer at 4° C
for 1-3 hours. Samples then centrifuged at minimum speed (e.g. 500 rpm) for 2 minutes and
then the supernatant removed and returned to storage for later analysis. Then added 1 mL
of protein extraction buffer (protease inhibitor not added to buffer used for wash steps) and
returned to end over end mixer at 4° C for 5 minutes. Then centrifuged samples like previous
step and removed supernatant. This wash step was repeated 3 times. After final wash step,
added double the sample volume (120 µL for input samples and 40 µL for Co-IP samples)
of solution that is 1:1 mix protein extraction buffer (protease inhibitor not added to buffer
used for this step) and roti-load to both the input sample and the Co-IP sample. Mixed and
then boiled for 10 minutes at 95° C (70° C for 20 minutes can also be used if precipitation
is a concern). Co-IP and input samples now ready for use or for storage at -20° C.
PAGE
Polyacrylamide gels prepared using 6-10% resolving gel (6-10% acrylamide, 1.5 M Tris-
HCl pH 8.8, 0.4% (vol/vol) SDS) and 4.5% stacking gel (4.5% acrylamide, 0.5 M Tris-HCl

96
pH 6.8, 0.4% (vol/vol) SDS) and run using SDS running buffer (25 mM Tris base pH 8.5-
8.8, 192 mM glycine, 1% (vol/vol) SDS). 5-20 µL of pre-stained protein ladder
(PageRuler™ Thermo Fisher Scientific) and 5-20 µL of Co-IP samples loaded into sample
wells (roti-load protein extraction buffer mix used in empty wells). Gels first run at 60 V
for 30 minutes, and then subsequently run at 150-200 V.
Western Blot
PVDF membrane (Immobilon-P) activated by incubation for minimum of 2 minutes in
100% Methanol, and then washed in semi-dry buffer. Whatman paper incubated in semi-
dry buffer (48 mM Tris base, 39 mM glycine, 20% methanol, 0.0375% SDS). Used semi-
dry blotting system to transfer PAGE gel proteins to PVDF membrane (55 minutes, 0.4
Amp, 15 V)(Trans-Blot Turbo, BIORAD)(from bottom to top, 4 stack Whatman paper –
PVDF membrane – Gel-4 stack Whatman paper). After transfer, incubated membrane in 1X
TBST (20 mM Tris base pH 7.4, 150 mM NaCl, 0.05% Tween) containing 5% (w/vol) milk
powder (Roth) for 1 hour on tabletop shaker. Primary antibodies diluted to 1:10,000 in 1X
TBST containing 1% (w/vol) milk powder and incubated overnight on tabletop shaker at 4°
C. Membrane then washed for 5 minutes in 1X TBST. Repeated wash step 4 times.
Membranes then incubated for 1 hour in 1X TBST with 1:10,000 diluted secondary
antibodies coupled with the horseradish peroxidase. Membrane then washed for 5 minutes
in 1X TBST. Repeated wash step 4 times. Imaging then performed by incubating with
chemiluminescence mix (SuperSignalÒ West Pico Chemiluminescence Substrate,
SuperSignalÒ West Femto Trial Kit Thermo Scientific). Chemiluminscence then detected
using a CCD camera imaging system (ChemCam Imager, Intas).
Confocal Laser Scanner Microscopy
Confocal microscopy performed using the Nikon AR1 Confocal Microscope at the
University of Heidelberg’s Nikon Imaging Center and using the Leica TCS SP5 Confocal
microscope at the University of Heidelberg’s Center for Organismal Studies.

97
GreenGate Cloning
Generation of Entry Modules: Cloning steps follow published GreenGate protocol
(Lampropoulos et al., 2013). Gene of interest cloned using Q5 PCR, 8 µL of PCR product
removed and used to verify appropriate product length by gel electrophoresis, and then
product purified using GeneJet Gel Extraction Kit (modified protocol by not cutting band
out of agarose gel but instead using PCR product solution directly). Purified fragment then
ligated into vector backbone with GG-reaction (both empty plasmid vector (pGGA-I) and
purified PCR product digested with Eco31I FD (Thermo Scientific) with 10X Fast Digest
Buffer (Thermo Scientific). Digestion products column purified and 20-100 ng of product
and 2-3 times more vector ligated together with Instant Sticky End Ligase Master Mix (5
µL of combined products and 5 µL of Instant Sticky End Ligase Master Mix) or ligated
using protocol from New England Biolabs® Inc.: Ligation Protocol with T4 DNA Ligase
(M0202) by New England Biolabs® inc. T4 DNA ligation reaction. Ligation reaction
product put on ice for immediate use or stored at -20° C. DH5a or XL1 Blue E. coli cells
transformed with entry module plasmid. Culture then plated, colonies selected, confirmed
by PCR, culture scaled up, and then plasmid collected using Plasmid Mini-Prep Kit (Sigma)
or by following Plasmid Miniprep protocol, and then stored at -20° C. Plasmid sequenced
to confirm proper DNA sequence using Eurofins Genomics.
Destination Module Creation: Cloning steps follow published GreenGate protocol
(Lampropoulos et al., 2013). Added 1.5 µL of necessary entry modules to 1 µL of empty
destination vector pGGZ001, 2 µL of FastDigest buffer (Thermo Scientific), 1.5 µL of 10
mM ATP, 1 µL T4 DNA ligase, and 1 µL Eco31I (FastDigest). Reaction performed on
thermo-cycler using following program.
New plasmid was then used to transform E. coli, culture used to propagate plasmid, and
then mini-prepped (following same protocol as Generation of Entry Module) to produce
Step: Temperature: Time:1 37° 2'2 16° 2'3 50° 5'4 80° 5'
Repeat Steps 1 and 2 X 30-60
GreenGate Module Creation

98
plasmid for confirmation via PCR and sequencing. Once confirmed, plasmid ready for use
in transformation of A. tumefaciens (using A. tumefaciens transformation protocol).
Bacteria Cultivation
Cultures of A. tumefaciens (strain ASE or C5891) and E. coli (strain DH5a or XL1 Blue)
grown with lysogeny broth (LB) media with appropriate selective antibiotics on agar plates
or in liquid media. Plates put in incubator and liquid cultures put in shaking incubator. E.
coli cultures allowed to grow for 1 day at 37° C, and A. tumefaciens cultures allowed to
grow for 2 days at 28° C.
Transformation of E. coli
Chemically competent E. coli cells (DH5a or XL1 Blue) taken from -80° C storage and
allowed to thaw on ice. 2.5 µL of plasmid for transformation added to culture and allowed
to incubate for 15 minutes on ice. Culture then heat shocked at 42° C for 50 seconds and
then put back on ice for 2 minutes. Then 1 mL of LB media added to transformed bacteria
culture and culture placed in shaking incubator at 37° C for a minimum of 1 hour. Then
culture plated on LB agar plates containing appropriate selective antibiotics and allowed to
incubate overnight at 37° C. After successful colony formation, picked colonies for plasmid
check via PCR and placed confirmed colonies into liquid media for overnight incubation at
37° in shaking incubator. Culture then ready for use such as for plasmid harvest.
Transformation of A. tumefaciens
Chemical Transformation:
Cultures of chemically competent A. tumefaciens cells (ASE) taken from -80° C storage and
thawed on ice. 2.5-5 µL of plasmid selected for transformation added to culture which is
then incubated on ice for 10 minutes. Culture then placed in liquid nitrogen for 5 minutes,
then transferred to heat block at 37° C for 5 minutes of hear shock. 1 mL of LB media added
to culture after heat shock. Culture then placed in shaking incubator set to 28° C for at least
2 hours. Culture then plated on selective media agar plates and left to grow for 2 days.

99
Colonies then selected and checked with PCR. Positive colonies transferred to liquid media
and then incubated overnight in shaking incubator at 28° C. Culture now ready for use in
plant transformation or storage in cold room for later use.
Electrical Transformation:
Cultures of electrically competent A. tumefaciens cells (C5891) taken from -80° C storage
and thawed on ice. 2.5-5 µL of plasmid selected for transformation added to culture which
is then incubated on ice for 1 minute. Culture transferred to electro-transformation cuvette
and then shocked using a Bio-RAD MicroPulser set to the Ec1 program. Cells then chilled
on ice for 30-60 seconds. Then added 1 mL LB to cuvette and pipette mixed contents before
transferring to Eppendorf tube for minimum of 2 hours incubation in 28° C shaking
incubator. Culture then plated on selective media agar plates and left to grow for 2 days.
Colonies then selected and checked with PCR. Positive colonies transferred to liquid media
and then incubated overnight in shaking incubator at 28° C. Culture now ready for use in
plant transformation or storage in cold room for later use.
GeneJet Gel Extraction Kit
Product of Thermo Fisher Scientific. Followed PCR product purification protocol provided
with modification that liquid PCR product was mixed with Binding Buffer solution and
added directly to the column unless cloning was proving problematic, in which case the
protocol was followed with no modifications.
GenEluteÔ Plasmid Miniprep Kit
Product of Sigma-Aldrich. Adhered to protocol for extraction and purification of plasmid
DNA from E. coli.
Plasmid Miniprep
Bacterial cultures for miniprep were allowed to grow to high enough densities for adequate
plasmid extraction. 2 mL of culture then transferred to 2 mL tube and then spun at 6800g
for 2 minutes at room temperature. Supernatant then removed. 200 µL of cold P1 buffer
100
added and culture resuspended. 200 µL of cold P2 buffer added and culture inverted to mix.
200 µL of cold P3 buffer added and culture inverted to mix. Culture then spun for 5 minutes
at full speed. Supernatant transferred to new 1.5 mL tube, 500 µL of isopropanol added, and
solution inverted to mix. Solution then spun for 5 minutes at full speed. Supernatant
removed and pellet washed with 500 µL of 70% Ethanol. Solution then spun for 1 minute
at full speed. Supernatant then removed and pellet allowed to dry. DNA pellet dissolved in
50 µL ddH2O and ready for immediate use or storage at -20° C.
P1 solution: 6.06 g Tris base. 3.72 g Na2EDTA x 2H2O. Dissolved in 800 mL dH2O. pH
adjusted to 8.0 using HCl (approximately 8 mL of 2 N HCl solution). Final volume adjusted
to 1 L with dH2O. Solution autoclaved or filter sterilized. 10 mg of RNase A added per 100
mL of solution before use. Stored at 4° C.
P2 solution: 0.2 M NaOH and 1% SDS in dH2O. (8 g NaOH and 10 g SDS per liter dH2O).
Solution dissolved and sterilized only though filter sterilization. Stored at room temperature.
P3 solution: 3 M Potassium acetate in dH2O with pH of 5.5 adjusted by addition of glacial
acetic acid (acetic acid will end up being almost a third of total volume). Stored at 4° C.
TECAN Plate Reader
Tecan plate reader (Infinite M1000, Tecan) used for measuring of chemo-luminescence of
samples in white flat bottom 96 well plates (Perkin Elmer 96 Flat Bottom White
Polystyrene). Plate reader software used was Tecan i-Control 1.10.4.
Setting for ROS burst experiment: Kinetic Measurement, Kinetic Cycles 30, Interval Time
Minimal, Mode Luminescence, Attenuation None, Integration Time 1000 ms, Settle Time
100 ms. 48 wells measured at a time to limit time between measurements of same well
during time course.
DNA Sequencing
EuroFins Genomics performed sequencing of DNA samples using both in house and
provided primers.

101
Primer Design, Gene Analysis and Sequencing Data Analysis
The programs Serial Cloner (version 2.6.1) and 4Peaks (version 1.8) were used for analysis
of DNA sequencing files, searching genes for restriction enzyme sites, and for primer
design.
Agarose Gel Electrophoresis
Gel comprised of 1-2% agarose TAE (4.84 g/L Tris base, 0.1142% (vol/vol) acetic acid and
1 mM EDTA (pH 8) buffer solution to which 2-3 drops (~50µL) of Ethidium bromide
solution (0.025% Ethidium bromide, ROTH) per 50 mL of gel was added before pouring.
Used Blue Power 500 (Serva) gel electrophoresis power source to run gel. Gel then analyzed
using UV light and camera from BioDocAnalyze (biometra) machine and software.
Genotyping
Plant tissue collected from plants needing to be genotyped. Then gDNA extraction protocol
performed on collected plant tissue. PCR then performed on gDNA with primers testing for
desired genetic sequence, or PCR product purified using GeneJet Gel Extraction kit and
submitted for genetic sequencing with appropriate primers. Alternatively, seeds sown on
selective media and plantlet survival assessed in order to determine segregation ratios.
Measurement of DNA or RNA Concentration using Nana-Drop
Purified DNA or RNA sample concentration measured using NanoDrop 2000C (Thermo
Scientific) DNA measurement device. NanoDrop 2000/2000C software (version 1.4.2).
T-DNA Genotyping
Salk T-DNA plant line seeds received from SIGnAL (Salk Institute Genomic Analysis
Laboratory). T-DNA plant lines grown and tissue collected for gDNA extraction. PCR
performed with primers testing for presence of T-DNA insertion in correct gene and for
homozygosity of mutation. In case of segregating T-DNA lines, plants were grown on
102
Phyto-agar plates containing selection antibiotic for T-DNA line. Lines showing high
percentages of survival were then tested using gDNA extraction and PCR.
Root Length Abiotic Stress Phenotype Experimental Setup
Sterile seeds form desired plant lines sown on plates containing ½ Murashige-Skooog (MS)
media used with 0.9% Phyto-Agar, 0-6.5% Sucrose, 0-150 mM Mannitol, 0-2% Glucose,
and 0-150 mM NaCl (media pH of 5.8 adjusted with HCl and KOH) in sterile hood. Plates
sealed with Millipore sterile surgical tape and put in dark at 5° C for 2 days of stratification.
Plates then placed vertically in growth chambers or grow room with long day conditions (16
hours light, 8 hours dark, 100-150 µE light intensity in growth chamber and 5xPhilips Green
power LED production module deep red/blue 120 LD [415 µmol/sec at distance of 40 cm]
in grow rooms, 60-70% humidity, and 22-23° C) and allowed to germinate. 5 days after
germination, plates imaged and root lengths measured (see Measuring Root Length
method).
Drought Tolerance Experiments
Plants were first germinated on Phyto agar under short day conditions and then transferred
to soil 17 DAG. Plants were grown in single pots under short day conditions (to prevent
bolting) until 24 days after germination, after which watering was discontinued. 38 days
after germination, plants were top watered with 10 mL each to assess their ability to recover
from the initial drought stress. After this, the plants were given no water until the end of the
experiment at 42 days after germination. Light intensities were 100-150 µE light intensity
in growth chamber and 5xPhilips Green power LED production module deep red/blue 120
LD [415 µmol/sec at distance of 40 cm] in grow rooms.
Generation of CRISPR Mutants
CRISPR/Cas9 constructs created using pHEE401E plasmid containing egg-cell specific
promotor (Wang et al., 2015b). Guide RNA (gRNA) designed using the online tool
CHOPCHOP (https://chopchop.rc.fas.harvard.edu/) (Labun et al., 2019). Target sequence

103
selected from list provided by CHOPCHOP program. Forward primer designed as ATTG
followed by 19bp from CHOPCHOP (making sure first bp is G) and reverse primer designed
as compliment of 19bp from CHOPCHOP followed by GTTT. gRNA oligo duplex then
annealed using annealing buffer solution with gRNA primers added (solution heated to 95°
C for 5 minutes and then allowed to cool to room temperature). Oligo duplex now ready to
be used in GreenGate reaction with pHEE401E plasmid. GreenGate product ready for
subsequent transformation of E. coli to lead to later transformation of Agrobacterium and
eventual floral dips. After floral dips, T1 seeds placed on 0.7% PA horizontal Hygromycin
plates for selection (covered in paper for first 5 days in growth chamber before being
exposed to regular light). Selected T1 plants then sequenced to check for mutations and
confirmed mutants transferred to soil for seed collection. T2 seeds then genotyped and
plants homozygous for mutation and lacking Cas9 gene selected. CRISPR derived mutant
line now ready for use.
5x Annealing Buffer: 5 M NaCl, 0.5 M EDTA, and 1 M Tris-HCL pH 7.5.
Oligo duplex solution: 10 µL of 100 µM forward primer, 10 µL of 100 µM reverse primer,
and 5 µL of 5x annealing buffer.
ROS Bust Experiment
Desired plant lines grown under short day conditions to prevent bolting until rosette stage
(20-40 DAG). 4 mm leaf disks collected from youngest fully matured sample leaves, placed
in sterile water, and covered with aluminum foil to equilibrate for at least 2 hours. After
equilibration, leaf disks transferred delicately using flat forceps to a 96 well plate (Perkin
Elmer 96 Flat Bottom White Polystyrene) with 1 leaf disk and 150 µL sterile water per well.
Plate covered with aluminum foil and put back in growth chamber or grow room overnight.
Next day, chemiluminescence and elicitor solutions prepared. Sample plate kept covered
while moving to room with plate reader and preparing experiment. All lights turned off
except for green light which was used for experiment set up beyond this point. Plates
uncovered and sterile water removed from first 4 rows of plate using micropipette (this was
done to keep the length between sample time points to ~60 seconds), being careful not to
damage the leaf disks. Next added 100 µL of the L-012 and HRP solution to each well of

104
the first 4 rows, and made sure the leaf disks are fully submerged (needed to push the leaf
disk down with a pipette tip and concluded it was alright if it floated back to the surface
after it was pushed down). Before starting the next step, made sure the plate reader was open
with the correct acquisition program loaded and ready to begin since as little delay as
possible between the next step and the beginning on sample acquisition was desired. Then
added 50 µL of the HRP elicitor solution to the first 4 sample well rows (being sure to use
a multichannel pipette for this step since wanted to begin recording sample results as fast as
possible and wanted all samples to be exposed to elicitors at roughly the same time) and
placed the uncovered plate in the plate reader. Began sample data acquisition (see plate
reader for protocol for program settings). After successful collection of data, repeated the
process starting from the removal of sterile water for the bottom 4 sample rows.
L-012 and HRP Solution: 0.75 µM L-012 and 15 µg/mL HRP in ddH2O.
Elicitor solution: 300 nM flg22 or elf18 in ddH2O.
Final solution concentrations: 0.5 µM L-012, 10 µg/mL HRP, and 100 nM flg22 or elf18 in
ddH2O.
Normalization of Root Length Data
Root length data normalized by comparison to control treatment for respective plant line.
Average root length of control group set to 100%, and all recorded root lengths converted
to percent by dividing them by the average control root length and multiplying by 100.
Plate Growth Inhibition Experiment
Experiments using Phyto-Agar Plates: Phyto-agar media prepared as usual. Media allowed
to cool after autoclaving to point where media was still liquid, but the bottle could be
handled without heat protective equipment. Elicitors then added to media under sterile
conditions and mixed. After this point plates poured as usual. After plates allowed to cool,
seeds germinated on the elicitor infused Phyto-agar plates after 2-3 days vernalization, and
roots measured 14 DAG.
Experiments using 48 well plates: Seeds germinated on Phyto-agar plates and allowed to
grow for 4-5 days after germination. Plants then transferred under sterile conditions to 48

105
well plates. One plant per well with 400 µL of liquid media per well. Media contained 0-
100 nM elf18 or flg22 elicitor. Plates sealed with Millipore sterile surgical tape and returned
to growth chamber. After 7-10 days the plates were removed from the growth chamber and
the fresh weights of the individual plants were recorded.
Experiments using 100 mL Erlenmeyer flasks: Seeds germinated on Phyto-agar plates and
allowed to grow for 4-5 days after germination. Plants then transferred under sterile
conditions to 100 mL Erlenmeyer flasks (10-30 per flask). Flasks then sealed with sterile
aluminum foil, being sure not to cut off gas flow completely, and placed in growth chamber
on Heidolph UNIMAX 2010 orbital shaker set to shake slowly. After 7-10 days the flasks
were removed from the growth chamber. Filter paper was first labeled using a pencil and
then weighed, making sure to have one filter per flask. After this, all plants from one flask
were placed on appropriately labeled filter paper. Plants on filter paper then placed in oven
at 60-70° C and allowed to dry overnight or until completely dry. After drying complete,
filters with plants were removed from oven and allowed to cool before dry mass was
recorded for each filter paper plant combination. Weight of filter was subtracted from final
combined weight to determine sample dry mass.
Data Analysis Using RStudio
Used RStudio Version 1.2.5019 © 2009-2019 RStudio, Inc.
FIJI (ImageJ)
Version: 2.0.0-rc-69/1.52p
Elicitor RT-qPCR Gene Impact Experiment
Seeds germinated on Phyto-agar plates and allowed to grow for 5 days after germination.
Plants then transferred to 100 mL Erlenmeyer flasks (30 per flask) containing 20 mL of
liquid ½ Murashige-Skooog (MS) media each. Then added 5 mL of liquid ½ MS media
containing 5x final elicitor concentration (regular ½ MS media with no elicitors for negative
controls) to each flask (making sure not to pour directly on the plants). Flasks then sealed
with aluminum foil, being sure not to cut off gas flow completely, and placed in growth

106
chamber on Heidolph UNIMAX 2010 orbital shaker set to shake slowly. After 1 hour,
plantlets removed from media and frozen together in liquid nitrogen. Process repeated for
all flasks, keeping different treatments separate. Samples then ready for RNA extraction,
cDNA generation, and RT-qPCR analysis.

107
References
Amano, Y., Tsubouchi, H., Shinohara, H., Ogawa, M., and Matsubayashi, Y. (2007). Tyrosine-sulfated glycopeptide involved in cellular proliferation and expansion in Arabidopsis. Proceedings of the National Academy of Sciences 104: 18333–18338.
Asai, T., Tena, G., Plotnikova, J., Willmann, M.R., Chiu, W.-L., Gomez-Gomez, L., Boller, T., Ausubel, F.M., and Sheen, J. (2002). MAP kinase signaling cascade in Arabidopsis innate immunity. Nature 415: 977–983.
Augustin, S. (2015). Structure-function analysis of the Arabidopsis thaliana Receptor-Like Protein 4 (AtRLP4). Master Thesis, Heidelberg University.
Bai, C., Sen, P., Hofmann, K., Ma, L., Goebl, M., Harper, J.W., and Elledge, S.J. (1996). SKP1 Connects Cell Cycle Regulators to the Ubiquitin Proteolysis Machinery through a Novel Motif, the F-Box. Cell 86: 263–274.
Berardini, T.Z., Reiser, L., Li, D., Mezheritsky, Y., Muller, R., Strait, E., and Huala, E. (2015). The arabidopsis information resource: Making and mining the “gold standard” annotated reference plant genome: Tair: Making and Mining the “Gold Standard” Plant Genome. genesis 53: 474–485.
Brady, S.M., Orlando, D.A., Lee, J.-Y., Wang, J.Y., Koch, J., Dinneny, J.R., Mace, D., Ohler, U., and Benfey, P.N. (2007). A High-Resolution Root Spatiotemporal Map Reveals Dominant Expression Patterns. Science 318: 801–806.
Bu, Q., Li, H., Zhao, Q., Jiang, H., Zhai, Q., Zhang, J., Wu, X., Sun, J., Xie, Q., Wang, D., and Li, C. (2009). The Arabidopsis RING Finger E3 Ligase RHA2a Is a Novel Positive Regulator of Abscisic Acid Signaling during Seed Germination and Early Seedling Development. Plant Physiol. 150: 463–481.
Burgh, A.M. van der, Postma, J., Robatzek, S., and Joosten, M.H.A.J. (2019). Kinase activity of SOBIR1 and BAK1 is required for immune signaling. Molecular Plant Pathology 20: 410–422.
Caesar, K., Elgass, K., Chen, Z., Huppenberger, P., Witthöft, J., Schleifenbaum, F., Blatt, M.R., Oecking, C., and Harter, K. (2011). A fast brassinolide-regulated response pathway in the plasma membrane of Arabidopsis thaliana: A BL-regulated plasma membrane response pathway. The Plant Journal 66: 528–540.
Chaiwanon, J. and Wang, Z.-Y. (2015). Spatiotemporal Brassinosteroid Signaling and Antagonism with Auxin Pattern Stem Cell Dynamics in Arabidopsis Roots. Current Biology 25: 1031–1042.
El-Brolosy, M.A. and Stainier, D.Y.R. (2017). Genetic compensation: A phenomenon in search of mechanisms. PLoS Genet 13: e1006780.

108
Fiers, M., Golemiec, E., Xu, J., Geest, L. van der, Heidstra, R., Stiekema, W., and Liu, C.-M. (2005). The 14–Amino Acid CLV3, CLE19, and CLE40 Peptides Trigger Consumption of the Root Meristem in Arabidopsis through a CLAVATA2-Dependent Pathway. The Plant Cell 17: 2542–2553.
Fritz-Laylin, L.K., Krishnamurthy, N., Tör, M., Sjölander, K.V., and Jones, J.D.G. (2005). Phylogenomic Analysis of the Receptor-Like Proteins of Rice and Arabidopsis. Plant Physiology 138: 611.
Garnelo Gómez, B. (2017). Phosphorylation of RLP44: Shifting between subcellular localization and receptor complexes. PhD Thesis, Heidelberg University.
Gómez-Gómez, L. and Boller, T. (2000). FLS2: An LRR Receptor–like Kinase Involved in the Perception of the Bacterial Elicitor Flagellin in Arabidopsis. Molecular Cell 5: 1003–1011.
Gurevich, V.V. and Gurevich, E.V. (2015). Analyzing the roles of multi-functional proteins in cells: the case of arrestins and GRKs. Critical reviews in biochemistry and molecular biology 50: 440.
Hartwig, T., Corvalan, C., Best, N.B., Budka, J.S., Zhu, J.-Y., Choe, S., and Schulz, B. (2012). Propiconazole Is a Specific and Accessible Brassinosteroid (BR) Biosynthesis Inhibitor for Arabidopsis and Maize. PLoS ONE 7: e36625.
He, Y., Zhou, J., Shan, L., and Meng, X. (2018). Plant cell surface receptor-mediated signaling – a common theme amid diversity. J Cell Sci 131: jcs209353.
Hillmer, R.A., Tsuda, K., Rallapalli, G., Asai, S., Truman, W., Papke, M.D., Sakakibara, H., Jones, J.D.G., Myers, C.L., and Katagiri, F. (2017). The highly buffered Arabidopsis immune signaling network conceals the functions of its components. PLoS Genet 13: e1006639.
Hohmann, U., Lau, K., and Hothorn, M. (2017). The Structural Basis of Ligand Perception and Signal Activation by Receptor Kinases. Annu. Rev. Plant Biol. 68: 109–137.
Holzwart, E. (2018). The role of RLP44 in cell wall signalling integration and vascular cell fate determination in Arabidopsis thaliana. PhD Thesis, Heidelberg University.
Holzwart, E., Huerta, A.I., Glöckner, N., Garnelo Gómez, B., Wanke, F., Augustin, S., Askani, J.C., Schürholz, A.-K., Harter, K., and Wolf, S. (2018). BRI1 controls vascular cell fate in the Arabidopsis root through RLP44 and phytosulfokine signaling. Proc Natl Acad Sci USA 115: 11838–11843.
Igarashi, D., Tsuda, K., and Katagiri, F. (2012). The peptide growth factor, phytosulfokine, attenuates pattern-triggered immunity: Attenuation of PTI by PSK. The Plant Journal 71: 194–204.

109
Jamieson, P.A., Shan, L., and He, P. (2018). Plant cell surface molecular cypher: Receptor-like proteins and their roles in immunity and development. Plant Science 274: 242–251.
Jeong, S., Trotochaud, A.E., and Clark, S.E. (1999). The Arabidopsis CLAVATA2 Gene Encodes a Receptor-like Protein Required for the Stability of the CLAVATA1 Receptor-like Kinase. The Plant Cell 11: 1925–1933.
de Jong, W.W., Zweers, A., and Cohen, L.H. (1978). Influence of single amino acid substitutions on electrophoretic mobility of sodium dodecyl sulfate-protein complexes. Biochemical and Biophysical Research Communications 82: 532–539.
Klepikova, A.V., Kasianov, A.S., Gerasimov, E.S., Logacheva, M.D., and Penin, A.A. (2016). A high resolution map of the Arabidopsis thaliana developmental transcriptome based on RNA-seq profiling. Plant J 88: 1058–1070.
Komori, R., Amano, Y., Ogawa-Ohnishi, M., and Matsubayashi, Y. (2009). Identification of tyrosylprotein sulfotransferase in Arabidopsis. Proceedings of the National Academy of Sciences 106: 15067–15072.
Kung, J.E. and Jura, N. (2016). Structural Basis for the Non-catalytic Functions of Protein Kinases. Structure 24: 7–24.
Kuroda, H., Yanagawa, Y., Takahashi, N., Horii, Y., and Matsui, M. (2012). A Comprehensive Analysis of Interaction and Localization of Arabidopsis SKP1-LIKE (ASK) and F-Box (FBX) Proteins. PLoS ONE 7: e50009.
Kutschmar, A., Rzewuski, G., Stührwohldt, N., Beemster, G.T.S., Inzé, D., and Sauter, M. (2009). PSK-α promotes root growth in Arabidopsis. New Phytologist 181: 820–831.
Labun, K., Montague, T.G., Krause, M., Torres Cleuren, Y.N., Tjeldnes, H., and Valen, E. (2019). CHOPCHOP v3: expanding the CRISPR web toolbox beyond genome editing. Nucleic Acids Research 47: W171–W174.
Ladwig, F., Dahlke, R.I., Stührwohldt, N., Hartmann, J., Harter, K., and Sauter, M. (2015). Phytosulfokine Regulates Growth in Arabidopsis through a Response Module at the Plasma Membrane That Includes CYCLIC NUCLEOTIDE-GATED CHANNEL17, H + -ATPase, and BAK1. Plant Cell 27: 1718–1729.
Lampropoulos, A., Sutikovic, Z., Wenzl, C., Maegele, I., Lohmann, J.U., and Forner, J. (2013). GreenGate - A Novel, Versatile, and Efficient Cloning System for Plant Transgenesis. PLoS ONE 8.
Lempe, J., Lachowiec, J., Sullivan, A.M., and Queitsch, C. (2013). Molecular mechanisms of robustness in plants. Current opinion in plant biology 16: 62.
Li, J. and Chory, J. (1997). A Putative Leucine-Rich Repeat Receptor Kinase Involved in Brassinosteroid Signal Transduction. Cell 90: 929–938.

110
Li, J. and Nam, K.H. (2002). Regulation of Brassinosteroid Signaling by a GSK3/SHAGGY-Like Kinase. Science 295: 1299–1301.
Li, J., Wen, J., Lease, K.A., Doke, J.T., Tax, F.E., and Walker, J.C. (2002). BAK1, an Arabidopsis LRR Receptor-like Protein Kinase, Interacts with BRI1 and Modulates Brassinosteroid Signaling. Cell 110: 213–222.
Liebrand, T.W.H., Berg, G.C.M. van den, Zhang, Z., Smit, P., Cordewener, J.H.G., America, A.H.P., Sklenar, J., Jones, A.M.E., Tameling, W.I.L., Robatzek, S., Thomma, B.P.H.J., and Joosten, M.H.A.J. (2013). Receptor-like kinase SOBIR1/EVR interacts with receptor-like proteins in plant immunity against fungal infection. PNAS 110: 10010–10015.
Lorbiecke, R. and Sauter, M. (2002). Comparative analysis of PSK peptide growth factor precursor homologs. Plant Science 163: 321–332.
Matsubayashi, Y., Ogawa, M., Kihara, H., Niwa, M., and Sakagami, Y. (2006). Disruption and Overexpression of Arabidopsis Phytosulfokine Receptor Gene Affects Cellular Longevity and Potential for Growth. Plant Physiol. 142: 45–53.
Matsubayashi, Y., Ogawa, M., Morita, A., and Sakagami, Y. (2002). An LRR Receptor Kinase Involved in Perception of a Peptide Plant Hormone, Phytosulfokine. Science 296: 1470–1472.
Matsubayashi, Y. and Sakagami, Y. (1996). Phytosulfokine, sulfated peptides that induce the proliferation of single mesophyll cells of Asparagus officinalis L. Proc. Natl. Acad. Sci. USA: 5.
Nam, K.H. and Li, J. (2002). BRI1/BAK1, a Receptor Kinase Pair Mediating Brassinosteroid Signaling. Cell 110: 203–212.
Pickart, C.M. (2001). Mechanisms Underlying Ubiquitination. Annu. Rev. Biochem. 70: 503–533.
Roux, M., Schwessinger, B., Albrecht, C., Chinchilla, D., Jones, A., Holton, N., Malinovsky, F.G., Tör, M., de Vries, S., and Zipfel, C. (2011). The Arabidopsis Leucine-Rich Repeat Receptor–Like Kinases BAK1/SERK3 and BKK1/SERK4 Are Required for Innate Immunity to Hemibiotrophic and Biotrophic Pathogens. Plant Cell 23: 2440–2455.
Santiago, J., Henzler, C., and Hothorn, M. (2013). Molecular Mechanism for Plant Steroid Receptor Activation by Somatic Embryogenesis Co-Receptor Kinases. Science 341: 889–892.
Sauter, M. (2015). Phytosulfokine peptide signalling. EXBOTJ 66: 5161–5169. Segonzac, C., Macho, A.P., Sanmartín, M., Ntoukakis, V., Sánchez‐Serrano, J.J., and
Zipfel, C. (2014). Negative control of BAK 1 by protein phosphatase 2A during plant innate immunity. EMBO J 33: 2069–2079.

111
Shi, Y., Mowery, R.A., Ashley, J., Hentz, M., Ramirez, A.J., Bilgicer, B., Slunt-Brown, H., Borchelt, D.R., and Shaw, B.F. (2012). Abnormal SDS-PAGE migration of cytosolic proteins can identify domains and mechanisms that control surfactant binding. Protein Sci 21: 1197–1209.
Shiu, S.-H. and Bleecker, A.B. (2003). Expansion of the Receptor-Like Kinase/Pelle Gene Family and Receptor-Like Proteins in Arabidopsis. Plant Physiol. 132: 530–543.
Shiu, S.-H. and Bleecker, A.B. (2001). Plant Receptor-Like Kinase Gene Family: Diversity, Function, and Signaling. Sci. STKE 2001: re22–re22.
Shpak, E.D., Lakeman, M.B., and Torii, K.U. (2003). Dominant-Negative Receptor Uncovers Redundancy in the Arabidopsis ERECTA Leucine-Rich Repeat Receptor–Like Kinase Signaling Pathway That Regulates Organ Shape. Plant Cell 15: 1095–1110.
Srivastava, R., Liu, J.-X., and Howell, S.H. (2008). Proteolytic processing of a precursor protein for a growth-promoting peptide by a subtilisin serine protease in Arabidopsis: Peptide hormone processing. The Plant Journal 56: 219–227.
Stone, S.L. (2014). The role of ubiquitin and the 26S proteasome in plant abiotic stress signaling. Front. Plant Sci. 5.
Stührwohldt, N., Dahlke, R.I., Steffens, B., Johnson, A., and Sauter, M. (2011). Phytosulfokine-α Controls Hypocotyl Length and Cell Expansion in Arabidopsis thaliana through Phytosulfokine Receptor 1. PLoS ONE 6.
Sun, Y. et al. (2010). Integration of Brassinosteroid Signal Transduction with the Transcription Network for Plant Growth Regulation in Arabidopsis. Developmental Cell 19: 765–777.
Szekeres, M., Németh, K., Koncz-Kálmán, Z., Mathur, J., Kauschmann, A., Altmann, T., Rédei, G.P., Nagy, F., Schell, J., and Koncz, C. (1996). Brassinosteroids Rescue the Deficiency of CYP90, a Cytochrome P450, Controlling Cell Elongation and De-etiolation in Arabidopsis. Cell 85: 171–182.
Tena, G., Boudsocq, M., and Sheen, J. (2011). Protein kinase signaling networks in plant innate immunity. Current Opinion in Plant Biology 14: 519–529.
Wang, G. et al. (2008). A Genome-Wide Functional Investigation into the Roles of Receptor-Like Proteins in Arabidopsis. Plant Physiol. 147: 503–517.
Wang, J., Li, H., Han, Z., Zhang, H., Wang, T., Lin, G., Chang, J., Yang, W., and Chai, J. (2015a). Allosteric receptor activation by the plant peptide hormone phytosulfokine. Nature 525: 265–268.
Wang, Z.-P., Xing, H.-L., Dong, L., Zhang, H.-Y., Han, C.-Y., Wang, X.-C., and Chen, Q.-J. (2015b). Egg cell-specific promoter-controlled CRISPR/Cas9

112
efficiently generates homozygous mutants for multiple target genes in Arabidopsis in a single generation. Genome Biol 16: 144.
Wang, Z.-Y., Nakano, T., Gendron, J., He, J., Chen, M., Vafeados, D., Yang, Y., Fujioka, S., Yoshida, S., Asami, T., and Chory, J. (2002). Nuclear-Localized BZR1 Mediates Brassinosteroid-Induced Growth and Feedback Suppression of Brassinosteroid Biosynthesis. Developmental Cell 2: 505–513.
Wolf, S. et al. (2014). A receptor-like protein mediates the response to pectin modification by activating brassinosteroid signaling. Proc Natl Acad Sci USA 111: 15261–15266.
Wolf, S., Mravec, J., Greiner, S., Mouille, G., and Höfte, H. (2012). Plant Cell Wall Homeostasis Is Mediated by Brassinosteroid Feedback Signaling. Current Biology 22: 1732–1737.
Wu, J., Liu, Z., Zhang, Z., Lv, Y., Yang, N., Zhang, G., Wu, M., Lv, S., Pan, L., Joosten, M.H.A.J., and Wang, G. (2016). Transcriptional regulation of receptor-like protein genes by environmental stresses and hormones and their overexpression activities in Arabidopsis thaliana. EXBOTJ 67: 3339–3351.
Yang, H., Matsubayashi, Y., Nakamura, K., and Sakagami, Y. (2001). Diversity of Arabidopsis Genes Encoding Precursors for Phytosulfokine, a Peptide Growth Factor. Plant Physiol. 127: 842–851.
Yin, Y., Wang, Z.-Y., Mora-Garcia, S., Li, J., Yoshida, S., Asami, T., and Chory, J. (2002). BES1 Accumulates in the Nucleus in Response to Brassinosteroids to Regulate Gene Expression and Promote Stem Elongation. Cell 109: 181–191.
Yu, X., Li, L., Zola, J., Aluru, M., Ye, H., Foudree, A., Guo, H., Anderson, S., Aluru, S., Liu, P., Rodermel, S., and Yin, Y. (2011). A brassinosteroid transcriptional network revealed by genome-wide identification of BESI target genes in Arabidopsis thaliana: Brassinosteroid transcriptional network. The Plant Journal 65: 634–646.
Zhang, W., Fraiture, M., Kolb, D., Löffelhardt, B., Desaki, Y., Boutrot, F.F.G., Tör, M., Zipfel, C., Gust, A.A., and Brunner, F. (2013). Arabidopsis RECEPTOR-LIKE PROTEIN30 and Receptor-Like Kinase SUPPRESSOR OF BIR1-1/EVERSHED Mediate Innate Immunity to Necrotrophic Fungi. The Plant Cell 25: 4227–4241.
Zheng, N. and Shabek, N. (2017). Ubiquitin Ligases: Structure, Function, and Regulation. Annu. Rev. Biochem. 86: 129–157.
Zipfel, C., Kunze, G., Chinchilla, D., Caniard, A., Jones, J.D.G., Boller, T., and Felix, G. (2006). Perception of the Bacterial PAMP EF-Tu by the Receptor EFR Restricts Agrobacterium-Mediated Transformation. Cell 125: 749–760.

113
Zipfel, C., Robatzek, S., Navarro, L., Oakeley, E.J., Jones, J.D.G., Felix, G., and Boller, T. (2004). Bacterial disease resistance in Arabidopsis through flagellin perception. Nature 428: 764–767.

114
Appendix Appendix 1: Table containing PCR primers used in the experiments of this thesis.
Primer Set: Forward Sequence: Reverse Sequence: Function:PS1 CGTTGCAGCAGTTTTACTTAGC GACGAGCCACTGAAGCAAG RT-qPCR of PSKL1PS2 GCGTGCACCTAAAGAGATGG GCGGTTTTGGAGGATGTGTT RT-qPCR of PSKL1
PSKL1 gRNA 1 ATTGGACTCTCCAGAGCAAATCAA AAACTTGATTTGCTCTGGAGAGTC PSKL1 CRISPR/CAS9 guide sequencePSKL1 gRNA 2 ATTGGTAACTTTAGGTGCACGCGG AAACCCGCGTGCACCTAAAGTTAC PSKL1 CRISPR/CAS9 guide sequence
PSKL1 CRISPR Confirmation AACATTCTTATCGTTGCAGCAG AACCAAACTCTCCATAGATGCAA Sequencing of CRISPR/CAS9 targeted DNAPSKL1 sequencing CGCAACGCAATTAATGTGAG CAGATTGTACTGAGAGTGCACC Sequencing of cloned PSKL1 gene
RLP44 TDNA Genoyping Gene Primers ACCTCACTTCTGCTAAAACGC AGACCTAATTGCTGCGGAATC Genotyping of RLP44 TDNA line SAIL_596_E12RLP44 TDNA Genoyping Insert Primer ATAACCAATCTCGATACAC - Genotyping of RLP44 TDNA line SAIL_596_E12
BSA Primer: CER448567 ATAGAAAGGTTTGAGGGGGC TGCGAAGAACCACTAAACCC BSA Primer 1 (Chromosome 1)BSA Primer: F9L1 CTCGGAAATTCTTAGCTTTC TTATAACTTGCCCAAAGCGAA BSA Primer 2 (Chromosome 1)
BSA Primer: F1K23ind38 GGATTGAACATAGGGAAGGGG GATCTGTATCTGAAACCTGGG BSA Primer 3 (Chromosome 1)BSA Primer: F6D8ind94 CCGTTACCCCCATACGAACG TCGTGAGGTTATGCCGATCC BSA Primer 4 (Chromosome 1)
BSA Primer: F5I14 CTGCCTGAAATTGTCGAAAC GGCATCACAGTTCTGATTCC BSA Primer 5 (Chromosome 1)BSA Primer: CER466780 GAACCCTTATAATATGGCTGGC GGAAGTATTCCC AAGACAAGG BSA Primer 6 (Chromosome 2)BSA Primer: MSAT2-36 GATCTGCCTCTTGATCAGC CCAAGAACTCAAAACCGTT BSA Primer 7 (Chromosome 2)BSA Primer: F3N11 GTTAAAGCGAGGACGATTGG AGATACTGTCGCCATCAAGG BSA Primer 8 (Chromosome 2)BSA Primer: MSAT2-9 TAAAAGAGTCCCTCGTAAAG GTTGTTGTTGTGGCATT BSA Primer 9 (Chromosome 2)BSA Primer: nga172 AGCTGCTTCCTTATAGCGTCC CATCCGAATGCCATTGTTC BSA Primer 10 (Chromosome 3)
BSA Primer: CER455386 CTCTTTTGGCTCGGACAAG GTTGTAATCGGGAAAATGC BSA Primer 11 (Chromosome 3)BSA Primer: CER455914 GGAGCAGAGAAAGAGAC GAGGAAGGACAACATGGC BSA Primer 12 (Chromosome 3)
BSA Primer: CER456071-Indel-35 AGCCATAGGTAATGTCCACG CTCGCGGATGAGTATCATCC BSA Primer 13 (Chromosome 3)BSA Primer: CER470172 GTAAAACTCCTCCTCTGGGG TGTAATCGTGGCGGAACGGG BSA Primer 14 (Chromosome 3)
BSA Primer: nga8 GAGGGCAAATCTTTATTTCGG TGGCTTTCGTTTATAAACATCC BSA Primer 15 (Chromosome 4)BSA Primer: FCA0ind25 AAGCCAACTATTGCCAAGGG TCACTGCCCTTTACTCCGGT BSA Primer 16 (Chromosome 4)BSA Primer: F7J7-47 TGGTGAAGAGCTTAGTTGATGA TCACTAGATATCTCTAGTGGCT BSA Primer 17 (Chromosome 4)
BSA Primer: CER451534 AGCTACGGTGGAGTGTAATTTCGT GCTGATACTTGCTTTCGCTTTGCAG BSA Primer 18 (Chromosome 4)BSA Primer: CER459444 AGTAGCATCGTAGCTCCTAGG GTTGTATACGTGCACGTTCCC BSA Primer 19 (Chromosome 4)BSA Primer: nga151 GTTTTGGGAAGTTTTGCTGG CAGTCTAAAAGCGAGAGTATGATG BSA Primer 20 (Chromosome 5)BSA Primer: nga139 GGTTTCGTTTCACTATCCAGG AGAGCTACCAGATCCGATGG BSA Primer 21 (Chromosome 5)
BSA Primer: T26D22-IND52/CER459812 TCCCACGAAGAGAGAAGTGC CTATTTGCTTATGAAGGTGTCC BSA Primer 22 (Chromosome 5)BSA Primer: CER456772 CCATGTGACATGCACTTACAC ACCATTCTCTACCACTCCAC BSA Primer 23 (Chromosome 5)
BSA Primer: K6M13ind33/CER454758 ATAGATGAGATCCACTTGCC ACAAACTGTTGCTGTGGGAG BSA Primer 24 (Chromosome 5)BSA Primer: MBK5ind35/CER455203 ATTCTCGGACCAGGCTTCAT AAAGAACAGCTACTGCGTGC BSA Primer 25 (Chromosome 5)
RLP46 RT-qPCR TAGGTAGTCTTGTCGAACTACTG TTGAGCTTCGTTAACCGTGA RT-qPCR of RLP46FRK1 RT-qPCR ATCTTCGCTTGGAGCTTCTC TGCAGCGCAAGGACTAGAG RT-qPCR of FRK1NHL10 RT-qPCR TTCCTGTCCGTAACCCAAAC CCCTCGTAGTAGGCATGAGC RT-qPCR of NHL10RLP46 gRNA ATTGGTCAAGGAGAACAATTCATG AAACCATGAATTGTTCTCCTTGAC RLP46 CRISPR/CAS9 guide sequence
RLP46 CRISPR Confirmation ATGGCTACGCGTGACATGTAAC ATATCGAGCCACTCAAGGTATG Sequencing of CRISPR/CAS9 targeted DNARLP46 Sequencing 1 CAGAACAATTTCTTGTCTTC - Sequencing of cloned RLP46 geneRLP46 Sequencing 2 TTGTACTATCAAGGAACAAC - Sequencing of cloned RLP46 geneRLP46 Sequencing 3 CTCTCTGAGAACAATCTTGATG - Sequencing of cloned RLP46 geneRLP46 Sequencing 4 CCTAAAGGTTTTAAATCTTTC - Sequencing of cloned RLP46 gene
CID4 gRNA ATTGGAAGATTGCGAGAGAGATCG AAACCGATCTCTCTCGCAATCTTC CID4 CRISPR/CAS9 guide sequenceCID4 CRISPR Confirmation TGGATTTCCACTCAAAAGAGGT TGAAATCAAACCCCCAAATTAC Sequencing of CRISPR/CAS9 targeted DNA
UPL4 gRNA ATTGGCACTCTTAAGTTCTGATAG AAACCTATCAGAACTTAAGAGTGC UPL4 CRISPR/CAS9 guide sequenceUPL4 CRISPR Confirmation TAGTAGCACTACAGGTTGCGGA TCCAAAGAAACCCTCCTTGATA Sequencing of CRISPR/CAS9 targeted DNA
F-Box/RNI Like gRNA ATTGGAACAGAGGAGAGGATATGG AAACCCATATCCTCTCCTCTGTTC F-Box/RNI Like CRISPR/CAS9 guide sequenceF-Box/RNI Like CRISPR Confirmation ATACAGAAAGACAGCGTCTCCG GATGCAGCCATTAACAGAATCA Sequencing of CRISPR/CAS9 targeted DNA
F-Box/RNI Like TDNA Genoyping Gene Primers ACTGGCGATTCAATCGACGG AACAGGTCTCACTGACTATCGTTGAGGGAAAGTGTTG Genotyping of F-Box/RNI Like TDNA line SALK 01956F-Box/RNI Like TDNA Genoyping Insert Primer ATTTTGCCGATTTCGGAAC - Genotyping of F-Box/RNI Like TDNA line SALK 01956
F-Box/RNI Like sequencing 1 GAAGCTTTCACTGGAGTCTCG - Sequencing of cloned F-Box/RNI Like geneF-Box/RNI Like sequencing 2 ATTACCATGTAGTTTAGTTG - Sequencing of cloned F-Box/RNI Like gene
CYP77A9 gRNA ATTGGGCGATAGAGTGGGGAATCG AAACCGATTCCCCACTCTATCGCC CYP77A9 CRISPR/CAS9 guide sequenceCYP77A9 CRISPR Confirmation TCAGAGTTGATGGTCGTGAAAC GGCCGTAGATGTTTCTCATCTC Sequencing of CRISPR/CAS9 targeted DNA
UMAMIT9 gRNA ATTGGGGATAGTGATGAAGAAAAG AAACCTTTTCTTCATCACTATCCC UMAMIT9 CRISPR/CAS9 guide sequenceUMAMIT9 CRISPR Confirmation CAAGCTCTAAACCCTACTTCGC AAGAAAGCAAAGGGTGCAATAA Sequencing of CRISPR/CAS9 targeted DNA
ABCG6 gRNA ATTGGGAAAAGCAGAATCGGATCG AAACCGATCCGATTCTGCTTTTCC ABCG6 CRISPR/CAS9 guide sequenceABCG6 CRISPR Confirmation GAAGCCTTTCGAAATCAAAGAA CTATGAGTTGTTGTGGTCGCTC Sequencing of CRISPR/CAS9 targeted DNA
GreenGate Sequencing Primer 1 CATCAGGGATTATACAAGGCC - Sequencing of GreenGate cloning constructsGreenGate Sequencing Primer 2 GTATTCAGTCGACTGGTACCAAC - Sequencing of GreenGate cloning constructsGreenGate Sequencing Primer 3 ACCTCTCGGGCTTCTGG - Sequencing of GreenGate cloning constructsGreenGate Sequencing Primer 4 CGATTTTTGTGATGCTCGCT - Sequencing of GreenGate cloning constructsGreenGate Sequencing Primer 5 TTGGTACCAGTCGACTGAATAC - Sequencing of GreenGate cloning constructs

115
Appendix 2: Uncropped Western Blot image from figure 36 section A.
RLP46:GFP RLP44:GFP GFP:LTI6B
40kDa55kDa
70kDa
α-HA
100kDa
130kDa
170kDa
α-GFPα-GFP α-GFP
α-HA α-HA
35kDa
40kDa55kDa
70kDa100kDa
130kDa
170kDa
35kDa
40kDa55kDa
70kDa
100kDa
130kDa
170kDa
35kDa
40kDa55kDa
70kDa
100kDa
130kDa
170kDa
40kDa55kDa
70kDa
100kDa
130kDa
170kDa
40kDa55kDa
70kDa100kDa
130kDa170kDa
35kDa
SOBIR1:HA BAK1:HACo-IP Co-IP
SOBIR1:HA BAK1:HAInput Input
SOBIR1:HA BAK1:HACo-IP Co-IP
SOBIR1:HA BAK1:HAInput Input
SOBIR1:HA BAK1:HACo-IP Co-IP
SOBIR1:HA BAK1:HAInput Input
SOBIR1:HA BAK1:HACo-IP Co-IP
SOBIR1:HA BAK1:HAInput Input
SOBIR1:HA BAK1:HACo-IP Co-IP
SOBIR1:HA BAK1:HAInput Input
SOBIR1:HA BAK1:HACo-IP Co-IP
SOBIR1:HA BAK1:HAInput Input

116
Appendix 3: Uncropped Western Blot image from figure 36 section B.
RLP46:GFP RLP44:GFP GFP:LTI6B
α-HA
α-GFPα-GFP α-GFP
α-HA α-HA
40kDa55kDa
70kDa
100kDa
130kDa
170kDa
35kDa
40kDa55kDa
70kDa
100kDa
130kDa
170kDa
40kDa55kDa
70kDa
100kDa
130kDa
170kDa
40kDa55kDa
70kDa100kDa
130kDa170kDa
35kDa
SOBIR1:HA BAK1:HACo-IP Co-IP
SOBIR1:HA BAK1:HAInput Input
SOBIR1:HA BAK1:HACo-IP Co-IP
SOBIR1:HA BAK1:HAInput Input
SOBIR1:HA BAK1:HACo-IP Co-IP
SOBIR1:HA BAK1:HAInput Input
SOBIR1:HA BAK1:HACo-IP Co-IP
SOBIR1:HA BAK1:HAInput Input

117
Appendix 4: Uncropped Western Blot image from figure 36 section C.
Appendix 5: Uncropped Western Blot image from figure 36 section D.
40kDa55kDa
70kDa
100kDa
130kDa
170kDa
35kDa
α-GFP
Co-IP Input
RLP46:GFP RLP44:GFP GFP:LTI6B RLP46:GFP RLP44:GFP GFP:LTI6BSOBIR1:HA BAK1:HA SOBIR1:HA BAK1:HA SOBIR1:HA BAK1:HA SOBIR1:HA BAK1:HA SOBIR1:HA BAK1:HA SOBIR1:HA BAK1:HA
70kDa
100kDa
130kDa
170kDa
α-GFP
RLP46:GFP RLP44:GFP GFP:LTI6BSOBIR1:HA BAK1:HA SOBIR1:HA BAK1:HA SOBIR1:HA BAK1:HA
40kDa55kDa
70kDa
100kDa
130kDa
170kDa
35kDa
α-HA
RLP46:GFP RLP44:GFP GFP:LTI6BSOBIR1:HA BAK1:HA SOBIR1:HA BAK1:HA SOBIR1:HA BAK1:HA
RLP46:GFP RLP44:GFP GFP:LTI6BSOBIR1:HA BAK1:HA SOBIR1:HA BAK1:HA SOBIR1:HA BAK1:HA
Co-IP Input Input

118
Appendix 6: Complete Tukey HSD test results from figure 7. pskl1 mutant lines showed a significant difference in their response to PSK treatment as compared to the WT control (p value of 0.002 AND 6.1x10⁻⁶ respectively), however only pskl1-058 showed a significant response to PSK (p value of 4.8x10⁻⁵), which contradicts literary sources on Col-0 response (Kutschmar et al., 2009). N of 94, 93, 60, 77, 58, and 81 respectively. Data combined from 3 iterations of experiment.

119
Acknowledgments I thank all of the many colleagues and mentors that have helped me along the way to this
moment. Without your support and instruction, I would not be the person I am today.
Dr. Sebastian Wolf, thank you for providing me this opportunity and being a great mentor.
Prof. Dr. Karin Schumacher, thank you for accepting me into the master program in the first
place.
Nabila, Polo, Rachel, and Tobi, thank you for always being rays of sunshine in the lab and
good friends outside of it.
The Wolf group, thank you for being a wonderful set of colleagues to spend the last few
years with.
HBIGS, thank you for accepting me into this program, and thank you all of COS for being
the best institute a guy could hope to work in.
I also thank my wonderful family for everything they have done for and with me over the
years. I could not have asked for a better sister or set of parents and your support has been
the foundation of all my accomplishments.
To all my friends, especially Brian, Canaan, Geoff, and Kevin, thank you for always being
there for me and always encouraging me to strive for what I believe in.
And lastly, thank you for everything Nora, you are an endless source of wonder. Even if
coming to Germany had only resulted in meeting you it would still be the best decision I
ever made. You inspire me to be the best person I can be.