
I/V Curve studies of the control of a K + transporter in Nitella by temperature
13
J. Membrane Biol. 98, 1-13 tl987) The Journal of Membrane Biology Springer-Verlag New York Inc. 1987 1~V-Curve Studies of the Control of a K + Transporter in Nitella by Temperature Ulf-Peter Hansen and Joachim Fisahn Institut for Angewandte Physik, Neue Universit~t, 2300 Kiel, Federal Republic of Germany Summary. In Nitella, current-voltage relationships were mea- sured at different temperatures ranging from 5 to 25~ Sets of these I/V curves were subject to curve fitting on the basis of a cyclic reaction scheme (Class I model). Different hypotheses of the mode of action of temperature on the I/V curve were tested, including changes in reaction constants in the transport cycle and deactivation of transport molecules. It was found that models assuming an influence of temperature on pairs of rate constants of the transport cycle gave very bad fits. Good fits were obtained with models implying that temperature influences the number of active transporters. The lazy-state model (the exchange of an inactive state with a state N3 in the transport cycle is influenced by temperature) gave a slightly better fit than the assumption of an unspecific inactivation (independent of the state of the trans- port molecule). According to the lazy-state analysis, the inactive state is kinetically closer to No, the state in which the transport molecule is open to the outside substrate than to Ni, the state in which it is open to the inside substrate. The two inactivation models imply that temperature does not act directly on the prop- erties of the plasmamembrane, but that temperature-sensitive metabolic processes in the cell send signals which control the activation and deactivation of the transporter. Key Words control curve fitting I/V curves K + trans- porter Nitella lazy state, reaction-kinetic model - temperature Introduction The occurrence of oscillations (Fisahn, Mikschl & Hansen, 1986) revealed the involvement of control processes in the activation and deactivation of membrane transporters. Further evidence for the importance of these control processes was obtained from the analysis of the temperature effect on mem- brane potential and on resistance (Fisahn & Han- sen, 1986). An estimate of the nature of the temperature- induced changes can be obtained from what may be called the RT/F component. All equations of the electrical characteristics of membrane transport start with the factor RT/F. This factor introduces an obvious temperature dependence, the RT/F compo- nent. In the investigations of Fisahn and Hansen (1986), the responses to fast changes in temperature (shorter than 1 sec) obtained the values predicted by the RT/F component. However, slow changes caused much greater signals. Either of these fea- tures, the magnitude of the responses or the occur- rence of slow time constants (20 sec to 10 min) indi- cates that transport activity is subject to control by signals from other temperature-sensitive functional units of the cell. In the case of the temperature-induced changes in membrane potential, which are assigned to the electrogenic H + pump, the time constants obtained from the kinetic analysis were found to be equal to those of the light-induced changes in membrane po- tential. Consequent upon this, the statement was obtained that the temperature effects on photosyn- thesis and on cytoplasmic pH regulation, and not the temperature effect on this transporter itself, controlled the activity of the electrogenic pump. Also, the biochemical mechanism related to the time constant of the temperature action on resis- tance which is assigned to a K + channel, seems to be located in the chloroplasts as seen from recent (unpublished) studies of Susanne Stein in our labo- ratory. She found that the time constants of the temperature effect on resistance (and on potential) are very sensitive to light intensity. This implies that the reactions sending the signal to the K + chan- nel "see" the light, i.e., the concentrations of the involved reactants vary strongly with light inten- sity. Thus, also in the case of the temperature effect on resistance the involvement of control mecha- nisms rather than a direct effect of temperature has to be assumed. The question which could not be answered in the preceding paper is that of the mechanism by means of which the signals from the temperature- modulated metabolic processes manage to control transport activity. Two different modes can be imagined: slowing down of the reactions in the transport cycle (catalytic effect) or complete deacti- vation of some transport molecules.
-
Upload
independent -
Category
Documents
-
view
4 -
download
0
Transcript of I/V Curve studies of the control of a K + transporter in Nitella by temperature
J. Membrane Biol. 98, 1-13 tl987) The Journal of
Membrane Biology �9 Springer-Verlag New York Inc. 1987
1~V-Curve Studies of the Control of a K + Transporter in Nitella by Temperature
Ulf-Peter Hansen and Joachim Fisahn Institut for Angewandte Physik, Neue Universit~t, 2300 Kiel, Federal Republic of Germany
S u m m a r y . In Nitella, current-voltage relationships were mea- sured at different temperatures ranging from 5 to 25~ Sets of these I /V curves were subject to curve fitting on the basis of a cyclic reaction scheme (Class I model). Different hypotheses of the mode of action of temperature on the I /V curve were tested, including changes in reaction constants in the transport cycle and deactivation of transport molecules. It was found that models assuming an influence of temperature on pairs of rate constants of the transport cycle gave very bad fits. Good fits were obtained with models implying that temperature influences the number of active transporters. The lazy-state model (the exchange of an inactive state with a state N3 in the transport cycle is influenced by temperature) gave a slightly better fit than the assumption of an unspecific inactivation (independent of the state of the trans- port molecule). According to the lazy-state analysis, the inactive state is kinetically closer to No, the state in which the transport molecule is open to the outside substrate than to Ni, the state in which it is open to the inside substrate. The two inactivation models imply that temperature does not act directly on the prop- erties of the plasmamembrane, but that temperature-sensitive metabolic processes in the cell send signals which control the activation and deactivation of the transporter.
K e y W o r d s c o n t r o l �9 curve fitting �9 I /V curves �9 K + trans- porter �9 Nitella �9 lazy state, reaction-kinetic model - temperature
Introduction
The occurrence of oscillations (Fisahn, Mikschl & Hansen, 1986) revealed the involvement of control processes in the activation and deactivation of membrane transporters. Further evidence for the importance of these control processes was obtained from the analysis of the temperature effect on mem- brane potential and on resistance (Fisahn & Han- sen, 1986).
An estimate of the nature of the temperature- induced changes can be obtained from what may be called the RT/F component. All equations of the electrical characteristics of membrane transport start with the factor RT/F. This factor introduces an obvious temperature dependence, the RT/F compo- nent. In the investigations of Fisahn and Hansen
(1986), the responses to fast changes in temperature (shorter than 1 sec) obtained the values predicted by the RT/F component. However, slow changes caused much greater signals. Either of these fea- tures, the magnitude of the responses or the occur- rence of slow time constants (20 sec to 10 min) indi- cates that transport activity is subject to control by signals from other temperature-sensitive functional units of the cell.
In the case of the temperature-induced changes in membrane potential, which are assigned to the electrogenic H + pump, the time constants obtained from the kinetic analysis were found to be equal to those of the light-induced changes in membrane po- tential. Consequent upon this, the statement was obtained that the temperature effects on photosyn- thesis and on cytoplasmic pH regulation, and not the temperature effect on this transporter itself, controlled the activity of the electrogenic pump.
Also, the biochemical mechanism related to the time constant of the temperature action on resis- tance which is assigned to a K + channel, seems to be located in the chloroplasts as seen from recent (unpublished) studies of Susanne Stein in our labo- ratory. She found that the time constants of the temperature effect on resistance (and on potential) are very sensitive to light intensity. This implies that the reactions sending the signal to the K + chan- nel "see" the light, i.e., the concentrations of the involved reactants vary strongly with light inten- sity. Thus, also in the case of the temperature effect on resistance the involvement of control mecha- nisms rather than a direct effect of temperature has to be assumed.
The question which could not be answered in the preceding paper is that of the mechanism by means of which the signals from the temperature- modulated metabolic processes manage to control transport activity. Two different modes can be imagined: slowing down of the reactions in the transport cycle (catalytic effect) or complete deacti- vation of some transport molecules.
2 U.P. Hansen and J. Fisahn: Control of K ~ Transport
Models and evidence for the control of trans- port activity by transitions into and out of an inac- tive (lazy) state have been obtained from the study of the temporal behavior of membrane transport. Hansen, Tittor and Gradmann (1983) calculated the influence of the exchange with the "lazy state" on transport activity. Warncke and Lindemann (1985) explained the action of amiloride on a Na + channel in toad urinary bladder by the transition of the mole- cule into such a lazy state (Lindemann, 1986a,b). Armstrong and Bezanilla (1977) concluded the exis- tence of several closed states of the Na + channel in nerve cells from the temporal behavior of gating currents.
In this paper it is shown that a distinction be- tween the different models of transport control can be based on the study of the behavior of steady- state current-voltage relationships (//V curves). Ac- cording to the findings of Fisahn and Hansen (1986) and of Fisahn et al. (1986b), there are two trans- porters in Nitella which can be considered for such an analysis, the H + pump and the K + channel. The H + pump in our cells has a reversal potential of about -450 mV, as concluded from the high impe- dance (Fisahn et al., 1986b, Fisahn & Hansen, 1986) and from unpublished I/V curve measurements. This is in line with findings of Beilby (1984) and Lucas (1982) who assigned a stoichiometry of 1 H+/ ATP to the H + pump in Chara, and in contrast to the findings of Kishimoto et al. (1984), who came to the conclusion that the stoichiometry is 2. Thus, only a small part of the pump I/V curve is accessible in the "voltage-window" from -450 to +200 mV.
The situation is more favorable in the case of the K + transporter. In a previous paper (Fisahn, Hansen & Gradmann, 1986) it was shown that the K + transporter in Nitella can be described by a Class-I model (Hansen et al., 1981). This finding was a surprise to us, as we believed that the Class-I mechanisms were restricted to electrogenic pumps and to cotransporters. However, prior to that inves- tigation, Gradmann, Klieber and Hansen (1987) re- alized tha t / /V curves of a single K + channel from patch-clamp experiments on protoplasts of Vicia faba (Schroeder, Hedrich & Fernandez, 1984) could be described by the Class-I model. In addi- tion, saturation regions of t h e / / V curves of a K + transporter indicating the involvement of cyclic Class-I transporters were found in patch-clamp studies of protoplasmic droplets of Chara (Lt~hring, 1986) and of Acetabularia (Bertl & Gradmann, 1986). The major part of the / /V curves of this trans- porter is in the accessible voltage window.
These findings encouraged us to make use of the temperature effect for the study of the mecha- nism controlling the activity of a transporter. A the- ory on which such an analysis can be based was
published by Hansen et al. (1983). In order to ex- plain peculiarities of the electrical impedance of bi- ological membranes, two models were proposed. One of them, the so-called Class-I model B, the lazy-state model, deals with the activation and de- activation of membrane transport by the exchange of the transport cycle with an inactive (lazy) state L.
Materials and Methods
The setup and the experimental procedures are similar to those described in previous papers (Fisahn & Hansen, 1986; Fisahn et al., 1986a,b). Briefly, Nitellaflexilis was purchased from R. Kiel in Frankfurt and kept in APW (0.1 mol m -3 KCI, 1.0 mol m -3 NaC1, 0.5 mol m 3 CaCI2, no buffer) in a refrigerator at 10~ at a light intensity of 5 W m -2 (16 hr �9 d-~). pH was adjusted by small amounts of HCI, when the pH-meter showed deviations of 0.5 pH units. Experiments were performed in 10 molm -3 KCI, be- cause Fisahn et al. (1986a) have shown that under these condi- tions the K + transporter with saturating I /V curves dominates the electrical characteristics of the membrane.
I/V-curve runs in the dark at high outside KC1, as necessary for bringing the cell in a state which shows the original I /V curves of the channel (see Discussion below) provide a serious stress for the cells (Beilby, 1986a; Fisahn et al., 1986a). As long lifetimes are required for a series of experiments at different temperatures, cells of good health were required. Thus, point- clamp of intact cells was applied. Short cells (2 cm length with a diameter of 0.5 mm) were selected in order to keep the cable problems small.
The cable problems could have been avoided by using sin- gle membrane samples (Hirono & Mitsui, 1983; Beilby & Blatt, in preparation), or air gaps (Sokolik & Yurin, 1986), or a central current electrode (Beilby, 1984). However, these techniques might have increased the health problem. We regarded the cable problem to be less serious because of three reasons. 1. The I /V curves with saturation regions are less sensitive to the cable problem, because in the saturation region, the current does not depend on the membrane potential. Consequently, the value of the current at the ends of the cell is not influenced by the longitu- dinal decay of the membrane potential. 2. The cable problems cannot perturbate the symmetry of the temperature effect on the I /V curves which is the crucial feature for the statement obtained in this paper. 3. V. Delfs in our laboratory installed the cable- correction program suggested by Smith (1984) on a personal computer. The calculations based on a longitudinal resistance of 10 Ml)/m showed that the "real" current was higher than the input current by about 15% in the experiments at 25~ and by about 7% in those at 5~ The curve shapes did not change. The results of these calculations verified that the two features men- tioned above prevented changes in the basic behavior of the curves.
The setup for temperature regulation is described by Fisahn and Hansen (1986). The bathing medium (10 mol m 3) flowed through a cooler and then through a heater which set the temper- atures to a desired value between 5 and 25~ Light intensity was zero in the temperature experiments.
I /V curves (current-voltage relationships) were measured under voltage clamp. Two electrodes were inserted into the mid- dle of the cell. By means of a relay in the tip of the preamplifiers the electrode could be connected to the FET-OP 3140 (RCA) for the measurement of membrane potential, or via 10 kfl to the output of the clamp amplifier for current injection during the
U.P. Hansen and J. Fisahn: Control of K' Transport 3
V - " -
_
10
1 5 ~ 2 0 ~ 25
N 2 T
- " - V N 3
N~ T
i ~tA
- 400 -200 /~.xK~ I . ~ . S ~ . ~ A ~ A X / q p +
A X X d 0 ~3 ~*
x . • 2 1 5 ~ ~,.= ~ /
.o.O o o. U2 y
O O la
4 . - + + + +
- 20 . +.+
.+ o-o-~-g #+ . 0 ~ _ 0 o -
~%0"~ 0 ~ 0 /-U.o "o • x
+ 13.0 ..~.C~.- X~
- -20
200 I
v
V mY
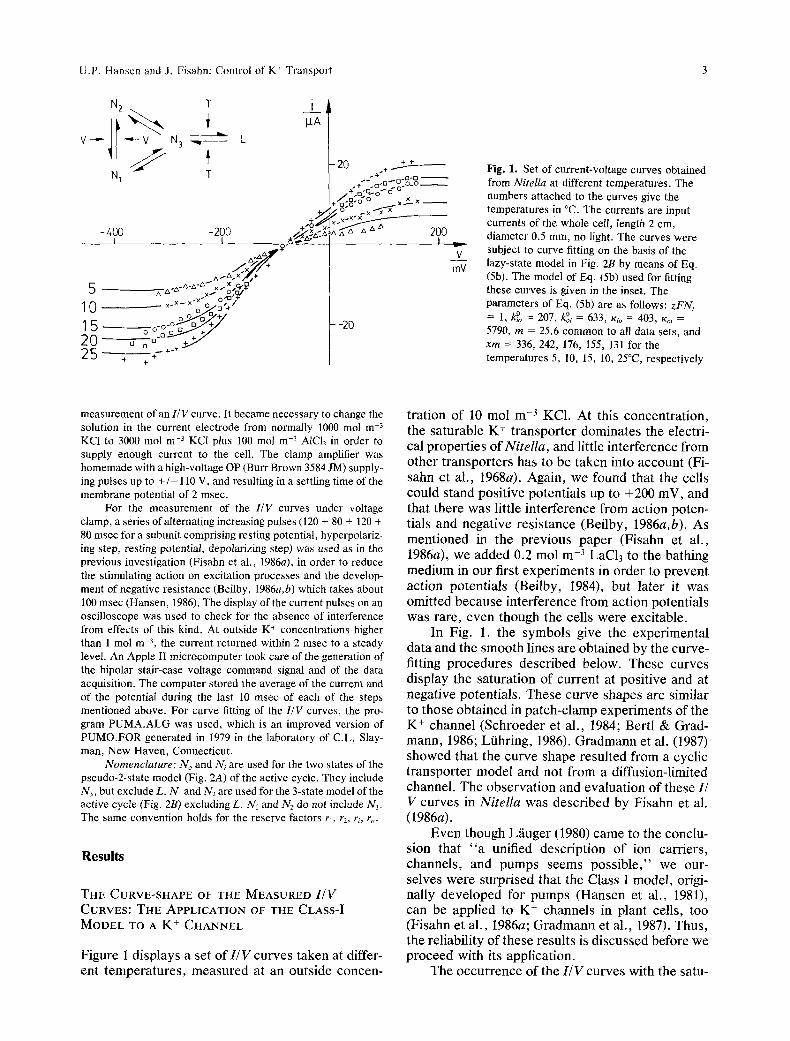
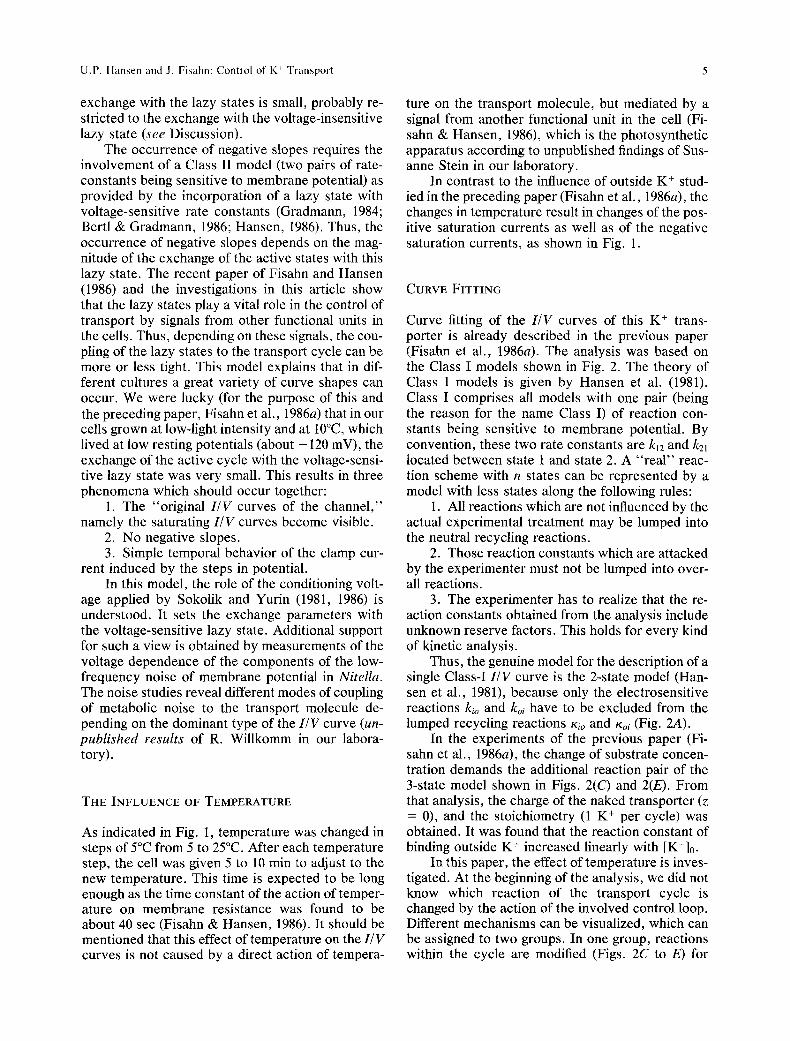
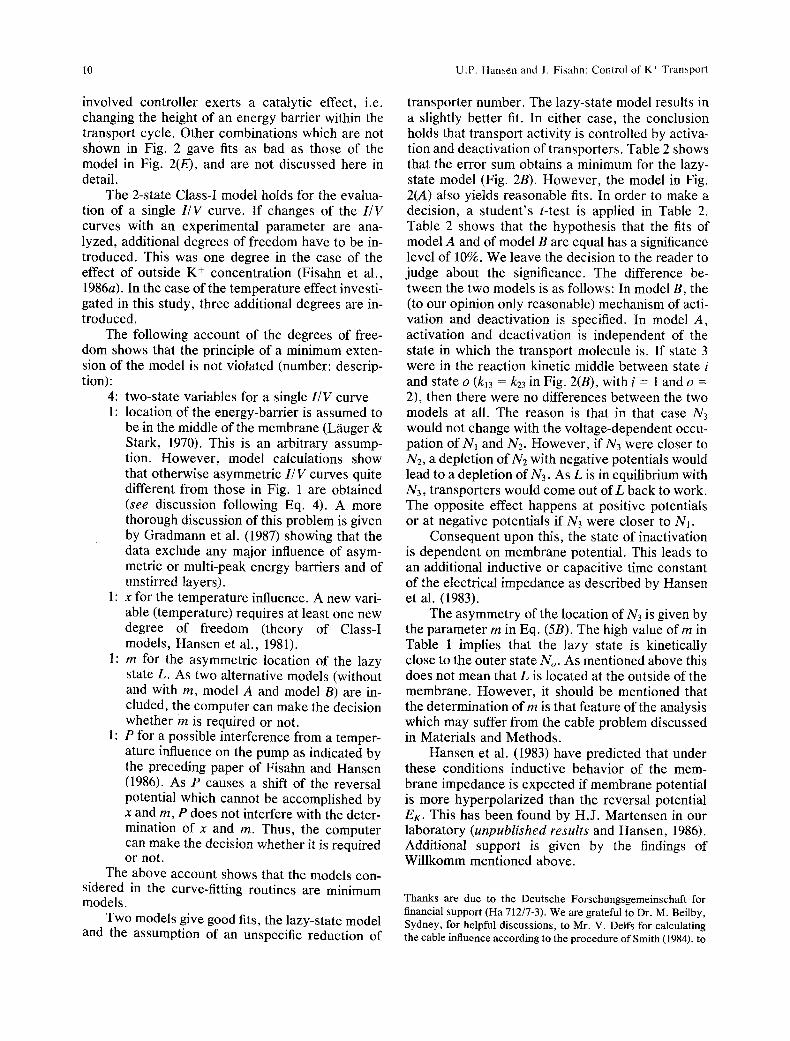
Fig. 1. Set of current-voltage curves obtained from Nitella at different temperatures. The numbers attached to the curves give the temperatures in ~ The currents are input currents of the whole cell, length 2 cm, diameter 0.5 mm, no light. The curves were subject to curve fitting on the basis of the lazy-state model in Fig. 2B by means of Eq. (Sb). The model of Eq. (5b) used for fitting these curves is given in the inset. The parameters of Eq. (5b) are as follows: zFNt = 1, k~ = 207, ~i = 633, Kit = 403, t% = 5790, m = 25.6 common to all data sets, and xm = 336, 242, 176, 155, 131 for the temperatures 5, 10, 15, 10, 25~ respectively
measurement of an I / V curve. It became necessary to change the solution in the current electrode from normally 1000 tool m 3 KC1 to 3000 mol m -3 KC1 plus 100 mol m -3 A1C13 in order to supply enough current to the cell. The clamp amplifier was homemade with a high-voltage OP (Burr Brown 3584 JM) supply- ing pulses up to + / -110 V, and resulting in a settling time of the membrane potential of 2 msec.
For the measurement of the I / V curves under voltage clamp, a series of alternating increasing pulses (120 + 80 + 120 + 80 msec for a subunit comprising resting potential, hyperpolariz- ing step, resting potential, depolarizing step) was used as in the previous investigation (Fisahn et al., 1986a), in order to reduce the stimulating action on excitation processes and the develop- ment of negative resistance (Beilby, 1986a,b) which takes about 100 msec (Hansen, 1986). The display of the current pulses on an oscilloscope was used to check for the absence of interference from effects of this kind. At outside K + concentrations higher than 1 tool m -3, the current returned within 2 msec to a steady level. An Apple II microcomputer took care of the generation of the bipolar stair-case voltage command signal and of the data acquisition. The computer stored the average of the current and of the potential during the last I0 msec of each of the steps mentioned above. For curve fitting of the I / V curves, the pro- gram PUMA.ALG was used, which is an improved version of PUMO.FOR generated in 1979 in the laboratory of C.L. Slay- man, New Haven, Connecticut.
Nomencla ture: No and Ni are used for the two states of the pseudo-2-state model (Fig. 2A) of the active cycle. They include N3, but exclude L. N1 and N2 are used for the 3-state model of the active cycle (Fig. 2B) excluding L. NI and N2 do not include N3. The same convention holds for the reserve factors q, r2, r~, ro.
Results
THE CURVE-SHAPE OF THE MEASURED I / V
CURVES; THE APPLICATION OF THE CLASS-/
MODEL TO A K + CHANNEL
Figure 1 displays a set of I /V curves taken at differ- ent temperatures, measured at an outside concen-
tration of 10 tool m -3 KC1. At this concentration, the saturable K + transporter dominates the electri- cal properties of Nitella, and little interference from other transporters has to be taken into account (Fi- sahn et al., 1968a). Again, we found that the cells could stand positive potentials up to +200 mV, and that there was little interference from action poten- tials and negative resistance (Beilby, 1986a,b). As mentioned in the previous paper (Fisahn et al., 1986a), we added 0.2 mol m -3 LaC13 to the bathing medium in our first experiments in order to prevent action potentials (Beilby, 1984), but later it was omitted because interference from action potentials was rare, even though the cells were excitable.
In Fig. 1. the symbols give the experimental data and the smooth lines are obtained by the curve- fitting procedures described below. These curves display the saturation of current at positive and at negative potentials. These curve shapes are similar to those obtained in patch-clamp experiments of the K + channel (Schroeder et al., 1984; Bertl & Grad- mann, 1986; L/ihring, 1986). Gradmann et al. (1987) showed that the curve shape resulted from a cyclic transporter model and not from a diffusion-limited channel. The observation and evaluation of these I/ V curves in Nitella was described by Fisahn et al. (1986a).
Even though Lfiuger (1980) came to the conclu- sion that "a unified description of ion carriers, channels, and pumps seems possible," we our- selves were surprised that the Class I model, origi- nally developed for pumps (Hansen et al., 1981), can be applied to K + channels in plant cells, too (Fisahn et al., 1986a; Gradmann et al., 1987). Thus, the reliability of these results is discussed before we proceed with its application.
The occurrence of the I /V curves with the satu-
4 U.P. Hansen and J. Fisahn: Control of K' Transport
ration regions as shown in Fig. 1 is a peculiarity. A great variety of other curve shapes is shown by other authors. Especially at low [K+]o, the I/V curves display an increase of current at positive and at negative potentials, similar to the I/V curves of single or of pairs of anti-parallel semiconductor di- odes. These I/V curves can be observed in Nitella (Sokolik & Yurin, 1981, 1986), in Chara (Coleman & Findlay, 1985; Beilby, 1986a,b) or in Eremos- phaera (K6hler et al., 1986). Sokolik and Yurin (1981, 1986) found that the shape of the I/V curves depended on a so-called conditioning voltage, which was applied to the cell prior to the run of the I/V curve measurement. They assumed that differ- ent potassium channels, namely D channels and H channels, can be found in Nitella. The D channels, induced by a depolarizing conditioning voltage, dis- played saturation at potentials more negative than ca. -150 mV in some experiments, whereas the range of positive potentials was not shown. Beilby (1985), too, interpreted her findings in Chara by the assumption of two different channels. In the first series of experiments, she distinguished between an unspecific " leak" and K + channel. In a later paper (Beilby, 1986b), she found K + sensitivity of the leak, too. At negative potentials, the downward bending can result from another hazard: Coster and Hope (1968) and Tyerman, Findlay and Paterson (1986a,b) reported an increase of chloride fluxes at negative potentials.
The curve shape shown in Fig. 1 is observed in intact cells very rarely. Beilby (1985) showed such a curve in cells presoaked in 2 and 5 tool m -3 Na +, but she attributes this curve to the proton pump which was more active in her Chara than in our Nitella. Other regions of saturating current found in I/V curves of Chara at potentials more negative than -300 mV or more positive than -50 mV were also assigned to the H + pump (Beilby 1984; Kishi- moto et al., 1984).
In contrast to the results from intact cells, patch-clamp experiments on K + channels in Vicia faba (Schroeder et al., 1984; Gradmann et al., 1987), in Chara (Lfihring, 1986) or in Acetabularia (Bertl & Gradmann, 1986) revealed I/V curves with saturation regions like those in Fig. 1, as mentioned above.
Probably, the experiments of Bertl and Grad- mann (1986) can provide the key for the understand- ing of the different I/V curves. The saturation curves, similar to those in Fig. 1, are found if the current of the open channel is plotted versus mem- brane potential. If the average current (including open and closed states) is taken, then I/V curves are found which show an increase of current at depolar- ized potentials.
The experiments of Bertl and Gradmann (1986) lead to the conclusion that the basic curve shape of the I/V curve of the K + channel is of the saturating type shown in Fig. 1. The deviations commonly ob- served in intact cells are introduced by the activa- tion-deactivation properties of the channel, since measuring the current of an intact cell implies aver- aging over many channels in different states.
Bertl and Gradmann (1986) explained this be- havior by a model with two "lazy states" (Hansen et al., 1983) of the transport molecule. One of them L; performs the exchange with the transport cycle via voltage-insensitive rate-constants; the other one Lv via voltage-sensitive rate constants. It is the volt- age-sensitive exchange with Lv which causes the deviations from the saturating I/V curves. Lazy states with voltage-insensitive rate constants can- not change the basic shape of a Class I I/V curve (Hansen et al., 1981, 1983).
Beilby (personal communication) raised the fol- lowing argument against our results: Cable prob- lems originating from the applied point clamp might smooth out the region of negative impedance (Ohkawa & Kishimoto, 1977; Coleman & Findlay, 1985; Beilby, 1986b; Hansen, 1986; K6hler et al., 1986; Sokolik & Yurin, 1986;), thus pretending the occurrence of saturation. The following features convinced us that this does not occur.
1. We observed the region of negative resis- tance in many other experiments, mainly in Chara (Hansen, 1986). Thus, we know that our recording technique reveals the negative slopes if they occur.
2. In experiments making use of Ogata's water film electrode (Ogata, 1983) the negative slopes oc- curred in about 10% of all records. This shows that also in experiments in which the cable problem was eliminated negative slopes occurred rarely (in our cells in contrast to those of Beilby).
3. The negative slope develops with time (Cole- man & Findlay, 1985; Hansen, 1986). Consequent upon this, all records of the time-course of the cur- rent pulses in those//V-curve studies which reveal negative slopes display a strong variation of the cur- rent with time (Beilby, 1985; Coleman & Findlay, 1985; Sokolik & Yurin, 1986).
In our experiments, the time-course of the cur- rent steps did not exhibit these transients. The anal- ysis of the time-courses (unpublished results of V. Dells) showed that the component, originating from the loading of the membrane capacitor via the cell wall resistance and via internal cable resistances (time constant about 2 msec) was independent on membrane potential indicating the absence of un- stirred layer effects and little influence of membrane potential on the cable properties. The second com- ponent (time constant 10 to 100 msec) shows that
U.P. Hansen and J. Fisahn: Control of K + Transport 5
exchange with the lazy states is small, probably re- stricted to the exchange with the voltage-insensitive lazy state (see Discussion).
The occurrence of negative slopes requires the involvement of a Class II model (two pairs of rate- constants being sensitive to membrane potential) as provided by the incorporation of a lazy state with voltage-sensitive rate constants (Gradmann, 1984; Bertl & Gradmann, 1986; Hansen, 1986). Thus, the occurrence of negative slopes depends on the mag- nitude of the exchange of the active states with this lazy state. The recent paper of Fisahn and Hansen (1986) and the investigations in this article show that the lazy states play a vital role in the control of transport by signals from other functional units in the cells. Thus, depending on these signals, the cou- pling of the lazy states to the transport cycle can be more or less tight. This model explains that in dif- ferent cultures a great variety of curve shapes can occur. We were lucky (for the purpose of this and the preceding paper, Fisahn et al., 1986a) that in our cells grown at low-light intensity and at 10~ which lived at low resting potentials (about - 120 mV), the exchange of the active cycle with the voltage-sensi- tive lazy state was very small. This results in three phenomena which should occur together:
1. The "original I /V curves of the channel," namely the saturating//V curves become visible.
2. No negative slopes. 3. Simple temporal behavior of the clamp cur-
rent induced by the steps in potential. In this model, the role of the conditioning volt-
age applied by Sokolik and Yurin (1981, 1986) is understood. It sets the exchange parameters with the voltage-sensitive lazy state. Additional support for such a view is obtained by measurements of the voltage dependence of the components of the low- frequency noise of membrane potential in Nitella. The noise studies reveal different modes of coupling of metabolic noise to the transport molecule de- pending on the dominant type of the I /V curve (un- published results of R. Willkomm in our labora- tory).
THE INFLUENCE OF TEMPERATURE
As indicated in Fig. 1, temperature was changed in steps of 5~ from 5 to 25~ After each temperature step, the cell was given 5 to 10 min to adjust to the new temperature. This time is expected to be long enough as the time constant of the action of temper- ature on membrane resistance was found to be about 40 sec (Fisahn & Hansen, 1986). It should be mentioned that this effect of temperature on the I /V curves is not caused by a direct action of tempera-
ture on the transport molecule, but mediated by a signal from another functional unit in the cell (Fi- sahn & Hansen, 1986), which is the photosynthetic apparatus according to unpublished findings of Sus- anne Stein in our laboratory.
In contrast to the influence of outside K + stud- ied in the preceding paper (Fisahn et al., 1986a), the changes in temperature result in changes of the pos- itive saturation currents as well as of the negative saturation currents, as shown in Fig. 1.
CURVE FITTING
Curve fitting of the I /V curves of this K + trans- porter is already described in the previous paper (Fisahn et al., 1986a). The analysis was based on the Class I models shown in Fig. 2. The theory of Class I models is given by Hansen et al. (1981). Class I comprises all models with one pair (being the reason for the name Class I) of reaction con- stants being sensitive to membrane potential. By convention, these two rate constants are kt2 and kzl located between state 1 and state 2. A "real" reac- tion scheme with n states can be represented by a model with less states along the following rules:
I. All reactions which are not influenced by the actual experimental treatment may be lumped into the neutral recycling reactions.
2. Those reaction constants which are attacked by the experimenter must not be lumped into over- all reactions.
3. The experimenter has to realize that the re- action constants obtained from the analysis include unknown reserve factors. This holds for every kind of kinetic analysis.
Thus, the genuine model for the description of a single Class-I/ /V curve is the 2-state model (Han- sen et al., 1981), because only the electrosensitive reactions kio and koi have to be excluded from the lumped recycling reactions Kio and Ko~ (Fig. 2A).
In the experiments of the previous paper (Fi- sahn et al., 1986a), the change of substrate concen- tration demands the additional reaction pair of the 3-state model shown in Figs. 2(C) and 2(E). From that analysis, the charge of the naked transporter (z = 0), and the stoichiometry (1 K + per cycle) was obtained. It was found that the reaction constant of binding outside K + increased linearly with [K+]0.
In this paper, the effect of temperature is inves- tigated. At the beginning of the analysis, we did not know which reaction of the transport cycle is changed by the action of the involved control loop. Different mechanisms can be visualized, which can be assigned to two groups. In one group, reactions within the cycle are modified (Figs. 2C to E) for
6 U.P. Hansen and J. Fisahn: Control of K' Transport
A.
No ~ T OUT
N i ~ T IN
S . N 2
V . . . . V
N1
N 3
T
T
C. D. E.
N2 No OUT N 2 ~ .
V--q I - -V ~ N 3 V'T-- ( I~V'T 11 V- -1L- - , , 4 \
N1 ~ \T Ni I N N 1
N 3
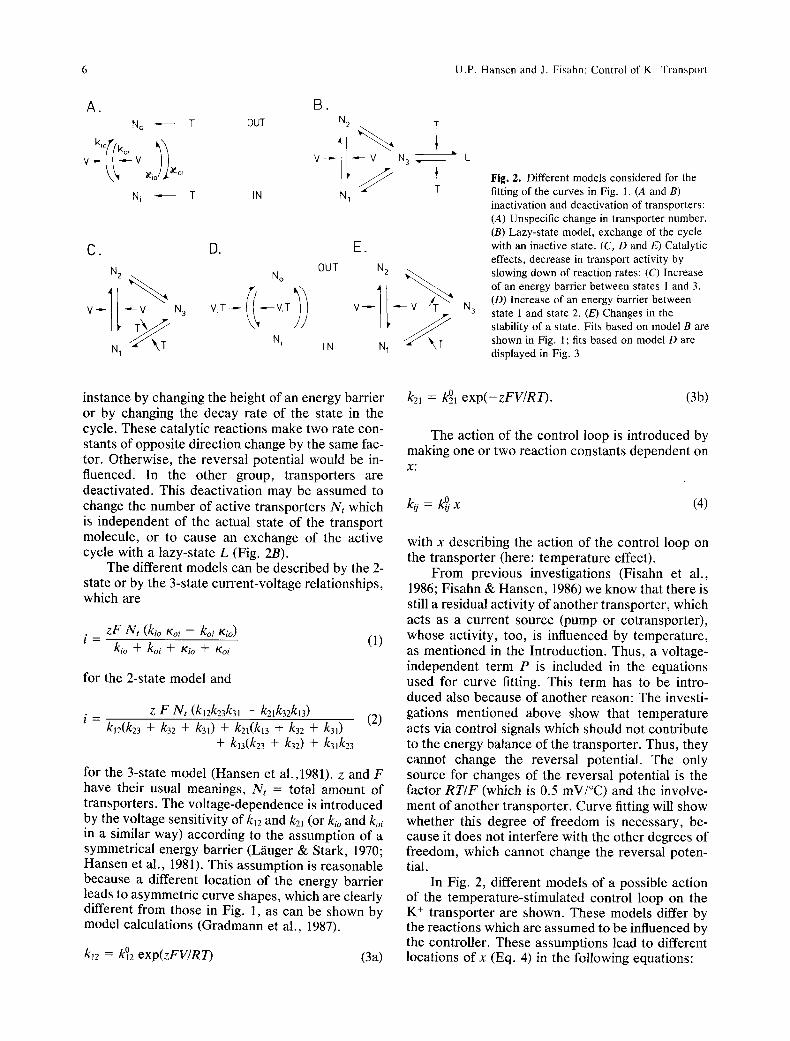
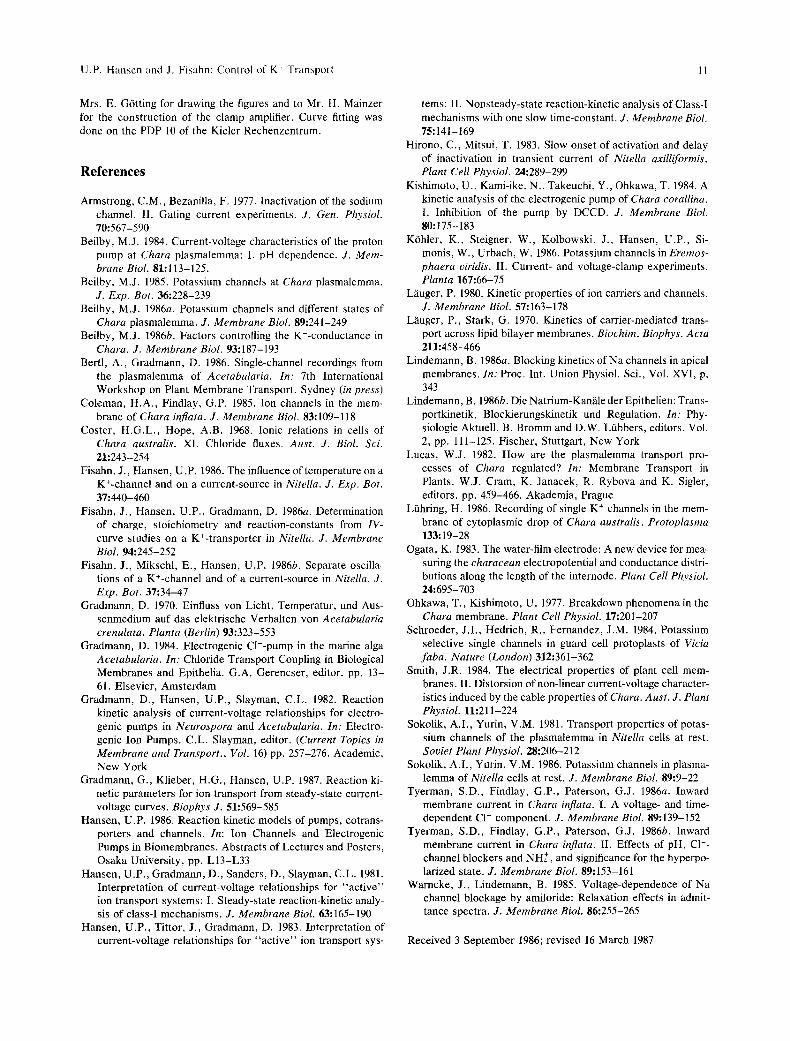
Fig. 2. Different models considered for the fitting of the curves in Fig. 1. (A and B) inactivation and deactivation of transporters: (A) Unspecific change in transporter number. (B) Lazy-state model, exchange of the cycle with an inactive state. (C, D and E) Catalytic effects, decrease in transport activity by slowing down of reaction rates: (C) Increase of an energy barrier between states 1 and 3. (D) Increase of an energy barrier between state 1 and state 2. (E) Changes in the stability of a state. Fits based on model B are shown in Fig. 1; fits based on model D are displayed in Fig. 3
instance by changing the height of an energy barrier or by changing the decay rate of the state in the cycle. These catalytic reactions make two rate con- stants of opposite direction change by the same fac- tor. Otherwise, the reversal potential would be in- fluenced. In the other group, transporters are deactivated. This deactivation may be assumed to change the number of active transporters Nt which is independent of the actual state of the transport molecule, or to cause an exchange of the active cycle with a lazy-state L (Fig. 2B).
The different models can be described by the 2- state or by the 3-state current-voltage relationships, which are
z F N t (kio Koi - koi Kio) (1)
i = kio + koi + Kio + Koi
for the 2-state model and
z F Nt (k12k23k31 - k21k32k13)
i = ku(k23 + k32 + k31) + k21(k13 + k32 + k31) (2) + k13(k23 + k32) + k31k23
for the 3-state model (Hansen et a1.,1981), z and F have their usual meanings, Nt = total amount of transporters. The voltage-dependence is introduced by the voltage sensitivity of k u and k21 (or kio and koi in a similar way) according to the assumption of a symmetrical energy barrier (L~iuger & Stark, 1970; Hansen et al., 1981). This assumption is reasonable because a different location of the energy barrier leads to asymmetric curve shapes, which are clearly different from those in Fig. 1, as can be shown by model calculations (Gradmann et al., 1987).
kj? = k~ e x p ( z F V / R T ) (3a)
k21 = k~ e x p ( - z F V / R T ) . (3b)
The action of the control loop is introduced by making one or two reaction constants dependent on x:
k o. = k ~ x (4)
with x describing the action of the control loop on the transporter (here: temperature effect).
From previous investigations (Fisahn et al., 1986; Fisahn & Hansen, 1986) we know that there is still a residual activity of another transporter, which acts as a current source (pump or cotransporter), whose activity, too, is influenced by temperature, as mentioned in the Introduction. Thus, a voltage- independent term P is included in the equations used for curve fitting. This term has to be intro- duced also because of another reason: The investi- gations mentioned above show that temperature acts via control signals which should not contribute to the energy balance of the transporter. Thus, they cannot change the reversal potential. The only source for changes of the reversal potential is the factor R T / F (which is 0.5 mV/~ and the involve- ment of another transporter. Curve fitting will show whether this degree of freedom is necessary, be- cause it does not interfere with the other degrees of freedom, which cannot change the reversal poten- tial.
In Fig. 2, different models of a possible action of the temperature-stimulated control loop on the K + transporter are shown. These models differ by the reactions which are assumed to be influenced by the controller. These assumptions lead to different locations of x (Eq. 4) in the following equations:
U.P. Hansen and J. Fisahn: Control of K' Transporl 7
Fig. 2(A)
Change in the number of transporters. A 2-state model is required in which N, is changed by temper- ature:
z F x N t ( k i o K o i - koiKio) i = + P .
kio + koi + Kio + Koi
Fig. 2(B)
Exchange with the lazy state. The resulting equa- tion is derived in the Appendix (Eq. A19).
zFNt(kioKoi - koiKio) i = + P .
(1 + xm)(klo + Kio) + (1 + x)(koi + Koi)
Fig. 2(C)
Effect on a neutral reaction pair, e.g. k31 and kj3. This may be achieved by a change in the height of an energy barrier. A 3-state model is required since the effects of potential and of temperature occur at different places.
i = zFNtx(k12k23k~ - k21k32k~ 3- P. kl2(k23 + k32 + xk~ + k21(xk~ + k32
+ xk~ + xk~ (k23 + k32) + xk~
Fig. 2(D)
Effect on the pair of electrosensitive reaction con- stants. Again, the height of an energy barrier is changed. In this case a 2-state model can be used, because the same reaction pair is influenced by volt- age and temperature. The related equation is:
i = zFNt(kioxKoi - koixKio) + P. (5d) x (kio 3- koi ) 3- I'r 3- I'%i
Fig. 2(E)
Catalytic effect, the stability of a complex is changed, and the decay reaction to either side has changed, e.g. k32 and k31. A 3-state model is re- quired
i = zFNtx(k12kz3k~ - kzjk~ + P. (5e) k~2(k23 + xk~ + xk~ + k:l(k,3 + xk%
+ xk~ + kl3(k23 + xk~ + xk~
The applicability of the models shown in Fig. 2 was tested by subjecting the data to a joint-fit analy-
(5a) sis. In the curve-fitting routines, x and P in the equations above were allowed to be different for the individual data sets obtained at different tempera- tures, whereas the same set of k reaction rates had to be used for all data sets.
In Fig. 1, a fit based on the lazy-state model (Fig. 2B) is shown. Figure 1 shows that the curves calculated by the computer are very close to the experimental data points. Deviations are seen for the 5~ curve at positive potentials and for the 25~ curve at negative potentials. We think that 5~ is
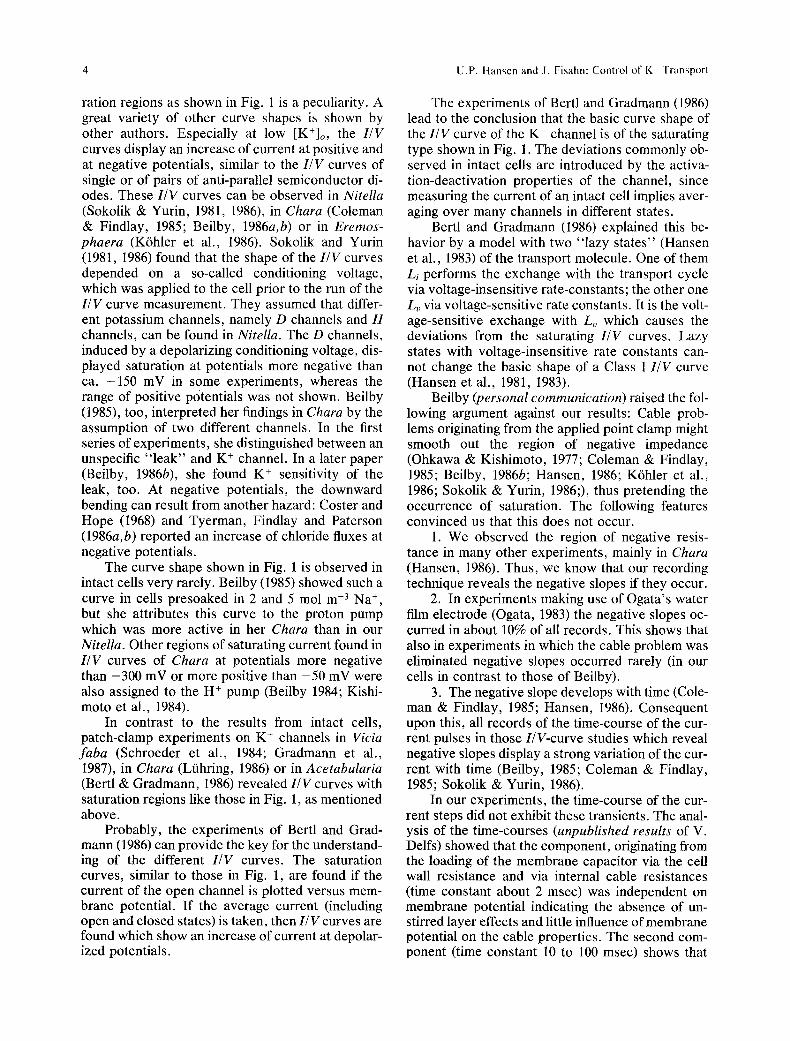
(5b) already pretty cold and secondary effects of the temperature may be involved. The deviation may also result from an interference from incomplete suppression of the negative resistance region de- scribed by Beilby (1986b) which we hoped to sup- press by the alternating pulse series and/or LaC13. The downward bending at negative potentials prob- ably results from the involvement of an additional transporter, presumably a chloride channel, which opens at very negative potentials (Coster & Hope, 1968; Tyerman et al., 1986a,b) as discussed in our previous paper (Fisahn et al., 1986a).
The lazy-state model applied in Fig. 1 gave the best fit. A good fit is also obtained by the model of
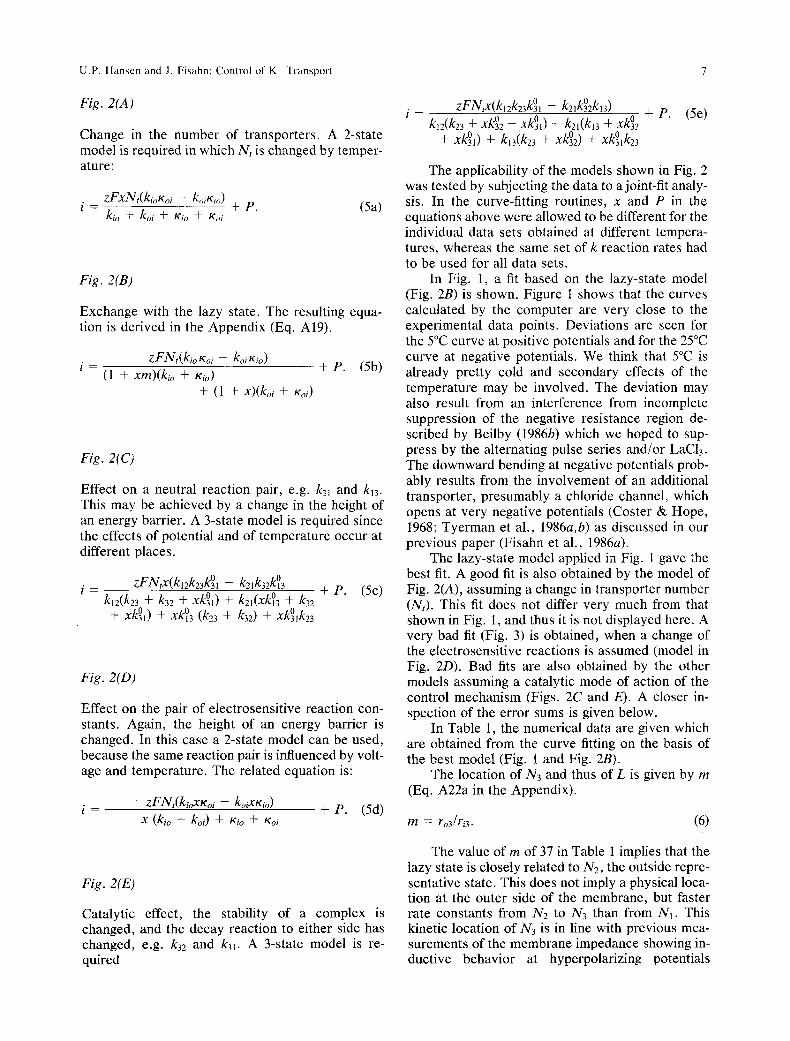
(5c) Fig. 2(A), assuming a change in transporter number (Nt). This fit does not differ very much from that shown in Fig. 1, and thus it is not displayed here. A very bad fit (Fig. 3) is obtained, when a change of the electrosensitive reactions is assumed (model in Fig. 2D). Bad fits are also obtained by the other models assuming a catalytic mode of action of the control mechanism (Figs. 2C and E). A closer in- spection of the error sums is given below.
In Table 1, the numerical data are given which are obtained from the curve fitting on the basis of the best model (Fig. 1 and Fig. 2B).
The location of N3 and thus of L is given by m (Eq. A22a in the Appendix).
m = ro3/r~. (6)
The value of m of 37 in Table 1 implies that the lazy state is closely related to N2, the outside repre- sentative state. This does not imply a physical loca- tion at the outer side of the membrane, but faster rate constants from N2 to N3 than from N1. This kinetic location of N3 is in line with previous mea- surements of the membrane impedance showing in- ductive behavior at hyperpolarizing potentials
8 U.P. Hansen and J. Fisahn: Control of K' Transport i: N2 ~ A
+ + . , / + -1o
] + ~ I 3 - C I ~ O O ~ / / - -
+ f Z c , x.,~x x ~ / ' ~ #i./o..~,, ~S" /
- oo -2oo 200
__L_v
d mv
A a 7 t x " ~ / ,,,~ ~ : o / X , + z
r.- / ,60 j o - + - x / o - u / , ,
o oJ .- +
/ U , / D - ~ a g.2..~...7.~ 9 n - ' 7 - - - ~ ~ ~ + "~ +
ZD +
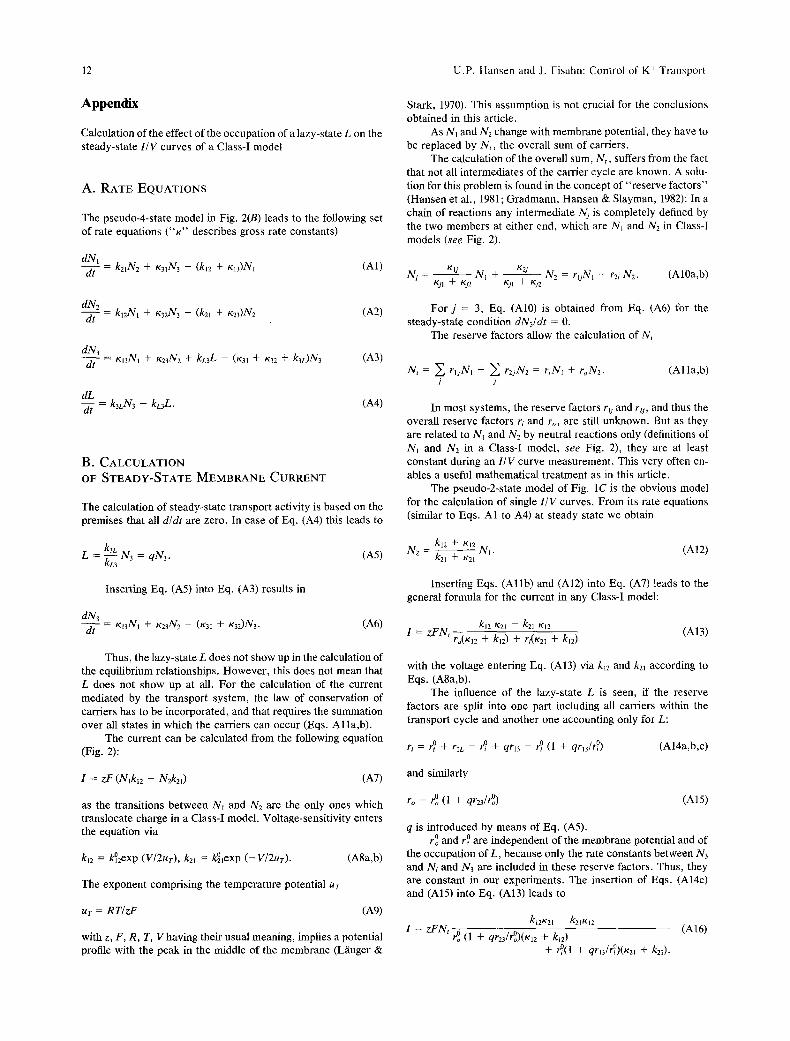
Fig. 3. The "best" fit based on model D of Fig. 2. The same data as in Fig. 1 are fitted by Eq. (5d). Model D assumes that temperature changes the Eyring barrier across which the charged complex has to bop
Table 1. Temperature effect" x. m
Value 175 540 277 3215 37 Scatter 1.3 1.5 1.5 2. l 1.8
200 -
T~ 5 10 15 20 25
x rn 218 163 122 109 88 x 5.9 4.4 3.3 2.9 2.4 Scatter 1.5 1.4 1.4 1.3 1.4 P 0.001 0.018 0.122 0.127 0.252 Scatter 1.1 4.0 1.7 1.4 1.6
Upper part: The constraint (common to all data sets) 2-state reaction constants of the lazy-state model in Fig. 2B (dimension is sec -1 for zFNt = 1) obtained from curve fitting of five data sets by Eq. (5b). Lower part: Dependence of the free parameters x and P on temperature. The scatter is given as a factor according to averaging in a logarithmic scale.
( H a n s e n et a l . , 1983; H a n s e n , 1986). U n p u b l i s h e d s tud ies o f R. W i l l k o m m in ou r l a b o r a t o r y have s h o w n tha t the i n d u c t i v e b e h a v i o r is found on ly in t hose cel ls w h i c h d i s p l a y the sa tu ra t ing I / V cu rves , w h e r e a s a c a p a c i t i v e c o m p o n e n t p e a k s at EK, if the n o n s a t u r a t i n g I / V cu rves occu r .
The l o w e r pa r t o f T a b l e 1 d i s p l a y s the depen - d e n c e o f x on t e m p e r a t u r e . A s s h o w n in the A p p e n - dix, x is r e l a t e d to the ra t io o f f o r w a r d and back- w a r d r e a c t i o n in the e x c h a n g e b e t w e e n the l a z y - s t a t e L and the t r a n s p o r t cyc l e as g iven b y Eq. (A22). By m e a n s o f Eq. (A21), Eq. (A22) can be c o n v e r t e d to an a l t e rna t i ve fo rm
x m = k3L/kL3 ro3. (7)
T h e i n v o l v e m e n t o f ro3 (Eq. A20O r ende r s the
150
100-
50
o
I\T i To
0 I I ~-
0 5 10 I~5 20 25 T I~
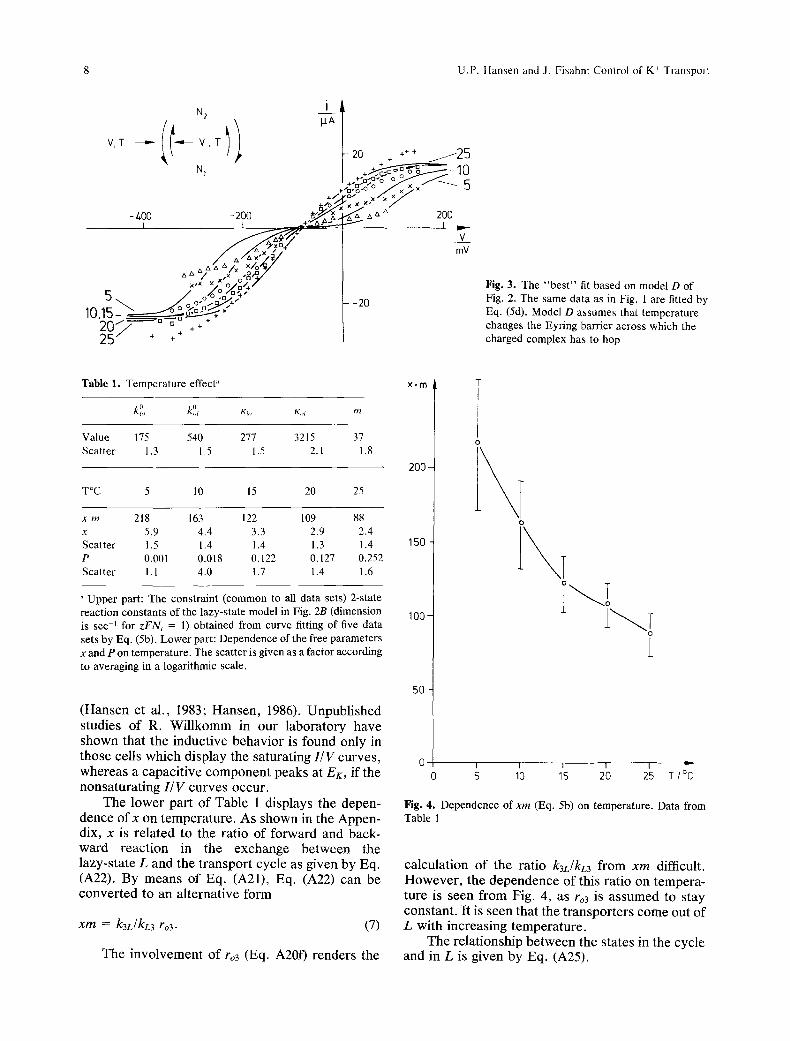
Fig. 4. Dependence of xm (Eq. 5b) on temperature. Data from Table 1
ca l cu l a t i on o f the r a t io k3L/NL3 f rom x m difficult . H o w e v e r , the d e p e n d e n c e o f this ra t io on t e m p e r a - ture is s een f rom Fig. 4, as ro3 is a s s u m e d to s tay cons t an t . I t is s een tha t the t r a n s p o r t e r s c o m e out o f L wi th i nc r e a s ing t e m p e r a t u r e .
The r e l a t i onsh ip b e t w e e n the s ta tes in the cyc l e and in L is g iven b y Eq . (A25).
U.P. Hansen and J. Fisahn: Control of K + Transport
Table 2. The average error as calculated by Eq. (10) obtained from fitting five data sets by the five different models in Fig. 2 a
A B C D E Data Transport Lazy k13 and k31 k12 and k2j k32 and k3i set number state
1 0.31 0.25 0.31 0.40 0.59 2 0.31 0.29 0.41 0.78 0.71 3 0.28 0.27 0.40 0.78 0.62 4 0.40 0.33 0.50 1.60 0.56 5 0.38 0.35 0.47 0.80 0.62
Average 0.33 0.30 0.41 0.79 0.62 Scatter 1.1 1.1 1.2 1.6 1.1
t-vat 1.4 3.59 3.2 12.1 Signif. Level 10% 0.5% 1% 0%
a In the last two rows, four of these models are compared with the lazy-state model (second column) by means of the student's t-test.
L = xNi + xmNo (8)
with Ni and No being the apparent concentrations of the transporters at the inner and outer side (Eqs. A20g,h). As Ni and No change with membrane po- tential, L also changes with membrane potential. This is the cause of the changes in the shape of the I /V curves related to the action of L.
The values of xm, given in Table 1, are very high. The absolute values should not be taken very seriously. Equation (5b) shows that the value of about 200 ofxm overrides the "1" in the denomina- tor of Eq. (5b). Thus, a common factor may be ex- tracted from (1 + xm) and from (1 + x) in Eq. (5b) and merged into N, without major influence on the quality of the fit. Thus, the values of xm in Table 1 should not lead to the statement that the number of transporters in L is more than 200 times that in No. However, the dependence of xm on temperature is not influenced by this objection.
In Eq. (5b), the term P was used to account for a possible current source. It is found that P de- creases rapidly with temperature. Even though we do not take the estimation of P very seriously, we should like to point out that P is strongly reduced at 5~ This is in line with results of Gradmann (1970) who inhibited the C1- pump in Acetabularia by tem- peratures below 8~
The failure of the model D used for the fit in Fig. 3 is quite obvious. Thus, this model can be ruled out very clearly. The difference between the models in Fig. 2(A) and Fig. 2(B) was less striking. Thus the behavior of the error of the fits has to be investi- gated. Table 2 shows the error sums obtained from
five data sets subject to fits by the five different models in Fig. 2. The error sum is calculated as follows
N N
(lm l,) 2 ,/2
(10)
with N N being the number of all data points (5 times 32) and KK the number of degrees of freedom (7 or 9, depending on the model).
According to Table 2, preference is given to the lazy-state model as discussed below.
Discussion
In a preceeding investigation (Fisahn et al., 1986a) the analysis of the K + effect on t h e / / V curves in Nitella has shown that the K + channel is not yet a water-filled hole, but a more complicated mecha- nism. Transport by this channel is mediated by tran- sitions between several states of the molecule, as assumed for the Na + channel in exitable membranes (Armstrong & Bezanilla, 1977). The important fea- ture of the K + channel in Nitella is the recycling step, which is necessary to bring the molecule back into a state ready to accept a new passenger after the preceding one has been delivered. The exis- tence of this recycling step leads to a kinetic behav- ior which can be described by the Class-I model originally developed for electrogenic pumps (Han- sen et al., 1981). Further details of the application of this model to K + channels, e.g., the rejection of a diffusion-limited channel as an alternative explana- tion, are given by Gradmann et al. (1987).
Additional support for these findings comes from the patch-clamp experiments discussed above, and from the results of the investigations of this paper. The I /V curve analysis of the temperature effect on the K + transporter in Nitella has shown again that the curves can be analyzed by a Class-I model.
The peculiar question of the present investiga- tions is whether this analysis is capable of revealing the locus at which the control unit interferes with the transport molecule. As mentioned in the Intro- duction, it has been shown in a preceeding paper (Fisahn & Hansen, 1986) that the main temperature effect is not due to a direct action on the transport molecule, but to secondary effects mediated via sig- nals from the photosynthetic apparatus. The analy- sis of the changes of the steady-state I /V curves shows that some models can be ruled out, namely all those which start from the assumption that the
10 U.P. Hansen and J, Fisahn: Control of K ' Transport
involved controller exerts a catalytic effect, i.e. changing the height of an energy barrier within the transport cycle. Other combinations which are not shown in Fig. 2 gave fits as bad as those of the model in Fig. 2(E), and are not discussed here in detail.
The 2-state Class-I model holds for the evalua- tion of a single I/V curve. If changes of the I/V curves with an experimental parameter are ana- lyzed, additional degrees of freedom have to be in- troduced. This was one degree in the case of the effect of outside K + concentration (Fisahn et al., 1986a). In the case of the temperature effect investi- gated in this study, three additional degrees are in- troduced.
The following account of the degrees of free- dom shows that the principle of a minimum exten- sion of the model is not violated (number: descrip- tion):
4: 1:
two-state variables for a single I/V curve location of the energy-barrier is assumed to be in the middle of the membrane (Lfiuger & Stark, 1970). This is an arbitrary assump- tion. However, model calculations show that otherwise asymmetric/ /V curves quite different from those in Fig. 1 are obtained (see discussion following Eq. 4). A more thorough discussion of this problem is given by Gradmann et al. (1987) showing that the data exclude any major influence of asym- metric or multi-peak energy barriers and of unstirred layers).
1: x for the temperature influence. A new vari- able (temperature) requires at least one new degree of freedom (theory of Class-I models, Hansen et al., 1981).
1: m for the asymmetric location of the lazy state L. As two alternative models (without and with m, model A and model B) are in- cluded, the computer can make the decision whether m is required or not.
1: P for a possible interference from a temper- ature influence on the pump as indicated by the preceding paper of Fisahn and Hansen (1986). As P causes a shift of the reversal potential which cannot be accomplished by x and m, P does not interfere with the deter- mination of x and m. Thus, the computer can make the decision whether it is required or not.
The above account shows that the models con- sidered in the curve-fitting routines are minimum models.
Two models give good fits, the lazy-state model and the assumption of an unspecific reduction of
transporter number. The lazy-state model results in a slightly better fit. In either case, the conclusion holds that transport activity is controlled by activa- tion and deactivation of transporters. Table 2 shows that the error sum obtains a minimum for the lazy- state model (Fig. 2B). However, the model in Fig. 2(A) also yields reasonable fits. In order to make a decision, a student's t-test is applied in Table 2. Table 2 shows that the hypothesis that the fits of model A and of model B are equal has a significance level of 10%. We leave the decision to the reader to judge about the significance. The difference be- tween the two models is as follows: In model B, the (to our opinion only reasonable) mechanism of acti- vation and deactivation is specified. In model A, activation and deactivation is independent of the state in which the transport molecule is. If state 3 were in the reaction kinetic middle between state i and state 0 (k13 = k23 in Fig. 2(B), with i = 1 and o = 2), then there were no differences between the two models at all. The reason is that in that case N3 would not change with the voltage-dependent occu- pation of N1 and N2. However, if N3 were closer to N2, a depletion of N2 with negative potentials would lead to a depletion of N3. As L is in equilibrium with N3, transporters would come out of L back to work. The opposite effect happens at positive potentials or at negative potentials if N3 were closer to N1.
Consequent upon this, the state of inactivation is dependent on membrane potential. This leads to an additional inductive or capacitive time constant of the electrical impedance as described by Hansen et al. (1983).
The asymmetry of the location of N3 is given by the parameter m in Eq. (5B). The high value of m in Table 1 implies that the lazy state is kinetically close to the outer state No. As mentioned above this does not mean that L is located at the outside of the membrane. However, it should be mentioned that the determination of m is that feature of the analysis which may suffer from the cable problem discussed in Materials and Methods.
Hansen et al. (1983) have predicted that under these conditions inductive behavior of the mem- brane impedance is expected if membrane potential is more hyperpolarized than the reversal potential EK. This has been found by H.J. Martensen in our laboratory (unpublished results and Hansen, 1986). Additional support is given by the findings of Willkomm mentioned above.
Thanks are due to the Deutsche Forschungsgemeinschaft for financial support (Ha 712/7-3). We are grateful to Dr. M. Beilby, Sydney, for helpful discussions, to Mr. V. Delfs for calculating the cable influence according to the procedure of Smith (1984), to
U.P. Hansen and J. Fisahn: Control of K ~ Transport 11
Mrs. E. G6tting for drawing the figures and to Mr. H. Mainzer for the construction of the clamp amplifier. Curve fitting was done on the PDP 10 of the Kieler Rechenzentrum.
References
Armstrong, C.M., Bezanilla, F. 1977. Inactivation of the sodium channel. II. Gating current experiments. J. Gen. Physiol. 70:567-590
Beilby, M.J. 1984. Current-voltage characteristics of the proton pump at Chara plasmalemma: I. pH dependence. J. Mem- brane Biol. 81:113-125.
Beilby, M.J. 1985. Potassium channels at Chara plasmalemma. J. Exp. Bot. 36:228-239
Beilby, M.J. 1986a. Potassium channels and different states of Chara plasmalemma. J. Membrane Biol. 89:241-249
Beilby, M.J. 1986b. Factors controlling the K+-conductance in Chara. J. Membrane Biol. 93:187-193
Bertl, A., Gradmann, D. 1986. Single-channel recordings from the plasmalemma of Acetabularia. In: 7th International Workshop on Plant Membrane Transport. Sydney (in press)
Coleman, H.A., Findlay, G.P. 1985. Ion channels in the mem- brane of Chara inflata. J. Membrane Biol. 83:109-118
Coster, H.G.L., Hope, A.B. 1968. Ionic relations in cells of Chara australis. XI. Chloride fluxes. Aust. J. Biol. Sci. 21:243-254
Fisahn, J., Hansen, U.P. 1986. The influence of temperature on a K+-channel and on a current-source in Nitella. J. Exp. Bot. 37:440-460
Fisahn, J., Hansen, U.P., Gradmann, D. 1986a. Determination of charge, stoichiometry and reaction-constants from IV- curve studies on a K+-transporter in Nitella. J. Membrane Biol. 94:245-252
Fisahn, J., Mikschl, E., Hansen, U.P. 1986b. Separate oscilla- tions of a K+-channel and of a current-source in Nitella. J. Exp. Bot. 37:34-47
Gradmann, D. 1970. Einfluss von Licht, Temperatur, und Aus- senmedium auf das elektrische Verhalten von Acetabularia crenulata. Planta (Berlin) 93:323-553
Gradmann, D. 1984. Electrogenic C1--pump in the marine alga Acetabularia. In: Chloride Transport Coupling in Biological Membranes and Epithelia. G.A. Gerencser, editor, pp. 13- 61. Elsevier, Amsterdam
Gradmann, D., Hansen, U.P., Slayman, C.L. 1982. Reaction kinetic analysis of current-voltage relationships for electro- genic pumps in Neurospora and Acetabularia. In: Electro- genic Ion Pumps. C.L. Slayman, editor. (Current Topics in Membrane and Transport., Vol. 16) pp. 257-276. Academic, New York
Gradmann, G., Klieber, H.G., Hansen, U.P. 1987. Reaction ki- netic parameters for ion transport from steady-state current- voltage curves. Biophys J. 51:569-585
Hansen, U.P. 1986. Reaction kinetic models of pumps, cotrans- porters and channels. In: Ion Channels and Electrogenic Pumps in Biomembranes. Abstracts of Lectures and Posters, Osaka University, pp. L13-L33
Hansen, U.P., Gradmann, D., Sanders, D., Slayman, C.L. 1981. Interpretation of current-voltage relationships for "act ive" ion transport systems: I. Steady-state reaction-kinetic analy- sis of class-I mechanisms. J. Membrane Biol. 63:165-190
Hansen, U.P., Tittor, J., Gradmann, D. 1983. Interpretation of current-voltage relationships for "act ive" ion transport sys-
terns: II. Nonsteady-state reaction-kinetic analysis of Class-I mechanisms with one slow time-constant. J. Membrane Biol. 75:141-169
Hirono, C., Mitsui, T. 1983. Slow onset of activation and delay of inactivation in transient current of Nitella axilliformis. Plant Cell Physiol. 24:289-299
Kishimoto, U., Kami-ike, N., Takeuchi, Y., Ohkawa, T. 1984. A kinetic analysis of the electrogenic pump of Chara corallina. I. Inhibition of the pump by DCCD. J. Membrane Biol. 80:175-183
K6hler, K., Steigner, W., Kolbowski, J., Hansen, U.P., Si- monis, W., Urbach, W. 1986. Potassium channels in Eremos- phaera viridis. II. Current- and voltage-clamp experiments. Planta 167:66-75
L~iuger, P. 1980. Kinetic properties of ion carriers and channels. J. Membrane Biol. 57:163-178
L~iuger, P., Stark, G. 1970. Kinetics of carrier-mediated trans- port across lipid bilayer membranes. Bioehim. Biophys. Acta 211:458-466
Lindemann, B. 1986a. Blocking kinetics of Na channels in apical membranes. In: Proc. Int. Union Physiol. Sci., Vol. XVI, p. 343
Lindemann, B. 1986b. Die Natrium-Kan~ile der Epithelien: Trans- portkinetik, Blockierungskinetik und Regulation. In: Phy- siologie Aktuell. B. Bromm and D.W. L/ibbers, editors. Vol. 2, pp. 111-125. Fischer, Stuttgart, New York
Lucas, W.J. 1982. How are the plasmalemma transport pro- cesses of Chara regulated? In: Membrane Transport in Plants. W.J. Cram, K. Janacek, R. Rybova and K. Sigler, editors, pp. 459-466. Akademia, Prague
Liihring, H. 1986. Recording of single K + channels in the mem- brane of cytoplasmic drop of Chara australis. Protoplasma 133:19-28
Ogata, K. 1983. The water-film electrode: A new device for mea- suring the characean electropotential and conductance distri- butions along the length of the internode. Plant Cell Physiol. 24:695-703
Ohkawa, T., Kishimoto, U. 1977. Breakdown phenomena in the Chara membrane. Plant Cell Physiol. 17:201-207
Schroeder, J.I., Hedrich, R., Fernandez, J.M. 1984. Potassium selective single channels in guard cell protoplasts of Vicia faba. Nature (London) 312:361-362
Smith, J.R. 1984. The electrical properties of plant cell mem- branes. II. Distorsion of non-linear current-voltage character- istics induced by the cable properties of Chara. Aust. J. Plant Physiol. 11:211-224
Sokolik, A.I., Yurin, V.M. 1981. Transport properties of potas- sium channels of the plasmalemma in Nitella cells at rest. Soviet Plant Physiol. 28:206-212
Sokolik, A.I., Yurin, V.M. 1986. Potassium channels in plasma- lemma of Nitella cells at rest. J. Membrane Biol. 89:9-22
Tyerman, S.D., Findlay, G.P., Paterson, G.J. 1986a. Inward membrane current in Chara inflata. I. A voltage- and time- dependent C1- component. J. Membrane Biol. 89:139-152
Tyerman, S.D., Findlay, G.P., Paterson, G.J. 1986b. Inward membrane current in Chara inflata, lI. Effects of pH, C1-- channel blockers and NH + , and significance for the hyperpo- larized state. J. Membrane Biol. 89:153-161
Warncke, J., Lindemann, B. 1985. Voltage-dependence of Na channel blockage by amiloride: Relaxation effects in admit- tance spectra. J. Membrane Biol. 86:255-265
Received 3 September 1986; revised 16 March 1987
12
Appendix
Calculation of the effect of the occupation of a lazy-state L on the steady-state I / V curves of a Class-I model
A . RATE EQUATIONS
The pseudo-4-state model in Fig. 2(B) leads to the following set of rate equations ("K" describes gross rate constants)
dN1 d t = kziN2 + K3]N3 - (k12 + KI3)NI (A1)
dN2 d--'-[- = k]zNi + K32N3 - (k21 + K23)N2 (A2)
dN3 dt = KI3N1 + K23N2 + kL3L - - (K31 -~- K32 -}- k3L)N3 (A3)
d L d~ = k3LN3 -- kL3L. (A4)
B. CALCULATION OF STEADY-STATE MEMBRANE CURRENT
The calculation of steady-state transport activity is based on the premises that all d /d t are zero. In case of Eq. (A4) this leads to
k3L L = ~ N3 = qN3. (A5)
Inserting Eq. (A5) into Eq. (A3) results in
dN3 dt = t<13N1 + K23N2 - (K3I + K32)N3. (A6)
Thus, the lazy-state L does not show up in the calculation of the equilibrium relationships. However, this does not mean that L does not show up at all. For the calculation of the current mediated by the transport system, the law of conservation of carriers has to be incorporated, and that requires the summation over all states in which the carriers can occur (Eqs. AI la,b).
The current can be calculated from the following equation (Fig. 2):
I = z F (Nlk12 - Nzkzl) (A7)
as the transitions between Nt and N z are the only ones which translocate charge in a Class-I model. Voltage-sensitivity enters the equation via
k12 = k~ (V /2ur ) , k2i = k~ (--V/2UT). (A8a,b)
The exponent comprising the temperature potential Ur
ur = R T / z F (A9)
with z, F, R, T, V having their usual meaning, implies a potential profile with the peak in the middle of the membrane (L~uger &
U.P. Hansen and J. Fisahn: Control of K' Transport
Stark, 1970). This assumption is not crucial for the conclusions obtained in this article.
As N~ and N2 change with membrane potential, they have to be replaced by Nt, the overall sum of carriers.
The calculation of the overall sum, Nt , suffers from the fact that not all intermediates of the carrier cycle are known. A solu- tion for this problem is found in the concept of "reserve factors" (Hansen et al., t981; Gradmann, Hansen & Slayman, 1982): In a chain of reactions any intermediate Nj is completely defined by the two members at either end, which are N~ and N2 in Class-I models (see Fig. 2).
Nj Kjj Kv+ Kj~ N~ + Kj~ Kzj+ Kj2 N2 = rlsNl + r2s N2. (A10a,b)
For j = 3, Eq. (A10) is obtained from Eq. (A6) for the steady-state condition d N J d t = O.
The reserve factors allow the calculation of N,
Nt = ~ r l jN t + ~ r2sN2 = riN1 + roN2. (Alla,b) J J
In most systems, the reserve factors rlj and r2j, and thus the overall reserve factors ri and ro, are still unknown. But as they are related to Nt and Nz by neutral reactions only (definitions of NI and Nx in a Class-I model, see Fig. 2), they are at least constant during an 1 /V curve measurement. This very often en- ables a useful mathematical treatment as in this article.
The pseudo-2-state model of Fig. 1C is the obvious model for the calculation of single I / V curves. From its rate equations (similar to Eqs. A1 to A4) at steady state we obtain
k12 + KI2 N1. (A12) N2 k21 + K2t
Inserting Eqs. (A1 lb) and (A12) into Eq. (A7) leads to the general formula for the current in any Class-I model:
k12 1(21 -- k21 /<12 1 = zFNt ro(Klz + k12) + ri(K21 + kl2)
(AI3)
with the voltage entering Eq. (A13) via k]2 and kzl according to Eqs. (A8a,b).
The influence of the lazy-state L is seen, if the reserve factors are split into one part including all carriers within the transport cycle and another one accounting only for L:
ri = r ~ + riL = r~ + qr13 = r ~ (1 + qrt3/r~ (Al4a,b,c)
and similarly
ro = r~ (1 + qr23/r~ (AI5)
q is introduced by means of Eq. (A5). r~ and r, ~ are independent of the membrane potential and of
the occupation of L, because only the rate constants between N3 and Ni and N3 are included in these reserve factors. Thus, they are constant in our experiments. The insertion of Eqs. (A14c) and (A15) into Eq. (A13) leads to
k12K21 - k21K12 I = zFN~ rO (1 + qr23/r~ + ki2) (A16)
+ r~ + qr13/r7)(K21 + k21).
U.P. Hansen and J. Fisahn: Control of K + Transport 13
The curve shape of the I / V curve is changed in most cases, when carriers move into or out of L. This is especially seen from the positive and the negative saturation currents
/sat+ = z F N t K2"-'~I and/sat- = zFNr K12 (Al7a,b) ro ri
because according to Eqs. (Al4c) and (A15) ro and ri suffer un- equal changes with changes in q. If
r13 r23 r-~ = 7o (AI8)
then the factors in Eq. (A16) resulting from Eqs. (Al4c) and (A15) are equal. In that case these factors could be merged into Nt . If the condition of Eq. (A18) holds, N3 is in the "reaction- kinetic middle" between iV,. and No, and the scaling factor, but not the curve shape is changed with the occupation of L.
For curve fitting of the lazy-state model (Fig. 2B) a different version of Eq. (A16) is used:
kl2K2i - - k2tKi2 1 = z F N t rOo (1 + xrn)(Ki2 + kl2) + r ~ (1 + x)(K21 + k21) (A19a)
I = z F N t (1 + xm)(Kio + kio) + (1 + x)(Koi + koi) (A19b)
In Eq. (A19b) the (only measurable) apparent rate constants indexed by i and o replacing 1 and 2 are used. These apparent rate constants are:
kio = ki2/r ~ koi = k21/r~ (A20a,b) Kio = K12/r~ Koi ~- Kzl/r~ (A20c,d) r~3 = r13/r ~ ro3 = rz3/r~ (A20e,f) Ni = N t r ~ No = N2 r~ (A20g,h)
The comparison of Eqs. (A16) and (A19) shows that
x m = qro3 and x = qri3. (A21a,b)
Rearrangement of Eqs. (A21a,b) leads to
ro3 m = - - (A22a)
ru
which is a measure of the location of N3. If m = 1, N3 is in the reaction kinetic middle.
According to Eq. (A20b), x is a parameter which increases linearly with q (Eq. A3), and thus with the occupation of L.
k3Lri3 x = kL3 (A22b)
C. DISTRIBUTION OF CARRIERS BETWEEN THE
LAZY-STATE L AND THE TRANSPORT CYCLE
According to Eq. (A6)
N3 = r n N l + r23N2 (A23)
and to. Eq. (A5), we obtain
L = qr,~ N l r ~ + qro3Nzr~ (A24)
with ri3 and ro3 being defined by Eqs. (A20e,f). The introduction of Eq. (A21) and of Eqs. (A20g,h) leads to
L = x N i + x m N o . (A25)