
Item: Impure Mixture of Plutonium Oxide and Uranium Oxide (PUUOXBC05
26
LA-13295-MS Materials Identification and Surveillance Project Item Evaluation Item: Impure Mixture of Plutonium Oxide and Uranium Oxide (PUUOXBC05) Los NATIONAL LABORATORY Alamos Los Alamos National Laboratory is operated by the University of California for the United States Department of Energy under contract W-7405-ENG-36.
-
Upload
independent -
Category
Documents
-
view
0 -
download
0
Transcript of Item: Impure Mixture of Plutonium Oxide and Uranium Oxide (PUUOXBC05

i
LA-13295-MS
Materials Identification and
Surveillance Project Item Evaluation
Item: Impure Mixture of Plutonium Oxide andUranium Oxide (PUUOXBC05)
LosN A T I O N A L L A B O R A T O R Y
AlamosLos Alamos National Laboratory is operated by the University of Californiafor the United States Department of Energy under contract W-7405-ENG-36.
ii
An Affirmative Action/Equal Opportunity Employer
This report was prepared as an account of work sponsored by an agency of the United StatesGovernment. Neither The Regents of the University of California, the United StatesGovernment nor any agency thereof, nor any of their employees, makes any warranty, expressor implied, or assumes any legal liability or responsibility for the accuracy, completeness, orusefulness of any information, apparatus, product, or process disclosed, or represents that itsuse would not infringe privately owned rights. Reference herein to any specific commercialproduct, process, or service by trade name, trademark, manufacturer, or otherwise, does notnecessarily constitute or imply its endorsement, recommendation, or favoring by The Regentsof the University of California, the United States Government, or any agency thereof. Theviews and opinions of authors expressed herein do not necessarily state or reflect those ofThe Regents of the University of California, the United States Government, or any agencythereof. Los Alamos National Laboratory strongly supports academic freedom and aresearcher's right to publish; as an institution, however, the Laboratory does not endorse theviewpoint of a publication or guarantee its technical correctness.
Edited by: Margaret Burgess, Group CIC-1Photocomposition by: Deidre´ A. Plumlee, Comforce, for Group CIC-1;Barbara A. Ritchie, Group CIC-1
This work was supported by US Department of Energy,Office of Environmental Management EM-66 Nuclear MaterialsStabilization Office.

Materials Identification andSurveillance Project Item Evaluation
LA-13295-MS
UC-940 and UC-904Issued: June 1997
Item: Impure Mixture of Plutonium Oxide andUranium Oxide (PUUOXBC05)
Tom AllenQuentin AppertCharles DavisJohn HaschkeWilliam HollisDavid HorrellAaron MartinezRichard MasonLuis MoralesJim RubinCraig TaylorJohn TelfordAndreas ToupadakisJeremy Trujillo
LosN A T I O N A L L A B O R A T O R Y
AlamosLos Alamos, New Mexico 87545
v
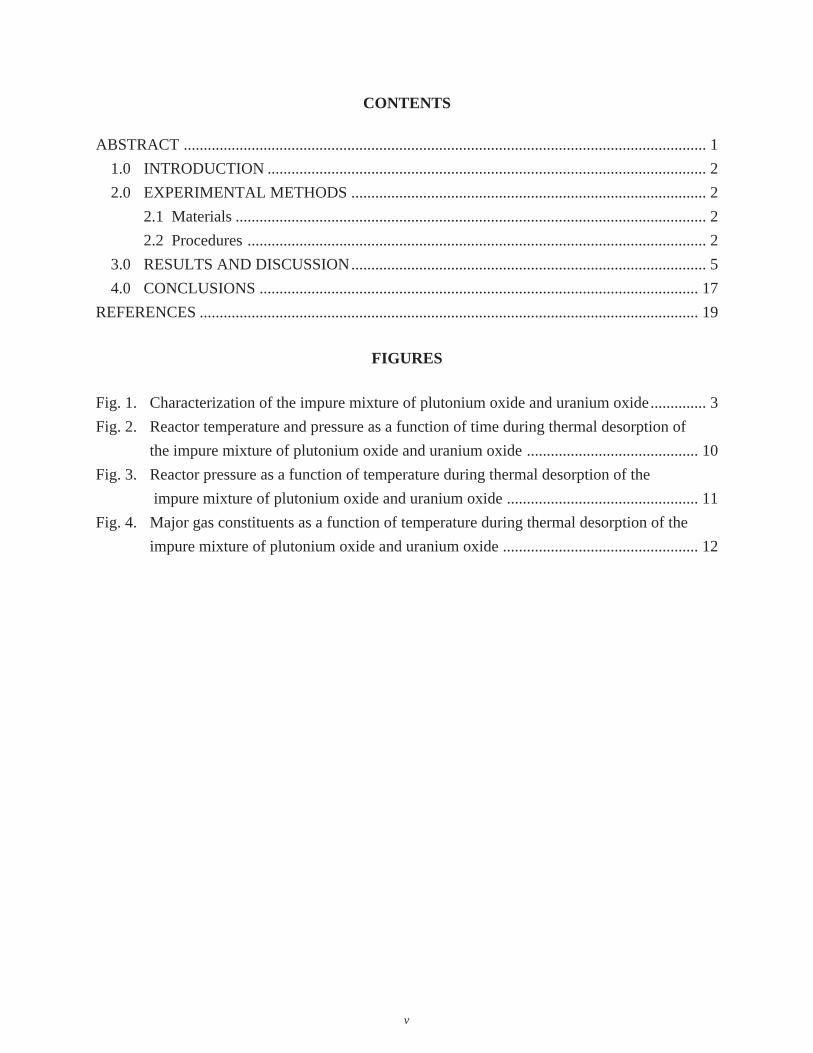
CONTENTS
ABSTRACT ................................................................................................................................... 1
1.0 INTRODUCTION .............................................................................................................. 2
2.0 EXPERIMENTAL METHODS ......................................................................................... 2
2.1 Materials ...................................................................................................................... 2
2.2 Procedures ................................................................................................................... 2
3.0 RESULTS AND DISCUSSION......................................................................................... 5
4.0 CONCLUSIONS .............................................................................................................. 17
REFERENCES ............................................................................................................................. 19
FIGURES
Fig. 1. Characterization of the impure mixture of plutonium oxide and uranium oxide.............. 3
Fig. 2. Reactor temperature and pressure as a function of time during thermal desorption of
the impure mixture of plutonium oxide and uranium oxide ........................................... 10
Fig. 3. Reactor pressure as a function of temperature during thermal desorption of the
impure mixture of plutonium oxide and uranium oxide ................................................ 11
Fig. 4. Major gas constituents as a function of temperature during thermal desorption of the
impure mixture of plutonium oxide and uranium oxide ................................................. 12

vi
TABLES
Table I. Percent Mass Loss During Calcination of Sample PUUOXBC05 ............................ 5
Table II. LOI Analyses Results of the Impure Mixture of Plutonium Oxide and
Uranium Oxide .......................................................................................................... 6
Table III. Elemental Analysis of Precalcined Powder S and Calcined Powders S′ and S″ ....... 7
Table IV. Comparison of Specific Surface Area Results for Pure Plutonium Oxide, Impure
Plutonium Oxide, and Impure MOX. ........................................................................ 7
Table V. Particle Analysis Results of Precalcined Powder S and Calcined Powders S′and S″......................................................................................................................... 8
Table VI. Isotopic Distribution of Plutonium and Uranium for the “As-received”
Powder S .................................................................................................................... 8
Table VII. Thermal Desorption-Gas Composition of Sample S2 at 175°C ............................... 14
Table VIII. Thermal Desorption-Gas Composition of Sample S2 at 210°C ............................... 14
Table IX. Thermal Desorption-Gas Composition of Sample S2 at 275°C ............................... 15
Table X. Thermal Desorption-Gas Composition of Sample S2 at 520°C ............................... 15
Table XI. Thermal Desorption-Gas Composition of Sample S2 at 577°C ............................... 15
Table XII. Thermal Desorption-Gas Composition of Sample S2 at 780°C ............................... 16
Table XIII. Thermal Desorption-Gas Composition of Sample S2 at 980°C ............................... 17
1
MATERIALS IDENTIFICATION AND SURVEILLANCEPROJECT ITEM EVALUATION
Item: Impure Mixture of Plutonium Oxide and Uranium Oxide (PUUOXBC05)
by
Tom Allen, Quentin Appert, Charles Davis, John Haschke, William Hollis,
David Horrell, Aaron Martinez, Richard Mason, Luis Morales, Jim Rubin,
Craig Taylor, John Telford, Andreas Toupadakis, and Jeremy Trujillo
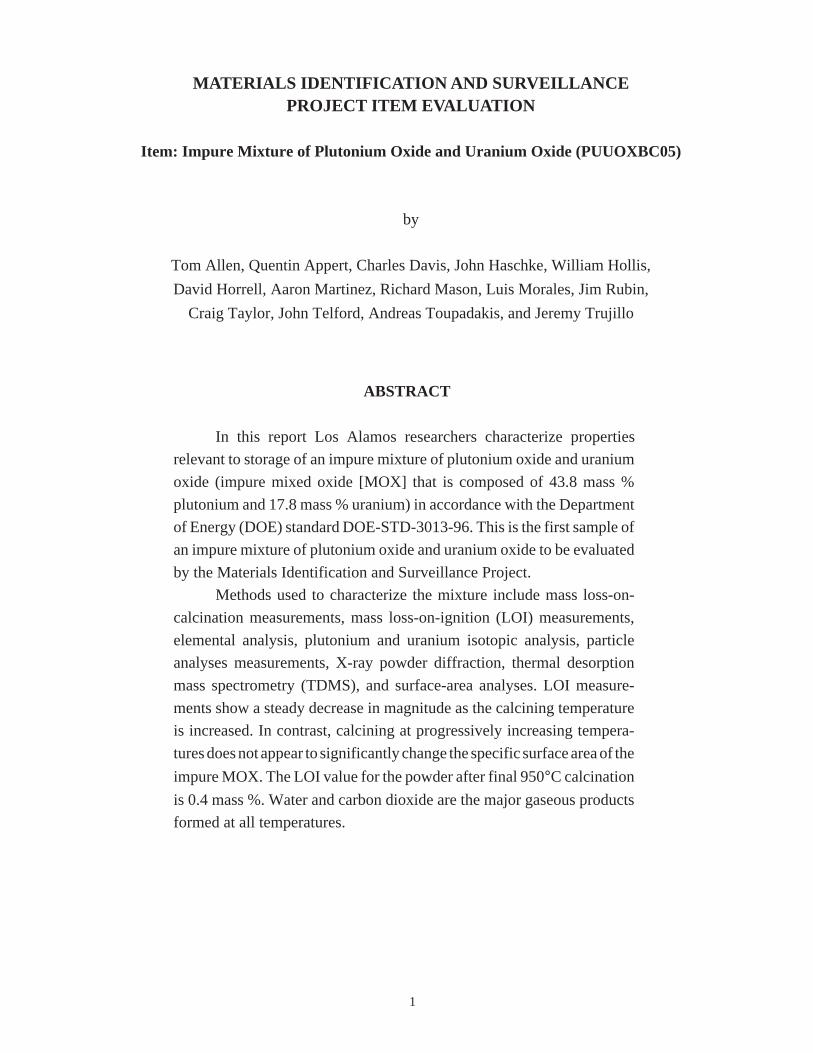
ABSTRACT
In this report Los Alamos researchers characterize properties
relevant to storage of an impure mixture of plutonium oxide and uranium
oxide (impure mixed oxide [MOX] that is composed of 43.8 mass %
plutonium and 17.8 mass % uranium) in accordance with the Department
of Energy (DOE) standard DOE-STD-3013-96. This is the first sample of
an impure mixture of plutonium oxide and uranium oxide to be evaluated
by the Materials Identification and Surveillance Project.
Methods used to characterize the mixture include mass loss-on-
calcination measurements, mass loss-on-ignition (LOI) measurements,
elemental analysis, plutonium and uranium isotopic analysis, particle
analyses measurements, X-ray powder diffraction, thermal desorption
mass spectrometry (TDMS), and surface-area analyses. LOI measure-
ments show a steady decrease in magnitude as the calcining temperature
is increased. In contrast, calcining at progressively increasing tempera-
tures does not appear to significantly change the specific surface area of the
impure MOX. The LOI value for the powder after final 950°C calcination
is 0.4 mass %. Water and carbon dioxide are the major gaseous products
formed at all temperatures.
2
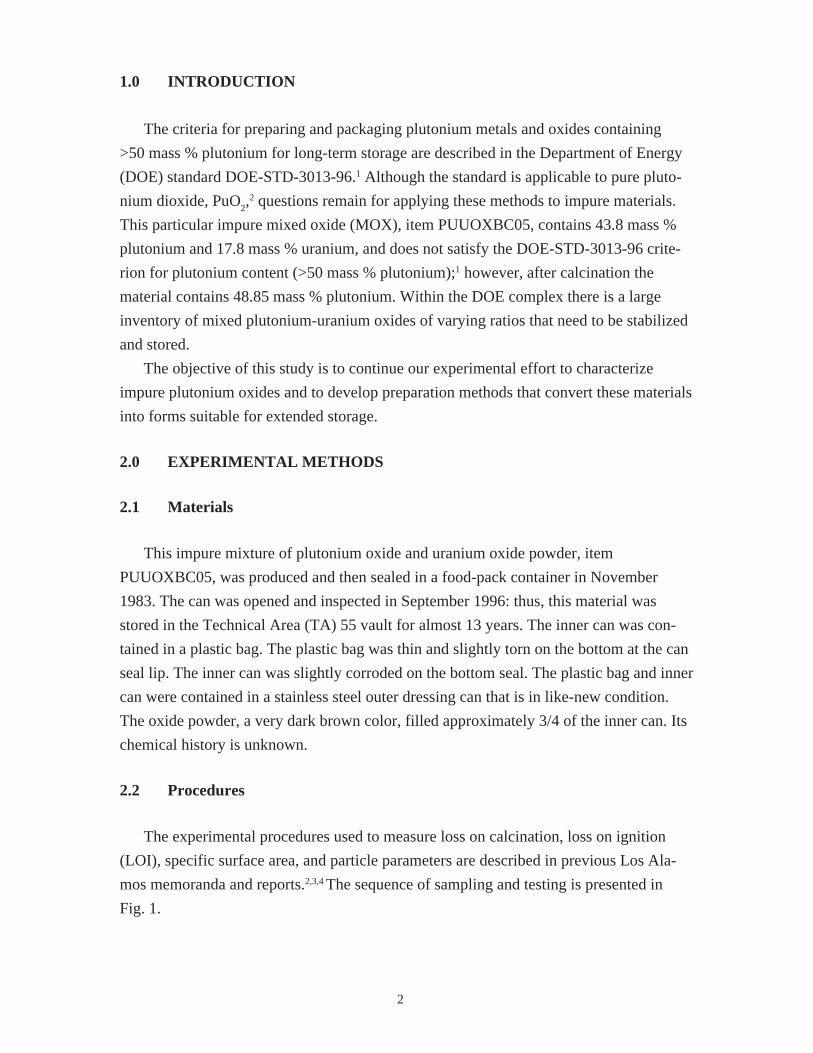
1.0 INTRODUCTION
The criteria for preparing and packaging plutonium metals and oxides containing
>50 mass % plutonium for long-term storage are described in the Department of Energy
(DOE) standard DOE-STD-3013-96.1 Although the standard is applicable to pure pluto-
nium dioxide, PuO2,2 questions remain for applying these methods to impure materials.
This particular impure mixed oxide (MOX), item PUUOXBC05, contains 43.8 mass %
plutonium and 17.8 mass % uranium, and does not satisfy the DOE-STD-3013-96 crite-
rion for plutonium content (>50 mass % plutonium);1 however, after calcination the
material contains 48.85 mass % plutonium. Within the DOE complex there is a large
inventory of mixed plutonium-uranium oxides of varying ratios that need to be stabilized
and stored.
The objective of this study is to continue our experimental effort to characterize
impure plutonium oxides and to develop preparation methods that convert these materials
into forms suitable for extended storage.
2.0 EXPERIMENTAL METHODS
2.1 Materials
This impure mixture of plutonium oxide and uranium oxide powder, item
PUUOXBC05, was produced and then sealed in a food-pack container in November
1983. The can was opened and inspected in September 1996: thus, this material was
stored in the Technical Area (TA) 55 vault for almost 13 years. The inner can was con-
tained in a plastic bag. The plastic bag was thin and slightly torn on the bottom at the can
seal lip. The inner can was slightly corroded on the bottom seal. The plastic bag and inner
can were contained in a stainless steel outer dressing can that is in like-new condition.
The oxide powder, a very dark brown color, filled approximately 3/4 of the inner can. Its
chemical history is unknown.
2.2 Procedures
The experimental procedures used to measure loss on calcination, loss on ignition
(LOI), specific surface area, and particle parameters are described in previous Los Ala-
mos memoranda and reports.2,3,4 The sequence of sampling and testing is presented in
Fig. 1.

3
Samplefrom the
Vault
S
S1
S2
SA
S3
S″
S1 0
S1 1
S′
S5
S8
950°C2 h
Elemental Analys i s Table III5. 08 mass %
Moisture Adsorption
For 5 days0. 12 mass %
Table IV, V6. 37 mass %
S urface Area, Parti cl e S i ze
Elemental Analys i s Table III1. 85 mass %
Table IV, V1. 67 mass %
S urface Area, Parti cl e S i ze
Elemental Analys i s Table III0. 17 mass %
Table IV0. 40 mass %
S urface Area, Parti cl e S i ze
LOI (900°C/2 h)
LOI (1000°C/2 h)
LOI (900°C/2 h)
LOI (1000°C/2 h)
LOI (900°C/2 h)
LOI (1000°C/2 h)
Thermal Desorption Figs . 2–4Tables VII-XIIIMass S pectroscopy
600°C12 h
Fig. 1. Characterization of the impure mixture of plutonium oxide and uranium
oxide.

4
After samples were taken from the as-received material, sample S (the remaining
powder) was calcined at 600°C to produce sample S'. After samples were taken from the
600°C calcined powder, all of the remaining powder was calcined at 950°C to produce
sample S''.
In brief, LOI data were obtained as follows. Each of three sample sets was halved and
placed in a platinum calcining boat. All six boats were heated in the LOI furnace during
the same furnace run. The furnace was ramped to 1000°C in approximately 4 h, held at
1000°C for 2 h, and cooled to 200°C in approximately 12 h. The samples were held at
200°C until they were removed from the furnace. After removing the samples from the
furnace, they were immediately placed in a desiccator until they were cooled to room
temperature and weighed. Materials S and S′ were placed in ceramic calcining boats and
then calcined in a calibrated muffle furnace.
Elemental analyses were performed on the as-received precalcined powder (sample
S), 600°C calcined powder (sample S′), and 950°C calcined powder (sample S″). Ura-
nium content was measured and plutonium and uranium isotopic analyses were per-
formed only for the as-received material.
Before particle size analysis was performed, each sample was heated at 350°C for
16 h in a vacuum. Particle size distribution was analyzed on a NOVA-1000 Brunauer-
Emmett-Teller (BET) Surface Area Analyzer™. Five-point BET analysis was used to
determine the specific surface area and a single-point specific surface area analysis was
also used. Each powder set (precalcined, 600°C calcined, and 950°C calcined) was split
and measured using both the five-point BET analysis and the single-point specific surface
area analysis.
Samples S1, S
5, and S
10 were examined by X-ray powder diffraction (see Fig. 1). The
samples were prepared for X-ray diffraction by light grinding with an Al2O
3 mortar and
pestle. A 1 mg portion of the sample was then loaded into a 0.2 mm quartz capillary. The
capillary was cut to the appropriate length, sealed with epoxy, and centered in a Debye-
Scherrer™ camera containing Kodak DEF-392™ film. The sample was exposed to
nickel-filtered copper radiation for 6.5 h; the X-ray tube settings were 35 kV and 25 mA.
Thermal desorption mass spectrometry (TDMS) was performed on the as-received
sample S2 (see Fig. 1). An amount of 9.959 g of the material was placed in a 10 cm3
tantalum cup. The weighed cup and oxide were placed inside a magnesium oxide, MgO,
crucible and this assembly placed in the reactor constructed of a 1.5-in. schedule 40
stainless steel tube approximately 16-in. long with a welded plug on the bottom and a

5
ConflatTM flange on the top. A thermocouple pass through and high-pressure nipple were
welded to a mating ConflatTM flange. When the reactor was assembled, the thermocouple
was located between 0.25 in. and 0.5 in. above the oxide surface. The reactor was con-
nected to the pressure vacuum system, evacuated, and leak checked. A 1200°C clam-
shell tube furnace is placed around the reactor that was maintained under dynamic
vacuum conditions during heating. The furnace was programmed for an 8 h rise from
room temperature to 950°C. The residual gas analyzer (RGA) is calibrated using standard
procedures. Mass spectra were taken approximately every 15 min, and the reactor tem-
perature and pressure were recorded throughout the run.
3.0 RESULTS AND DISCUSSION
Before the first calcination, 112.6 g of powder S was set in a glovebox. After 5 days
of exposure to the glovebox atmosphere, the weight of powder S increased by
0.12 mass %.
Each time the powder was calcined the percent mass loss was measured. During the
second calcination step the percent mass loss was half of the percent mass loss during the
first calcination step. The results are shown below in Table I.
Table I. Percent Mass Loss During Calcination of Sample PUUOXBC05a
aThe whole as-received batch was first calcined at 600°C. After sampling the 600°C calcined powder, this
entire batch was calcined at 950°C.
Table II shows that LOI values steadily decrease in magnitude as the calcining tem-
perature is increased. The LOI value (at 1000°C for 2 h) for the 950°C calcined powder is
0.4 mass %. The effect of the temperature at which the LOI measurement is performed is
noticeable.
CalcinationTemperature
(oC)
HeatingTime(h)
Mass BeforeCalcination
(g)
Mass AfterCalcination
(g)
Mass Loss(%)
600 12 1 160.2 1 108.4 4.4
950 2 1 058.7 1 036.3 2.1

6
Table II. LOI Analyses Results of the Impure Mixture of Plutonium Oxide andUranium Oxide
aPowder S is the impure oxide from the vault before any calcination.bPowder S′ is obtained after impure oxide S is calcined at 600°C for 12 h.c Powder S″ is obtained after impure oxide S' is calcined at 950°C for 2 h.
Plutonium, nickel, calcium, copper, magnesium, and zinc concentrations increased
after the 600°C calcining step and subsequently decreased after the 950°C calcining step.
Lithium and carbon were the only elements for which concentration decreased after both
the 600°C and the 950°C calcining. Table III shows these results and the elements found.
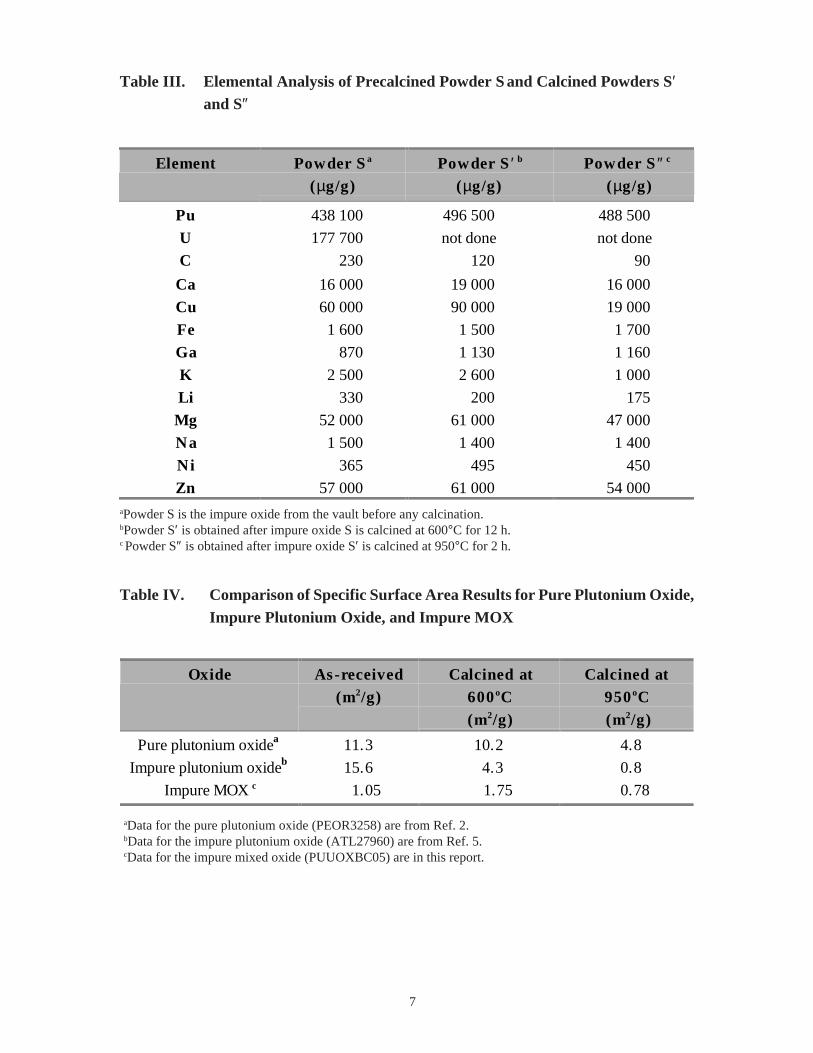
The as-received powder S has a specific surface area of 1.05 m2/g; and the 950°Ccalcined powder S'' has a specific surface area of 0.78 m2/g. The specific surface area of
600°C calcined material (sample S′) is larger than the specific surface area of both the as-
received and the 950°C (sample S″) calcined material. One of the two measurements at
600°C was over 70% larger than the other; so, one of the two measurements may be in
error. Nevertheless, for this impure mixed oxide (PUUOXBCO5) heating the powder to
600°C and 950°C does not appear to significantly change its specific surface area. In
contrast, the previous oxides studied, ATL27960 and PEOR3258,5 show that calcination
significantly changed their specific surface areas (see Table IV). The two impure oxides
calcined at 950°C show almost identical specific surface area values of about 0.8 m2/g.
This value of specific surface area for the impure oxides is six times smaller than that for
the pure plutonium oxide. This smaller value can be attributed to sintering during the
heating process facilitated by the presence of inorganic salts as impurities.
LOIConditions
Powder S a LOI(mass %)
Powder S ′b LOI(mass %)
Powder S ″c LOI(mass %)
900oC for 2 h 5.08 1.85 0.17
1000oC for 2 h 6.37 1.67 0.40
7
Table III. Elemental Analysis of Precalcined Powder S and Calcined Powders S′and S″
aPowder S is the impure oxide from the vault before any calcination.bPowder S′ is obtained after impure oxide S is calcined at 600°C for 12 h.c Powder S″ is obtained after impure oxide S′ is calcined at 950°C for 2 h.
Table IV. Comparison of Specific Surface Area Results for Pure Plutonium Oxide,Impure Plutonium Oxide, and Impure MOX
aData for the pure plutonium oxide (PEOR3258) are from Ref. 2.bData for the impure plutonium oxide (ATL27960) are from Ref. 5.cData for the impure mixed oxide (PUUOXBC05) are in this report.
Element Powder S a
(µg/g)Powder S ′ b
(µg/g)Powder S ″ c
(µg/g)
Pu 438 100 496 500 488 500
U 177 700 not done not done
C 230 120 90
Ca 16 000 19 000 16 000
Cu 60 000 90 000 19 000
Fe 1 600 1 500 1 700
Ga 870 1 130 1 160
K 2 500 2 600 1 000
Li 330 200 175
Mg 52 000 61 000 47 000
Na 1 500 1 400 1 400
Ni 365 495 450
Zn 57 000 61 000 54 000
Oxide As-received(m2/g)
Calcined at600oC(m2/g)
Calcined at950oC (m2/g)
Pure plutonium oxidea 11.3 10.2 4.8
Impure plutonium oxideb 15.6 4.3 0.8
Impure MOX c 1.05 1.75 0.78

8
As expected, particle analysis showed an increase in the values of spherical equiva-
lent mean and diameter-by-volume mean after the first calcination step, but particle
analysis unexpectedly showed a decrease in these values after the second calcination step
(see Table V).
Table V. Particle Analysis Results of Precalcined Powder S and Calcined Powders S′and S″
aPowder S is the impure oxide from the vault before any calcination.bPowder S′ is obtained after impure oxide S is calcined at 600°C for 12 h.c Powder S″ is obtained after impure oxide S′ is calcined at 950°C for 2 h.
The isotopic distribution of plutonium and uranium was also measured for the as-
received powder S and the results are shown in Table VI.
Table VI. Isotopic Distribution of Plutonium and Uranium for the “As-received”Powder S
Property Powder S a Powder S ′ b Powder S ′′ c
Spherical equivalent mean (µm) 14.2 19.1 16.65
Diameter-by-volume mean (µm) 50.35 75.05 60.9
Isotope Atomic % Mass %
Pu-238 0.0142 0.0141
Pu-239 94.8383 94.8171
Pu-240 4.9999 5.0197
Pu-241 0.1156 0.1165
Pu-242 0.0322 0.0325
Pu-244 0.0000 0.0000
Total 100 100
U-233 0.0000 0.0000
U-234 0.0498 0.0490
U-235 4.3734 4.3206
U-236 0.0474 0.0470
U-238 95.5295 95.5835
Total 100 100

9
The X-ray powder diffraction results for samples S1, S
5, and S
10 are summarized as
follows. The as-received material, S1, was determined to be a face-centered cubic, space
group Fm3m, solid solution of PuO2 and UO
2 with a lattice constant of 5.4067(5) Å. The
composition of this solid solution, based on the lattice constant, was Pu0.82
U0.18
O2+x
.6,7
However, this formula does not agree very well with Pu:U ratio based on chemical
analyses (see Table III). In addition, CuO and MgO were found as minor phases. Sample
S5 was found to be Pu
0.82U
0.18O
2+x, with a lattice constant of 5.3973(5) Å, and with CuO
and MgO as minor phases. Sample S5 contained less CuO than sample S
1. Sample S
10 was
a mixture of Pu0.82
U0.18
O2+x
, with a lattice constant 5.3832(8) Å, and MgO. Copper oxide
was not found. The lattice contraction upon firing indicated that a substantial amount of
uranium was oxidized to +5. The oxygen stoichiometry could not be determined quantita-
tively, however 0 < x < 0.12. Based on this range of oxygen composition, the maximum
mass increase due to the oxidation of UO2 in the sample is 0.72 g per 100 g of sample.
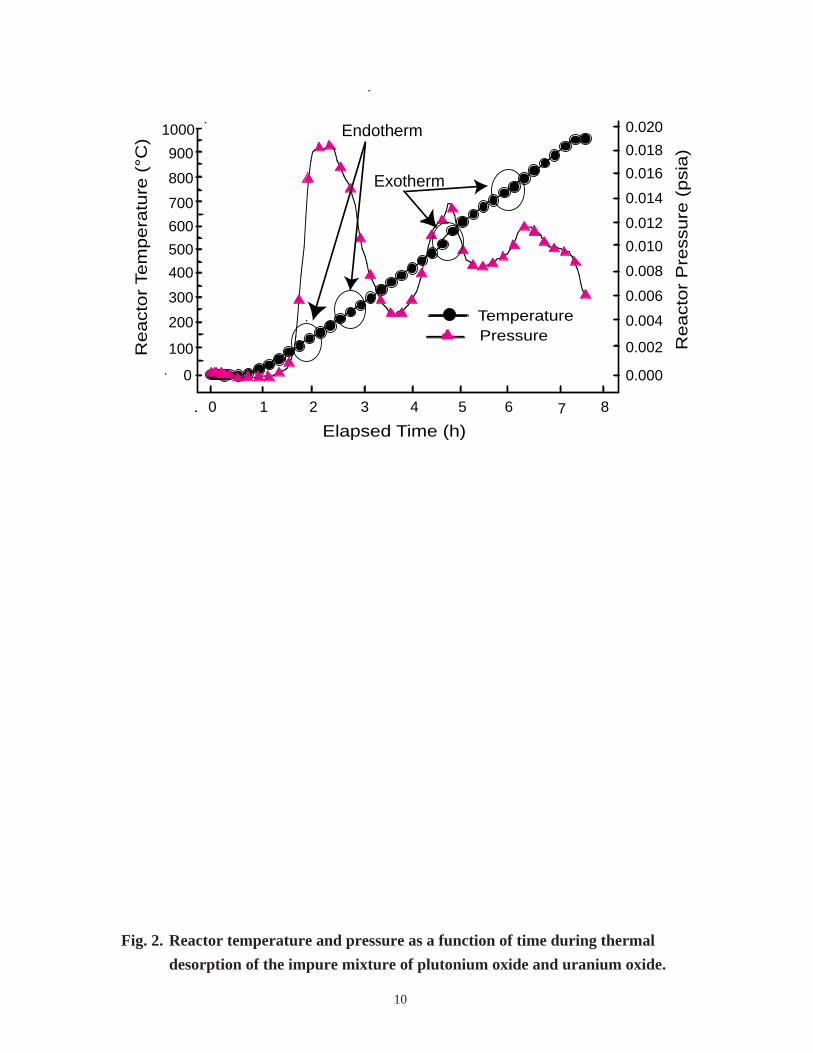
The TDMS results for sample S2 are summarized as follows. A plot of reactor tem-
perature and pressure as a function of time is shown in Fig. 2. A plot of reactor pressure
as a function of temperature is shown in Fig. 3. Figure 4 shows the major gas constituents
as a function of temperature. A large pressure spike is observed in Fig. 2 at approxi-
mately 2 h, and the temperature of the reactor is approximately 150°C. The temperature
plot in Fig. 2 shows an endothermic drop in temperature at 125°C that directly corre-
sponds to the pressure rise. This endothermic process appears between 125°C and 225°Cwhile water is vaporized. An endotherm appears when the observed temperature is lower
than the programmed temperature. The lower temperature remains as long as the endo-
thermic process continues to cool the sample. A false exotherm is observed after the
endothermic process is completed and the temperature recovers.
The gas composition is shown in Table VII. At this point, the major constituent of the
gas mixture is water. The pressure then drops slightly (Fig. 3) followed by a slight pres-
sure increase between 2.4 h and 2.75 h. The gas analysis shows a loss of O2 and CO
2 and
a small increase in the water concentration (Table VIII). Some minor unidentified peaks
are also present. The water pressure now drops off radically with a small shoulder ob-
served at about 275°C (Table IX). Figure 4 shows C2H
6, CO
2, and CO are essentially
constant between 150°C and 350°C. Their percent amounts increase because water
decreases somewhat. All gases continue to fall off until a pressure minimum is reached at
about 380°C. The pressure then starts to rise to a pressure plateau at about 510°C (Table
X). This is followed by a sharp pressure rise at 570°C (Table XI). An exotherm appears
between 525°C and 725°C where CO2 is the major gaseous product. The gas composition
10
Fig. 2. Reactor temperature and pressure as a function of time during thermal
desorption of the impure mixture of plutonium oxide and uranium oxide.
(
900
800
700
600
500
0
100
200
400
300
1000 0.020
0.018
0.016
0.014
0.012
0.010
0.008
0.006
0.004
0.002
0.000
0 81 2 3 4 5 6 7
React
or
Tem
pera
ture
(°C
)
React
or
Pre
ssure
(psi
a)
Elapsed Time (h)
Temperature Pressure
Endotherm
Exotherm

11
Fig. 3. Reactor pressure as a function of temperature during thermal desorption of
the impure mixture of plutonium oxide and uranium oxide.
0.018
0.020
0.016
0.014
0.012
0.010
0.008
0.006
0.004
0.002
0.000
0 100 200 300 400 500 600 700 800 900 1000
Re
ac
tor
Pre
ss
ure
(p
sia
)
Temperature ( C)o

12
Fig. 4. Major gas constituents as a function of temperature during thermal desorption of the impure mixture of plutonium oxide
and uranium oxide.
0 100 200 300 400 500 600 700 800 900 100010- 13
10-12
10-11
10-10
10-9
10-8
10-7
Pea
k In
tens
ity (
A)
H
H O
N /CO
C H
O
amu 36
CO
CH
Temperature (°C)
2
2
2
2
2
6
4
2
13
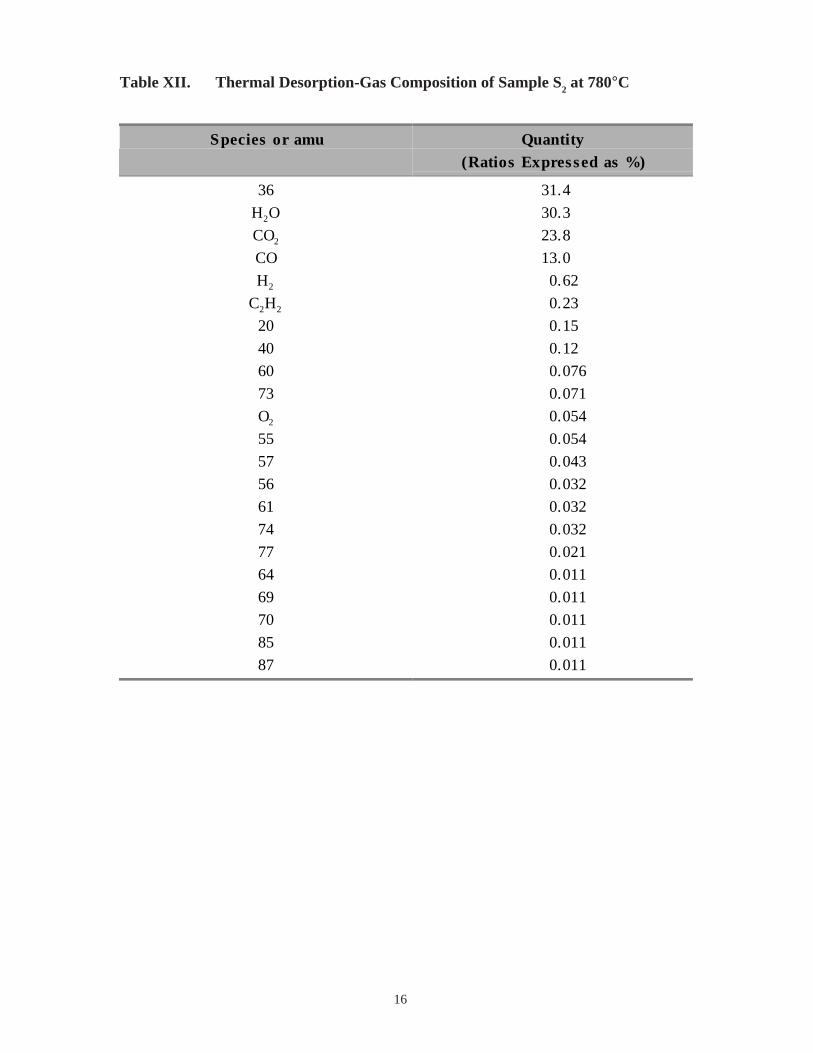
and distribution in this region does not change substantially. The pressure now drops to a
second minimum followed by a rise to a pressure plateau at about 780°C (Table XII). The
major constituent, atomic mass unit (amu) 36, has not been identified. The pressure drops
off to a plateau at about 910°C (Table XIII), but the gas composition does not change
radically.
The reactor was cooled and disassembled. A large amount of unidentified material
was plated out on the cooler reactor surfaces. The tantalum cup and oxide were re-
weighed and the mass loss, 11.6% on thermal treatment during TDMS (up to 1000°Cwithin 8 h), was calculated based on the weight difference. This is about a factor of 2
greater than that measured by conventional LOI analyses (Table II). A possible explana-
tion for the difference in these values may be that the TDMS was run under dynamic
vacuum conditions, resulting in vaporization of some volatile residues. Mass loss may
also be due to the tantalum cup used. It is known that Ta2O
5 forms under oxidizing condi-
tions and is highly volatile.
Water is seen throughout the process; however, the largest quantity is observed
between 175°C and 340°C. The CO and CO2 that evolved and the pressure stages suggest
the decomposition of carbonates that formed during storage, as well as the desorption of
adsorbed CO2. The methane and ethane that evolve during thermal desorption may result
from the decomposition of small amounts of hydrocarbon contamination in the sample, or
they may result from catalytic reaction of hydrogen and carbon on platinum-rich oxide
surface. Chemical analyses of the sample show, in addition to plutonium and uranium,
high quantities of sodium, zinc, potassium, lithium, calcium, and magnesium, but the
specific chemical forms of these six elements are unknown. The residues plated out on
the reactor surface probably contain these materials. TDMS measures only permanent
gases. Volatile inorganics are plated out on the cooler surfaces of the reactor and do not
reach the analyzer. There were no peaks observed past 90 amu. Many unidentified peaks
were observed at the higher temperatures (Tables XII and XIII), but make up only about
0.5% of the total gas mixture. Attempts to match these peaks with volatile inorganic
species failed. At this temperature it is unlikely that complex organic molecules would
survive. Work will continue to identify these peaks.
In mass spectroscopy, the gas molecules that comprise the analyte are ionized. The
ions are then accelerated across a potential difference, through a mass filter, to a detector.
The mass filter separates the ions so that only a specific ion reaches the detector. The
results are generally displayed as a table or graph showing the ratio of ion mass to charge

14
in contrast to the ion current (in amperes). The ion current is directly proportional to the
amount of that ion present in the analyte. The quantitative analysis of mass spectra
requires that each mass peak be identified as a parent or daughter peak of the compounds
in the analyte. After each peak is identified, it is normalized to nitrogen, based on the
ionization cross section for that compound. The quantity of that molecule is directly
related to the total normalized ion current for that molecule. The quantity of a specific
molecule in a given analyte is calculated using the sample pressure, molecule ion current,
and the total ion current for the analyte. In the data from this test it was not possible to
identify all of the peaks and, therefore, the quantitative results described above are not
presented. The ratio of the ion current of a specific peak over the total ion current is
presented in the tables below and represents approximately a ±10% error in the amount of
a given molecule when compared with real quantitative results.
Table VII. Thermal Desorption-Gas Composition of Sample S2 at 175°C
Table VIII. Thermal Desorption-Gas Composition of Sample S2 at 210°C
Species or amu Quantity(Ratios Expressed as %)
H2O 90.77
CO2 2.99
O2 2.57
CO 1.74
C2H2 1.25
H2 0.68
Species or amu Quantity(Ratios Expressed as %)
H2O 91.6
CO2 2.5
CO 1.9
H2 1.4
C2H2 1.4
O2 0.95
20 0.18
40 0.021
61 0.010

15
Table IX. Thermal Desorption-Gas Composition of Sample S2 at 275°C
Table X. Thermal Desorption-Gas Composition of Sample S2 at 520°C
Table XI. Thermal Desorption-Gas Composition of Sample S2 at 577°C
Species or amu Quantity(Ratios Expressed as %)
H2O 72.4
CO2 8.4
C2H2 7.8
CO 6.7
H2 4.5
20 0.13
O2 0.045
50 0.033
40 0.017
Species or amu Quantity(Ratios Espressed as %)
CO2 60.8
H2O 20.6
CO 15.9
O2 1.78
C2H2 0.57
H2 0.36
20 0.037
64 0.009
Species or amu Quantity(Ratios Expressed as %)
CO2 62.7
H2O 22.0
CO 12.2
O2 2.4
C2H2 0.49
H2 0.15
20 0.049
16
Table XII. Thermal Desorption-Gas Composition of Sample S2 at 780°C
Species or amu Quantity(Ratios Expressed as %)
36 31.4
H2O 30.3
CO2 23.8
CO 13.0
H2 0.62
C2H2 0.23
20 0.15
40 0.12
60 0.076
73 0.071
O2 0.054
55 0.054
57 0.043
56 0.032
61 0.032
74 0.032
77 0.021
64 0.011
69 0.011
70 0.011
85 0.011
87 0.011

17
Table XIII. Thermal Desorption-Gas Composition of Sample S2 at 980°C
4.0 CONCLUSIONS
We continue studies to define the conditions for preparing and handling impure
plutonium oxide for long-term storage. It becomes progressively apparent, as it was
expected, that the identity and concentration of impurities determine the physical and
chemical behavior of the impure oxide.
Species or amu Quantity(Ratios Expressed as %)
CO2 47.13
H2O 17.95
CO 16.83
36 16.83
H2 0.66
C2H2 0.13
20 0.079
60 0.067
56 0.045
57 0.045
73 0.045
O2 0.036
55 0.034
61 0.034
40 0.022
85 0.022
69 0.011
74 0.011
87 0.011

18
We obtained the following results in the course of this study for the impure mixed
oxide PUUOXBC05:
• Thermal treatment makes the impure MOX conform to the DOE-STD-3013-961 LOI
requirement of <0.5 mass % loss tested at 1000°C for 2 h.
• Heating the powder to 600°C and 950°C does not appear to significantly change the
specific surface area.
• The specific surface area of the powder calcined at 950°C is 6 times smaller than that
of the pure plutonium oxide calcined at 950°C and is comparable to the specific
surface area of the previously studied impure oxide (ATL27960), approximately
0.8 m2/g. Impurities appear to facilitate sintering.
• For a 100°C increase (i.e., 1000°C for 2 h instead of 900°C for 2 h) an LOI of
0.40 mass % was found instead 0.17 mass % for the calcined sample S''. LOI condi-
tions appear to be important for impure oxides.
• The calculated mass loss of 11.6% on thermal treatment during TDMS (up to 1000°Cwithin 8 h) for the as-received sample S, is about a factor of 2 greater than that mea-
sured by conventional LOI analyses, 6.37% (at 1000°C for 2 h), possibly because the
TDMS was run under dynamic vacuum conditions that resulted in vaporization of
volatile residues. Another possible reason for the observed large value of 11.6% mass
loss on thermal treatment during TDMS is the longer time used, 8 h compared with
2 h by conventional LOI analyses. The vaporization of tantalum (tantalum cup) as
T2O
5 on thermal treatment of the MOX sample during TDMS cannot be excluded.
• Chemisorbed water is the primary gaseous product observed during calcination of the
oxide and appears throughout the TDMS process. The largest quantity of water is
seen between 175°C and 340°C.
• The CO2 that evolves during thermal desorption at low temperatures should be due to
the desorption of absorbed CO2. The CO
2 that evolves during thermal desorption at
high temperatures suggests the decomposition of carbonates that formed during
storage. Water and carbon dioxide are the major gases formed between 450°C and
950°C.
• The methane and ethane that evolve during thermal desorption may result from the
decomposition of small amounts of hydrocarbon contamination in the sample, or they
may result from catalytic reaction of hydrogen and carbon on a plutonium-rich oxide
surface.
19
REFERENCES
1. “Criteria for Preparing and Packaging Plutonium Metals and Oxides for Long-Term
Storage,” Department of Energy document DOE-STD-3013-96 (September 1996).
2. J. M. Haschke and T. E. Ricketts, “Plutonium Dioxide Storage: Conditions for
Preparation and Handling,” Los Alamos National Laboratory report LA-12999-MS
(August 1995).
3. T. E. Ricketts, “Phase II-Plutonium Dioxide Preparation Procedure and
Characterization Results,” Los Alamos National Laboratory memorandum
NMT-2: FY96-308 to B. Marshall (March 30, 1996).
4. T. E. Ricketts, “Characterization Results of Impure Plutonium Dioxide,” Los Alamos
National Laboratory memorandum NMT-2: FY96-200 to David Horrell (May 4,
1996).
5. T. Allen et al., “Materials Identification and Surveillance Project Item Evaluation,
Items: Impure Plutonium Oxide (ATL27960) and Pure Plutonium Oxide
(PEOR3258),” Los Alamos National Laboratory report LA-13246-MS (March 1997).
6. T. D. Chikalla, "Studies on the Oxides of Plutonium," in Plutonium 1960, E. Grison,
W. Lord, and R. Fowler, Eds. (Cleaver-Hume Press, Ltd., London, 1961), p. 455.
7. T. L. Markin and R. S. Street, "The Uranium-Plutonium-Oxygen Ternary Phase
Diagram," Journal of Inorganic and Nuclear Chemistry 29, 2265–2280 (1967).
vii
This report has been reproduced directly from thebest available copy.
It is available to DOE and DOE contractors fromthe Office of Scientific and Technical Information,P.O. Box 62,Oak Ridge, TN 37831.Prices are available from(615) 576-8401.
It is available to the public from theNational Technical Information Service,US Department of Commerce,5285 Port Royal Rd.,Springfield, VA 22616.

viii
LosN A T I O N A L L A B O R A T O R Y
AlamosLos Alamos, New Mexico 87545