Southeast Asia Report - Defense Technical Information Center
Upload
khangminh22Category
view
1download
0
S nAI:,RC 1-1 and
IT C IH NWOL.O' GYaI_______________ _I' N 00 RW P0 R . A T Al D
DEVELOPIV!: 'T LIFE SCIENCES DIVISION
OCULAR EFFECTS OF NEAR INFRARED LASER
RADIATION FOR SAFETY CRITERIA
ffUNE, 1972, D D C
FINAL REPORT JUL 27 197 .
:1. B
I. Aix Fo'ce Contract F416'.,-71-.C-001s
1 ~ ~~Project '101, .'.k- .1 •o.-5, U- 022'III
Reproduced by
NATIONAL TECHNICALINFORMATION SERVICE
U S Department of CommerceSpringfield VA 22151
II
Approved for' public release; distribution unlimited. Q. .8533. N. N3EW IDAUNTFTILS AV•. * 9 N A
Security Classification
__DOCU.MEN'T CONTROL DATA. R&D(Security classification of title, body of abstract and Indcxjn. annotation m.uot be entered t.hen the ovatote l rport is c¢lssi.isd)
I. ORIGINATIN G ACTIVITY (Coporate authorJ 2a. RCPORT SECURITY C LASWICATION
Technology Incorporated, Life Sciences Division "T8531 N. New Braunfels Ave 2b. GROUP
* San Antonio, Tx 782173. REPORT TITLE
Ocular Effects of Near Infrared Laser Radiation for Safety Criteria
4. DESCRIPTIVE NOTES (Typo of report and Inclusive datc;)
* Final Report - March 1971 - June 1972S. AUTHOR(S) (Last n.mo, a lrt hinee, inlticl)
Skeen, C.H.; Bruce, W. Robert; Tips, J.H., Jr.; Smith, M. Gearity;* Garza, G.G.
6. REPORT DATE 70. TOTAL NO. OF PAGES ; 7b. NO. OV REFS
"June 1972 82 _
Ca. CONTRACT OR GRANT NO. Sa. ORIGINATOR'S REPORT NOM3ER(S)
F41609-71-C-0016b. PROJECT NO.
601%, Task 05c. 631, Tsk ~Sb. OTHMER RTPOn-. N4O(SJ (Any ot4Scrnuzabers thatrsy b; ajiislnd
Work Unit 022 2d,
l10. AVAILAaIL;TY/LIMITATION NOTICES
Distribution of this document is unlimited
1. SUPPL EMEN TARY NOTES 12. SPONSORING MI1LITARY ACTIVITY
USAF School of Aerospace Medicine,Aerospace Medical Division (AFSC)
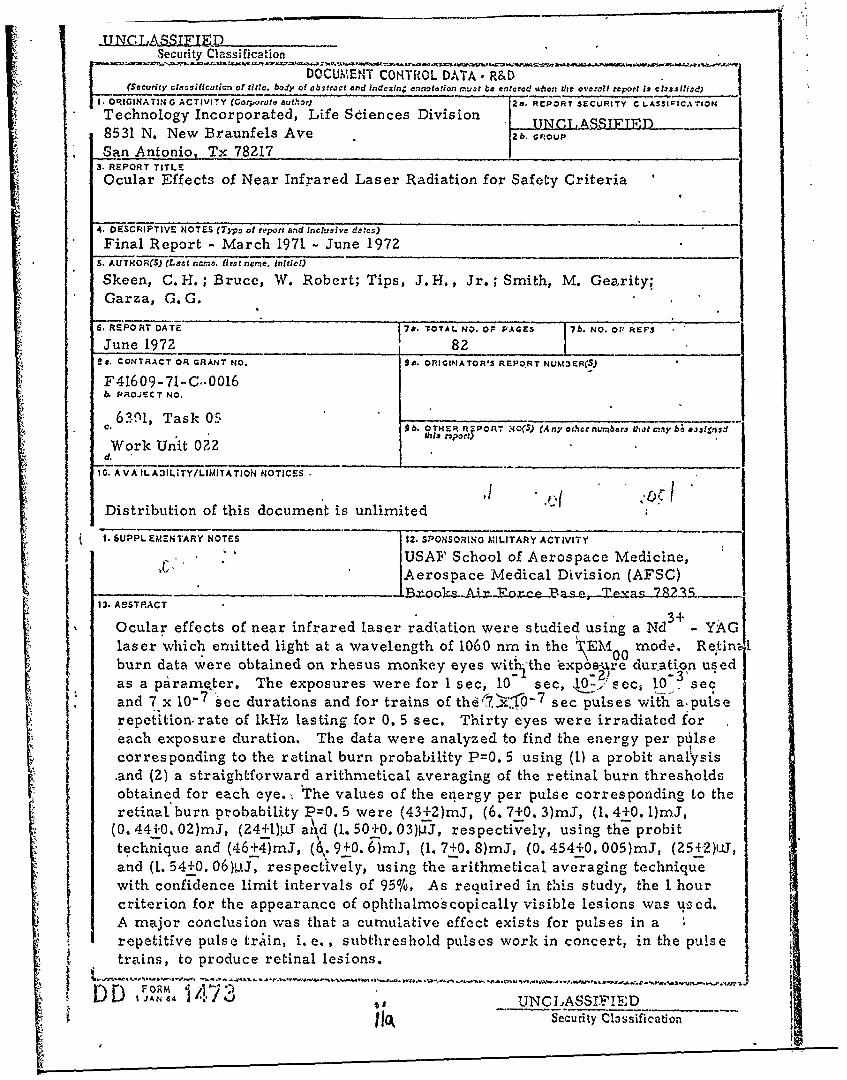
13. ASSTRACT
3+Ocular effects of near infrared laser radiation were studied using a Nd - YAGlaser which emitted light at a wavelength of 1060 nm in the TEM mode. Retiv L
00burn data were obtained on rhesus monkey eyes wirtNthe •xposre duration usedas a parameter. The exposures were for 1 sec, 10 sec, ,•q$'secI• l0se Iand 7 x 10⁻⁷ sec durations and for trains of thd(?.K.C0 7 sec pulses wii-h aýpulserepetition rate of lkHz lasting for 0. 5 sec. Thirty eyes were irradiated foreach exposure duration, The data were analyzed to find the energy per pulsecorresponding to the retinal burn probability P=0. 5 using (1) a probit anal'ysis.and (2) a straightforward arithmetical averaging of the retinal burn thresholdsobtained for each eye.,, The values of the energy per pulse corresponding to the
retinal burn probability P=0. 5 were (43+2)mJ, (6. 7+0. 3)mJ, (1, 4+0. l)mJ,(0. 44ir0. 02)mJ, (24+1)0J and (1. 50+0. 03)P!J, respectively, using the probittechnique and (46+4)mJ, (6. 9+0. 6)mJ, (1. 7+0. 8)mJ, (0. 454+0. 005)mJ, (25+2),u1,and (1. 54+0. 06),J.J, respectively, using the arithmetical averaging techniquewith confidence limit intervals of 956/. As reauired in this study, the 1 hourcriterion for the appearance of ophLhalmoscopically visible lesions was used.A major conclusion was that a curnulaive effect exists for pulses in arepetitive pulse train, i.e. , subtlireshold pulses work in concert, in the pulsetrains, to produce retinal lesions.
SD O J UNC LASSIFIED ___
Security Classification

_IINC_ IF IED
Security Classification
t.KEY WORDOS LIN A IKBLNI
Nd3+ YAG laser; thermal injury; retinal burns;!-rhesus monkey; laser safeguards; laser safetystandards
INSTRUCTIONS1. ORIGINATING ACTIVITY: Enter the name and address Imposed by security classification, using standard statementsof the contractor, subcontractor, grantee, Department of De- such as:fense activity or other organization (corporate author) issuing (I) "Qualified requesters may obtain copies of thisthe report.()"Qaiidrqetrmaobancpsofhs report from DDC."
2a. REPORT SECURITY CLASSIFICATION: Enter the over- (2) "Foreign announcement and dissemination of thisall security classification of the report. Indicate whether () Fore a ino t and disem t oh"Restricted Data" is included. Marking is to be in accord- report by DDC is not authorized."ance with appropriate security regulations. (3) "U. S. Government agencies may obtain copies of
Is specified in DoD Di- this report directly from DDC. Other qualified DDC2b. GROUP: Automatic downgrading ispcieinDDD-users shall reques-t through
rective 5200. 10 and Armed Forces Industrial Manual. Enterthe group number. Also, when applicable, show that optionalmarkings have been used for Group 3 and Group 4 as author- (4) "U S. military agencies may obtain copies of thisized. report directly from DDC. Other qualified users
3. REPORT TITLE: Enter thu complete report title in all shall request throughcapital letters. Titles in all cases should be unclassified.If a meaningful title cannot be selected without classifica- .tion, show title classification in all capitals in parenthesis (5) "All distribution of this report is controlled. Qu•'l.Immediately following the title. Ified DDC users shall request. through
4. DESCRIPTIVE NOTES: If appropriate, enter the type of - -
report, e.g., interim, progress, summary, annual, or final. If the report has boen furnished to the Office of TechnicalGive tle inclusive dates when a specific reporting period is Services, Department of Commerce, for sale to the public, indl-,c6vered. cate this fact and enter the price, if known.S. AUTHOR(S): Enter the name(s) of author(s) as shown on IL SUPPLEMENTARY NOTES: Use for addition.I explana-or in the report. Entet last name, first name, middle initial, tory notes.If mifltary, show rank -nd branch of service. The name ofthe principal .:,thar is an absolute minimum requirement. 12. SPONSORING MILITARY ACTIVITY: Enter the name of6. Rthe departmental project office or laboratory sponsoring (pay-6. REPORT DATo-" Enter If more tha othe report as day, ing for) the research and development. Include address.on the re-port. use date of publication. 13. ABSTRACT: Enter an abstract giving a brief and factual
7a. TOTAL. NUMBER OF PAGES: The total page count summary of the document indicative of the report, even thoughit may also appear elsewhere in the body of the technical re-
should follow norm:al pagination procedures, i.e., enter the port. If additional space Is required, a continuation sheet shallnumber of pages containing information. be attached.7b. NUMBER OF REFERENCES. Enter the total number of It is highly desirable that the abstract of classified reportsreferences cited in the report. be unclassified. Each paragraph of the abstract shall end with
So. CONTRACT OR GRANT'NUMBER: If appropriate, enter an indication of the military security classification of the in-the applicable number of the contract or grant under which formation in the paragraph, represented as (Ts). (S), (c). or (U).the report was written. There is no limitation on the length of the abstract. How.8b, 8c, & 8d. PROJECT NUMBER. Enter the appropriate ever, the suggested length is from 150 to 225 words,military dcepartment identification, such as project number,subproject number, system numbers, task number, etc. 14. KEY WORDS: Key words are technically meaningful terms
or short phrases that characterize a report and may be used as9a. ORIGINATOR'S REPORT NUMBER(S): Enter the offi- index entries for cataloging the repo-t. Key words must becial report number by which the document will be identified selected so that no security classification is required. Identi-and controlled by the originating activity. This number must fiers, such as equipment model designation, trade name, militarybe unique to this report. project code'name, geographic location, m.ay be used ad key9b. OTHMlf REPORT NUMOER(S): If the report has been words but %ill be followed by an indication of technical coa-assigned any other report nua.bers (either by the originator text. The assignment of links, rules, and wegehts is optional.or by the speonour), als,: enter this number(s). o .
10. AVAILAMLITY/LIMITATION NOTICES: Enter any limo-itations on furthur dissemination of the report, other than those ,
9,-
OCULAR EFFECTS OF NEAR INFRARED LASER
RADIATION FOR SAFETY CRITERIA
-FINAL REPORT
Jim
UrUNE, 197Z
C. H. Skeen, 'Ph.D., W.Robert BruceJ. H. Tips, Jr., M.S., M. GearitySmith, B.S., G.' G. Garza
1.
Air Force Contract F41609-71-C-0016
Project 6301, Task 05, Work Unit 022
(I APPROVED BY:
IV /o" ,
fli ,' lJames V. Benedict, Ph.D.Manager, San Antonio BranchLife Sciences Division
lII
I
FOREWORD
The cooperation of the Vivarium personnel at Brooks Air Force Base,-
notably Sgts. E. L. Hendrix, F. W. Smith and A. E. Wiedeman, was out-
standing and greatly appreciated. Special thanks are extended to Dr. Robert
W. Ebbers for his assistance as the contract monitor, to Dr. Eb• ers,
Dr. Irving L. Dunsiky and Mr. E. 0. Richey for many helpful consultations
throughout this study and to Mr. Richard McNee for calling to our attention
a possible fundamental difficulty in applying the probit analysis to retinal
, burn data.
The work in the animal holding facilities and in the anirmal preparations at
Technology Incorporated done by Mr. Robert Neish and Mr. Peter Herrera,
and the photographic service supplied by Mr. Richard Johnson was most
I helpful as was the art work done by Mr. Hector Lizcano.
[ Special thanks are accorded to Dr. Ralph G. Allen, Dr. J. V. Benedict and
ii ii I Dr. M•a-ptin M. Mainster for numerous• conferences which helped immensely
in ou-: understanding and in our interpretation of our experimental results.
Finally, our appreciation is hereby expressed to Mrs. Linda Anderson forItyping this draft final report and for her secretarial support throughout this
program.
!i

LIST OF FIGURES
PAGE
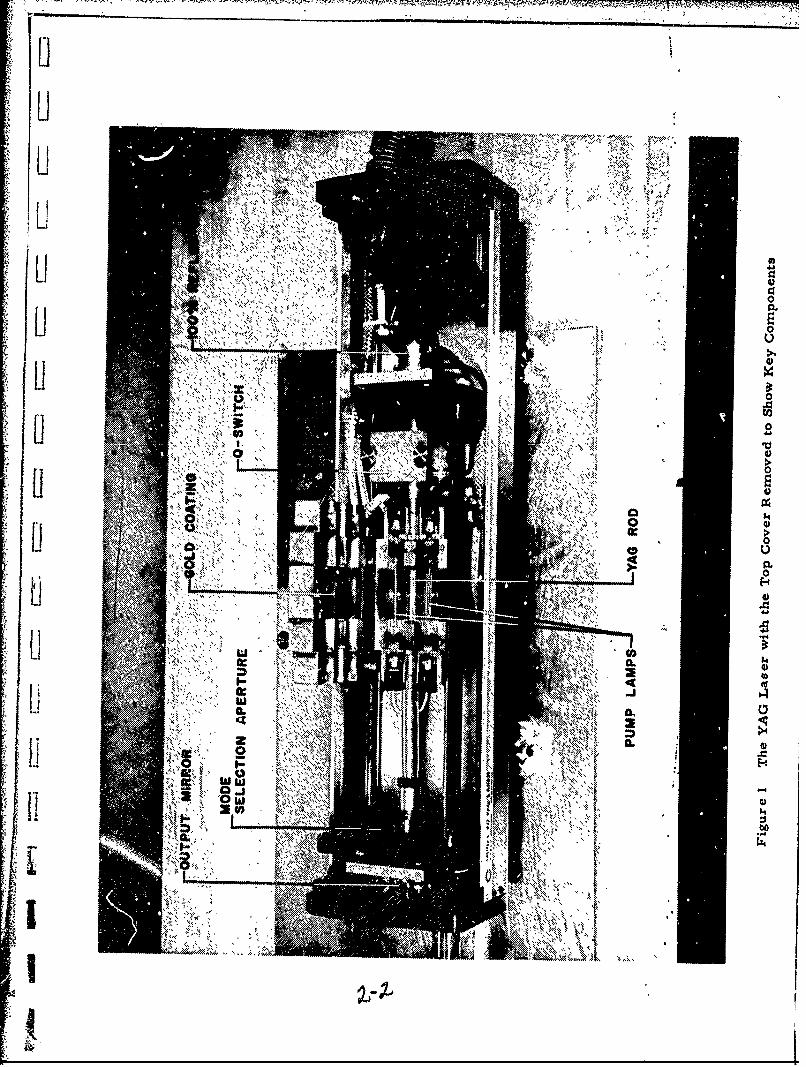
IT? F-- -re 1. The YAG Laser with the Top Cover Removed to Show
i Key Components 2-2
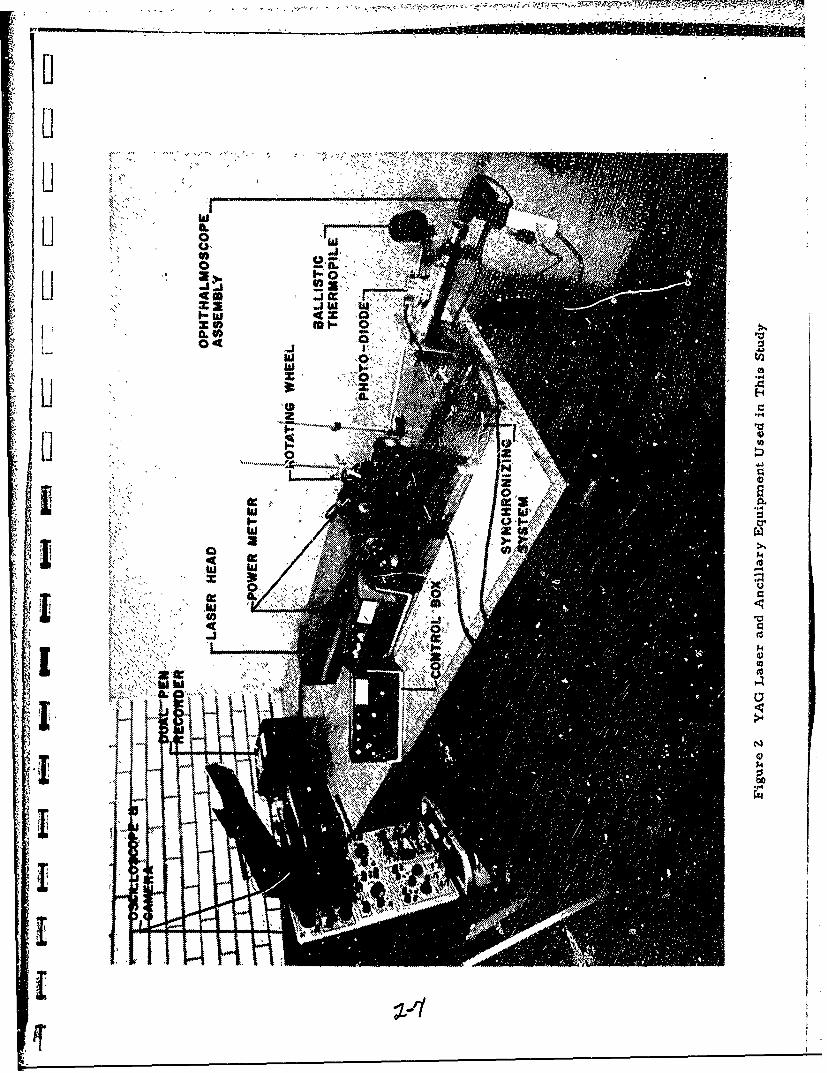
Figure 2. YAG Laser and Ancillary Equipment Used in This Study Z-7
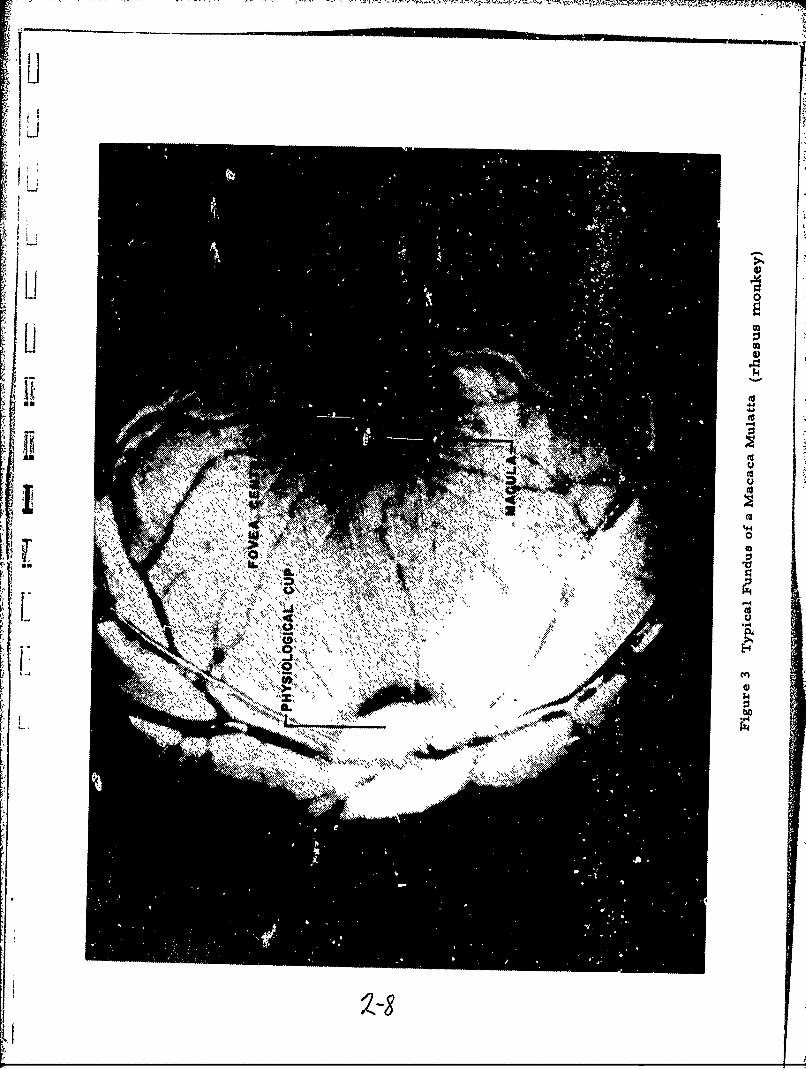
Figure 3. Typical Fundus of a Macaca Mulatta (rhesus monkey) 2-8
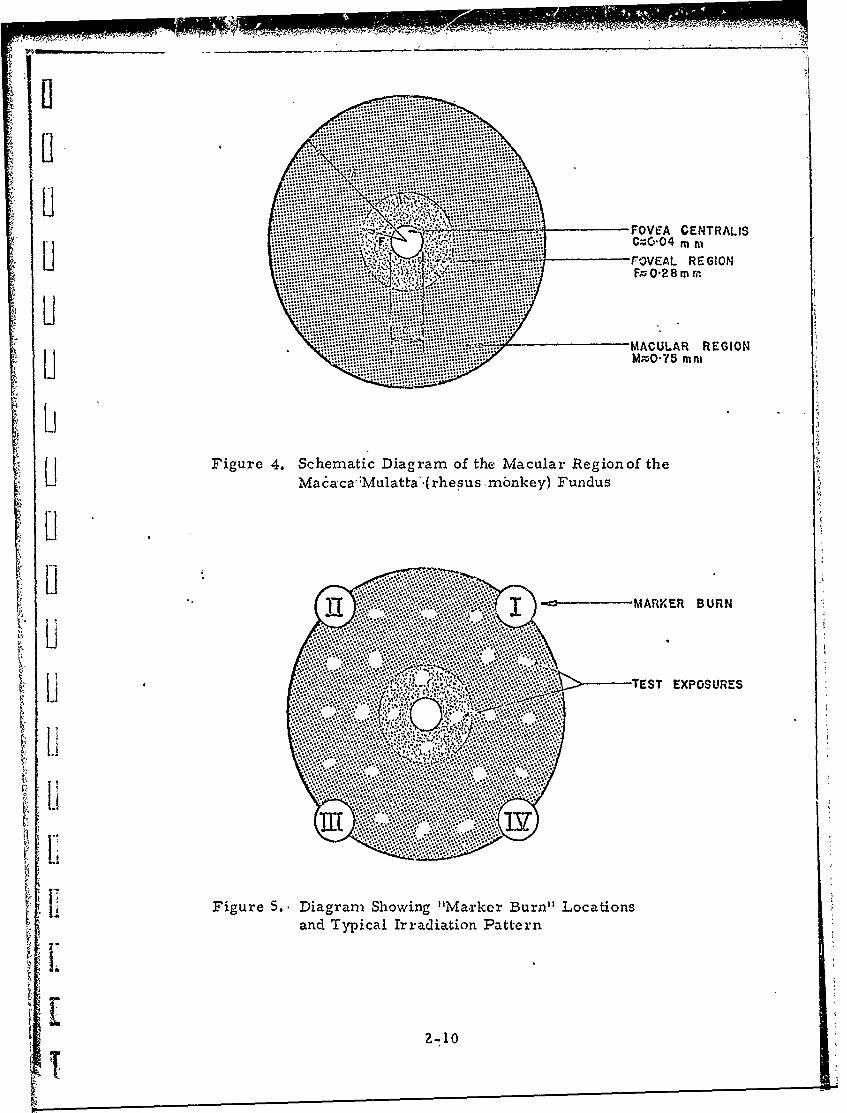
Figure 4. Schematic Diagram of the Macular Region of the
Macaca Mulatta ý*(hesus monkey) Fundus 2-10
Figure 5. Diagram Showing "Marker Burn" Locations and
Typical Irradiation Pattern 2-10
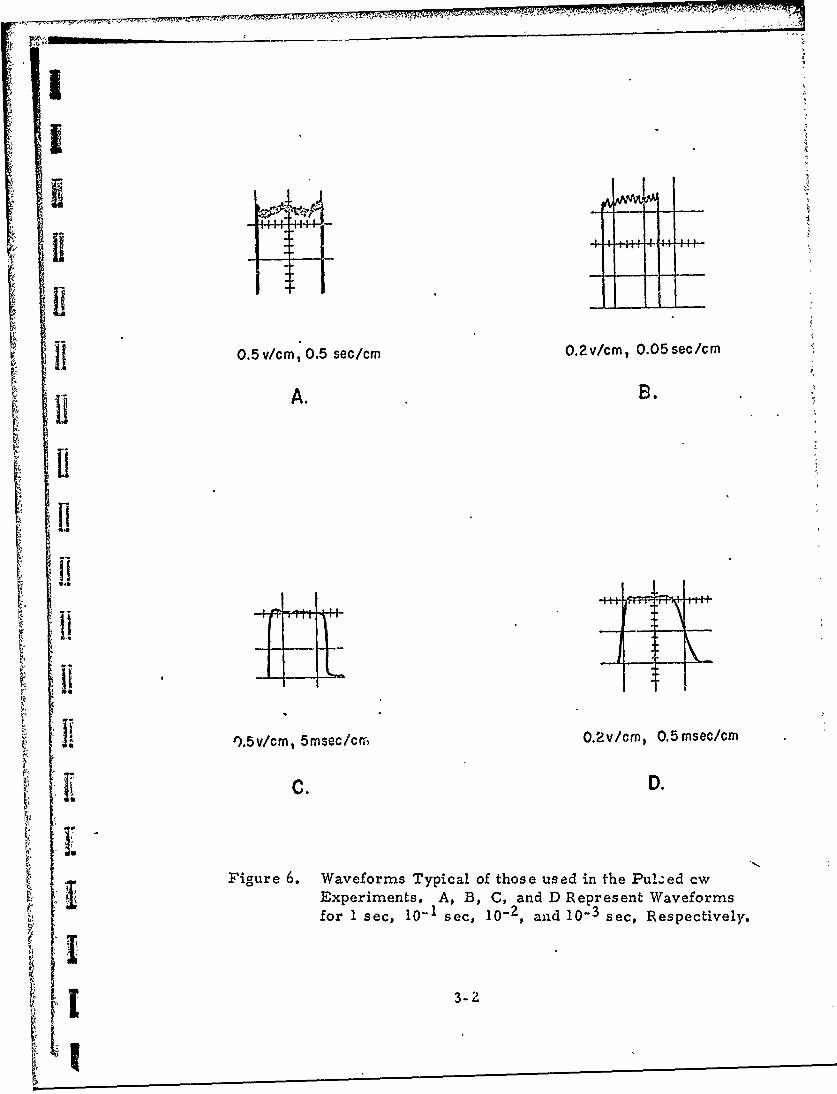
Figure 6. Waveforms Typical 6f those used in the Pulsed cw
Experiments. 'A, B, C,'and D Represent Waveforms
-1 -2 -3for 1 sec, 10 sec. 10 , and 10 sec, Respectively.
3-2
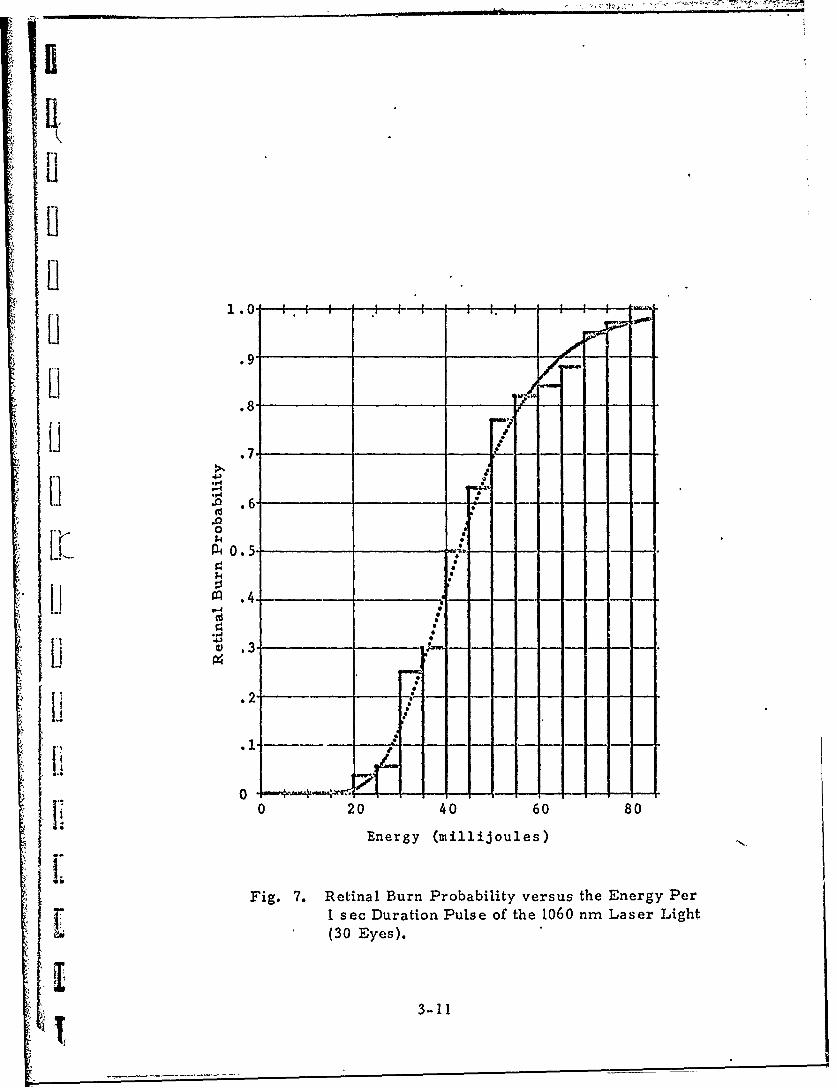
Figure 7. Retinal Burn Probability versus the Energy Per
1 sec Duration Pulse of the 1060 nm Laser Light
(30 Lyes). 3-11
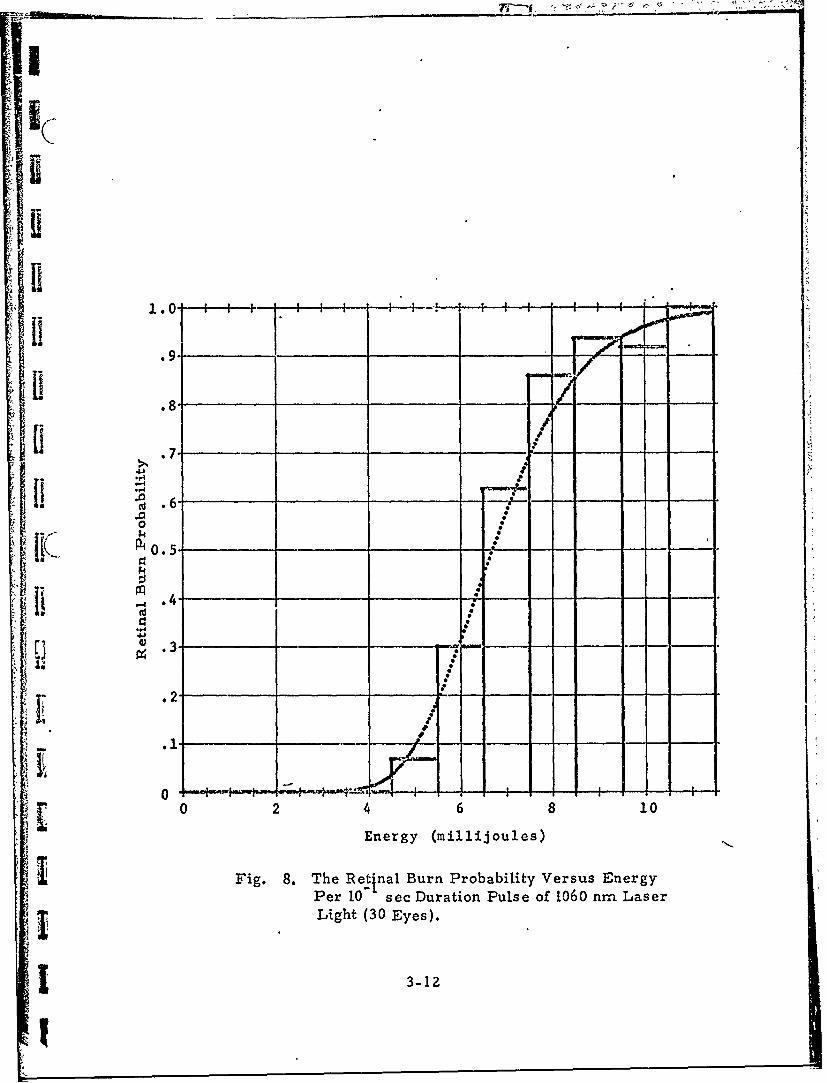
Figure 8. The Retinal Burn Probability versus Energy
I Per 10"I sec Duration Pulse of 1060 nm Laser
Light (30 Eyes). 3-12
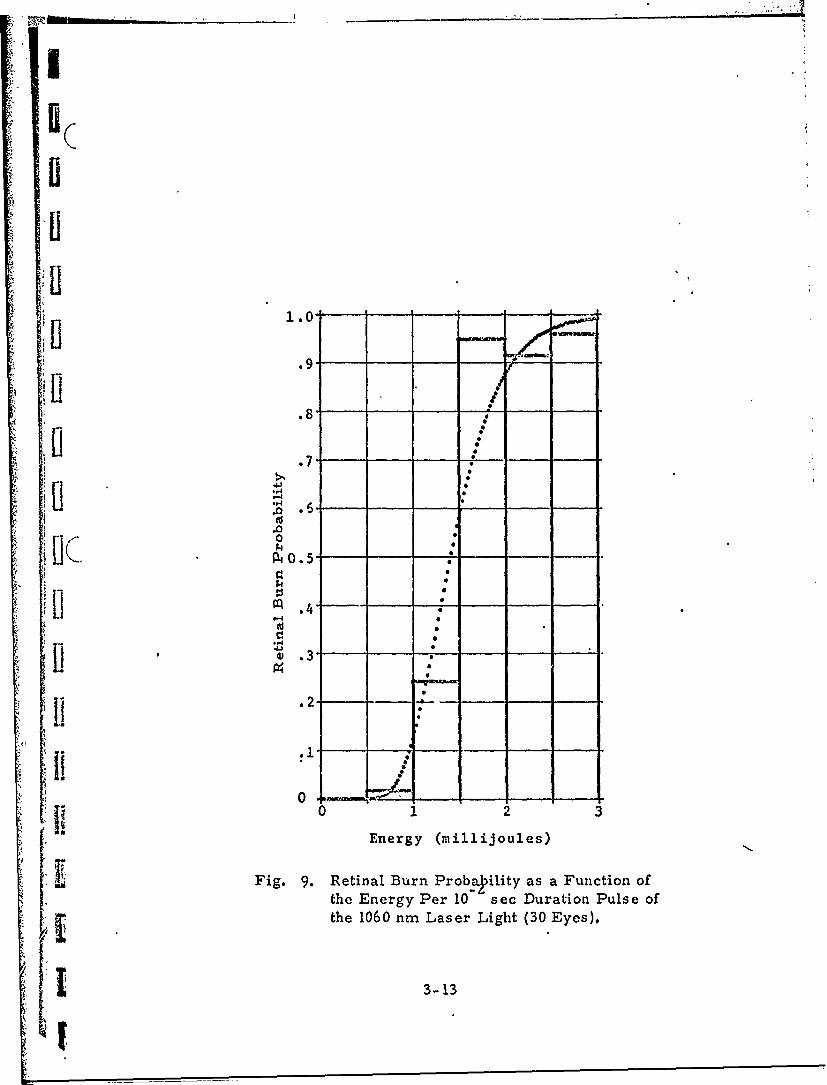
Figure 9. Retinal Burn Probability as a Function of the Energy
2I per 10 sec Duration Pulse of the 1060 nm Laser
Light (30 Eyes).. 3-13
*1Il
I i
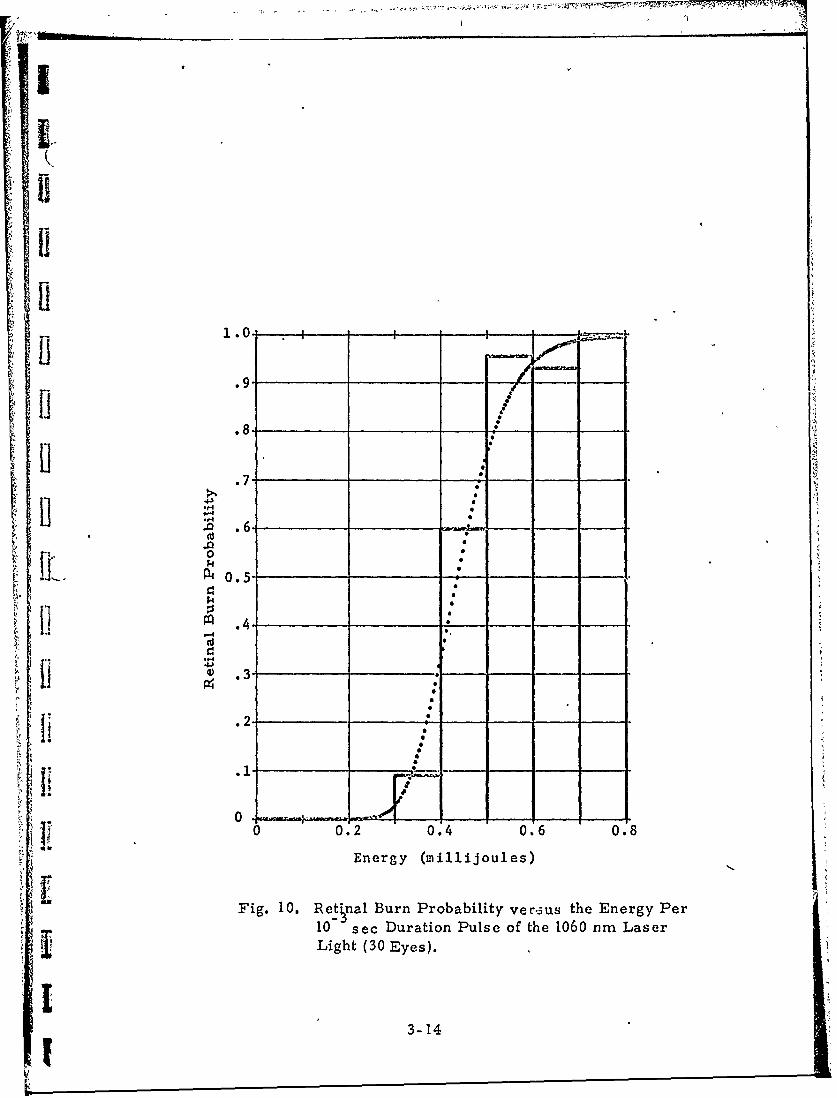
Figure 10. Retinal Burn Probability versus the Energy per 10t-3
sec Duration Pulseof the 1060 nmr Laser Light (30 Eyes). 3-14
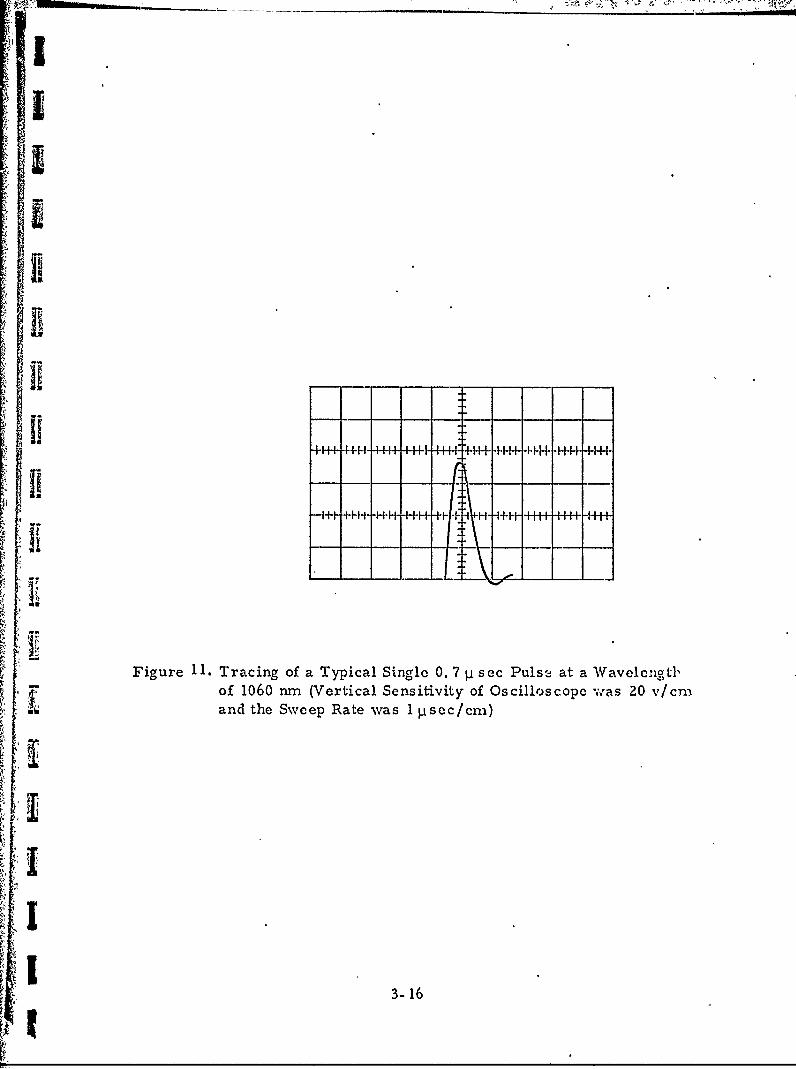
Figure 1 1. Tracing of a Typical Single 0.7 p sec Pulse at a Wavelengfh
of 1060 nm (Vertical Sensitivity of Oscilloscope was 20 v/cm
and the Sweep Rate was 1 P sec/cm). 3-16
Figure 12. Retinal Burn Probability versus Energy of the Single 0..7 3p
sec Laser Pulses at a Wavelength of 1060nm.( 3 0 Eyes) 3-19
Figure 13. Retinal Burn Probability versus Energy per Phalse in the
1A Train of 0. 7 p. sec Laser Pulses at a: Wavelength of 1060 nm. 3-23
(30 Eyes)
Figure 14. Retinal Burn Threshold versus Eqxposure Time 4-2
Figure 15. A Schematic '.agram of the Nd 3+-YAG Laser Cavity A-2
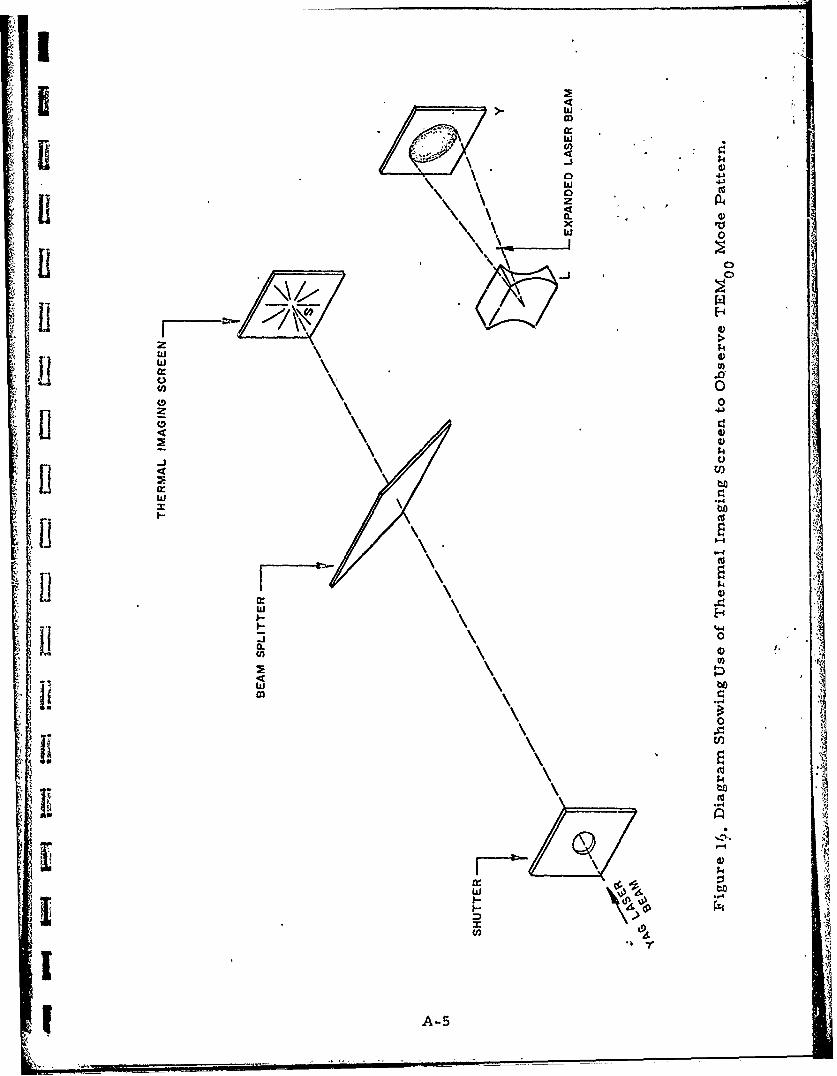
Figure 16. Diagram Showing Use, of Thermal Imaging Screen. to
Observe TEM00 Mode Pattern. A-5
Figure 17. Schematic Diagram of Arrangement Used in Laser Beam
"Aiming Experiments. A-7
Figure 18. Schematic Diagram Showing Use of Camera Shutter to
Obtain Laser Pulses. B-2
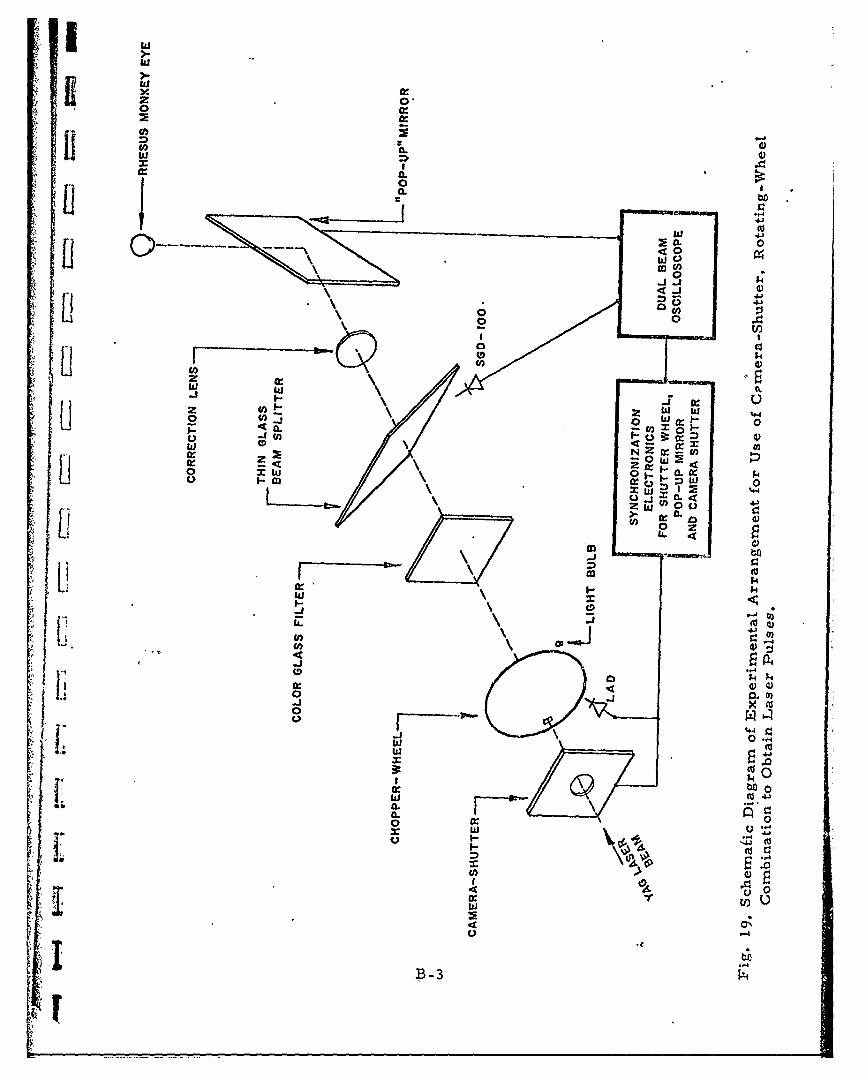
Figure 19. Schematic Diagram of Experimental Arrangement for Use ofU Camera-Shutter, Rotating-Wheel Combination to Obtain
Laser Pulses. B-3
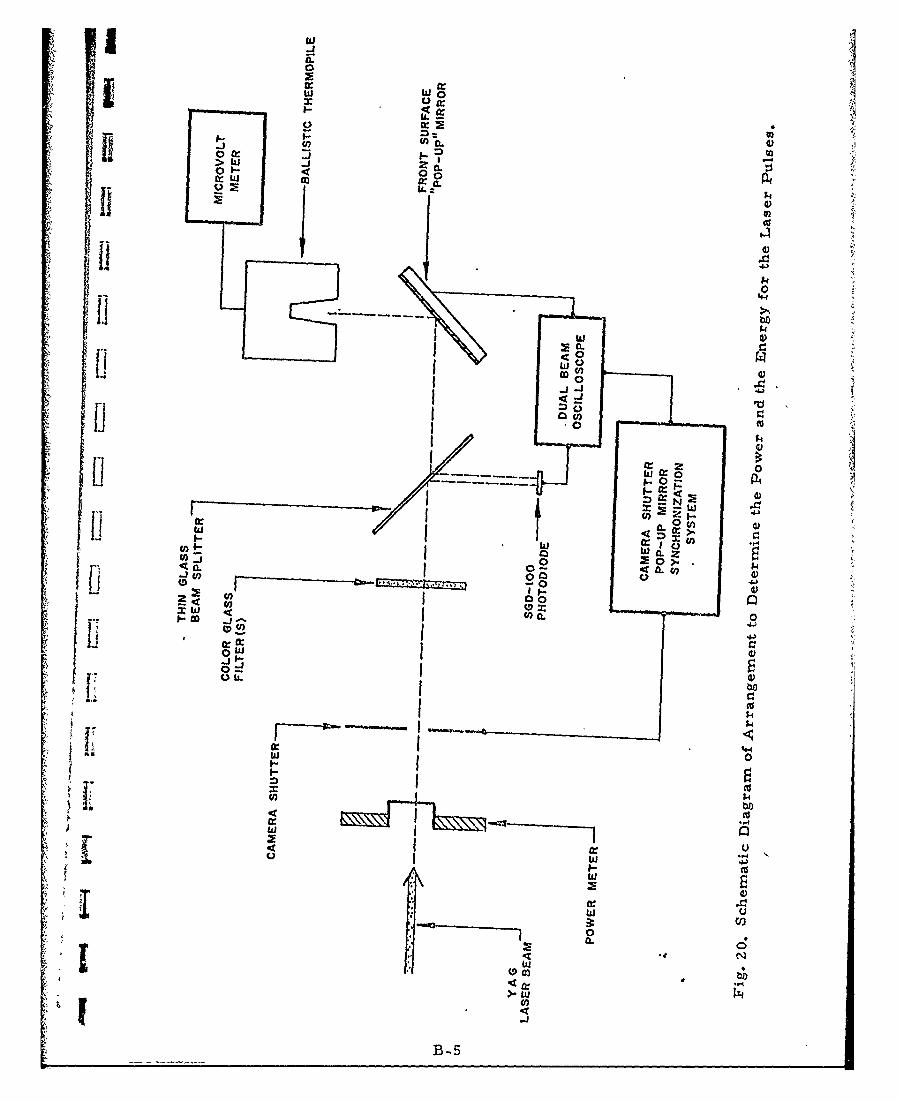
, Figure 20. Schematic Diagram of Arrangement to Determine the
Power and the Energy for the Laser Pulses, B-5
I
| ILIST OF TABLES
PAGE
Table I. Retinal Burn Threshold Data for 1 sec Duration Pulses
of i060 nm Laser Light.(Eye No. 15.5) 3-3
- Table II. Retinal Burn Threshold Data for 10 sec Duration
i L Pulses of 1060 nm Lasei Light. (Eye No. 44) 3-4
Table III. Data for Retinal Burn ThreshOld for 10 sec Duration
0 Pulses of 1060nm Laser Light. (Eye No. 79) 3-5
-3U Table IV. Retinal Burn Threshold Data for 10 sec Duration
Pulses of 1060nm Laser Light. (Eye No. 110) 3-6
Table V. Retinal Burn Thresholds for I sec Duration Exposures. 3-7
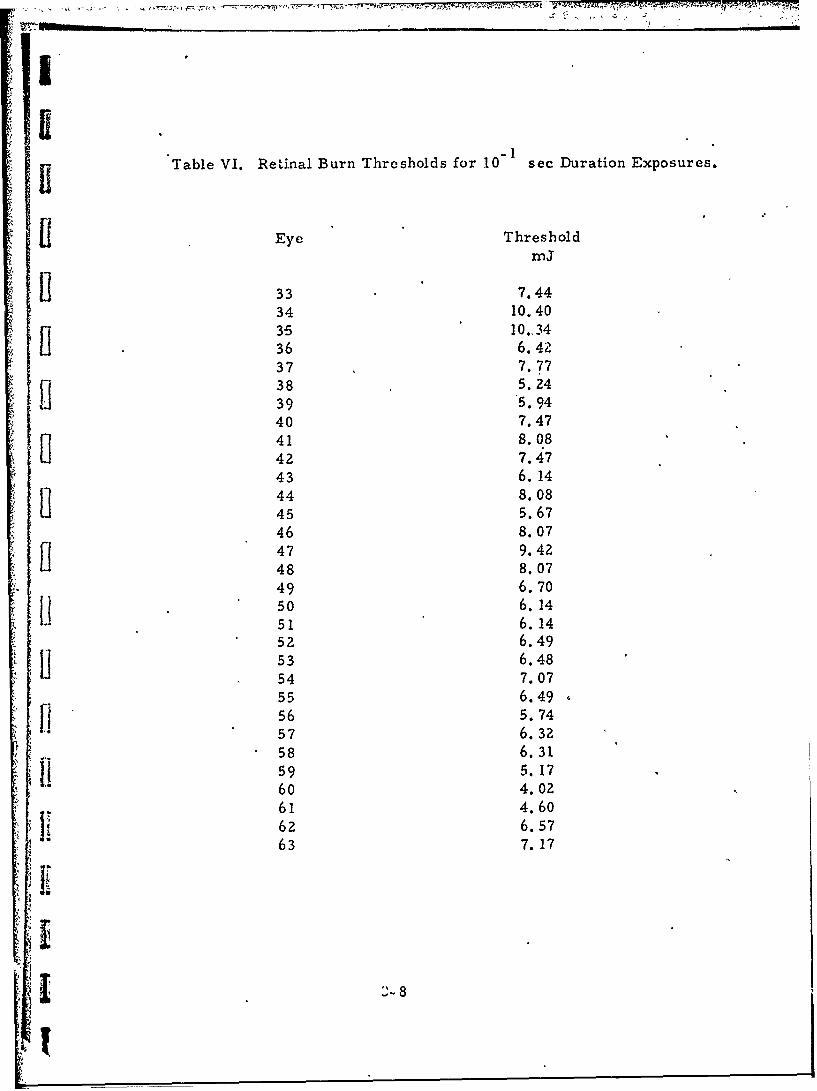
iTable VI. Retinal Burn Thresholds for 10" sec Duration Exposures. .3-
Table VII. Retinal Burn Thresholds for 10"3 sec Duration Exposures. 3-9t--Table VIII. Retinal Burn Thresholds for 10 -3sec Duration Exposures. 3-10
Table IX. A Sample of Retinal Burn Data for Single 0. 7 P sec Exposures of
SalRhesus MonkeyEye to the I060 nm Laser'Light. (Eye No, 146) 3-17
Table X, Retinal Burn Thresholds for 7 x 10 sec Duration
Exposures. 3-18
Table XI. A Sample of Retinal Burn Data for a Train of 0. 7 P sec
Exposures of a Rhesus Monkey Eye to the 1060 nm Laser
I Light. (Eye No. 179) 3-20
• I Table XII. Retinal Burn Threshold for Trains of 7 x 10"7 sec Pulses
at Pulse Repetition Rate of 1 kHz Lasting for 0.5 sec. 3-21
: V
ITable XIII. Energy Per Pulse Corresponding to the Retinal Burn
Probability, P=0. 5 or ED50 Values for Laser Single
Pulse Durations from 7 x 10"7 sec to 1 sec and for a
Repetitive Pulse Train. 3-24
Table XIV. Power per. Pulse Corresponding to the Retinal Burn
Probability, P=0. 5, for Laser Pulse Durations from
7 x 10⁻⁷ sec to ] sec. and for a Repetitive Pulse Train. 4-1
Table XV. Alternative Distributions C-6
iv
II
K. .
4'• vi" _
TABLE OF CONTENTS
1. INTRODUCTION 1-1~ I
2. EXPERIMENTAL PROCEDURES 2-1
"2. 1 Laser System 2-1
2. 2 Exposure Durations aiid Laser Calibrations 1
2.3 Primate Housing and Primate Preparations 2-3
2.4 Retinal Irradiations 2-5
3. EXPERIMENTAL RESULTS 3-1
jj 3.1 Variable.Duration cw Experiments 3-1
3.2 Q-Switched Pulse Experiments 3-15
3. 3 Q-Switched Pulse Train Experiments 3-15
1 3.4 ED50 or P-0. 5 Energy Values .3-22
S4. DISCUSSION OF RESULTS 4-1
5. SUMMARY AND CONCLUSIONS 5-1
6. REFERENCES 6-1
APPENDIX A A-1
APPENDIX B B-I
APPENDIX C C-1
K'I
1. INTRODUCTION
The light emitted by lasers is highly collimated, nearly monochromatic and
very intense, Because of its good collimation and high intensity, laser
light is potentially hazardous to both the human skin and Ghe human eye.
The eye if quite vulnerable to the laser light (visible and near infrared
wavelengths) which is transmitted efficiently by the intraocular rnedia.
This vulnerability arises because the tiansmitted light is focussed into a
small spot on the retina by the optics of the eye. The fluence (energy per
i unit area) incident on the cornea c'.n be quite small and still be very hazardous
because the fluence at the retiila is amplified by a factor of about 10 relative
to the fluence at the cornea.
Since it is a requirement that lasers be operated safely, many experiments
T are performed to determine the extent of the vulnerability of the eye to the
laser light which it transmits efficiently. These experiments are designed
.9 ~ 1to find the extent of this vulnerability by the deterrmination of the retinal
SI burn threshold for the eye when the cornea is irradiated by laser light at a
given wavelefigth, a given beam divergence and for a given exposure level and
duration. These retinal burn thiesholds are used to establish permissible
exposure levels (PEL), The PEL are considered as safe exposure levels
for personnel working either with or in the vicinity of the corresponding
laser systems. Sa•eguard procedures can be instituted to ensure that
personnel do not receive ocular exposures from a laser in excess of the
Pi.
In the retinal burn experiments, eyes are irradiated with laser light and
the retinas are observed ophthalmoscopically following an exposure.
Although the duration of the observation times used by some workers in the
past were as short as about 5 min and as long as about 24 hours, the obser-
vation time generally used now is I hour. Most experinents are "currcntlybeing
performed on the Macaca Mulatta (rhesup monkey) with the reddlts extia'polAted
to humans by using an arbitrary variability factor between the species.
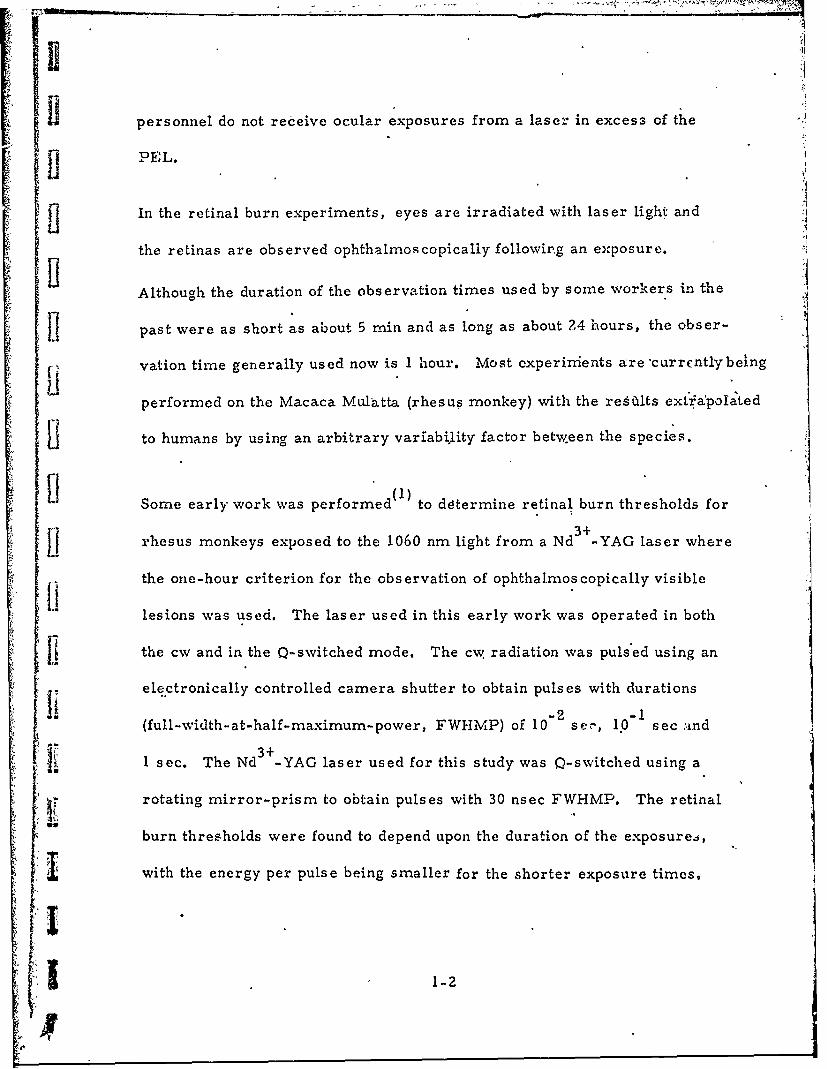
El Some early work was performed(1 ) to d&termine retinal burn thresholds for
3+rhesus monkeys exposed to the 1060 nm light from a Nd -YAG laser where
[i the one-hour criterion for the observation of ophthalmoscopically visible
lesions was used. The laser used in this early work was operated in both
the cw and in the Q-switched mode. The cw radiation was puls'ed using an
electronically controlled camera shutter to obtain pulses with durations
(full-width-at-half-maximum-power, FWHMP)of 10I s-, 10 sec and
I1 1 sec. The Nd 3 +-YAG laser used for this study was Q-switched using a
rotating mirror-prism to obtain pulses with 30 nsec FWHMP. The retinal
burn thresholds were found to depend upon the duration of the exposurej,
ti with the energy per pulse being smaller for the shorter exposure times,
1-2

'S -. - -, •- witS'--
j 1t is believed that the retinal'damage from the laser radiation in these ex-
(1) (a.-4).periments and in other experiments' is produced thermally. This
LI corresponds to the irradiated and contiguous chorioretinal tissues being raised
LI to a critical temperature for a given tlm.t and a lesion being produced.
Clearly, to first order approximations, there should be an irradiated
spot-size-effect, i. e., the smaller the retinal spot irradiated, the smaller
L the amount of energy required to cause the heated tis,,;Aes to reach the
critical temperature. This spot-size-effect was demonstrated first ex-
LI alruigawielgtsuc (5) (6)"perimentall4 using a white light source and later using a laser light
source.
For lasers, the retinal spot size depends upon the laser beam divergence
I i and the refracting properties of the eye; and, the diameter is estimated by
the product of the divergence (full angle) ad the focal length of the eye.
The divergence is related to the energy distribution in the laser beam wave-
r .(7)front. This energy distribution is described in terms of modes using the
symbol TEM... The i and j subscripts refer to the nodes in the transverse
electromagnetic field in the laser cavity. The mode having the lowest order
' s the TEM one. The energy distribution in the wavefront for the TEM00 00
mode is Gaussian. This TEM energy distribution is diffraction limited and;00
consequently, it is the smallest beam divergence possible without using ancillary
optics. Hence a laser with its output in the TEM mode will have a smaller00
retinal spot size than any other radiation mode from this laser.
1-3
- ."-.- . . •. : o , . .• ,•-• •v>* ,
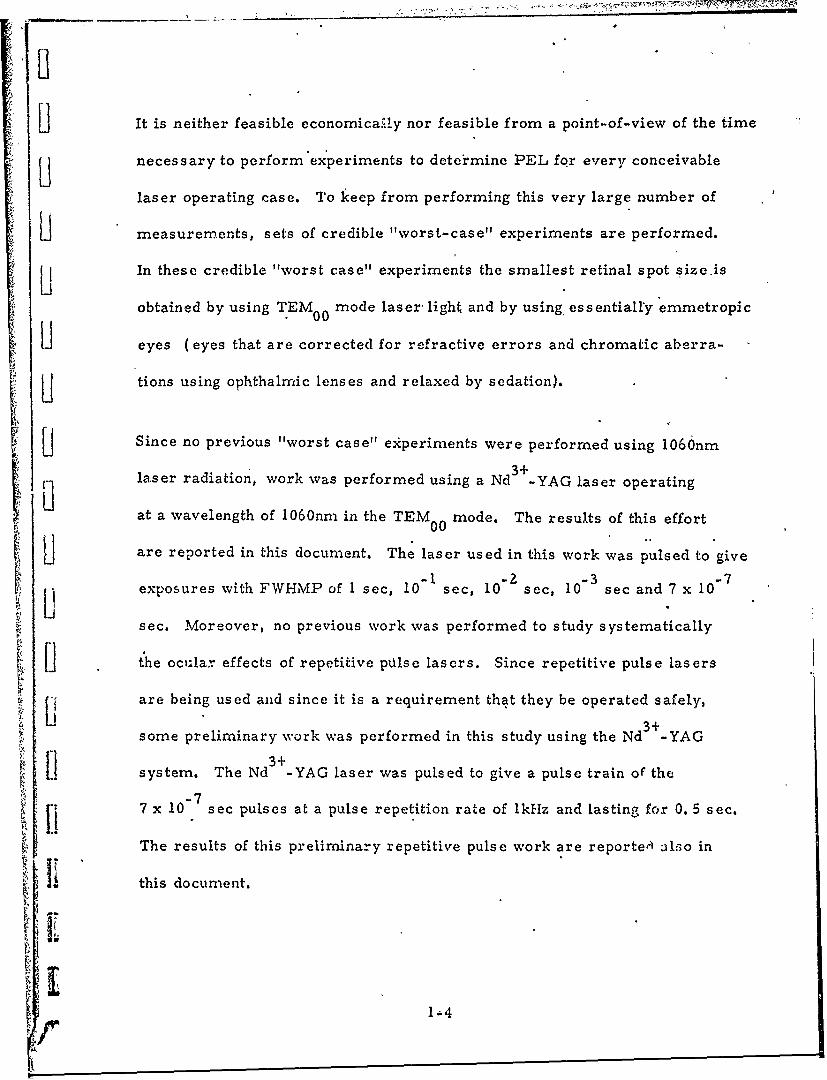
It is neither feasible economica!.!y nor feasible from a point-of-view of the time
U necessary to perform experiments to deteimine PEL for every conceivable
laser operating case. To keep from performing this very large number of
measurements, sets of credible "worst-case" experiments are performed.
[ UIn these credible "worst case" experiments the smallest retinal spot size is
obtained by using TEM00 mode laser- light and by using, essentially emmetropic
Seyes (eyes that are corrected for refractive errors and chromatic aberra-
tions using ophthalmic lenses and relaxed by sedation).
U Since no previous "worst case" experiments were performed using 106Onm
3+laser radiation, work was performed using a Nd -YAG laser operating
at a wavelength of 1060nm in the TEM mode. The results of this effort00
L. are reported in this document. The laser used in this work was pulsed to give
-1 -2 -3 -exposures with FWHMP of I sec, 10 sec, 10 sec, 10 sec and 7 x 10"
Lilsec. Moreover, no previous work was performed to study systematically
the ocular effects of repetitive pUlse lasers. Since repetitive pulse lasers
are being used and since it is a requirement that they be operated safely,
[1 3+_some preliminary work was performed in this study using the Nd -YAG
It system. The Nd 3+-YAG laser was pulsed to give a pulse train of the-7
7 x 10 sec pulses at a pulse repetition rate of Ik~lz and lasting for 0. 5 sec.
The results of this preliminary repetitive pulse work are reporteA a..Io in
this document.
1-4Li
.I : - _ , -
,. • 2. EXPERIMENTAL PROCEDURES
2. 1 Laser Svsten
The laser used in the experiments, described in this report, was
ii a Coherent Radiation, Inc. model 60 YAG system (see Appendix A
for the details of mode control, etc. ). A photograph of this- ystem
with a cover removed is shown in Figure 1. This system was operated
in the cw time regime, the Q-switched time regime and the repetitive
pulse time regime. It emitted laser radiation at a wavelength of
S1060nm in the TEM00 mode. The diameter of the limiting aperture
in the laser cavity was 2. 0mm and the corresponding beam divergence
(full angle) was about 1.2 milliradians. The laser light was circularly
Vli polarized.
I The peak power emitted during the cw portion of the experiments'was
2. 4 watts in the TEM mode. The peak power emitted in a single00
7 x 10 sec pulse was 2 kw. The peak ppwer per pulse for the
repetitive pulse time regime operation was 0. 5 kw using the pulse
repetition rate of 1 kHz.
2.2 xposure Duraions and Laser Calibrations
An electronically controlled camera-shutter was rqed to obtain
I exposure durations of 1 sec. An electronically controlled camera-
shutter synchronized with a rotating-slotted-wheel was used to obtain
2-1
~LI
LCICL)
JU 4)
ii
the 10- 1sec, 10-2 sec and 10 3 sec duration exposures. The Coherent
Radiation, Inc. model 460 Acoustic Q-switch was used to obtain the
7 x 10"7 sec duration exposures. A Q-switch controller-box was
operated either manually or by external triggering to obtain the
single Q-switched pulses. The Q-switch controller-box was operated
either internally or triggered exter.nally with an appropriate electronic
pulse and waveform generator to obtain the trains of 7 x 10⁻⁷ sec pulses.
The details of the techniques used to obtain the exposure durations are
outlined in Appendix B..'UThe temporal variation of the laser power in a pulse emitted by the
. laser as configured for these experiments was detected with an
EG&G silicon photodiode, model SGD-100, in conjunction witha
Tektronix model 555 dual beam oscilloscope. The laser output power
as detected by this oscilloscope-diode array was calibrated using two
"devices with calibrations traceable to NBS values. One of the devices
was a HADRON/TRG model 100 ballistic thermopile and the other one
was a Coherent Radiation, Inc. model 201 power meter. The waveforms
K [ were recorded and the energy per pulse was measured for every ocular
irradiation performed during this study. The details of the calibration
procedures are discussed in Appendix B.
2.3 Primate Hous!nE and Primate Preparations
SThe animal housing facility at the Life Sciences Division of Technology
a Incorporated has a carefu!ly controlled environment where the primattv
2-3
Sare individually housed in nriodern stainless steel cages. The animals
and facility are maintained in accordance with the "Guide for Lab-
[ oratory Animals, Facilities and Care" as published by the National
I Academy of Sciences - National Research Council. Regular in-
spections were made by a representative of the U. S. Department of
Agriculture, Agricultural Research Service, Animal Health Division.
IL Primate preparation for various experimental procedures were carried
'H out in the animal surgery suite. The surgery suite consisted of a
preparation room, a scrub room, and an operating room. Initial
preparations (e. g., sedation, pupil dilation, body weight determination)
Li were peirformed in the surgery preparation room. The operating room
was modern anid equipped for tlie finost sophisticated experimental -
preparations and procedures.
On the day prior to the retinal irradiations of a prinate, atropine
sulfate, 1% ophthalmic ointment was introduced into the conjunctival
pi sac. This procedure was utilized to give maximum pupillary dilation.
Just prior to the retinal irradiations, the primate was tranquilized
-. with phencyclidine hydrochloride (Sernylan) 20mg/cc, IM. The dosage
employed was 1 mg/Kg of body weight. Then an anesthetizing procedure
was started by introducing a 19 gauge intraveneous catheter into a posterior
m .superficial vein in a leg. Intitally 0.5 cc of sodium pentobarbital,
(Nembutal) 50 mg/cc, was administered by way of the intracatheter, and
1' 2-4
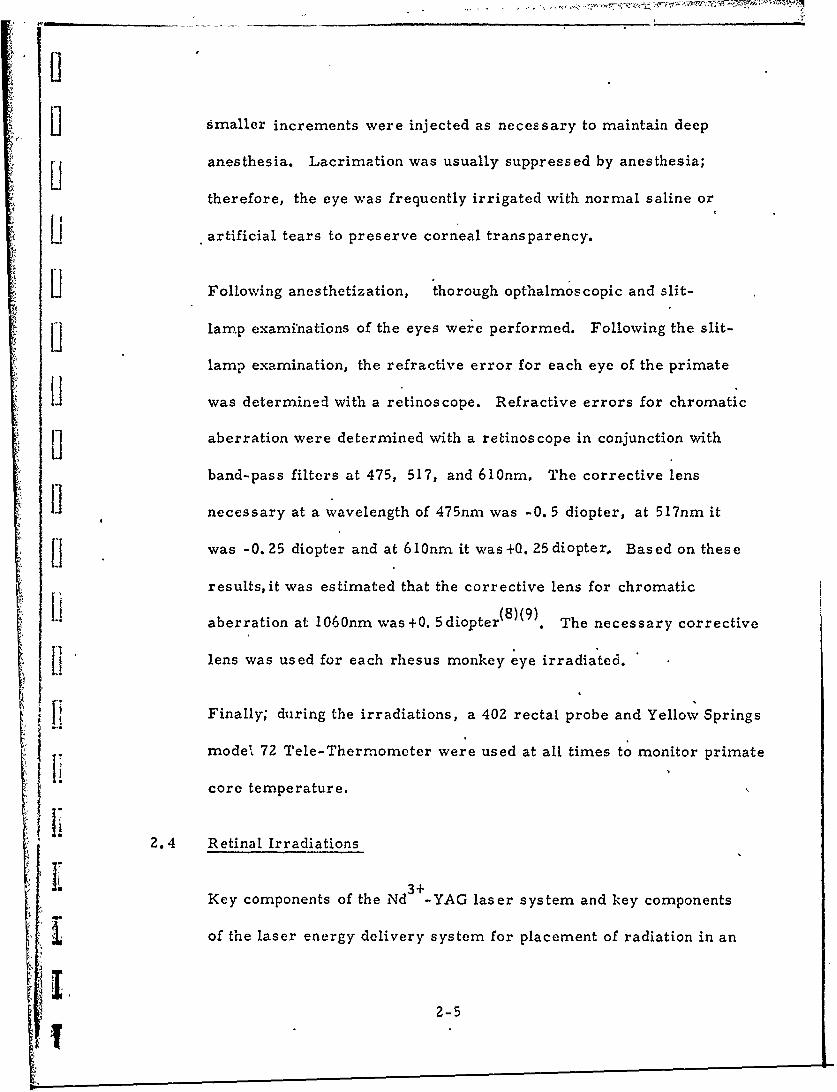
1]smaller increments were injected as necessary to maintain deep
u anesthesia. Lacrimation was usually suppressed by anesthesia;
therefore, the eye was frequently irrigated with normal saline or
artificial tears to preserve corneal transparency.
I Following anesthetization, thorough opthalmoscopic and slit-
LI lamp examinations of the eyes were performed. Following the slit-
lamp examination, the refractive error for each eye of the primateLI was determined with a retinoscope. Refractive errors for chromatic
I aberration were determined with a retinoscope in conjunction with
band-pass filters at 475, 517, and 610nm. The corrective lens
necessary at a wavelength of 475nm was -0. 5 diopter, at 517nm it
I was -0.25 diopter and at 6 10onm it was +Q. 25diopter Based on these
results, it was estimated that the corrective lens for chromatic
aberration at 1060nm was +0. 5 diopter(8 )(9 ). The necessary corrective
lens was used for each rhesus monkey eye irradiated.
Finally; during the irradiations, a 402 rectal probe and Yellow Springs..H
model 72 Tele-Thermometer were used at all times to monitor primate
core temperature.
2.4 Retinal Irradiations
Key components of the Nd -YAG laser system and key components
I of the laser energy delivery system for placement of radiation in an
2-5
L eye during these experiments are shown in the photograph in Figure 2.
The details of the operation of this equipment for this study are given
in Appendices A and B.LIjA sequence of events during a retinal irradiation procedure was as
LI follows. The cornea of an eye of an anesthetized primate was cleared
and a site iii the macular area selected. The cross-hairs of an
ophthalmoscope light were positioned so as to intersect at the chosen
LI site. A solenoid on the ophthalmoscope was energized and the "pop-
L up" mirror came into place. An electronic, signal in the form of a
voltage pulse was received then by either the camera-shutter, or by
L the camera shutter and rotating-wheel combinatioh or by the Q-switch
LI controller-box. This procedure permitted one ahd i only, one
pulse 6 r pulse train to be emitted by the laser and focussed onto
the retina with the eye's own optics togith'er with any required lens
correction.
i[ Li "Marker burns", which served as fiducial points, were placed at the
corners of a square with 1.5mm diagonal centered on the fovea. Up
iI to 26 independent irradiations including the "marker burns" were
j ~i placed in the macular region. All exposures, with the exception of
the "marker burns" were placed at random in the macula.
A fundus photograph, of a rhesus monkey eye, like those taken routinely
during this study is shown in Figure 3. A schematic diagram-of the
z_
T777 ---.---.- M.
[j.
000
ta
$4
r4Q'-4
..............
14
L9i, Y'l0
.iJ
Ii
0
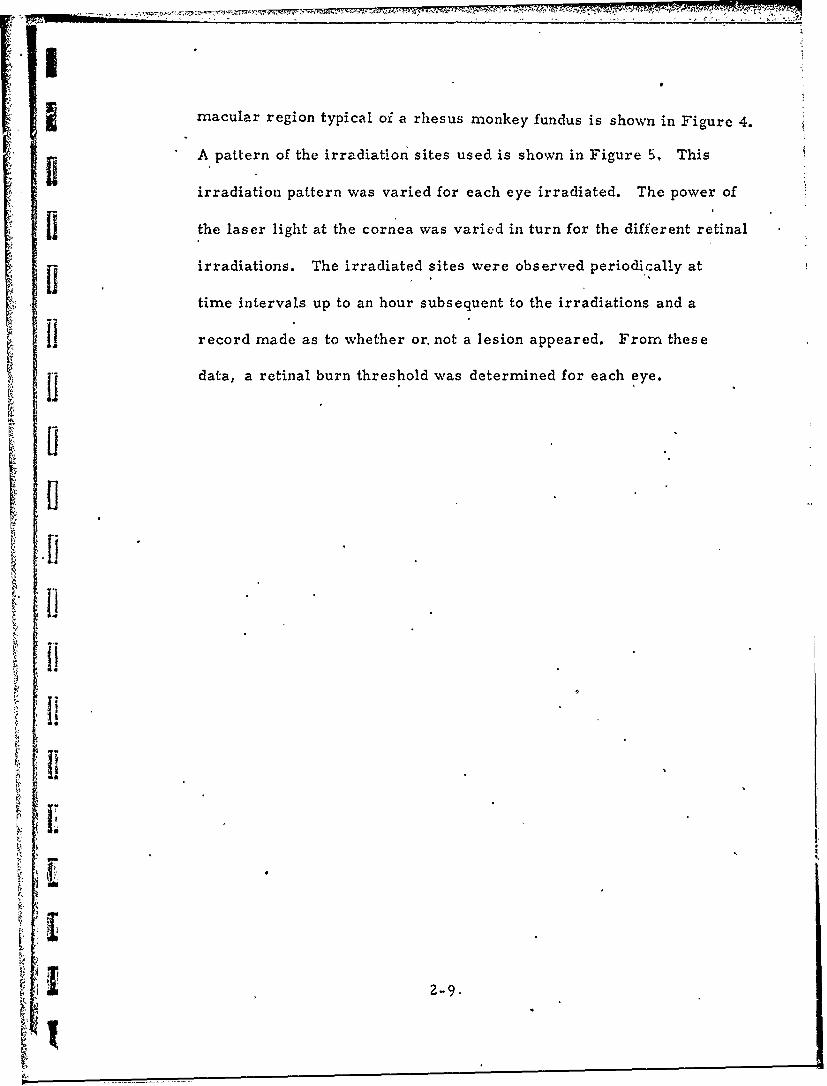
Irmacular region typical oi a rhesus monkey fundus is shown in Figure 4.
A pattern of the irradiation sites used is shown in Figure 5. This
irradiation pattern was varied for each eye irradiated. The power of
the laser light at the cornea was varied in turn for the different retinal
irradiations. The irradiated sites were observed periodically at
time intervals up to an hour subsequent to the irradiations and a
] [record made as to whether or. not a lesion appeared. From these
data, a retinal burn threshold was determined for each eye.
[.19
II
]i L
II
2-9.
. .. .. .. .. ..
................... ........... .... **'~ ...... ::~*:: ....... m..... .....
................................... ...... .......... .. .......
.............................. ........:- . .. . .. ....... ** ~ * * * *
...................
.. . . . . . . . . . . . .....
S.v..::FOVMACLA REGION<........
.. . .. ... .. .....*.....*... .... ... ......-. R K UR
....... ....... ........ .....
......... . . . . ......... '.. b~ .*.. ..... * .* **** .... . MA U A REGION~ ~*~* ... *... :
Figure 5..Shmai Diagram Shoin tMarer Baulrn LocaionsfthMandypcal Irradiationsu~mny Pattern
7'
K 2-10
3. EXPERIMENTAL RESULTS
3. 1 Variable Duratioil cw Experiments
Waveforms typical of those recorded for the 1 sec, 10 sec, 10 sec
VI -3Sand 10 sec FWHMP pulses chopped from the cw laser radiation are
shown at A, B., C andD, respectively, "in Fig u r e *6. Th e s e
are tracings of the actual waveforms that were recordcd on polaroid
Sfilm for a permanent record.
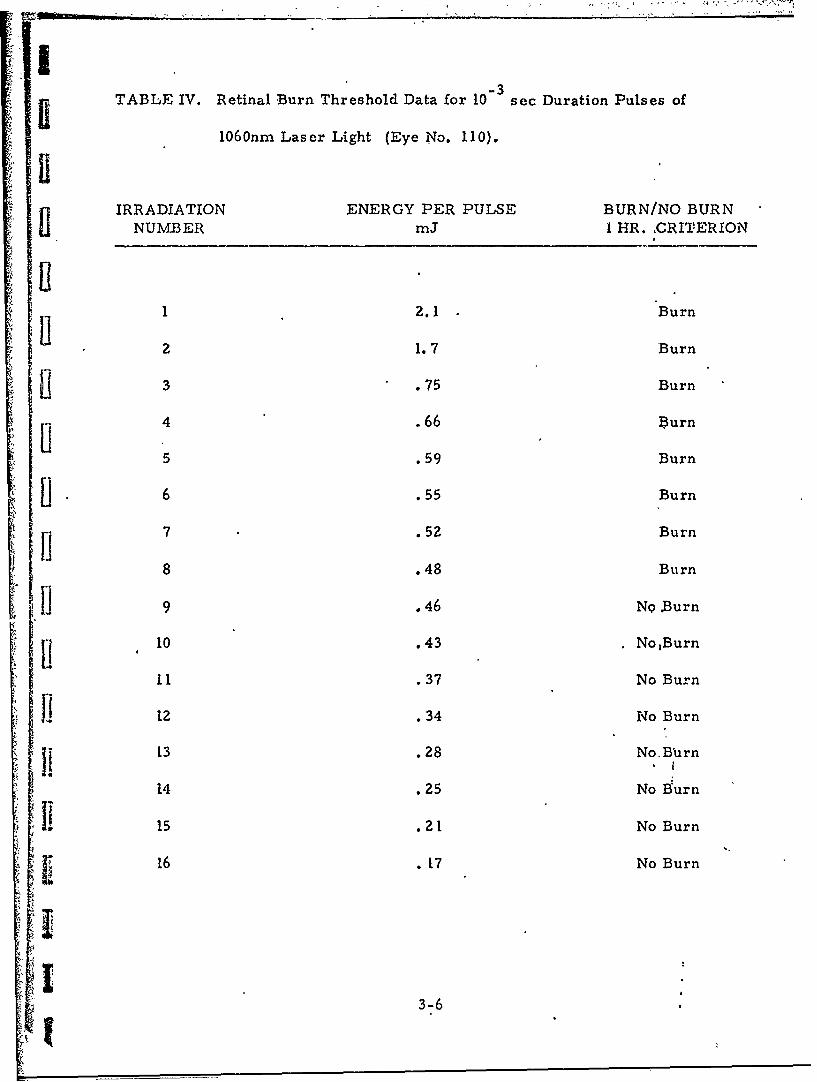
Data like those from which the retinal burn thresholds were determined
-1 -are shown in Tables I through IV for-the 1 sec, 10 sec, 10 sec and
-3
10 exposures, respectively. The corresponding retinal burn thres-
Sholds obtained from an analysis of the data secured are summarized
$ in Tables V through VIII.
i Data like those listed in Tables I through IV were analyzed uwng a
probit technique (10)(see Appendix C for details of the probi. a-nalysis
1! used in this study). The results of the probit analys3is are shown in
Figures 7throughl0 for the I sec, 10-1 sc, 102 sec andthe0 sec
duration exposures, respectively. In each of the Figures 7-10, the
retinal burn probability is plotted versus the energy per pulse incident
'~ I:on the cornea.
3-1
I
14 ; H !-
0.5 v/cm, 0.5 sec/cm 0.2 v/cm, 0.05 sec/cm
F Ai B.
3i--S'i - -
SF.v',5se/m02/m,0Sscc
IIII3-2
+4 r*
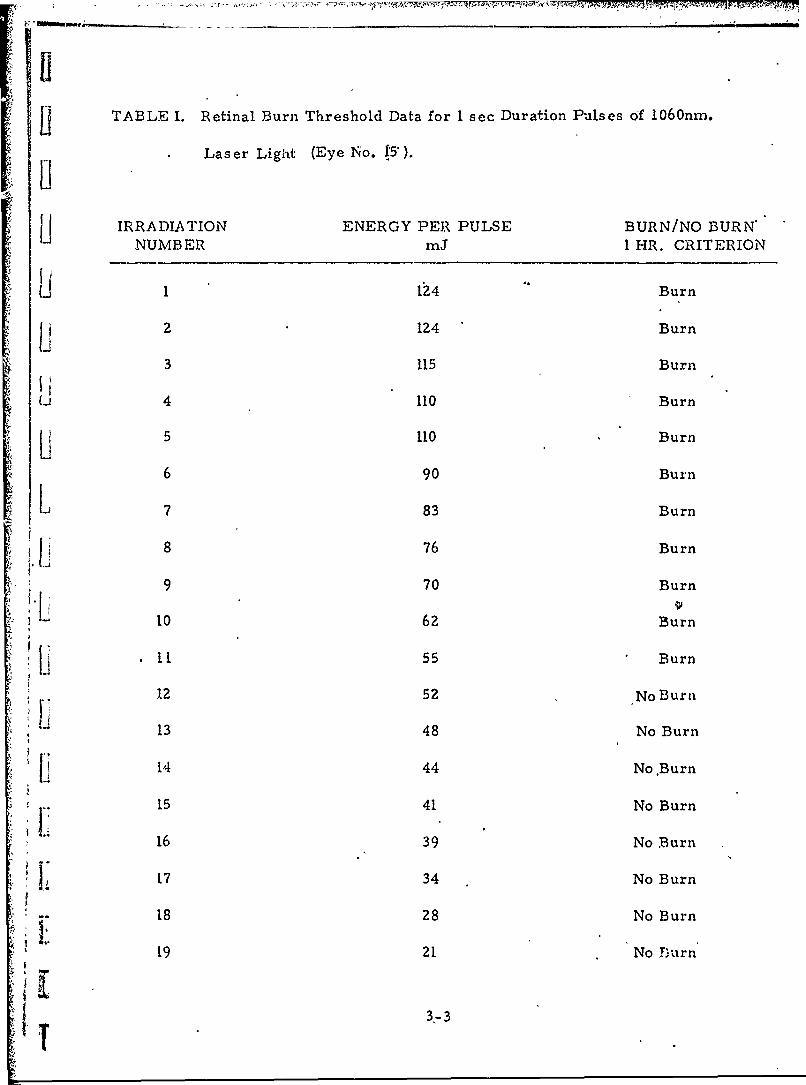
UTABLE I. Retinal Burn Threshold Data for 1 sec Duration Pulses of 1060nm.
Laser Light (Eye No. 5").
IRRADIATION ENERGY PER3 PULSE BURN/NO BURN'NUMBER mj1 HR. CRITERION
1 124 " Burn
2 124 Burn
3 115 Burn
4 110 Burn
S5 110 Burn
6 90 Burn
L 7 83 Burn
8 76 Burn
9 70 Burn
10 62 Burn
. .11 55 Burn
12 52 No Burn
13 48 No Burn
14 44 No Burn
15 41 No Burn
16 39 No Burn
. 17 34 No Burn
18 28 No Burn
19 21 No YTurn'
3.-3
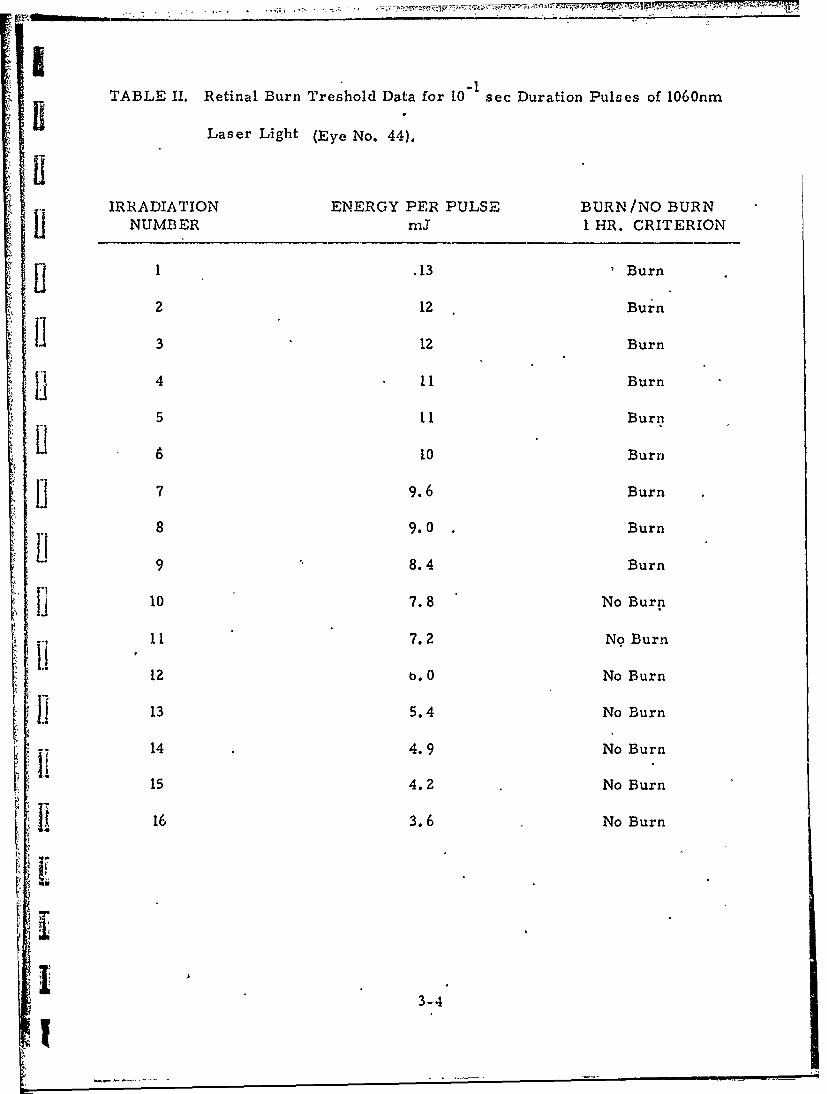
ITABLE II. Retinal Burn Treshold Data for 10"1 sec Duration Pulses of 1060nm
Laser Light (Eye No. 44).
IRRADIATION ENERGY PER PULSE BURN/NO BURNNUMBER mJ 1 HR. CRITERION
S1 .13 Burn
2 12 Burn
[. 3 12 Burn
Ii 4 11 Burn
5 11 Burn
16 0 Burn
j 7 9.6 Burn
8 9.0 . Burn
9 8.4 Burn
jJ 10 7.8 No Burn
11 7.2 No Burn
12 b. 0 No Burn
. 13 5.4 No Burn
14 4.9 No Burn
15 4.2 No Burn
16 3.6 No Burn
II
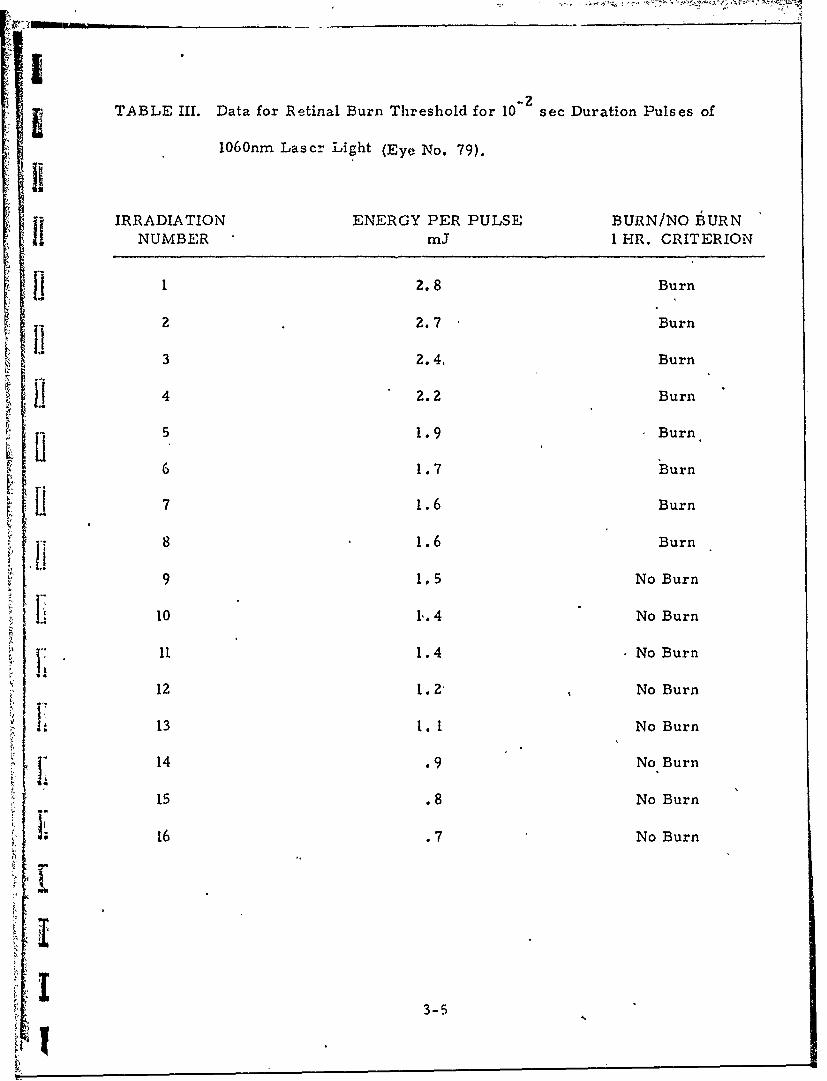
TABLE III. Data for Retinal Burn Threshold for 10 sec Duration Pulses of
1060nm Lascr Light (Eye No. 79).IiIRRADIATION ENERGY PER PULSE BURN/NO BURN
SNUMBER mJ I HR. CRITERION
1 2.8 Burn
2 2.7 Burn
3 2.4. Burn
[! 4 2.2 Burn
5 1.9 Burn
6 1.7 Burn
7 1.6 Burn
81.6 Burn
9 1,5 No Burn
1 10 1,. 4 No Burn
• 11 1.4 No Burn
12 1.2" No Burn
1± 13 1.1 No Burn
I14 .9 No Burn
15 .8 No Burn
16 .7 No Burn
3-5
"-3
TABLE IV. Retinal Burn Threshold Data for 10 sec Duration Pulses of
1060nm Laser Light (Eye No. 110).IIIRRADIATION ENERGY PER PULSE BURN/NO BURN
NUMBER mJ 1 HR. CRITERION
1 2.1 Burn
2 1.7 Burn
3 .75 Burn
4 .66 Burn
5 .59 Burn
6 .55 Burn
7 .52 Burn
8 .48 Burn
9 .46 NQ Burn
11 10 .43 NoBurn
11 .37 No Burn
S12 .34 No Burn
13 .28 No Burn
14 .25 No Burn
15 .21 No Burn
2 16 .17 No Burn
3-6

Table V. Retinal Burn Thresholds for 1 sec Duration Exposures.
Eye Threshold
'Uj1 45.72 42.03 67.74 47.5
5 60.26 47.97 40.2[1 8 46.69 47.6
10 33.4"[11 34.4
12 45.413 43.814 47.515 53.816 78.717 44.018 52.419 38.9LI20 66.721 65.622 . 42.923 33.324 35.625 28.726 45.827 49.028 36.929 31.3
30 41.531 40.432 33.3
3
:1.3-
IH
"Table VI. Retinal Burn Thresholds for 10- sec Duration Exposures
SEye T hresholdmJ
S33 7.4434 10.4035 10,3436 6.4237 7.7738 5.2439 5.9440 7.4741 8.0842 7.4743 6. 1444 8.0845 5.6746 8.0747 9.4248 8.0749 6.70s0 6. 1451 6.1452 6.49
53 6.4854 7.0755 6.4956 5.7457 6.32
58 6.3159 5.1760 4.0261 4.6062 6.5763 7.17
8-
I
I
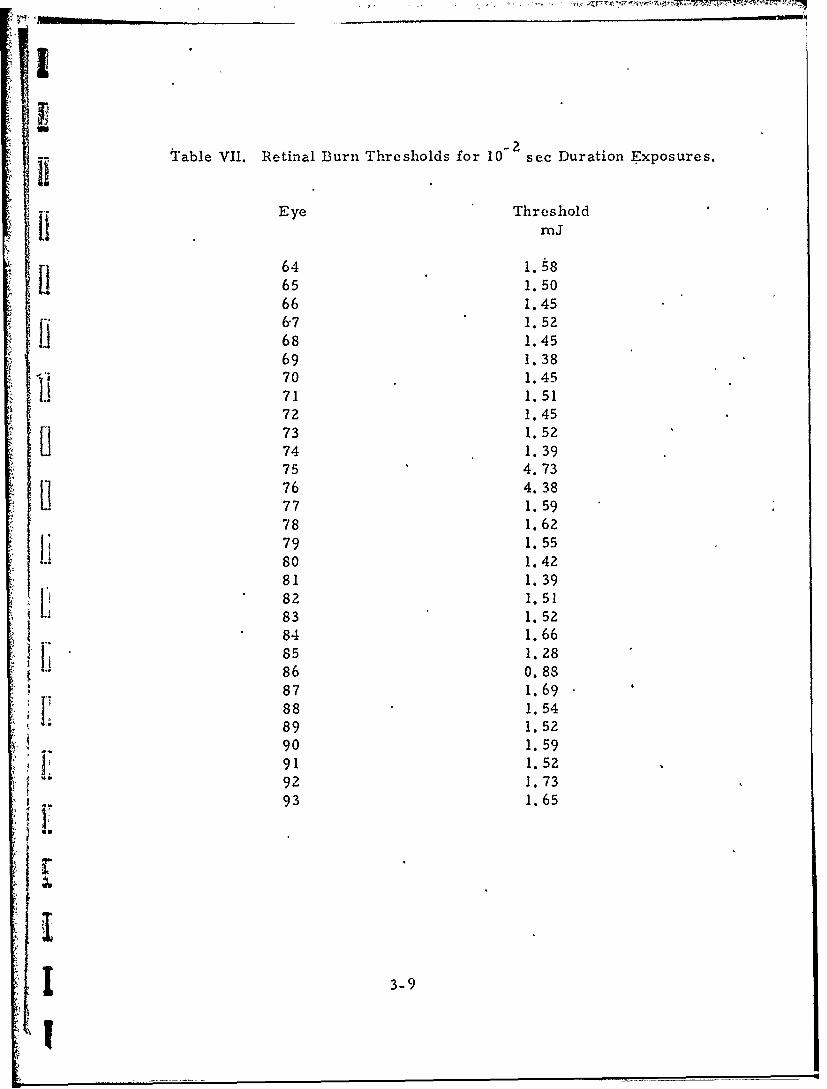
table VII. Retinal Burn Thresholds for 10 sec Duration Exposures.
Eye ThresholdL! mJ
64 1. 5865 1.5066 1.456.7 1.5268 1.4569 1. 3870 1.45
U 71 1.5172 1.45
V 73 1.5274 1. 3975 4.73Ii76 4.3877 1. 5978 1.6279 1.5580 1.4281 1.39182 1. 5183 1.5284 1.66
It85 1.2886 0.8887 1.69
P 88 1.5489 1.5290 1.5991 1. 5292 1. 73
93 1. 65
I3
I 3-

I5 Table VIII. Retinal Burn Thresholds for 10- see- Duration Exposures.
IEye ThresholdPJ
94 52595 57696 44097 50898 44099 423
100 669101 508102 4571103 423
104 457105 449
lI 106 475107 502108 398109 502110 475
447113 449113 404
115 449116 448117 395118 484119 449120 359121 314122 341
I123 398
3-10
Iin
H .9,
Li .~.6 .i--- ---
.0
Pi 0.5-
IiP00
.2.- . . .. . . . .
0 20 40 60 80
Energy (millijoules)
Fig. 7. Retinal Burn Probability versus the Energy Per1 sec Duration Pulse of the 1060 nm Laser Light(30 Eyes).
3'1 3-11
JQJ
U
.9-
Eli .8
S.7 ... .. _ _ _
lii *i-I .6 - _ _ _
.0
S0 2 46 8 10
Energy (millijoules)
Fig. 8. The Ret nal Burn Probability Versus EnergyPer 10"0 secDuration Pulse of 1060 n- Laser
Light (30 Eyes).
" 3-12
4!~___
~.ff
[1
'111~P .4 - -- A -
_ / _
.8" - a - _
00
00
o 0
Fig.1 9. 0.5a ur rbiit saFucino
S.4., •
the Energ Pe• 0 scDrainPleo
II •
•i0 1 23
Energy (millijoules)
S~Fig. 9. Retinal Burn ProbaJ~ilty as a Function of
the Energy Per 10" sec Duration Pulse of
the 1060 nm Laser Light (30 Eyes).
I 3-13
ji
I
I
:I i
.6.
11.4.
.- 2-
( Ii ,
. .¼
0 0 0 .2 .5 -
"-341
S.4.).:
,
4) ___'
Sa.:
, a
Figi . _ _ 0, R e5a _un
P ob b _t ve_ _ h E e g e
4_I0" se Duration Pulse of the 1060 nm LaserLight (30 Eyes).
3-14I
3.2 O-Switched Pulse Experiments
A waveform typical of those used during the C-switched pulse exposures
of the .primate eyes is -shown in Figure 11 which is a tracing from the
permanent record on polaroid film. The FWHMP of the C-switched
-7pulses was 7 x 10 sec.
Data typical of those from which the retinal burn thresholds were deter-
mined are shown in Table IX. The corresponding retinal burn thresholds
obtained from an analysis of these data are shown in Table X.
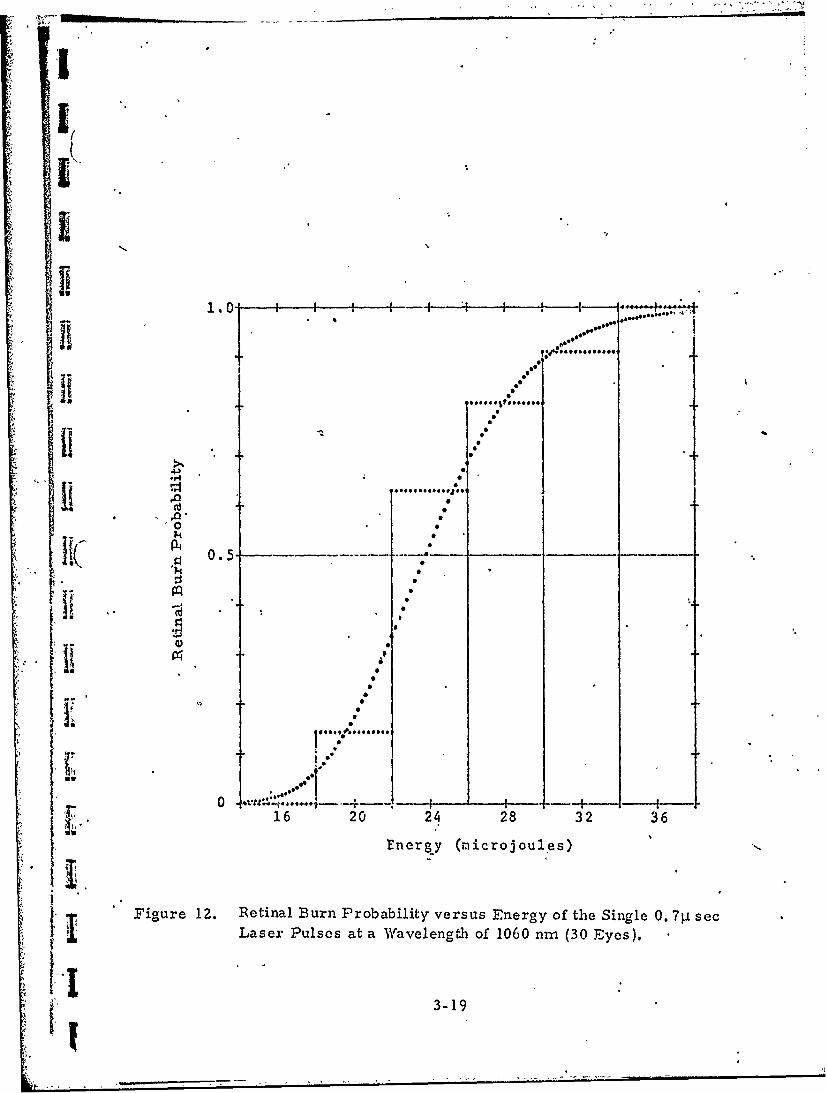
SThe data like those shown in Table IX, from 30 primate eyes, were
analyzed using the probit technique. A portion of the results obtained
H from this probit analysis is shown graphically in Figure 12 where the
M]b retinal buirn probability is plotted versus the energy per pulse at the
corneas irradiated.
3.3 0-Switched Pulse Train Experiments
Trains of the 7 x 10⁻⁷ sec pulses (like .at pulse shown in .'igure 11)
Sat a pulse repetition rate of 1 kFlz and lasting for 0. 5 sec were used to
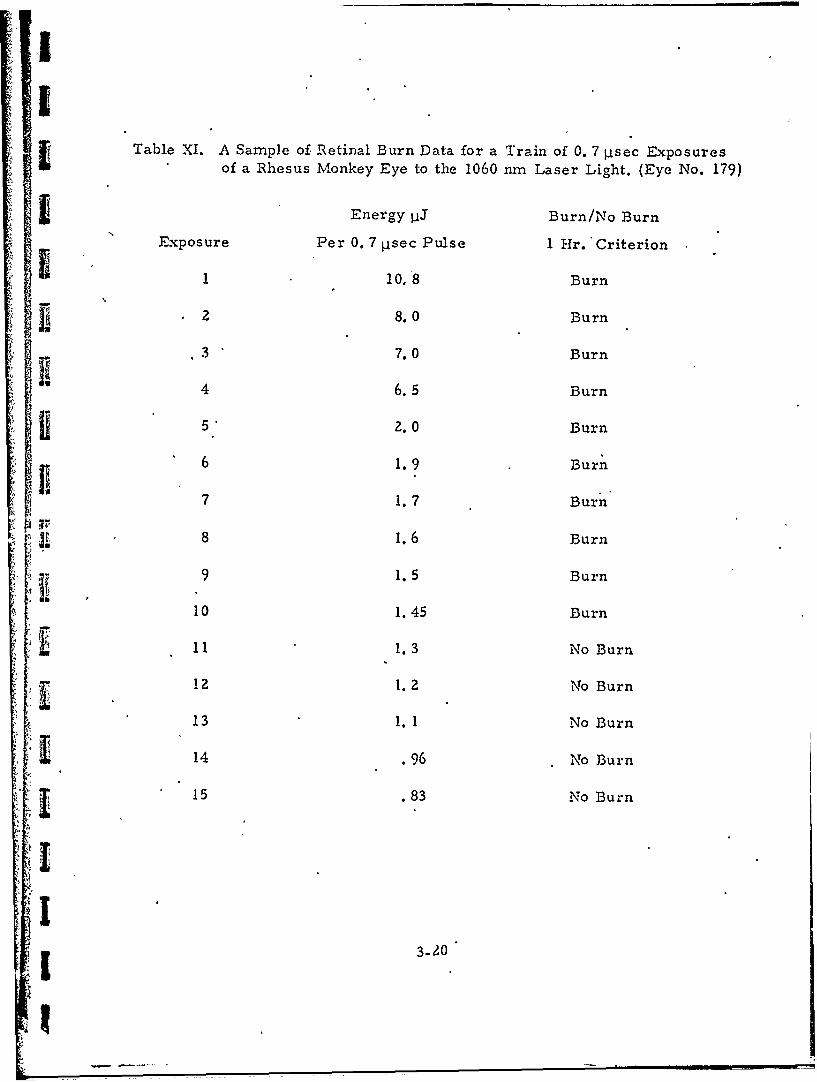
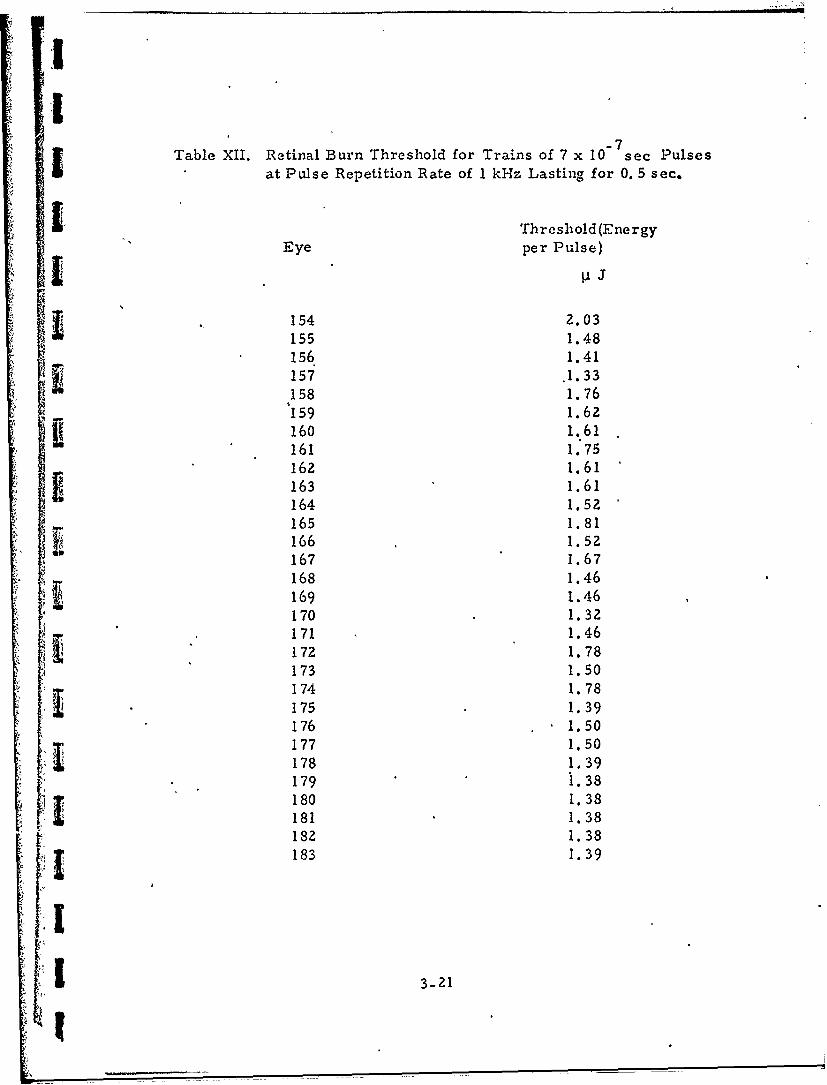
[ irradiate primate eyes. Retinal burn data typically obtained during
these pulse train experiments are displayed in Table XI. The retinal
burn thresholds obtained from the analysis of data like those in 'Lable XI
for 30 primate eyes are summarized in Table XII.
3-15'& I
I
- -f+ - ,,,, H-H H-H ,F" " -I--H- -1H- I - F -H-1-I.-.--,i--.-t-- F F--- Ik F---- 1 1 -I i
Figure 11. Tracing of a Typical Single 0.7 u sec Puls• at a Waveleia•tl,- of 1060 nxn (Vertical Sensitivity of Oscilloscope ;'was 20 v/cm
and the Sweep Rate was 1 psec/cm)
I
H 3- 16
L!
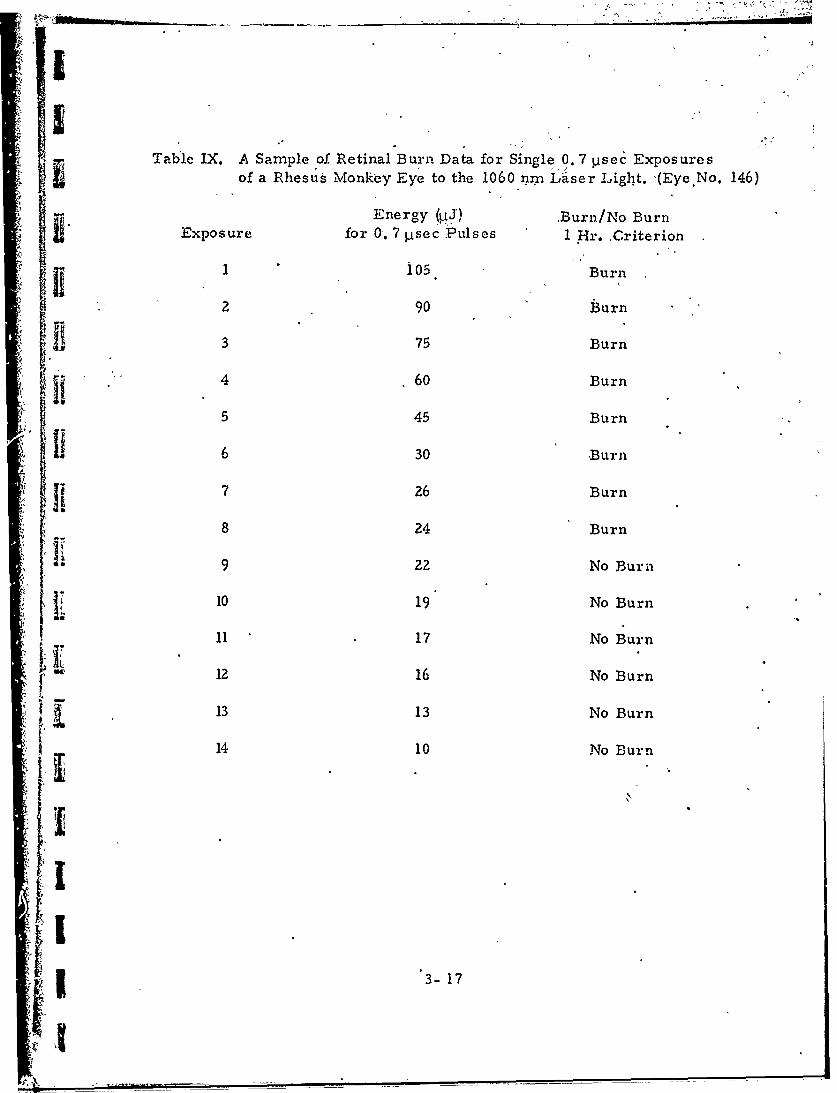
STable IX. A Sample of Retinal Burn Data for Single 0. 7 psec Exposuresof a Rhesus Monkey Eye to the 1060 nmn i'ser Light. ý(Eye.No. 146)
Energy !1 J) Burn/No BurnExposure for 0. 7 psec Pulses I Hr. Criterion
1 105. Burn
2 90 Burn
3 75 Burn
4 60 Burn
5 45 Burn
S6 30 Burn
I 7 26 Burn
8 24 Burn
L 9 22 No Burn
110 19 No Burn
11 17 No Burn
12 16 No Burn
13 13 No Burn
14 10 No Burn
3
p _ _ _ _ 3- 17

Table X. Retinal Burn Thresholds for 7 x 10 sec Duration Exposurcs.
Eye Thre'shold
124 42.7125' 42.7
4 126 23.3127 23.3128 22.6129 24.8
F1 130 20.4131 21.5132 19.4133 25. '3134 23o9135 21.8136 17.7
137 17.7138 21.8139 23.9140 24.2
lZ141 24.1142 24.2143 24.1144 27.5
S'145 ,31.1.146 22.7147 27.5148 2b. 1149 25.1150 29.0151 29.0152 19. 6153 19.6
1 3-18
fig
1.0 -1
1.0- i
l
W0a
0
4..
.33-19
11 . .0'00
0 . 5 ... _--__
IO'
IiiD
0 1xu~ ,..,a.:...1. ,r-f,.----
.. 16 20 24 28 32 36
Ener gy (rmierojoules) .
"Z•.
"hr Figure 12. Retinal Burn Probability versus Energy of the Single 0. 71isec
Laser" Pulses at a W•\avelength of 1060 nm (30 Eyes).
I Ii3-1
I
r Table XI. A Sample of Retinal Burn Data for a Train of 0. 7 11sec Exposuresof a Rhesus Monkey Eye to the 1060 nm Laser Light. (Eye No. 179)
Energy pJ Burn/No Burn
Exposure Per 0.7 psec Pulse 1 1Ir. Criterion
1 10,'8 Burn
2 8.0 Burn
S7. 0 Burn
4 6.5 Burn
i5, 2.0 Burn
6 1.9 Burn
7 1.7 Burn
8 1.6 Burn
-~9 1.5 Burn
10 1.45 Burn
11 1.3 No Burn
12 1.2 No Burn
13 1. 1 No Burn
14 .96 No Burn
1 15 .83 No Burn
I
I
-7Table XII. Retinal Burn Threshold for Trains of 7 x 10 sec Pulses
at Pulse Repetition Rate of 1 kHz Lasting for 0. 5 sec.
LThreshold(Energy
Eye per Pulse)
154 2.03155 1.48
156 1.41157 .1.33158 1.76
r159 1.62S160 1.61
161 1.,75162 1.61163 1.61
164 1.52165 1.81166 1.52167 1.67168 1.46169 1.46170 1.32171 1.46172 1.78173 1.50174 1.78175 1.39176 1.50177 1.50178 1.39179 1.38180 1.38181 1.3818Z 1.38183 1.39
3-21
!f
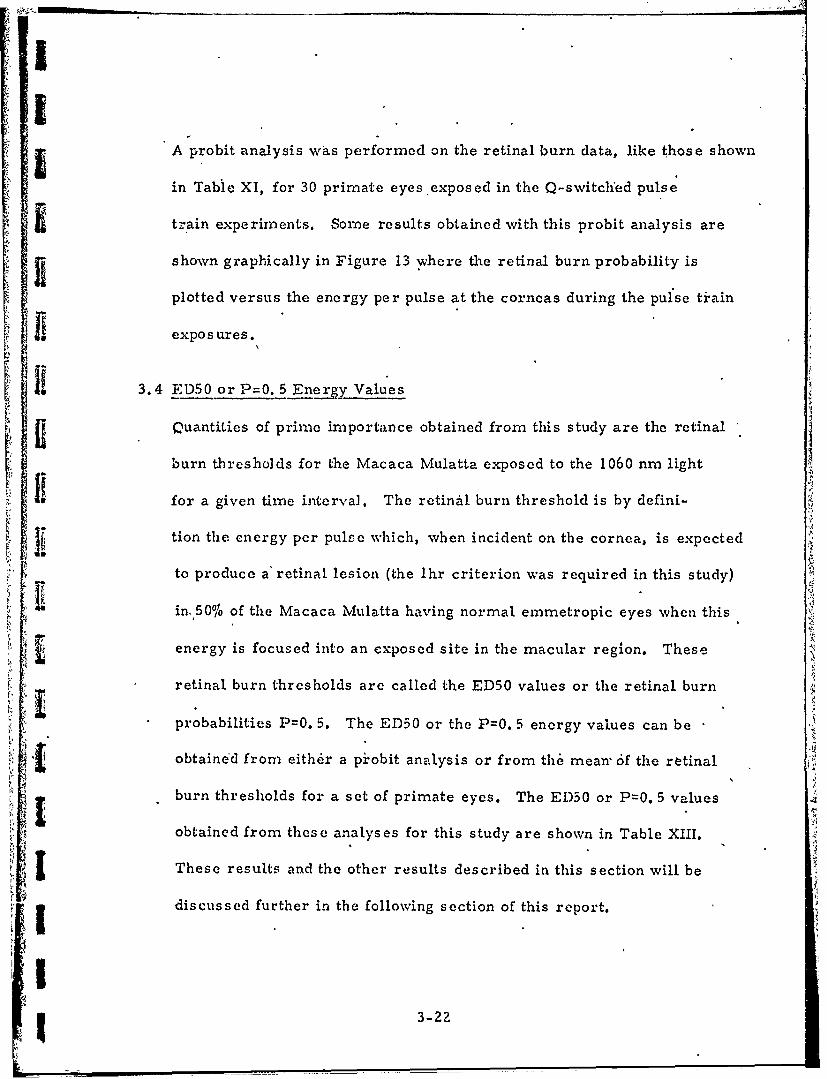
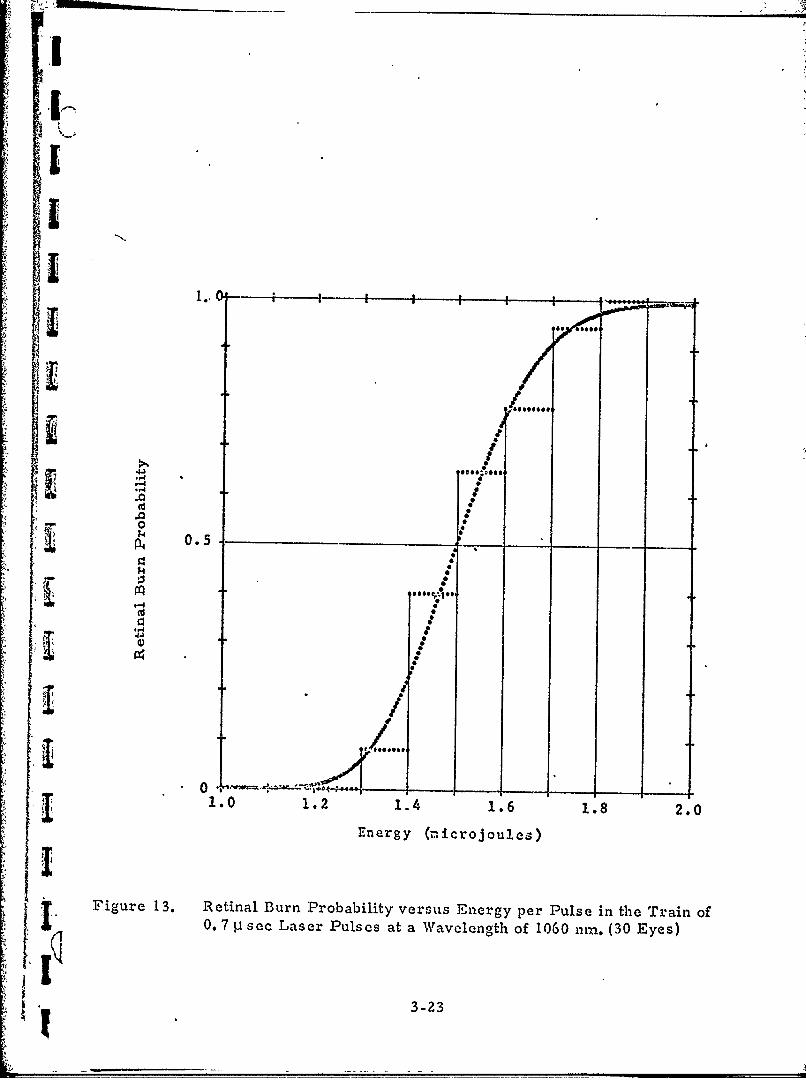
A probit analysis was performed on the retinal burn data, like those shown
in Table XI, for 30 primate eyes exposed in the Q-swvitclfed pulse
train experiments. Some results obtained with this probit analysis are
fi shown graphically in Figure 13 where the retinal burn probability is
plotted versus the energy per pulse at the corneas during the pulse train
exposures.
3.4 ED50 or P=O. 5 Ene~y Values
Quantities of prime importance obtained from this study are the retinal
burn thresholds for the Macaca Mulatta exposed to the 1060 nm light
for a given time interval. The retinal burn threshold is by defini-
tion the energy per pulse which, when incident on the cornea, is expected
to produce a'retinal lesion (the lhr criterion was required in this study)
in, 50% of the Macaca Mulatta having normal emnrmetropic eyes when this
j energy is focused into an exposed site in the macular region. These
retinal burn thresholds are called the ED50 values or the retinal burn
probabilities P=0. 5. The ED50 or the P=G. 5 energy values can be
"4 ~ obtained from eith6r a piobit analysis or from th6 mean' 6f the retinal
burn thresholds for a set of primate eyes. The ED50 or P=0. 5 values
obtained from these analyses for this study are shown in Table XIII.
These results and the other results described in this section will be
discussed further in the following section of this report.
""2
IT
1.
& t o ,
ITI
| '4
.00
1.0 1. .410. .
± 0.5--
1-0 ., ...ve0. 7 ....et W e n o
G3-23
T1.0 1.2 1.4 1.6 1.8 2.0
Energy (microjoulea)
,I Figure 13. Retinal Burn Probability versus Energy per Pulse in the Train of'IFO0 7 pa soc Laser Pulses at a W•avelength of 1060 mnm (30 Eyes)
I? .. 2 "- ] ". -L "- -- _,
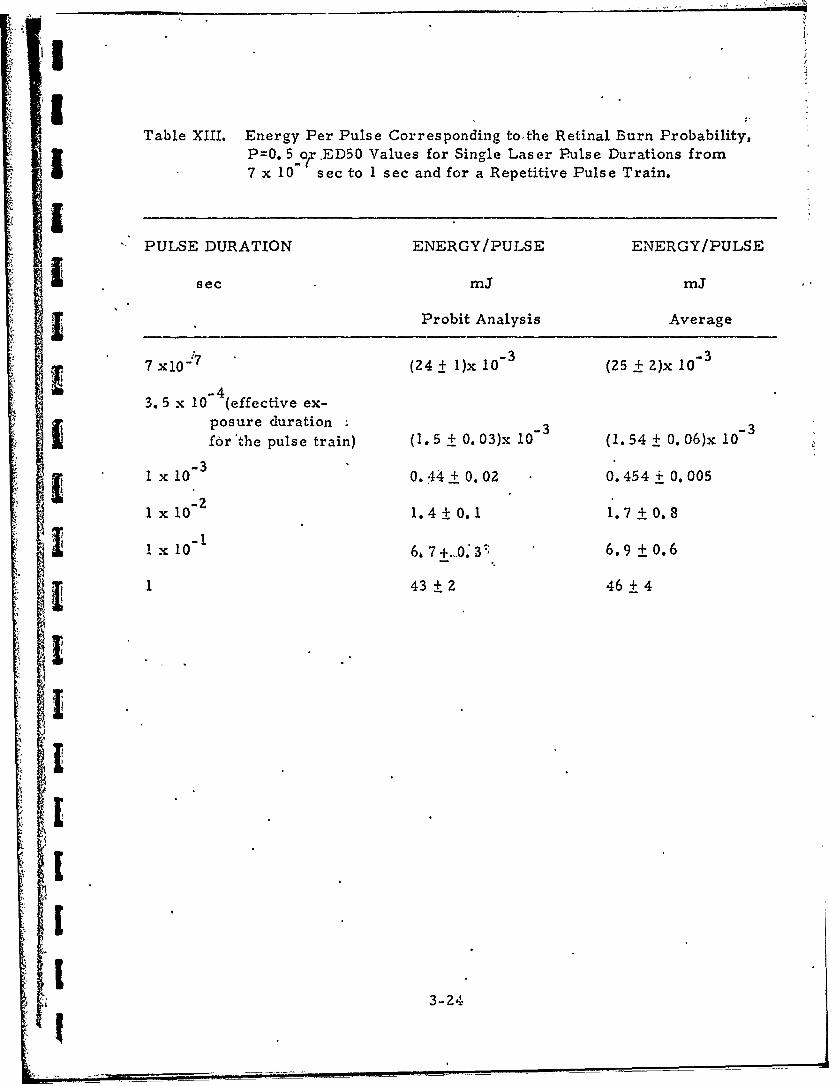
Table XIII. Energy Per Pulse Corresponding toothe Retinal Burn Probability,P=0. 5or .ED50 Values for Single Laser Pulse Durations from7 x 10 sec to 1 sec and for a Repetitive Pulse Train.
"PULSE DURATION ENERGY/PULSE ENERGY/PULSE
sec mJ mJ
Probit Analysis Average
7 xl0' 7 (24 + 1)x 10-3 (25 + Z)x 10-3
3. 5 x 10 (effective ex-posure duration 3 3for'the pulse train) (1. 5 + 0.03)x 10- (1. 54 ± 0.06)x 10
I x 10-3 0.44+0.02 0.454 + 0. 005
1 x 10"2 1.4± 0.1 1.7 _0.8
! 10" 6. 7 +.-0.3", 6.9 + 0. 6
1 43 2 46 + 4
.3-24\
3-24
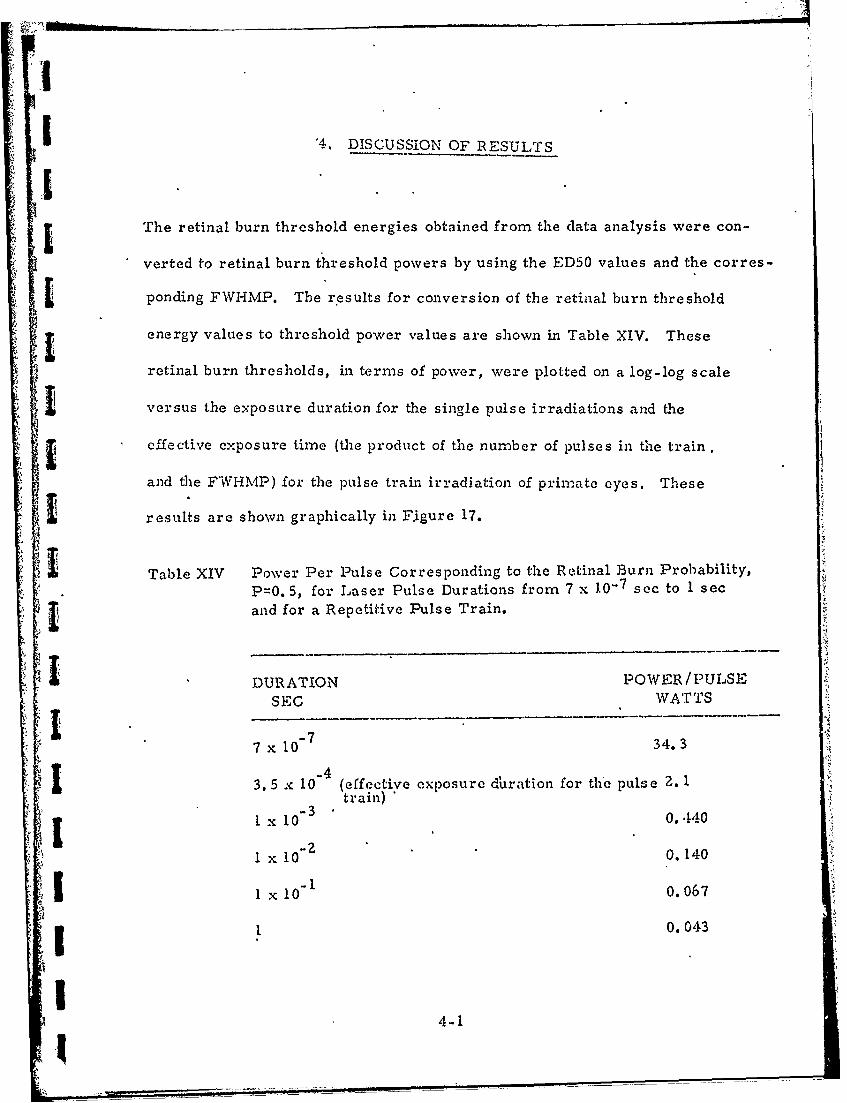
S4. DISCUSSION OF RESULTS
IThe retinal burn threshold energies obtained from the data analysis were con-
verted to retinal burn threshold powers by using the ED50 values and the corres-
ponding FWHMP. The results for conversion of the retinal burn threshold
energy values to threshold power values are shown in Table XIV. These
retinal burn thresholds, in terms of power, were plotted on a log-log scale
versus the exposure duration for the single pulse irradiations and the
[ effective exposure time (the product of the number of pulses in the train,
and the F'WHMP) for the pulse train irradiation of prin-ate eyes. These
results are shown graphically in Figure 17.
Table XIV Power Per Pulse Corresponding to the Retinal Burn Probability,P=0. 5, for Laser Pulse Durations from 7 x .0-7 sec to 1 secand for a Repetitive Pulse Train.
DURATION POWER/PULSESEC WATTS
7 x 10- 34.3
-43.5 x 10 (effective exposure dUration for the pulse 2. 1
train) 01 10 I03 0.440
I x 10 0.140
I 1x 101 0.067
1 1 0.043
4-1
i
-J
CLw w
(D 4 00a.I
z
w w 0:
-0 :5-;
il0w
14
00
0w
/ '0
041
/ 4-2
I
d3+
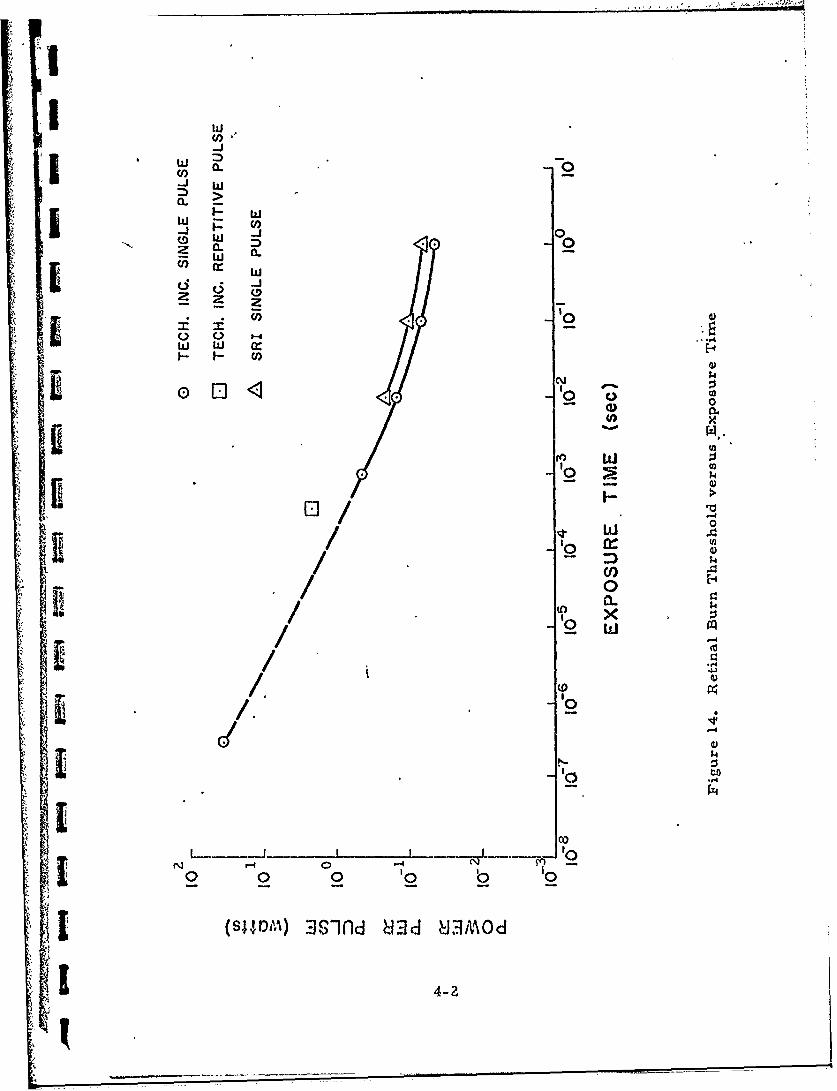
Work was done elsewhere using a Nd-YAG laser tP determine retinal
burn thresholds for primates with some exposure durations being on the
same interval as that reported in this document. The results obtained01 )
wer6 plotted (SRI curve) as shown in Figure 14. The results are
consistently higher than the results for the single pulse exposure reported
here by a factor of approximately 1. 2. No remark was made about the
"modal pattern of the laser beam used; and, if this modal pattern was
not TEM0, then it is to be expected that the thresholds would be higher00'
because this beam would have a larger divergence.
In work reported elsewhere (11), an argon-ion laser operating in the TEM00
imode was used to produce retinal burns. The retinal burn thresholds for
primates irradiated by this argon-ion laser fall along a straight line when
displayed in a log-log plot. The reason why the Nd _-YAG data are non-
linear and the argon-ion laser data are linear on the log-log plots is not
known.
The retinal burn thresho]ds reported in this docLunent for the Nd 3+-YAG
laser are approximately a factor of 7 larger than thos6 obtained(11) with t.e
argon-ion laser for the same pulse durations. This value of 7 is approxi-
mately equal to the product of the ratio of the absorptance of the fundus( 12 )
at 514.5 urn to the absorptance of the fuindus at 1060 nrn (this factor is 2.5).KIand the relative areas of the minhinum spot areas for these two lasers
4-3 _
13I
(this factor is 2. 89 as seen below). The divergence of the Nd7-YAG laser
I beam is a factor of 1. 7 larger than the divergence of the argon-ion laser
beam (1) Thus the minimal area of the spot of the argon-ion light on the
"fundus should be a factor of about 2. 89 smaller than the spot area for the
YAG laser light. Because of the larger beam divergence and the smaller
absorptance of the fundus at .1060 nm, it is to be expected that the retinal
burn threshold for thle Nd +-YAG laser would be a factor of 7. 2 larger
than for the argon-ion laser. The agreement between these two values
S7 and 7.2 is remarkable. This can be taken to imply (1) that the Nd 3+-YAG
results reported here are internally consistent with the argon-ion data
reported elsewhere(II) and (2) the absorptance values for rhesus monkey
fundus oculi are accurately known :-- a't least on a relative basis.
-3The curve in Figure 14 between the 10- sec and 1 sec exposures can be
extrapolated graphically to predict the retinal burn probability for a
0-switched pulse having a FWHMP of 0. 7p sec. This extrapolation was
performed over three orders of magnitude in exposure time and it pre-
dicted a value of 20 11 J for the retinal burn threshold. The nearness of
the extrapolated value to our masured valLie reveals an internal consistency
between the long pulse duration data and the Q- switched data for the Nd 3 -
YAG laser operated in the TEM00 mode.
Results were repoi'ted elsewhere(1) for retinal burn thresholds for primates
3+exposed to a Q-sswitched Nd -YAG laser.- A value of 150 [J was reported
1 4-4
there for the retinal burn threshold for the macular regiori of rhesuis
I monkey eyes using a pulse with a 30 nsec FWHMP. It is clear that this
value (150 pJ) is not in agreement with the 24lp J value reported in this
current work. The exact reason for this apparent disagreement is not
I fully understood. A 30 nsec pulse would be expected to have an associated
lower retinal burn threshold than would a 0. 7 1 sec pulse if all other ex-
perimental conditions were the same. Clearly, the -conditions in these two
experiments were not the same. In the former experiment , the eyes
r were uncorrected whereas in the current experiment.they were corrected.
Inthe former experiment, the spot diameter into which the radiation was
focussed was estimated to be 9011. In the current experiment, the region
into which the energy is focussed is believed to be a "minimal- size-spot"
and is estimated to be 40 p or less in diameter. Finally, the energy
distribution in the laser beam in the former experiment was unreported
Sjwwhereas in the current experiment it was known with certainty to be TEM0 0.
It is worthwhile to compare the value for the threshold power per pulse for
the train 6f 0.7 u sec pulses at a pulse repetition rate of I kHz lasting
for 0. 5 sec with the value obtained froin the single 0. 7 Pt sec exposures.
I'Elhe former value is 2. 1 watts whereas the latter value is 34. 3 wvatts and
these differ by a factor of about 17. Making a similar comparison for the
I (13)results obtained for the power per pulse (15. 7 iew) to be reported
for a train of 10 p soc pulses at a pulse repetition rate of 1 kHz lasting for
4-5
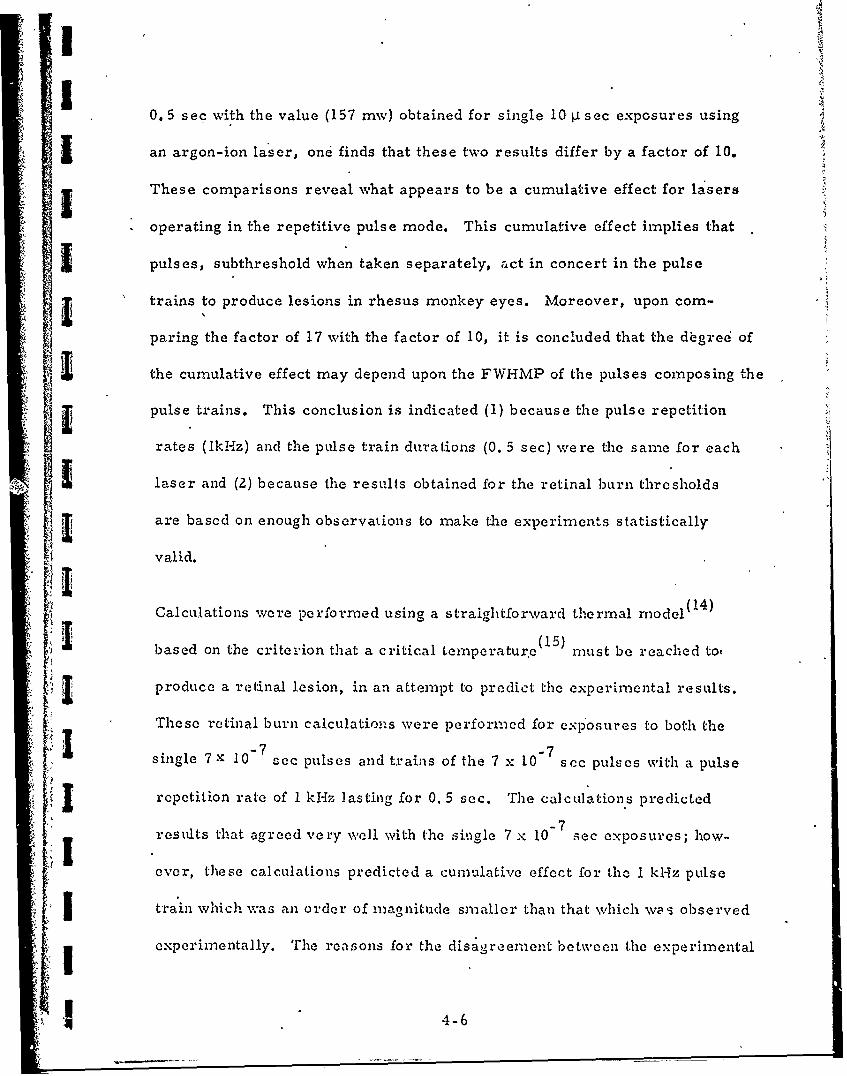
0.5 sec with the value (157 mw) obtained for single l0 p sec exposures using
an argon-ion laser, one finds that these two results differ by a factor of 10.
These comparisons reveal what appears to be a cumulative effect for lasers
operating in the repetitive pulse mode. This cumulative effect implies that
pulses, subthreshold when taken separately, act in concert in the pulse
trains to produce lesions in rhesus monkey eyes. Moreover, upon com-Iparing the factor of 17 with the factor of 10, it is concluded that the d~gred of
the cumulative effect may depend upon the FWHIMP of the pulses composing the
M pulse trains. This conclusion is indicated (1) because the pulse repetition
rates (IkI-Az) and the pulse train durations (0. 5 sec) were the same for each
laser and (2) because the results obtained for the retinal burn thresholds
are based on enough observations to make the experiments statistically
valid.TCalculations were performed using a straightforward thermal model 14)
based on the criterion that a critical Lemperature(15) must be reached to,
I produce a retinal lesion, in an attempt to predict the experi-nental results.
These retinal burn calculations were performed for exp'osures to both theI 7 -7single 7 X 10 sec pulses and trains of the 7 x 10 sec pulses with a pulse
I repetition rate of I kHz lasting for 0. 5 sec. The calculations predicted
results that agreed very well with the single 7 x 10⁻⁷ .•ec exposures; how-
ever, these calculations predicted a cumulative effect for the I kl-Iz pulse
'1 Itrain which was an order of magnitude smaller than that which was observed
experimentally. The reasons for the disagre ement between the experimental4-6

Iand calculate results for Ohe repetitive pulse train is not understood.
As seen in another study (13), in which this cumulative effect was ob-
served at several pulse repetition ratcs, this disagreement is not
due to some artilact of the 1 kHz pulse train used. The disagreement
between the experimental values and calculated *values may indicate either
(1) the thermal relaxation time and heat transfer coefficients of the chorio-
retinal tissues involved are temperature dependent or (2) the optical absoip-
tion coefficients of the chorioretinal tissues involved are temperature
dependent.
Some remarks about the use of both (1) the probit analysis and the (2) the
41 arithbmatical average of the individual retinal burr thresholds to determine
the ED50 value and/or the P=O. 5 values are in order. An underlying
assumption for using 'the probit technique to ahalyze these data is that
the retinal bdrn/no burn observations are independent ones. This implies
ltat each retinal site irradiated is independent of any other retinal site
and dor'rcsponds to a random sample of the primaee population. It
appears that the retinal burn data like that compiled in Table I; for
example, from observations on an eye may not be truly independent. To
see why those retinal burn probabilities may arise from dependent obser-
vations consider the following. Measurements taken elsewhere show that
the sensitivity of the chorioretinal tissues to laser light varies by about a
factor of 2 in going from the paramacular to the matular region and the latter
is the more sensitive than the former. Data from retinal burn thresholds
4-7
____... . . . . .

taken for 30 primate eyes fcr a given exposure duration, e. g., data like
that in Table VII reveal a variation of a factor of as much -.s 5 or 6 in
II the sensitivity of the macular region from primate to primate in the
rhesus monkey population. If the factor of 5 or 6 is considered to be
statistically valid,'then the variability between eyes at random is larger
Sthan the variability within any particular eye. Hence, it is possible.
11 that the frequency of observations used to determine retinal burn prob-
(16)abilities in any energy interval is different than for the population
If this is true, then the observations are not truly iiidependent and the
Sprobit technique m ust be used w ith caution, if used at all. It is interesting
to note that of the 6 sets of 30 primate eyes investigated in this study, only
those listed in Table VII reveal retinal burn thresholds with spreads (ratio
of highest to lowest values) that are only s.lightly greater than a factor of
: - 2. It is interesting to note that the mean of the retinal burn thresholds for
the 30 eyes in Table VII is 1. 70 rnJ with a standard deviation, a, of 0. 79mJ.
SIi The two values in Table VII which cause the spread to be greater than the
factor of 2 mentioned above have deviations from the mean value larger
than 3a. Following good statistical analysis procedures, some statis-
ticians recommend excluding measurements with deviations from the mean
which are greater than 3R. If this procedure is followed with the data in
Table VII, then the most probable value obtained for the retinal burn
threshold is (1. 50-0. 16)mJ, and it is concluded that the variations in the
sensitivity of the macular region of normal rhesus monkey eyes do not differ
V4-8
significantly by amounts greater than the factor of 2 from primate to
U primate. It this is the case, then the conditions for use of the probit
analysis may be satisfied.
As m-fentioned previously in this report it was the apparent difficulty using
Sthe probit analysis that led to the determ ination of the E D50 values by
Lcomputation of the arithmetical average for the set of 30 eyes irradiated
by the laser for a given exposure duration. It is observed that the 'ED50
values obtained using the probit analysis and determined by the ave% aging
U techniques agree well statisticilly. Moreover, it is noted that the 9570
confidence ]imit intervals obtained are smaller foe. the probit anilysis
than for the averaging process. The reason for the lack of agreement of
Sthe 951/ confidence limit intervals nsing these two techniques is not known;
but, it is suggestive of the fact that more observations are being used in
Vthe probit analysis than in the averaging process.
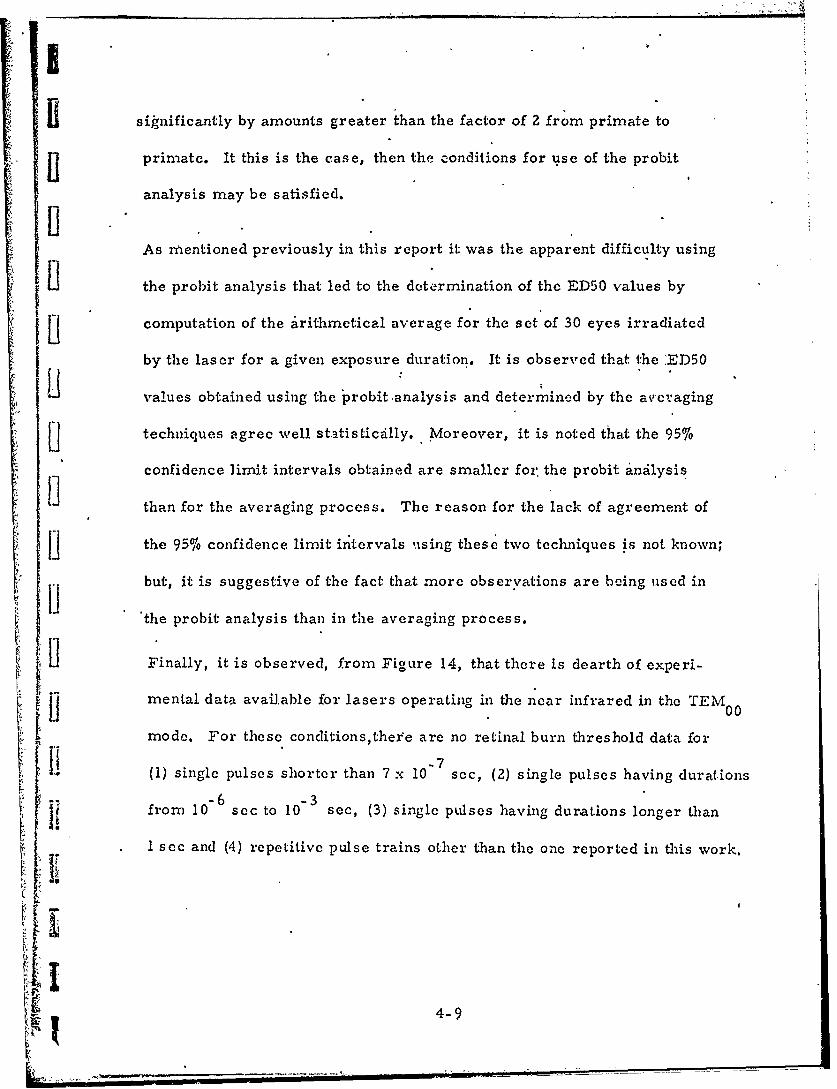
LI Finally, it is observed, from Figure 14, that there is dearth of experi-
mental data available for lasers operating in the near infrared in the TEM 0
mode. For these conditionsthere are no retinal burn threshold data for
11 (1) single pulses shorter than 7 x 10 sec, (2) single pulses having durations
-6 -3from 10 sec to 10 sec, (3) single pulses having durations longer than
1 sec and (4) repetitive pulse trains other than the one reported in this work.
4-9", 1Ej.,

5. SUMMARY AND CONCLUSIONS
The ocular effects of near infrared laser light were investigated in this study.
The Loer used during the investigation was a Nd -YAG laser. This las'er
emitted light at a wavelength, of 1060 nm in the TEM00 mode. Retinal burn
probabilities were determined for six different exposure durations.. The
exposures were for. (1) single pulses with'durations of I sec, 10 sec, 10 sec,
I -3 -7 710 sec and 7 x 10 sec and (2) a train of 7 x 10- sec pulses with a puls'e
Lrepetition rate of I kHz and lastinig for 0. 5 sec. Retinal burn thresholds were
obtained for 30 rhesus monkey eyes for each exposure duration. The ED50
values were determined (1) by using a probit analysis of the retinal burn data
ii and (2) by finding the arithmetical average of the. retinal burn thresholds for
LI each set of 30 primate eyes. The -arithmetical averaging technique was
employed when it was demonstrated using Monte Carlo methods that the
L retinal burn observations may not be independent as they must be-for
(10)I] accurate use of the probit method . The results obtained from these two
analyses are shown in TablfXIIIwith the corresponding.95% confidence intervals.
.. T The reasons for the agreement between the ED50 values and the disagreement
i between the 955% cbnfidence limit intervals for corresponding exposure dura'-
tions from these two analyses are not understood fully.
The ED50 values obtained for the long pulse exposures (10"3 sec to 1 sec)'
in tbis study were compared with ED50 values using another Nd" "-YAG laser
elsewhere (I. The ED50 values found in the other study (1) disagreed con-i
5- IIi

B sistently by a factor of 1. 2 with those found in the study reported here. The
disagreement between these ED50 values probably indicates that the otherIINd3+Nd -YAG laser was not operated in the TEM mode.
00LI -7The EDI50 value (24+1 UJ) for a single 7 x 10" sec pulse was compared with.
(I -3U the ED50 value (20 PJ) by extrapolating graphically the long pulse data (10
sec to 1 sec exposuies) on a log-log scale. The closeness of these two values
was interpreted to imply that the long pulse data and the single Q-switched
Ii pulse data were internally consistent.
The ED50 value (244JaJ) for the single 7 x 10 sec pulse was .compared with
the ED50 value (150uJ) obtained for a 30 nsec pulse in another stu4y(1 ). A portion
of the disagreement between these two values is attributable to (1) eyes were
(1)not corrected in the -other study . and (2) estimated:retinal spot size was 901A
in the other study and .40 or less in' this study.
U A cumulative effect was found for the Nd 3+ YAG laser operating in the repetitive
pulse mode. The existence of this cumulative effect appears obvious from a
-7L comparison of the ED50 value (24•1WJ) for single 7 x 10 sec exposures with
the ED50 value (1. 50.+0. 03,uJ) per pulse in the train of 7 x 10"7 sec pulses at
a pulse repetition rate of 1kHz lastihg for 0. 5 sec. The observation of this cumu-lative effect indicates that subthreshold pulses (taken individually') appear to.
work in concert (in the pulse trains) to produce retinal lesions. Calculations per-
formed to predict the ED50 values using a straightforward thermal model4and a
i 5-2
H!
i
(15)LItemperature critericin gave results in agreement with experiments for£ -7
the single 7 x 10 sec exposures; but, these calculations underestimated the
cumulative effect observed by about an order-of-magnitude. The reasons for
""the lack of agreement between the calculations performed and the experimental
results obtained for the repetitive pulse train merits further study.
L A great lack of retinal burn threshold data exists for lasers operating at
near infrared wavelengths. This dearth of information indicates that much
additional work must be done to obtain ED-50 values for single pulse
Ul exposures and many different pulse trains. The single pulse studies
-7should include exposure durations (1) shorter than 7x10 sec., (2)
between 10-6 sec and 10 sec., and (3) longer than 1 sec. The pulse
ii train experiments that appear to be required include (1) trains composed
4 of pulses with several different FWIIMP, (2) trains with many different
pulse repetition rates and (3) pulse trains with several different durations.
5
•LI
H
I
6. REFERENCES
1. A..Vassiliadis, R. C. Rosan and 11. C. Zweng. "Research on Ocular
Laser Thresholds", Final Report Contract F41609-68-C-0041, August
II1969.fj 2. A. M. Clarke.- "Ocular Hazards" (Handbook of Lasers with Selected
Data on Optical Technology, Robert J. Pressley, Ed.) Chemical
U Rubber, Co., Cleveland, Ohiio, 1971, Page 3-10.
3. D. H. Sliney. "The Development of Laser Safety Criteria-Biological
Considerations" (Laser Applications in Medicine and Biology, Volume I,
iM. L. Wolbarsht, Ed.), Plenum Press, New York 1971, Page 163-238.
11 4. A. Vassiliadis. "Ocular Damage from Laser Radiation-' (Laser Appli-
cations in Medicine and Biology, Volume I, M. IL. Wolbyarsht, Ed. ),
Plenum Press, New York 1971, Page 125-162.
i 5. R. G. Allen, et al. "Research on Ocular Effects Produced by Thermal
Radiation", Final Report, USAF Contract No. AF41(609)-3099, July 1967.
6. R. G. King and W. J. Geeraets. "The Effect of Q-Switched Ruby Laser
on Retinal Pigment Epithelium in Vitro", Acta Ophthal. 46, 617 (1968).
7. Herwig Kogolnik. "Modes in Optical Resonators", (Lasers, Volume I,
Albert K. Levine, Ed. ) Marcel Dekker, Inc., New York, 1966, Pages
295- 347.
S8. G. Wald and D. R. Griffin. "Change in Refractive Power of Human
Eye in Dim and B right Light", J. Opt. Soc. Am. , 37, 321 (1947).
6-1
U
SI9. R. E. Bedford and G. Wyszecki. "Axial Chromatic Aberration of the
Human Eye", J. Opt. Soc. Am., 47, 564 (1957).
10. D. J. Finney. Probit Analysis, Second Edition, Cambridge University
U Press, New York, New York, 1,952.
11. G. H. Bresnick, et al. "Ocular Effects of Argon Laser Radiation",
L Investigative Ophthalmology 2, 901 (1970).
U12. W. J. Geeraets and E. R. Berry. "Ocular Spectral Characteristics as
Related to Hazards from Laser and Other Light Sources", Amer. J.
Ophthal. 66,15 (1968).
U13. C. H. Skeen, W. Robert Bruce, J. H. Tips, Jr., M. G. Smith and
G. G. Garza. "Ocular Effects of Repetitive Laser Pulses", Contract
H] No. F41609-71-C-0018, Draft Final Report, to be submitted on 30
U April 1972.
14. M. Maii~ster, T. J. White, J. H1. Tips and P. W. Wilson. "Retinal
Temperature Increases Produced by Intense Light Sources"
* [1 J. Opt. Soc. Am. 60, 264(1970).
15. M. Mainster. "Destructive Light Adaptation" Ann. of Ophthal.
.2, 44 (1970).
11 16. Richrad McNee. A Private Communication..
17. G. Birnbaum. "Optical Masers" Academic Press, New York, 1964
page 68.
6-2
T
18. A. Goldstein. "Biostatistico: MacMillian Co., New York, 1964,
4! Page 177.
[6-
ULi
LIEi• i. A
I
APPENDIX A
The Nd 3+-YAG Laser System
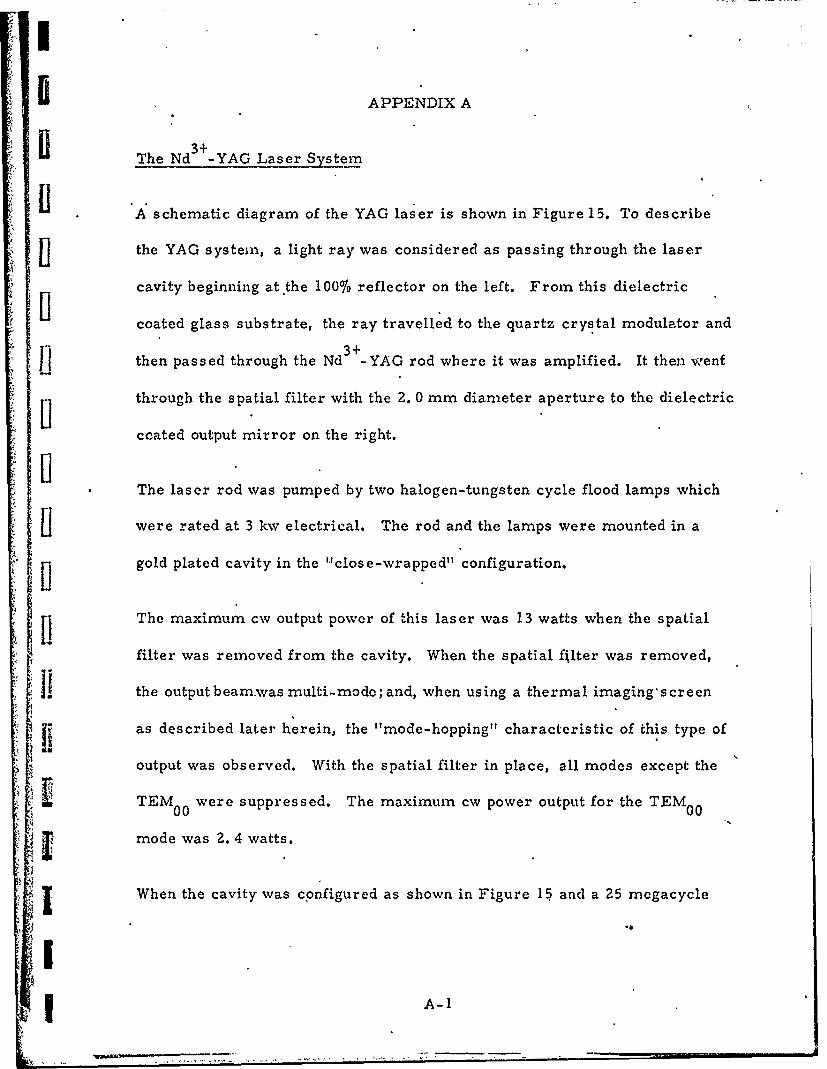
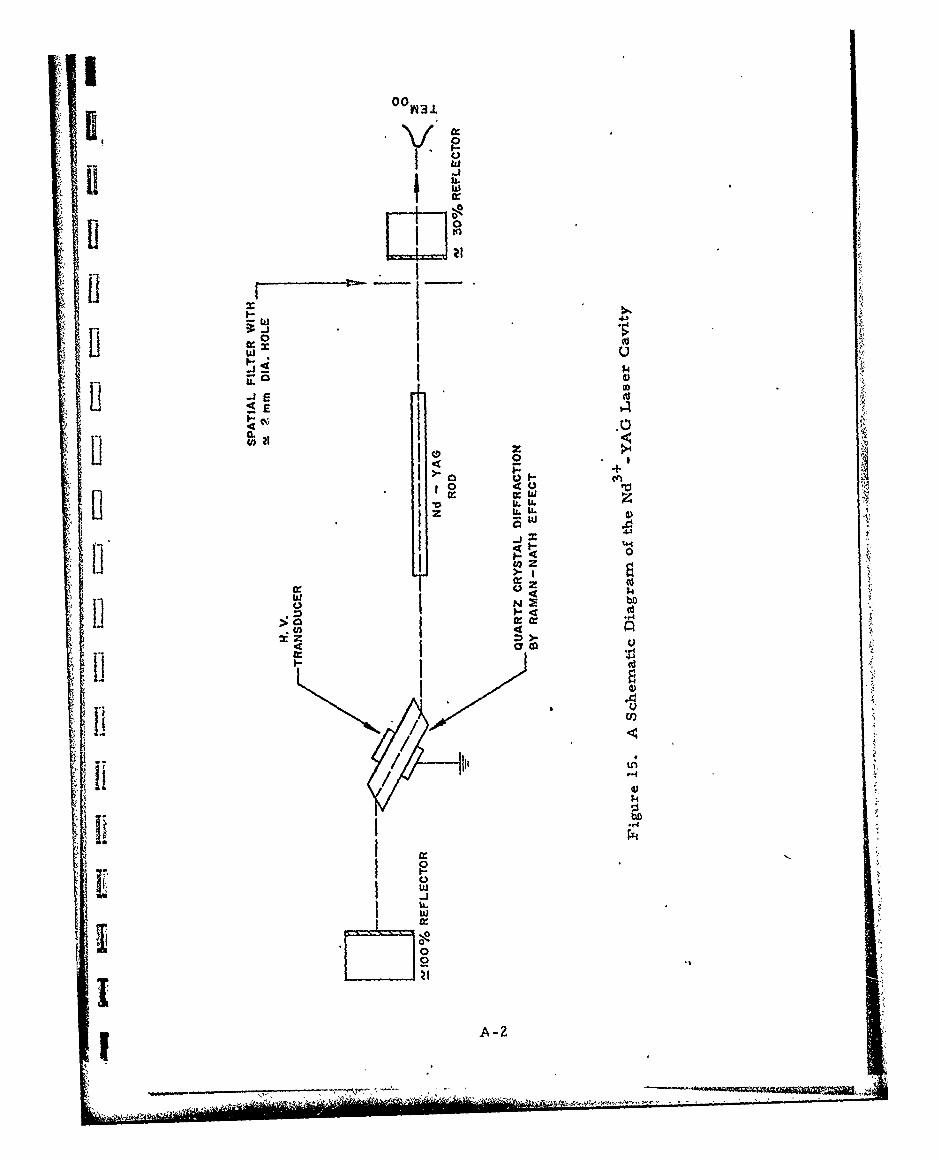
[IA schematic diagram of the YAG laser is shown in Figure 15. To describe
U the YAG system, a light ray was considered as passing through the laser
cavity beginning at the 100% reflector on the left. From this dielectric
coated glass substrate, the ray travelled to the quartz crystal modulator and
3+then passed through the Nd _-YAG rod where it was amplified. It then went
through the spatial filter with the 2. 0 mm diameter aperture to the dielectric
coated output mirror on the right.
The laser rod was pumped by two halogen-tungsten cycle flood lamps which
were rated at 3 kw electrical. The rod and the lamps were mounted in a
gold plated cavity in the "'close-wrapped" configuration.
The maximum cw output power of this laser was 13 watts when the spatial
filter was removed from the cavity. When the spatial ftlter was removed,f Ii the output beam was multi-mode; and, when using a thermal imaging'screen
as described later herein, the "mode-hopping" characteristic of this type of
output was observed. With the spatial filter in place, all modes except the
TEM00 were suppressed. The maximum cw power output for the TEM00
mode was 2. 4 watts.
I When the cavity was configured as shown in Figure 15 and a 25 megacycle
I A-1
7111
4.)
I~ Wicia w
w Uo
11x z
P tA
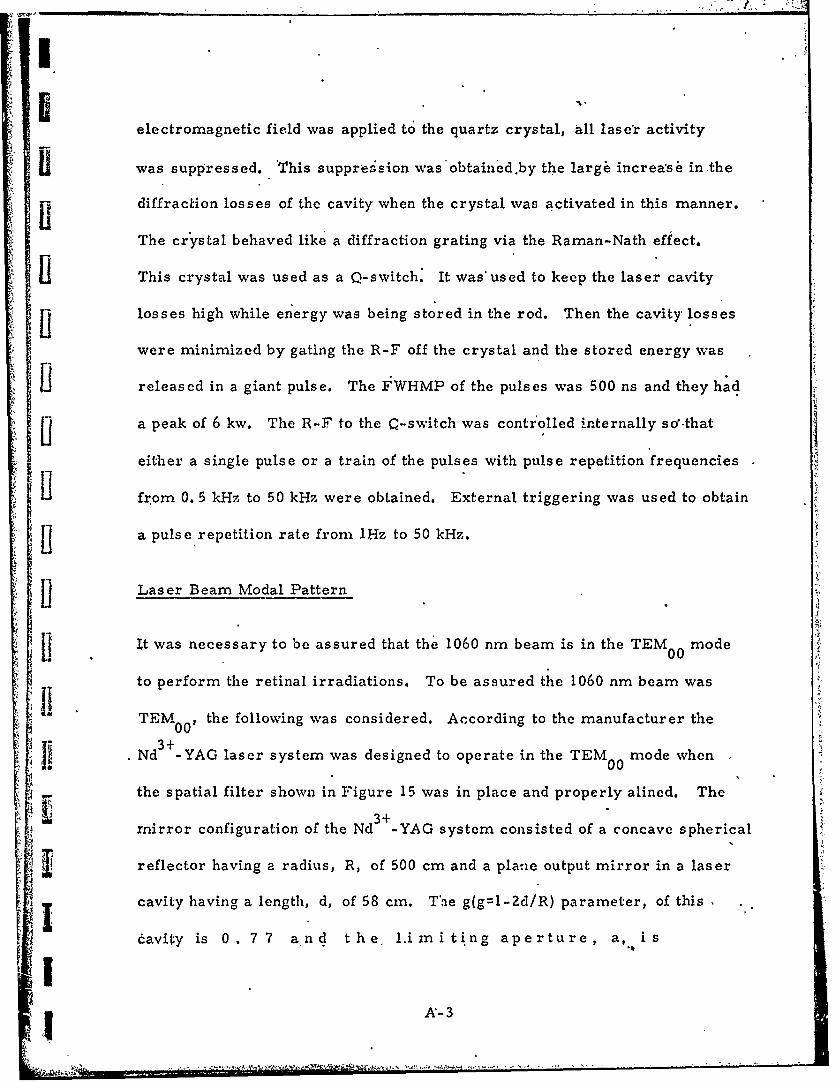
Irelectromagnetic field was applied t6 the quartz crystal, all laser activity
Swas suppressed. "This suppreision was obtained.by the largo increa'sý in the
diffraction losses of the cavity when the crystal was activated in this manner.
The crystal behaved like a diffraction grating via the Raman-Nath effect.
This crystal was used as a Q-switch. It was'used to keep the laser cavity
jj losses high while energy was being stored in the rod. Then the cavity losses
were minimized by gating the R-F off the crystal and the stored energy was
Lireleased in a giant pulse. The FWHMP of the pulses was 500 ns and they had
a peak of 6 kw. The R-F to the Q-switch was controlled internally sor-that
either a single pulse or a train of the pulses with pulse repetition frequencies
H fr~om 0. 5 kHz to 50 kHz were obtained. External triggering was used to obtain
a pulse repetition rate from 1Hz to 50 kHz.
[JLaser Beam Modal Pattern
I It was necessary to be assured that the 1060 nm beam is in the TEM0 0 mode
to perform the retinal irradiations. To be assured the 1060 nm beam was
MTEM00, the following was considered. According to the manufacturer the
r 3+Nd _-YAG laser system was designed to operate in the TEM mode when
00
the spatial filter shown in Figure 15 was in place and properly alined. The
3+mirror configuration of the Nd _-YAG system consisted of a concave spherical
reflector having a radius, R, of 500 cm and a plane output mirror in a laser
cavity having a length, d, of 58 cm. Tae g(g-l-2d/R) parameter, of this
Kavity is 0. 7 7 and the, L.imiting aperture, a,.,is
A-3
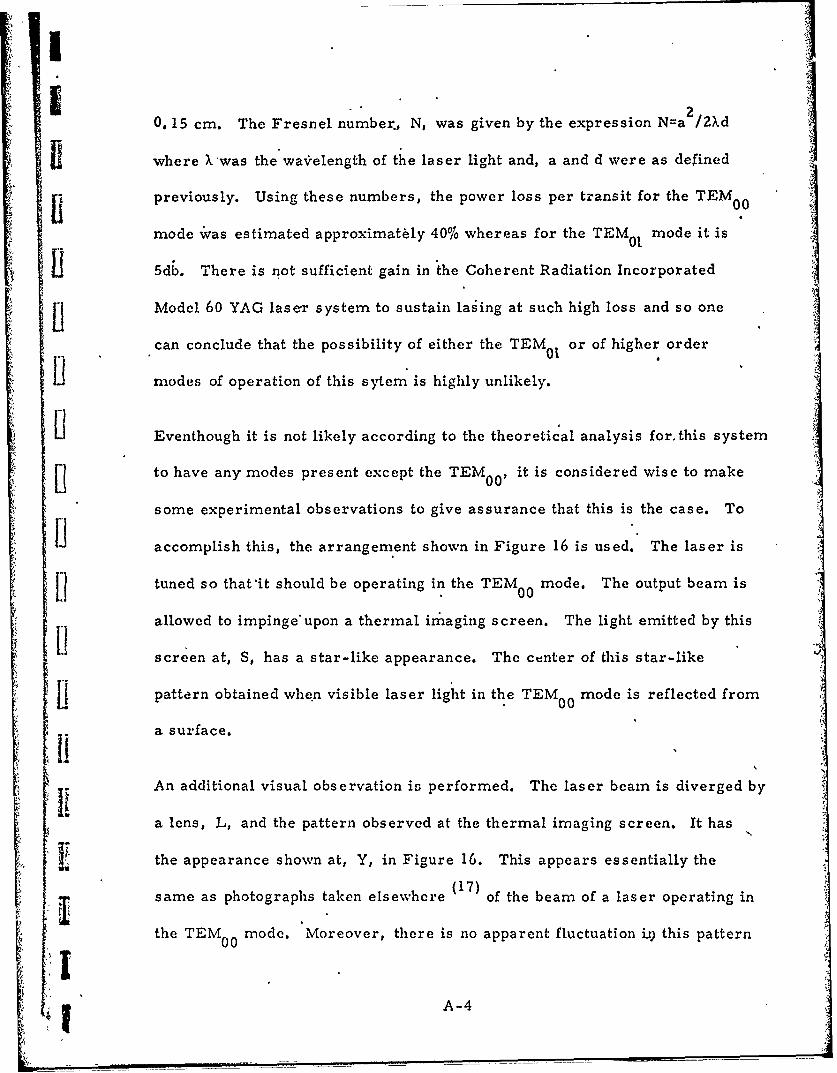
0. 15 cm. The Fresnel number., N, was given by the expression N=a2 /Zkd
where Xwas the wavelength of the laser light and, a and d were as defined
previously. Using these numbers, the power loss per transit for the TEM0 0
mode wvas estimated approximately 40% whereas for the TEM mode it is
5db. There is not sufficient gain in the Coherent Radiation Incorporated
K jModel 60 YAG laser system to sustain lasing at such high loss and so one
can conclude that the possibility of either the TEM or of higher order01
'modes of operation of this sytem is highly unlikely.
Eventhough it is not likely according to the theoretical analysis for.this system
Sto have any modes present except the TEM00, it is considered wise to make
some experimental observations to give assurance that this is the case. To
1] accomplish this, the arrangement shown in Figure 16 is used. The laser is
[1 tuned so that'it should be operating in the TEM00 mode. The output beam is
allowed to impinge'upon a thermal imaging screen. The light emitted by this
screen at, S, has a star-like appearance. The center of this star-like
II pattern obtained when visible laser light in the TEM mode is reflected fromL. 00
a surface.
An additional visual observation is performed. The laser beam is diverged by
a lens, L, and the pattern observed at the thermal imaging screen. It has
the appearance shown at, Y, in Figure 16. This appears essentially the
same as photographs taken elsewhere (17) of the beam of a laser operating in
the TEM00 mode. Moreover, there is no apparent fluctuation ii this pattern
Ii A-4
I
a to1 \w 0
4 '4
-r-
j *-5
~~to
U 44
-4C
z0
IA--
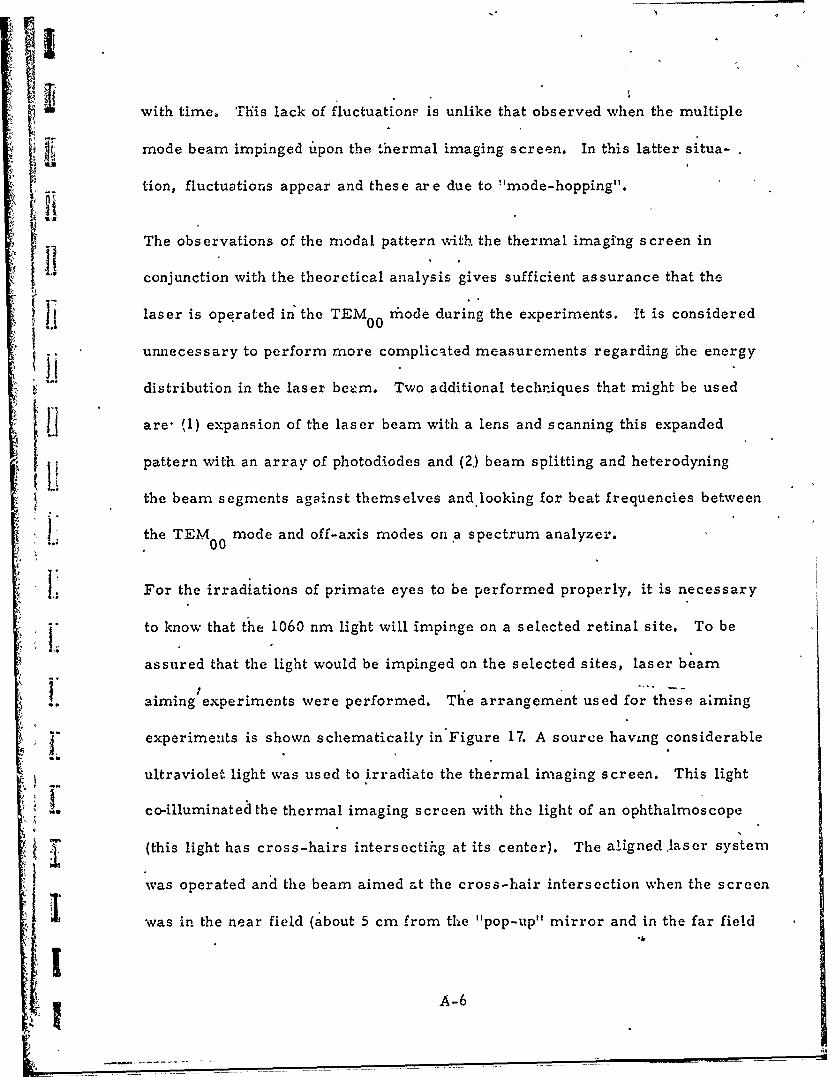
with time, This lack of fluctuationr is unlike that observed when the multiple
mode beam impinged 'Upon the thermal imaging screen. In this latter situa-
tion, fluctuations appear and these are due to "'mode -hopping".
The observations of the modal pattern with the thermal imaging screen in
conjunction with the theoretical analysis gives sufficient assurance that the
laser is opeirated in the TEM0 riiode during the experiments, It is considered
- unnecessary to perform more complicated measurements regarding fhe energy
distribution in the laser bezam. Two additional techniques that might be used
are- (1) expansion of the laser beam with a lens and scanning this expanded
pattern with an array of photodiodes and (2) beam splitting and heterodyning
the beam segments against themselves and looking for beat frequencies between
the TEM mode and off-axis modes on a spectrum analyzer.1* 00
For the irradiations of primate eyes to be performed properly, it is necessary
to know that the 1060 nm light will impinge on a selected retinal site. To be
assured that the light would be impinged on the selected sites, laser beam
aiming experiments were performed. The arrangement used for these aiming
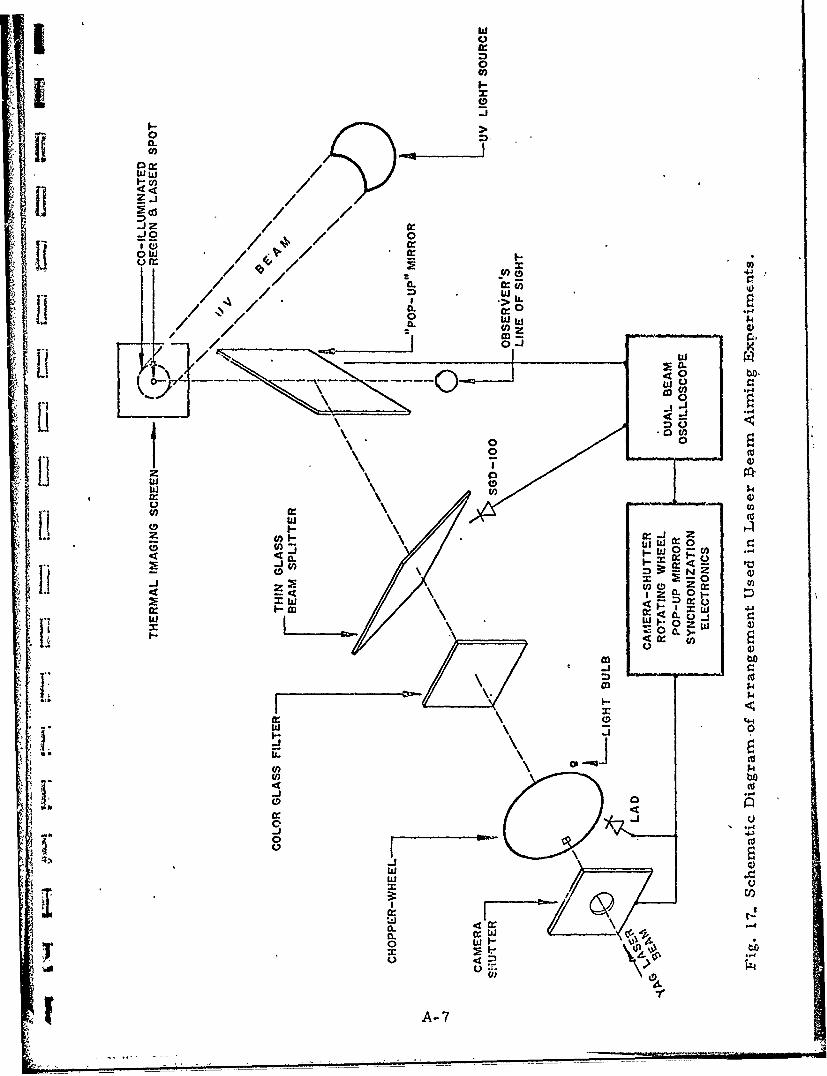
"experiments is shown schematically in Figure 17. A source having considerable
ultraviolet light was used to irradiate the thermal imaging screen. This light
1.. co-illuminatedtthe thermal imaging screen with the light of an ophthalmoscope
(this light has cross-hairs intersectifig at its center). The alignedlaser system
was operated and the beam aimed at the cross-hair intersection when the screenIiwas in the near field (about 5 cm from the "pop-up" mirror and in the far field
1A-6
0w
00
9L a:C00
0~0
440
_W 0di ~/go
< CL : no: cv))
w~~ 0C)4
a)) ILII 0 L
0 uW0 m W
$4
IIV
L..).oCLCl0 4)
Cl>)
CA-7
(about 50 cm from the "pop-up" mirror). The laser beam impinged upon the
screen at a given position and this position relative to the intersection of the
cross-hairs was noted. Adjustments in the laser beam direction were made
until the intersection of the cross-hairs and the spot on which the laser beam
impinged were identical. Clearly this technique revealed that the laser beam
can be aimed precisely at the selected retinal location. These aiming exper-
[i ifnents were performed routinely throughout the retinal burn program.
,A-HIi
~, [
(I:
I A-8
APPENDIX B
S MLaser Energy Detection and Calibrations
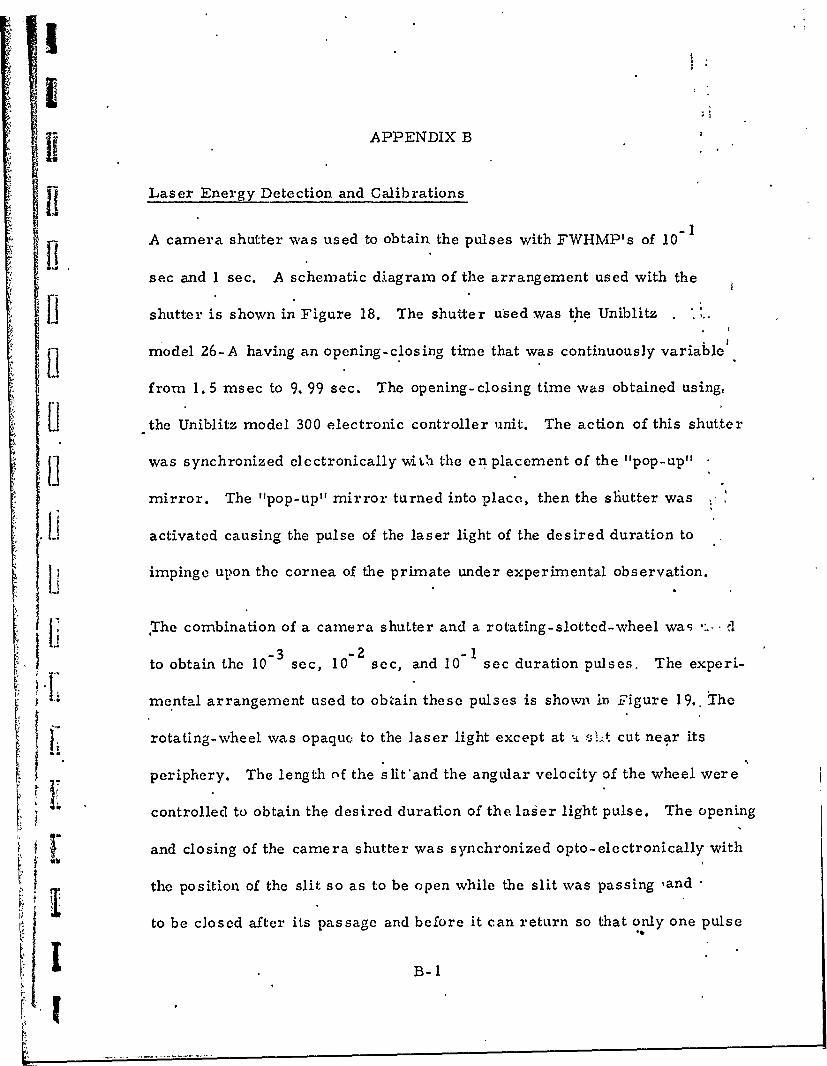
A camera shutter was used to obtain the pulses with FWHMP's of 10"
sec and I sec. A schematic diagram of the arrangement used with the
shutter is shown in Figure 18. The shutter used was the Uniblitz
model 26-A having an opening-closing time that was continuously variable
from 1. 5 msec to 9. 99 sec. The opening-closing time was obtained using,
Sthe Uniblitz model 300 electronic controller unit. The action of this shutter
U was synchronized electronically with the en placement of the "pop-up"
mirror. The "pop-up" mirror turned into place, then the shutter was
ii activated causing the pulse of the laser light of the desired duration to
I iimpinge upon the cornea of the primate under experimental observation.
The combination of a camera shutter and a rotating-slotted-wheel wa; d
t3 2- -1to obtain the 10- sec, 10- sec, and 10 sec duration pulses. The experi-
mental arrangement used to obtain these pulses is shown in Figure 19.. The
rotating-wheel was opaque to the laser light except at a *Lt cut near its
periphery. The length of the slit'and the angular velocity of the wheel were
controlled to obtain the desired duration of the laser light pulse. The opening
Sand closing of the camera shutter was synchronized opto-electronically with
$ the position of the slit so as to be open while the slit was passing ,and
to be closed after its passage and before it can return so that only one pulse
II B-1
KI
Iw'Iir
22o< 0
0 00
40
0)022 ii i 4)
0 0 02
x w I
w. I.0.
to
j] ~ 0* C.) ,..~0 0~0,5
LL00
~ Q404
-- JIIB-22
0 cr
wa:>
0:Bato111
U))
I4-
cowUi J~o
U 0 z-ý - :$
I- U CDn:C)-J 0
ILc 4U))
41 m-~ U4)
aa:ILd
o u -4
B-3

was obtained. The synchronization was accomplished by using a light
activated photodiode (LAD) to detect the light pas~ing through the slit from
Ui a light bulb and by using the necessary electronic dela.y circuitry. The
laser pulse widths were quite reproducible because the angular velocity
of the wheel is very uniform,
The methods for obtaining the single 0-switched pulses and the trains of
the Q-switched pulses were described adequately in Appendix A and will
* not be repeated here.
In the determination of the retinal burn threshold, the energy per laser
pulse was a key parameter to be measured. This energy was determined
ji for every irradiation of a primate eye. Two instruments with calibrations
traceable to the National Bureau of Standards were used to measuire the laser
power and the energy in an absolute manner. The placement of these for the
JRi experiments is shown schematically in Figure 20. One of these was a
Coherent Radiation Incorporated Model 201 power mete'r and the other was
a HADRON/TRG model 100 ballistic thermopile. The power meter was a
t IIdevice for measuring the power in cw laser beams. The ballistic thermopile
was a detector for measuring the energy in laser pulses. Each of these had
an accuracy of + 50,%o.
The response of the power meter was so slow that it is not capable of
I measuring either the 'power or the energy in the I sec and shorter laser
ii B-4
00
ii 0CC3
Ix4
(1 I~ 4) @ 2
4 •I -.
0 c02
o . 00
€ r w CL
00
il t
2 0"
NN
I'
to
t[1
-I.
M11-5IJ~ 0.T 0-
41U~ Ii
00
0 j0 U. 0
at)a
0
IILd4
B-51
iI
pulses of interest in this study. The ballistic thermopile was capable of
H measuring laser pulse energy provided it was delivered'in 5 sec or less
and the energy was large enough. The ballistic thermopile had a sensitivity
of 198 pv/J and detected a pulse energy as large as 150J and as low as
1.5 x 10- 3. Many of the pulses of interest had considerably less energy
than 1. 5 x 10 J; hence, it was necessary to use another detector to deter-
u mine the energy of each pulse.
To determine the energy for each laser pulse it was necessary initially
to use a silicon photodiode. The photodiode used is the EG&G model
SSGD-IO0, silicon photodiode. The laser was operated in the chopped-
pulse mode and the response of the diode in the form of the instantaneous
pulse power and the time integral of this instantaneous pulse power were
II displayed on the Tektronix model 555 dual beam oscilloscope. The energy
p of the pulses was measured simultaneously using the ballistic thermopile.
In this manner it was possible to calibrate both the pulse height (peak power)
and the total integrated power (pulse energy) from the diode-scope responses
f versus the ballistic thermopile measurements. This procedure was followed
throughout the irradiations made using laser pulses having a 1 sec dcaration.
During these irradiations using the 1 sec duration laser pulses, the power
meter was placed in the laser beam at the exit mirror (see Figure 20) and the
power recorded before and after the irradiations. This power determination
- in conjunction with the'pulse duration observation permitted another determin-
ation of the pulse energy by multiplying the power by the pulse duration. It
B-6
Im
L was found that this latter determination of the pulse energy was just as
reliable or better than the value obtained using the pulse height or the
IItime integral of the instantaneous power. This latter technique was used3 -2 -1
for the lI, sec, 10 sec and 10 sec irradiations of the primate corneas
with the laser pulses.
Throughout ,the irradiations, it was necessary to use optical attenuators
Sin conjunction w ith changing the laser pum p energy to vary. the energy of a
- pulse incident on the primate corneas. These attenuators were calibrateddaily by determining their external transmissions. The energy of the
L 7 x 10"7 sec pulses and the energy per pulse in a train of the 7 x 10"7 sec
'I -pulses. were determined in the following manner.
The Nd3 +-YAG laser was operated in the Q-switched mode. The C-switch
controller-box was governed internally to give a continuous train of the{ L Q-switched pulses with a pulse repetition rate of 1 kHz. The FWHMP of these
pulses was determined and shown to be 0. 7 psec. The average power of this
pulse train was monitored then with the Coherent Radiation Incorporated
model 201 meter. This average power was readily converted into the energy
per pulse since the pulse repetition frequency was known.
i I. The Q-switch function control box was governed then, in the external-
trigger-mode, using a pulse train and a waveform generator. This arrange-
ment madte it possible to select trains of the 0. 7 pisec pulses having a pulse
I~~ I -7
!I
repetition rate of I kHz and lasting for 0. 5 sec. These individual pulse
trains were detected with the IIADRON/TRG model 100 ballistic thermopile.
The energy per pulse was determined readily from the sensitivity of the
ballistic thermopile, the pulse repetition rate and the pulse train duration.
Comparison of the.pulse energies determined by these two independent and
absolute detectors agreed with each other within the + 5% accuracy of the
11 * two instruments.
With the energy per pulse known, it was possible thbn to calibrate the
response, in volts, of the SGD-100 photodiode to the laser light pulses in
terms of the energy per pulse. This calibration was performed routinelyIithroughout the experiments. Thus it was possible to determine the energy
per pulse for each and every irradiation of a primate eye with the Q-switched
laser pulses .and this was done.
B-8
- *
1.1I -
,II l-
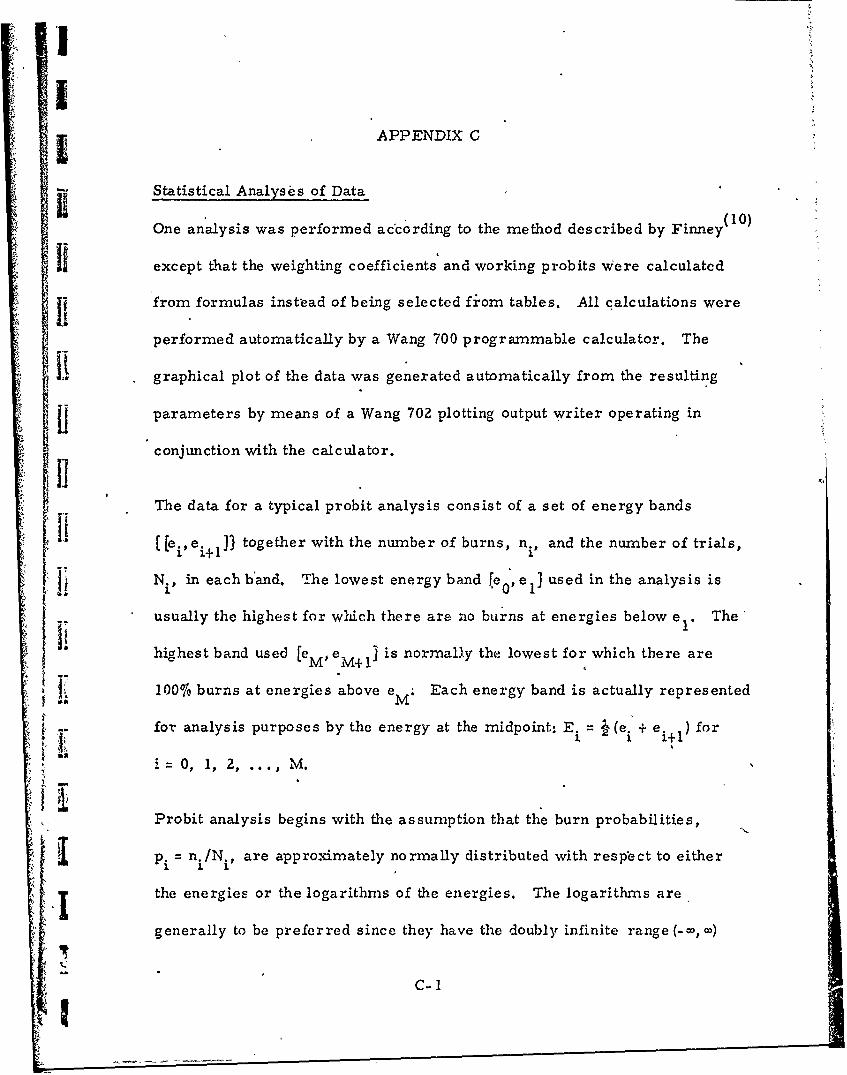
I5
APPENDIX C
Statistical Analyses of Data
One analysis was performed according to the method described by Finney(I0 )
except that the weighting coefficients and working probits Were calculated
SI!from formulas instead of being selected fiom tables. All calculations were
performed automatically by a Wang 700 programmable calculator. The
ili -graphical plot of the data was generated automatically from the resulting
Iiparameters by means of a Wang 702 plotting output writer operating in
conjunction with the calculator.
The data for a typical probit analysis consist of a set of energy bands
([e,, ei+l] together with the number of burns, n., and the number of trials,
N N. in each b'and. The lowest energy band fe 0 , e 1 ] used in the analysis is
usually the highest for which there are no burns at energies below e The'
highest band used [eM, eM jl] is normally the lowest for which there are
100%0 burns at energies above eM. Each energy band is actually represented
for analysis purposes by the energy at the midpoint: E. = (ei + e )+l for
0 1 2, M.
Probit analysis begins with the assumption that the burn probabilities,
IPi = n./N.i are approximately normally distributed with resplect to either
the energies or the logarithms of the energies. The logarithms are
generally to be preferred since they have the doubly infinite range (_0, o)
C-1
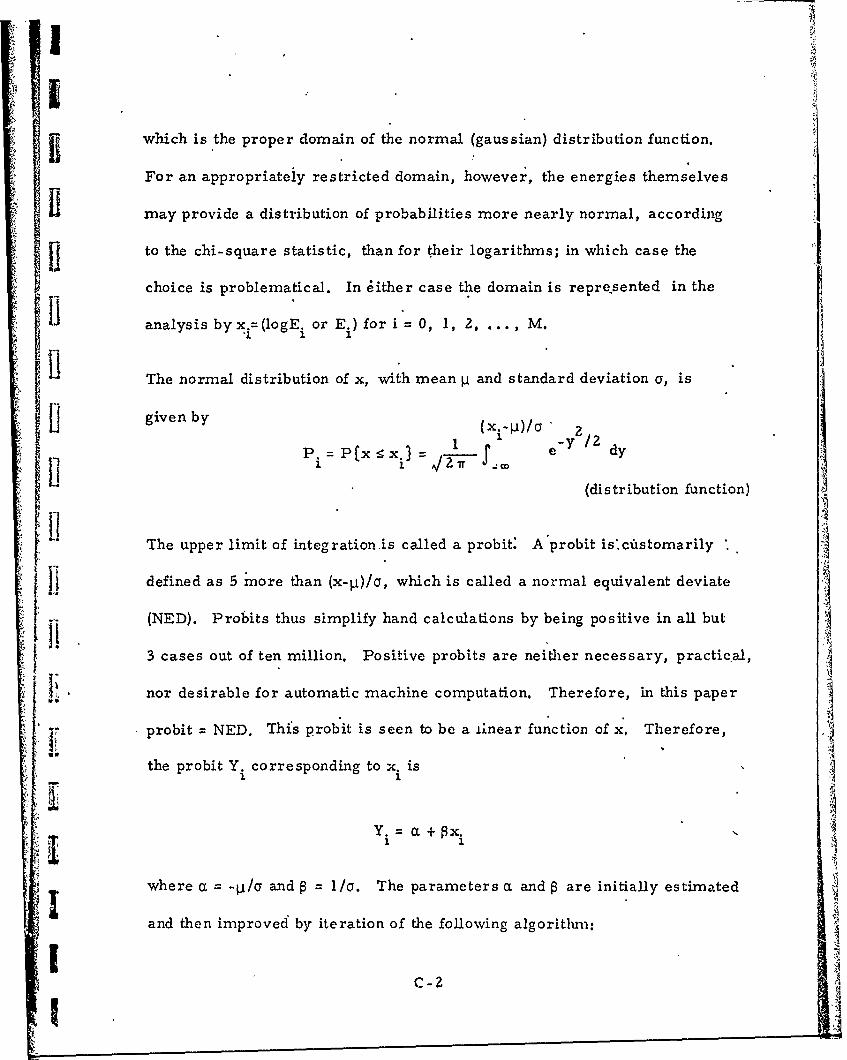
which is the proper domain of the normal (gaussian) distribution function.
For an appropriateiy restricted domain, however, the energies themselves
IImay provide a distribution of probabilities more nearly normal, according
to the chi-square statistic, than for their logarithms; in which case the
choice is problematical. In 6ither case the domain is repre.sented in the
analysis byx.=(logE. or E.) for i = 0, 1, 2, ... M.>1
The normal distribution of x, with mean p and standard deviation a, is
given by ( x 'C )/ a 2
P1x : 1 -y dy
(distribution function)
The upper limit of integration is called a probit" A probit is.cilstomarily
B defined as 5 more than (x-p)/a, which is called a normal equivalent deviate
(NED). Probits thus simplify hand calculations by being positive in all but
3 cases out of ten million. Positive probits are neither necessary, practical,
nor desirable for automatic machine computation. Therefore, in this paper
i[ probit NED. This probit is seen to be a ±inear function of x, Therefore,
the probit Y. corresponding to x. is1 1
Y. a + Ox.
where a = -P// and I = 1/a. The parameters a and • are initially estimated
and then improved by iteration of the following algoritlum:
C-2: 1 c-
I.
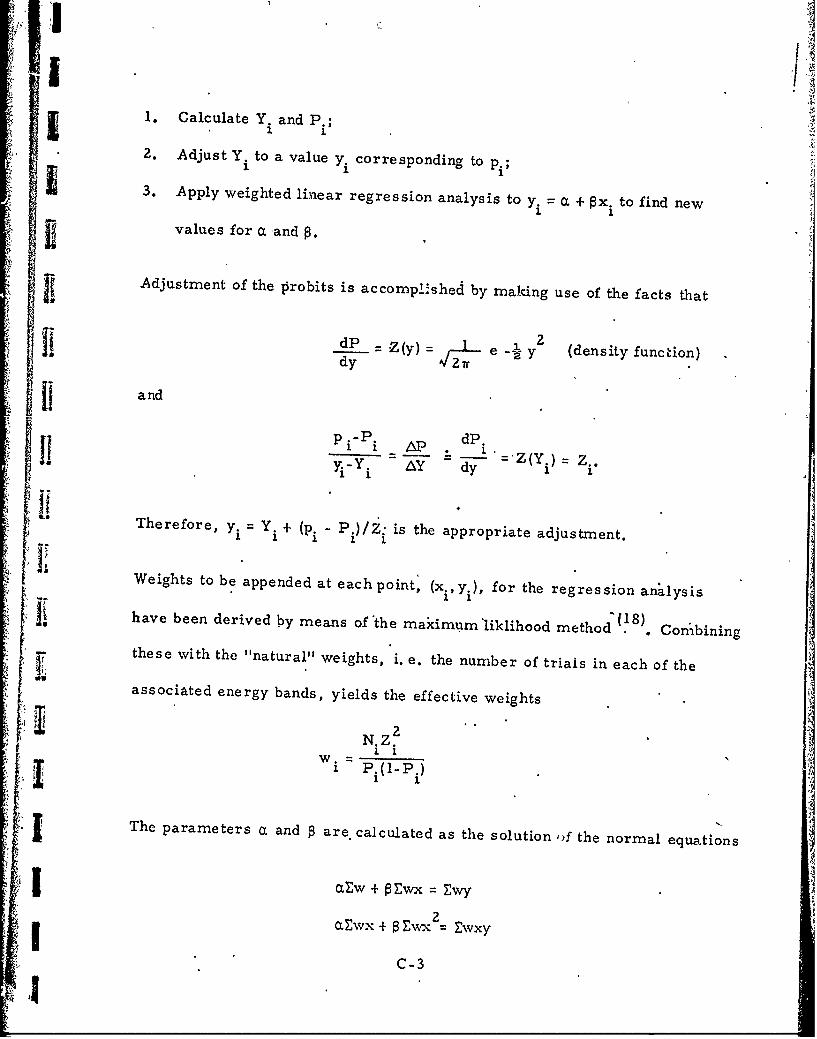
1. Calculate Y. and P.;I I.
2. Adjust Y. to a value y corresponding to p.;
3. Apply weighted linear regression analysis to yi = cL + Ox. to find new1
values for a and •.
Adjustment of the Probits is accomplished by malking use of the facts that
idP ) (density function)
and
p.- P dP.I I LiP . I .yi-Yi = y "Z(Y.) = Z..Ii- A dy 1
Therefore, yi Y" + (P. )/Z: is the appropriate adjustment.
Weights to be appended at eachpoint, (x.,y.), for the regression analysis
have been derived by means of the maximum'liklihood method 1 Con'ibining
these with the "natural" weights, i. e. the number of trials in each of the
associated energy bands, yields the effective weights
S~N. Z.
• P.i(1-P.
The parameters a and are. calculated as the solution ,if the normal equations
(XW + PE2wx E wy
2az x + 0W ÷ wx = - wxyF C - 3
Il"
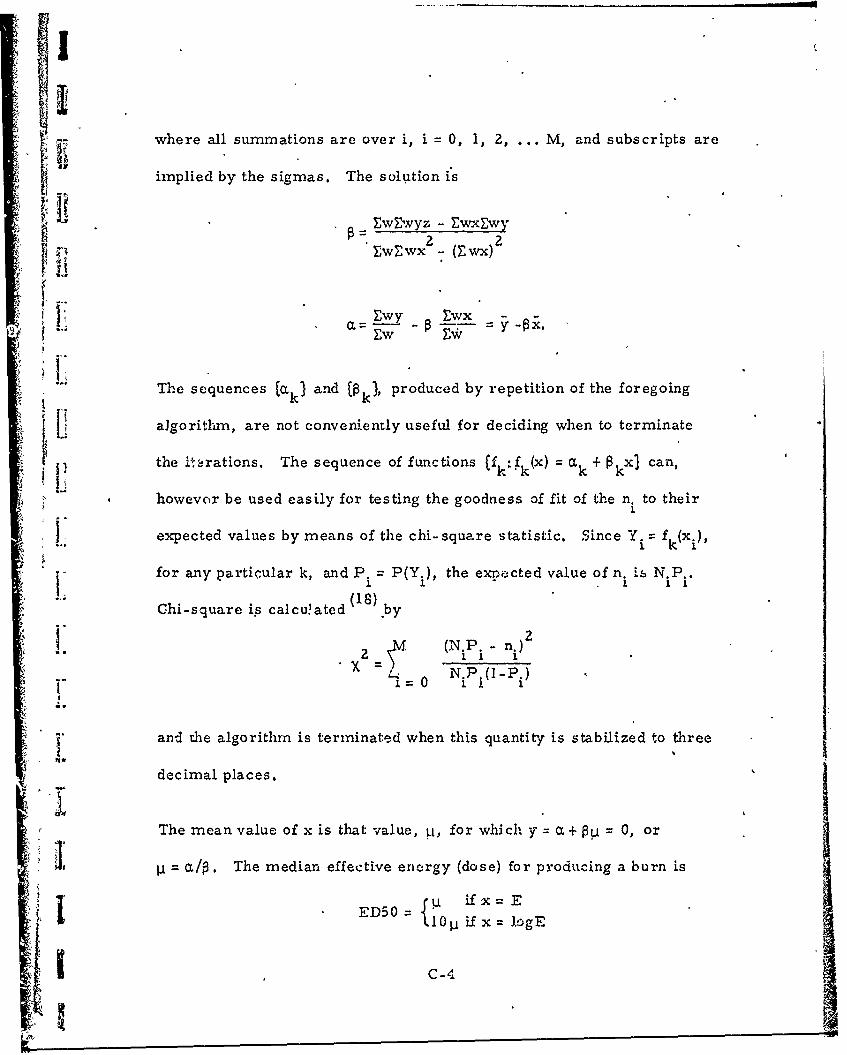
-- where all summations are over i, i =0, 1, 2, . M, and subscripts are
implied by the sigmas. The solution is
wEwyzw - (Ewx)
VLKX
The sequences (a k) and (p k ) produced by repetition of the foregoing
L ~ algorithm, are not conveniently useful for deciding when to terminate
pthe i'+-rations. The sequence of functions (f :f~x W + P xj can,*
howevor be used easily for testing the goodness of fit of the n i to their
13=.
1. expected values by means of the chi- square statistic. Since Y = f (xSk iw
for any particular k, and P. = P(Y. w the ex=icted value of n. is N.P..(18 L I I
Chi-square is calcu'ated ,by
2 =~ ~(NP -n.)
i i
J andr the algorithm is terminated when this quantity is stabilized to three
decimal places.
The mean value of x is that value, u, for which Y= + OP = 0, or
-I hoecr bThe median effective encrgy (dose) for producing a burn is
U if X E
ED50{Qjj=)g
I' Ih-Iaei cluae b-•"~~ . (N .- n<)1
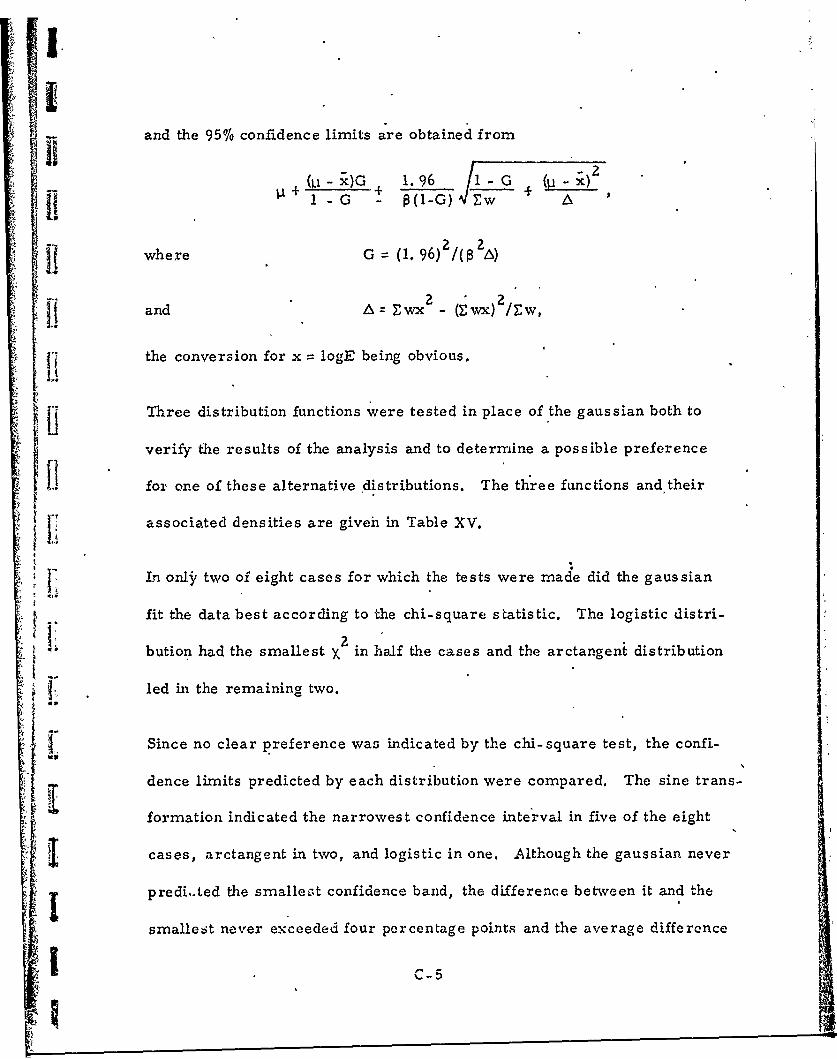
i!
and the 95% confidence limits are obtained from
ii 1 - - A
where G (1. 96) /(p A)
and A= EwX- (Ewx) /EZw,
the conversion for x logE being obvious.
Three distribution functions were tested in place of the gaussian both to
verify the results of the analysis and to determine a possible preference
fox one of these alternative distributions. The three functions and their
associated densities are giveh in Table XV.
I In onl- two of eight cases for which the tests were made did the gaussian
fit the data best according to the chi-square statistic. The logistic distri-
* * bution had the smallest Xy in half the cases and the arctangent distribution
led in the remaining two.
Since no clear preference was indicated by the chi-square test, the confi-
dence limits predicted by each distribution were compared. The sine trans-
formation indicated the narrowest confidence inte'rval in five of the eight
cases, arctangent in two, and logistic in one. Although the gaussian never
i predi,.ted the smalle,•at confidence band, the difference between it and the
smallest never exceeded four percentage points and the average differenceIi C-5

ii
"-4U S . .
00
1 10'0
'-4•
[H
o o- V
II ,,,
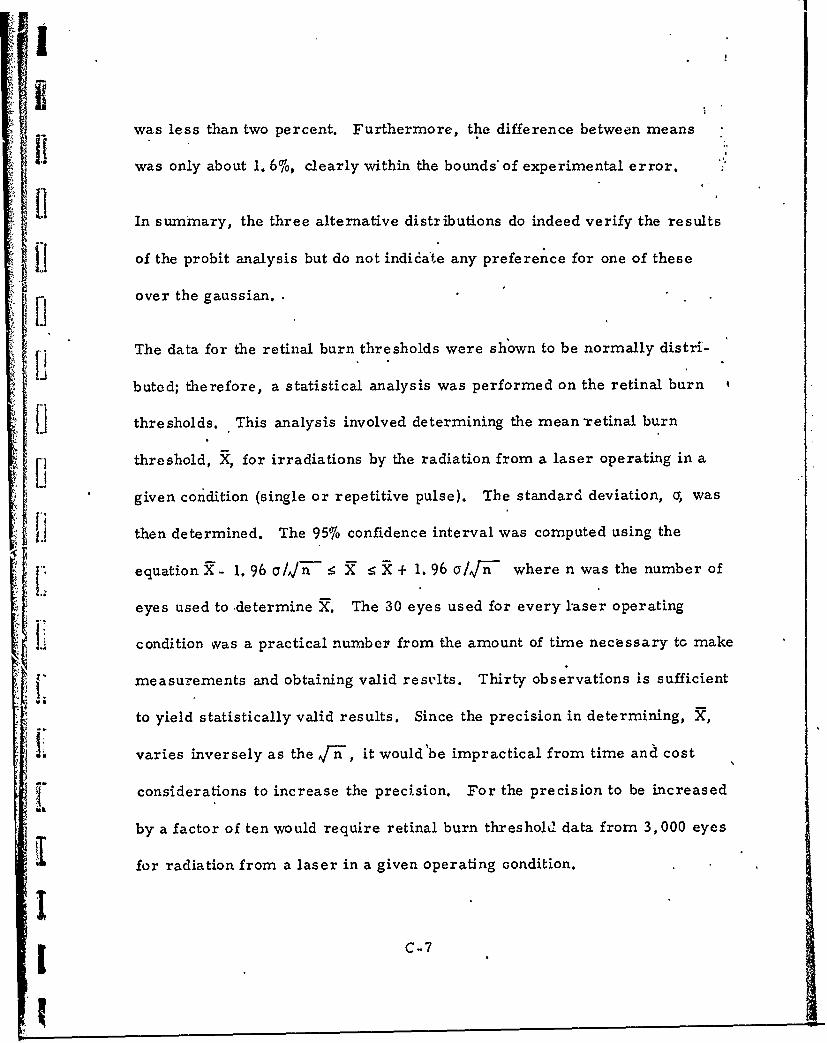
!1
was less than two percent. Furthermore, the difference between means
was only about 1. 67, clearly within the bounds' of experimental error.
[iLl In summary, the three alternative distributions do indeed verify the results
fof the probit analysis but do not indica'te any preference for one of these
over the gaussian.
The data for the retinal burn thresholds were shown to be normally distri-
buted; therefore, a statistical analysis was performed on the retinal burn
[ thresholds. This analysis involved determining the mean -retinal burn
Sthreshold, X, for irradiations by the radiation from a laser operating in a
given condition (single or repetitive pulse). The standard deviation, a, was
j.. then determined. The 95% confidence interval was computed using the
equation X- 1.96 a/•/n X X+ 1.96 a//"n-- where n was the number of
eyes used to determine X. The 30 eyes used for every l'aser operating
1. condition was a practical number from the amount of time necessary to make
measurements and obtaining valid restlts. Thirty observations is sufficient
to yield statistically valid results. Since the precision in determining, X,
varies inversely as the A-n-, it wouldcbe impractical from time and cost
"considerations to increase the precision. For the precision to be increased
by a factor of ten would require retinal burn threshold data from 3,000 eyes
Sfor radiation from a laser in a given operating condition.
I C-7
Copyright © 2022 FDOKUMEN