Issues in the Geography of Borno State
156
Issues in the Geography of Borno State Edited By Muhammad Waziri Abba Kagu Abubakar K Monguno
Transcript of Issues in the Geography of Borno State
Issues in the Geography of Borno State
Edited By
Muhammad Waziri Abba Kagu
Abubakar K Monguno
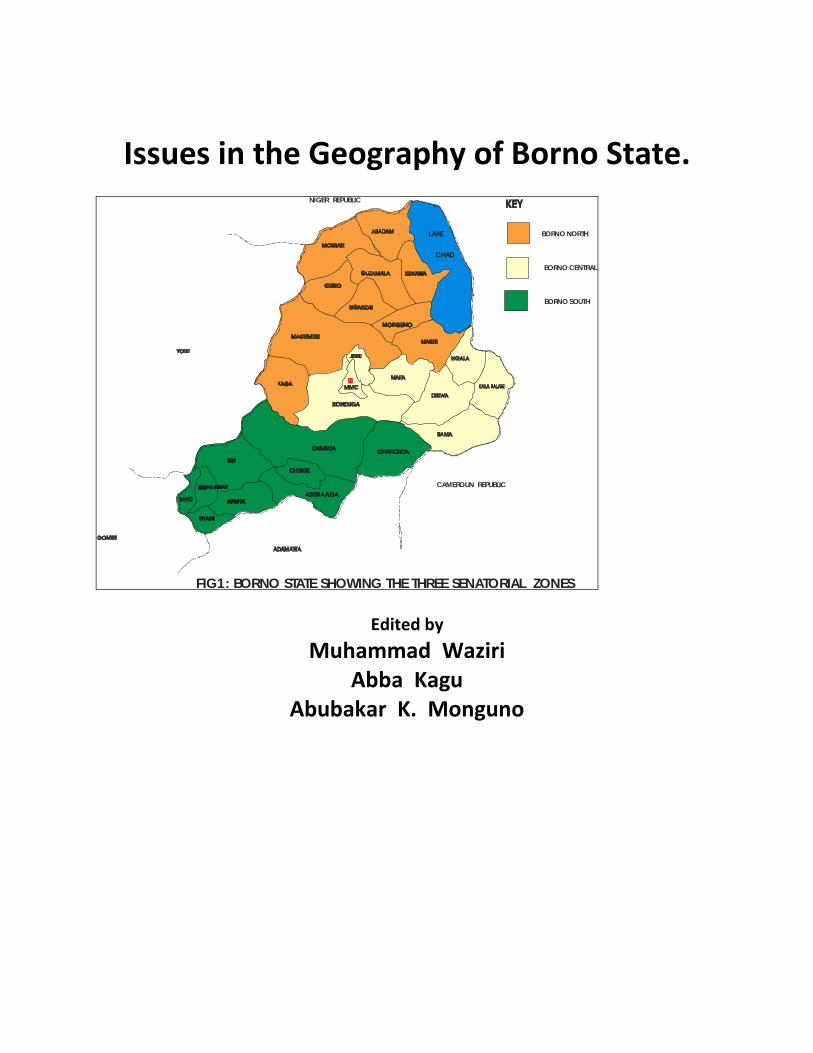
Issues in the Geography of Borno State.
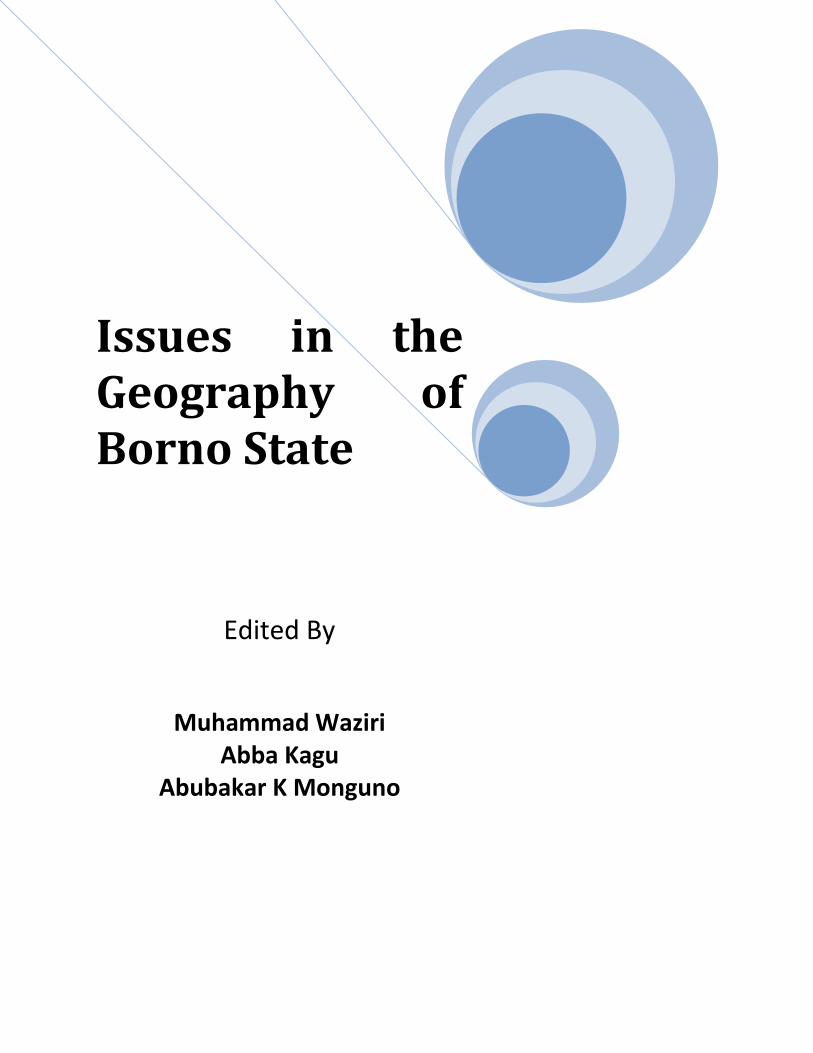
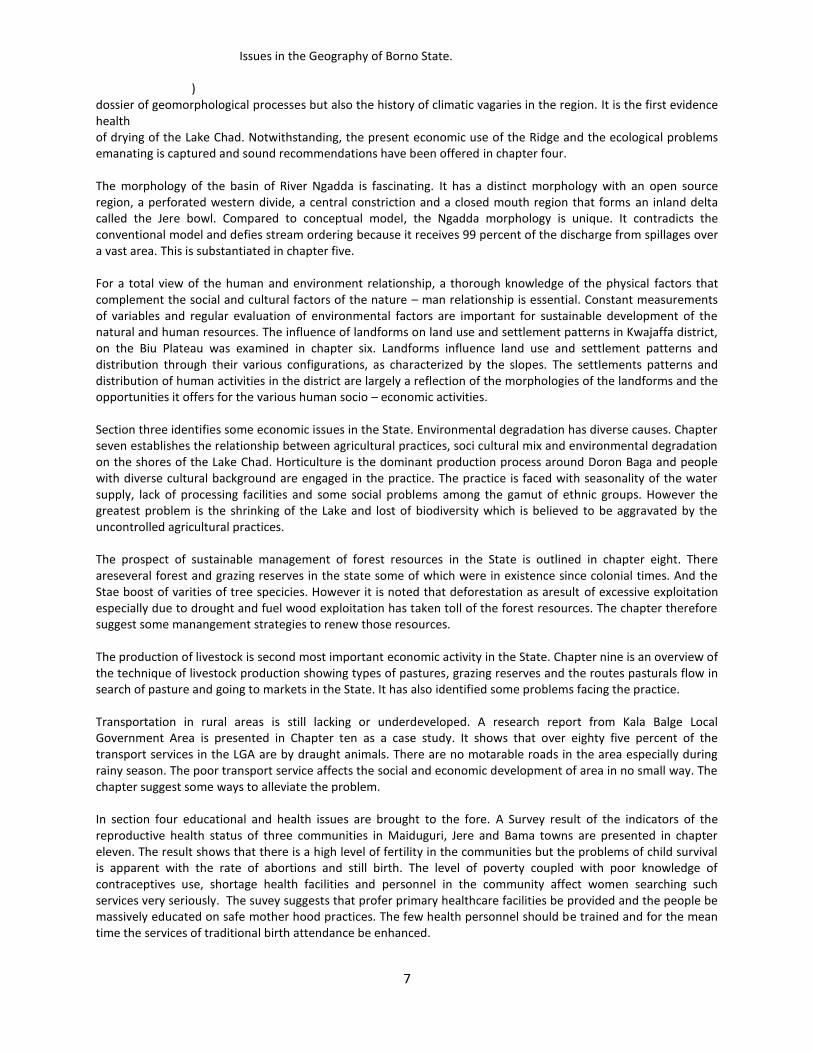
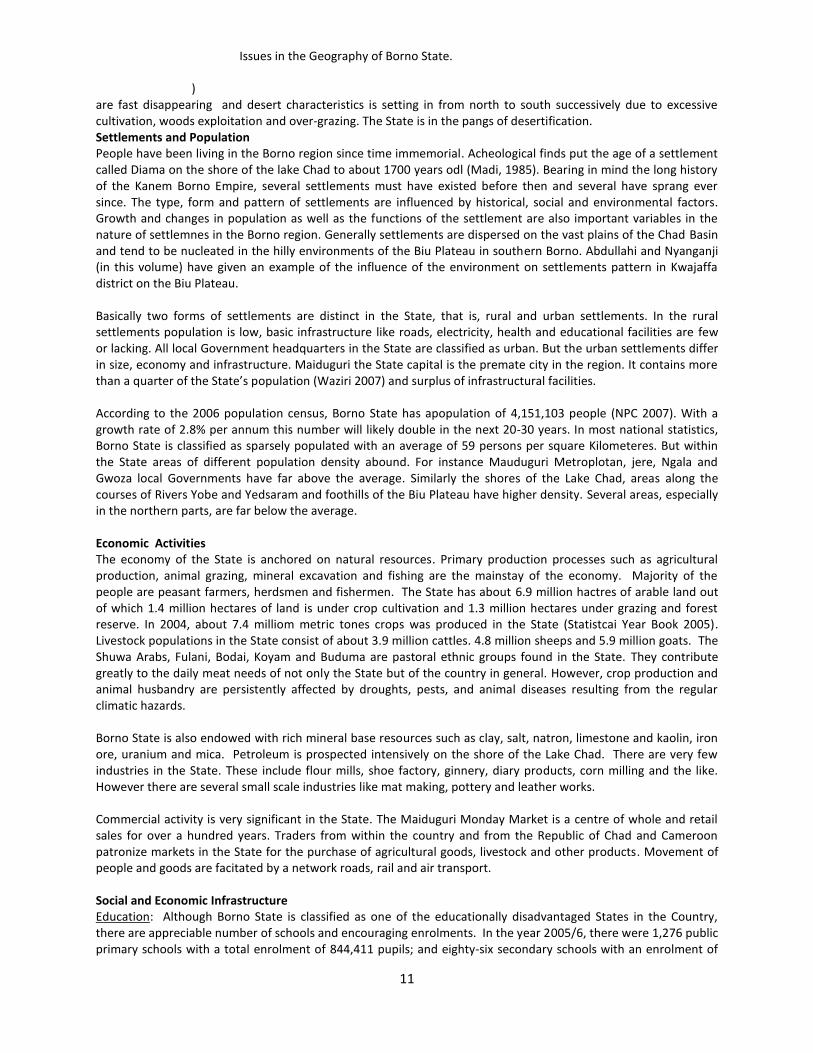
FIG1: BORNO STATE SHOWING THE THREE SENATORIAL ZONES
BORNO NORTH
BORNO CENTRAL
BORNO SOUTH
LAKE
CHAD
NIGER REPUBLIC
CAMEROUN REPUBLIC
Edited by
Muhammad Waziri Abba Kagu
Abubakar K. Monguno
3
First Published 2009 Published in Nigeria by ADAMU JOJI PUBLISHERS No 123 Mangwarori Street, Sabon Titin Mandawari, Kano City, Kano State. Copyright © Editors 2009 All rights reserved. No part of this publication may be reproduced, transmitted or stored in a retrieval system by any means, electronic, mechanical,photocopying, recording or ortherwise without prior permlssion of the editors and publishers. ISBN 978-34896-1-5

4
Table of Contents Forward
SECTION ONE: Introduction 1 Introduction 6 2 The Geography of Borno 9
MUHAMMAD WAZIRI 3 Kanem Borno Empire- A Historical Introduction to the Geography of Borno 14
BABA GANA WAKIL SECTION TWO: Physiographic Issues 4 The Bama Ridge, A Significant Landmark In Borno State 20 ABBA KAGU 5 The Morphology of the Ngadda River Basin 25
JACOB K. NYANGANJI
6 Landforms and Settlement Patterns in Kwajaffa district, Biu Plateau 34 JOHN ABDULLAHI
SECTION THREE: Economic Issues 7 Agriculture, Cultural Interplay and Environmental Degradation on the Shores of the Lake
Chad 43 BABA GANA JUGUDUM KABIR, ABBA KAGU & FATI A. K. YERIMA
8 Towards Efficient Water Quality In Fish Farming In The Arid-Zone 54 BAKO MALLAM MODU
9 Prospects for Sustainable Management of Forest Resources 60 HARUNA KUJE AYUBA
10 Livestock Production In Borno State: An Overview 68 ALHAJI MUKTHAR, MUHAMMAD WAZIRI, & IBRAHIM D. MOHAMMED 11 Rural Transport in Kala Balge Local Government Area 77
MUHAMMAD WAZIRI, & MOHAMMED ABBA JIMME SECTION FOUR: Human and Health Issues 12 Reproductive Health Indicators in selected Communities in Maiduguri, Jere and Bama
LGAs: A Survey Report 86
MUHAMMAD WAZIRI, AMINA SHETTIMA and KAKA GANA ABBA
13 Socio-Cultural And Economic Factors Militating Against Girl-Child Education In Northern Borno 90 YAGANA MUHAMMAD AJI & YAGANA BUKAR
14 Distribution of Public Health Facilities 102 YUSUF MUHAMMAD ADAMU & ABUBAKAR KAWU MONGUNO
15 An Assessment Of The Expanded Programme On Immunisation (Epi) 110 ABUBAKAR KAWU MONGUNO
Issues in the Geography of Borno State.
)
5
SECTION FIVE: Urban Environmental Issues 16 Viability of Rainwater Harvesting In Maiduguri 122
WAKIL MALAH BUKAR and MUSTI LAWAL ALH. ALI 17 The Impact Of Declining Water Supply On Rural Women In Northern Borno 128
YAGANA BUKAR and YAGANA MUHAMMAD AJI 18 Towards an Efficient Water Quality in Fish Farming in the Arid Zone 135
BAKO MALLAM MODU 19 Urban Floods and Environmental Degradation in Borno State. 146 MOHAMMED ABBA JIMME and ABBAS BASHIR
Issues in the Geography of Borno State
6
1 Issues in the Geography of Borno State Introduction The age long tradition in geographic study is believed to be the description of the physical and human characteristics of a given place. The geography of a place usually means the description of the position, size, physical features, and the people of the place as well as the socio-economic activities. However, Carl Saur in 1925 observed that although geographers had earlier been devoted to description of unique places…they had also been trying to formulate generalization and empirical laws. In his contribution to the ‘nature of geography’, Hartshone (1939) argued that geography is ‘a science that interprets realities of areal differentiation of the world as they are found, not only in terms of differences in certain things from place to place, but also in terms of total combination of phenomena in each place different from those at every other place’. Ever since, the discipline has evolved into a real scientific adventure to find out not only the spatial pattern of physical and human phenomena, but investigates the behavior and changes overtime as well as the relationship of the phenomena upon one another. Although the Hartshonian ‘regional paradigm’ has been challenged, it was the beginning of the changes in methods of studying geography. Geographers have broadened their efforts to find practical applications for geographic studies. The scientific culture and tradition of hypotheses testing has been embedded in the discipline such that theories can be formulated and prediction can be made through geographic analysis. Quantitative techniques are utilized rigorously and objectively to test hypotheses and answer research questions. With the evolution of Geographical Information System (GIS) the relevance of geography is fundamental in any research. Therefore Geography is no more what only geographers do. It is an essential tool in social sciences, humanities and even pure sciences when studying the spatial characteristics of any subject. The increasing relevance of GIS (Geographical Information System) in development planning and monitoring, as well as in administration, politics and governance is the proof of relevance of geography in everyday life. Thus geographical issues are widespread in most disciplines and researches. Contributions in this volume are therefore not restricted to geographers. The book is an exposition of certain issues observed in various disciplines that are unique to the geographical set up of Borno State as a region. Systematic studies of some physical and human issues are made to give insight to the nature of such issues in Borno as a region. The book is divided into five sections which includes an introductory section that outlines the geographical characteristics and historical evolution of the region; a section each on physiographic and economic issues in the region as well as sections on human health and water resource management respectively. The physical setting of the State is an amalgam of factors relating to its location, geology, climate as well as the intensity of resources exploitation in the area. Borno as a region is synonymous with the basin of the Lake Chad. Chapter two is an overview of the geography of Borno State outlining the physical, human and economic characteristics of the State. A brief historical introduction attempts to link the relationship between the environment and the socio-political evolution of the region that enabled the ancient Kanem Borno to have flourished as an empire for centuries. The existence of Borno especially from the 17
th to the 18
th centuries in terms of the establishment of an elaborate
system of political and socio-economic suzerainty over the entire Chad basin and beyond can not simply be reduced to military prowess and political adventurism of individuals divorced from the geographical environment in which they operated. Also the impact of climatic/ecological vagaries over time on the political developments of the region up to the commencement of colonial rule at the beginning of the twentieth century is adequately documented in chapter three. In section two, prominent landmarks otherwise immersed in the general geography of the region has been brought to fore. Bama Ridge, the ancient shoreline of the Lake Chad, is a remarkable landform that encapsulates not only a
Issues in the Geography of Borno State.
)
7
dossier of geomorphological processes but also the history of climatic vagaries in the region. It is the first evidence health of drying of the Lake Chad. Notwithstanding, the present economic use of the Ridge and the ecological problems emanating is captured and sound recommendations have been offered in chapter four. The morphology of the basin of River Ngadda is fascinating. It has a distinct morphology with an open source region, a perforated western divide, a central constriction and a closed mouth region that forms an inland delta called the Jere bowl. Compared to conceptual model, the Ngadda morphology is unique. It contradicts the conventional model and defies stream ordering because it receives 99 percent of the discharge from spillages over a vast area. This is substantiated in chapter five. For a total view of the human and environment relationship, a thorough knowledge of the physical factors that complement the social and cultural factors of the nature – man relationship is essential. Constant measurements of variables and regular evaluation of environmental factors are important for sustainable development of the natural and human resources. The influence of landforms on land use and settlement patterns in Kwajaffa district, on the Biu Plateau was examined in chapter six. Landforms influence land use and settlement patterns and distribution through their various configurations, as characterized by the slopes. The settlements patterns and distribution of human activities in the district are largely a reflection of the morphologies of the landforms and the opportunities it offers for the various human socio – economic activities. Section three identifies some economic issues in the State. Environmental degradation has diverse causes. Chapter seven establishes the relationship between agricultural practices, soci cultural mix and environmental degradation on the shores of the Lake Chad. Horticulture is the dominant production process around Doron Baga and people with diverse cultural background are engaged in the practice. The practice is faced with seasonality of the water supply, lack of processing facilities and some social problems among the gamut of ethnic groups. However the greatest problem is the shrinking of the Lake and lost of biodiversity which is believed to be aggravated by the uncontrolled agricultural practices. The prospect of sustainable management of forest resources in the State is outlined in chapter eight. There areseveral forest and grazing reserves in the state some of which were in existence since colonial times. And the Stae boost of varities of tree specicies. However it is noted that deforestation as aresult of excessive exploitation especially due to drought and fuel wood exploitation has taken toll of the forest resources. The chapter therefore suggest some manangement strategies to renew those resources. The production of livestock is second most important economic activity in the State. Chapter nine is an overview of the technique of livestock production showing types of pastures, grazing reserves and the routes pasturals flow in search of pasture and going to markets in the State. It has also identified some problems facing the practice. Transportation in rural areas is still lacking or underdeveloped. A research report from Kala Balge Local Government Area is presented in Chapter ten as a case study. It shows that over eighty five percent of the transport services in the LGA are by draught animals. There are no motarable roads in the area especially during rainy season. The poor transport service affects the social and economic development of area in no small way. The chapter suggest some ways to alleviate the problem. In section four educational and health issues are brought to the fore. A Survey result of the indicators of the reproductive health status of three communities in Maiduguri, Jere and Bama towns are presented in chapter eleven. The result shows that there is a high level of fertility in the communities but the problems of child survival is apparent with the rate of abortions and still birth. The level of poverty coupled with poor knowledge of contraceptives use, shortage health facilities and personnel in the community affect women searching such services very seriously. The suvey suggests that profer primary healthcare facilities be provided and the people be massively educated on safe mother hood practices. The few health personnel should be trained and for the mean time the services of traditional birth attendance be enhanced.
Issues in the Geography of Borno State
8
Chapter twelve dwells on the socio cultural and economic factors militating against girl child education in the northern part of Borno State. Disparity in the rates of enrolment of female and males were reviewed in the country in general and Borno in particular. The northern part of the state is observed to be the most appelling in term of girl child enrolments in the State. The chapter alluded to universal factors of gender discrimination in female education as responsible for the problem. Furthermore in Borno particular factors such as cultural role ascription of the Rashidi/Kshaana concept, fear of culture corruption and shortage of girls school, jeopordise the chances of female enrolment. The chapter has presented some suggession to improve the situation. The spatial distribution of phenomena has been the major thrust of geographic inquiry. Chapter thirteen explores the distribution of public health facilities in the State to see if it is rational owing to the social disparity in the State.The distribution of health facilities and health personale were examined by is and maldistrbution across the State. This is linked with preventive health seeking behaviour in the next chapter. Immunisation against diseases is an important preventive measure in curtailing morbidity and mortality. Chapter fourteen examines the routine Expanded Programme on Immunisation (EPI) in terms of coverage and reduction in child mortality in the State. Ten years retrospective were used to make the analysis. It was observed the progamme is irregular and coverage is low. As a result child morbidity and mortality are still high in the State. Section five focuses on water resources in the State. Chapters fifteen is born out of problems faced by fish farmers in the arid lands. Water quality determines the success or failure of aquaculture operations. An overview of crtical physical and chemical properties of water for viable fish farming is presented in simple terms. As primary water carriers, managers and end user, women play important role in water management especially in arid environment of the State.Chapter sixteen explores the role of women in water supply and the impact of water shortage on women in northern part of the State.Some recommendations were given to alleviate the problem of women inn water supply. The interception of rainwater for human use is a common practice all over the world. Many techniques are used in the practice. Chapter seventeen examines viability of rain water harvesting from roof tops in Maiduguri, the State capital. The result o an experiment shows that rain fall harvesting is a viable venture for households in the State to suplement their water needs.
9
2 The Geography of Borno State: An Overview MUHAMMAD WAZIRI Department of Geography, University of Maiduguri. Historical Background Borno State lies in the extreme north-east corner of Nigeria between latitudes 10˚ 30’ and 13˚ 50’ north and longitudes 11.00˚ and 13˚ 45’ east. It occupies an area of 69.435 sq km sharing border with three States, Adamawa to the south, Gombe to the south west and Yobe to the west as well as three countries, namely, Republic of Niger, Chad and Cameroon to the north, north-east and east respectively. Borno is a small State in Nigeria but it was a great ancient nation in sub Saharan Africa. As an ancient nation state, it existed in a name of a polity known as Kanem-Borno Empire, for over one millennium, and was acknowledged as one of the longest surviving kingdom in recorded history. It lies along the caravan trade routes from the heart of West Africa and Central Africa to North Africa and the Arabian Peninsula. At the zenith of its existence in the fourteenth century it extended as far as Fezzan in present Libya in the east and to Kano in the west. The region was occupied by the European expansionist about the beginning of the 20
th century. The ancient
Borno was partitioned and shared between, Nigeria, Niger, Chad and Cameroon Republics. In 1907, the portion of old Borno that was occupied by the British became a province in Northern Nigeria with its provincial capital at Maiduguri. Borno formed a part of North Eastern State in 1967 and became a State during the 1976 States creation. However, part of it was carved out in 1991 to form the present Yobe State. Although its territory and system of governace has changed over the millennium, Borno is still the preserve of a particular people and culture bonded by the Islamic religion and the Kanuri language. Wakil, (in this volume), has adequately expounded the historical geography of the region in chapter two. Presently the traditional set up of Borno State is made up of seven emirates namely: Borno, Dikwa, Biu, Shani, Askira, Uba and Gwoza emirates. These emirates are domains of different ethnic groups. Borno and Dikwa Emirates are the domains of the Kanuri, Shuwa, Gamargu, Fulani, Kwayam, Buduma, Kotoko, Marghi, Wula, etc; the Babur-Bura are dominant in Biu, the Kanakuru in Shani; Marghi in Askira and Uba as well as a group of tribes usually referred to as “the Gwoza” in Gwoza emirate respectively. In the local government administrative set up, the State comprises of twenty seven local government areas, each of which is divided into a number of culturally based districts and village units. It is important to note that the emirates, districts and village units are still effectively administered by traditional rulers who advise the Local Government Councils and the State government on different matters, such as taxation, land/farm matters, security, etc. Physical Set-up Borno State, has a dynamic physical setting which arises from an amalgam of factors relating to location, geology, climate as well as the intensity of resources exploitation in the area. It lies almost entirely within the Lake Chad Basin typographic formation, which is an area that was formed as a result of down-warping during the Pleistocene period. The Chad Basin is a shallow depression of about 2.5 million square kilometres encircling the Lake Chad in the heart of the central Sudan. (Adelekan 1998) The Basin and its hydrological catchment area span Borno, Yobe, Jigawa, Kano and Plateau States. About 17 million people occupy it most of who are farmers, pastorals and fishermen (Oladipo 1996). However Borno State accounts for more than 75% of the Basin area. The Lake Chad is a dominant feature both in the history and economy of Borno State. The lake which was believed to be much larger in historical times was estimated to have covered an area of over 400,000 square Kilometers about 4000 BC. The present lake is the remains of the inland sea, locally known as Dilara, which existed during the Pleistocene epoch (about 15000 to 25000 years ago) The lake shrinked as a result of climatic change, underground seepage and recently due to excessive exploitation through damming of life line rivers and uncontrolled irrigation schemes. During the rainy season the lake is as great as 25 000 sq Km but it shrinks to less than 10,600 sq Km
Reproductive Health Indicators in selected Communities in Maiduguri, Jere and Bama LGAs: A Survey Report
10
during the dry season. In open water the depth of the water varies from about 1 meter in the north west to 6 metres in the south. The lake is fed principally by River Chari which originates from Central Africa. Borno State has two basic relief formations consisting of the highlands of the Biu Plateau and Mandara mountains to the southern part rising to about 650m above sea level and the vast Lake Chad plains covering northern part of the State with an average height of 300m above sea level. The Biu Plateau was an area of intense volcanic activities during ancient times. Landforms of the area are charaterised by rugged terrain with features of volcanic origin such as conical hills, craters and escarpments. The mean altitude of the plateau ranges between 650 metres above sea level in the north eastern part down to 300 metres high on the gentle slopes of the escarpment over looking the Hawul valley in the southern margins. The Mandara Mountains in south eastern part of the State is an extension of the Adamawa/Bamenda Highlands which forms part of Nigeria’s frontier with the Republic of Cameroon. The area is marked by varying altitudes having been subjected to many circles of erosion in the past. It rises to an altitude of 4000ft around the Mubi Hills. The mountain has been dissected by numerous rivers with deep channels. The Gwoza area is charaterised by relief varying from foothills to pediments, rugged mountain ranges and steep sided residusl hills known as inselbergs above the basement plain in several places. A vast open flat undulating plain is the characteristic feature central and northern Borno. The plain covering over three quarters of the State are divided into two sub regions based on the nature of the surface. The southern part is a hard surface plain made up of the pediments of the foothills of the Biu Plateau and the Mandara Mountains which are broken by small boulders and rock out crops merging into the lowest steps of the plateau as in the kwaya plains or as in the Askira plains and the Chibok area. Northern Borno is a vast loose sandy plain without any hill or rivers. The Bama Ridge, which is believed to be the shoreline of theancient Mega Chad prominently stretched from Maiduguri through Magumeri towards Geidam. Kagu (in this volume) has extensive discussed the ridge and its socio economic significance. In the extreme north of the State, sand dunes of aeoline origin rise upto 900 metres in some places such as the Gudumbali Dunes. In terms of natural drainage, there are two groups of seasonal rivers. River Hawul drains the Biu Plateau southwards into the river Gongola which is part of the river Benue system. The River Ngadda and some short course rivers drain the northern part of the plateau and flow north east towards the Lake Chad. River Yedsaram and its tributaries take their source on the Mandara Mountains and flow north east towards the Lake Chad. The two systems converge at Maiduguri and flow out north ward but dissipate into the Jere Bowl in the outskirt of the capital city. The climate of Borno State is characterized by dry and wet seasons. The natives of the region traditionally identify four seasons, viz: Binəm (cool dry season), harmattan season from December to February; Bey, (hot dry season), from March to late May: Nəngəli, raining season from June to September and Biila, humid dry transitional period between September and November. The timing is however not rigid owing to climatic vagaries of recent times. The daily average temperature are high throughout the year ranging between 25
oC to 44
oC, where lower
temperature are recorded in January and the highest in April. There are sharp differences between diurnal and night temperature especially in the northern fringes of the State. It is common knowledge that rainfall is dwindling in the State both in quantity and number of rainy days since the 1970s. The mean annual rainfall ranges between a little over 800mm on the Biu Plateau and less than 500mm in the extreme northern part of the State while rainy days reduces from south to north between 80 to less than 40 days. For instance, in 2004, there were 60 rainy days in Biu and 20 days in Ngala and a total amount of 951 and 499 millimeters of rain respectively (Statistical Year Book 2006). Droughts, famine and pest occur so often. Rivers are often dry, ground water is getting deep and desiccation is wide spread. The State is getting bare of vegetation as a result of the climatic changes and over exploitation. The vegetation characteristic consists of Sudan savannah in the southern part of the State and Sahel savannah in the northern part. The vegetation that used to consists of scrubs interspersed with occasional trees and parches of woodland
Issues in the Geography of Borno State.
)
11
are fast disappearing and desert characteristics is setting in from north to south successively due to excessive cultivation, woods exploitation and over-grazing. The State is in the pangs of desertification. Settlements and Population People have been living in the Borno region since time immemorial. Acheological finds put the age of a settlement called Diama on the shore of the lake Chad to about 1700 years odl (Madi, 1985). Bearing in mind the long history of the Kanem Borno Empire, several settlements must have existed before then and several have sprang ever since. The type, form and pattern of settlements are influenced by historical, social and environmental factors. Growth and changes in population as well as the functions of the settlement are also important variables in the nature of settlemnes in the Borno region. Generally settlements are dispersed on the vast plains of the Chad Basin and tend to be nucleated in the hilly environments of the Biu Plateau in southern Borno. Abdullahi and Nyanganji (in this volume) have given an example of the influence of the environment on settlements pattern in Kwajaffa district on the Biu Plateau. Basically two forms of settlements are distinct in the State, that is, rural and urban settlements. In the rural settlements population is low, basic infrastructure like roads, electricity, health and educational facilities are few or lacking. All local Government headquarters in the State are classified as urban. But the urban settlements differ in size, economy and infrastructure. Maiduguri the State capital is the premate city in the region. It contains more than a quarter of the State’s population (Waziri 2007) and surplus of infrastructural facilities. According to the 2006 population census, Borno State has apopulation of 4,151,103 people (NPC 2007). With a growth rate of 2.8% per annum this number will likely double in the next 20-30 years. In most national statistics, Borno State is classified as sparsely populated with an average of 59 persons per square Kilometeres. But within the State areas of different population density abound. For instance Mauduguri Metroplotan, jere, Ngala and Gwoza local Governments have far above the average. Similarly the shores of the Lake Chad, areas along the courses of Rivers Yobe and Yedsaram and foothills of the Biu Plateau have higher density. Several areas, especially in the northern parts, are far below the average. Economic Activities The economy of the State is anchored on natural resources. Primary production processes such as agricultural production, animal grazing, mineral excavation and fishing are the mainstay of the economy. Majority of the people are peasant farmers, herdsmen and fishermen. The State has about 6.9 million hactres of arable land out of which 1.4 million hectares of land is under crop cultivation and 1.3 million hectares under grazing and forest reserve. In 2004, about 7.4 milliom metric tones crops was produced in the State (Statistcai Year Book 2005). Livestock populations in the State consist of about 3.9 million cattles. 4.8 million sheeps and 5.9 million goats. The Shuwa Arabs, Fulani, Bodai, Koyam and Buduma are pastoral ethnic groups found in the State. They contribute greatly to the daily meat needs of not only the State but of the country in general. However, crop production and animal husbandry are persistently affected by droughts, pests, and animal diseases resulting from the regular climatic hazards. Borno State is also endowed with rich mineral base resources such as clay, salt, natron, limestone and kaolin, iron ore, uranium and mica. Petroleum is prospected intensively on the shore of the Lake Chad. There are very few industries in the State. These include flour mills, shoe factory, ginnery, diary products, corn milling and the like. However there are several small scale industries like mat making, pottery and leather works. Commercial activity is very significant in the State. The Maiduguri Monday Market is a centre of whole and retail sales for over a hundred years. Traders from within the country and from the Republic of Chad and Cameroon patronize markets in the State for the purchase of agricultural goods, livestock and other products. Movement of people and goods are facitated by a network roads, rail and air transport. Social and Economic Infrastructure Education: Although Borno State is classified as one of the educationally disadvantaged States in the Country, there are appreciable number of schools and encouraging enrolments. In the year 2005/6, there were 1,276 public primary schools with a total enrolment of 844,411 pupils; and eighty-six secondary schools with an enrolment of
Reproductive Health Indicators in selected Communities in Maiduguri, Jere and Bama LGAs: A Survey Report
12
105,142 students (Statistical Year Book 2005/6). However, enrolment distribution is lopsided with local government in the northern part showing very much lower figure than the southern parts. Aji and Bukar (in this volume) have expounded the reasons for the disparity especially the low enrollment of the girl child. There are six State owned tertiary institutions and a Federal University in the State. Health: Borno State has a number of health establishments. It consists of 501 health clinics and dispensaries; thirty general hospitals; ninety six Maternal and Child clinics; seven leprosium and thirty two private clinics. In addition, there are an eye clinic, dental clinic, chest clinic, and Infectious Diseases Hospital, as well as a Federal Neuro-Psychiatric and a Teaching Hospital in the State. Most of the secondary health care facilities are in the urban area while the Primary Health Care facilities are randomly spread in all over the State. Water & Electricity Supply: Scarcity of water resources has remained a fundamental problem in the State owing to its location in semi-arid region. Access to clean potable water differs from one location surface water supply system in the State capital. There are about 1,548 cement wells and 692 boreholes in the State. Electricity supply is restricted to urban areas in the State. The State capital and some local government headquarters are connected to the national grid. In 2004 about 67,000 residential houses 11,000 commercila concern were connected to public power system. Over 140 million Kwh were consumed in the State. Some local governments areas get supply from the Rural Electrification scheme run by the State government. Transport and Communication: Borno State is connected to other parts of the federation by air, road and rail. Maiduguri the State capital is the main hub about which roads radiate in all directions connecting the State to other parts of the country and to neigbouring countries. The State has a total of 2,449km of all season roads and 755km of seasonal linking various parts of the State. However, most of the existing roads are in a deplorable condition. Generally road density is low and many parts of the State, including some local government headquarters like Abadam and Kala-Balge are remote and difficult to access. Though Borno State is connected with rail transport line, its utility is very limited for many purpose.The Maiduguri International Airport provides daily flights from Maiduguri to Abuja and Lagos. Telecommunication network is not developed in the State. Only the State capital Maiduguri, Bama Gwoza and Biu are linked with fixed land lines. Mobile phones are recently introduced in the State, appreciable coverage in made. NIPOST services are not widely extended. Ther e were 19 Post Offices and four postal agencies. Borno State has one State owned Radio and Television station, a federal radio and the NTA zonal office/station. Receptions of programmes of all the three stations are restricted to the State capital and environs only. The State population is connected to the IT world by satellite Televisions and the internet. The use of the internet is fast increasing through commercial Café, corporate users and use of modems from GSM service providers. Tourism: Although tourism is not well developed, the State has several tourism resources ig sceneric attraction such as the Jaffi Falls, the Gwoza hills, the Alau dam, the Lake Chad the kyarimi Park as well tradition place of interest such as the Rabeh’s Port, Shehu’s Palace, The Shehus’ Tombs and Yamtarawala tombs. Also there several ceremonies and cultural shows among which is the durbar. Substantial numbers of hospitality industry are available in the State. Banking and financial institutions are found almost in every urban centre in the State. Conclusion The geographical location of Borno State is unique. Its physical landscape is diverse with mountains and plains while climatic conditions ranges from desert like to montane with resultant vegetation characteristics. The State is occupied by diverse culture and historical experiences. It has an abundant natural resources and significant infrastructure. However there are also significant problems resulting from resource over exploitation and improper management. The following chapters highlight or discuss different issues in the geography of Borno State. The discussions are however not exhaustive, there are clear openings for further discussions in another volume.
Issues in the Geography of Borno State.
)
13
Reference Adelakan, I O (1998) Hydrological Implications of Inter Annual Rainfall Variation in Northern Nigeria:
The Case of Chad Basin in Hydrology in a Changing Environment, Vol 1, Proceedings of British Hydrological Society, John Wiley and Sons London.
Statistical Year Book (2006) Borno State Statistical Year Book 2005/6, Maiduguri, Directorate of
Statistics, Department of Budget and Planing Governor Office. Mahdi, A (1985) Cities of Borno in the Cities of the Savanah, Nigeria Magazine. National Population Commission (NPC) (2007 ) Population Census of Federal Republic of Nigeria, NPC
Abuja. Oladipo, E. O (1996) Lake Chad Integrated Management Preparatory Assistance, Ndjemena,
First regional Workshop on Integrated Management of International Waters Waziri, M (2007) Trends in Population Dynamics and Implications for Contemporary Socio-economic
Development in the Chad Basin, paper presented at the Kanem Borno Milleneum Conference, Maiduguri.
14
3 Kanem-Borno Empire- A Historical Introduction to the Geography of Borno. BABA GANA WAKIL National Population Commission, Abuja Introduction Borno had an ancient and chequered political history dating back to around the eight (8
th) century with the
kingdom of kanem. It grew through the centuries into a formidable polity in the central Sudan, first under the Magumi Mai (Kings) of the Sayfawa dynasty in Kanem and Bornu Kingdom, later under the Kanemiyyin leaders as from the 19
th century. The Sayfawa dynasty, one of the oldest dynasties in the world, ruled for nearly a 1000 years.
During this long, chequered and glorious history, they evolved a hierarchically structured political system and an administrative structure and exerted significant influence in shaping the historical development of the entire central Sudanese region. (Alkali, 1980, Tijani, 1980) The remarkable successes of Borno especially from the 17
th to the 18
th centuries in terms of the establishment of
an elaborate system of political and socio-economic suzerainty over the entire Chad basin and beyond can not simply be reduced to military prowess and political adventurism of individuals divorced from the more fundamental socio-economic environment in which they operated. This brief historical introduction will attempt only to highlight the strong economic support base of the region that enabled the empire flourished for centuries and also the vagaries of climatic/ecological changes over time that had impacted on the political developments up to the commencement of colonial rule. The Lake Chad and Bornuan State formation Borno Empire at its peak of splendour and glory in the 17
th and 18
th centuries extends to Kanem to the east, the
Gongola/Benue Valley, the Mandara Mountains and the Biu/Marghi highlands in the South/southwest, the central desert oasis of Bilma in the Sahara desert to the north and Hausalands in the west. This vast area over which the empire held sway coincided, to a considerable extent, with the boundaries of the Lake Chad basin, an area of more than 300,000 sq miles. Today, the areas that erstwhile constituted the kingdoms of Kanem and Borno are shared between the modern states of Nigeria, Niger, Chad and Cameroons. (Lavers, 1980). The history of Kanem-Borno is aptly described as the history of peopling of the drying bed of the Mega Chad. The process of Bornuan State formation is inextricably linked to the power tussle between the dominant groups notably the Kanuri, Bulala, Bagirmi, Wadai, Kotoko and Mandara people in the Lake Chad Basin area.Indeed, the gradual desiccation of the area resulted in the permanent diminution of the Lake that resulted in mass migratory movement of people to occupy the more humid area of the dried bed of the lake as well as the well drained areas of the Chari-Logone Rivers. {Lavers, 1980). There was no doubt that the successes of the Kanem-Bornu Empire can largely be attributed to the tremendous resource endowments of the region. The fertility of the extensive Bornuan plains provided the solid economic base upon which the Empire flourished. A viable regional economy evolved and was sustained over the period from an array of five separate economic zones that comprised the entire Bornuan territory. There was the north-east economic zone or ‘Firgi’ floodplains (black soil) region. This was a very fertile landmass with specialty in agriculture, fishing and pastoralism. It was a region that supported large population concentration and perhaps the area where human settlement first began in the Chad basin. In the south-west lies the sandy plain, ample home for grazing and limited cultivation. The northern sandy plains drained by river Yobe was a home for dum palms, craftworks and fishing. This region also supports dense population. The Mandara Mountains and Biu plateau in the southern fringes were main sources of supply of iron and slave to the empire. There were also, the margins and islands within the lake, benevolently endowed for fishing, animal farming and collection of wild rice. (Alkali, 1983)
Issues in the Geography of Borno State.
)
15
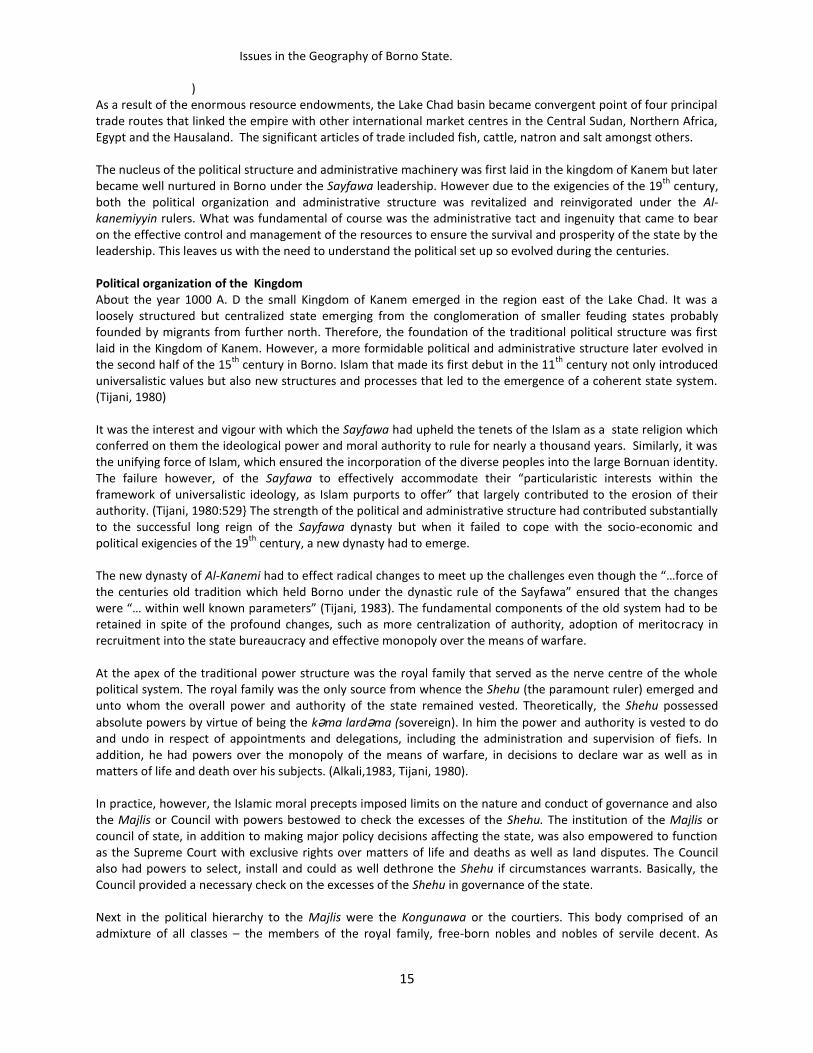
As a result of the enormous resource endowments, the Lake Chad basin became convergent point of four principal trade routes that linked the empire with other international market centres in the Central Sudan, Northern Africa, Egypt and the Hausaland. The significant articles of trade included fish, cattle, natron and salt amongst others. The nucleus of the political structure and administrative machinery was first laid in the kingdom of Kanem but later became well nurtured in Borno under the Sayfawa leadership. However due to the exigencies of the 19
th century,
both the political organization and administrative structure was revitalized and reinvigorated under the Al-kanemiyyin rulers. What was fundamental of course was the administrative tact and ingenuity that came to bear on the effective control and management of the resources to ensure the survival and prosperity of the state by the leadership. This leaves us with the need to understand the political set up so evolved during the centuries. Political organization of the Kingdom About the year 1000 A. D the small Kingdom of Kanem emerged in the region east of the Lake Chad. It was a loosely structured but centralized state emerging from the conglomeration of smaller feuding states probably founded by migrants from further north. Therefore, the foundation of the traditional political structure was first laid in the Kingdom of Kanem. However, a more formidable political and administrative structure later evolved in the second half of the 15
th century in Borno. Islam that made its first debut in the 11
th century not only introduced
universalistic values but also new structures and processes that led to the emergence of a coherent state system. (Tijani, 1980) It was the interest and vigour with which the Sayfawa had upheld the tenets of the Islam as a state religion which conferred on them the ideological power and moral authority to rule for nearly a thousand years. Similarly, it was the unifying force of Islam, which ensured the incorporation of the diverse peoples into the large Bornuan identity. The failure however, of the Sayfawa to effectively accommodate their “particularistic interests within the framework of universalistic ideology, as Islam purports to offer” that largely contributed to the erosion of their authority. (Tijani, 1980:529} The strength of the political and administrative structure had contributed substantially to the successful long reign of the Sayfawa dynasty but when it failed to cope with the socio-economic and political exigencies of the 19
th century, a new dynasty had to emerge.
The new dynasty of Al-Kanemi had to effect radical changes to meet up the challenges even though the “…force of the centuries old tradition which held Borno under the dynastic rule of the Sayfawa” ensured that the changes were “… within well known parameters” (Tijani, 1983). The fundamental components of the old system had to be retained in spite of the profound changes, such as more centralization of authority, adoption of meritocracy in recruitment into the state bureaucracy and effective monopoly over the means of warfare. At the apex of the traditional power structure was the royal family that served as the nerve centre of the whole political system. The royal family was the only source from whence the Shehu (the paramount ruler) emerged and unto whom the overall power and authority of the state remained vested. Theoretically, the Shehu possessed
absolute powers by virtue of being the kəma lardəma (sovereign). In him the power and authority is vested to do and undo in respect of appointments and delegations, including the administration and supervision of fiefs. In addition, he had powers over the monopoly of the means of warfare, in decisions to declare war as well as in matters of life and death over his subjects. (Alkali,1983, Tijani, 1980). In practice, however, the Islamic moral precepts imposed limits on the nature and conduct of governance and also the Majlis or Council with powers bestowed to check the excesses of the Shehu. The institution of the Majlis or council of state, in addition to making major policy decisions affecting the state, was also empowered to function as the Supreme Court with exclusive rights over matters of life and deaths as well as land disputes. The Council also had powers to select, install and could as well dethrone the Shehu if circumstances warrants. Basically, the Council provided a necessary check on the excesses of the Shehu in governance of the state. Next in the political hierarchy to the Majlis were the Kongunawa or the courtiers. This body comprised of an admixture of all classes – the members of the royal family, free-born nobles and nobles of servile decent. As

Reproductive Health Indicators in selected Communities in Maiduguri, Jere and Bama LGAs: A Survey Report
16
bureaucrats or executive arm of Government, they ensured the implementation of the state policies articulated by the Majlis. As fief holders they also ensured the collection of revenues, mobilization of armaments and men against internal and external security threats to the state. The Kongunawa were a formidable political force albeit the fact that their powers were limited by virtue of being appointees of the Shehu and could be dismissed at his pleasure. They however functioned effectively to counter unwarranted pressures exerted on the Shehu by the Majlis. In this highly centralized state, the political and administrative system functioned on the basis of the Chima
(vicegerent) system. The Shehu, being the kəma lardəma, had the overall power and control over land and divide the territory into fiefs under the authority of the Chima Kura. The Chima Kura, for strategic reasons, resided with the Shehu at the capital though in control of the fiefs at various locations. Fiefs holders could be Abba or princes, freeborn or nobles of servile decent such as Kachalla. (Alkali,1983). The Chima Kura administered his fiefs through the Chima Gana, who could be his slave or free born client. The Chima Gana in turn shared his delegated authority with the Bulama or community leader. This traditional political and administrative structure did survive in spite of the debacle of Rabeh, a war lord who invaded Borno in 1893 and provided the foundation upon which the British system of indirect rule was built. Economic depression and decline of State power 18
th to the 19
th Century
Indeed, there had to be ups and downs in the life history of a State or often rise and collapse of states but what was remarkable about the Bornuan history was that of rise and fall but never collapse. A perennial ecological phenomenon of the region had been periodic famines and droughts with great consequences to the economy. In times of good harvest, there could be better living standards, increased state revenues, enhanced military capability and territorial control. In periods of depression and poor intervention policies of State to avert dire consequences, internal security threat, disenchantment of peasants, rebellion, external attacks and succession disputes reigned supreme to undermine the state authority and power. It could amply be stated that the short span of the Kingdom of Kanem, can be attributed to the inadequate resource base relative to mass migratory movements into the region which generated rivalry amongst the various semi-autonomous kingdoms. Therefore, this general atmosphere of insecurity and violence necessitated a shift to Borno in the 15
th century.
The fundamental push and pull factor for the shift of power base to Borno was economic and this underscored the spectacular successes in its imperial expansionism under girded by strong military build up and efficient administrative and political organization unsurpassed in the entire central Sudan in the 16
th and well into the 18
th
centuries. A common feature of the Chad basin ecology had been the periodic famines and droughts. The gravity of these natural disasters became worrisome with devastating effects on the regional economy especially as from the 17
th century. The dwindling state revenue failed to cope with the expanding bureaucratic machinery of the
state and especially the military, with the result that by second half of the 18th
century Borno suffered defeat and lost the salt mines of Bilma to Agades. The economic situation worsen towards the end of the century with the result that the state became virtually incapacitated to manage the continued influx of migrants and to handle food crisis as well as the deteriorating morale of the military. The most serious of these internal pressures on the state was the Fulata rebellion of 1808 which destabilized the State and devastated the already ailing economy. The political disarray and economic dislocation triggered by the Fulata onslaught was to send Bornuan kingdom tottering towards a deep abyss except for the timely debut of Muhammad Al-Amin Al-Kanemi on political scene. (Tijani,1980, Garba, 1994). However, from the 1840s onwards Borno witnessed serious famines and droughts and the economic bail-out
strategies as price control polices and obnoxious measures as the Kəmo-reji (forfeiture of half of one’s possession) to the State never averted the deteriorating livings standards, insecurity, mass disaffection and disenchantment, rebellion and leadership crisis. Borno was almost in a crisis situation before the Rabeh’s invasion, which was seen as a descend of an unprecedented catastrophe (masiwa) on the Bornuan kingdom in 1893.
Issues in the Geography of Borno State.
)
17
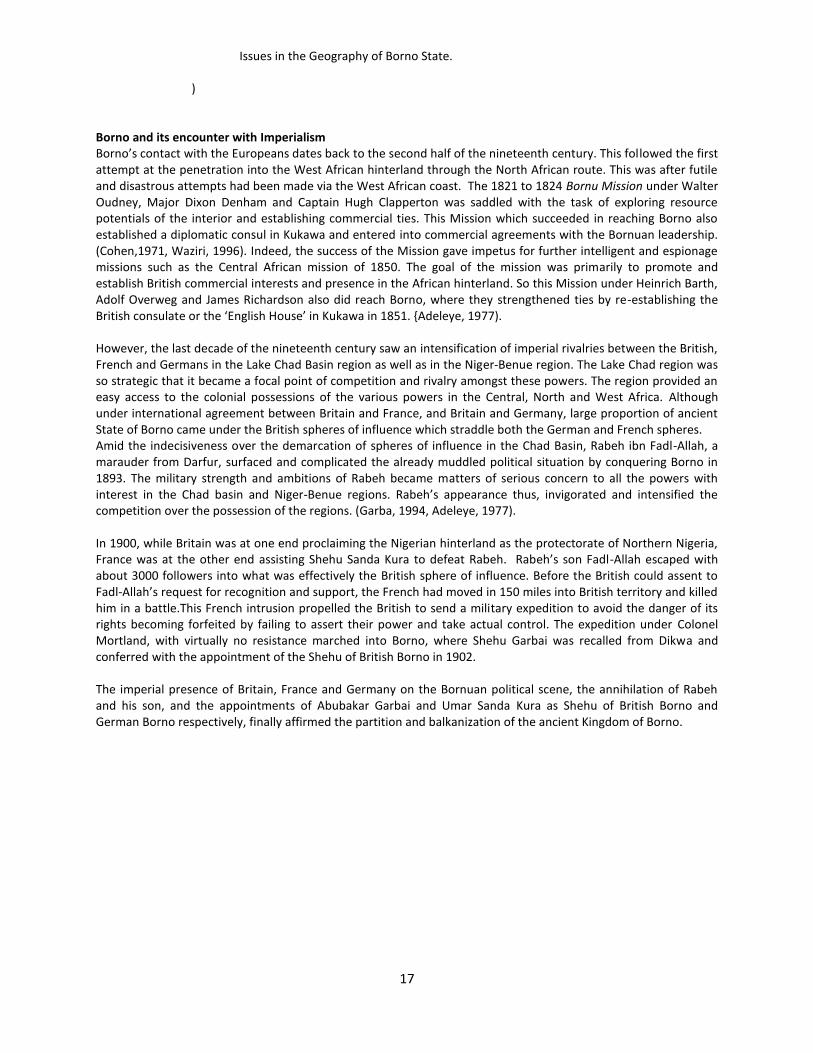
Borno and its encounter with Imperialism Borno’s contact with the Europeans dates back to the second half of the nineteenth century. This followed the first attempt at the penetration into the West African hinterland through the North African route. This was after futile and disastrous attempts had been made via the West African coast. The 1821 to 1824 Bornu Mission under Walter Oudney, Major Dixon Denham and Captain Hugh Clapperton was saddled with the task of exploring resource potentials of the interior and establishing commercial ties. This Mission which succeeded in reaching Borno also established a diplomatic consul in Kukawa and entered into commercial agreements with the Bornuan leadership. (Cohen,1971, Waziri, 1996). Indeed, the success of the Mission gave impetus for further intelligent and espionage missions such as the Central African mission of 1850. The goal of the mission was primarily to promote and establish British commercial interests and presence in the African hinterland. So this Mission under Heinrich Barth, Adolf Overweg and James Richardson also did reach Borno, where they strengthened ties by re-establishing the British consulate or the ‘English House’ in Kukawa in 1851. {Adeleye, 1977). However, the last decade of the nineteenth century saw an intensification of imperial rivalries between the British, French and Germans in the Lake Chad Basin region as well as in the Niger-Benue region. The Lake Chad region was so strategic that it became a focal point of competition and rivalry amongst these powers. The region provided an easy access to the colonial possessions of the various powers in the Central, North and West Africa. Although under international agreement between Britain and France, and Britain and Germany, large proportion of ancient State of Borno came under the British spheres of influence which straddle both the German and French spheres. Amid the indecisiveness over the demarcation of spheres of influence in the Chad Basin, Rabeh ibn Fadl-Allah, a marauder from Darfur, surfaced and complicated the already muddled political situation by conquering Borno in 1893. The military strength and ambitions of Rabeh became matters of serious concern to all the powers with interest in the Chad basin and Niger-Benue regions. Rabeh’s appearance thus, invigorated and intensified the competition over the possession of the regions. (Garba, 1994, Adeleye, 1977). In 1900, while Britain was at one end proclaiming the Nigerian hinterland as the protectorate of Northern Nigeria, France was at the other end assisting Shehu Sanda Kura to defeat Rabeh. Rabeh’s son Fadl-Allah escaped with about 3000 followers into what was effectively the British sphere of influence. Before the British could assent to Fadl-Allah’s request for recognition and support, the French had moved in 150 miles into British territory and killed him in a battle.This French intrusion propelled the British to send a military expedition to avoid the danger of its rights becoming forfeited by failing to assert their power and take actual control. The expedition under Colonel Mortland, with virtually no resistance marched into Borno, where Shehu Garbai was recalled from Dikwa and conferred with the appointment of the Shehu of British Borno in 1902. The imperial presence of Britain, France and Germany on the Bornuan political scene, the annihilation of Rabeh and his son, and the appointments of Abubakar Garbai and Umar Sanda Kura as Shehu of British Borno and German Borno respectively, finally affirmed the partition and balkanization of the ancient Kingdom of Borno.
Reproductive Health Indicators in selected Communities in Maiduguri, Jere and Bama LGAs: A Survey Report
18
Reference: Alkali, N. (1978) Kanem-Bornu under Sayfawa: A study of Origin, Growth and Collapse of a Dynasty. Ph. D thesis
ABU, Zaria. Adeleye, R.A. (1977) Power and Diplomacy in Northern Nigeria 1804-1906’ Longman, London Bala, U and Nur Alkali eds (1983,57} Studies in the History of pre-colonial Borno. NNPC, Nigeria Benisheikh, A. “The Revenue system of the Government of Borno in the nineteenth century” in Bala, U and Nur
Alkali eds (1983} Studies in the History of pre-colonial Borno. NNPC, Nigeria Cohen, R. “From Empire to Colony Borno in the nineteenth and twentieth centuries” in Turner, V. (1971) Profiles
of changes in African Society and Colonial rule. Cambridge press. Garba Ibrahim (1994) Borno Under the British: A study of the evolution and Development of Indirect rule in North
-eastern Nigerian Community 1902-1925. Ph.D thesis, University of Maiduguri. Lavers, J.C (1980,187) “Kanem and Borno Under three dynasties: Some aspects of change and development C.700
-1900” in Ade-Ajayi and Ikara, B eds. (1985) Evolution of political culture in Nigeria- proceedings of a national seminar organized by the Kaduna state Council of Arts and Culture, University press.
Lavers, J.C. (1980) “ Kanem Borno up to 1808” in Ikime, O {1980) Groundwork of Nigerian History. Heinneman Educational Books, Ibadan.
Tijani, K. (1980,651) Political and Administrative Development in Pre-colonial Borno. Ph.D thesis, ABU Zaria Tijani, K. (1983:127-139) Political and Contitutional Changes in Borno under the Shehu Muhammad Al-Kanemi:
The Case of the Majlis. Wakil, B.G (2006). The Dynamics of the Political Processes in Bornu Division within an Emergent Nigerian State
1950-1966. Ph.D thesis, University of Maiduguri. Waziri, I.M. (1998) Colonial Export Trade in Borno: A case study of the impact of selected commodities in the
emergence and growth of a cash economy 1902-1945. Ph.D thesis, University of Maiduguri.
Issues in the Geography of Borno State.
)
19
SECTION TWO PHYSIOGRAPHIC ISSUES
Reproductive Health Indicators in selected Communities in Maiduguri, Jere and Bama LGAs: A Survey Report
20
4 The Bama Ridge, A Significant Landmark ABBA KAGU Department of Geography, University of Maiduguri Introduction A ridge could literally be referred to as any of the following:, raised line where two sloping surfaces meet; long, narrow stretch of highlands along the tops of a line of hills; raised part of the earth’s surface between two furrows; or a long narrow upland, with steep sides (Monkhouse and Small, 1979; Zarma, 1997). In any case, a ridge is a part of the earth surface which has withstood the test of geologic time amidst geologic processes (surface) and occurs at an elevation that is relatively higher than its surrounding. Bama Ridge (BR) is a long sandy ridge made up of layered sand and gravel bands. It runs from the foothills of the Mandara Mountains in North-eastern part of Nigeria, crossing through Maiduguri, Konduga and Bama towns in Borno State. It extends some 300kms north-wards to Geidam in Yobe State (Fig.3.1). It is believed to have emerged mainly as a result of the processes of fluvial erosion and deposition. According to Grove (1959), the ridge was built during a high water level of the Lake Chad, an elevation of about 320m above sea level, instead of today’s 280m lake level. This huge Paleo-lake was the largest extension of the Lake Chad during the late Pleistocene. The ridge according to Grove is the southwestern rim of the lake, crossing Borno State almost straight, through the northwest. Thambyahpillay (1983), confirms that the ridge has been identified with certainty as the shoreline of a Paleo-lake of which the present day Lake Chad is only a mere shrunken relic. The present shoreline of the lake is more than 100kms away from the Bama Ridge (Fig.3.1). Although it is very difficult to date with certainty the exact time when the ridge was formed, Thiemeyer (1992), found charcoal and potsherds in the lowest parts of the upper layer of the ridge near Konduga which was used to arrive at a 14C – date. The dating gave an age of 6,350 + 250 years before present to the ridge. According to the date it is evident that at that time, the Lake Chad must have had a high water level of about 320m which confirms Grove (1959) and Thambyahpillay (1983). Overview of Some Studies on the Bama Ridge Various authors have directly or indirectly touched on some aspects of the Bama Ridge. The earliest geological account of the ridge was that of Barber and Jones (1960), in their study of the geology and hydrology of Maiduguri who reported that the sediments of the ridge are over 21m thick. Some of the sediments are cross bedded and show ripple marks. They concluded that the ridge marks the former shoreline of the Lake Chad. Based on sedimentological characteristics, they reported that most of the sediments are alluvial, but some aeolian sands may be present. Grove and Warren (1968), who studied the quaternary landforms and climate on the South side of the Sahara were of the view that a Lake of about 320m level occupied the centre of the Chad Basin and was responsible for the formation of the Bama Ridge sediments. According to them, the morphological evidences for this “palaeolake” are very clear, and that the ridge has been recognized as an old strandline. Durand (1982) and Durand et al (1984), observed the oscillation of the Lake Chad over the past 50,000yrs, and associated the origin of the ridge with geotectonic movements. On the basis of stratigraphical, sedimentological, geomorphological, hydrological and geophysical arguments, they discarded the hypothesis of a “mega Chad” held by other authors such as Barber and Jones (1960), Grove and Warren (1968). Seneviratne (1983), while treating the landforms in Borno State however ignored Durand and Durand et al by suggesting that the ridge was formed as a result of shoreline processes of the ancestral Lake Chad during the Pleistocene.
Issues in the Geography of Borno State.
)
21
Iwuagwu (1991), analysed the lithofacies of the ridge sediments and attributed the origin to shoreline process. However, this analysis did not reveal typical beach sand characteristics, thus questioning the beach origin ascribed to the ridge. He concluded that the ridge may be a beach with difference. However, Ijere (1991), observed the landscape development and potentialities of Lake Chad and hypothesized that the down warping of the Chad area facilitated drainage from the south in which materials transported by water from this region were deposited at the Lake shore at a time when currents were not strong enough to carry them further to the Lake bed. These materials must have resulted in the formation of the sediments of the ridge. Nyanganji (1994), studied the morphology and hydrography of the Ngadda catchments and the Bama Ridge. He observes that the Bama Ridge hydrography is controlled by the influent Ngadda river flow processes which account for about 97 percent of its ground water recharge processes. He concluded that rainfall minimally influences the surface and the groundwater hydrography of the ridge. According to Agbo and Goni (1995), who studied the geology and sedimentology of North-east Nigeria, the sediments of the Bama Ridge show a fining upward sequence which repeats vertically, in a cyclic fashion. Each cycle is composed of two units which can be distinguished on the basis of texture and structure. Based on the geometry, lithology, texture and structure of the sands of this ridge, the sediments could be regarded as having been laid down by fluvial processes with some Aeolian components, probably along the shore of the ancestral Lake Chad. However, it was further argued that paleocurrent studies together with textural and mineralogical attributes suggest that the granitic rocks of the Mandara hills may have provided the source materials for the ridge. Similarly, Ijere and Kagu (1998), observed the texture and structure of the ridge and argued that the texture and structure of materials in the quarries suggest that the ridge deposits came from different sources. The structure shows evidence of several formation episodes. Horizontal bedding planes of sand and gravel, with cross-bedding in some sections, imply alternating erosion and deposition intervals. The assorted nature of the ridge materials indicate that they were deposited under fluvial conditions. Zarma (2000), subjected the exposed portion of the ridge to petrographic analysis which revealed that quartz, feldspar and lithic rock fragments constitute the essential components of the mineralogy. Subordinate minerals associated with these include mica and iron oxide, acting as cement. Study by Kagu (2008) dwelled on excavation activities on the Bama Ridge, with focus on socio-economic and environmental analysis. The study revealed that excavation activities on the Bama Ridge, which has been going on for decades, has brought about some transformation in both the rural and urban areas of the Bama Ridge. Socio-economically, such transformation is positive in the urban areas because they benefit more from the income and other gains resulting from the business. However, this is to the detriment of the rural areas that are at the receiving end despite their proximity to such resources. They end up losing their farmlands to excavators together with other negative socio-economic problems attached to it. Environmentally the consequences are disastrous in the various excavation zones which are mostly situated in the rural areas of the ridge. The popular view about the excavation business in the study area is that of mixed feelings of both a curse and a blessing.

Reproductive Health Indicators in selected Communities in Maiduguri, Jere and Bama LGAs: A Survey Report
22
Source: Modified from Land Resource Study No.9 1972 Figure 3.1 The Bama Ridge North-Eastern Nigeria Potentialities of the Ridge Bama Ridge is an area of great economic potentialities if properly managed as revealed by a number of empirical studies. In recent years the search for and extraction of resources is one activity through which the environment suffer damage and man is being affected socio-economically. Udo (1990), observes that man has always been conspicuous in his ability to alter the surface of the earth for various purposes. Goudie (1993), puts it that man is an important factor in the environment, because he both modifies it through his actions, and has his actions modified by the environment. He admits that the environment is always changing, partly because of human activity, but it is often difficult to ascertain whether any particular change is purely man made or as a result of natural changes. However, widespread destruction of the rural landscape is caused by indiscriminate quarrying of sand, laterite and gravels for road construction and for building purposes. This is a typical activity on the Bama Ridge. Although excavation on the ridge has been going on for decades, Ijere (1991), asserts that the economic boom, which started in the late 1970s accelerated the process due to the ever increasing demand for sand and gravel in the construction industry. The ridge is being destroyed by excavators in ways that pose great threat to the environment.
Issues in the Geography of Borno State.
)
23
Bama Ridge which is a significant landmark in north eastern Nigeria and perceived to be an inexhaustible resource is now tending towards being exhausted, because of the uncontrolled excavation. If one is amongst the rural communities, one hears such statements like, “that place over there used to be a thick forest where we fetched our firewood when I was young” or “this soil here does not yield as much as it did some ten seasons ago” or “we used to catch plenty of fishes in the stream yonder, but it is there no more”. These and many similar statements are manifestations of the effects of land degradation on the affected communities. On approaching the environs of the ridge, one notices hundreds of tippers going in and out of the excavation sites loaded with various materials removed from the ridge. However, it is pertinent to note that the excavation of the ridge which has been going on for decades (Ijere, 1991), has some socio-economic and environmental impacts. Bama Ridge, which is seen as a national monument, is today being tempered with by excavators in ways that signal a lot of dangers to the environment. Excavation, which leads to removal of the overburden of a portion of the earth surface, may also bring about some changes in the geological stability of the earth surface. Conclusion From the various reviews above, it is obvious that the Bama Ridge is an area of great potentials, especially with regard to its socio-economic and environmental impacts. It is however evident that most of the authors worked on the geological and sedimentological aspects of the ridge with less emphasis on the role of Man in changing the landscape, thereby affecting the sustainability of the resources in such environments. In view of these, further research should be carried out in order to assess the possibilities of rehabilitating or reclaiming the abandoned excavation zones which not only changed the aesthetic quality of the environment, but also destroyed the entire scenery of the Bama Ridge. Such research should be adequately funded, while information and demonstration of new techniques that can help to improve the people and the environment should be adequately disseminated especially to the grassroots.
Reproductive Health Indicators in selected Communities in Maiduguri, Jere and Bama LGAs: A Survey Report
24
References: Agbo, J.U. and Goni, I.B. (1995) “The Geology and Sedimentology of North-east Nigeria”, Research Journal
of Science, Vol.1, No.1, pp 1-10. Barber, W. and Jones, D.G. (1960): “The Geology and Hydrology of Maiduguri, Borno province”, Record of Geology
of Nigeria, pp 5-20. Durand, A. (1982): “Oscillation of the Lake Chad Over the Past 50,000 Years, New Data and New Hypothesis”,
Palacogeoge, Palaeodimi, Palaeoecology, Vol.39, pp 37-53. Durand, A.; Fontes, J; Gasse, F; Kole, M. and Lang, J.S. (1984): “Nord Ouest du Lac Tchad an Quarternaire Etude de
Palaoenvironments Alluviaux, Eoliens, Palustres et Lacustres”, (A Quarterly Study on Paleo-environment, Alluvial and Aeolian Deposits in North-Western Lake Chad), Palaeoecology Africa Vol.16, pp 215-243.
Goudie, A. (1993): The Nature of the Environment 3
rd edn, Oxford and Cambridge: Blackwell publishers.
Grove, A.T. (1959): “A Note on the Former Extent of Lake Chad”, Geographical Journal, Vol.125, pp 465-467. Grove, A.T. and Warren, A. (1968): “Quaternary Landforms and Climate on the South Side of the Sahara”.
Geographical Journal, Vol. 134, pp 194-208. Ijere, J.A. (1991) “Landscape Development and Potentialities of Lake Chad Basin” In Jungraithmayr, H. and
Nagel, G. (eds) West African Savanna Culture, Language and Environment in a Historical Perspective. The Frankfurt Ammain, pp 93-95.
Ijere, J.A. and Kagu, A. (1998): “Environmental Degradation”, A Case Study of Bama Ridge Borno State, Annals of Borno Vol.13 & 14 (1996/97) pp 353-361.
Iwuagwu, C.J. (1991): “Bama Ridge: A Beach Ridge with a Difference”. Abstracts Volume of the Nigerian Mining and Geosciences Society Conference.
Kagu, A. (2008): Excavation on the Bama Ridge: A Socio-economic and Environmental Analysis, Unpublished Ph.D Thesis, Department of Geography, Usmanu Danfodiyo University Sokoto.
Monkhouse, F.J. and Small, J. (1979): A Dictionary of the Natural Environment, London: Edward Arnold Publishers Ltd.
Nyanganji, J.K. (1994): “The Morphology and Hydrography of the Ngadda Catchments and the Bama Beach Ridge”, Unpublished Ph.D. Thesis, Department of Geography, Bayero University Kano, Nigeria.
Seneviratne, H.M.M.B (1983): An Introduction to Landforms in Borno State”, Geographical Society Publication, Borno College of Education, Maiduguri Vol.2 pp 58-71.
Thambyahpillay, G.G.R. (1983): “Hydro geography of Lake Chad and Environs: Contemporary Historical and Palaeoclimatic”, Annals of Borno, Vol.1, University of Maiduguri Press pp 105-145.
Thiemeyer, H. (1992): “On the Age of the Bama Ridge, A New 14C Record from the Bama Ridge Near Konduga Area, Borno State, N.E Nigeria”, Annals of Borno, Vol.8/9 (1991/92) pp. 239-242.
Udo, R.K. (1990): Land Use Policy and Ownership in Nigeria, Lagos: Ebuakwa Ventures Ltd. Zarma, A.A. (1997): “Sedimentological Investigation of the Bama Ridge (Halocene) Exposed Around Maiduguri
Tchad Basin”, M.Sc. Thesis, Department of Geology, University of Benin. Zarma, A.A. (2000): “Petrographic Study of the Sandstones Exposed on the Bama Ridge Maiduguri”, Borno Journal
of Geology, an International Journal of Earth Sciences, Vol.2, No.2 pp. 65-77.
25
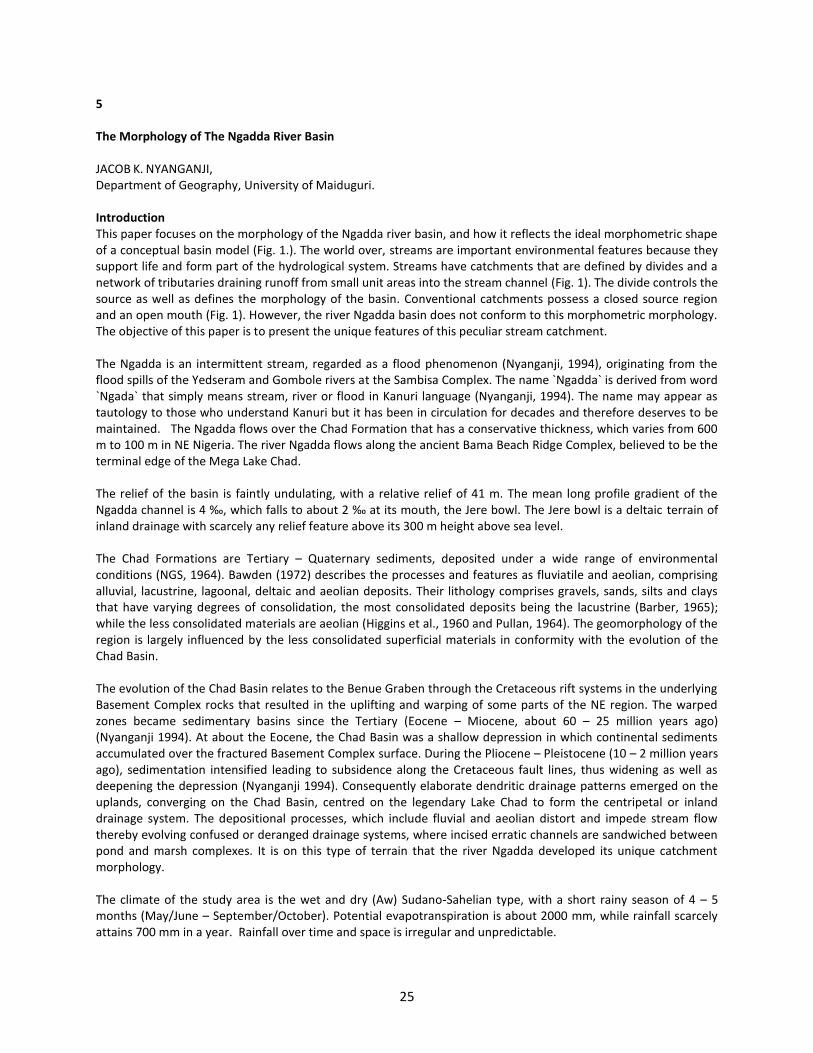
5 The Morphology of The Ngadda River Basin JACOB K. NYANGANJI, Department of Geography, University of Maiduguri. Introduction This paper focuses on the morphology of the Ngadda river basin, and how it reflects the ideal morphometric shape of a conceptual basin model (Fig. 1.). The world over, streams are important environmental features because they support life and form part of the hydrological system. Streams have catchments that are defined by divides and a network of tributaries draining runoff from small unit areas into the stream channel (Fig. 1). The divide controls the source as well as defines the morphology of the basin. Conventional catchments possess a closed source region and an open mouth (Fig. 1). However, the river Ngadda basin does not conform to this morphometric morphology. The objective of this paper is to present the unique features of this peculiar stream catchment. The Ngadda is an intermittent stream, regarded as a flood phenomenon (Nyanganji, 1994), originating from the flood spills of the Yedseram and Gombole rivers at the Sambisa Complex. The name `Ngadda` is derived from word `Ngada` that simply means stream, river or flood in Kanuri language (Nyanganji, 1994). The name may appear as tautology to those who understand Kanuri but it has been in circulation for decades and therefore deserves to be maintained. The Ngadda flows over the Chad Formation that has a conservative thickness, which varies from 600 m to 100 m in NE Nigeria. The river Ngadda flows along the ancient Bama Beach Ridge Complex, believed to be the terminal edge of the Mega Lake Chad. The relief of the basin is faintly undulating, with a relative relief of 41 m. The mean long profile gradient of the Ngadda channel is 4 ‰, which falls to about 2 ‰ at its mouth, the Jere bowl. The Jere bowl is a deltaic terrain of inland drainage with scarcely any relief feature above its 300 m height above sea level. The Chad Formations are Tertiary – Quaternary sediments, deposited under a wide range of environmental conditions (NGS, 1964). Bawden (1972) describes the processes and features as fluviatile and aeolian, comprising alluvial, lacustrine, lagoonal, deltaic and aeolian deposits. Their lithology comprises gravels, sands, silts and clays that have varying degrees of consolidation, the most consolidated deposits being the lacustrine (Barber, 1965); while the less consolidated materials are aeolian (Higgins et al., 1960 and Pullan, 1964). The geomorphology of the region is largely influenced by the less consolidated superficial materials in conformity with the evolution of the Chad Basin. The evolution of the Chad Basin relates to the Benue Graben through the Cretaceous rift systems in the underlying Basement Complex rocks that resulted in the uplifting and warping of some parts of the NE region. The warped zones became sedimentary basins since the Tertiary (Eocene – Miocene, about 60 – 25 million years ago) (Nyanganji 1994). At about the Eocene, the Chad Basin was a shallow depression in which continental sediments accumulated over the fractured Basement Complex surface. During the Pliocene – Pleistocene (10 – 2 million years ago), sedimentation intensified leading to subsidence along the Cretaceous fault lines, thus widening as well as deepening the depression (Nyanganji 1994). Consequently elaborate dendritic drainage patterns emerged on the uplands, converging on the Chad Basin, centred on the legendary Lake Chad to form the centripetal or inland drainage system. The depositional processes, which include fluvial and aeolian distort and impede stream flow thereby evolving confused or deranged drainage systems, where incised erratic channels are sandwiched between pond and marsh complexes. It is on this type of terrain that the river Ngadda developed its unique catchment morphology. The climate of the study area is the wet and dry (Aw) Sudano-Sahelian type, with a short rainy season of 4 – 5 months (May/June – September/October). Potential evapotranspiration is about 2000 mm, while rainfall scarcely attains 700 mm in a year. Rainfall over time and space is irregular and unpredictable.
Reproductive Health Indicators in selected Communities in Maiduguri, Jere and Bama LGAs: A Survey Report
26
Fig. 1: An ideal Catchment Morphology (Strahler, 1973). The catchment morphology The shape and size (881.2 km
2) of the Ngadda basin is presented in figure 2. It has a distinct morphology with an
open source region, a perforated western divide, a central constriction and a closed mouth region that forms the inland delta (Jere bowl). Compared to the conceptual model (Fig. 1 (Strahler, 1973 and McCullagh, 1978), the Ngadda morphology is unique. It contradicts the conventional model and defies stream ordering since it receives 99% of the discharge from spillages (Fig. 2). The unique features of the catchment morphology are the shape, source of water, and characteristic channel flow patterns. Methods Data for this paper were obtained mainly from the author’s Ph. D (Nyanganji, 1994) Thesis. Major sources of data were maps, air photographs and some field observations. Shape The shape comprises three conspicuous units: The source region (A), that opens towards the channels of the rivers Gombole and Yedseram where it terminates in conformity with law of watershed on the banks of the two rivers. Secondly there is the central constriction (B), which channels the discharge into the Ngadda inland delta (C) or the Jere bowl, which serves as a natural reservoir of the discharge. Source region and catchment components One unique attribute of this catchment is its open source region, created by the termination of the divide on the banks of the Gombole and Yedseram rivers. This shows the attachment and the dependence of the Ngadda flow on the two streams. The open area allows spillage to ‘pour’ (siphoned) into the Ngadda channel from the floods of the Yedseram and Gombole rivers (Fig. 2). From figure 2 the following units are clearly discernible. They are (1) the collection region which serves as the “funnel” – siphon system, (2) the conveyance units (channels) or ‘necks’ and (3) the reservoir or deltaic zone (storage units). The source of the river is largely a function of flood magnitudes of the Yedseram and Gombole rivers, induced by climatic factors and human activities like deforestation, perpetuated mainly through farming, over grazing, fuel-
Issues in the Geography of Borno State.
)
27
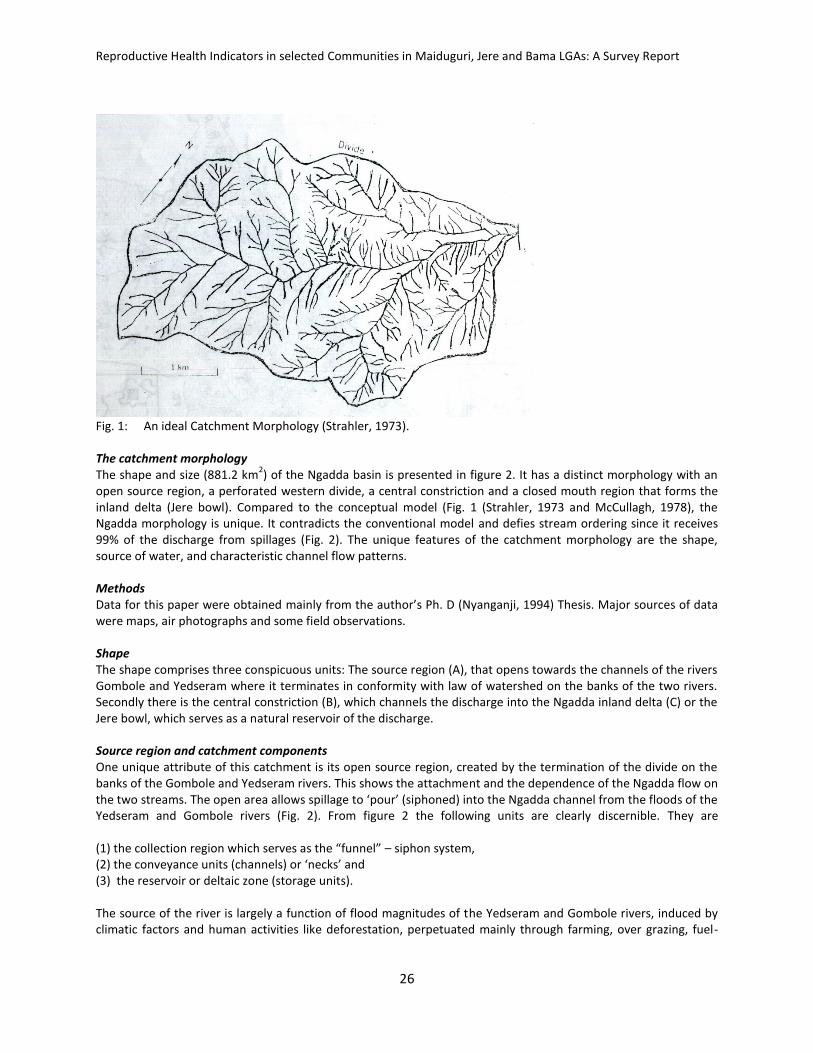
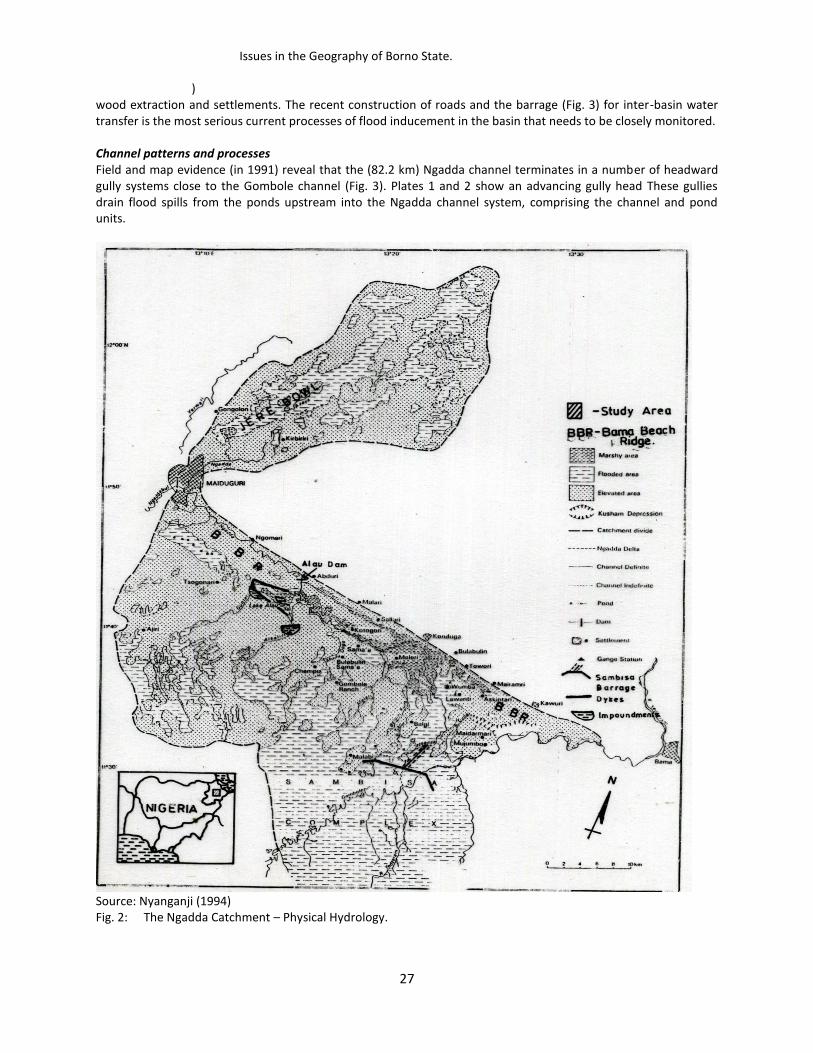
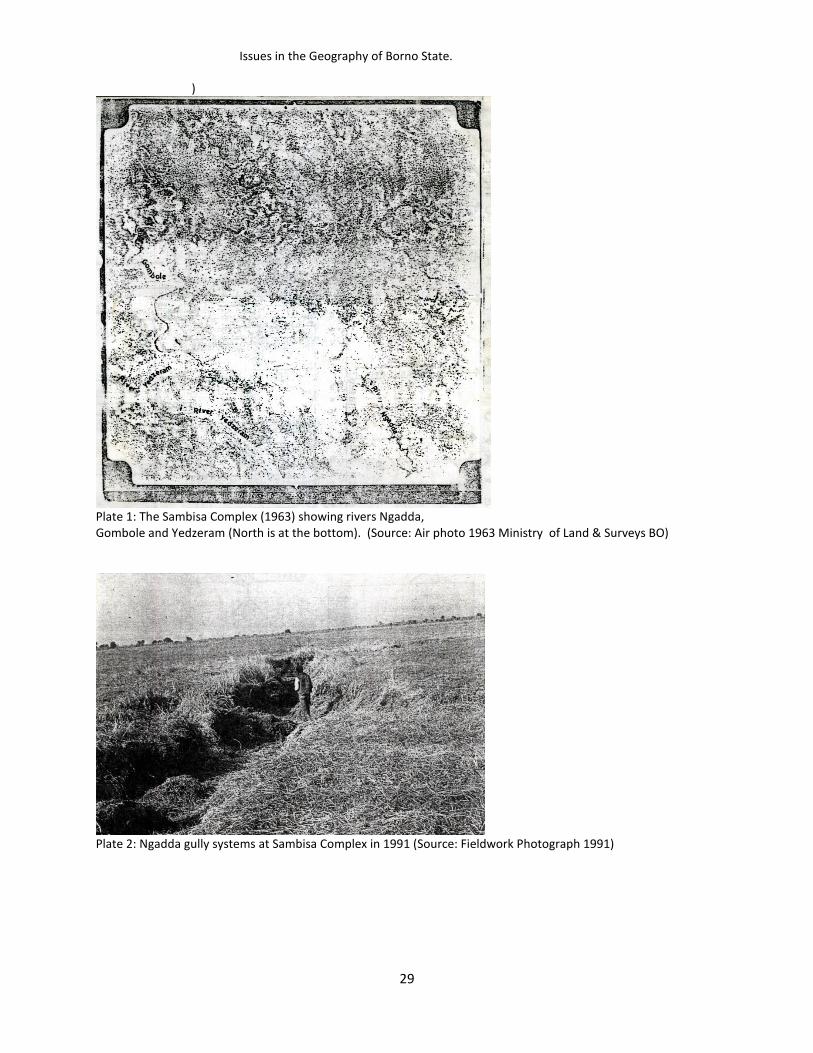
wood extraction and settlements. The recent construction of roads and the barrage (Fig. 3) for inter-basin water transfer is the most serious current processes of flood inducement in the basin that needs to be closely monitored. Channel patterns and processes Field and map evidence (in 1991) reveal that the (82.2 km) Ngadda channel terminates in a number of headward gully systems close to the Gombole channel (Fig. 3). Plates 1 and 2 show an advancing gully head These gullies drain flood spills from the ponds upstream into the Ngadda channel system, comprising the channel and pond units.
Source: Nyanganji (1994) Fig. 2: The Ngadda Catchment – Physical Hydrology.

Reproductive Health Indicators in selected Communities in Maiduguri, Jere and Bama LGAs: A Survey Report
28
Source: Map & Fieldwork Nyanganji (1994) Fig. 3: The Sambisa Complex in relation to rivers Yedzeram, Gombole and Ngadda.
Issues in the Geography of Borno State.
)
29
Plate 1: The Sambisa Complex (1963) showing rivers Ngadda, Gombole and Yedzeram (North is at the bottom). (Source: Air photo 1963 Ministry of Land & Surveys BO)
Plate 2: Ngadda gully systems at Sambisa Complex in 1991 (Source: Fieldwork Photograph 1991)
Reproductive Health Indicators in selected Communities in Maiduguri, Jere and Bama LGAs: A Survey Report
30
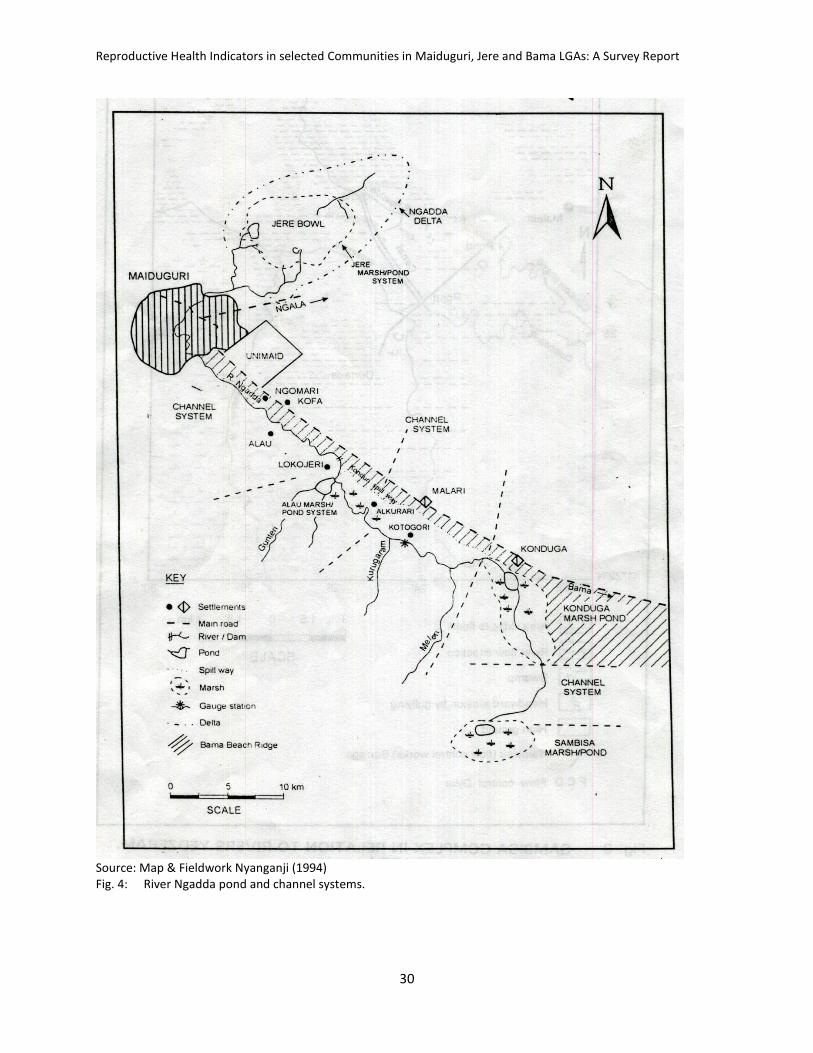
Source: Map & Fieldwork Nyanganji (1994) Fig. 4: River Ngadda pond and channel systems.
Issues in the Geography of Borno State.
)
31
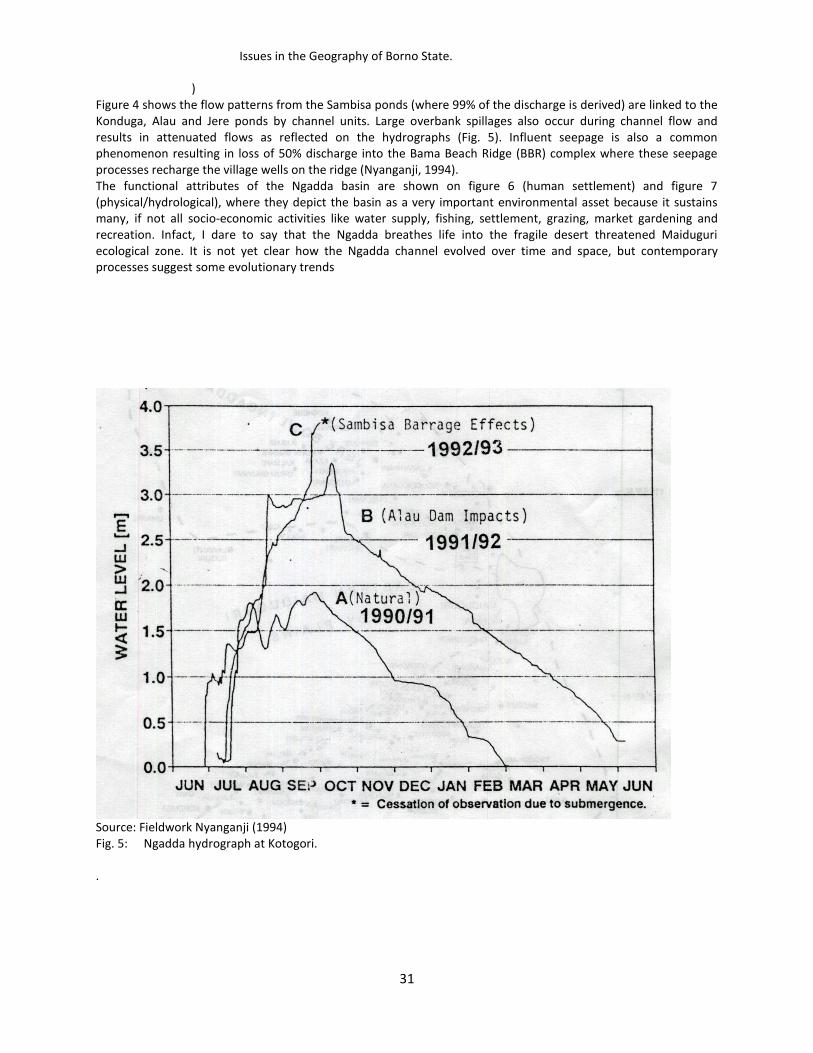
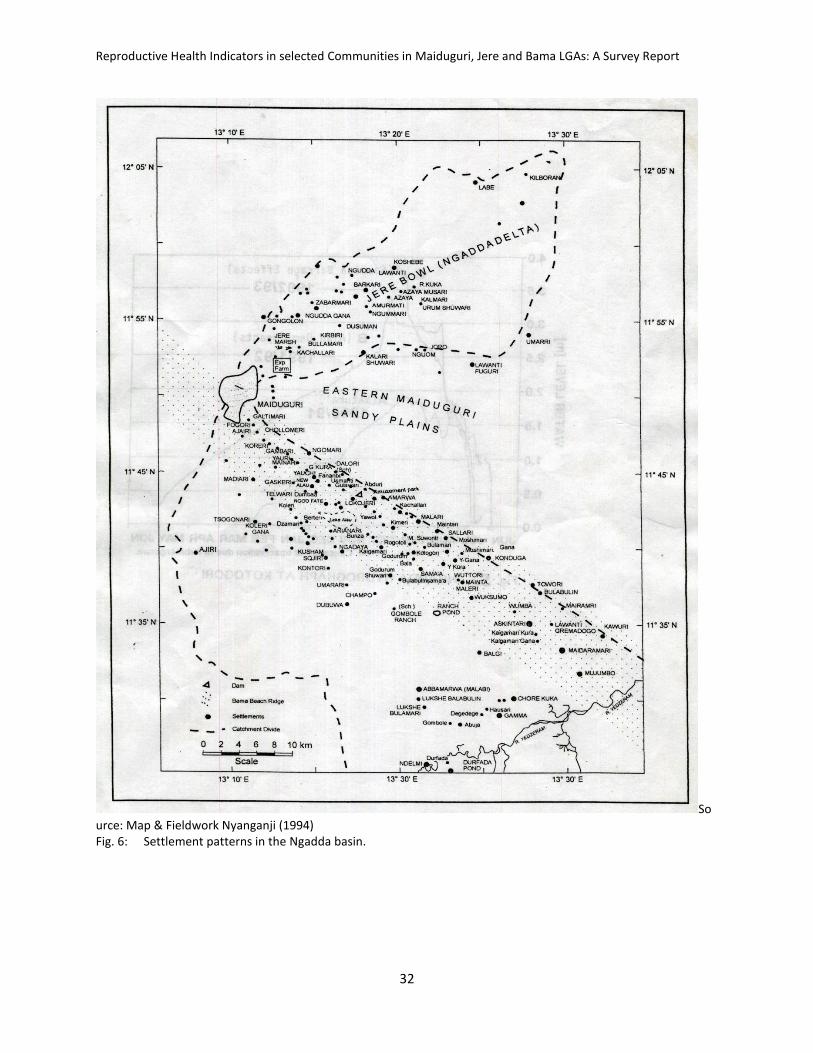
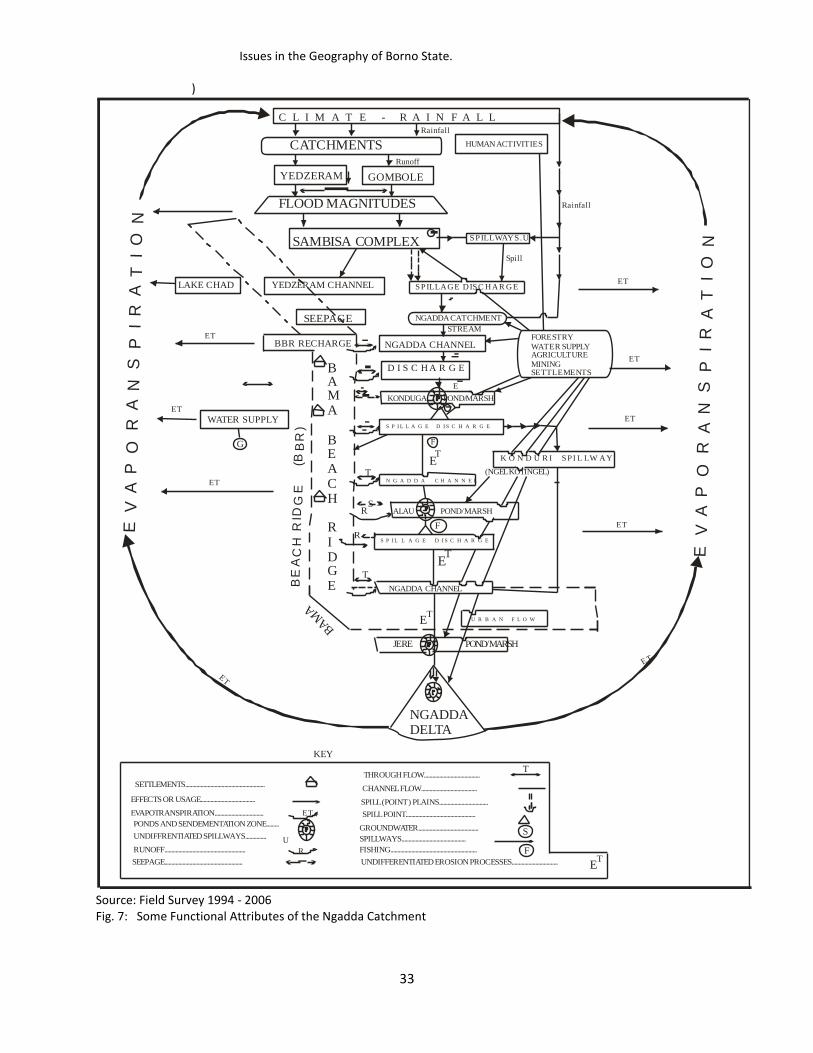
Figure 4 shows the flow patterns from the Sambisa ponds (where 99% of the discharge is derived) are linked to the Konduga, Alau and Jere ponds by channel units. Large overbank spillages also occur during channel flow and results in attenuated flows as reflected on the hydrographs (Fig. 5). Influent seepage is also a common phenomenon resulting in loss of 50% discharge into the Bama Beach Ridge (BBR) complex where these seepage processes recharge the village wells on the ridge (Nyanganji, 1994). The functional attributes of the Ngadda basin are shown on figure 6 (human settlement) and figure 7 (physical/hydrological), where they depict the basin as a very important environmental asset because it sustains many, if not all socio-economic activities like water supply, fishing, settlement, grazing, market gardening and recreation. Infact, I dare to say that the Ngadda breathes life into the fragile desert threatened Maiduguri ecological zone. It is not yet clear how the Ngadda channel evolved over time and space, but contemporary processes suggest some evolutionary trends
Source: Fieldwork Nyanganji (1994) Fig. 5: Ngadda hydrograph at Kotogori. .
Reproductive Health Indicators in selected Communities in Maiduguri, Jere and Bama LGAs: A Survey Report
32
Source: Map & Fieldwork Nyanganji (1994) Fig. 6: Settlement patterns in the Ngadda basin.
Issues in the Geography of Borno State.
)
33
C L I M A T E - R A I N F A L L
CATCHMENTS HUMAN ACTIVITIES
GOMBOLE
YEDZERAM CHANNEL
NGADDA CHANNEL
D I S C H A R G E
WATER SUPPLYS P I L L A G E D I S C H A R G E
S P I L L A G E D I S C H A R G E
N G A D D A C H A N N E L
SPILLWAYS.U
SPILLAGE DISC HAR GE
YEDZERAM
LAKE CHAD
BBR RECHARGE
SEEPAGE NGADDA CATCHMENT
FORESTRY
WATER SUPPLYAGRICULTURE
MININGSETTLEMENTS
SAMBISA COMPLEX
FLOOD MAGNITUDES
NGADDA CHANNEL
SETTLEMENTS.........................................................
UNDIFFERENTIATED EROSION PROCESSES.................................
FISHING..............................................................
SPILLWAYS..............................................
GROUNDWATER...........................................
SPILL POINT..................................................
SPILL (POINT ) PLAINS...................................
CHANNEL FLOW........................................
THROUGH FLOW........................................
SEEPAGE........................................................
RUNOFF..........................................................
UNDIFFRENTIATED SPILLWAYS...............
PONDS AND SENDEMENTATION ZONE.........
EFFECTS OR USAGE.......................................
EVAPOTRANSPIRATION...................................
(NGEL KOTINGEL)
K O N D U R I SPI L LW AY
U R B A N F L O W
KONDUGA POND/MARSH
F
F
F
S
ALAU POND/MARSH
JERE POND/MARSH
BAMA
BEACH
RIDGEB
EA
CH
RID
GE
(BB
R)
E V
A P
O R
A N
S P
I R
A T
I O
N
E V
A P
O R
A N
S P
I R
A T
I O
N
BAM
A
ET
U
E
R
KEY
ET
ET
ET
E T
ET
ET
ET
ET
ET
NGADDADELTA
T
SR
R
T
T
T
ET
ET
ET
E
STREAM
Rainfall
Runoff
Spill
Rainfall
G
Source: Field Survey 1994 - 2006 Fig. 7: Some Functional Attributes of the Ngadda Catchment
Reproductive Health Indicators in selected Communities in Maiduguri, Jere and Bama LGAs: A Survey Report
34
The probable Evolution of the Ngadda channel Some contemporary channel processes seem to suggest the likely trends in the evolution of the Ngadda channel. It appears that after the retreat of the Mega Lake Chad and consequently the withdrawal of the water table in the vicinity of the BBR, the Jere bowl must have assumed the new base level of channel (rill and gully) erosion into the BBR Complex. Such channel processes through headscarp recession aided by the BBR relief could have facilitated channel elongation southward to eventually link up with flood spill discharging into the BBR complex. This probably explains why the Ngadda channel breaks through the BBR at Maiduguri where the relief is highest (338 m ASL west of the University of Maiduguri). It is also here that the stream has incised its course by about 10 m into the BBR. In the vicinity of the high relief area, elaborate gully systems like the Galtimari and the Chollomeri gullies situated north and south of the region respectively are still extending their channel network westward through headscarp recession into the old GRA (Government Reservation Area). Conclusion The morphology of the Ngadda catchment sharply contrasts ideal or conceptual catchment morphology. This is because it has an open source region, a constricted mid section and a closed mouth. Since the stream largely depends on flood magnitudes of the Yedseram and Gombole rivers, it is referred to as an “appended catchment”. The Ngadda channel morphology reveals a pond and channel system where large overbank spillages result in attenuation flow and influent seepages. The Ngadda channel is strongly suspected to be a post Mega Chad watercourse that evolved through the process of headward channel erosion initiated by the new base level of erosion at the Jere bowl after the retreat of the Mega Lake Chad. Acknowledgement: I am most grateful to Dr. Maren. M. Gumnior for her valuable intellectual and material contributions during the preparation of this paper.
0100200300400500600700800
Ra
infa
ll A
mo
un
ts (
mm
)
Years of Rainfall
Data Source: Borno state Water Corporation Fig.1 Maiduguri Rainfall 1983 – 1996
Issues in the Geography of Borno State.
)
35
References Barber, W. (1965). Pressure Water in the Chad Formation of Bornu and Dikwa Emirates, North-eastern Nigeria Bull. Geol. Surv. Niger. No. 35 Bawden, M. G. (1972). Physiography, Geology and Geomorphology. In: Aitchison, P. J., Bawden, M. G., Carroll,
P. E., Glover, K., Klinkenberg, P. N., de Leeuw and P. Tuley (1972). The Land Resources of North East Nigeria, Vol. 1 The Environment. Land Res. Study No. 9, Land Resource Division, Tolworth Tower, Surbiton, Surrey, England. Pp. 43-83.
Higgins, G. M., Ramsay, D. M., Pullan, R. A. and de Leeuw, P. N. (1960) Report on Reconnaissance and semi detailed Soil Survey undertaken in north east Bornu. Samaru Soil Survey Bull. No. 14
McCullagh, P. (1978). Modern Concepts in Geomorphology Oxford Univ. Press, Oxford pp. 16-34 Morisawa, M. (1968) Streams: their Dynamics and Morphology McGraw, Hill, New York 175 pp NGS (Nigeria Geology Survey Dept) (1964) Geological Map of Nigeria Lagos, Federal Surveys Nyanganji, J. K. (1994) The Morphology and Hydrography of the Ngadda Catchment and the Bama Beach Ridge
(BBR) Ph. D. Thesis, Bayero University Kano. Pullan, R. A. (1964) The Recent Geomorphological Evolution of the South Central Part of the Chad Basin J. W.
Afr. Sci. Ass. 9. pp. 115-139 Strahler, A. N. (1973). Introduction to Physical Geography (3
rd Edn) John Wiley & Sons, New York p. 149

36
6 Landforms and Settlement Patterns in Kwajaffa District, Biu Plateau JOHN ABDULLAHI Department of Geography, University of Maiduguri JACOB K NYANGANJI Department of Geography, University of Maiduguri Introduction Man – nature (physical environment) relationship is a two way affair. This is because man affects his environment as he responds to the changing conditions set by the environment and the environment responds to human manipulation, thereby, creating a state of dynamic equilibrium that over space and time, (Mikesell, 1974). From a broad perspective, the environment consists of three realms; the realms of nature, the realm of man and the realm of nature and man. The realm of nature refers to physical attributes of the environment that includes their basic processes of evolution. For instance, the air, water and landform are considered necessary for assessing the land capability of a given region for human use. The human realm is the most widely seen and recognized feature of the environment and depicts man’s direct attempt to influence the environment through socio – economic activities such as crop cultivation, settlement, transport, population, culture, grazing and bush burning among others. The third realm, the realm of nature and man refers to the area where man and nature interact and influence each other in the process. It is this interaction that this study examined, focusing on the relationship between landforms and settlement patterns in Kwajaffa district, Hawul local government area of Borno state. For a total view of the human environment, it is imperative that a through knowledge of the physical factors that complement the social and cultural factors of the nature – man relationship be investigated. To investigate the environment fully, constant measurements of variables and regular evaluation of environmental factors are important for sustainable development of the natural and human resources. This section examines the influence of landforms on land use and settlement patterns in Kwajaffa district, with the following specific objectives: Identify and describe the landforms and types of land use; Describe the settlement distribution pattern using nearest Neighbour Analysis (NNA) statistics and to Relate the settlement patterns to the landforms. Study area Kwajaffa district forms part of Biu Plateau in the Southern part of Borno State bordering Adamawa State. The mean elevation of Biu Plateau is about 460 m asl. In some parts the heights are much higher than this especially around Miringa Volcanic zone. Some volcanic peak rise above this level. The low area can be found along the river Hawul, bordering Adamawa State. Kwajaffa is drained by river kirbutu and zur. The tributaries of these two streams are mainly seasonal streams. They record high discharge during the months of July and August. The streams with their tributaries drain into the Hawul, the major tributary of the Gongola River. The area has a sub-humid climate, that is strongly influenced by two distinctive air masses, namely the South Westerly tropical maritime air mass which brings the wet season for about six months (April/May to October) and the tropical continental air mass originating from the North East of the Sahara, resulting in dry season or harmattan, between November to March. The rainfall in the area is undoubtedly a very important environmental variable, that impact on geomorphic processes and related human activities. The soils of the area are derived mainly from the weathering of the Biu basalt as the major parent material. According to (Davies, 1954 and Ayuba, 2005) the soil of the Kwajaffa district are shallow but are very fertile. The vegetation of Kwajaffa belongs to the guinea savannah type (Udo, 1970), and appears to be in equilibrium with
Issues in the Geography of Borno State.
)
37
the environmental factors of climate, soil, rainfall, and human interference. Man’s socio-economic activities such as land cultivation, bush burning, over grazing, fuel wood exploitation as well as constructional activities contributes immensely to the degradation and deterioration of the vegetal resources such that the climax vegetation is difficult to attain in any part of the area. The seasonality of rainfall and its spatial distribution is reflected in the nature of height and density of vegetation species. In the dry season, trees shed their leaves to reduce evapotranspiration and grasses dry up completely. The common tree species includes; Anageisus leicarpus (marke), Terminalia avicenioides (Baushe), Terminalia lariflora (Kishi), comniphora africana (Dashi) and Adansonia digitata (Kuka). Among the grasses that are commonly found are Andropogan gayanus (gamba grass) and chinchona. The Biu Plateau is made up of Babur- bura, Bura, Hausa, Igbo, Fulani, Chibok and Hona. Most of the Babur – bura and Bura people are farmers while others are either civil servants and a fewer business men. Kwajaffa district is mostly populated by Bura and Babur - bura people who constitute about 80% of the total population of the area (Davies, 1954). That is why the area is divided into two and called Kwajaffa Bura and Kwajaffa Babur respectively. The major economic activity of the larger population of the people is subsistent agriculture that is made possible by the fertile volcanic soil that supports crop cultivations hence about 90% of the total population are farmers. Other ethnic groups like the Hausa migrated into the area to practice irrigation farming along the stream especially on the Hawul flood plane during the dry season (Balami, 1987). Major cash crops grown includes beans (cowpea), groundnut (Arachis hypogea), and cotton (Gossypium spp), while the food crops includes maize (zea mays), Guinea corn (sorghum), Rice (oriza sativa), Cassava (manihot esculentus) and pepper. The vegetable and fruits cultivated includes tomatoes (lycoperiscum esculentus), orange (citrus), pawpaw (carica papaya), and cabbage (lettuce), Banana (Musa spp) and Mango (mangifera indica) The types of agricultural practice include mixed farming, crop rotation, mixed cropping and terrace farming. Methods Data for the study were generated through both primary and secondary sources. The primary data were obtained from 50 structural questionnaires, administered on 50 purposively selected respondents, resident in 10 randomly chosen settlements. The secondary sources of information were extracted from landuse map and Shani 1:50,000 topographical sheets. The cross – profiles along chosen lines (latitudes and Longitudes). (Fig. 1) facilitated identification and description of the landforms, types of landuse, and compilation of settlements distribution map (Fig.2) of the area, using the location of the settlements on maps, distance between them were obtained (Table 1)and used in computing Nearest Neighbour Analysis statistics of Christaller (1933). The general distribution of settlements in the area is described by the Nearest Neighbour Analysis using the values in table 1 and substituting them with the variables presented in the Nearest Neighbour Analysis formula below: Rn = 2 d N A
Where Rn is the Nearest Neighbour value Where A is the size of the study area. N is the number of selected settlements and d is the mean distance between the settlements. The Rn value ranges from 0 to 2.15. A value of 0 indicates a situation where all the settlements occupy the same location or space, which is not obtainable in the physical landscape. A value of 1.0 indicates that the phenomena are randomly distributed while the value of 2.15 indicates a situation where the settlements are regularly distributed and have maximum spacing which is only obtainable under pre planned environment.
Hence, when d = 8.6, N = 10 and A =3422.25km2
Rn = 2 x 8.6 _10___ 3422.25
Thus, Rn = 17.2 x 0.05 Rn =0.90
Reproductive Health Indicators in selected Communities in Maiduguri, Jere and Bama LGAs: A Survey Report
38
TABLE: 1.DISTANCE OF NN OF SETTLEMENTS
S/No NAME OF SETTLEMENT DISTANCE IN km
1 Debiro – Shaffa 8
2 Shaffa – Pelachiroma 4
3 Pelochiroma – Kogumagera 26
4 Kogumagera – Kogu 11
5 Kogu – Puba 6
6 Puba – Kwajaffa Pabur 6
7 Kwajaffa Pabur – Gangaran 8
8 Gangaran – Pelamindi 8
9 Pelamindi – Bouva 5
10 Bouva – Dsebiro 4
Source: Fieldwork, (1997) Total = 86 = 9.8 km Results and discussion: As shown on table 2, Fig 1 and 2 the location and pattern of land use and settlements are influenced by several physical and human factors. Among the physical factors, landform is basic and central to human settlement and his activities anywhere on the globe because man is basically a terrestrial animal and all his socio-economic endeavour are tied to the landform factors and its associated resources. The landform provides the basis for settlements, soils for farming, vegetation for grazing, fuel wood and building materials, water supply, mining hunting and fishing grounds, recreation and religious places, among others. The landforms influence land use and settlement patterns and distribution through their various configurations, as characterized by the slopes. Therefore, the settlements patterns and distribution of human activities are largely a reflection of the morphologies of the landforms and the opportunities it offers for the various human socio – economic activities in Kwajaffa district. Land use in the area is estimated as: Residential (2%), Farmlands (83%), Bush Fallow (7%), Grazing land (4%), Forest Reserve (3%) and others (1%). The landform and associated land resources therefore offer an opportunity for man – nature relationship in the study area. Relief And Settlement As shown on Figs. 1 and 2, the distribution of settlements shows that 28 settlements are sited on relief unit between 305 – 610mn (Zone B). (Table 2). TABLE 2: SETTLEMENT DISTRIBUTION ON RELIEF ZONES
S/N Relief Units No of Settlements
1 Above 610m (Zone A) 6
2 305 – 610m (Zone B) 28
3 Below 305m (Zone C) 2
Source: Filed Work 1998. This suggest that people tend to settle more on this relief zone for the advantages it offers for their various socio – economic activities, such as farming, transportation and communication, water supply etc. Landform Features. Landform units in the area have been classified into 3 distinctive relief zones (Fig 4). The information on fig, 1 and 2 reveal some interesting relationship between land use, settlements and topography. Fig 4 and table 2 reveals that 77 percent of the settlements are sited on relief zone B, 17 percent on relief zone A and only 6 percent on relief zone C respectively. The distribution shows that more settlements are located on the relief Zone C unit. Basic landforms on this volcanic terrain are the knolls superimposed on the undulating plateau surface that is fairly flat in some places and highly dissected in other parts. On the dissected topography, streams are incised into the terrain creating steep sided valley slopes of 10
0 - 20
0 with the stream channel entrenching at the narrow valley
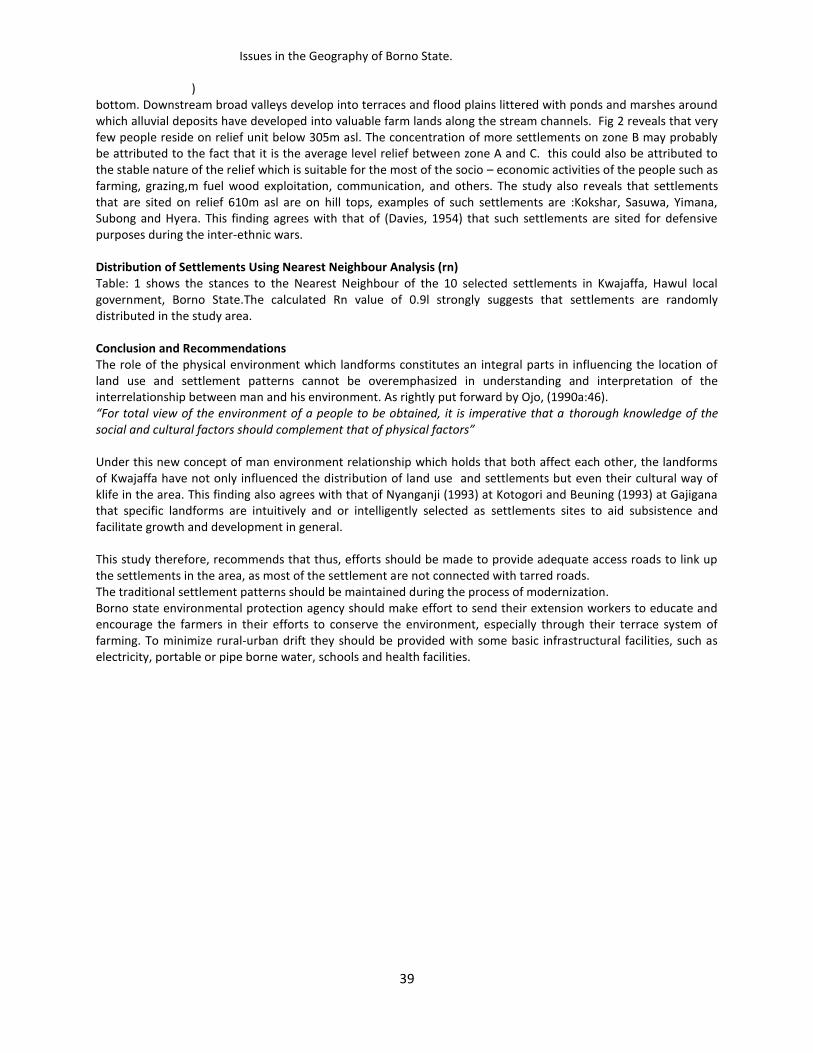
Issues in the Geography of Borno State.
)
39
bottom. Downstream broad valleys develop into terraces and flood plains littered with ponds and marshes around which alluvial deposits have developed into valuable farm lands along the stream channels. Fig 2 reveals that very few people reside on relief unit below 305m asl. The concentration of more settlements on zone B may probably be attributed to the fact that it is the average level relief between zone A and C. this could also be attributed to the stable nature of the relief which is suitable for the most of the socio – economic activities of the people such as farming, grazing,m fuel wood exploitation, communication, and others. The study also reveals that settlements that are sited on relief 610m asl are on hill tops, examples of such settlements are :Kokshar, Sasuwa, Yimana, Subong and Hyera. This finding agrees with that of (Davies, 1954) that such settlements are sited for defensive purposes during the inter-ethnic wars. Distribution of Settlements Using Nearest Neighbour Analysis (rn) Table: 1 shows the stances to the Nearest Neighbour of the 10 selected settlements in Kwajaffa, Hawul local government, Borno State.The calculated Rn value of 0.9l strongly suggests that settlements are randomly distributed in the study area. Conclusion and Recommendations The role of the physical environment which landforms constitutes an integral parts in influencing the location of land use and settlement patterns cannot be overemphasized in understanding and interpretation of the interrelationship between man and his environment. As rightly put forward by Ojo, (1990a:46). “For total view of the environment of a people to be obtained, it is imperative that a thorough knowledge of the social and cultural factors should complement that of physical factors” Under this new concept of man environment relationship which holds that both affect each other, the landforms of Kwajaffa have not only influenced the distribution of land use and settlements but even their cultural way of klife in the area. This finding also agrees with that of Nyanganji (1993) at Kotogori and Beuning (1993) at Gajigana that specific landforms are intuitively and or intelligently selected as settlements sites to aid subsistence and facilitate growth and development in general. This study therefore, recommends that thus, efforts should be made to provide adequate access roads to link up the settlements in the area, as most of the settlement are not connected with tarred roads. The traditional settlement patterns should be maintained during the process of modernization. Borno state environmental protection agency should make effort to send their extension workers to educate and encourage the farmers in their efforts to conserve the environment, especially through their terrace system of farming. To minimize rural-urban drift they should be provided with some basic infrastructural facilities, such as electricity, portable or pipe borne water, schools and health facilities.
Reproductive Health Indicators in selected Communities in Maiduguri, Jere and Bama LGAs: A Survey Report
40
REFERENCES Ayuba, H.K. (2005) Environmental Science: An introductory Text. Loud Books Publishers, Ibadan, Nigeria. Balami, I. (1987) Constraints to agricultural development in Biu Local government Area. B.Sc Thesis A.B.U Zaria Pp. 23 - 35 Breuning, P. (1993)”Gajiganna” New data on early settlement and Environment in the Chad Basin. In Journal of Social Science. University of Maiduguri. Christaller, W (1933) “Nearest Neighbour Analysis” in Gregory, S. (1963) Statistical Methods and the Geogrphers. Longman Group Ltd London. Davies, J.G. (1954) The Biu Book. Gaskiya Corporation, Zaria. Mikeselb M.W. (1974) “Geogeaphy as a study of environment: an assessment of some old and new commitments in I. R. Manners & M. W. Mikesell (eds) Perspectives on Environment. Association of American Geographers Publication. Nyanganji, J.K. (1993) Landform, Land use and settlement patterns In the Ngadda catchment. A contemporary perspective of Kotogori Environment. Arch. Association of Nigeria Ann. Conf. CTSS, Unimaid, 29/11/1/12/1993. Ojo, G.J.A. (1990b), Geography in contemporary society. In B. Ayeni and A. Faniran (eds) Geographical perspectives 81- 93 (1972 Presidential Address). Udo, R. K (1970) Geographical Regions of Nigeria Hienemann, Ibadan

Issues in the Geography of Borno State.
)
41
Reproductive Health Indicators in selected Communities in Maiduguri, Jere and Bama LGAs: A Survey Report
42
SECTION THREE ECONOMIC ISSUES
43
7 Agriculture, Cultural Interplay and Environmental Degradation on the Shores of the Lake Chad BABA GANA JUGUDUM KABIR Department of Crop Protection, University of Maiduguri. ABBA KAGU Department of Geography, University of Maiduguri. FATI A. K. YERIMA Federal Ministry of Environment, Maiduguri Zonal Office Introduction Agriculture, the production of crops and animals for human consumption, is perhaps the oldest profession known to man. The Kanem Borno Empire of yonder was successful largely due to, in addition to other factors, the suitability of the Kanem area for viable agricultural activities and the farming prowess of the then populace inhabiting the shores and basin of the Lake Chad. The Lake Chad is the largest lake in West Africa, fourth largest in Africa (LCBC, 2005), and the seventh largest in the world (Daily Trust, 2007). Located between latitude 6
0 and 24
o N and longitude 7
o and 24
o E, it covers an
area of 27,000km2
The lake covers Borno and Yobe states in Nigeria, and the Republics of Chad, Niger and Cameroon, (Gambo et al., 2007). Lying strategically at the edge of the Sahara desert, the present Lake Chad is a remnant of a far larger Lake known to history as the “Mega-Chad”, (Mohammed, 2002). The size of the lake has increased and decreased overtime, and currently stands at 1,500 km
2 due to environmental degradation.
(Connah, 1981; UNEP, 2004). The Lake Chad because of its unique location in the heart of this zone has provided sustenance to fishermen, pastoralist and agriculturalist living on its shores and remained a focal point for the intermixture of people and cultures for centuries (Tijani, 1980). Agriculture is the main economic activity of approximately 60% of the basin population. Crops cultivated in the region includes maize, cotton, beans, groundnuts, sorghum, cassava, millet, rice, onions and vegetables. Most of the farming in the drainage basin is rain-fed, harvested by hand and cultivated without the use of fertilizers and other agro-chemicals. Mixed cropping is widely practiced and rice is grown using both traditional and modern methods (Odada, et al, 2005). For thousands of years it has been a centre for trade and still remains a focal point for intermixture of peoples and culture. Being one of Africa’s largest fresh water lakes, the Lake Chad provides vital source of water to human, livestock and wildlife communities. The lake presently supports a growing human population, as well as millions of birds and a number of mammals, reptiles and amphibians, despite the fact that its potential evaporation rate is four times as large as the rainfall in the region (Jauro,2006). However, due to the devastating droughts experienced in the region for the past decades, the lake has shrunk dramatically in the last 40 years (Odada et al; 2005). During this period the open water surface has reduced from approximately 25,000 sq. km in 1973 to less than 2,000 sq. km in 1990 (UNESCO, 2007). The massive shrinkage of the lake has considerably affected agricultural systems, leading to adaptive changes in farming and fishing practices. This further led to serious degradation of the environment resulting in disappearance of many valuable plant and fish species, wildlife species, and the reduction of canopy cover. The Nigerian part of the drainage basin has an irrigation potential of 1.16 million hectares, however at present, less than 115,000 hectares are actually irrigated due to the lowering of the water level and of the reduced inflow of its main rivers (FAO 1997). The intense competition between different land and water users, notably, upstream and downstream, crop farmers and nomadic herdsmen, urban water and irrigation water etc. has become profound. (Odada et al; 2005). Social tensions have also been further provoked by the increased pressure on resources due to
Reproductive Health Indicators in selected Communities in Maiduguri, Jere and Bama LGAs: A Survey Report
44
migration of people from drought shrike areas of the basin (Anonymous, 2003). In cognizance of the socio-economic importance of the Lake Chad the present study was undertaken to appreciate agricultural production activities, prospects and problems at the sores of the lake, with a view of providing useful information required for identifying research needs, interventions, increased production and sustainable development. Methodology Data were collected from farming communities around Doron Baga area of Kukawa Local Government in 2005, employing interview schedules and open ended questionnaires. Simple random sampling technique was used to select fifty farmers out of the mapping frame of whole farmers on the shores of the Lake. While the area may not be representative of the entire shore of the lake, it could be dependable indicator of the agricultural and socio-economic activities as well as of the major problems encountered. Characteristics of Doron Baga Area. Doron Baga is fish port situated at the outskirt of Baga Kauwa on the shore of the Lake in Kukawa Local Government Area of Borno State. It lies on latitude 12
o 55’ N and longitude 13
o 35’ E. The major occupation of
the people is agriculture, particularly, the growing of horticultural crops in the dry season and fishing. The “Baga” fish is known all over the country and forms a great item of internal trade between Borno and other States. The dominant ethnic group is Kanuri, however a sizeable number of Hausa, Fulani, Igbo, Yoruba and other international tribes from Chad, Niger, Cameroon, and other African countries all co-exist by the lake. The vegetation is Sahel savanna, with mainly grasses, shrubs and few trees. The area experiences long dry season between November-May, a short rainy season between June- September, and a cold harmattan period between December-February. Annual rainfall ranges from 500-1000mm, with an average temperature range of 25-40
oC (BOSG, 2007).
Socio-Economic Importance of Lake Chad The local economy is based on agriculture, fishing and pastoralism. Agricultural practices include rain fed farming, irrigation and dry season farming. Major crops grown are cereals such as maize, millet, sorghum, wheat and rice, legumes such as cowpea, groundnut and Bambara groundnut coupled with vegetables such as okra, roselle, tomatoes, pumpkins, potatoes, peppers, onions, watermelon and cucumber. More than 150,000 fishermen live on the lakes shore and its islands. Many of them originate from well beyond the riparian region, sometimes from as far as Ghana. Over 100 species of fish have been recorded from the upper Chari system, while over 120 species are known from the lake itself and the lower reaches of the Chari River. The current estimate of fish production from the lake is 60,000 – 70,000 tonnes in 2000/2001. Fisheries make an important contribution to the regional economy of the Lake Chad Basin. The fisheries provide employment, income and food for over 10 million people. The annual trade in fish products is currently worth over US$ 24 million dollars. The fish trade supplies food to urban markets in all the riparian countries, especially Nigeria, and also generates secondary employment for fish-sellers and transporters (FAO, 2005, LCBC, 2005; Sarch, 2001). Raising of cattle, sheep and camel by the local as well as nomadic herders is also economically important together with the cultivation of traditional crops. The common system is lake-bottom cropping or receding moisture cultivation which has been a response to the contraction of the lake. Some villagers have shifted from relying entirely on fishing to farming the emergent lake floor as the flood water recedes (Landebergue, 2005).Both the lake and the Chari flood-plains support a rich terrestrial and aquatic fauna. The region is also notable for the Kuri cattle a domesticated breed of Bos taurus longifrons at risk of extinction. Lake Chad is on a major migration route for birds moving between Africa and the Palearctic. At least 70 species of bird make stopovers each year, especially Pintail Anas acuta (about half a million),
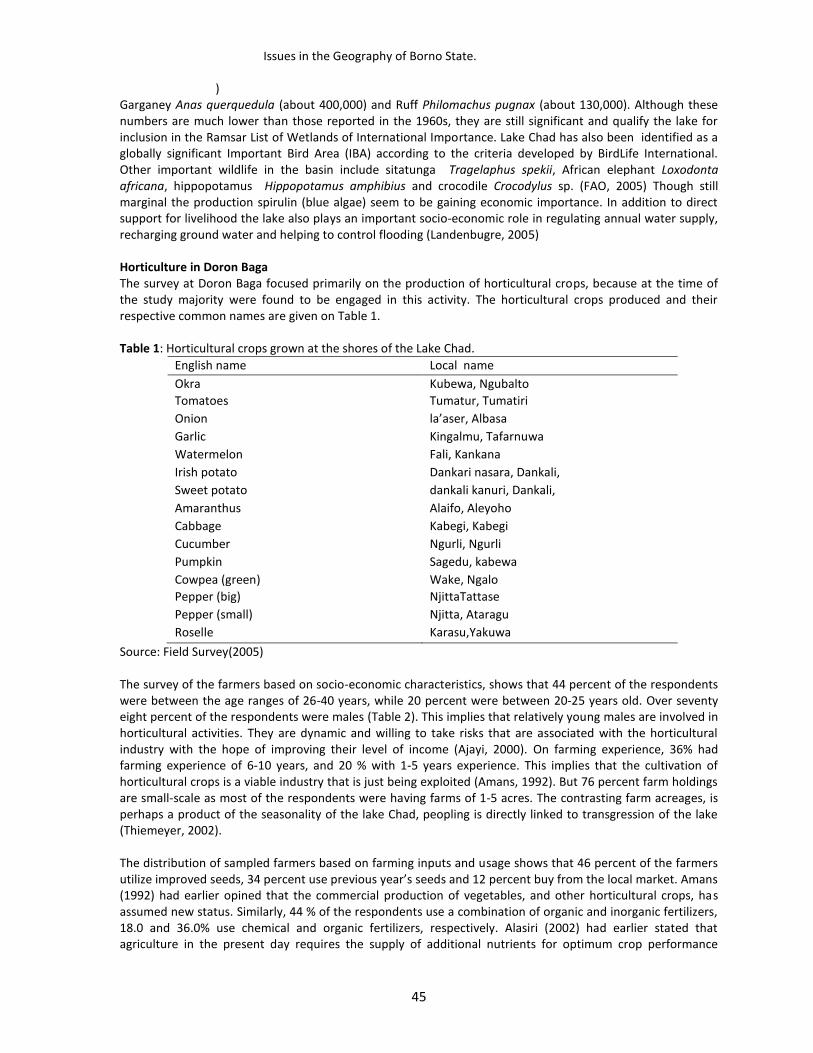
Issues in the Geography of Borno State.
)
45
Garganey Anas querquedula (about 400,000) and Ruff Philomachus pugnax (about 130,000). Although these numbers are much lower than those reported in the 1960s, they are still significant and qualify the lake for inclusion in the Ramsar List of Wetlands of International Importance. Lake Chad has also been identified as a globally significant Important Bird Area (IBA) according to the criteria developed by BirdLife International. Other important wildlife in the basin include sitatunga Tragelaphus spekii, African elephant Loxodonta africana, hippopotamus Hippopotamus amphibius and crocodile Crocodylus sp. (FAO, 2005) Though still marginal the production spirulin (blue algae) seem to be gaining economic importance. In addition to direct support for livelihood the lake also plays an important socio-economic role in regulating annual water supply, recharging ground water and helping to control flooding (Landenbugre, 2005) Horticulture in Doron Baga The survey at Doron Baga focused primarily on the production of horticultural crops, because at the time of the study majority were found to be engaged in this activity. The horticultural crops produced and their respective common names are given on Table 1. Table 1: Horticultural crops grown at the shores of the Lake Chad.
English name Local name
Okra Kubewa, Ngubalto
Tomatoes Tumatur, Tumatiri
Onion la’aser, Albasa
Garlic Kingalmu, Tafarnuwa
Watermelon Fali, Kankana
Irish potato Dankari nasara, Dankali,
Sweet potato dankali kanuri, Dankali,
Amaranthus Alaifo, Aleyoho
Cabbage Kabegi, Kabegi
Cucumber Ngurli, Ngurli
Pumpkin Sagedu, kabewa
Cowpea (green) Wake, Ngalo
Pepper (big) NjittaTattase
Pepper (small) Njitta, Ataragu
Roselle Karasu,Yakuwa
Source: Field Survey(2005) The survey of the farmers based on socio-economic characteristics, shows that 44 percent of the respondents were between the age ranges of 26-40 years, while 20 percent were between 20-25 years old. Over seventy eight percent of the respondents were males (Table 2). This implies that relatively young males are involved in horticultural activities. They are dynamic and willing to take risks that are associated with the horticultural industry with the hope of improving their level of income (Ajayi, 2000). On farming experience, 36% had farming experience of 6-10 years, and 20 % with 1-5 years experience. This implies that the cultivation of horticultural crops is a viable industry that is just being exploited (Amans, 1992). But 76 percent farm holdings are small-scale as most of the respondents were having farms of 1-5 acres. The contrasting farm acreages, is perhaps a product of the seasonality of the lake Chad, peopling is directly linked to transgression of the lake (Thiemeyer, 2002). The distribution of sampled farmers based on farming inputs and usage shows that 46 percent of the farmers utilize improved seeds, 34 percent use previous year’s seeds and 12 percent buy from the local market. Amans (1992) had earlier opined that the commercial production of vegetables, and other horticultural crops, has assumed new status. Similarly, 44 % of the respondents use a combination of organic and inorganic fertilizers, 18.0 and 36.0% use chemical and organic fertilizers, respectively. Alasiri (2002) had earlier stated that agriculture in the present day requires the supply of additional nutrients for optimum crop performance
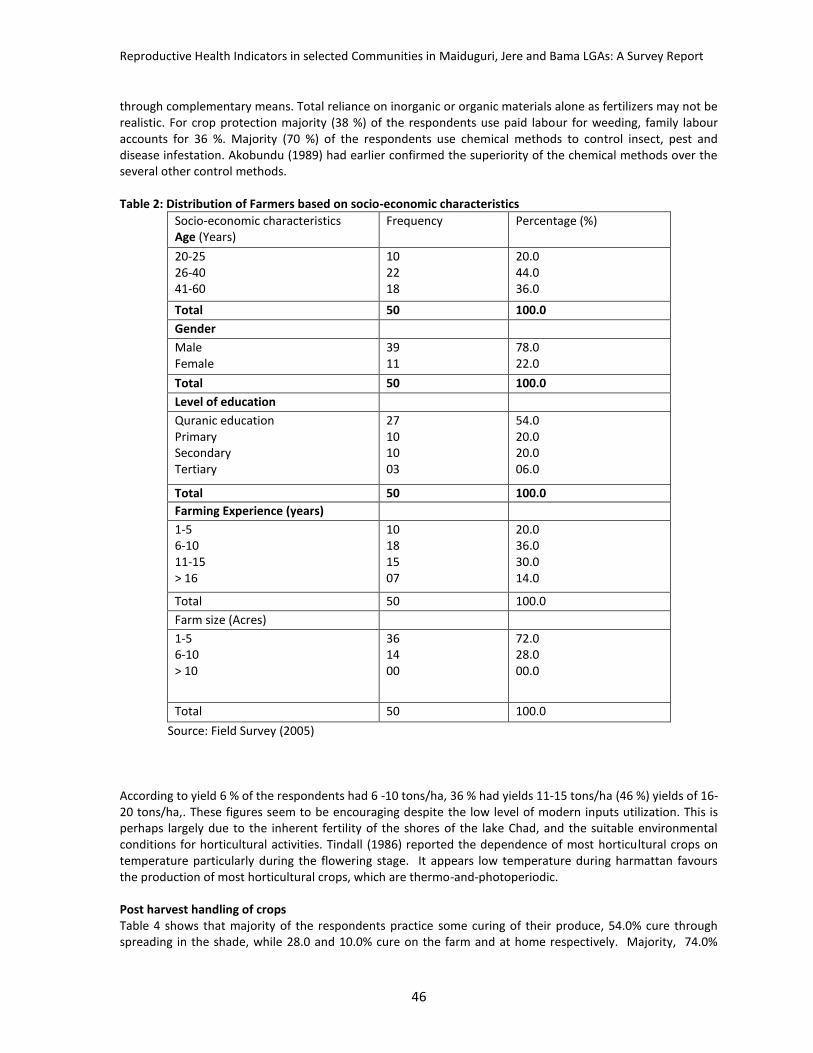
Reproductive Health Indicators in selected Communities in Maiduguri, Jere and Bama LGAs: A Survey Report
46
through complementary means. Total reliance on inorganic or organic materials alone as fertilizers may not be realistic. For crop protection majority (38 %) of the respondents use paid labour for weeding, family labour accounts for 36 %. Majority (70 %) of the respondents use chemical methods to control insect, pest and disease infestation. Akobundu (1989) had earlier confirmed the superiority of the chemical methods over the several other control methods. Table 2: Distribution of Farmers based on socio-economic characteristics
Socio-economic characteristics Age (Years)
Frequency Percentage (%)
20-25 26-40 41-60
10 22 18
20.0 44.0 36.0
Total 50 100.0
Gender
Male Female
39 11
78.0 22.0
Total 50 100.0
Level of education
Quranic education Primary Secondary Tertiary
27 10 10 03
54.0 20.0 20.0 06.0
Total 50 100.0
Farming Experience (years)
1-5 6-10 11-15 > 16
10 18 15 07
20.0 36.0 30.0 14.0
Total 50 100.0
Farm size (Acres)
1-5 6-10 > 10
36 14 00
72.0 28.0 00.0
Total 50 100.0
Source: Field Survey (2005) According to yield 6 % of the respondents had 6 -10 tons/ha, 36 % had yields 11-15 tons/ha (46 %) yields of 16-20 tons/ha,. These figures seem to be encouraging despite the low level of modern inputs utilization. This is perhaps largely due to the inherent fertility of the shores of the lake Chad, and the suitable environmental conditions for horticultural activities. Tindall (1986) reported the dependence of most horticultural crops on temperature particularly during the flowering stage. It appears low temperature during harmattan favours the production of most horticultural crops, which are thermo-and-photoperiodic. Post harvest handling of crops Table 4 shows that majority of the respondents practice some curing of their produce, 54.0% cure through spreading in the shade, while 28.0 and 10.0% cure on the farm and at home respectively. Majority, 74.0%
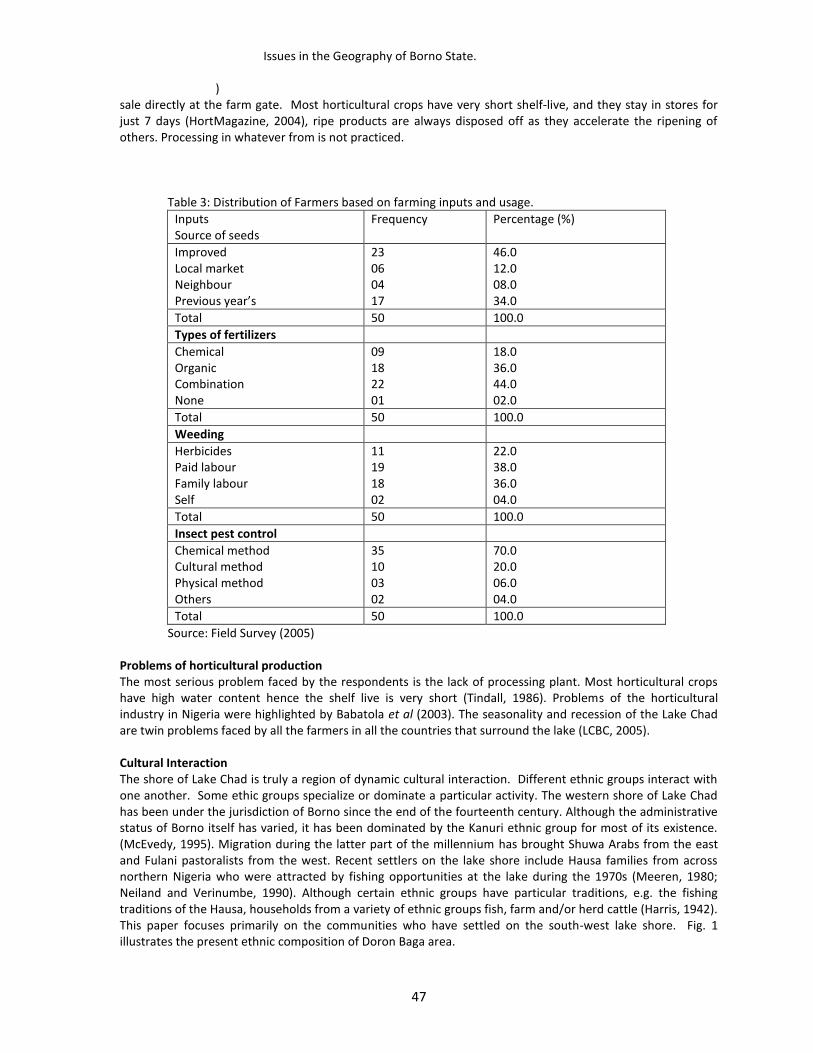
Issues in the Geography of Borno State.
)
47
sale directly at the farm gate. Most horticultural crops have very short shelf-live, and they stay in stores for just 7 days (HortMagazine, 2004), ripe products are always disposed off as they accelerate the ripening of others. Processing in whatever from is not practiced.
Table 3: Distribution of Farmers based on farming inputs and usage.
Inputs Source of seeds
Frequency Percentage (%)
Improved Local market Neighbour Previous year’s
23 06 04 17
46.0 12.0 08.0 34.0
Total 50 100.0
Types of fertilizers
Chemical Organic Combination None
09 18 22 01
18.0 36.0 44.0 02.0
Total 50 100.0
Weeding
Herbicides Paid labour Family labour Self
11 19 18 02
22.0 38.0 36.0 04.0
Total 50 100.0
Insect pest control
Chemical method Cultural method Physical method Others
35 10 03 02
70.0 20.0 06.0 04.0
Total 50 100.0
Source: Field Survey (2005) Problems of horticultural production The most serious problem faced by the respondents is the lack of processing plant. Most horticultural crops have high water content hence the shelf live is very short (Tindall, 1986). Problems of the horticultural industry in Nigeria were highlighted by Babatola et al (2003). The seasonality and recession of the Lake Chad are twin problems faced by all the farmers in all the countries that surround the lake (LCBC, 2005). Cultural Interaction The shore of Lake Chad is truly a region of dynamic cultural interaction. Different ethnic groups interact with one another. Some ethic groups specialize or dominate a particular activity. The western shore of Lake Chad has been under the jurisdiction of Borno since the end of the fourteenth century. Although the administrative status of Borno itself has varied, it has been dominated by the Kanuri ethnic group for most of its existence. (McEvedy, 1995). Migration during the latter part of the millennium has brought Shuwa Arabs from the east and Fulani pastoralists from the west. Recent settlers on the lake shore include Hausa families from across northern Nigeria who were attracted by fishing opportunities at the lake during the 1970s (Meeren, 1980; Neiland and Verinumbe, 1990). Although certain ethnic groups have particular traditions, e.g. the fishing traditions of the Hausa, households from a variety of ethnic groups fish, farm and/or herd cattle (Harris, 1942). This paper focuses primarily on the communities who have settled on the south-west lake shore. Fig. 1 illustrates the present ethnic composition of Doron Baga area.
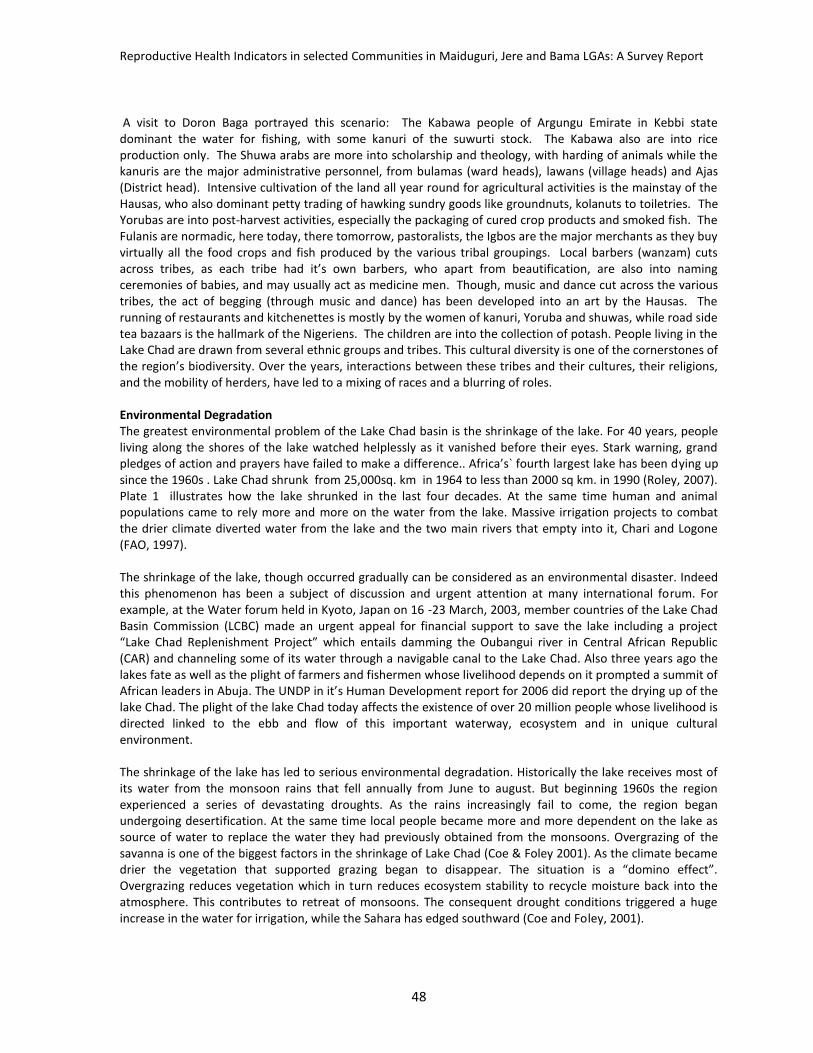
Reproductive Health Indicators in selected Communities in Maiduguri, Jere and Bama LGAs: A Survey Report
48
A visit to Doron Baga portrayed this scenario: The Kabawa people of Argungu Emirate in Kebbi state dominant the water for fishing, with some kanuri of the suwurti stock. The Kabawa also are into rice production only. The Shuwa arabs are more into scholarship and theology, with harding of animals while the kanuris are the major administrative personnel, from bulamas (ward heads), lawans (village heads) and Ajas (District head). Intensive cultivation of the land all year round for agricultural activities is the mainstay of the Hausas, who also dominant petty trading of hawking sundry goods like groundnuts, kolanuts to toiletries. The Yorubas are into post-harvest activities, especially the packaging of cured crop products and smoked fish. The Fulanis are normadic, here today, there tomorrow, pastoralists, the Igbos are the major merchants as they buy virtually all the food crops and fish produced by the various tribal groupings. Local barbers (wanzam) cuts across tribes, as each tribe had it’s own barbers, who apart from beautification, are also into naming ceremonies of babies, and may usually act as medicine men. Though, music and dance cut across the various tribes, the act of begging (through music and dance) has been developed into an art by the Hausas. The running of restaurants and kitchenettes is mostly by the women of kanuri, Yoruba and shuwas, while road side tea bazaars is the hallmark of the Nigeriens. The children are into the collection of potash. People living in the Lake Chad are drawn from several ethnic groups and tribes. This cultural diversity is one of the cornerstones of the region’s biodiversity. Over the years, interactions between these tribes and their cultures, their religions, and the mobility of herders, have led to a mixing of races and a blurring of roles. Environmental Degradation The greatest environmental problem of the Lake Chad basin is the shrinkage of the lake. For 40 years, people living along the shores of the lake watched helplessly as it vanished before their eyes. Stark warning, grand pledges of action and prayers have failed to make a difference.. Africa’s` fourth largest lake has been dying up since the 1960s . Lake Chad shrunk from 25,000sq. km in 1964 to less than 2000 sq km. in 1990 (Roley, 2007). Plate 1 illustrates how the lake shrunked in the last four decades. At the same time human and animal populations came to rely more and more on the water from the lake. Massive irrigation projects to combat the drier climate diverted water from the lake and the two main rivers that empty into it, Chari and Logone (FAO, 1997). The shrinkage of the lake, though occurred gradually can be considered as an environmental disaster. Indeed this phenomenon has been a subject of discussion and urgent attention at many international forum. For example, at the Water forum held in Kyoto, Japan on 16 -23 March, 2003, member countries of the Lake Chad Basin Commission (LCBC) made an urgent appeal for financial support to save the lake including a project “Lake Chad Replenishment Project” which entails damming the Oubangui river in Central African Republic (CAR) and channeling some of its water through a navigable canal to the Lake Chad. Also three years ago the lakes fate as well as the plight of farmers and fishermen whose livelihood depends on it prompted a summit of African leaders in Abuja. The UNDP in it’s Human Development report for 2006 did report the drying up of the lake Chad. The plight of the lake Chad today affects the existence of over 20 million people whose livelihood is directed linked to the ebb and flow of this important waterway, ecosystem and in unique cultural environment. The shrinkage of the lake has led to serious environmental degradation. Historically the lake receives most of its water from the monsoon rains that fell annually from June to august. But beginning 1960s the region experienced a series of devastating droughts. As the rains increasingly fail to come, the region began undergoing desertification. At the same time local people became more and more dependent on the lake as source of water to replace the water they had previously obtained from the monsoons. Overgrazing of the savanna is one of the biggest factors in the shrinkage of Lake Chad (Coe & Foley 2001). As the climate became drier the vegetation that supported grazing began to disappear. The situation is a “domino effect”. Overgrazing reduces vegetation which in turn reduces ecosystem stability to recycle moisture back into the atmosphere. This contributes to retreat of monsoons. The consequent drought conditions triggered a huge increase in the water for irrigation, while the Sahara has edged southward (Coe and Foley, 2001).
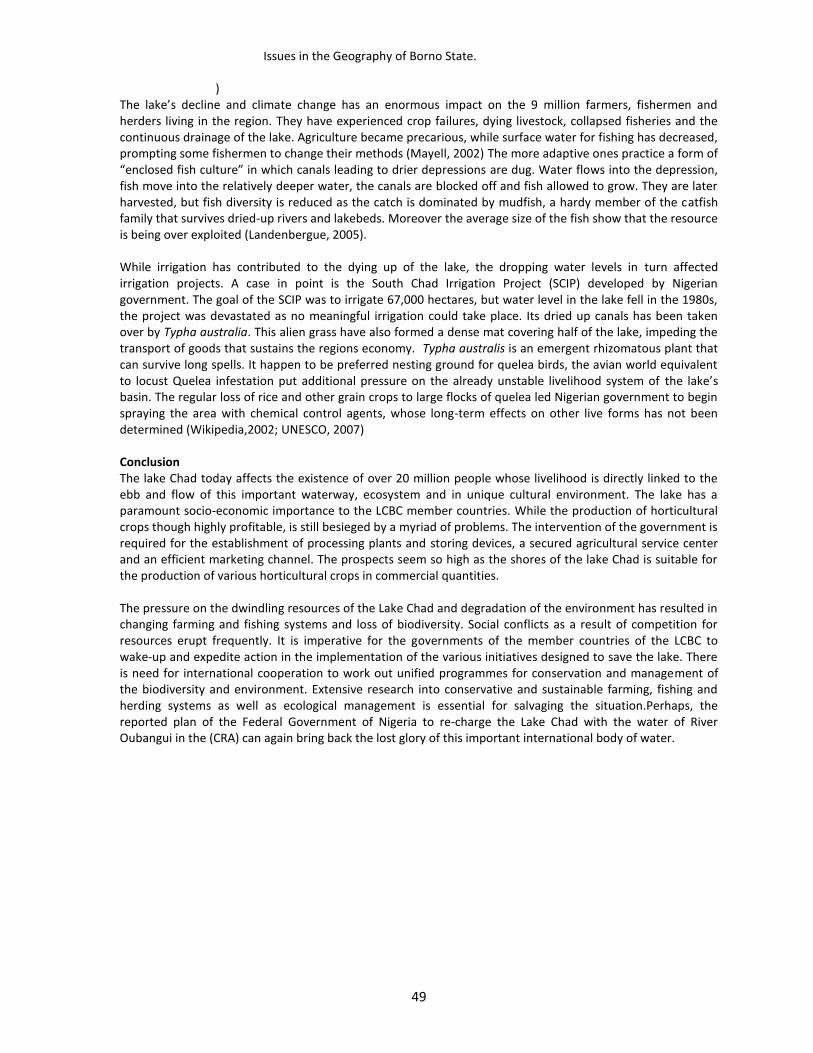
Issues in the Geography of Borno State.
)
49
The lake’s decline and climate change has an enormous impact on the 9 million farmers, fishermen and herders living in the region. They have experienced crop failures, dying livestock, collapsed fisheries and the continuous drainage of the lake. Agriculture became precarious, while surface water for fishing has decreased, prompting some fishermen to change their methods (Mayell, 2002) The more adaptive ones practice a form of “enclosed fish culture” in which canals leading to drier depressions are dug. Water flows into the depression, fish move into the relatively deeper water, the canals are blocked off and fish allowed to grow. They are later harvested, but fish diversity is reduced as the catch is dominated by mudfish, a hardy member of the catfish family that survives dried-up rivers and lakebeds. Moreover the average size of the fish show that the resource is being over exploited (Landenbergue, 2005). While irrigation has contributed to the dying up of the lake, the dropping water levels in turn affected irrigation projects. A case in point is the South Chad Irrigation Project (SCIP) developed by Nigerian government. The goal of the SCIP was to irrigate 67,000 hectares, but water level in the lake fell in the 1980s, the project was devastated as no meaningful irrigation could take place. Its dried up canals has been taken over by Typha australia. This alien grass have also formed a dense mat covering half of the lake, impeding the transport of goods that sustains the regions economy. Typha australis is an emergent rhizomatous plant that can survive long spells. It happen to be preferred nesting ground for quelea birds, the avian world equivalent to locust Quelea infestation put additional pressure on the already unstable livelihood system of the lake’s basin. The regular loss of rice and other grain crops to large flocks of quelea led Nigerian government to begin spraying the area with chemical control agents, whose long-term effects on other live forms has not been determined (Wikipedia,2002; UNESCO, 2007) Conclusion The lake Chad today affects the existence of over 20 million people whose livelihood is directly linked to the ebb and flow of this important waterway, ecosystem and in unique cultural environment. The lake has a paramount socio-economic importance to the LCBC member countries. While the production of horticultural crops though highly profitable, is still besieged by a myriad of problems. The intervention of the government is required for the establishment of processing plants and storing devices, a secured agricultural service center and an efficient marketing channel. The prospects seem so high as the shores of the lake Chad is suitable for the production of various horticultural crops in commercial quantities. The pressure on the dwindling resources of the Lake Chad and degradation of the environment has resulted in changing farming and fishing systems and loss of biodiversity. Social conflicts as a result of competition for resources erupt frequently. It is imperative for the governments of the member countries of the LCBC to wake-up and expedite action in the implementation of the various initiatives designed to save the lake. There is need for international cooperation to work out unified programmes for conservation and management of the biodiversity and environment. Extensive research into conservative and sustainable farming, fishing and herding systems as well as ecological management is essential for salvaging the situation.Perhaps, the reported plan of the Federal Government of Nigeria to re-charge the Lake Chad with the water of River Oubangui in the (CRA) can again bring back the lost glory of this important international body of water.
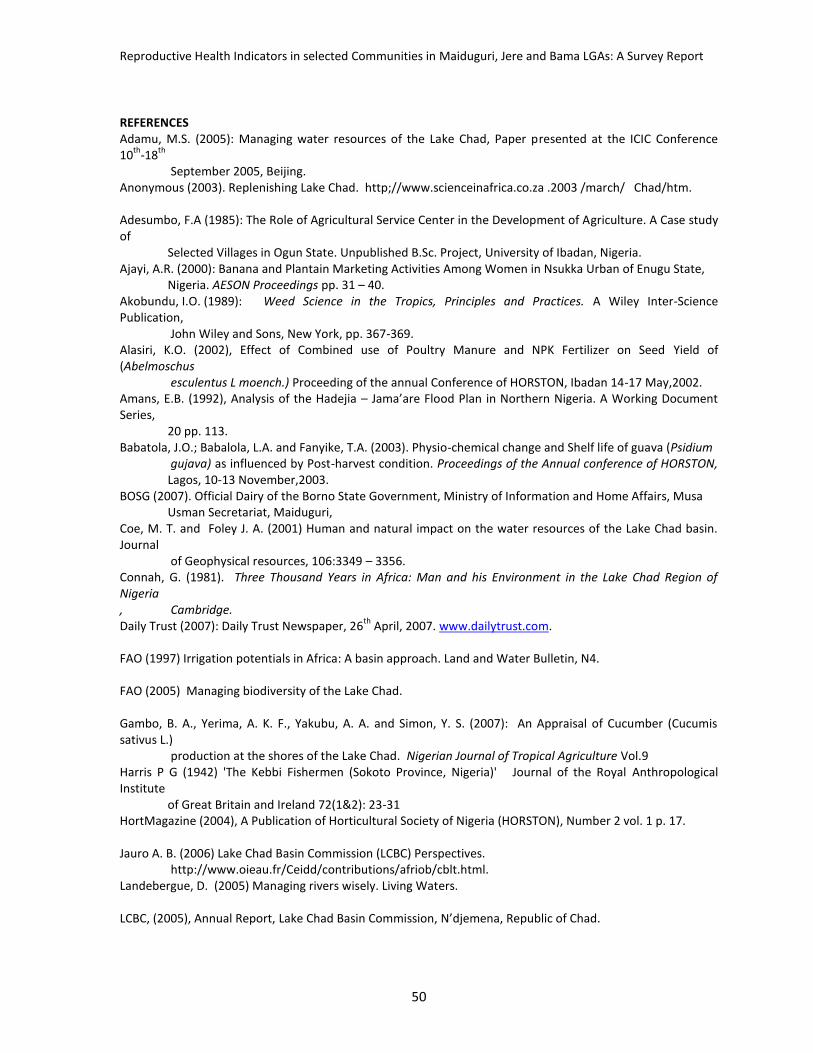
Reproductive Health Indicators in selected Communities in Maiduguri, Jere and Bama LGAs: A Survey Report
50
REFERENCES Adamu, M.S. (2005): Managing water resources of the Lake Chad, Paper presented at the ICIC Conference 10
th-18
th
September 2005, Beijing. Anonymous (2003). Replenishing Lake Chad. http;//www.scienceinafrica.co.za .2003 /march/ Chad/htm. Adesumbo, F.A (1985): The Role of Agricultural Service Center in the Development of Agriculture. A Case study of
Selected Villages in Ogun State. Unpublished B.Sc. Project, University of Ibadan, Nigeria. Ajayi, A.R. (2000): Banana and Plantain Marketing Activities Among Women in Nsukka Urban of Enugu State,
Nigeria. AESON Proceedings pp. 31 – 40. Akobundu, I.O. (1989): Weed Science in the Tropics, Principles and Practices. A Wiley Inter-Science Publication,
John Wiley and Sons, New York, pp. 367-369. Alasiri, K.O. (2002), Effect of Combined use of Poultry Manure and NPK Fertilizer on Seed Yield of (Abelmoschus
esculentus L moench.) Proceeding of the annual Conference of HORSTON, Ibadan 14-17 May,2002. Amans, E.B. (1992), Analysis of the Hadejia – Jama’are Flood Plan in Northern Nigeria. A Working Document Series,
20 pp. 113. Babatola, J.O.; Babalola, L.A. and Fanyike, T.A. (2003). Physio-chemical change and Shelf life of guava (Psidium
gujava) as influenced by Post-harvest condition. Proceedings of the Annual conference of HORSTON, Lagos, 10-13 November,2003.
BOSG (2007). Official Dairy of the Borno State Government, Ministry of Information and Home Affairs, Musa Usman Secretariat, Maiduguri,
Coe, M. T. and Foley J. A. (2001) Human and natural impact on the water resources of the Lake Chad basin. Journal
of Geophysical resources, 106:3349 – 3356. Connah, G. (1981). Three Thousand Years in Africa: Man and his Environment in the Lake Chad Region of Nigeria , Cambridge. Daily Trust (2007): Daily Trust Newspaper, 26
th April, 2007. www.dailytrust.com.
FAO (1997) Irrigation potentials in Africa: A basin approach. Land and Water Bulletin, N4. FAO (2005) Managing biodiversity of the Lake Chad. Gambo, B. A., Yerima, A. K. F., Yakubu, A. A. and Simon, Y. S. (2007): An Appraisal of Cucumber (Cucumis sativus L.)
production at the shores of the Lake Chad. Nigerian Journal of Tropical Agriculture Vol.9 Harris P G (1942) 'The Kebbi Fishermen (Sokoto Province, Nigeria)' Journal of the Royal Anthropological Institute
of Great Britain and Ireland 72(1&2): 23-31 HortMagazine (2004), A Publication of Horticultural Society of Nigeria (HORSTON), Number 2 vol. 1 p. 17. Jauro A. B. (2006) Lake Chad Basin Commission (LCBC) Perspectives.
http://www.oieau.fr/Ceidd/contributions/afriob/cblt.html. Landebergue, D. (2005) Managing rivers wisely. Living Waters. LCBC, (2005), Annual Report, Lake Chad Basin Commission, N’djemena, Republic of Chad.
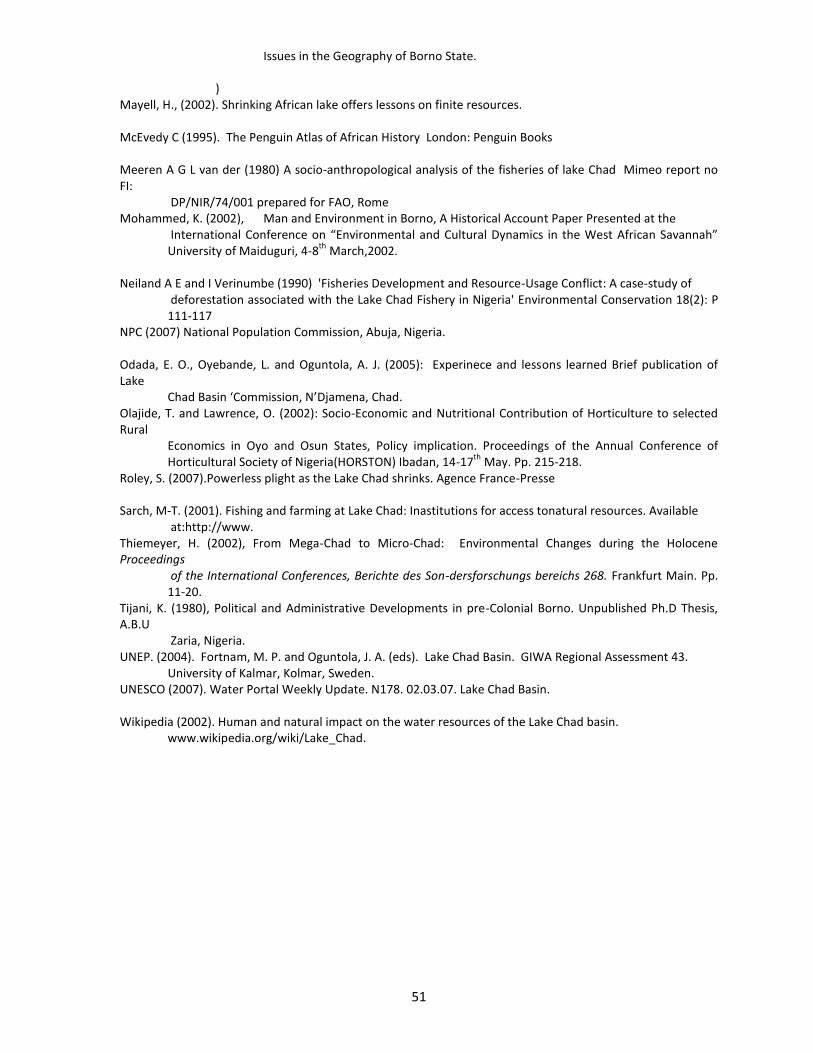
Issues in the Geography of Borno State.
)
51
Mayell, H., (2002). Shrinking African lake offers lessons on finite resources. McEvedy C (1995). The Penguin Atlas of African History London: Penguin Books Meeren A G L van der (1980) A socio-anthropological analysis of the fisheries of lake Chad Mimeo report no FI:
DP/NIR/74/001 prepared for FAO, Rome Mohammed, K. (2002), Man and Environment in Borno, A Historical Account Paper Presented at the
International Conference on “Environmental and Cultural Dynamics in the West African Savannah” University of Maiduguri, 4-8
th March,2002.
Neiland A E and I Verinumbe (1990) 'Fisheries Development and Resource-Usage Conflict: A case-study of
deforestation associated with the Lake Chad Fishery in Nigeria' Environmental Conservation 18(2): P 111-117
NPC (2007) National Population Commission, Abuja, Nigeria. Odada, E. O., Oyebande, L. and Oguntola, A. J. (2005): Experinece and lessons learned Brief publication of Lake
Chad Basin ‘Commission, N’Djamena, Chad. Olajide, T. and Lawrence, O. (2002): Socio-Economic and Nutritional Contribution of Horticulture to selected Rural
Economics in Oyo and Osun States, Policy implication. Proceedings of the Annual Conference of Horticultural Society of Nigeria(HORSTON) Ibadan, 14-17
th May. Pp. 215-218.
Roley, S. (2007).Powerless plight as the Lake Chad shrinks. Agence France-Presse Sarch, M-T. (2001). Fishing and farming at Lake Chad: Inastitutions for access tonatural resources. Available
at:http://www. Thiemeyer, H. (2002), From Mega-Chad to Micro-Chad: Environmental Changes during the Holocene Proceedings
of the International Conferences, Berichte des Son-dersforschungs bereichs 268. Frankfurt Main. Pp. 11-20.
Tijani, K. (1980), Political and Administrative Developments in pre-Colonial Borno. Unpublished Ph.D Thesis, A.B.U
Zaria, Nigeria. UNEP. (2004). Fortnam, M. P. and Oguntola, J. A. (eds). Lake Chad Basin. GIWA Regional Assessment 43.
University of Kalmar, Kolmar, Sweden. UNESCO (2007). Water Portal Weekly Update. N178. 02.03.07. Lake Chad Basin. Wikipedia (2002). Human and natural impact on the water resources of the Lake Chad basin.
www.wikipedia.org/wiki/Lake_Chad.
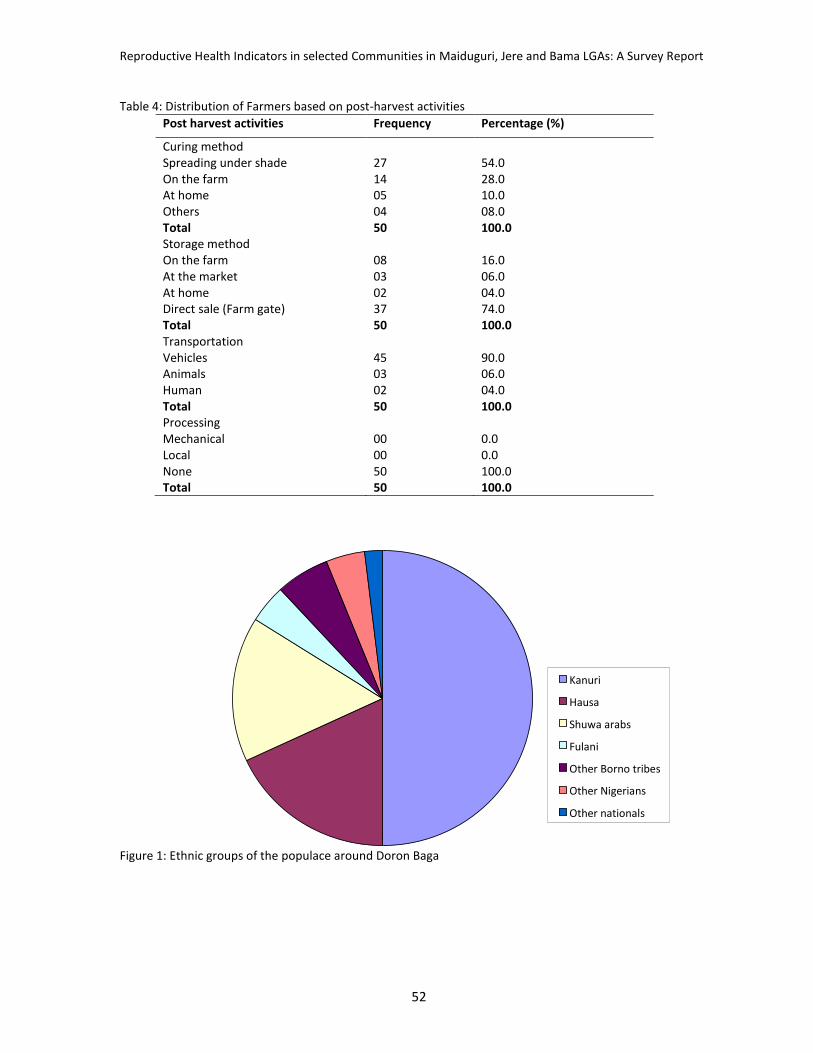
Reproductive Health Indicators in selected Communities in Maiduguri, Jere and Bama LGAs: A Survey Report
52
Table 4: Distribution of Farmers based on post-harvest activities
Post harvest activities Frequency Percentage (%)
Curing method Spreading under shade On the farm At home Others
27 14 05 04
54.0 28.0 10.0 08.0
Total 50 100.0 Storage method On the farm At the market At home Direct sale (Farm gate)
08 03 02 37
16.0 06.0 04.0 74.0
Total 50 100.0 Transportation Vehicles Animals Human
45 03 02
90.0 06.0 04.0
Total 50 100.0 Processing Mechanical Local None
00 00 50
0.0 0.0 100.0
Total 50 100.0
Figure 1: Ethnic groups of the populace around Doron Baga
Kanuri
Hausa
Shuwa arabs
Fulani
Other Borno tribes
Other Nigerians
Other nationals
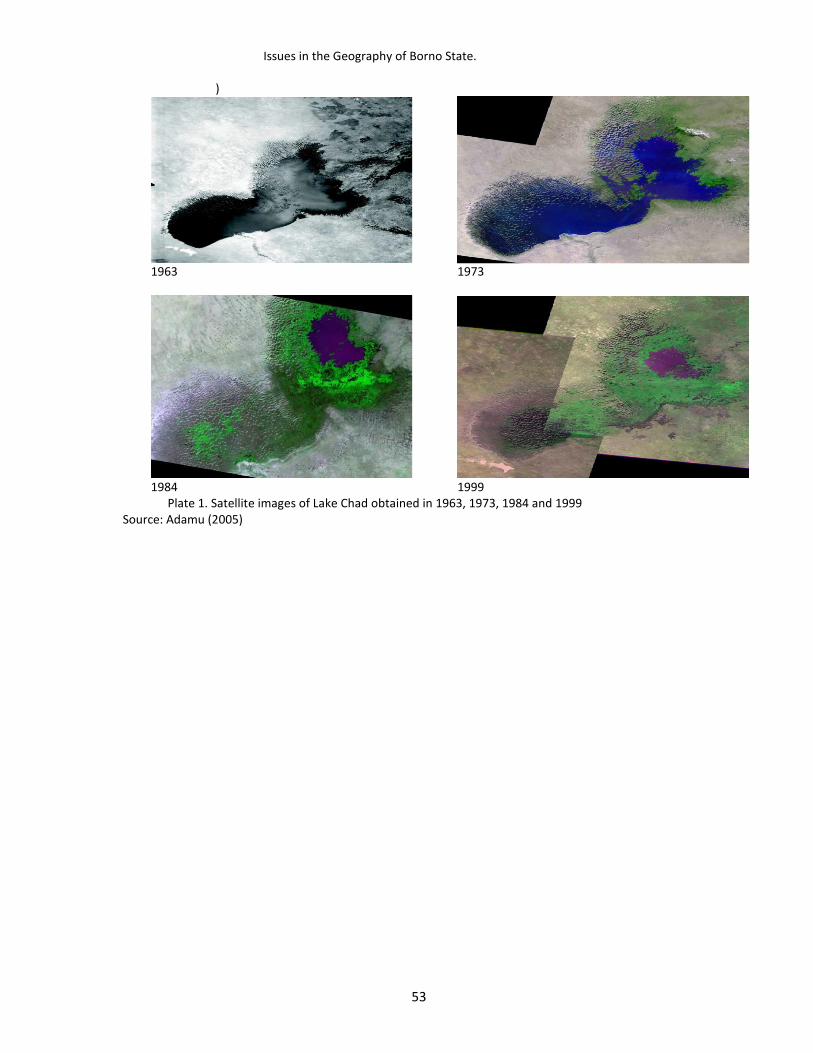
Issues in the Geography of Borno State.
)
53
1963
1973
1984 1999
Plate 1. Satellite images of Lake Chad obtained in 1963, 1973, 1984 and 1999 Source: Adamu (2005)
54
8 Prospects for Sustainable Management of Forest Resources HARUNA KUJE AYUBA Department of Geography, University of Maiduguri Introduction Forest resources include all the attributes of the forest that man can tap for his benefits. These benefits are either tangible or intangible. Tangible benefits are synonymous with woody (eg., fuel wood, poles, and timber) and non-woody physical components such as leaves, fruits, nuts, and oils. The intangible benefits emanate from services, which relate to the amelioration and beautification of the environment and maintenance of ecosystem productivity. For instance, vegetation acts as carbon sink, moderate microclimate, and reduces soil erosion. The early attempts by the Colonialists to develop the Borno region consisted of the creation of forest reserves. In the period ranging from 1922 to 1960, Government embarked on forest preservation by acquiring large tracts of land and constituting them into gazetted forest reserves, game reserves and community forest reserves. A total of about 51 indigenous plant species of various sizes and uses occurred in the natural savanna woodlands (Hopkins and Standfield, 1966). A list of some of the major forest and game reserves is shown in Table 1. According to Onochie (1984), these reserves covered an area of 1 823.50 sq.km., accounting for 4% of the total land area. In addition, between 1929 and 1960, a programme for the establishment of exotic plantations all over the Borno region was conceived by then Borno Provisional Administration. The campaign became successful as a result of the pioneer work of Alhaji Musa Daggash, who convinced the people (Traditional rulers, farmers and pastoralists) to plant such exotic trees. Three of the species, Azadirachta indica, Eucalyptus cameldulensis and Gmelina arborea, have become the main species for afforestation, often planted as monoculture, in the region today. These species were selected because of their fast rate of growth and their ability to produce wood between 4-5 years of planting. In most places today, these exotic species have replaced the genetically diverse natural forests of the region. It was in the period between 1975 and 1980 that negotiations for International Donor Agencies for loans or grants for specific afforestation programmes were initiated. Such assistance came from EEC (Now EU), World Bank, UNDP, amongst others, through various Forestry Projects. Ownership and uses of forest resources in the region Different types of ownership of forest stands exist in the region. These include private (individual) plantations, community plantations, and Government plantations (afforestation sites, shelterbelts, and forest reserves). The private plantations are found mostly around homesteads and sometimes on the boundaries of farmlands. Live trees are planted as a way of strengthening the owner’s claim to a particular field or land. Both indigenous and exotic tree species are planted for such purpose. Typical among such trees are Neem, Baobab, Acacia, Mango, Cashew, Guava, and Eucalyptus. The community plantations consist largely of exotic tree species such as Neem and Eucalyptus. Diseased and/or dry and mature trees are cut down for house construction, fuel wood, and other purposes. Since the use and management of such community woodlots are often not well defined, there is indiscriminate felling of trees by individual members of the community. In recent years however, there seems to be a shift toward fruit-and- tannin- or gum-producing species such as Acacia senegal (gum Arabic), because of their income generating abilities. The Local or State governments provide the seedlings. Government plantations include major afforestation projects, shelterbelt sites and the forest/game reserves. On the major streets of towns in Borno State there are exotic species of Azadirachta indica, Gmelina arborea, and Eucalyptus spp. The main thrust here is to protect the environment from drought and desertification, and to supply fuelwood other minor forest products.
Issues in the Geography of Borno State.
)
55
Studies by Ayuba et al (2002) and Odihi (2003) for the region revealed that over 60 woody species were mentioned more than once as preferred species, but 20 are most frequently cited, and there is great variation in the uses to which the woody species are put (Table 2). For more on the distribution, local names and uses of plants in the region, readers are advised to see Akinniyi and Sultan Bawa (1983). Table 1: A list of the major Forest and Grazing reserves in Borno
Forest/Game reserves Area (Km2) Location
Magurba 323.75 Kaga
Chingurmi 255.25 Bama
Fuchu 168.01 Mafa
Sambissa 163.33 Konduga
Ngohi/Ngulde 157.00 Askira/Uba
Gombole 144.83 Konduga
Miringa 131.12 Biu
Yerwa 120.33 Damboa
Wuda-Taye 99.79 Mafa
Divana 96.94 Kwayar Kusa
Yo 96.86 Mobbar
Bonoram 93.20 Magumeri
Imirshua 86.51 Damboa
Guburde 84.51 Bayo
Limanti 84.17 Mafa
Pela Chiroma 80.29 Hawul
Source: NEAZDP, 1991 and, Min. of Animal & Forest Resources, 1999 From Table 2, virtually all the woody species are used as fuelwood in the region. It has been estimated that about 90-95% of the rural households and 85-90% of the urban households in the region use fuelwood (FOS, 1987). As more and more people depend on the use of fuelwood as source of fuel and energy, the demand has continued to increase. Some important fuelwood use determinants in the region include: Traditional familiarity with the use of fuelwood as a major source of energy; The knowledge that fuelwood is a renewable resource. Unlike coal, gas and petroleum, fuelwood is extremely easy to locate and extract. There are no major financial or technological overheads or investments are required for the extraction, processing, handling, storage, and utilization of fuelwood. Fuelwood is comparably cheaper than other sources of energy. There are no risks of dangerous leakages or hazardous explosions involved, compared with kerosene, gas or petrol.The long-standing preference of fuelwood by the elderly who opined that food prepared with fuelwood has better taste compared with that prepared using gas, kerosene or electric cookers. Even among the fuelwood species, some are preferred to others because of reasons such as slow burn, charcoal residue, strength, low smoking, easy ignition, and availability. Apart from the major uses listed in Table 2, many of these species serve other environmental purposes such as erosion control, nitrogen fixation, improvement of soil fertility, shade, and ornamental.
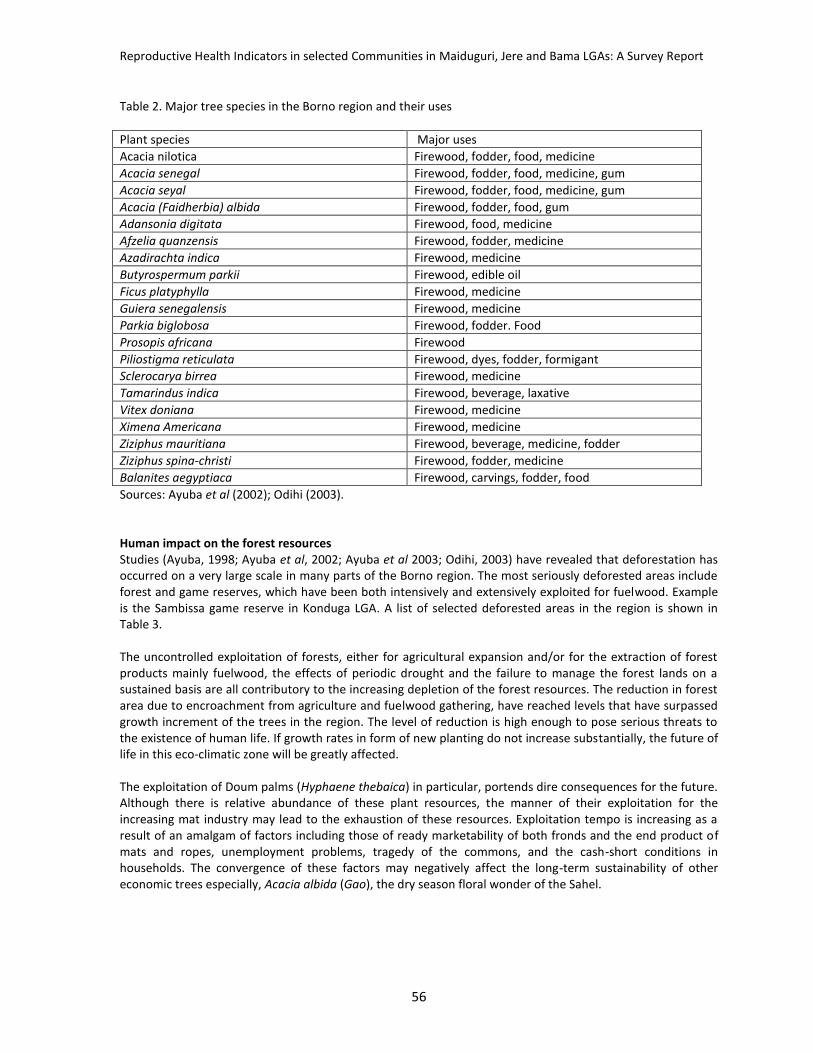
Reproductive Health Indicators in selected Communities in Maiduguri, Jere and Bama LGAs: A Survey Report
56
Table 2. Major tree species in the Borno region and their uses
Plant species Major uses
Acacia nilotica Firewood, fodder, food, medicine
Acacia senegal Firewood, fodder, food, medicine, gum
Acacia seyal Firewood, fodder, food, medicine, gum
Acacia (Faidherbia) albida Firewood, fodder, food, gum
Adansonia digitata Firewood, food, medicine
Afzelia quanzensis Firewood, fodder, medicine
Azadirachta indica Firewood, medicine
Butyrospermum parkii Firewood, edible oil
Ficus platyphylla Firewood, medicine
Guiera senegalensis Firewood, medicine
Parkia biglobosa Firewood, fodder. Food
Prosopis africana Firewood
Piliostigma reticulata Firewood, dyes, fodder, formigant
Sclerocarya birrea Firewood, medicine
Tamarindus indica Firewood, beverage, laxative
Vitex doniana Firewood, medicine
Ximena Americana Firewood, medicine
Ziziphus mauritiana Firewood, beverage, medicine, fodder
Ziziphus spina-christi Firewood, fodder, medicine
Balanites aegyptiaca Firewood, carvings, fodder, food
Sources: Ayuba et al (2002); Odihi (2003). Human impact on the forest resources Studies (Ayuba, 1998; Ayuba et al, 2002; Ayuba et al 2003; Odihi, 2003) have revealed that deforestation has occurred on a very large scale in many parts of the Borno region. The most seriously deforested areas include forest and game reserves, which have been both intensively and extensively exploited for fuelwood. Example is the Sambissa game reserve in Konduga LGA. A list of selected deforested areas in the region is shown in Table 3. The uncontrolled exploitation of forests, either for agricultural expansion and/or for the extraction of forest products mainly fuelwood, the effects of periodic drought and the failure to manage the forest lands on a sustained basis are all contributory to the increasing depletion of the forest resources. The reduction in forest area due to encroachment from agriculture and fuelwood gathering, have reached levels that have surpassed growth increment of the trees in the region. The level of reduction is high enough to pose serious threats to the existence of human life. If growth rates in form of new planting do not increase substantially, the future of life in this eco-climatic zone will be greatly affected. The exploitation of Doum palms (Hyphaene thebaica) in particular, portends dire consequences for the future. Although there is relative abundance of these plant resources, the manner of their exploitation for the increasing mat industry may lead to the exhaustion of these resources. Exploitation tempo is increasing as a result of an amalgam of factors including those of ready marketability of both fronds and the end product of mats and ropes, unemployment problems, tragedy of the commons, and the cash-short conditions in households. The convergence of these factors may negatively affect the long-term sustainability of other economic trees especially, Acacia albida (Gao), the dry season floral wonder of the Sahel.

Issues in the Geography of Borno State.
)
57
Table 3. Deforestation in selected areas (Odihi, 2003)
Area Estimated average rate of deforestation
Comments
Sambissa game reserve, Borno state
13.3 x 10³
tonnes/year Over 60% of the fuelwood from this area is taken principally to Maiduguri, Bama and Konduga.This has led to game and habitat reduction, decline in species diversity and other modifications.
Damboa LGA, Borno state 19.6 x 10³ tonnes/year The various fuelwood fields of
this LGA serve important urban markets such as Kano, Maiduguri, Damaturu, Nguru, Hadeija, and Biu.
Recent environmental conditions in the region aided the exploitation of forest resources. Drought in this zone has been very frequent, of high magnitude and long duration. Plant desiccation and burning of forest resources are enhanced when drought dries up ground water resources, and exploitation of sparse resources are intensified. Diseases affecting trees were important factors of deforestation from the late 1980s. A disease Aonidella orientalis was responsible for area-wide cut down of Azadirachta indica in 1991. It was believed to be fatal to humans. Although the disease itself did not actually result in the death of affected trees, the belief that people had about it resulted in intensive campaign to destroy affected trees in urban and surrounding areas as precautionary measures. An emerging dimension of deforestation problem concerns development programmes such as housing estate and road construction projects. These projects are resulting in large-scale deforestation in the region. Maiduguri and Damaturu are clear examples. Residential estates development (State government’s Low-cost housing projects; eg 202, 303, and now 707 housing estates in Borno state and Ben-Kalu’s housing estate in Yobe state) has led to substantial destruction of the forest resources. An estimated over 100 hectares of forest resources were lost to such projects in various parts of the region between 1980 and 1991 (Odihi, 2003). Thus, deforestation poses a real threat to the long-term sustainability of plant resources in particular and environmental resources in general due to its scale and the preponderance of the factors causing it.
Reproductive Health Indicators in selected Communities in Maiduguri, Jere and Bama LGAs: A Survey Report
58
Suggested management strategies There are strong indications that for a long time to come fuel wood will remain the most important source of energy for majority of the rural and urban dwellers in this region. This expectation is corroborated by the ever-rising prices of kerosene, gas, electricity, and of the corresponding stoves and cookers. Obviously, the only way out of meeting the increasing demand for fuel wood is concerted, carefully articulated, vigorously pursued, long-drawn, and large-scale programme that goes much deeper than the cosmetic yearly tree-planting ritual. Such a programme must simultaneously encompass general afforestation and reforestation, private and family woodlots, special fuel wood plantation, active protection of existing forest reserves, roadside tree planting in both rural and urban areas, agro forestry, and widespread tree planting in schools, Government offices and other comparable locations. The efforts of the State Governments in this regard are commended, but more can still be accomplished. A set of strategies to ensure affordable, cost effective and reliable energy services have been proposed. The proposed approach lays emphasis on a people-centred (bottom-up) programme based on the socio-cultural and economic realities of the people within the areas. i. Direct Involvement of Local Communities in Afforestation Projects The major flaw of the afforestation projects in the region has been the top-down approach of government. The communities should be directly involved in the preparation and execution of such afforestation projects. When local people are involved, they become fully aware that apart from protecting the environment by planting trees, they also stand to benefit economically by generating forestry products. ii. Fuelwood To arrest the tide of fuel wood depletion with the attendant problems of desertification, these strategies are proposed. Cultivation of fast growing tree species (such as Leucaena leucocephala). The many varieties of this species have long been recognized as a soil erosion control plant, a nitrogen fixer, a firewood and timber producer, a fodder plant, and a high quality charcoal producer. Enforcement of laws on indiscriminate tree felling by Increasing the area covered by forest reserves by setting up an effective system of forest regeneration (creation of special fuel wood plantations). iii. Promoting the use of Suitable Cooking Stoves The use of improved cooking stoves as a way to save scarce wood supplies has met with great success in Burkina Faso, Tanzania and Mali. Some results have also been achieved by the Sokoto Energy Research Centre (SERC) in the development of improved wood, coal/charcoal and saw dust stoves. Such stoves have the advantage of organized exist of smoke and are fuel- efficient. In addition, more than one cooking pots could be used at the same time. These stoves have the potential of being adopted by the people due to the fact that they and their fuel sources are comparatively cheap and culturally compatible in that the stoves could be constructed with local technology and materials. iv. Public Enlightenment It is our contention that the mass media and other extension workers are underutilized. Both radio and television jingles about afforestation should be employed. Major roads should be marked with signposts conveying messages on the tree planting campaigns, shelterbelt programmes etc. Stickers on afforestation should be distributed to all private and public car owners. Well- trained forest and agricultural extension workers should also be integrated. v. Agroforestry Agroforestry is a collective name for land use systems in which woody perennials (trees, shrubs etc) are grown in association with herbaceous plants (crops, pastures) and/or livestock in a spatial arrangement. This seems to be practiced only by local farmers (and it is not enough). Government should establish large-scale agroforestry farms in the region. This will increase total yield from the land, widen the range of produce and thus spread risks, and conserve the forest resources. vi. Afforestation This is the process of establishing forest in areas, which hitherto did not have natural forest. This should not just be the cosmetic yearly tree-planting programmes. There must be proper management of such plantations
Issues in the Geography of Borno State.
)
59
by communities living near such sites (some incentives may be given by government) or, by the local government in which the plantation is located. vii. Other Biomass Resources Other biomass resources such as plant resources and animal dung could be converted to produce fuel for small- scale industries. The objective is to promote the efficient use of agricultural resides, animal and human wastes as energy sources. viii. Research and Development Many researchers in the university are ready to conduct research on how to harness the solar energy for use in government offices, residential buildings etc. but are constrained by lack of funds. The State Government could encourage research and development in energy technology and energy conversion systems. ix. Integration with Foreign Assistance Efforts on forestry promotion carried out with the assistance of foreign bodies like the World Bank and EU should continue in a more invigorating and integrating form with more commitment and prudence on the part of the state and local governments. This type of linkage will allow for the exchange of ideas on new energy alternatives. In a nutshell, a sustainable alleviation of the fuel wood crisis will require a policy on environment that will encourage effective participation by the local communities, the promotion of suitable cooking stoves, agroforestry practices, and other educational measures.
Reproductive Health Indicators in selected Communities in Maiduguri, Jere and Bama LGAs: A Survey Report
60
REFERENCES Akinniyi J A and M U S Sultanbawa 1983 A glossary of Kanuri names of plants with botanical names,
distribution and uses. Annals of Borno vol., 1, 85-98. University of Maiduguri Ayuba, H.K. 1992. Effects of continuous cultivation and burning on soils in Konduga LGA, Borno state.
Unpublished MSc. Dissertation, submitted to University of Ibadan, Nigeria 92pp Ayuba, H.K. 1998 Grazing and land degradation in a semi-arid rangeland in northeastern Nigeria. Unpublished
PhD Thesis. Geography department, University of Ibadan, Nigeria. 293pp. Ayuba, H.K.; M.M. Daura; J.A. Ijere; U.M. Maryah and D.S. Msheliza 2002. Desertification and Sustainable
Utilisation of Natural Forest Resources in Borno State. Research Report (REF/ACA. 32/C9/Vol XVIII) University of Maiduguri. 37p.
Ayuba, H.K. Y.M Aji and D S Msheliza 2003. Cultural dynamics in resources utilization, conservation and management among rural communities in Borno State. Book published by Salone psycho-educational services; 98pp.
FOS (1987). Federal Office of Statistics. Annual Abstracts of Statistics, Lagos. Hopkins B and Standfield D P (1966) A field key to the savanna trees of Nigeria. Ibadan Univ. press. NEAZDP 1991. Northeast Arid Zone Development Project. Rangeland report. Onochie C F A. (1984). What is wrong with Nigerian forestry? A keynote address, Forestry Assoc., Nigeria (FAN)
annual conf., proceedings, 14-51. Odihi J O 2003. Deforestation in afforestation priority zone in sudano-sahelian Nigeria. Applied Geography 23,
227-259. Elsevier.
61
9 Livestock Production In Borno State: An Overview ALHAJI MUKTHAR Imam Malik Islamic Centre, Maiduguri. MUHAMMAD WAZIRI Department of Geography, University of Maiduguri IBRAHIM D. MOHAMMED Department of Animal Science, University of Maiduguri Introduction: Production of livestock by pastoralists and agro- pastoralists is the second most important economic activity in Borno State, Nigeria (Mohammed and Abdullahi, 2002). Livestock are kept in different systems of production in Nigeria. Different ways of feeding, breeding and using livestock have evolved in response to factors such as climate, needs of the owner, economic environment, and the level of technology available. Within each system of production, livestock keepers have developed their own methods of looking after their animals according to their own particular circumstances. Two forms of land use are common in the state, pastoralism and sedentary agriculture (RIM, 1992). However, the livestock keepers are usually classified according to the enterprise system and the degree of mobility namely; pure pastoralist and animal keeping farmers. Natural pasture and road side grazing and browsing of bushes, shrubs and trees serve as the main source of feed. However, animals are occasionally supplemented with residues of cereals/ legumes and also given local mineral lick (POTASH) during the dry season (Jimoh,1992). The main sources of watering stock are rivers, streams, ponds and dug wells. Occasionally, bore holes may be available. Housing for livestock is usually in form of confinement in open space with thatched sheds which may or may not be separated from family dwellings or camps (NEAZDP, 1991b) and Jimoh (1992). Pastoral/ Nomadism Pastoralists or Nomads are livestock owners who exploit natural grasslands mainly in the semi- arid areas with their herds of cattle, sheep and goats. Most are transhumant, having permanent homes in an area with a more favourable rainfall. Natural grazing as practiced involves animals being grazed on pastures right from the field. RIM (1992) reported that available grazing land in the state ranged from 1.6 to 2.7 hectares per animal. Similarly RIM (1992) has observed that the heaviest concentration of livestock (cattle, sheep and goats) ranged from 259 to 384 animals per km
2 around Maiduguri and Magumeri districts to medium densities of 130- 256
animals per km2 around Kaga and Marte districts. The state has about 2.7 million heads of cattle; out of these
2.4 million heads are kept under pastoral condition while 0.29 million are kept under village conditions with a density of 23.34 animals/ km
2. Goats population in the state is about 3.15 million out of which 0.9 million are
pastoral while 2.25 million are kept under village conditions with a density with a density of 2.50 animals/ km2.
Sheep population is about 2.38 million out of which 0.92 million are pastoral while 1.46 are kept under village conditions with a density of 20.48 animals/ km
2. The state has a population of 0.02 million camels, 3000 are
pastoral while about 23,000 are kept under village conditions with a density of 0.23 animals/ km2. Donkeys
total about 0.18 million, out of which about 2,000 are pastoral while about 78,000 are kept under village conditions with a density of 1.55 animals/ km
2. Similarly, the horses population is about 86,000 out of which
3,500 are pastoral with 84,000 are kept under village conditions. The breeds of cattle found in the state are: Wadara, Kuri, White Fulani, and Adamawa Gudali. The sheep breeds found include Balami, Yankasa and Uda; while the goats breeds are Borno White, Sokoto Red and West African Dwarf. Economic Importance Cattle, sheep and goats are important sources of food (meat, milk and butter) and also provide traction for crop production. They also serve as sources of cash income through sales of live animals and animal products. Manure of cattle, sheep and goats are used as organic fertilizer on farms.
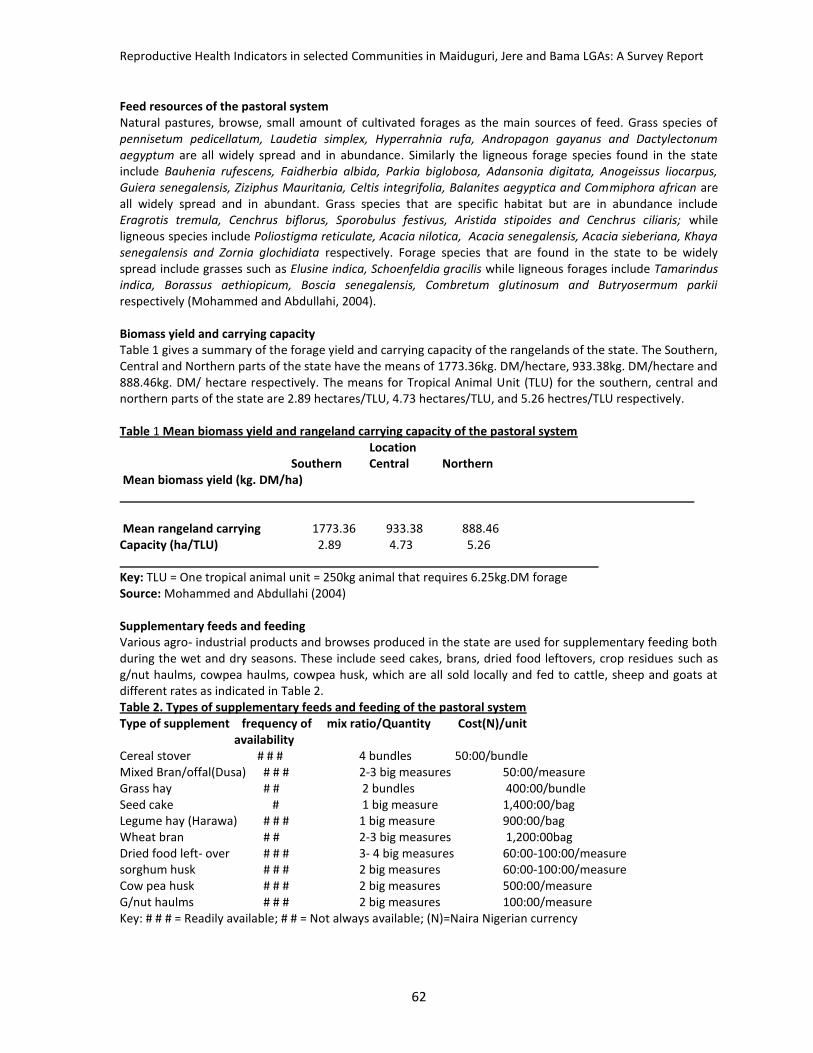
Reproductive Health Indicators in selected Communities in Maiduguri, Jere and Bama LGAs: A Survey Report
62
Feed resources of the pastoral system Natural pastures, browse, small amount of cultivated forages as the main sources of feed. Grass species of pennisetum pedicellatum, Laudetia simplex, Hyperrahnia rufa, Andropagon gayanus and Dactylectonum aegyptum are all widely spread and in abundance. Similarly the ligneous forage species found in the state include Bauhenia rufescens, Faidherbia albida, Parkia biglobosa, Adansonia digitata, Anogeissus liocarpus, Guiera senegalensis, Ziziphus Mauritania, Celtis integrifolia, Balanites aegyptica and Commiphora african are all widely spread and in abundant. Grass species that are specific habitat but are in abundance include Eragrotis tremula, Cenchrus biflorus, Sporobulus festivus, Aristida stipoides and Cenchrus ciliaris; while ligneous species include Poliostigma reticulate, Acacia nilotica, Acacia senegalensis, Acacia sieberiana, Khaya senegalensis and Zornia glochidiata respectively. Forage species that are found in the state to be widely spread include grasses such as Elusine indica, Schoenfeldia gracilis while ligneous forages include Tamarindus indica, Borassus aethiopicum, Boscia senegalensis, Combretum glutinosum and Butryosermum parkii respectively (Mohammed and Abdullahi, 2004). Biomass yield and carrying capacity Table 1 gives a summary of the forage yield and carrying capacity of the rangelands of the state. The Southern, Central and Northern parts of the state have the means of 1773.36kg. DM/hectare, 933.38kg. DM/hectare and 888.46kg. DM/ hectare respectively. The means for Tropical Animal Unit (TLU) for the southern, central and northern parts of the state are 2.89 hectares/TLU, 4.73 hectares/TLU, and 5.26 hectres/TLU respectively. Table 1 Mean biomass yield and rangeland carrying capacity of the pastoral system Location Southern Central Northern Mean biomass yield (kg. DM/ha) Mean rangeland carrying 1773.36 933.38 888.46 Capacity (ha/TLU) 2.89 4.73 5.26 Key: TLU = One tropical animal unit = 250kg animal that requires 6.25kg.DM forage Source: Mohammed and Abdullahi (2004) Supplementary feeds and feeding Various agro- industrial products and browses produced in the state are used for supplementary feeding both during the wet and dry seasons. These include seed cakes, brans, dried food leftovers, crop residues such as g/nut haulms, cowpea haulms, cowpea husk, which are all sold locally and fed to cattle, sheep and goats at different rates as indicated in Table 2. Table 2. Types of supplementary feeds and feeding of the pastoral system Type of supplement frequency of mix ratio/Quantity Cost(N)/unit availability Cereal stover # # # 4 bundles 50:00/bundle Mixed Bran/offal(Dusa) # # # 2-3 big measures 50:00/measure Grass hay # # 2 bundles 400:00/bundle Seed cake # 1 big measure 1,400:00/bag Legume hay (Harawa) # # # 1 big measure 900:00/bag Wheat bran # # 2-3 big measures 1,200:00bag Dried food left- over # # # 3- 4 big measures 60:00-100:00/measure sorghum husk # # # 2 big measures 60:00-100:00/measure Cow pea husk # # # 2 big measures 500:00/measure G/nut haulms # # # 2 big measures 100:00/measure Key: # # # = Readily available; # # = Not always available; (N)=Naira Nigerian currency
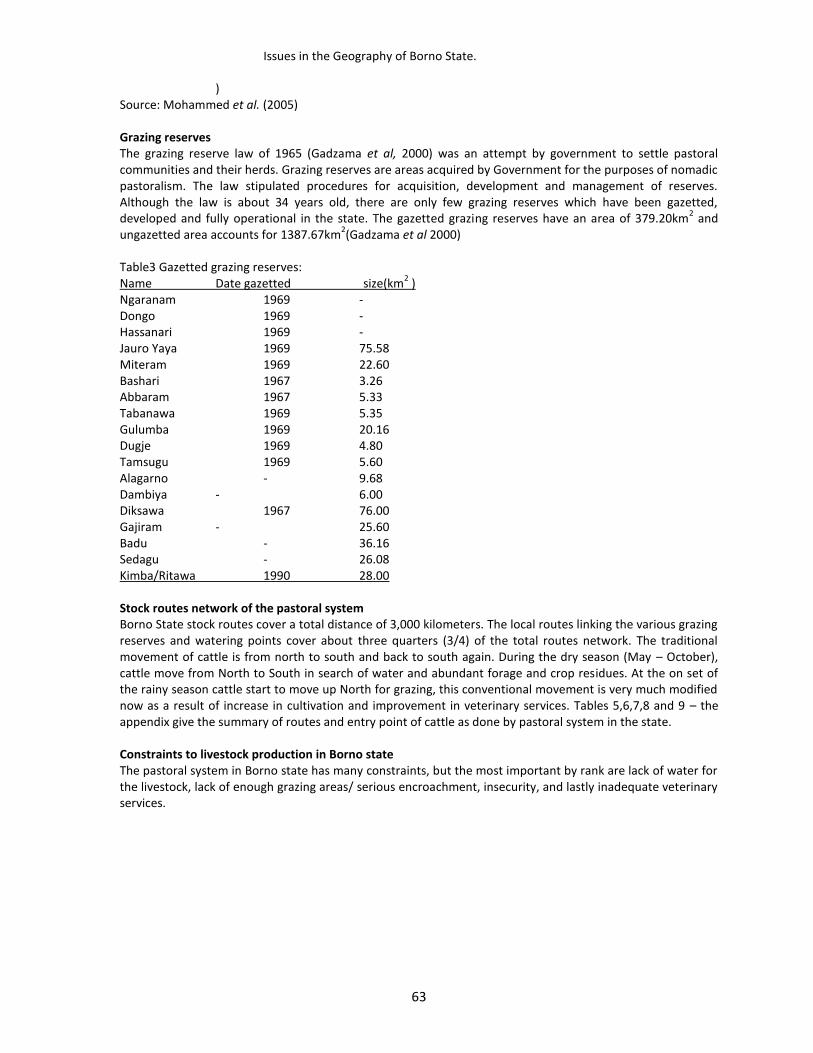
Issues in the Geography of Borno State.
)
63
Source: Mohammed et al. (2005) Grazing reserves The grazing reserve law of 1965 (Gadzama et al, 2000) was an attempt by government to settle pastoral communities and their herds. Grazing reserves are areas acquired by Government for the purposes of nomadic pastoralism. The law stipulated procedures for acquisition, development and management of reserves. Although the law is about 34 years old, there are only few grazing reserves which have been gazetted, developed and fully operational in the state. The gazetted grazing reserves have an area of 379.20km
2 and
ungazetted area accounts for 1387.67km2(Gadzama et al 2000)
Table3 Gazetted grazing reserves: Name Date gazetted size(km
2 )
Ngaranam 1969 - Dongo 1969 - Hassanari 1969 - Jauro Yaya 1969 75.58 Miteram 1969 22.60 Bashari 1967 3.26 Abbaram 1967 5.33 Tabanawa 1969 5.35 Gulumba 1969 20.16 Dugje 1969 4.80 Tamsugu 1969 5.60 Alagarno - 9.68 Dambiya - 6.00 Diksawa 1967 76.00 Gajiram - 25.60 Badu - 36.16 Sedagu - 26.08 Kimba/Ritawa 1990 28.00 Stock routes network of the pastoral system Borno State stock routes cover a total distance of 3,000 kilometers. The local routes linking the various grazing reserves and watering points cover about three quarters (3/4) of the total routes network. The traditional movement of cattle is from north to south and back to south again. During the dry season (May – October), cattle move from North to South in search of water and abundant forage and crop residues. At the on set of the rainy season cattle start to move up North for grazing, this conventional movement is very much modified now as a result of increase in cultivation and improvement in veterinary services. Tables 5,6,7,8 and 9 – the appendix give the summary of routes and entry point of cattle as done by pastoral system in the state. Constraints to livestock production in Borno state The pastoral system in Borno state has many constraints, but the most important by rank are lack of water for the livestock, lack of enough grazing areas/ serious encroachment, insecurity, and lastly inadequate veterinary services.
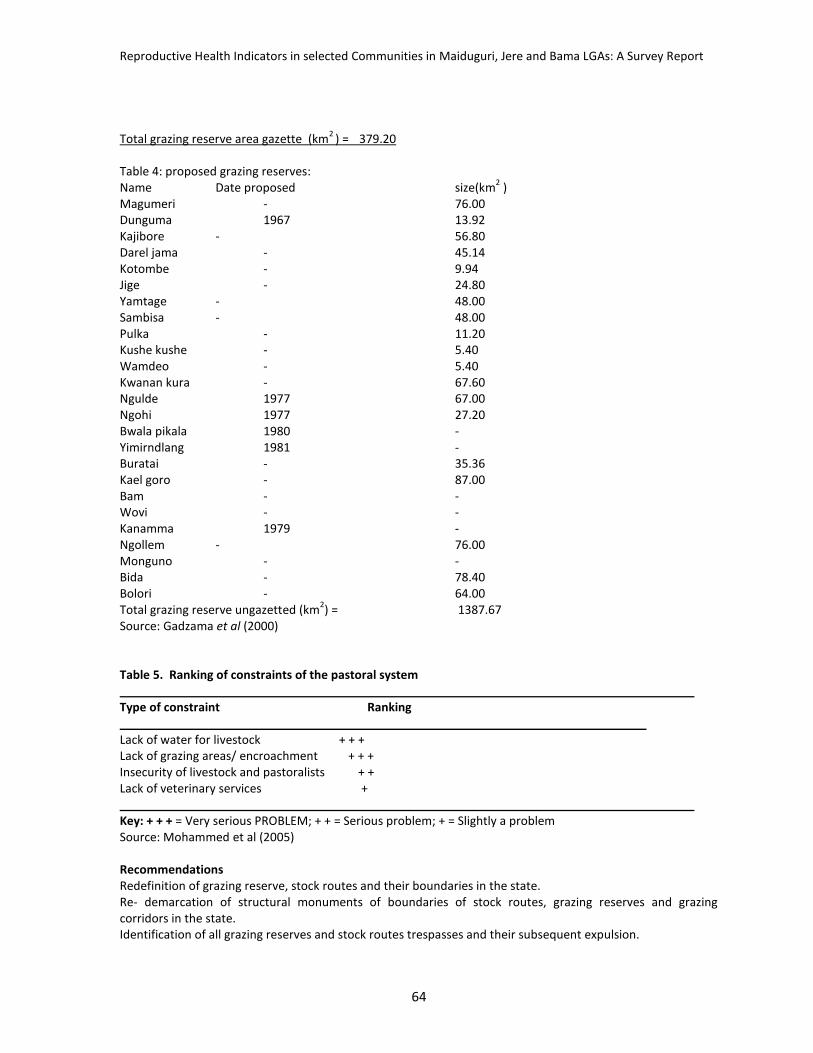
Reproductive Health Indicators in selected Communities in Maiduguri, Jere and Bama LGAs: A Survey Report
64
Total grazing reserve area gazette (km
2 ) = 379.20
Table 4: proposed grazing reserves: Name Date proposed size(km
2 )
Magumeri - 76.00 Dunguma 1967 13.92 Kajibore - 56.80 Darel jama - 45.14 Kotombe - 9.94 Jige - 24.80 Yamtage - 48.00 Sambisa - 48.00 Pulka - 11.20 Kushe kushe - 5.40 Wamdeo - 5.40 Kwanan kura - 67.60 Ngulde 1977 67.00 Ngohi 1977 27.20 Bwala pikala 1980 - Yimirndlang 1981 - Buratai - 35.36 Kael goro - 87.00 Bam - - Wovi - - Kanamma 1979 - Ngollem - 76.00 Monguno - - Bida - 78.40 Bolori - 64.00 Total grazing reserve ungazetted (km
2) = 1387.67
Source: Gadzama et al (2000) Table 5. Ranking of constraints of the pastoral system Type of constraint Ranking Lack of water for livestock + + + Lack of grazing areas/ encroachment + + + Insecurity of livestock and pastoralists + + Lack of veterinary services + Key: + + + = Very serious PROBLEM; + + = Serious problem; + = Slightly a problem Source: Mohammed et al (2005) Recommendations Redefinition of grazing reserve, stock routes and their boundaries in the state. Re- demarcation of structural monuments of boundaries of stock routes, grazing reserves and grazing corridors in the state. Identification of all grazing reserves and stock routes trespasses and their subsequent expulsion.

Issues in the Geography of Borno State.
)
65
Construction and renovation of earth dams, ring wells as well as construction of new watering troughs along watering points. Establishment of market outlets for the livestock. Encouragement of organic fertilizer usage from animal origin to substitute chemical fertilizers. Establishment of strong conflict resolution mechanism to encourage peaceful coexistence between pastoralists and crop farmers.
Reproductive Health Indicators in selected Communities in Maiduguri, Jere and Bama LGAs: A Survey Report
66
References Gadzama, T., Ngulde S.and Seyoji, M.( 2000): Grazing reserves and stock routes of Borno State, Nigeria. Technical Report, Ministry of Animal and Forest Resources Maiduguri. Pp 1- 10 Jimoh, M.A. (1992): Livestock grazing and its production value in the Hadejia- Nguru Flood plains. Hadejia- Nguru Wetlands conservation. Yobe State Nigeria. Mohammed, I.D. and Abdullahi, B.A.( 2002): Species abundance, nutritional composition and ranking of Browses in Sheep and goats diets in semi- arid part of Yobe state, Nigeria. Journal of Science and technology Research. Vol.1. (1) Pp.101-106. Mohammed, I.D. and Abdullahi, B.A.( 2004): Comparison of forage productivity, carrying capacity of rangelands and nutritional value of some common feedstuffs of Semi- arid part of Yobe State, Nigeria. Journal of Science and Technology Research. Vol. 3, (3). Pp.29- 31. Mohammed, I.D., Bila, Y. and Ibrahim, I.U.(2005): Assessing livestock productivity in Semi- arid part of Borno State using participatory rural appraisal (P RA) method. Journal of Science and Technology Research. Vol.4 (4). Pp.51-55. NEAZDP, (1991b): Important Fodder Trees in NEAZDP area. North East Arid zone Development Programme Gashua, Yobe State, Nigeria. August, 1991. Pp.1-25. RIM, (1992): Nigerian Livestock Resources. National Synthesis Report. Vol 1. Resource Inventory Management Limited. Pp.1-36 Table 6: Routes of pastoral system in the state 1
st Entry point
1
st Route
From Cameroon republic …(Bama L.G.A) … Dukuma … Walasa … Digira … Kashimiri … As’shab … Bungel … Tokoba …Tolai …Bashari … Gambaram (Konduga L.G.A)… Yakuburi … Puch’chu … Nordi … Ngulo Awaje …Modu Kur …(Jere L.G.A) … Masarmari …Tungushe … (Magumeri L.G.A) … Kollo Koro … Dogorgor … Bam Bam …. Kineram … Gambayakku Dambusaram 1
st major resting point Zuntuwa during rainy season …
Kamandawa … Aja Bujarti … Sheik Dahab … Goshaldi- Zaiwa … Bam Bam … Sheik Daboram 2nd
major resting point … Fafari Kaji jiwa … During the rains Belokola 3
rd resting point for a month
2nd
Route Amshakime … (Konduga L.G.A) … Kelewa … Amchubul … Alli Betti … Bisi … Bime … Katal Karam … Kashuwa … Mainari … Ajiri … Mayinta Malimri … Kolori … Dubuwa … Gasa Gambaraji … 4
th resting point …Balage …
Umorondon …. 3
rd route
(Bama L.G.A) …Kulburi … Garno … Gozombon ….Tokoba … Bungel … Digira … Lamudi Kagilmari … Malge … Kajata … Ndabaga … Brasiri … Dembam … Naba … Braho … Ngarada … Jaddana … Duguma … Back to Cameroon Republic.
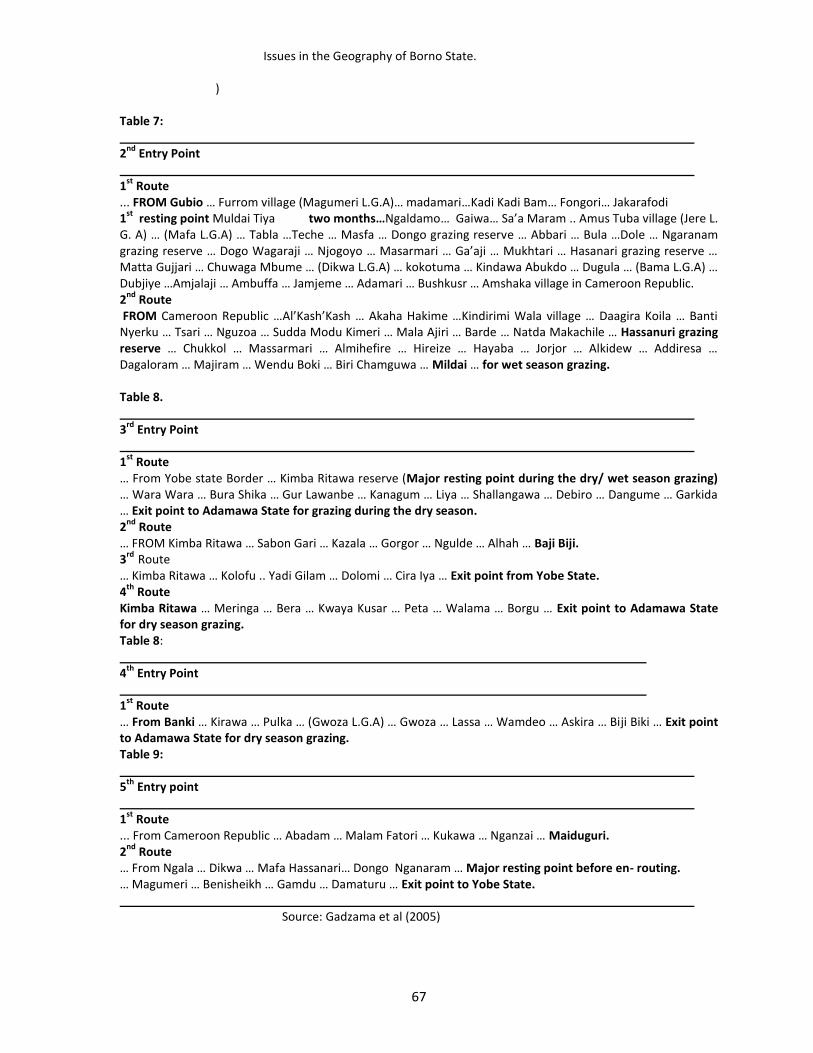
Issues in the Geography of Borno State.
)
67
Table 7: 2
nd Entry Point
1
st Route
... FROM Gubio … Furrom village (Magumeri L.G.A)… madamari…Kadi Kadi Bam… Fongori… Jakarafodi 1
st resting point Muldai Tiya two months…Ngaldamo… Gaiwa… Sa’a Maram .. Amus Tuba village (Jere L.
G. A) … (Mafa L.G.A) … Tabla …Teche … Masfa … Dongo grazing reserve … Abbari … Bula …Dole … Ngaranam grazing reserve … Dogo Wagaraji … Njogoyo … Masarmari … Ga’aji … Mukhtari … Hasanari grazing reserve … Matta Gujjari … Chuwaga Mbume … (Dikwa L.G.A) … kokotuma … Kindawa Abukdo … Dugula … (Bama L.G.A) … Dubjiye …Amjalaji … Ambuffa … Jamjeme … Adamari … Bushkusr … Amshaka village in Cameroon Republic. 2
nd Route
FROM Cameroon Republic …Al’Kash’Kash … Akaha Hakime …Kindirimi Wala village … Daagira Koila … Banti Nyerku … Tsari … Nguzoa … Sudda Modu Kimeri … Mala Ajiri … Barde … Natda Makachile … Hassanuri grazing reserve … Chukkol … Massarmari … Almihefire … Hireize … Hayaba … Jorjor … Alkidew … Addiresa … Dagaloram … Majiram … Wendu Boki … Biri Chamguwa … Mildai … for wet season grazing. Table 8. 3
rd Entry Point
1
st Route
… From Yobe state Border … Kimba Ritawa reserve (Major resting point during the dry/ wet season grazing) … Wara Wara … Bura Shika … Gur Lawanbe … Kanagum … Liya … Shallangawa … Debiro … Dangume … Garkida … Exit point to Adamawa State for grazing during the dry season. 2
nd Route
… FROM Kimba Ritawa … Sabon Gari … Kazala … Gorgor … Ngulde … Alhah … Baji Biji. 3
rd Route
… Kimba Ritawa … Kolofu .. Yadi Gilam … Dolomi … Cira Iya … Exit point from Yobe State. 4
th Route
Kimba Ritawa … Meringa … Bera … Kwaya Kusar … Peta … Walama … Borgu … Exit point to Adamawa State for dry season grazing. Table 8: 4
th Entry Point
1
st Route
… From Banki … Kirawa … Pulka … (Gwoza L.G.A) … Gwoza … Lassa … Wamdeo … Askira … Biji Biki … Exit point to Adamawa State for dry season grazing. Table 9: 5
th Entry point
1
st Route
... From Cameroon Republic … Abadam … Malam Fatori … Kukawa … Nganzai … Maiduguri. 2
nd Route
… From Ngala … Dikwa … Mafa Hassanari… Dongo Nganaram … Major resting point before en- routing. … Magumeri … Benisheikh … Gamdu … Damaturu … Exit point to Yobe State. Source: Gadzama et al (2005)
68
10 Rural Transport in Kala Balge Local Government Area MOHAMMED ABBA JIMME Department of Geography, University of Maiduguri MUHAMMAD WAZIRI Department of Geography, University of Maiduguri Introduction Transportation has been generally regarded as a very crucial part of the society and plays a key role in the development process of any area (Gbadamosi, 1997). Roads have been recognized as important means of opening up rural areas.They help to move goods, services, passengers and other required inputs for rural development to and from rural areas and make goods and services available to those who needed them (Ofoegbu, 1978). Available figures shows that nearly 58% of the roads are in the rural areas giving a ratio of 59 miles and 83 miles for urban and rural roads respectively(Lele,1989).However, many of the rural areas are inaccessible during the rainy season. It was also been observed that in the Sub Saharan Africa, two third of the population live in the rural areas, travel along roads and seasonal tracks that are rarely maintained and walk along treacherous paths and foot bridges to obtain water, fire wood and to reach markets, schools and clinics (RTTP 1997). Besides walking, non motorized vehicles such as bicycles, wheel barrows, pack donkeys and carts, are the primary means of transport. In response to the need for the development of the transport sector of the rural areas, the Federal Government has been allocating funds for special projects for the construction, rehabilitation and expansion of roads. This is reflected in the various government development plans such as rolling plans for the 1
st, 2
nd 3
rd
and 4th
period. Such plans were supplemented each time by other supporting programmes like the Integrated Rural Development (IRD), National Road Development Fund (NRDF), Directorate of Foods Roads and Rural Infrastructure (DFFRI) and Petroleum (Special) Trust Fund (PTF). Although, the ADP
S, RBDA
S, the defunct DFFRI
and NALDA made some head way in the provision of rural feeder/farm roads. However, the facilities provided were not fully consolidated in the given period of time due to changes in government policy direction, which either led to the phasing out of those institutions or the refocusing of their mandates (NEPAD, 2003). Most projects have largely been concentrated in the urban environments (Mshelia, 1989). Emphasis is on the development and improvement of intra and intercity roads transport services. In essence, the existing transport system in the country has not stimulated enough socio economic integration in most Nigeria’s rural areas. This is because wide variations exist in the available transport facilities in different parts of the country. Rural transport system has generally been seriously neglected in the area of policy implementation in most parts of the country. As a result places like Kala Balge have not benefited much. The state of transport system in the area is grossly under developed. A greater part of the area still remains in accessible during the rainy season thus retarding the opening up of the area for development. This situation is a constraint for the full utilization of the area’s resources which had among others contributed to the deterioration of rural life as manifested in ineffective and inadequate commercial activities in the area. This Chapter therefore, examines the rural transport situation in Kala Balge LGA of Borno State.
Materials and Methods The data used for this paper included information on the daily travel behavior of individuals, distances from the individual settlements to where they get access to their social amenities such as drinking water, health facilities, schools, grinding mills, markets, fuel wood and socio- cultural uses as well as means for travels. This data was sourced from field observation, use of structured and unstructured interview schedules as well as

Issues in the Geography of Borno State.
)
69
Focus Group Discussion (FGD). The level of transport development was assessed based on the available number and types of roads and vehicles used in the area. Information was also obtained from National Union of Road Transport Workers (NURTW), motor parks, works and transport department of Kala Balge local government council and the Nigerian television Authority (NTA).Other data included both published and unpublished materials such as text books, dissertation, journals and documentaries from the information unit of Kala Balge LGA. The LGA has three districts i.e Rann, Jarawa and Kala with 108 settlements. A total of four (4) settlements were selected from each of the districts.The areas selected were Rann, Kala, Chauwa as most accessible, Sigal, Daima, Jilbe, Wumbi as moderately accessible and Makandri, Sabkara, Sausawa, Koma Kaudi and Gozalful as least accessible areas (Fig 2). About eighty percent (80%) of the respondents are illiterates, therefore three (3) research assistants who speak the local languages were employed and trained and assisted in the administration of the interview schedules. A total of fifty (50) and twenty (20) interview schedules were administered in major and minor settlements respectively. Thirty (30) transport operators, twenty (20) traders and fifty council officials were also interviewed. An FGD was conducted with age groups of between 18 – 50 years. Key informants included the council chairman, councilors, school teachers, health workers, business men, traders, traditional rulers as well as elders. A total of five hundred and seventy (570) respondents were interviewed. Twelve (12) FGDs were held in six (6) sample settlements. The data generated were analyzed using statistical techniques such as percentage and Road Network Density (RND). The RND was measured using the Ginsburg (1961) Road Network density index. This index is the total length of the road networks (L) divided by the Area which it covers (A).
Study Area Kala Balge LGA is located to the extreme North eastern part of Borno state, between latitudes 11
o 45’ N and
12o 20’ N and longitudes 14
o 15’E and 14
o 40’E.It shares an international boundary with Cameroun Republic to
the East and local boundaries with Ngala LGA to the north west, Dikwa LGA to the south west and Bama LGA to the southern part and to the far north the Area is bounded by the Lake Chad (Fig 1). Kala Balge has an estimated population of 47,257 (NPC, 2006), with a density of 27 persons per square Kilometer. It covers a total land mass of 1750km
2.
Topography of the area consists of a single vast plain rising to an average height of 300 – 400 meters above sea level and slope into the Lake Chad depression in the North. (Bunneth & Okunrotifa, 1984). This is evident from the course of the rivers Elbeid, Sarbowel, Nbuli and Kalia which empty their water into the Lake Chad. The area lies within the Sudano Sahelian climatic region which exhibits a well marked wet and dry season. The climate is relatively uniform through out the area. The vegetation is grass land dotted with trees, which are stunted and twisted in appearance with hard corky bark. The trees are thorny and have small leaves with height ranging from two to seven meters (2 – 7m). This consists of scattered acacia trees, gum Arabic and few xerophytes such as cactus. The soils of the area comprise of heavy clays called “firki” or “firgi” by the Shuwa Arabs and the Kanuris respectively (Skorupinski et al, 1995). In some locations clay layers may be up to three meters thick. Temperature is sufficient for plant growth all year round and rains are convectional usually received in the after noon and evening during the wet season. Thus rainfall is not only short in duration but is also very scanty in amount (500 – 700mm) very erratic and highly variable over space reaching its peak in August and September The people are mostly Shuwa Arab, few Kanuri and Kotoko dominates the area. The major economic activities of the people of the area are farming, livestock rearing and fishing. Crops grown include guinea corn, maize, beans and garden crops such as Onions, tomatoes, Pepper, Gorongo, Garden Egg, Okro as well as livestock rearing mainly cattle, goats and sheep which supplement income from farming.
Reproductive Health Indicators in selected Communities in Maiduguri, Jere and Bama LGAs: A Survey Report
70
Results and Discussions
The Role of Transport. Man’s daily activities both socio economic and political are greatly influenced by transportation (Baima,1991).Transportation network in the rural areas play a necessary part not only in providing for movement of goods and services but also improves accessibility and disseminates ideas. Transportation therefore plays a very vital role both during the dry and rainy season in this area. Traveling is a very important factor in achieving any need either domestic or official. The mode and means of transportation is also important in making the trip efficient and reliable. In rural areas, travels usually falls into two distinct categories on farm and off farm (Barwell, 1996). Most of the on farm or village task is for domestic subsistence purposes such as the gathering of fire wood and collecting water with some activities such as transporting farm implement, seeds and fertilizers to the field being indirectly related to economic purposes. Off farm village travels is usually done to get access to schools, health centers, shops and public offices and for socially related travels. Transportation System
Road Network Kala Balge is linked to other LGA councils namely Bama, Ngala and Dikwa by three major dry season laterite roads. There are few inter village roads. The existing dry season roads are all untarred. There are six available routes which most vehicles ply. These routes are Gambaru – Rann – Sigal, Gambaru – Daima – Kala, Gambaru – Kala – Jilbe, Gambaru – Aukula – Malumri, Gambaru – Wumbi and Bama – Gulumba – Jarawa – Kala. Over 40% of the vehicles ply the Gambaru – Rann – Sigal with Gambaru – Wumbi as the least patronized route, while Bama –Gulumba – Jarawa – Kala was abandoned because of the activity of armed bandits (Table 2). Vehicles ply these routes once a week. There are few other routes used by smugglers but they are not useful in terms of easing transportation problem because the people have no access to their services. The calculated road density of the area is only 10.4 which is regarded to be very low and may not encourage accessibility. Passengers pay N 350 to N1200 depending on the distance to be covered and at times changes in fuel prices (Table 2). In most cases passengers pay fares for the last destination even when they are covering half of the journey. This is attributed to the fact that not all passengers reach the last destination. Rolling Stock The nature of the environment determines the types of vehicles to be operated in the area. The efficiency and inefficiency of flow of goods, services and people rely very much on the transport facilities available and used. Over 95% of the area consists of clay soil making the roads rough during the dry season and muddy in the rainy season. Only four wheel drive (4WD) vehicles such as Land rovers, Land Cruisers, Dyna and few Mercedes 911 Lorries to ply these roads. This condition led to the availability of limited vehicles to transport goods and services within and outside the study area. The area is generally served by human porterage, motorcycles, bicycles, draught animals and engine boats and paddled boats that serve as means of water transport. Human Porterage: This is the oldest and most common form of transport in the past. It is by far the most difficult because it has to do with human energy. People transport farm produce by carrying them on their head or shoulders. During the rainy season it is the only form of transportation as the area is mostly flooded (Table 1). Motorcycles: This is common but expensive means of transportation in the area during the dry season. They are always available for those who can afford them, hence the least patronized. The charges range from N500 to as much as N2000 depending on the distance covered or route. Most cyclists are patronized mostly for emergency services. The highest patronage comes from the council officials (Table 1).
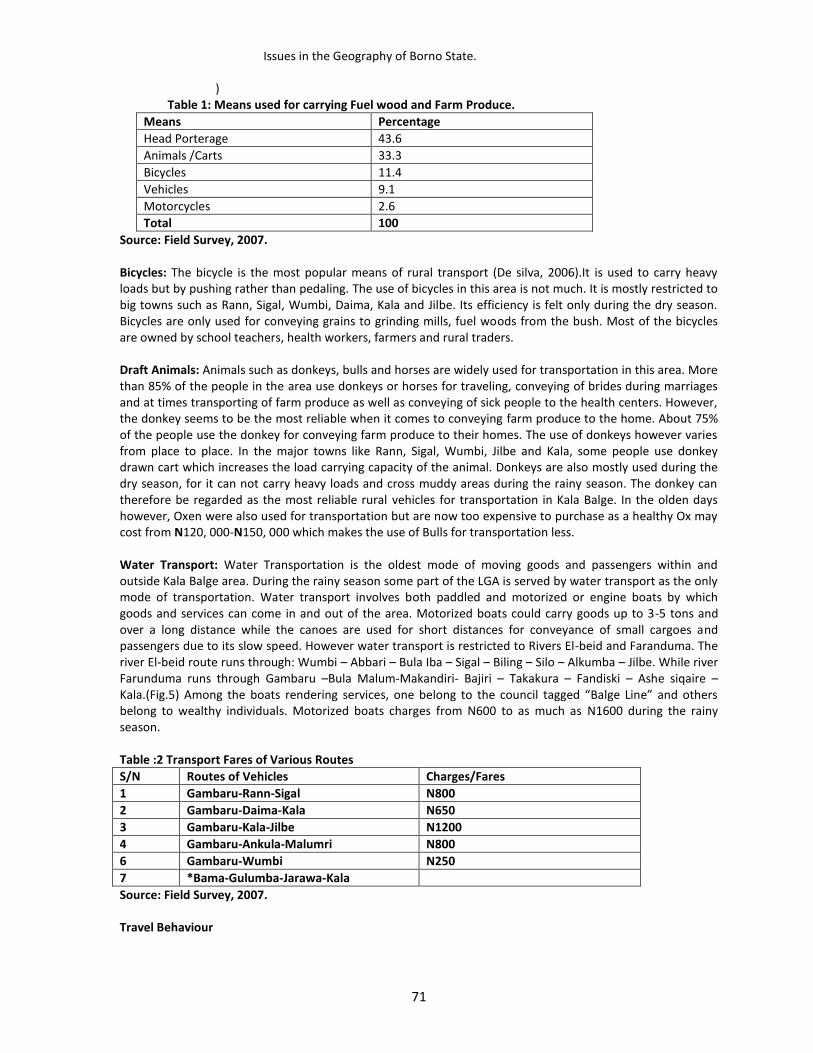
Issues in the Geography of Borno State.
)
71
Table 1: Means used for carrying Fuel wood and Farm Produce.
Means Percentage
Head Porterage 43.6
Animals /Carts 33.3
Bicycles 11.4
Vehicles 9.1
Motorcycles 2.6
Total 100
Source: Field Survey, 2007.
Bicycles: The bicycle is the most popular means of rural transport (De silva, 2006).It is used to carry heavy loads but by pushing rather than pedaling. The use of bicycles in this area is not much. It is mostly restricted to big towns such as Rann, Sigal, Wumbi, Daima, Kala and Jilbe. Its efficiency is felt only during the dry season. Bicycles are only used for conveying grains to grinding mills, fuel woods from the bush. Most of the bicycles are owned by school teachers, health workers, farmers and rural traders.
Draft Animals: Animals such as donkeys, bulls and horses are widely used for transportation in this area. More than 85% of the people in the area use donkeys or horses for traveling, conveying of brides during marriages and at times transporting of farm produce as well as conveying of sick people to the health centers. However, the donkey seems to be the most reliable when it comes to conveying farm produce to the home. About 75% of the people use the donkey for conveying farm produce to their homes. The use of donkeys however varies from place to place. In the major towns like Rann, Sigal, Wumbi, Jilbe and Kala, some people use donkey drawn cart which increases the load carrying capacity of the animal. Donkeys are also mostly used during the dry season, for it can not carry heavy loads and cross muddy areas during the rainy season. The donkey can therefore be regarded as the most reliable rural vehicles for transportation in Kala Balge. In the olden days however, Oxen were also used for transportation but are now too expensive to purchase as a healthy Ox may cost from N120, 000-N150, 000 which makes the use of Bulls for transportation less.
Water Transport: Water Transportation is the oldest mode of moving goods and passengers within and outside Kala Balge area. During the rainy season some part of the LGA is served by water transport as the only mode of transportation. Water transport involves both paddled and motorized or engine boats by which goods and services can come in and out of the area. Motorized boats could carry goods up to 3-5 tons and over a long distance while the canoes are used for short distances for conveyance of small cargoes and passengers due to its slow speed. However water transport is restricted to Rivers El-beid and Faranduma. The river El-beid route runs through: Wumbi – Abbari – Bula Iba – Sigal – Biling – Silo – Alkumba – Jilbe. While river Farunduma runs through Gambaru –Bula Malum-Makandiri- Bajiri – Takakura – Fandiski – Ashe siqaire – Kala.(Fig.5) Among the boats rendering services, one belong to the council tagged “Balge Line” and others belong to wealthy individuals. Motorized boats charges from N600 to as much as N1600 during the rainy season. Table :2 Transport Fares of Various Routes
S/N Routes of Vehicles Charges/Fares
1 Gambaru-Rann-Sigal N800
2 Gambaru-Daima-Kala N650
3 Gambaru-Kala-Jilbe N1200
4 Gambaru-Ankula-Malumri N800
6 Gambaru-Wumbi N250
7 *Bama-Gulumba-Jarawa-Kala
Source: Field Survey, 2007. Travel Behaviour
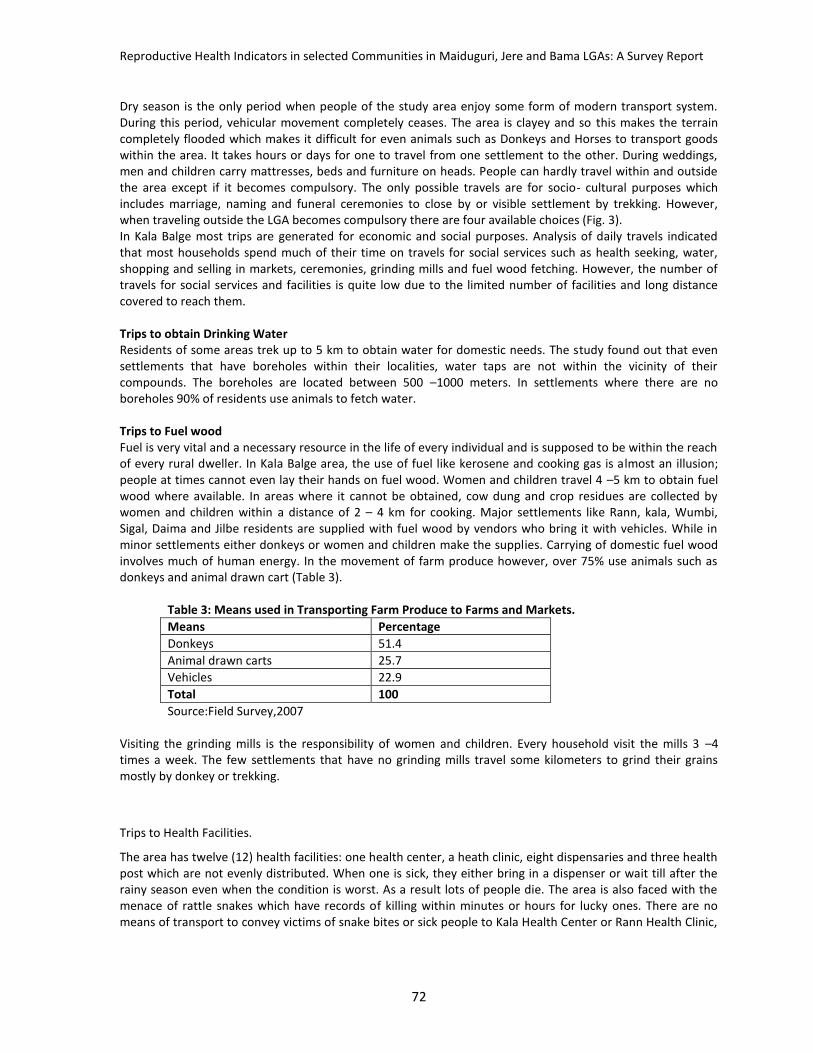
Reproductive Health Indicators in selected Communities in Maiduguri, Jere and Bama LGAs: A Survey Report
72
Dry season is the only period when people of the study area enjoy some form of modern transport system. During this period, vehicular movement completely ceases. The area is clayey and so this makes the terrain completely flooded which makes it difficult for even animals such as Donkeys and Horses to transport goods within the area. It takes hours or days for one to travel from one settlement to the other. During weddings, men and children carry mattresses, beds and furniture on heads. People can hardly travel within and outside the area except if it becomes compulsory. The only possible travels are for socio- cultural purposes which includes marriage, naming and funeral ceremonies to close by or visible settlement by trekking. However, when traveling outside the LGA becomes compulsory there are four available choices (Fig. 3). In Kala Balge most trips are generated for economic and social purposes. Analysis of daily travels indicated that most households spend much of their time on travels for social services such as health seeking, water, shopping and selling in markets, ceremonies, grinding mills and fuel wood fetching. However, the number of travels for social services and facilities is quite low due to the limited number of facilities and long distance covered to reach them. Trips to obtain Drinking Water Residents of some areas trek up to 5 km to obtain water for domestic needs. The study found out that even settlements that have boreholes within their localities, water taps are not within the vicinity of their compounds. The boreholes are located between 500 –1000 meters. In settlements where there are no boreholes 90% of residents use animals to fetch water.
Trips to Fuel wood Fuel is very vital and a necessary resource in the life of every individual and is supposed to be within the reach of every rural dweller. In Kala Balge area, the use of fuel like kerosene and cooking gas is almost an illusion; people at times cannot even lay their hands on fuel wood. Women and children travel 4 –5 km to obtain fuel wood where available. In areas where it cannot be obtained, cow dung and crop residues are collected by women and children within a distance of 2 – 4 km for cooking. Major settlements like Rann, kala, Wumbi, Sigal, Daima and Jilbe residents are supplied with fuel wood by vendors who bring it with vehicles. While in minor settlements either donkeys or women and children make the supplies. Carrying of domestic fuel wood involves much of human energy. In the movement of farm produce however, over 75% use animals such as donkeys and animal drawn cart (Table 3). Table 3: Means used in Transporting Farm Produce to Farms and Markets.
Means Percentage
Donkeys 51.4
Animal drawn carts 25.7
Vehicles 22.9
Total 100
Source:Field Survey,2007 Visiting the grinding mills is the responsibility of women and children. Every household visit the mills 3 –4 times a week. The few settlements that have no grinding mills travel some kilometers to grind their grains mostly by donkey or trekking.
Trips to Health Facilities.
The area has twelve (12) health facilities: one health center, a heath clinic, eight dispensaries and three health post which are not evenly distributed. When one is sick, they either bring in a dispenser or wait till after the rainy season even when the condition is worst. As a result lots of people die. The area is also faced with the menace of rattle snakes which have records of killing within minutes or hours for lucky ones. There are no means of transport to convey victims of snake bites or sick people to Kala Health Center or Rann Health Clinic,
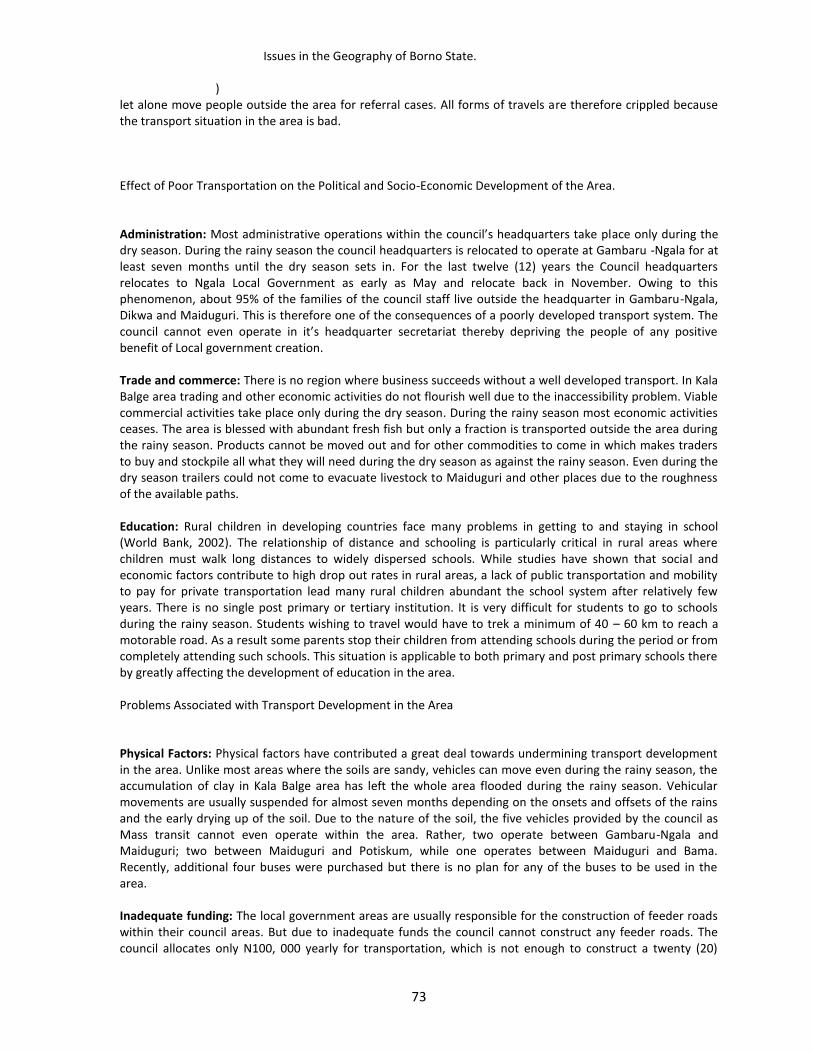
Issues in the Geography of Borno State.
)
73
let alone move people outside the area for referral cases. All forms of travels are therefore crippled because the transport situation in the area is bad.
Effect of Poor Transportation on the Political and Socio-Economic Development of the Area.
Administration: Most administrative operations within the council’s headquarters take place only during the dry season. During the rainy season the council headquarters is relocated to operate at Gambaru -Ngala for at least seven months until the dry season sets in. For the last twelve (12) years the Council headquarters relocates to Ngala Local Government as early as May and relocate back in November. Owing to this phenomenon, about 95% of the families of the council staff live outside the headquarter in Gambaru-Ngala, Dikwa and Maiduguri. This is therefore one of the consequences of a poorly developed transport system. The council cannot even operate in it’s headquarter secretariat thereby depriving the people of any positive benefit of Local government creation.
Trade and commerce: There is no region where business succeeds without a well developed transport. In Kala Balge area trading and other economic activities do not flourish well due to the inaccessibility problem. Viable commercial activities take place only during the dry season. During the rainy season most economic activities ceases. The area is blessed with abundant fresh fish but only a fraction is transported outside the area during the rainy season. Products cannot be moved out and for other commodities to come in which makes traders to buy and stockpile all what they will need during the dry season as against the rainy season. Even during the dry season trailers could not come to evacuate livestock to Maiduguri and other places due to the roughness of the available paths.
Education: Rural children in developing countries face many problems in getting to and staying in school (World Bank, 2002). The relationship of distance and schooling is particularly critical in rural areas where children must walk long distances to widely dispersed schools. While studies have shown that social and economic factors contribute to high drop out rates in rural areas, a lack of public transportation and mobility to pay for private transportation lead many rural children abundant the school system after relatively few years. There is no single post primary or tertiary institution. It is very difficult for students to go to schools during the rainy season. Students wishing to travel would have to trek a minimum of 40 – 60 km to reach a motorable road. As a result some parents stop their children from attending schools during the period or from completely attending such schools. This situation is applicable to both primary and post primary schools there by greatly affecting the development of education in the area. Problems Associated with Transport Development in the Area
Physical Factors: Physical factors have contributed a great deal towards undermining transport development in the area. Unlike most areas where the soils are sandy, vehicles can move even during the rainy season, the accumulation of clay in Kala Balge area has left the whole area flooded during the rainy season. Vehicular movements are usually suspended for almost seven months depending on the onsets and offsets of the rains and the early drying up of the soil. Due to the nature of the soil, the five vehicles provided by the council as Mass transit cannot even operate within the area. Rather, two operate between Gambaru-Ngala and Maiduguri; two between Maiduguri and Potiskum, while one operates between Maiduguri and Bama. Recently, additional four buses were purchased but there is no plan for any of the buses to be used in the area.
Inadequate funding: The local government areas are usually responsible for the construction of feeder roads within their council areas. But due to inadequate funds the council cannot construct any feeder roads. The council allocates only N100, 000 yearly for transportation, which is not enough to construct a twenty (20)

Reproductive Health Indicators in selected Communities in Maiduguri, Jere and Bama LGAs: A Survey Report
74
meter of tarred road (Jimme, 2002). In June 2001, it was estimated that the sum of N600, 000,000 was needed to construct the 40km road between Gambaru and Rann. The meager amount being allocated by the council alone cannot cope with such an amount in even five years.
Low level of Vehicular Traffic: The availability and reliability of any form of transport in an area is very important. In Kala Balge Local government area one problem facing the development of transport is adequate vehicles in the area. A person wishing to travel waits for hours and at times even days to get a vehicle. Most dwellers avoid the routes because of the poor condition of roads and coupled with the scarcity of petroleum products. Government Policies and Attitudes toward Transport Development
Although the role of transport is acknowledged by National policy to be a positive catalyst for progress, policy makers often lack an understanding of the particular transport problem faced by poor rural and urban communities (Barwell, 1996). Consequently, effort to improve transport facilities in developing countries rarely benefits the poor. Priority is usually given to developing large scale roads system for motor traffic encouraging the use of private motorized vehicles. Development like this do not meet the transport need of the poor especially those in rural areas where most of the villages are situated far away from the vehicular roads and rural township.
Conclusion
There is no doubt that government has made some concerted efforts to improve the accessibility problems of the rural areas. However, this effort has not been very effective most especially when it comes to implementation of transport policies. Investment in appropriate transport intervention for rural communities can make a real impact on lives and livelihoods by improving people’s access to markets and reducing the time spent by women and children on daily tasks. Equally, improving access and mobility of the isolated poor paves the way for access to services and more opportunities. By improving transport, poorer people are able to access markets where they can buy or sell goods for income, make better use of essential services such as health and education and keep abreast of social, economic and political development happenings in their country. And if effort is not made to arrest this situation, it can further lead to continuous under development of our rural communities such as Kala Balge.
Recommendations
The government should try and develop a comprehensive transport planning policy towards improving rural transport with all tiers of government involved in the implementation process. At least two roads should also be constructed from Gambaru to Jilbe to Bama via Kala. The State mass transit should be extended to the rural areas using four wheel drive vehicles and the provision of more engine boats by the council to boost water transportation.
REFERENCE
Baima, K.D. (1991) The role of Transport in Urban Development, A Case Study of Bauchi Metropolis
Unpublished B.Sc. Final Year Essay, Department of Geography, University of Maiduguri. Pp 1 – 42.
Barwell, I. (1996) Transport and the Village, Findings from African Village Travel and Transport Survey &
Issues in the Geography of Borno State.
)
75
Related Studies. Discussion Paper No 344, Africa Region Serves, World Bank Washington, DC.
Bunneth, R.B and Okunrotifa, P. O. (1984) General Geography in Diagram for West Africa, Longman, London. Pp 58 – 61.
De Silva, (1996) Rural Transport Planning. RTTP Approach Paper.Working Paper, 20. World Bank, Sub- Saharan Africa Transport policy Programme, Africa Technical Department, Washington, D.C.
Encyclopedia, (1978) The American International Education, American Corporation Vol. 27 pp 16- 26.
Encyclopedia, (1978) The American International Education, American Corporation Vol. 27 pp 16- 26.
Filani, M.O. and Onyemelukwe, J.O.C. (1979)” Road Transport in Nigeria, In Barbous, K.M (1982) Nigeria in Maps, Hodder and Stoughton p 214.
Gbadamosi, K.T. (1997) “Rural Accessibility Problem: An Impediment to Rural Development in Nigeria” Paper presented at NGA 40
th Annual Conference, Bayero University, Kano. Pp 1 – 9.
Ginsburg, N. (1961) Atlas of Economic Development, University Press, Chicago. P 120.
Jimme, M. A. (2002) Rural Transport in Kala Balge Local Government Area of Borno State. An unpublished M.Sc. Thesis. Dept of Geography University of Maiduguri Pp1 – 75.
Lele, U. (1976) Rural Development Strategies, Baltimore of London. Pp 12 – 19.
Mshelia,G.G.(1989) Rural Roads as an agent of rural development in Biu Local Government area of Borno State. Unpublished M.Sc Thesis, Dept of Geography, University of Maiduguri pp24.
NPC, (2005) National Population Commission Projected population for 2005.
NEPAD, (2003) New Partnership for Africa’s Development: Report on the Activities of the NEPAD National Committee on Rural Development.
Ofoegbu,P.A. (1978) Institutional and Spatial Framework for Rural Development. A Book of Abstract” In Resource Mobilization for Rural Development pp 56-58.
R.T.T.P,(1997) Rural Travels and Transport Programme, Sub-Saharan Africa Transport Policy Programme (SSATP). Pp 1-5.
Reproductive Health Indicators in selected Communities in Maiduguri, Jere and Bama LGAs: A Survey Report
76
Skorupinski,T; Gronenborn,D;Wiesmuller,B. & Barbara,Z.(1995) Settlement History of Kala Balge Region. In Proceedings International Symposium. SFB268. Frankfurt/Maim.pp 203-207
World Bank, (2002) Rural Transport Services and Intermediate Means of Transport, World Bank Working Paper, Retrieved 19/12/2004 http://www.worldbank.org/transport/rural_tr/rts_imt.htm
Issues in the Geography of Borno State.
)
77
11 Crop farming in Borno State: Prospects for Increased Output and Challenges. BABA GANA JUGUDUM KABIR Department of Crop Protection, Faculty of Agriculture, University of Maiduguri. BABA GANA ABBA GAMBO Department of Crop Production, Faculty of Agriculture, University of Maiduguri Introduction Agriculture has undoubtly been recognized as the oldest profession known to man. It is the important sector of Nigeria’s economy contributing 42% of Gross Domestic products (GDP) in 2007. Agriculture employs 42 % of the country’s total labour force. (CADP, 2006 ; Dujge et al., 2005). Borno state which is located in the north eastern part of Nigeria has a total land area of 70,898 square kilometers, accounting for 7.7% of Nigeria’s land mass. The state spans across three ecological zones and is essentially an agrarian state. Borno has a population of 4,588,668 inhabitants (BOSG, 2008). There are 536,322 farming families in the state, predominantly small holder farmers (NFRA, 2007). Agricultural production activities include crop production, livestock rearing and to a relatively lesser extent fishing. The agroecological conditions in the state permits the cultivation of many food and cash crop such as cereals, grain legumes, tree crops, and vegetables, under both rain fed and irrigated cropping systems. There are high potentials for increasing production and output. However, production is predominantly at subsistence level and the potential are not being realized. Agricultural production is faced by many problems including low inputs, inadequate research and extension services, environmental problems, marketing problem, lack of rural agricultural infrastructure, poor post-harvest handling processing and storage among others. This paper, with focus on crop production, seeks to highlight the current status of production. The prospects the State holds for expansion, the problems faced, and offer recommendations which will give rise to increased and sustainable agricultural production which will undoubted reduce poverty, hunger, unemployment leading to better standard of living of the farming families in Borno State. Physical characteristic OF BORNO state Borno state, geographically located at 11ºN and 13.5ºE is bordering Adamawa, Gombe and Yobe states from the south, south west and west, respectively. It also borders Cameroon Republic from the eastern part and Chad Republic along the north - eastern part of Lake Chad and Niger Republic from the north. The three ecological zones namely northern guinea savannah, Sudan savannah and Sahel savannah cover the southern, central and northern parts of the state, respectively (BOSG, 2008; LCRI, 2008; Maina et al., 2006). The hottest time of the year in the state is March to June with maximum day temperature reaching as high as 38.8 ºC for much of Borno and 43.3ºC in the north and north east. December and January are the coldest months when night temperatures fall below 20ºC. The rainy season is normally from June to September in the North and May to October in the South with relative humidity of about 49% and evaporation of 203mm per year (BOSG, 2008). The soils of Borno state are largely sandy in the northern and central parts of the southern part. Clay soil known as “Firgi” covers substantial area from the southern shores of Lake Chad and areas bordering Cameroon Republic. Production of Crop in Borno State Given that Borno State spans across three agro ecological zones several types of crops are grown in the state under both rainfed, irrigated and fadama (residual moisture) systems. These crops include maize, millet, sorghum, rice, wheat, cowpea, groundnut, bambara nut, soybeans, sweet potatoes, Irish potatoes, cocoyam, cotton, sesame, cassava, citrons and different vegetable crops. For cereals and grain legumes land areas under cultivation and yields obtained between 1999 and 2006 are given in Fig. 1 and 2, while for vegetables and cash crops are presented in Fig. 3 and 4, Analysis of these tables shows staggering production. For most crops
Reproductive Health Indicators in selected Communities in Maiduguri, Jere and Bama LGAs: A Survey Report
78
production was low for the period between 2001 and 2004 compared to preceding and subsequent years. However figures for 2005 and 2006 indicate increase in both cultivated land area and harvested yield. Data for many other crops are not available but it could be assumed that they probably follow the same trends in terms of yield and acreage, given that there was stagnation in production for that period. Constraints to agricultural production in Borno State. There are several factors that hinder successful crop production in the state, however for purpose of brevity only few key factors are mentioned here. These include: Environmental problems Environmental factors such as low rainfall, desertification and poor soil fertility present serious obstacles for successful agricultural production. Over the past decades the total amount of rainfall in the Sahel and Sudan Savannahs continued to decline by 15 – 20 % ( Dugje et al., 2005). Even when the total amount is sufficient, the distribution during the cropping season may not be optimum to warrant a good crop harvest. Low rainfall and uneven distribution leads to drought conditions which in turn leads to inefficient input utilization, poor production and poor grazing conditions. The Sahara desert is moving southwards at a rate of 0.6 km yearly ( Olori, 2008). Borno state which is located in the desert region, borders the Sahel savannah vegetation is believed to be naturally affected by deforestation because it experiences less rainfall, high temperature and sparsely covered by vegetation.The human factors also contribute immensely to deforestation in Borno state. Studies show that 84% of the populace rely solely on firewood for cooking. Forest reserves in Borno State are numerous and of varying sizes. A total of 83 consolidated forest reserves exist in the state making up a total land area of 3.5 - 4.0 square kilometers. The Sambiza forest reserve, being the largest forest reserve, has a total land area of 51,839 km. However, because of poor management, these reserves have suffered increasing degradation in the last three decades due to indiscriminate bush burning, empowerment by farmers, pastoralists and poaching of animals (Busuma, 2008). In addition most soils of Borno State are characterized by low organic matter content, low available nitrogen, phosphorus and potassium and low water holding and cation exchange capacities (Rayar, 1987). Inadequate capital and supply of farm inputs Agricultural production in Borno state as in many parts of the country is almost entirely in the hands of resource poor subsistence farmers who depend on unimproved input and rudimentary technology. Most farmers lack modern fixed inputs such as tractors and accompanying implements, harvesters, threshers, storages structures etc.The Borno State Government through the Borno State Agricultural Mechanization Authority (BOSAMA) attempted to salvage the situation but great success in mechanizing farming operations has not been achieved. Most farmers in the state could not afford or access to tractor and implements hiring services. In addition variable inputs such as fertilizers, improved seeds, pesticides which are essential for profitable farming are also lacking. These are further aggravated by the fact that cash resources of farmers are at there lowest level during few months preceding the onset of cropping season and at peak of farm operations. It is known that small holder farmers are not able to source credit from formal sources due largely to lengthy administrative procedures, high cost of obtaining funds and stringent conditions which are too difficult for the numerous small-scale farmers to fulfill. For example it was reported that about 90% of small holder farmers in the north east region still depend on informal sources for their credits (Odo and Gambo, 2003). Problems of weeds, pests and diseases Cultivated crops are subject to attack throughout their growth period by a wide variety of pests and disease as well as being subjected to resource competition from weeds which may host their pest and pathogens. The activities of these organisms reduce gross yield and affects quality resulting in lowered market value. Food and Agriculture Organization of the United Nations estimates one third of all food grown in the world is lost to pests and diseases (Fenemore, 1984).
Issues in the Geography of Borno State.
)
79
Weeds are termed as unwanted plants which compete with cultivated crops for available soil resources. The most significant weeds are the annuals and perennials. In Borno State annuals are serious problems in cereal crops. There are several important weed species found across the state and the amount of labour spent on combating weeds is huge as manual hoeing or preplanning disc harrowing are the main methods used. Of special importance is the parasitic Witch weed (Striga spp) which causes untold yield losses especially in cowpea and sorghum fields. Bad land management, poor seedling establishment and extreme environmental conditions e.g droughts has been described as factors greatly favouring weed growth (Moule, 1995).Pests through their association with crops severely reduce yield and lower produce quality. These pests range from insects to non-insect pests such as snails, mites, birds and rodents. Injury to plants is caused primarily by feeding with the exception of some which transmit diseases. Pest damage to field and horticultural crops in the State is colossal. The pest species found are varied but the most important fall into the groups of insects, birds and rodents. Occasionally total losses of specific crops in certain areas are caused by migratory pests such as locust and quelea birds. In particular, the quelea bird has assumed the status of perennial pest in the State. Added to these are storage losses caused by insects, rodents and microorganisms. Equally important are crop losses due to plant diseases. The term disease is used in relation to pathogenic microorganisms primarily fungi, bacteria and viruses. Marketing Constraints In Nigeria, agricultural marketing process takes place primarily at the farm gate or in periodic local markets (Akande, 1993). Small holder farmers usually lack authentic information about the prevailing market prices, which puts them at a disadvantage (Odo and Gambo, 2003). Generally prices are low at harvest time, rising as the season advances, peaking at planting time when demand for seeds is added onto the regular demand for consumption purposes. However farmers are unable to take advantage of the higher prices as they are compelled to sell most of their produce at harvest time due to lack of storage facilities, poor roads from the rural areas and need for cash income. As a result the advantage of high profit margin available in distant urban markets accrues to middle men. This phenomenon is true to Borno as it is to the whole country. Crop farmers / herdsmen Conflicts Though mildly reported, a serious setback to crop production is the frequent conflict between crop farmers and nomadic /semi-nomadic herdsmen. As a result of these conflicts several lives were lost in addition to loss of property and displacement of people. The destruction of unharvested crop by herding animal results in inestimable crop losses. This development has discouraged many people to quit from crop farming where alternative means of livelihood exists. It also discouraged people from entering the faming business. The overall effect being reduction in number of substantive and potential farmers and decrease in crop output Research and Extension problems A considerable amount of agricultural research has been done and is still carried out in Nigeria to generate new technologies and practices that will increase output at the farm level. However the significance and impact of research on agricultural development in Nigeria have been very little. This is due to the fact that farmers’ yields are still far behind yields obtained at the research stations (Okoro, 1994). On the other hand, agricultural extension is the primary process through which farmers learn the process of change. Through extension services farmers are informed of the novel of farming as well as new technical and economic possibilities developed by research institutes. Research institutes and extension agency must work closely together to achieve their set objectives. One could not achieve its objectives without the other. The aims of agricultural extension services are to boost food production and increase income of rural farmers, improve farm services such a delivery of inputs and improving the quality of rural life. The Borno state Agricultural Development Project shoulders the responsibility of agricultural extension services. Unfortunately agricultural extension activities in Borno State over the recent years have declined due to inadequate funding. Prospects for increased production Among the cereals and grain legumes presented in Fig. 1, all the crops with the exception of rice and wheat are cultivated under rainfed cropping system. For most part success of the crops depends on the amount and
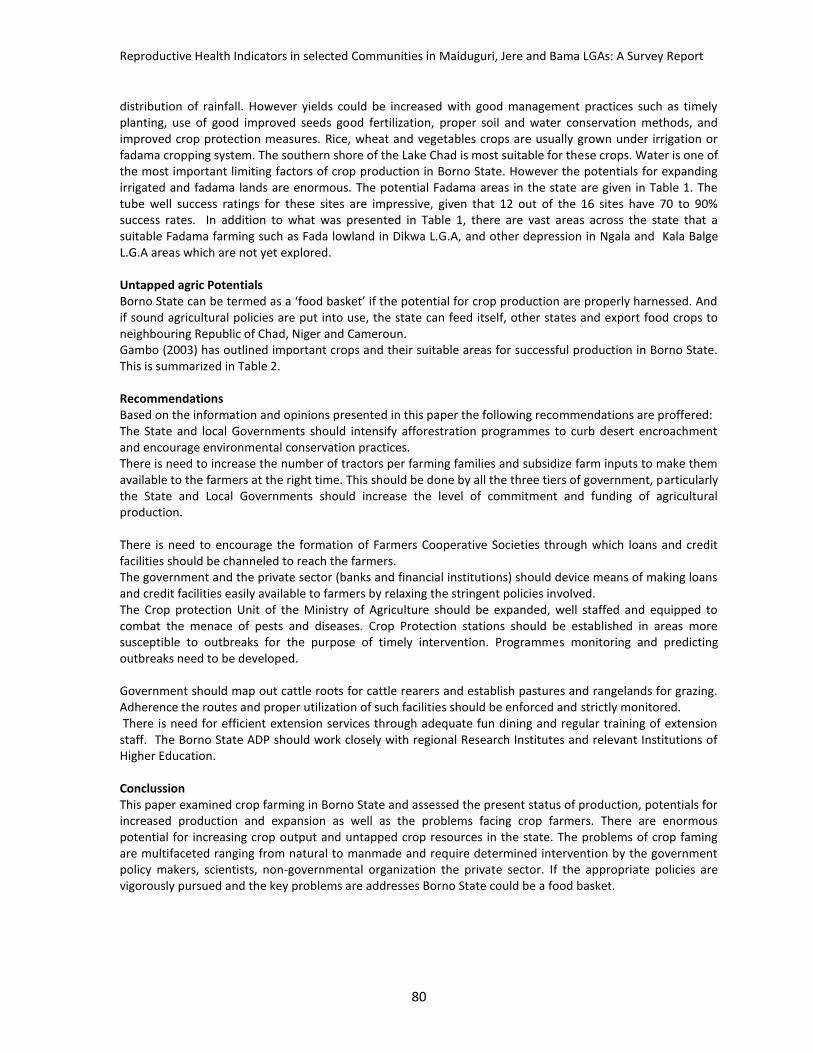
Reproductive Health Indicators in selected Communities in Maiduguri, Jere and Bama LGAs: A Survey Report
80
distribution of rainfall. However yields could be increased with good management practices such as timely planting, use of good improved seeds good fertilization, proper soil and water conservation methods, and improved crop protection measures. Rice, wheat and vegetables crops are usually grown under irrigation or fadama cropping system. The southern shore of the Lake Chad is most suitable for these crops. Water is one of the most important limiting factors of crop production in Borno State. However the potentials for expanding irrigated and fadama lands are enormous. The potential Fadama areas in the state are given in Table 1. The tube well success ratings for these sites are impressive, given that 12 out of the 16 sites have 70 to 90% success rates. In addition to what was presented in Table 1, there are vast areas across the state that a suitable Fadama farming such as Fada lowland in Dikwa L.G.A, and other depression in Ngala and Kala Balge L.G.A areas which are not yet explored. Untapped agric Potentials Borno State can be termed as a ‘food basket’ if the potential for crop production are properly harnessed. And if sound agricultural policies are put into use, the state can feed itself, other states and export food crops to neighbouring Republic of Chad, Niger and Cameroun. Gambo (2003) has outlined important crops and their suitable areas for successful production in Borno State. This is summarized in Table 2. Recommendations Based on the information and opinions presented in this paper the following recommendations are proffered: The State and local Governments should intensify afforestration programmes to curb desert encroachment and encourage environmental conservation practices. There is need to increase the number of tractors per farming families and subsidize farm inputs to make them available to the farmers at the right time. This should be done by all the three tiers of government, particularly the State and Local Governments should increase the level of commitment and funding of agricultural production. There is need to encourage the formation of Farmers Cooperative Societies through which loans and credit facilities should be channeled to reach the farmers. The government and the private sector (banks and financial institutions) should device means of making loans and credit facilities easily available to farmers by relaxing the stringent policies involved. The Crop protection Unit of the Ministry of Agriculture should be expanded, well staffed and equipped to combat the menace of pests and diseases. Crop Protection stations should be established in areas more susceptible to outbreaks for the purpose of timely intervention. Programmes monitoring and predicting outbreaks need to be developed. Government should map out cattle roots for cattle rearers and establish pastures and rangelands for grazing. Adherence the routes and proper utilization of such facilities should be enforced and strictly monitored. There is need for efficient extension services through adequate fun dining and regular training of extension staff. The Borno State ADP should work closely with regional Research Institutes and relevant Institutions of Higher Education. Conclussion This paper examined crop farming in Borno State and assessed the present status of production, potentials for increased production and expansion as well as the problems facing crop farmers. There are enormous potential for increasing crop output and untapped crop resources in the state. The problems of crop faming are multifaceted ranging from natural to manmade and require determined intervention by the government policy makers, scientists, non-governmental organization the private sector. If the appropriate policies are vigorously pursued and the key problems are addresses Borno State could be a food basket.

Issues in the Geography of Borno State.
)
81
References Akande, S. O. (1993). Periodic rural markets in Oyo State. NISER Monograph Series No. 4, Ibadan. BOSG (2008) Borno State Government Official Website. www.bornonigeria.com (Accessed March, 2009). Busuma, M. (2008). Deforestation at its peak in Borno. http://allafrica.com/stories /printable/200810290406.html. (Accessed January, 2009). CAPD, (2008). Commercial agriculture development project. Project information document (PID).
Appraisal Stage. Report No. AB3498. Dugje, I. Y., Gambo, B. A and Kagu A. (2005). Strategies for improving the productivity of rainfed and irrigated
agriculture in Borno state. Maiduguri Journal of Arts and Social Sciences, 3:35-40. Fenemore, P.G. (1984). Plant Pests and their Control. Butterworth & Co (Publishers) Ltd., London. Gambo, B. A. (2003). The untapped agricultural potentials of Borno State. A paper presented at a Workshop
for Local Government Heads of Agriculture Department. International Conference Centre, Musa usman Secretariat. 10 -13th April, 2003., Maiduguri
LCRI, ( 2009). Lake Chad Research Institute, Maiduguri : Review of 2008 Activities. Maina, V. A., Chaudhari, S. U. R., Mshelia, G. D. and Williams, A. (2006). The influence of season and semen
characteristics of Sahel Bucks in Borno State. Journal of Applied Sciences 6:353-356. Moule, G. (1995). ‘Crop Health’ in Soffe, R. (1995) (Ed.) The Agricultural Notebook (19
th Edition). Blackwell
Science Ltd., London. NFRA, (2007).National Food Reserve Agency. 2006 Crop Area and Yield Survey (CAYS) Report. 88pp. Odo , P. E. and Gambo , B. A (2003). Mixed farming in the Sudan Sahelian Zone of Nigeria. A paper presented
at a 3-day Workshop ‘Forestry and Livestock as Tools for Sustainable Economic Development. International Conference Centre, Musa Usman Secretariat, 22 -24.
Okoro, E. G. (1994). Development of research capacity and technology for sustainable agricultural and economic development in Nigeria. Proceedings of a workshop on Nigeria’s agricultural research ,
policy, planning and plan implementation experience and relevance to development. Held at the University of Ibadan. Winrock International Institute for Agricultural Development.
Olori, T. (2008). Desertification Threatens Economy, Food Security. http://ipsnews.net/ riomas10/2608_8.shtml (Accessed 05.07.09) Rayar, A. J. (1987). Studies on some physico-chemical parameters of the soils of Borno state. Annals of Borno,
4:283-291.

82
Table 1: Potential Fadama areas and success rating of well in Borno State
S/no Fadama name Total Fadama area (ha)
Percentage total Success rating of tube well (%)
1 Lake Chad 274,300 56.1 70
2 Komadugu Yobe man 44.600 9.1 90
3 Lower Gongola 12.000 2.5 80
4 Hawul River 13,000 2.8 80
5 Upper Yedzaram 29,800 6.1 70
6 Dangling 9,200 1.9 80
7 Exachia 22,500 4.6 80
8 Bayo 3,500 0.7 90
9 Nagadda 6,500 1.3 70
10 Goya 24,200 4.9 70
11 Hawule 10,900 2.2 50
12 Damboa (Koyari) 11,700 2.4 80
13 Gombole Mussa 15,000 3.1 70
14 Benisheikh 10,000 2.0 50
15 Askira 900 0.2 60
16 Jauaye 600 011 60
Total Total 489,300 100 -
Source: Dugje el al. (2005) Table 2: List of crops and their suitable areas for production in Borno State
Crop Suitable area for production
Vegetables Tomatoes Onion, carrots Cabbage, lettuce Peppers Garden egg Water melon Okra, Garlic
Hawul axis, Nguro soye axis Alau axis Damasak axis Biu, Fada axis Shores of Lake Chad All over the state
Fruits Mango Citrus (Sinensis, Lemon, Paradisis Banana Apples Cashew, Guava, Pomegranate, Tamarind, Boabab
Maiduguri/Jere axis Damboa axis The Southern Borno axis Gamboru/Ngala axis All over the state
Cereals Maize, millet, rice, Sorghum,Wheat, Barley
All over the state,Firgi areas,Shores of Lake Chad
Legumes Cowpea, groundnut, Bambara nut Pigeon pea
All over the state
Source: Gambo (2003)
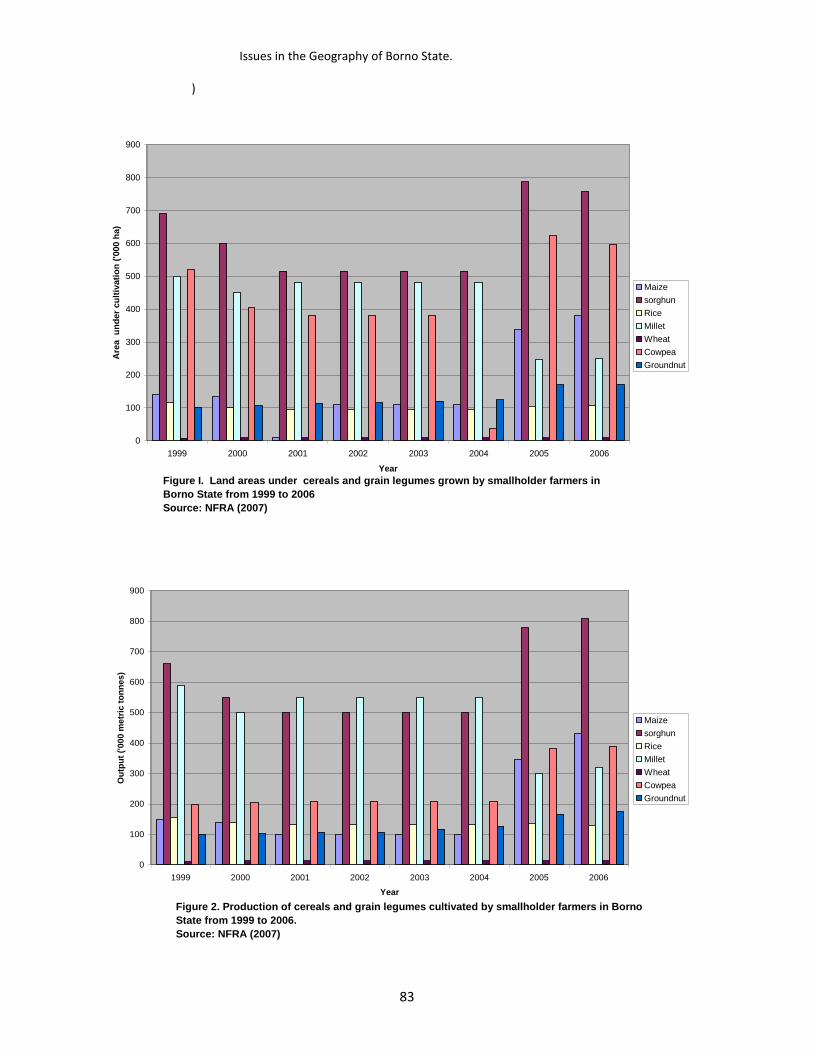
Issues in the Geography of Borno State.
)
83
Figure I. Land areas under cereals and grain legumes grown by smallholder farmers in
Borno State from 1999 to 2006
Source: NFRA (2007)
0
100
200
300
400
500
600
700
800
900
1999 2000 2001 2002 2003 2004 2005 2006
Year
Are
a
un
der
cu
ltiv
ati
on
('0
00 h
a)
Maize
sorghun
Rice
Millet
Wheat
Cowpea
Groundnut
Figure 2. Production of cereals and grain legumes cultivated by smallholder farmers in Borno
State from 1999 to 2006.
Source: NFRA (2007)
0
100
200
300
400
500
600
700
800
900
1999 2000 2001 2002 2003 2004 2005 2006
Year
Ou
tpu
t ('
00
0 m
etr
ic t
on
ne
s)
Maize
sorghun
Rice
Millet
Wheat
Cowpea
Groundnut

Reproductive Health Indicators in selected Communities in Maiduguri, Jere and Bama LGAs: A Survey Report
84
Figure 3. Land area under vegetables and cash crops cultivated by smallholder farmers in
Borno Srate from 1999 to 2006.
Source: NFRA (2007)
0
5
10
15
20
25
30
35
40
1999 2000 2001 2002 2003 2004 2005 2006
Year
Lan
d a
rea (
'000 h
a)
Onion
Okra
Pepper
Tomato
Garden egg
Cocoyam
Cassava
Cotton
Sugarcane
Figure 4. Production of vegetables and cash crop by smallholder farmers in Borno State from
1999 to 2006
Source: NFRA (2007)
0
50
100
150
200
250
300
1999 2000 2001 2002 2003 2004 2005 2006
Year
Ou
tpu
t ('
000 m
etr
ic t
on
nes)
Onion
Okra
Pepper
Tomato
Garden egg
Cocoyam
Cassava
Cotton
Sugarcane

85
SECTION FOUR
HUMAN AND HEALTH ISSUE
86
12 Reproductive Health Indicators in selected Communities in Maiduguri, Jere and Bama LGAs: A Survey Report MUHAMMAD WAZIRI Department of Geography, University of Maiduguri. AMINA SHETTIMA Planned Parenthood Federation of Nigeria, Borno State Branch KAKA GANA ABBA Department of Languages and Linguistics, University of Maiduguri Introduction The reproductive health needs of women in a particular place could hardly be met if the prevailing situations in which women undergo childbearing process are not known. Several factors influence the behaviour of women in safe motherhood practices. The level of knowledge of reproductive health problems, the availability of health facilities, and skilled personnel as well as the social and economic condition of the people in a given place are very important determinants of mothers and children health. This survey reports the situation of some indicators of reproductive health of women in some selected communities in Maiduguri Metroplitan, Jere and Bama local government areas of Borno State. Maiduguri and Jere are urban areas that constitute the capital of Borno State. The population of the area during the 2006 population census was 732,696 people (NPC 2007). However the population is growing very fast due to mass emigration and high birth rate. The current estimate for the two Local government areas is in the tune of 3 million people. As the state capital Maiduguri/Jere have several health facilities including a University Teaching Hospital, specialist Hospital and several private specialist clinics. But in the surveyed communities, Gwange and Maiduwuri, people have problems of accessing the services of health facilities for one reason or another. Bama Local Government headquarters is also an urban setting with a population of about 269,986 during the 2006 census. Its current estimate has tripled this much It is a basically agrarian community but fast growing in commercial activities. It has one general Hospital, an Maternal and Child Health (MCH) clinic and few dispensaries. The survey was undertaken at the kasugula ward. Purpose of the survey The overall objective of the survey was to generate first hand information to show the reproductive health indicators of the women in the target communities. The result was used as a baseline data to assist in identifying problems and plan for appropriate intervention strategy by a Non Governmental Organisation (NGO). Primary data was generated through a questionnaire administered on women aged between 12 and 45 years old in the three communities. A total of one hundred two women were randomly selected in different localities for the questionnaire administeration. The basic indicators of reproductive health and safe motherhood practice investigated from the respondents include social and demographic characteristics of the respondents, reproductive health problems ever encountered, utilisation of health facility as well as knowledge and attitude towards Vesico Viginal Fistula (VVF) and Female genital Mutulation (FGM). Questions were asked on the number of pregnancy ever had, number still birth/ abortions ever had, number of surviving children, ante natal Clinic attendance during last pregnancy, place of delivery of last child, post Natal clinic attendance, quality of services rendered in health facilities, breast feeding practices, level of Male involvement, the Knowledge of VVF, the practice of FGM. Data presentation The data obtained in this survey is presented in a simple percentage tables and figures where each category of response is calculated as a ratio of the total response of the respective category. The sample size compared to the overall population of the communities is too limited. Thus this result should be used cautiously. It is not suitable

Issues in the Geography of Borno State.
)
87
for generalise conclusions. However it gives a rough idea of the picture of the Reproductive Health situation to form a baseline data for the proposed safe motherhood project in the three communities by a team of NGOs, the Planned Parenthood Federation of Nigeria, Borno State Branch and the Young Parents Forum, Maiduguri with a grant from the German Technical Coorporation, (GTZ). Background Characteristics of Respondents The social, cultural and economic characteristics of a person have significant influence on his or her health seeking behaviour. Respondents in the target community in this survey are of different social and economic back ground. Table 1 shows percent distribution of the social and economic characteristics of the respondents. Table 1 Background Characteristics of respondents Age % Level of Education % 15- 24yrs 28 No formal Educ 42 25 –34yrs 36 Islamic Educ 25 35 – 44yrs 20 Primary 17 45yrs + 06 Secondary 11 Post Secondary 03 Religion % Muslim 98 Employment % Christian 02 Housework 45 Petty Trade 40 Marital Status % Pvt Business 02 Single 00 Civil servant 12 Married 94 Agriculture 01 Divorce 04 Window 02 Level of Income (pa) % Undetermine 25 Ethnicity % Less than N50,000 51 Kanuri 36 Up to N100,000 20 Shuwa Arab 44 More than N100,000 04 Babur/Bura 03 Marghi 02 Hausa 08 Others 07 The respondents are predominantly Muslims. More than 64% of them are below 35 years of age while 94% of the women are married. This is an indication of high tendency of child bearing in the communities. The communities are of mixed ethnic groups. Kanuri and Shuwa Arabs are dominant with 80% of the respondents. Cultural differences may account for differing behaviour among women. The level of formal education of women in the communities is very low. Only 16% of the respondents have been to secondary schools or beyond and 45% have never been to any school including Islamic schools. Thus most women in these communities can hardly read or write. Consequently most of them have no economically buoyant jobs to earn a living. About 76% percent hardly earn N138 (barely one dollar) per day. Reproductive Behaviour The number of pregnancy of women is an indication of the level of her fertility and may determine her reproductive health. Figure 1 shows the distribution of the number of pregnancy respondents have experience in their lifetime.
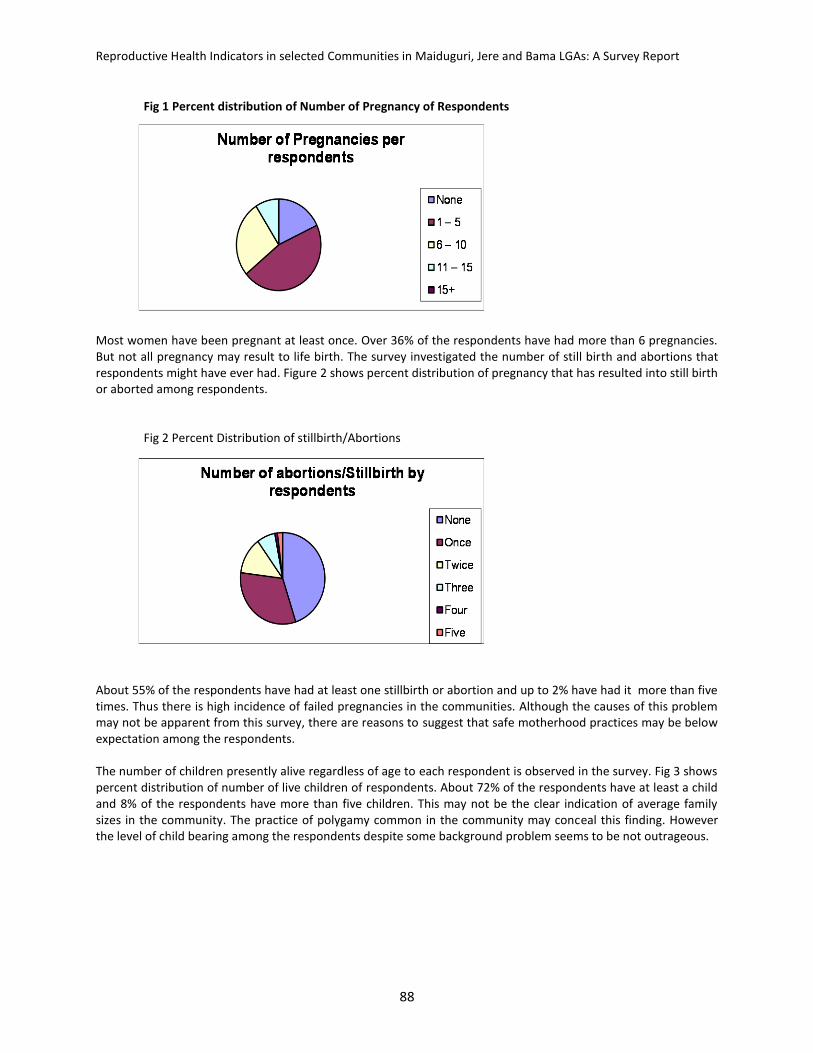
Reproductive Health Indicators in selected Communities in Maiduguri, Jere and Bama LGAs: A Survey Report
88
Fig 1 Percent distribution of Number of Pregnancy of Respondents
Most women have been pregnant at least once. Over 36% of the respondents have had more than 6 pregnancies. But not all pregnancy may result to life birth. The survey investigated the number of still birth and abortions that respondents might have ever had. Figure 2 shows percent distribution of pregnancy that has resulted into still birth or aborted among respondents.
Fig 2 Percent Distribution of stillbirth/Abortions
About 55% of the respondents have had at least one stillbirth or abortion and up to 2% have had it more than five times. Thus there is high incidence of failed pregnancies in the communities. Although the causes of this problem may not be apparent from this survey, there are reasons to suggest that safe motherhood practices may be below expectation among the respondents. The number of children presently alive regardless of age to each respondent is observed in the survey. Fig 3 shows percent distribution of number of live children of respondents. About 72% of the respondents have at least a child and 8% of the respondents have more than five children. This may not be the clear indication of average family sizes in the community. The practice of polygamy common in the community may conceal this finding. However the level of child bearing among the respondents despite some background problem seems to be not outrageous.
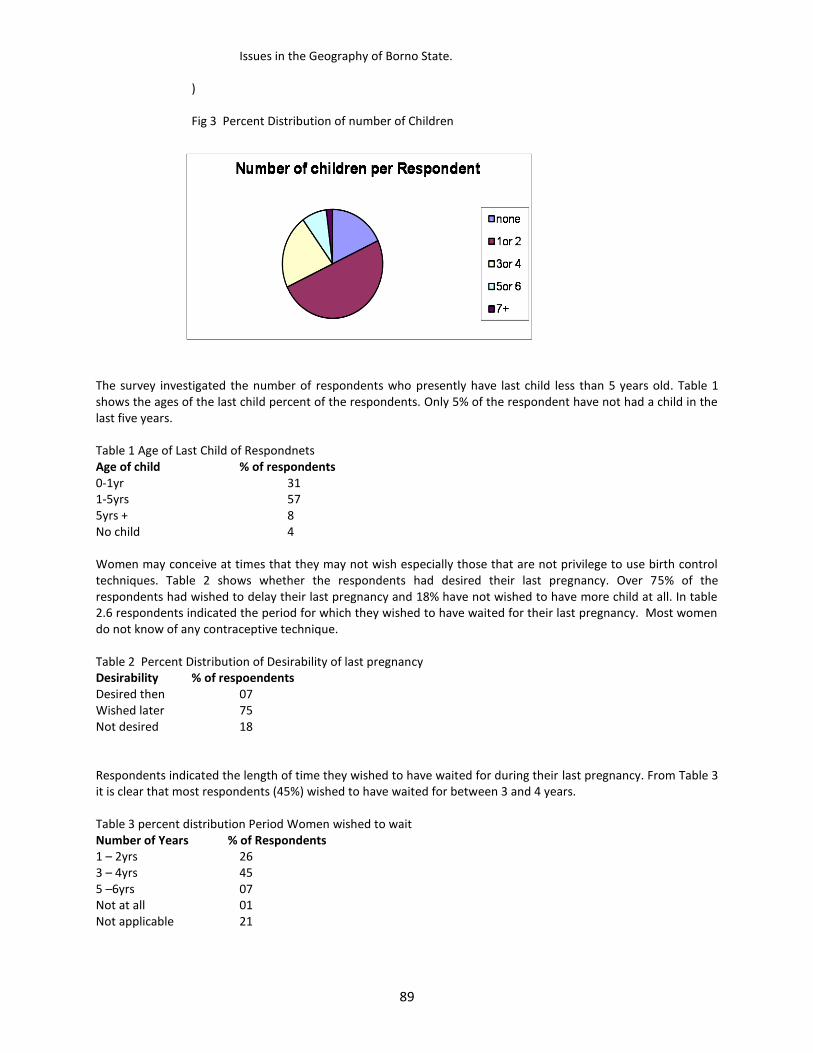
Issues in the Geography of Borno State.
)
89
Fig 3 Percent Distribution of number of Children
The survey investigated the number of respondents who presently have last child less than 5 years old. Table 1 shows the ages of the last child percent of the respondents. Only 5% of the respondent have not had a child in the last five years. Table 1 Age of Last Child of Respondnets Age of child % of respondents 0-1yr 31 1-5yrs 57 5yrs + 8 No child 4 Women may conceive at times that they may not wish especially those that are not privilege to use birth control techniques. Table 2 shows whether the respondents had desired their last pregnancy. Over 75% of the respondents had wished to delay their last pregnancy and 18% have not wished to have more child at all. In table 2.6 respondents indicated the period for which they wished to have waited for their last pregnancy. Most women do not know of any contraceptive technique. Table 2 Percent Distribution of Desirability of last pregnancy Desirability % of respoendents Desired then 07 Wished later 75 Not desired 18 Respondents indicated the length of time they wished to have waited for during their last pregnancy. From Table 3 it is clear that most respondents (45%) wished to have waited for between 3 and 4 years. Table 3 percent distribution Period Women wished to wait Number of Years % of Respondents 1 – 2yrs 26 3 – 4yrs 45 5 –6yrs 07 Not at all 01 Not applicable 21
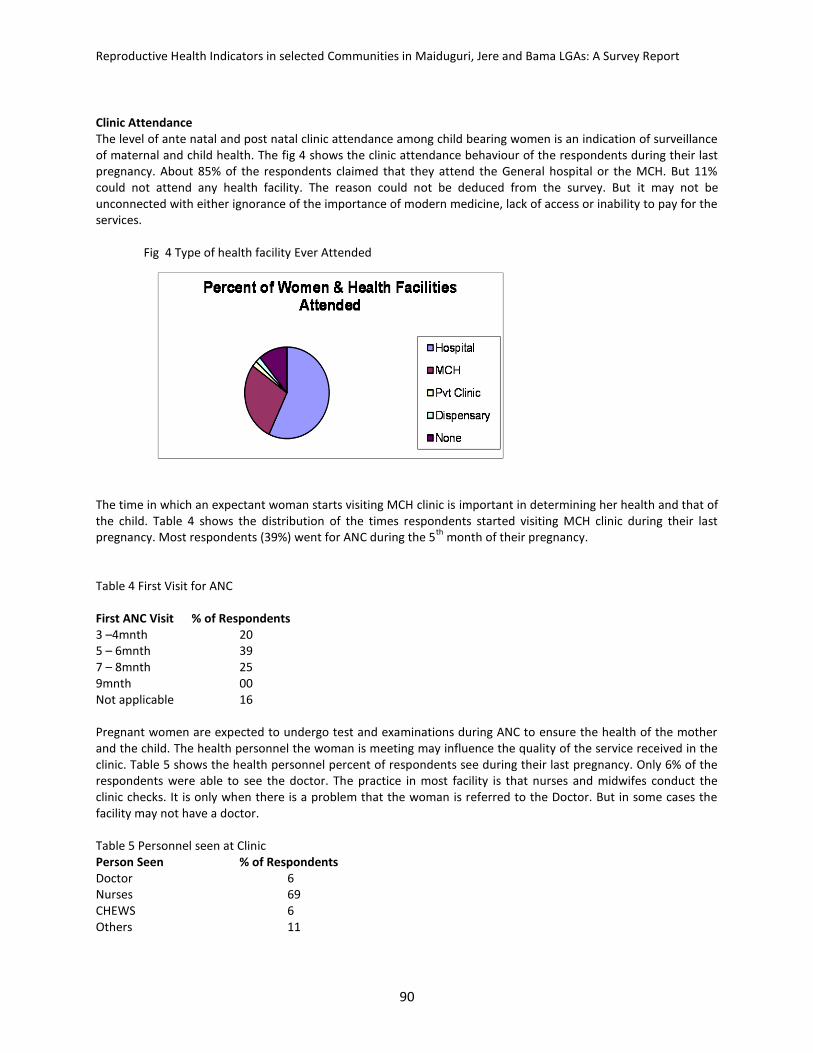
Reproductive Health Indicators in selected Communities in Maiduguri, Jere and Bama LGAs: A Survey Report
90
Clinic Attendance The level of ante natal and post natal clinic attendance among child bearing women is an indication of surveillance of maternal and child health. The fig 4 shows the clinic attendance behaviour of the respondents during their last pregnancy. About 85% of the respondents claimed that they attend the General hospital or the MCH. But 11% could not attend any health facility. The reason could not be deduced from the survey. But it may not be unconnected with either ignorance of the importance of modern medicine, lack of access or inability to pay for the services.
Fig 4 Type of health facility Ever Attended
The time in which an expectant woman starts visiting MCH clinic is important in determining her health and that of the child. Table 4 shows the distribution of the times respondents started visiting MCH clinic during their last pregnancy. Most respondents (39%) went for ANC during the 5
th month of their pregnancy.
Table 4 First Visit for ANC First ANC Visit % of Respondents 3 –4mnth 20 5 – 6mnth 39 7 – 8mnth 25 9mnth 00 Not applicable 16 Pregnant women are expected to undergo test and examinations during ANC to ensure the health of the mother and the child. The health personnel the woman is meeting may influence the quality of the service received in the clinic. Table 5 shows the health personnel percent of respondents see during their last pregnancy. Only 6% of the respondents were able to see the doctor. The practice in most facility is that nurses and midwifes conduct the clinic checks. It is only when there is a problem that the woman is referred to the Doctor. But in some cases the facility may not have a doctor.
Table 5 Personnel seen at Clinic Person Seen % of Respondents Doctor 6 Nurses 69 CHEWS 6 Others 11
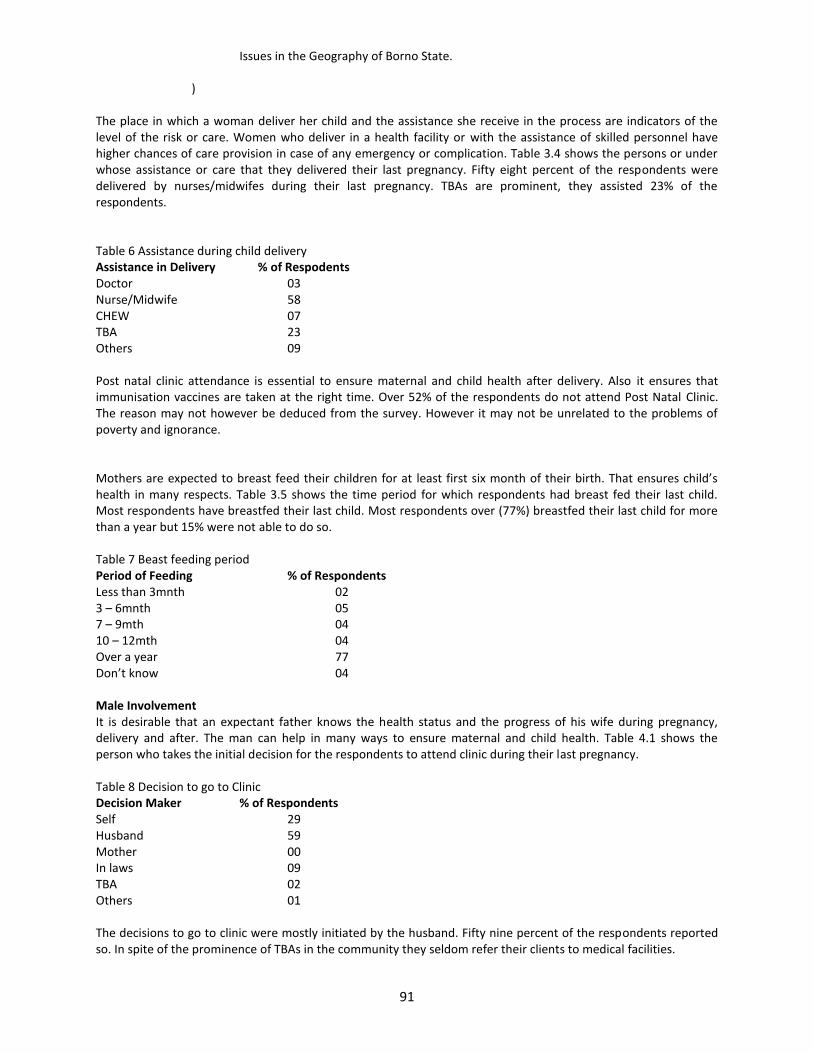
Issues in the Geography of Borno State.
)
91
The place in which a woman deliver her child and the assistance she receive in the process are indicators of the level of the risk or care. Women who deliver in a health facility or with the assistance of skilled personnel have higher chances of care provision in case of any emergency or complication. Table 3.4 shows the persons or under whose assistance or care that they delivered their last pregnancy. Fifty eight percent of the respondents were delivered by nurses/midwifes during their last pregnancy. TBAs are prominent, they assisted 23% of the respondents. Table 6 Assistance during child delivery Assistance in Delivery % of Respodents Doctor 03 Nurse/Midwife 58 CHEW 07 TBA 23 Others 09 Post natal clinic attendance is essential to ensure maternal and child health after delivery. Also it ensures that immunisation vaccines are taken at the right time. Over 52% of the respondents do not attend Post Natal Clinic. The reason may not however be deduced from the survey. However it may not be unrelated to the problems of poverty and ignorance.
Mothers are expected to breast feed their children for at least first six month of their birth. That ensures child’s health in many respects. Table 3.5 shows the time period for which respondents had breast fed their last child. Most respondents have breastfed their last child. Most respondents over (77%) breastfed their last child for more than a year but 15% were not able to do so. Table 7 Beast feeding period Period of Feeding % of Respondents Less than 3mnth 02 3 – 6mnth 05 7 – 9mth 04 10 – 12mth 04 Over a year 77 Don’t know 04 Male Involvement It is desirable that an expectant father knows the health status and the progress of his wife during pregnancy, delivery and after. The man can help in many ways to ensure maternal and child health. Table 4.1 shows the person who takes the initial decision for the respondents to attend clinic during their last pregnancy. Table 8 Decision to go to Clinic Decision Maker % of Respondents Self 29 Husband 59 Mother 00 In laws 09 TBA 02 Others 01 The decisions to go to clinic were mostly initiated by the husband. Fifty nine percent of the respondents reported so. In spite of the prominence of TBAs in the community they seldom refer their clients to medical facilities.
Reproductive Health Indicators in selected Communities in Maiduguri, Jere and Bama LGAs: A Survey Report
92
Pregnant women, especially those going for delivery are expected to be escorted to the health facility and be helped in case of any need. Table 7 shows the person who escorted the respondents to health clinic during their last child birth. Twenty five percent of the respondents claimed to have gone to the facilities on their own. TBAs and male parents do not accompany expectant mothers to the clinic. Table 9 Person accompanying Excort to Clinic % of Respondents Husband 39 Mother 05 In laws 07 Father 00 Relative 10 Friend 03 TBA 00 No one 25 NA 11 Condition in Health facility Women who attend maternal and child health clinics are sometimes faced with difficulties or problems in the facility. This may influence their future attendance of the clinic or any other clinic. Table 5.1 shows the average length of time respondents used to spend before being attended to in Antenatal clinics during their last pregnancy. Most respondents (29%) used to wait between one and two hours before they were attended to. However the waiting time in the clinics is related to the number of patients in the clinic Table 10 Length of time waiting on queue Average Time % of Respondents Less than 30min 07 30min- 1hr 24 1 – 2hrs 29 3 – 4hrs 18 More than 4hrs 04 Don’t know 04 NA 14 Other problems respondents have encountered in clinics is shown in table 5.2 The most common problem reported by 37% of the respondents was the lack of drugs in the health facilities and 18% complained of the unfriendly behaviour of the health personnel.
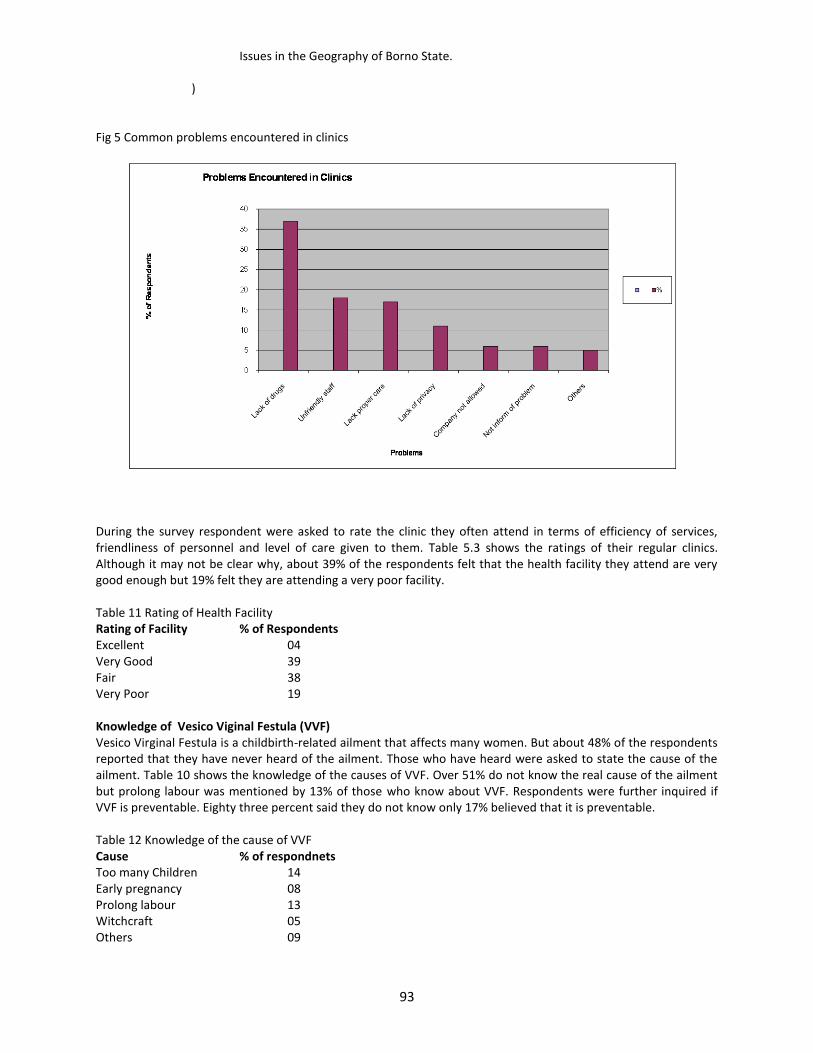
Issues in the Geography of Borno State.
)
93
Fig 5 Common problems encountered in clinics
During the survey respondent were asked to rate the clinic they often attend in terms of efficiency of services, friendliness of personnel and level of care given to them. Table 5.3 shows the ratings of their regular clinics. Although it may not be clear why, about 39% of the respondents felt that the health facility they attend are very good enough but 19% felt they are attending a very poor facility. Table 11 Rating of Health Facility Rating of Facility % of Respondents Excellent 04 Very Good 39 Fair 38 Very Poor 19 Knowledge of Vesico Viginal Festula (VVF) Vesico Virginal Festula is a childbirth-related ailment that affects many women. But about 48% of the respondents reported that they have never heard of the ailment. Those who have heard were asked to state the cause of the ailment. Table 10 shows the knowledge of the causes of VVF. Over 51% do not know the real cause of the ailment but prolong labour was mentioned by 13% of those who know about VVF. Respondents were further inquired if VVF is preventable. Eighty three percent said they do not know only 17% believed that it is preventable. Table 12 Knowledge of the cause of VVF Cause % of respondnets Too many Children 14 Early pregnancy 08 Prolong labour 13 Witchcraft 05 Others 09
Reproductive Health Indicators in selected Communities in Maiduguri, Jere and Bama LGAs: A Survey Report
94
Don’t know 51 Those who claimed to know about VVF were asked if it is curable and where do they thought for help. Table 11 shows the percent of respondents who know where to seek treatment for the ailment. Twenty one percent responded that hospital can cure but 75% do not know whether it is curable. Table 13 Knowledge of Place VVF treatment Expected Place % of respondents Hospital 21 Traditional 08 MCH 00 Dispensary 00 Spiritual 04 Others 02 Don’t Know 75 Practice of Female Genital Mutulation (FGM) Female genital mutilation (FGM) is widely known in communities. Table 7.1 shows the experience of the practice among respondents and their daughters. Ninety four percent of the respondents have heard of the practice that is known as female circumcision. Further more 45% have reported to have been circumcised themselves and about 25% have daughters who have had the experience. Table 14 FGM experience Response % Self %Daughters Yes 45 21 No 41 21 No response 14 58 Respondents were asked if they desire to continue the practice. Table 13 reports that 38% of the respondents said there is desire to continue the practice but 55% refused to take side Table 15 Desire to continue the practice Response % of Respondents Yes 38 No 07 No response 55 Summary The sample survey of reproductive health indicators in MMC, Jere and Bama has revealed that there is a high level fertility in the communities. Over 72% of the respondents have at least a child. The problem of failed pregnancy is very common. Fifty five percent of the respondents have had at least one abortion or a still birth. Although there is the desire among women to control the timing of having children there is very low knowledge of contraception in the area. Appreciable number of expectant women visit Hospitals and MCH clinics for maternal and child care services but there are no doctors to check them, only few Nurses and Midwives give routine checks. Respondents disclosed that there are no drugs in the health facilities. Traditional birth attendants are very prominent in assisting women in delivery in ht communities. However very few women attend postnatal clinics. The decision for a woman to go ANC and PNC are mostly taken and financially facilitated by men, but men seldom accompany their wives or daughters to the clinics for delivery and the health personnel do not welcome the few who dared.Although most respondents desire to go the health facilities for MCH services, the conditions in the facilities
Issues in the Geography of Borno State.
)
95
are appalling. Delays, congestion, few personnel, poor service delivery and unfriendly approaches of Nurses are mentioned as some the problems There is very low knowledge of VVF and its causes in the community. The ailment is claimed to be uncommon in the communities. But female genital mutilation (FGM) is commonly practice. The health implication of the practice is not widely known among respondents and there is an alarming desire to continue the practice or do nothing about it Intervention strategies The following strategies may be adopted to help women in the communities Mass education of men and women in the communities using IEC, BCC and advocacy visits on reproductive health. Training of health personnel in the target communities on modern MCH practices and friendly service provision to clients. Training of the Traditional Birth Attendants on safe motherhood practices. Providing some basic service needs to the clinics in the communities. Encourage men to attend clinics with their wives. Create an easy access to common drugs and supplements that are needed by expectant mothers. Advocacy visits and campaigns to policy makers to improve the conditions of the health facilities in the communities
96
13 SOCIO-CULTURAL AND ECONOMIC FACTORS MILITATING AGAINST GIRL-CHILD EDUCATION IN NORTHERN BORNO YAGANA MUHAMMAD AJI Department of Geography, University Of Maiduguri YAGANA BUKAR Department of Geography, University Of Maiduguri Introduction Education could be referred to as the transfer of all the necessary knowledge, skills and values that help in altering the behaviour and attitude of the individual member of the society for rapid and accelerated development (Bukar, 1997). Education is said to be a powerful means of achieving progress in all areas of human endeavour. It changes the individual or group of people into more effective and efficient members of society. The national policy on education (2004) states that, education is the greatest, investment and force that can be used to bring about speedy development in economic, political, sociological and human resources. It is imperative therefore, for any nation to attain a meaningful level of advancement, it has to educate all its citizens, irrespective of gender. Badejo (1991) observed that, illiteracy and lack of education and training in basic skills contributed to the vicious cycle of under-development, low productivity, poor health conditions and welfare, especially among the female sex who have always been placed at the lower strata of the socio-economic ladder world wide. It is this disturbing trend that prompted this research work. This chapter examines girl-child education in Borno State and the factors associated with the observed pattern. International and national efforts to improve on girl-child education The gender gap in education continues to be wide in southern Asia and sub-Saharan Africa where girls have historically lagged behind boys. These two regions contain almost one-third of the women in the world and are among the fastest growing populations. The implication is that, the absolute number of illiterate and poorly educated women in these regions will continue to increase (Population Reference Bureau, 2002). In recognition of its importance to both national and individual development, girl-child education has received a lot of attention nationally and internationally over the years. Several international conferences and conventions have been held with the aim of helping the girl-child out of her predicament. The 1960 UNESCO convention against discrimination in education, the 1975 Mexico world conference on the status of women, the 1985 UN Nairobi Forward Looking Strategies for the Advancement of Women and Children, the Beijing world conference on women of 1995, the convention for the Elimination of all forms of discriminations against women (CEDAW) in 1979 etc. were all geared towards improving the condition of women (The Beacon, 2007). Nigeria is signatory to most of these conventions. In the domestic scene there are numerous policies which try to enshrine the equality of the female child to that of the male child. Some of them are the 1976 Universal Primary Education (UPE) scheme, the blue print on women education produced by the Federal Ministry of Education in 1986 which mandated states to set up women units in their education ministries and the 1999 Universal Basic Education (UBE) programme, with the goal of establishing tuition–free compulsory schooling through to junior secondary school. (The Beacon, 2007). In 1996 the ministry of women affairs and youth development established girl-child education units in all state ministries of education and, at the federal level. Furthermore, in 2000, the government adopted a national policy on women, which recommends the enrolment and retention of girls in schools to be compulsory and suggest legal sanctions for withdrawal of girls younger than 18 from school to be married. The question remains- are these policies being actively enforced throughout the country?
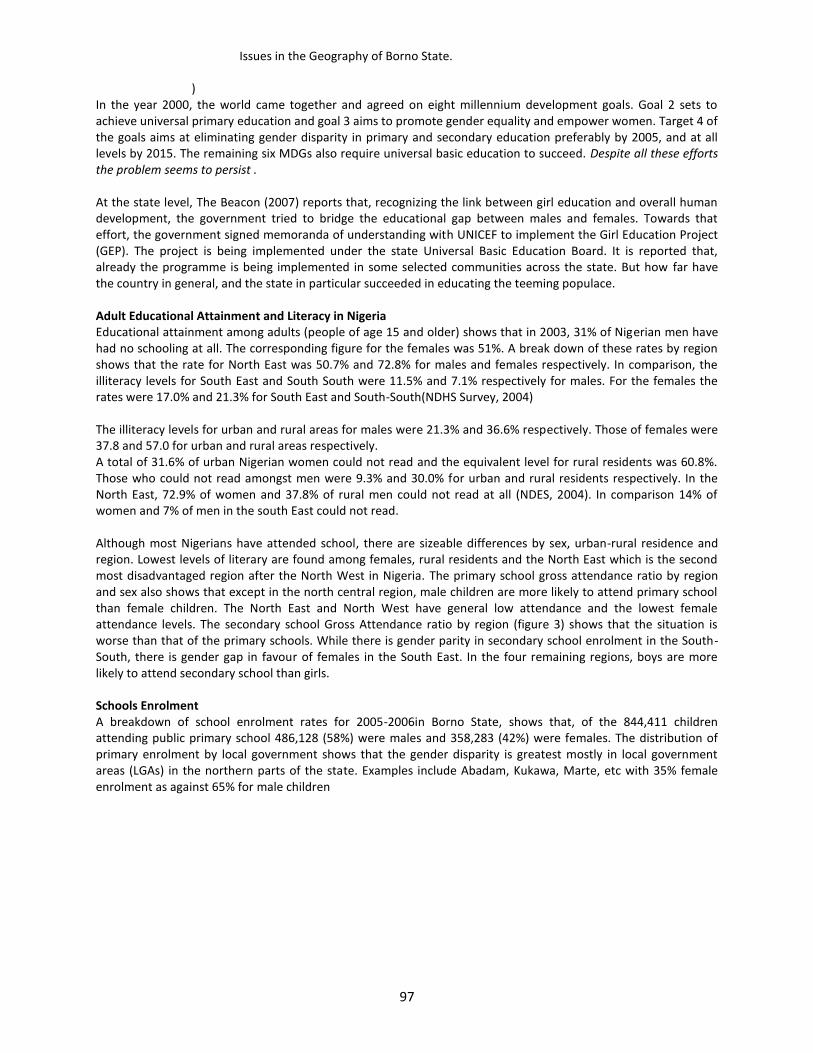
Issues in the Geography of Borno State.
)
97
In the year 2000, the world came together and agreed on eight millennium development goals. Goal 2 sets to achieve universal primary education and goal 3 aims to promote gender equality and empower women. Target 4 of the goals aims at eliminating gender disparity in primary and secondary education preferably by 2005, and at all levels by 2015. The remaining six MDGs also require universal basic education to succeed. Despite all these efforts the problem seems to persist . At the state level, The Beacon (2007) reports that, recognizing the link between girl education and overall human development, the government tried to bridge the educational gap between males and females. Towards that effort, the government signed memoranda of understanding with UNICEF to implement the Girl Education Project (GEP). The project is being implemented under the state Universal Basic Education Board. It is reported that, already the programme is being implemented in some selected communities across the state. But how far have the country in general, and the state in particular succeeded in educating the teeming populace. Adult Educational Attainment and Literacy in Nigeria Educational attainment among adults (people of age 15 and older) shows that in 2003, 31% of Nigerian men have had no schooling at all. The corresponding figure for the females was 51%. A break down of these rates by region shows that the rate for North East was 50.7% and 72.8% for males and females respectively. In comparison, the illiteracy levels for South East and South South were 11.5% and 7.1% respectively for males. For the females the rates were 17.0% and 21.3% for South East and South-South(NDHS Survey, 2004) The illiteracy levels for urban and rural areas for males were 21.3% and 36.6% respectively. Those of females were 37.8 and 57.0 for urban and rural areas respectively. A total of 31.6% of urban Nigerian women could not read and the equivalent level for rural residents was 60.8%. Those who could not read amongst men were 9.3% and 30.0% for urban and rural residents respectively. In the North East, 72.9% of women and 37.8% of rural men could not read at all (NDES, 2004). In comparison 14% of women and 7% of men in the south East could not read. Although most Nigerians have attended school, there are sizeable differences by sex, urban-rural residence and region. Lowest levels of literary are found among females, rural residents and the North East which is the second most disadvantaged region after the North West in Nigeria. The primary school gross attendance ratio by region and sex also shows that except in the north central region, male children are more likely to attend primary school than female children. The North East and North West have general low attendance and the lowest female attendance levels. The secondary school Gross Attendance ratio by region (figure 3) shows that the situation is worse than that of the primary schools. While there is gender parity in secondary school enrolment in the South-South, there is gender gap in favour of females in the South East. In the four remaining regions, boys are more likely to attend secondary school than girls. Schools Enrolment A breakdown of school enrolment rates for 2005-2006in Borno State, shows that, of the 844,411 children attending public primary school 486,128 (58%) were males and 358,283 (42%) were females. The distribution of primary enrolment by local government shows that the gender disparity is greatest mostly in local government areas (LGAs) in the northern parts of the state. Examples include Abadam, Kukawa, Marte, etc with 35% female enrolment as against 65% for male children

Reproductive Health Indicators in selected Communities in Maiduguri, Jere and Bama LGAs: A Survey Report
98
Source The secondary school enrolment rate is 36% for girls as against 64% for their male counter parts. The secondary school enrolment data per local government is incomplete. However, for those that are available, the gender gap is even wider than that of the primary school enrolment. The gap is widest among the northern LGAs as in the primary school enrolment, examples include, 17% for Abadam, 25% for Bama, 25% for Kukawa, 19% for Mobbar and 15%, for Nganzai. One would wonder why literacy levels are lowest in northern Borno. Socio-Cultural and Economic Factors Associated With Low Levels Of Girl-Child Education In Northern Borno. Throughout most of the country and in Borno state in particular, girls do not have equal opportunities as boys in achieving literacy. Some of the factors according to a UNDP (2008) report are resource constraints, poverty, institutional constraints, culture and quality of teaching. These factors translate into girls being more likely than boys not to be enrolled or to discontinue schooling because of household duties, early marriage and/or child bearing, parents perceptions that education is more beneficial for sons, and worries about girls’ safety at school (Population Reference Bureau, 2002). Historically, the reluctance of society to educate the female child in Nigeria could be traced back to the colonial times. As a result of the western tradition in the olden days when the man fends for the family while the wife looks after the home, the first schools established by the then colonial masters were boys’ schools. Girls’ schools were established much later. In most cultures, boys and girls are brought up in certain ways that define their attitude and behaviour. In a patriarchal society such as Nigeria, boys are expected to cultivate masculine behavior and be aggressive, competitive and independent (Biu, 1999). Girls on the other hand, are expected to cultivate feminine attitudes such as gentleness, be loving and cooperative and not be self assertive and fierce. Sex role identification ensures that boys copy masculine roles from the father and girls feminine roles from the mother. Masculine roles are regarded as superior, while feminine roles are regarded as inferior or subordinate. These gender differences are the result of socially approved and culturally sanctioned roles and expectations. They invariably lead to gender differences. Gender differences are different from what feminist scholars refer to as ‘sex differences’. Sex differences are, biological and natural differences between the male and female gender. These do not vary from one culture to another. However, stereo typical gender roles vary among different cultures (Biu, 1999). Borno, particularly the northern part is predominantly inhabited by the Kanuri people. As can be seen from statistics presented previously in this write up, it is this part of the state which suffers the most disadvantage in
Issues in the Geography of Borno State.
)
99
terms of girl-child education. It is suggested that, perhaps it has to do with the Kanuri culture where male superiority is deeply entrenched. According to Bukar (1998) a woman is considered to be weak and cannot handle difficult tasks such as leading the family. It is believed that, the place of a woman is her home and it is the responsibility of the man to fend for the family. Kanuri women are expected to depend on the husband, while the man holds the position of authority and independence, strength and power. Cohen (1991) explains the socio-cultural concept of male and female in the Kanuri society where a man is referred to as rashidi. This word denotes manliness or masculinity and symbolizes characteristics such as strength, independence, firmness, endurance, truthfulness, consistency, to be sensible, considerate and emotionally strong. On the other hand, women are referred to as kshana which denotes womanhood. The characteristics of kshana, in addition to being the opposite of rashidi, the female should also be obedient, respectful, polite, submissive, jovial and must be of good service to her husband (Cohen, 1991). These two male and female stereo type sex-roles are believed to be natural characteristics that are acquired by virtue of being either male or female. Under this concept, the man is expected to be the provider, household head and the politician in society. On the other hand, the woman moves to the husband’s house when the marriage is contracted, takes care of domestic chores and welfare of the family. The man is expected to be domineering full of strength and educator of the wife and children. In war, leadership position, arbitration and conflict resolution, family and community matters, men are given prominence. A woman is accorded priority only after the man. According to Cohen (1991) western education, which tends to alter this cherished way of life may be rejected by the Kanuri people. In addition to the widespread patriarchal systems of organization, customary early marriage, heavy domestic chores and lower regard for the value of female life all combine to affect girl-child education. Other factors are the feeling that a girl will eventually get married and be looked after by a man whether educated or not, so there is no need to waste family resources. Parents also have the notion that, since the girl will get married and relocate to the husband’s house, it is the boys who will stay behind and look after them therefore, they are more worthy of the expense (Badejo, 1989). The girls themselves sometimes do not put in their best in schools because of low self esteem they developed as a result of the socializing process. Discriminatory school curriculum, books and teachers also help in reinforcing the gender roles. Also the northern part of this country came into contact with western education much later than the Western and Eastern parts. Because of the Christian missionary activities that accompanied western education, it was received with much restriction and suspicions which still persist in some quarters today. Some parents believe that western education makes girls to be loose which leads to immorality and unwanted pregnancies. Also the claim by some scholars that Islam is responsible for the low educational achievement of girls has been refuted by Rufai (1996). He stated that, Islam encourages the acquisition of knowledge on the part of both males and females. Examples abound in the Islamic world where females ruled during Islamic eras. Benefits That Can Be Derived From Educating Women Women constitute about 50% of any society. When they are relegated to the background, that much productivity is lost. Improving women’s opportunities can enhance national growth by enhancing a country’s stock of human capital thereby maximizing output. Education reduces fertility in a number of ways. It increases potential wages accruing to women which in turn raises the value of women’s time thereby, adding to the effective cost of child bearing. It discourages early marriage and makes women to be better informed about family planning. With fewer children, educated women are more likely to have better fed and healthier children who will be better educated. This is because evidence suggests that, the probability of a child being in school increases with mother’s education (Biu, 1999). Educating women will bring about psycho-social transformation of a country, because women will be in a better position to take good care of themselves, their families, crops, animals, think better, become more socially informed and politically involved. Educated women stand a better chance of participating and contributing their quota at other levels of societal organization, such as political administration, or social leadership.
Reproductive Health Indicators in selected Communities in Maiduguri, Jere and Bama LGAs: A Survey Report
100
Conclusion In conclusion education being the greatest investment to bring about speedy development, can only be ignored at our peril. Without education, the vicious cycle of under-development, low productivity and poor health conditions and welfare, especially among the females will continue to persist. The educational level among the females in the state is about the lowest in the country. Despite the fact that there are huge cultural and economic factors to surmount, it is time to find ways to tackle the problems. This is because without educating the girl-child, we can never catch up with the rest of the technology driven global village. The way forward First and foremost, all the treaties and agreements that have been signed which were followed up by policies must be backed by appropriate laws that will prosecute offenders. When the laws are made, they must be enforced through well known legal units known to every body so that the girls too can go to and seek redress when the need arises. The mass media (radio, television, newspapers and magazines) as well as the Nigerian film and drama industry could be utilized to sensitize people on the ills of current practices that are detrimental to the well being of the girl child.Policy makers and advocates should continue to actively promote policies and programmes to improve educational attainment among girls and young women nationally and especially in the northern states. Educational infrastructure will have to be improved upon especially in rural areas to ensure that quality education is given to our children. Teachers should also be well remunerated to guarantee their commitment.School environment should be made girl friendly through adequate water supply, provision of toilets, sanitary pads, etc. Primary and secondary education should be made truly free especially for the poorer segments of society, so that there will be no payment of school, WAEC or PTA fees, uniforms and other school requirements, to enable them stay long enough in school. Traditional and religious leaders who are closer to the people should be sensitized to prevail on the people regarding enrolment, retention and transition to higher level schools of female children. Western education should be introduced into Islamic schools which are more acceptable to some people or establish Islamic schools and incorporate the western aspect, as in the case of some schools in Maiduguri. Create more schools that give a second chance to drop outs and, also explore the possibility of mobile schools that would seek out the pupils or students as the case may be in the markets, motor parks, etc.
Issues in the Geography of Borno State.
)
101
References Badejo, O. (1989) Sex-role stereotype attitude towards the education of women in Borno State. Unpublished PhD.
Thesis, university of Maiduguri, Nigeria. Badejo, O. (1991) “The role of the federal government of Nigeria in women education: an appraisal”. Maiduguri
Journal of Education Studies (1) 13-23 Biu, H. A. (1999) “Need, Education and Women Development, a Challenge to educationists and society”. Maiduguri
Journal of Education Studies, vol. 3, 2. Borno state statistical year Book 2005-2006. Dept. of Budget Planning Statistical Bukar, M. (1989) The Study of Socio-cultural Values and the Education of Kanuri Women in Borno State
,Unpublished Masters Dissertation, University of Maiduguri, Nigeria. Bukar, S. (1997) Education/Child Welfare Development in Borno State: Problems and prospects. A paper preserved
at national institute for policy and strategic studies, Kuru, Nigeria Cohen, R. (1991) From Tribe to Nation in Africa. Chandler publishing company, Pennsylvania. Maianguwa, A (1998), Education and Gender Inequality in Nigeria: Etiology, Effect and Control of Malignance in
Nigeria. Askemi and Company, Zaria Nigeria. National Policy on Education Document (2004) National Population Commission (Nigeria) and ORC Macro (2004) Nigeria DHS Ed data Survey (2004): Education
Data for Decision Making. Calverton, Maryland, USA; National population commission and OKC Marco. National Population Commission(2006) Provisional Census Figures. Nigeria and Millennium Development Goals (www.undp.org.ng,2008) Population Reference Bureau (2002) Women of Our World www.prb.org Rufai, (1996), Guide to Girl-child Education in Borno State. Awosanni press Maiduguri, Nigeria. The Alan Guttmacher institute (2004) “Early child bearing in Nigeria: a Continuing Challenge”. Research in Brief
2004 Series, No. 2. The Beacon, vol. 3, 2 (2007), “What Future for Nigeria girl-child” The Beacon of Hope, Maiduguri ,Borno, Nigeria U.N.D.P (2008), Nigerians and Millennium Development Goals. (www.undp.org.ng)
Reproductive Health Indicators in selected Communities in Maiduguri, Jere and Bama LGAs: A Survey Report
102
14 Distribution Of Public Health Facilities in Borno State YUSUF MUHAMMAD ADAMU Department of Geography, Bayero University Kano ABUBAKAR KAWU MONGUNO Department of Geography, Kashim Ibrahim College of Education, Maiduguri Introduction The spatial distribution of phenomena (both natural and man made) has been the major thrustof geographic inquiry since the early years of the discipline. Distinct spatial patterns pervade not only the natural environment but human landscape as well (despite the levels of control exerted). An understanding of such irregularities in human landscapes and especially issues relating human health is necessary in order to understand disparities in between places. The location of health facilities has therefore important implications for the well being of man as it determines access to health services (Adamu and Awaisu, 2003; Gatrell, 2002; Al-Kahtani,1996).Since Nigeria operates a pyramidal three tier system of health care delivery systemcorresponding with the federal, state, and local government levels of administration, each of these has a threshold population and a sphere of influence. Thus, tertiary health facilities such as teaching hospitals and federal medical centres at the top are controlled and funded by the federal government while the secondary health facilities such as general and specialists hospitals are controlled by the state governments. At the bottom of the pyramid are primary health centres as well as dispensaries belonging to and managed by local government councils (Ransom- Kuti, cited in Adamu and Awaisu, 2003). In so far as the secondary and tertiary health institutions deal with specialized health care needs of the population within their spheres of influence, their location and hence the services they provide should be equitable to avoid disparities in the quality of health as is the case in many places. The distribution of health facilities at the national level has been adequately studied in the past. Many studies conducted in Nigeria e.g. Jigawa State (Adamu and Awaisu, 2003), Taraba State (Mohammed, 2002) and Bauchi State (Madaki, 1998) have shown that some sections of the population are disadvantaged in terms of health care service provision, the consequences of which are enormous on the disadvantaged population. With the return of Nigeria to democratic rule in 1999, there was a lot of hope that the wellbeing of Nigerians including health would improve. It is against this background that a study of the distribution of health services in Borno State was conducted to examine whether or not some. It is expected that this study would shed light on the healthcare services of the state and form a baseline for policy intervention. Study Area Created in 1976 Borno State today (Figure 1) comprises of 27 Local Government Areas (LGAs) with a total population of 4,151,193 based on the provisional results of the 2006 national census (National Population Commission, n.d). There are three senatorial zones i.e. Borno North, Borno Central, and Borno South. Borno North has a population of 1,238,390 comprising 10 LGAs, Borno Central with 1,666,541 has 9 LGAs and Borno south (pop. 1,246,262) has a total of 9 LGAs. Excepting the Lake Chad shores and the state capital Maiduguri which are cosmopolitan both Borno North and Borno Central are ethnically homogenous while Borno South is heterogeneous. The state has 2 tertiary health facilities (University of Maiduguri Teaching Hospital [UMTH] and Federal Neuropsychiatric Hospital) and 35 secondary health facilities. Methodology Data for this study is based on information collected from Borno State Ministry of Health covering the year 2005. The information gathered was the most current available on facilities and manpower according to location in the state at the time the research was carried out. The data include public health facilities under Borno State Government, health manpower such as number of doctors, nurses, midwives as well as nurses/midwives with double qualification. Others include pharmacists, radiologists, Community Health Extension Workers (CHEWs) and
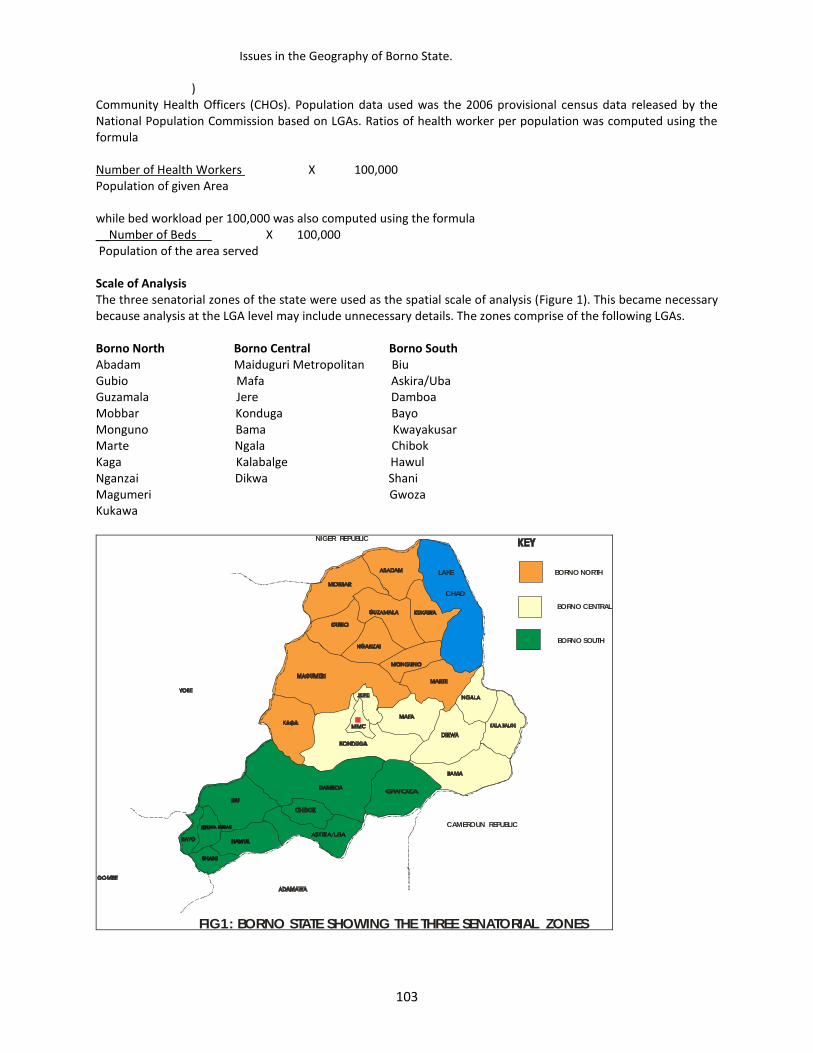
Issues in the Geography of Borno State.
)
103
Community Health Officers (CHOs). Population data used was the 2006 provisional census data released by the National Population Commission based on LGAs. Ratios of health worker per population was computed using the formula Number of Health Workers X 100,000 Population of given Area while bed workload per 100,000 was also computed using the formula __Number of Beds X 100,000 Population of the area served Scale of Analysis The three senatorial zones of the state were used as the spatial scale of analysis (Figure 1). This became necessary because analysis at the LGA level may include unnecessary details. The zones comprise of the following LGAs. Borno North Borno Central Borno South Abadam Maiduguri Metropolitan Biu Gubio Mafa Askira/Uba Guzamala Jere Damboa Mobbar Konduga Bayo Monguno Bama Kwayakusar Marte Ngala Chibok Kaga Kalabalge Hawul Nganzai Dikwa Shani Magumeri Gwoza Kukawa
FIG1: BORNO STATE SHOWING THE THREE SENATORIAL ZONES
BORNO NORTH
BORNO CENTRAL
BORNO SOUTH
LAKE
CHAD
NIGER REPUBLIC
CAMEROUN REPUBLIC
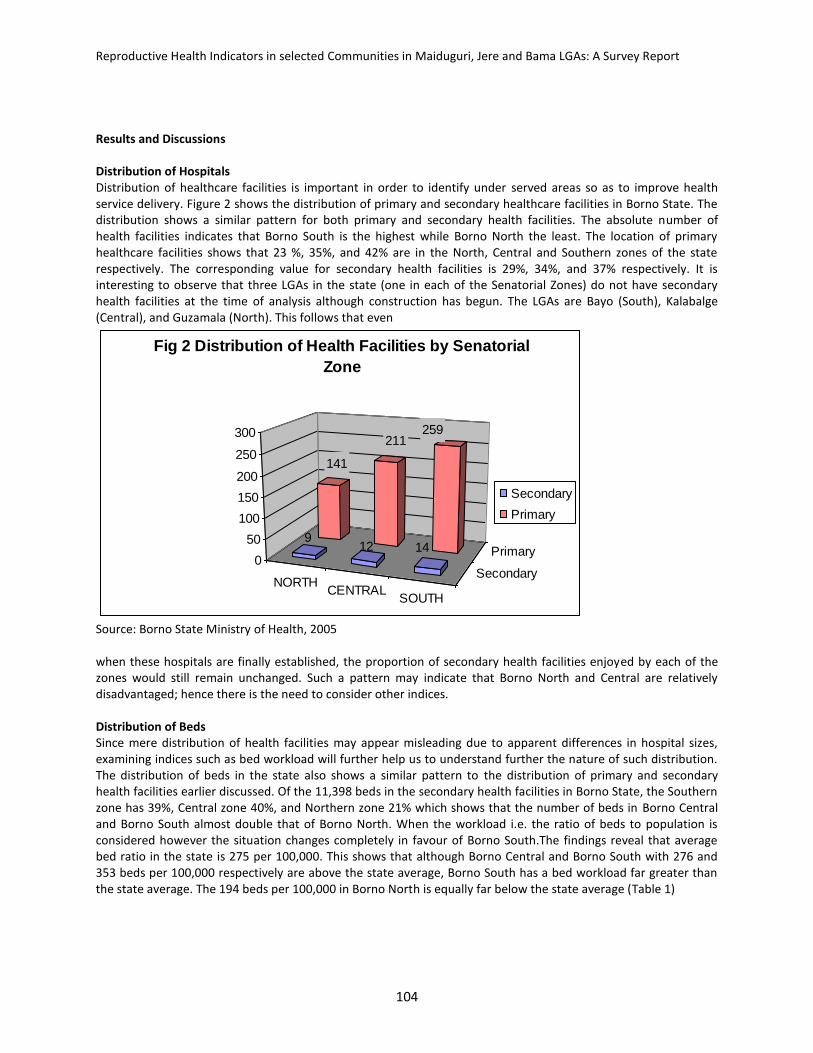
Reproductive Health Indicators in selected Communities in Maiduguri, Jere and Bama LGAs: A Survey Report
104
Results and Discussions Distribution of Hospitals Distribution of healthcare facilities is important in order to identify under served areas so as to improve health service delivery. Figure 2 shows the distribution of primary and secondary healthcare facilities in Borno State. The distribution shows a similar pattern for both primary and secondary health facilities. The absolute number of health facilities indicates that Borno South is the highest while Borno North the least. The location of primary healthcare facilities shows that 23 %, 35%, and 42% are in the North, Central and Southern zones of the state respectively. The corresponding value for secondary health facilities is 29%, 34%, and 37% respectively. It is interesting to observe that three LGAs in the state (one in each of the Senatorial Zones) do not have secondary health facilities at the time of analysis although construction has begun. The LGAs are Bayo (South), Kalabalge (Central), and Guzamala (North). This follows that even
NORTHCENTRAL
SOUTH
Secondary
Primary
141
211259
912 14
0
50
100
150
200
250
300
Fig 2 Distribution of Health Facilities by Senatorial
Zone
Secondary
Primary
Source: Borno State Ministry of Health, 2005 when these hospitals are finally established, the proportion of secondary health facilities enjoyed by each of the zones would still remain unchanged. Such a pattern may indicate that Borno North and Central are relatively disadvantaged; hence there is the need to consider other indices. Distribution of Beds Since mere distribution of health facilities may appear misleading due to apparent differences in hospital sizes, examining indices such as bed workload will further help us to understand further the nature of such distribution. The distribution of beds in the state also shows a similar pattern to the distribution of primary and secondary health facilities earlier discussed. Of the 11,398 beds in the secondary health facilities in Borno State, the Southern zone has 39%, Central zone 40%, and Northern zone 21% which shows that the number of beds in Borno Central and Borno South almost double that of Borno North. When the workload i.e. the ratio of beds to population is considered however the situation changes completely in favour of Borno South.The findings reveal that average bed ratio in the state is 275 per 100,000. This shows that although Borno Central and Borno South with 276 and 353 beds per 100,000 respectively are above the state average, Borno South has a bed workload far greater than the state average. The 194 beds per 100,000 in Borno North is equally far below the state average (Table 1)
Issues in the Geography of Borno State.
)
105
Table1: Borno State Bed Workload by Senatorial Zone
Source: Borno State Ministry of Health, 2005 Health Manpower Distribution Distribution of Doctors The mere establishment of hospitals alone without the requisite manpower is not enough to influence the utilisation of healthcare. Collier, Dercon and Mackinon (2002) have demonstrated that the utilization of healthcare facilities is dependent not only on the distance to the nearest health facilities but also on the quality of healthcare service provided. There is hence the need to examine the distribution of doctors in particular since they constitute the backbone of secondary and tertiary healthcare delivery. As at 2005 there were only 36 doctors in the service of Borno State government, giving a doctor/patient ratio of 1:115,310 which is grossly below the recommended 1:20,000 by WHO. Analysis by zone shows that Borno Central has a doctor/patient ratio of 1:59,519 compared with 1:309,593 for Borno North and 1:311,565 for Borno South. Ratio per 100,000 also shows that there was 0.87 doctor/100,000 of population in the state on average (Table 2). Table 2: Doctor/Patient Ratio by Senatorial Zone
Senatorial Zone No of Doctors Ratio/100,000 Ratio/1000
Borno North 3 0.24 0.0024
Borno Central 29 1.74 0.0174
Borno South 4 0.32 0.0032
Total/Average 36 0.87 0.0009
Source: Borno State Ministry of Health, 2005 When viewed at the zonal level Borno North has 0.24, Borno Central 1.74 and Borno South 0.32 doctor(s) per 100,000.These findings are in sharp contrast to those of Adamu and Awaisu (2002) in Jigawa State where doctor/patient ratio was observed to be about 9/100,000. The implication of this is that all the three zones are grossly underserved in terms of doctors albeit with a sharp contrast between the Central and other zones. The generally poor doctor/patient ratio in the state is explained by the mass exodus of doctors from the state due to poor working conditions while the fairer ratio in the Central zone is the result of the concentration of doctors in the state capital which accounts for over 60% of doctors. When the fact is further noted that the two tertiary health facilities in the state i.e. University of Maiduguri Teaching Hospital (UMTH) and Federal Neuropsychiatric Hospital are all located within the state capital (Central Zone) the other two zones become even poorer. Many hospitals located in the rural areas do not have doctors in both the Northern and Southern zones. The climatically marginal location of the Northern zone in particular coupled with its poor infrastructural base combine to make the area further unattractive and hence the dearth of doctors. Distribution of Nurses/Midwives Nurses and midwives equally constitute a vital component of any healthcare delivery system. In the rural areas in particular, recourse is made to this category of health manpower as a result of the absence of doctors. Three categories of nurses/midwives have been identified in Borno State. These are registered nurses with single
Senatorial Zone No of Beds Ratio/100,000 Ratio/1000
North 2400 193.8 1.94
Central 4598 275.9 2.76
South 4400 353.1 3.53
Total 11398 274.6 2.75
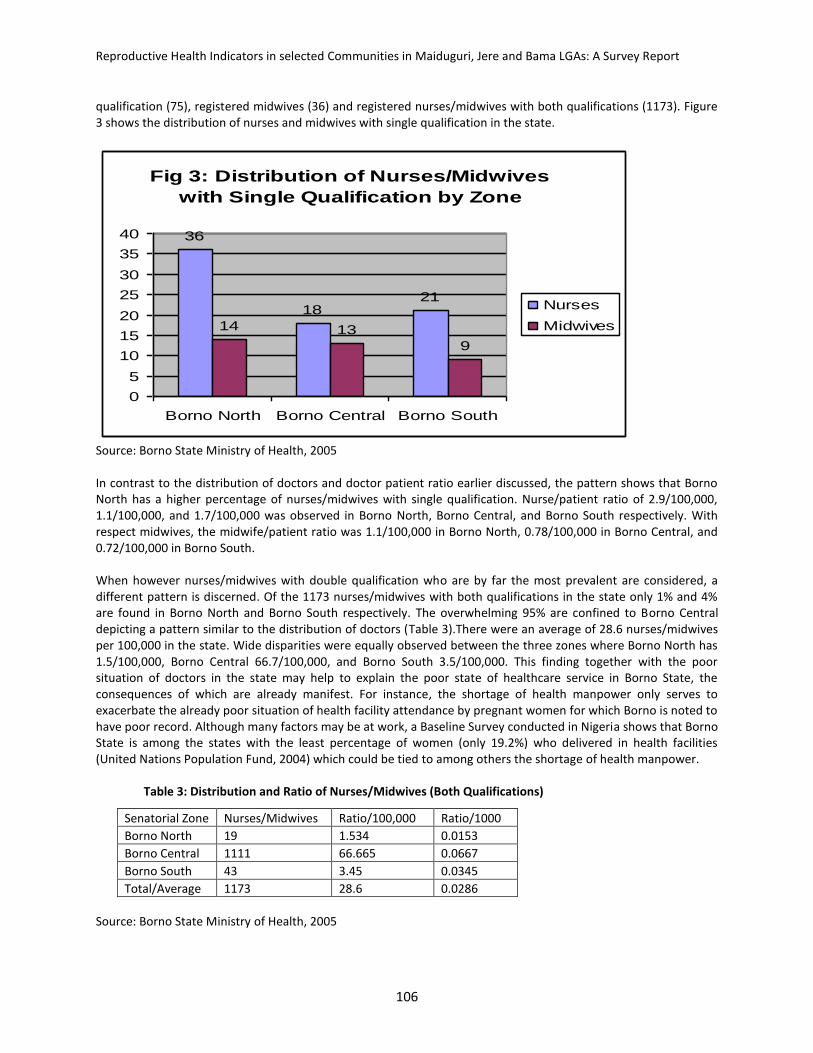
Reproductive Health Indicators in selected Communities in Maiduguri, Jere and Bama LGAs: A Survey Report
106
qualification (75), registered midwives (36) and registered nurses/midwives with both qualifications (1173). Figure 3 shows the distribution of nurses and midwives with single qualification in the state.
Fig 3: Distribution of Nurses/Midwives
with Single Qualification by Zone
36
1821
14 13
9
0
5
10
15
20
25
30
35
40
Borno North Borno Central Borno South
Nurses
Midwives
Source: Borno State Ministry of Health, 2005 In contrast to the distribution of doctors and doctor patient ratio earlier discussed, the pattern shows that Borno North has a higher percentage of nurses/midwives with single qualification. Nurse/patient ratio of 2.9/100,000, 1.1/100,000, and 1.7/100,000 was observed in Borno North, Borno Central, and Borno South respectively. With respect midwives, the midwife/patient ratio was 1.1/100,000 in Borno North, 0.78/100,000 in Borno Central, and 0.72/100,000 in Borno South. When however nurses/midwives with double qualification who are by far the most prevalent are considered, a different pattern is discerned. Of the 1173 nurses/midwives with both qualifications in the state only 1% and 4% are found in Borno North and Borno South respectively. The overwhelming 95% are confined to Borno Central depicting a pattern similar to the distribution of doctors (Table 3).There were an average of 28.6 nurses/midwives per 100,000 in the state. Wide disparities were equally observed between the three zones where Borno North has 1.5/100,000, Borno Central 66.7/100,000, and Borno South 3.5/100,000. This finding together with the poor situation of doctors in the state may help to explain the poor state of healthcare service in Borno State, the consequences of which are already manifest. For instance, the shortage of health manpower only serves to exacerbate the already poor situation of health facility attendance by pregnant women for which Borno is noted to have poor record. Although many factors may be at work, a Baseline Survey conducted in Nigeria shows that Borno State is among the states with the least percentage of women (only 19.2%) who delivered in health facilities (United Nations Population Fund, 2004) which could be tied to among others the shortage of health manpower.
Table 3: Distribution and Ratio of Nurses/Midwives (Both Qualifications)
Source: Borno State Ministry of Health, 2005
Senatorial Zone Nurses/Midwives Ratio/100,000 Ratio/1000
Borno North 19 1.534 0.0153
Borno Central 1111 66.665 0.0667
Borno South 43 3.45 0.0345
Total/Average 1173 28.6 0.0286
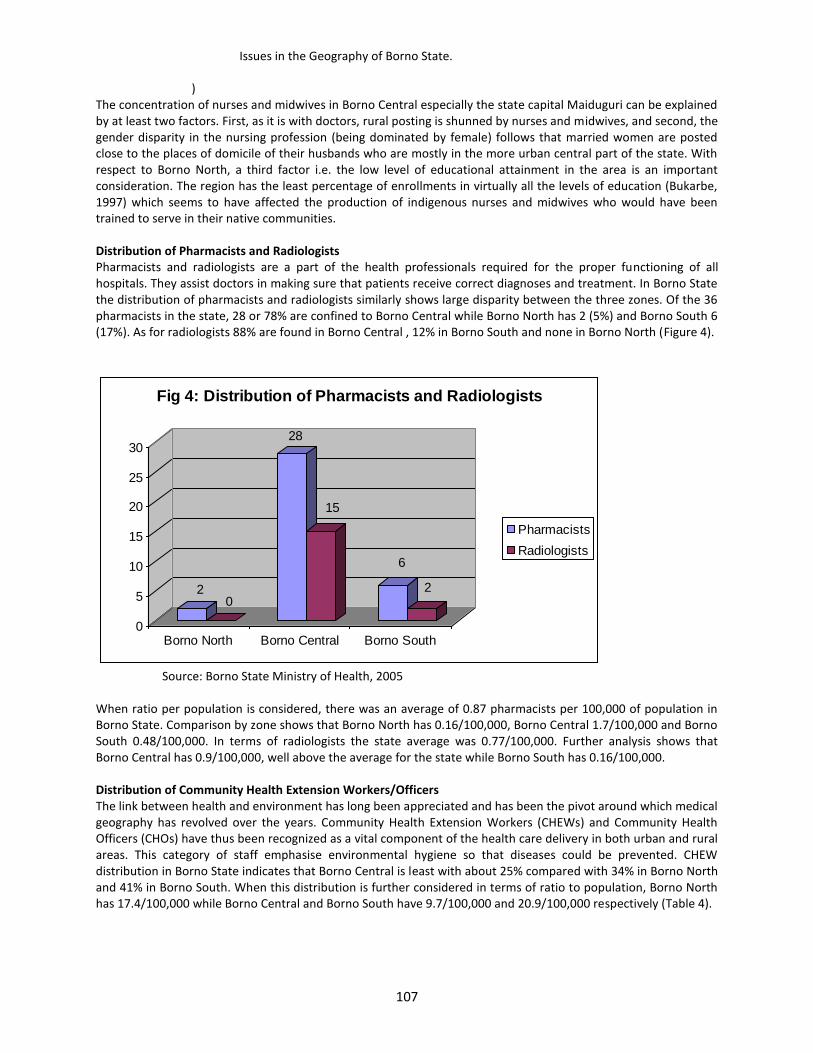
Issues in the Geography of Borno State.
)
107
The concentration of nurses and midwives in Borno Central especially the state capital Maiduguri can be explained by at least two factors. First, as it is with doctors, rural posting is shunned by nurses and midwives, and second, the gender disparity in the nursing profession (being dominated by female) follows that married women are posted close to the places of domicile of their husbands who are mostly in the more urban central part of the state. With respect to Borno North, a third factor i.e. the low level of educational attainment in the area is an important consideration. The region has the least percentage of enrollments in virtually all the levels of education (Bukarbe, 1997) which seems to have affected the production of indigenous nurses and midwives who would have been trained to serve in their native communities. Distribution of Pharmacists and Radiologists Pharmacists and radiologists are a part of the health professionals required for the proper functioning of all hospitals. They assist doctors in making sure that patients receive correct diagnoses and treatment. In Borno State the distribution of pharmacists and radiologists similarly shows large disparity between the three zones. Of the 36 pharmacists in the state, 28 or 78% are confined to Borno Central while Borno North has 2 (5%) and Borno South 6 (17%). As for radiologists 88% are found in Borno Central , 12% in Borno South and none in Borno North (Figure 4).
20
28
15
6
2
0
5
10
15
20
25
30
Borno North Borno Central Borno South
Fig 4: Distribution of Pharmacists and Radiologists
Pharmacists
Radiologists
Source: Borno State Ministry of Health, 2005 When ratio per population is considered, there was an average of 0.87 pharmacists per 100,000 of population in Borno State. Comparison by zone shows that Borno North has 0.16/100,000, Borno Central 1.7/100,000 and Borno South 0.48/100,000. In terms of radiologists the state average was 0.77/100,000. Further analysis shows that Borno Central has 0.9/100,000, well above the average for the state while Borno South has 0.16/100,000. Distribution of Community Health Extension Workers/Officers The link between health and environment has long been appreciated and has been the pivot around which medical geography has revolved over the years. Community Health Extension Workers (CHEWs) and Community Health Officers (CHOs) have thus been recognized as a vital component of the health care delivery in both urban and rural areas. This category of staff emphasise environmental hygiene so that diseases could be prevented. CHEW distribution in Borno State indicates that Borno Central is least with about 25% compared with 34% in Borno North and 41% in Borno South. When this distribution is further considered in terms of ratio to population, Borno North has 17.4/100,000 while Borno Central and Borno South have 9.7/100,000 and 20.9/100,000 respectively (Table 4).
Reproductive Health Indicators in selected Communities in Maiduguri, Jere and Bama LGAs: A Survey Report
108
Table 4: CHEW/CHO/Patient Ratio by Zone
Senatorial Zone CHEW % Ratio/100,000 CHO % Ratio/100,000
Borno North 215 34 17.36 103 27 8.32
Borno Central 162 25 9.72 189 50 11.34
Borno South 261 41 20.94 87 23 6.98
Total/Average 638 100 15.4 379 100 9.13
Source: Borno State Ministry of Health, 2005 Community Health Officers (CHO) distribution is however different from the above being slightly similar to that of doctors and nurses/midwives. About 50% of CHOs are confined to the Central zone while 27% and 23% are in the Northern and Southern zones respectively. Average CHO ratio in the state was 9.13/100,000 which follows that only the Central zone with 11.3/100,000 is above the state average. The preponderance of CHOs in the Central zone when compared with CHEWs is explained by the fact that the former are officers hence may not find rural posting convenient. Conclusion Healthcare provision is a basic human necessity which makes it an important index of development. This vital social service in Borno State appears to be challenged by not only inadequacy of facilities and manpower but in their distribution as well. This inadequacy and mal-distribution of health facilities and manpower has serious consequences for health service provision in the different zones of the state. In order to actualise the objectives of the National Health Policy in the state, there is the need to conduct a study of health facilities service area to identify areas that are under served and those that overlap. This should be in addition the training and recruitment of more healthcare staff to man the decaying health services in the state. The need to ensure fairness in the distribution of health manpower so that their distribution is based on population rather than any other consideration in the state is important so as to reduce undue concentration of the critical elements in health care provision in urban areas.
Issues in the Geography of Borno State.
)
109
References Adamu, Y.M; and Awaisu, S (2002) Who gets what? Distribution of Healthcare Services in Jigawa State, in
Shitu , M. B and Adamu, Y. M. (eds) Studies on inequality in Nigeria; A Multi Disciplinary Perspective, Kano :Adamu Joji.
Al Kahtani, M.M.S (1996) Regional deveploment of health facilities in Saudi Arabia, Proceedings of the 7th Intrenational Symposium in Medical Geography, University of Portsmouth, United Kingdom pp263 - 273.
Bukarbe, B. (1997) Universal Primary Education: Analysis of Factors Influencing its Achievement in Borno State, Unpublished Ph.d Thesis, University of Maiduguri
Collier,P; Dercon, S; and Mackinnon, J. (2002) Density Versus Quality in Healthcare Provision: Using Household Data to Make BudgetaryChoices in Ethiopia, The World Bank Economic Review Vol. 16 Number 3 pp 425-
448. Gatrell, A .C.(2002) Geographies of health, Oxford: Blackwell Madaki, M (1998) Distribution of Healthcare Facilities in Bauchi State, Unpublished Bsc Project, Bayero University,
Kano Mohammed, S (2002) Distribution of Health Facilities in Taraba State, Unpublished Bsc Project, Bayero University,
Kano National Population Commission, Borno State, (n.d) Population of Borno State by Local Government Areas, 2006 United Nations Population Fund (2004) Reproductive Health and Gender Indicators Baseline Survey of UNFPA
Assisted States in Nigeria, 2004.
110
15 An Assessment Of The Expanded Programme On Immunisation (EPI) ABUBAKAR KAWU MONGUNO Department of Geography, Kashim Ibrahim College of Education, Maiduguri Introduction It has been observed, especially in the developing world that a high proportion of children die before the age of 5. Nigeria in particular falls among the group of countries with very high infant and child mortality rates (National Population Commission/ORC Macro, 2004). Most of these deaths are traceable to Vaccine Preventable Diseases (VPDs). An improvement in immunisation coverage is therefore seen as sine qua non to stem the rising trend of child morbidity and mortality from these diseases (Awosika, 2004). Accordingly, the Expanded Programme on Immunisation (EPI) was launched by World Health Organisation (WHO) as a bold initiative to reduce the high mortality rates. In Nigeria, the programme first started in 1977 but was later re-launched in 1983 in Owo Local Government of Ondo state as a pilot scheme due to massive failure of the initial attempt (Umar, 2006). The success of the latter was then used as a blueprint for the eventual introduction of the programme to other parts of the country thereby increasing coverage from 9% 83% (ibid). However, coverage later declined in Nigeria to 13% (National Population Commission/ORC Macro, 2004) and the programme was shown to have failed in its objectives (Ekanem, 1988). There is however the need to examine the programme at the level of the state (there are 36 states in Nigeria) since according to Gesler & Gage (1987 p.466) “one of the most interesting aspects of many geographic studies is that many scales may be involved …each one deserves careful study of its own”. This study examines routine immunisation coverage (a vital aspect of EPI) and its impact on the reduction of child morbidity and mortality in Borno State. Methodology To achieve the aim of the research 10 years retrospective data on routine immunisation coverage in the state (1998-2007) was collected from the ministry of health. Additional 10 years data on reported cases of VPDs (mortality and morbidity) disaggregated by age was collected from the Health Management Information System (HMIS) unit of the Ministry of Health. As a supplement to the data collected 6 FGDs were held (2 in each of the 3 geopolitical zone of the state). Data were analysed using simple descriptive statistics and correlation technique. Results and Discussion Annual Trends in Childhood Immunisation An irregular trend appears to be a generally marked feature of childhood immunisation in Borno State in the ten year period 1998 to 2007. This applies to the uptake of almost all the antigens. The coverage for all the vaccines is however less than satisfactory being much less than the number of children targeted for vaccination. The highest coverage of 70% of the target population was recorded for measles vaccine while the first dose of polio vaccine (OPV0) given at birth was the least observed with 21% of the target population vaccinated. Table 1 shows the percentage coverage trend for all the six EPI vaccines. It can be easily discerned from the table that none of the vaccines had attained herd immunity or 80% coverage considered to be within safety limits by WHO (Bennett, 1988). However, measles coverage in the state was well above the 60% coverage as targeted in the National Economic Empowerment and Development Strategy (NEEDS) plan document for Nigeria. NEEDS is Nigeria’s micro development plan for the actualization of the Millennium Development Goals. A further look at the trend of individual vaccines provides a more useful pattern.
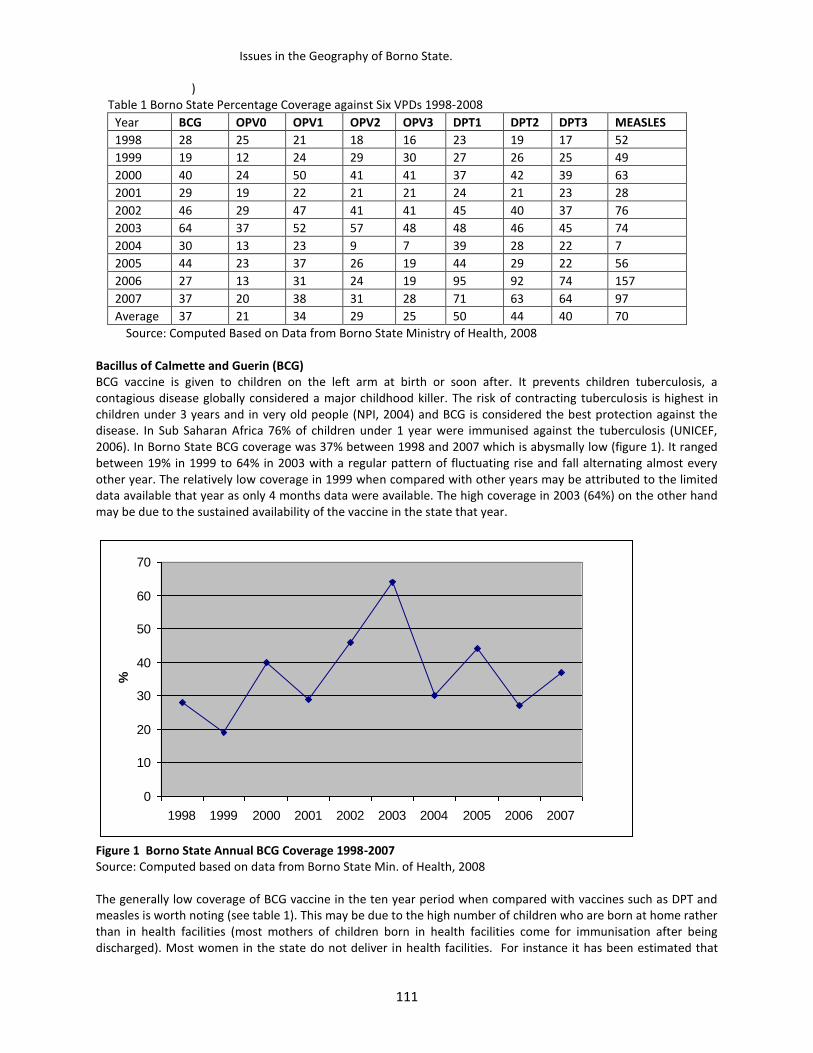
Issues in the Geography of Borno State.
)
111
Table 1 Borno State Percentage Coverage against Six VPDs 1998-2008
Year BCG OPV0 OPV1 OPV2 OPV3 DPT1 DPT2 DPT3 MEASLES
1998 28 25 21 18 16 23 19 17 52
1999 19 12 24 29 30 27 26 25 49
2000 40 24 50 41 41 37 42 39 63
2001 29 19 22 21 21 24 21 23 28
2002 46 29 47 41 41 45 40 37 76
2003 64 37 52 57 48 48 46 45 74
2004 30 13 23 9 7 39 28 22 7
2005 44 23 37 26 19 44 29 22 56
2006 27 13 31 24 19 95 92 74 157
2007 37 20 38 31 28 71 63 64 97
Average 37 21 34 29 25 50 44 40 70
Source: Computed Based on Data from Borno State Ministry of Health, 2008 Bacillus of Calmette and Guerin (BCG) BCG vaccine is given to children on the left arm at birth or soon after. It prevents children tuberculosis, a contagious disease globally considered a major childhood killer. The risk of contracting tuberculosis is highest in children under 3 years and in very old people (NPI, 2004) and BCG is considered the best protection against the disease. In Sub Saharan Africa 76% of children under 1 year were immunised against the tuberculosis (UNICEF, 2006). In Borno State BCG coverage was 37% between 1998 and 2007 which is abysmally low (figure 1). It ranged between 19% in 1999 to 64% in 2003 with a regular pattern of fluctuating rise and fall alternating almost every other year. The relatively low coverage in 1999 when compared with other years may be attributed to the limited data available that year as only 4 months data were available. The high coverage in 2003 (64%) on the other hand may be due to the sustained availability of the vaccine in the state that year.
0
10
20
30
40
50
60
70
1998 1999 2000 2001 2002 2003 2004 2005 2006 2007
%
Figure 1 Borno State Annual BCG Coverage 1998-2007 Source: Computed based on data from Borno State Min. of Health, 2008 The generally low coverage of BCG vaccine in the ten year period when compared with vaccines such as DPT and measles is worth noting (see table 1). This may be due to the high number of children who are born at home rather than in health facilities (most mothers of children born in health facilities come for immunisation after being discharged). Most women in the state do not deliver in health facilities. For instance it has been estimated that
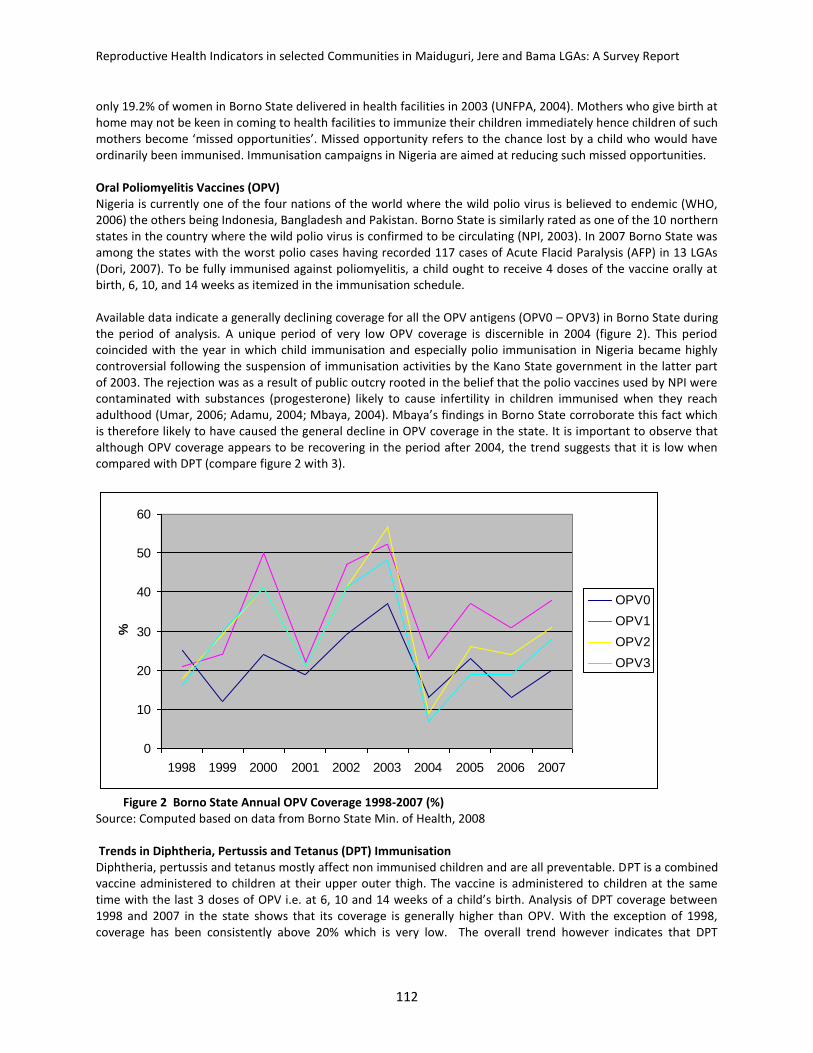
Reproductive Health Indicators in selected Communities in Maiduguri, Jere and Bama LGAs: A Survey Report
112
only 19.2% of women in Borno State delivered in health facilities in 2003 (UNFPA, 2004). Mothers who give birth at home may not be keen in coming to health facilities to immunize their children immediately hence children of such mothers become ‘missed opportunities’. Missed opportunity refers to the chance lost by a child who would have ordinarily been immunised. Immunisation campaigns in Nigeria are aimed at reducing such missed opportunities. Oral Poliomyelitis Vaccines (OPV) Nigeria is currently one of the four nations of the world where the wild polio virus is believed to endemic (WHO, 2006) the others being Indonesia, Bangladesh and Pakistan. Borno State is similarly rated as one of the 10 northern states in the country where the wild polio virus is confirmed to be circulating (NPI, 2003). In 2007 Borno State was among the states with the worst polio cases having recorded 117 cases of Acute Flacid Paralysis (AFP) in 13 LGAs (Dori, 2007). To be fully immunised against poliomyelitis, a child ought to receive 4 doses of the vaccine orally at birth, 6, 10, and 14 weeks as itemized in the immunisation schedule. Available data indicate a generally declining coverage for all the OPV antigens (OPV0 – OPV3) in Borno State during the period of analysis. A unique period of very low OPV coverage is discernible in 2004 (figure 2). This period coincided with the year in which child immunisation and especially polio immunisation in Nigeria became highly controversial following the suspension of immunisation activities by the Kano State government in the latter part of 2003. The rejection was as a result of public outcry rooted in the belief that the polio vaccines used by NPI were contaminated with substances (progesterone) likely to cause infertility in children immunised when they reach adulthood (Umar, 2006; Adamu, 2004; Mbaya, 2004). Mbaya’s findings in Borno State corroborate this fact which is therefore likely to have caused the general decline in OPV coverage in the state. It is important to observe that although OPV coverage appears to be recovering in the period after 2004, the trend suggests that it is low when compared with DPT (compare figure 2 with 3).
0
10
20
30
40
50
60
1998 1999 2000 2001 2002 2003 2004 2005 2006 2007
%
OPV0
OPV1
OPV2
OPV3
Figure 2 Borno State Annual OPV Coverage 1998-2007 (%) Source: Computed based on data from Borno State Min. of Health, 2008 Trends in Diphtheria, Pertussis and Tetanus (DPT) Immunisation Diphtheria, pertussis and tetanus mostly affect non immunised children and are all preventable. DPT is a combined vaccine administered to children at their upper outer thigh. The vaccine is administered to children at the same time with the last 3 doses of OPV i.e. at 6, 10 and 14 weeks of a child’s birth. Analysis of DPT coverage between 1998 and 2007 in the state shows that its coverage is generally higher than OPV. With the exception of 1998, coverage has been consistently above 20% which is very low. The overall trend however indicates that DPT
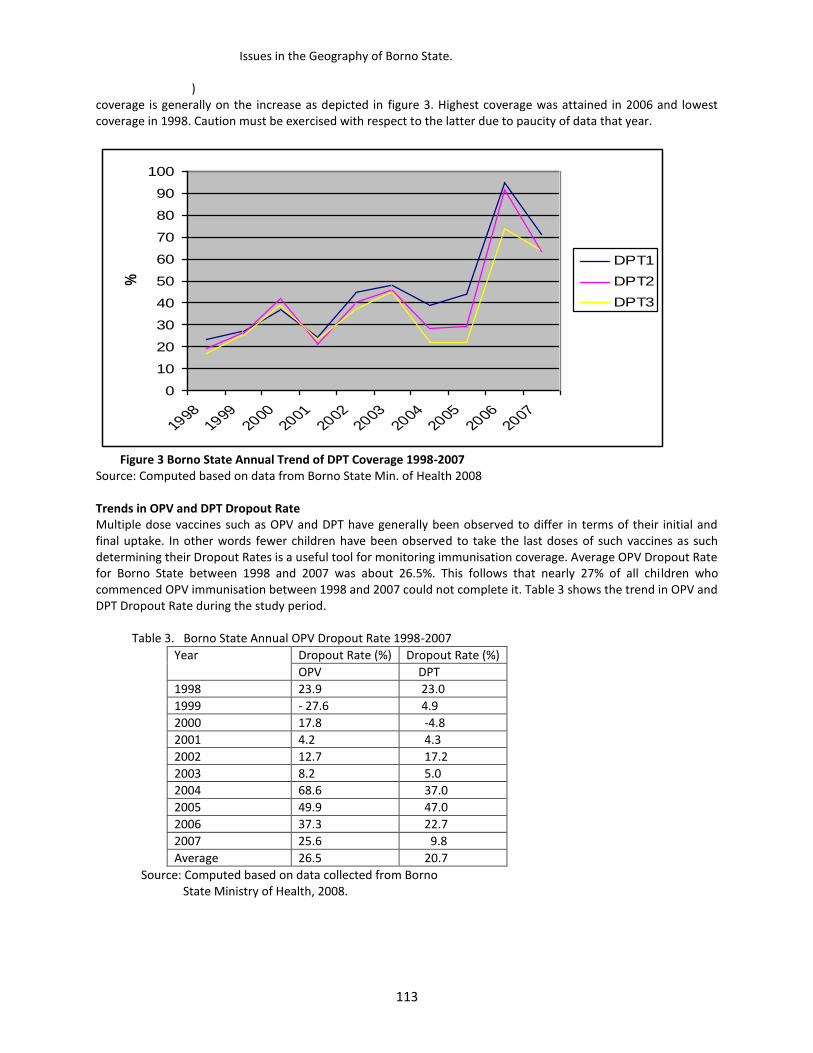
Issues in the Geography of Borno State.
)
113
coverage is generally on the increase as depicted in figure 3. Highest coverage was attained in 2006 and lowest coverage in 1998. Caution must be exercised with respect to the latter due to paucity of data that year.
0
10
20
30
40
50
60
70
80
90
100
19981999
20002001
20022003
20042005
20062007
%
DPT1
DPT2
DPT3
Figure 3 Borno State Annual Trend of DPT Coverage 1998-2007 Source: Computed based on data from Borno State Min. of Health 2008 Trends in OPV and DPT Dropout Rate Multiple dose vaccines such as OPV and DPT have generally been observed to differ in terms of their initial and final uptake. In other words fewer children have been observed to take the last doses of such vaccines as such determining their Dropout Rates is a useful tool for monitoring immunisation coverage. Average OPV Dropout Rate for Borno State between 1998 and 2007 was about 26.5%. This follows that nearly 27% of all children who commenced OPV immunisation between 1998 and 2007 could not complete it. Table 3 shows the trend in OPV and DPT Dropout Rate during the study period. Table 3. Borno State Annual OPV Dropout Rate 1998-2007
Year Dropout Rate (%) Dropout Rate (%)
OPV DPT
1998 23.9 23.0
1999 - 27.6 4.9
2000 17.8 -4.8
2001 4.2 4.3
2002 12.7 17.2
2003 8.2 5.0
2004 68.6 37.0
2005 49.9 47.0
2006 37.3 22.7
2007 25.6 9.8
Average 26.5 20.7
Source: Computed based on data collected from Borno State Ministry of Health, 2008.
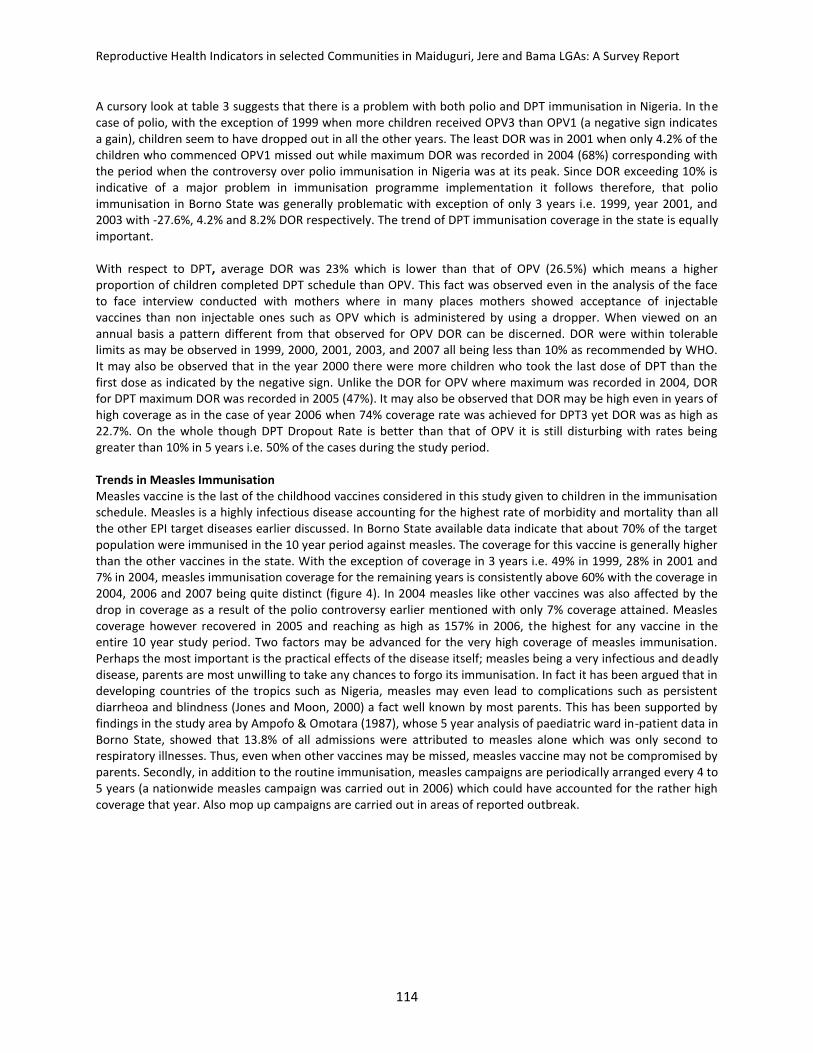
Reproductive Health Indicators in selected Communities in Maiduguri, Jere and Bama LGAs: A Survey Report
114
A cursory look at table 3 suggests that there is a problem with both polio and DPT immunisation in Nigeria. In the case of polio, with the exception of 1999 when more children received OPV3 than OPV1 (a negative sign indicates a gain), children seem to have dropped out in all the other years. The least DOR was in 2001 when only 4.2% of the children who commenced OPV1 missed out while maximum DOR was recorded in 2004 (68%) corresponding with the period when the controversy over polio immunisation in Nigeria was at its peak. Since DOR exceeding 10% is indicative of a major problem in immunisation programme implementation it follows therefore, that polio immunisation in Borno State was generally problematic with exception of only 3 years i.e. 1999, year 2001, and 2003 with -27.6%, 4.2% and 8.2% DOR respectively. The trend of DPT immunisation coverage in the state is equally important. With respect to DPT, average DOR was 23% which is lower than that of OPV (26.5%) which means a higher proportion of children completed DPT schedule than OPV. This fact was observed even in the analysis of the face to face interview conducted with mothers where in many places mothers showed acceptance of injectable vaccines than non injectable ones such as OPV which is administered by using a dropper. When viewed on an annual basis a pattern different from that observed for OPV DOR can be discerned. DOR were within tolerable limits as may be observed in 1999, 2000, 2001, 2003, and 2007 all being less than 10% as recommended by WHO. It may also be observed that in the year 2000 there were more children who took the last dose of DPT than the first dose as indicated by the negative sign. Unlike the DOR for OPV where maximum was recorded in 2004, DOR for DPT maximum DOR was recorded in 2005 (47%). It may also be observed that DOR may be high even in years of high coverage as in the case of year 2006 when 74% coverage rate was achieved for DPT3 yet DOR was as high as 22.7%. On the whole though DPT Dropout Rate is better than that of OPV it is still disturbing with rates being greater than 10% in 5 years i.e. 50% of the cases during the study period. Trends in Measles Immunisation Measles vaccine is the last of the childhood vaccines considered in this study given to children in the immunisation schedule. Measles is a highly infectious disease accounting for the highest rate of morbidity and mortality than all the other EPI target diseases earlier discussed. In Borno State available data indicate that about 70% of the target population were immunised in the 10 year period against measles. The coverage for this vaccine is generally higher than the other vaccines in the state. With the exception of coverage in 3 years i.e. 49% in 1999, 28% in 2001 and 7% in 2004, measles immunisation coverage for the remaining years is consistently above 60% with the coverage in 2004, 2006 and 2007 being quite distinct (figure 4). In 2004 measles like other vaccines was also affected by the drop in coverage as a result of the polio controversy earlier mentioned with only 7% coverage attained. Measles coverage however recovered in 2005 and reaching as high as 157% in 2006, the highest for any vaccine in the entire 10 year study period. Two factors may be advanced for the very high coverage of measles immunisation. Perhaps the most important is the practical effects of the disease itself; measles being a very infectious and deadly disease, parents are most unwilling to take any chances to forgo its immunisation. In fact it has been argued that in developing countries of the tropics such as Nigeria, measles may even lead to complications such as persistent diarrheoa and blindness (Jones and Moon, 2000) a fact well known by most parents. This has been supported by findings in the study area by Ampofo & Omotara (1987), whose 5 year analysis of paediatric ward in-patient data in Borno State, showed that 13.8% of all admissions were attributed to measles alone which was only second to respiratory illnesses. Thus, even when other vaccines may be missed, measles vaccine may not be compromised by parents. Secondly, in addition to the routine immunisation, measles campaigns are periodically arranged every 4 to 5 years (a nationwide measles campaign was carried out in 2006) which could have accounted for the rather high coverage that year. Also mop up campaigns are carried out in areas of reported outbreak.

Issues in the Geography of Borno State.
)
115
0
20
40
60
80
100
120
140
160
%
1998 1999 2000 2001 2002 2003 2004 2005 2006 2007
Figure 4.4 Borno State Annual Measles Coverage 1998-2007 Source: Computed based on data from Borno State Min. of Health, 2008 While understanding the temporal trends in childhood is important the need to examine its relationship with the prevalence of childhood diseases in Borno State is necessary so as to provide an assessment of the immunisation programme. Therefore childhood morbidity and mortality trends are examined in the next section. Childhood Morbidity and Mortality Child Morbidity Trend As a result of their stage of development children more than adults are affected by a wide range of diseases. Data collected from Borno State Health Management Information System indicate that children are affected by over 30 different diseases reported in health facilities across the state. In this study, data pertaining to only the six EPI target diseases or major child killers are considered and discussed. A summary of the 10 year morbidity cases of the 6 diseases is provided in Figure 5.
32061
9931
217
14024
2576 1017
DIPHTERIA
MEASLES
PERTUSSIS
POLIMYELITIS
TETANUS
TUBERCULOSIS
Figure 5 Borno State Reported Cases of Under 5 Mortality by Cause 1998-2007 Source: Computed based on data from Borno State Ministry of Health, 2008

Reproductive Health Indicators in selected Communities in Maiduguri, Jere and Bama LGAs: A Survey Report
116
It could be discerned from figure 5 that measles recorded the highest number of cases with 32,061 children followed by tetanus (including neonatal tetanus) with 14,024 and pertussis, 9,931. Least in occurrence is poliomyelitis with only 217 reported cases all of which occurred in just 3 years (2005, 2006 and 2007). The low occurrence of this disease may be due two factors. The disease might not have been reported well in the years prior to 2005. According to National Planning Commission/UNICEF (2001 p.40) ‘many cases of illnesses and deaths may not be reported by parents or caregivers to public health facilities. In addition, shortcomings in the diagnosis of illnesses, as well as capacity weaknesses for routine data collection and management at various levels of the health system, limit the completeness and quality of the data’. Secondly, it may be due to the fact that polio has received so much international attention through sustained immunisation during IPDs all over the nation and is now on the brink of being eradicated globally, hence making cases becoming too rare and infrequent. When the variability of the diseases is further taken into account the picture becomes even clearer (table 5) Table 5 Variability of Six Childhood Diseases in Borno State, 1998-2007
Source: Computed based on data from Borno State Min of Health, 2008 From the table it could be observed that almost all the diseases have very high variability, all being more than 40%. This resulted from the fact that most of the diseases recorded high morbidity rates in few years especially in 2003 and 2004. Highest variability occurred from measles with a co-efficient of variation of 100.6% followed by whooping cough with 104%. This may not be surprising when one looks at the morbidity trend as depicted in figure 6 where 34% of the reported cases occurred in 2004 alone and 61% of cases occurring in just 3 years i.e. 2003, 2004, 2005. Gregory (1978) however cautions that co-efficient of variation exceeding 35% would be misleading because in such situations the distribution curve of the data becomes asymmetrical. A very important observation is the high occurrence of childhood diseases in 2004 coinciding with low immunisation coverage in that year (compare figure 6 on child morbidity with figures 1, 2, 3 & 4 on BCG, OPV, DPT and measles coverage). Since the relationship between morbidity and mortality is obvious it would also be illuminating to equally examine the latter with respect to immunisation.
Disease Total Mean Standard Deviation
Co-efficient of Variation (%)
Tetanus 14,024 1,402 2,951 47.5
Tuberculosis 2,576 258 326 79.1
Poliomyelitis 217 22 36 61.1
Pertussis 9,931 993 948 104
Diphtheria 1,017 102 178 57.3
Measles 32,061 3,206 3,185 100.6
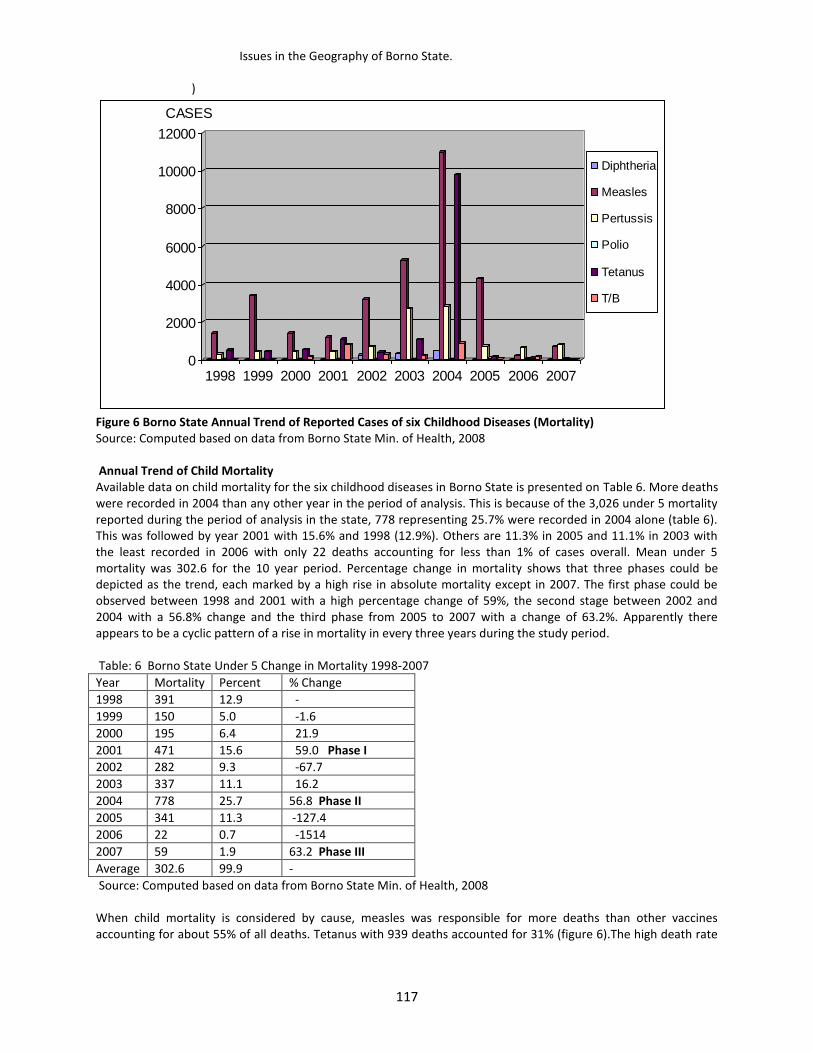
Issues in the Geography of Borno State.
)
117
0
2000
4000
6000
8000
10000
12000
CASES
1998 1999 2000 2001 2002 2003 2004 2005 2006 2007
Diphtheria
Measles
Pertussis
Polio
Tetanus
T/B
Figure 6 Borno State Annual Trend of Reported Cases of six Childhood Diseases (Mortality) Source: Computed based on data from Borno State Min. of Health, 2008 Annual Trend of Child Mortality Available data on child mortality for the six childhood diseases in Borno State is presented on Table 6. More deaths were recorded in 2004 than any other year in the period of analysis. This is because of the 3,026 under 5 mortality reported during the period of analysis in the state, 778 representing 25.7% were recorded in 2004 alone (table 6). This was followed by year 2001 with 15.6% and 1998 (12.9%). Others are 11.3% in 2005 and 11.1% in 2003 with the least recorded in 2006 with only 22 deaths accounting for less than 1% of cases overall. Mean under 5 mortality was 302.6 for the 10 year period. Percentage change in mortality shows that three phases could be depicted as the trend, each marked by a high rise in absolute mortality except in 2007. The first phase could be observed between 1998 and 2001 with a high percentage change of 59%, the second stage between 2002 and 2004 with a 56.8% change and the third phase from 2005 to 2007 with a change of 63.2%. Apparently there appears to be a cyclic pattern of a rise in mortality in every three years during the study period. Table: 6 Borno State Under 5 Change in Mortality 1998-2007
Year Mortality Percent % Change
1998 391 12.9 -
1999 150 5.0 -1.6
2000 195 6.4 21.9
2001 471 15.6 59.0 Phase I
2002 282 9.3 -67.7
2003 337 11.1 16.2
2004 778 25.7 56.8 Phase II
2005 341 11.3 -127.4
2006 22 0.7 -1514
2007 59 1.9 63.2 Phase III
Average 302.6 99.9 -
Source: Computed based on data from Borno State Min. of Health, 2008 When child mortality is considered by cause, measles was responsible for more deaths than other vaccines accounting for about 55% of all deaths. Tetanus with 939 deaths accounted for 31% (figure 6).The high death rate
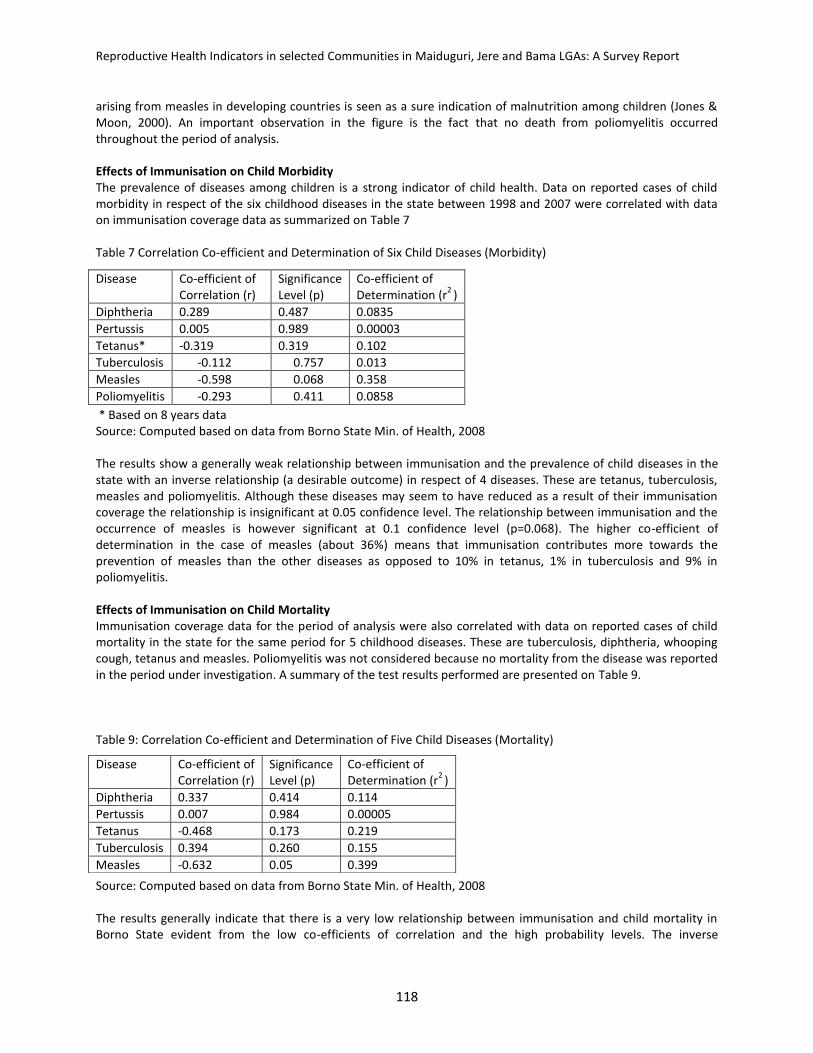
Reproductive Health Indicators in selected Communities in Maiduguri, Jere and Bama LGAs: A Survey Report
118
arising from measles in developing countries is seen as a sure indication of malnutrition among children (Jones & Moon, 2000). An important observation in the figure is the fact that no death from poliomyelitis occurred throughout the period of analysis. Effects of Immunisation on Child Morbidity The prevalence of diseases among children is a strong indicator of child health. Data on reported cases of child morbidity in respect of the six childhood diseases in the state between 1998 and 2007 were correlated with data on immunisation coverage data as summarized on Table 7 Table 7 Correlation Co-efficient and Determination of Six Child Diseases (Morbidity)
* Based on 8 years data Source: Computed based on data from Borno State Min. of Health, 2008 The results show a generally weak relationship between immunisation and the prevalence of child diseases in the state with an inverse relationship (a desirable outcome) in respect of 4 diseases. These are tetanus, tuberculosis, measles and poliomyelitis. Although these diseases may seem to have reduced as a result of their immunisation coverage the relationship is insignificant at 0.05 confidence level. The relationship between immunisation and the occurrence of measles is however significant at 0.1 confidence level (p=0.068). The higher co-efficient of determination in the case of measles (about 36%) means that immunisation contributes more towards the prevention of measles than the other diseases as opposed to 10% in tetanus, 1% in tuberculosis and 9% in poliomyelitis. Effects of Immunisation on Child Mortality Immunisation coverage data for the period of analysis were also correlated with data on reported cases of child mortality in the state for the same period for 5 childhood diseases. These are tuberculosis, diphtheria, whooping cough, tetanus and measles. Poliomyelitis was not considered because no mortality from the disease was reported in the period under investigation. A summary of the test results performed are presented on Table 9. Table 9: Correlation Co-efficient and Determination of Five Child Diseases (Mortality)
Source: Computed based on data from Borno State Min. of Health, 2008 The results generally indicate that there is a very low relationship between immunisation and child mortality in Borno State evident from the low co-efficients of correlation and the high probability levels. The inverse
Disease Co-efficient of Correlation (r)
Significance Level (p)
Co-efficient of Determination (r
2 )
Diphtheria 0.289 0.487 0.0835
Pertussis 0.005 0.989 0.00003
Tetanus* -0.319 0.319 0.102
Tuberculosis -0.112 0.757 0.013
Measles -0.598 0.068 0.358
Poliomyelitis -0.293 0.411 0.0858
Disease Co-efficient of Correlation (r)
Significance Level (p)
Co-efficient of Determination (r
2 )
Diphtheria 0.337 0.414 0.114
Pertussis 0.007 0.984 0.00005
Tetanus -0.468 0.173 0.219
Tuberculosis 0.394 0.260 0.155
Measles -0.632 0.05 0.399
Issues in the Geography of Borno State.
)
119
relationship between immunisation and child mortality with respect to tetanus and measles as indicated by the negative sign should be noted. However, the relationship is significant only in respect of measles (p=0.05). This implies that mortality from childhood diseases might have been reduced as a result of immunisation only with respect to measles. Since mere co-efficient of correlation would be misleading a co-efficient of determination (r
2)
was used to ascertain the degree to which immunisation contributes to the relationship. The co-efficient of determination as shown in table 9 suggests that immunisation may be a factor in reducing mortality only from measles accounting for about 40%. Conclusion Childhood immunisation is an effective strategy towards reducing mortality and morbidity of vaccine preventable diseases. So much resources have been expended through the EPI over the years. However, available data with respect to Borno State show that little evidence exists of the impact of the programme in reducing child diseases and deaths arising from vaccine preventable diseases. A change in strategy aimed at reaching all households for the immunisation of all eligible children is desirable to attain herd immunity (80% and above) for all vaccines.
Reproductive Health Indicators in selected Communities in Maiduguri, Jere and Bama LGAs: A Survey Report
120
References Adamu, Y.M. (2004) Study of community and systemic factors affecting the uptake of immunisation in Nigeria
(Kano State study report) submitted to PATHS Ampofo, L. & Omotara, B.A. (1987) Epidemiology of measles in Borno State, Annals of Borno vol. IV pp. Awosika, D (2004) ‘Forward’. In Basic Guide for Routine Immunization Service Providers, National Programme on
Immunization, Abuja. Bennett, F.J. (1988) Community diagnosis and health action: A manual for tropical rural areas. London: Macmillan. Dori, F, (2007) Speech delivered as permanent secretary Ministry of Women Affairs and Social Development
Borno State during a sensitization meeting for the November 2007 immunisation Plus Days (IPDs) held at the Musa Usman Secretariat, Maiduguri 24
th November.
Ekanem, E. E (1988) A 10 year review of morbidity from child hood preventable diseases in Nigeria: How successful is the EPI ? Journal of Tropical Paediatrics 34/6 (abstract)
Gesler, W.M & Gage, G. (1987) ‘Health care delivery for under five children in rural Sierra Leone.’ In Akhtar, R. (ed.) Health and Disease in Tropical Africa:Geographical and Medical Viewpoints. Switzerland: Harwood pp.
427-468. Gregory, S. (1978) Statistical Methods and the Geographer, London: New York p. 159. Jones, K and Moon, G (1987) Health, Disease and Society: An introduction to Medical Geography, London:
Routeledge Mbaya, J. Y (2004) Study of community and systemic factors affecting the uptake of immunization in Nigeria, Borno
State Report PATHS. National Population Commission (NPC)/ ORC Macro (2004a). Nigeria Demographic and Health Survey 2003,
Calverton, Maryland: National Population Commission and ORC Macro. Umar, B.A. (2006) Child Immunisation: Muslim reaction in Northern Nigeria, Kano: International Institute for
Islamic Thought (Nigeria Office) WHO (2006) Millennium Development Goal 4, www.who.int/mdg/goal4/en/index.html. Accessed on 25/8/06

Issues in the Geography of Borno State.
)
121
SECTION FIVE Water Resource utilization
122
16 Viability of Rainwater Harvesting In Maiduguri WAKIL MALAH BUKAR Department of Geography Kashim Ibrahim College of Education, Maiduguri MUSTI LAWAL ALH. ALI Department of Geography Kashim Ibrahim College of Education, Maiduguri Introduction Water is an essential element in life. It is a basic natural resource that supports the existence of all forms of life on the planet earth, whose over 70% of its surface constitute water. Despite the significance of water on human life and its abundance earth surface, yet millions of people throughout the world lack enough of this basic commodity for drinking and other domestic needs (Agarawal and Narain, 1997). This scenario prevails more in arid and semi arid environment particularly, that of third world countries, where poverty and low level of technology combine to hinder development. This problem is compounded by the rapid population growth in these countries and hence increased water demands. Maiduguri, the Borno state capital fits into the scenario described above, hence the necessity of obtaining and securing sufficient quantities of water for domestic (and agricultural) consumption dominate political and economic discourse of both the people and the government(s). Water continued to be a development challenge in the city as the two main supply sources (ground water and surface water) could not guarantee steady supply, hence call for the need for alternative sources. Such alternative can be sourced from rain water harvesting from roof tops as the case in many areas with similar water crisis. Rain water harvesting simply refers to the direct interception of rainfall for human use. In its broadest sense, UNEP (2000), defines it as the technology used for collecting and storing rainwater for human use from roof tops, land surface or rock, catchments using simple and relatively affordable materials such as coarse mesh, gutters, conduits, filters and storage tanks. This study therefore focuses on supplementary role of rain water harvesting from root top by households in Maiduguri. Statement of the Problem Underground and surface water sources are the two major supply sources for domestic needs of the residents of Maiduguri. Underground water is mainly exploited through the various boreholes spread in the area. The only exploitable surface water for domestic uses is the dam at Alau along the channel of river Ngadda. Alau dam supplies water to substantial parts of Maiduguri and environs (Bukar, 2006). At maximum operation hours, the boreholes yield 622,360liters per day, while the current maximum yield from the Alau treatment plant is 25,000m
3
(25,000,000 liters per day), thus giving the combined supply from the two sources as 25.6 million liters daily (Bukar, 2006). The analysis of domestic water demand in Maiduguri shows that the daily water need (domestic) of the city is 31.16 million liters (Bukar, 2006). This clearly indicates domestic water deficit of 5.56 million liters daily. Therefore, there is the need for focusing research attention to alternative sources. It is believed that rain water harvesting provides such alternative, considering successes recorded in other places with similar water crisis (Hartung, 2002, UNEP, 2000).In addition, the US National Academy of Science revealed that mean annual rainfall of 100mm is enough to support any harvesting system (NAS, 1974). Also 10mm of rain gives an equivalent of 10m
3 (Suleiman et al, 1999). These potentials, therefore, call for research attention, with the
view of demonstrating its strength or otherwise in Maiduguri. Examples of Countries with successful Rainwater Harvesting Scheme Examples of rainwater harvesting and utilisalition are many in both developed and developing countries of the world. In Tokyo, Japan rainwater harvesting and utilisation is promoted to mitigate water shortages, control floods, and secure water for emergencies. At the community level, a simple and unique rainwater utilisation facility, ‘Rojison’, has been set up by local residents in the Mukojinna of Tokyo (UNEP, 2000) to utilize rainwater collected from roofs of private houses for garden watering, fire fighting and drinking water in emergencies. In October 1998
Issues in the Geography of Borno State.
)
123
rainwater utilisation systems were introduced in Berlin, Germany as part of a large scale urban re-development, control urban flooding, save city water and create a better micro climate. Rain falling on the rooftops (32,000m²) of 19 buildings is collected and stored in 350m³ rainwater basement tanks. It is used for toilet flushing watering of green areas and replenishing of artificial ponds (UNEP, 2000). Storing rainwater from rooftop in jars is an appropriate and inexpensive means of obtaining high quality drinking water in Thailand. The jars come in various capacities, ranging from 100 to 3,000 liters and equipped with lid, faucet and drain. The most popular size is 2,000 liters, which holds sufficient rainwater for a six person household during the dry season, lasting up to six months. Gansu is one of the desert provinces in China where rainwater harvesting takes place. Since the 1980s, research, demonstrations and extension projects on rainwater harvesting have been carried out with very positive results (National Resource Conservation Commission, 2003). Those efforts have proven successful in supplying drinking water for 1.3 million people and developing irrigated land for a courtyard economy. Rainwater collection is becoming more widespread in Africa with projects currently in Botswana, Togo, Mali, Malawi, South Africa, Namibia, Zimbabwe, Sierra Leone and Tanzania among others. Kenya is leading the way (UNEP, 2000; National Resource Conservation Commission, 2003). In Nigeria, however, the practice is not well developed. Apart from few pilot projects mostly in the southern part of the country, interception of rainwater for utilization is still done in the crude ways (Sridhar et al, 2006). Purpose of the Study
The study is aimed at demonstrating the potential of rainwater harvesting in supplementing water supply in households of Maiduguri. This can be achieved by analyzing the rainfall regime in Maiduguri for a given period; demonstrating the strength of rainwater harvesting from roof top and to determine the extent to which rainwater harvesting, supplements domestic water supply Methods Data used in this study are annual rainfall records of Maiduguri (1960 - 2002) to determine the strength of the Maiduguri rains in supporting harvesting for utilisation. Roof water collection experiment was carried out to ascertain the potential and the extent at which this practice supplements existing water sources. Roof catchment of 6m x 0.3m or 1.8m
2 was used together with a stopwatch and two 15 liter buckets were also used. The
experiment was restricted to the four rainy months of June, July, August and September in 2002 (this trend is seem to be changing in recent years, for example no rain has been recorded in June this year; 2009). Other information used is the domestic water demand in Maiduguri and the volume of water harvested from a given amount of rainfall which are secondarily sourced. The study has a limitation of restricting the roof water collection experiment to one point instead of repeated experiments from different sampled locations. However without prejudices to the variation of rainfall events within a locality, the study incorporates the rain gauge readings and the duration of rainfall events so that whatever volume harvested from the roof is the function of the rain gauge reading and the duration of those rain events. The analysis techniques used are essentially descriptive. However, inferences are also used in the analysis of the roof water collection experiment. Results and Discussion It has been established that 100mm of annual rainfall is sufficient for any harvesting system (NAS, 1974). In addition 10mm of rain falling on a hectare of land is equivalent to 10m
3 of water (Suleiman et al 1995). In other
words, 10mm of rain falling on an area of 1000m2 or 10km
2 yields 10,000 liters of water. These are the bases on
which the viability of rainwater harvesting in Maiduguri is measured. Though rainfall lasts for four months in Maiduguri (online Nigeria, 2003), the annual figures from 1960 – 2002, always exceeded the 100mm set by the NAS. Figure 1 below summaries the rainfall distribution and variation within the period.
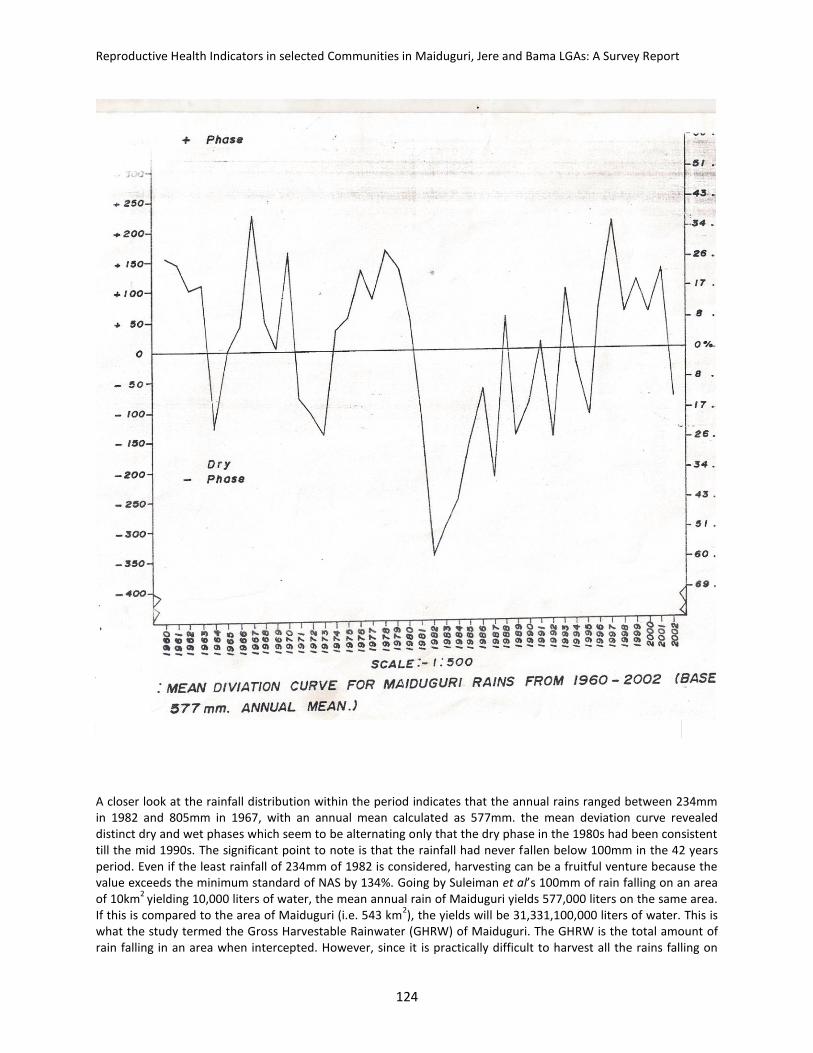
Reproductive Health Indicators in selected Communities in Maiduguri, Jere and Bama LGAs: A Survey Report
124
A closer look at the rainfall distribution within the period indicates that the annual rains ranged between 234mm in 1982 and 805mm in 1967, with an annual mean calculated as 577mm. the mean deviation curve revealed distinct dry and wet phases which seem to be alternating only that the dry phase in the 1980s had been consistent till the mid 1990s. The significant point to note is that the rainfall had never fallen below 100mm in the 42 years period. Even if the least rainfall of 234mm of 1982 is considered, harvesting can be a fruitful venture because the value exceeds the minimum standard of NAS by 134%. Going by Suleiman et al’s 100mm of rain falling on an area of 10km
2 yielding 10,000 liters of water, the mean annual rain of Maiduguri yields 577,000 liters on the same area.
If this is compared to the area of Maiduguri (i.e. 543 km2), the yields will be 31,331,100,000 liters of water. This is
what the study termed the Gross Harvestable Rainwater (GHRW) of Maiduguri. The GHRW is the total amount of rain falling in an area when intercepted. However, since it is practically difficult to harvest all the rains falling on
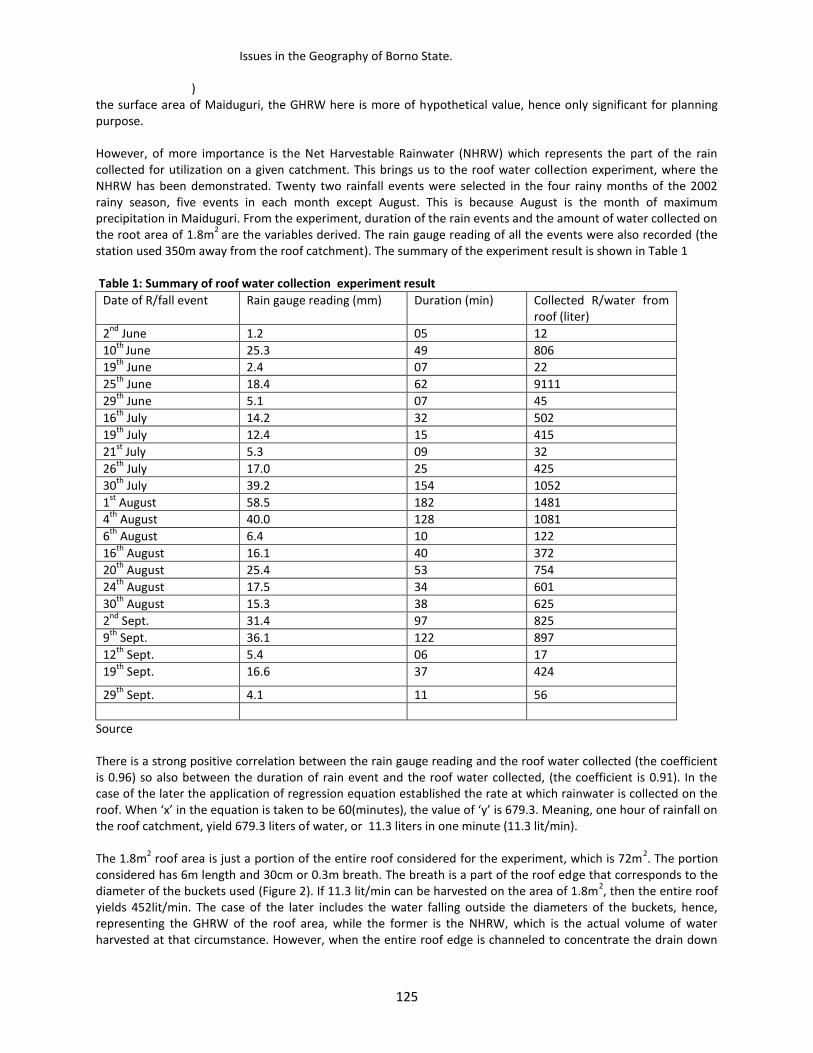
Issues in the Geography of Borno State.
)
125
the surface area of Maiduguri, the GHRW here is more of hypothetical value, hence only significant for planning purpose. However, of more importance is the Net Harvestable Rainwater (NHRW) which represents the part of the rain collected for utilization on a given catchment. This brings us to the roof water collection experiment, where the NHRW has been demonstrated. Twenty two rainfall events were selected in the four rainy months of the 2002 rainy season, five events in each month except August. This is because August is the month of maximum precipitation in Maiduguri. From the experiment, duration of the rain events and the amount of water collected on the root area of 1.8m
2 are the variables derived. The rain gauge reading of all the events were also recorded (the
station used 350m away from the roof catchment). The summary of the experiment result is shown in Table 1 Table 1: Summary of roof water collection experiment result
Date of R/fall event Rain gauge reading (mm) Duration (min) Collected R/water from roof (liter)
2nd
June 1.2 05 12
10th
June 25.3 49 806
19th
June 2.4 07 22
25th
June 18.4 62 9111
29th
June 5.1 07 45
16th
July 14.2 32 502
19th
July 12.4 15 415
21st
July 5.3 09 32
26th
July 17.0 25 425
30th
July 39.2 154 1052
1st
August 58.5 182 1481
4th
August 40.0 128 1081
6th
August 6.4 10 122
16th
August 16.1 40 372
20th
August 25.4 53 754
24th
August 17.5 34 601
30th
August 15.3 38 625
2nd
Sept. 31.4 97 825
9th
Sept. 36.1 122 897
12th
Sept. 5.4 06 17
19th
Sept. 16.6 37 424
29th
Sept. 4.1 11 56
Source There is a strong positive correlation between the rain gauge reading and the roof water collected (the coefficient is 0.96) so also between the duration of rain event and the roof water collected, (the coefficient is 0.91). In the case of the later the application of regression equation established the rate at which rainwater is collected on the roof. When ‘x’ in the equation is taken to be 60(minutes), the value of ‘y’ is 679.3. Meaning, one hour of rainfall on the roof catchment, yield 679.3 liters of water, or 11.3 liters in one minute (11.3 lit/min). The 1.8m
2 roof area is just a portion of the entire roof considered for the experiment, which is 72m
2. The portion
considered has 6m length and 30cm or 0.3m breath. The breath is a part of the roof edge that corresponds to the diameter of the buckets used (Figure 2). If 11.3 lit/min can be harvested on the area of 1.8m
2, then the entire roof
yields 452lit/min. The case of the later includes the water falling outside the diameters of the buckets, hence, representing the GHRW of the roof area, while the former is the NHRW, which is the actual volume of water harvested at that circumstance. However, when the entire roof edge is channeled to concentrate the drain down
Reproductive Health Indicators in selected Communities in Maiduguri, Jere and Bama LGAs: A Survey Report
126
water at one or two points of collection, the GHRW = NHRW. This is more tenable on small catchments such as the roof. Conclusion and Recommendations It can be concluded from the analysis above that rain water harvesting for domestic uses can be a viable venture, first the annual rainfall of Maiduguri for 42 years always exceeded the 100mm limit set, the least annual figure is 234mm in 1982. Second, going by the 10mm of rain yield 10m
3 of water, the mean annual rain of 577 yields 31.33
billion liter of GHRW and thirdly, the demonstration of roof water collection revealed that 11.3 lit/min can be harvested from the roof area of 1.8m
3. All these are pointers to the potential of rain water harvesting in
supplementing domestic water supply particularly in bridging the daily water deficit of 5.56 million liters. However, these potentials cannot be realized unless techniques that maximize the NHRW are adopted. Using buckets and other small containers, as well as unhygienic practices are inimical to the realization of this potential. To improve the practice in order to realize its potential the following recommendation are put forward. More interest should be developed by government agencies concerned with water, NGOs as well individual on this viable source of almost pure an d free source of water. A special rain water harvesting unit should be established by water supply agencies at all levels of government. Such units should be vested with the responsibilities of mobilization- in the forms of seminars, workshops, and conferences, dissemination of borrowed harvesting techniques from other places, regulation for hygienic practices; and conducting studies in the field. More research efforts should be focused on the practice, particularly on the quality of such water harvested. Governments’ water and public health agencies, universities and private cooperate organization- as part of their social responsibilities Finally, technology from other countries on the practice should be imported for adoption. This should be spear-head by the suggested rainwater harvesting units and NGOs.

Issues in the Geography of Borno State.
)
127
References Agarawal, A. and Narain, S. (1997) Dying wisdom: Rise, fall and Potentials of Indians Traditional Water Harvesting
System. Center for Science and Environment (CES) New Delhi. Bukar, W. M. (2006) The Viability and Sustainability of Rainwater Harvesting in Maiduguri Metropolis. Unpublished
M.sc Dissertation, University of Maiduguri. Federal Ministry of Foreign Affairs (2003) Borno state: Physical Setting.
www.onlinenigeria.com/links/bornoadv.asp Hartung, H. (2002) The Rain Water Harvesting. Margrat publishers; Germany. Mohammed, B; Daura, M M; and Dunham, R J (1997) ‘Rainwater Harvesting and Runoff Recovery Techniques for
Improving Range and Cropland Productivity in Semi-arid Regions of Nigeria’ in Daura, M M (ed) Issues in Environmental Monitoring in Nigeria Proceedings of the 1996 N G A Conference, Maiduguri.
National Academy of Science, NAS (1974) More Water for Arid Lands; Promising Technology and Research Opportunities. NAS, Washington DC.
Suleiman, S; Wood, M K; Shah, B H and Murry, L (1995) ‘Development Rainwater Harvesting Systems for Increasing Soil Moisture in Arid Range Lands in Pakistan’ Journal of Arid Environment Vol.31. U. A.
Texas National Resource Conservation Commission, (2003)
RainwaterharvestingorCollection.www.tnrc.state.TxUs/exec/sbea/rainwater.Html. United Nations Environment Program, UNEP (2000) Rainwater harvesting and Utilisation: An Environmentally
Sound Approach for Sustainable Urban Water Management. www.unep.or.jp/ietc/publications.
128
17 The Impact Of Declining Water Supply On Rural Women In Northern Borno YAGANA BUKAR Department of Geography, University of Maiduguri YAGANA MUHAMMAD AJI Department of Geography, University of Maiduguri Introduction There is wide spread recognition that the world is facing a growing water crises. Millions of people suffer from lack of water for domestic purpose and for agricultural production. The U.N. reports that 1.1 billion people (one in six of the world population) lack access to clean drinking water and 2.4 billion lack sanitation (UNWWDR, 2007). According to the report, rapidly growing populations, urbanization, agricultural intensification and climate change all contribute to greater competition and scarcity of water resources. A number of International initiatives aim to tackle this global problem through improving management of water and setting targets for provision of supplies to increased number of people within the general context of poverty alleviation and environmental sustainability. The greater involvement of women and the adoption of gender sensitive approaches are recognised as means of achieving these targets. The millennium Development Goals (MDGS) adopted at the U.N. in 2000 include goals to “promote gender equality and empower women” and to “ensure environmental sustainability”. It emphasised the importance of a gender-sensitive approach to water resources management and recognised that in addition to being prime users of domestic water, women also use water in their key role in food production and thus women and children are most vulnerable to water related disasters. As primary water carriers, managers and end- users, women play a paramount role in water resources management. The semi arid and arid zones of northern Nigeria are areas of serious water scarcity. Located on the fringes of this fragile zone, one recurrent environmental problem facing Borno State is the threatening drought and desertification and its attendant degradation of natural resources. The northern part of Borno state is particularly vulnerable to low rainfall regimes often punctuated by periodic droughts. By and large, the region is water deficient as both surface and underground water supply potentials are extremely limited. According to Ijere and Daura (2000) most women in the northern parts of Borno State do not have enough water for daily needs and so in addition to being short in supply, water is polluted and this may cause problem for women and their entire families and communities. Thus, women spend a lot of time and energy sourcing for water and as water supplies dry up or become polluted, more time is spent and women may become exposed to water related diseases. Despite the outlined scenario, not enough attention has been given to the role of women in water resources and the impact of declining water on women. Their water related work is taken for granted and denied economic and social value. This paper therefore seeks to explore the role of women in water supply and the impact of water shortage on women. It will attempt to fill the paucity in our knowledge of the impact of declining water supply on rural women’s access to water. What are the specific impacts of declining water availability on women’s access in
rural areas of Northern Borno State In what ways are rural women responding to water shortages? How has this
problem affected women’s socioeconomic status, including access to education and participation in other economic activities? These and other related questions would be addressed in this study. The broad aim of this paper is therefore to examine the impact of declining water availability on women in rural communities of northern parts of Borno state. The specific objectives include: to examine the sources and distances of water supply to communities; to document the specific ways in which rural women are affected by water shortage; to examine the ways rural women are responding to water shortage; to appraise the gender dimensions of water shortage in rural northern Borno state and to examine women’s role in terms of access, management and control over water sources.

Issues in the Geography of Borno State.
)
129
Materials and Methods Two sources of data were used in this study namely the primary and secondary sources. Primary data was generated through the administration of interview schedules and questionnaires. In addition Focus Group Discussions (FGDs) were held with groups of women and in depth interview conducted with key informants such as traditional title holders. Published and unpublished materials such as textbooks, journals, seminar papers and the internet provided the secondary data required in this study. The study area covers the ten local government areas of Borno State namely: Abadam, Gubio, Guzamala, Kukawa, Magumeri, Mobbar, Monguno, Marte, Kaga and Nganzai local government areas. All the women in these areas form the study population for this research. The study in based on a sample selected from three of the local government areas listed. A purposive procedure was used to select the most arid L.G, the most semi-arid and the third L.G falls within the two extremes. The aridity in this perspective is associated with geographical location of the areas. Ijere et al (2000) identify three major geographical location-associated problems namely drought desertification and wind erosion. Thus, the LG areas selected are Kukawa which is the most arid, Magumeri the most semi-arid, and Mobbar which falls within the two extremes. Stratified simple random procedure was adopted to select a sample of three hundred rural women. The stratification was a multi-staged process in which the selected LGAs were stratified on the basis of village clusters and within each cluster, rural women representing the different demographic categories above the age of fifteen randomly selected. One hundred (100) women were selected from each of the three local government areas. Focus Group Discussions FGDS were held with group of women (six to ten women) in each locality. The traditional title holder in each local government served as the key informant of the in-depth interviews. Data Analysis Data generated for this study was analyzed both qualitatively and quantitatively. The qualitative data that was generated through the FGDS and in-depth interviews were transcribed and discussed by discerning the key themes and findings. Simple descriptive statistics was used to show the various characteristics of rural women. The mean frequency and percentage were used to analyze the socio – economic variables. RESULTS AND DISCUSSION Socio – demographic characteristics of respondents: Majority of the respondents are female (86.4%) and they form the target group of the study. These women fall within the economically active age group of 25-50years, indispensable for water collection and management. The area is mostly dominated by the Kanuri and the Shuwa–Arab ethnic groups. The survey result show that most of the respondents are married (94.01%). In these communities, marital status is considered an important determinant of social status and marriage is an indicator of responsibility and achievement in society. In all the study area, it was observed that there is no sixteen year old girl that is unmarried. Thus, the composition of the households show that majority of the respondents (63%) have children between 1-8 children. Though this has implication for family well being in terms of savings, education, and so on, within the context of rural communities, large household sizes provided necessary agricultural labor, domestic water and fuel needs among others. The survey results indicate that majority of the respondents 56% have no form of education at all while about 32% have Qur’anic education. Those with primary education are less than 12%. The level of education among women is very low and this has serious negative implications in terms of enhancing their roles in decision making, policy implementation and indeed even for girl child education. Socio–economic activities of respondents The major occupation in the study area as in most parts of rural northern Nigeria is agriculture and animal rearing. This is reflected in the survey data which shows that majority (94%) of the women are all engaged in agricultural production, both rain-fed agriculture and fadama farming during the dry season. Women are also involved in petty trading, marketing of dairy products, groundnut oil processing etc. In addition to being responsible for many of the above agricultural activities, women are also the major providers of fuel wood and domestic water to their house
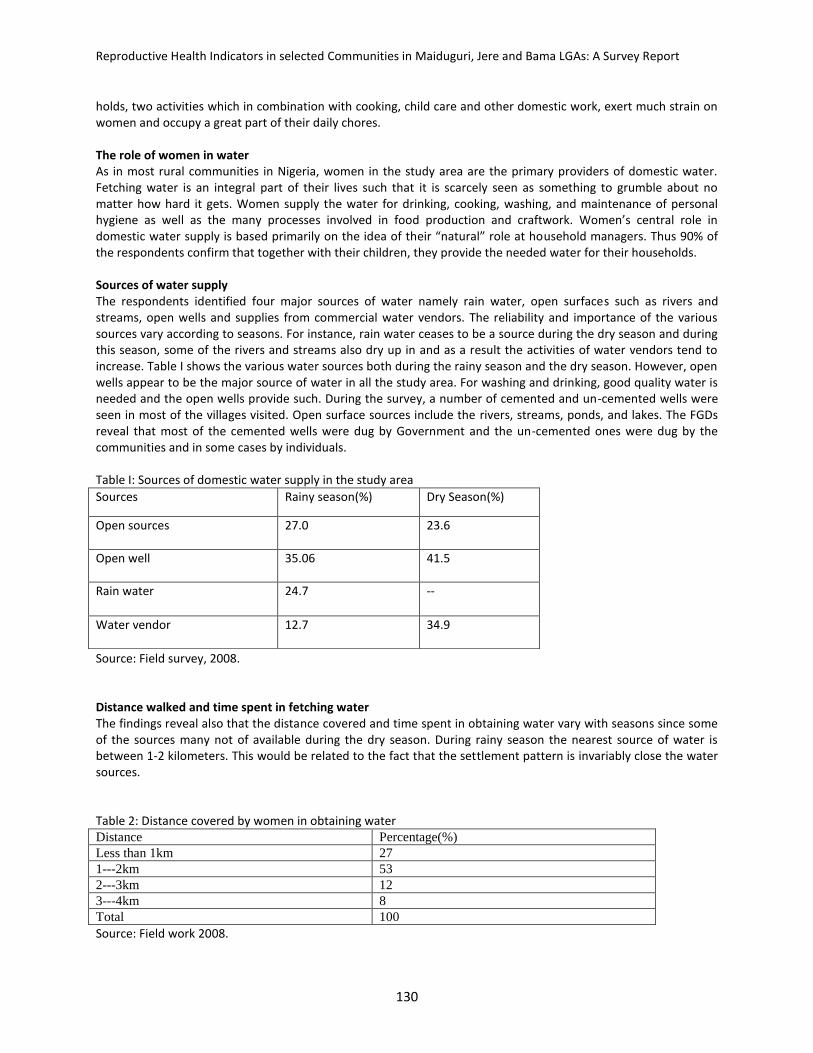
Reproductive Health Indicators in selected Communities in Maiduguri, Jere and Bama LGAs: A Survey Report
130
holds, two activities which in combination with cooking, child care and other domestic work, exert much strain on women and occupy a great part of their daily chores. The role of women in water As in most rural communities in Nigeria, women in the study area are the primary providers of domestic water. Fetching water is an integral part of their lives such that it is scarcely seen as something to grumble about no matter how hard it gets. Women supply the water for drinking, cooking, washing, and maintenance of personal hygiene as well as the many processes involved in food production and craftwork. Women’s central role in domestic water supply is based primarily on the idea of their “natural” role at household managers. Thus 90% of the respondents confirm that together with their children, they provide the needed water for their households. Sources of water supply The respondents identified four major sources of water namely rain water, open surfaces such as rivers and streams, open wells and supplies from commercial water vendors. The reliability and importance of the various sources vary according to seasons. For instance, rain water ceases to be a source during the dry season and during this season, some of the rivers and streams also dry up in and as a result the activities of water vendors tend to increase. Table I shows the various water sources both during the rainy season and the dry season. However, open wells appear to be the major source of water in all the study area. For washing and drinking, good quality water is needed and the open wells provide such. During the survey, a number of cemented and un-cemented wells were seen in most of the villages visited. Open surface sources include the rivers, streams, ponds, and lakes. The FGDs reveal that most of the cemented wells were dug by Government and the un-cemented ones were dug by the communities and in some cases by individuals. Table I: Sources of domestic water supply in the study area
Source: Field survey, 2008. Distance walked and time spent in fetching water The findings reveal also that the distance covered and time spent in obtaining water vary with seasons since some of the sources many not of available during the dry season. During rainy season the nearest source of water is between 1-2 kilometers. This would be related to the fact that the settlement pattern is invariably close the water sources. Table 2: Distance covered by women in obtaining water Distance Percentage(%)
Less than 1km 27
1---2km 53
2---3km 12
3---4km 8
Total 100
Source: Field work 2008.
Sources Rainy season(%) Dry Season(%)
Open sources 27.0 23.6
Open well 35.06 41.5
Rain water 24.7 --
Water vendor 12.7 34.9
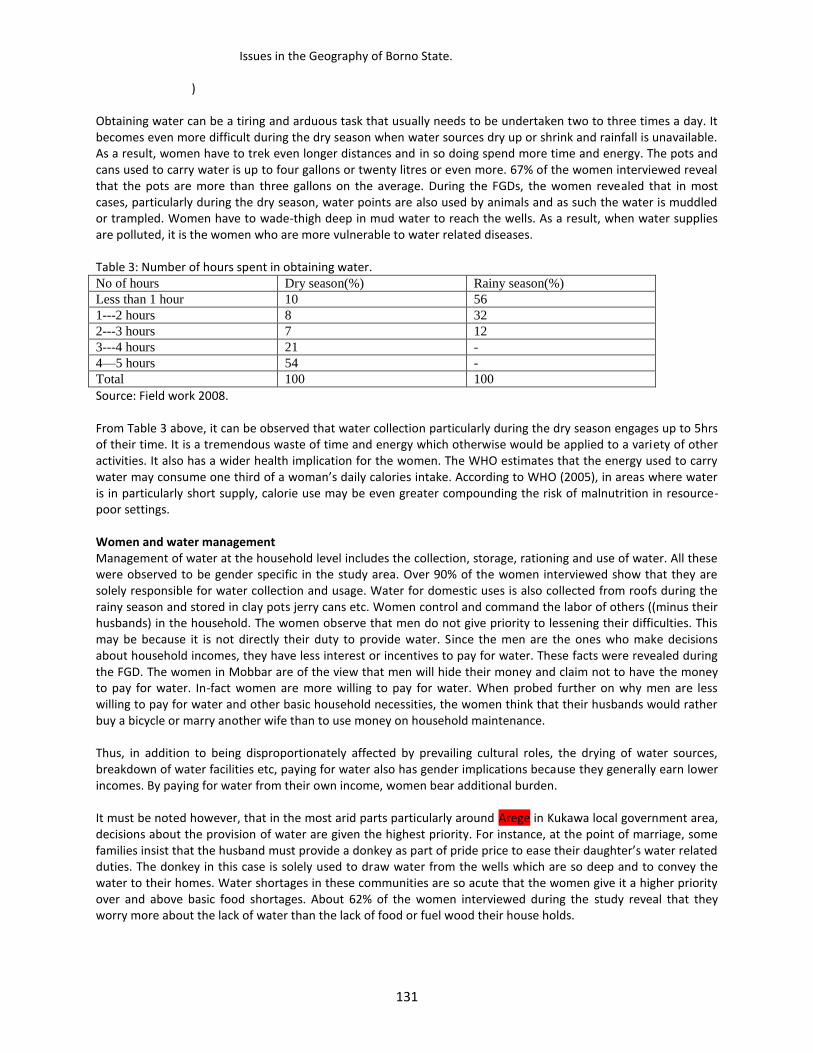
Issues in the Geography of Borno State.
)
131
Obtaining water can be a tiring and arduous task that usually needs to be undertaken two to three times a day. It becomes even more difficult during the dry season when water sources dry up or shrink and rainfall is unavailable. As a result, women have to trek even longer distances and in so doing spend more time and energy. The pots and cans used to carry water is up to four gallons or twenty litres or even more. 67% of the women interviewed reveal that the pots are more than three gallons on the average. During the FGDs, the women revealed that in most cases, particularly during the dry season, water points are also used by animals and as such the water is muddled or trampled. Women have to wade-thigh deep in mud water to reach the wells. As a result, when water supplies are polluted, it is the women who are more vulnerable to water related diseases. Table 3: Number of hours spent in obtaining water. No of hours Dry season(%) Rainy season(%)
Less than 1 hour 10 56
1---2 hours 8 32
2---3 hours 7 12
3---4 hours 21 -
4—5 hours 54 -
Total 100 100
Source: Field work 2008. From Table 3 above, it can be observed that water collection particularly during the dry season engages up to 5hrs of their time. It is a tremendous waste of time and energy which otherwise would be applied to a variety of other activities. It also has a wider health implication for the women. The WHO estimates that the energy used to carry water may consume one third of a woman’s daily calories intake. According to WHO (2005), in areas where water is in particularly short supply, calorie use may be even greater compounding the risk of malnutrition in resource-poor settings. Women and water management Management of water at the household level includes the collection, storage, rationing and use of water. All these were observed to be gender specific in the study area. Over 90% of the women interviewed show that they are solely responsible for water collection and usage. Water for domestic uses is also collected from roofs during the rainy season and stored in clay pots jerry cans etc. Women control and command the labor of others ((minus their husbands) in the household. The women observe that men do not give priority to lessening their difficulties. This may be because it is not directly their duty to provide water. Since the men are the ones who make decisions about household incomes, they have less interest or incentives to pay for water. These facts were revealed during the FGD. The women in Mobbar are of the view that men will hide their money and claim not to have the money to pay for water. In-fact women are more willing to pay for water. When probed further on why men are less willing to pay for water and other basic household necessities, the women think that their husbands would rather buy a bicycle or marry another wife than to use money on household maintenance. Thus, in addition to being disproportionately affected by prevailing cultural roles, the drying of water sources, breakdown of water facilities etc, paying for water also has gender implications because they generally earn lower incomes. By paying for water from their own income, women bear additional burden. It must be noted however, that in the most arid parts particularly around Arege in Kukawa local government area, decisions about the provision of water are given the highest priority. For instance, at the point of marriage, some families insist that the husband must provide a donkey as part of pride price to ease their daughter’s water related duties. The donkey in this case is solely used to draw water from the wells which are so deep and to convey the water to their homes. Water shortages in these communities are so acute that the women give it a higher priority over and above basic food shortages. About 62% of the women interviewed during the study reveal that they worry more about the lack of water than the lack of food or fuel wood their house holds.
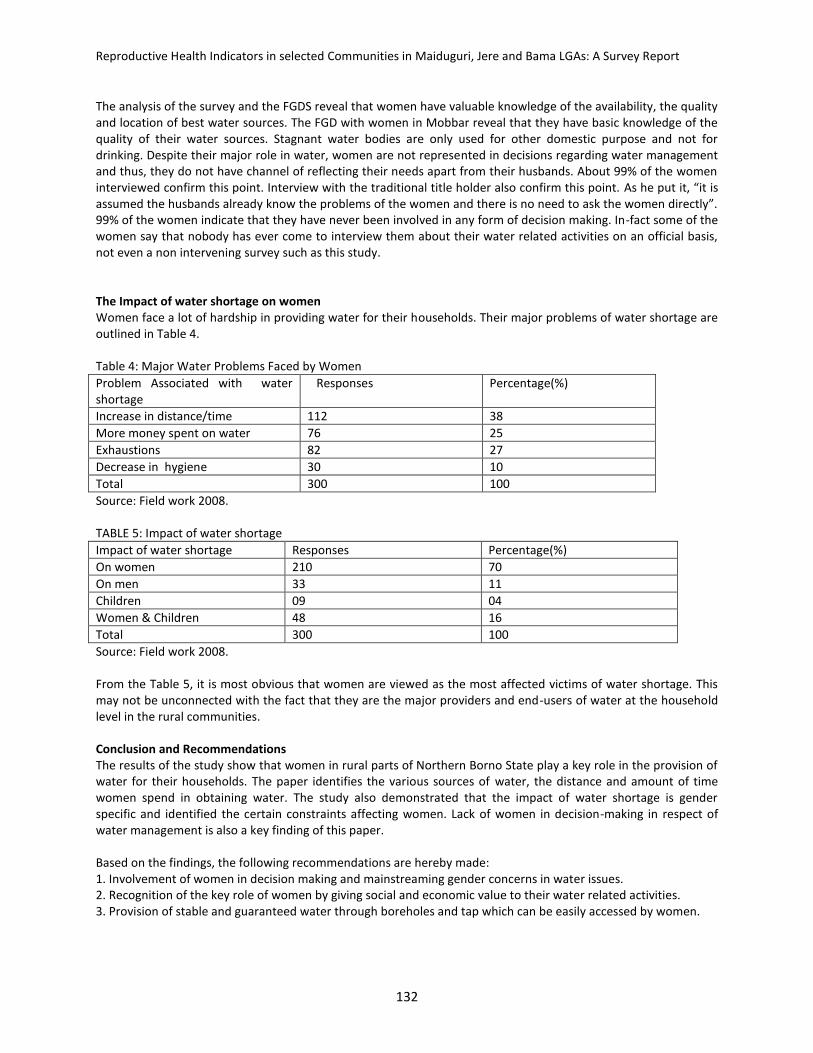
Reproductive Health Indicators in selected Communities in Maiduguri, Jere and Bama LGAs: A Survey Report
132
The analysis of the survey and the FGDS reveal that women have valuable knowledge of the availability, the quality and location of best water sources. The FGD with women in Mobbar reveal that they have basic knowledge of the quality of their water sources. Stagnant water bodies are only used for other domestic purpose and not for drinking. Despite their major role in water, women are not represented in decisions regarding water management and thus, they do not have channel of reflecting their needs apart from their husbands. About 99% of the women interviewed confirm this point. Interview with the traditional title holder also confirm this point. As he put it, “it is assumed the husbands already know the problems of the women and there is no need to ask the women directly”. 99% of the women indicate that they have never been involved in any form of decision making. In-fact some of the women say that nobody has ever come to interview them about their water related activities on an official basis, not even a non intervening survey such as this study. The Impact of water shortage on women Women face a lot of hardship in providing water for their households. Their major problems of water shortage are outlined in Table 4. Table 4: Major Water Problems Faced by Women
Problem Associated with water shortage
Responses Percentage(%)
Increase in distance/time 112 38
More money spent on water 76 25
Exhaustions 82 27
Decrease in hygiene 30 10
Total 300 100
Source: Field work 2008. TABLE 5: Impact of water shortage
Impact of water shortage Responses Percentage(%)
On women 210 70
On men 33 11
Children 09 04
Women & Children 48 16
Total 300 100
Source: Field work 2008. From the Table 5, it is most obvious that women are viewed as the most affected victims of water shortage. This may not be unconnected with the fact that they are the major providers and end-users of water at the household level in the rural communities. Conclusion and Recommendations The results of the study show that women in rural parts of Northern Borno State play a key role in the provision of water for their households. The paper identifies the various sources of water, the distance and amount of time women spend in obtaining water. The study also demonstrated that the impact of water shortage is gender specific and identified the certain constraints affecting women. Lack of women in decision-making in respect of water management is also a key finding of this paper. Based on the findings, the following recommendations are hereby made: 1. Involvement of women in decision making and mainstreaming gender concerns in water issues. 2. Recognition of the key role of women by giving social and economic value to their water related activities. 3. Provision of stable and guaranteed water through boreholes and tap which can be easily accessed by women.
Issues in the Geography of Borno State.
)
133
4. Policy makers should seek a gendered approach to water resources management that strives for a balanced division between men and women in access to and control over resources, access to information, contributions in time and cash 5. Since this work has not exhausted all the constraints faced by women in water supply, but briefly highlighted some important factors, there is need for further research on the impact of declining water supply on women.
Reproductive Health Indicators in selected Communities in Maiduguri, Jere and Bama LGAs: A Survey Report
134
References AbdulKarim, B. (2008): the Realities of Women’s survival in the Ecological Threshold of Northen Nigeria”. Proceedings of the 50
th Annual
Conference of Association of Nigerian Geographers, ANG Calabar. Ijere, J. A. and Daura M.M. (2000) ‘Survey of Borno State’ in “Nigeria: A People United, A Future Assured Vol 2. Abuja Federal Ministry of Information, PP 105-115 Hannan, C. and Ingar, A. 1995: A Gender Perspective on Water Resources Management. Stockholm, Sida. United Nations Development Programme, UNDP, 2003: “Mainstreaming Gender in Water Management: A practical Journey to Sustainability”. New York, UNDP. Available online from: www.undp.org/water/genderguide United Nations World Water Development Report (UNWWDR), 2007:’Water for People-Water for Life”. Paris, UNESCO. Berghahn books. World Health Organisation (WHO) (2005) ‘Women and the environment: Effects of Environmental Factors on Women Health’, Division of Environmental Health.
135
18 Towards an Efficient Water Quality in Fish Farming in the Arid Zone BAKO MALLAM MODU Department Of Fisheries, University of Maiduguri, Introduction. To a great, extent water quality determines the success or failure of an aquaculture operation. As fish are consumers (of oxygen and feed) and producers (of carbon dioxide, ammonia and faces), the quality of the water diminishes as it is exposed to the fish. (Summerfelt, 2004).Consequently, what comes out of a holding system is not as good as what went in. Fish perform all their bodily functions in water, they are totally dependent upon water to breathe, feed and grow, excrete wastes, maintain a salt balance, and reproduce. Therefore, understanding the physical and chemical qualities of the water is critical to successful aquaculture.(LaDon, 1990). The list of potential water quality parameters along with the importance of any one parameter depending on the species held the type of culture system, the values of other water quality parameters, the specific application and many other influences (Summerfelt, 2004). Some water quality factors are more likely to be involved in mortalities while others are usually not directly toxic. All parameters, however, interact with other parameters and influence the overall water quality. What causes mortalities in one situation may not be in another. Some of the typical water quality parameters need to be known are: Dissolved oxygen, (DO) Temperature, pH, Ammonia, Carbon Dioxide, Salinity, Alkalinity, Hardness, Dissolved Minerals and Clarity. Of course, other parameters of concern include: water flows, (in recirculation system), solids content due to faeces and uneaten feed, and pathogens (Summerfelt, 2004). This presentation is born out of problems faced by individual fish farmers in and around Maiduguri on water quality. Moreover, information on the physico-chemical characteristics of the man-made impoundments in the arid-zone is scanty. It is therefore imperative to stress out some brief overview of the critical physical and chemical qualities of water that are important to fish culture in the region. The objective of the paper is to review the properties of water as they affect fish culture Physical and Chemical Characteristics of Water The physical and chemical properties of water greatly influence the uses, the distribution and richness of aquatic biota (Courtney and Clement, 1998). Water can hold large amounts of heat with a relatively small change in temperature. This heat capacity has far reaching implications. It permits a body of water to act as a buffer against wide fluctuations in temperature. The larger the body of water, the slower the rate of temperature change (Boyd, 1979). Furthermore, aquatic organisms take on the temperature of their environment and cannot tolerate rapid changes in temperature. Far from being a "universal solvent," as it is sometimes called, water can dissolve more substances than any other liquid. Water's Physical Factors Temperature Water temperature is the second most critical water quality parameter to be maintained. It directly affects all physiological processes of the fish, including respiration, feeding efficiency, growth, reproduction and behaviour (Swamn, 2003). Fish are cold-blooded organisms and assume approximately the same temperature as their surroundings. Fish are generally categorized into warm water, cool water, and coldwater species based on optimal growth temperatures. It also affects other water quality parameters such as dissolved oxygen levels, as previously indicated. Additionally, the proportion of total ammonia in the water that is un-ionized is directly affected by temperature, almost doubling for a temperature increase from 10
OC to 20
OC.
Reproductive Health Indicators in selected Communities in Maiduguri, Jere and Bama LGAs: A Survey Report
136
Temperature also determines the amount of dissolved gases (oxygen, carbon dioxide, nitrogen, etc.) in the water. The cooler the water the more solubility of gases in the aquatic systems. Temperature plays a major role in the physical process called thermal stratification. Here in the tropics, temperature may reach up to 40-45
oC during the
dry season. This can heat up all available aquatic media thereby making life difficult to the inhabitant. Plankton Planktons comprises of both phytoplankton’s and zooplanktons that causes turbidity but not directly harmful to fish. Phytoplankton (green algae) not only produces oxygen, but also provides a food source for zooplankton and filter feeding fish/shellfish. Phytoplankton also uses ammonia produced by fish as a nutrient source. Zooplankton is a very important food source for fry and fingerlings. Excessive amounts of algae can lead to increased rates of respiration during the night thereby consuming extra oxygen. Excessive phytoplankton build-ups or "blooms" which subsequently die will also consume extra oxygen. Any wide swings between day and night oxygen levels can lead to dangerously low oxygen concentrations. Suspended Solids The term is usually associated with plankton, fish wastes, uneaten fish feeds, or clay particles suspended in the water. Suspended solids are large particles which usually settle out of standing water through time. Suspend solids leads to water turbidity, and turbidity refers to the decrease in ability of water to transmit light into it, which is caused by colloidal effects of the suspended organic and inorganic sources (Boyd, 1979). Turbidity affects photosynthetic processes and thus inversely affects fish growth and development. LaDon (1990) added that, pond turbidity caused by planktonic organism is desirable trait whereas, that caused by suspended clay particles is undesirable. Fish wastes Fish waste particles can be a major source of poor water quality since they may contain up to 70 percent of the nitrogen load in the system These waste not only irritate the fish's gills, but can cause several problems to the biological filter. The particulate waste can clog the biological filter, causing the nitrifying bacteria to die from lack of oxygen. Particulate waste can also promote the growth of bacteria that produces--rather than consumes ammonia. Water's Chemical Factors Photosynthesis Photosynthesis is one of the most important biological activities in standing pond aquaculture. Many water quality parameters such as dissolved oxygen, carbon dioxide, pH cycles, and nitrogenous waste products are regulated by the photosynthetic reaction in phytoplankton. In addition to supplying oxygen in fish ponds, photosynthesis also removes several forms of nitrogenous wastes, such as ammonia, nitrates, and urea. Formula A Chlorophyll CO2 + H2O C6H12O6 + O2 Sunlight Formula B CO2 + H2OH2C03 HC03
- + H
+
During the day, respiration continues, but algae use CO2 for photosynthesis ,(formula A), the reaction goes from right to left, reducing the abundance of H
+ ions, and pH goes up. However, at night, respiration by bacteria, plants,
and animals (Fish) results in oxygen consumption and carbon dioxide production, the reaction in formula (B) goes from left to right, first producing carbonic acid (H2CO3) then bicarbonate HCO3
- and H
+ ions, the increase in H
+
causes the pH to drop. Dissolved Gases
Issues in the Geography of Borno State.
)
137
The most common gases measured and most studied in fish culture include: Oxygen, Carbon dioxide, Nitrogen, and ammonia. Concentrations are measured in parts per million (ppm) or milligrams per litre (mg/1), both units of measure are the same. Dissolved oxygen (DO) Dissolved oxygen, or DO, is the most critical water quality parameter and, therefore, requires continuous monitoring in systems maintaining high stocking densities. Low-dissolved oxygen levels are responsible for more fish kills, either directly or indirectly, than all other problems combined (LaDon, 1990). For fresh water at 10
OC, the
saturation DO level will be approximately 11.3 milligrams of oxygen per litre of water (mg/L) The saturation DO level drops as temperature rises, so that warmer water holds less oxygen (approximately 9.1 ppm in 20
OC
water).The minimum dissolved oxygen (DO) level that fish can safely tolerate depends upon temperature and to a certain extent the species being cultured. Solubility of oxygen increases as temperature decreases and vice versa. DO in a culture system must be maintained above levels considered stressful to fish. Warm water fish (species that grow best at temperatures above 27
OC) can tolerate lower DO concentrations than coldwater fish (species that
grow best at temperatures below 16OC). As a rule of thumb, DO should be maintained above 3.0 ppm (parts per
million; frequently used interchangeably with milligrams per litre, mg/L) and 5.0 ppm for warm and coldwater fish, respectively (LaDoN, 1990). Prolonged exposure to low, non-lethal levels of DO constitutes a chronic stress and will cause fish to stop feeding, reduce their ability to convert ingested food into fish flesh, and make them more susceptible to disease (Boyd, 1979). Intensive fish production in ponds, cages, flow-through, and recirculation systems requires aeration or oxygenation to maintain DO at safe levels. The amount of oxygen consumed by the fish is a function of its size, feeding rate, activity level, and temperature. Small fish consume more oxygen than large fish because of their higher metabolic rate (Boyd, 1979) To obtain good growth, fish must be cultured at optimum levels of dissolved oxygen. Dissolved oxygen levels less than 55 ppm can place undue stress on the fish, and levels less than 2 ppm will result in death. Some warm water species such as tilapia and carp are better adapted to withstand occasional low DO levels, while most cool water species cannot. Oxygen enters the water primarily through direct diffusion at the air-water interface and through plant photosynthesis. Direct diffusion is relatively insignificant unless there is considerable wind and wave action. Carbon dioxide (CO2) The primary sources of carbon dioxide in fish ponds are derived from respiration by fish and the microscopic plants and animals that comprise the fish pond biota.The problem with the potential toxicity of carbon dioxide can be related to the daily fluctuating pattern of dissolved oxygen and carbon dioxide concentrations.Carbon dioxide concentrations are highest when dissolved oxygen concentrations are lowest. Thus, dawn is a critical time for evaluating pond water quality from the standpoint of both dissolved oxygen and, to a lesser extent, carbon dioxide. See Fig. 1.
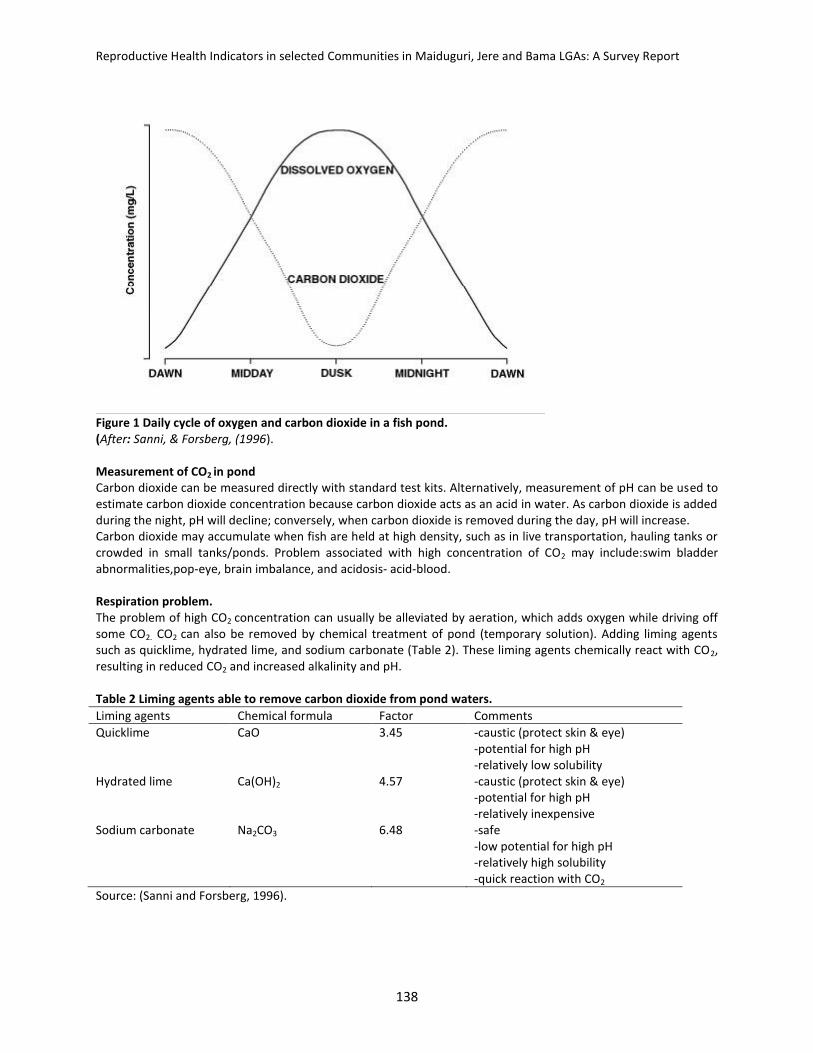
Reproductive Health Indicators in selected Communities in Maiduguri, Jere and Bama LGAs: A Survey Report
138
Figure 1 Daily cycle of oxygen and carbon dioxide in a fish pond. (After: Sanni, & Forsberg, (1996). Measurement of CO2 in pond Carbon dioxide can be measured directly with standard test kits. Alternatively, measurement of pH can be used to estimate carbon dioxide concentration because carbon dioxide acts as an acid in water. As carbon dioxide is added during the night, pH will decline; conversely, when carbon dioxide is removed during the day, pH will increase. Carbon dioxide may accumulate when fish are held at high density, such as in live transportation, hauling tanks or crowded in small tanks/ponds. Problem associated with high concentration of CO2 may include:swim bladder abnormalities,pop-eye, brain imbalance, and acidosis- acid-blood. Respiration problem. The problem of high CO2 concentration can usually be alleviated by aeration, which adds oxygen while driving off some CO2. CO2 can also be removed by chemical treatment of pond (temporary solution). Adding liming agents such as quicklime, hydrated lime, and sodium carbonate (Table 2). These liming agents chemically react with CO2, resulting in reduced CO2 and increased alkalinity and pH. Table 2 Liming agents able to remove carbon dioxide from pond waters.
Liming agents Chemical formula Factor Comments
Quicklime Hydrated lime Sodium carbonate
CaO Ca(OH)2 Na2CO3
3.45 4.57 6.48
-caustic (protect skin & eye) -potential for high pH -relatively low solubility -caustic (protect skin & eye) -potential for high pH -relatively inexpensive -safe -low potential for high pH -relatively high solubility -quick reaction with CO2
Source: (Sanni and Forsberg, 1996).
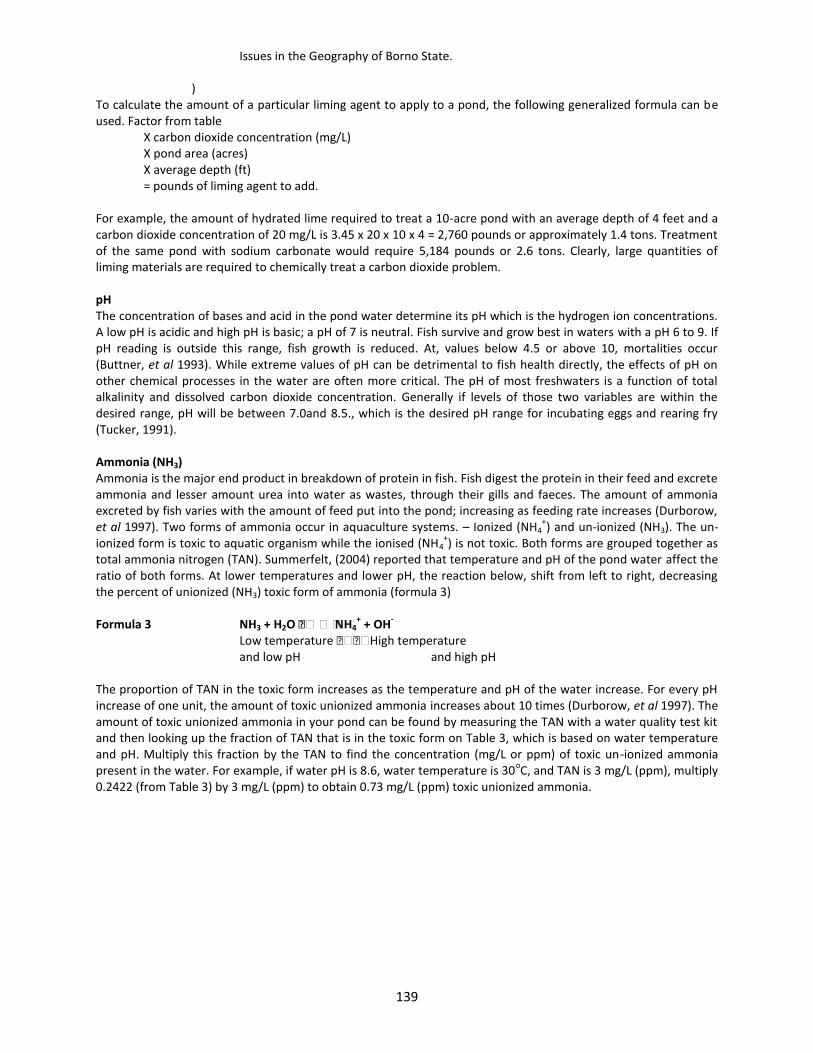
Issues in the Geography of Borno State.
)
139
To calculate the amount of a particular liming agent to apply to a pond, the following generalized formula can be used. Factor from table
X carbon dioxide concentration (mg/L) X pond area (acres) X average depth (ft) = pounds of liming agent to add.
For example, the amount of hydrated lime required to treat a 10-acre pond with an average depth of 4 feet and a carbon dioxide concentration of 20 mg/L is 3.45 x 20 x 10 x 4 = 2,760 pounds or approximately 1.4 tons. Treatment of the same pond with sodium carbonate would require 5,184 pounds or 2.6 tons. Clearly, large quantities of liming materials are required to chemically treat a carbon dioxide problem. pH The concentration of bases and acid in the pond water determine its pH which is the hydrogen ion concentrations. A low pH is acidic and high pH is basic; a pH of 7 is neutral. Fish survive and grow best in waters with a pH 6 to 9. If pH reading is outside this range, fish growth is reduced. At, values below 4.5 or above 10, mortalities occur (Buttner, et al 1993). While extreme values of pH can be detrimental to fish health directly, the effects of pH on other chemical processes in the water are often more critical. The pH of most freshwaters is a function of total alkalinity and dissolved carbon dioxide concentration. Generally if levels of those two variables are within the desired range, pH will be between 7.0and 8.5., which is the desired pH range for incubating eggs and rearing fry (Tucker, 1991). Ammonia (NH3) Ammonia is the major end product in breakdown of protein in fish. Fish digest the protein in their feed and excrete ammonia and lesser amount urea into water as wastes, through their gills and faeces. The amount of ammonia excreted by fish varies with the amount of feed put into the pond; increasing as feeding rate increases (Durborow, et al 1997). Two forms of ammonia occur in aquaculture systems. – Ionized (NH4
+) and un-ionized (NH3). The un-
ionized form is toxic to aquatic organism while the ionised (NH4+) is not toxic. Both forms are grouped together as
total ammonia nitrogen (TAN). Summerfelt, (2004) reported that temperature and pH of the pond water affect the ratio of both forms. At lower temperatures and lower pH, the reaction below, shift from left to right, decreasing the percent of unionized (NH3) toxic form of ammonia (formula 3) Formula 3 NH3 + H2O NH4
+ + OH
-
Low temperature High temperature and low pH and high pH The proportion of TAN in the toxic form increases as the temperature and pH of the water increase. For every pH increase of one unit, the amount of toxic unionized ammonia increases about 10 times (Durborow, et al 1997). The amount of toxic unionized ammonia in your pond can be found by measuring the TAN with a water quality test kit and then looking up the fraction of TAN that is in the toxic form on Table 3, which is based on water temperature and pH. Multiply this fraction by the TAN to find the concentration (mg/L or ppm) of toxic un-ionized ammonia present in the water. For example, if water pH is 8.6, water temperature is 30
oC, and TAN is 3 mg/L (ppm), multiply
0.2422 (from Table 3) by 3 mg/L (ppm) to obtain 0.73 mg/L (ppm) toxic unionized ammonia.
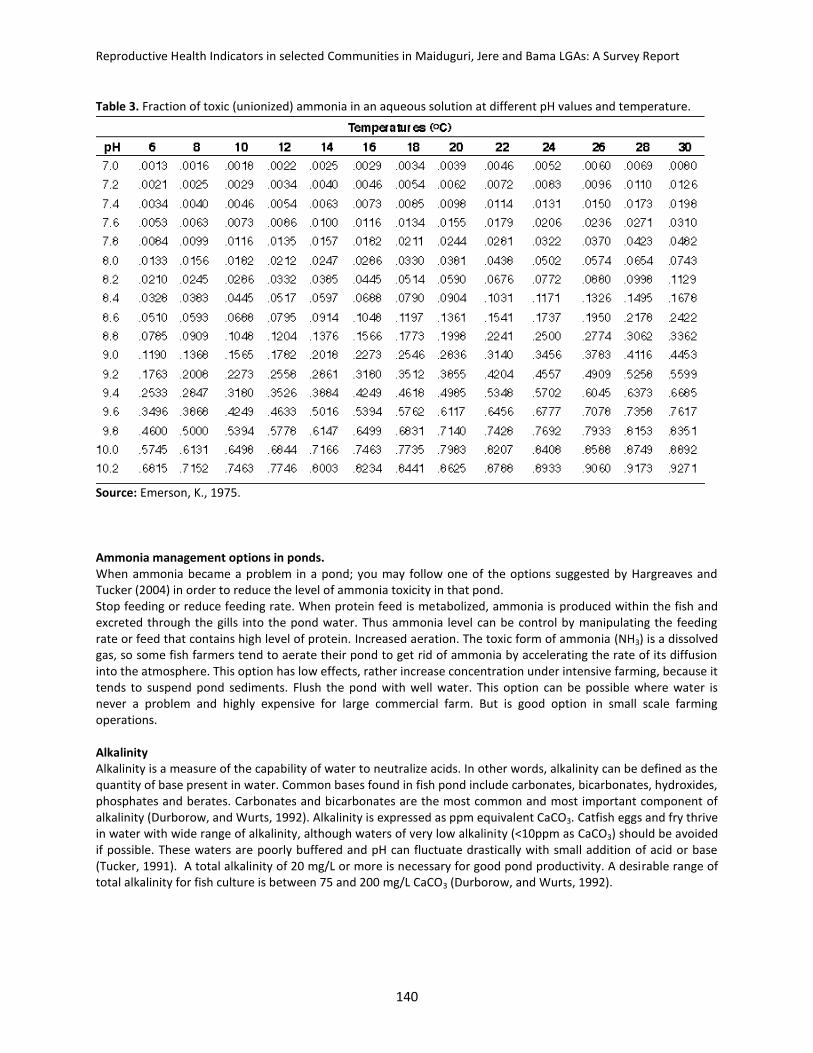
Reproductive Health Indicators in selected Communities in Maiduguri, Jere and Bama LGAs: A Survey Report
140
Table 3. Fraction of toxic (unionized) ammonia in an aqueous solution at different pH values and temperature.
Source: Emerson, K., 1975. Ammonia management options in ponds. When ammonia became a problem in a pond; you may follow one of the options suggested by Hargreaves and Tucker (2004) in order to reduce the level of ammonia toxicity in that pond. Stop feeding or reduce feeding rate. When protein feed is metabolized, ammonia is produced within the fish and excreted through the gills into the pond water. Thus ammonia level can be control by manipulating the feeding rate or feed that contains high level of protein. Increased aeration. The toxic form of ammonia (NH3) is a dissolved gas, so some fish farmers tend to aerate their pond to get rid of ammonia by accelerating the rate of its diffusion into the atmosphere. This option has low effects, rather increase concentration under intensive farming, because it tends to suspend pond sediments. Flush the pond with well water. This option can be possible where water is never a problem and highly expensive for large commercial farm. But is good option in small scale farming operations. Alkalinity Alkalinity is a measure of the capability of water to neutralize acids. In other words, alkalinity can be defined as the quantity of base present in water. Common bases found in fish pond include carbonates, bicarbonates, hydroxides, phosphates and berates. Carbonates and bicarbonates are the most common and most important component of alkalinity (Durborow, and Wurts, 1992). Alkalinity is expressed as ppm equivalent CaCO3. Catfish eggs and fry thrive in water with wide range of alkalinity, although waters of very low alkalinity (<10ppm as CaCO3) should be avoided if possible. These waters are poorly buffered and pH can fluctuate drastically with small addition of acid or base (Tucker, 1991). A total alkalinity of 20 mg/L or more is necessary for good pond productivity. A desirable range of total alkalinity for fish culture is between 75 and 200 mg/L CaCO3 (Durborow, and Wurts, 1992).
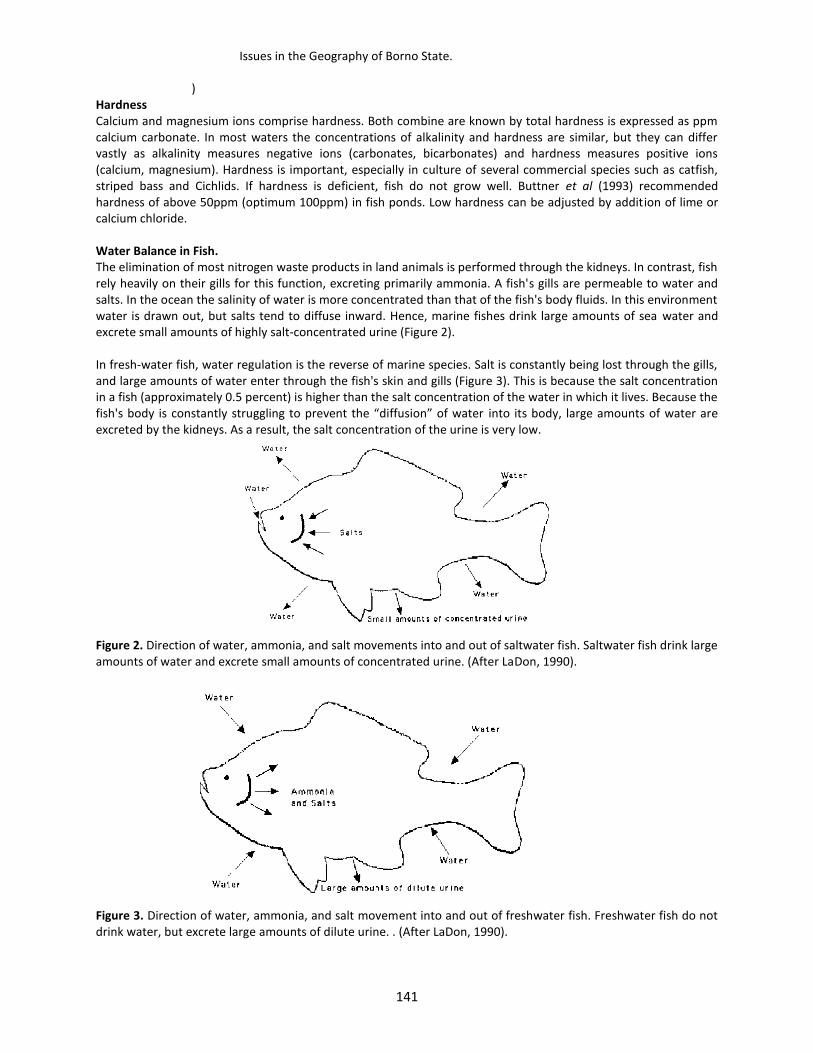
Issues in the Geography of Borno State.
)
141
Hardness Calcium and magnesium ions comprise hardness. Both combine are known by total hardness is expressed as ppm calcium carbonate. In most waters the concentrations of alkalinity and hardness are similar, but they can differ vastly as alkalinity measures negative ions (carbonates, bicarbonates) and hardness measures positive ions (calcium, magnesium). Hardness is important, especially in culture of several commercial species such as catfish, striped bass and Cichlids. If hardness is deficient, fish do not grow well. Buttner et al (1993) recommended hardness of above 50ppm (optimum 100ppm) in fish ponds. Low hardness can be adjusted by addition of lime or calcium chloride. Water Balance in Fish. The elimination of most nitrogen waste products in land animals is performed through the kidneys. In contrast, fish rely heavily on their gills for this function, excreting primarily ammonia. A fish's gills are permeable to water and salts. In the ocean the salinity of water is more concentrated than that of the fish's body fluids. In this environment water is drawn out, but salts tend to diffuse inward. Hence, marine fishes drink large amounts of sea water and excrete small amounts of highly salt-concentrated urine (Figure 2). In fresh-water fish, water regulation is the reverse of marine species. Salt is constantly being lost through the gills, and large amounts of water enter through the fish's skin and gills (Figure 3). This is because the salt concentration in a fish (approximately 0.5 percent) is higher than the salt concentration of the water in which it lives. Because the fish's body is constantly struggling to prevent the “diffusion” of water into its body, large amounts of water are excreted by the kidneys. As a result, the salt concentration of the urine is very low.
Figure 2. Direction of water, ammonia, and salt movements into and out of saltwater fish. Saltwater fish drink large amounts of water and excrete small amounts of concentrated urine. (After LaDon, 1990).
Figure 3. Direction of water, ammonia, and salt movement into and out of freshwater fish. Freshwater fish do not drink water, but excrete large amounts of dilute urine. . (After LaDon, 1990).
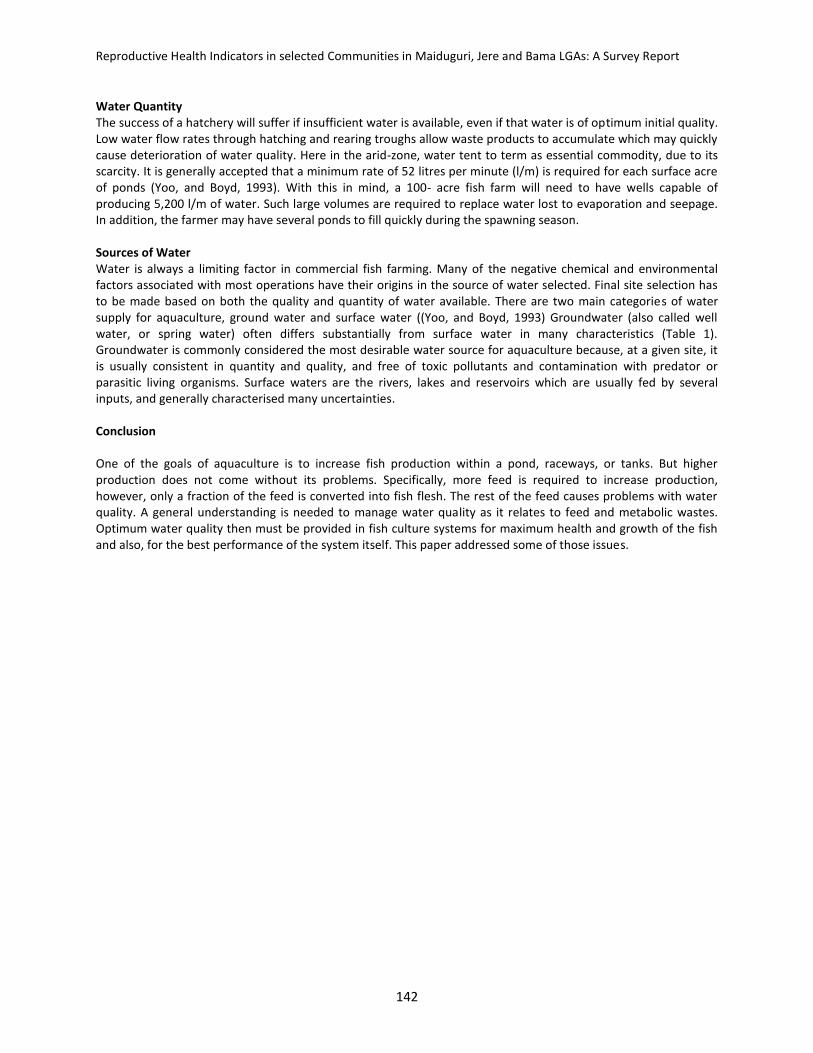
Reproductive Health Indicators in selected Communities in Maiduguri, Jere and Bama LGAs: A Survey Report
142
Water Quantity The success of a hatchery will suffer if insufficient water is available, even if that water is of optimum initial quality. Low water flow rates through hatching and rearing troughs allow waste products to accumulate which may quickly cause deterioration of water quality. Here in the arid-zone, water tent to term as essential commodity, due to its scarcity. It is generally accepted that a minimum rate of 52 litres per minute (l/m) is required for each surface acre of ponds (Yoo, and Boyd, 1993). With this in mind, a 100- acre fish farm will need to have wells capable of producing 5,200 l/m of water. Such large volumes are required to replace water lost to evaporation and seepage. In addition, the farmer may have several ponds to fill quickly during the spawning season. Sources of Water Water is always a limiting factor in commercial fish farming. Many of the negative chemical and environmental factors associated with most operations have their origins in the source of water selected. Final site selection has to be made based on both the quality and quantity of water available. There are two main categories of water supply for aquaculture, ground water and surface water ((Yoo, and Boyd, 1993) Groundwater (also called well water, or spring water) often differs substantially from surface water in many characteristics (Table 1). Groundwater is commonly considered the most desirable water source for aquaculture because, at a given site, it is usually consistent in quantity and quality, and free of toxic pollutants and contamination with predator or parasitic living organisms. Surface waters are the rivers, lakes and reservoirs which are usually fed by several inputs, and generally characterised many uncertainties. Conclusion One of the goals of aquaculture is to increase fish production within a pond, raceways, or tanks. But higher production does not come without its problems. Specifically, more feed is required to increase production, however, only a fraction of the feed is converted into fish flesh. The rest of the feed causes problems with water quality. A general understanding is needed to manage water quality as it relates to feed and metabolic wastes. Optimum water quality then must be provided in fish culture systems for maximum health and growth of the fish and also, for the best performance of the system itself. This paper addressed some of those issues.
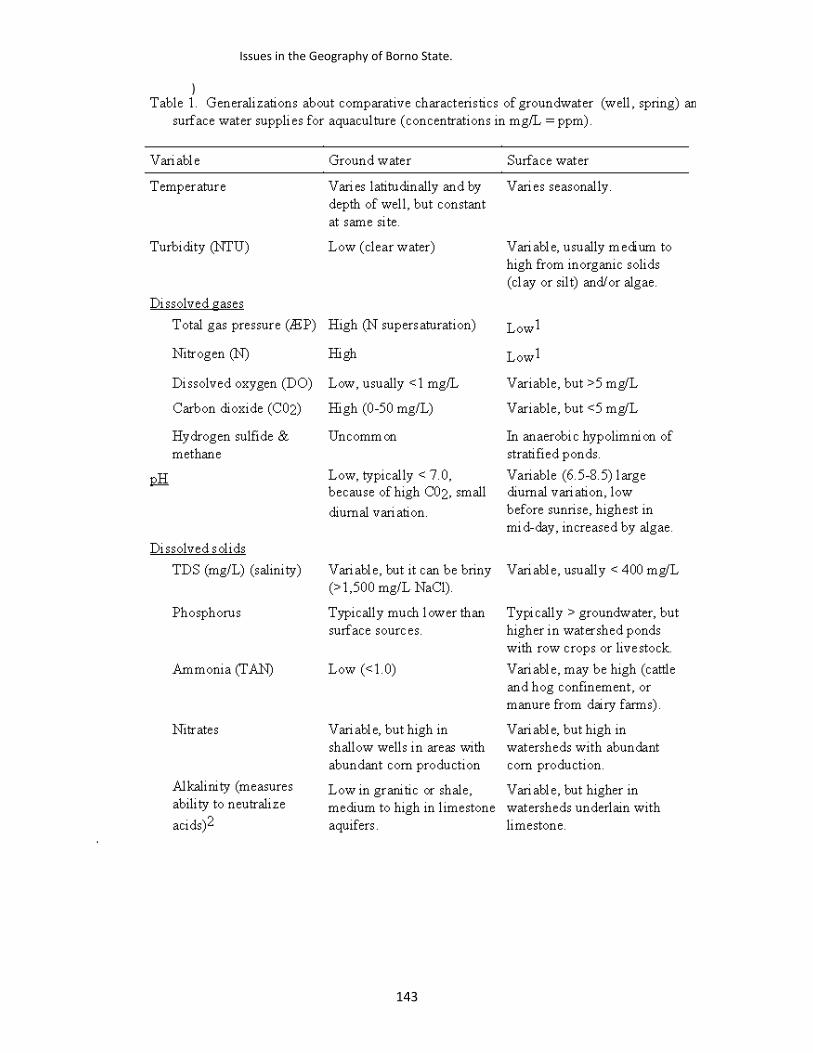
Issues in the Geography of Borno State.
)
143
.
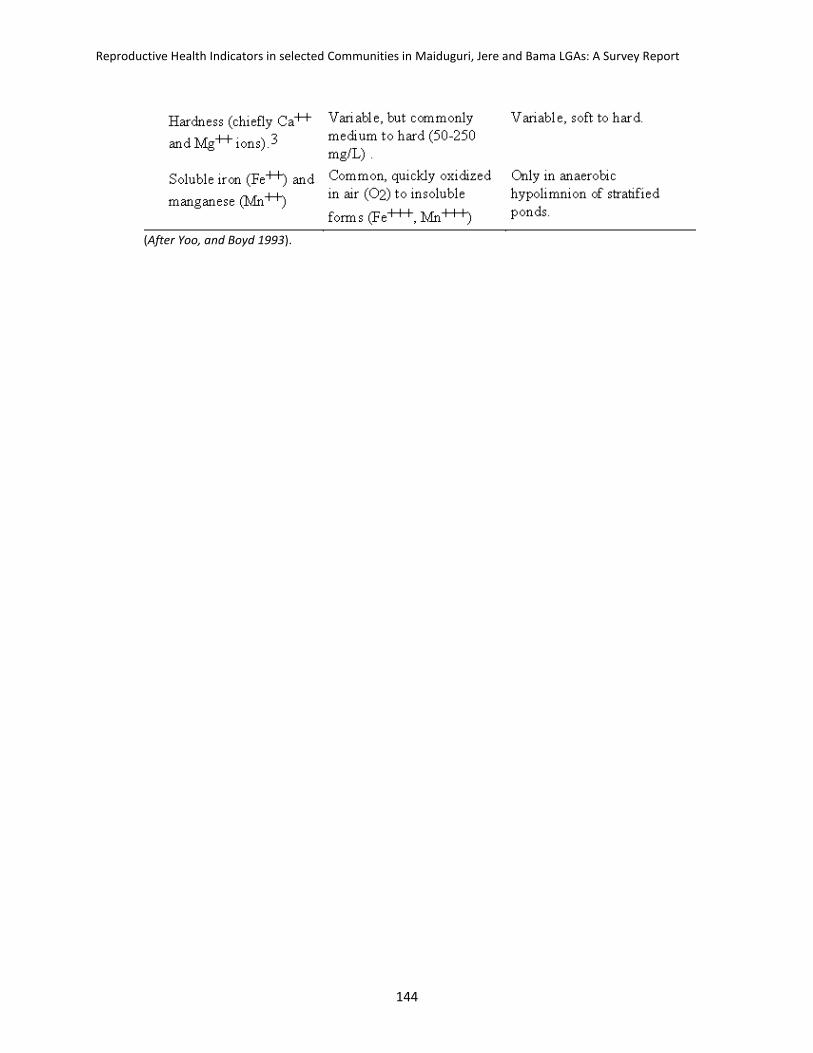
Reproductive Health Indicators in selected Communities in Maiduguri, Jere and Bama LGAs: A Survey Report
144
(After Yoo, and Boyd 1993).
Issues in the Geography of Borno State.
)
145
References: Boyd, C. E. 1979. Water Quality in Warmwater Fish Pond. Agriculture Experiment Station, Auburn, Alabama.
Pp 359 pp. Buttner, J. K. Soderberg, R. W. and Terlizii, D. E. 1993. An Introduction to Water Chemistry in Freshwater Aquaculture. Northeastern Regional Aquaculture Centre.NRAC Fact Sheet No: 170. Courtney, L. A. and Clements, W. H. (1998). Effects of Acid pH on Benthic Macro Invertebrate Communitie
Hydrobiologia, 3: 79-145. Durborow, R. M; Crosby, D. M; and Brunson, M. W. 1997 Ammonia in Fish Ponds Southern Regional Aquaculture
Centre. SRAC Publication No: 463. Durborow, M. R. and Wurts, A. W. 1992 Interaction of pH, Carbon Dioxide, Alkalinity and Hardness in Fish Ponds
Southern Regional Aquaculture Centre. SRAC Publication No: 464. Emerson, K. Russo, R. C. and Thurston, R. V. 1979. Aqueous ammonia equilibrium Tabulation of percent unionized
ammonia. Environmental Research Laboratory-Duluth, U.S. Environmental Protection Agency, Duluth, Minnesota. EPA-600/3-79-091.
Emerson, K., R.C. Russo, R.E. Lund, and R.V. Thurston. 1975. Aqueous ammonia equilibrium calculations: effect of pH and temperature. Journal of the Fisheries Research Board of Canada. 32:2379-2383. Hargreaves, A. J. and Brunson, M. 1996. Carbon Dioxide in Fish Ponds. Southern Regional Aquaculture Centre.
SRAC Publication No: 468. Hargreaves, A. J. and Tucker, C. S. 2004. Managing Ammonia in Fish Ponds. Southern Regional Aquaculture Centre.
SRAC Publication No: 4603. LaDon, S. 1990. A Fish Farmers Guide to Understanding Water Quality. Aquaculture Network Information Centre,
Illinois-Indiana Sea Grant Program, Purdue University. Sanni, S. & Forsberg, O. I (1996). Modelling pH and CO2 in single-pass seawater aquaculture system. Aquacultural
Engineering, 15 (2), 91-110. Summerfelt, R. C. 2005. Water Quality Considerations for Aquaculture. Department of Animal Ecology, Iowa State
University. Ames, IA 50011-3221. Tucker, C. S. 1991. Water Quantity and Quality Requirements for Channel Catfish Hatcheries. Southern Regional
Aquaculture Centre. SRAC Publication No: 461. Yoo, K. H. and C. E. Boyd 1993. Hydrology and Water Supply for Pond Aquaculture.Wiley & Sons. Inc., New York.
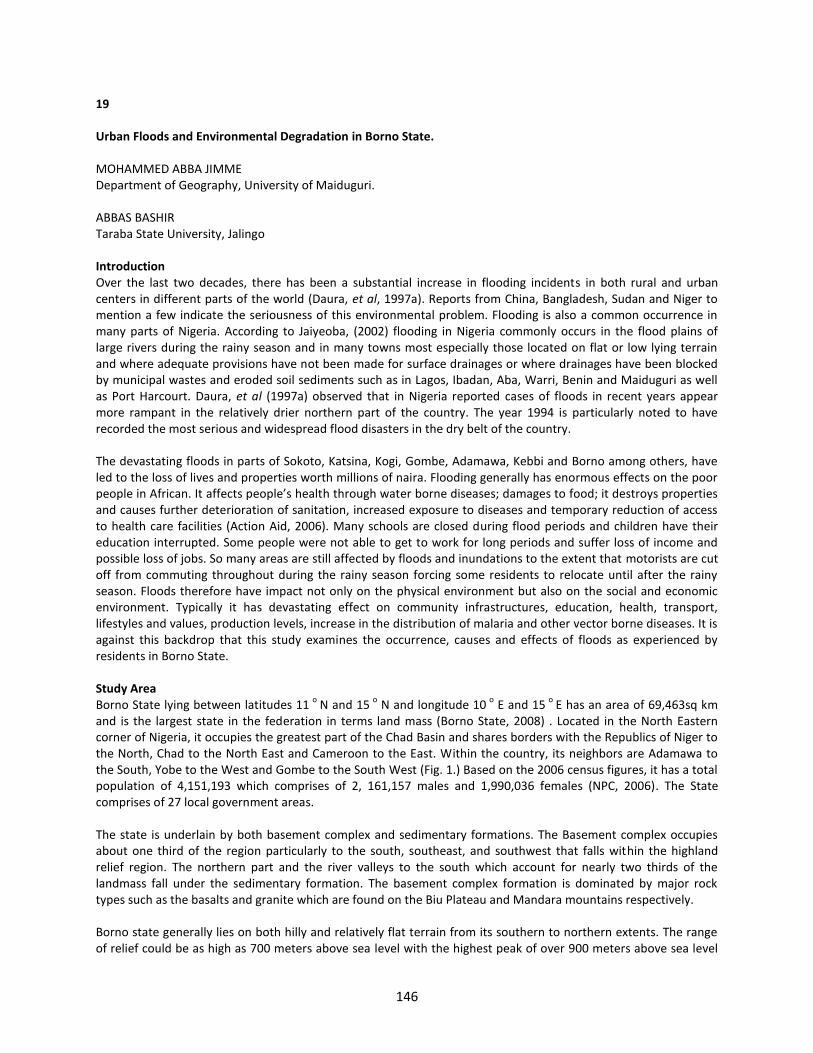
146
19 Urban Floods and Environmental Degradation in Borno State. MOHAMMED ABBA JIMME Department of Geography, University of Maiduguri. ABBAS BASHIR Taraba State University, Jalingo Introduction Over the last two decades, there has been a substantial increase in flooding incidents in both rural and urban centers in different parts of the world (Daura, et al, 1997a). Reports from China, Bangladesh, Sudan and Niger to mention a few indicate the seriousness of this environmental problem. Flooding is also a common occurrence in many parts of Nigeria. According to Jaiyeoba, (2002) flooding in Nigeria commonly occurs in the flood plains of large rivers during the rainy season and in many towns most especially those located on flat or low lying terrain and where adequate provisions have not been made for surface drainages or where drainages have been blocked by municipal wastes and eroded soil sediments such as in Lagos, Ibadan, Aba, Warri, Benin and Maiduguri as well as Port Harcourt. Daura, et al (1997a) observed that in Nigeria reported cases of floods in recent years appear more rampant in the relatively drier northern part of the country. The year 1994 is particularly noted to have recorded the most serious and widespread flood disasters in the dry belt of the country. The devastating floods in parts of Sokoto, Katsina, Kogi, Gombe, Adamawa, Kebbi and Borno among others, have led to the loss of lives and properties worth millions of naira. Flooding generally has enormous effects on the poor people in African. It affects people’s health through water borne diseases; damages to food; it destroys properties and causes further deterioration of sanitation, increased exposure to diseases and temporary reduction of access to health care facilities (Action Aid, 2006). Many schools are closed during flood periods and children have their education interrupted. Some people were not able to get to work for long periods and suffer loss of income and possible loss of jobs. So many areas are still affected by floods and inundations to the extent that motorists are cut off from commuting throughout during the rainy season forcing some residents to relocate until after the rainy season. Floods therefore have impact not only on the physical environment but also on the social and economic environment. Typically it has devastating effect on community infrastructures, education, health, transport, lifestyles and values, production levels, increase in the distribution of malaria and other vector borne diseases. It is against this backdrop that this study examines the occurrence, causes and effects of floods as experienced by residents in Borno State. Study Area Borno State lying between latitudes 11
o N and 15
o N and longitude 10
o E and 15
o E has an area of 69,463sq km
and is the largest state in the federation in terms land mass (Borno State, 2008) . Located in the North Eastern corner of Nigeria, it occupies the greatest part of the Chad Basin and shares borders with the Republics of Niger to the North, Chad to the North East and Cameroon to the East. Within the country, its neighbors are Adamawa to the South, Yobe to the West and Gombe to the South West (Fig. 1.) Based on the 2006 census figures, it has a total population of 4,151,193 which comprises of 2, 161,157 males and 1,990,036 females (NPC, 2006). The State comprises of 27 local government areas. The state is underlain by both basement complex and sedimentary formations. The Basement complex occupies about one third of the region particularly to the south, southeast, and southwest that falls within the highland relief region. The northern part and the river valleys to the south which account for nearly two thirds of the landmass fall under the sedimentary formation. The basement complex formation is dominated by major rock types such as the basalts and granite which are found on the Biu Plateau and Mandara mountains respectively. Borno state generally lies on both hilly and relatively flat terrain from its southern to northern extents. The range of relief could be as high as 700 meters above sea level with the highest peak of over 900 meters above sea level
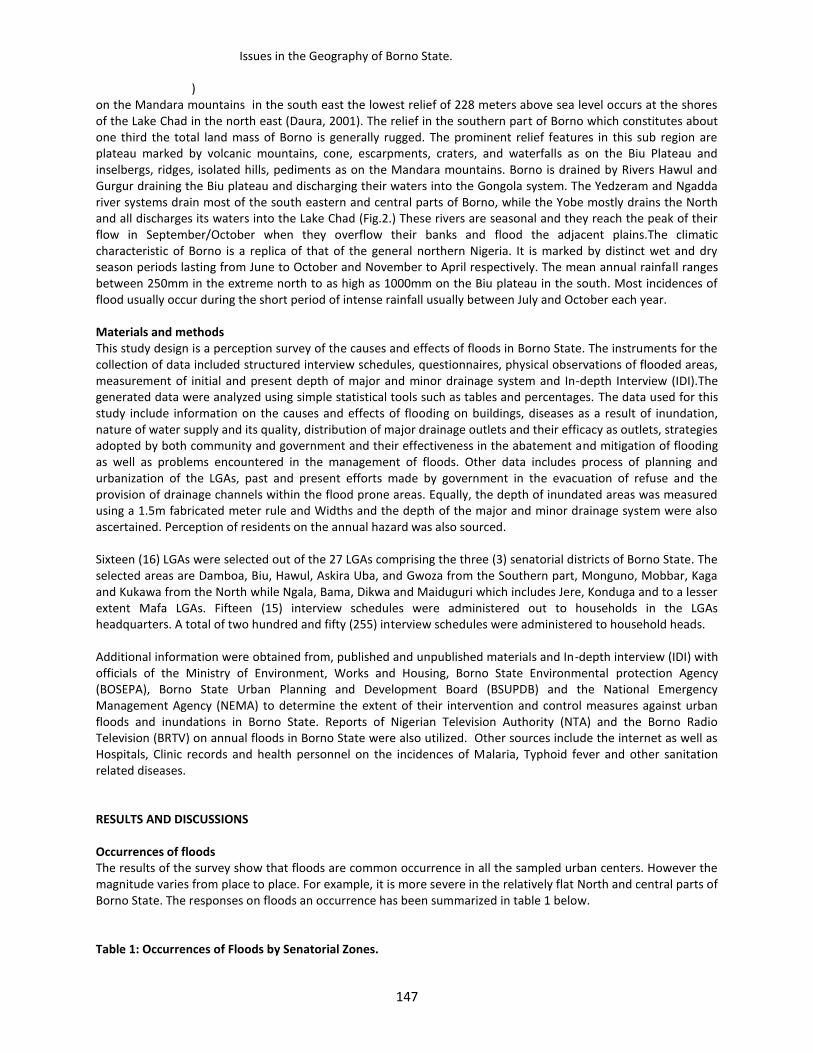
Issues in the Geography of Borno State.
)
147
on the Mandara mountains in the south east the lowest relief of 228 meters above sea level occurs at the shores of the Lake Chad in the north east (Daura, 2001). The relief in the southern part of Borno which constitutes about one third the total land mass of Borno is generally rugged. The prominent relief features in this sub region are plateau marked by volcanic mountains, cone, escarpments, craters, and waterfalls as on the Biu Plateau and inselbergs, ridges, isolated hills, pediments as on the Mandara mountains. Borno is drained by Rivers Hawul and Gurgur draining the Biu plateau and discharging their waters into the Gongola system. The Yedzeram and Ngadda river systems drain most of the south eastern and central parts of Borno, while the Yobe mostly drains the North and all discharges its waters into the Lake Chad (Fig.2.) These rivers are seasonal and they reach the peak of their flow in September/October when they overflow their banks and flood the adjacent plains.The climatic characteristic of Borno is a replica of that of the general northern Nigeria. It is marked by distinct wet and dry season periods lasting from June to October and November to April respectively. The mean annual rainfall ranges between 250mm in the extreme north to as high as 1000mm on the Biu plateau in the south. Most incidences of flood usually occur during the short period of intense rainfall usually between July and October each year. Materials and methods This study design is a perception survey of the causes and effects of floods in Borno State. The instruments for the collection of data included structured interview schedules, questionnaires, physical observations of flooded areas, measurement of initial and present depth of major and minor drainage system and In-depth Interview (IDI).The generated data were analyzed using simple statistical tools such as tables and percentages. The data used for this study include information on the causes and effects of flooding on buildings, diseases as a result of inundation, nature of water supply and its quality, distribution of major drainage outlets and their efficacy as outlets, strategies adopted by both community and government and their effectiveness in the abatement and mitigation of flooding as well as problems encountered in the management of floods. Other data includes process of planning and urbanization of the LGAs, past and present efforts made by government in the evacuation of refuse and the provision of drainage channels within the flood prone areas. Equally, the depth of inundated areas was measured using a 1.5m fabricated meter rule and Widths and the depth of the major and minor drainage system were also ascertained. Perception of residents on the annual hazard was also sourced. Sixteen (16) LGAs were selected out of the 27 LGAs comprising the three (3) senatorial districts of Borno State. The selected areas are Damboa, Biu, Hawul, Askira Uba, and Gwoza from the Southern part, Monguno, Mobbar, Kaga and Kukawa from the North while Ngala, Bama, Dikwa and Maiduguri which includes Jere, Konduga and to a lesser extent Mafa LGAs. Fifteen (15) interview schedules were administered out to households in the LGAs headquarters. A total of two hundred and fifty (255) interview schedules were administered to household heads. Additional information were obtained from, published and unpublished materials and In-depth interview (IDI) with officials of the Ministry of Environment, Works and Housing, Borno State Environmental protection Agency (BOSEPA), Borno State Urban Planning and Development Board (BSUPDB) and the National Emergency Management Agency (NEMA) to determine the extent of their intervention and control measures against urban floods and inundations in Borno State. Reports of Nigerian Television Authority (NTA) and the Borno Radio Television (BRTV) on annual floods in Borno State were also utilized. Other sources include the internet as well as Hospitals, Clinic records and health personnel on the incidences of Malaria, Typhoid fever and other sanitation related diseases. RESULTS AND DISCUSSIONS Occurrences of floods The results of the survey show that floods are common occurrence in all the sampled urban centers. However the magnitude varies from place to place. For example, it is more severe in the relatively flat North and central parts of Borno State. The responses on floods an occurrence has been summarized in table 1 below. Table 1: Occurrences of Floods by Senatorial Zones.
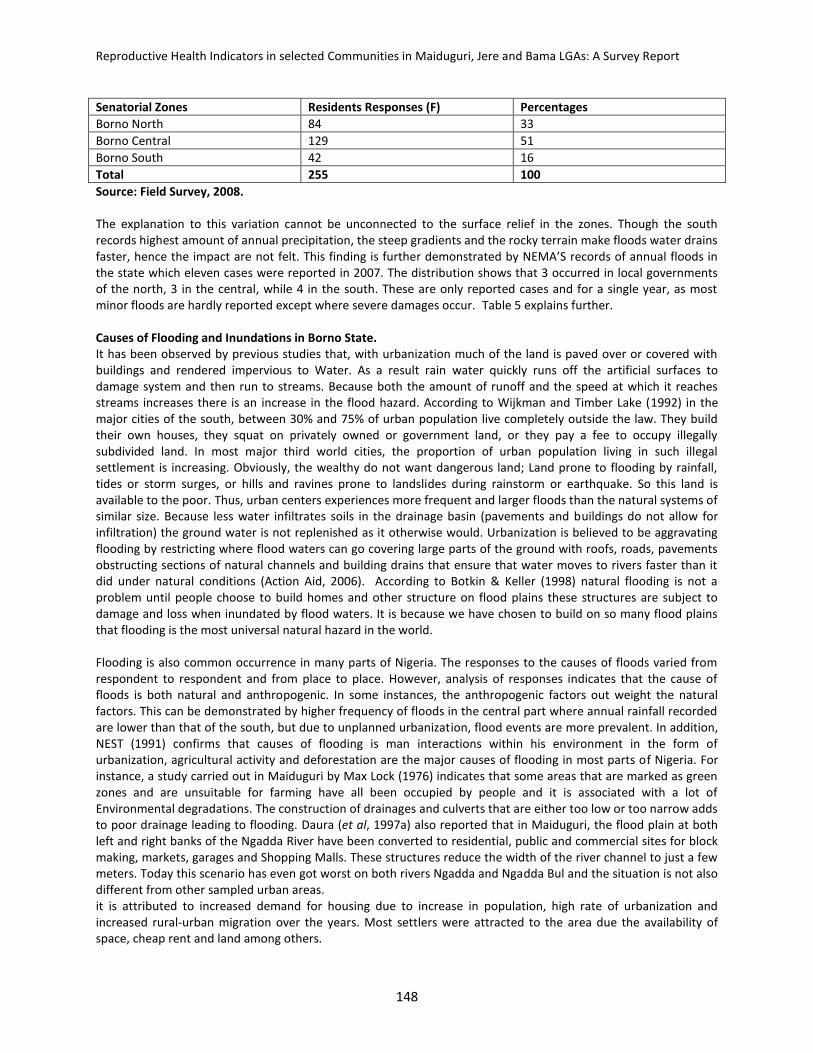
Reproductive Health Indicators in selected Communities in Maiduguri, Jere and Bama LGAs: A Survey Report
148
Senatorial Zones Residents Responses (F) Percentages
Borno North 84 33
Borno Central 129 51
Borno South 42 16
Total 255 100
Source: Field Survey, 2008. The explanation to this variation cannot be unconnected to the surface relief in the zones. Though the south records highest amount of annual precipitation, the steep gradients and the rocky terrain make floods water drains faster, hence the impact are not felt. This finding is further demonstrated by NEMA’S records of annual floods in the state which eleven cases were reported in 2007. The distribution shows that 3 occurred in local governments of the north, 3 in the central, while 4 in the south. These are only reported cases and for a single year, as most minor floods are hardly reported except where severe damages occur. Table 5 explains further. Causes of Flooding and Inundations in Borno State. It has been observed by previous studies that, with urbanization much of the land is paved over or covered with buildings and rendered impervious to Water. As a result rain water quickly runs off the artificial surfaces to damage system and then run to streams. Because both the amount of runoff and the speed at which it reaches streams increases there is an increase in the flood hazard. According to Wijkman and Timber Lake (1992) in the major cities of the south, between 30% and 75% of urban population live completely outside the law. They build their own houses, they squat on privately owned or government land, or they pay a fee to occupy illegally subdivided land. In most major third world cities, the proportion of urban population living in such illegal settlement is increasing. Obviously, the wealthy do not want dangerous land; Land prone to flooding by rainfall, tides or storm surges, or hills and ravines prone to landslides during rainstorm or earthquake. So this land is available to the poor. Thus, urban centers experiences more frequent and larger floods than the natural systems of similar size. Because less water infiltrates soils in the drainage basin (pavements and buildings do not allow for infiltration) the ground water is not replenished as it otherwise would. Urbanization is believed to be aggravating flooding by restricting where flood waters can go covering large parts of the ground with roofs, roads, pavements obstructing sections of natural channels and building drains that ensure that water moves to rivers faster than it did under natural conditions (Action Aid, 2006). According to Botkin & Keller (1998) natural flooding is not a problem until people choose to build homes and other structure on flood plains these structures are subject to damage and loss when inundated by flood waters. It is because we have chosen to build on so many flood plains that flooding is the most universal natural hazard in the world. Flooding is also common occurrence in many parts of Nigeria. The responses to the causes of floods varied from respondent to respondent and from place to place. However, analysis of responses indicates that the cause of floods is both natural and anthropogenic. In some instances, the anthropogenic factors out weight the natural factors. This can be demonstrated by higher frequency of floods in the central part where annual rainfall recorded are lower than that of the south, but due to unplanned urbanization, flood events are more prevalent. In addition, NEST (1991) confirms that causes of flooding is man interactions within his environment in the form of urbanization, agricultural activity and deforestation are the major causes of flooding in most parts of Nigeria. For instance, a study carried out in Maiduguri by Max Lock (1976) indicates that some areas that are marked as green zones and are unsuitable for farming have all been occupied by people and it is associated with a lot of Environmental degradations. The construction of drainages and culverts that are either too low or too narrow adds to poor drainage leading to flooding. Daura (et al, 1997a) also reported that in Maiduguri, the flood plain at both left and right banks of the Ngadda River have been converted to residential, public and commercial sites for block making, markets, garages and Shopping Malls. These structures reduce the width of the river channel to just a few meters. Today this scenario has even got worst on both rivers Ngadda and Ngadda Bul and the situation is not also different from other sampled urban areas. it is attributed to increased demand for housing due to increase in population, high rate of urbanization and increased rural-urban migration over the years. Most settlers were attracted to the area due the availability of space, cheap rent and land among others.
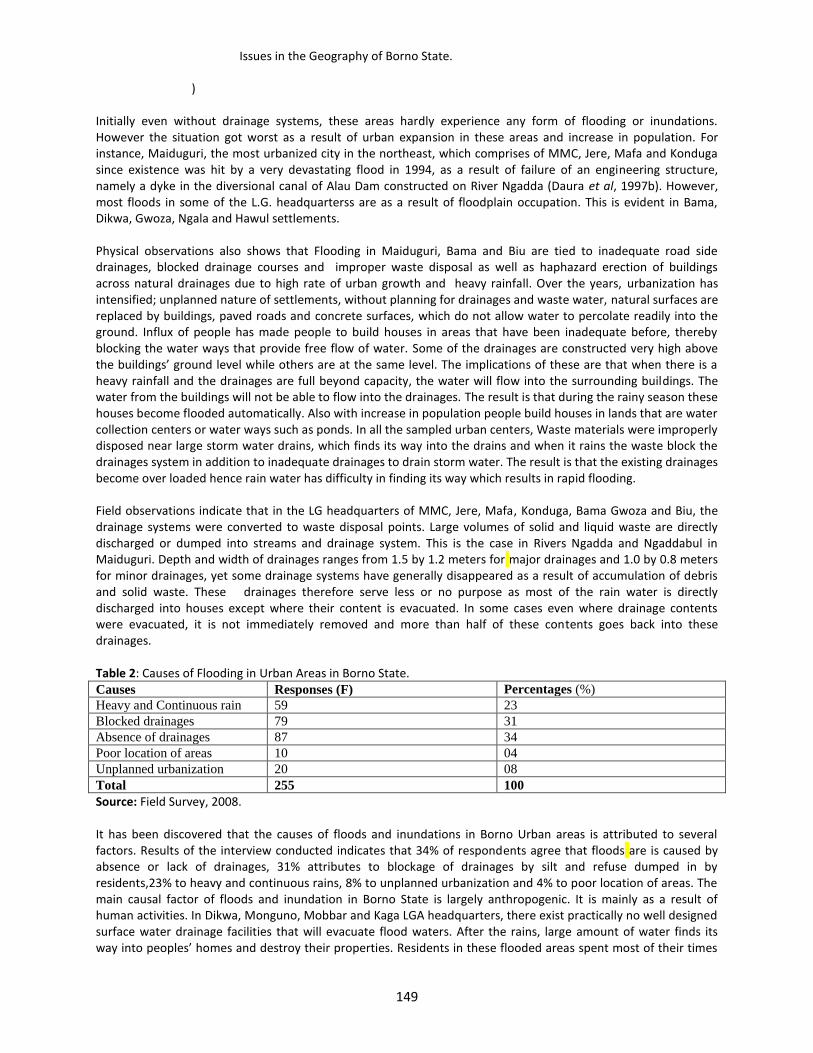
Issues in the Geography of Borno State.
)
149
Initially even without drainage systems, these areas hardly experience any form of flooding or inundations. However the situation got worst as a result of urban expansion in these areas and increase in population. For instance, Maiduguri, the most urbanized city in the northeast, which comprises of MMC, Jere, Mafa and Konduga since existence was hit by a very devastating flood in 1994, as a result of failure of an engineering structure, namely a dyke in the diversional canal of Alau Dam constructed on River Ngadda (Daura et al, 1997b). However, most floods in some of the L.G. headquarterss are as a result of floodplain occupation. This is evident in Bama, Dikwa, Gwoza, Ngala and Hawul settlements. Physical observations also shows that Flooding in Maiduguri, Bama and Biu are tied to inadequate road side drainages, blocked drainage courses and improper waste disposal as well as haphazard erection of buildings across natural drainages due to high rate of urban growth and heavy rainfall. Over the years, urbanization has intensified; unplanned nature of settlements, without planning for drainages and waste water, natural surfaces are replaced by buildings, paved roads and concrete surfaces, which do not allow water to percolate readily into the ground. Influx of people has made people to build houses in areas that have been inadequate before, thereby blocking the water ways that provide free flow of water. Some of the drainages are constructed very high above the buildings’ ground level while others are at the same level. The implications of these are that when there is a heavy rainfall and the drainages are full beyond capacity, the water will flow into the surrounding buildings. The water from the buildings will not be able to flow into the drainages. The result is that during the rainy season these houses become flooded automatically. Also with increase in population people build houses in lands that are water collection centers or water ways such as ponds. In all the sampled urban centers, Waste materials were improperly disposed near large storm water drains, which finds its way into the drains and when it rains the waste block the drainages system in addition to inadequate drainages to drain storm water. The result is that the existing drainages become over loaded hence rain water has difficulty in finding its way which results in rapid flooding. Field observations indicate that in the LG headquarters of MMC, Jere, Mafa, Konduga, Bama Gwoza and Biu, the drainage systems were converted to waste disposal points. Large volumes of solid and liquid waste are directly discharged or dumped into streams and drainage system. This is the case in Rivers Ngadda and Ngaddabul in Maiduguri. Depth and width of drainages ranges from 1.5 by 1.2 meters for major drainages and 1.0 by 0.8 meters for minor drainages, yet some drainage systems have generally disappeared as a result of accumulation of debris and solid waste. These drainages therefore serve less or no purpose as most of the rain water is directly discharged into houses except where their content is evacuated. In some cases even where drainage contents were evacuated, it is not immediately removed and more than half of these contents goes back into these drainages. Table 2: Causes of Flooding in Urban Areas in Borno State. Causes Responses (F) Percentages (%)
Heavy and Continuous rain 59 23
Blocked drainages 79 31
Absence of drainages 87 34
Poor location of areas 10 04
Unplanned urbanization 20 08
Total 255 100
Source: Field Survey, 2008. It has been discovered that the causes of floods and inundations in Borno Urban areas is attributed to several factors. Results of the interview conducted indicates that 34% of respondents agree that floods are is caused by absence or lack of drainages, 31% attributes to blockage of drainages by silt and refuse dumped in by residents,23% to heavy and continuous rains, 8% to unplanned urbanization and 4% to poor location of areas. The main causal factor of floods and inundation in Borno State is largely anthropogenic. It is mainly as a result of human activities. In Dikwa, Monguno, Mobbar and Kaga LGA headquarters, there exist practically no well designed surface water drainage facilities that will evacuate flood waters. After the rains, large amount of water finds its way into peoples’ homes and destroy their properties. Residents in these flooded areas spent most of their times
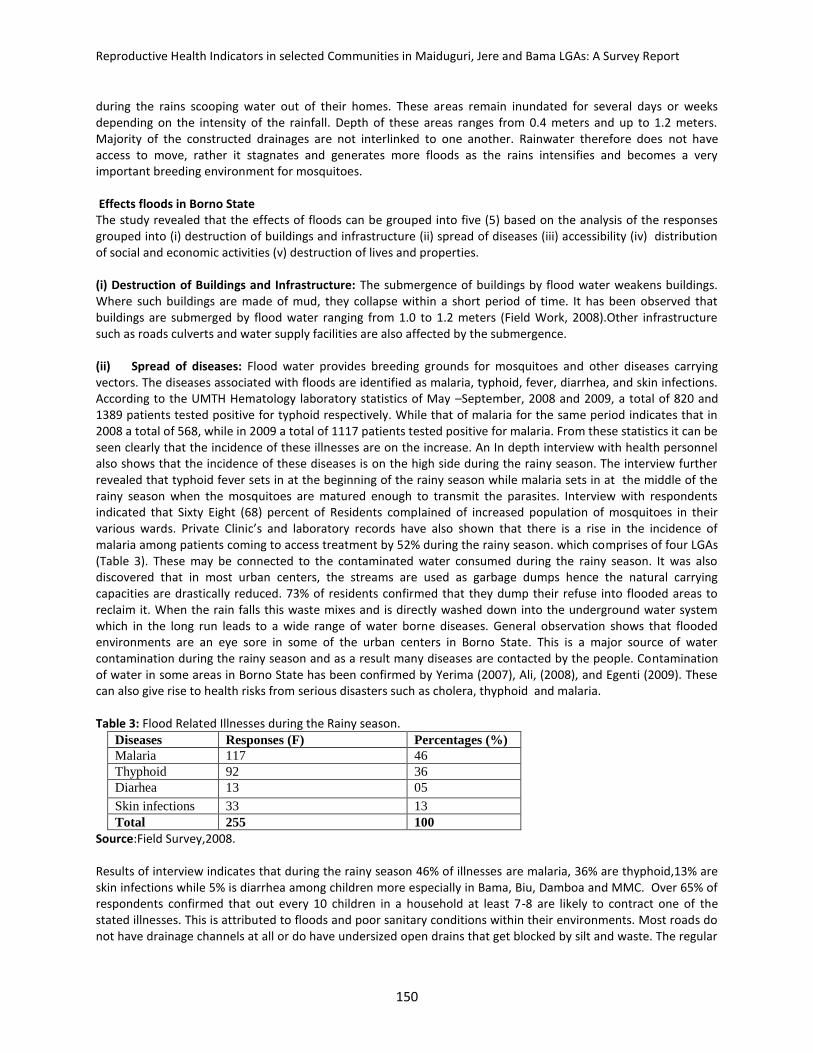
Reproductive Health Indicators in selected Communities in Maiduguri, Jere and Bama LGAs: A Survey Report
150
during the rains scooping water out of their homes. These areas remain inundated for several days or weeks depending on the intensity of the rainfall. Depth of these areas ranges from 0.4 meters and up to 1.2 meters. Majority of the constructed drainages are not interlinked to one another. Rainwater therefore does not have access to move, rather it stagnates and generates more floods as the rains intensifies and becomes a very important breeding environment for mosquitoes. Effects floods in Borno State The study revealed that the effects of floods can be grouped into five (5) based on the analysis of the responses grouped into (i) destruction of buildings and infrastructure (ii) spread of diseases (iii) accessibility (iv) distribution of social and economic activities (v) destruction of lives and properties. (i) Destruction of Buildings and Infrastructure: The submergence of buildings by flood water weakens buildings. Where such buildings are made of mud, they collapse within a short period of time. It has been observed that buildings are submerged by flood water ranging from 1.0 to 1.2 meters (Field Work, 2008).Other infrastructure such as roads culverts and water supply facilities are also affected by the submergence.
(ii) Spread of diseases: Flood water provides breeding grounds for mosquitoes and other diseases carrying vectors. The diseases associated with floods are identified as malaria, typhoid, fever, diarrhea, and skin infections. According to the UMTH Hematology laboratory statistics of May –September, 2008 and 2009, a total of 820 and 1389 patients tested positive for typhoid respectively. While that of malaria for the same period indicates that in 2008 a total of 568, while in 2009 a total of 1117 patients tested positive for malaria. From these statistics it can be seen clearly that the incidence of these illnesses are on the increase. An In depth interview with health personnel also shows that the incidence of these diseases is on the high side during the rainy season. The interview further revealed that typhoid fever sets in at the beginning of the rainy season while malaria sets in at the middle of the rainy season when the mosquitoes are matured enough to transmit the parasites. Interview with respondents indicated that Sixty Eight (68) percent of Residents complained of increased population of mosquitoes in their various wards. Private Clinic’s and laboratory records have also shown that there is a rise in the incidence of malaria among patients coming to access treatment by 52% during the rainy season. which comprises of four LGAs (Table 3). These may be connected to the contaminated water consumed during the rainy season. It was also discovered that in most urban centers, the streams are used as garbage dumps hence the natural carrying capacities are drastically reduced. 73% of residents confirmed that they dump their refuse into flooded areas to reclaim it. When the rain falls this waste mixes and is directly washed down into the underground water system which in the long run leads to a wide range of water borne diseases. General observation shows that flooded environments are an eye sore in some of the urban centers in Borno State. This is a major source of water contamination during the rainy season and as a result many diseases are contacted by the people. Contamination of water in some areas in Borno State has been confirmed by Yerima (2007), Ali, (2008), and Egenti (2009). These can also give rise to health risks from serious disasters such as cholera, thyphoid and malaria. Table 3: Flood Related Illnesses during the Rainy season.
Diseases Responses (F) Percentages (%)
Malaria 117 46
Thyphoid 92 36
Diarhea 13 05
Skin infections 33 13
Total 255 100
Source:Field Survey,2008. Results of interview indicates that during the rainy season 46% of illnesses are malaria, 36% are thyphoid,13% are skin infections while 5% is diarrhea among children more especially in Bama, Biu, Damboa and MMC. Over 65% of respondents confirmed that out every 10 children in a household at least 7-8 are likely to contract one of the stated illnesses. This is attributed to floods and poor sanitary conditions within their environments. Most roads do not have drainage channels at all or do have undersized open drains that get blocked by silt and waste. The regular
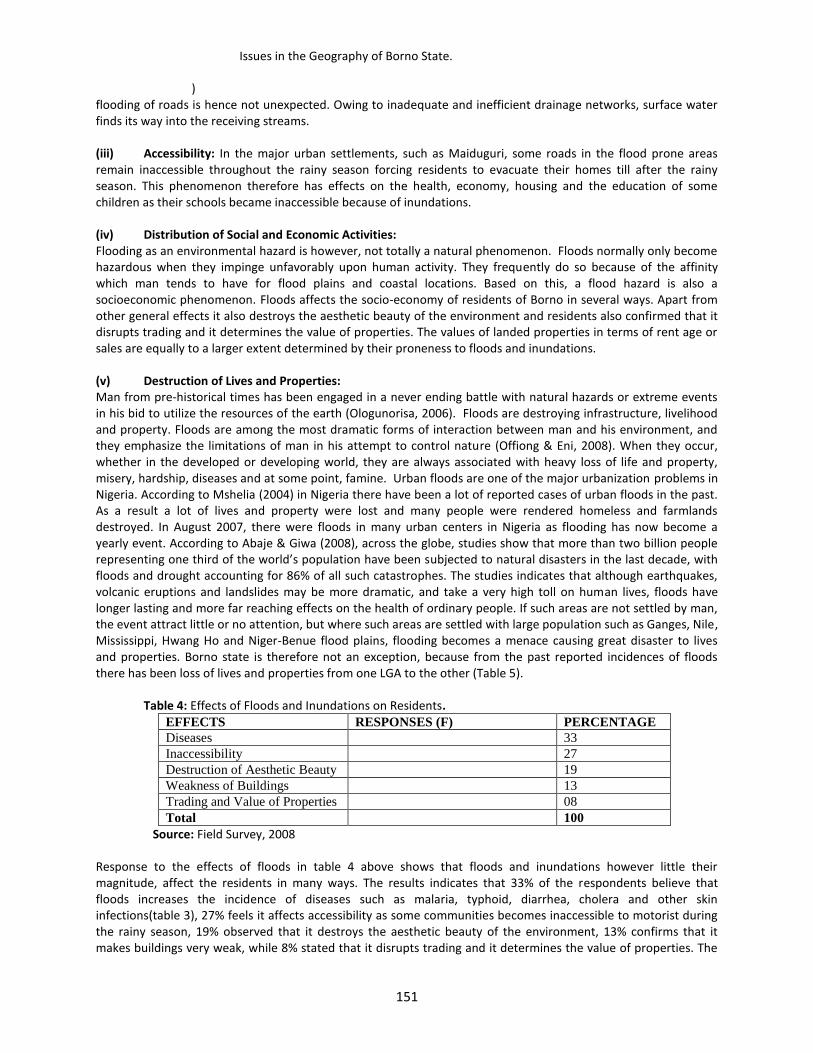
Issues in the Geography of Borno State.
)
151
flooding of roads is hence not unexpected. Owing to inadequate and inefficient drainage networks, surface water finds its way into the receiving streams. (iii) Accessibility: In the major urban settlements, such as Maiduguri, some roads in the flood prone areas remain inaccessible throughout the rainy season forcing residents to evacuate their homes till after the rainy season. This phenomenon therefore has effects on the health, economy, housing and the education of some children as their schools became inaccessible because of inundations. (iv) Distribution of Social and Economic Activities: Flooding as an environmental hazard is however, not totally a natural phenomenon. Floods normally only become hazardous when they impinge unfavorably upon human activity. They frequently do so because of the affinity which man tends to have for flood plains and coastal locations. Based on this, a flood hazard is also a socioeconomic phenomenon. Floods affects the socio-economy of residents of Borno in several ways. Apart from other general effects it also destroys the aesthetic beauty of the environment and residents also confirmed that it disrupts trading and it determines the value of properties. The values of landed properties in terms of rent age or sales are equally to a larger extent determined by their proneness to floods and inundations. (v) Destruction of Lives and Properties: Man from pre-historical times has been engaged in a never ending battle with natural hazards or extreme events in his bid to utilize the resources of the earth (Ologunorisa, 2006). Floods are destroying infrastructure, livelihood and property. Floods are among the most dramatic forms of interaction between man and his environment, and they emphasize the limitations of man in his attempt to control nature (Offiong & Eni, 2008). When they occur, whether in the developed or developing world, they are always associated with heavy loss of life and property, misery, hardship, diseases and at some point, famine. Urban floods are one of the major urbanization problems in Nigeria. According to Mshelia (2004) in Nigeria there have been a lot of reported cases of urban floods in the past. As a result a lot of lives and property were lost and many people were rendered homeless and farmlands destroyed. In August 2007, there were floods in many urban centers in Nigeria as flooding has now become a yearly event. According to Abaje & Giwa (2008), across the globe, studies show that more than two billion people representing one third of the world’s population have been subjected to natural disasters in the last decade, with floods and drought accounting for 86% of all such catastrophes. The studies indicates that although earthquakes, volcanic eruptions and landslides may be more dramatic, and take a very high toll on human lives, floods have longer lasting and more far reaching effects on the health of ordinary people. If such areas are not settled by man, the event attract little or no attention, but where such areas are settled with large population such as Ganges, Nile, Mississippi, Hwang Ho and Niger-Benue flood plains, flooding becomes a menace causing great disaster to lives and properties. Borno state is therefore not an exception, because from the past reported incidences of floods there has been loss of lives and properties from one LGA to the other (Table 5).
Table 4: Effects of Floods and Inundations on Residents.
EFFECTS RESPONSES (F) PERCENTAGE
Diseases 33
Inaccessibility 27
Destruction of Aesthetic Beauty 19
Weakness of Buildings 13
Trading and Value of Properties 08
Total 100
Source: Field Survey, 2008 Response to the effects of floods in table 4 above shows that floods and inundations however little their magnitude, affect the residents in many ways. The results indicates that 33% of the respondents believe that floods increases the incidence of diseases such as malaria, typhoid, diarrhea, cholera and other skin infections(table 3), 27% feels it affects accessibility as some communities becomes inaccessible to motorist during the rainy season, 19% observed that it destroys the aesthetic beauty of the environment, 13% confirms that it makes buildings very weak, while 8% stated that it disrupts trading and it determines the value of properties. The

Reproductive Health Indicators in selected Communities in Maiduguri, Jere and Bama LGAs: A Survey Report
152
values of landed properties in terms of rent age or sales are equally to a larger extent determined by their proneness to floods and inundations. Owing to the menace of poverty, many poor people cannot build quality buildings because of the cost of cement, thus many homes are made of mud and little cement. Inundations further make these buildings weak and eventually collapse. This is the experience of residents of Monguno, Dikwa, and Ngala during the rainy season. Flood Incidence and Destructions in Borno State. In August, 1999, seven (7) LGAs in Borno State were devastated by floods and hundreds rendered homeless. About N25 Million worth of property were destroyed in Railway Corporation Quarters (Maiduguri). In the same year, six villages in Hawul LGA were flooded and hundreds of people rendered homeless with other damages undetermined. Between the years 2004 and 2007 Borno state witnessed not less that thirteen cases of foods. In 2007, alone there were not less than eleven cases distributed all over the state (Table 5). Several towns and villages were severely affected including Maiduguri Metropolitan (the State Capital). Hundreds of people were rendered homeless, large quantities of grains; farm lands and other personal property worth millions of Naira were lost. Table 5: Recent Reported Flood Incidences in Borno State.
S/N Date Location Occurrences Remarks
1. 2004 Kala Balge 21 Villages were flooded 2315 people rendered homeless, 54
Farms, Food and Cash crops were
destroyed.
2. 2006 Biu 12 Villages were flooded Houses and Farms destroyed, 1
death,200 persons displaced
3. 2007 Biu Miringa Villages Submerged Shops and Houses destroyed, 79
persons displaced
4. 2007 A/Uba Several villages destroyed Houses and Grains Destroyed, 650
persons displaced
5. 2007 MMC/Jere Maiduguri Urban Flooded 5 persons died, 470 persons
displaced
6. 2007 Kaga Several Villages flooded Properties and Food stuff destroyed
7. 2007 Chibok Several Villages Flooded Personal belongings destroyed, 215
persons displaced
8. 2007 Mobbar Several villages Flooded Damages undetermined
9. 2007 K/Kusar Several villages Flooded Personal belongings destroyed
10. 2007 Jere Several wards Flooded Several houses destroyed, 210
persons displaced
11. 2007 Biu Several wards Flooded Houses and Shops destroyed, 79
persons displaced.
12. 2007 Gwoza Several villages Flooded Houses and properties destroyed
13. 2007 Monguno Several villages Flooded Millions of Naira property
destroyed.
Source: NEMA, 2008. Floods and Inundation related Environmental Degradation. Nigeria arguably is the most urbanized country on the African continent. This claim is based not so much on the percentage of the urban population but on the magnitude and spread of urbanization across the country (Abumere, 2002). By the year 2010 it is projected that there will be more people in urban than in rural areas in Nigeria. The paradox of Nigerian urbanization is that while the urban population is ballooning, the resources to manage the cities are dwindling. This mismatch between rapid urban growth and the growth in resources is at the

Issues in the Geography of Borno State.
)
153
root of the pervasive urban decay in Nigeria is characterized by urban poverty, inadequate infrastructure, ill managed urban environment and severe urban insecurity. Jaiyeoba (2002) also observed that because of unplanned urbanization, most Nigerian cities suffer from acute problem of sewage and waste disposal, pollution and general land degradation. The operations of the waste management authorities where they exist are inefficient and ineffective only about 30 – 50% of waste is collected in most cities. The reminder is often burnt or dumped haphazardly on open plots of land, particularly along and on the streets where it creates health hazards, blocks drains and contributes to urban flooding. This is now the situation in most urban centres in Borno State more especially Maiduguri which Kagu, (1997) described as the most urbanized city in the Northeast. Government and Peoples’ Response to Floods and Inundations. Douglas et al (2008) observed that floods are already having very large impacts on cities and smaller urban centres in many African nations. They also showed how little local government was doing to address these issues. Responses of government have always been in the area of relief and assistance, which have not always been adequate. Destruction of houses by flood has most times rendered the victims homeless. On many occasions the affected people have to be evacuated and settled temporarily in primary schools, with their relatives or neighbors as a result of destruction of their houses by urban floods and no further assistance comes thereafter. Victims will have to look for places on their own. When floods are experienced in communities, normally it is the residents that will report to the government agencies namely the National Emergency Management Agency (NEMA) and the State Emergency Relief Agency (SERA) for possible intervention. These interventions comes inform of relief materials such as Grains, Mats, Mattresses, Buckets, blankets roofing sheets, and at times a little token in form of cash. These assistance more often than not hardly reach or touch the target beneficiaries more especially when the affected areas are involving rural people. As for the urban residents, such assistance hardly comes their way. Although most flood events reports comes from the rural areas, NEMA officials confirmed that not every flood incident is reported to their office. This makes it difficult for the Agency to render any form of assistance to those affected by floods in such areas. Residents construct minor drainages to evacuate waste water from latrines and bathrooms, however these strategies is not effective as it leads to more degradation and worsen the situation during the rainy season. To reduce the collapse of buildings and against the pressure being exerted by motorist in avoiding inundated terrains, residents erect tires, Wood logs, Sandbags and high building foundations for those who can afford it. In recent times government has constructed so many drainages in many LGAs headquarters but residents complained that it has rather increased mosquitoes and flood incidence in these areas. In depth interview with the agencies concerned indicated that they are doing their best in evacuating waste. Their major problems however, include lack of vehicles and waste packing machines. As urban areas grow in population, they expand outward and often overwhelming the natural environment and destroying the ecosystem. Borno State Urban centers especially Maiduguri, Biu, Gwoza, Bama etc. have all expanded over the years both in size and population. The United Nations (2006) also confirmed that some of the problems that are facing cities, towns, and their people as includes inadequate financial resources, increased poverty and a widening gap between rich and poor, unsustainable use of land, uncoordinated development and insecure land tenure, lack of green spaces and inadequate water supply and sanitation. These main problems have related to many other smaller problems like lack of jobs, spreading homelessness and expanding squatter settlements, inadequate and deterioration of building stock, services and infrastructure, lack of health, rising traffic congestion and more pollution. Conclusion Floods are environmental hazards which involves increase in volume of surface flow be it of natural or manmade drainage channel where the flood water originates from precipitation or water body. The study of the occurrence causes and effects of floods in Borno revealed that the phenomenon is on the increase. Factors responsible for this believed to be both natural and anthropogenic. However, the anthropogenic causes out weight the natural ones. The natural factor that can be of significance should be surface topography. Increase in annual rainfall may not be a significant cause as part of the state with highest rainfall does not corresponds with the highest flood

Reproductive Health Indicators in selected Communities in Maiduguri, Jere and Bama LGAs: A Survey Report
154
occurrences. The explanation of the variations in the three senatorial zones of the state stressed these points. Some of the human factors are that more people are migrating to the state which means increase urbanization and population as well as environmental degradation. The causes of floods and inundations are found to be lack of and inadequate drainage system, blocked drainages and unplanned construction of buildings. These causes are more often than not highly propelled by rapid urbanization, population increase and flood plain occupation. Since the causes are mostly anthropogenic in nature and effort can be put in place to curtail the devastating effects. However, the more seriously the problems of rapid urbanization, rapid population growth, poor urban planning and management activities are left unattended to flood will be a major threat to residents in most urban areas of the state. To curtail the situation, there is therefore the need for government to imbibe the culture of proper planning, provision of adequate drainage system, proper enlightenment on sanitary practices and Environmental Education as well as community participation should be encouraged by Government, Non Governmental Organizations and individuals.
Issues in the Geography of Borno State.
)
155
REFERENCES Abumere, S.I. (2002); “Urbanization” Atlas of Nigeria. In Africa Atlases, Bietlot Belgium. pp. 88-91. Abaje, I.B. & Giwa, P.N (2008) Urban Floods and Environmental Safety: A Case Study of Kafanchan Town in Kaduna
State. In Mamman, A.B: Chup, C.D. & Mashi, S.A (2008) Urbanization, Resource Exploitation and Environmental Stability in Nigeria.Book of Proceedings of the 49
th Annual Conference of the Nigerian
Geographers (ANG) Kaduna, Joyce. pp 582-589 Action Aid (2006); Climate Change, Urban flooding and the rights of the Urban Poor in Africa. Key findings from Six
African cities. Action Aid International. www.actionaid.org Ali, Z.K. (2008) Assessment of Rural Water Supply (RWS) Schemes in Bama LGA of Borno State, M.Sc Dissertation,
Department of Geography, Federal University of Technology, Yola, Adamawa State. PP 70 Botkin, D.B and Kellar, E.A (1998); Environmental Science “Earth as a living planet” 2
nd Edition, John Willey & Sons
Juc. New York, pp 409-412. Borno State,(2008) Borno State Diary, Ibro Prints, Kaduna. P6 Daura, M.M (2001); “The Physical Environment and Development: A study of Borno Region in Daura, M.M;
Ogunnika, O; Irefin, D; & Balami, D. (eds) Environment and Development. Issues in Sub-Saharan African, Seminar Series, Vol.1. Faculty of Social and Management Sciences University of Maiduguri pp 35-47.
Daura, M.M, Nyanganji, J.K; Odihi, J.O and Gisilanbe, A.M (1997); Responses to Flood Hazards: A study of Maiduguri 1994 Flood Disaster in Daura, M.M. (1997); Issues in Environmental Monitoring in Nigeria.
Later Days Maiduguri, pp 173-176. Daura, M.M; Gisilanbe, A.M; & M. Waziri (1997); Floodplain Encroachment and Hazard Awareness in Urbanized
Catchments: A Study of Ngadda Floodplain in Maiduguri. In Ogunnika,O; Irefin,D; Daura,M & Balami,D. (2001)Environment and Development Issues in Sub-Saharan Africa, Seminar Series, Vol.1. FSMS, University of Maiduguri.pp 50-60.
Douglas, I; Alam, K; Maghenda, M; Mc Donnel, Y; MC Lean, L.& Campbell, J. (2008) “Unjust Waters: Climate Change, Flooding and the Urban Poor in Africa”. Environment and Urbanization.Vol.20,No1.
Egenti, J.O. (2009) Assessment of the Sources and Quality of Water Supplied by Water Vendors (Mai Moya) in Maiduguri Metropolis, Borno State, M.Sc Dissertation, Department of Geography, University of
Maiduguri. Pp 96 Jaiyeoba, I.A. (2002); “Environment” Atlas of Nigeria. In Africa Atlases Bietlot, Belgium. Pp 122. Kagu, A.A (1997); Urban Refuse Generation and Disposal: A Case Study of Maiduguri Metropolis. A published M.Sc
Dissertation, Dept. of Geography, University of Maiduguri, Borno State, pp 1-63. Max, L. (1976); Maiduguri: Surveys and Planning Reports for the North Eastern States Government of Nigeria, Max
Lock Group, U.K Warminster press Ltd. Mshelia, A.D.(2004) Flood and the Urban Environment in Nigeria: Nature, Sources and Causes “Environmental
Watch Journal, Vol.1,No.1. The Federal Polytechnic, Bida,Niger State. MLS, (2008); Ministy of Land and Survey, Maiduguri, Borno State. NPC (2006) National Population Commission, 2006 Borno State Population. Offiong,R.A. & Eni,D.I.(2008)Urban Flood:An Appraisal of the Effects of Flooding on Urban Infrastructure in Calabar
Metropolis ,Cross River State, Nigeria. In Mamman, A.B., Chup, C.D. & Mashi, S.A. (2008) Urbanization, Resource Exploitation and Environmental Stability in Nigeria. Book of Proceedings of the 49
th Annual
Conference of the Nigerian Geographers (ANG) Kaduna, Joyce. pp 583- 581 Ologunnorisa, R.E (2006); Flood Risk Assessment and Management in Nigeria: Perspective from the Niger Delta
. Selfless Educational Books, Makurdi, pp159. United Nations (2006) World Urbanization Prospects: The 2005 Revision United Nation population Division,
Reproductive Health Indicators in selected Communities in Maiduguri, Jere and Bama LGAs: A Survey Report
156
Department of Economic and Social Affairs, United Nations, New York. PP 25 – 27 Wijkman, A. & Timberlake, L. (1992) Natural Disasters; Acts of God or act of Man? Earth Scan. Yerima, F. (2007) Assessment of Ground Water Quality in Bama Town, M.Sc Dissertation, Department of
Geography, University of Maiduguri,Nigeria.