PERCEPTIONS OF FET GEOGRAPHY EDUCATORS ...
128
COPYRIGHT AND CITATION CONSIDERATIONS FOR THIS THESIS/ DISSERTATION o Attribution — You must give appropriate credit, provide a link to the license, and indicate if changes were made. You may do so in any reasonable manner, but not in any way that suggests the licensor endorses you or your use. o NonCommercial — You may not use the material for commercial purposes. o ShareAlike — If you remix, transform, or build upon the material, you must distribute your contributions under the same license as the original. How to cite this thesis Surname, Initial(s). (2012). Title of the thesis or dissertation (Doctoral Thesis / Master’s Dissertation). Johannesburg: University of Johannesburg. Available from: http://hdl.handle.net/102000/0002 (Accessed: 22 August 2017).
-
Upload
khangminh22 -
Category
Documents
-
view
3 -
download
0
Transcript of PERCEPTIONS OF FET GEOGRAPHY EDUCATORS ...

COPYRIGHT AND CITATION CONSIDERATIONS FOR THIS THESIS/ DISSERTATION
o Attribution — You must give appropriate credit, provide a link to the license, and indicate ifchanges were made. You may do so in any reasonable manner, but not in any way thatsuggests the licensor endorses you or your use.
o NonCommercial — You may not use the material for commercial purposes.
o ShareAlike — If you remix, transform, or build upon the material, you must distribute yourcontributions under the same license as the original.
How to cite this thesis
Surname, Initial(s). (2012). Title of the thesis or dissertation (Doctoral Thesis / Master’s Dissertation). Johannesburg: University of Johannesburg. Available from: http://hdl.handle.net/102000/0002 (Accessed: 22 August 2017).

DIGITAL TRENDS IN MAPPING: PERCEPTIONS OF FET
GEOGRAPHY EDUCATORS REGARDING THE USE OF ICTS IN THE
TEACHING OF MAP WORK
by
TASNEEM SEEDAT
MINOR DISSERTATION
submitted in partial fulfilment of the
requirements for the degree
MAGISTER EDUCATIONIS
in
INFORMATION AND COMMUNICATION TECHNOLOGY IN
EDUCATION
in the
FACULTY OF EDUCATION
at the
UNIVERSITY OF JOHANNESBURG
SUPERVISOR: PROF G. LAUTENBACH

ii
DECLARATION
I, Tasneem Seedat, student number 809737227, hereby declare that the minor
dissertation entitled:
Digital trends in mapping: Perceptions of FET Geography educators regarding
the use of ICTs in the teaching of map work
Submitted to the University of Johannesburg, apart from the assistance recognised
and acknowledged, is my own work.
Furthermore, I confirm that:
• All sources have been referenced in accordance with the APA style,
• Data and findings have been collected and documented ethically,
• This document has not been presented previously or concurrently, for
examination.
Signature: - ------------------------------------
Date: --------------------------------------------

iii
DEDICATION
I dedicate this dissertation to my loving husband, Zakir, and dearest children
Saaleha, Safiyya, and Mohammed the source of my inspiration and encouragement
throughout my studies. I am forever grateful for your support even through my
exhaustions, irritability and mood swings.

iv
ACKNOWLEDGEMENTS
A scholar once addressed an audience at a graduation ceremony, commenting,
“There are only two people who will rejoice at your accomplishments: your parents
and teachers. Thank them”.
• To my beloved parents, Yusuf and Farida Seedat, I am eternally grateful for
your endless love that has carried me along this journey.
• To all my teachers past and present, “If I have seen further than others, it is
standing upon the shoulders of giants” (Isaac Newton, 1675).
The completion of this minor dissertation was possible with the assistance of several
people.
I extend my appreciation to my supervisor, Professor Geoffrey Lautenbach, for his
professional guidance and academic perspective.
I remain grateful to the Gauteng Department of Education for allowing me permission
to conduct research.
My deepest gratitude towards the principals and participating educators of the
schools where I conducted my research. This research would not be possible without
your time and commitment that you extended towards me.
To my virtual colleagues, although distant by space, your network of inspiration
carried me through.
My heartfelt appreciation to the board members, principals, HODs, and colleagues at
work for encouraging me to pursue my studies.
To my husband Zakir and children Saaleha, Safiyya, and Mohammed, my support
structure. I am grateful for your patience and support despite the challenges and
frustrations through this long journey.
Ultimately, I am eternally grateful to God, the Almighty for giving me the strength and
wisdom to strive towards the best in myself.

v
ABSTRACT
Digital trends in mapping: Perceptions of FET Geography educators regarding
the use of ICTs in the teaching of map work
21st Century mapping solutions have changed from manual cartography to
Information and Communication Technology (ICT) mapping applications, however in
Further Education and Training (FET) Geography, map work pedagogies have
remained paper-based (Fleischmann, Van der Westhuizen, & Cilliers, 2015). This
study focuses on how Geography educators perceive the use of ICTs in teaching
map work. The Technological, Pedagogical and Content Knowledge (TPACK)
framework is an ideal heuristic to theorise this research. The study presents findings
based on a qualitative case study design, focusing on a “bounded system, under
natural conditions, so that the system could be understood in its own environment”
(Stake, 1995, p.2). The results of this study suggest that although educators
embraced ICT and used ICT to enhance their teaching, each educator displayed
some degree of anguish. Paper-based maps develop skills otherwise not realised
through ICT such as: spatial perceptions, visual and graphic skills. Results further
displayed obstacles, such as lack of resources and educator ICT training, which
“outweigh teacher optimism and cause many to revert to textbook (GIS) teaching”
(Mzuza, Van Der Westhuizen, 2019). The findings of this study suggest that a
“blended approach” of combining paper-based maps and ICT can be effective.
School management, districts, and the Department of Basic Education (DBE) can
provide the necessary training and support for educators to foster positive ICT
perception in map work teaching.

vi
GLOSSARY OF TERMS
ArcGIS Aeronautical Reconnaissance Coverage Geographic Information
System
CAPS Curriculum and Assessment Policy Statement
CAT Computer Applications Technology
DBE Department of Basic Education (from 2009)
DoE Department of Education (prior to 2009)
ESRI Environmental Systems Research Institute
FET Further Education and Training
GET General Education and Training
GIS Geographic Information System
ICT Information and communication Technologies
NCS National Curriculum Statement (Curriculum 2000)
OBE Outcomes Based Education
PCK Pedagogical Content Knowledge
RNCS Revised National Curriculum Statement (Curriculum 2005)
TPACK Technological, pedagogical, and content knowledge

vii
LIST OF FIGURES
Figure 1: A Cross-Section of Curriculum Introduction Over Time (Source: Innes, 2012, p.99) ..................................................................................................................... 9
Figure 3: Shulman’s PCK model (Source: Koehler & Mishra, 2006, p.1020) ............ 16
Figure 4: TPACK model. (Source: Koehler & Mishra 2009, p.63) ............................. 17
Figure 5: A Continuum Blended Learning (Source: Chew, Jones & Turner, 2008, p.46) ............................................................................................................................. 26
Figure 6: A framework of Population Refinement for Sampling in Qualitative data (Source: Asiamah, Mensah & Oteng-Abayie, 2017, p.1615) ..................................... 32

viii
LIST OF TABLES
Table 1: Overview of Post-Apartheid Curriculum Changes (Source: Adapted from Innes 2012) .................................................................................................................... 8
Table 2: Content summary for CAPS Geography (Source: Department of Basic Education, 2011a, p.18) .............................................................................................. 13
Table 3: Section A - Overview of Geography Skills and Techniques for FET (Source: Department of Basic Education, 2011b, p.15) .......................................................... 14
Table 4: Section B - Overview of Geographical Skills and Techniques for FET (Source: Department of Basic Education, 2011b, p.16) ............................................. 14
Table 5: List of Participants ......................................................................................... 35

ix
TABLE OF CONTENTS
DESCRIPTION PAGE
DECLARATION............................................................................................................. ii
DEDICATION ............................................................................................................... iii
ACKNOWLEDGEMENTS ............................................................................................ iv
ABSTRACT ................................................................................................................... v
GLOSSARY OF TERMS.............................................................................................. vi
LIST OF FIGURES ...................................................................................................... vii
LIST OF TABLES ...................................................................................................... viii
TABLE OF CONTENTS ............................................................................................... ix
CHAPTER 1. INTRODUCTION ................................................................................. 1
1.1 BACKGROUND TO ICT IN SOUTH AFRICA ................................................. 1
1.2 TEACHING MAP WORK WITH ICT ................................................................ 2
1.3 RESEARCH PROBLEM ................................................................................... 3
1.4 RESEARCH QUESTION .................................................................................. 4
1.5 AIMS AND OBJECTIVES ................................................................................ 4
1.6 THE RESEARCH METHODS AND DESIGNS ................................................ 5
1.7 SUMMARY ........................................................................................................ 6
CHAPTER 2. LITERATURE REVIEW ....................................................................... 7
2.1 INTRODUCTION ............................................................................................... 7
2.2 THE PROCESS TOWARDS A DEMOCRATIC GEOGRAPHY EDUCATION 7
The First Wave – Outcomes Based Education (OBE)............................... 9
The Second Wave at GET – Revised National Curriculum Statement (RNCS 2005) ........................................................................................................ 10
The Second Wave at FET – National Curriculum Statement (NCS 2005) 11
The Third Wave – Introduction of Curriculum Assessment Policy Statement (CAPS) ................................................................................................ 12
2.3 THEORETICAL FRAMEWORK: AN OVERVIEW OF TPACK ..................... 15
Historical Background of the TPACK Framework .................................... 15

x
The Development of the TPACK Model ................................................... 16
Limitations of the TPACK Model .............................................................. 19
2.4 RECONCEPTUALISING MODERN MAPPING IN GEOGRAPHY ............... 19
ICT Mapping Applications ......................................................................... 20
Teaching Map work in Schools ................................................................ 20
2.5 CHALLENGES IN ICT IMPLEMENTATION .................................................. 21
Gap in Theoretical Knowledge ................................................................. 21
Lack of ICT Resources ............................................................................. 22
ICT as a Teaching Aid vs ICT as an Interactive Tool .............................. 23
2.6 POSSIBLE SOLUTIONS FOR ICT IMPLEMENTATION .............................. 24
TPACK for Geography Teaching.............................................................. 24
Educator Training Programmes ............................................................... 25
Blended Learning Approach ..................................................................... 25
Interactive Learning .................................................................................. 26
2.7 SUMMARY ...................................................................................................... 27
CHAPTER 3. RESEARCH DESIGN AND METHODOLOGY ................................ 28
3.1 INTRODUCTION ............................................................................................. 28
3.2 RESEARCH DESIGN ..................................................................................... 28
Qualitative Research Designs .................................................................. 29
Validating Qualitative Data ....................................................................... 29
A Case Study Approach ........................................................................... 30
Bounded Systems ..................................................................................... 30
3.3 POPULATION AND SAMPLING ................................................................... 31
Redefining Population............................................................................... 31
Sampling ................................................................................................... 33
3.4 DATA SATURATION ...................................................................................... 33
3.5 THE PARTICIPANTS ..................................................................................... 34
3.6 RESEARCH METHODOLOGY ...................................................................... 37
Data Collection .......................................................................................... 37

xi
Data Recording ......................................................................................... 38
Data Analysis ............................................................................................ 39
3.7 ETHICAL CONSIDERATIONS ....................................................................... 40
3.8 SUMMARY ...................................................................................................... 41
CHAPTER 4. FINDINGS .......................................................................................... 42
4.1 INTRODUCTION ............................................................................................. 42
4.2 EDUCATORS’ FIRST EXPERIENCE WITH TECHNOLOGY ....................... 42
“It was nerve-wracking…” ......................................................................... 43
“It was very fascinating…” ........................................................................ 44
“…that was going back a long time…” ..................................................... 44
“…my everyday lessons…” ...................................................................... 46
4.3 THE USE OF ICT IN TEACHING MAP WORK ............................................. 47
“…the traditional way…” ........................................................................... 47
“I begin with a PowerPoint…” ................................................................... 48
“…the exam has to cater for paperwork…” .............................................. 49
4.4 WEIGHING UP THE PROS AND CONS ....................................................... 50
“…learners would perform better…” ......................................................... 50
“…understanding abstract concepts…” ................................................... 51
“…we do not practically make them do it anymore…” ............................. 52
“…we don’t have access…”...................................................................... 53
4.5 ICT AS A TEACHING AID VS. ICT AS AN INTERACTIVE TOOL .............. 55
“…both are of equal value…” ................................................................... 55
“…just a shallow understanding…” .......................................................... 57
4.6 EDUCATOR TRAINING PROGRAMMES ..................................................... 58
“…perhaps we ourselves are not properly trained…” .............................. 58
“…I would love to be an expert…” ............................................................ 59
“…not only that we must be running it…” ................................................. 60
4.7 SUMMARY ...................................................................................................... 61
CHAPTER 5. SUMMARY, DISCUSSION, RECOMMENDATIONS, CONCLUSIONS AND FINAL WORD ........................................................................ 62

xii
5.1 INTRODUCTION ............................................................................................. 62
5.2 LIMITATIONS OF THE STUDY ..................................................................... 63
5.3 CONCLUSIONS EMANATING FROM THE FINDINGS................................ 63
Confidence to use ICTs ............................................................................ 64
Integrating ICT in Map Work..................................................................... 64
The Great Contradiction ........................................................................... 65
Curriculum Aligned Software .................................................................... 66
Educator Training Programmes ............................................................... 66
Access to Resources ................................................................................ 67
Educators’ Knowledge of GIS and its Usability in the Classroom ........... 67
5.4 RECOMMENDATIONS FOR FUTURE STUDIES ......................................... 68
5.5 A FINAL WORD .............................................................................................. 69
REFERENCES ............................................................................................................ 71
APPENDIX A: GDE RESEARCH REQUEST FORM ................................................ 77
APPENDIX B: GDE RESEARCH APPROVAL LETTER ......................................... 87
APPENDIX C: LETTER TO SCHOOLS ..................................................................... 89
APPENDIX D: APPROVAL OF PROPOSAL ............................................................ 90
APPENDIX E: ETHICS CLEARANCE CERTIFICATE.............................................. 91
APPENDIX F: INTERVIEW SCHEDULE ................................................................... 92
APPENDIX G: INTERVIEW TRANSCRIPT – MR PHILLIP ...................................... 94
APPENDIX H: INTERVIEW TRANSCRIPT – MRS HARRIS AND MRS CLARK.... 97
APPENDIX I: INTERVIEW TRANSCRIPT – MRS MARTIN ................................... 104
APPENDIX J: INTERVIEW TRANSCRIPT – MRS BERN ...................................... 106
APPENDIX K: INTERVIEW TRANSCRIPT – MRS JOHNSON .............................. 111
APPENDIX L: INTERVIEW TRANSCRIPT – MR ROBERT ................................... 114

1
CHAPTER 1. INTRODUCTION
___________________________________________________________________
“We understand ourselves and others only when we transfer our own lived
experience into every kind of expression of our own and other people’s lives.”
(Wilhelm Dilthey, 1910)
___________________________________________________________________
1.1 BACKGROUND TO ICT IN SOUTH AFRICA
Commencing in 2003, the South African education system has undergone rapid
changes with the introduction of the Draft White Paper on e-learning, a policy aimed
to transform learning and teaching with Information and Communication
Technologies (ICTs) (Department of Education, 2003). With the publication of the
draft White Paper on e-Education (2003), policy makers affirmed that through ICT
learner performance, teaching pedagogies and overall school functioning would
improve (Vandeyar, 2015). Contrary to this, the anticipated outcome of policymakers
was detached from the negligible implementation of ICT at province, district, and
schools level.
Expectations of e-learning policies at national level were not realised during school
level implementations (Vandeyar, 2015). Positioned between policy and
implementation, educators struggled to successfully implement each new policy in
an environment that did not promote conditions for e-learning. e-Learning policies
depend upon the broader spectrum of the schooling environment, including educator
skills development and access to resources (Mzuza, Van Der Westhuizen, 2019).
The Department of Basic Education’s (DBE) Annual Report states its continuation,
“to engage and mobilise all stakeholders to support future roll-outs, using the
Operation Phakisa platform” (Department of Basic Education, 2017). The operation
allocated a substantial portion of the budget to delivering ICT resources such as
laptops, tablets, and software to 719 schools for supporting curriculum and teaching

2
at Further Education and Training (FET) level (Department of Basic Education,
2017). However, it was only after this much-awaited support that South African
schools began to benefit from e-learning.
Acknowledging the educator as instrumental in determining success in implementing
ICT within schools, educator-training programmes were established. In the interim,
the Guidelines for Teacher Training and Professional Development (2007) were
published by the DoE to outline a structural plan for the implementation and up-
skilling of educators in using ICT. Educators were encouraged to attend workshops
on ICT training at school and district level. Workshops concentrated on up-skilling
their technological knowledge (TK) and not pedagogical knowledge (PK). Lacking
integration of technical knowledge and pedagogical knowledge educators were
unable to successfully use ICT in the specific learning areas (Voogt, Fisser, Pareja,
Tondeur & Van Braak, 2013). With insufficient knowledge the usage of ICT is limited
to a teaching aid and its potential, as an interactive tool is not realised.
1.2 TEACHING MAP WORK WITH ICT
Numerous problems continue to exist in schools, despite the significant progression
in implementing ICT including increased resources, up-skilling educators and
enhanced connectivity (Department of Education, 2017). A significant gap persists in
merging technological knowledge (TK) and pedagogical knowledge (PK) for effective
ICT teaching (Curtis, 2019). Geography educators are unable to effectively integrate
ICT into map work teaching and are inclined to uphold traditional pedagogies. As a
result, Geography educators are keeping in line with “traditional field mapping -
pencil on the paper” (De Donatis, Alberti, Cesarini, Menichetti, & Susini, 2016).
Map work has long been an integral part of higher education and presently exists as
a major section in the Geography syllabus as stimulated by CAPs (Curriculum and
Assessment Policy Statement) (Department of Basic Education, 2011b). As modern
mapping solutions have changed from manual cartography to ICT mapping

3
applications (Fleischmann, Van der Westhuizen, & Cilliers, 2015), so too has the
curriculum been updated. CAPs have introduced a small sub-section within map
work, namely GIS (Geographic Information Systems) keeping inline with ICT
mapping innovations. However, the introduction of GIS into map work has been
purely theoretical and lacks any ICTs practical. Map work concepts, in particular GIS
are dependent on ICT for learner comprehension (Hong & Stonier, 2015). Thus map
work remains a paper-based subject in teaching, learning and assessment in the
FET (Further Education and Training) under CAPs (Department of Basic Education,
2011b).
To clarify the use of the concepts “map work” and “GIS” within this research, I will
refer back to the CAPs documents (Department of Basic Education, 2011b). The
CAPs document outlines the syllabus for Geography categorises map work as one of
the five sections of the curriculum, with GIS as a minor sub-section within map work
(Department of Basic Education, 2011b). In this research “map work” will be used as
a broad term to include all concepts in mapping including “GIS”. Where specific
reference is made to “GIS”, is it for the purpose of emphasis and isolating the
concept of “GIS”. This method of referencing is in line with that of “geography
educators” and allows for easier comprehension of educators responses in the
interviews.
1.3 RESEARCH PROBLEM
Based on the discussion above this research will examine the perceptions of FET
(Further Education and Training) Geography educators regarding their use of ICTs in
teaching map work. The research expands on previous comparable research into the
integration of ICT in the South African Geography classroom by Fleischmann, Van
der Westhuizen, and Cilliers (2015); Wilmot and Dube (2015); and Golightly and Van
Der Westhuizen. (2016). The research focuses on educators’ perceptions in using
ICT in teaching and learning map work. Literature evidence sate modern mapping
applications have been modified to include ICT applications; yet teaching map work
and GIS remains ‘paper-based’ (Breetzke, Eksteen, & Pretorius, 2011; Fleischmann,

4
Van der Westhuizen, & Cilliers, 2015). The research examines the insights of
educators’ perceptions in “remaining paper-based” (if any), which is adversely
associated with the shift from paper base to ICT in map work. The efficiency of
integrating technological knowledge and pedagogical knowledge when teaching map
work with ICTs by Geography educators will also be examined.
1.4 RESEARCH QUESTION
This brings me to the research question: What are the perceptions of FET
Geography educators regarding the use of ICTs in the teaching of map work?
The following sub-questions will be addressed
• What are the underlying curriculum policies regarding the teaching of Map
work?
• What are the challenges educators’ experiences in ICT implementation in
Map work?
• What are the possible solutions for ICT implementation in Map work?
• How can the TPACK framework be implemented in in Map work teaching?
1.5 AIMS AND OBJECTIVES
The aim of this research is to explore the perceptions of FET Geography educators
regarding the use of ICTs in teaching map work. To achieve this aim the following
objectives have been set:
• To identify and explain the perceptions of FET Geography educators
regarding the use of ICTs in teaching map work.
• To explore the integration of educators’ technological knowledge and
pedagogical knowledge of teaching map work in FET schools through
interviews.
5
• To analyse the data to derive recommendations for improving ICT integration
in teaching map work and,
• To identify initiatives of educators’ self-directed learning towards developing
professional ICT skills in teaching map work.
1.6 THE RESEARCH METHODS AND DESIGNS
Research method is referred to as “a plan or blueprint” outlining the research project
to be conducted (Mouton, 2001). The research method expands on the process of,
sampling, collecting data, recording data, and analysing the data. The primary form
of data collection in this research is individual and group interviews with the
participants. Interviews provide explanatory data of the participants and their use of
ICT (Mills, Harrison, Franklin & Birks, 2017). The chosen methods allow the
participants to comfortably relate their experiences, feelings, and beliefs regarding
their technological knowledge and pedagogical knowledge in teaching Geography
map work within FET schools. Recording of data is two-fold: the audio interview and
transcribing the interviews. Data analysis through using process-coding techniques
(Saldana, 2015) provides awareness into the perceptions of the participants.
This research adopts a case study design, as the nature of the research question is
indicative of understanding the perception of FET Geography educators regarding
the use of ICTs in teaching map work. Studying the educators in their natural
environment allows for an understanding of social phenomena as environment,
interactions, and behaviour (Creswell & Clark, 2017; Mays & Pope, 2006). This
“focuses on a bounded system, usually under natural conditions, so that the system
can be understood in its own environment” (Stake, 1995). A qualitative approach
allows for an in-depth exploration entailing individual interviews, group interviews,
discussions, document analysis, and projective techniques (Strauss & Myburgh,
2015). Qualitative research focuses on a deeper understanding of the way
individuals interpret and make sense of their existence within society. The literature
review forms an important focus on the design of this research. A comprehensive
literature review provides the framework and serves to validate the subsequent

6
findings (Creswell & Clark, 2017; Marshall & Rossman, 2014). The literature review
encompasses a critical study of local and international research papers and articles.
1.7 SUMMARY
Four additional chapters follow the introductory Chapter 1 of this research. Chapter
2, the literature review, commences with a background into the history of Geography
in South Africa’s education and continues to position the TPACK framework and ICT
within present day map-work teachings. Chapter 3 outlines the research design and
methodology with reference to Stake and Merriam’s method of qualitative studies
(Merriam, 1998; Stake, 1995). The case study approach enables in-depth
exploration into educators’ perceptions regarding their use of ICT in teaching map
work during individual and group interviews with the participants. Chapter 4 presents
data analysis of the raw data collected through the interviews as educators’
experiences, feelings, and beliefs. The concluding Chapter 5 presents the findings
emanating from the research as well as the limitations of the study and
recommendations for future studies.

7
CHAPTER 2. LITERATURE REVIEW
___________________________________________________________________
“The journey to digital field mapping in the geosciences academic world is far
from ending.”
(Donatis, Alberti, Cesarini, Menichetti & Susini, 2016, pg. 1)
___________________________________________________________________
2.1 INTRODUCTION
Chapter 2 is a review of the literature supporting this research: Digital trends in
mapping: Perceptions of FET Geography educators regarding the use of ICTs
in the teaching of map work. The literature concentrates on the following five
areas:
• The Process Towards a Democratic Geography Education
• Theoretical Framework: An Overview of TPACK
• Reconceptualising Modern Mapping in Geography
• Challenges in ICT Implementation
• Possible Solutions for ICT Implementation
2.2 THE PROCESS TOWARDS A DEMOCRATIC GEOGRAPHY EDUCATION
This section examines the historical transformation of the South African education
system, with Geography teaching at its focus. Since 1994, South Africans have seen
substantial amendments towards curriculum reform intended to address inequalities
brought about by apartheid policies (Adu &, Ngibe, 2014; Jansen, 1998).
Amendments to the curriculum occurred through two distinct curricula, namely,
Outcomes Based Education (OBE) and Curriculum and Assessment Policy
Statement (CAPS).

8
Table 1 simplifies the curriculum changes and provides a quick reference for
subsequent curriculum and policy orientation. Important to differentiate is the
Revised National Curriculum Statement (RNCS 2005) for GET phase and the
National Curriculum Statement 2005 (NCS 2005) for FET phase, as an amendment
to OBE.
Table 1: Overview of Post-Apartheid Curriculum Changes (Source: Adapted from Innes 2012)
CURRICULUM POLICY STATEMENT
YEAR IMPLEMENTED
LEARNING AREA
PHASE
1st wave
OBE Curriculum 2000
National Curriculum Statement NCS 2000
1998 Human and Social Sciences
GET
2nd wave
Curriculum 2005 Revised National Curriculum Statement 2005 RNCS 2005
Implemented in 2005 for gr. 7 Implemented in 2006 for gr. 8 and 9
Social Sciences
GET
Curriculum 2005 National Curriculum Statement 2005 NCS 2005
Phased in 2006 from gr. 10
Geography FET
3rd wave
CAPS Curriculum and Assessment Policy Statement
Phased in 2012 from gr. 10
Geography FET
CAPS Curriculum and Assessment Policy Statement
Implemented in 2014 for gr. 7,8 and 9
Social Sciences
GET
With the implementation of each new curriculum, immediate improvements are not
evident across any phase. Figure 1 highlights the Path of Learners A, B and C as red
arrows symbolising a six-year lag time from implementation of a new curriculum to
potential impact on matriculant results (Innes, 2012, p.99). For a learner to progress
from grade 1 to grade 12, a twelve-year lag time is speculated. Taking into account
the twelve-year lag time, there is no post-apartheid matric class who completed
twelve years of schooling without undergoing any curricula changes. The
matriculants of 2014 progressed through all three waves of curricula changes to
become the first CAPS matriculants. If the education curriculum remains unchanged
over the next five years, than the future class of 2024 would be the first CAPS
learners to benefit from a single curriculum.

9
Figure 1: A Cross-Section of Curriculum Introduction Over Time (Source: Innes, 2012, p.99)
The First Wave – Outcomes Based Education (OBE)
OBE was seen as a three-hundred-and-sixty degree change from the previous
apartheid curriculum towards “outcomes of skills, knowledge and values for social
justice, equality and development” (Mouton, Louw & Strydom, 2012, p.1214). OBE
was implemented through the NCS 2000 for the GET Band from Grade R to Grade
9, with inconspicuous effect on the FET (Gluckman, 2016). The DoE implemented
OBE policies, even though it was an unsuccessful venture in many first world
countries, amid abundance of resources, small classrooms, and qualified educators
(Mouton et. al., 2012). The new Geography FET curriculum followed previous
syllabus and assessment system introduced in the 1970s by the Committee of
Heads of Education (CHE) and the Joint Matriculation Board (JMB). Geography
learners wrote two examination papers Paper 1- theoretical work forming 75% of the
total mark, and Paper 2 - map work forming 25% of the total mark. FET map skill
confirmed a “spatial competence problem among school leavers in South Africa”
(Innes, 2012, p.97).

10
OBE proved problematic across the curriculum including Geography. OBE brought
on complex curriculum changes but with insufficient support and training (Jansen,
1989). Historically underprivileged schools demonstrated a lack of managing new
policies, due to insufficient resources (Tshiredo, 2013). The state of the 1990s
Geography learners had not changed with OBE and, “many had never seen an
example of a topographic map sheet and certainly had never seen their local
topographic map. They were unaware of the existence of South Africa’s National
Mapping Organisation (NMO) and still viewed the introduction of the practical paper
to assess map skills with fear and resentment” (Innes, 2012, p.95).
The Second Wave at GET – Revised National Curriculum
Statement (RNCS 2005)
In 1999, newly appointed Minister of Education, Kader Asmal conducted a reviewed
of OBE and the Revised National Curriculum Statement (RNCS 2005) replace it
(Mouton, 2001). The new curriculum policy document focused on both the GET and
FET bands. The new RNCS curriculum published two guidelines for educators. The
Revised National Curriculum Statement (RNCS 2005) revised the National
Curriculum Statement (NCS 2000), implemented for the GET phase under OBE.
Concurrently the National Curriculum Statement (NCS 2005) was implemented for
the FET phase, thus becoming the first policy document for the FET under OBE.
RNCS 2005 brought about desired changes for Geography in the GET, with
“Geography and History disentangled and reformulated as individual topics, carrying
equal weight” (Innes, 2012. p.98). A commendable change was introduced at
primary level regarding map work. Map skills and spatial concepts were proposed at
the GET assessment level for the first time (Department of Education, 2002). Taking
note that between 2000 and 2005 there was no preparatory exposure to map work in
the GET phase, RNCS 2005 would now prepare learners for map work at FET level.
The new curriculum specifically mentioned topographic maps along with fieldwork
investigation, improving the spatial competencies of learners as they entered the
FET phases.

11
The Second Wave at FET – National Curriculum Statement (NCS
2005)
Assisting educators in implementing Geography changes under the NCS 2005
curriculum, the following two official documents were implemented: “Learning
Programme Guidelines” (LPG) (Department of Education, 2008) and “Subject
Assessment Guidelines” (SAG) (Department of Education, 2008). Noting that these
documents were published in 2008, coinciding with the first year that matriculants
would write the NCS 2005 examination and two years subsequent to the grade 10
phasing in of NCS 2005. Although the documents positioned the central importance
of map skills within Geography, it did not provide a clear structure and “guidance on
what map use techniques should be introduced when, and at what skill level” (Innes,
2012, p.100). The early years of NCS 2005 implementation caused concern, as
educators were not confident in introducing map skills without a progressive
framework moving from simple map skills to complicated tasks.
Although RNCS was implemented in 2005, phasing in commenced with grade 10 in
2006 and grade 12 in 2008. The DoE administered overall responsibility for the nine
provincial education departments and the Independent Examinations Board (IEB).
NCS 2005 provided one examination body, removing provincial and racial
differences in education policies and examinations (Innes, 2012). For the first time, in
2008, matriculants wrote a common National Senior Certificate (NSC) exam, which
substituted the previous Senior Certificate (Mouton, Louw, & Strydom, 2012).
Reviewing the Learning Outcomes and Assessment Standards in the NCS 2005 for
Geography grades 10 to 12 (Department of Education, 2003) concerning map work
and map applications, references made to resources should be distinguished. The
term “sources” refers to: globes, different types of maps, models and other teaching
resources for Geography, while “only two specific references to maps were made
with no reference to other spatial information products such as aerial photographs or
satellite images” (Innes, 2012, p.99).

12
RNCS saw the introduction of Geographic Information Systems (GIS) as the first
step towards integrating ICT in map work (Innes, 2012). Policy changes appeared
attractive on paper but were not easily adapted for practice in the Geography
classroom. Regrettably, work schedules failed to specify GIS concepts across
grades 10, 11 and 12 (Department of Education, 2008). And so began the precarious
debate linking “paper-based map study (which had long been under-instructed in
many schools) and the information technology (IT) resources that were then not
available for teaching in the majority of South African high schools” (Innes, 2012,
p.100). This resulted in learners having a superficial understanding of GIS under
NCS 2005 with educators either blaming their lack of ICT or their knowledge of GIS.
The Third Wave – Introduction of Curriculum Assessment Policy
Statement (CAPS)
In 2009, the Department of Education split to form the formed the new Department of
Basic Education (DBE) and the Department of Higher Education and Training
(DHET). The DBE initiated a review of both the RNCS 2005 for grades R to 9 and
the NCS 2005 for grades 10 to 12 (Innes, 2012). In 2010, Minister Angie Motshekga
announced the latest curriculum improvement, CAPS (Curriculum Assessment
Policy Statement), in an effort to improve the quality of both teaching and learning.
At GET level positive changes were implemented, including a precise framework for
map skills development commencing from Intermediate Phase (grades 4 to 6) into
the Senior Phase (grades 7 to 9) as illustrated in Table 2 (Department of Basic
Education, 2011a). Social Sciences educators received pre-CAPS training
specifically for map study skills and use of topographic and orthophoto maps. With
CAPS implemented, Geography educators had access to clear guidelines and
additional resources from the National Mapping Organisation (NMO). CAPS aimed to
build foundational knowledge in mapping for GET learners by ensuring learners
“should be well equipped to use maps with confidence in the internal school
examinations” (Innes, 2012 p.100).

13
Table 2: Content summary for CAPS Geography (Source: Department of Basic Education, 2011a, p.18)
Within the FET phase, CAPS for grades 10-12 Geography integrated “the teaching
of geographical skills and techniques … across all four terms, and it should be linked
to specific topics in each grade” (Department of Basic Education, 2011b, p.15).
Table 3 and 4 outlines the map work syllabus focusing on: map skills, topographic
maps, aerial photographs, orthophotos, Geographic Information Systems (GIS),
using atlases, and fieldwork. Acceptable implementation of CAPS curriculum rests
upon educators’ skills development and availability of resources. For example, as
seen in the short excerpt from Table 3: Section A, “Navigating position using
compass direction (16 points), and true bearing, landforms and contour, simple
cross-sections” does not effectively explain the map skills and techniques
(Department of Basic Education, 2011b, p.15). Teaching map work would be
ineffective if educators did not have the necessary map skills and resources at their
disposal. Table 4 emphasises the use of “oblique and vertical aerial photos,
orthophoto maps to be in conjunction with 1:50 000 maps and aerial photos” in map
work lessons (Department of Basic Education, 2011b, p.15).

14
Table 3: Section A - Overview of Geography Skills and Techniques for FET (Source: Department of Basic Education, 2011b, p.15)
Table 4: Section B - Overview of Geographical Skills and Techniques for FET (Source: Department of Basic Education, 2011b, p.16)

15
Compared to NCS, the CAPS curriculum delivers a comprehensive syllabus for
teaching GIS. Table 4 provides an overview of the syllabus for GIS across the FET
phase highlighting theory concepts, atlas use and fieldwork, however it fails to
include ICT into GIS. The CAPS approach towards GIS favours a “paper-based
approach” as is confirmed from Table 4: “Develop a ‘paper GIS’ from existing maps,
photographs or other records on layers of tracing paper” (Department of Basic
Education, 2011b, p.16). A ‘paper GIS’ dismisses educators’ reliance on ICT to teach
GIS.
Policy makers are set on reviewing the CAPS curriculum. The DBE invited all
education stakeholders to review the current CAPS curriculum through the national
call of comments in August 2018, by Angelina Matsie Motshekga, Minister of Basic
Education. Section four and section three of CAPS core subjects for grade R to 12
are up for review, Geography being one of them. The Geography changes proposed
are to combine the present separate theory paper 1 and map work paper 2
examinations to form one examination, to both include theory and map work. This
would entail that there would be no specific map work paper focusing on map skills
and techniques. Of course, these legal policies will dismantle the long-standing
1970s policy of a separate map work examination.
2.3 THEORETICAL FRAMEWORK: AN OVERVIEW OF TPACK
This section focuses on the use of the Technological, Pedagogical, and Content
Knowledge (TPACK) framework to enhance map work teaching in FET Geography.
The review will commence with a historical background of the TPACK framework
and its limitations.
Historical Background of the TPACK Framework
The TPACK framework is an extension of Shulman’s notion of Pedagogical Content
Knowledge (PCK) model (Rosenberg & Koehler, 2015; Schmidt, Baran, Thompson,

16
Mishra, Koehler, & Shin, 2009; Voogt, Fisser, Pareja, Tondeur & Van Braak, 2013).
PCK emphasises the concept of educators combining content knowledge (CK) with
appropriate pedagogy knowledge (PK) to enhance learners’ understanding of the
subject, leading to effective learning and teaching as illustrated in Figure 3.
Figure 2: Shulman’s PCK model (Source: Koehler & Mishra, 2006, p.1020)
Shulman asserted that educator training programmes adversely dealt with PK and
CK as separate entities and not as interrelated core concepts (Koehler & Mishra,
2006). PCK was characterised by a complex method for educator-training combining
pedagogy knowledge and content knowledge as an interlinked framework (Koehler &
Mishra, 2006)
The Development of the TPACK Model
Shulman’s PCK model concentrated on PK and CK but failed to examine technology
knowledge (TK). As technology became an increasingly integral part of society and
education, Koehler and Mishra updated the PCK model to include TK as illustrated in
Figure 4. The TPACK model, (pronounced tee-pack), was formulated to incorporate
technological knowledge regarding ICT integration (Schmidt, Baran, Thompson,
Mishra, Koehler, & Shin, 2009).

17
Figure 3: TPACK model. (Source: Koehler & Mishra 2009, p.63)
Initially named the TPCK framework, the acronym was subsequently changed to
TPACK. Hailed as the “Total PACKage” towards effective teaching with technology,
TPACK stands for Technological, Pedagogical, and Content Knowledge (Thompson
& Mishra, 2007).
Teaching is defined as a complex activity, and for effective teaching and learning,
educators should be competent in initiating relationships between technological,
pedagogical, and content (Schmidt et. al., 2009). The TPACK framework effectively
communicates the interdependence of the three kinds of the knowledge:
“technology, pedagogy, and content” (Voogt, et. al. 2013). The three elements are
defined as:
• Technology is the equipment including mundane things e.g. chalkboards and
advanced ICT as digital computers
• Pedagogy is the methods of teaching and learning
• Content is the academic subject material

18
However, technology, pedagogy, and content cannot exist exclusively within a
schooling situation. These concepts are interlinked as depicted within the TPACK
framework (Koehler & Mishra, 2006). The following seven elements proposed by
Koehler and Mishra (2009) emphasise the interrelationships of the three kinds of
knowledge within the framework:
• Technology knowledge (TK) is knowledge regarding technology tools and
resources, ranging from chalk and books to smartboards and projectors.
• Content knowledge (CK) is the educators’ content knowledge regarding the
learning area or subject that is to be taught. CK differs greatly between fields
and phases to include concepts, theories and ideas.
• Pedagogical knowledge (PK) is the educators’ knowledge regarding the
teaching and learning methods. PK includes classroom management skills,
lesson planning, student learning, and assessment technique.
• Pedagogical content knowledge (PCK) is knowledge regarding teaching
methods applicable to the content knowledge. The educator identifies, adapts
and tailors the pedagogical style for the specific subject content knowledge.
• Technological content knowledge (TCK) is knowledge regarding how
technology can be used to influence the understanding of specific content.
The choice of technology and content can enhance or constrain one another.
• Technological pedagogical knowledge (TPK) is knowledge regarding how
technology can be used to enhance teaching methodologies. Teaching and
learning can change when a particular technology is introduced into the
learning environment.
• Technological pedagogical content knowledge (TPACK) is knowledge
combining all three components - TK, PK, and CK. TPACK is knowledge
regarding the use of appropriate pedagogical styles to use technology to
cover content knowledge.
The TPACK framework is an ideal heuristic to theorize this research. With the advent
of technology, the South African education system has undergone significant
changes. However, Geography educators are reluctant to integrate ICT into map

19
work teaching. Geography educators fail to combine appropriate PK with the
appropriate TK for effective map work teaching.
Limitations of the TPACK Model
The model has proven effective in the education sector, especially with the
introduction of ICT (Koehler & Mishra, 2006). The TPACK model has a dual impact
on educators, improving their content knowledge and skills. However, the following
limitations are evident:
• The first limitation of the framework is the inability of TPACK to accurately
measure different kinds of knowledge; pedagogy, content, and technology to
ascertain effective knowledge types for teaching (Koehler & Mishra, 2006).
• Secondly, educators are limited to available ICT resources in their schools
due to lack of funds, making socio-economic context an important issue to the
model.
• The model becomes insignificant if educators fail to ensure that technology is
integrated with content and pedagogy (Koehler & Mishra, 2006).
• Lastly, for the model to be effective, an educator has to remain in a specific
learning area for extended periods to become a specialist in that field of
content knowledge. This is seldom the case in schools as educators may be
transferred from one learning area to another.
2.4 RECONCEPTUALISING MODERN MAPPING IN GEOGRAPHY
Modern mapping is being reconceptualised in and out of the classroom as “a global
drive among political and educational institutions to implement Geographic
Information System (GIS) practice in secondary schools” (Fleischmann, Van der
Westhuizen & Cilliers, 2015, p.23). With regard to geo-spatial and map skills,
including GIS, several researchers concur on the usefulness of ICT in secondary
education (Fleischmann, Van der Westhuizen & Cilliers, 2015; Hong & Stonier, 2015;
Johansson, 2003). With the increased availability of ICT in the classroom GIS is
progressively used in areas of Geography and Science.

20
ICT Mapping Applications
At this point, it is appropriate to define ICT mapping applications. Modern mapping
applications have changed from manual cartography (paper and pencil) to ICT
mapping applications (software) (Fleischmann, Van der Westhuizen & Cilliers, 2015).
An example of this modern mapping software is GIS which is defined as “a set of
integrated software programs designed to store, retrieve, manipulate, analyse and
display geographical data concerning people, places and the environment” (Demirci,
2008, p.169). Distinct to GIS systems is the unique method of storing data. GIS data
is stored as “supporting geospatial information” which enables “management and
geospatial problem solving” (Fleischmann, Van der Westhuizen, & Cilliers, 2015,
p.1). Expanding on the term “geospatial Information” - every feature on the earth can
be mapped with a unique geospatial co-ordinate using its latitude and longitude.
Using a relational data structure GIS stores attribute data (descriptive and
quantitative) based on its particular set of co-ordinates (Bangbo, 2010). Thus, GIS
software produces a database of linked, spatial (co-ordinate) and attribute
(descriptive) data that can be customised to time, place, and user need.
It is crucial to clarify the difference between GIS applications and GIS analyses.
While GIS applications form the software, GIS analyses are the functions
geographers’ use. A GIS application collects and stores data relationally according to
spatial co-ordinates (Demirci, 2008). A GIS analysis uses the GIS application to
perform specific functions that can solve a problem (Demirci, 2008). The versatility of
GIS enables its use “in other disciplines with a spatial component (i.e., biology,
political science, urban planning, geology and sociology” (Demirci, 2008, p.169).
Teaching Map work in Schools
There is a common misconception that maps only represent spatial information
about geographical concepts such as rivers, cities, or countries. Modern maps offer
visual and graphical representations of any locational data regarding beliefs,
insights, economics, and trends, of events in the world. Thus, maps have taken up

21
an important position across all learning areas in the school curriculum, not specific
to Geography. Due to the diverse uses of GIS, software applications have been
placed firmly within secondary school curricula ranging from “Science, Chemistry,
Biology, Mathematics, Environmental, and Social Sciences along with Geography in
the USA, Canada, and Europe” (Demirci, 2008, p169).
In South Africa, many Geography educators teach map work as a paper-base
application and fail to integrate ICT (Fleischmann, Van der Westhuizen & Cilliers,
2015). The study by Fleischmann, Van der Westhuizen and Cilliers (2015), offers a
possible solution for Geography educators. This study documents a South African
application, a GIS plug-and-play tutor, exploring the move from paper-base mapping
to GIS software. This case study implemented a mixed method approach to examine
both the learners and the educators’ perception to the Interactive GIS Tutor (IGIST).
The study indicated, “IGIST is a feasible option, and fosters a positive GIS attitude
among learners and educators” (Fleischmann, Van der Westhuizen & Cilliers, 2015,
P.23). Although the study showed positive perceptions by educators and learners
towards the IGIST, a significant budget is required to implement the software at a
national level.
2.5 CHALLENGES IN ICT IMPLEMENTATION
Challenges facing educators regarding the effective teaching of map work is their
gap in theoretical knowledge and a lack of ICT resources. Educators also fail to
effectively use ICT mapping applications as an interactive tool to teach map work.
This section will examine the common challenges experienced by FET Geography
educators.
Gap in Theoretical Knowledge
Many educators lack adequate training in map work, especially GIS, evident even
during their tertiary education (Mitchell, Roy, Fritch & Wood, 2018). Added to the

22
challenge are complex GIS software and a lack of ICT resources in schools. The
result is that Geography educators are ill equipped, both theoretically and practically,
to implement GIS in schools. Despite GIS being introduced into the CAPS curriculum
from grade 10 through to grade 12, South African educators have reverted to
teaching GIS from textbooks (Fleischmann, Van der Westhuizen & Cilliers, 2015).
As ICT is becoming progressively more significant in education overall, the need for
specialist GIS educators becomes apparent. At the same time, positions for GIS
personnel are being created in government, administration, environment, and utility
companies. It is disheartening to note that educators trained in GIS are leaving the
schooling profession to fill these positions, as the school environment does not
warrant job gratification (Innes, 2012). GIS teaching will remain problematic due to
the shortages of computer-literate Geography teachers.
Lack of ICT Resources
Schools largely located in South Africa’s “townships areas”, outlying low-income
areas previously designated for non-white residents under apartheid laws,
experience a lack of general resources (Mzuza, Van Der Westhuizen, 2019).
Township schools suffered “from poor conditions, ineffective national examinations,
and exceedingly low teaching standards” (Gluckman, 2016, p.2). Teaching and
learning was hindered decreased due to “libraries are sparsely filled with books,
plumbing systems are improperly constructed and school environments are
unsanitary and unsafe” (Gluckman, 2016, p.2). Many South African schools feel the
need for basic equipment to be met instead of high-end ICT laboratories and GIS
technologies.
Despite significant progression in implementing ICTs through resource provision, up-
skilling educators and enhanced connectivity in schools; numerous problems exist
(Department of Basic Education, 2017). “Lack of curriculum aligned GIS resources,
funds, and educator GIS pedagogical knowledge have been documented as key GIS
23
practice integration challenges. Evidently, GIS development and GIS curriculum
incorporation have outpaced GIS educational research” (Fleischmann, Van der
Westhuizen & Cilliers, 2015; Hong & Stonier, 2015). Lack of appropriate ICT
resources remains a major challenge across many schools in South Africa.
Educators are confronted with the additional challenge of designing appropriate
learning interventions within the blended classroom. Many learners are ill equipped
with key computing skills due to inadequate exposure to essential ICT application in
the classroom. Crucial to blended learning is integrating computer literacy skills into
the curriculum for e-learning. However learner skills demands are shifting from basic
computer literacy skills to higher order problem-solving and entrepreneurial skills.
ICT as a Teaching Aid vs ICT as an Interactive Tool
A major challenge that occurs with ICT implementation that often goes unnoticed in
educational systems is the difference between ICT as a teaching aid and ICT as an
interactive tool. In the same sense, when transposing this to GIS education, it can be
compared to “teaching with GIS” and “teaching about GIS” (Demirci, 2008). The
purpose of “teaching with GIS” is enabling learners to study spatial skills with the aid
of GIS software. The purpose of “teaching about GIS” is primarily to teach GIS terms
and functions. “The overall opinion among the educators about the type of use of
GIS in geographic education focuses on Teaching with GIS” (Demirci, 2008, p.170).
However, Johansson (2003) has stressed the importance of returning to “teaching
about GIS” to enable learners’ theoretical understanding of the software.
Many South African schools fail to implement GIS as an interactive tool. Low
adoption rates have been attributed to a lack of, resources such as the appropriate
hardware, software and data; teacher training and curriculum approved materials,
and; time for teachers to use GIS in a content-heavy curriculum (Demirci, 2008). It
seems that challenges in implementing ICT for map work remain interconnected and
continuously lead back to each other.

24
Additionally, GIS software is “not designed for a teaching / learning function and
does not offer obvious opportunities for teaching / learning to many educators and
are not appropriate for use in schools” (Demirci, 2008, p.170). The software is highly
technical and forms a challenge for educators to learn, let alone master it and be
able to prepare lessons and use it for teaching. As a result, educators teach GIS by
means of a “paper GIS” and not by means of interactive software.
2.6 POSSIBLE SOLUTIONS FOR ICT IMPLEMENTATION
Within the new ICT school environment, educators have to reconceptualise the
pedagogical methods to construct an interactive approach to learning. The 21st
Century classroom enables learners to explore learning material using ICT. This
section draws on solutions from the TPACK framework for teaching map work skills
in Geography. The literature focuses on the intersection of technological knowledge
and pedagogical knowledge of Geography educators from recent publications.
TPACK for Geography Teaching
Despite the availability of ICT in the Geography classroom, the TPACK model
appears disconnected, as educators do not effectively merge their technological
knowledge of ICT and pedagogical knowledge of teaching GIS in an interactive
manner (Fleischmann, Van der Westhuizen, & Cilliers, 2015). Educators cautiously
approach the change from paper-based learning to investigating the world by means
of GIS interactive software and thus present a lower adoption rate of ICT as
compared to other subjects (Hong & Stonier, 2015). Demirci (2008) and Curtis.
(2019) states that the aim of “teaching with GIS” is to enable the learner to gain
geographical skills and knowledge regarding mapping. In using ICT, learning takes
on an active role in interpreting “geographical information on real-world issues and
collectively builds up knowledge through inquiry and reflection” (Johansson, 2003).
Incorporating the TPACK model into teaching allows for an interaction between the
forms of knowledge, creating an interactive GIS experience.

25
Educator Training Programmes
Available workshops and training courses for educators in ICT are aimed at
improving the ICT competencies and not pedagogical approaches to teaching. The
educator, although newly skilled in ICT literacies, continues to use the old
pedagogies for traditional classrooms, thus remaining ineffective. Educators need to
be up-skilled in pedagogical practices to include 21st Century pedagogies.
Added to the challenges is the demand for quality assurance amongst stakeholders
to ensure that workshops and courses hold substance and value to the educator,
subject content, and ICT tools to ensure a holistic approach to educator training
(Koehler, & Mishra, 2009). Educator training programmes should be structured to
integrate pedagogical practices and promote diversity in the community (Mitchell,
Roy, Fritch & Wood, 2018). Furthermore, such education programmes should
contribute towards the Continuing Professional Teacher Development (CPTD)
system, system launch by the South African Council of Educators (SACE) to
encourage educators to expand their knowledge and skills.
Blended Learning Approach
“GIS may foster a resource rich environment, enhance spatial reasoning and support
problem solving in the classroom” (Johansson, 2003, p.2). In addition to the
implementation of a GIS application system, paper-based resources can be used as
a means of instruction. By moving from concrete paper-based maps towards more
abstract GIS application systems, geographic competence and interdisciplinary
learning will be promoted (Johansson, 2003). This pedagogical approach of blending
traditional teaching methods with e-learning produces a blended approach (Chew,
Jones & Turner, 2008). As depicted in Figure 5, blended learning is not presented
as a standard model for learning, but as an adjustable model with several degrees of
blended learning (Chew, Jones & Turner, 2008). Blended learning exist as various
degrees of blending between available technology and traditional learning to suit the
learner and learning environment. The blended classroom can easily be adapted to
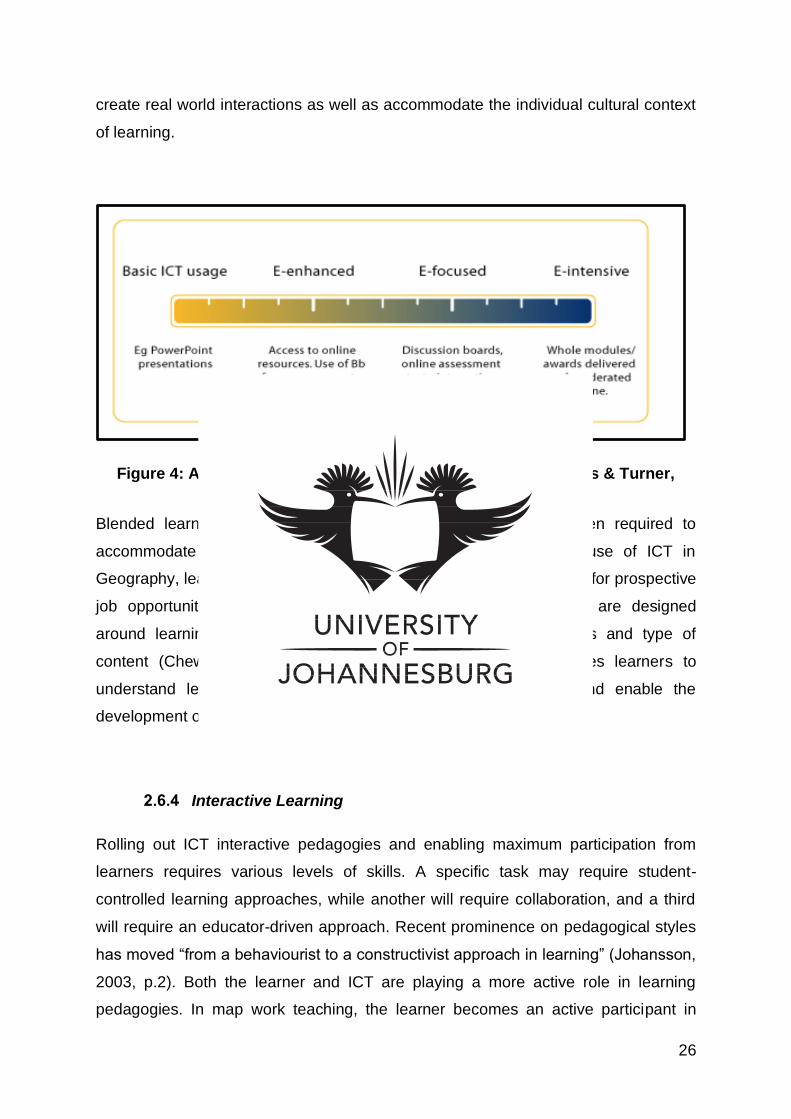
26
create real world interactions as well as accommodate the individual cultural context
of learning.
Figure 4: A Continuum Blended Learning (Source: Chew, Jones & Turner, 2008, p.46)
Blended learning, as a mixture of pedagogical techniques is often required to
accommodate the learner and the content. Comparable to the use of ICT in
Geography, learner experience and technical expertise are beneficial for prospective
job opportunities (Johansson, 2003). Rich learning environments are designed
around learning objectives, target audiences, access to resources and type of
content (Chew, Jones, & Turner, 2008). The use of ICT enables learners to
understand learning content in relation to the world of work and enable the
development of 21st Century skills (Moore, Dickson & Galyen, 2011).
Interactive Learning
Rolling out ICT interactive pedagogies and enabling maximum participation from
learners requires various levels of skills. A specific task may require student-
controlled learning approaches, while another will require collaboration, and a third
will require an educator-driven approach. Recent prominence on pedagogical styles
has moved “from a behaviourist to a constructivist approach in learning” (Johansson,
2003, p.2). Both the learner and ICT are playing a more active role in learning
pedagogies. In map work teaching, the learner becomes an active participant in

27
spatial learning through group activities and GIS software usage. Learners construct
knowledge on real world issues and concepts collectively through investigative
learning and reflection. Similarly, educator roles are evolving to become a means of
motivation and support to learning. In a well-resourced environment, geography
learners use maps, globes, the internet, textbooks, and GIS software towards their
own learning experiences.
An interactive learning approach can be adopted for practice in learning map work.
The implementation of GIS as an interactive medium of instruction may promote
geographic proficiency in spatial and analytical skills (Johansson, 2003). Additionally
with the interactive use of ICT in education, GIS will provide learners with technical
skills for future job opportunities and promote learners into entering careers of
science, geology, marine studies and engineering (Johansson, 2003).
2.7 SUMMARY
In conclusion, chapter 2 provided a review of the literature supporting this research.
The literature concentrates on the following areas:
• The Process Towards a Democratic Geography Education
• Theoretical Framework: An Overview of TPACK
• Reconceptualising Modern Mapping in Geography
• Challenges in ICT Implementation
• Possible Solutions for ICT Implementation
The subsequent chapter will provide clarity on the research design and methodology.

28
CHAPTER 3. RESEARCH DESIGN AND METHODOLOGY
___________________________________________________________________
“Previously unknown relationships and variables can be expected to emerge
from case studies leading to a rethinking of the phenomenon being studied.”
(Stake, 1981, p.47)
___________________________________________________________________
3.1 INTRODUCTION
This chapter examines the selection and relevance of the research design and the
methodology. This research adopted a case study design with a qualitative
approach. The research methodology gives a comprehensive explanation of the data
collection, data recording, and data analysis. Also included in this chapter are the
ethical considerations and a brief description of the participants.
3.2 RESEARCH DESIGN
A research design is referred to as “a plan or blueprint” outlining the research project
to be conducted (Mouton, 2001). Emerging researchers predominantly use case
study research design, despite it not having authentic status as a social science
research strategy (Yin, 2002). The following three prominent designs attempt to
provide structure through their respective books: Robert K. Yin's Case Study
Research: Design and Methods (2002); Sharan B. Merriam's Qualitative Research
and Case Study Applications in Education (1998); and Robert E. Stake's The Art of
Case Study Research (1995). Yin seeks to gather data, both qualitative and
quantitative, whereas Merriam and Stake use a predominantly qualitative approach
towards the case study (Yazan, 2015).

29
Qualitative Research Designs
This research adopted a qualitative case study design as a research and reporting
method. A qualitative case study uses an approach to research enabling exploration
of the phenomenon within its natural environment using a variety of data sources. A
qualitative researcher uses a theoretical lens to study the way people interpret and
make sense of their lives in the world they live in. Strauss and Myburgh (2015). This
research ensures that “the issue is not explored through one lens, but rather a
variety of lenses which allows for multiple facets of the phenomenon to be revealed
and understood” (Baxter & Jack, 2008, p. 543). Qualitative approach allows for an in-
depth exploration entailing individual interviews, group interviews, discussions,
observations, document analysis, and projective techniques.
Validating Qualitative Data
The approach to validity is distinctly different between quantitative studies and
qualitative studies. Differing views on data validation exist between researches.
Quantitative validity thrives to judge the quality and accuracy of the data (Yin, 2002),
whereas qualitative validity seeks to ascertain the credibility of the interpretation of
knowledge and is dependant on triangulation (Merriam, 1998; Stake, 1995).
Stake’s approach to validation of data is also based on triangulation (Stake, 1995).
He proposes four strategies towards triangulating data: “data source triangulation,
investigator triangulation, theory triangulation, and methodological triangulation”
(Yazan, 2015, p.146). His apprehension towards encompassing both accuracy and
alternative explanations is elucidated by his words, “In our search for both accuracy
and alternative explanations, we need discipline, we need protocols which do not
depend on mere intuition and good intention to ‘get it right’” (Stake, 1995, p.107).
Merriam concurs with Stake’s notion regarding data validation. However, Merriam
outlines a distinct approach of data validation for qualitative studies. This research
adopts Merriam’s approach to validation as her comprehensive guidelines provide
research organisation for emerging researchers. Validity is verified by adopting

30
Merriam’s six strategies: triangulation, member checks, long-term observation, peer
examination, participatory research, and disclosure of researcher bias (1998).
Preservation of reliability is ensured through: clarification of the researcher’s position
concerning the case, triangulation, and the use of an audit trail (Merriam, 1998).
A Case Study Approach
Case studies are commonly used across a wide scope of specialisations such as
psychology, sociology, political science, social work, and business (Yin, 2002). A
case study is unanimously defined as an intense research strategy, with the purpose
to understand complex phenomena in real-life situations (Merriam, 1998; Stake,
1995; Yin, 2002). A case study design permitted the study of the participants in their
natural environment, thus supporting an understanding of social phenomena through
their interactions and behaviour (Creswell & Clark, 2017; Mays & Pope, 2006). Case
studies allow the researcher to explore the individual cases through complex
interventions, relationships and communities Mills, Harrison, Franklin & Birks, 2017).
Thus a case study design is suitable towards acquiring a detailed account and an in-
depth understanding of FET Geography educators’ perceptions regarding the use of
ICTs in the teaching map work.
Bounded Systems
The research design used in this case study focuses on a “bounded system, under
natural conditions, so that the system can be understood in its own environment”
(Stake, 1995, p.2). A bounded system depicts a case study in which the researcher
set out boundaries to clarify the focus and extent of the research (Yazan, 2015). The
case adopts a “holistic” exploration of the perceptions of FET educators regarding
the use of ICTs in teaching map work Mills, Harrison, Franklin & Birks, 2017). This
methodology has suggested an empirical yet emphatic approach in this study as it
allows an exhaustive analysis into educators’ perceptions regarding the use of ICTs
in the teaching of map work. This methodology provides precise boundaries in which
to study the topic.

31
3.3 POPULATION AND SAMPLING
Population and sampling specifications for qualitative and quantitative studies cannot
be portrayed along the same guidelines (Asiamah, Mensah & Oteng-Abayie, 2017;
Creswell, Hanson, Clark & Morales 2007). Qualitative studies focus “on relatively few
participants who have the ability to describe their experiences and knowledge with
respect to some research questions or phenomenon” (Asiamah, Mensah & Oteng-
Abayie, 2017, p.1608).
Redefining Population
The umbrella term ‘population’ requires clarification in disparities between general
population, target population, and accessible population, for understanding the case
study. Figure 6 assists the researcher to specify the population for this research
(Asiamah, Mensah & Oteng-Abayie, 2017). The first stage is to identify all potential
individuals who are suitable for the research. Common to all individuals is a basic
attribute necessitated by the research topic, i.e. educators. General population refers
to “the largest group of potential participants of a qualitative study” (Asiamah,
Mensah & Oteng-Abayie, 2017, p.1661). The general population is frequently,
collectively recognised and identified by researchers, however it offers little meaning
unless the target and accessible population are elaborated upon. At least one
attribute is common to the participants within the general population. This
characteristic is defined by the research question and goal. This research is limited
to a general population of all Geography FET educators from the Ekurhuleni district.

32
Figure 5: A framework of Population Refinement for Sampling in Qualitative data (Source: Asiamah, Mensah & Oteng-Abayie, 2017, p.1615)
The general population is filtered by precise selection criteria to generate a target
population. The target population determines the most suitable participants for the
case study, considering the depth and quality of information required to address the
qualitative research question (Creswell, Hanson Clark & Morales, 2007; Asiamah,
Mensah, & Oteng-Abayie, 2017). The target population for this research meets the
following criteria: Geography educators using ICT in the classroom. Willingness to
participate in the qualitative study is not consistent for all participants of the target
population. Qualitative case study designs infringe on the participants’ personal time
while conducting interviews (Creswell & Clark, 2017). Willingness to participate and
time infringement may lead to a lower accessible population in qualitative designs as
opposed to quantitative designs. The accessible population is indicative of the

33
participants who have agreed to participate in the research. The accessible
population for this case study was seven participants.
Sampling
From the accessible population a sample can be drawn for this research. Due to the
type of the research focusing on map work teaching, Geography FET educators
have specifically been identified as possible participants. The case constitutes seven
FET Geography educators from the Ekurhuleni North district. Selection of
participating educators was based on their pedagogical knowledge proficiency and
their ICT efficiency. To ensure effective sampling the following information was
obtained from school principals: number of years of teaching experience in
Geography, Geography matric pass rates, use of ICT in teaching and educator
training in map work. Compatible participants were then selected for interviews.
Consistent with a bounded system, research was conducted under natural
environmental conditions (on school premises) to understand the participants within
the environmental context.
3.4 DATA SATURATION
Defining data saturation can be problematic due to the various research designs
(Fusch & Ness, 2015). Data saturation is contextual, and what may be data
saturation for one design is far from saturation for another design. The research
design guiding this research aimed for data saturation explicit to the data. Data
saturation is achieved when there is sufficient data to duplicate the study (O’Reilly &
Parker, 2013). Data saturation occurs when no new additional data is attainable
without duplicating the present data and additional coding is no longer practical
(Fusch & Ness, 2015; Guest, Bunce, & Johnson, 2006). The researcher should
understand the interdependency of new data and new coding (Fusch & Ness, 2015;
O’Reilly & Parker, 2013). When the researcher realises the point of no new data, the
possibility of no new themes to code is most likely (Fusch & Ness, 2015).
34
The number of interviews required to reach data saturation in a qualitative study is
not definite and is dependent on the case itself (Fusch & Ness, 2015). For data
saturation, it is essential to structure interview questions and ask the same questions
to all the participants, and avoid a shift in the research aim amongst the participants
(Guest, Bunce, & Johnson, 2006). While an abundance of a “rich and thick data
description…is the best opportunity to answer the research question” (Fusch & Ness,
2015, p.1413), failure to attain data saturation negatively influences the validity of the
research. For this research, data saturation was realised after coding six interviews.
Through data analysis, it was realised that data was saturated and no new additional
data was attainable without duplicating the existing codes.
3.5 THE PARTICIPANTS
This case study commenced with seven FET Geography schools of the Ekurhuleni
North district. Due to confidentiality and privacy, actual names of the school and
educators are not mentioned and are replaced with pseudonyms. Table 5 offers a
simple referencing list of participating schools with educator and school
pseudonyms. Of the seven participating schools, one participant was unable to
commit to the interview appointment. Due to data saturation being reached with
previous participants, a new interview date was not scheduled. Of the remaining six
schools, five schools had one Geography educator available for the interview and
one school had two Geography educators available. Due to time restraints Mrs
Johnson, Mrs Martin and Mr Robert could not avail themselves for the entire
interview but accommodated to answer a few questions. Thus, seven educators
participated in this study. All seven Geography educators are qualified Geography
educators presently teaching in the D6 District. The population consisted of two male
and five female educators. As the whole population formed the research sample, the
unequal division of male and female participants was deemed as acceptable for the
purpose of the study.
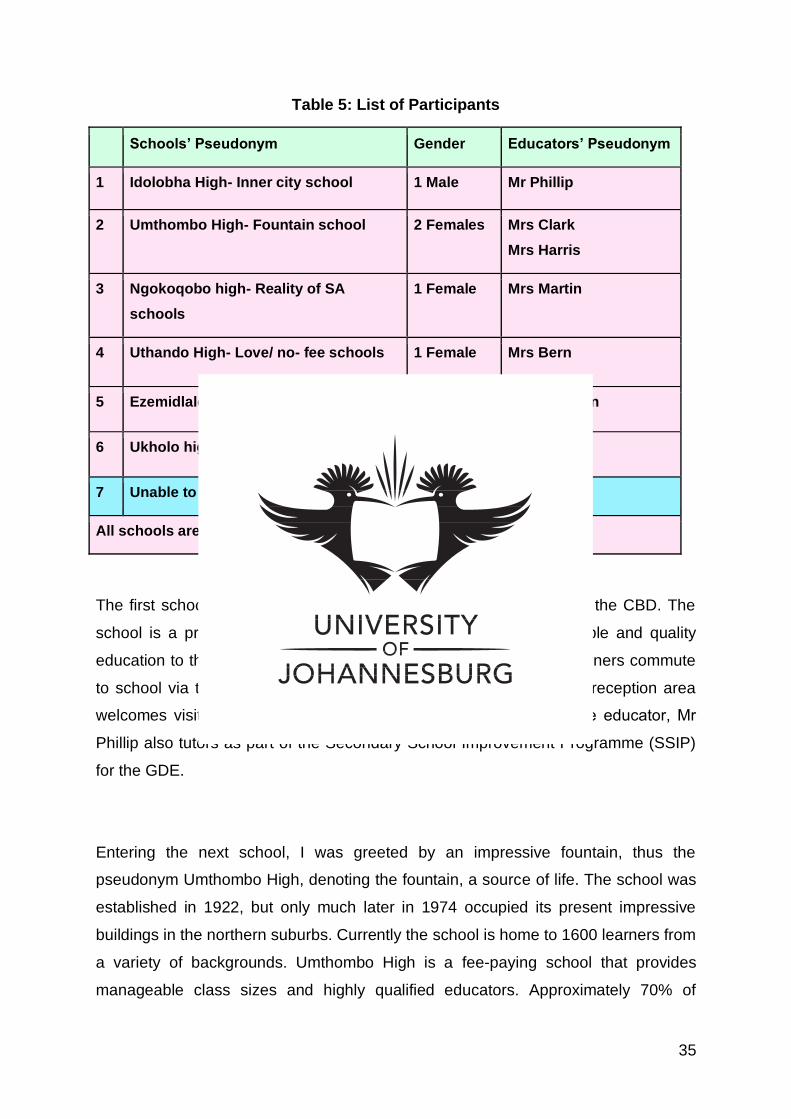
35
Table 5: List of Participants
Schools’ Pseudonym Gender Educators’ Pseudonym
1 Idolobha High- Inner city school 1 Male Mr Phillip
2 Umthombo High- Fountain school 2 Females Mrs Clark
Mrs Harris
3 Ngokoqobo high- Reality of SA
schools
1 Female
Mrs Martin
4 Uthando High- Love/ no- fee schools 1 Female Mrs Bern
5 Ezemidlalo- Athletics school 1 Female Mrs Johnson
6 Ukholo high- Growth in technology 1 Male Mr Robert
7 Unable to meet 1 Female Mrs X
All schools are affiliated to the GDE and followed the CAPS curriculum.
The first school, Idolobha High (Zulu for the city) lies in the heart of the CBD. The
school is a private combined Christian high school offering affordable and quality
education to the community. Being in the heart of the CBD, most learners commute
to school via taxis or walking. Entering from the busy main road, a reception area
welcomes visitors while strictly controlling learners’ movements. The educator, Mr
Phillip also tutors as part of the Secondary School Improvement Programme (SSIP)
for the GDE.
Entering the next school, I was greeted by an impressive fountain, thus the
pseudonym Umthombo High, denoting the fountain, a source of life. The school was
established in 1922, but only much later in 1974 occupied its present impressive
buildings in the northern suburbs. Currently the school is home to 1600 learners from
a variety of backgrounds. Umthombo High is a fee-paying school that provides
manageable class sizes and highly qualified educators. Approximately 70% of

36
learners go on to study at tertiary institutes. The Geography educators, Mrs Clark
and Mrs Harris, both notable experts in their field, shared valuable insights on the
research topic.
The next school is in complete juxtaposition to the previous; Ngokoqobo High
(meaning reality in Zulu) brings the reality of the majority of South African schools to
the forefront. At the intersection of two main roads, the school is situated in a low-
income residential area. Approaching the school, one is met by a security guard and
is led to the office. The school is faced with non-payment of fees, theft, vandalism,
discipline issues and an absence of parent involvement. Despite this, the school
continues to produce notable matric results and boasts a set of long standing staff
members, one of whom is Mrs Martin, the Geography educator.
Uthando High is a no-fee paying school in a low-income suburb, thus fitting the
pseudonym Uthando meaning love in Zulu. The school comprises impoverished
learners from various backgrounds. The scheduled interview coincided with the end
of term school lunch; for many learners it may be their only wholesome meal in a
while. Being a no-fee school the problem persists with learners not able to afford
basic school equipment. The educator, Mrs Bern affirmed that many learners do not
even have calculators for map work. Despite the circumstances, the Geography
class boasts a projector and well-stocked map resources. The newly appointed IT
personnel assist educators with their technological needs.
Visiting Ezemidlalo High, one is astounded by the striking sports facilities
(Ezemidlalo means sports in Zulu). Ezemidlalo High is located in Benoni Central
alongside the schools majestic stadium. The school is an active participant in
swimming, rugby, netball, athletics, hockey, tennis, and chess. Opening its doors to
just 431 learners in 1974, the school has grown to occupy its present premises. Mrs
Johnson, an experienced Geography educator, shared her views and experiences in
teaching map work.

37
Ukholo high, I named emulating the growth (Ukholo) in technology. Ukholo High
opened its doors in 1980 unknowing that it was destined to be placed in the Top 3 of
all districts for the past seven years. The school is proud to have dedicated
educators who have won top teacher awards in various subjects over the years. The
school provides a holistic education in academics, culture, and sports. Ukholo high is
a complete e-learning school from grade 8 to grade 12. All hard copy textbooks have
been replaced with tablets. Learners bring their own tablet to school every day and
purchase ebooks through the school. Mr Robert shared his views and experiences in
teaching map work.
3.6 RESEARCH METHODOLOGY
Research methodology can be defined as the entire procedure followed towards
investigating, analysing, and presenting the findings of the research problem (Collis
& Hussey, 2013). This section explains the data collection, data recording, and data
analysis. Distinct differences emerge when comparing the three methodologies
concerning case study research. A Yin case study design consists of five
components: “a study’s questions; its propositions, if any; its unit(s) of analysis; the
logic linking the data to the propositions; and the criteria for interpreting the findings”
(Yazan, 2015, p.148). Stake proposes a “Flexible design” permitting researchers to
make alterations even once the research design has been selected (Yazan, 2015).
Merriam proposes “Five steps of research design: conducting literature review,
constructing a theoretical framework, identifying a research problem, crafting and
sharpening research questions, and selecting the sample (purposive sampling)”
(Yazan, 2015, p.148). For this research, I adopted aspects from Stake and Merriam’s
approach to qualitative case studies.
Data Collection
Data for this research was collected by means of:
• A review of existing literature
• Individual and group interviews with the participants for explanatory data.

38
Pertinent to data collection is the review of existing literature. A comprehensive
literature review provides both the framework and serves to validate the subsequent
findings (Creswell & Clark, 2017; Marshall & Rossman, 2014). The literature review
guided the structure of the interviews. It is essential to understand the gaps within
the theory to develop the research topic. The interview question is a trajectory from
the theory studied in the literature review.
The interview forms the most important aspect of data collection. In depth interviews
enable the researcher to ascertain the participants’ perceptions of the research
problem through conversations (Cohen & Crabtree, 2006). Depending on the
research topic, the interviews may fluctuate in levels of formality: informal, semi
structured, and structured interviews. For this study, a semi-structured interview
format was used. The choice thereof was to initiate discussion around the topic
without creating a feeling of anxiety for the participants. The pertinent questions are
accessible in Appendix F. In line with a semi-structured interview, I used one broad
question, followed by several predetermined sub questions (Cohen & Crabtree,
2006).
Data Recording
In commencing a research task of this level, it is pertinent to enforce suitable data
recording methods from the preliminary phases. The data recording methods for this
research included:
• Interviews were recorded using the Voice Recorder application on an iPad
device, after requesting permission from the participants. The interview
recordings were then transcribed on an interview template that highlighted
important questions and avoided ‘tangent conversations’ (see Appendix G)
• Transcripts of interviews enabled qualitative analysis using simple content
analysis (Neuman, 2007; Strauss & Myburg, 2015).

39
Data Analysis
Coding qualitative data is a challenging process and some researchers rely on
software, however software is just one tool within the comprehensive coding process
(Neuman, 2014). Observational field notes, video recordings, and open-ended
interviews can be systematised and simplified in a three-step coding method: open,
axial, and selective coding.
Open coding forms the first process of coding. Neuman defines open coding as “The
first coding of qualitative data that examines the data to condense them into
preliminary analytic categories or codes” (Neuman, 2014, p.481). To begin, open
coding the data was studied and assigning labels to the data, thus condensing the
raw data and identified themes. Although a list of themes was identified from earlier
literature reviews, amendments were made to the list. The list assisted in recognising
themes at a glance and finding themes in future coding. The list also helped in
building themes for the study, which were reorganised, sorted, combined, discarded,
or extended for further analysis (Neuman, 2014).
Axial coding is defined as, “A second stage of coding of qualitative data during which
the researcher organizes the codes, links them, and discovers key analytical
categories” (Neuman, 2014, p.482). Open coding focused on identifying themes and
assigning code labels, whereas axial coding elaborated on the connections between
themes. During axial coding, relations were identified through “causes and
consequences, conditions and interactions, strategies and processes” and identified
“categories or concepts that cluster together” (Neuman, 2000, p.423).
Selective coding is defined as, “The last stage in coding qualitative data that
examines previous codes to identify and select data that will support the conceptual
coding categories that were developed” (Neuman, 2014, p.484). During selective
coding the most important themes are identified. Selective coding enables the
researcher to identify the central themes and sub-themes of the research. For

40
selective coding, the axial coded data was scanned to identify the main themes, and
linked the sub-themes in a systematic process.
3.7 ETHICAL CONSIDERATIONS
Conducting interviews in an ethical manner will ensure the validity of the data
collected (Merriam, 2002). Appendix A, the GDE Research Request Form was used
to apply for permission from the GDE to conduct research in selected Gauteng
schools. Upon receiving GDE approval (see appendix B: GDE Research Approval
Letter), contact was made with the participants to set up the interview dates. The
procedure followed for interviews was explained to all participants and all questions
regarding the research were answered. The interview schedule was made available
to all participants, with only one participant opting to view the interview schedule
before the interview.
Upon commencing with each interview the content of the Ethics Clearance
Certificate, as mandated by the University of Johannesburg’s Faculty of Education
was explained to participants. All participants were asked to sign the Informed
Consent forms. The participants were informed that no harm or discomfort would be
associated with their participation in the study. All effort was made to ensure the
participants felt comfortable, calm, and relaxed during the interviews. In no way were
the participants discriminated against or stigmatised regarding their perceptions in
the study. The confidentiality and privacy of all participants was protected throughout
the research. All data captured through written notes and voice recordings were held
in the strictest of confidence, ensuring real names and identity were not used in the
research.
All participants opted to view the results of the research once completed and the
completed study will be emailed to the respective participants. The results of this
study will be advantageous towards recognising the perception of educators towards
using ICT in teaching map work in the curriculum as well as identifying how

41
effectively educators integrate technological knowledge and pedagogical knowledge
when teaching with ICT.
3.8 SUMMARY
In conclusion, this chapter set out to clarify the selection and relevance of the
research design and the methodology. This research espoused a bounded case
study design with a qualitative approach. The research methodology detailed the
data collection, data recording, and data analysis. Also included in this chapter were
the ethical considerations and a brief description of the participants. The resulting
chapter will present the findings from the data collection for the research.
42
CHAPTER 4. FINDINGS
___________________________________________________________________
“The sociologist, then, is someone concerned with understanding society in a
disciplined way. The nature of this discipline is scientific. This means that
what the sociologist finds and says about the social phenomena he studies
occurs within a certain rather strictly defined frame of reference.”
(Berger, An Invitation to Sociology, 1963, p. 16)
___________________________________________________________________
4.1 INTRODUCTION
Chapter 4 present the findings resulting from the data collected for this research
study: Digital trends in mapping: Perceptions of FET Geography educators
regarding the use of ICTs in teaching map work. The case study included seven
participants from six high schools in Ekurhuleni North. The predominant method of
data collection for this research was by means of interviews with the participants
which are included in appendices G to L. Five major themes emerged through the
analysis using the coding method described in Chapter 3. The participants’
perceptions regarding the use of ICTs in teaching map work have been recorded as
themes using the participants’ actual words and may not comply with academic
grammar.
4.2 EDUCATORS’ FIRST EXPERIENCE WITH TECHNOLOGY
In understanding the perceptions of Geography educators, it is essential to
understand how each participant began their journey towards using ICT. This
landmark first experience sets the course for the participants’ journey. Early
experiences with ICT can lead to a positive or negative perception regarding their
use of ICTs in schools. The participants’ first experiences have been grouped
together alongside similar events, to allow for analysis. The following sub-themes are
recurring: educator levels of confidence, lesson preparation and practice, and ICT

43
support from learners. At present only one educator, Mr Robert, teachers in an e-
learning school, and one educator, Mrs Martin, teachers in a school without any ICT
resources for teaching. The remaining five educators use ICT as either a projector or
a smart board to enhance their lessons.
“It was nerve-wracking…”
Mr Robert of Ukholo high, a school fully equipped with the latest ICT resources
shared his first experience using ICT from his own student days:
…it was the use of the OHP [overhead projector] in my 1st year of teaching 18 years ago. It was nerve wracking as I had my lecturer critiquing me as well as a class…
This challenging first experience has empowered Mr Robert to use ICT with ease in
his Geography classroom today. This “nerve-wracking” experience has increased his
confidence levels within his present e-learning school environment. The key to his
ease of ICT usage is ensuring all necessary preparations for lessons are in order:
…I am more confident as I test equipment before the class arrives. We are presently an e-learning school…
Likewise, Mr Phillip, the Geography educator at Idolobha High, in the heart of the
Benoni town, shared his first experience as a student at UNISA (University of South
Africa). Although Mr Phillip encountered a more modern form of ICT as compared to
Mr Roberts’ OHP, both educators’ initial approach was that of a cautious student. Mr
Phillip goes a step further and labels his former self as “computer illiterate” and felt
he needed additional time to practice how to use ICT equipment.
…it was quite difficult, because from high school I used to use paper and pen, no tablets, computers. In 2013 at UNISA, I really faced challenges because I was really computer illiterate. I didn't get enough class time to use technology, although we had labs…

44
Mr Phillip's confidence in ICT has increased and is demonstrated in his after school
role as an Secondary School Improvement Programme (SSIP) tutor. The SSIP is a
learning programme initiative by the Sci-Bono Discovery Centre and the Gauteng
Department of Education aimed at improving grade 12 marks.
“It was very fascinating…”
Mrs Bern has taken the duty to head the Geography department at Uthando, a no-
fee school. She shares her first experience with ICT:
…I had a BlackBerry, at the time we could get the Internet on your phone. It was very fascinating. And we had the BBM. Besides the fact, we could use that little phone for simple searches. It was very exciting for me…
With the launch of smartphones, so began the tension of social etiquette and the use
of cell phones in public spaces. While Mrs Bern admits as educators, “we were not
really encouraged to use our cellphones in class” she uses it occasionally for Internet
searchers. Her early journey toward ICT has increased her confidence in using the
smart boards presently installed at her school:
…we were not really encouraged to use our cell phones in class. Although from time to time I use it for searches, as it was convenient. You also have to remember that the students didn’t have access to phones for a long time. Only in the last two years we got smart boards in class that made our lives so much more easy…
“…that was going back a long time…”
Mrs Harris, the grade 10 Geography educator at Umthombo High reminisces about
her childhood days of playing rented movies as a treat for her birthday party. Similar
to Mr Roberts, she displayed anguish in ensuring the successful use of ICTs in front
of an audience.
…I don't know if you call it technology but I remember, we use to have birthday parties, we use to have films and then we didn't have our own video machine, we use to hire the video machine and the video. We had to connect it to the television and then when your friends came it was always a concern

45
whether it was going to work, because there was no going back…
Mrs Harris presently uses ICT with confidence and enthusiasm in her class,
concurring with Mr Roberts on the importance of preparation and practice of ICT for
lessons.
…I have a positive view of technology and can overcome any anxiety. But I still think it’s very important if I am going to use technology I make sure everything is working properly before hand…
Mrs Clark, the grade 11 and 12 Geography educator, and Mrs Harris’s colleague at
Umthombo High shares a similar experience but differing views. Mrs Clark fondly
remembers her first experience with ICT through her father’s old movie projector.
…my dad had the movie machines and we used to watch movies on the white wall, that was going back a long time…
Mrs Clark did not express much anxiety in her present usage of ICT.
…most of the kids are a lot more okay with technology than what I am and I’m not anxious at all because I know if I don't know they will. And they are very willing to help, so it takes a lot of the anxiety away…
…yes it does, but you know it’s terrible when you built your whole lesson around it and the brightness is too much and they can’t see, but it's most definitely worth it 100% worth it…
On the one hand, Mrs Clark admits how learners would assist with any ICT glitches
“because I know if I don't know they will.” However, she confesses that even though
one may prepare thoroughly, a simple thing like controlling the screen “brightness” of
a projector can have devastating impacts on a lesson. Despite any misgivings, Mrs
Clark validates her appreciation for the use of ICT in her statement, “100% worth it.”

46
“…my everyday lessons…”
Mrs Johnson of Ezemidlalo High describes her experiences using ICT in the class as
“daunting.” While Mrs Johnson did not receive formal ICT training, she ensured
success in ICT lessons through self-education, preparation, and practice sessions at
home, as her words state:
…the introduction and implementation of new technology is always a daunting process. So to overcome this fear, I did a practice session of my lesson at home with the use of PowerPoints, videos and presentations to ensure a smooth run on the day…
Mrs Johnson’s use of ICT has changed from “daunting” experiences to her becoming
a very confident user. She shares Mrs Clark's sentiments of accepting ICT support
from learners “who willingly shared their knowledge.” Mrs Johnson concurs with Mrs
Clark’s appreciation of ICT in her words “this encourages a very positive teaching
and learning experience for all concerned.”
…over time I became very confident using technological resources in my everyday lessons…
…as I often encountered learners who knew far more than me with the use of technology and who willingly shared their knowledge by showing me shorter methods and little tricks they had learnt. I was also never afraid to admit to them lack of knowledge in certain aspects and whenever I needed help, there was always a learner who could assist in the class; this encourages a very positive teaching and learning experience for all concerned…
A general trend is noticeable amongst the participants, of increasing levels of
confidence with the educators’ continual usage of ICT over time. This trend is
noticeable in Mrs Martin as she admits she felt anxious using ICT for the first time.
Her initial ICT experience was a cause of concern, as she mentions:
…I was reluctant to use technology as it was a new experience…
…it has made me more confident, as I am now able to make use of search engines to clarify information and to use uploaded info…

47
Similar to Mrs Bern, Mrs Martin also emphasises her use of “search engines to
clarify information.” The importance of instant access to information through ICT has
enhanced Mrs Martin’s teaching experience despite being in a poorly resourced
school.
4.3 THE USE OF ICT IN TEACHING MAP WORK
The next major theme to emerge is “The use of ICT in teaching map work.” This
theme gives an insight into the participants’ daily Geography teaching. While most
educators use ICT to teach theory related to content in Geography, map work
presents a different standpoint. Each participant has adopted a uniquely different
approach to teaching map work, but common to all participants is their embracing of
pedagogical styles to suit the needs of the learners. A sub theme emerging from
these findings is the argument of paper-based maps versus digital map applications.
“…the traditional way…”
Mrs Bern favours the traditional pedagogical approach to teaching map work and
uses paper-based maps as opposed to digital resources. However, she is somewhat
keen to leave her familiar approach and use ICT in teaching map work. The
assistance of an “IT personnel member” on the staff makes her confident to make
the change. Her choice of words “as soon as I’m equipped” hint once again to the
need for ICT educator training.
…I only know one way of teaching map work - the traditional way. Doing the actual work on the maps. But this year was more of a trial and error, we have an IT personnel that could assist us with the Smart boards. Map work, mmm, I think for some reason, as soon as I’m equipped it will make teaching so much easier. But up until now I don’t think I’m fully equipped to teach map work on the Smart Board...
In comparison, Mrs Martin of Ngokoqobo High prefers the traditional approach to
teaching map work. Mrs Martin’s teaching aids are limited to common maps and
48
atlases. The school lacks ICT resources, thus constraining Mrs Martin from exploring
ICT usage further as she explains:
…topographical and orthophoto maps are used. Teaching aids, such as the chalkboard and atlases are used as the school lacks facilities to teach electronically…
Surprisingly, Mr Robert prefers the traditional method of teaching map work despite
being in an e-learning environment. All educators concur that the use of paper-based
maps enables the learners to develop “spatial skills and visual perception” otherwise
not possible to realise whilst using ICT applications. Although Mr Robert uses ICT in
teaching theory, he emphasises the importance of using the “chalkboard” to show
learners step-by-step processes in calculations that cannot be realised with ICT.
…maps are used once teaching is done using the chalkboard to illustrate formula and examples…
“I begin with a PowerPoint…”
Mrs Johnson uses a blended approach to teaching map work by integrating ICT
presentations and paper-based maps. Her pedagogical approach centres on her
learners’ need to move from a visual representation towards an abstract map. Mrs
Johnson explains her pedagogical style towards ensuring learners understand
complex formulas in map work:
…I begin concepts with a PowerPoint presentation making it easy to show the learners colour images and step-by-step processes. This I find expands their understanding and then I work with actual maps accompanied by questions which we work through together before they attempt questions on their own…
However commendable Mrs Johnson's approach towards integrating ICT in map
work is, she is unable to incorporate map work applications as an interactive ICT tool
due to limited access to curriculum aligned GIS software.
49
Mr Phillip of Idolobha High also uses a blended approach. However, to the contrary,
Mr Phillip's use of ICT is primarily to enhance visual representation of landform
depicted on maps. Analysing paper based-maps enables learners to identify
landforms through reading symbol depictions and contour lines. Mr Phillip explains
learners who have never travelled find it difficult to understand landforms such a
cliffs, coasts, waterfalls or escarpments and depend on PowerPoint presentations for
visual understanding.
…for example in map work calculations, where we calculate the slopes, calculate gradient or where they need to identify the natural feature after calculating the gradient. I can show them if the slope is gentle or steep using the slides…
“…the exam has to cater for paperwork…”
Mrs Harris and Mrs Clark of Umthombo High both adopt a “teach for the test”
approach. This approach to teaching emphasis the test conditions and prepares
learners for tests. The map work exams “cater for paperwork” and Mrs Harris
ensures her pedagogical style caters for paper-based map teaching. Mrs Harris
believes that because map work is a practical subject and requires the acquisition of
spatial skills, learners have to fold out a map and work on it and “to actually get down
and practise the skill we need to practise on a piece of paper.” Mrs Harris explains in
detail her perceptions into map work pedagogical styles:
…in terms of map work I haven’t been able to use the technology much because the way children are going to be tested is on a map. So although I could find ways to teach them using GIS, at the end of the day the exam has to cater for paperwork and therefore [I have] to teach them to be able to cope with the exam using maps. To have a lovely lesson, to have all sorts of digital exercises is all very well but they have to be comfortable with folding out that map, looking in the right place, looking at the great detail on that piece of paper.
I mean I have used these things [ICT] just to show the contours, to show land features, to show 3D, it's great for that. To show the aeroplane taking off taking the photos for the orthophoto. But to actually get down and practise the skill we need to practise on a piece of paper…

50
Mrs Clark concurs with “teaching towards the test” and ensuring learners are well
prepared for the year-end exam to discourage learners from absconding. Mrs Clark’s
strong sentiments flowed from her words:
...for me to say that map work, most teachers don't know how to teach it, when I go and mark [matric] map work papers at the end of the year there are far less map work papers. It is out of 75 [marks] and a lot of them that couldn’t be bothered. And those that do come and write, it’s atrocious. It shows us that even teachers are not teaching it. And in many schools they don't even have maps. And GIS [content] is becoming less and less, and easier. So technology might be going that way but the schools are not capable. And the teachers do not understand it, can not teach it [map work]…
4.4 WEIGHING UP THE PROS AND CONS
Participants’ answers may appear to be contradictory, but answers inevitably turn
towards weighing the pros and the cons of using ICTs for teaching map work.
“…learners would perform better…”
Mr Robert, who uses ICT for theory explanations, agrees that if ICTs were used for
map work, “lessons would be more productive with improved results in
assessments.” However, he also emphasises a need for the traditional approach
when teaching map work. He further mentions “it [ICT] is good but has
disadvantages as well.... learners are aware technology may let them down, like no
battery life to use GPS, hence methods are important too.”
Mrs Martin has limited access to ICT at Ngokoqobo High but if presented with the
ideal teaching environment she would use ICT in her lessons. Mrs Martin’s words
confirm that ICT has the potential to increase learners performance;
…results in map work would increase. They [learners] would find it visually stimulating. They would show more interest in the subject...

51
Mrs Martin has an idealistic visionary approach to a future with ICT and believes it
will be “a hands-on approach.” Unlike Mr Roberts, who at present has access to
teaching map work with ICT but has a “hands-off approach” and prefers using
traditional paper based maps. Nevertheless, Mrs Johnson and Mrs Bern would both
confirm that ICT provides visual stimulation for learners that Mrs Martin hopes to
achieve.
…a computer-based map is a hands-on approach. It will be more visually stimulating for the learners. As an educator, it would enhance the teaching experience…
“…understanding abstract concepts…”
Whether participants used technology or not, there is consensus on the difficulty of
learners understanding abstract concepts. Mrs Harris’s statement clarifies this point
and explains the importance of visual aids in Geography.
…but we tend to forget a lot of our children have never crossed a river, have never stood on a beach and seen waves. It's very difficult to explain wave action to them…
Even the most experienced map work educator can explain contour patterns and
map symbols when analysing maps, but if a learner has never seen a river, beach or
waves the concept becomes increasingly difficult to understand in relation to the map
context.
Mrs Johnson, an avid user of ICT, said learners were excited to attend her lessons
and “an improvement in academics was noted together with a greater understanding
of their work.” Similarly, to Mrs Harris, when teaching map work, Mr Johnson is
concerned regarding his learners’ 3D visualisation of landforms. Mrs Johnson
explained her use of PowerPoint presentations as a visual aid for abstract ideas;
…my learners enjoyed the visuals which enhanced their understanding and abstract concepts now became a familiar idea to grasp…

52
Mr Phillip concurs with Mrs Harris and Mrs Johnson that ICT can be used to visualise
abstract concepts learners find difficulty. Mr Phillip is particularly in favour of “playing
videos” when teaching abstract concepts in map work.
…yes it can enhance learners’ performance, because gradient and slope - those are difficult topics in map work so if we going to use it they going to understand. Even playing videos for them, I’ve played previous Youtube [videos] and it will become easy for them…
However, Mr Phillip affirms in the end learners have to learn how to analyse maps,
determine direction, calculate scale, and interpret land features in the test.
“…we do not practically make them do it anymore…”
Mrs Clark’s statement, “We give a lot more to interpret, we do not practically make
them do it anymore” is perhaps the most important statement under this theme. In
striving to introduce ICT in map work, one has to wonder if cartography and map
reading will eventually become a lost art. Mrs Harris emphasises the importance of
spatial skills and critical thinking in her statement:
..and I do think our educational system takes away critical thinking and takes away the need to think spatially and 3D and Geography is one of the few subjects that ensures that children become adults that can relate to the world three dimensionally and, when if we think we keep making everything just being linear. We robbing children with capabilities that can think 3D…
In introducing ICT in mapping, learners will increasingly rely on map applications to
perform functions such as calculations and analysis. Using ICT for map work will
have adverse effects, according to Mrs Harris. “In my experience the children
actually battle with it more, it doesn’t make it easier.” She further explains that when
teaching GIS, an educator is able to use a map application and “can present it (GIS)
in an exciting way and show them all the links. But to expect all the children to each
have all the ability and capabilities might be a bit too expensive and dangerous.” The
syllabus does not require or cater for such a deep understanding of GIS.

53
Mrs Bern’s response to whether ICT could improve learners’ performance is: “That is
a tricky one, but look with digital teaching, it gives them a more, ... not a narrowed
vision, [but] a 3D 4D vision.” She agrees that ICT enable learners to visualise paper
maps and understand the landscape through a 3D or 4D vision. However, at the
same time she maintains that learners would become reliant on ICT to perform
calculations such as direction, as learners already rely on GPS.
Mrs Clark and Mrs Harris concur on the point that eventually society and learners will
be so reliant on technology to complete tasks and functions that simple calculations
will no longer be necessary to teach at school. Already this is noticeable in
Mathematics. Mrs Harris points out, “It's almost like we used to use log tables to
work out logarithms in maths, and now they are allowed to do it on a calculator.”
Reluctantly, she concludes:
…what’s the point if a map on your phone is going to tell you, you travelling north, or, when will you get there. You will only have a map unless it is to understand the geology or whatever…
“…we don’t have access…”
At Umthombo High, Mrs Clark has limited access to the computer centre to allow her
learners to use GIS applications. She confesses that using GIS software in the
computer centre would enhance learners’ understanding of GIS applications. The
GIS software would enable Mrs Clark to teach GIS using an interactive pedagogical
approach. Due to lack of access to resources, she explains why she has resorted to
using PowerPoint presentations for visual stimulation:
…we do not have access as a school to computers; the computers are for the IT and the CAT [Computer Applications Technology] students. So I cannot if I’m doing GIS I take the students and use a GIS programme to show them point, line, polygons, data layering, buffering, which would really help. We do not have the facilities here. So yes, apart from being able to show what a trig beacon looks like, I can show them lots of pictures but not as a GIS programme. Ya I know many schools that can do it, it's wonderful…

54
Mrs Martin, who teaches at an under resourced public school states, “the school
lacks facilities to teach electronically.” Ngoko Qobo high represents the stark reality
of the majority of South African schools. There are no Smart boards, projectors, or
computer labs that can be used for map work teaching. Although Mrs Martin uses
ICT for her planning and administrative duties at school, she is unable to use ICT in
her teaching. Despite her limited access to ICT, she envisions that in an ideal ICT
situation learners’ performance would increase.
Mrs Harris of Umthombo High shares her concerns “even the resources, it’s looking
after resources.” There exists the challenge of looking after all resources in schools.
She shares her previous teaching experience of using a Computer Applications
Technology (CAT) lab to teach Social Sciences, due to limited classrooms in the
school. She was disheartened because learners vandalised the lab to make space
for their own learning.
…you know if you have a school, and they all write the map work paper exam and you keep the map after the paper. Then should have every year two sets of maps. So why are there no maps? Because people are not able to look after the maps. No that's the problem with technology as well. In my second year, I went into a class. They had computers all nailed down and it use to be for the CAT students. I had grade 8 Geography, they didn’t have any use for it, and they would just break those apart because they needed space on the desk. It was really sad because here was all these computers because over here I had a grade 8 who has to spend most of their year not on that computer, but is just going to use it to hold his cool drink. It's a problem of looking after it, everything gets stolen as well…
Idolobha High does not benefit from “subsidies like public schools” and therefore the
school has a limited budget to spend on ICT resources. Mr Phillip explains how he
finds it difficult to use ICT as often as he would like, but welcomes the exposure to
ICT teaching at the SSIP classes:
…actually I can say that we are an independent school and we don't get subsidies like public schools, so it becomes difficult for us to use technology. But when I go to the SSIP classes that's where I use Smart boards...

55
4.5 ICT AS A TEACHING AID VS. ICT AS AN INTERACTIVE TOOL
While ICT can enhance learners’ performance, the use of GIS software as an
interactive tool will lead towards a deeper understanding of GIS. It was evident
across all participants that ICT was not being used as an interactive tool for teaching
and learning. The main reason for non-adoption of GIS software is the lack of
suitable ICT software and resources to enable interactive teaching.
“…both are of equal value…”
When discussing ICT as a teaching aid vs. ICT as an interactive tool, participants
share differing views. Mrs Johnson is very articulate as she shares her mixed views:
…I think that whether it is used as a teaching aid or interactive tool, it must be first implemented correctly to be successful. Both are of equal value…
Her statement is suggestive of a need for educator knowledge and ICT training and
support. Particularly with regards to map work, educators are not sufficiently trained
to use GIS software in an interactive learning environment.
Mrs Martin admits that as an educator, one has to adapt to change:
…at first [I was] reluctant, as technology cannot replace a human aid, but if it benefits the learners’ teaching experience, as an educator I need to adapt to change…
However, she contemplates that schools are not on par with social changes in
technology. Public schools are increasingly lagging behind in the race for
technology, leaving learners at a disadvantage as they enter the workforce.
Mrs Bern shares her concerns, “We are not that way equipped with computer
centres. I feel that they are disadvantaged not having it.” While Mrs Bern uses ICT

56
as a teaching aid, the school lacks the facilities to use ICT as an interactive tool in
teaching. Learners at Mrs Martin and Mrs Bern’s schools are from lower income
groups and cannot afford their own tablets for school use.
Mr Robert explains all learners at Ukholo high have their own tablets, thus making
interactive teaching possible without a CAT lab:
…it [ICT] is more interactive and learners are fond of it… it enhances learning…
Mr Robert at Ukholo uses ICT as a teaching tool and as an interactive tool. However,
his use of ICT is limited to teaching Geography theory and does not extend into map
work teaching.
Mrs Harris has limited access to opportunities of interactive teaching with ICT at her
present school. However, she vividly reminisces about her relief teaching experience
and the advantages of interactive learning. Learners who experienced learning
difficulties were especially renowned for gaining confidence during GIS interactive
sessions. Mrs Harris describes her experience in detail:
…well when I thought for a little while, just relief teaching at XXX school, they had a computer centre and they let us load a GIS programme. The children were able to do switching on layers and switching off layers and working out where they live and measuring distances from their house to the school an even print that map. It was so good because some of those children had problems with concentration or handwriting might be problematic. But when they do that sort of visualising on the computer, sometimes it's as if they gifted. They have a greater ability to think hypothetically and so on...
Mrs Harris broadens her view on interactive learning that while it would definitely
“stimulate learners and make them comfortable and make them go into that [GIS]
career” they “must still be able to measure with a ruler between a trig beacon and a
spot height.”

57
Mrs Clark uses ICT as a teaching aid but shares an outdoor experience, which
required her learners to download an app on their phones prior to arriving at the
venue.
…I remember wanting to take my grade 11s on a river rafting trip and the man there saying we going to do a map work exercise, get your learners to download this app. So when they get here the app will be on their phones. But you know some kids don't have phones or data. You think it's easy, but not everybody has got access to it. So at the end of the day we worked with paper and pen and photocopied notes. Because everybody had excess to that and that's how we did it. And it did bring home the fact that not everybody can. You know, out there in the field on a cloudy day technology might not be able to help you. Your phone might not be charged and technology might not be able to help you. But a map and a compass will. So yes we are very dependent on it (ICT) but it's also good to know the paper and pen method. There is still value in that…
Mrs Clark’s experience highlights the lack of resources in schools. While it is
common for most teenagers to own a cellphone, many of Mrs Clark’s learners did
not. Added to her challenge was the issue of data - learners who owned phones
could not download the app because data is expensive.
“…just a shallow understanding…”
Mrs Bern draws on an analogy of English literature to explain her changing view of
GIS. For English literature, learners have to read a novel or play as their set work.
Many learners often watch the movie instead of reading the book. Through watching
the movie learners have a visual understanding but with limited comprehension.
Likewise learners in Geography have both paper-based maps and a digital map. The
digital map offers greater understanding but learners are unable to perform in the
practical paper-based exam.
…like even today if you ask a child the GPS, they just Google it, they won’t go to the place and find out where exactly is XXX school, what is the co-ordinates….
Mrs Bern concludes her interview, “The programs calculate for them literally. So
especially now coming to the end of the interview, I do think map work will become a
lost skill.”

58
Mrs Harris shares similar sentiments and believes that with the increased use of
technology learners will have a “shallow understanding of everything” including map
skills. So “if map work will eventually be phased out then it will” by GIS software.
…but if they [DBE] want to phase out paper-based mapping skills, they will. I mean we used to teach kids how to draw a pie chart, how to draw a bar graphs. Now we just teach them how to read it, but they [learners] don't know how because they don't know how it was created. So it just gives you just a shallow understanding of everything. If map work will eventually be phased out then it will…
Mr Phillip concurs with Mrs Bern and Mrs Harris and strongly believes in learners
working on the paper maps. His intense feelings against GIS as an interactive tool
are perhaps that mapping applications will inevitably make “learners lazy.” He affirms
that paper-based maps allow learner to think spatially and build on critical thinking
skills.
…No, I think there’s a lot of work when we are using a paper map. Using a paper map it will take them (learners) a lot of time to check the place, the distance and all that. But when it comes to a technology such as GIS or GPS there will just go it and press the location or maybe using some voice activation and within seconds it will give them that information (location) and it will also give them kilometres as distance and buildings around the place they looking for…
4.6 EDUCATOR TRAINING PROGRAMMES
Educator training programmes are essential to ensure effective use of ICT in
teaching map work as either an interactive tool or as a teaching aid. Educator
training programmes are two-fold: 1) with regards to map work content knowledge
and 2) pedagogical training in ICT and GIS software.
“…perhaps we ourselves are not properly trained…”
Of the seven participants, Mrs Clark, Mrs Bern, Mrs Martin and Mrs Johnson had not
received any GIS training. All four educators completed their educational training
prior to the introduction of GIS courses at tertiary education level. Their GIS
knowledge has been mostly self-taught. Mrs Clark confirms she received no GIS
training with her statement:

59
…No I was very young at university so I did no GIS training. But map work we did back then and it was quite intense as well. We worked a lot more on aerial photographs, I don't remember orthophoto graphs..
Likewise, Mrs Johnson, Mrs Bern and Mrs Martin did not receive any specialised
training at a tertiary education level. Mrs Bern explains, “the level of Geography I did
at varsity was up to primary school. But, I did Geography at matric level. I always
attended workshops to improve my teaching.” Mrs Martin also had basic exposure to
GIS through workshops but not as any specialised training courses.
Mr Phillip was the only participant to receive GIS training at tertiary level during his
initial teaching training. This is perhaps because Mr Phillip is the youngest of the
participants. He briefly explained his courses at UNISA for Geography,
…Yes I did about six (Geography) modules at UNISA. GGH1501, GGH1502, GGH2601, GG 2602, GGH2603. So 2603 I was doing map work online…
Both Mr Robert and Mrs Harris returned to their tertiary studies and completed
courses in GIS. Mr Harris confirms, “Yes – I completed a six-month GIS course and
attended the recent Edu-Tech conference.” This is indicative of self-driven learning.
Mrs Harris also returned to university and completed a course in GIS:
…We use to have pracs [practicals], we use to have to do a lot of statistics in map work. Working out the mean, the median. I went back to university later, so when I got my degree I didn't do any GIS, we still had punch cards then. But later when I went back then I did GIS and I found it very interesting and at least I was very involved in it…
“…I would love to be an expert…”
Despite the trend of lack of training in GIS, there is consensus amongst the
educators for the need for knowledge. Mrs Johnson received no specialised training
in GIS but suggests that educator training would be beneficial, as seen from the
excerpt below:

60
…This [ICT] tool can be realised effectively if the teachers are more than adequately trained to use this method to their advantage. We live in a very technological age where learners often know more than their teachers with regard to implementing new skills, and if teachers can also harness this knowledge, it will create a wonderful avenue for learning and teaching for both the teacher and learner…
Mrs Bern admitted that perhaps “we ourselves are not fully trained to teach.”
Despite challenges, ICT advances are occurring rapidly around the globe, “It's
exciting times ahead, I feel we will just be lagging behind if we don't learn (ICT)
ourselves.” When asked regarding her ideal classroom, Mrs Bern vividly describes
both the perfect teaching environment and the perfect teacher:
…I would love to be an expert on the Smart board and for my learners to also have tablets. So that they could also access additional information, relevant information related to the topics. Yes I would have my globes, a lot of maps and textbooks…
Mrs Martin also accepts the changes in ICT and thinks ahead to an interactive
classroom. It would be a stark disparity from her present learning environment, but
she replies hopefully:
…if it benefits the teaching experience and learners are exposed to different teaching methodology. It can work, however learners need to be exposed, experienced in using computers. If there are adequate resources and training. It would work…
Despite all grievances and misgivings towards ICT, educators understand the need
to move forward into a technologically advanced world and to equip their learners
with the necessary skills.
“…not only that we must be running it…”
As a concluding note, I would like to end this section with Mrs Harris’s words:
…something that worries me a lot, is in the future, I see the first world countries turning third world countries or countries in the south into their data gathering machine. And they would be the ones with the technology, satellites and GIS…. And they say you gather all the data and you send it to us and we will be the clever people and we will draw up all the prediction, reiteration and

61
we will tell you how to face the disasters of your world and I feel it's our duty to keep teaching map work and to teach proper skills so that we stay in charge of managing our world and we don't just hand it over to these supposedly clever people who live on another part of the world. So that is why I would commit to all of this technology. Not only that we must be running it, we mustn’t just be feeding it with data…
Mrs Harris’s final words leave one with much to ponder. Her words support an
evolving perceptions towards integrating ICT in teaching map work. Educators may
seem persistent in maintaining their “paper-based” approach to map work to ensure
spatial development and critical thinking in learners. However Mrs Harris’s
sentiments leave one with the urgency to move on to ICT and begin to not only use
GIS as a software but “we must be running it”- developing the software as well. ICT
has evolved and with the many GIS programmes being used in South Africa, it is not
sufficient to teach learners just how to use the programs. If “paper-based” skills will
become redundant then learners must be equipped with ICT skills to develop
programs and not just be “feeding it with data.” When Geography educators see the
spatial and critical skills from “paper-based” maps transferred into proficient
computing, application, and programming skills, they would embrace ICT in map
work teaching.
4.7 SUMMARY
In conclusion, Chapter 4 set out to present the findings from the data collected for
this research, through the use of interviews. The following themes were examined:
Educators’ first experience with technology, The use of ICT in teaching map work,
Weighing up the pros and cons, ICT as a teaching aid vs. ICT as an interactive tool,
Educator training programmes. Chapter 5, the concluding chapter will present the
summary of the research.

62
CHAPTER 5. SUMMARY, DISCUSSION, RECOMMENDATIONS, CONCLUSIONS AND FINAL WORD
___________________________________________________________________
“One of the assumptions underlying qualitative research is that reality is
holistic, multidimensional, and ever-changing; it is not a single, fixed,
objective phenomenon waiting to be discovered, observed, and measured as
in quantitative research”
(Merriam, 1998, p. 202)
___________________________________________________________________
5.1 INTRODUCTION
This study aimed to explore the perceptions of FET Geography educators regarding
their use of ICTs in teaching map work. This study focused on the integration of
educators’ technological knowledge and pedagogical knowledge in teaching map
work in FET schools. Interviews provided a rich source of data and enabled a deeper
understanding into educators’ use of ICT. All participants expressed overall positivity
towards the research and articulated an interest in the final results of this study.
This study began with an introductory chapter 1, briefly providing an overview of the
research. Chapter 2 discussed the literature pertaining to educators’ usage of ICTs
in teaching map work. The literature review covered four main topics: the history of
Geography education, the TPACK framework, modern mapping in Geography
education and ICT implementation. Chapter 3 encompassed the details of the
research design and methodology. This chapter provided systematic details
regarding sampling, data collection, data recording, and data analysis. This chapter
also included a brief description of the participants and ethical considerations.
Chapter 4 presented the findings that emerged as themes from the data collected.
The findings presented in this study were the result of coding through data analysis.
Chapter 5 discusses the summary and recommendations and concludes the
research.

63
5.2 LIMITATIONS OF THE STUDY
As with most research studies, limitations are present even though the research
design and methodology may be meticulously carried out. The main limitation of this
research is observing and interviewing only seven educators from the Ekurhuleni D6
area. Findings of the study are therefore generalised and exclusive to these seven
schools in the Ekurhuleni district. It is recommended to expand the sample size in
order to include other districts in future studies.
The primary method of data collection was interviews, which could lead to biased
responses due emotional or personal factors affecting the participants (Neuman,
2000). The interview schedule was deliberate in directing conversations towards
examining the educators’ integration of ICT and the pedagogical practices used in
their teachings. Future research can adopt a mixed method research to include
quantitative surveys. This will extend the research area to include a larger sample
size as well as provide the researcher with statistical information on the topic.
This study was conducted across a spectrum of socioeconomically diverse schools
where the digital divide was evident. To research a digitally contextual topic in
schools with inadequate ICT resources alongside e-learning schools would arguably
lead to inconsistent findings. It can further be argued that educator skills and
teaching pedagogies cannot reflect their ICT confidence levels but is inevitably
dictated by their environment. It is recommended that future studies be conducted
with rigorous controls and measures taking the digital divide into consideration.
5.3 CONCLUSIONS EMANATING FROM THE FINDINGS
Chapter 4 presented the findings from the data collected through interviews. The
findings emerged as themes and sub-themes stating the perceptions of educators
towards the use of ICT in teaching map work. This section will present the
conclusions emanating from the findings.
64
Confidence to use ICTs
Through the interviews, all educators reflected a sense of confidence in using ICTs.
Educators were competent in using ICTs within the school for administrative
purposes and lesson planning. All participants except Mrs Martin had access to ICTs
for teaching. Six participants were confident to integrate ICTs in their daily
Geography teaching. The use of projectors as a means of a teaching aid to present
PowerPoint slides was most common. Only two educators were keen on using ICTs
for map work teaching but not as an interactive tool. Learners’ ICT experience in all
schools were limited to PowerPoint presentations and did not involve their interaction
with ICT, mainly due to the lack of access to ICT resources. The lack of integrating
ICT in map work should not be mistaken as a lack of confidence by the educator but
rather as a choice in pedagogical styles dictated by the limited access and exposure
to ICT resources.
Integrating ICT in Map Work
At present only one educator, Mr Robert, teachers in an e-learning school, and one
educator, Mrs Martin, teachers in a school without any ICT resources for teaching.
Surprisingly, both Mr Roberts and Mrs Martin prefer the traditional paper-based
maps to teach map work. The remaining five educators use ICT, either a projector or
a smart board, to enhance their lessons. ICT is used as a teaching aid to assist
learners in visualising abstract and 3D concepts. Although the majority of educators
demonstrated minimal use of ICT in teaching map work, their level of engagement in
the interviews indicated a sufficient depth of theoretical knowledge regarding GIS
concepts and an awareness of integrating GIS in teaching in an ICT resourced
environment. Their foresight into their restricted use of ICT in teaching map work is a
pedagogical choice and due to limited ICT resources.
Educators decline to integrate ICT in teaching map work due to various reasons.
While educators agreed that ICT improved visual understanding of 3D and abstract
ideas, at the same time they felt ICT would reduce learners’ level of spatial

65
understanding. Educators were reluctant to explore new ICT tools for teaching map
work due to time constraints to complete a content-heavy syllabus. Educators
favoured traditional paper-based maps, as they believe the value of ICT is not
beneficial towards preparing learners for the paper-based examination. Lack of ICT
resources and curriculum aligned GIS software further deterred educators from
integrating ICT when teaching map work.
The Great Contradiction
Today GIS has been “listed among the 25 most important developments which have
affected the life of humanity in the 20th century” (Demirci, 2008, p.169). Despite
perceiving the value of GIS and appreciating the influences of GIS towards
technological advancements beyond its geographic compounds, educators are
cautious in integrating GIS in teaching map work. Participants state various reasons
- loss of spatial skills being the most critical. Through using GIS software
applications, educators are of the consensus learners will not be able to think
spatially. GIS programmes will perform the calculations, analyses and simple
functions learners previously constructed on a paper-based map. The findings
revealed that learners were already reliant on Google Maps for co-ordinates and
directions. Map work remains one of the few topics within the curriculum that enables
learners to think critically and spatially.
However, educators do feel the urgency to equip learners with the ICT skills to gain
headway in the workplace. Opportunities for GIS applied occupations is constantly
being created in society, and many learners show an interest in these opportunities.
The realisation in using a GIS programme is that it requires far more intricate skills
than the present paper-based map skills taught at FET level. Using GIS programmes
would ignite learners’ interest in coding, programme developing, data analysis, and
web design, to say the least.
66
Curriculum Aligned Software
Six participants used ICT in their teaching but upon further questioning, it was
realised that ICT was used as a teaching aid and not as an interactive tool. Despite,
GIS progression in the fields of development, business and research (Fleischmann,
Van der Westhuizen & Cilliers, 2015; Hong & Stonier, 2015) there is fewer available
resources for schools. Educators are faced with the challenge to design appropriate
ICT teaching material that seamlessly aligns into existing curriculum. However, the
realisation sets in that GIS ICT resources will remain ineffective unless the need for
an explicit GIS curriculum aligned software is met. The GIS curriculum aligned
software can be implemented across school nationally.
Educator Training Programmes
The findings revealed that all educators are in favour of educator training
programmes. Professional development is recommended at two levels, namely
understanding the ICT devices and understanding the software used. GIS curriculum
aligned software will enhance and support teaching and learning with ICT. Educators
should be encouraged and funded to attend workshops and seminars aiming to
promote, develop, and aid them in teaching with ICT resources and in developing an
interactive use of GIS.
Approved software can be purchased from a number of publishers in South Africa.
The study by Fleischmann, Van der Westhuizen and Cilliers (2015) documents a
South African application, a GIS plug-and-play tutor, which was used effectively in
teaching map work. The study indicated, “IGIST is a feasible option, and fosters a
positive GIS attitude among learners and educators. Future IGIST recommendations
include multiple languages and more exploratory activities” (Fleischmann, Van der
Westhuizen & Cilliers, 2015, p.23).

67
Access to Resources
These findings reveal problematic areas regarding ICT resources and access to
resources for both the educators and learners within the schools studied here. The
lack of ICT resources adversely affects the integration of ICT in teaching map work
and indirectly affects learners’ performance. It was observed that depending on their
budget, schools provided a variety of ICT resources such as smart boards, fixed
projectors, portable projectors and CAT labs. Disappointingly, it was observed the
CAT labs were used predominantly for the CAT classes. Many educators simply
opted not to use ICT due to the lengthy process to set up projectors and screens or
the complicated process of booking the CAT lab.
The proposed improvement of ICT resources for educator usage and the
development of an ICT resource centre at schools will be a very costly initiative. The
school relies heavily on subsidies, sponsorships, or donations as a small percentage
for ICT resources. A short-term solution to this issue is to allow learners to bring their
own devices to school. This will require adjustments to the school’s code of conduct
and additional security initiatives. For long-term solutions to funding, this research
recommends sponsoring the setup of the initial ICT resource centre and continued
upkeep of the ICT resource centre by a public/private enterprise. The sponsorship
strategy has seen enormous benefits and can spiral into mentorship, apprenticeship,
and training programmes with the sponsor. Wi-Fi connectivity could be easily set up
through the available networks that carry affordable options for schools. The school
could also view the option of installing a communication signal tower on its property
to receive income from rentals, which could fund the resource centre and Wi-Fi
connectivity.
Educators’ Knowledge of GIS and its Usability in the Classroom
All educators within this study demonstrated a respectable level of GIS knowledge to
participate in the research. Only Mr Phillip received GIS training during his initial
tertiary education, which he completed through UNISA and benefited from

68
established GIS courses. The remaining six educators did not receive GIS training in
their initial tertiary education; this can be due to the scarcity of GIS courses and
equipment at the time of their studies. Two of the six educators were self-driven to
go back and study a GIS course. The remaining four educators did not receive any
specific GIS training except occasional workshops, leaving much of the content for
self study. Findings concur with Johansson, “There will be a huge demand for GIS
training for in-service Geography teachers” (Johansson, 2003, p.8).
While educators were confident in teaching GIS through a theoretical perspective,
educators lacked familiarity with the practical use of GIS technology and software. All
educators were keen to learn how to use GIS software and allow learners to use GIS
practically in map work lessons. However, educators contemplated the significance
of learning software mapping applications when learners will be tested on paper-
based maps. Two of the participants used the blended approach when teaching map
work, but limited ICT for visual and graphical understanding. The remaining
educators stressed the importance of paper-based mapping teaching and learning
for Geography.
5.4 RECOMMENDATIONS FOR FUTURE STUDIES
This study presents the perceptions of seven FET educators regarding their use of
ICT in teaching map work. The findings identified high levels of ICT confidence in the
educators despite a significant lack of ICT resources. The participants indicated a
need for educator training programmes and curriculum aligned GIS software. Based
on the findings and taking the limitations of this research into account, future
research on this topic is suggested. Recommendations for future research would
include, among others:
• Extend the research population to include additional schools in the area
• Increase the sample size
• Extend the research to schools that integrate ICT in teaching map work
• Include quantitative research to develop a mixed method research

69
• Retest the same sample in a longitudinal study to determine changes in their
attitude
5.5 A FINAL WORD
Geography as a core subject in South African schools has undergone rapid
transformation, especially through the last two decades (Wilmot & Dube, 2015). ICT
and emerging technology have been received with great enthusiasm across South
Africa and within schools. ICT cannot be viewed as the solution to all problems within
the education system, but its positive impact cannot be denied. Amid the challenges
faced, ICT can greatly influence and improve map work teaching and learning. ICT
will enable learners to gain lifelong skills for any socio-economic environment.
Together with the increased allocation and budget allowance for ICT resources in
schools across South Africa, it is imperative to implement educator training
programmes. This will ensure that educators are skilled and knowledgeable on how
to use ICTs in the classroom as an active tool.
While most educators embrace and use ICT to teach theory related content in
Geography, map work presents a different perspective. In teaching map work
educators adhere to traditional “paper-based” maps for teaching. Perhaps educators
seek to find suitable pedagogical practices to effectively integrate ICT in map work
(Baran & Uygun, 2016). All educators concur that the use of paper-based maps
enables the learners to develop “spatial skills and visual perception” otherwise not
possible to realise whilst using ICT applications. Paper-based maps emphasise test
conditions and prepare learners for the test. Traditional pedagogies of analysing a
paper-based map involve spatial skills that enable the learners to develop critical
thinking.
Additional challenges educators face in integrating ICT in map work is the lack of
curriculum aligned software. The map work syllabus does not equip learners with
adequate skills to use GIS software. Available software is too complicated and leads

70
to “a shallow understanding” of map skills. Participating educators are wary of
“paper-based maps” and cartography becoming a lost art. However, if “paper-based”
skills will become redundant then learners must be equipped with ICT skills to
develop programs and not just be “feeding it with data.” When Geography educators
see the spatial and critical skills from “paper based” maps transferred into proficient
computing, application, and programming skills, than perhaps they will embrace ICT
in map work teaching.

71
REFERENCES
Adu, E. O., & Ngibe, N. C. (2014). Continuous Change in Curriculum: South African
Teachers’ Perceptions. Mediterranean Journal of Social Sciences, 5(23), 983.
Asiamah, N., Mensah, H. K., & Oteng-Abayie, E. F. (2017). General, target, and
accessible population: Demystifying the concepts for effective sampling. The
Qualitative Report, 22(6), 1607-1621.
Bangbo, H. (2010). Application of Geographic Information Systems (GIS) in the
History of Cartography. World Academy of Science, Engineering and
Technology. International Journal of Civil and Architectural Engineering, 4(6).
Baran, E., & Uygun, E. (2016). Putting technological, pedagogical, and content
knowledge (TPACK) in action: An integrated TPACK-design-based learning
(DBL) approach. Australasian Journal of Educational Technology, 32(2).
Baxter, P., & Jack, S. (2008). Qualitative Case Study Methodology: Study Design
and Implementation for Novice Researchers . Qualitative Report, 13(4), 544-559.
Berger, P. L. (1963). Invitation to Sociology, reprinted from Invitation to Sociology,
Anchor Books/Doubleday & Company, Inc. Copyright © by Peter L. Berger, 1-24.
www.randomhouse.com
Breetzke, G., Eksteen, S., & Pretorius, E. (2011). Paper-based GIS: A practical
answer to the implementation of GIS education into resource-poor schools in
South Africa. Journal of Geography, 110(4), 148-157.
Chew, E., Jones, N.,& Turner, D. (2008). Critical Review of the Blended Learning
Models Based on Maslow’s and Vygotsky’s Educational Theory. Springer-
Verlag: Berlin, 40-53.
Cohen, D., & Crabtree, B. (2006). Qualitative research guidelines project.
Collis, J., & Hussey, R. (2013). Business research: A practical guide for
undergraduate and postgraduate students. Macmillan International Higher
Education.
Creswell, J. W., & Clark, V. L. P. (2017). Designing and conducting mixed methods
research. Sage publications.

72
Creswell, J. W., Hanson, W. E., Clark, V. L.P, & Morales, A. (2007). Qualitative
research designs: Selection and implementation. The counselling
psychologist, 35(2), 236-264.
Curtis, M. D. (2019) Professional Technologies in Schools: The Role of Pedagogical
Knowledge in Teaching With Geospatial Technologies. Journal of
Geography 118:3, pages 130-142.
De Donatis, M., Alberti, M., Cesarini, C., Menichetti, M., & Susini, S. (2016). Open
source GIS for geological field mapping: research and teaching experience. Peer
J Preprints, 4(1).
Demirci, A. (2008). Evaluating the implementation and effectiveness of GIS-based
application in secondary school Geography lessons. American Journal of
Applied Sciences, 5(3), 169-178.
Department of Basic Education. (2011a). Curriculum and Assessment Policy
Statement Grades 7-9 Social Sciences. Printed By: Government Printing Works.
ISBN: 978-1-4315-0526-5
Department of Basic Education. (2011b). Curriculum and Assessment Policy
Statement Grades 10-12 Geography. Printed By: Government Printing Works.
ISBN: 978-1-4315-0580-7
Department of Basic Education. (2017). Annual Report 2016/2017. Printed By:
Government Printing Works.
Department of Education, (2003). Draft White Paper on e-Education: Transforming
learning and teaching through ICT, Pretoria: Government Printer.
Department of Education. (2002). Revised National Curriculum Statement Grades R-
9 (schools). Gazette No.: 23406, Vol. 443. Printed By: Government Printer.
Department of Education. (2007). Guidelines for Teacher Training and Professional
Development in ICT.
Department of Education. (2008). Learning Programme Guidelines. National
Curriculum Statement. Grade 10-12. Pretoria: Government Printer.
Department of Education. (2008). Subject Assessment Guidelines. Pretoria:
Government Printer.

73
Dilthey, W. (1910). The construction of the historical world of human studies.
Fleischmann, E., Van der Westhuizen, C., & Cilliers, D. (2015). Interactive-GIS-Tutor
(IGIST) integration: Creating a digital space gateway within a textbook-bound
South African Geography class. International Journal of Education and
Development using ICT, 11(2).
Fusch, P. I., & Ness, L. R. (2015). Are we there yet? Data saturation in qualitative
research. The qualitative report, 20(9), 1408-1416.
Gluckman, A. (2016) Realities of South Africa's Post-Apartheid Education System.
Odyssey online https://www.theodysseyonline.com/realities-south-africas-post-
apartheid-education-system
Golightly, A., & Van der Westhuizen, C. P. V. D. (2016). An Assessment of Hybrid
Collaborative Learning in Geography Micro-teaching: A South African Case
Study. International Journal of Educational Sciences, 12(2), 139-154.
Guest, G., Bunce, A., & Johnson, L. (2006). How many interviews are enough? An
experiment with data saturation and variability. Field methods, 18(1), 59-82.
Hong, J. E., & Stonier, F. (2015). GIS in-service teacher training based on
TPACK. Journal of Geography, 114(3), 108-117.
Innes, L. M. (2012). South African school Geography: Underpinning the foundation of
geospatial competence. South African Journal of Geomatics, 1(1), 77-91.
Jansen, J. D. (1998). Curriculum reform in South Africa: A critical analysis of
outcomes based education. Cambridge journal of education, 28(3), 321-331.
Johansson, T. (2003). GIS in Teacher Education-Facilitating GIS Applications in
Secondary School Geography. In Scan GIS (pp. 285-293).
Kerski, J. J. (eds.) International perspectives on teaching and learning with GIS in
secondary schools. New York: Springer.
Koehler, M., & J. Mishra, P. (2006). Technological pedagogical content knowledge: A
framework for teacher knowledge. Teachers college record, 108(6), 1017.
Koehler, M., & Mishra, P. (2009). What is technological pedagogical content
knowledge (TPACK)? Contemporary issues in technology and teacher
education, 9(1), 60-70.

74
Marshall, C., & Rossman, G. B. (2014). Designing qualitative research. Sage
publications.
Mays, N., & Pope, C. (2006). Quality in qualitative health research. Qualitative
research in health care, 82-101.
Merriam, S. B. (1998). Qualitative research and case study applications in education.
San Francisco, CA: Jossey-Bass.
Mills, J., Harrison, H., Franklin, R., & Birks, M. (2017). Case study research:
foundations and methodological orientations. Forum Qualitative Sozialforschung
/ Forum: Qualitative Social Research, 18(1), 1-17. https:// doi.org/10.17169/fqs-
18.1.2655
Mitchell, J.T, Roy, G., Fritch, S., & Wood, B. (2018) GIS professional development
for teachers: lessons learned from high-needs schools, Cartography and
Geographic Information Science, 45:4, 292-
304, DOI: 10.1080/15230406.2017.1421482
Moore, J. L., Dickson-Deane, C., & Galyen, K. (2011). eLearning, online learning,
and distance learning environments: Are they the same? The Internet and
Higher Education, 14(2), 129-135.
Mouton, J. (2001). How to succeed in your master's and doctoral studies: A South
African guide and resource book. Van Schaik.
Mouton, N., Louw, G. P., & Strydom, G. L. (2012). A historical analysis of the post-
apartheid dispensation education in South Africa (1994-2011). The International
Business & Economics Research Journal (Online), 11(11), 1211.
Mzuza, M. K., Van Der Westhuizen, C. O. (2019) Review on the state of GIS
application in secondary schools in the southern African region. South African
Geographical Journal 101:2, pages 175-191.
Neuman, W. L. (2014). Social research methods: Qualitative and quantitative
approaches. Pearson education.
Neuman, W.L. (2000). Social Research Methods: Qualitative and Quantitative
approaches. (4th ed.). Allyn and Bacon
75
Neuman, W.L. (2007). Basics of Social Research: Qualitative and Quantitative
Methods. Pearson/Allyn and Bacon
O’Reilly, M., & Parker, N. (2013). ‘Unsatisfactory Saturation’: a critical exploration of
the notion of saturated sample sizes in qualitative research. Qualitative
research, 13(2), 190-197.
Rosenberg, J. M., & Koehler, M. J. (2015). Context and technological pedagogical
content knowledge (TPACK): A systematic review. Journal of Research on
Technology in Education, 47(3), 186-210.
Saldana, J. (2015). The Coding Manual for Qualitative Researchers. London: SAGE
Publications Inc.
Schmidt, D. A., Baran, E., Thompson, A. D., Mishra, P., Koehler, M. J., & Shin, T. S.
(2009). Technological pedagogical content knowledge (TPACK) the
development and validation of an assessment instrument for preservice
teachers. Journal of Research on Technology in Education, 42(2), 123-149.
http://files.eric.ed.gov/fulltext/EJ868626.pdf
Stake, R. E. (1981). Case study methodology: An epistemological advocacy. Case
study methodology in educational evaluation. Minneapolis: Minnesota Research
and Evaluation Center, 272.
Stake, R. E. (1995). The art of case study research. Thousand Oaks, CA: SAGE
Publications.
Strauss, J., & Myburgh, C. P. H. (2015). Research methodology (Study Guide
81416). Johannesburg: University of Johannesburg.
Thompson A. & Mishra P. (2007) Breaking news: TPCK becomes TPACK! Journal of
Computing in Teacher Education 24, 38–39.
Tshiredo, L. L. (2013). The impact of the curriculum change in the teaching and
learning of science: A case study in under-resourced schools in Vhembe district
(Doctoral dissertation).
Vandeyar, T. (2015). Policy intermediaries and the reform of e-education in South
Africa. British Journal of Educational Technology, 46(2), 344-359.

76
Voogt, J., Fisser, P., Pareja, R.N., Tondeur, J., & Van Braak, J. (2013).
Technological pedagogical content knowledge–a review of the literature. Journal
of computer assisted learning, 29(2), 109-121.
Wilmot, D., & Dube, C. (2015). School Geography in South Africa after two decades
of democracy: teachers' experiences of curriculum change. Geography, 100, 94.
Yazan, B. (2015). Three approaches to case study methods in education: Yin,
Merriam, and Stake. The Qualitative Report, 20(2), 134-152. Retrieved from
http://www.nova.edu/ssss/QR/QR20/2/yazan1.pdf
Yin, R. K. (2002). Case study research: Design and methods. Thousand Oaks, CA:
SAGE Publications. Department of Education (DoE), (2007). Guidelines for
Teacher Training and Professional Development in ICT.
77
APPENDIX A: GDE RESEARCH REQUEST FORM

78

79
80

81

82

83

84
85

86

87
APPENDIX B: GDE RESEARCH APPROVAL LETTER

88

89
APPENDIX C: LETTER TO SCHOOLS
28 August 2018
Dear Sir/Madam
Re: REQUEST TO CONDUCT RESEARCH INTERVIEWS IN YOUR SCHOOL
I am a BEd (ICT) Masters student at the University of Johannesburg. I am currently
writing my Dissertation entitled: Digital trends in modern mapping: Perception of
FET Geography educators regarding the use of ICT’s in the teaching of map
work. The study is undertaken through the supervision of Prof. G Lautenbach,
Faculty of Education, University of Johannesburg.
Your school has been selected as a possible option for the research study.
Participation is voluntary and you may choose not to participate without fear or
penalty. I assure you that neither the names of educators nor the name of the school
will be published in the research report. Upon acceptance of this request, the
comprehensive Ethical Clearance forms will be forwarded. For the research, I intend
to conduct an interview with the Geography FET educators and it should not take
more than 45 minutes. Furthermore, one or two of those teachers could preferably
be a senior member of staff (has been in the service for a long time).
I humbly request you consider my request and I hope to have a favourable response.
Your consideration in this matter will be highly appreciated. If you have any
questions concerning this study, please contact me (contact details below).
Yours sincerely
Tasneem Seedat
083 704 5491

90
APPENDIX D: APPROVAL OF PROPOSAL
Room: B Ring 313 (APK) Cnr Kingsway and University Road Auckland Park • PO Box 524 Auckland Park 2006 • +27 11 559 2280
Auckland Park Bunting Road Campus • Auckland Park Kingsway Campus • Doornfontein Campus • Soweto Campus
12/12/2018
PO Box 30
Alberton
1450
Reference number: 809737227
APPROVAL OF PROPOSAL – MS T SEEDAT (809737227)
Dear Ms T Seedat You first registered for the qualification MEd in ICT in Education (M5ICTQ) in 2017 as a part time student. Your proposal served for notification at the Faculty Higher Degrees Committee meeting on the 26th of November 2018.
Proposed title: Digital trends in mapping: Perceptions of FET geography teachers
regarding the use of ICT in the teaching of mapwork.
Supervisor: Prof G Lautenbach
Should your title change prior to the final submission of the minor dissertation, be advised that a change of title must serve at the Faculty Higher Degrees Committee. Regards Ms B Tshidumo Faculty Officer: Higher Degrees [email protected]

91
APPENDIX E: ETHICS CLEARANCE CERTIFICATE

92
APPENDIX F: INTERVIEW SCHEDULE
Main Question
What is your perceptions regarding the use of ICTs (Information Communication
Technologies), in the teaching of map work?
Sub Questions
1. Let us start at the beginning; can you describe your first experience using
technology? (It may be related to school or not)
2. How has your initial experience affected your use of technology in the
classroom?
3. Can you briefly describe your present teaching style for map work?
4. Mapping in modern society has become increasingly digitized. How do you
feel that as Geography teachers we can increase learners’ interest with
computer-based maps?
5. In an ideal classroom, how would you like to teach map work with a digital
twist?
6. What challenges/barriers prevents you from reaching this ideal classroom?
7. If your ideal classroom was granted, how do you think it will affect learner
performance in map work?
8. How do you feel about using ICTs as a teaching aid vs. ICT as an interactive
learning tool?
9. Do you think map work on a whole needs to be integrated with ICT or just GIS
and why?
10. Are you presently using software or applications specific to teach map work?
11. Did you attend training or instructions in the use of any computer-based map
work applications?

93
12. Have you heard of the concepts ArcGIS and ESRI before? Can you define
and explain them?
13. In your opinion do you feel using specific mapping applications can stimulate
learner interactivness e.g. in GIS.
In conclusion, what is your final perception regarding the use of ICTs in teaching map work?

94
APPENDIX G: INTERVIEW TRANSCRIPT – MR PHILLIP
Date: 25/09/2018
Participant: Mr Phillips
Idolobha High- Inner city school 1. @ Lets start at the beginning; can you describe your first experience using
technology? (It may be related to school or not) 2.
3. # …it was quite difficult, because from high school I used to use paper
and pen, no tablets, computers. In 2013 at UNISA, I really faced
challenges because I was really computer illiterate. I didn't get enough
class time to use technology, although we had labs…
4.
5.
6.
7. @ How has your initial experience affected your use of technology in the
classroom? 8.
9. # I prefer technology than paperwork, especially with teaching
Geography, learners have to see pictures not only imagination. If I'm
explaining co-ordinates, they have to see something on the map. So I
prefer technology to the paperwork, technology makes everything
simple for them rather than using paper based maps. So most of
learners believe in new technology: such as social medias, whatsapp,
facebook as all that. It becomes difficult for them to read, but when we
show them something on a slide, it becomes easy for them to
understand.
10.
11.
12.
13.
14.
15.
16.
17.
18. @ Can you briefly describe your present teaching style for map work?
19. # For example in map work calculations, where we calculate the slopes,
calculate gradient or where they need to identify the natural feature
after calculating the gradient. I can show them if the slope is gentle or
steep using the slides.
20.
21.
22.
23. @ Mapping in modern society has become increasingly digitized. How do
you feel that as Geography teachers we can increase learners’ interest
with computer-based maps?
24.
25.
26. # Yes, they can let me briefly explain something to you. Remember the
components of GIS: people, hardware, software, procedure and data.
They have to gather information first, after the gather information they
27.
28.

95
29. install the software. The GPS, GIS software and the hardware the
phone or the computers the learners can use. And the data the is the
information needed. So we can introduce a GIS software in school.
30.
31.
32. @ If your ideal classroom was granted, how do you think it will affect
learner performance in map work? 33.
34. Yes it can enhance learners’ performance, because gradient and slope
- those are difficult topics in map work so if we going to use it they going
to understand. Even pla
g videos for them, I’ve played previous Youtube [videos] and it will
become easy for them.
35.
36.
37.
38. # I prefer teaching map work in-group discussion; map work has different
types of questions. They need a team in order to understand it.
Especially when I teach calculations, I’ll create about five groups and
give them each topic. The first group I’ll give them gradient, the next
group magnetic declination, true bearing and GIS. I will give 5 questions
per group
39.
40.
41.
42.
43.
44. @ How do you feel about using ICTs as a teaching aid vs. ICT as an
interactive learning tool? 45.
46. # No, I think there’s a lot of work when we are using a paper map. Using
a paper map it will take them (learners) a lot of time to check the place,
the distance and all that. But when it comes to a technology such as
GIS or GPS there will just go it and press the location or maybe using
some voice activation and within seconds it will give them that
information (location) and it will also give them kilometres as distance
and buildings around the place they looking for.
47.
48.
49.
50.
51.
52.
53. @ What are the barriers that you experience in teaching map work
54. # Actually I can say that we are an independent school and we don't get
subsidies like public schools, so it becomes difficult for us to use
technology. But when I go to the SSIP classes that's where I use Smart
boards. [A brief pause] So when it comes to discipline wise, geography
map work is interesting so they don't misbehave, you know something
interesting something practical. Where they (learners) have to use
different instrument such as shoelace, ruler, protractor, different
55.
56.
57.
58.
59.
60.

96
61. equipment so it’s interesting so it becomes more interesting for them.
62. @ So you prefer an interactive approach to map work. I like that style. Did
you attend training or instructions in the use of any computer-based
map work applications, while studying?
63.
64.
65. # Yes I did about six (Geography) modules at UNISA. GGH1501,
GGH1502, GGH2601, GG 2602, GGH2603. So 2603 I was doing map
work online. I prefer using slides (to teach) more than paperwork.
66.
67.
68. @ Have you heard of the concepts ArcGIS and ESRI before? Can you
define and explain them? 69.
70. # No I have not.
71. @ In conclusion, what is your final perception regarding the use of ICTs in
teaching map work? 72.
73. # Technology is making things possible, in our today’s generation. Just
say when you conducting a lesson, you are explaining things from a
textbook to the learners. It becomes difficult for them, and learners are
wasting a lot of time imagining what you are explaining. But when you
have some slides or video playing. It becomes easier what you are
explaining. So in using technology it becomes simple for learners.
Saves a lot of time to recall I mean to understand to read or write.
74.
75.
76.
77.
78.
79.

97
APPENDIX H: INTERVIEW TRANSCRIPT – MRS HARRIS AND MRS CLARK
Date: 25/09/2018
Participant: Mrs Harris (#) and Mrs Clark (%)
Umthombo High- Fountain school 1. @ Let’s start at the beginning; can you describe your first experience using
technology? (It may be related to school or not) 2.
3. # I don't know if you call it technology but I remember, we use to have
birthday parties, we use to have films and then we didn't have our own
video machine, we use to hire the video machine and the video. We
had to connect it to the television and then when your friends came it
was always a concern whether it was going to work, because there was
no going back.
4.
5.
6.
7.
8.
9. % I remember in 1997 leaving South Africa I went overseas to Greece and
I had my first mobile phone, it was those tiny little blue one with the door
open. But previous to that my dad had the movie machines and we
used to watch movies on the white wall, that was going back a long
time.
10.
11.
12.
13.
14. @ How has your initial experience affected your use of technology in the
classroom? Do you, # still experience any anxiousness? 15.
16. # I have a positive view of technology and can overcome any anxiety. But
I still think it’s very important if I am going to use technology I make sure
everything is working properly before hand.
17.
18.
19. % Most of the kids are a lot more okay with technology than what I am and
I’m not anxious at all because I know if I don't know they will. And they
are very willing to help, so it takes a lot of the anxiety away.
20.
21.
22. Yes it does, but you know it’s terrible when you built your whole lesson
around it and the brightness is too much and they can’t see, but it's
most definitely worth it 100% worth it.
23.
24.
25. @ Can you briefly describe your present teaching style for map work?
26. # Well for me it hasn't really, in terms of map work I haven’t been able to
use the technology much because the way children are going to be
tested is on a map. So although I could find ways to teach them using
GIS, at the end of the day the exam has to cater for paperwork and
27.
28.
29.

98
30. therefore [I have] to teach them to be able to cope with the exam using
maps. To have a lovely lesson, to have all sorts of digital exercises is all
very well but they have to be comfortable with folding out that map,
looking in the right place, looking at the great detail on that piece of
paper. [a brief pause]
I mean I have used these things [ICT] just to show the contours, to
show land features, to show 3D, it's great for that. To show the
aeroplane taking off taking the photos for the orthophoto. But to actually
get down and practise the skill we need to practise on a piece of paper
31.
32.
33.
34.
35.
36.
37.
38.
39. % We do not have access as a school to computers; the computers are for
the IT and the CAT [Computer Applications Technology] students. So I
cannot if I’m doing GIS I take the students and use a GIS programme to
show them point, line, polygons, data layering, buffering, which would
really help. We do not have the facilities here. So yes, apart from being
able to show what a trig beacon looks like, I can show them lots of
pictures but not as a GIS programme. Ya I know many schools that can
do it, it's wonderful.
40.
41.
42.
43.
44.
45.
46.
47. @ Your answer moves our discussion towards, using ICTs as a teaching
aid vs. ICT as an interactive learning tool. How do you feel about this. 48.
49. # Well when I thought for a little while, just relief teaching at XXX school,
they had a computer centre and they let us load a GIS programme. The
children were able to do switching on layers and switching off layers
and working out where they live and measuring distances from their
house to the school an even print that map. It was so good because
some of those children had problems with concentration or handwriting
might be problematic. But when they do that sort of visualising on the
computer, sometimes it's as if they gifted. They have a greater ability to
think hypothetically and so on.
So I would definitely want to use it (ICT) as much as possible but then
how, would that benefit those children when they do it on a map? I think
it would be just to stimulate learners and make them comfortable and
make them go into that [GIS] career. But must still be able to measure
with a ruler between a trig beacon and a spot height.
50.
51.
52.
53.
54.
55.
56.
57.
58.
59.
60.
61.
62.

99
63. % I remember wanting to take my grade 11s on a river rafting trip and the
man there saying we going to do a map work exercise, get your
learners to download this app. So when they get here the app will be on
their phones. But you know some kids don't have phones or data. You
think it's easy, but not everybody has got access to it. So at the end of
the day we worked with paper and pen and photocopied notes.
Because everybody had excess to that and that's how we did it. And it
did bring home the fact that not everybody can. You know, out there in
the field on a cloudy day technology might not be able to help you. Your
phone might not be charged and technology might not be able to help
you. But a map and a compass will. So yes we are very dependent on it
(ICT) but it's also good to know the paper and pen method. There is still
value in that.
64.
65.
66.
67.
68.
69.
70.
71.
72.
73.
74.
75.
76. # But we could actually use the interactive ICT for theory where you can
plan a holiday to go around the southern tip of Africa. And find out what
the ocean currents are? What fish you can catch and than they can
learn about the theory exam.
77.
78.
79.
80. @ That sounds fantastic, and learners would be interested in geography
related careers like marine geology for instance? 81.
82. # I think if they think there is money. But we tend to forget a lot of our
children have never crossed a river, have never stood on a beach and
seen waves. It's very difficult to explain wave action to them.
83.
84.
85. % Talking about jobs, next year for the first time we have grouped our
subjects into specifics, so you can’t just take anything you want. They
have been group so they could help university entrances. And we’ve
grouped geography with the sciences, because we feel it is pointless to
take geography without taking maths or physical sciences or life
science because than you can go in the engineering field. So we feel
our numbers will drop, but the quality will definitely increase, because at
the moment we have whoever can’t do anything do geography. And
they don't have the passion and neither the interpreting capabilities
going into explain.
86.
87.
88.
89.
90.
91.
92.
93.
94.
95. @ Did you attend training or instructions in the use of any computer-based

100
96. map work applications?
97. % No I was very young at university so I did no GIS training. But map work
we did back then and it was quite intense as well. We worked a lot more
on aerial photographs, I don't remember orthophoto graphs.
98.
99.
100. # We use to have pracs [practical’s]; we use to have to do a lot of
statistics in map work. Working out the mean, the median. I went back
to university later, so when I got my degree I didn't do any GIS, we still
had punch cards then. But later when I went back then I did GIS and I
found it very interesting and at least I was very involved in it.
101.
102.
103.
104.
105. @ Mapping in modern society has become increasingly digitized. Do you
feel that as Geography teachers we can increase learners’ interest with
computer-based maps?
106.
107.
108. % For me to say that map work, most teachers don't know how to teach it,
when I go and mark [matric] map work papers at the end of the year
there are far less map work papers. It is out of 75 [marks] and a lot of
them that couldn’t be bothered. And those that do come and write, it’s
atrocious. It shows us that even teachers are not teaching it. And in
many schools they don't even have maps. And GIS [content] is
becoming less and less, and easier. So technology might be going that
way but the schools are not capable. And the teachers do not
understand it, can not teach it [map work]…
109.
110.
111.
112.
113.
114.
115.
116.
117. # And the sad thing its (GIS) quiet simple. Even the resources, its looking
after resources. You know if you have a school, and they all write the
map work paper exam and you keep the map after the paper. Then
should have every year two sets of maps. So why are there no maps?
Because people are not able to look after the maps. No that's the
problem with technology as well. In my second year, I went into a class.
They had computers all nailed down and it use to be for the CAT
students. I had grade 8 Geography, they didn’t have any use for it, and
they would just break those apart because they needed space on the
desk. It was really sad because here was all these computers because
over here I had a grade 8 who has to spend most of their year not on
that computer, but is just going to use it to hold his cool drink. It's a
118.
119.
120.
121.
122.
123.
124.
125.
126.
127.
128.

101
129. problem of looking after it, everything gets stolen as well.
130. @ What is your opinion regarding the proposed changes made towards
integrating the map work and theory examinations? 131.
132. % I think it's a good think, more learners will write the exam. However, I do
see that a lot more theory is being asked in the map work paper
compared to the actual map skills
133.
134.
135. # But if they [DBE] want to phase out paper-based mapping skills, they
will. I mean we used to teach kids how to draw a pie chart, how to draw
a bar graphs. Now we just teach them how to read it, but they [learners]
don't know how because they don't know how it was created. So it just
gives you just a shallow understanding of everything. If map work will
eventually be phased out then it will. It’s almost like we used to use log
tables to work out logarithms in maths, and now they are allowed to do
it on a calculator.
136.
137.
138.
139.
140.
141.
142.
143. @ Do you think changes in the map work syllabus have reduced spatial
and critical thinking skills? 144.
145. % We give a lot more to interpret, we do not practically make them do it
anymore 146.
147. # And I do think our educational system takes away critical thinking and
takes away the need to think spatially and 3D and Geography is one of
the few subjects that ensures that children become adults that can
relate to the world three dimensionally and, when if we think we keep
making everything just being linear. We robbing children with
capabilities that can think 3D. We making the world so boring that they
can’t retain.
148.
149.
150.
151.
152.
153.
154. % I also feel that, South Africa has a vast coastline and I really feel coastal
Geography should be brought right back into the syllabus in a big ways
and you know map work I'm sure there is a practical application around
the coastline. I love mapwork, but I keep on seeing the same questions
coming up again and again. I just think it needs to be freshen up.
Gradient, magnetic declination, it's the same same questions, we need
to bring something fresh, new in. I like the way the exam is going to be
changed, I think its good its going to be like that. But I’d like a rehaul a
155.
156.
157.
158.
159.
160.
161.
102
162. relook at it. I think we have the same people we have setting the
papers,163.
164. @ If your ideal classroom was granted, how do you think it will affect
learner performance in map work?165.
166. I like that idea that it has to be integrated, but in my experience the
children actually battle with it more, it doesn’t make it easier. Say if we
learnt submerged coastline in theory and I say look at the maps, all
these inlets are evidence of a submerged coastline. We learnt that in
the theory, its not that easier for they like it when they have to just work
out the gradient or distance. Otherwise what’s the point of a map your
phone is going to tell you, you travelling north, or, when will you get
there. You will only have a map unless it is to understand the geology or
whatever.
167.
168.
169.
170.
171.
172.
173.
174.
175. % For me everything you teach in theory you have to bring in a map, it
mustn’t be separated. I know we don't all do it like that. I mean when
you doing climate take a map of Paarl and bring up adiabatic winds.
176.
177.
178. # But that's also nice for the teacher if the teacher has all the technology
than you can use GIS, the teacher can say here is the excel sheet that's
got the population, and how many are farmers and how many are
factory workers. And here’s the map and think to that here is the
climatology table than you as a teacher can present it in an exciting way
and show them all the links. But to expect all the children to each have
all that ability and capabilities might be a bit too expensive and
dangerous.
179.
180.
181.
182.
183.
184.
185.
186. % Its too much hard work for a teacher as well sometimes, so teachers
don't bother.187.
188. @ In conclusion, what is your final perception regarding the use of ICTs in
teaching map work?189.
190. # Something that worries me a lot, is in the future, I see the first world
countries turning third world countries or countries in the south into their
data gathering machine. And they would be the ones with the
technology, satellites and GIS…. And they say you gather all the data
191.
192.
193.

103
194. and you send it to us and we will be the clever people and we will draw
up all the prediction, reiteration and we will tell you how to face the
disasters of your world and I feel it's our duty to keep teaching map
work and to teach proper skills so that we stay in charge of managing
our world and we don't just hand it over to these supposedly clever
people who live on another part of the world. So that is why I would
commit to all of this technology. Not only that we must be running it, we
mustn’t just be feeding it with data.
So I hope that answers all your questions
195.
196.
197.
198.
199.
200.
201.
202.
203. @ Yes, you answers have definitely shed insight on my topic. Well thank
you ladies, for your time and patience. 204.

104
APPENDIX I: INTERVIEW TRANSCRIPT – MRS MARTIN
Date: 25/09/2018
Participant: Mrs Martin
Ngokoqobo High- Reality of SA schools
1. @ Let’s start at the beginning; can you describe your first experience using
technology? (It may be related to school or not) 2.
3. # Firstly, I was reluctant to use technology as it was a new experience.
4. @ How has your initial experience affected your use of technology in the
classroom? 5.
6. # It has made me more confident, as I am now able to make use of
search engines to clarify information and to use uploaded info. 7.
8. @ Can you briefly describe your present teaching style for map work?
9. # Topographical and orthophoto maps are used. Teaching aids, such as
the chalkboard and atlases are used as the school lacks facilities to
teach electronically.
10.
11.
12. @ Mapping in modern society has become increasingly digitized. How do
you feel that as Geography teachers we can increase learners’ interest
with computer-based maps?
13.
14.
15. # A computer-based map is a hands-on approach. It will be more visually
stimulating for the learners. As an educator, it would enhance the
teaching experience.
16.
17.
18. @ If your ideal classroom was granted, how do you think it will affect
learner performance in map work? 19.
20. # Learners would perform better. Results in map work would increase.
They would find it visually stimulating. They would show more interest in
the subject.
21.
22.
23. @ How do you feel about using ICTs as a teaching aid vs. ICT as an
interactive learning tool? 24.
25. # At first [I was] reluctant, as technology cannot replace a human aid, but
if it benefits the learners’ teaching experience, as an educator I need to 26.

105
27. adapt to change.
28. @
Did you attend training or instructions in the use of any computer-based
map work applications? 29.
30. # No.
31. @ Have you heard of the concepts ArcGIS and ESRI before? Can you
define and explain them? 32.
33. # No.
34. @ In conclusion, what is your final perception regarding the use of ICTs in
teaching map work? 35.
36. # If it benefits the teaching experience and learners are exposed to
different teaching methodology. It can work, however learners need to
be exposed, experienced in using computers. If there are adequate
resources and training. It would work
37.
38.
39.
40. # Thank you
41. . 42.
@ In conclusion, what is your final perception regarding the use of ICTs in
teaching map work?

106
APPENDIX J: INTERVIEW TRANSCRIPT – MRS BERN
Date: 26/09/2018
Participant: Mrs Bern
Uthando High- Love/ no- fee schools 1. @ Let’s start at the beginning; can you describe your first experience using
technology? (It may be related to school or not) 2.
3. # It was the Blackberry phone many years ago, remember we had to use
the cell phones that had different apps. 4.
5. @ Yes the Blackberry I remember
6. # …I had a Blackberry, at the time we could get the Internet on your
phone. It was very fascinating. And we had the BBM. Besides the fact,
we could use that little phone for simple searches. It was very exciting
for me…It was a good experience for me and in fact I learnt a lot.
7.
8.
9.
10. @ How has your initial experience affected your use of technology in the
classroom? 11.
12. # Ammm well not necessarily, …we were not really encouraged to use
our cell phones in class. Although from time to time I use it for
searches, as it was convenient. You also have to remember that the
students didn’t have access to phones for a long time. Only in the last
two years we got smart boards in class that made our lives so much
more easy.
13.
14.
15.
16.
17.
18. @ Can you briefly describe your present teaching style for map work?
19. # I only know one way of teaching map work - the traditional way. Doing
the actual work on the maps. But this year was more of a trial and error,
we have an IT personnel that could assist us with the Smartboards.
Map work, mmm, I think for some reason, as soon as I’m equipped it
will make teaching so much easier. But up until now I don’t think I’m
fully equipped to teach map work on the Smart Board.
20.
21.
22.
23.
24.
25. @ Mapping in modern society has become increasingly digitized. Do you
feel that as Geography teachers we can increase learners’ interest with
computer-based maps?
26.
27.
28. # Definitely the kids don't understand zoning, reasons for settlement in
certain areas - everything is taken today as a political issues. Like the 29.
107
30. land use but if they have that kind of software, they could understand it
effectively. Learners would understand these issues better.31.
32. @ In an ideal classroom, how would you like to teach map work with a
digital twist?33.
34. # I would love to be an expert on the Smart board and for my learners to
also have tablets. So that they could also access additional information,
relevant information related to the topics. Yes I would have my globes,
a lot of maps and textbooks, but time permitting I don’t use them. And
syllabus content is so vast I try to extract information from these
textbooks to support my teaching. Time is also limited, so it would be
nice if I could.
35.
36.
37.
38.
39.
40.
41. @ Do you think map work on a whole needs to be integrated with ICT or
just GIS and why?42.
43. # That would actually answer one of your earlier questions. We are not
that way equipped with computer centres. I feel that they are
disadvantage not having it. They would really be at an advantage if they
could use software to learn GIS. They could do the buffering or data
layering. Where they could not do it them self, mind you with our
Smartboard and like I said trial and error. They were better at
buffering… we did have a few lessons. In identifying spatial areas,
creating new areas, it will obviously improve.
44.
45.
46.
47.
48.
49.
50.
51. @ If you look at our modern world, kids are exposed maps in applications,
like Google maps and touch board maps in shopping center. Do you
think that kind of application should be brought into school?
52.
53.
54. # I don't think it will make them lazy, prior to them having maps on the
phone, co-ordinates was difficult to learn, especially the minutes and
seconds. Now with their phones it is so much easier to understand and
therefore I'm saying it will not make them lazier, it will just benefit them.
55.
56.
57.
58. @ How do you feel about using ICTs as a teaching aid vs. ICT as an
interactive learning tool?59.
60. # They ought to be, because very soon that is the only way they will
operate, in whatever careers they choose. It will also streamline the
career, you know if they more exposed to mmm things. Sometimes a
61.
62.

108
63. practical map, as much as we can make it exciting. It don't catch that
3D effect. You know it’s more interesting and appealing to them. 64.
65. @ Did you attend training or instructions in the use of any computer-based
map work applications? 66.
67. # No I acquired it over the years, because the level of Geography I did at
varsity was up to primary school. But, I did Geography at matric level. I
always attended workshops to improve my teaching. I’ve been for all
the map work course, even on the SSIP training on map work. Look
GIS for some reason it has become difficult with learners, I don't know
why.
68.
69.
70.
71.
72.
73. @ Do you think, maybe it’s the teachers knowledge of integrating ICT in
their teaching? 74.
75. # Yes, perhaps we ourselves are not properly trained in GIS. It's a pretty
a relatively new topic. But in actual fact that (ICT) is what the learners
are working with.
76.
77.
78. @ Have you heard of the concepts ArcGIS and ESRI before? Can you
define and explain them? 79.
80. # No I don't know, what are they?
81. @ Esri's (Environmental Systems Research Institute) is an international
supplier of geographic information system (GIS) software 82.
83. ArcGIS is an Esri product- is a mapping software for geographic
information system (GIS) for Desktops use mainly and consists of an
entire suite of Arc products, of which ArcMap, ArcGlobe, ArcScene,
and ArcCatalog is part of.
84.
85.
86.
87. So both of them are used in South Africa,
88. # Okay at school level?
89. @ You could buy or get a simplified version, “ArcGIS for schools”.
90. @ If we use ICT will learners performance improve, bearing in mind they
tested with pen and paper. 91.
92. # That is a tricky one, but look with digital teaching, it gives them a more,
how can I say, not a narrowed vision, [but] a 3D 4D vision. It’s like the
synoptic maps on news. Previously it was not like that, but now learners
understand it with the graphics. That is very visually appealing even to
93.
94.
95.

109
96. someone not doing geography. You know they get to know the height of
the country, the areas within the country. The fronts coming in, the wind
speed, the weather. You know like seeing a movie, when we have a
play or novel in English they finish seeing a movie, they must remember
it and relate to it and to be able to put it on paper. Here we question
them on practical things, sometimes in English we question on abstract
things. And here its practical maps, they see it, so they can do well. It’s
exciting. You know we have to use both.
97.
98.
99.
100.
101.
102.
103.
104. @ In your opinion do you feel using specific mapping applications can
stimulate learner interactivness e.g. in GIS. 105.
106. # It’s going to be exciting, you see these maps don't have the new
informal settlement, the new macro. With technology, we can show the
new development. Like you know we use GIS for disaster relief. It's a
fundamental to teach map work paper base. This is the foundation,
teaching it digital just becomes an enhancement. However I still feel
they ultimately maybe 10 years from today I don't think they still going
to be using paper maps. I particularly enjoy the map work, analysing the
maps. It will probably like even today if you ask a child the GPS, they
just Google it, they won’t go to the place and find out where exactly is
XXX school, what is the co-ordinates. You know.
107.
108.
109.
110.
111.
112.
113.
114.
115.
116. @ Yes, yes……
117. # Declinations are even calculated for them on apps. Like you see exam
papers have less calculations. The programs calculate for them literally.
So especially now coming to the end of the interview, I do think map
work will become a lost skill. Although I particular like maps I'm am at
the same time looking forward. Maps are too amazing, you reading
brings them to a point of understanding the area.
118.
119.
120.
121.
122.
123. @ In conclusion, what is your final perception regarding the use of ICTs in
teaching map work? 124.
125. # There’s no real answer, I think orthodox teachers like myself will prefer
to start of the paper map. 126.
127. @ And then enhance with ICT?
128. # Maybe, because we ourselves are not fully trained to teach on the

110
129. smart board. I thoroughly enjoy map work and also the success is I
teach the gr 8 and 9 so when they get to FET, its like I thought you this.
It’s exciting times ahead, I feel we will just be lagging behind if we don't
learn (ICT) ourselves.
130.
131.
132.

111
APPENDIX K: INTERVIEW TRANSCRIPT – MRS JOHNSON
Date: 27/09/2018
Participant: Mrs Johnson
Ezemidlalo- Athletics school 1. @ Let’s start at the beginning; can you describe your first experience
using technology? (It may be related to school or not) 2.
3. # The introduction and implementation of new technology is always a
daunting process. So to overcome this fear, I did a practice session
of my lesson at home with the use of PowerPoints, videos and
presentations to ensure a smooth run on the day.
4.
5.
6.
7. @ How has your initial experience affected your use of technology in
the classroom? 8.
9. # Over time I became very confident using technological resources in
my everyday lessons. My learners enjoyed the visuals which
enhanced their understanding and abstract concepts now became a
familiar idea to grasp. The use of these resources encouraged and
fostered a different relationship in the classroom as I often
encountered learners who knew far more than me with the use of
technology and who willingly shared their knowledge by showing me
shorter methods and little tricks they had learnt. I was also never
afraid to admit to them lack of knowledge in certain aspects and
whenever I needed help, there was always a learner who could
assist in the class; this encourages a very positive teaching and
learning experience for all concerned.
10.
11.
12.
13.
14.
15.
16.
17.
18.
19.
20.
21. @ Can you briefly describe your present teaching style for map work?
22. # I begin concepts with a PowerPoint presentation making it easy to
show the learners colour images and step-by-step processes. This I
find expands their understanding and then I work with actual maps
accompanied by questions which we work through together before
they attempt questions on their own.
23.
24.
25.
26.
27. @ Mapping in modern society has become increasingly digitized. How
do you feel that as Geography teachers we can increase learners’ 28.

112
29. interest with computer-based maps?
30. # This is achieved when learners are exposed to the relevance of it,
show the career mapping in this field together with outside speakers
who are currently working in this field.
31.
32.
33. @ If your ideal classroom was granted, how do you think it will affect
learner performance in map work?34.
35. # Learners were excited to attend lessons; an improvement in
academics was noted together with a greater understanding of their
work.
36.
37.
38. @ How do you feel about using ICTs as a teaching aid vs. ICT as an
interactive learning tool?39.
40. # I think that whether it is used as a teaching aid or interactive tool, it
must be first implemented correctly to be successful. Both are of
equal value.
41.
42.
43. @ Did you attend training or instructions in the use of any computer-
based map work applications?44.
45. # No
46. @ Have you heard of the concepts ArcGIS and ESRI before? Can you
define and explain them?47.
48. # No
49. @ In conclusion, what is your final perception regarding the use of
ICTs in teaching map work?50.
51. # This [ICT] tool can be realised effectively if the teachers are more
than adequately trained to use this method to their advantage. We
live in a very technological age where learners often know more
than their teachers with regard to implementing new skills and if
teachers can also harness this knowledge, it will create a wonderful
avenue for learning and teaching for both the teacher and learner.
Hopefully my answers are of some help.
52.
53.
54.
55.
56.
57.
58. @ Yes certainly, your insight give me great insight into your teaching
style and will be of definite value to my research59.
60. # Thank you for allowing me to be part of this process. Please keep
me informed of further research and the outcome of this master’s61.
113
62. research.
63. @ Yes, I will. Thank you once again.

114
APPENDIX L: INTERVIEW TRANSCRIPT – MR ROBERT
Date: 27/09/2018
Participant: Mr Robert
Ukholo high- Growth in technology 1. @ Let’s start at the beginning; can you describe your first experience using
technology? (It may be related to school or not) 2.
3. # It was the use of the OHP [overhead projector] in my 1st year of teaching
18 years ago. It was nerve wracking as I had my lecturer critiquing me
as well as a class.
4.
5.
6. @ How has your initial experience affected your use of technology in the
classroom? 7.
8. # I am more confident as I test equipment before class arrives. We are
presently an e-learning school. 9.
10. @ Can you briefly describe your present teaching style for map work?
11. # Maps are used once teaching is done using the chalkboard to illustrate
formula and examples.12.
13. @ Mapping in modern society has become increasingly digitized. How do
you feel that as Geography teachers we can increase learners’ interest
with computer-based maps?
14.
15.
16. # It [ICT] is good but has disadvantages as well.... learners are aware
technology may let them down, like no battery life to use GPS, hence
methods are important too.
17.
18.
19. @ If your ideal classroom was granted, how do you think it will affect
learner performance in map work?20.
21. # Lessons would be more productive with improved results in
assessments22.
23. @ How do you feel about using ICTs as a teaching aid vs. ICT as an
interactive learning tool?24.
25. # It [ICT] is more interactive and learners are fond of it, it enhances
learning26.
27. @ Did you attend training or instructions in the use of any computer-based
map work applications?28.
29. # Yes – I completed a 6 month GIS course and attended the recent edu-

115
30. tech conference
31. @ Have you heard of the concepts ArcGIS and ESRI before? Can you
define and explain them32.
33. # Heard of them but cannot remember definition or explain - not
concentrated on for syllabus34.
35. @ In conclusion, what is your final perception regarding the use of ICTs in
teaching map work?36.
37. # It is beneficial but time consuming