013 GEOGRAPHY COVERF - Examination Results
73
THE NATIONAL EXAMINATIONS COUNCIL OF TANZANIA CANDIDATES’ ITEM RESPONSE ANALYSIS REPORT FOR THE CERTIFICATE OF SECONDARY EDUCATION EXAMINATION (CSEE) 2019 013 GEOGRAPHY
-
Upload
khangminh22 -
Category
Documents
-
view
1 -
download
0
Transcript of 013 GEOGRAPHY COVERF - Examination Results

THE NATIONAL EXAMINATIONS COUNCIL OF TANZANIA
CANDIDATES’ ITEM RESPONSE ANALYSIS REPORT FOR THE CERTIFICATE OF SECONDARY
EDUCATION EXAMINATION (CSEE) 2019
013 GEOGRAPHY

THE NATIONAL EXAMINATIONS COUNCIL OF TANZANIA
CANDIDATES’ ITEM RESPONSE ANALYSIS REPORT FOR
THE CERTIFICATE OF SECONDARY EDUCATION
EXAMINATION (CSEE) 2019
013 GEOGRAPHY

ii
Published by
The National Examinations Council of Tanzania
P.O. Box 2624
Dar es Salaam, Tanzania
©The National Examinations Council of Tanzania, 2019
All rights reserved.

iii
FOREWORD
The Candidates’ Item Responses Analysis (CIRA) report for Geography subject
on the Certificate of Secondary Education Examination (CSEE) 2019 aimed at
providing feedback to secondary school candidates, teachers, Educational Policy
makers, parents and other Educational stakeholders on the candidates’ performance
and how well the instructional goals and objectives were met.
The Certificate of Secondary Education Examination (CSEE) marks the end of four
years of secondary education. It is a summative evaluation which, among other
things, assesses the effectiveness of general system of education and the mode of
education delivery in Tanzania secondary schools.
In this report, reasons for poor, average and good performance are identified. The
analysis shows that the candidates with good performance provided appropriate
responses. This suggests that they were able to identify the demand of each
question, had enough knowledge on the subject matter, adequate drawing and
mathematical skills as well as proficiency in English Language It was established
that those with low scores lacked such qualities. The analysis of each question has
been done in order to show the strengths and weaknesses of the candidates in
responding to the questions.
The National Examinations Council of Tanzania believes that the feedback provided
in this report will enable the educational administrators, schools managers and
students to identify proper measures to be taken in order to improve candidates’
performance in future examinations administered by the Council.
Finally the Council is grateful to all stakeholders who provided valuable assistance
in the preparation of this report.
Dr. Charles E. Msonde
EXECUTIVE SECRETARY

iv
TABLE OF CONTENTS
FOREWORD ......................................................................................................... iii
1.0 INTRODUCTION ............................................................................................. 1
2.0 ANALYSIS OF THE CANDIDATES’ PERFORMANCE IN EACH
QUESTION ....................................................................................................... 2
2.1 SECTION A: OBJECTIVE QUESTIONS .................................................. 2
2.1.1 Question 1: Multiple Choice Items ................................................................. 2
2.1.2 Question 2: Matching Items............................................................................ 6
2.2 SECTION B: SHORT ANSWERS .............................................................. 8
2.2.1 Question 3: Map Reading and Interpretation .................................................. 8
2.2.2 Question 4: Application of Statistics ............................................................ 18
2.2.3 Question 5: Elementary Surveying and Map Making .................................. 26
2.2.4 Question 6: Introduction to Research ........................................................... 32
2.2.5 Question 7: Photograph Interpretation .......................................................... 38
2.3 SECTION C: ESSAY QUESTIONS ....................................................... 46
2.3.1 Question 8: Solar System.............................................................................. 46
2.3.2 Question 9: Water Management for Economic Development ...................... 51
2.3.3 Question 10: Manufacturing Industries ....................................................... 57
3.0 PERFORMANCE OF THE CANDIDATES IN EACH TOPIC ..................... 65
4.0 CONCLUSION................................................................................................ 65
5.0 RECOMMENDATIONS ................................................................................. 66
Appendix I ............................................................................................................. 67

1
1.0 INTRODUCTION
This report is intended to analyse the candidates’ item response for the Form Four
National Examination in Geography subject for the year 2019. This examination
covered the 2010 syllabus and adhered to 2019 examination format. The paper
consisted of ten (10) questions categorized in three (03) sections A, B, and C. The
candidates were required to attempt all questions from section A and B also to
choose two questions from section C making a total of nine (09) questions.
Section A had two questions, which were constructed from various topics.
Question one consisted of ten multiple choice items and question two consisted of,
five matching items. The candidates were required to choose the correct answer
from the alternatives given. Section B had five short answer questions, which were
constructed from various topics. Section C consisted of three essay questions
which were taken from different topics.
The report aims to give feedback to the stakeholders on the performance of the
candidates in each question by showing what candidates were required to do, the
candidates’ strengths and weakness in responding to the questions. The
performance of the candidates is grouped into three categories: namely good,
average and weak. Scores from 65 – 100 were considered as good performance, 30
– 64 as average and 0 – 29 as weak performance. The samples of the candidates’
responses are inserted as extracts to represent good, average and weak cases.
Graphs and charts are used to summarize the candidates’ performance in
percentage for each question.
In 2019, a total of 432,047 (100%) candidates sat for the Geography examination,
of which 224,138 (53.15%) passed, while 207,909 (46.85%) failed. In 2018 the
total of 359,445 (100%) candidates sat for the Geography examination, of which
189,525 (53.03%) passed and 169,920 (46.97%) failed. This indicates that the
performance rate of the candidates in CSEE for the year 2019 in Geography
subject has increased by 0.12 percent compared to the 2018 results.
Lastly, the report provides the conclusion, recommendation and the appendix
which shows the percentage of the candidates who scored 30 marks and above for
each question. It is expected that the report will be useful to education stakeholders
and it will enable teachers and the students to improve the teaching and learning
process in Geography subject.

2
2.0 ANALYSIS OF THE CANDIDATES’ PERFORMANCE IN EACH
QUESTION
2.1 SECTION A: OBJECTIVE QUESTIONS
2.1.1 Question 1: Multiple Choice Items
The multiple choice items aimed at testing the candidates’ knowledge on
Physical Geography, Mathematical Geography and Human Geography. The
candidates were required to choose correct answer among the five given
alternatives.
The question was attempted by 424,025 (100%) of all the candidates, where by
171,789 (40.5%) scored from 0 to 2 marks, 229,126 (54.1%) scored from 3 to 6
marks and 2,309 (5.4%) scored from 7 to 10 marks. This implies that the
question had average performance because 59.5 percent of the candidates scored
30 marks and above.
The candidates who scored from 7 to 10 marks were knowledgeable on the topics
involved in the multiple choices questions. Those candidates were able to
identify correct responses from the given alternatives.
The candidates who scored from 3 to 6 marks had insufficient knowledge in
understanding the demand of the question. Most of them were able to provide
correct answers for some items but failed in others. This made them to end up
with average performance.
Most of the candidates who scored 0 to 2 marks misconceived the demand of the
question. This suggests that the candidates were not aware of contents tested.
Due to lack of awareness, they failed to distinguish the correct and in correct
answers from the alternatives given. Figure 1 illustrates the performance in this
question.

3
40.5%
54.1%
5.4%
0.0 - 2.0
3.0 - 6.0
7.0 - 10.0
Scores
Figure 1: Trend of the candidates’ performance in question 1.
The following paragraphs aims to provide analysis of candidates’ responses for
each item by starting the requirements of each item. The strengths and
weaknesses of candidates’ responses are also identified and possible reasons for
their poor, average or good performance are provided.
Item (i) required the candidates to identify the layer of the earth’s interior which
is made up of Sima and Sial. The candidates who opted for the correct answer D
lithosphere had sufficient knowledge and skills on the concept of the internal
structure of the earth. The candidates who opted for distractors, C Asthenosphere
and E Barysphere confused sima and sial with other layers of the internal
structure of the earth, especially on the outer layer (crust), the middle layer
(mantle) and the inner layer (core). The candidates who opted for distractors A
Biosphere and B Hydrosphere lacked knowledge on the concept of the internal
structure of the earth as Biosphere means a part of the earth which support life
while Hydrosphere is concerned with water sources of the earth including
oceans, lakes and rivers.
Item (ii) required the candidates to calculate time for Burundi (30° E) when the
goal was scored. The candidates who opted for the correct answer A 2:00 am
indicated that they had good mathematical skills on calculating time. Those who
opted for distracter B 10:00 am, C 4:00 am, D 10:00 pm and E 12:00 am, lacked
mathematical knowledge and skills on how to calculate the time which made
them to choose incorrect options.

4
Item (iii) required the candidates to identify the geological processes occurring in
the area when large amount of soil and rock materials were sliding down wards
the slope. The correct answer was D mass wasting and transportation. The
candidate who opted for this alternative were familiar with the topic of forces
that affect the earth especially on mass wasting and transportation since Mass
wasting is the downward movement of the materials on the slope by the influence
of gravity. This process does not involve transportation agent such as wind, water
or ice. The candidates who chose other alternatives were not familiar with Mass
wasting. Those who chose A Weathering and Erosion were not informed that
weathering does not involve sliding of the materials under the slope, rather it is
the disintegration of the rock materials by either chemical or mechanical
processes while erosion is the removal of the weathered materials by agents of
erosion such as water, wind or ice.
The candidates who chose B Deposition and Transportation misconceived these
terms with mass wasting because deposition is the lying down of the materials of
the earth, which were carried out by the transporting agents like (water, wind or
ice) while transportation is the removal of the eroded materials from one place
to another through water, wind or ice.
The candidates who chose distructors C Weathering and Denudation and E
Erosion and Transportation were not aware that weathering, denudation and
erosion involves the disintegration and removal of the rock materials which are
transported from one place to another through wind, water and ice.
In item (iv) the candidates were required to identify the type of forest which is
found in low temperate areas. The candidates who opted for the correct answer B
“coniferous forest”, revealed good knowledge on the topic of climate. The
candidates who opted for other alternatives A Tropical rain forest, C Equatorial
forest, D Deciduous forest and E Mediterranean forest, had general knowledge
on the topic of climate, but failed to associate it with the type of temperature
found in the regions.
Item (v) required the candidates to identify the general term used to show
seasonal movement of herdsmen with their cattle between lowlands and
highlands in search of water and pasture. The candidates who chose the correct
answer B Transhumance, had sufficient knowledge on the concept of livestock
keeping. The candidates who opted for other alternatives A Pastoralism, C
Nomadic, D Semi nomadic and E Zero grazing had general knowledge on the
livestock keeping but failed to differentiate these terms because they are related.

5
Item (vi) required the candidates to identify the social-economic advantages of
reserved forests to societies. The candidates, who chose the correct answer
Tourism, were knowledgeable on the topic of sustainable use of forest resources
which made them to opt for the correct answer. The candidates who opted for
distractor B Lumbering, had poor knowledge on the concept of reserved forests.
They were not aware that reserved forests are among the tourist attraction and not
for lumbering. The candidates, who chose distractor C Mining, lacked knowledge
on the importance of reserved forest resources. This made them to choose a
wrong alternative mining which involves the extraction of minerals resources on
the earth’s surface. The candidates who opted for destructor D Forestry wrongly
associated reserved forests and forestry which is the science of managing forest
resources for human use. Those who chose E Agriculture, failed to associate
tourist attractions with agricultural activities. These candidates had poor
knowledge on the concept of reserved forests as agriculture involves growing
crops for subsistence and commercial activities while reserved forests is for
tourists attractions.
In item (vii), the candidates were required to identify the best type of soil which
can be mixed with cement for building a house. The correct answer was A Sandy.
Those who picked the correct answer Sandy revealed to have good knowledge
and skills in the topic of the study of soil especially on the uses of it. Those who
opted for other alternatives B silt, D loam” and E clay were aware on the general
types of soil but they were not knowledgeable on the functions of soil types.
Those who opted for distractor C Alkaline, had knowledge on soil pH but not soil
types and their functions.
In item (ix), the candidates were required to identify the best components of
weather to be considered for the growth of crops cultivated on a farm from the
given alternatives. The candidates, who chose the correct answer D temperature
and rainfall, revealed good knowledge on the weather as they were able to
identify the best components of weather to be considered when one wants to
cultivate crops. The candidates who opted for other alternatives A “ Rainfall and
Soil, B moisture and sun shine, C Rainfall and clouds cover and E Humidity and
rainfall demonstrated general knowledge on the concept of weather and its
components, but they were not able to associate the best components of weather
suitable for crop cultivation.
Item (x) required the candidates to identify the type of climate in the area
experiencing seasonal reverse of wind. The candidates, who opted for C Tropical
continental, understood the characteristics of tropical continental climate. Those
who opted for other alternatives were not knowledgeable on the types of climate

6
and natural regions in relation to wind system. The candidates in this category
were not aware of the kind of climatic regions in relation to wind. They failed to
recognize the effect of wind reverse in relation to climate of the region or area
which led them to opt for incorrect alternatives A Tropical maritime, B Tropical
monsoon, D Equatorial monsoon and E Equatorial.
2.1.2 Question 2: Matching Items
This question consisted of 5 matching items which were composed from the
topic of forces that affect the earth. The question required the candidates to
match the descriptions of karst regions in Colum A with corresponding features
in Colum B by writing the letter of the correct answer. This question tested the
candidates knowledge on different features formed as a result of water action in
limestone region.
The question was attempted by 424,021 (100%) candidates. Majority of the
candidates (72.4%) scored from 0 to 1 mark, 108,982 (25.7%) scored average
marks (2 to 3) and very few candidates (1.9%) scored higher marks (4 to 5).
Generally, the candidates’ performance in this question was poor because only
27.6 percent of the candidates were able to score 2 to 5 marks. Figure 2 illustrates
the performance in this question.
Figure 2: Trend of candidates’ performance in question 2.
The candidates who performed well 81,279 (1.9%) in this question had adequate
knowledge on the topic of forces that affect the earth’s surface. They were able
to match correctly most of the features formed as a result of water action in the
limestone region.

7
Item (i) required the candidates to identify the irregular gullies found on the
limestone surface which separate limestone region. The candidates who matched
the correct option F “Grike” had good knowledge on the concept of the features
found on the limestone regions due to the action of moving water. The candidates
who opted for other alternatives A Doline, C Swallow hole, D Polje, E Uvala and
G Gorge had general knowledge on the features formed in karst region, but they
were not able to differentiate these features. The candidates who opted for B
“Clint” had general knowledge on features formed in karst region, but failed to
differentiate between the Clint and Grike, since Clints are ridges of limestone
blocks formed after erosion which they are separated by the gullies called
Grikes. Therefore, those candidates misconceived the two items.
In item (ii), the candidates were required to identify the vertical holes in the
limestone ground through which rain water or river may disappear into the
ground beneath. The candidates who chose the correct answer C swallow hole
had knowledge on the topic of forces that affect the earth, particularly in the
Limestone or Karst region. Other candidates who opted for A Doline, B Clint, D
Polje, E Uvala, F Grike and G Gorge did not recognize the difference between
these features and the swallow hole. Probably, they had little knowledge on the
formation of these features.
Item (iii) required the candidate to identify the round hollow on the surface of a
limestone region. The correct answer was A Doline. The candidates who opted
for the correct answer A Doline were well informed on this part as they were
capable of distinguishing characteristics of the feature named with other features.
Those who opted for other options B Clint, C Swallow hole, D Polje, E Uvala, F
Grike and G Gorge had general knowledge on the distinguishing characteristics
of these features, but they were not knowledgeable on how each feature is
formed, and had little knowledge on the observed characteristics of each feature.
Item (iv) required the candidates to identify the wide depression with a fairly flat
floor in a limestone surface. The correct answer was E Uvala. The candidates
who made the choice of the correct answer Uvala were well informed about the
formation of features in the limestone region and its distinguishing
characteristics. Those who chose the other options had insufficient knowledge on
how these features are formed. The mode of formation of these features confused
them because they somehow resemble one another. Therefore, the candidates
failed to match with the correct answer.
Item (v) required the candidates to identify the largest surface depression found
in limestone region which is formed due to action of solution. The correct answer

8
was D Polje. The candidates who chose the correct answer Polje were
knowledgeable on the different features formed in Karst region. Those who opted
for A Doline, B Clint, C swallow hole, E Uvala, F Grikes and G Gorge, had
general knowledge on the formation of features in limestone region, but they
were not able to differentiate these features by identifying the characteristics of
each feature. This made them to match incorrectly.
2.2 SECTION B: SHORT ANSWERS
2.2.1 Question 3: Map Reading and Interpretation
This question required the candidates to study carefully the map extract of
Mkomazi (sheet 109/1) provided and answer the questions given. The question
had five parts (a-e). In part (a), the candidates were required to measure the
distance of river Pangani in Kilometres from grid reference 910771 to 910826 by
using the given RF Scale. In part (b), the candidates were required to describe
relief of the area where as in part (c), they were required to identify two types of
rocks found in the map, with reasons. In part (d), the candidates were required to
name the major way used to show the height of the land in the mapped area. In
part (e), the candidates were required to draw an annotated cross section from
grid reference 960820 to 910880 and mark Ruvu river basin and the main trucks
by using a vertical scale of 1cm to represent 50m. This question intended to test
the knowledge and skills of the candidates on reading and interpreting
topographical maps.
This question was attempted by 424,025 (100%) candidates. Majority of the
candidates 382,101 (90.1%) scored from 0 to 2.5 marks, of which
181,313(42.8%) scored 0 marks. Further analysis shows that 41,378 (9.8%)
scored average marks (3 to 6.5) and 546 (0.1%) candidates scored high marks (7
to 11). The general performance of the candidates in this question was poor
because 9.9 percent of the candidates scored from 3 to 11 marks, out of 11.
Figure 3 illustrates the performance in this question.

9
Figure 3: Trend of candidates’ performance in question 3.
Most of the candidates who scored from 0 to 2.5 marks failed to understand the
demand of the question. Some of them were unable to provide correct responses
for all parts of the question. The main reason for poor performance was poor
skills on measuring, describing, drawing, calculating, reading and interpreting
topographical maps. The analysis indicates further, these candidates failed to
follow instructions to some parts of the question, hence provided incorrect
responses.
In part (a), the candidates were required to measure the distance of river Pangani
in kilometres from grid reference 910771 to 910826 by using the given RF scale.
In order to get the correct answer, the candidates were required to measure the
length of the river Pangani in centimeter on the map from grid reference 910771
to 910826, and then by using RF scale, they were required to convert it into the
actual ground distance in Kilometres. The main problem was that, some of the
candidates failed to determine the map distance in centimeters, hence fail to
relate map distance with actual ground distance represented by the RF scale. For
example, one candidate who performed poorly measured the length of the river
and obtained 44cm, after converting to RF scale, he/she got 22km. Another
candidate measured the same length and got 16.5cm, after converting to RF scale,
she/he got 8.2km. Furthermore, some of the candidates failed to measure the
length of the river because they were not able to read or to identify the grid
references correctly while others left the part of the question unanswered.

10
Further analysis shows that some of the candidates had poor mathematical skills
on calculating the distance of river Pangani or Ruvu in kilometers. For example,
one candidate measured the length of the river 12.5cm and converted to ground
distance as 12.5 km, while the other measured 18.5cm and got 5.3 after
conversion as the length of the river. This suggests that the candidates had poor
skills in mathematical Geography operations.
It was also noted that, some of the candidates calculated the area of the mapped
area instead of measuring the distance of river Pangani in kilometres from grid
reference 910771 to 910826 by using the given RF scale. For example, one
candidate wrote full squares 2 half squares 5, and then used the procedures for
calculating the area of the irregular shape.
In part (b), the candidates were required to describe relief of the area. But they
failed due to lack of knowledge on map reading and interpretation. For example,
one candidate mentioned features found in the mapped area, such as: the
seasonal swamp, shrubs covered in all parts of the map, rivers, lakes and forest
instead of providing the correct answer which is the relief of the area is a
highland because the contour height on the map ranges from 1500 m in the South
West corner to 1900 m in the North East such height depict that the area is a
highland zone. Another candidate mentioned physical features such as: plain and
plateau while the other explained the drainage pattern such as: there is presence
of dendritic drainage pattern found at Mikocheni at grid reference 915900 and
many rocks.
In part (c), the candidates were required to identify two types of rocks found in
the map and also provide reasons. The candidates provided incorrect answers due
to insufficient interpretation skills. For example, one candidate identified the
types of rocks, as boulder rocks and outcrops rocks, another one described
mountainous rocks and volcanic rocks. Others named the type of rocks, as fold
rocks and metamorphic rocks. These candidates failed to provide reasons for
their answers, the correct answers were:
Igneous rock at North – South centre, because the nature of the mountain range
and its drainage pattern at the centre to the North West corner and eastern part
of mountain range, its tributaries form a shape like a tree with its branches and
Sedimentary rocks to the Eastern part of mountain ranges and Western part
along River Pangani or Ruvu as the steams flowing from the peak of a mountain
at the centre towards the papyrus and seasonal swamps to the east and braided
drainage pattern from the north to the south beneath mountain range all together
indicate the eastern part is a deposition zone hence rock formed at this zone
mostly is sedimentary rock.

11
In part (d), the candidates were required to name the major way used to show the
height of the area. These candidates lacked skills of Map Interpretation as most
of them mixed the methods used to show relief features on Topographical maps
with the way used to show the height of the land in the mapped area. For
example, one candidate identified Bench mark and Spot height while another
wrote Trigonometrical and Hachuring as the main ways used to show the height,
of the land. These responses were incorrect. The correct answer was contour
method.
In part (e), the candidates were required to draw an annotated cross section from
grid reference 960820 to 910880 and mark Ruvu river basin and the main track.
Most of the candidates were not able to draw an annotated cross section. They
failed to determine the height of the area where the cross section was to be drawn
and the scale to be used. This suggests the candidates lacked skills of drawing
cross section. Extract 3.1 represents a sample of the candidate who performed
poorly in this question.

12
Extarct 3:1 A sample of a poor response, from one of the candidates who
performed poorly.

13
In extract 3:1, the candidate in part (a) calculated wrong map distance as 16.5 cm
and obtained 8.25 km instead of 7.4km. In (b), he/she explained the features
found in the area instead of describing the relief of the area and (c) he/she
mentioned water bodies instead of the rocks found in the area.
Extract 3:2 A sample of a candidate with poor response.
In extract 3: 2, the candidate failed to draw the correct cross section. The
candidates failed to determine the height of the area where the cross section was

14
to be drawn and the scale to be used. This implies that he/she had no knowledge
on cross section drawing.
The candidates who scored from 3 to 6.5 marks were able to respond correctly to
some parts of the question. This suggests that they had insufficient knowledge
and skills on topographical map reading and interpretation and were able to
observe the demand of the question for some parts of the question.
In part (a), the candidates were required to measure the distance of river Pangani
in kilometers. Some candidates managed to measure the distance of river Pangani
in centimeter, but failed to convert the measurement in the representative scale
given. Other candidates failed to measure the distance of river Pangani in the
map, while others failed to follow the procedures of converting the map
measurements into the actual ground measurement by using the RF scale given.
For example, one candidate measured 34.3 cm and converted it into ground
measurement as 17.2 km, another candidate measured the distance of the river
and got 17.5cm and he/she converted into ground distance as 17.5 km while
another candidate calculated the distance of the river in 2150 gram, he/she
converted into kilogram then multiplied by 100 and got 215000kg. This is an
indication that the candidates had insufficient knowledge and skills on units of
measurement because kg is not used to measure distance.
In part (b) the candidates were required to describe relief of the area. Some
candidates described the relief of the area with reason, while other did not
provide any reason. Some of the candidates provided inadequate description of
the relief of the area without reasons, while others mixed correct and incorrect
answers concerning the relief of the area. For example, one candidate explained
the presence of gentle slope on the eastern part of the map, presence of strip of
steep slope running through areas of Mgongoni and Mikocheni, presence of
rivers and lakes and the presence of seasonal swamp as a description of the relief
of the area. Another candidate described the relief of the area as forest at
Kwaniali and shrubs in the Southern region of the mapped area.
In part (c), the candidates were required to identify two types of rocks found in
the map. Some of the candidates mixed up correct and incorrect answers, with
reasons, while others identified correct rocks type with wrong evidence. For
example, one candidate mixed correct and incorrect answer, he/she mentioned
Igneous rocks and Metamorphic rocks, another candidate mentioned the correct
types of rocks as Igneous and Sedimentary rocks without reasons, another
candidate identified the type of rocks as Impermeable rocks due to presence of
several water bodies and Permeable rocks due existence of scattered trees.

15
Another candidate identified the type of rocks as Mountainous rocks due the
direction of the flow of river and limestone rocks due to formation of terraces.
This suggests that the candidates had inadequate knowledge and skills on the
subject matter.
In part (d), the candidates were required to name the major way used to show the
height of the land in the mapped area. Some of the candidates were able to name
the major, way used to represent the relief of the area, while others failed.
Furthermore, some of the candidates named other methods which are not major
but they are used to represent relief of the area while others mixed the major way
with minor. For example one candidate managed to mention the correct major
way used to show the height of the land as Contour. Another candidate named
Spot height, as the major way which is used to show the height of the land which
was incorrect. Another candidate mentioned Contour, naming method and Spot
heigh,t while another candidate named Contour line and by using
Trigonometrical station.
In part (e), the candidates were required to draw an annotated cross section by
using a vertical scale of 1cm to represent 50m from grid reference 960820 to
910880, and mark Ruvu river and the main truck. Some candidates drew a cross
section without labeling it. Some drew a cross section without a scale, while
others drew a wrong cross section but they provided correct scale and title for the
cross section. Disparity of their responses made them to have variation in their
scores in this category.
The candidates who scored from 7 to 11 marks were knowledgeable on
topographical map reading and interpretation, especially on the concept of
measurements of distance, description of relief of the area, identification of the
rocks as well as cross section drawing skills.
In part (a), they were able to measure the distance of river Pangani in kilometres
from grid reference 910771 to 910826 by using the given RF scale which was 7.4
km, they were able to apply correct procedures whereby in the first step, they
measured the distance of river Pangani in centimeter as 14.8 and they managed to
convert into actual ground distance as:
1 : 0.5cm km
14.8 :cm x
14.8 0.57.4
1
cm x kmkm
cm

16
In part (b), they were able to describe the relief of the area as: highland because
the contour height on the map ranges from 1500 m to 1900 m.
In part (c), they identified the two types of rocks found in the map as Igneous
rock at North – South centre and North West corner and sedimentary rocks to the
Eastern part of mountain ranges and Western part along river Pangani or Ruvu.
In part (d), the candidates managed to name the major way used to show the
height of the land in the mapped area as contour.
In part (e), they managed to draw an annotated cross section using a vertical scale
provided and marked the Ruvu river basin and the main tracks. Also they
managed to label the cross section drawn.
However, their marks varied from 7 to 11 depending on the strengths and
accuracy of their responses, because some did not get all parts correctly. Extract
3.3 represents part of the candidate’s response who managed to answer the
question fairly well.
17
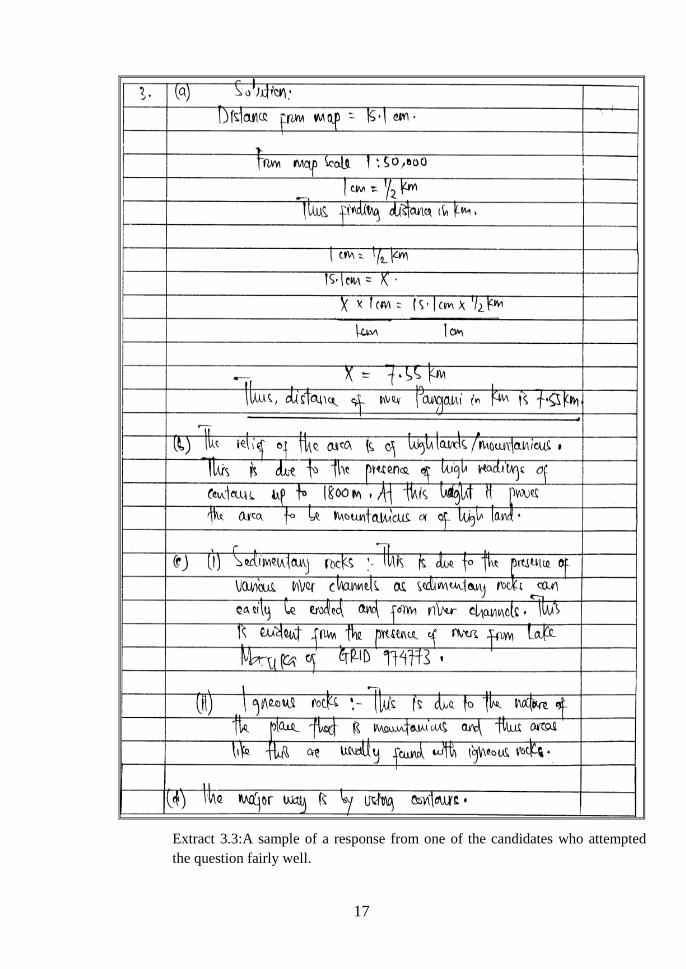
Extract 3.3:A sample of a response from one of the candidates who attempted
the question fairly well.

18
In extract 3.3, the candidate managed to provide the correct answers in part (a),
(b), (c) and (d). In part (e), the candidates did not manage to draw a cross section.
This may be due to insufficient skills in reading and drawing cross section. Also,
some candidates might have failed to determine the correct contour heights,
because in some parts the contour numbers seemed to be faint, for example at
grid reference 192865. Majority of the candidates tried to draw an annotated
cross section, but no one made it.
2.2.2 Question 4: Application of Statistics
This question had three parts namely (a), (b) and (c). The candidates were given
a table of values and were required to: (a) name the two simplest ways of
presenting the data, (b) explain five advantages of presenting the data by simple
methods mentioned in (a) and (c) to present the given statistical information by
using simple graph.
The candidates’ performance shows that the question was attempted by 424,025
(100%) candidates. Further analysis of candidate’s performance shows that,
149,554 (35.3%) scored from 0 to 2.5 mark 155,970 (36.8%) scored average
marks (3 to 6.5) and 118,501 (27.9%) scored from 7 to 11 marks. The general
performance for this question was average because 64.7 percent of the candidates
scored from 3 to 11 marks. Figure 4 illustrates the percentage of the candidates’
performance in this question.
Figure 4: Trend of candidates’ performance in question 4.
Candidates’ responses show that the question had average performance because
64.7 percent of all the candidates scored 3 to 11 marks.

19
The candidates who scored from 7 to 11 marks interpreted the demand of the
question relatively well. This suggests these candidates had sufficient knowledge
and skills on statistical issues related to mentioning, calculating and drawing the
statistical information according to the demand of the question. For example, in
part (a), some candidates managed to name the two simplest ways of presenting
the data which were; simple line graph and simple bar graph.
In part (b), some of the candidates were able to present five advantages of
presenting the data by using the methods mentioned in part (a). For example, one
candidate provided correct advantages of presenting the data by using the simple
method, such as; they are simple to interpret from the graph, they are simple to
prepare or draw as they involve only one variable, they do not consume time,
they do not need high skills, they are easy to read the exact time value against
plotted points and they do not involve calculations.
In part (c), some of the candidates managed to draw a simple line/bar graphs and
labeled it with a well written title. The variation in their scores resulted from the
strengths and accuracy of candidates’ responses. Extract 4.11 is a sample of a
candidate’s responses who met the demand of the question.

20
Extract 4.1 A sample of a good response, for question (4 a-c).
In extract 4:1 the candidate was able to provide correct answers in part (a), (b)
and (c).

21
Extract 4.2 A sample of candidates’ good response, for question (4a-c)
In extract 4:2 the candidate was able to provide correct answers in part (a), (b)
and (c).
The analysis indicates that candidates who scored from 3 to 6.5 marks interpreted
the question differently and had insufficient knowledge on the content. In part
(a), some candidates in this category were able to mention only one simplest way
of presenting the data instead of two. Some mixed up correct and incorrect

22
answers, while other candidates pointed out incorrect responses in some parts of
the question. For example, one candidate wrote Simple line graph and Multiple
bar graph. Another candidate provided Divergent line graph and Divergent bar
graph while another candidate wrote Compound line graph and Pie chart instead
of providing the correct answer which were Simple line and bar graph.
In part (b), some candidates explained few advantages of presenting the data by
simple methods, while, others mixed up correct and incorrect answers. For
example one candidate wrote correct and incorrect responses such as; it is easy to
compare, it shows fluctuation more clearly for example divergent method, it is
easy to read the item and understand the data presented and it brings good visual
impression when they are coloured.
In part (c), some of the candidates managed to write the correct title but they
failed to present statistical information by using simple graph. Some of them
were able to write correctly the vertical and horizontal scale but failed to draw
the graph. Others drew a simple graph correctly but failed to label it.
Some of the candidates who scored from 0 to 2.5 marks did not meet the demand
of the question while, others had inadequate knowledge of the subject matter
tested. The candidates who scored 0 mark provided incorrect responses in all
parts of the questions. Analysis shows that, some of the candidates had
responded to some parts of the question, while others responded only to few parts
of the question.
In part (a), some of the candidates failed to name the two simplest ways of
presenting the data. For example, one of the candidates wrote wrong answers
such as; Compound line graph and Divergent line graph. Another candidate
mentioned Divergent bar graph and Grouped bar graph instead of Simple line
graph and Simple bar graph.
In part (b), some of the candidates were able to name few advantages of simple
graphs mentioned in (a), while others failed. For example, one candidate
explained advantages of comparative bar graph, as; used when one wants to make
comparison, comparative does not involve calculations and it is empirical.
Another candidate provided incorrect answers, such as; it help to learn different
information, it help to generate skills and knowledge, it help to be innovative and
it help to determine different events instead of providing the correct answers such
as; they are simple to interpret, they are simple to prepare, they do not have
skills, they are easy to read the exact time value against plotted point on straight
graph, they can be used to compare between years and they do not involve
calculations.

23
In part (c), majority of candidates failed to present the given statistical
information by using simple graph, while few of them were moderately able to
present the data. For example, one candidate drew Divergent bar graph, another
candidate drew Compound bar graph, while another candidate drew a line graph
but failed to give tittle and scale for the graph, hence scored low marks. Extract
4.3 indicates a sample of a candidate’s response who failed to meet the demand
of the question.

24
Extract 4:3 A sample of a response from one of the candidates.

25
In extract 4.4, the candidate misconceived the question. Instead of drawing
simple bar/line graph, he/she drew a compound bar graph and mixed it with
grouped graph for two years (2002 and 2003).
Extract 4.4 is the sample of a candidates’ poor response.

26
In extract 4.4, the candidate failed to meet the demand of the question because
he/she drew a compound line graph instead of a simple bar/line graph.
2.2.3 Question 5: Elementary Surveying and Map Making
The question had two parts, (a) and (b). The candidates were required to describe
five instruments used in surveying in part (a), to explain three procedures to be
followed during the surveying process in part (b). Marks allocated for this
question were 11.
This question was attempted by 424,025 (100%) candidates, of which 225,597
(53.2%) scored from 0 to 2.5, 165,392 (39%) scored from 3 to 6.5 marks, and
33,035 (7.8%) scored from 7 to 11 marks. Figure 5 illustrates the percentage of
the candidates’ performance in this question.
53.2
39.0
7.8
0
10
20
30
40
50
60
70
80
90
100
0.0 - 2.5 3.0 - 6.5 7.0 - 11.0
Per
cen
tag
e o
f C
an
did
ate
s
Scores
Figure 5: Trend of the candidates’ performance in question 5.
The analysis shows the general performance was average because 46.8 percent of
all the candidates scored between 3 and11 marks.
The candidates who scored from 7 to 11 marks had sufficient knowledge of the
subject matter examined. In part (a), the candidates managed to provide the
correct answers by explaining the instruments used to survey the school
compound, as follows: chain, tape surveyors band, cross staff, ranging poles,
pegs, note book, arrows and pencils. Also, in part (b), they provided correct
procedures to be followed when conducting survey in the school compound,

27
including; inspection of the area, surveying in the field and recording or
presentation of data.
The variations of their scores were influenced by the accuracy of their responses.
Extract 5.2 indicates a sample of a response from one of the candidates who
managed to meet the demand of the question.

28
29
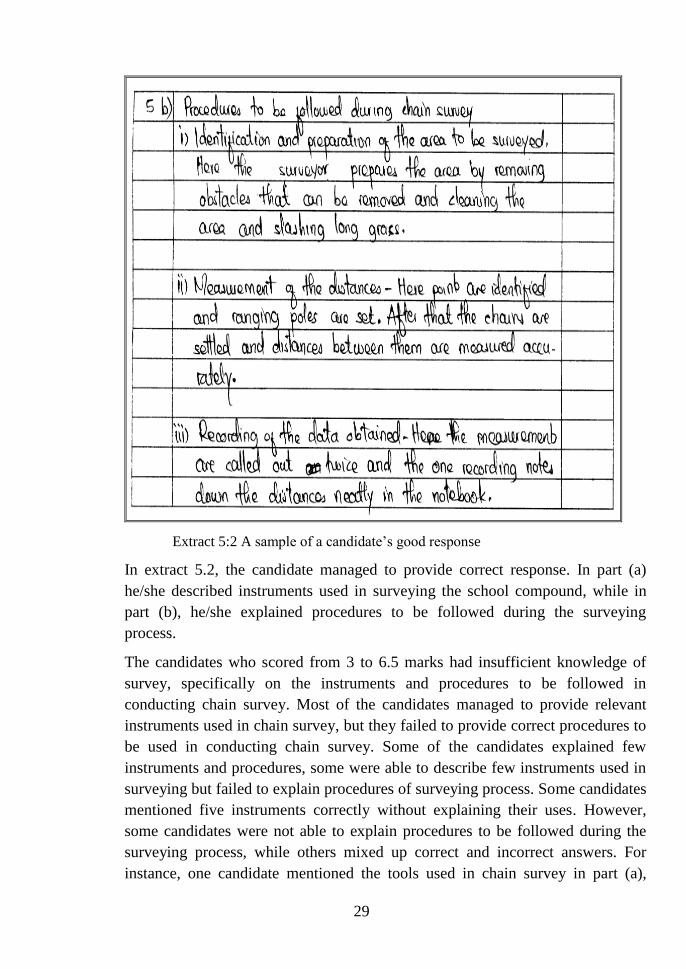
Extract 5:2 A sample of a candidate’s good response
In extract 5.2, the candidate managed to provide correct response. In part (a)
he/she described instruments used in surveying the school compound, while in
part (b), he/she explained procedures to be followed during the surveying
process.
The candidates who scored from 3 to 6.5 marks had insufficient knowledge of
survey, specifically on the instruments and procedures to be followed in
conducting chain survey. Most of the candidates managed to provide relevant
instruments used in chain survey, but they failed to provide correct procedures to
be used in conducting chain survey. Some of the candidates explained few
instruments and procedures, some were able to describe few instruments used in
surveying but failed to explain procedures of surveying process. Some candidates
mentioned five instruments correctly without explaining their uses. However,
some candidates were not able to explain procedures to be followed during the
surveying process, while others mixed up correct and incorrect answers. For
instance, one candidate mentioned the tools used in chain survey in part (a),

30
Tripod stand, survey, books, chain and rulers instead of chain, tape, cross staff,
surveyors band, pegs, note book and pencil. In part (b), he/she explained the
procedures to be followed in surveying process such as avoid of the steep slope,
straight of be the chain so as to avoid errors and the use of required instruments.
Another candidate provided correct answers in part (a) but he/she provided
irrelevant procedures of conducting chain survey, such as preparation of
equipment used, identifying the problem and conducting the survey process.
Another candidate, provided correct and incorrect answers such as chain,
boundaries, in tree increase, tape and in area production while in part (b), he/she
explained irrelevant procedures of conducting chain survey such as chain,
leveling and chain surveying. The correct procedures of conducting chain survey
are; inspection of the area, surveying in the field and presentation of data or
recording. Such responses indicate that the candidate had partial knowledge of
the topic. The variations of their scores were a result of varying degree of clarity
of their responses.
Some of the candidates who scored 0 to 2.5 marks failed to understand the
demand of the question, while others showed to have inadequate knowledge of
survey particularly on the five instruments used in surveying. Furthermore, some
of the candidates failed to explain three procedures to be followed during the
survey process, while others explained few correct procedures. For example, one
candidate mentioned cars and motorbike. Another candidate wrote Equatorial
monsoon and Tropical continental. Another candidate mentioned chain survey,
labour, companies of social services and compound of chain, while another
candidate provided answers such as Mass wasting, weathering, swallow hole
and transportation instead of providing correct answers which are instruments
used in surveying such as; the chain, the tape, surveyor’s band, cross staff,
ranging poles, pegs, arrows, notebook and a pencil.
In part (b), some of the candidates failed to explain three procedures to be
adhered to during conducting the surveying process, while others misconceived
the question demand. For example, one candidate wrote, in part (b); to ensure
you have money for paying the surveyors and to ensure you have instruments
which can be used in the survey. Another candidate wrote; to ask for permission
from the village chairperson and to make sure you have good transport while,
another candidate wrote; prepare required equipment and choose any three
assistant and prepare. These are the important things to consider before
conducting survey work and not the instruments used in surveying. Extract 5.1
illustrates such a poor response from one of the candidates in this question.

31
Extract 5.1 A sample of a candidate’s poor response in question 5.
In extract 5.1, the candidate misconceived the question. In part (a) the candidates
listed the types of climate, forces that affect the earth and the features found in
Karst region, instead of describing instruments used in surveying the school
compound. In part (b), the candidate mentioned features formed in Karst region
instead of procedures to be followed during surveying process.
32
2.2.4 Question 6: Introduction to Research
This question had four parts (a), (b), (c) and (d). The question required the
candidates to suggest the statement of the problem for the research in part (a) to
identify two sources of the research problem in part (b), to elaborate four
possible research tools Lugano would use during data collection and in part (c)
and to explain three significance of conducting research in part (d). The total
marks allocated for this question were 11.
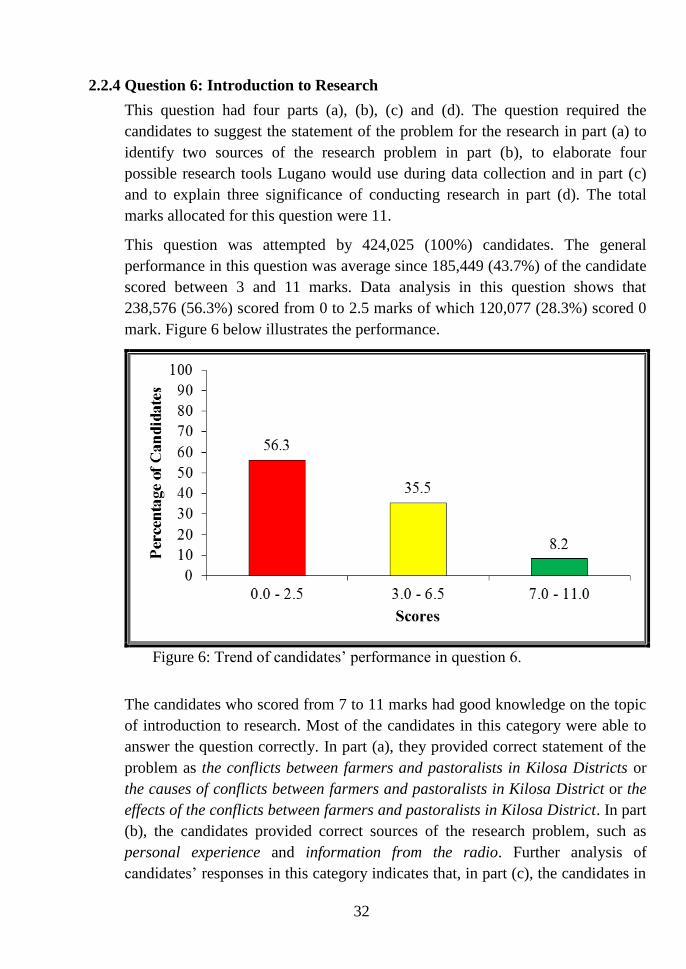
This question was attempted by 424,025 (100%) candidates. The general
performance in this question was average since 185,449 (43.7%) of the candidate
scored between 3 and 11 marks. Data analysis in this question shows that
238,576 (56.3%) scored from 0 to 2.5 marks of which 120,077 (28.3%) scored 0
mark. Figure 6 below illustrates the performance.
Figure 6: Trend of candidates’ performance in question 6.
The candidates who scored from 7 to 11 marks had good knowledge on the topic
of introduction to research. Most of the candidates in this category were able to
answer the question correctly. In part (a), they provided correct statement of the
problem as the conflicts between farmers and pastoralists in Kilosa Districts or
the causes of conflicts between farmers and pastoralists in Kilosa District or the
effects of the conflicts between farmers and pastoralists in Kilosa District. In part
(b), the candidates provided correct sources of the research problem, such as
personal experience and information from the radio. Further analysis of
candidates’ responses in this category indicates that, in part (c), the candidates in

33
this category managed to provide the research tools, as interview, questionnaires,
focus group discussion and observation. Further analysis shows that in part (d),
candidates provided the significance of conducting research such as; it helps to
know the root causes of the problem, it will help the government to make
appropriate intervention on the problem and will help to suggest or find proper
solution of the problems. The disparity of their marks was a result of the
strengths and weakness of the candidates’ responses because some of the
candidates failed to respond correctly in some parts of the question. Moreover,
others candidates provided few points while others had incorrect points. Extract
6.1 is a sample of a candidate’s good responses.

34

35
Extract 6.1: A sample of a candidate’s good response.
In extract 6.1 the candidate managed to meet the demand of the question in parts
(a), (b), (c) and (d).
On the other hand, the candidates who scored from 3 to 6.5 marks had partial
understanding of the skills and concepts of research. In part (a), the candidates
were required to suggest the statement of the problem for Lugano’s research.
Most of the candidates in this group were able to provide relevant statement of
the problem, while, others provided incorrect responses which indicated lack of
knowledge of the subject matter or misconception of the question requirement.
On the other hand, in part (b), the candidates were required to identify two
sources of that research problem. Most of the candidates were able to suggest
two possible sources of the research problem, while others mixed correct and
incorrect sources. For example, some of the candidates misconceived sources of
research problem with types of research, while others outlined types of research
sampling techniques, such as; random sampling and systematic sampling.
In part (c) the candidates were required to elaborate four possible research tools
Lugano would use during data collection. Most of the candidates provided
correct research tools such as: interview, questionnaires, focus group discussion,
observation and rapid appraisal while, others mixed up correct and incorrect
research tools. For example, one candidate mixed up correct and incorrect
answers, as; political matters and literature review and the other mentioned
Books and quantitative research.
36
In part (d), the candidates were required to explain three significance of
conducting that research. Most of the candidates provided correct significance of
conducting that research, while others failed. Analysis from candidates’ responses
shows that the candidates who provided incorrect responses in this part had inadequate
knowledge or misconceived the demand of the question. Moreover, some
candidates mixed up correct and incorrect answers on the significance. For
example, one candidate explained the significance of research, as; it helps to
know the root causes of the problem, language barrier, it will help the
government to make appropriate intervention on the problem and poor
transportation system. Other candidates provided irrelevant importance of
Lugano’s research while others provided irrelevant significant, as; it enable a
researcher in collecting information, it enable researcher to know what has been
study and it enable a researcher to know the interest and idea which researcher
want to work on it instead of presenting relevant importance of research such as;
it helps to know the root causes of the problem, it will help the government to
make appropriate intervention on the problem and will help to suggest or find
proper solution of the problems. The variation in the correctness of responses
made the candidates to have different scores.
Some of the candidates with low performance (0 to 2.5 marks) demonstrated
inadequate knowledge of the subject matter, while others misinterpreted the
requirement of the question, thus providing irreverent answers. For example, in
part (a), some of the candidates failed completely to suggest the statement of the
problem for Lugano’s research correctly, while others provided partial responses
on the statement of the problem, hence scored low marks. This indicates that they
had partial knowledge on the topic of research, specifically on the procedures of
conducting research, tools of research and their significance.
For example, one candidate suggested the statement of the problem, as; to reduce
the conflict between farmers and pastoralists. Another candidate stated the
statement of the problem as lack of cooperation between farmers and pastoralists
while, another candidate stated the statement of the problem as to ensure security
among farmers and pastoralists instead of stating the correct statement of the
problems, as; the conflicts between farmers and pastoralists in Kilosa Districts or
the causes of conflicts between farmers and pastoralists in Kilosa District or the
effects of the conflicts between farmers and pastoralists in Kilosa District from
the given question. Some of the candidates were confused the word problem,
hence they interpreted it as “difficulty” or “challenge” as a result they mentioned
the challenges/ difficulties encountered in conducting a research. For example,

37
one candidate mentioned the challenges, as; lack of tools, lack of science and
technology, poor transport and communication and lack of concentration.
In part (b), the candidates were required to identify two sources of the research
problem. Some of the candidates in this part provided incorrect responses, some
mixed correct and incorrect points while others identified only few research
sources. For example, one candidate mentioned the sources of research as; from
political status and from practical experience. Another candidate mentioned the
sources of research problem as; shortage of land and lack of permanent
settlement while another mentioned: poor geographical location and conclusion
from other researchers. Other candidates misinterpreted the question demand on
the sources of research thus responded as; questionnaires and interview, while
others mentioned the types of research such as; basic research and applied
research instead of identifying the correct sources of the research problems such
as personal experience and information from media (Radio, Television etc).
In part (c), the candidates were required to elaborate four possible research tools
Lugano would use during data collection. Majority of candidates in this category
failed to provide the correct research tools due to inadequate knowledge on the
subject matter. The analysis shows that other candidates misconceived the
question demand. For example, some of the candidates mentioned the stages of
field research such as; problem identification, hypothesis formulation and data
analysis, the other mentioned types of sample in research such as: random
sampling and systematic sampling. It was also noted that some candidates
provided irrelevant answers which were contrary to the demand of the question,
such as; mental, health, good friend ship and respect for the people. These
responses indicate that the candidates had poor understanding of the subject
matter.
In part (d), the candidates were required to explain three significance of
conducting research. Some of the candidates in this category failed to meet the
demand of the question, thus provided incorrect answers. Other candidates
explained few significant of conducting that research. For example, one
candidate provided wrong explanations on the importance of research, such as;
provide data for playing data, it helps to economic activities and it helps to know
the classifying and storing data. This indicates that the candidates had inadequate
knowledge on the topic of research. Extract 6.2 indicates a sample of a poor
response from one of the candidates.

38
Extract 6.2: A sample of poor responses.
In extract 6.2 the candidate misconceived the question. In part (a), the candidate
mentioned literature review, instead of the statement of the problem of Lugano’s
research. In part (b), he/she mentioned sources of data, instead of sources of
research problem. In part (c), he/she mentioned stages of conducting research,
instead of research tools and in part (d), the candidate mentioned the qualities of
a good research, instead of significance of conducting the research. Furthermore,
the candidate demonstrated poor proficiency in English language.
2.2.5 Question 7: Photograph Interpretation
This question had five parts, namely (a), (b), (c), (d) and (e). The candidates were
required to study the photograph provided and answer the questions that
followed. The marks allocated for this question were 11.
The candidates were required in part (a) to name the dominant tree found in the
area. In part (b), they were supposed to name two land uses that might be suitable
in the area. Part (c) required the candidates to suggesting three possible regions
in Tanzania where the photograph might have been taken and in part (d) they
were required to describe the relief features shown in the photograph and part (e)
demanded them to explain the formation of the relief features found in the
background. The question aimed at testing the candidates’ basic knowledge and
skills in photograph interpretation.

39
Photograph
The question was attempted by 424,019 (100%) candidates. Analysis shows that
229,341 (54.1%) candidates scored from 0 to 2.5 marks. The performance was
average for 179,988 (42.4%) candidates and was good for 14,690 (3.5%)
candidates because they scored from 7 to 11 marks. The general performance in
this question was average because 45.9 percent of all the candidates scored
between 3 and 11 marks. The candidates’ performance in this question is
illustrated in figure 7.

40
54.1%42.4%
3.5
%
0.0 - 2.5
3.0 - 6.5
7.0 - 11.0
Scores
Figure 7: Trend of candidates’ performance in question 7.
The candidates who scored 7 to 11 marks had adequate knowledge and skills in
photograph reading and interpretation. Majority of them managed to provide
satisfactory answers in most parts of the question. The variations in their scores
were the result of the accuracy of the responses provided. For example, in part
(a), one candidate managed to name the dominant tree as Baobab tree, while
others used the name Baobao tree. In part (b), the candidates were required to
suggest the possible land use such as; subsistence crop cultivation, mixed
farming, nomadic pastoralism, tourism and reserved areas for different species.
For example, one of candidates suggested the land use of the area correctly as
subsistence crop cultivation and reserved areas for different species.
In part (c), the candidates were required to suggest the three possible regions
where the photograph might have been taken. The possible regions were; Iringa,
Morogoro, Singida, Tabora, Shinyanga, Kilimanjaro and Dodoma. For example,
one candidate managed to suggested the possible regions where the photograph
was taken as; Morogoro, Iringa and Singida. In part (d), the candidates were
required to describe the relief features shown in the photograph. The correct
features found in the photograph were valley, Fold Mountain, saddle and spur.
For example, one candidate mentioned mountains and valleys which were
correct. In part (e), the question required the candidates to explain the formation
of the relief features found in the background. The correct answer was the Fold
Mountains are formed due to the influence of tectonic forces that cause the
horizontal earth movement which causes compression with rocks. Most of the

41
candidates managed to explain the forces that led to the formation of the features
found in the photograph.
The variation of the candidates’ scores depended on the clarity of their responses.
Extract 7.1 is a sample of a good response from one of the candidates.
Extract 7.1: A sample of a candidate’s good response.
In extract 7.1, the candidate provided correct responses in parts (a), (b), (c), (d)
and (e).

42
Analysis from candidates’ responses indicates that most of the candidates who
scored from 0 to 2.5 marks had insufficient knowledge and skills in the
photograph reading and interpretation because some of them failed to provide
correct answers in all parts. Moreover, candidate’s poor performance was due to
failure to understand the requirement of the question, as they responded contrary
to the demands of the question. In part (a), the candidates were required to name
the dominant trees in the photograph. The analysis shows that some of the
candidates failed to give the correct name of the dominant trees and provided
wrong responses such as; Bamboo, sugar cane, Palm tree and Coffee, instead of
Baobab tree. Other candidate mentioned Polje as the dominant trees which is in
correct in real sense Polje is the feature found in limestone region. Further
analysis shows that some of the candidates presented the name of the dominant
trees in the photograph by using Swahili language such as Ubuyu trees and
Mbuyu. This shows that the candidates were aware of the dominat tree found in
the photograph but due to poor proficiency of English Language they failed to
provide the name of the tree in the required language.
In part (b), the candidates were required to name two land uses that might be
suitable for the area. Most of the candidates in this category failed to name the
land uses that might be suitable for the area. Others provided incorrect land use.
For example, one candidate wrote; land alienation and land desert as the land
use in the photograph.
In part (c), the candidates were required to suggest the possible regions in
Tanzania where the photograph might have been taken. Most of the candidates in
this category failed to suggest the possible regions in Tanzania where the
photograph might have been taken. For example, one candidate mentioned
Mwanza, Ruvuma and Rukwa. The other mentioned climatic zones of the world
such as Desert area and Equatorial area.
In part (d), the candidates were required to describe the relief features shown in
the photograph. Most of the candidates failed to describe the relief features
shown in the photograph as most of them were distracted by the word “features”
which made them to mention the features shown in the photograph instead of
describing the relief features found in the photograph. For instance, one
candidate mentioned dense forests, Baobab trees and small thicket, while another
mentioned trees and road.
In part (e), the candidates were required to explain the formation of the relief
feature found in the back ground. Some of the candidates provided inadequate
explanation of the formation of the relief feature found in the background. Other

43
misconceived the demand of the question. For instance, one candidate mentioned
concepts related with weather and climate of the area such as; Sunshine
availability, the cold climate, winter and rainfall. Another candidate explained
concepts related to volcanic activities such as: solidification of magma that was
found in the photograph. Based on the analysis of candidates’ responses, poor
English language proficiency was also a problem to some of the candidates in
attempting this question. Extract 7.2 is a sample of poor responses from a
candidate.

44
Extract 7.2: A sample of a poor response from one of the candidate.

45
In extract 7.2, the candidate misconceived the demand of the question. In part (a)
he/she mentioned ground as the dominant tree, instead of Baobab tree. In part (b)
he/she mentioned climatic condition, instead of two land uses. In part (c) he/she
mentioned enjoyment of pupils, presence of animals, instead of the possible
regions where the photograph was taken. In part (d), he/she mentioned climatic
condition instead of relief features of the area. In part (e), the candidate explained
about climate, instead of showing the formation of relief features.
The candidates who scored from 3 to 6.5 marks had inadequate knowledge and
skills in the photograph reading and interpretation. These candidates provided
partial descriptions of the answers in some parts of this question, which shows
inadequate knowledge of the subject matter.
In part (a), some candidates were able to name the dominant tree found in the
photograph such as: Baobab trees, while others misconceived the question
demand. For example, one candidate mentioned Mahogany. In part (b), some
candidates provided two correct uses of the land that might be suitable for the
area such as tourism and research site, while others provided incorrect uses. For
example, one candidate mentioned the land uses as lumbering and irrigation
farming. In part (c), some candidates were able to suggest the possible regions
where the photograph might have been taken such as: Iringa, Morogoro and
Dodoma. Others provided wrong regions such as: Ruvuma, Rukwa and Tanga.
In part (d), some candidates provided partial description of the features shown in
the background of the photograph. Others gave the correct descriptions of relief
features such as: valley and fold mountains while, another candidate provided
wrong description of the relief features such as; dense forest and there is small
thicket. In part (e), some candidates explained correct features shown in the
photograph, while others failed to explain the formation of relief features found
in the background. Others candidates provided partial explanations. For instance,
one candidate explained that the formation of the features found on photograph is
due to eruption of magma. The disparity in their scores was a result of strengths
and weakness of their responses.

46
2.3 SECTION C: ESSAY QUESTIONS
2.3.1 Question 8: Solar System
The question required the candidates to describe how Rose will prove to her
grandmother that the earth is spherical by using six evidences. The question
tested candidates’ knowledge on Solar system.
This question was opted by 159,650 (37.7%) candidates, of which 57,665
(36.1%) scored from 0 to 4 marks. Analysis shows that majority of candidates
(54.0%) scored from 4.5 to 9.5 marks, and 15,701 (9.8%) scored from 10 to 15
marks. The performance in this question was average because 63.9 percent
scored from 4.5 to 15. Figure 8 illustrates such a performance.
36.1
54.0
9.8
0
10
20
30
40
50
60
70
80
90
100
0.0 - 4.0 4.5 - 9.5 10.0 - 15.0
Perc
en
tag
e o
f C
an
did
ate
s
Scores
Figure 8: Trend of the candidates’ performance in question 8.
The candidates who scored from 10 to 15 marks understand the demand of the
question. However, some were not able to provide the required number of points
as the question demanded, while others mixed up the correct and incorrect points.
For example, one candidate provided correct introduction, he/she explained
evidences such as aerial photographs, lunar eclipse, day and night, ship visibility
and circumnavigation of the earth. Also the candidate ended with a relevant
conclusion. Majority of the candidates in this category describe the six pieces of
evidence which prove that the earth is spherical by providing clear explanations
and employing appropriate essay writing skills. For example, one candidate
provided correct points such as circumnavigation of the earth, ship visibility,
aerial photograph, sunrise and sunset, the moon eclipse, the earth’s horizon,

47
surveying with poles on level ground and the shape of other planets. However,
the variations of their scores were determined by the strengths and correctness of
their explanation. Extract 8.1 is a sample of a response from a candidate who
performed well.

48

49
Extract 8.1 A sample of the candidate’s correct response.
In extract 8.1, the candidate managed to describe the evidence which proves that
the earth is spherical in shape and supported them with a well labeled diagrams.
The candidates who scored from 4.5 to 9.5 marks had partial knowledge of the
subject matter. Their responses varied from one candidate to another due to
clarity of points. Their responses were characterized by irrelevant explanations of
points, provision of few points as required and a mixture of correct and incorrect
points. For example, one candidate provided correct and incorrect pieces of
evidence such as seasonal of the year, the earth, ship visibility, circumnavigation
of the earth, lunar eclipse and solar eclipse
The candidates who scored from 0 to 4 marks demonstrated inadequate
knowledge in the topic of solar system specifically on the evidence of the shape of
the earth. For example, some of the candidates managed to provide relevant
introduction with some few correct points but without a conclusion. Other
candidates mentioned few correct points but failed to provide relevant
introduction and conclusion. Analysis from candidates’ responses in this group
shows that most of the candidates who scored low marks misconceived the
question demand, while others lacked knowledge of the subject matter. For

50
example, the candidates provided wrong responses such as: explaining on the
effects of the earth rotation, instead of the evidence which proves that the earth is
spherical, such as; day and night, climate change and rise and fall of sea level,
explaining on the structure of the earth such as: Barysphere, Asthenosphere,
Lithosphere and Sima. Others provided irrelevant responses such as formation of
landforms, formation of volcanic eruption, rotation of earth surface, presence of
mountain, river and sea and different soil formation. Furthermore, the analysis
indicates that some were not able to provide relevant introduction and conclusion,
while others had poor English language proficiency. Extract 8.2 is a sample of
such a weak performance.
Extract 8.2: A sample of the candidate’s poor response in question 8.

51
In extract 8.2, the candidate explained the internal structure of the earth, instead
of the evidence which prove that the earth is spherical.
2.3.2 Question 9: Water Management for Economic Development
This question required the candidates to justify that Hydro Electric Power (HEP)
is environmental friendly energy but still has damaging effects on the
environment.
This question was opted by 219,287 (51.7%) candidates. The analysis of the
candidates’ responses indicates that 179,423 (81.85%) candidates scored from 0
to 4 marks, 35741 (16.3%) scored from 4.5 to 9.5 marks, and 4,123 (1.9%)
scored from 10 to 15 marks. The general performance in this question was poor
because 18.2 percent scored between 4.5 to 15 marks. Figure 9 indicates such a
performance.
81.8%
16.3%
1.9%
0.0 - 4.0
4.5 - 9.5
10.0 - 15.0
Figure 9: Trend of the candidates’ performance in question 9.
The analysis of the candidates’ responses indicated in table 9 shows that the
majority of the candidates (81.8%) performed poorly in this question. The main
reasons for the candidates’ poor performance were: inadequate knowledge on the
subject matter and majority they did not understand the demand of the question.
Most of the candidates who scored low marks showed insufficient knowledge on
the subject matter. For instance, one candidate failed to provide a good
introduction; he/she mentioned few points with inadequate explanation such as,
loss of biodiversity, soil erosion and water pollution. Another one failed to give a

52
good conclusion. Most of the candidates who scored from 0.5 to 4 marks mixed
correct and incorrect points, while others provided few points. For example, one
candidate wrote the increase of production of electricity, the increase
transportation of water, deforestation, it improves national income and loss of
soil fertility.
Some of the candidates in this group misinterpreted the question as they
explained the importance of Hydro Electric Power instead of the damaging
effects of HEP to the environment. For example, one candidate wrote;
development of agriculture, employment opportunities and improvement of
transport and communication. Moreover, other candidates explained the factors
which hinder the development of HEP project, including; capital problem, poor
government support, poor infrastructure, low technology, poor transport and
communication while other candidates explained incorrect answers which have
no direct relation with the question. For example, one candidate explained the
effects of high population growth, such as; eruption of diseases, increase of
prostitution, high rate of crime and robbery, environmental pollution and
irresponsibility. Furthermore, most of the candidates in this group had poor essay
writing skills. Extract 9.1 is a sample of poor responses.

53

54
Extract 9.1:A sample of poor responses, from a candidate.
In extract 9:1 the candidate explained the importance of HEP production instead
of the damaging effects of HEP to the environment.
The candidates who scored from 4.5 to 9.5 marks had moderate knowledge and
skills in this question. Some candidates were able to write an introduction and
provide some examples on Hydro Electric Power (HEP) project in Tanzania.
Furthermore, they managed to mention few effects without justifying them as the

55
question demanded. Others tried to mention the effect of the Hydro Electric
Power (HEP) on the environment but they partially explained without giving any
examples. Their conclusion was also irrelevant.
The candidates who scored from 10 to 15 marks had clear understanding of the
effects of the Hydro Electric Power on environment. The strengths and accuracy
of their points made their scores to vary.
Some of the candidates were able to provide correct introduction of Hydro
Electric Power (HEP) and correctly explained the effect of Hydro Electric Power
on environment. For example, one candidate wrote, clearing of vegetation,
disturbance to the wildlife habitats, loss of the arable agricultural land,
environment refugees, collapse of dam, excessive evaporation and it may
accelerate earth quake. Also they ended up with relevant conclusion. Extract 9.2
illustrates a sample of good responses from one of the candidates.

56

57
Extract 9.2: A sample of a candidate’s correct response.
In extract 9.2, the candidate has managed to justify that Hydro Electric Power
(HEP) has damaging effects on the environment.
2.3.3 Question 10: Manufacturing Industries
In question ten (10) candidates were required to explain six factors which hinder
rapid development of manufacturing industries in Tanzania.
This was the most opted question, as it attracted 401,854 (94.8%) candidates.
The analysis of the candidates’ responses indicates that 190,531 (47.4%)
candidates scored from 0 to 4 marks, 120,872 (30.1%) candidates scored from

58
4.5 to 9.5 marks and 90,451 (22.5%) scored from 10 to 15 marks. Table 10
illustrates the candidates’ performance in question 10.
Figure 10: Trend of the candidates’ performance in question 10.
The candidates who scored from 10 to 15 marks had adequate knowledge of the
subject matter. They understood the demand of the question and provided
relevant answers. Most of the candidates managed to explain clearly the six
factors which hinder rapid development of manufacturing industries in Tanzania.
For instance, one candidate wrote; in adequate capital investment to develop
local manufacturing industries, lack of political will to develop local
manufacturing industries, poor market, poor technologies, inadequate skilled
labour, and poor infrastructure, unreliability of power supply and lack of raw
materials. The candidates showed good skills in essay writing. However, some
of the candidates were not able to exhaust all the required points; this is what
made them to have variation in their scores. Extract 10.1 is a sample of good
responses.

59

60

61
Extract 10.1: A sample of the candidate’s good response.
In extract 10.1, the candidate has explained six factors which hinder rapid
development of manufacturing industries in Tanzania.

62
The candidates who scored from 4.5 to 9.5 understood the demand of the
question, but were not able to provide the required number of points. Some of
them mixed correct and incorrect points. This is due to the limited knowledge on
the subject content. The analysis shows that majority of the candidates provided
partial explanations of their points, which probably affected their performance
because they scored not more than 9.5 marks. For example, one candidate
managed to give correct introduction and provided some points which were not
explained clearly and sufficiently such as, inadequate infrastructure, shortage of
labour, lack of government support, shortage of the capital, shortage of energy
and power. The candidate provided wrong conclusion. However, the variations of
their marks were determined by the strengths and weakness of their response.
The candidates who scored low marks (0 to 4) in this question demonstrate
inadequate knowledge on manufacturing industries in Tanzania, while others
failed to understand the demand of the question. Majority of them were distracted
by the word “development” hence they explained explain the factors which
enhance the development of manufacturing industries. For example, one
candidate wrote; availability of capital, availability of power of energy,
availability of market, availability of labour, availability of raw materials,
availability of transport and communication. Some of the candidates
misconceived the meaning of the word “hinder” as a result they explained the
negative effects of manufacturing industries in Tanzania. For example, one
candidate wrote; environmental pollution, loss of aquatic animals, increase in the
rate of spread of diseases, child labour, emission of gases and environmental
degradation while other candidates explained the importance of manufacturing
industries. For example, one candidate wrote; it helps to increase income, it
creates employment, it helps to get food from manufacturing industries, source of
tourism and it helps to get labour.
Further analysis from the candidates’ responses shows that, some of the
candidates provided irrelevant introduction and conclusion. They also mixed up
correct and incorrect reasons on the factors influencing the development of
manufacturing industries in Tanzania. For example, one of the candidates
responded on the problems facing manufacturing industries in Tanzania such as:
poor transport and communication, lack of capital, insufficient labour power,
poor market and unavailability of enough raw materials, instead of factors
influencing the development of manufacturing industries in Tanzania. Hence
irrelevant and insufficient responses led them to score low marks. Extract 10.2 is
a sample of such poor responses.

63

64
Extract 10.1: A sample of a candidate’s poor response.
In extract 10.1, the candidate explained the negative impacts of manufacturing industries
in Tanzania, instead of the factors which hinder rapid development of manufacturing
industries in Tanzania.

65
3.0 PERFORMANCE OF THE CANDIDATES IN EACH TOPIC
The analysis shows that the Geography paper had 10 questions set from 15
topics. These topics are; Structure of the Earth, Solar System, Forces that affect
the earth surface, Climate, Agriculture, Sustainable Use of Forest Resources,
Soil, Weather, Map Reading and Interpretation, Application of Statistics,
Elementary Survey and Map Making, Introduction to Research, Photograph
Reading and Interpretation, Sustainable Use of Power and Energy Resources
and Manufacturing Industries.
The analysis of candidates’ performance in CSEE 2019 in each topic shows that
the candidates had the average performance in 14 topics which were tested in 7
questions. Generally, the candidates got average performance in the following
topics: Application of Statistics (64.7%), Solar system (63.9%), Manufacturing
Industries (52.6%), Elementary Surveying and Map Making (46.8%)
Photograph reading and Interpretation (45.9%), Introduction to Research(43.7)
and 59.5 percent were from the topics of Structure of the Earth, Solar system,
Forces that affect the Earth’s Surface, Soil, Climate and Natural Regions,
Agriculture, Weather, Sustainable Forestry and Population (Which were tested
in multiple choice items)
Further analysis shows that the candidates had poor performance in 3 topics
which they were tested in questions 2, 9, and 3. The topics were; Forces that
Affect the Earth’s Surface (27.6%), Sustainable use of power and energy
resources (18.2%) and Map Reading and Interpretation (10%).
4.0 CONCLUSION
The general performance in the Geography subject in CSEE 2019 was average.
The analysis shows that this performance was a result of several factors such as
the candidates the ability of the candidates to identify the demand of the
question, their knowledge on the subject matter and proficiency in the English
Language. Additionally, statistical skills in computation and drawing of graphs
and a cross section were other factors which contributed to the candidates’

66
performance in this subject. Therefore, the candidates with poor performance
demonstrated their weaknesses on the aforementioned skills.
5.0 RECOMMENDATIONS
Based on the observation made during analysis of the candidates’ item response
the following are recommended in order to improve the performance of
prospective candidates in this subject.
(i) Map interpretation skills should be emphasized. This area should be given
more time and perhaps more strategies should be employed especially on
how to measure distances in the map, the way the scale is to be converted
and interpreting other information presented in the map. Practical
activities in different topic should also be given more attention in order to
improve students’ skills in drawing, measuring and calculating.
(ii) Teachers should encourage candidates to read various resources, such as,
books, pamphlets and online internet resources in order to raise
knowledge of different academic related with Geography subject.
(iii) Teachers are advised to adhere to the principles of conducting
competence based continuous assessment in teaching and learning
process in the classroom. This will help the student to build self
confidence in any assessment because the students will be familiar with
necessary terms used in assessments items.
(iv) Teachers should encourage students to improve their English language
through reading different books. This will help them to familiarize with
different terms used in assessments and especially those terms specific for
Geography.

67
Appendix I
Summary of the Candidates’ Performance per Topic
S/N Topic Question
Number
Percentage of
candidates
who scored
30% and
above
Remarks
1. Application of Statistics 4
64.7 Average
2. Solar system 8 63.9 Average
3. 1
.
Structure of the Earth, Solar
system, Forces that affect the
Earth’s Surface, Soil, Climate and
Natural Regions, Agriculture,
Weather, Sustainable Forestry and
Population.
1 59.5 Average
4. Manufacturing Industries 10 52.6 Average
5. Elementary Surveying and Map
Making 5
46.8
Average
6. Photograph Reading and
Interpretation 7
45.9
Average
7. Introduction to Research 6 43.7 Average
8. Forces that Affect the Earth’s
Surface 2
27.6
Weak
9. Sustainable use of power and
energy resouces 9
18.2
Weak
10. Map Reading and Interpretation 3 10
Weak