Isotopic fractionations associated with phosphoric acid digestion of carbonate minerals: Insights...
23
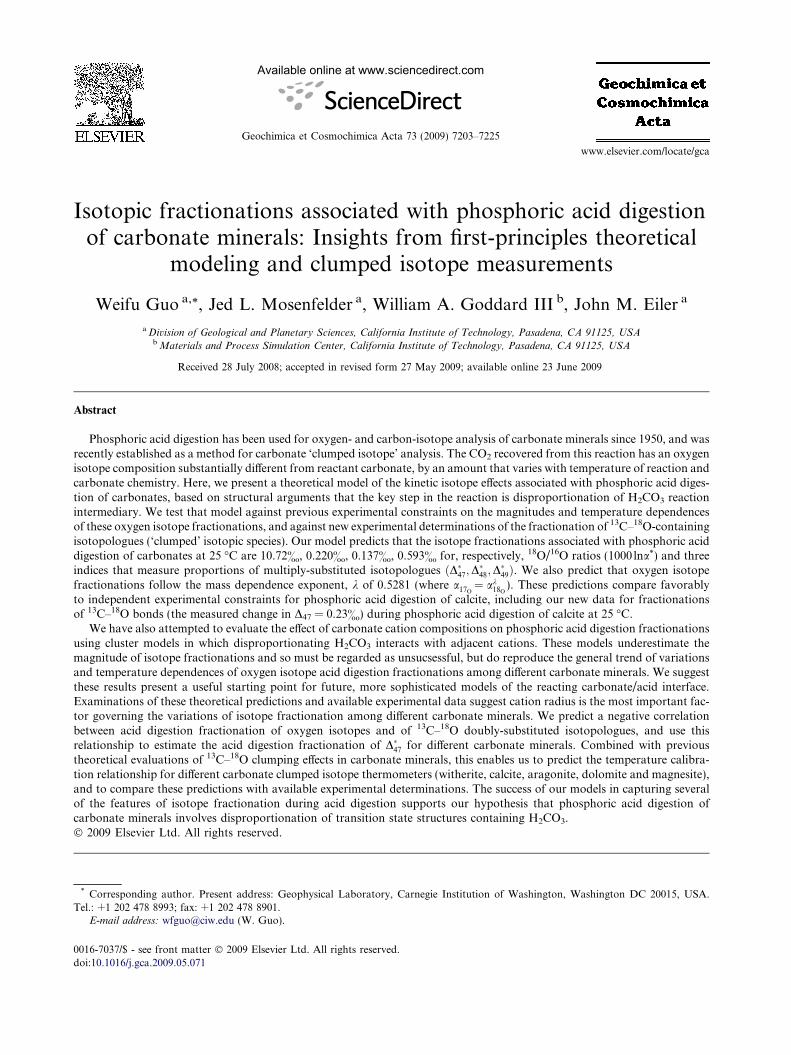
Isotopic fractionations associated with phosphoric acid digestion of carbonate minerals: Insights from first-principles theoretical modeling and clumped isotope measurements Weifu Guo a, * , Jed L. Mosenfelder a , William A. Goddard III b , John M. Eiler a a Division of Geological and Planetary Sciences, California Institute of Technology, Pasadena, CA 91125, USA b Materials and Process Simulation Center, California Institute of Technology, Pasadena, CA 91125, USA Received 28 July 2008; accepted in revised form 27 May 2009; available online 23 June 2009 Abstract Phosphoric acid digestion has been used for oxygen- and carbon-isotope analysis of carbonate minerals since 1950, and was recently established as a method for carbonate ‘clumped isotope’ analysis. The CO 2 recovered from this reaction has an oxygen isotope composition substantially different from reactant carbonate, by an amount that varies with temperature of reaction and carbonate chemistry. Here, we present a theoretical model of the kinetic isotope effects associated with phosphoric acid diges- tion of carbonates, based on structural arguments that the key step in the reaction is disproportionation of H 2 CO 3 reaction intermediary. We test that model against previous experimental constraints on the magnitudes and temperature dependences of these oxygen isotope fractionations, and against new experimental determinations of the fractionation of 13 C– 18 O-containing isotopologues (‘clumped’ isotopic species). Our model predicts that the isotope fractionations associated with phosphoric acid digestion of carbonates at 25 °C are 10.72&, 0.220&, 0.137&, 0.593& for, respectively, 18 O/ 16 O ratios (1000 lna * ) and three indices that measure proportions of multiply-substituted isotopologues ðD 47 ; D 48 ; D 49 Þ. We also predict that oxygen isotope fractionations follow the mass dependence exponent, k of 0.5281 (where a 17 O ¼ a k 18 O ). These predictions compare favorably to independent experimental constraints for phosphoric acid digestion of calcite, including our new data for fractionations of 13 C– 18 O bonds (the measured change in D 47 = 0.23&) during phosphoric acid digestion of calcite at 25 °C. We have also attempted to evaluate the effect of carbonate cation compositions on phosphoric acid digestion fractionations using cluster models in which disproportionating H 2 CO 3 interacts with adjacent cations. These models underestimate the magnitude of isotope fractionations and so must be regarded as unsucsessful, but do reproduce the general trend of variations and temperature dependences of oxygen isotope acid digestion fractionations among different carbonate minerals. We suggest these results present a useful starting point for future, more sophisticated models of the reacting carbonate/acid interface. Examinations of these theoretical predictions and available experimental data suggest cation radius is the most important fac- tor governing the variations of isotope fractionation among different carbonate minerals. We predict a negative correlation between acid digestion fractionation of oxygen isotopes and of 13 C– 18 O doubly-substituted isotopologues, and use this relationship to estimate the acid digestion fractionation of D 47 for different carbonate minerals. Combined with previous theoretical evaluations of 13 C– 18 O clumping effects in carbonate minerals, this enables us to predict the temperature calibra- tion relationship for different carbonate clumped isotope thermometers (witherite, calcite, aragonite, dolomite and magnesite), and to compare these predictions with available experimental determinations. The success of our models in capturing several of the features of isotope fractionation during acid digestion supports our hypothesis that phosphoric acid digestion of carbonate minerals involves disproportionation of transition state structures containing H 2 CO 3 . Ó 2009 Elsevier Ltd. All rights reserved. 0016-7037/$ - see front matter Ó 2009 Elsevier Ltd. All rights reserved. doi:10.1016/j.gca.2009.05.071 * Corresponding author. Present address: Geophysical Laboratory, Carnegie Institution of Washington, Washington DC 20015, USA. Tel.: +1 202 478 8993; fax: +1 202 478 8901. E-mail address: [email protected] (W. Guo). www.elsevier.com/locate/gca Available online at www.sciencedirect.com Geochimica et Cosmochimica Acta 73 (2009) 7203–7225
Transcript of Isotopic fractionations associated with phosphoric acid digestion of carbonate minerals: Insights...
Available online at www.sciencedirect.com
www.elsevier.com/locate/gca
Geochimica et Cosmochimica Acta 73 (2009) 7203–7225
Isotopic fractionations associated with phosphoric acid digestionof carbonate minerals: Insights from first-principles theoretical
modeling and clumped isotope measurements
Weifu Guo a,*, Jed L. Mosenfelder a, William A. Goddard III b, John M. Eiler a
a Division of Geological and Planetary Sciences, California Institute of Technology, Pasadena, CA 91125, USAb Materials and Process Simulation Center, California Institute of Technology, Pasadena, CA 91125, USA
Received 28 July 2008; accepted in revised form 27 May 2009; available online 23 June 2009
Abstract
Phosphoric acid digestion has been used for oxygen- and carbon-isotope analysis of carbonate minerals since 1950, and wasrecently established as a method for carbonate ‘clumped isotope’ analysis. The CO2 recovered from this reaction has an oxygenisotope composition substantially different from reactant carbonate, by an amount that varies with temperature of reaction andcarbonate chemistry. Here, we present a theoretical model of the kinetic isotope effects associated with phosphoric acid diges-tion of carbonates, based on structural arguments that the key step in the reaction is disproportionation of H2CO3 reactionintermediary. We test that model against previous experimental constraints on the magnitudes and temperature dependencesof these oxygen isotope fractionations, and against new experimental determinations of the fractionation of 13C–18O-containingisotopologues (‘clumped’ isotopic species). Our model predicts that the isotope fractionations associated with phosphoric aciddigestion of carbonates at 25 �C are 10.72&, 0.220&, 0.137&, 0.593& for, respectively, 18O/16O ratios (1000 lna*) and threeindices that measure proportions of multiply-substituted isotopologues ðD�47;D
�48;D
�49Þ. We also predict that oxygen isotope
fractionations follow the mass dependence exponent, k of 0.5281 (where a17O¼ ak
18O). These predictions compare favorably
to independent experimental constraints for phosphoric acid digestion of calcite, including our new data for fractionationsof 13C–18O bonds (the measured change in D47 = 0.23&) during phosphoric acid digestion of calcite at 25 �C.
We have also attempted to evaluate the effect of carbonate cation compositions on phosphoric acid digestion fractionationsusing cluster models in which disproportionating H2CO3 interacts with adjacent cations. These models underestimate themagnitude of isotope fractionations and so must be regarded as unsucsessful, but do reproduce the general trend of variationsand temperature dependences of oxygen isotope acid digestion fractionations among different carbonate minerals. We suggestthese results present a useful starting point for future, more sophisticated models of the reacting carbonate/acid interface.Examinations of these theoretical predictions and available experimental data suggest cation radius is the most important fac-tor governing the variations of isotope fractionation among different carbonate minerals. We predict a negative correlationbetween acid digestion fractionation of oxygen isotopes and of 13C–18O doubly-substituted isotopologues, and use thisrelationship to estimate the acid digestion fractionation of D�47 for different carbonate minerals. Combined with previoustheoretical evaluations of 13C–18O clumping effects in carbonate minerals, this enables us to predict the temperature calibra-tion relationship for different carbonate clumped isotope thermometers (witherite, calcite, aragonite, dolomite and magnesite),and to compare these predictions with available experimental determinations. The success of our models in capturing severalof the features of isotope fractionation during acid digestion supports our hypothesis that phosphoric acid digestion ofcarbonate minerals involves disproportionation of transition state structures containing H2CO3.� 2009 Elsevier Ltd. All rights reserved.
0016-7037/$ - see front matter � 2009 Elsevier Ltd. All rights reserved.
doi:10.1016/j.gca.2009.05.071
* Corresponding author. Present address: Geophysical Laboratory, Carnegie Institution of Washington, Washington DC 20015, USA.Tel.: +1 202 478 8993; fax: +1 202 478 8901.
E-mail address: [email protected] (W. Guo).
7204 W. Guo et al. / Geochimica et Cosmochimica Acta 73 (2009) 7203–7225
1. INTRODUCTION
Analysis of the stable isotope compositions of carbonateminerals is among the most common and useful measure-ments in isotope geochemistry. For example, much of paleo-climatology is based on the carbonate–water oxygen isotopethermometry (Urey, 1947) and most records of the globalcarbon cycle through time depend on measuring the carbonisotope compositions of sedimentary carbonates (Des Mar-ais, 1997). More recently, Ghosh et al. (2006) and Schaubleet al. (2006) developed a carbonate ‘clumped isotope’ ther-mometer based on the ordering of 13C and 18O into bondswith each other within the carbonate mineral lattice.
These stable isotope measurements of carbonates aregenerally performed indirectly by reacting the sample car-bonate with anhydrous phosphoric acid and then analyzingthe product CO2 on a gas source isotope ratio mass spec-trometer (McCrea, 1950). This method is relatively straight-forward to perform, is applicable to a wide range of samplesizes, has been automated in several different ways, and isexceptionally precise. These features make this approachpreferable to alternative methods for most applications(e.g., fluorination, Sharma and Clayton, 1965; secondaryion mass spectrometry, Rollion-Bard et al., 2007; laserablation, Sharp and Cerling, 1996). However because onlytwo out of three oxygen atoms in carbonate are releasedas CO2 during phosphoric acid digestion, this methodinvolves a kinetic oxygen isotope fractionation; i.e., productCO2 is �10& higher in d18O than reactant carbonate (Gilget al., 2003 and reference therein). The exact magnitude ofthis kinetic fractionation varies with acid digestiontemperature and appears to differ among carbonate miner-als (Sharma and Clayton, 1965; Kim and O’Neil, 1997; Gilget al., 2003). Similarly, preliminary evidence suggeststhat values of D47 (a measure of the abundance anomaly
of 13C–18O bonds in CO2; defined as D47 ¼R47
actual
R47stochastic
� 1� �
�1000; Eiler and Schauble, 2004) are enriched in CO2
produced by acid digestion of calcite and aragonite relativeto values one expects in the absence of any associatedfractionation (Ghosh et al., 2006). These analytical fractio-nations must be corrected for in any study of the oxygenisotope or ‘clumped isotope’ compositions of carbonateminerals.
The oxygen isotope fractionations associated with phos-phoric acid digestion of different carbonate minerals havebeen experimentally studied over a range of temperatures(Sharma and Clayton, 1965; Sharma and Sharma,1969a,b; Rosenbaum and Sheppard, 1986; Swart et al.,1991; Bottcher, 1996; Kim and O’Neil, 1997; Gilg et al.,2003; Kim et al., 2007). However, there are significantdiscrepancies among acid digestion fractionations of oxygenisotopes determined in different studies (Kim et al., 2007 andreference therein). For example, reported acid digestionfractionations at 25 �C range from 10.10& (Das Sharmaet al., 2002) to 10.52& (Land, 1980) for calcite, and from10.29& (Sharma and Clayton, 1965) to 11.01& (Kim andO’Neil, 1997) for aragonite. Even within a single study,the measured acid digestion fractionation factors for thesame type of carbonate minerals can vary among differentsamples of the same phase (as much as �2& for octavite,
�0.6& for witherite and �0.5& for calcite at 25 �C; Kimand O’Neil, 1997). More generally, our understanding ofthis phenomenon is entirely empirical, and thus provideslittle basis for extrapolation to new materials or conditionsof acid digestion.
Our understanding of acid digestion fractionations isparticularly poor in relation to the carbonate ‘clumped iso-tope’ thermometer (Ghosh et al., 2006). It has been shownthat the abundance anomaly of 13C–18O bonds in CO2 pro-duced by acid digestion of carbonate differs from that inreactant carbonate (Ghosh et al., 2006), but the exact mag-nitude of this fractionation was poorly constrained and itsvariation among different carbonate minerals is unexplored.These gaps in our understanding limit the use of the car-bonate clumped isotope thermometer for minerals otherthan calcite and aragonite, e.g., dolomite or magnesite. Be-cause these carbonates are difficult to synthesize in isotopicequilibrium (especially at ambient temperatures), theoreti-cal understandings of both 13C–18O clumping within miner-als (Schauble et al., 2006) and clumped isotopefractionations during acid digestion are important guidesto interpreting observations on natural samples.
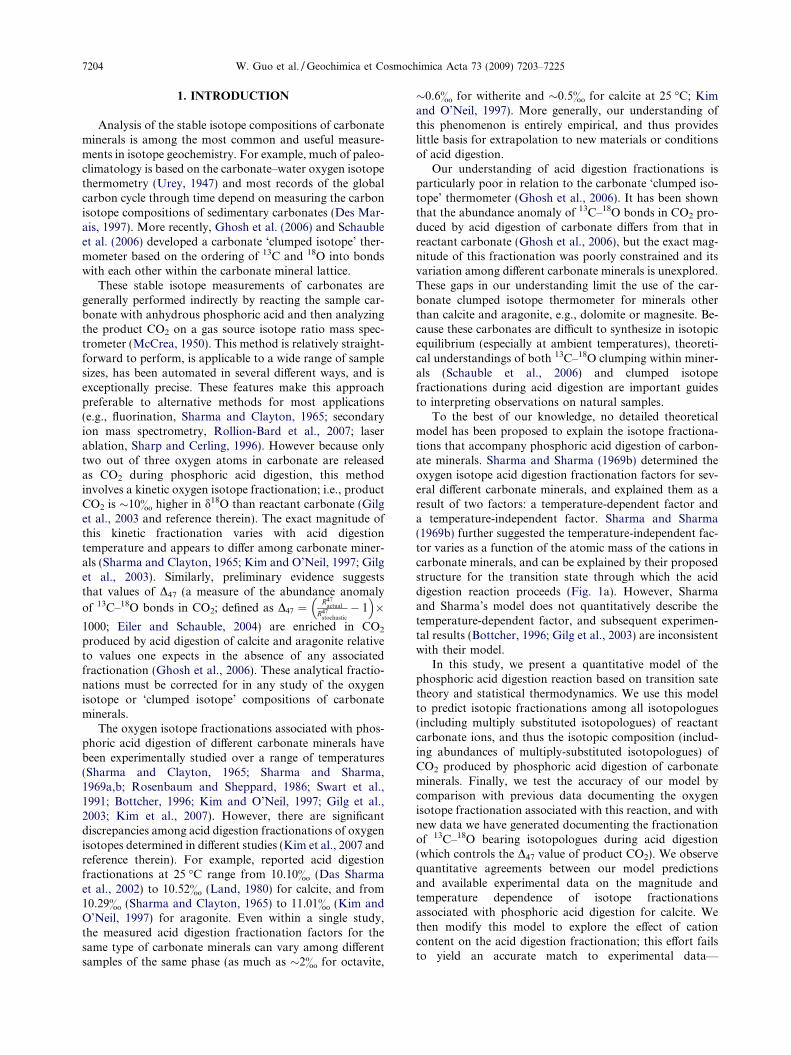
To the best of our knowledge, no detailed theoreticalmodel has been proposed to explain the isotope fractiona-tions that accompany phosphoric acid digestion of carbon-ate minerals. Sharma and Sharma (1969b) determined theoxygen isotope acid digestion fractionation factors for sev-eral different carbonate minerals, and explained them as aresult of two factors: a temperature-dependent factor anda temperature-independent factor. Sharma and Sharma(1969b) further suggested the temperature-independent fac-tor varies as a function of the atomic mass of the cations incarbonate minerals, and can be explained by their proposedstructure for the transition state through which the aciddigestion reaction proceeds (Fig. 1a). However, Sharmaand Sharma’s model does not quantitatively describe thetemperature-dependent factor, and subsequent experimen-tal results (Bottcher, 1996; Gilg et al., 2003) are inconsistentwith their model.
In this study, we present a quantitative model of thephosphoric acid digestion reaction based on transition satetheory and statistical thermodynamics. We use this modelto predict isotopic fractionations among all isotopologues(including multiply substituted isotopologues) of reactantcarbonate ions, and thus the isotopic composition (includ-ing abundances of multiply-substituted isotopologues) ofCO2 produced by phosphoric acid digestion of carbonateminerals. Finally, we test the accuracy of our model bycomparison with previous data documenting the oxygenisotope fractionation associated with this reaction, and withnew data we have generated documenting the fractionationof 13C–18O bearing isotopologues during acid digestion(which controls the D47 value of product CO2). We observequantitative agreements between our model predictionsand available experimental data on the magnitude andtemperature dependence of isotope fractionationsassociated with phosphoric acid digestion for calcite. Wethen modify this model to explore the effect of cationcontent on the acid digestion fractionation; this effort failsto yield an accurate match to experimental data—
C O
O
O H
H O
O
P OH
O
(a)
M 2+
2-
(b)
Fig. 1. Reaction mechanisms during phosphoric acid digestion ofcarbonate minerals, proposed by (a) Sharma and Sharma (1969b),and (b) this study. See Section 2.2.1 for details.
Phosphoric acid digestion of carbonate minerals 7205
presumably because our guess regarding the structure of thecarbonate-acid interface is imperfect. Nevertheless, it yieldsa trend of variations of oxygen isotope fractionations withcation identity that resembles experimental data, and thusthe approach may be a fruitful starting point for future,more sophisticated models.
This study provides a framework for understanding iso-tope fractionations accompanying phosphoric acid diges-tion of carbonate minerals, and applying them toconditions or materials that are not yet understood throughexperimental work. Furthermore, this study demonstrates atechnique of first-principles modeling of kinetic isotope ef-fects associated with irreversible reactions and illustratesthe utility of this technique by application to one of themore extensively studied inorganic reactions in stable iso-tope geochemistry, taking advantage of new constraintsprovided by clumped isotope measurements. This approachtherefore serves as a model for future work of similar butless well known kinetically-controlled fractionations.
2. THEORETICAL AND COMPUTATIONAL
METHODS
2.1. Transition state theory of reaction rates
Transition state theory is long established as a tool forstudying chemical kinetics (Eyring, 1935a,b) and has beenused previously to understand irreversible reactions ingeoscience problems (Lasaga, 1998; Felipe et al., 2001).Classical transition state theory is based on two key
assumptions (Felipe et al., 2001): (1) instead of transform-ing directly into products, reactants in a chemical reactionfirst proceed through an unstable chemical state called the‘‘transition state”, which has a higher chemical potential en-ergy than reactants or products; (2) the transition state mayonly form from the reactants (i.e., the conversion of thetransition state to products is irreversible), and any transi-tion state that proceeds in the reaction coordinate past itspotential energy maximum must eventually form products.This second assumption is also called the ‘‘non-recrossingrule”. For example, transition state theory would describeAþ B! CþD as proceeding through two steps: revers-ible transformation of reactants A and B into a transitionstate, M�, after which M� transforms irreversibly into prod-ucts C and D (i.e. Aþ B ¢
1M y !2 CþD). Therefore, the
rate of the overall reaction (i.e. the production rate of Cand D), R, equals the decomposition rate of the transitionstate, M� and can be described through the relation:
R ¼ ½My�
s¼ jmyLj½M y� ð1Þ
where [M�] is the concentration of transition state M�, s isthe average lifetime of transition state M� and myL is the‘decomposition frequency’ (defined as the reciprocal ofthe average life time) of M� (Melander and Saunders,1987; Felipe et al., 2001). The concentration of the transi-tion state, [M�], can be estimated by assuming that the
reversible reaction, Aþ B ¢1
M y, is at equilibrium(Melander and Saunders, 1987):
½M y� ¼ K½A�½B� ð2Þ
where [A] and [B] are the concentrations of reactant A andB respectively, and K is the equilibrium constant for reac-tion 1 and is evaluated using statistical thermodynamics(Urey, 1947):
K ¼ Qy
QA � QB
¼ sA � sB
sy
Q3N y�7
iuyi � 1
e12uy
i
� 1
1�e�uy
i
� �
Q3NA�6
jA
ujA� 1
e12ujA� 1
1�e�ujA
� ��Q3NB�6
jB
ujB� 1
e12ujB
� 11�e
�ujB
� �
uyi ¼hc-yikT
; ujA¼ hc-jA
kT; ujB
¼ hc-jB
kTð3Þ
where Q�, QA, QB are the partition functions of transitionstate M� and reactants, A and B, respectively; -yi ;-jA
;-jB
are the vibration frequencies, in wave numbers, for thetransition state M�and reactants, A and B, respectively(one such term is required for each mode of vibration ofeach species); s�, sA, sB are the symmetry numbers for tran-sition state M� and reactants A and B, respectively; N�, NA,NB are the numbers of atoms within transition state M� andreactants, A and B, respectively; h is Plank’s constant; c isthe velocity of light; k is the Boltzmann constant; and T
is the reaction temperature in Kelvin.When one is interested in kinetic isotope effects, as in
this study, relative reaction rates (i.e., the ratios of reactionrates of different isotopologues) are of greatest importance:
7206 W. Guo et al. / Geochimica et Cosmochimica Acta 73 (2009) 7203–7225
Rð1ÞRð2Þ¼jmyLjð1Þ½M y�ð1ÞjmyLjð2Þ½M y�ð2Þ
ð4Þ
where subscript (1) and (2) denote different isotopologuesof the transition state.
2.2. Application of transition state theory to phosphoric acid
digestion of carbonate minerals
2.2.1. Proposed reaction mechanism and transition state
structure during phosphoric acid digestion of carbonate
minerals
In order to calculate the partition function of the transi-tion state associated with phosphoric acid digestion of car-bonates, we must first determine or assume the transitionstate structure. This is commonly done by initially guessingthe structure of transition state and then refining on thatguess using ab inito calculations (Felipe et al., 2001).
Little is known about the exact reaction mechanism andtransition state structure during the phosphoric acid diges-tion of carbonate minerals. Although the transition statestructure suggested by Sharma and Sharma (1969b) is intu-itively appealing (Fig. 1a), there is no evidence to date thatsupports it. Instead, recent spectroscopic studies of calciumcarbonate undergoing reactions with anhydrous acidicgases (e.g., HNO3, SO2, HCOOH and CH3COOH) identi-fied absorbed H2CO3 on the carbonate surface and sug-gested carbonic acid as the important intermediate speciesduring these reactions (Al-Hosney and Grassian, 2004;Al-Hosney and Grassian, 2005). Though carbonic aciddecomposes rapidly in aqueous solution, it is kinetically sta-ble in the absence of water (Hage et al., 1998; Loertinget al., 2000 and reference therein). We suggest that theseexperiments are analogous to the local environment at thesurface of a carbonate mineral during reaction withanhydrous phosphoric acid (i.e., the 105% concentratedphosphoric acid used in stable isotope analyses of carbon-ates; Coplen et al., 1983). We therefore propose thatH2CO3 is also an intermediate during phosphoric aciddigestion of carbonate minerals, i.e. this reaction,XCO3 þH3PO4 ! XHPO4 þ CO2 þH2O, proceedsthrough two steps (Fig. 1b):
XCO3 þH3PO4!1
XHPO4 þH2CO3
H2CO3!2
CO2 þH2O
where X is a cation, such as Ca, contained in the carbonatemineral.
We infer that the first of these two reaction steps shouldbe associated with little or no net isotopic fraction-ation (including fractionations of multiply-substitutedisotopologues), for two reasons: (1) in practice, phosphoricacid digestion is always driven to completion before collect-ing and analyzing product CO2. Because CO2�
3 ionic unitsin the reactant carbonate are quantitatively converted intoH2CO3 during step 1, it is not possible to express a net iso-topic fractionation of C or O isotopes during that step, evenif that reaction has some intrinsic kinetic isotope effect.And, (2) any kinetic isotope effect that might accompanystep 1 could only be expressed if the site at which the
reaction occurs (i.e., a mineral surface) can undergo isoto-pic exchange with the unreacted mineral interior, whichwe consider unlikely at the low temperatures and anhy-drous conditions of phosphoric acid digestion. That is, weinfer that step 1 is analogous to sublimation of ice, whichgenerally fails to express a vapor pressure isotope effect be-cause the reaction effectively ‘peels’ away layers of the solidwithout leaving an isotopically modified residue. Similarly,we assume no oxygen isotope exchange between the car-bonic acid and the surrounding anhydrous phosphoricacids and among different carbonic acid isotopologues dur-ing the phosphoric acid digestion. In order for such ex-change to occur, C–O bonds in the carbonic acid wouldhave to break and reform. We regard this as unlikely giventhe kinetic stability of carbonic acid under anhydrousenvironments (Loerting et al., 2000; Hage et al., 1998 andreference therein). For these reasons, we focus on step2—the dissociation of carbonic acid.
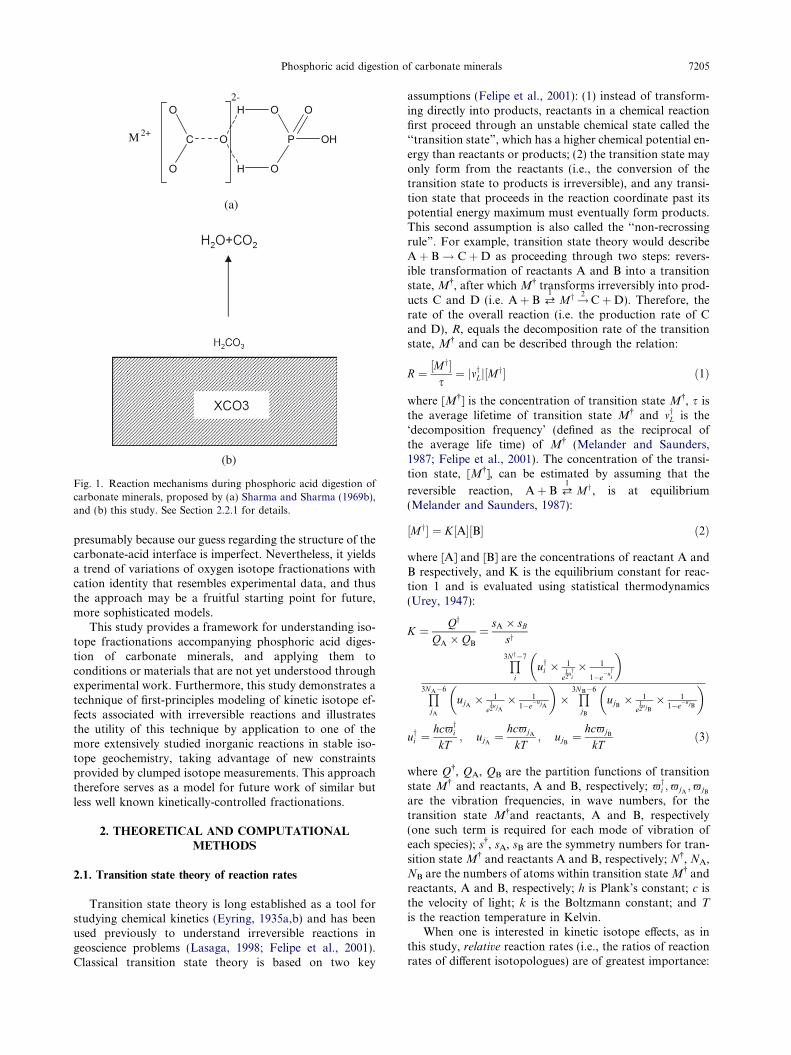
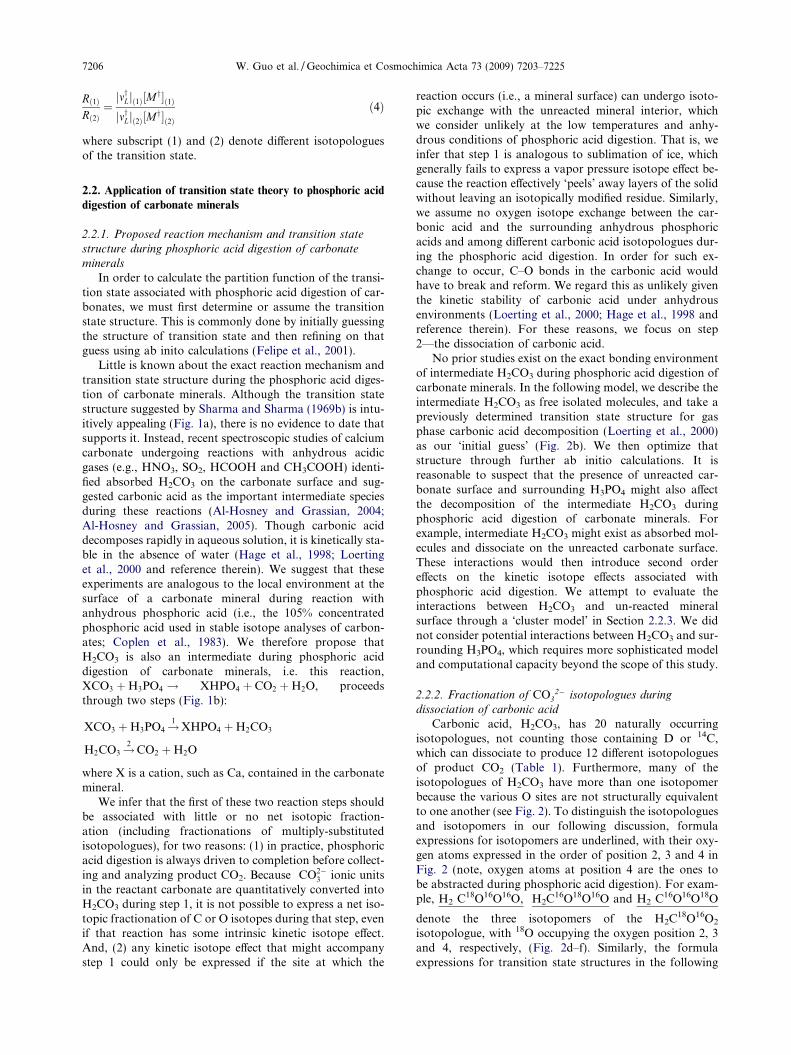
No prior studies exist on the exact bonding environmentof intermediate H2CO3 during phosphoric acid digestion ofcarbonate minerals. In the following model, we describe theintermediate H2CO3 as free isolated molecules, and take apreviously determined transition state structure for gasphase carbonic acid decomposition (Loerting et al., 2000)as our ‘initial guess’ (Fig. 2b). We then optimize thatstructure through further ab initio calculations. It isreasonable to suspect that the presence of unreacted car-bonate surface and surrounding H3PO4 might also affectthe decomposition of the intermediate H2CO3 duringphosphoric acid digestion of carbonate minerals. Forexample, intermediate H2CO3 might exist as absorbed mol-ecules and dissociate on the unreacted carbonate surface.These interactions would then introduce second ordereffects on the kinetic isotope effects associated withphosphoric acid digestion. We attempt to evaluate theinteractions between H2CO3 and un-reacted mineralsurface through a ‘cluster model’ in Section 2.2.3. We didnot consider potential interactions between H2CO3 and sur-rounding H3PO4, which requires more sophisticated modeland computational capacity beyond the scope of this study.
2.2.2. Fractionation of CO32� isotopologues during
dissociation of carbonic acid
Carbonic acid, H2CO3, has 20 naturally occurringisotopologues, not counting those containing D or 14C,which can dissociate to produce 12 different isotopologuesof product CO2 (Table 1). Furthermore, many of theisotopologues of H2CO3 have more than one isotopomerbecause the various O sites are not structurally equivalentto one another (see Fig. 2). To distinguish the isotopologuesand isotopomers in our following discussion, formulaexpressions for isotopomers are underlined, with their oxy-gen atoms expressed in the order of position 2, 3 and 4 inFig. 2 (note, oxygen atoms at position 4 are the ones tobe abstracted during phosphoric acid digestion). For exam-ple, H2 C18O16O16O, H2C16O18O16O and H2 C16O16O18O
denote the three isotopomers of the H2C18O16O2
isotopologue, with 18O occupying the oxygen position 2, 3and 4, respectively, (Fig. 2d–f). Similarly, the formulaexpressions for transition state structures in the following
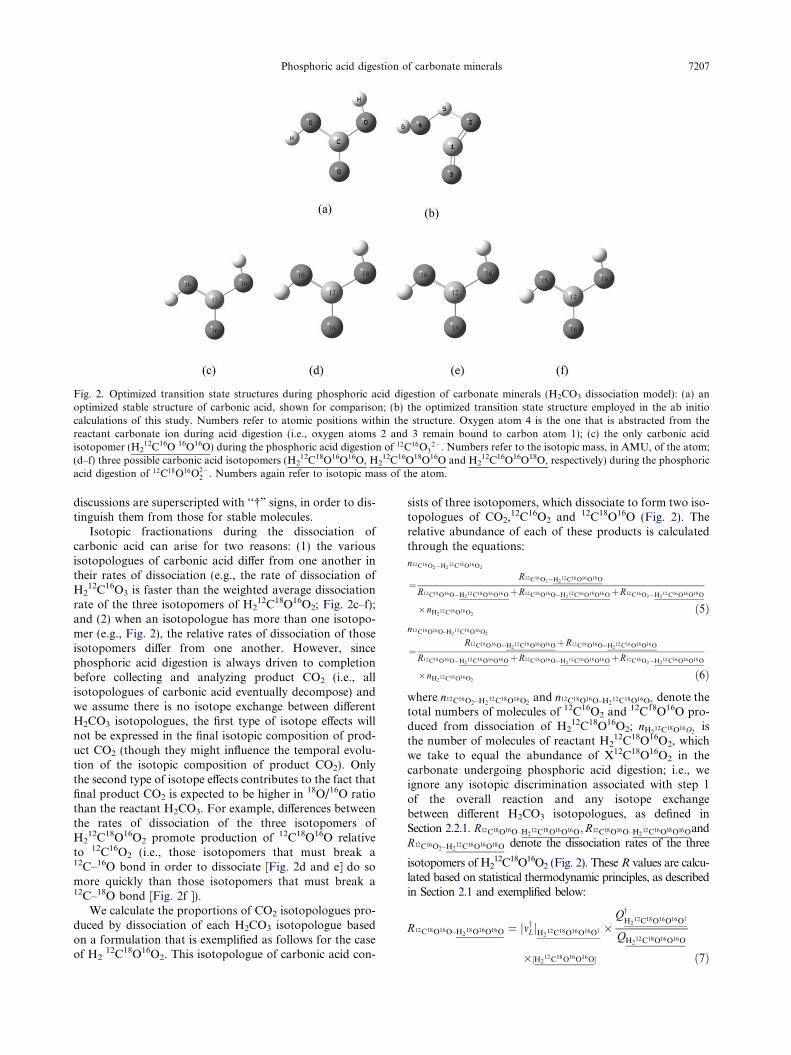
Fig. 2. Optimized transition state structures during phosphoric acid digestion of carbonate minerals (H2CO3 dissociation model): (a) anoptimized stable structure of carbonic acid, shown for comparison; (b) the optimized transition state structure employed in the ab initiocalculations of this study. Numbers refer to atomic positions within the structure. Oxygen atom 4 is the one that is abstracted from thereactant carbonate ion during acid digestion (i.e., oxygen atoms 2 and 3 remain bound to carbon atom 1); (c) the only carbonic acidisotopomer (H2
12C16O 16O16O) during the phosphoric acid digestion of 12C16O32�. Numbers refer to the isotopic mass, in AMU, of the atom;
(d–f) three possible carbonic acid isotopomers (H212C18O16O16O, H2
12C16O18O16O and H212C16O16O18O, respectively) during the phosphoric
acid digestion of 12C18O16O2�2 . Numbers again refer to isotopic mass of the atom.
Phosphoric acid digestion of carbonate minerals 7207
discussions are superscripted with ‘‘�” signs, in order to dis-tinguish them from those for stable molecules.
Isotopic fractionations during the dissociation ofcarbonic acid can arise for two reasons: (1) the variousisotopologues of carbonic acid differ from one another intheir rates of dissociation (e.g., the rate of dissociation ofH2
12C16O3 is faster than the weighted average dissociationrate of the three isotopomers of H2
12C18O16O2; Fig. 2c–f);and (2) when an isotopologue has more than one isotopo-mer (e.g., Fig. 2), the relative rates of dissociation of thoseisotopomers differ from one another. However, sincephosphoric acid digestion is always driven to completionbefore collecting and analyzing product CO2 (i.e., allisotopologues of carbonic acid eventually decompose) andwe assume there is no isotope exchange between differentH2CO3 isotopologues, the first type of isotope effects willnot be expressed in the final isotopic composition of prod-uct CO2 (though they might influence the temporal evolu-tion of the isotopic composition of product CO2). Onlythe second type of isotope effects contributes to the fact thatfinal product CO2 is expected to be higher in 18O/16O ratiothan the reactant H2CO3. For example, differences betweenthe rates of dissociation of the three isotopomers ofH2
12C18O16O2 promote production of 12C18O16O relativeto 12C16O2 (i.e., those isotopomers that must break a12C–16O bond in order to dissociate [Fig. 2d and e] do somore quickly than those isotopomers that must break a12C–18O bond [Fig. 2f ]).
We calculate the proportions of CO2 isotopologues pro-duced by dissociation of each H2CO3 isotopologue basedon a formulation that is exemplified as follows for the caseof H2
12C18O16O2. This isotopologue of carbonic acid con-
sists of three isotopomers, which dissociate to form two iso-topologues of CO2,12C16O2 and 12C18O16O (Fig. 2). Therelative abundance of each of these products is calculatedthrough the equations:
n12C16O2�H212C18O16O2
¼R12C16O2�H2
12C16O16O18O
R12C18O16O�H212C18O16O16OþR12C18O16O�H2
12C16O18O16OþR12C16O2�H212 C16O16O18 O
�nH212C18O16O2
ð5Þn12C18O16O–H2
12C18O16O2
¼R12C18O16O�H2
12C18 O16O16OþR12C18O16O�H212C16O18O16O
R12C18O16O�H212C18O16O16OþR12C18O16O�H2
12C16O18O16OþR12C16O2�H212 C16O16O18 O
�nH212C18O16O2
ð6Þ
where n12C16O2–H212C18O16O2
and n12C18O16O–H212C18O16O2
denote thetotal numbers of molecules of 12C16O2 and 12C18O16O pro-duced from dissociation of H2
12C18O16O2; nH212C18O16O2
isthe number of molecules of reactant H2
12C18O16O2, whichwe take to equal the abundance of X12C18O16O2 in thecarbonate undergoing phosphoric acid digestion; i.e., weignore any isotopic discrimination associated with step 1of the overall reaction and any isotope exchangebetween different H2CO3 isotopologues, as defined inSection 2.2.1. R12C18O16O–H2
12C18O16O16O;R12C18O16O–H212C16O18O16Oand
R12C16O2–H212C16O16O18O denote the dissociation rates of the three
isotopomers of H212C18O16O2 (Fig. 2). These R values are calcu-
lated based on statistical thermodynamic principles, as describedin Section 2.1 and exemplified below:
R12C18O16O–H218O16O16O ¼ jmyLjH2
12C18O16O16Oy �Qy
H212C18O16O16Oy
QH212C18O16O16O
�½H212C18O16O16O� ð7Þ
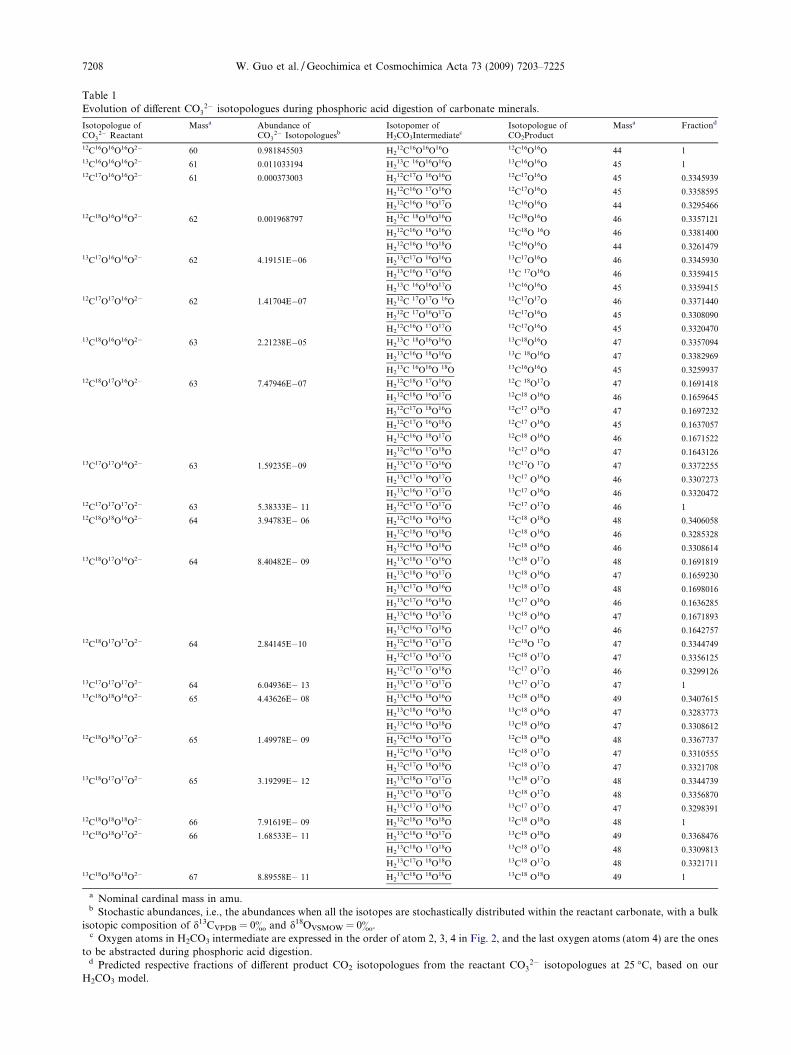
Table 1Evolution of different CO3
2� isotopologues during phosphoric acid digestion of carbonate minerals.
Isotopologue ofCO3
2� ReactantMassa Abundance of
CO32� Isotopologuesb
Isotopomer ofH2CO3Intermediatec
Isotopologue ofCO2Product
Massa Fractiond
12C16O16O16O2� 60 0.981845503 H212C16O16O16O 12C16O16O 44 1
13C16O16O16O2� 61 0.011033194 H213C 16O16O16O 13C16O16O 45 1
12C17O16O16O2� 61 0.000373003 H212C17O 16O16O 12C17O16O 45 0.3345939
H212C16O 17O16O 12C17O16O 45 0.3358595
H212C16O 16O17O 12C16O16O 44 0.3295466
12C18O16O16O2� 62 0.001968797 H212C 18O16O16O 12C18O16O 46 0.3357121
H212C16O 18O16O 12C18O 16O 46 0.3381400
H212C16O 16O18O 12C16O16O 44 0.3261479
13C17O16O16O2� 62 4.19151E�06 H213C17O 16O16O 13C17O16O 46 0.3345930
H213C16O 17O16O 13C 17O16O 46 0.3359415
H213C 16O16O17O 13C16O16O 45 0.3359415
12C17O17O16O2� 62 1.41704E�07 H212C 17O17O 16O 12C17O17O 46 0.3371440
H212C 17O16O17O 12C17O16O 45 0.3308090
H212C16O 17O17O 12C17O16O 45 0.3320470
13C18O16O16O2� 63 2.21238E�05 H213C 18O16O16O 13C18O16O 47 0.3357094
H213C16O 18O16O 13C 18O16O 47 0.3382969
H213C 16O16O 18O 13C16O16O 45 0.3259937
12C18O17O16O2� 63 7.47946E�07 H212C18O 17O16O 12C 18O17O 47 0.1691418
H212C18O 16O17O 12C18 O16O 46 0.1659645
H212C17O 18O16O 12C17 O18O 47 0.1697232
H212C17O 16O18O 12C17 O16O 45 0.1637057
H212C16O 18O17O 12C18 O16O 46 0.1671522
H212C16O 17O18O 12C17 O16O 47 0.1643126
13C17O17O16O2� 63 1.59235E�09 H213C17O 17O16O 13C17O 17O 47 0.3372255
H213C17O 16O17O 13C17 O16O 46 0.3307273
H213C16O 17O17O 13C17 O16O 46 0.3320472
12C17O17O17O2� 63 5.38333E� 11 H212C17O 17O17O 12C17 O17O 46 1
12C18O18O16O2� 64 3.94783E� 06 H212C18O 18O16O 12C18 O18O 48 0.3406058
H212C18O 16O18O 12C18 O16O 46 0.3285328
H212C16O 18O18O 12C18 O16O 46 0.3308614
13C18O17O16O2� 64 8.40482E� 09 H213C18O 17O16O 13C18 O17O 48 0.1691819
H213C18O 16O17O 13C18 O16O 47 0.1659230
H213C17O 18O16O 13C18 O17O 48 0.1698016
H213C17O 16O18O 13C17 O16O 46 0.1636285
H213C16O 18O17O 13C18 O16O 47 0.1671893
H213C16O 17O18O 13C17 O16O 46 0.1642757
12C18O17O17O2� 64 2.84145E�10 H212C18O 17O17O 12C18O 17O 47 0.3344749
H212C17O 18O17O 12C18 O17O 47 0.3356125
H212C17O 17O18O 12C17 O17O 46 0.3299126
13C17O17O17O2� 64 6.04936E� 13 H213C17O 17O17O 13C17 O17O 47 1
13C18O18O16O2� 65 4.43626E� 08 H213C18O 18O16O 13C18 O18O 49 0.3407615
H213C18O 16O18O 13C18 O16O 47 0.3283773
H213C16O 18O18O 13C18 O16O 47 0.3308612
12C18O18O17O2� 65 1.49978E� 09 H212C18O 18O17O 12C18 O18O 48 0.3367737
H212C18O 17O18O 12C18 O17O 47 0.3310555
H212C17O 18O18O 12C18 O17O 47 0.3321708
13C18O17O17O2� 65 3.19299E� 12 H213C18O 17O17O 13C18 O17O 48 0.3344739
H213C17O 18O17O 13C18 O17O 48 0.3356870
H213C17O 17O18O 13C17 O17O 47 0.3298391
12C18O18O18O2� 66 7.91619E� 09 H212C18O 18O18O 12C18 O18O 48 1
13C18O18O17O2� 66 1.68533E� 11 H213C18O 18O17O 13C18 O18O 49 0.3368476
H213C18O 17O18O 13C18 O17O 48 0.3309813
H213C17O 18O18O 13C18 O17O 48 0.3321711
13C18O18O18O2� 67 8.89558E� 11 H213C18O 18O18O 13C18 O18O 49 1
a Nominal cardinal mass in amu.b Stochastic abundances, i.e., the abundances when all the isotopes are stochastically distributed within the reactant carbonate, with a bulk
isotopic composition of d13CVPDB = 0& and d18OVSMOW = 0&.c Oxygen atoms in H2CO3 intermediate are expressed in the order of atom 2, 3, 4 in Fig. 2, and the last oxygen atoms (atom 4) are the ones
to be abstracted during phosphoric acid digestion.d Predicted respective fractions of different product CO2 isotopologues from the reactant CO3
2� isotopologues at 25 �C, based on ourH2CO3 model.
7208 W. Guo et al. / Geochimica et Cosmochimica Acta 73 (2009) 7203–7225
Phosphoric acid digestion of carbonate minerals 7209
R12C18O16O–H216O18O16O ¼ jmyLjH2
12C16O18O16Oy �Qy
H212C16O18O16Oy
QH212C16O18O16O
�½H212C16O18O16O� ð8Þ
R12C16O2–H216O16O18O ¼ jmyLjH2
12C16O16O18Oy �Qy
H212C16O16O18Oy
QH212C16O16O18O
�½H212C16O16O18O� ð9Þ
where [H212C18O16O16O], [H2
12C16O18O16O], [H212C16O
16O18O] are the abundances of the different isotopomers
of H212C18O16O2 (Fig. 2d–f, respectively). Because the life-
time of carbonic acid is relatively long under anhydrousconditions (Loerting et al., 2000 and reference therein),we assume the concentrations of these various carbonic acidisotopomers are in equilibrium (presumably through the ex-changes of protons):
½H212C18O16O16O�
QH212C18O16O16O
¼ ½H212C16O18O16O�
QH212C16O18O16O
¼ ½H212C16O16O18O�
QH212C16O16O18O
ð10Þ
therefore,
R12C18O16O�H212C18O16O16O : R12C18O16O�H2
12C16O18O16O
: R12C16O2�H212C16O16O18O ¼ ðjmyLj � QyÞH2
12C18O16O16Oy
: ðjmyLj � QyÞH212C18O16O16Oy : ðjmyLj � QyÞH2
12C16O16O18Oy ð11Þ
The relations given above for the case of H212C18O16O2
are applied to all the isotopologues of H2CO3 that are capa-ble of producing more than one CO2 isotopologue; forH2CO3 isotopologues capable of producing only one CO2
isotopologue, ni values for that CO2 isotopologueproduced from that H2CO3 isotopologue equal nj of thatH2CO3 isotopologue, e.g., for isotopologue H2
12C16O3;n12C16O2�H2
12C16O3¼ nH2
12C16O3. The summation of all ni values
for the various isotopologues of CO2 produced from all iso-topologues of H2CO3 allow us to calculate the isotopicfractionations (including the fractionations of multiplysubstituted isotopologues) associated with acid digestion(Table 1).
2.2.3. Exploration of cation effects during phosphoric acid
digestion through cluster models
The cation compositions of carbonate minerals mightexert a second-order, but measurable influence on the oxy-gen isotope fractionation associated with phosphoric aciddigestion (e.g., Gilg et al., 2003). The data in support ofsuch effects are open to question, as the fluorination mea-surements required to independently establish the d18O val-ues of reactant carbonates generally have poorer thanexpected reproducibility (and other peculiarities). Neverthe-less, mineral-specific acid digestion fractionations seempossible and are widely assumed. The H2CO3-dissociationmodel we described above cannot account for sucheffects because it describes carbonic acid, the reactionintermediate, as free isolated molecules without any interac-tions with the cations present in the carbonate mineral(Section 2.2.1). Thus, while our approach has the advantageof allowing for a relatively rigorous treatment of part of theacid digestion process, it is an over-simplification that will
not permit full understanding of differences in fractiona-tions between various types of carbonate minerals. We havetried to develop an understanding of these second-order ef-fects by constructing a ‘cluster model’ that describes the dis-sociation of H2CO3 attached to XCO3 clusters, whichsimulates the situation where H2CO3 is influenced by bondson the surface of adjacent, un-reacted carbonate. Similar abinitio cluster models have been used previously to investi-gate local properties and reactions of carbonate surfaces,such as hydration (Mao and Siders, 1997) and adsorption(Ruuska et al., 1999). In this study, we limit our model tosmall clusters comprising only two XCO3 units, i.e.(XCO3)2 � H2CO3, where X = Mg2+, Ca2+, Mn2+, Fe2+,Zn2+, Sr2+, Pb2+, Ba2+.
Following the same method outlined in previous sec-tions, we obtain the structures of the transition states forthese clusters (Fig. 3) and derive the isotope fractionationsduring phosphoric acid digestion of different carbonateminerals. Note, we will confine our discussion on this clus-ter model to Section 4.4. In other parts of the text, ‘‘model”refers to the H2CO3 dissociation model described in Section2.2.1, unless stated otherwise.
2.3. Computational methods
Molecular geometries were optimized and bond frequen-cies were calculated for the transition state isotopologuesusing the Jaguar program (Ringnalda et al., 2005), on aworkstation cluster with 79 Dell PowerEdge-2650 servernodes (Xeno, 2.2–2.4 GHz, 512 K) in the Materials andProcess Simulation Center at Caltech. The singlet state elec-tron wave functions of the molecular configurations werebuilt using a density functional theory with hybrid func-tionals, B3LYP, and extended basis sets 6–31G� (for theH2CO3 model) and LACV3P (for the cluster model). Thesewere selected based on their previous success in similar abinitio models (Foresman and Frisch, 1993; Scott andRadom, 1996; Ringnalda et al., 2005).
Ab initio harmonic oscillator calculations typically over-estimate vibration frequencies, mostly because they neglectthe effects of anharmonicity (Scott and Radom, 1996).Therefore, a scaling factor based on the comparison be-tween the calculated bond vibration frequencies and exper-imentally measured frequencies usually needs to be appliedto harmonic frequencies derived from ab initio models. Noexperimentally-measured frequencies of the assumedcarbonic acid transition state are available for comparisonwith our ab initio model. Therefore, we have used a univer-sal frequency scaling factor of 0.9614, previously shown tobe appropriate for B3LYP/6-31G� calculations (Scott andRadom, 1996). To test the effectiveness of this assumed fre-quency scaling factor, we computed the vibration frequen-cies for the carbonic acid molecule using the B3LYP/6-31G� method, applied the 0.9614 scaling factor, andcompared the scaled bond-vibration frequencies to the pre-viously published results (Tossell, 2006) from more sophis-ticated, higher level calculations (CCSD/6-311+G(2d,p)level) and anharmonicity corrections (B3LYP/CBSB7level). Results from these two independent models aregenerally consistent with each other (Fig. 4), suggesting that
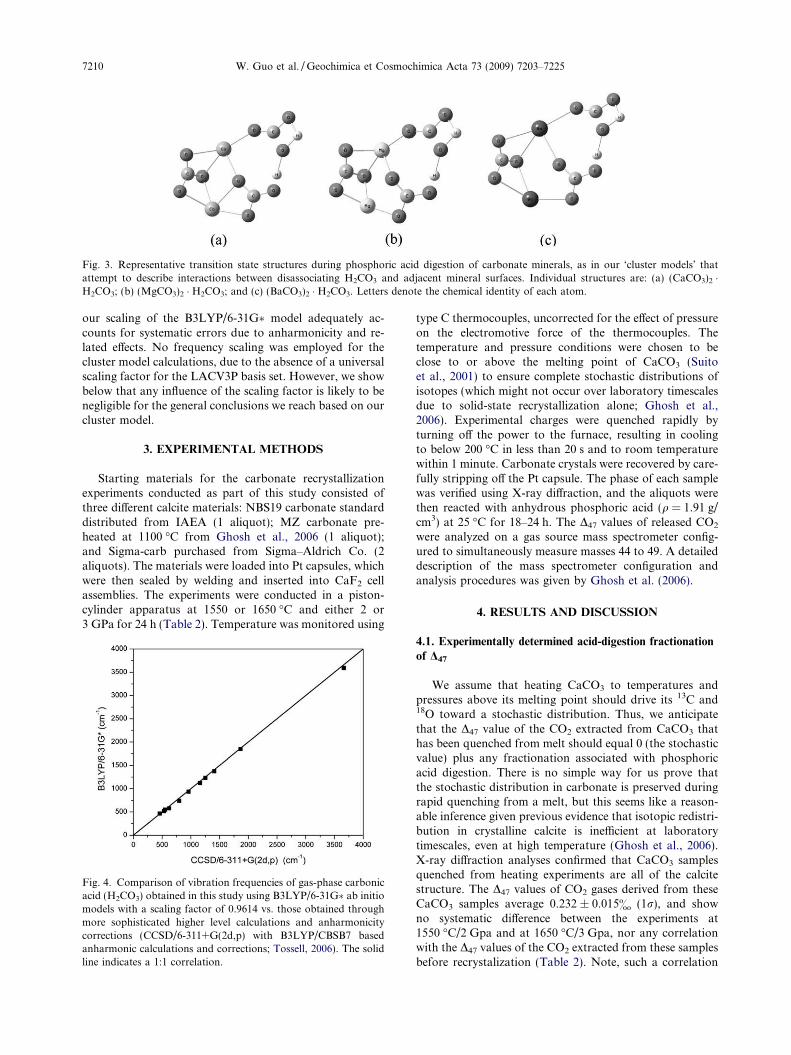
Fig. 3. Representative transition state structures during phosphoric acid digestion of carbonate minerals, as in our ‘cluster models’ thatattempt to describe interactions between disassociating H2CO3 and adjacent mineral surfaces. Individual structures are: (a) (CaCO3)2 �H2CO3; (b) (MgCO3)2 � H2CO3; and (c) (BaCO3)2 � H2CO3. Letters denote the chemical identity of each atom.
7210 W. Guo et al. / Geochimica et Cosmochimica Acta 73 (2009) 7203–7225
our scaling of the B3LYP/6-31G� model adequately ac-counts for systematic errors due to anharmonicity and re-lated effects. No frequency scaling was employed for thecluster model calculations, due to the absence of a universalscaling factor for the LACV3P basis set. However, we showbelow that any influence of the scaling factor is likely to benegligible for the general conclusions we reach based on ourcluster model.
3. EXPERIMENTAL METHODS
Starting materials for the carbonate recrystallizationexperiments conducted as part of this study consisted ofthree different calcite materials: NBS19 carbonate standarddistributed from IAEA (1 aliquot); MZ carbonate pre-heated at 1100 �C from Ghosh et al., 2006 (1 aliquot);and Sigma-carb purchased from Sigma–Aldrich Co. (2aliquots). The materials were loaded into Pt capsules, whichwere then sealed by welding and inserted into CaF2 cellassemblies. The experiments were conducted in a piston-cylinder apparatus at 1550 or 1650 �C and either 2 or3 GPa for 24 h (Table 2). Temperature was monitored using
Fig. 4. Comparison of vibration frequencies of gas-phase carbonicacid (H2CO3) obtained in this study using B3LYP/6-31G� ab initiomodels with a scaling factor of 0.9614 vs. those obtained throughmore sophisticated higher level calculations and anharmonicitycorrections (CCSD/6-311+G(2d,p) with B3LYP/CBSB7 basedanharmonic calculations and corrections; Tossell, 2006). The solidline indicates a 1:1 correlation.
type C thermocouples, uncorrected for the effect of pressureon the electromotive force of the thermocouples. Thetemperature and pressure conditions were chosen to beclose to or above the melting point of CaCO3 (Suitoet al., 2001) to ensure complete stochastic distributions ofisotopes (which might not occur over laboratory timescalesdue to solid-state recrystallization alone; Ghosh et al.,2006). Experimental charges were quenched rapidly byturning off the power to the furnace, resulting in coolingto below 200 �C in less than 20 s and to room temperaturewithin 1 minute. Carbonate crystals were recovered by care-fully stripping off the Pt capsule. The phase of each samplewas verified using X-ray diffraction, and the aliquots werethen reacted with anhydrous phosphoric acid (q = 1.91 g/cm3) at 25 �C for 18–24 h. The D47 values of released CO2
were analyzed on a gas source mass spectrometer config-ured to simultaneously measure masses 44 to 49. A detaileddescription of the mass spectrometer configuration andanalysis procedures was given by Ghosh et al. (2006).
4. RESULTS AND DISCUSSION
4.1. Experimentally determined acid-digestion fractionation
of D47
We assume that heating CaCO3 to temperatures andpressures above its melting point should drive its 13C and18O toward a stochastic distribution. Thus, we anticipatethat the D47 value of the CO2 extracted from CaCO3 thathas been quenched from melt should equal 0 (the stochasticvalue) plus any fractionation associated with phosphoricacid digestion. There is no simple way for us prove thatthe stochastic distribution in carbonate is preserved duringrapid quenching from a melt, but this seems like a reason-able inference given previous evidence that isotopic redistri-bution in crystalline calcite is inefficient at laboratorytimescales, even at high temperature (Ghosh et al., 2006).X-ray diffraction analyses confirmed that CaCO3 samplesquenched from heating experiments are all of the calcitestructure. The D47 values of CO2 gases derived from theseCaCO3 samples average 0.232 ± 0.015& (1r), and showno systematic difference between the experiments at1550 �C/2 Gpa and at 1650 �C/3 Gpa, nor any correlationwith the D47 values of the CO2 extracted from these samplesbefore recrystalization (Table 2). Note, such a correlation

Table 2Fractionation of multiply-substituted isotopologues, D�47 (see text for the definition), during phosphoric acid digestion of CaCO3 at 25 �Cdetermined through phosphoric acid digestion of high temperature and pressure equilibrated CaCO3 (calcite) samples.
Sample Before re-crystallization Re-crystallization experiments After re-crystallization
D47
(&)d13CVPDB
(&)d18OVSMOW
(&)T(�C)
P(GPa)
Duration(h)
D47
(&)1ra d13CVPDB
(&)d18OVSMOW
(&)
Re-crystallized MZ 0.267 �13.66 34.61 1550 2 24 0.234 0.025(3) �17.03 34.11NBS19 standard 0.334 2.01 39.28 1550 2 24 0.210 0.012(2) �4.82 38.64Sigma carbonate 0.468 �42.28 20.55 1550 2 24 0.243 0.015(3) �33.96 20.44
1650 3 24 0.239 0.009(2) �25.82 20.78
a 1r denotes the external standard deviation. Numbers in the bracket indicate the numbers of independent replicate extraction and isotopicanalyses of the carbonate samples after re-crystallization.
Phosphoric acid digestion of carbonate minerals 7211
was observed by Ghosh et al. (2006), in the products ofsolid-state recrystallization experiments, leading them toconclude that such treatment led to only partial approachto the stochastic distribution. These results support ourinference that our heating experiments succeeded at driv-ing these samples to a stochastic distribution, and thus im-ply that the ‘clumped isotope’ fractionation of 13C–18Obonds during phosphoric acid digestion of calcite at25 �C corresponds to an increase in D47 of 0.23& in prod-uct CO2.
4.2. Model results for the oxygen-isotope and clumped-
isotope fractionations associated with phosphoric acid
digestion
Table 3 summarizes the vibration frequencies we calcu-late for the various isotopologues and isotopomers of tran-sition states in our H2CO3 dissociation model. The negativefrequencies, -1, correspond to the decomposition frequen-cies myL in Section 3.1 (Melander and Saunders, 1987).Following procedures outlined in Section 3, these frequen-cies are used in our transition-state-based predictions of theproportions of different CO2 isotopologues that are pro-duced by dissociation of the H2CO3 intermediate, and thetemperature dependence of those proportions. Unless sta-ted otherwise, all of our calculations assume that reactantcarbonate has a d13CVPDB value of 0&, a d18OVSMOW valueof 0& and a stochastic distribution of multiply-substitutedisotopologues (Table 1), and that the H2CO3 intermediate isidentical in isotopic composition to reactant carbonate(Section 2.2.2).
We define the fractionations of oxygen isotope(1000 lna*) and multiply substituted species ðD�47;D
�48;D
�49Þ
during phosphoric acid digestion as the differences betweend18O, D47, D48, D49 in the product CO2 and d18O,D63,D64,D65 in the reactant carbonates, respectively:
1000 ln a� ¼ 1000 lnd18OCO2
=1000þ 1
d18OXCO3=1000þ 1
;
D�47 ¼ D47 � D63; D�48 ¼ D48 � D64; D�49 ¼ D49 � D65
where D48, D49, D63, D64 and D65 are defined, similar to D47,following the same principle as in Eiler and Schauble(2004):
D48 ¼R48
actual
R48stochastic
� 1
� �� 1000
¼½12C18O18O�þ½13C18O17O�
½12C16O16O�½12C18O18O�sþ½13C18O17O�s
½12C16O16O�s
� 1
0@
1A� 1000; ð12Þ
D49 ¼R49
actual
R49stochastic
� 1
� �� 1000
¼½13C18O18O�½12C16O16O�½13C18O18O�s½12C16O16O�s
� 1
0@
1A� 1000; ð13Þ
D63¼R63
actual
R63stochastic
�1
� ��1000
¼½X 13C18O16O16O�þ½X 12 C18 O17 O16 O�þ½X 13 C17 O17O16O�þ½X 12C17O17O17O�
½X 12C16O16O16O�½X 13C18O16O16O�sþ½X 12C18O17O16O�sþ½X 13 C17 O17O16O�sþ½X 12 C17 O17 O17 O�s
½X 12C16O16O16O�s
�1
0@
1A�1000;
ð14Þ
D64¼R64
actual
R64stochastic
�1
� ��1000
¼½X 12C18O18O16O�þ½X 13 C18 O17 O16 O�þ½X 12 C18 O18O17O�þ½X 13C17O17O17O�
½X 12C16O16O16O�½X 12C18O18O16O�sþ½X 13C18O17O16O�sþ½X 12 C18 O18O17O�sþ½X 13 C17 O17 O17 O�s
½X 12C16O16O16O�s
�1
0@
1A�1000;
ð15Þ
D65 ¼R65
actual
R65stochastic
� 1
� �� 1000
¼½X 12C18O18O17O�þ½X 13C18O18O16O�þ½X 13C18O17O17O�
½X 12C16O16O16O�½X 12C18O18O17O�sþ½X 13C18O18O16O�sþ½X 13C18O17O17O�s
½X 12C16O16O16O�s
� 1
0@
1A� 1000; ð16Þ
where ‘s’ in the subscript denotes the expected abundanceof an isotopologue when all the isotopes are stochasticallydistributed; and X denotes the cation contained in the car-bonate mineral.
Fig. 5 and Table 4 present the oxygen isotope fractiona-tions that accompany phosphoric acid digestion over arange of relevant temperatures, as predicted by our transi-tion-state theory model. The predicted oxygen isotope frac-tionation and its temperature dependence are broadlysimilar to those determined for different carbonate mineralsin previous laboratory studies. At 25 �C, our model pre-dicted oxygen isotope fractionation of 10.72&, is in themiddle of the range of observed fractionations among dif-ferent carbonate minerals (from 10.06& for MnCO3 to11.92& for MgCO3), and is close to the experimental

Table 3Scaled vibration frequencies (unit: cm�1) for different transition state structure isotopomers during phosphoric acid digestion of carbonateminerals (H2CO3 model, DFT-B3LYP/6-31G� with a frequency scaling factor of 0.9614). Oxygen atoms in the transition state structureisotopomers are expressed in the order of atom 2, 3 and 4 in Fig. 2.
Isotopomer -1 -2 -3 -4 -5 -6 -7 -8 -9 -10 -11 -12
H212C16O16O16O� �1650.22 381.74 489.85 588.65 720.73 760.00 927.16 1246.50 1267.18 1903.52 2102.57 3573.50
H213C16O16O16O� �1643.59 380.77 488.29 577.55 710.57 754.21 920.93 1234.69 1266.94 1881.48 2069.33 3573.50
H212C17O16O16O� �1649.47 381.07 489.52 587.30 716.91 750.19 925.95 1230.07 1266.52 1901.17 2101.66 3573.50
H212C16O17O16O� �1650.10 378.19 488.88 587.13 719.09 755.13 926.78 1237.11 1266.92 1896.67 2094.47 3573.50
H212C16O16O17O� �1649.38 377.05 487.91 587.36 713.34 757.87 924.34 1246.34 1265.39 1902.99 2102.51 3567.31
H212C18O16O16O� �1648.80 380.42 489.21 586.08 713.11 741.52 924.84 1215.38 1265.98 1899.15 2100.89 3573.50
H212C16O18O16O� �1649.99 374.93 488.00 585.78 717.47 750.72 926.43 1228.35 1266.80 1890.27 2087.85 3573.50
H212C16O16O18O� �1648.64 372.65 486.21 586.06 706.41 756.43 921.86 1246.19 1263.81 1902.53 2102.45 3561.83
H213C17O16O16O� �1642.83 380.13 488.01 576.12 707.41 744.04 919.75 1217.63 1266.31 1878.83 2068.74 3573.50
H213C16O17O16O� �1643.46 377.27 487.23 576.01 708.42 750.10 920.55 1225.28 1266.72 1872.20 2063.05 3573.50
H213C16O16O17O� �1642.75 376.08 486.35 576.41 704.07 751.04 918.05 1234.52 1265.14 1881.01 2069.22 3567.30
H212C17O17O16O� �1649.35 377.52 488.56 585.76 715.41 745.12 925.59 1220.74 1266.33 1894.08 2093.59 3573.50
H212C17O16O17O� �1648.63 376.41 487.58 585.96 709.09 748.37 923.15 1229.93 1264.71 1900.64 2101.59 3567.31
H212C16O17O17O� �1649.26 373.46 486.96 585.84 711.98 752.68 923.96 1236.95 1265.12 1896.15 2094.39 3567.31
H213C18O16O16O� �1642.14 379.51 487.73 574.82 704.33 734.92 918.66 1202.37 1265.78 1876.56 2068.24 3573.50
H213C16O18O16O� �1643.34 374.05 486.27 574.66 706.31 746.40 920.21 1216.51 1266.59 1863.66 2058.04 3573.50
H213C16O16O18O� �1642.00 371.68 484.64 575.27 697.76 748.85 915.50 1234.38 1263.55 1880.60 2069.11 3561.83
H212C18O17O16O� �1648.68 376.86 488.26 584.53 711.79 736.22 924.50 1206.14 1265.81 1891.85 2092.85 3573.50
H212C18O16O17O� �1647.96 375.78 487.27 584.69 704.84 740.04 922.07 1215.25 1264.17 1898.62 2100.82 3567.30
H212C17O18O16O� �1649.24 374.25 487.71 584.41 713.89 740.56 925.26 1212.10 1266.21 1887.46 2087.00 3573.50
H212C17O16O18O� �1647.89 372.02 485.88 584.61 701.79 747.20 920.69 1229.81 1263.12 1900.18 2101.54 3561.83
H212C16O18O17O� �1649.15 370.15 486.11 584.50 710.69 747.92 923.62 1228.19 1265.00 1889.76 2087.76 3567.31
H212C16O17O18O� �1648.51 369.01 485.28 584.55 705.19 751.07 921.48 1236.82 1263.53 1895.70 2094.33 3561.83
H213C17O17O16O� �1642.70 376.62 486.96 574.56 705.29 739.84 919.39 1208.33 1266.13 1869.28 2062.50 3573.50
H213C17O16O17O� �1641.99 375.46 486.07 574.94 700.60 741.04 916.89 1217.48 1264.51 1878.36 2068.62 3567.30
H213C16O17O17O� �1642.62 372.53 485.31 574.88 702.27 746.55 917.68 1225.12 1264.92 1871.74 2062.91 3567.30
H212C17O17O17O� �1648.51 372.80 486.65 584.43 707.89 742.97 922.80 1220.60 1264.52 1893.56 2093.51 3567.30
H212C18O18O16O� �1648.57 373.59 487.42 583.16 710.40 731.48 924.19 1197.60 1265.70 1885.04 2086.30 3573.50
H212C18O16O18O� �1647.21 371.41 485.56 583.28 697.20 739.13 919.62 1215.14 1262.56 1898.16 2100.76 3561.82
H212C16O18O18O� �1648.40 365.67 484.44 583.22 704.07 746.11 921.15 1228.05 1263.40 1889.31 2087.69 3561.83
H213C18O17O16O� �1642.01 375.99 486.70 573.25 702.27 730.63 918.33 1193.18 1265.62 1866.79 2062.04 3573.50
H213C18O16O17O� �1641.30 374.86 485.79 573.61 697.17 732.16 915.83 1202.23 1263.98 1876.09 2068.12 3567.30
H213C17O18O16O� �1642.58 373.39 486.01 573.20 703.17 736.12 919.08 1199.68 1266.01 1860.50 2057.53 3573.50
H213C17O16O18O� �1641.23 371.07 484.35 573.76 693.95 739.07 914.36 1217.36 1262.91 1877.95 2068.52 3561.82
H213C16O18O17O� �1642.50 369.27 484.37 573.53 700.54 742.45 917.34 1216.33 1264.79 1863.21 2057.90 3567.30
H213C16O17O18O� �1641.87 368.09 483.62 573.74 696.18 744.09 915.14 1224.97 1263.33 1871.34 2062.80 3561.82
H212C18O17O17O� �1647.84 372.17 486.35 583.15 703.81 734.43 921.73 1206.01 1264.00 1891.33 2092.77 3567.30
H212C17O18O17O� �1648.40 369.49 485.81 583.08 706.73 738.01 922.48 1211.96 1264.41 1886.95 2086.92 3567.30
H212C17O17O18O� �1647.76 368.38 484.96 583.09 700.72 741.63 920.33 1220.48 1262.93 1893.11 2093.45 3561.83
H213C17O17O17O� �1641.85 371.91 485.04 573.39 698.92 736.38 916.54 1208.18 1264.33 1868.83 2062.36 3567.30
H213C18O18O16O� �1641.90 372.76 485.76 571.88 700.13 726.89 918.04 1184.64 1265.50 1857.79 2057.10 3573.50
H213C18O16O18O� �1640.55 370.49 484.08 572.38 690.16 730.46 913.32 1202.12 1262.38 1875.68 2068.02 3561.82
H213C16O18O18O� �1641.75 364.78 482.70 572.40 694.69 739.72 914.81 1216.18 1263.20 1862.82 2057.77 3561.82
H212C18O18O17O� �1647.73 368.85 485.53 581.79 702.81 729.25 921.42 1197.47 1263.89 1884.52 2086.21 3567.30
H212C18O17O18O� �1647.09 367.76 484.66 581.75 696.27 733.38 919.28 1205.90 1262.40 1890.88 2092.70 3561.82
H212C17O18O18O� �1647.65 365.03 484.14 581.75 699.73 736.48 920.02 1211.83 1262.81 1886.50 2086.84 3561.82
H213C18O17O17O� �1641.17 371.29 484.78 572.05 695.63 727.32 915.50 1193.04 1263.82 1866.33 2061.90 3567.30
H213C17O18O17O� �1641.74 368.63 484.12 572.03 697.26 732.17 916.23 1199.52 1264.21 1860.05 2057.39 3567.30
H213C17O17O18O� �1641.10 367.48 483.35 572.22 692.51 734.13 914.02 1208.05 1262.73 1868.42 2062.24 3561.82
H212C18O18O18O� �1646.98 364.40 483.85 580.40 695.42 728.04 918.98 1197.36 1262.30 1884.07 2086.13 3561.82
H213C18O18O17O� �1641.05 368.01 483.87 570.68 694.07 722.97 915.21 1184.49 1263.70 1857.34 2056.96 3567.30
H213C18O17O18O� �1640.42 366.88 483.09 570.83 688.88 725.32 913.00 1192.92 1262.22 1865.93 2061.78 3561.82
H213C17O18O18O� �1640.99 364.17 482.44 570.86 691.14 729.60 913.71 1199.39 1262.62 1859.66 2057.26 3561.82
H213C18O18O18O� �1640.31 363.56 482.19 569.46 687.64 720.61 912.71 1184.37 1262.10 1856.95 2056.82 3561.82
7212 W. Guo et al. / Geochimica et Cosmochimica Acta 73 (2009) 7203–7225
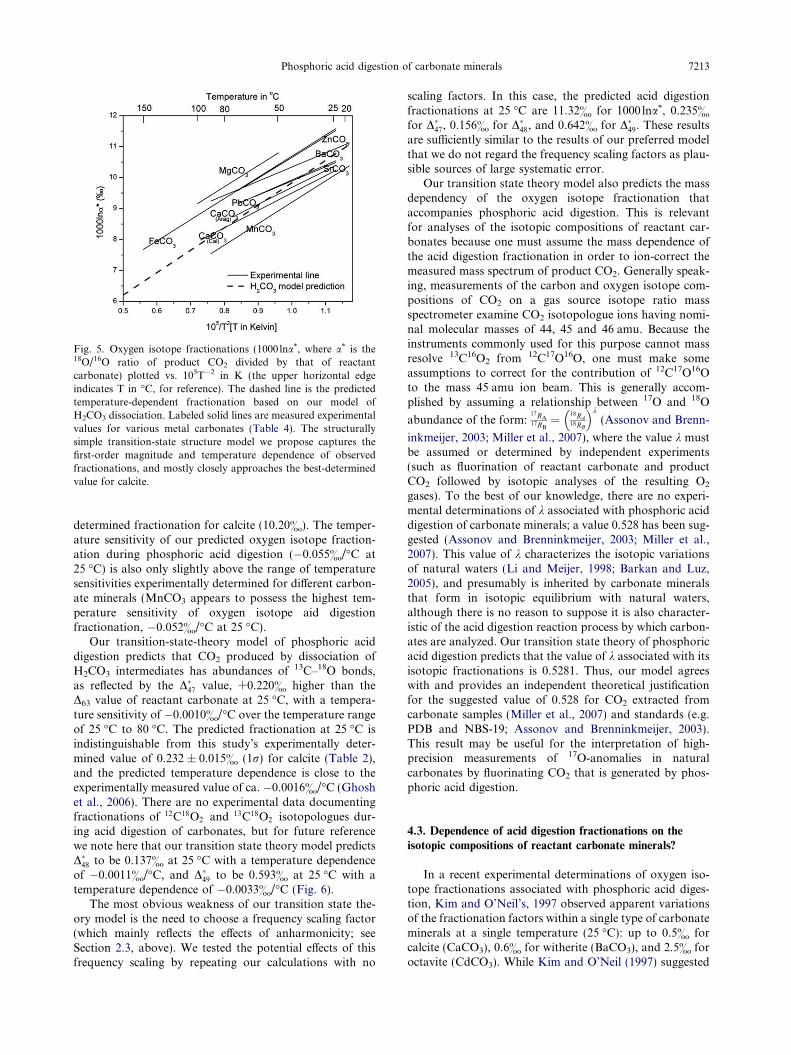
Fig. 5. Oxygen isotope fractionations (1000lna*, where a* is the18O/16O ratio of product CO2 divided by that of reactantcarbonate) plotted vs. 105T�2 in K (the upper horizontal edgeindicates T in �C, for reference). The dashed line is the predictedtemperature-dependent fractionation based on our model ofH2CO3 dissociation. Labeled solid lines are measured experimentalvalues for various metal carbonates (Table 4). The structurallysimple transition-state structure model we propose captures thefirst-order magnitude and temperature dependence of observedfractionations, and mostly closely approaches the best-determinedvalue for calcite.
Phosphoric acid digestion of carbonate minerals 7213
determined fractionation for calcite (10.20&). The temper-ature sensitivity of our predicted oxygen isotope fraction-ation during phosphoric acid digestion (�0.055&/�C at25 �C) is also only slightly above the range of temperaturesensitivities experimentally determined for different carbon-ate minerals (MnCO3 appears to possess the highest tem-perature sensitivity of oxygen isotope aid digestionfractionation, �0.052&/�C at 25 �C).
Our transition-state-theory model of phosphoric aciddigestion predicts that CO2 produced by dissociation ofH2CO3 intermediates has abundances of 13C–18O bonds,as reflected by the D�47 value, +0.220& higher than theD63 value of reactant carbonate at 25 �C, with a tempera-ture sensitivity of �0.0010&/�C over the temperature rangeof 25 �C to 80 �C. The predicted fractionation at 25 �C isindistinguishable from this study’s experimentally deter-mined value of 0.232 ± 0.015& (1r) for calcite (Table 2),and the predicted temperature dependence is close to theexperimentally measured value of ca. �0.0016&/�C (Ghoshet al., 2006). There are no experimental data documentingfractionations of 12C18O2 and 13C18O2 isotopologues dur-ing acid digestion of carbonates, but for future referencewe note here that our transition state theory model predictsD�48 to be 0.137& at 25 �C with a temperature dependenceof �0.0011&/�C, and D�49 to be 0.593& at 25 �C with atemperature dependence of �0.0033&/�C (Fig. 6).
The most obvious weakness of our transition state the-ory model is the need to choose a frequency scaling factor(which mainly reflects the effects of anharmonicity; seeSection 2.3, above). We tested the potential effects of thisfrequency scaling by repeating our calculations with no
scaling factors. In this case, the predicted acid digestionfractionations at 25 �C are 11.32& for 1000 lna*, 0.235&
for D�47, 0.156& for D�48, and 0.642& for D�49. These resultsare sufficiently similar to the results of our preferred modelthat we do not regard the frequency scaling factors as plau-sible sources of large systematic error.
Our transition state theory model also predicts the massdependency of the oxygen isotope fractionation thataccompanies phosphoric acid digestion. This is relevantfor analyses of the isotopic compositions of reactant car-bonates because one must assume the mass dependence ofthe acid digestion fractionation in order to ion-correct themeasured mass spectrum of product CO2. Generally speak-ing, measurements of the carbon and oxygen isotope com-positions of CO2 on a gas source isotope ratio massspectrometer examine CO2 isotopologue ions having nomi-nal molecular masses of 44, 45 and 46 amu. Because theinstruments commonly used for this purpose cannot massresolve 13C16O2 from 12C17O16O, one must make someassumptions to correct for the contribution of 12C17O16Oto the mass 45 amu ion beam. This is generally accom-plished by assuming a relationship between 17O and 18O
abundance of the form:17RA17RB¼ 18RA
18RB
� �k(Assonov and Brenn-
inkmeijer, 2003; Miller et al., 2007), where the value k mustbe assumed or determined by independent experiments(such as fluorination of reactant carbonate and productCO2 followed by isotopic analyses of the resulting O2
gases). To the best of our knowledge, there are no experi-mental determinations of k associated with phosphoric aciddigestion of carbonate minerals; a value 0.528 has been sug-gested (Assonov and Brenninkmeijer, 2003; Miller et al.,2007). This value of k characterizes the isotopic variationsof natural waters (Li and Meijer, 1998; Barkan and Luz,2005), and presumably is inherited by carbonate mineralsthat form in isotopic equilibrium with natural waters,although there is no reason to suppose it is also character-istic of the acid digestion reaction process by which carbon-ates are analyzed. Our transition state theory of phosphoricacid digestion predicts that the value of k associated with itsisotopic fractionations is 0.5281. Thus, our model agreeswith and provides an independent theoretical justificationfor the suggested value of 0.528 for CO2 extracted fromcarbonate samples (Miller et al., 2007) and standards (e.g.PDB and NBS-19; Assonov and Brenninkmeijer, 2003).This result may be useful for the interpretation of high-precision measurements of 17O-anomalies in naturalcarbonates by fluorinating CO2 that is generated by phos-phoric acid digestion.
4.3. Dependence of acid digestion fractionations on the
isotopic compositions of reactant carbonate minerals?
In a recent experimental determinations of oxygen iso-tope fractionations associated with phosphoric acid diges-tion, Kim and O’Neil’s, 1997 observed apparent variationsof the fractionation factors within a single type of carbonateminerals at a single temperature (25 �C): up to 0.5& forcalcite (CaCO3), 0.6& for witherite (BaCO3), and 2.5& foroctavite (CdCO3). While Kim and O’Neil (1997) suggested
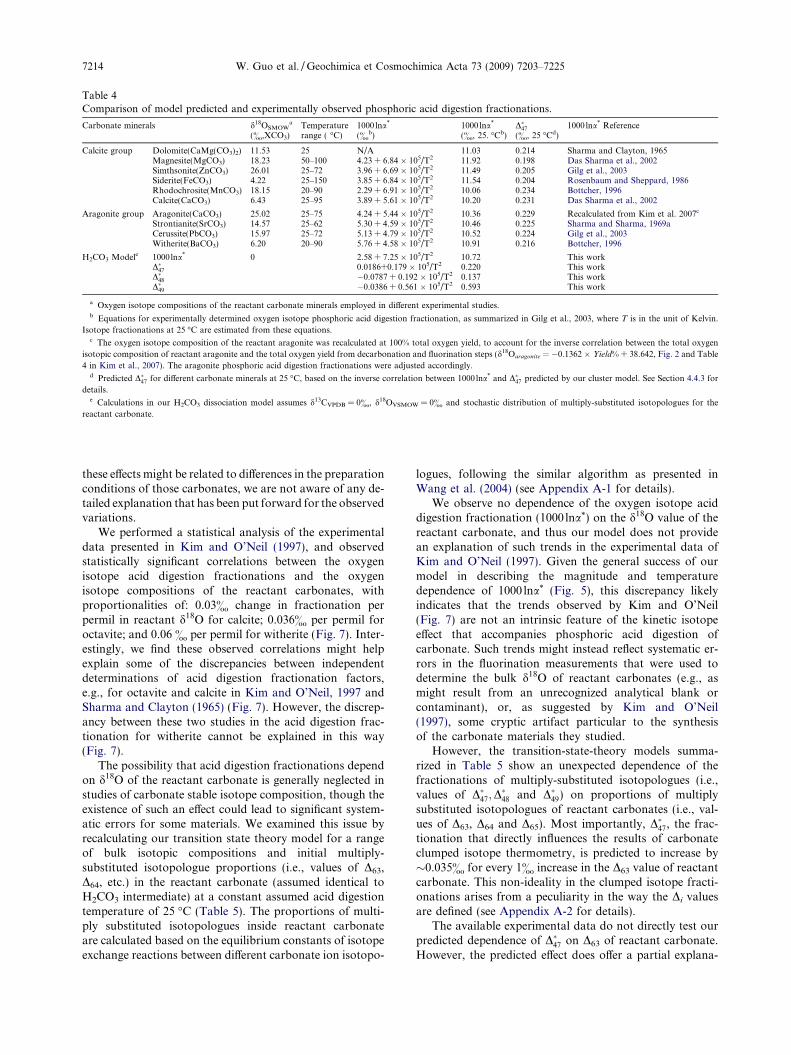
Table 4Comparison of model predicted and experimentally observed phosphoric acid digestion fractionations.
Carbonate minerals d18OSMOWa
(&,XCO3)Temperaturerange ( �C)
1000 lna*
(&b)1000 lna*
(&, 25. �Cb)D�47(&, 25 �Cd)
1000 lna* Reference
Calcite group Dolomite(CaMg(CO3)2) 11.53 25 N/A 11.03 0.214 Sharma and Clayton, 1965Magnesite(MgCO3) 18.23 50–100 4.23 + 6.84 � 105/T2 11.92 0.198 Das Sharma et al., 2002Simthsonite(ZnCO3) 26.01 25–72 3.96 + 6.69 � 105/T2 11.49 0.205 Gilg et al., 2003Siderite(FeCO3) 4.22 25–150 3.85 + 6.84 � 105/T2 11.54 0.204 Rosenbaum and Sheppard, 1986Rhodochrosite(MnCO3) 18.15 20–90 2.29 + 6.91 � 105/T2 10.06 0.234 Bottcher, 1996Calcite(CaCO3) 6.43 25–95 3.89 + 5.61 � 105/T2 10.20 0.231 Das Sharma et al., 2002
Aragonite group Aragonite(CaCO3) 25.02 25–75 4.24 + 5.44 � 105/T2 10.36 0.229 Recalculated from Kim et al. 2007c
Strontianite(SrCO3) 14.57 25–62 5.30 + 4.59 � 105/T2 10.46 0.225 Sharma and Sharma, 1969aCerussite(PbCO3) 15.97 25–72 5.13 + 4.79 � 105/T2 10.52 0.224 Gilg et al., 2003Witherite(BaCO3) 6.20 20–90 5.76 + 4.58 � 105/T2 10.91 0.216 Bottcher, 1996
H2CO3 Modele 1000lna* 0 2.58 + 7.25 � 105/T2 10.72 This workD�47 0.0186+0.179 � 105/T2 0.220 This workD�48 �0.0787 + 0.192 � 105/T2 0.137 This workD�49 �0.0386 + 0.561 � 105/T2 0.593 This work
a Oxygen isotope compositions of the reactant carbonate minerals employed in different experimental studies.b Equations for experimentally determined oxygen isotope phosphoric acid digestion fractionation, as summarized in Gilg et al., 2003, where T is in the unit of Kelvin.
Isotope fractionations at 25 �C are estimated from these equations.c The oxygen isotope composition of the reactant aragonite was recalculated at 100% total oxygen yield, to account for the inverse correlation between the total oxygen
isotopic composition of reactant aragonite and the total oxygen yield from decarbonation and fluorination steps (d18Oaragonite = �0.1362 � Yield% + 38.642, Fig. 2 and Table
4 in Kim et al., 2007). The aragonite phosphoric acid digestion fractionations were adjusted accordingly.d Predicted D�47 for different carbonate minerals at 25 �C, based on the inverse correlation between 1000 lna* and D�47 predicted by our cluster model. See Section 4.4.3 for
details.e Calculations in our H2CO3 dissociation model assumes d13CVPDB = 0&, d18OVSMOW = 0& and stochastic distribution of multiply-substituted isotopologues for the
reactant carbonate.
7214 W. Guo et al. / Geochimica et Cosmochimica Acta 73 (2009) 7203–7225
these effects might be related to differences in the preparationconditions of those carbonates, we are not aware of any de-tailed explanation that has been put forward for the observedvariations.
We performed a statistical analysis of the experimentaldata presented in Kim and O’Neil (1997), and observedstatistically significant correlations between the oxygenisotope acid digestion fractionations and the oxygenisotope compositions of the reactant carbonates, withproportionalities of: 0.03& change in fractionation perpermil in reactant d18O for calcite; 0.036& per permil foroctavite; and 0.06 & per permil for witherite (Fig. 7). Inter-estingly, we find these observed correlations might helpexplain some of the discrepancies between independentdeterminations of acid digestion fractionation factors,e.g., for octavite and calcite in Kim and O’Neil, 1997 andSharma and Clayton (1965) (Fig. 7). However, the discrep-ancy between these two studies in the acid digestion frac-tionation for witherite cannot be explained in this way(Fig. 7).
The possibility that acid digestion fractionations dependon d18O of the reactant carbonate is generally neglected instudies of carbonate stable isotope composition, though theexistence of such an effect could lead to significant system-atic errors for some materials. We examined this issue byrecalculating our transition state theory model for a rangeof bulk isotopic compositions and initial multiply-substituted isotopologue proportions (i.e., values of D63,D64, etc.) in the reactant carbonate (assumed identical toH2CO3 intermediate) at a constant assumed acid digestiontemperature of 25 �C (Table 5). The proportions of multi-ply substituted isotopologues inside reactant carbonateare calculated based on the equilibrium constants of isotopeexchange reactions between different carbonate ion isotopo-
logues, following the similar algorithm as presented inWang et al. (2004) (see Appendix A-1 for details).
We observe no dependence of the oxygen isotope aciddigestion fractionation (1000 lna*) on the d18O value of thereactant carbonate, and thus our model does not providean explanation of such trends in the experimental data ofKim and O’Neil (1997). Given the general success of ourmodel in describing the magnitude and temperaturedependence of 1000 lna* (Fig. 5), this discrepancy likelyindicates that the trends observed by Kim and O’Neil(Fig. 7) are not an intrinsic feature of the kinetic isotopeeffect that accompanies phosphoric acid digestion ofcarbonate. Such trends might instead reflect systematic er-rors in the fluorination measurements that were used todetermine the bulk d18O of reactant carbonates (e.g., asmight result from an unrecognized analytical blank orcontaminant), or, as suggested by Kim and O’Neil(1997), some cryptic artifact particular to the synthesisof the carbonate materials they studied.
However, the transition-state-theory models summa-rized in Table 5 show an unexpected dependence of thefractionations of multiply-substituted isotopologues (i.e.,values of D�47;D
�48 and D�49) on proportions of multiply
substituted isotopologues of reactant carbonates (i.e., val-ues of D63, D64 and D65). Most importantly, D�47, the frac-tionation that directly influences the results of carbonateclumped isotope thermometry, is predicted to increase by�0.035& for every 1& increase in the D63 value of reactantcarbonate. This non-ideality in the clumped isotope fracti-onations arises from a peculiarity in the way the Di valuesare defined (see Appendix A-2 for details).
The available experimental data do not directly test ourpredicted dependence of D�47 on D63 of reactant carbonate.However, the predicted effect does offer a partial explana-

Fig. 6. Fractionations of multiply-substituted species ðD�47;D�48;
D�49Þ during phosphoric acid digestion predicted by our H2CO3
dissociation model, plotted as a function of 105T�2, in K. The solidcircle is the average value of D�47 experimentally determined duringphosphoric acid digestion of calcites at 25 �C (Table 2; this study).The bar is 1 standard deviation (1r) of multiple replicateextractions of the calcites (the standard error of the average isapproximately the size of the symbol).
Phosphoric acid digestion of carbonate minerals 7215
tion why the experimentally determined relationship be-tween the D47 of CO2 produced by acid digestion of calciteand calcite growth temperature (Ghosh et al., 2006) is moresensitive to temperature than the theoretically predictedtemperature dependence for D63 in carbonates (Schaubleet al., 2006). For example, over the temperature range of0–50 �C, Schauble et al. (2006) predicts D63 (includingcontributions from both D13C18O16O2
and D12C18O17O16O; seeAppendix A-2) in thermodynamically equilibrated calcitesolids decreases by 0.00279& for every degree increase ofits growth temperature; Assuming calcite has the samedependence of D�47 on D63 as predicted by our aboveH2CO3 model, we predict the D47 of CO2 produced by aciddigestion of calcite will have a temperature sensitivity of�0.00289&/�C, which is closer to the �0.00453&/�C deter-mined experimentally by Ghosh et al. (2006) than the theo-retically predicted temperature sensitive of D63 (Schaubleet al., 2006).
4.4. Cation effects on acid digestion fractionations
The transition-state model we present in precedingsections simultaneously explains a variety of features ofthe kinetic isotope effects associated with phosphoric aciddigestion of carbonates, including the magnitude and tem-perature dependence of 1000 lna* and D�47 fractionations.Given that all of these predictions are strictly independentof the experimental data to which they are compared, wecontend that our model closely captures the most importantmechanistic details of this reaction. However, phosphoricacid digestion of carbonates is also believed to exhibit adependence of 1000 lna* on the cation chemistry (and pos-sibly crystal structure) of reactant carbonate (Table 4;
Fig. 5). At 25 �C, the observed oxygen isotope fractiona-tions among different carbonate minerals vary from10.06& (MnCO3) to 11.92& (MgCO3), and the tempera-ture sensitivity of oxygen isotope fractionations duringphosphoric acid digestion vary from �0.027&/�C (BaCO3)to �0.041&/�C (MnCO3) over the temperature range of25 �C to 80 �C (Table 4; Fig. 5). Nothing in our above mod-el of H2CO3 dissociation can explain such observations. Inthis section, we use a cluster model of the reacting carbon-ate surface (Section 2.2.3 and Fig. 3) to explore the possiblecauses of these effects.
4.4.1. Cluster model results on the oxygen isotope
fractionation among different carbonate minerals
Table 6 and Fig. 8 present the predictions of our clustermodel on the variations of oxygen isotope fractionationamong different carbonate minerals, and the comparisonsbetween these cluster model predictions and the resultsdetermined from previous experimental studies. Our clustermodel of the carbonate surface, in which the H2CO3 inter-mediate interacts with adjacent metal-carbonate groups,succeeds in capturing the experimentally-observed depen-dence of 1000 lna* on cation composition, but fails to de-scribe the absolute values and absolute temperaturedependences of 1000 lna*(and D�47) characteristic of our sim-pler H2CO3 dissociation model (above).
In particular, our cluster model predicts values of1000 lna* at 25 �C from 1.771& (PbCO3) to 3.652&
(FeCO3) for the eight different carbonate minerals studied(Table 6). Except for PbCO3, these predicted oxygen iso-tope fractionations are approximately one-third the experi-mentally observed values. Nevertheless, the predicteddifferences in oxygen isotope fractionation between differ-ent minerals generally reproduce those observed in previousexperimental studies (Fig. 8a). The oxygen isotope fraction-ation predicted by our cluster model for PbCO3 is an excep-tion, falling far below the trend defined by other carbonateminerals. This might be related to the spin-orbit effects andthe basis set superposition error in ab initio calculations ofPb-containing complexes with effective core potential basissets (Ramirez et al., 2006). We evaluate the temperaturesensitivity of oxygen isotope acid digestion fractionationpredicted by our cluster model as the ratio of predicted oxy-gen isotope fractionation between 80 �C and 25 �C, andcompare them with the experimental observations(Fig. 8b). The model prediction and experimental data fallclose to 1:1 correlation, indicating our cluster model, de-spite its obvious failure at matching the absolute magni-tudes of acid digestion fractionations, captures thevariations of the temperature sensitivity of oxygen isotopeacid digestion fractionation among different carbonate min-erals (including PbCO3; Fig. 8b).
We conclude that our cluster model captures someessential features of the cation effects during phosphoricacid digestion, but is quantitatively inaccurate because itfails to describe the structural relationship betweenH2CO3 and the crystal surface. This deficiency is likelydue to the small size and simple geometry of the clusterswe have modeled. It should be possible to refine thismodel so that it simultaneously describes the absolute
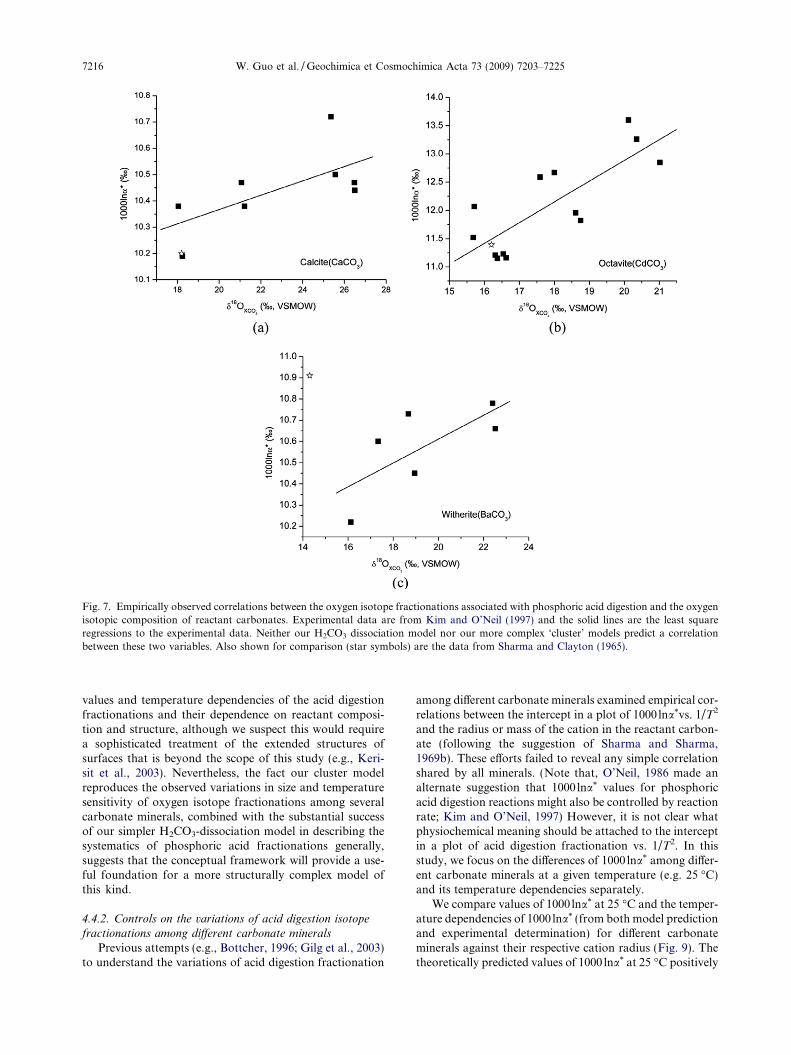
Fig. 7. Empirically observed correlations between the oxygen isotope fractionations associated with phosphoric acid digestion and the oxygenisotopic composition of reactant carbonates. Experimental data are from Kim and O’Neil (1997) and the solid lines are the least squareregressions to the experimental data. Neither our H2CO3 dissociation model nor our more complex ‘cluster’ models predict a correlationbetween these two variables. Also shown for comparison (star symbols) are the data from Sharma and Clayton (1965).
7216 W. Guo et al. / Geochimica et Cosmochimica Acta 73 (2009) 7203–7225
values and temperature dependencies of the acid digestionfractionations and their dependence on reactant composi-tion and structure, although we suspect this would requirea sophisticated treatment of the extended structures ofsurfaces that is beyond the scope of this study (e.g., Keri-sit et al., 2003). Nevertheless, the fact our cluster modelreproduces the observed variations in size and temperaturesensitivity of oxygen isotope fractionations among severalcarbonate minerals, combined with the substantial successof our simpler H2CO3-dissociation model in describing thesystematics of phosphoric acid fractionations generally,suggests that the conceptual framework will provide a use-ful foundation for a more structurally complex model ofthis kind.
4.4.2. Controls on the variations of acid digestion isotope
fractionations among different carbonate minerals
Previous attempts (e.g., Bottcher, 1996; Gilg et al., 2003)to understand the variations of acid digestion fractionation
among different carbonate minerals examined empirical cor-relations between the intercept in a plot of 1000 lna*vs. 1/T2
and the radius or mass of the cation in the reactant carbon-ate (following the suggestion of Sharma and Sharma,1969b). These efforts failed to reveal any simple correlationshared by all minerals. (Note that, O’Neil, 1986 made analternate suggestion that 1000 lna* values for phosphoricacid digestion reactions might also be controlled by reactionrate; Kim and O’Neil, 1997) However, it is not clear whatphysiochemical meaning should be attached to the interceptin a plot of acid digestion fractionation vs. 1/T2. In thisstudy, we focus on the differences of 1000 lna* among differ-ent carbonate minerals at a given temperature (e.g. 25 �C)and its temperature dependencies separately.
We compare values of 1000 lna* at 25 �C and the temper-ature dependencies of 1000 lna* (from both model predictionand experimental determination) for different carbonateminerals against their respective cation radius (Fig. 9). Thetheoretically predicted values of 1000 lna* at 25 �C positively

Table 6Variations of acid digestion isotope fractionations and their temperature dependencies among different carbonate minerals, predicted fromour cluster model. The cation radius and mass are shown for comparison.
Carbonate minerals MgCO3 ZnCO3 FeCO3 MnCO3 CaCO3 SrCO3 PbCO3 BaCO340MgCO3
40BaCO3
Cation radiusa r, (A) 0.65 0.70 0.79 0.80 1.02 (cal) 1.35 1.41 1.55 0.65 1.551.26 (arag)
Cation mass, m 24 65 56 55 40 88 207 137 40 40
25 �C 1000lna* 3.4844 3.3885 3.6518 3.3369 3.0630 2.8842 1.7706 3.0994 3.5143 3.0923D�47 0.0651 0.0572 0.0474 0.0375 0.0708 0.0725 0.0581 0.0761 0.0648 0.0762D�48 �0.0494 �0.0311 �0.0581 �0.0538 �0.0460 �0.0439 �0.0386 �0.0367 �0.0501 �0.0366D�49 0.0877 0.0810 0.0427 0.0264 0.1028 0.1083 0.0836 0.1227 0.0864 0.1230
50 �C 1000lna* 3.1975 3.0878 3.2966 3.0043 2.8263 2.6674 1.6603 2.8628 3.2209 2.8575D�47 0.0577 0.0508 0.0422 0.0337 0.0625 0.0639 0.0514 0.0669 0.0574 0.0669D�48 �0.0390 �0.0233 �0.0450 �0.0414 �0.0367 �0.0352 �0.0309 �0.0295 �0.0394 �0.0294D�49 0.0824 0.0762 0.0446 0.0304 0.0944 0.0988 0.0771 0.1105 0.0815 0.1108
80 �C 1000lna* 2.9007 2.7821 2.9404 2.6726 2.5792 2.4400 1.5416 2.6150 2.9185 2.6110D�47 0.0499 0.0440 0.0367 0.0295 0.0538 0.0549 0.0443 0.0573 0.0497 0.0574D�48 �0.0297 �0.0166 �0.0337 �0.0308 �0.0285 �0.0274 �0.0239 �0.0230 �0.0300 �0.0229D�49 0.0751 0.0694 0.0439 0.0319 0.0843 0.0876 0.0691 0.0970 0.0744 0.0971
a Cation radii from Golyshev et al. (1981). For CaCO3, the Ca cation radii are different in its two polymorphs, calcite and aragonite, and are1.02 A and 1.26A respectively.
Table 5Dependences of phosphoric acid digestion fractionations on the isotopic compositions and the distributions of multiply-substitutedisotopologues in reactant carbonates at 25 �C.
d13CVPDB(&) 0 10 0 0 10 0 0 10 0CO32� in reactant carbonate
d18OVSMOW(&) 0 0 10 0 0 10 0 0 10Equil. Ta (K) Random Random Random 500 500 500 300 300 300D63
a (&) 0 0 0 0.101 0.101 0.101 0.382 0.382 0.382D64
a (&) 0 0 0 0.042 0.042 0.042 0.155 0.155 0.155D65
a (&) 0 0 0 0.248 0.248 0.248 0.937 0.937 0.937
Model prediction on product CO2 d18OVSMOW (&) 10.776 10.776 20.884 10.776 10.776 20.884 10.774 10.774 20.882D47 (&) 0.220 0.220 0.220 0.324 0.324 0.324 0.615 0.615 0.615D48 (&) 0.137 0.137 0.137 0.180 0.180 0.180 0.297 0.297 0.297D49 (&) 0.593 0.593 0.592 0.847 0.847 0.847 1.555 1.555 1.555
Acid digestion fractionation 1000lna* (&) 10.719 10.719 10.719 10.718 10.718 10.718 10.717 10.717 10. 717D�47 (&) 0.220 0.220 0.220 0.223 0.223 0.223 0.233 0.233 0.233D�48 (&) 0.137 0.137 0.137 0.138 0.138 0.138 0.142 0.142 0.142D�49 (&) 0.593 0.593 0.593 0.660 0.660 0.660 0.618 0.618 0.618
a Hypothetical equilibration temperature for the distributions of multiply-substituted isotopologues inside reactant carbonates. D63, D64,and D65 (see text for definitions) are estimated based on calculations for an isolated CO3
2� group in the gas phase (see Appendix A-1 fordetails).
Phosphoric acid digestion of carbonate minerals 7217
correlate with the reciprocal of cation radius (Fig. 9a). Thetheoretically predicted, as opposed to experimentally deter-mined, 1000 lna* at 25 �C show better correlations in thiscomparison, because significant uncertainties are associatedwith experimental determinations of 1000 lna* (more specif-ically, associated with the determination of total oxygen iso-topic compositions of reactant carbonates through thefluorination methods; Kim et al., 2007). In contrast, boththeoretically predicted and the experimentally determinedtemperature dependencies of 1000 lna* exhibit positivecorrelations with the reciprocal of cation radius (Fig. 9cand d). The experimental determinations of the temperaturedependencies of the oxygen isotope acid fractionationhave much smaller uncertainties (since the uncertainties
associated with fluorination methods cancel out in thedetermination of temperature dependence), and thereforeshow better correlation in the above comparison. The exis-tence of these correlations suggests that cation radius isthe most important mineral-specific factor controlling aciddigestion fractionations.
To examine the possible effects of cation mass on theacid digestion fractionation, we adopt a similar strategyto that employed by Schauble et al. (2006) in their discus-sion of equilibrium carbon and oxygen isotope fractiona-tions among different carbonate minerals, and create twohypothetical isotopic carbonates, 40MgCO3 and 40BaCO3.In these cluster models, all the optimization and calcula-tion were performed in the same manner as outlined
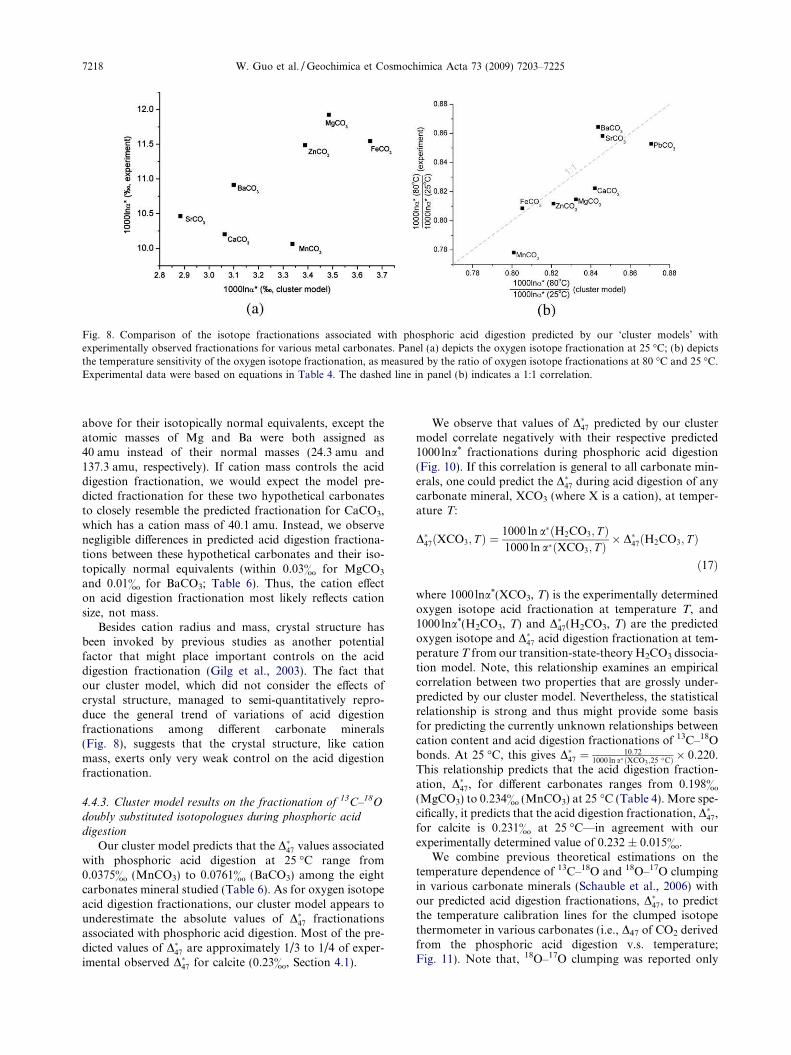
Fig. 8. Comparison of the isotope fractionations associated with phosphoric acid digestion predicted by our ‘cluster models’ withexperimentally observed fractionations for various metal carbonates. Panel (a) depicts the oxygen isotope fractionation at 25 �C; (b) depictsthe temperature sensitivity of the oxygen isotope fractionation, as measured by the ratio of oxygen isotope fractionations at 80 �C and 25 �C.Experimental data were based on equations in Table 4. The dashed line in panel (b) indicates a 1:1 correlation.
7218 W. Guo et al. / Geochimica et Cosmochimica Acta 73 (2009) 7203–7225
above for their isotopically normal equivalents, except theatomic masses of Mg and Ba were both assigned as40 amu instead of their normal masses (24.3 amu and137.3 amu, respectively). If cation mass controls the aciddigestion fractionation, we would expect the model pre-dicted fractionation for these two hypothetical carbonatesto closely resemble the predicted fractionation for CaCO3,which has a cation mass of 40.1 amu. Instead, we observenegligible differences in predicted acid digestion fractiona-tions between these hypothetical carbonates and their iso-topically normal equivalents (within 0.03& for MgCO3
and 0.01& for BaCO3; Table 6). Thus, the cation effecton acid digestion fractionation most likely reflects cationsize, not mass.
Besides cation radius and mass, crystal structure hasbeen invoked by previous studies as another potentialfactor that might place important controls on the aciddigestion fractionation (Gilg et al., 2003). The fact thatour cluster model, which did not consider the effects ofcrystal structure, managed to semi-quantitatively repro-duce the general trend of variations of acid digestionfractionations among different carbonate minerals(Fig. 8), suggests that the crystal structure, like cationmass, exerts only very weak control on the acid digestionfractionation.
4.4.3. Cluster model results on the fractionation of 13C–18O
doubly substituted isotopologues during phosphoric acid
digestion
Our cluster model predicts that the D�47 values associatedwith phosphoric acid digestion at 25 �C range from0.0375& (MnCO3) to 0.0761& (BaCO3) among the eightcarbonates mineral studied (Table 6). As for oxygen isotopeacid digestion fractionations, our cluster model appears tounderestimate the absolute values of D�47 fractionationsassociated with phosphoric acid digestion. Most of the pre-dicted values of D�47 are approximately 1/3 to 1/4 of exper-imental observed D�47 for calcite (0.23&, Section 4.1).
We observe that values of D�47 predicted by our clustermodel correlate negatively with their respective predicted1000 lna* fractionations during phosphoric acid digestion(Fig. 10). If this correlation is general to all carbonate min-erals, one could predict the D�47 during acid digestion of anycarbonate mineral, XCO3 (where X is a cation), at temper-ature T:
D�47ðXCO3; T Þ ¼1000 ln a�ðH2CO3; T Þ1000 ln a�ðXCO3; T Þ
� D�47ðH2CO3; T Þ
ð17Þ
where 1000 lna*(XCO3, T) is the experimentally determinedoxygen isotope acid fractionation at temperature T, and1000 lna*(H2CO3, T) and D�47(H2CO3, T) are the predictedoxygen isotope and D�47 acid digestion fractionation at tem-perature T from our transition-state-theory H2CO3 dissocia-tion model. Note, this relationship examines an empiricalcorrelation between two properties that are grossly under-predicted by our cluster model. Nevertheless, the statisticalrelationship is strong and thus might provide some basisfor predicting the currently unknown relationships betweencation content and acid digestion fractionations of 13C–18Obonds. At 25 �C, this gives D�47 ¼ 10:72
1000 ln a�ðXCO3 ;25 �CÞ � 0:220.This relationship predicts that the acid digestion fraction-ation, D�47, for different carbonates ranges from 0.198&
(MgCO3) to 0.234& (MnCO3) at 25 �C (Table 4). More spe-cifically, it predicts that the acid digestion fractionation, D�47,for calcite is 0.231& at 25 �C—in agreement with ourexperimentally determined value of 0.232 ± 0.015&.
We combine previous theoretical estimations on thetemperature dependence of 13C–18O and 18O–17O clumpingin various carbonate minerals (Schauble et al., 2006) withour predicted acid digestion fractionations, D�47, to predictthe temperature calibration lines for the clumped isotopethermometer in various carbonates (i.e., D47 of CO2 derivedfrom the phosphoric acid digestion v.s. temperature;Fig. 11). Note that, 18O–17O clumping was reported only
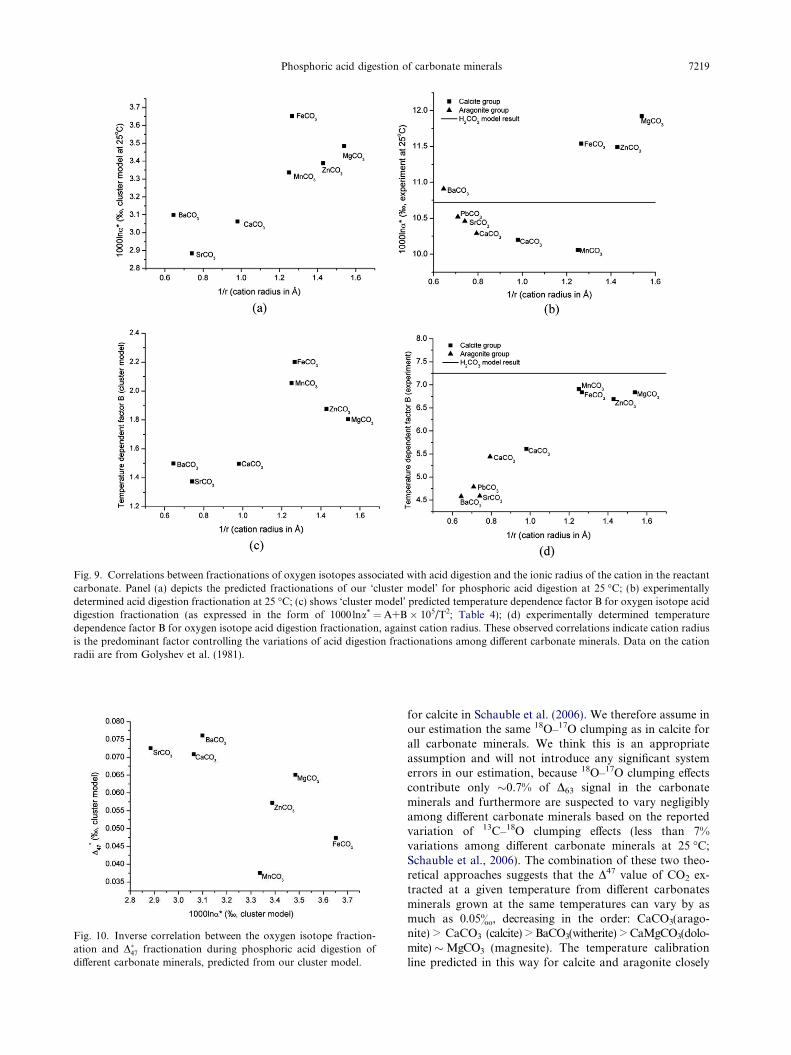
Fig. 9. Correlations between fractionations of oxygen isotopes associated with acid digestion and the ionic radius of the cation in the reactantcarbonate. Panel (a) depicts the predicted fractionations of our ‘cluster model’ for phosphoric acid digestion at 25 �C; (b) experimentallydetermined acid digestion fractionation at 25 �C; (c) shows ‘cluster model’ predicted temperature dependence factor B for oxygen isotope aciddigestion fractionation (as expressed in the form of 1000lna* = A+B � 105/T2; Table 4); (d) experimentally determined temperaturedependence factor B for oxygen isotope acid digestion fractionation, against cation radius. These observed correlations indicate cation radiusis the predominant factor controlling the variations of acid digestion fractionations among different carbonate minerals. Data on the cationradii are from Golyshev et al. (1981).
Fig. 10. Inverse correlation between the oxygen isotope fraction-ation and D�47 fractionation during phosphoric acid digestion ofdifferent carbonate minerals, predicted from our cluster model.
Phosphoric acid digestion of carbonate minerals 7219
for calcite in Schauble et al. (2006). We therefore assume inour estimation the same 18O–17O clumping as in calcite forall carbonate minerals. We think this is an appropriateassumption and will not introduce any significant systemerrors in our estimation, because 18O–17O clumping effectscontribute only �0.7% of D63 signal in the carbonateminerals and furthermore are suspected to vary negligiblyamong different carbonate minerals based on the reportedvariation of 13C–18O clumping effects (less than 7%variations among different carbonate minerals at 25 �C;Schauble et al., 2006). The combination of these two theo-retical approaches suggests that the D47 value of CO2 ex-tracted at a given temperature from different carbonatesminerals grown at the same temperatures can vary by asmuch as 0.05&, decreasing in the order: CaCO3(arago-nite) > CaCO3 (calcite) > BaCO3(witherite) > CaMgCO3(dolo-mite)�MgCO3 (magnesite). The temperature calibrationline predicted in this way for calcite and aragonite closely
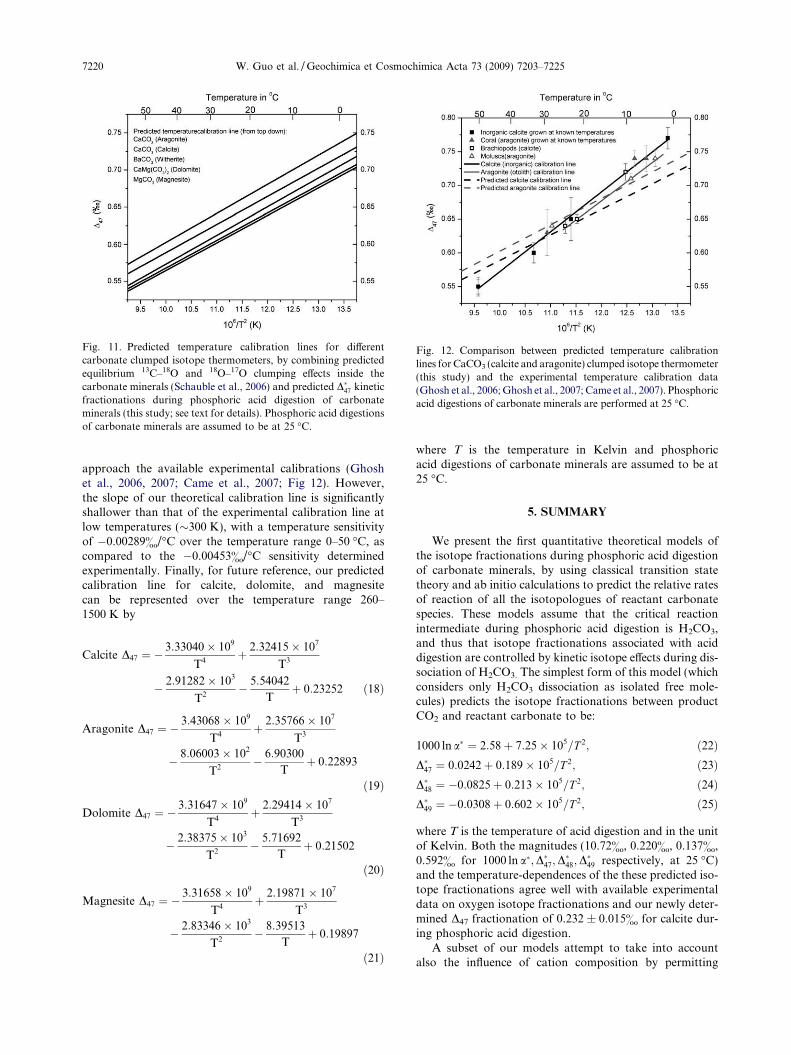
D49 ¼ �0:0308þ 0:602� 10 =T ; ð25Þ
Fig. 11. Predicted temperature calibration lines for differentcarbonate clumped isotope thermometers, by combining predictedequilibrium 13C–18O and 18O–17O clumping effects inside thecarbonate minerals (Schauble et al., 2006) and predicted D�47 kineticfractionations during phosphoric acid digestion of carbonateminerals (this study; see text for details). Phosphoric acid digestionsof carbonate minerals are assumed to be at 25 �C.
Fig. 12. Comparison between predicted temperature calibrationlines for CaCO3 (calcite and aragonite) clumped isotope thermometer(this study) and the experimental temperature calibration data(Ghosh et al., 2006; Ghosh et al., 2007; Came et al., 2007). Phosphoricacid digestions of carbonate minerals are performed at 25 �C.
7220 W. Guo et al. / Geochimica et Cosmochimica Acta 73 (2009) 7203–7225
approach the available experimental calibrations (Ghoshet al., 2006, 2007; Came et al., 2007; Fig 12). However,the slope of our theoretical calibration line is significantlyshallower than that of the experimental calibration line atlow temperatures (�300 K), with a temperature sensitivityof �0.00289&/�C over the temperature range 0–50 �C, ascompared to the �0.00453&/�C sensitivity determinedexperimentally. Finally, for future reference, our predictedcalibration line for calcite, dolomite, and magnesitecan be represented over the temperature range 260–1500 K by
Calcite D47 ¼ �3:33040� 109
T4þ 2:32415� 107
T3
� 2:91282� 103
T2� 5:54042
Tþ 0:23252 ð18Þ
Aragonite D47 ¼ �3:43068� 109
T4þ 2:35766� 107
T3
� 8:06003� 102
T2� 6:90300
Tþ 0:22893
ð19Þ
Dolomite D47 ¼ �3:31647� 109
T4þ 2:29414� 107
T3
� 2:38375� 103
T2� 5:71692
Tþ 0:21502
ð20Þ
Magnesite D47 ¼ �3:31658� 109
T4þ 2:19871� 107
T3
� 2:83346� 103
T2� 8:39513
Tþ 0:19897
ð21Þ
where T is the temperature in Kelvin and phosphoricacid digestions of carbonate minerals are assumed to be at25 �C.
5. SUMMARY
We present the first quantitative theoretical models ofthe isotope fractionations during phosphoric acid digestionof carbonate minerals, by using classical transition statetheory and ab initio calculations to predict the relative ratesof reaction of all the isotopologues of reactant carbonatespecies. These models assume that the critical reactionintermediate during phosphoric acid digestion is H2CO3,and thus that isotope fractionations associated with aciddigestion are controlled by kinetic isotope effects during dis-sociation of H2CO3. The simplest form of this model (whichconsiders only H2CO3 dissociation as isolated free mole-cules) predicts the isotope fractionations between productCO2 and reactant carbonate to be:
1000 ln a� ¼ 2:58þ 7:25� 105=T 2; ð22ÞD�47 ¼ 0:0242þ 0:189� 105=T 2; ð23ÞD�48 ¼ �0:0825þ 0:213� 105=T 2; ð24Þ� 5 2
where T is the temperature of acid digestion and in the unitof Kelvin. Both the magnitudes (10.72&, 0.220&, 0.137&,0.592& for 1000 ln a�;D�47;D
�48;D
�49 respectively, at 25 �C)
and the temperature-dependences of the these predicted iso-tope fractionations agree well with available experimentaldata on oxygen isotope fractionations and our newly deter-mined D47 fractionation of 0.232 ± 0.015& for calcite dur-ing phosphoric acid digestion.
A subset of our models attempt to take into accountalso the influence of cation composition by permitting
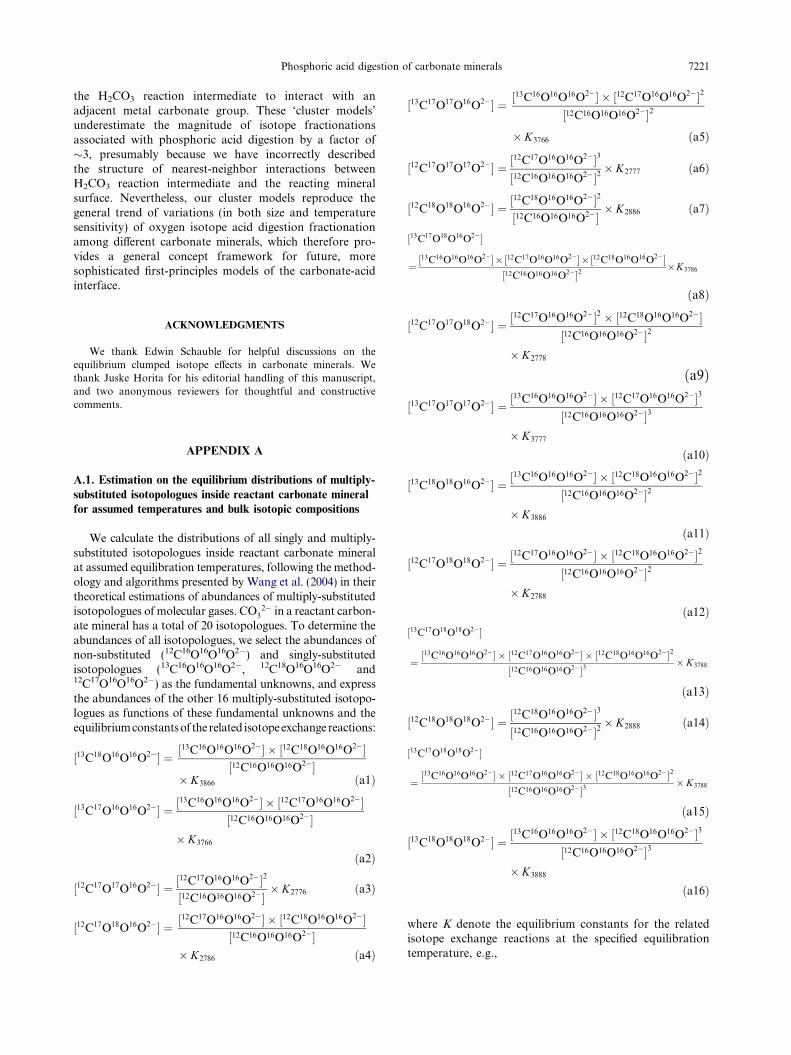
Phosphoric acid digestion of carbonate minerals 7221
the H2CO3 reaction intermediate to interact with anadjacent metal carbonate group. These ‘cluster models’underestimate the magnitude of isotope fractionationsassociated with phosphoric acid digestion by a factor of�3, presumably because we have incorrectly describedthe structure of nearest-neighbor interactions betweenH2CO3 reaction intermediate and the reacting mineralsurface. Nevertheless, our cluster models reproduce thegeneral trend of variations (in both size and temperaturesensitivity) of oxygen isotope acid digestion fractionationamong different carbonate minerals, which therefore pro-vides a general concept framework for future, moresophisticated first-principles models of the carbonate-acidinterface.
ACKNOWLEDGMENTS
We thank Edwin Schauble for helpful discussions on theequilibrium clumped isotope effects in carbonate minerals. Wethank Juske Horita for his editorial handling of this manuscript,and two anonymous reviewers for thoughtful and constructivecomments.
APPENDIX A
A.1. Estimation on the equilibrium distributions of multiply-
substituted isotopologues inside reactant carbonate mineral
for assumed temperatures and bulk isotopic compositions
We calculate the distributions of all singly and multiply-substituted isotopologues inside reactant carbonate mineralat assumed equilibration temperatures, following the method-ology and algorithms presented by Wang et al. (2004) in theirtheoretical estimations of abundances of multiply-substitutedisotopologues of molecular gases. CO3
2� in a reactant carbon-ate mineral has a total of 20 isotopologues. To determine theabundances of all isotopologues, we select the abundances ofnon-substituted (12C16O16O16O2�) and singly-substitutedisotopologues (13C16O16O16O2�, 12C18O16O16O2� and12C17O16O16O2�) as the fundamental unknowns, and expressthe abundances of the other 16 multiply-substituted isotopo-logues as functions of these fundamental unknowns and theequilibriumconstantsof therelated isotopeexchangereactions:
½13C18O16O16O2�� ¼ ½13C16O16O16O2�� � ½12C18O16O16O2��
½12C16O16O16O2��� K3866 ða1Þ
½13C17O16O16O2�� ¼ ½13C16O16O16O2�� � ½12C17O16O16O2��
½12C16O16O16O2��� K3766
ða2Þ
½12C17O17O16O2�� ¼ ½12C17O16O16O2��2
½12C16O16O16O2��� K2776 ða3Þ
½12C17O18O16O2�� ¼ ½12C17O16O16O2�� � ½12C18O16O16O2��
½12C16O16O16O2��� K2786 ða4Þ
½13C17O17O16O2�� ¼ ½13C16O16O16O2�� � ½12C17O16O16O2��2
½12C16O16O16O2��2
� K3766 ða5Þ
½12C17O17O17O2�� ¼ ½12C17O16O16O2��3
½12C16O16O16O2��2� K2777 ða6Þ
½12C18O18O16O2�� ¼ ½12C18O16O16O2��2
½12C16O16O16O2��� K2886 ða7Þ
½13C17O18O16O2��
¼ ½13C16O16O16O2���½12C17O16O16O2���½12C18O16O16O2��
½12C16O16O16O2��2�K3786
ða8Þ
½12C17O17O18O2�� ¼ ½12C17O16O16O2��2 � ½12C18O16O16O2��
½12C16O16O16O2��2
� K2778
ða9Þ
½13C17O17O17O2�� ¼ ½13C16O16O16O2�� � ½12C17O16O16O2��3
½12C16O16O16O2��3
� K3777
ða10Þ
½13C18O18O16O2�� ¼ ½13C16O16O16O2�� � ½12C18O16O16O2��2
½12C16O16O16O2��2
� K3886
ða11Þ
½12C17O18O18O2�� ¼ ½12C17O16O16O2�� � ½12C18O16O16O2��2
½12C16O16O16O2��2
� K2788
ða12Þ½13C17O18O18O2��
¼ ½13C16O16O16O2�� � ½12C17O16O16O2�� � ½12C18O16O16O2��2
½12C16O16O16O2��3� K3788
ða13Þ
½12C18O18O18O2�� ¼ ½12C18O16O16O2��3
½12C16O16O16O2��2� K2888 ða14Þ
½13C17O18O18O2��
¼ ½13C16O16O16O2�� � ½12C17O16O16O2�� � ½12C18O16O16O2��2
½12C16O16O16O2��3� K3788
ða15Þ
½13C18O18O18O2�� ¼ ½13C16O16O16O2�� � ½12C18O16O16O2��3
½12C16O16O16O2��3
� K3888
ða16Þ
where K denote the equilibrium constants for the relatedisotope exchange reactions at the specified equilibrationtemperature, e.g.,
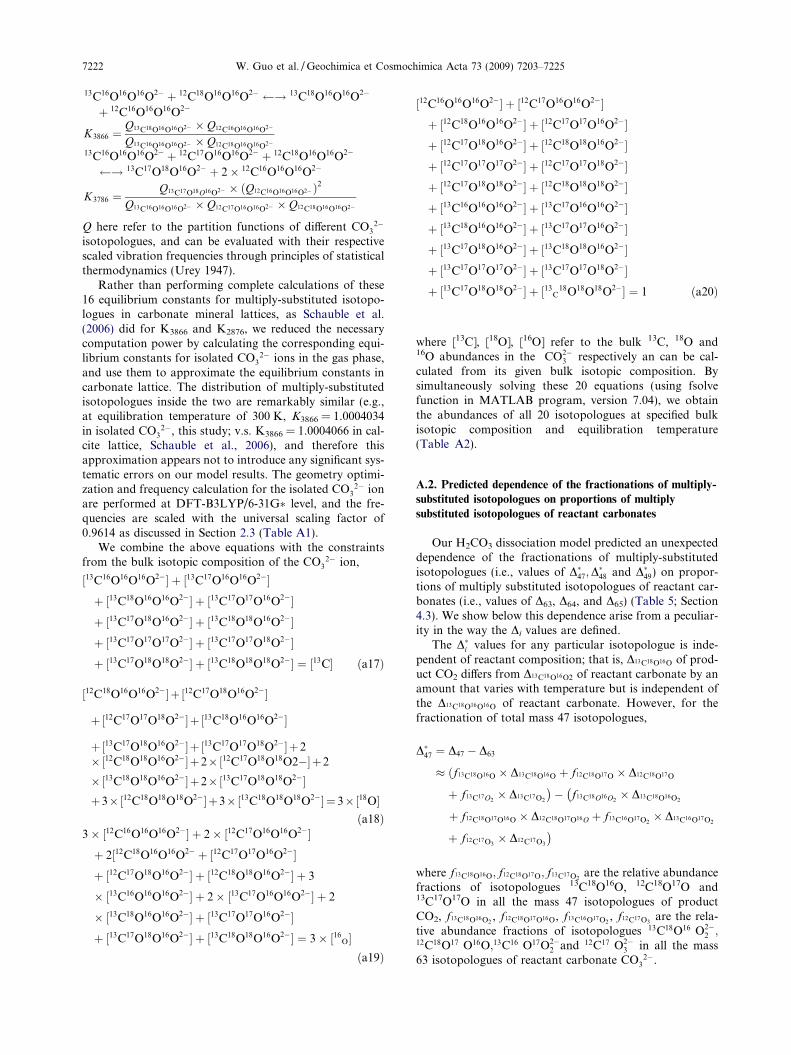
7222 W. Guo et al. / Geochimica et Cosmochimica Acta 73 (2009) 7203–7225
13C16O16O16O2� þ 12C18O16O16O2� ! 13C18O16O16O2�
þ 12C16O16O16O2�
K3866 ¼Q13C18O16O16O2� � Q12C16O16O16O2�
Q13C16O16O16O2� � Q12C18O16O16O2�13C16O16O16O2� þ 12C17O16O16O2� þ 12C18O16O16O2�
! 13C17O18O16O2� þ 2� 12C16O16O16O2�
K3786 ¼Q13C17O18O16O2� � ðQ12C16O16O16O2�Þ2
Q13C16O16O16O2� � Q12C17O16O16O2� � Q12C18O16O16O2�
Q here refer to the partition functions of different CO32�
isotopologues, and can be evaluated with their respectivescaled vibration frequencies through principles of statisticalthermodynamics (Urey 1947).
Rather than performing complete calculations of these16 equilibrium constants for multiply-substituted isotopo-logues in carbonate mineral lattices, as Schauble et al.(2006) did for K3866 and K2876, we reduced the necessarycomputation power by calculating the corresponding equi-librium constants for isolated CO3
2� ions in the gas phase,and use them to approximate the equilibrium constants incarbonate lattice. The distribution of multiply-substitutedisotopologues inside the two are remarkably similar (e.g.,at equilibration temperature of 300 K, K3866 = 1.0004034in isolated CO3
2�, this study; v.s. K3866 = 1.0004066 in cal-cite lattice, Schauble et al., 2006), and therefore thisapproximation appears not to introduce any significant sys-tematic errors on our model results. The geometry optimi-zation and frequency calculation for the isolated CO3
2� ionare performed at DFT-B3LYP/6-31G� level, and the fre-quencies are scaled with the universal scaling factor of0.9614 as discussed in Section 2.3 (Table A1).
We combine the above equations with the constraintsfrom the bulk isotopic composition of the CO3
2� ion,
½13C16O16O16O2�� þ ½13C17O16O16O2��þ ½13C18O16O16O2�� þ ½13C17O17O16O2��þ ½13C17O18O16O2�� þ ½13C18O18O16O2��þ ½13C17O17O17O2�� þ ½13C17O17O18O2��þ ½13C17O18O18O2�� þ ½13C18O18O18O2�� ¼ ½13C� ða17Þ
½12C18O16O16O2��þ ½12C17O18O16O2��
þ ½12C17O17O18O2��þ ½13C18O16O16O2��
þ ½13C17O18O16O2��þ ½13C17O17O18O2��þ2�½12C18O18O16O2��þ2�½12C17O18O18O2��þ2
�½13C18O18O16O2��þ2�½13C17O18O18O2��þ3�½12C18O18O18O2��þ3�½13C18O18O18O2��¼ 3�½18O�
ða18Þ3� ½12C16O16O16O2�� þ 2� ½12C17O16O16O2��þ 2½12C18O16O16O2� þ ½12C17O17O16O2��þ ½12C17O18O16O2�� þ ½12C18O18O16O2�� þ 3
� ½13C16O16O16O2�� þ 2� ½13C17O16O16O2�� þ 2
� ½13C18O16O16O2�� þ ½13C17O17O16O2��þ ½13C17O18O16O2�� þ ½13C18O18O16O2�� ¼ 3� ½16
O�ða19Þ
12 16 16 16 2� 12 17 16 16 2�
½ C O O O � þ ½ C O O O �þ ½12C18O16O16O2�� þ ½12C17O17O16O2��þ ½12C17O18O16O2�� þ ½12C18O18O16O2��þ ½12C17O17O17O2�� þ ½12C17O17O18O2��þ ½12C17O18O18O2�� þ ½12C18O18O18O2��þ ½13C16O16O16O2�� þ ½13C17O16O16O2��þ ½13C18O16O16O2�� þ ½13C17O17O16O2��þ ½13C17O18O16O2�� þ ½13C18O18O16O2��þ ½13C17O17O17O2�� þ ½13C17O17O18O2��þ ½13C17O18O18O2�� þ ½13C18O18O18O2�� ¼ 1 ða20Þ
where [13C], [18O], [16O] refer to the bulk 13C, 18O and16O abundances in the CO2�
3 respectively an can be cal-culated from its given bulk isotopic composition. Bysimultaneously solving these 20 equations (using fsolvefunction in MATLAB program, version 7.04), we obtainthe abundances of all 20 isotopologues at specified bulkisotopic composition and equilibration temperature(Table A2).
A.2. Predicted dependence of the fractionations of multiply-
substituted isotopologues on proportions of multiply
substituted isotopologues of reactant carbonates
Our H2CO3 dissociation model predicted an unexpecteddependence of the fractionations of multiply-substitutedisotopologues (i.e., values of D�47;D
�48 and D�49) on propor-
tions of multiply substituted isotopologues of reactant car-bonates (i.e., values of D63, D64, and D65) (Table 5; Section4.3). We show below this dependence arise from a peculiar-ity in the way the Di values are defined.
The D�i values for any particular isotopologue is inde-pendent of reactant composition; that is, D13C18O16O of prod-uct CO2 differs from D13C18O16O2 of reactant carbonate by anamount that varies with temperature but is independent ofthe D13C18O16O16O of reactant carbonate. However, for thefractionation of total mass 47 isotopologues,
D�47 ¼ D47 � D63
f13C18O16O � D13C18O16O þ f12C18O17O � D12C18O17Oð
þ f13C17O2� D13C17O2
�� f13C18O16O2
� D13C18O16O2
�þ f12C18O17O16O � D12C18O17O16O þ f13C16O17O2
� D13C16O17O2
þ f12C17O3� D12C17O3
�
where f13C18O16O; f12C18O17O; f13C17O2are the relative abundance
fractions of isotopologues 13C18O16O, 12C18O17O and13C17O17O in all the mass 47 isotopologues of productCO2, f13C18O16O2
, f12C18O17O16O, f13C16O17O2, f12C17O3
are the rela-tive abundance fractions of isotopologues 13C18O16 O2�
2 ;12C18O17 O16O;13C16 O17O2�
2 and 12C17 O2�3 in all the mass
63 isotopologues of reactant carbonate CO32�.
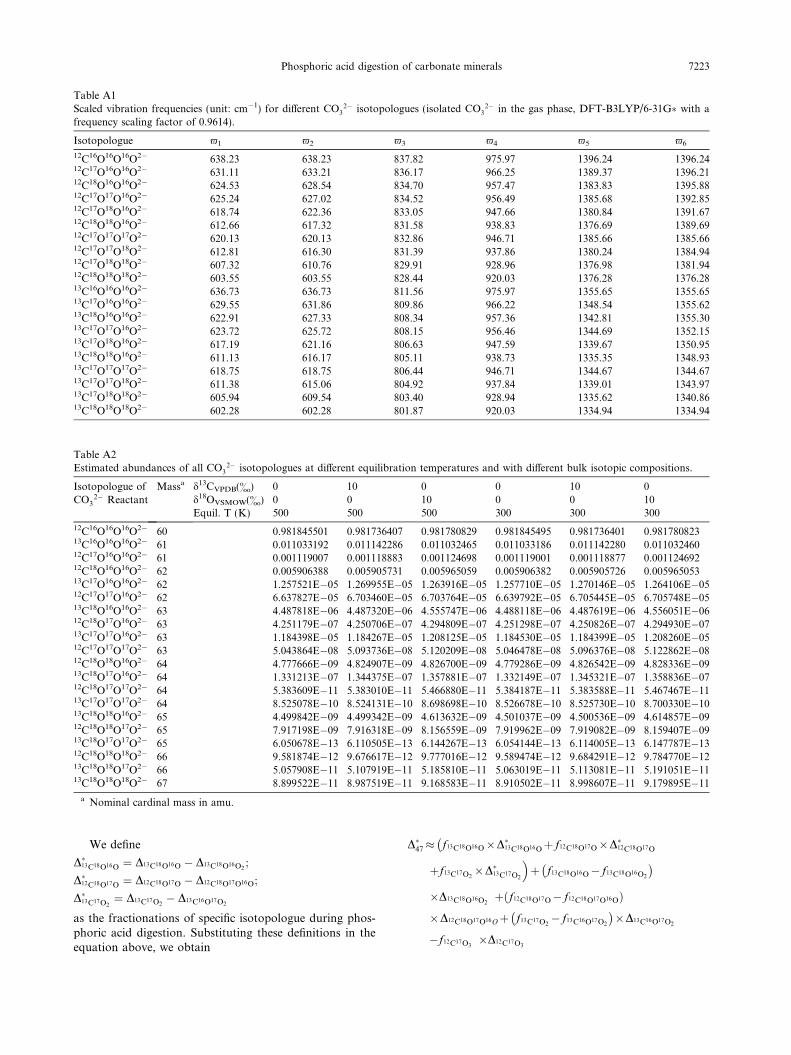
Table A1Scaled vibration frequencies (unit: cm�1) for different CO3
2� isotopologues (isolated CO32� in the gas phase, DFT-B3LYP/6-31G� with a
frequency scaling factor of 0.9614).
Isotopologue -1 -2 -3 -4 -5 -6
12C16O16O16O2� 638.23 638.23 837.82 975.97 1396.24 1396.2412C17O16O16O2� 631.11 633.21 836.17 966.25 1389.37 1396.2112C18O16O16O2� 624.53 628.54 834.70 957.47 1383.83 1395.8812C17O17O16O2� 625.24 627.02 834.52 956.49 1385.68 1392.8512C17O18O16O2� 618.74 622.36 833.05 947.66 1380.84 1391.6712C18O18O16O2� 612.66 617.32 831.58 938.83 1376.69 1389.6912C17O17O17O2� 620.13 620.13 832.86 946.71 1385.66 1385.6612C17O17O18O2� 612.81 616.30 831.39 937.86 1380.24 1384.9412C17O18O18O2� 607.32 610.76 829.91 928.96 1376.98 1381.9412C18O18O18O2� 603.55 603.55 828.44 920.03 1376.28 1376.2813C16O16O16O2� 636.73 636.73 811.56 975.97 1355.65 1355.6513C17O16O16O2� 629.55 631.86 809.86 966.22 1348.54 1355.6213C18O16O16O2� 622.91 627.33 808.34 957.36 1342.81 1355.3013C17O17O16O2� 623.72 625.72 808.15 956.46 1344.69 1352.1513C17O18O16O2� 617.19 621.16 806.63 947.59 1339.67 1350.9513C18O18O16O2� 611.13 616.17 805.11 938.73 1335.35 1348.9313C17O17O17O2� 618.75 618.75 806.44 946.71 1344.67 1344.6713C17O17O18O2� 611.38 615.06 804.92 937.84 1339.01 1343.9713C17O18O18O2� 605.94 609.54 803.40 928.94 1335.62 1340.8613C18O18O18O2� 602.28 602.28 801.87 920.03 1334.94 1334.94
Table A2Estimated abundances of all CO3
2� isotopologues at different equilibration temperatures and with different bulk isotopic compositions.
Isotopologue ofCO3
2� ReactantMassa d13CVPDB(&) 0 10 0 0 10 0
d18OVSMOW(&) 0 0 10 0 0 10Equil. T (K) 500 500 500 300 300 300
12C16O16O16O2� 60 0.981845501 0.981736407 0.981780829 0.981845495 0.981736401 0.98178082313C16O16O16O2� 61 0.011033192 0.011142286 0.011032465 0.011033186 0.011142280 0.01103246012C17O16O16O2� 61 0.001119007 0.001118883 0.001124698 0.001119001 0.001118877 0.00112469212C18O16O16O2� 62 0.005906388 0.005905731 0.005965059 0.005906382 0.005905726 0.00596505313C17O16O16O2� 62 1.257521E�05 1.269955E�05 1.263916E�05 1.257710E�05 1.270146E�05 1.264106E�0512C17O17O16O2� 62 6.637827E�05 6.703460E�05 6.703764E�05 6.639792E�05 6.705445E�05 6.705748E�0513C18O16O16O2� 63 4.487818E�06 4.487320E�06 4.555747E�06 4.488118E�06 4.487619E�06 4.556051E�0612C18O17O16O2� 63 4.251179E�07 4.250706E�07 4.294809E�07 4.251298E�07 4.250826E�07 4.294930E�0713C17O17O16O2� 63 1.184398E�05 1.184267E�05 1.208125E�05 1.184530E�05 1.184399E�05 1.208260E�0512C17O17O17O2� 63 5.043864E�08 5.093736E�08 5.120209E�08 5.046478E�08 5.096376E�08 5.122862E�0812C18O18O16O2� 64 4.777666E�09 4.824907E�09 4.826700E�09 4.779286E�09 4.826542E�09 4.828336E�0913C18O17O16O2� 64 1.331213E�07 1.344375E�07 1.357881E�07 1.332149E�07 1.345321E�07 1.358836E�0712C18O17O17O2� 64 5.383609E�11 5.383010E�11 5.466880E�11 5.384187E�11 5.383588E�11 5.467467E�1113C17O17O17O2� 64 8.525078E�10 8.524131E�10 8.698698E�10 8.526678E�10 8.525730E�10 8.700330E�1013C18O18O16O2� 65 4.499842E�09 4.499342E�09 4.613632E�09 4.501037E�09 4.500536E�09 4.614857E�0912C18O18O17O2� 65 7.917198E�09 7.916318E�09 8.156559E�09 7.919962E�09 7.919082E�09 8.159407E�0913C18O17O17O2� 65 6.050678E�13 6.110505E�13 6.144267E�13 6.054144E�13 6.114005E�13 6.147787E�1312C18O18O18O2� 66 9.581874E�12 9.676617E�12 9.777016E�12 9.589474E�12 9.684291E�12 9.784770E�1213C18O18O17O2� 66 5.057908E�11 5.107919E�11 5.185810E�11 5.063019E�11 5.113081E�11 5.191051E�1113C18O18O18O2� 67 8.899522E�11 8.987519E�11 9.168583E�11 8.910502E�11 8.998607E�11 9.179895E�11
a Nominal cardinal mass in amu.
Phosphoric acid digestion of carbonate minerals 7223
We define
D�13C18O16O ¼ D13C18O16O � D13C18O16O2;
D�12C18O17O ¼ D12C18O17O � D12C18O17O16O;
D�13C17O2¼ D13C17O2
� D13C16O17O2
as the fractionations of specific isotopologue during phos-phoric acid digestion. Substituting these definitions in theequation above, we obtain
D�47 f13C18O16O�D�13C18O16Oþf12C18O17O�D�12C18O17O
�þf13C17O2
�D�13C17O2
�þ f13C18O16O�f13C18O16O2
� ��D13C18O16O2
þ f12C18O17O�f12C18O17O16Oð Þ
�D12C18O17O16Oþ f13C17O2�f13C16O17O2
� ��D13C16O17O2
�f12C17O3�D12C17O3

7224 W. Guo et al. / Geochimica et Cosmochimica Acta 73 (2009) 7203–7225
In carbonates of natural isotopic compositions,f13C18O16O � f13C18O16O2
� � � f12C18O17O � f12C18O17O16Oð Þ �
f13C17O2� f13C16O17O2
� � f12C17O3
and D13C18O16O2
D12C18O17O16O (e.g. for calcite D13C18O16O2¼ 0:406& and
D12C18O17O16O ¼ 0:071& at 300 K; Schauble et al., 2006),the above equation can therefore be further approximatedas
D�47 f13C18O16O � D�13C18O16O þ f12C18O17O � D�12C18O17O
�þf13C17O2
� D�13C17O2
�þ f13C18O16O � f13C18O16O2
� ��D13C18O16O2
As mentioned above, the D�i values are independent of Di ofthe reactant carbonate and are a function of only aciddigestion temperature, and thus can be regarded as con-stant at given temperature (at 25 �C, D�13C18O16O ¼ 0:225&;D�12C18O17O ¼ 0:070& and D�13C17O17O ¼ 0:277&, respec-tively):
D�47 constantþ f13C18O16O � f13C18O16O2
� �� D13C18O16O2
constantþ f13C18O16O � f13C18O16O2
� �� D63
For carbonates with d13C=0& and d18O=0&, as as-sumed in our model, f13C18O16O2
¼ 0:9671 andf13C18O16O ¼ 0:9366. Therefore, we expect the dependenceof D�47 on D63 of the reactant carbonate to have a slope of�0.0305, based on the above analyses. This agrees well withour quantitative H2CO3 model prediction, �0.035& in-crease in D�47 for every 1& increase in D63. The small dis-crepancy is believed to arise from the approximationsadopted in the derivation of the above equations. Note thatthis slope for the dependence of D�47 on D63 varies little forcarbonates of different bulk isotopic compositions, sinceboth f13C18O16O and f13C18O16O2
are insensitive to the changesin the bulk isotopic compositions. The slope increases byonly �0.002 for 50& increase in d13C, and decrease by�0.0005 for 50& increase in d18O.
REFERENCES
Al-Hosney H. A. and Grassian V. H. (2004) Carbonic acid: animportant intermediate in the surface chemistry of calciumcarbonate. J. Amer. Chem. Soc. 126, 8068–8069.
Al-Hosney H. A. and Grassian V. H. (2005) Water, sulfur dioxideand nitric acid adsorption on calcium carbonate: a transmissionand ATR-FTIR study. Phys. Chem. Chem. Phys. 7, 1266–1276.
Assonov S. S. and Brenninkmeijer C. A. M. (2003) On the 17Ocorrection for CO2 mass spectrometric isotopic analysis. Rapid
Commun. Mass Spectrom. 17, 1007–1016.
Barkan E. and Luz B. (2005) High precision measurements of17O/16O and 18O/16O ratios in H2O. Rapid Commun. Mass
Spectrom. 19, 3737–3742.
Bottcher M. (1996) 18O/16O and 13C/12C fractionation during thereaction of carbonates with phosphoric acid: effects of cationicsubstitution and reaction temperature. Isot. Environ. Health
Stud. 32, 299–305.
Came R. E., Eiler J. M., Veizer J., Azmy K., Brand U. andWeidman C. R. (2007) Coupling of surface temperatures andatmospheric CO2 concentrations during the Palaeozoic era.Nature 449, 198–201.
Coplen T. B., Kendall C. and Hopple J. (1983) Comparison ofstable isotope reference samples. Nature 302, 236–238.
Das Sharma S., Patil D. J. and Gopalan K. (2002) Temperaturedependence of oxygen isotope fractionation of CO2 frommagnesite-phosphoric acid reaction. Geochim. Cosmochim. Acta
66, 589–593.
Des Marais D. J. (1997) Long-term evolution of the biogeochem-ical carbon cycle. Rev. Miner. Geochem. 35, 429–448.
Eiler J. M. and Schauble E. (2004) 18O13C16O in Earth’satmosphere. Geochim. Cosmochim. Acta 68, 4767–4777.
Eyring H. (1935a) Activated complex in chemical reactions. J.
Chem. Phys. 3, 107–115.
Eyring H. (1935b) The activated complex and the absolute rate ofchemical reactions. Chem. Rev. 17, 65–77.
Felipe M. A., Xiao Y. and Kubicki J. D. (2001) Molecular orbitalmodeling and transition state theory in geochemistry. Rev.
Mineral. Geochem. 42, 485–531.
Foresman, J.B., Frisch, A. (1993). Exploring chemistry withelectronic structure methods. Gaussian, Inc.
Ghosh P., Adkins J., Affek H. P., Balta B., Guo W., Schauble E.A., Schrag D. and Eiler J. M. (2006) 13C–18O bonds incarbonate minerals: a new kind of paleothermometer. Geochim.
Cosmochim. Acta 70, 1439–1456.
Ghosh P., Eiler J., Campana S. E. and Feeney R. F. (2007)Calibration of the carbonate’clumped isotope’ paleothermom-eter for otoliths. Geochim. Cosmochim. Acta 71, 2736–2744.
Gilg H. A., Struck U., Vennemann T. and Boni M. (2003)Phosphoric acid fractionation factors for smithsonite andcerussite between 25 and 72 �C. Geochim. Cosmochim. Acta
67, 4049–4055.
Hage W., Liedl K. R., Hallbrucker A. and Mayer E. (1998)Carbonic acid in the gas phase and its astrophysical relevance.Science 279, 1332–1335.
Kerisit S., Parker S. C. and Harding J. H. (2003) Atomisticsimulation of the dissociative adsorption of water on calcitesurfaces. J. Phys. Chem. B 107, 7676–7682.
Kim S.-T., Mucci A. and Taylor B. E. (2007) Phosphoric acidfractionation factors for calcite and aragonite between 25 and75 �C: revisited. Chem. Geol. 246, 135–146.
Kim S.-T. and O’Neil J. R. (1997) Equilibrium and nonequilibriumoxygen isotope effects in synthetic carbonates. Geochim. Cos-
mochim. Acta 61, 3461–3475.
Land, L.S. (1980). The isotopic and trace element geochemistry ofdolomite: the state of the art.In SEPM Special Publications. 28.87-110.
Lasaga A. C. (1998) Kinetic Theory in the Earth Science. PrincetonUniversity Press.
Li W. J. and Meijer H. A. J. (1998) The use of electrolysis foraccurate d17O and d18O isotope measurements in water. Isot.
Environ. Health Stud. 34, 349–369.
Loerting T., Tautermann C., Kroemer R. T., Kohl I., HallbruckerA., Mayer E. and Liedl K. R. (2000) On the surprising kineticstability of carbonic acid (H2CO3). Angew. Chem. Int. Ed. 39,
892–894.
Mao Y. and Siders P. D. (1997) Molecular Hartree–Fock model ofcalcium carbonate. J. Mol. Struct. Theochem. 419, 173–
184.
McCrea J. M. (1950) The isotopic chemistry of carbonates and apaleo-temperature scale. J. Chem. Phys. 18, 849–857.
Melander L. and Saunders J. W. H. (1987) Reaction Rates of
Isotopic Molecules. John Wiley & Sons, Inc..Miller M. F., Rockmann T. and Wright I. P. (2007) A general
algorithm for the 17O abundance correction to 13C/12C deter-minations from CO2 isotopologue measurements, includingCO2 characterised by ‘mass-independent’ oxygen isotope dis-tributions. Geochim. Cosmochim. Acta 71, 3145–3161.
O’Neil J. R. (1986) Theoretical and experimental aspects ofisotopic fractionation. Rev. Mineral. 16, 1–40.
Phosphoric acid digestion of carbonate minerals 7225
Ramirez J.-Z., Vargas R., Garza J. and Hay B. P. (2006)Performance of the effective core potentials of Ca, Hg, andPb in complexes with ligands containing N and O donor atoms.J. Chem. Theory Comput. 2, 1510–1519.
Ringnalda, M.N., Langlois, J.-M., Greeley, B.H., Russo, T.V.,Muller, R.P., Marten, B., Won, Y., Donnelly, R.E., Pollard, J.,Thomas, W., Miller, G.H., Goddard, W.A.I., Friesner, R.A.(2005). Jaguar, version 6.5. Schrodinger, LLC, New York, NY.
Rollion-Bard C., Mangin D. and Champenois M. (2007) Devel-opment and application of oxygen and carbon isotopic mea-surements of biogenic carbonates by ion microprobe. Geostand.
Geoanal. Res. 31, 39–50.
Rosenbaum J. and Sheppard S. M. F. (1986) An isotopic study ofsiderites, dolomites and ankerites at high temperatures. Geo-
chim. Cosmochim. Acta 50, 1147–1150.
Ruuska H., Hirva P. and Pakkanen T. A. (1999) Cluster models forcalcite surfaces: ab initio quantum chemical studies. J. Phys.
Chem. B 103, 6734–6740.
Schauble E. A., Ghosh P. and Eiler J. M. (2006) Preferentialformation of 13C–18O bonds in carbonate minerals, estimatedusing first-principles lattice dynamics. Geochim. Cosmochim.
Acta 70, 2510–2529.
Scott A. P. and Radom L. (1996) Harmonic vibrational frequencies:an evaluation of Hartree–Fock, Moeller–Plesset, QuadraticConfiguration Interaction, Density Functional Theory, andsemiempirical scale factors. J. Phys. Chem. 100, 16502–16513.
Sharma S. K. and Sharma T. (1969a) Oxygen isotope fractionationfactor between carbon dioxide and carbonate ion. Int. J. Mass
Spectrom. Ion Phys 2, 367–371.
Sharma S. K. and Sharma T. (1969b) Intramolecular kineticisotope effect in the acid decomposition of carbonates. Int. J.
Mass Spectrom. Ion Phys. 2, 485–493.
Sharma T. and Clayton R. N. (1965) Measurement of 18O/16Oratios of total oxygen of carbonates. Geochim. Cosmochim. Acta
29, 1347–1354.
Sharp Z. D. and Cerling T. E. (1996) A laser GC-IRMS techniquefor in situ stable isotope analyses of carbonates and phosphates.Geochim. Cosmochim. Acta 60, 2909–2916.
Suito K., Namba J., Horikawa T., Taniguchi Y., Sakurai N.,Kobayashi M., Onodera A., Shimomura O. and Kikegawa T.(2001) Phase relations of CaCO3 at high pressure and hightemperature. Am. Mineral. 86, 997–1002.
Swart P. K., Burns S. J. and Leder J. J. (1991) Fractionationof the stable isotopes of oxygen and carbon in carbondioxide during the reaction of calcite with phosphoric acidas a function of temperature and technique. Chem. Geol. 86,
89–96.
Tossell J. A. (2006) H2CO3 and its oligomers: structures, stabilities,vibrational and NMR spectra, and acidities. Inorg. Chem. 45,
5961–5970.
Urey H. C. (1947) Thermodynamic properties of isotopic sub-stances. J. Chem. Soc., 562–581.
Wang Z., Schauble E. A. and Eiler J. M. (2004) Equilibriumthermodynamics of multiply substituted isotopologues ofmolecular gases. Geochim. Cosmochim. Acta 68, 4779–
4797.
Associate editor: Juske Horita