Isotopic and enzymatic analyses of planktonic nitrogen utilisation in the vicinity of Cape Sines...
25
8, Pergamon Deep-sea Research I. vol. 44. No. 1. pp. 1-25. 1997 Q 1997 Elsevier Science Lid Printed in Grcat Britain. All rights reserved PII: S0967-0637(96)00103-3 0967-0637/97 $17.00+0.00 Isotopic and enzymatic analyses of planktonic nitrogen utilisation in the vicinity of Cape Sines (Portugal) during weak upwelling activity GERD SLAWYK," BERNARD COSTE,* YVES COLLOS?. and MARTINE RODIERt (Received 19 April 1996; in revisedform 16 Jub 1996; accepted5 October 1996) Abstract-Using measurements of "N uptake and activities of nitrate reductase and glutamine synthetase, the utilization of nitrogenous nutrients by microplankton in the Portuguese upwelling area was investigated. During this cruise the euphotic zone of coastal waters was in most cases bisected by a nitracline forming two layers. Total inorganicnitrogen uptake rates (Ni$'+ NO;) in the upper mixed and nitrate-impoverished layer ranged from 0.1 to 0.8 nM h-' and were primarily supported by regenerated (ammonium) nitrogen (62-97%), whereas they varieed between 0.9 and 10.4 nM h-' in the deep nitrate-rich layer and were mainly driven by new (nitrate) nitrogen (52- 82%). Depth profiles of Chl u-specific uptake rates for ammonium and nitrate paralleled those of absolute uptake rates, i.e. values of G: were highest (up to 16.1 nmol pg-' b-') in nitrate-poor surfacewaters while values of were maximum(up to 8.4 nmol Fg-' h-I) within the nitracline. This latter vertical ordering of planktonic nitrogen nutrition was consistent With an aged upwelling situation. However, applying several indices of cell metabolism and nutritional status, such as "N uptake/enzyme activity, surge uptake/intemally controlled uptake, and *&/Kt ratios,we were able to demonstrate that the phytoplankton assemblages inhabiting the nutrient-impoverished upper layer still bore the signature of physically mediated nitrogen (nitrate) supply generated by active upwelling that had occurred during the week before our visit to the area. This signature was the most evident in samplesfrom the station furthestinshore and faded with distancefrom shore as a result of the deepening of the nitrate isopleths (weakening of upwelling activity), which showed the same offshoretrend. The appearance of nitrate-rich waters a t the s urf. after a strong pulse of upwelling favourable winds just before the end of the cruise, led to a fivefold in- in average (over the euphoticzone) absolute and Chl a-specific nitrate uptake ratCs (10.4 nM h-', 7.5 nmol pg-' h-') compared to the mean rates during weak upwelling (1.7 nh4 h-I, 1.5 nmol pg-' h-'). From a comparison with the neighbouring Moroccan upwelling, it is assumed that new produdion in the Portuguese upwelling averages 50 nM h-'." Thus, this upwelling would rank with the northwest African upwelling system off Cape Blanc o r with the Californian upwelling at Poinf Conception for the capacity of new production, but seems to be much less effcient (seven-fold) than the highly permanent Peru upwelling. 8 1997 Elsevier Science Ltd. All rights resewed . - INTRODUCTION Seasonal coastal temperature deficit charts established for the eastern boundary of the North Atlantic Ocean (Wooster et al., 1976) reveal during summer, between 37 and 43"N, a region off Portugal where surfacewater temperatures are pore than 2S°C colder than in the *Laboratoire d'Océanologie et de Biogéochimie (Uh4R CNRS 6533, Campus de Luminy, case 901,F-13288 ?Laboratoire d'Hydrobiologie @R CNRS 5556), Université de Montpellier II, Place Eugène Bataillon, CC $Centre ORSTOM, B.P. A5, Noum& cedex, New Caledonia. Marseille cedex 9, France. 093, F-34095 Montpellier cedex 5, France. 1 I , I
-
Upload
independent -
Category
Documents
-
view
3 -
download
0
Transcript of Isotopic and enzymatic analyses of planktonic nitrogen utilisation in the vicinity of Cape Sines...
8 ,
Pergamon Deep-sea Research I. vol. 44. No. 1. pp. 1-25. 1997
Q 1997 Elsevier Science Lid Printed in Grcat Britain. All rights reserved
PII: S0967-0637(96)00103-3 0967-0637/97 $17.00+0.00
Isotopic and enzymatic analyses of planktonic nitrogen utilisation in the vicinity of Cape Sines (Portugal) during weak upwelling activity
GERD SLAWYK," BERNARD COSTE,* YVES COLLOS?. and MARTINE RODIERt
(Received 19 April 1996; in revisedform 16 Jub 1996; accepted5 October 1996)
Abstract-Using measurements of "N uptake and activities of nitrate reductase and glutamine synthetase, the utilization of nitrogenous nutrients by microplankton in the Portuguese upwelling area was investigated. During this cruise the euphotic zone of coastal waters was in most cases bisected by a nitracline forming two layers. Total inorganic nitrogen uptake rates (Ni$'+ NO;) in the upper mixed and nitrate-impoverished layer ranged from 0.1 to 0.8 nM h-' and were primarily supported by regenerated (ammonium) nitrogen (62-97%), whereas they varieed between 0.9 and 10.4 nM h-' in the deep nitrate-rich layer and were mainly driven by new (nitrate) nitrogen (52- 82%). Depth profiles of Chl u-specific uptake rates for ammonium and nitrate paralleled those of absolute uptake rates, i.e. values of G: were highest (up to 16.1 nmol pg-' b-') in nitrate-poor surface waters while values of were maximum (up to 8.4 nmol Fg-' h-I) within the nitracline. This latter vertical ordering of planktonic nitrogen nutrition was consistent With an aged upwelling situation. However, applying several indices of cell metabolism and nutritional status, such as "N uptake/enzyme activity, surge uptake/intemally controlled uptake, and *&/Kt ratios, we were able to demonstrate that the phytoplankton assemblages inhabiting the nutrient-impoverished upper layer still bore the signature of physically mediated nitrogen (nitrate) supply generated by active upwelling that had occurred during the week before our visit to the area. This signature was the most evident in samples from the station furthest inshore and faded with distance from shore as a result of the deepening of the nitrate isopleths (weakening of upwelling activity), which showed the same offshore trend. The appearance of nitrate-rich waters a t the s u r f . after a strong pulse of upwelling favourable winds just before the end of the cruise, led to a fivefold in- in average (over the euphoticzone) absolute and Chl a-specific nitrate uptake ratCs (10.4 nM h-', 7.5 nmol pg-' h-') compared to the mean rates during weak upwelling (1.7 nh4 h-I, 1.5 nmol pg-' h-'). From a comparison with the neighbouring Moroccan upwelling, it is assumed that new produdion in the Portuguese upwelling averages 50 nM h-'." Thus, this upwelling would rank with the northwest African upwelling system off Cape Blanc or with the Californian upwelling at Poinf Conception for the capacity of new production, but seems to be much less effcient (seven-fold) than the highly permanent Peru upwelling. 8 1997 Elsevier Science Ltd. All rights resewed
. -
INTRODUCTION Seasonal coastal temperature deficit charts established for the eastern boundary of the North Atlantic Ocean (Wooster et al., 1976) reveal during summer, between 37 and 43"N, a region off Portugal where surface water temperatures are pore than 2S°C colder than in the
*Laboratoire d'Océanologie et de Biogéochimie (Uh4R CNRS 6533, Campus de Luminy, case 901, F-13288
?Laboratoire d'Hydrobiologie @R CNRS 5556), Université de Montpellier II, Place Eugène Bataillon, CC
$Centre ORSTOM, B.P. A5, Noum& cedex, New Caledonia.
Marseille cedex 9, France.
093, F-34095 Montpellier cedex 5, France. 1 I ,
I
2 G. Slawyk ef al.
mid-ocean. This temperature deficit along the west coast of Portugal suggests the occurrence of upwelling, i.e. vertical advection of cold and nutrient-rich subsurface waters. The spatial and temporal variation of the Portuguese upwelling has been studied in detail using wind data (speed and frequency), sea surface temperature anomalies relative to the central Atlantic taken from an atlas and remotely sensed sea surface temperature allowing a synoptic view of the study area (Fidza et al., 1982; Fiúza; 1983).
The latter authors have shown that upwelling off the Portuguese coast: (i) is seasonal with a maximum of intensity from July to September; (ii) is favoured by northerly winds (“the Portuguese trades”) blowing along the west coast; (iii) takes place with a l-month lag compared to the onset of favourable winds, which also present a summer maximum; and (iv) intensifies or relaxes within about 1 day with a corresponding offshore or onshore migration of the area covered by upwelled waters in response to intensification or weakening of windstress. The wind-induced offshore mass transport of water (Ekman transport) along the Portuguese coast, calculated from wind stress data, was monitored during summer 1981 and 1982 and was compared with satellite-derived phytoplankton-pigment distributions (Sousa and Bricaud, 1992). From that study, a significant relationship was found between the Ekman transport and the occurrence of plumes of phytoplankton-rich waters, i.e. during periods of intense (weak) transport corresponding satellite imagery exhibited well (poorly)- developed plumes.
In summer 1981, Coste et al. (1986) examined hydrological, chemical and biological (phytoplankton biomass) features of the Portuguese coastal upwelling region along an east- west transect at the latitude of Cape Sines. They were able to identify the signature of an active upwelling that had occurred prior to their study period although wann oligotrophic offshore waters were continuously progressing towards the coast on account of the steady weakening (from 6 to 1 m s- ’) of the upwelling favourable northerly component in the local wind field. An upwelling event that took place at the very end of their cruise, about 24 h after a reinforcement of these northerly winds (> 10 m s-’), gave further evidence of the close coupling between the patterns of the windfìeld and sea surface temperature.
A study of the distribution and taxonomic composition of the phytoplankton biomass carried out along the same section by Estrada (1995) showed that cells were abundant (up to 800 cells ml-’) in surface (inshore stations) and subsurface (offshore stations) waters and consisted mainly of diatoms and red tide-forming dinoflagellates.
The purpose of this paper is to present data on primary productivity, in terms of nitrogen, that were gathered in parallel with the hydrological and chemical data published by Coste et al. (1986) during the same cruise. This is the h t reported study using the 15N tracer to measure planktonic nutrient (nitrate and ammonium) uptake and kinetics in the Portuguese upwelling area. In addition, two enzymes (nitrate reductase and glutamine synthetase) involved in nitrogen assimilation of marine phytoplankton were assayed as an alternative to the determination of inorganic nitrogen incorporation applying the I5N methodology. From comparisons between activities of these two enzymes and corresponding I5N uptake rates, as well as from the response of the natural population to saturating additions of limiting nutrient (nutrient perturbation experiments), we attempted to derive indices of the nutritional status of the encountered planktonic assemblages reflecting the history of nitrogen metabolism, thus providing the means to assess nitrogen utilisation dynamics in the area.
i
Isotopic and enzymatic analyses of planktonic nitrogen utilisation 3
METHODS
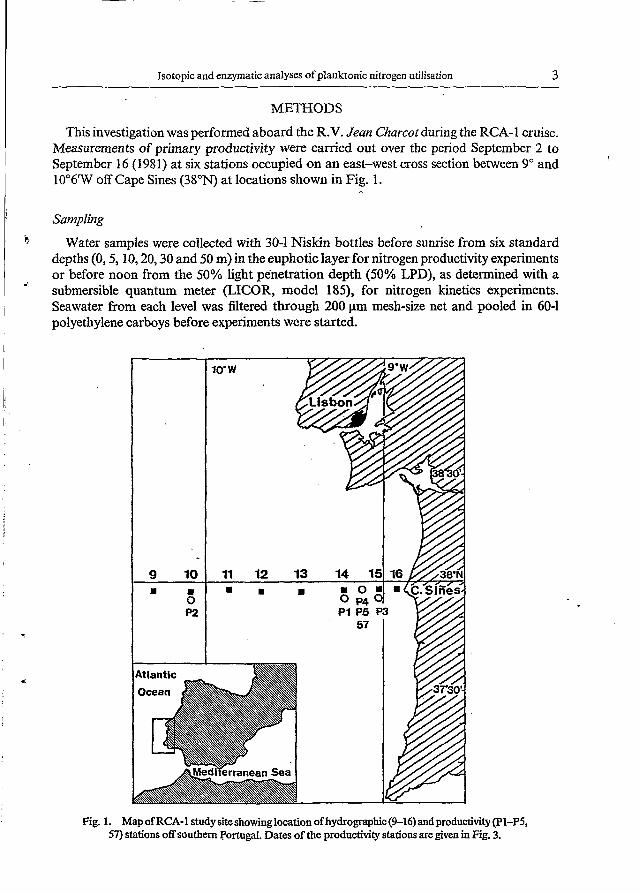
This investigation was performed aboard the R.V. Jean Charcot during the RCA-1 cruise. Measurements of primary productivity were carried out over the period September 2 to September 16 (1981) at six stations occupied on an east-west cross section between 9" and lO"6'W off Cape Sines (38"N) at locations shown in Fig. 1.
I
>
Sampling
Water samples were collected with 30-1 Niskin bottles before sunrise from six standard depths (O, 5,10,20,30 and 50 m) in the euphotic layer for nitrogen productivity experiments or before noon from the 50% light penetration depth (50% LPD), as determined with a submersible quantum meter (LICOR, model 185), for nitrogen kinetics experiments. Seawater from each level was filtered through 200 pm mesh-size net and pooled in 60-1 polyethylene carboys before experiments were started.
Fig. 1. Map of RCA-1 study site showing location of hydrographic (9-16) and productivity (Pl-P5, 57) stations off southem Portugal. Dates of the productivity stations are given in Fig. 3.
4 G. Slawyk el al.
Nutrients and bionzass
Concentrations of ambient nitrate and ammonium nitrogen were measured immediately after sampling using a Technicon AutoAnalyzer according to working procedures of Treguer and Le Corre (1975) and Slawyk and MacIsaac (1972), respectively. Ammonium concentrations were also measured manually by the Koroleff (1970) method. Particulate matter was collected on precombusted (400°C for 4 h) 'Whatman GF/C filters (25 mm in diameter) by filtration of 2 1 of seawater, and the particulate organic nitrogen (PON) was determined with a Perkin Elmer model 240 elemental analyser. Chl a was determined by filtering 500 ml of seawater onto combusted 47-mm Whatman GF/C filters. The filters were ground manually in 90% cold acetone. The suspension of homogenised filter and cells was kept in the dark at 4°C for 1 h to complete the extraction and was then centrifuged for 10 min at 3000g. Chl a concentrations in the supernatant were measured fluorimetrically with a Turner model 111 fluorimeter. The fluorimeter was calibrated against a standard made from pure Chl a (Sigma Chemical Co.).
ch tracer experiments
Ammonium and nitrate uptake were measured by the "N method as described by Dugdale and Goering (1967). Seawater samples were incubated in 5-1 Pyrex bottles under in situ conditions (Slawyk et ai., 1976) from sunrise to sunset (mean duration 13 h). Isotopes were added at "trace" concentrations so that enrichments in 15N as l 5 ~ C l (95 atoms %) and Na"N03 (97.4 atoms %) were 7-27% and 2-12% of the detectable ambient unlabelled compound for ammonium and nitrate, respectively. However, in samples from the nitrate- impoverished surface layer ( ~ 0 . 0 5 pM, lower detection limit) additions of 0.04-0.18 pM I5N-NO3- resulted probably in nearly 100% enrichments. Following incubation the particulate organic matter was collected onto pre-combusted (400°C for 4 h) GF/C glass- fiber filters (47 mm in diameter) by filtration using low vacuum (< 100 mm Hg), rinsed with nutrient-poor filtered seawaler, dried at 60"C, and its nitrogen (PON) converted to N2 by Dumas oxidation according to Slawyk et al. (1988). The "N abundance in the Nz was analyzed in a V.G. Micromass (U.K.) mm 601 isotope mass spectrometer fitted with a double collector. PON-specific nitrogen uptake rates (V; units, h-*) were calculated using a constant transport model based on PON concentrations at the beginning of the incubation according to Dugdale and Wilkerson (1986). Absolute uptake rates on a volume basis (p; units, nM h-') were computed from the product of Vand initial PON.
In addition, Chl a-normalised "N uptake rates, i.e. Chl a-specific uptake rates, were calculated by dividing absolute rates (p) by the corresponding Chl a concentrations. These rates are denoted as TOT and I@'+ (units, m o l pg-' h-') for Chl a-specific nitrate and ammonium uptake (Dickson and Wheeler, 1995).
To correct for the effect (enhancement) of increased substrate (from the added label) on the nitrate and ammonium uptake rate, at each productivity station a series of samples from the 50% LPD were enriched with "N-labelled nitrate (ammonium) in the range 0.1-10 pM (0.1-5.0 pM) and incubated under simulated in situ light conditions in surface water cooled deck incubators covered with 50% neutral density filters made from nickel screens (Veco- France). Assuming Michaelis-Menten kinetics, the half-saturation constants (KI, Table 1) were computed by a weighted non-linear regression method (Wilkinson, 1961). Uptake rates at ambient levels of substrate (in situ uptake rates) were then calculated as outlined by
_,
NH,
Isotopic and enzymatic analyses of planktonic nitrogen utilisation 5
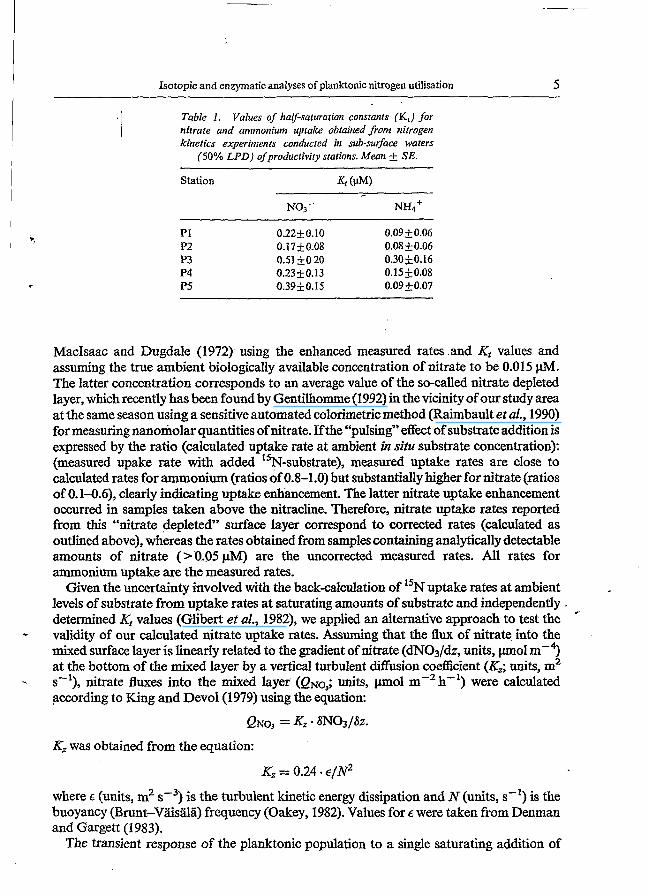
Table 1. Values of halj-saturation consrants (K,) for nitrate and ammonium uptake obtained front nitrogen kinetics experiments conducted in sub-surface waters
(50% LPD) ofproductivity stations. Mean L- SE.
Station K* (PM)
NO3- NH4+
PI 0.22+0.10 0.09 k0.06 P2 0.1 7 5 0.08 0.08 f 0.06 P3 0.51 &O 20 0.30k0.16 P4 0.23 *0.13 O. I 5 f 0.08 PS 0.3950.15 0.09 0.07
MacIsaac and Dugdale (1972) using the enhanced measured rates and Kt values and assuming the true ambient biologically available concentration of nitrate to be 0.015 pM. The latter concentration corresponds to an average value of the so-called nitrate depleted layer, which recently has been found by Gentilhomme (1992) in the Vicinity of our study area at the same season using a sensitive automated colorimetricmethod (Raimbault et al., 1990) for measuring nanomolar quantities of nitrate. If the “pulsing” effect of substrate addition is expressed by the ratio (calculated uptake rate at ambient in situ substrate concentration): (measured upake rate with added “N-substrate), measured uptake rates are close to calculated rates for ammonium (ratios of 0.8-1.0) but substantially higher for nitrate (ratios of O. 1-O.6), clearly indicating uptake enhancement. The latter nitrate uptake enhancement occurred in samples taken above the nitracline. Therefore, nitrate uptake rates reported from this “nitrate depleted” surface layer correspond to corrected rates (calculated as outlined above), whereas the rates obtained from samples containing analytically detectable amounts of nitrate (N.O5 pM) are the uncorrected measured rates. AU rates for ammonium uptake are the measured rates.
Given the uncertainty involved with the back-calculation of ”N uptake rates at ambient levels of substrate from uptake rates at saturating amounts of substrate and independently . determined Kz values (Glibert et al., 1982), we applied an alternative approach to test the validity of our calculated nitrate uptake rates. Assuming that the flux of nitrate into the mixed surface layer is linearly related to the gradient of nitrate (dNO&z, units, pm01 m-4) at the bottom of the mixed layer by a vertical turbulent diffusion coefficient (Kz; units, m2 s-’), nitrate fluxes into the mixed layer (&o,; units, pmol m-’h-’) were calculated according to King and Devo1 (1979) using the equation:
&o3 = Kz * 6NO3/6~.
K, was obtained from the equation:
Kz = 0.24 - €/N2 where 6 (units, m2 sW3) is the turbulent kinetic energy dissipation and N (units, s-l) is the buoyancy (Brunt-Vãisälä) frequency (Oakey, 1982). Values for L were taken from Denman and Gargett (1983).
The transient response of the planktonic population to a single saturating addition of
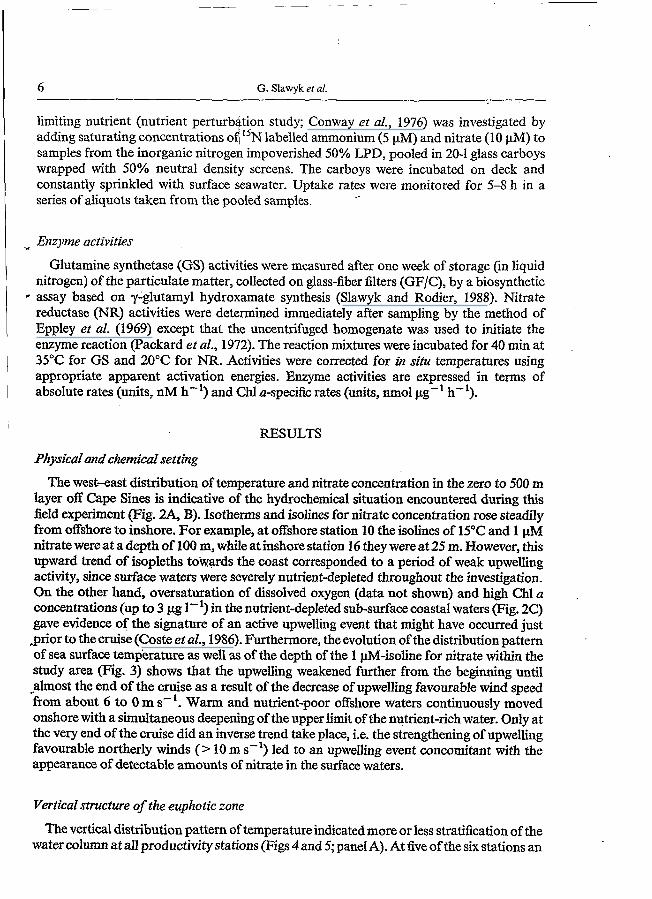
G. Slawyk et al.
limiting nutrient (nutrient perturbation study; Conway et al., 1976) was investigated by adding saturating concentrations ofl "N labelled ammonium (5 pM) and nitrate (10 pM) to samples from the inorganic nitrogen impoverished 50% LPD, pooled in 20-1 glass carboys wrapped with 50% neutral density screens. The carboys were incubated on deck and constantly sprinkled with surface seawater. Uptake rates were monitored for 5-8 h in a series of aliquots taken from the pooled samples.
Enzyme activities
Glutamine synthetase (GS) activities were measured after one week of storage (in liquid nitrogen) of the particulate matter, collected on glass-fiber filters (GF/C), by a biosynthetic
* assay based on y-glutamyl hydroxamate synthesis (Slawyk and Rodier, 1988). Nitrate reductase (NR) activities were determined immediately after sampling by the method of Eppley et al. (1969) except that the uncentrifuged homogenate was used to initiate the enzyme reaction (Packard et al., 1972). The reactionmixtures were incubated for 40 min at 35°C for GS and 20°C for NR. Activities were corrected for in situ temperatures using appropriate apparent activation energies. Enzyme activities are expressed in terms of absolute rates (units, nM h-') and Chl a-specific rates (units, m o l pg-' h-I).
, 1 1
, RESULTS
Physical and chemical setting
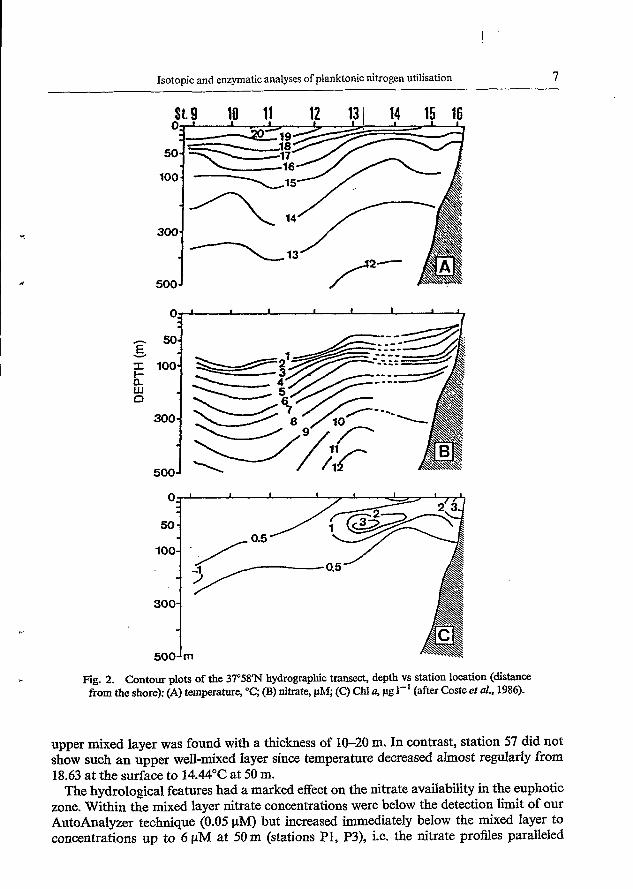
The west-east distribution of temperature and nitrate concentration in the zero to 500 m layer off Cape Sines is indicative of the hydrochemical situation encountered during this field experiment (Fig. 2A, B). Isotherms and isolines for nitrate concentration rose steadily from offshore to inshore. For example, at offshore station 10 the isolines of 15°C and 1 pM nitrate were at a depth of 100 m, while at inshore station 16 they were at 25 m. However, this upward trend of isopleths to@ards the coast corresponded to a period of weak upwelling activity, since surface waters were severely nutrient-depleted throughout the investigation. On the other hand, oversaturation of dissolved oxygen (data not shown) and high Chl a concentrations (up to 3 pg 1-') in the nutrient-depleted sub-surface coastal waters (Fig. 2C) gave evidence of the signature of an active upwelling event that might have occurred just ,prior to the cruise (Coste et al., 1986). Furthermore, the evolution of the distribution pattern of sea surface temlierature as well as of the depth of the 1 pM-isoline for nitrate within the study area (Fig. 3) shows that the upwelling weakened further from the beginning until -almost the end of the cruise as a result of the decrease of upwelling favourable wind speed from about 6 to O m s- '. Warm and nutrient-poor offshore waters continuously moved onshore with a simultaneous deepening of the upper limit of the nutrient-rich water. Only at the very end of the cruise did an inverse trend take place, i.e. the strengthening of upwelling favourable northerly winds (> 10 m s-') led to an upwelling event concomitant with the appearance of detectable amounts of nitrate in the surface waters.
.
Vertical structure of the euphotic zone
The vertical distribution pattern of temperature indicated more or less stratification of the water column at all productivity stations (Figs 4 and 5; panel A). At live of the six stations an
Isotopic and enzymatic analyses of planktonic nitrogen utilisation 7
h
E I I- a w cl
Y
r
300
500
Fig. 2. Contour plots of the 37'58" hydrographic tramst, depth vs station location (distance from the shore): (A) temperature, "C; (B) nitrate, p M (C) Chl u, pg I-' (after Coste et al., 1986).
upper mixed layer was found with a thickness of 10-20 m. In contrast, station 57 did not show such an upper well-mixed Iayer since temperature decreased almost regularly from 18.63 at the surface to 1 4 4 ° C at 50 m.
The hydrological features had a marked effect on the nitrate availability in the euphotic zone. Within the mixed layer nitrate concentrations were below the detection limit of our AutoAnalyzer technique (0.05 pM) but increased immediately below the mixed layer to concentrations up to 6 pM at 50 m (stations P1, P3), i.e. the nitrate profiles paralleled
8 G. Slawyk et al.
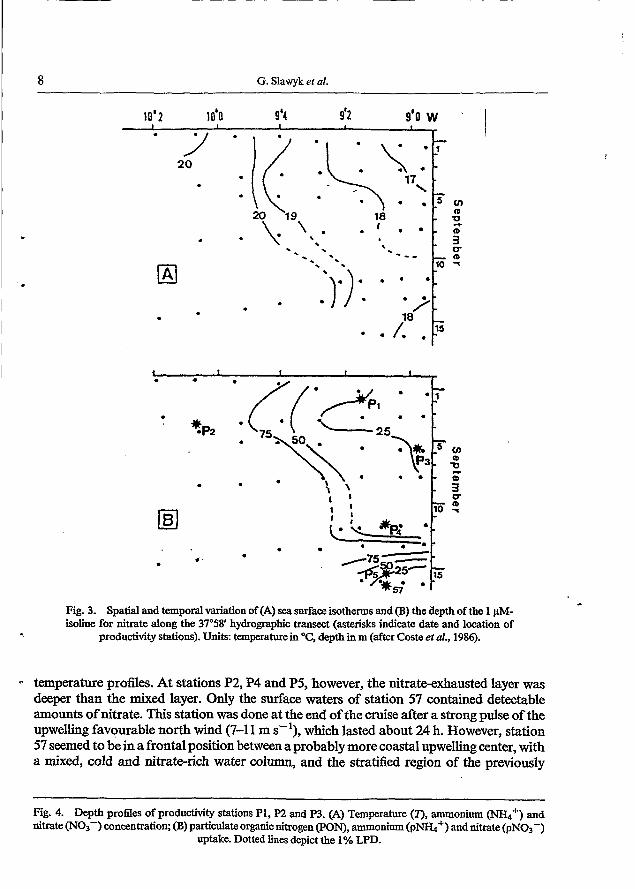
10'2 1to 9'4 9'0 w
Fig. 3. Spatial and temporal variation of (A) sea surface isotherms and (B) the depth of the 1 pM- isoline for nitrate along the 37"58' hydrographic transect (asterisks indicate date and location of
productivity stations). UNts: temperature ia OC, depth iam (after Coste et al., 1986).
temperature profiles. At stations P2, P4 and P5, however, the nitrate-exhausted layer was deeper than the mixed layer. Only the surface waters of station 57 contained detectable amounts of nitrate. This station was done at the end of the cruise after a strong pulse of the upwelling favourable north wind (7-1 1 m s-'), which lasted about 24 h. However, station 57 seemed to be in a frontal position between a probably more coastal upwelling center, with a mixed, cold and nitrate-rich water column, and the stratified region of the previously
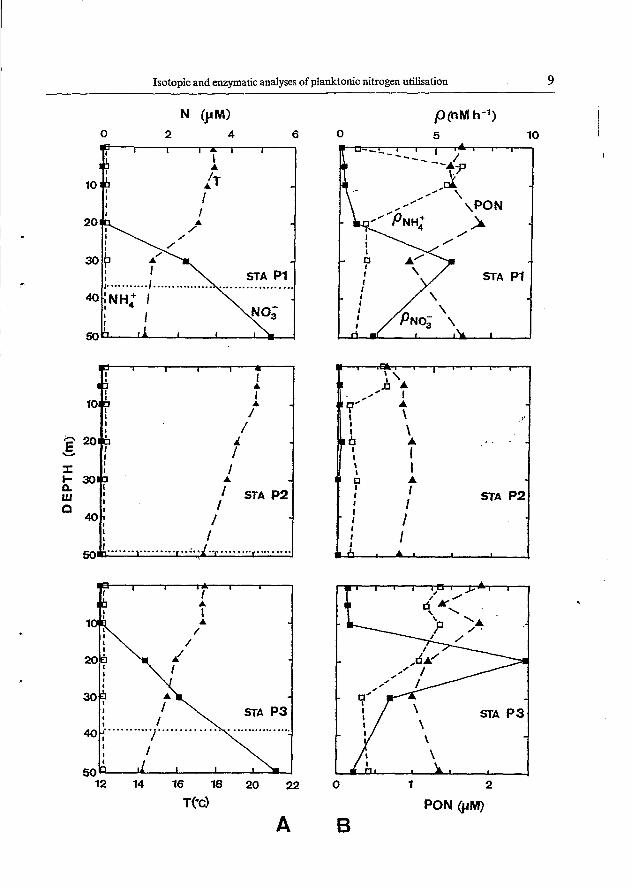
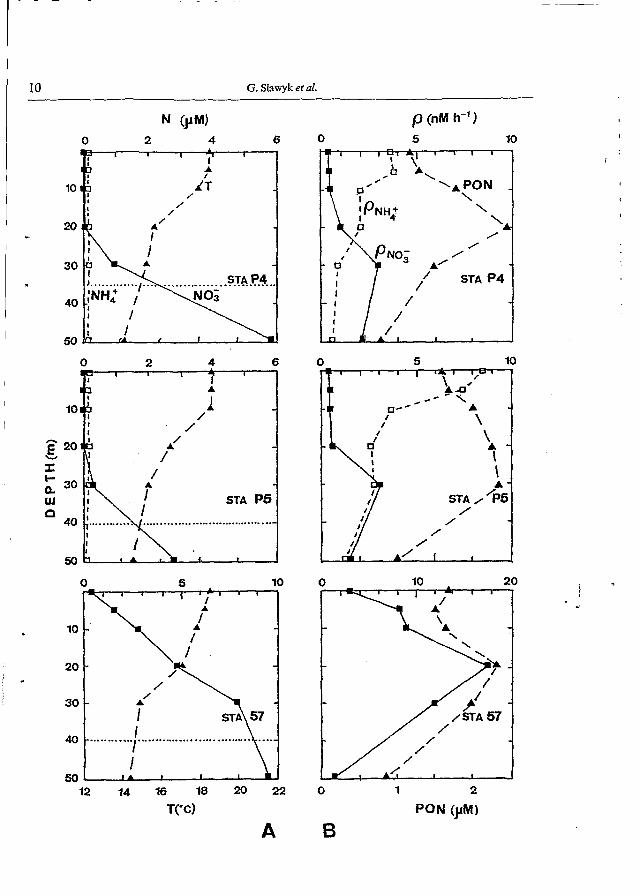
Fig. 4. Depth profiIes of productivity stations P1, P2 and P3. (A) Temperature (T), ammoaim (N€&+) and nitrate (NO,-) concentration; (B) particulate organic nitrogen (PON), ammonium ( p W + ) and nitrate @NO3-)
uptake. Dotted lines depict the 1% LPD.
Isotopic and enzymatic analyses of planktonic nitrogen utilisation 9
h l , I l 1 -
A ! 1
I I
l t 10 + I /
f g 201;:
w ; a l f
- 1
I : I k 30':
40: / I i
%1)1: .... * ..,.."..". +..i ..,.."..". .........
A - ' S A P 2
Ttc)
A
O 1 2
PON @M)
B
10 G. Slawyk ef al.
I I 1 f
1 - I
A l
/ I ' /
lo+
-
STA P5 .... .- ................... ...-
I , I
O 2 4 6
O 5 10
O 5 10
5 10
12 14 16 18 20 22 TCCI
A
Isotopic and enzymatic analyses of planktonic nitrogen utilisation 11
described stations with warm and nitrate-depleted surface waters. Ammonium concentrations were in the range 0.03-0.15 pM throughout the water column, showing no specific distribution patterns.
Concentrations of PON (Figs 4 and 5; panel B) ranged from about 1 to 2.5 pM and depicted, generally, a sub-surface maximum above or at the upper limit of the nitracline except at offshore station P2, where concentrations were < 1.0 pM and almost uniformly distributed over the euphotic layer.
Nitrate uptake profiles (Figs 4 and 5; panel B) directly paralleled nitrate concentration profiles. Uptake rates were < O 3 nM h-' in the upper layer and showed a distinct sub- surface maximum (up to 10 nM h-', station P3) within the nitracline between 20 and 30 m depth. Station 57 was the most productive station with nitrate uptake rates ranging from about three (surface) to 18 nM h-' (20 m). The sub-surface maximum was almost twice as high as the one found at station P3. Extremely low nitrate uptake rates ( ~ 0 . 1 nM h- ') were found at offshore station P2.
Values of integrated nitrate uptake rates from the mixed upper layer were close to the nitrate fluxes through the thermocline calculated from physical and chemical data (Table 2).
In contrast to nitrate uptake rates, those for ammonium were highest in the upper mixed and nitrate-depleted layer ranging from 0.6 (bottom of euphotic zone, station P2) to 8.5 nM h-' (surface, station P5).
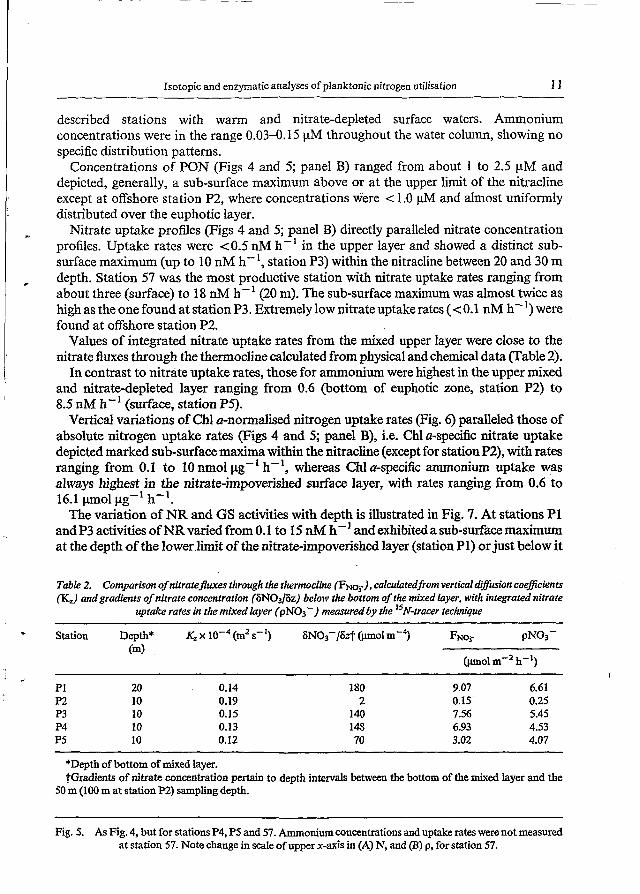
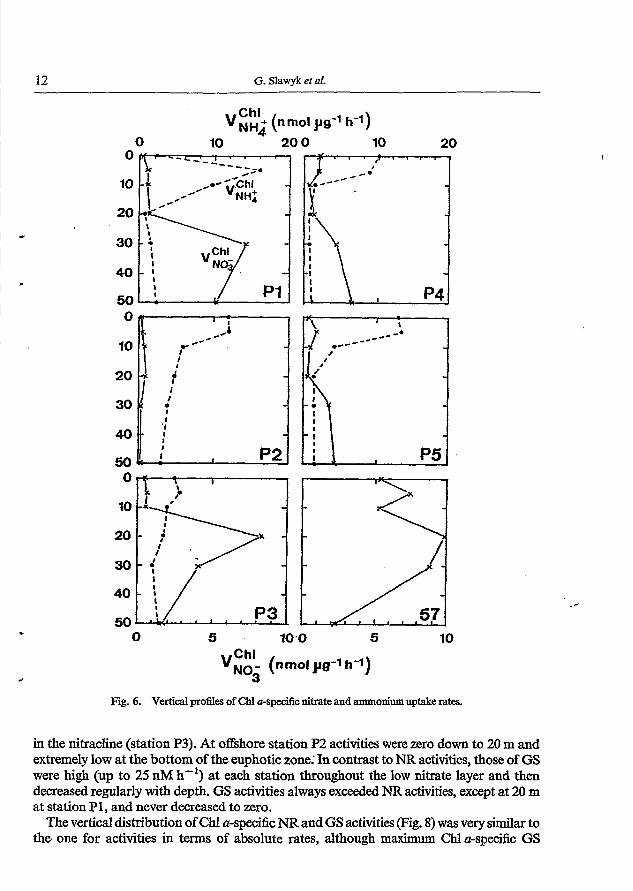
Vertical variations of Chl a-normalised nitrogen uptake rates (Fig. 6) paralleled those of absolute nitrogen uptake rates (Figs 4 and 5; panel B), i.e. Chl a-specific nitrate uptake depicted marked sub-surface maxima within the nitracline (except for station P2), with rates ranging from 0.1 to 10 nmol p8-l h-', whereas Chl a-specific ammonium uptake was always highest in the nitrate-impoverished surface layer, with rates ranging from 0.6 to 16.1 p o l pg-' h-'. The variation of NR and GS activities with depth is illustrated in Fig. 7. At stations P1
and P3 activities of NR varied from O. I to 15 nM h-' and exhibited a sub-surface maximum at the depth of the lower limit of the nitrate-impoverished layer (station P1) or just below it
Table 2. Comparison of niiratejluxes through ihe thermocline (FNO,-). calculatedfrom veriical d@wion coeficients (KJ andgradients of nitrate concentration (6NO316z) below the bottom ofthe mixed layer, wiih integrated nitraie
upidce rates ìn the mixed rayer (pNO3-) measured by the "N-irdcer technique . Station Depth* K, x (m' s-') i5NOJ-/6zt (IlmoI m-3 FNO,- PNo3- (4
@mol m-' h-') I
PI 20 O. 14 180 9.07 6.61 P2 10 0.19 2 0.15 0.25 P3 10 0.15 140 7.56 5.45 P4 10 0.13 148 6.93 4.53 P5 10 0.12 70 3.02 4.07
"Depth of bottom of mixed layer. +Gradients of nitrate concentration pertain to depth intervals between the bottom of the mixed layer and the
50 m (100 m at station PZ) sampling depth.
Fig. S. As Fig. 4, but for stations P4, P5 and 57. Ammonium concentrations and uptake rates were not measured at station 57. Note change in scale of upper x-axis in (A) N, and (B) p, for station 57.
1 12 G. Slawyk er aZ. I
O
10
20
30
40
50
O 10 20 o 10 20
O 5 10.0 5 10
Fig. 6. Vertical profles of Chl a-specific nitrate and ammonium uptake rates.
in the nJacline (station P3). At offshore station P2 activities were zero down to 2, m and extremely low at the bottom of the euphoticzone.' In contrast to NR activities, those of GS were high (up to 25 nM h-I) at each station throughout the low nitrate layer and then decreased regularly with depth. GS activities always exceeded NR activities, except at 20 m at station P 1, and never decreased to zero.
The vertical distribution of Chl a-specific NR and GS activities (Fig. 8) was very similar to the. one for activities in terms of absolute rates, although maximum Chl a-specifìc GS
. -'
Isotopic and enzymatic analyses of planktonic nitrogen utilisation 13
I l I l
II -
- I
30! -
I
40 f -
50. I I I
STA P2 I I
20 +--. . . . . . . . . . . . . -.. . .... 1 ..?*.
T I I l 1
I
ENZYME ACTIVITY (nM h-') Fig. 7. Depth distribution of nitrate reductase (NR) and glutamine synthetase (GS) activity. Dottedlinesdepictdepthofthelower limit ofnitrateimpoverished waters(>M matstationP2). NR
activity was not measured at 'STA P4".
\
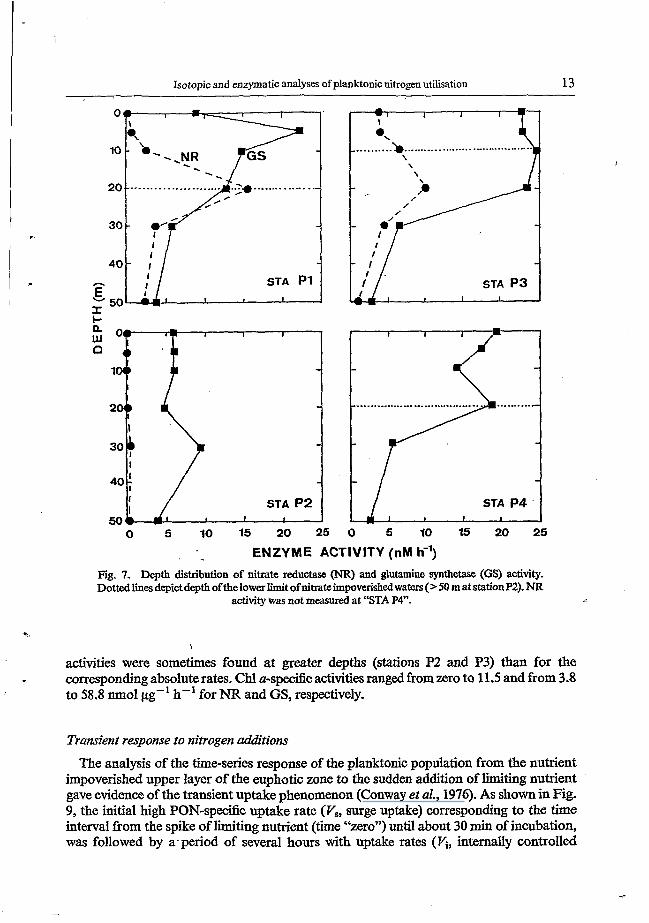
activities were sometimes found at greater depths (stations P2 and P3) than for the corresponding absolute rates. Chl a-specific activities ranged from zero to 11.5 and from 3.8 to 58.8 m o l jig-' h-' for NR and GS, respectively.
Transient response to nitrogen additions
The analysis of the time-series response of the planktonic population from the nutrient impoverished upper layer of the euphotic zone to the sudden addition of limiting nutrient gave evidence of the transient uptake phenomenon (Conway et al., 1976). As shown in Fig. 9, the initial high PON-spec5c uptake rate (VSy surge uptake) corresponding to the time interval from the spike of limiting nutrient (time "zero") until about 30 min of incubation, was followed by a-period of several hours with uptake rates (hY internally controlled
14 G. Slawyk et al.
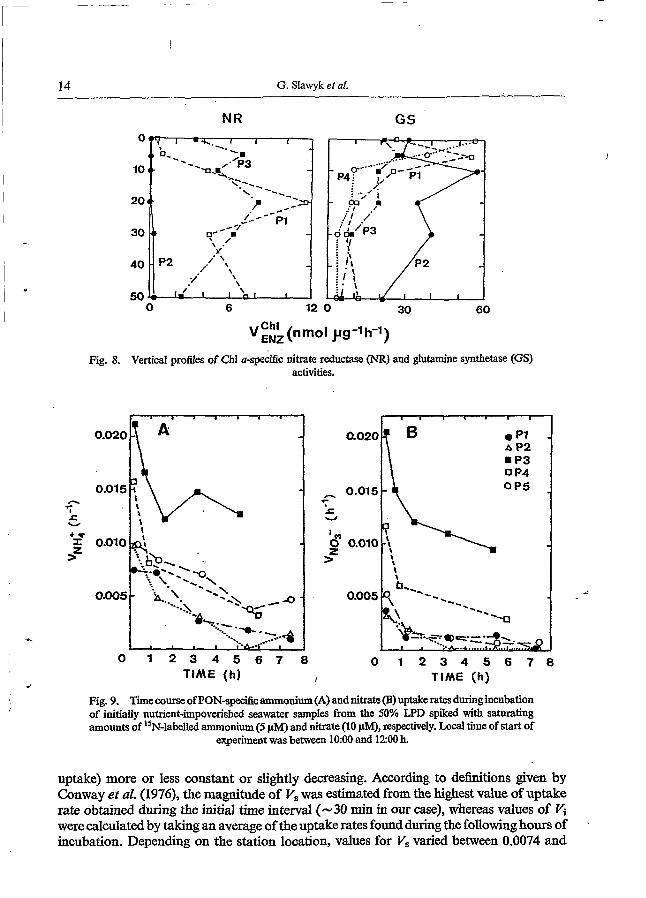
NR GS
I
O 6 12 o 30 60
(nmol pg-Ih-1) VChl ENZ
Fig. 8. Vertical profiles of Chi a-&ific nitrate reductase (NR) and glutamine synthetase (GS) activities.
O 1 2 3 4 5 6 7 E s O 1 2 3 4 5 6 7 8 TIME (h) I TIME (h)
Fi% 9. Time course of PON-specificammoninm (A) and nitrate (€3) uptake rates during incubation of initially nutrient-impoverished seawater samples from the 50% LPD spiked with saturating amounts of "N-labelled ammonium (5 pM) and nitrate (10 pIvl), respectively. Local time of start of
experiment was between 1O:OO and 1200 b
uptake) more or less constant or slightly decreasing. According to definitions given by Conway et al. (1976), the magnitude of V, was estimated from the highest value of uptake rate obtained during the initial time interval (-30 min in our case), whereas values of vl, were calculated by taking an average ofthe uptake rates found during the following hours of incubation. Depending on the station loation, values for V, varied between 0.0074 and
Isotopic and enzymatic analyses of planktonic nitrogen utilisation 15
0.0212 !h-' and between 0.0033 and 0.0204 h-' for ammonium and nitrate, respectiveiy. Those 'for Vi ranged from 0.0033 to 0.0141 h-' and from 0.0010 to 0.0119 h-' for
as for nitrate, were found at the station furthest offshore, station P2.
Indices of N utilisation and nutritional status
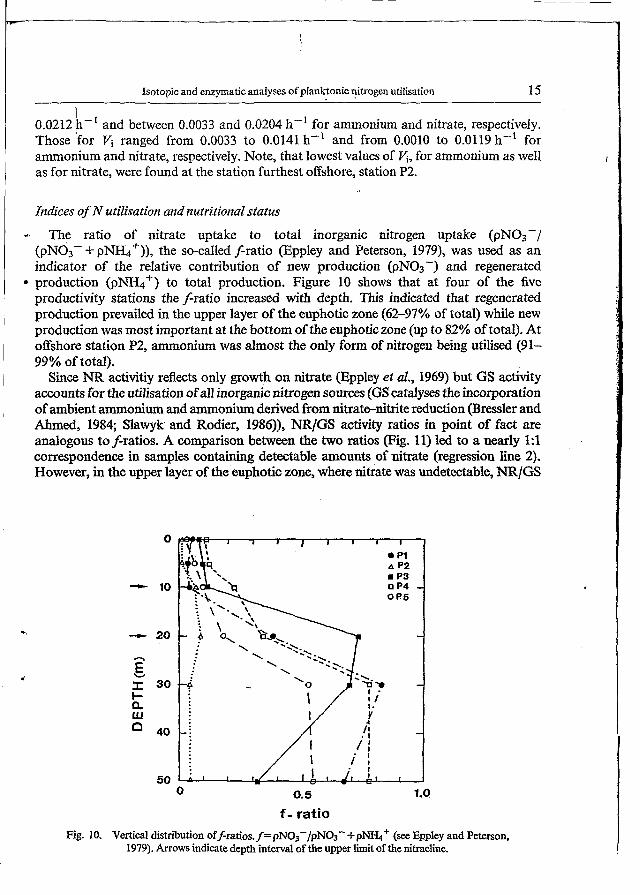
- The ratio of nitrate uptake to total inorganic nitrogen uptake @NO3-/ (pN03- + pNH4+)), the so-called f-ratio (Eppiey and Peterson, 1979), was used as an indicator of the relative contribution of new production (pNO3-) and regenerated production @NI&+) to total production. Figure 10 shows that at four of the five productivity stations the firatio increased with depth. This indicated that regenerated production prevailed in the upper layer of the euphotic zone (62-97% of total) while new production was most important at the bottom of the euphoticzone (up to 82% of total). At offshore station P2, ammonium was almost the only form of nitrogen being utilised (91- 99% of total).
ammonium and nitrate, respectively. Note, that lowest values of Vi, for ammonium as well I
! I Since NR activitiy reflects only growth on nitrate (Eppley er al., 1969) but GS activity
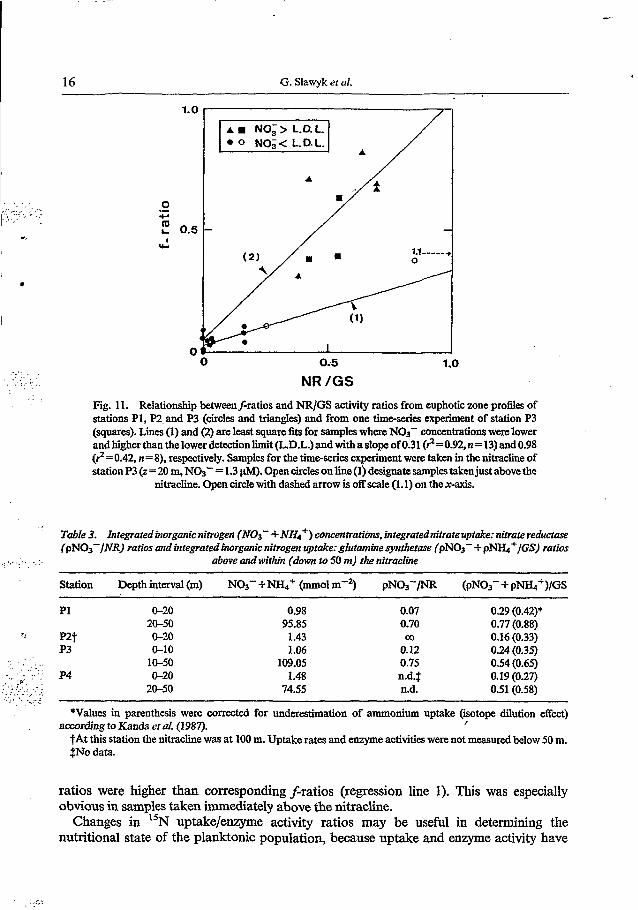
accounts for the utilisation of all inorganic nitrogen sources (GS catalyses the incorporation of ambient ammonium and ammonium derived from nitratenitrite reduction (Bressler and Aluned, 1984; Slawyk and Rodier, 1986)), NR/GS activity ratios in point of fact are analogous tof-ratios. A comparison between the two ratios (Fig. 11) led to a nearly 1:l correspondence in samples containing detectable amounts of nitrate (regression line 2). However, in the upper layer of the euphotic zone, where nitrate was undetectable, NR/GS
O
- 10 -c 20
Ê I" 30 t- P lil
40
50 O O. 5
f - ratio 1.0
Fig. 10. Vertical distribution offiratios. f = pNO3-/pN03- -k p m + (see ERpley and Peterson, 1979). Arrows indicate depth interval of the upper limit of the nitracline.
I *'
. .
. . . ... .. . . . . . . . . ..
, .'' 9. ' ', . . . ' l . . , .:. . . . . . . . j ( _ . .., .. . . . . . . , , . . , . . . . ~
16 G. Slawyk ei al.
A NO, > L.D.L. 0 NO,< L.D.L.
O Ob 1.0
NR /GS
Fig. 11. Relationship betweenf-ratios and NR/GS activity ratios from euphotic zone profles of stations PI, P2, and P3 (circles and triangles) and from one t i m d e s experiment of station P3 (squares). Lines (1) and (2) are least square fits for samples when NOS- concentrations wen lower and higher than the lower detection limit (L.D.L.) and with a slope of 0.31 (?=092, n= 13) and 0.98 (?=0.42, n=8). respectively. Samples for the theseries experiment were taken in the nitracline of station P3 (2 = 20 m, NO3- = 1.3 pM). Open circles on line (1) designate samples taken just above the
nitracline. Open circle with dashed arrow is off scale (1.1) on the x-axis.
Table 3. Integrated inorganic nitrogen (NO,- -I. NHA+) concentrations, integratednitrate uptake: nitrate reductase (pN03- JNR) ratios and integrated inorganic nitrogen uptake: glutamine synihetme (pNO3' + pN&+ JGS) raiíos
above and within (down to 50 m) the nitracline ~~ ~~
Station Depth interval (m) NO,- +NJ&+ (mol m-') pN03-/NR (pN03-+ pNT&+)/GS
PI 0-20 0.98 0.07 0.29 (0.42)* 20-50 95.85 0.70 0.77 (0.88)
P2f 0-20 1.43 Co 0.16 (0.33) P3 0-10 1.06 0.12 0.24 (0.35)
10-50 109.05 0.75 O S 4 (0.65)
20-50 74.55 n.d. 0.51 (0.58) P4 0-20 1.48 U.&$ 0.19 (0.27)
*Values in parenthesis were corrected for underestimation of ammonium uptake (isotope dilution effect)
tAt this station the nitracline was at 100 m. Uptake r a t a and enzyme activities were not measured below 50 m. $No data.
according to ]Kan& et al. (1987). I
ratios were higher than corresponding f-ratios (regression line 1). This was especially obvious in samples taken immediately above the nitracline.
Changes in I5N uptake/enzyme activity ratios may be useful in determining the nutritional state of the planktonic population, because uptake and enzyme activity have
- ., ...,. . .
Isotopic and enzymatic analyses of planktonic nitrogen utilisation 17
been shown to respond differently to changes i? the ambient light and nutrient fields (Collos and Slawyk, 1977; Blasco et al., 1984). The variations of pNOs-/NR and (pN03-+pNH4+)/GS ratios are shown in Table 3 for samples above and within the nitracline. Both ratios were lowest above the nitracline except at offshore station P2, where pN03-/NR ratios were infinite due to zero enzyme activity. Within the nitracline the ratios were substantially higher, approaching in some cases, a value of 1.0, which means equilibrium between uptake rates and enzyme activities. Note that the inclusion of possible 15N& isotope dilution did not change substantially the differences between (pNOs- + pN&')/GS ratios f r a above and within the nitracline. Thus, the two uptake/ enzyme activity ratios appeared to be influenced by nitrogenous nutrient availability or light level.
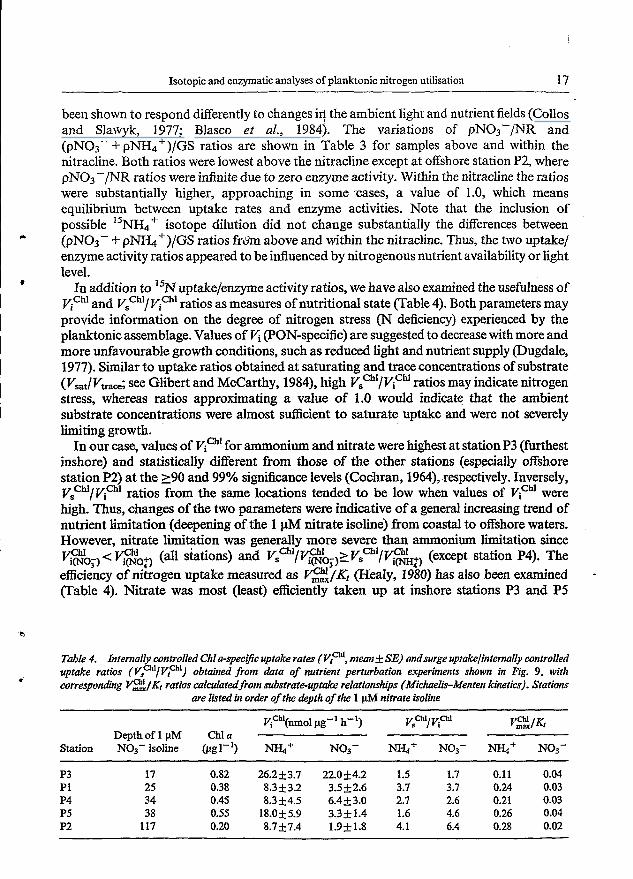
In addition to "N uptake/enzyme activity ratios, we have also examined the usefulness of Vich1 and V,""/ Vich1 ratios as measures of nutritional state (Table 4). Both parameters may provide information on the degree of nitrogen stress (N deficiency) experienced by the planktonic assemblage. Values of (PON-specific) are suggested to decrease with more and more unfavourable growth conditions, such as reduced light and nutrient supply (Dugdale, 1977). Similar to uptake ratios obtained at saturating and trace concentrations of substrate (Vmt/Vtrae; see Glibert and McCarthy, 1984), high VTh1/VfU ratios may indicate nitrogen stress, whereas ratios approximating a value of 1.0 would indicate that the ambient substrate concentrations were almost sufficient to saturate uptake and were not severely limiting growth.
In our case, values of Ka' for ammonium and nitrate were highest at station P3 (furthest inshore) and statistically different from those of the other stations (especially offshore station P2) at the 290 and 99% significance levels (Cochran, 1964), respectively. Inversely, V,Chl/Vial ratios from the same locations tended to be low when values of Vi"" were high. Thus, changes of the two parameters were indicative of a general increasing trend of nutrient limitation (deepening of the 1 pM nitrate isoline) from coastal to offshore waters. However, nitrate limitation was generally more severe than ammonium limitation since ?'$go:) < Go:, (all stations) and Vsa'/V$!$o~,~Vsch'/~$&.) (except station P4). The efficiency of nitrogen uptake measured as e / K , (Healy, 1980) has also been examined (Table 4). Nitrate was most (least) efficiently taken up at inshore stations P3 and P5
Table 4. Iniernah'y controlled Chia-specgc uptake rates ( Vta, mean &SE) andsurge upiake/in:ernally controlled uptake ratios (Vsa'/V;"-', obtained from data of nutrient perturbation experiments shown in Fig. 9. with corresponding PA/& ratios calculatedfrom substrate-upîake relationsfips (Michae&Menien kinetics). Statwns
are h ted in order of the depth of the 1 pA4 nitrate isoline
P3 17 0.82 26.253.7 22.024.2 1.5 1.7 0.11 0.04 P1 25 0.38 8.3k3.2 3.5k2.6 3.7 3.7 0.24 0.03
0.21 0.03 P4 34 0.45 8.354.5 6.4k3.0 2.7 2.6 P5 38 0.55 18.0k5.9 3.3k1.4 1.6 4.6 0.26 0.04 P2 117 0.20 8.7k7.4 1.9k1.8 4.1 6.4 0.28 0.02
18 G. Slawyk e l al.
TJ
(offshore station P2). Ammonium uptake was about one order of magnitvde more efficient than nitrate uptake (except at inshore station P3). 1
I
DISCUSSION
We visited the Portuguese upwelling area off Cape Sines during a period of mainly weak upwelling activity. At all stations (except station 57) a pronounced discontinuity layer existed within the euphotic zone. Applying the “N method to nitrogen uptake studies in such a system is not straight-forward. Most often, problems arise with samples collected in the nutrient-impoverished waters overlying the discontinuity layer. In these samples, incubation-related errors may stem from substrate exhaustion or the pulsing effect of adding the 15N tracer at concentrations well in excess of ambient substrate concentrations (Glibert and Goldman, 1981). From the good agreement between our corrected nitrate uptake rates and diffusional upward nitrate fluxes, we feel confident that nitrate utilisation was correctly measured in the upper mixed layer. However, we have estimated values for the vertical turbulent diffusion coefficient (K‘) using data on rates of turbulent kinetic energy (TISE) dissipation from the literature. Direct measurements of the dissipation rates and, hence, of K, (from the velocity shear microstructure; Oakey, 1982) simultaneously with those of ‘’N nitrate uptake would be the most powerful approach for assessing the importance of new production in upper mixed layers where nitrate concentrations are likely limiting. Furthermore, this approach could benefit from the highly sensitive methods now available for measuring nanomolar levels of nitrate (Garside, 1982; Raimbault et aZ., 1990). Note that the usefulness of combining direct measurements of TKE dissipation with biological observations has already been demonstrated in studies of phytoplankton growth (Lande et al., 1989) and photosynthetic performance (Lewis et al., 1984).
The relative contribution of “new” and “regenerated” nutrients to the planktonic nitrogenous nutrition (f-ratio) in the euphotic layer varied with depth in a way not unlike the classical distribution pattern known from oligotrophic stable open oceans (Goering et al., 1970) or temperate coastal waters during summer (Harrison, 1990). Phytoplankton within the discontinuity layer used nitrate as their major inorganic nitrogen source, while those living above it used to a large extent ammonium, as expected in this nitrate-impoverished layer which is presumably a site of enhanced in situ nutrient regeneration. Furthermore, maximum values of carbon uptake from vertical profiles (Minas, 1983) were at lower depths (above nitracline) than corresponding values of total nitrogen (nitrate+ ammonium) uptake. These íìndings indicate that primary productivity in terms of carbon during our situation of weak upwelling was mainly fuelled by regenerated nitrogen. Indirect evidence of grazer-induced nitrogen supply was obtained from two metabolic descriptors of the mesozooplankton community, i.e. amylase activity as an index of digestive assimilation of carbohydrates and aspartate transcarbamylase activity for assessing potential secondary production (Bergeron, 1995). Activities of the two enzymes increased steadily from the beginning to the end of the cruise, while integrated (over the euphotic zone) phytoplankton standing stocks showed a decreasing trend. Moreover, the importance of ammonium as a source of nitrogen for maintaining phytoplankton growth between upwelling events has been suggested previously by Dickson and Wheeler (1995).
Normalising ”N uptake rates from euphotic zone profìles to Chl a did not lead to a significant departure from the pattern of vertical ordering of inorganic nitrogen utilisation expressed in terms of absolute rates. There was a highly significant relationship between
' Y
Isotopic and enzymatic analyses of planktonic nitrogen utilisation 19
pN03- and V$& (r2=0.86, Pc0.001, n=36) and between pNH4+ and GE+ (r2=0.46, Pt0.001, n =30). The same was true when comparing Chl a-specific enzyme activities with absolute activities; i.e. for NR, r2=0.80 (P<O.OOl, a= 14) and for GS, r2=0.40 (P<O.Ol, n= 18), omitting the deviant station P2. Thus, changes in the vertical distribution of absolute uptake rates and absolute enzyme activities in our study area may reflect variations in some other parameter rather than phytoplankton biomass. We suggest that the changes in rates can be explained by changes ìn ambient nutrient concentrations. In the case of nitrate, we found a hyperbolic relationship between Chl u-specific nitrate uptake rate and nitrate concentration (r2=0.23, PtO.O1, n=36) with Ph'max=3.8 nmol 1.18-' h-' and KI =O. I pM (determined from a linear &die-Hofstee plot of the Michaelis-Menten equation). However, since we had to include in our analysis data from unsaturated light levels, the latter kinetic parameters are probably underestimated due to the light dependence of nitrate uptake. Dickson and Wheeler (1995) found a similar relationship between Chl u- specific nitrate uptake and nitrate concentration in the coastal upwelling off Oregon, but their kinetic coefficients gathered from light-saturated surface samples were about one order of magnitude higher than ours. Highest values of Chlu-specific nitrate uptake (- 10 nmol pg-' h-I) during weak upwelling off Portugal are within the range of values given by Dickson and Wheeler (1995) for a postbloom situation off Oregon.
Offshore station P2 may be considered as representative of a typically oligotrophic situation since it was located in the middle of an anticyclonic eddy, generated by a southward jet over the continental shelf and a northward flowing undercurrent about 100 km offshore, and characterised by a core of oceanic waters (Coste et al., 1986). Its nitrate discontinuity layer was much deeper (about 50 m) than the 1% LPD, and hence, nitrate uptake rates were extremely low (if not zero). This means that primary production within the euphotic zone of these oceanic waters relied heavily on regenerated nitrogen, i.e. ammonium. Zero NR activities with corresponding high Chl u-specific GS activities also gave evidence of planktonic preferred ammonium utilisation. A similar prevailing ammonium-based nitrogen nuhition has also been reported from the equatorial Atlantic (Le Bouteiller, 1986), where small size phytoplankton (picoplankton) was abundant in the whole euphotic layer. Small cells, utilising relatively more reduced nitrogen than net plankton (Probyn, 1985), may have also dominated primary production inside the eddy, because the typical large-sized planktonic upwelling community off Cape Sines was restricted mainly to an area between the coast and the eastqrn border of the eddy (Estrada, 1995).
It should be mentionned that other reduced nitrogen forms (urea for example) were not measured, nor was the possible underestimation of ammonium uptake, due to recycling of unlabelled ammonium during incubation (isotope dilution; Harrison et al., 1987), taken into account. The effect of these shortcomings is, of course, most signifiant in waters where primary productivity is fuelled largely by regenerated nutrients. Assuming that regeneration rates at least equalled uptake rates, we have estimated the isotope dilution effect according to a method suggested by Kanda et al. (1987). Based on these calculations, we would expect regenerated production to be higher by a factor of about 1.5.
In contrast to offshore station P2, inshore stations Pi, P3, P4 and P5 may ratherreflect an aged upwelling situation. Although the vertical ordering of planktonic nitrogen nutrition (f- ratio profiles) showed that, in surface waters, biologically mediated nitrogen (ammonium) supply mainly sustained primary productivity, there was evidence from several indices of nutritional status that the metabolic activity of the phytoplankton cells inhabiting these
I i I
.
20 G. Slawyk et al.
waters still bore the signature of physically mediated nitrogen (nitrate) supply (upwehg), which was probably prevailing just before we investigated the area.
For example, the low (<< 1) "N uptakelenzyme activity ratios indicated that external substrate was limiting but the enzyme system was still functioning. In other words, nitrogen utilisation was higher before sampling than during the I5N incubation period following sampling. These findings provide support for the idea that enzyme activity is a measure of the past (taking the sampling time as a point of reference), whereas 15N uptake is a measure of the future (Blasco et al., 1984). They are also consistent with data obtaiaed from nitrate- limited chemostat cultures (Slawyk and Rodier, 1986; Berges and Harrison, 1995). In these studies NR activity was positively correlated with nitrate incorporation, but rates of the former exceeded those of the latter. This fundamental difference between the two parameters may also explain why, in surface waters, NR/GS ratios are higher (> 1) than correspondingf-ratios. Interestingly, NR/GS activity ratios were highest in samples taken near the upper limit of the nitracline. This may reflect, in addition to the generai nitrogen assimilation potential resulting from a prior upwelling period, the enhanced potential of the cells due to their proximity to the base of the mixed layer, i.e. to a level where sporadic nitrate supply in response to wind stress is likely to OCCUT (Klein and Coste, 1984). Note that at the bottom of the euphotic zone, where nutrients were not limiting but light was limiting, 15N uptake/enzyme activity ratios did not reach a I:l correspondence (equilibrium). It seems that at low light levels uptake is relatively more depressed than enzyme activity (Blasco et al., 1984). This is, however, in contrast to results obtained from light-limited cultures, where NR activity was quantitatively related to nitrate uptake (Berges and Harrison, 1995).
Although comparisons of ea/& ratios indicated that ammonium uptake was more efficient than nitrate uptake in the upper mixed and nitrogen impoverished layer of all stations, further studies on uptake kinetics reinforced the view that coastal stations had recently experienced a period of active upwelling with nitrate enriched waters reaching the surface and, thus, with primary productivity essentially supported by new (nitrate) nitrogen. For example, planktonic populations from these stations exhibited much less nutrient stress (higher values for vl,"" and lower values for V:"/yi", than those inhabiting oceanic offshore waters. Moreover, changes of V:M/ fia ratios for nitrate with distance from shore reflected roughly the downward trend of nitrate isopleths (decreasing trend of upwelling activity), i.e. nutrient stress increased with decreasing nitrate proximity to the surface. However, it is worth remembering that there may be a significant shift in phytoplankton species from the coastal upwelling area (stations P1, P3, P4 and P5) to the offshore eddy (station P2). Hence, differences between indices of physiological status from populations of the oligotrophic offshore station and from those of the coastal stations may actually reflect differences in planktonic communities. Our V,Ch'/Via ratios may be compared to the Zehr et al. (1988) ratios of short-term 13N uptake to 13N incorporation in protein, with the exception that VicM in our ratios represents rather substrate uptake at rates saturating assimilatory enzymes involved in the incorporation of "N-labelled inorganic nitrogen into /
prhursors of protein synthesis (free amino acids). As in our natural populations, these authors found in a marine diatom that uptake and incorporation (ammonium in their case) were coupled (uncoupled) at high (low) growth rates.
With the indices we used in this study, we were able to assess the physiological condition of the populations encountered across the upwelling area, i.e. as upwelling intensity varied. In addition, we have verified the validity of the latter indices of N utilisation and nutrient
, -

Isotopic and enzymatic analyses of planktonic nitrogen utilisation 21
’P
J
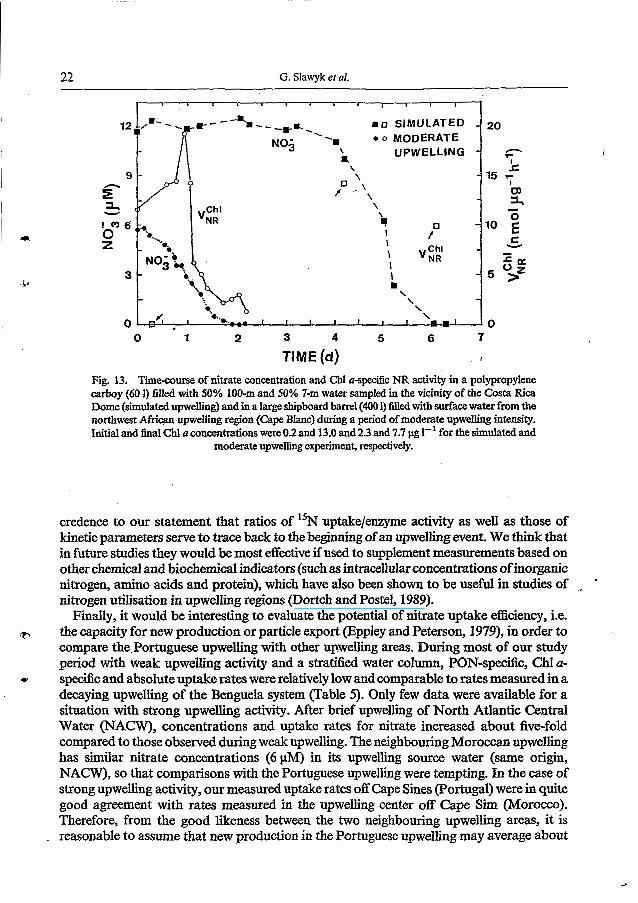
status as indicators of recent upwelling and examined what time scales are relevant to changes in these indices. High values of wind-induced offshore Ekman transport (-400 to -500 kg s-’ m-’) computed from wind measurements made in the vicinity of our study area (Sousa and Bricaud, 1992) clearly demonstrate that two upwelling events occurred several days before the beginning of the RCA-1 cruise (Fig. 12). In addition, we used information relating to nitrate disappearance rates, gathered from previous enclosure experiments, to examine if the latter time scale (several days since upwelling took place) is compatible with the lapse necessary to complete consumption of nitrate in recently upwelled water, since nitrate concentrations in surface waters of the Portuguese upwelling area were about zero at the start of our cruise (Fig. 13). In one enclosure (labelled on Fig. 13 as “simulated upwelling”) equal amounts of nitrate-rich deep water and of nitrate-depleted sub-surface water, sampled in a stratified oceanic area in the vicinity of the Costa Rica Dome, were mixed together. The other enclosure was obtained in the west African upwelling region (labeled on Fig. 13 as “moderate upwelling”) by filling it with surface water during a period of moderate upwelling intensity. In both enclosures, changes in nitrate concentration and in Chl a-specific NR activities were monitored until nitrate concentrations became zero. Interestingly, the time required to achieve nitrate exhaustion (2 and 6 days for the moderate and simulated upwelling experiment, respectively) is consistent with the time that elapsed since the occurrence of the two upwelling events just before the RCA-1 study period (Fig. 12). Note further that Chl a-specific NR activities are still easily detectable although nitrate has already been exhausted from the two shipboard cultures. Thus, these latter data give
Fig. 12. Six-hourly wind-induced Ekman transport computed from wind measurements made at coastal station Lisbon, for the period August 20 to September 29,1981. Negative transports are off-
shore. Redrawn from Sousa and Bricaud (1992).
22 G. Slawyk et al.
-, 0 0 MODERATE
O 1 2 3 4 5 6 7
TIME (d) , Fig. 13. Timecourse of nitrate concentration and Chl u-specific NR activity in a polypropylene carboy (60 1) filled with 50% 100-m and 50% 7-m water sampled in the vicinity of the Costa Rica Dome (simulated upwelling) and in a large shipboard barrel (400 1) filled with surface water from the northwest Afriqn upwelling region (Cape Blanc) during a period of moderate upwelling intensity. Initial and final Chl u concentrations were 0.2 and 13.0 and 2.3 and 7.7 pg 1-' for the simulated and
moderate upwelling experiment, respectively.
credence to our statement that ratios of "N uptake/enzyme activity as well as those of kinetic parameters serve to trace back to the beginning of an upwelling event. We think that in future studies they w6uld be most effective if used to supplement measurements based on other chemical and biochemical indicators (such as intracellular concentrations of inorganic nitrogen, amino acids and protein), which have also been shown to be useful in studies of ,
nitrogen utilisation in upwelling regions (Dortch and Postel, 1989). Finally, it would be interesting to evaluate the potential of nitrate uptake efficiency, i.e.
the capacity for new production or particle export (Eppley and Peterson, 1979), in order to compare the Portuguese upwelling with other upwelling areas. During most of our study period with weak upwelling activity and a stratified water column, PON-spedìc, Chl a- specific and absolute uptake rates were relatively low and comparable to rates measured in a decaying upwelling of the Benguela system (Table 5). Only few data were available for a situation with strong upwelling activity. After brief upwelling of North Atlantic Central Water (NACW), concentrations and uptake rates for nitrate increased about five-fold compared to those observed during weak upwelling. The neighbouring Moroccan upwelling has similar nitrate concentrations (6pM) in its upwelling source water (same origin, NACW), so that comparisons with the Portuguese upwelling were tempting. In the case of strong upwelling activity, our measured uptake rates off Cape Sines (Portugal) were in quite good agreement with rates measured in the upwelling center off Cape Sim (Morocco). Therefore, from the good likeness between the two neighbouring upwelling areas, it is
. reasonable to assume that new production in the Portuguese upwelling may average about
-
I
Isotopic and enzymatic analyses of planktonic nitrogen utilisation 23
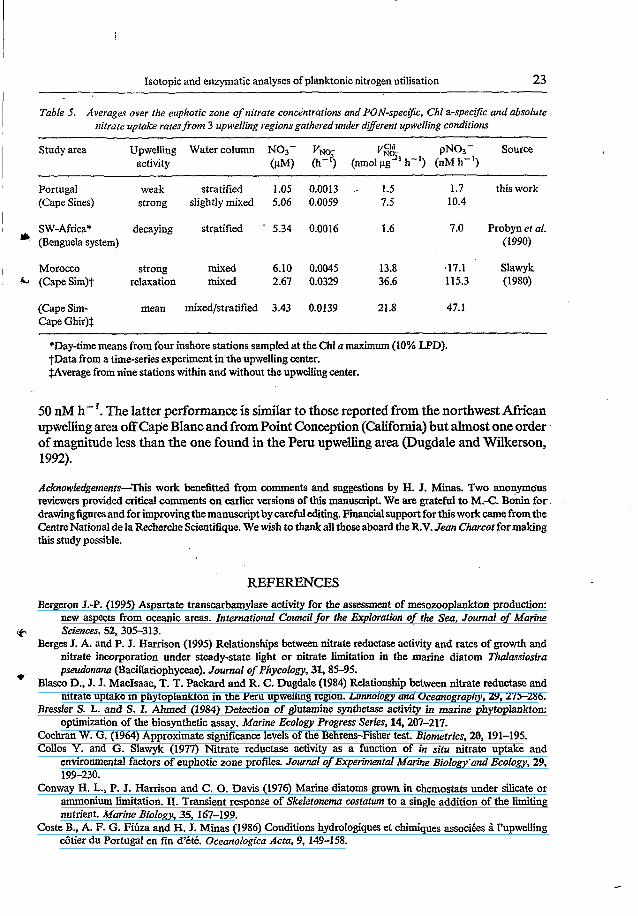
Table 5. Averages over the euphotic zone of nitrate concentrations and PON-specific. Chi a-specific and absolute nilrate uptake raies from 3 upwelling regions gathered under dyerent upwelling conditions
Study area Upwelling Water column NO3- VNO- P' pN03- Source activity (pM) O-') (nmd 2-l h-I) (nM h-')
Portugal weak stratified 1.05 0.0013 .- 1.5 1.7 this work (Cape Sines) strong slightly mixed 5.06 0.0059 7.5 10.4
SW-Afrim* decaying stratified . 5.34 0.0016 I .6 7.0 Probyn et ai. * (Benguela system) (1990)
Morocco strong mixed 6.10 0.0045 13.8 .17.1 Slawyk &I (CapeSim)t relaxation mixed 2.67 0.0329 36.6 115.3 (1980)
(Cape Sim- mean mixed/stratified 3.43 0.0139 21.8 47. I Cape Ghir)l
*Day-timemeans from four inshore stations sampled at the Chl u maximum (10% UD). ?Data from a time-series experiment in the upwelling center. $Average from nine stations within and without the upwelling center.
50 nM h- '. The latter performance is similar to those reported from the northwest African Upwelling area off Cape Blanc and from Point Conception (California) but almost one order of magnitude less than the one found in the Peru upwelling area (Dugdale and Wilkerson, 1992).
Acknowledgements-This work benefitted from comments and suggestions by H. J. Minas. Two anonymaus reviewers provided critical comments on earlier versions of this manuscript. We are grateful to M.-C. Bonin for. drawing figures and for improving the m a n h p t by careful editing. Financial support for this work came from the Centre National de la Recherche Scientifique. We wish to thank all thoseaboard the R.V. Jean Churcot for making this study possible.
REFERENCES Bergeron J.-P. (1995) Aspartate transcarbamylase activity for the assessment of mesozooplankton production:
new aspects from oceanic areas. International Council for the Exploration of the Sea, Journal of Marine
Berges J. A. and P. J. Harrison (1995) Relationships between nitrate reductase activity and rates of growth and nitrate incorporation under steady-siate light or nitrate limitation in the manne diatom Thalassiosiru pseudonana (Bacillariophyceae). J o m l of Phycology, 31,8545.
Blasco D., J. J. MacIsaac, T. T. Packard and R. C. Dugdale (1984) Relationship between nitrate reductase and nitrate uptake in phytoplankton in the Peru upwelling region. Limnalogy and Oceanography, 29.275-286.
Bressler S. L. and S. I. Ahmed (1984) Detection of g l u m h e synthetase activity in marine phytoplankton: optimization of the biosynthetic assay. Marine Ecology Progress Series, 14,207-217.
Cochran W. G. (1964) Approximate significance levels of the Behrens-Fisher test. Biometrics, 20,191-195. Collos Y . and G. Slawyk (1977) Nitrate reductase activity as a function of in situ nitrate uptake and
environmental factors of euphotic zone profiles. Journal of Experimental Mar& Biology 'and Ecology, 29,
Conway H. L., P. J. Harrison and C. O. Davis (1976) Marine diatoms grown in chemostats under silicate or ammonium limitation. II. Transient response of Skeletonema costatwn to a single addition of the limiting nutrient. Marine Biology, 35, 167-199.
Coste B., A. F. G. Fiúza and H. J. Minas (1986) Conditions hydroIogiques et chimiques associées i I'upwelling &tier du Portugal en fin d'été. Oceano1ogica Acta, 9, 149-158.
ifi Sciences, 52, 305-313.
199-230.
24 G. Slawyk et al.
Denman K. L. and A. E. Gargett (1983) Time and space scales of vertical mixing and advection of phytoplankton in the upper ocean. Limnology and Oceanography, 28, 801-815.
Dickson M.-L. and P. A. Wheeler (1995) Nitrate uptake rates in a coastal upwelling regime: a comparison of PN- specific, absolute, and Chl a-specific rates. Limnology and Oceanography, 40, 533-543.
Dortch Q. and J. R. Postel (1989) Biochemical indicators of N utilization by phytoplankton during upwelling off the Washington coast. Limnology and Oceanography, 34, 758-773.
Dugdale R. C. (1977) Nutrient modeling. In: The sea, E. D. Goldberg, I. N. McCave, J. J. O'Brien and J. H. Steele, editors, Wiley-Interscience, New York, pp. 789-806.
Dugdale R. C. and J. J. Goering (1967) Uptake of new and regenerated forms of nitrogen in primary productivity. Limnology and Oceanography, 12, 196-206.
Dugdale R. C. and F. P. Wilkerson (1986) The use of "N to measure nitrogen uptake in eutrophic oceans; experimental considerations. Limnology and Oceanography, 31, 673-680.
Dugdale R. C. and F. P. Wilkerson (1992) Nutrient limitation of new production in the sea. In: Primary productivity and biogeochemical cycles in the sea, P. G. Falkowski and A. D. Woodhead, editors, Plenum Press, New York, pp. 107-122.
Eppley R. W. and B. J. Peterson (1979) Particulate organic matter and planktonic new production in the deep Ocean. Nature, 282, 677-680.
Eppley R. W., J. L. Coatsworth and L. Solorzano (1969) Studies of nitrate reductase in marine phytoplankton. Limnology and Oceanography, 14, 194-205.
Estrada M. (1995) Dinoflagellate assemblages in the Iberian upwelling area. In: Harmfulmarine algal blooms, P. Lassus, G. A d , E. Erard, P. Gectien and C. Marcaillou, editors, Technique et Documentation, Lavoisier, Intercept Ltd, Pans, pp, 157-162.
Fiha A. F. G. (1983) Upwelling patterns off Portugal. In: Coastal upwelling, E. Suess and J. Thiede, editors, Plenum, New York, pp. 85-98.
FiÚza A. F. G., M. E. Macedo and M. R. Guemiro (1982) Climatological space and time variation of the Portuguese coastal upwelling. Oceanologica Acta, 5, 31-40.
Garside C. (1982) A chemiluminescent technique for the determination of nanomolar concentrations of nitrate, nitrate and nitrite, or nitrite alone in seawater. Marine Chemktry, 11, 159-167.
Gentilhomme V. (1992) Quantification des flux d'absorption et de régénération de l'azote minéral (nitrate, nitrite et ammonium) et organique (urée) dans la couche euphotique des océans oligotrophes. Thèse de Doctorat, Université Aix-Marseille II, 141 pp.
Glibert P. M. and J. C. Goldman (1981) Rapid ammonium uptake by marine phytoplankton. Marine Biology Letters, 2, 25-3 I .
Glibert P. M. and J. J. McCarttry (1984) Uptake and assimilation of ammonium and nitrate by phytoplankton: indices of nutritional status for natural assemblages. Journal of Plankton Research, 6,677-697.
Glibert P. M., F. Lipschultz, J. J. McCarthy and M. A. Altabet (1982) Isotope dilution models of uptake and remineralization of ammonium by marine plankton. Limnology and Oceanography, 27,639-650.
Goering J. J., D. D. Wallen and R. M. Nauman (1970) Nitrogen uptake by phytoplankton in the discontinuity layer of the eastern subtropical Pacific Ocean. Limnology and Oceanography, 15,789-796.
Hanison W. G. (1990) Nitrogen utilization in chlorophyll and primary productivity maximum layers: an analysis based on the f-ratio. Marine Ecology Progress Series, 60,85-90.
Hamson W. G., T. Platt and M. R. Lewis (1987) f-Ratio and its relationship to ambient nitrate concentration in coastal waters. Journal of Plankton Research, 9.235-248.
Healy F. P. (1980) Slope of the Monod equation as an indicator of advantage in nutrient competition. Microbial
Kanda J., E. A. Laws, T. Saino and A. Hattori (1987) An evaluation of isotope dilution effect from conventional data sets of "N uptake experiments. Journal of Plankton Research, 9,79-90.
King F. D. and A. H. Devol (1979) Estimates of vertical eddy diffusion through the thermocline from phytoplankton nitrate uptake rates in the mixed layer of the eastern tropical Pacific. Limnology and Oceanography, 24, 64165 1.
Nein P. and B. Coste (1984) Effects of wind-stress variability on nutrient transport into the mixed layer. Deep- Sea Research, 31, 21-37.
Koroleff F. (1970) Direct determination of ammonia in natural waters as indophenol blue. International Council for the Exploration of the Sea (ICES), revised version of ICES paper C.M. 1969/C:9, Interlaboratory Report 3, pp. 19-22.
m
ir
e
v
E C O ~ O ~ Y , 5,281-286.
Isotopic and enzymatic analyses of planktonic nitrogen utilisation 25
Lande R., W. K. W. Li, E. P. W. Horne and A. M. Wood (1989) Phytoplankton growth rates estimated from
Le Bouteiller A. (1986) Environmental control of nitrate and ammonium uptake by phytoplankton in the
Lewis M. R., E. P. W. Home, J. J. Cullen, N. S. Oakey and T. Platt (1984) Turbulent motions may control
MacIsaac J. J. and R. C. Dugdale (1972) Interactions of light and inorganic nitrogen in controlling nitrogen
I depth profiles of cell concentration and turbulent diffusion. Deep-sea Research, 36, 1141-1 159.
equatorial Atlantic Ocean. Marine Ecology Progress Series, 30, 167-179.
phytoplankton photosynthesis in the upper ocean. Nature, 311,49-50.
uptake in the sea. Deep-sea Research, 19, 209-232.
Campagne RCA-I (28 août-I9 septembre 1981). Publ. CNEXO, Série Rkultats des campagnes la mer, 25,
Oakey N. S. (1982) Determination of the rate of dissipation of turbulent energy from simultaneous temperature and velocity shear microstructure measurements. Journal of Physical Oceanography, 12,256-271.
rlr: Packard T. T., T. M. Moore and D. A. Harmon (1972) Biochemical assays. In: Phytoplankton growth dynamics, S. P. Pavlou, editor, Technical Series 1, Chemostat methodology and chemical analysis. Department of Oceanography, University of Washington, Seattle, Special Report 52, pp. 119-130.
Probyn T. A. (1985) Nitrogen uptake by size-fractionated phytoplankton populations in the southem Benguela upwelling system. Marine Ecology Progress series, 22, 249-258.
upwelled waters: Implications for pelagic food webs. Limnology and Oceanography, 35,202-210. Raimbault P., G. Slawyk, B. Coste and J. Fry (1990) Feasibility of using an automated colorimetric procedure for
the determination of seawater nitrate in the O to 100 nM range: examples from field and culture. Marine Biology, 104,347-351.
Slawyk G. (1980) L'absorption de composb azotés par le phytoplancton marin: rôle dans la production primaire, relations avec la photosynthèse et les variables du milieu extra- et intracellulaire. Thèse Doctorat i s Sciences, Université d'Aix-Marseille II, Marseille, 213 pp.
Slawyk G. and J. J. MacIsaac (1972) Comparison of two automated ammonium methods in a region of coastal upwelling. Deep-sea Research, 19, 521-524.
Slawyk G. and M. Rodier (1986) Glutamine synthetase activity in Chaeroceros uf$nnis (Bacillariophyceae): comparison with other estimates of nitrogen utilization during nutrient perturbation. Journal ofPhycology, 22,210-275.
Slawyk G. and M. Rodier (1988) Biosynthetically active glutamine synthetase in the marine diatom Phaeodaciylum Iricornufum: optimization of the forward- rdon assay. Marine Biology, 97,269-274.
SIawyk G., J. J. MacIsaac and R. C. Dugdale (1976) Inorganic nitrogen uptake by marine phytoplankton under in situ and simulated in situ incubation conditions: Results from the northwest African upwelling region. Limnology and Oceanography, 21, 149-152.
Slawyk G., S. L'Helguen, Y. Collosand H. Freije (1988) Quantitative determination of particulate organic N and C in marine phytoplankton samples using mass-spectrometer signals from isotope ratio analysis in "N and I3C tracer studies. Journal of Experimental Marine Biology and Ecology, 115, 187-195.
Sousa F. M. and A. Bricaud (1992) Satellitederived phytoplankton pigment structures in the Portuguese upwelling area. Journal of Geophysical Research, 97C, 11,343-11,356.
Treguer P. and P. Le Corre (1975) Manuel d'analyse des sels nutritifs dans l'eau de mer. Utilisation de I'AutoAnalyzer 2 Technicon, 2nd edn, Universitk. de Bretagne occidentale, Brest, France, 110 pp.
œ Wilkinson G. N. (1961) Statistical estimations in enzyme kinetics. Biochemical Journal, 80, 324-332. Wooster S. W., A. Bakun and D. R. McLain (1976) The seasonal upwelling cycle along the eastern boundary of
-the North Atlantic. Journal of Marine Research, 34, 131-141. Zehr J. P., P. G. Falkowski, J. Fowler and D. G. Capone (1988) Coupling between ammonium uptake and
incorporation in a marine diatom: Experiments with the short-lived radioisotope I3N. Limnology and Oceanography, 33, 51 8-524.
' 1
I Minas M. (1983) Production primaire planctonique. In: Remontées d'eaux sur les côtes atlantiques du Portugal.
* pp. 69-74. 1
1
I
I Probyn T. A., H. N. Waldron and A. G. James (1990) Size-fractionated measurements of nitrogen uptake in aged
*
I
i