Is Time Money? Media Expenditures in Economic and Technological Turbulence
18
Is Time Money? Media Expenditures in Economic and Technological Turbulence Daniel G. McDonald and Benjamin K. Johnson Recent years have seen changing and shifting technologies as well as an uncertain economic climate. This research focuses on how audiences have reacted to these shifts, using a number of different sources of data to test hypotheses related to spending time and money on media. We suggest that previous studies examining audience expenditures and diffusion of new tech- nologies may have overlooked the stressful economic conditions surrounding diffusion of some of those technologies. We find an increase in entertainment technology purchases as well as time spent with new and traditional media during recession years, beyond that indicated by the longer term trends. While there is a general decrease in coviewing behavior in recent years, the recession years reversed the trend. Results are discussed in terms of the constancy hypothesis and our hypothesis that the media provide outlets for reducing stress during difficult economic times. The most costly outlay is time. Antiphon (c. 430 B.C.) As quoted in Flexner and Flexner (1993) When it comes to media audiences, time and money are inextricably connected. From the earliest academic studies of how much individuals’ time and money are spent with the media (Edwards, 1915; Gulick, 1909), to a ratings industry set up to determine how much aggregate audience time is being purchased for advertisers’ money (Beville, 1988), the connection between time and money has been described, studied, and documented from psychological, sociological, and economic perspectives (Albarran & Arrese, 2003). This article focuses on time and money spent during a period of economic and technological turbulence. We first provide an overview of what is known about Daniel G. McDonald (Ph.D., University of Wisconsin) is a professor in the School of Communication at The Ohio State University. His research interests are primarily in the area of mediated communication. Benjamin K. Johnson (M.A., Michigan State University) is a doctoral student in Communication at The Ohio State University. His research interests include selective exposure and computer-mediated communication. The authors would like to thank Aaron Ibrahim for his thoughts on the early draft of the article. © 2013 Broadcast Education Association Journal of Broadcasting & Electronic Media 57(3), 2013, pp. 282–299 DOI: 10.1080/08838151.2013.816705 ISSN: 0883-8151 print/1550-6878 online 282
Transcript of Is Time Money? Media Expenditures in Economic and Technological Turbulence
Is Time Money? Media Expenditures inEconomic and Technological Turbulence
Daniel G. McDonald and Benjamin K. Johnson
Recent years have seen changing and shifting technologies as well as an
uncertain economic climate. This research focuses on how audiences have
reacted to these shifts, using a number of different sources of data to test
hypotheses related to spending time and money on media. We suggest that
previous studies examining audience expenditures and diffusion of new tech-
nologies may have overlooked the stressful economic conditions surrounding
diffusion of some of those technologies. We find an increase in entertainment
technology purchases as well as time spent with new and traditional media
during recession years, beyond that indicated by the longer term trends. While
there is a general decrease in coviewing behavior in recent years, the recession
years reversed the trend. Results are discussed in terms of the constancy
hypothesis and our hypothesis that the media provide outlets for reducing
stress during difficult economic times.
The most costly outlay is time.
Antiphon (c. 430 B.C.)
As quoted in Flexner and Flexner (1993)
When it comes to media audiences, time and money are inextricably connected.
From the earliest academic studies of how much individuals’ time and money
are spent with the media (Edwards, 1915; Gulick, 1909), to a ratings industry
set up to determine how much aggregate audience time is being purchased for
advertisers’ money (Beville, 1988), the connection between time and money has
been described, studied, and documented from psychological, sociological, and
economic perspectives (Albarran & Arrese, 2003).
This article focuses on time and money spent during a period of economic and
technological turbulence. We first provide an overview of what is known about
Daniel G. McDonald (Ph.D., University of Wisconsin) is a professor in the School of Communication atThe Ohio State University. His research interests are primarily in the area of mediated communication.
Benjamin K. Johnson (M.A., Michigan State University) is a doctoral student in Communication at The OhioState University. His research interests include selective exposure and computer-mediated communication.
The authors would like to thank Aaron Ibrahim for his thoughts on the early draft of the article.
© 2013 Broadcast Education Association Journal of Broadcasting & Electronic Media 57(3), 2013, pp. 282–299DOI: 10.1080/08838151.2013.816705 ISSN: 0883-8151 print/1550-6878 online
282
McDonald and Johnson/TIME, MONEY, AND TURBULENCE 283
spending money and time on new technologies, and the known links between
the two. We then suggest that economic pressures coincident with diffusion of the
major communication technologies may be responsible for some deviations from
the constancy hypothesis. We then test these ideas with data collected by the U.S.
government’s Bureau of Labor Statistics from 2003 to 2010, and discuss the results
of those analyses in terms of our hypotheses.
Spending Time
Audience time has been of key interest in the field of mass communication since
its earliest days. The standard measures in media effects research, since before the
advent of network radio (Edwards, 1915), through the television era (Bechtel, Ache-
pohl, & Akers, 1972), and continuing with research on the Internet (Valkenburg,
2007) have focused on how much time is spent with a medium, typically either on a
daily or weekly basis (Flanagin, 2005; Jordan, Trentacoste, Henderson, Manganello,
& Fishbein, 2007; Skouteris & McHardy, 2009). While some researchers have gone
to great pains to separate attention from time spent (Chaffee & Schleuder, 1986),
many researchers have used time as a surrogate measure of attention. The use of
time as an indicator of audience attention, though, is complicated by at least two
factors: time-constraint and multitasking.
Time-Constraint
Certain audience experiences are time-constrained while others are constrained
more by processing requirements. Those that are time-constrained require audience
members to devote a specified amount of time to enjoy the entire experience.
Motion pictures and television shows are typically this way. Although the advent
of VCRs, DVDs, and DVRs has given the audience members some control over the
experience, the required time spent while viewing remains relatively close to what
it was 50 years ago. An audience member will need to spend a minimum amount
of time if s/he is going to watch an entire production.
In spite of the technological changes of the past few decades, then, little of the
‘‘in-program’’ time requirement has changed for these media; indeed, despite the
capability for eliminating some of the time requirement, most viewing of television
continues to be real-time viewing, even in homes with a DVR (Nielsen, 2010a).
What has changed, though, is that the technologies currently associated with these
media have decreased waiting time—the time spent waiting for a program or motion
picture to start.
The VCR’s time-shifting function (Krugman & Johnson, 1991) was inherited and
made simpler by the DVR (Nielsen, 2010a). DVDs by mail or streaming over the
Internet allow audience members to avoid theatres or even rental stores altogether
(Hilderbrand, 2010). New technologies have allowed a lag time to replace waiting

284 Journal of Broadcasting & Electronic Media/September 2013
time. We don’t yet know what audience members are doing with the time that has
been ‘‘saved’’ in this way—TV time may simply be spent with other programs or
movies, or could be used in some other, non-media way. Nielsen (2010a) reports
that programs played back on the same day are typically played back in ‘‘real-
time’’ (without fast-forwarding through commercials), and so do not reduce time
spent with a particular program, while many of those played back a few days later
are viewed with fast-forwarding, reducing each media hour to about 47 minutes.
Time spent with print media has been declining for a number of decades, but
involves not only technology alternatives (e.g., online news) but also generational
and cohort change (De Waal, Schonbach, & Lauf, 2005; Kirchhoff, 2011). Because
the print media have always been seen as portable, time spent with them, among
those who continue to read printed material, may have been less impacted by
technological changes. Books, magazines, and newspapers have been affected by
new technologies, through e-readers or Internet versions of publications, but the
new technologies are likely having a different effect on time spent than is the case
with movies or television. Rather than a magazine or book on an airline flight, for
example, we may take an e-reader loaded with 1,000 books. Odds are, we won’t
read all of those books on the flight, because our own processing (reading) speed
remains the same.
Media Multi-tasking
Multi-tasking in general, and media multi-tasking (also referred to as simultaneous
media use) in particular, has been a part of the media experience for many years
(McDonald & Meng, 2009) but has only recently gotten much research attention
(Janusik & Wolvin, 2009; Jeong, Hwang, & Fishbein, 2010; Nielsen, 2010a). While
time spent typically has been seen as an indicator of attention, the very idea of
multitasking makes it clear that attention is not equivalent to time.
In earlier decades, multi-tasking might occur when people would listen to music
while reading a book. Today, an audience member may be purchasing music online
while watching TV, may be using picture-in-picture technology to watch two TV
programs at the same time, may have several Web sites open and be moving
between them, or may be talking on the phone while doing any of a number of other
activities. Traditional TV programs are now encouraging audience involvement in
a series by providing hashtags and other Internet resources for audience members,
telephone numbers for text or call-in votes, and other activities. While such devices
would maintain a consistent amount of time spent viewing, they likely encourage
program engagement or fan behavior, while taking attention away from the program
being viewed, and underscore not only that time and attention are not equivalent,
but also that attention and engagement are separate components of the audience
experience.
Initial research on the Internet and time use (DiMaggio, Hargittai, Neuman, &
Robinson, 2001; Robinson, Kestnbaum, Neustadtl, & Alvarez, 2000) found that

McDonald and Johnson/TIME, MONEY, AND TURBULENCE 285
Internet use did not necessarily displace other activities (De Waal et al., 2005).
However, time use data examined over a period of 3 years (1996–1999) indicated
that the Internet was pulling small amounts of time away from television viewing
(McDonald & Dimmick, 2003). Others noted that using the Internet supplements
other activities and serves as a time-saving technology (Robinson et al., 2000).
Mobile media and technologies like the DVR also presumably complement, as
much as displace, other media use. This may result in no net increase in media use,
or an increase in television and other traditional media use due to the enhancing
and time-saving function of newer technology. However, it does not necessarily
follow that spending money on media will remain a constant. New technologies do
require new money.
Spending Money
In the United States, most media are commercial media, so money is necessarily
involved in the audience experience. Audience members either pay directly for
access to the media content (e.g., movies, books, magazines) or pay indirectly (in
the case of sponsored media), providing their time as they watch commercials.
Additionally, and important in the diffusion of new communication technology,
they must pay for the technology to receive the content (e.g., DVR, DVD player,
smart phone).
Sponsored media have received the bulk of the academic research related to
audience spending on mass media. The best known of these is the constancy hypoth-
esis popularized by McCombs and colleagues (McCombs, 1972; Son & McCombs,
1993) and first described by publisher Charles Scripps (see McCombs, 1972). The
constancy hypothesis is that the level of spending on mass media is determined by
the general state of the economy, and that any change in the economy will cause a
parallel change in spending on mass media. An assumption in this research, called
the constancy assumption, is that spending on mass communication will remain at
the same percentage of the gross domestic product over time. Additionally, there
is the assumption of functional equivalence, which suggests that if spending on
one medium goes up (as a percentage of GDP), then spending on another medium
(typically one that serves a similar function) must go down to offset the change
(McCombs, 1972, pg. 10). A number of studies have focused on the constancy
assumption and typically, although not always, found support.
A natural question arises as to how the constancy hypothesis functions during
a period of introduction of new technologies. The assumption of functional equiv-
alence implies that money would need to be diverted from other technologies to
allow for purchase of (or access to) the new technologies. McComb’s original study
(1972) covered the period from 1929 to 1968, a period that included the Great
Depression and much of the diffusion of radio. In the data reported by McCombs,
the first few years of the series (1929–32) indicate a slightly higher spending level
than that seen during the rest of the series.

286 Journal of Broadcasting & Electronic Media/September 2013
Similarly, Fullerton’s (1988) study was an attempt to investigate the diffusion of
television under the umbrella of the constancy hypothesis. Fullerton found a short-
term increase in money spent during the early adoption of television, suggesting that
a period of major technological change may provide an exception to the constancy
hypothesis. Wood and O’Hare (1991) also found increasing proportions of media
expenditures from 1979 to 1988, which they attributed to the popularity of diffusing
video technologies (the VCR and various cable TV innovations). Son and McCombs
(1993) focused on the diffusion of videotext, videodisc players, and pay cable as
innovations in the 1980s and also found that there were increasing expenditures on
media in the then-most-recent decades (1970s and 1980s).
Son (1990, reported in Su, 2010) studied that same time period (the early 1980s)
and concluded that the reason for the departure from constancy was the nature of
the technologies that were diffusing. Some technological diffusions are of competing
media—providing content in direct competition with other media—while others
are complementary and add a new dimension to existing media. Son concluded
that adding a new dimension to existing media (new technologies providing a
complementary function) may result in a temporary departure from the principle
of relative constancy.
Spending Time and Money—Exploring theDeviations and Explanations
McCombs (1972) originally suggested that it is the limitation of both time and
money that results in the constancy of spending on media, but few researchers
have studied time in relation to the constancy hypothesis. Su (2010) suggests that
examining time is a logical extension of the traditional study of the constancy
hypothesis, but also suggests that a focus on both time and money would open
a ‘‘new door’’ for traditional research on the constancy hypothesis.
There are two additional wrinkles in our understanding of the relationships among
time, money, and diffusion of new technologies. The first is that most of the diffusion
eras that have been studied in relation to expenditure have been associated with
one major diffusing technology or medium, while the current environment is what
we might call technologically turbulent—multiple technologies providing similar
functions developing, becoming popular, then declining, all within a few months
or years.
The second complication is that earlier technology diffusion often coincided with
major economic setbacks. During the Great Depression (officially August 1929 to
March 1933), the historical record documents first, an increase in motion picture
attendance, followed by much faster diffusion of home radios (Dimmick & Wang,
2005). On the surface, this provides only a slight ‘‘blip’’ in the constancy hypothe-
sis—a short-term spending increase associated with diffusion of a new technology.
As noted above, this could simply be attributable to diffusion of new technology.
However, an explanation as to why people purchase the technologies and how

McDonald and Johnson/TIME, MONEY, AND TURBULENCE 287
they are used might need to turn more to social-psychological explanations. If new
technology purchases account for the short-term increase in spending money, why
would they do so during an economic recession, and how might that transfer from
spending money to spending time?
If, during difficult financial times, individuals turn their spending of both time
and money to activities that reinforce their relationships with friends and family,
we might see a similar pattern. For example, purchasing radio receivers during
the depression allowed the family to stay home and enjoy each others’ company.
Had the diffusing technology been the tape recorder, rather than the radio, would
we have seen that same increase? The operant factors in this case are not quality,
portability, or an improvement of an old technology. Radio offered audio, but no
image, while motion pictures, the older technology, offered both image and audio.
What radio did offer was a general entertainment medium for the entire family,
with a focus on choice between alternative programs more than a choice between
activities (Cantril & Allport, 1935; DeBoer, 1940; Eisenberg, 1936).
A number of early studies of television document a positive impact on the time
families spent together, rather than separately (e.g., Riley, Cantwell, & Ruttiger,
1949). Close examination also finds two recessions during early diffusion of tele-
vision—one in 1948–49, and one in 1953–54. Similarly, diffusion of pay cable,
VCRs, and video disc technologies (all related to media use by families) occurred
simultaneously with a recession from July of 1981 to November of 1982, and an
increase in expenditure during that time frame.
Recent research has suggested a number of psychological effects of economic
recessions. The impact on life at home is considerable. Researchers have described
stresses from work brought into the home, less available free time for those work-
ing, increased free time for those left unemployed, intergenerational stress, later
and lower marriage rates, higher divorce rates, marital discord, abandonment, and
mental illness (Cooper, 2011; Cvrcek, 2011; Davalos & French, 2011; Falconier &
Epstein, 2011; Tsai & Chan, 2011).
In particular, Deaton (2012) found sharp increases in worry, stress, and declines
in positive affect between fall 2008 and spring 2009, the beginning of the ‘‘great
recession.’’ Some have suggested that even observing others dealing with recession
events is stressful (Ackerman, Goldstein, Shapiro, & Bargh, 2009; Vohs & Faber,
2007). Similarly, Houdmont, Kerr, and Addley (2012) found that stress induced by
the recent recession resulted in stress, more hazard exposures, and sickness even
among those who held jobs during the recession.
Popular treatments suggest that coping behavior during a recession includes
attempts to overcome the sense of isolation and personal failure by reaching out to
family and others in the social network (e.g., Williams, undated). Ritualized media
use has long been associated with an escape function, but a small stream of research
suggests that it may be a specific strategy for coping with stress. Rosenblatt and
Cunningham’s (1976) study of TV viewing time and family tensions suggested that
TV is used as a coping mechanism in crowded home environments. Anderson and
Collins (1996) and Zillmann (1993) have also suggested that media use may serve as

288 Journal of Broadcasting & Electronic Media/September 2013
a coping mechanism for stress and stressful events. Verma and Larson (2002) find
that adolescents report lower worry and stress while watching TV. Lohaus, Ball,
Klein-Hessling, and Wild (2005) find that use of TV and other media serve a coping
function in relieving stress, and Hutchinson, Baldwin, and Oh (2006) found that
both TV and music listening were coping strategies.
This literature suggests to us that the increases in media spending observed during
diffusion of several new technologies may in part be a function of coping with
economic uncertainty; the purchase of new technologies may serve to provide a kind
of coping technology—increasing time with family and friends. In all three earlier
cases (radio, television, and VCRs), the diffusing technologies offered additional
diversions for family and friends.
The present study seeks to clarify whether the ‘‘driver’’ of these deviations from the
constancy hypothesis might be best understood as a drive for family togetherness
rather than an outlay to get the latest equipment. We focus on a combination
of aggregate and individual-level data to better understand how individual and
household factors might affect the diffusion of technology, and affect how we spend
our time and money with technology. To do so, we focus on the recent recession,
the years leading up to it (2003–2007), and one year after the recession had officially
ended (2010). The National Bureau of Economic Research (NBER, 2010) defined the
great recession as the period from December 2007 through June 2009. We thus have
a period of time in which we have innovations of competing and complementary
media technology for the entire period, with major economic changes during a
portion of that time. Using the literature associated with the constancy hypothesis
for our study frame, we suggest the following hypotheses:
During times of innovation, we have seen temporary increases in spending on
media technology. Because there are a number of new technologies diffusing prior
to and during the period examined in the present study, we should see continual
increases in spending on communication technology, but:
H1: During a recession, the percent of consumer spending allocated to commu-
nication technology will increase more quickly than in years prior to the
recession.
Multi-tasking enables a person to increase time spent with media without de-
creasing time spent with other activities. We therefore suggest that:
H2: Because many of the media diffusing during this time period offer increased
opportunities for multi-tasking, we should also see increases in overall time
spent with media.
The question arises as to how people will allocate their time among the new
and traditional media. Given that many of the new media develop as supplemental,
multi-tasking devices, we suspect that use of traditional media may actually increase

McDonald and Johnson/TIME, MONEY, AND TURBULENCE 289
because they will be part of entertainment multi-tasking while other technologies
are being used. In previous decades, people might have turned the television off or
left a room to make a phone call, but there is no need to do so if they are texting or
tweeting with friends during a television program. These new technologies should
then also afford more chances for use of traditional media.
H3: Because many of the diffusing media are often relegated to a multitasking
role, we expect that television and other traditional media use will increase
while most new media are diffusing.
Because coping strategies include reliance on social networks, such as family
members and friends, we should see an increase in the use of those networks
during the recession. Of interest for this article is whether some of that increase
results in increased coviewing activity. We suggest that we should see an increase in
coviewing media use during the most recent recession, given that alternative access
to television content (via Internet, smartphones, etc.) contributes to flexibility and
increased availability of typical family content.
H4: During the recession years (2008–2009) we should see an increase in coview-
ing activity in comparison to the non-recession years (2006–2007).
Similarly, because innovations such as DVRs, DVDs by mail, and Internet stream-
ing provide additional control over when TV and movies are viewable, we should
see decreases in time spent waiting for media content.
H5: During the entire innovation period, we should see a decrease in time spent
waiting for media content.
Method
These hypotheses were tested with data from the U.S. Department of Labor Bureau
of Labor Statistics. Aggregate household data from the Consumer Expenditure (CE)
Survey was used to test the hypothesis on money expenditures, and individual-level
data from the American Time Use Survey (ATUS) was used to test the hypotheses
on time expenditures.
Data Sources
Both the CE and ATUS surveys are conducted by the U.S. Census Bureau on
behalf of the Bureau of Labor Statistics. The CE survey uses stratified sampling to
recruit representative samples of American households for both interview and diary

290 Journal of Broadcasting & Electronic Media/September 2013
surveys. The interview sample size for 2009, for example, was 35,756 households
(representing a 75.1% response rate), and the diary sample for 2009 was 14,495
households (76.8% response rate) (BLS, 2011a). Aggregate spending data for hy-
pothesis testing were retrieved from the CE online database for the years 1984 to
2010 (BLS, 2011b).
The ATUS uses interviews to construct time diaries of the primary activities that
people expend their time on, along with data on activity location, time of day, du-
ration, and the presence of others (BLS, 2011c). The cooperation rate was over 52%
for all study years, and about 2,200 household representatives are surveyed each
month (BLS, 2011c). A total of 112,038 respondents completed diary interviews from
2003 through 2010. The study oversampled weekend days at a 2.5:1 ratio, so that
the time use analyses in the present study weigh weekend days with a .4 weight.
Computer-assisted telephone interviews were conducted with ATUS respondents.
Cooperation rate was approximately 52% across all the years included in the study.
Both the CE and ATUS datasets are limited by their use of self-report. Respondents
are required to recall not only their annual expenditures or their activities from
the day before, but also the extent of those expenditures or the duration of those
activities. Responses are therefore subject to a variety of self-report biases, from
faulty recall to social desirability.
Measures and Procedure
With regard to money expenditures, the CE survey provided annual household
averages for five categories of goods that cover media spending: (a) telephone
services, (b) entertainment fees and admission, (c) audio and visual equipment and
services, (d) other entertainment supplies, equipment, and services, and (e) reading.
Data from 1984 to 2010 were available for assessing the constancy of media
spending.
The ATUS provided individual-level data from 2003 to 2010 for daily time ex-
penditures. Only primary activities were recorded in the interview diary, so that
secondary activities, i.e., multitasking behaviors, were not measured. This poses an
additional limitation of the data. Activities that are frequently done as secondary
activities (e.g., using media) are underreported in the data, providing conservative
measures of time outlays. We aggregated individuals’ activities to provide aver-
age totals for 9 categories of time use (see Table 1). For the present study, tradi-
tional media time consisted of television, radio, recorded music, movie attendance,
and reading. Television included viewing television, religious television, and home
video including movies. All media is the most inclusive measure of media use,
summing traditional media, new technologies, phone use, and waiting associated
with entertainment and leisure. Each activity reported in the diary format included
information on whether others were present during the activity. These allowed for
the computation of total television coviewing and viewing alone for each person’s
diary day.

Table 1
Average American Household Annual Monetary Expenditures on Media, 2003–2010
Category 2003 2004 2005 2006 2007 2008 2009 2010
Serial Correlation
(2003–2010)
Serial Correlation
(1984–2003)
Telephone 1,138 1,139 1,174 1,174 1,166 1,138 1,185 1,178 r D .586 r D .965***
Entertainment fees
& admission
588 607 659 654 691 622 641 581 r D .036 r D �.016
Entertainment
equipment
869 906 995 978 1,036 1,046 995 954 r D .598 r D .852***
Entertainment
supplies
544 600 551 487 518 484 408 364 r D �.900** r D �.320
Reading 151 150 141 126 124 117 112 100 r D �.987*** r D �.984***
All media 3,289 3,402 3,519 3,420 3,534 3,408 3,341 3,177 r D �.325 r D .686***
All expenditures 48,572 49,904 51,978 52,270 52,120 50,991 50,048 48,109 r D �.102 r D .716***
Media share of all
expenditures
.0677 .0682 .0677 .0654 .0678 .0668 .0668 .0660 r D �.580 r D .084
Note. Spending in 2010 dollars. *p < .05, **p < .01, ***p < .001.
291
292 Journal of Broadcasting & Electronic Media/September 2013
Results
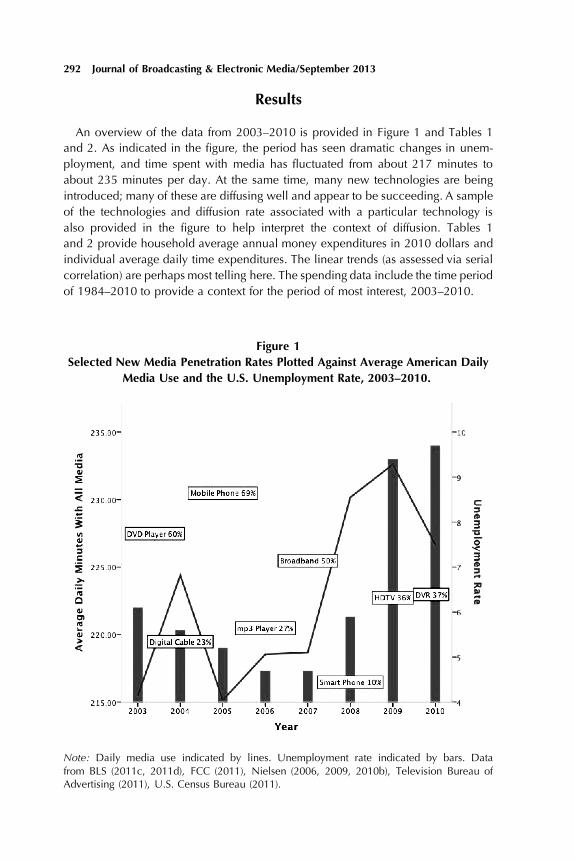
An overview of the data from 2003–2010 is provided in Figure 1 and Tables 1
and 2. As indicated in the figure, the period has seen dramatic changes in unem-
ployment, and time spent with media has fluctuated from about 217 minutes to
about 235 minutes per day. At the same time, many new technologies are being
introduced; many of these are diffusing well and appear to be succeeding. A sample
of the technologies and diffusion rate associated with a particular technology is
also provided in the figure to help interpret the context of diffusion. Tables 1
and 2 provide household average annual money expenditures in 2010 dollars and
individual average daily time expenditures. The linear trends (as assessed via serial
correlation) are perhaps most telling here. The spending data include the time period
of 1984–2010 to provide a context for the period of most interest, 2003–2010.
Figure 1
Selected New Media Penetration Rates Plotted Against Average American Daily
Media Use and the U.S. Unemployment Rate, 2003–2010.
Note: Daily media use indicated by lines. Unemployment rate indicated by bars. Datafrom BLS (2011c, 2011d), FCC (2011), Nielsen (2006, 2009, 2010b), Television Bureau ofAdvertising (2011), U.S. Census Bureau (2011).
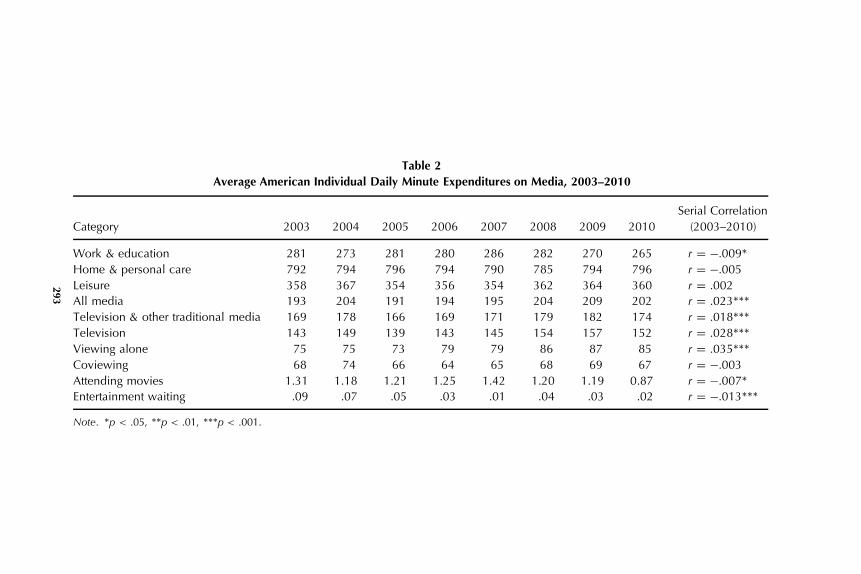
Table 2
Average American Individual Daily Minute Expenditures on Media, 2003–2010
Category 2003 2004 2005 2006 2007 2008 2009 2010
Serial Correlation
(2003–2010)
Work & education 281 273 281 280 286 282 270 265 r D �.009*
Home & personal care 792 794 796 794 790 785 794 796 r D �.005
Leisure 358 367 354 356 354 362 364 360 r D .002
All media 193 204 191 194 195 204 209 202 r D .023***
Television & other traditional media 169 178 166 169 171 179 182 174 r D .018***
Television 143 149 139 143 145 154 157 152 r D .028***
Viewing alone 75 75 73 79 79 86 87 85 r D .035***
Coviewing 68 74 66 64 65 68 69 67 r D �.003
Attending movies 1.31 1.18 1.21 1.25 1.42 1.20 1.19 0.87 r D �.007*
Entertainment waiting .09 .07 .05 .03 .01 .04 .03 .02 r D �.013***
Note. *p < .05, **p < .01, ***p < .001.
293
294 Journal of Broadcasting & Electronic Media/September 2013
As is evident in Table 1, expenditures on the telephone and entertainment equip-
ment have increased slightly in the study period 2003–2010, but not to the signifi-
cant extent found in the entire prior period since 1984. Entertainment fees have
remained constant since 1984. Entertainment supplies, however, have declined
sharply during the study period. Expenditures associated with reading appear to
remain on the same downward trend since 1984. Total expenditures on media and
total household consumer expenditures have both seen insignificant but negative
trends during the study period, but positive correlations over the entire period since
1984. However, the ratio of media to household spending has remained relatively
constant since 1984, despite a slightly negative trend during the study period.
In regard to time spent, there has been a linear increase in time spent with all
media, traditional media, and television (Table 2). Furthermore, time spent viewing
television alone has trended upward since 2003, but coviewing has remained
constant. Additionally, while waiting for entertainment represents a small amount
of time reported in the survey, it has declined significantly over the study period.
Our first hypothesis was that during a recession, the percent of disposable income
spent on communication technology will increase above that spent in years prior to
the recession. These data are available in Table 1. If we group 2008 and 2009 data
as the recession years and all others (1984–2007, 2010) as non-recession years,
a simple ANOVA indicates that there is a significant difference in entertainment
technology purchases during the recent recession years (F1,25) D 9.06, p D .006),
supporting the hypothesis.
Our second hypothesis was that we expected that overall time spent with media
would increase during the entire study period. A regression analysis indicated a
significant increase in time spent with all media is associated with year of data
collection (b D 1.026, t D 3.148, p < .001), indicating an increase of about a
minute per year. A dummy variable coded as 1 for recession years, 0 for all non-
recession years was also significant (b D 8.423, t D 4.544, p D .019), indicating
a significant increase in time spent with media during the recession years beyond
that of the general increasing trend (about 8 minutes added for each recession year).
After controlling for employment status, we found very similar results (b D 9.792,
t D 5.641, p < .001).
Our third hypothesis offers a similar suggestion, with a slightly more conservative
aspect: traditional media use (radio, television, motion pictures, reading) time will
increase as well, because traditional media offer opportunities for multitasking, and
the technologies have developed to make it easier. This hypothesis is also tested
via a regression equation. In this case, the results are very similar, with time spent
with traditional media increasing slightly over half a minute per year (b D .532, t D
1.734, p D .043), and increasing more dramatically during the recession years (b D
8.444, t D 4.8420, p < .001). A regression equation was formulated to control for
employment status, and results were very similar (b D 9.663. t D 5.886, p < .001).
With H4, we expected an increase in coviewing activity during the recession in
comparison to the non-recession years. In this case, there’s a decrease in coviewing
during the study period overall (b D �.408, t D �1.983, p2-tailed D .047), but
McDonald and Johnson/TIME, MONEY, AND TURBULENCE 295
a significant increase during the recession (b D 2.856, t D 2.441, p D .015),
supporting the hypothesis. The effect held even after controlling for employment
status (b D 3.049, t D 2.616, p D .004).
Hypothesis 5 suggested that the new technologies should result in a decrease
in time spent waiting for media during the entire study period. Examination of the
data indicated that only small percentages of respondents provided wait time as a
primary activity, and so wait time is likely under-reported in the sample. Of those
reporting wait time, about half also reported attending movies, a percentage much
higher than the general population. As a caution, we therefore selected those who
reported motion picture attendance and compared them to those who reported no
motion picture attendance. Results indicated that, among motion picture attendees,
waiting time decreased slightly as a linear trend during each year of the study
(b D �1.809, t1-tailed D �3.336, p D .001), consistent with H5. When we add
the code for recession years into the equation, there is an increase in time spent
waiting during the recession (b D 4.044, t D 3.318, p D .001). These findings
support the notion that, in general, among those who go to movies, waiting time
has decreased in recent years, while the recession saw an increase in time spent
waiting. Among those who did not report attending movies during this time frame,
waiting time was limited to only a small number of people, and results were only
marginally significant for the study period in general (b D �.006, t1-tailedD �1.880,
p D .030). Results show a similar pattern in regard to the recession years, but were
not significant. We therefore find evidence for H5.
Discussion
The constancy hypothesis is about individual-level behavior and macro-level
effects. Typically, tests of the constancy hypothesis have focused on macro-level
behavior and macro-level data. In the present study, we developed our analyses
from a mix of individual and macro level data. Having access to the individual data
enables us to develop some different measures than have been used previously, but
our results are still subject in some ways to the potential pitfalls of an ecological
fallacy. Still, as Kramer (1983) noted, even if aggregate results do not stand up at
the individual level, they can serve an important function in directing scientific
attention toward explaining the macro phenomenon.
In the current economic climate, it’s difficult to know exactly what is a product
of a short-term change, and what is a long-term trend. At the same time, the present
state provides some unique opportunities to test some micro-level processes that
have macro implications. Two, five, or even 10 minutes per day may not sound
like a major impact on the face of it. Multiplied by millions of people, though, we
see social system impacts that have not only economic implications but also relate
to our understanding of social processes and the role of media in people’s lives.
We find considerable evidence that the economy impacts our use of media
and our spending on media. At one level, the study adds to the weight of the

296 Journal of Broadcasting & Electronic Media/September 2013
constancy hypothesis, which stated that any change in the economy will cause a
parallel change in spending on mass media. It adds to the constancy hypothesis by
beginning to disentangle what we might mean by ‘‘a parallel change.’’ Clearly, we
see increases in entertainment technology purchases during recession years, similar
to what has been observed before, but these data enable us to test pre-recession
years against recession years, which has not really been possible before. We are
also able to see that entertainment fees and admissions were constant, entertainment
supplies decreased, and overall media expenditures declined during the recession.
This suggests to us that the ‘‘bump’’ observed in previous studies is associated
with purchase of new technologies, but that all household expenditures have to be
modified to pay for that bump. If that is so, then we need to ask about the value of
the entertainment technologies that are being purchased, and so turn to use of time.
Time spent on media, broadly defined, increased over the study period, and
increased even more during the recession. When we focused on the pre-recession
and recession years, we see increases in time spent with television, both alone and
in coviewing, but the increase in viewing alone is somewhat larger (5.162 minutes
more of viewing alone in the recession years, 3.049 minutes of coviewing, con-
trolling for employment status). For total TV viewing, we see an average increase
of 8.211 minutes per day during the recession, controlling for employment status
(analysis not reported above).
These data are rich sources of additional possibilities, but provide just enough
data to encourage post-hoc explanation and development of hypotheses. We would
have liked to have had better measures of waiting time. These data are not at all
conclusive, but are consistent with our hypotheses. Similarly, had we had measures
of psychological stress, we would have been able to test some of our ideas directly,
rather than in group effects, where differential patterns will likely be evident. The
data here are consistent with the ‘‘stress relief’’ hypothesis, but not conclusive. If
we had had panel data, rather than cross-sections, the ability to test for effects of
the recession, rather than correlations with economic conditions, would have been
immeasurably better. Still, a number of recent reports suggest that recessions have
impact on stress for many more people than those directly affected. Even those who
are secure in their jobs feel stress during a recession (Zivin, Paczowski, & Galea,
2011), so it is difficult to know what sort of measures would be most useful if we
did have them.
We are left with the conclusion that money spent on new technology may simply
be a cost-efficient means of relaxing and obtaining entertainment, with no relation
to the stress associated with the economy, but we don’t think that is the case.
Given these issues, we believe that the data presented here are highly suggestive
that the money is a means to a particular end—during tough economic times, it
is likely that the ‘‘end’’ is feeling better and lowering stress, and the money that
is spent on new technologies is not simply spent because the technology exists.
Logically, much of the money spent on media, especially on media technologies,
can provide a great deal of cost-efficient entertainment—much more than many
other activities. Given the extensive research on the gratifications we obtain from

McDonald and Johnson/TIME, MONEY, AND TURBULENCE 297
media, though, it’s not surprising that fulfilling basic stress reduction might be a
major driver behind technology purchases. While our data are not conclusive,
they are strongly suggestive that research on the time and money we spend on
media technologies has only scratched the surface of possible breadth and depth of
motivations.
References
Ackerman, J., Goldstein, N. J., Shapiro, J. R., & Bargh, J. A. (2009). You wear me out: The vi-carious depletion of self-control. Psychological Science, 20, 326–332. doi: 10.1111/j.1467-9280.2009.02290.x
Albarran, A. B., & Arrese, A. (2003). Time and media markets. Mahwah, NJ: Lawrence Erlbaum.Anderson, D. R., & Collins, P. A. (1996). Stressful life events and television viewing. Commu-
nication Research, 23, 243–260. doi: 10.1177/009365096023003001Bechtel, R., Achepohl, C., & Akers, R. (1972). Correlates between observed behavior and
questionnaire responses in television viewing. In E. A. Rubinstein, G. A. Comstock, & J. P.Murray (Eds.), Television and social behavior, vol. 4: Television in day-to-day life. (pp. 274–344). Washington, DC: U.S. Government Printing Office.
Beville, H. M. (1988). Audience ratings: Radio, television and cable. Hillsdale, NJ: LawrenceErlbaum.
Bureau of Labor Statistics. (2011a). BLS handbook of methods: Chapter 16, consumer expen-ditures and income. Retrieved from http://www.bls.gov/opub/hom/homch16.htm
Bureau of Labor Statistics. (2011b). Consumer expenditure survey. Retrieved from http://www.bls.gov/cex/
Bureau of Labor Statistics. (2011c). American time use survey. Retrieved from http://www.bls.gov/tus/
Bureau of Labor Statistics. (2011d). Labor force statistics from the Current Population Survey.Retrieved from http://www.bls.gov/cps/
Cantril, H., & Allport, G. W. (1935). The psychology of radio. New York, NY: Harper &Brothers.
Chaffee, S. H., & Schleuder, J. (1986). Measurement and effects of attention to media news.Human Communication Research, 13, 76–107. doi: 10.1111/j.1468-2958.1986.tb00096.x
Cooper, B. (2011). Economic recession and mental health: An overview. Neuropsychiatrie:Klinik, Diagnostik, Therapie und Rehabilitation: Organ der Gesellschaft OsterreichischerNervenarzte und Psychiater, 25, 113–117.
Cvrcek, T. (2011). U.S. marital disruptions and their economic and social correlates, 1860–1948. Journal of Family History, 36, 142–158. doi: 10.1177/0363199011398758
Davalos, M. E., & French, M. T. (2011). This recession is wearing me out! Health-relatedquality of life and economic downturns. Journal of Mental Health Policy and Economics,14, 61–72.
De Waal, E. D., Schonbach, K., & Lauf, E. (2005). Online newspapers: A substitute or comple-ment for print newspapers and other information channels? Communications: The EuropeanJournal of Communication Research, 30, 55–72. doi: 10.1515/comm.2005.30.1.55
Deaton, A. (2012). The financial crisis and the well-being of Americans. Oxford EconomicPapers, 64, 1–26. doi: 10.1093/oep/gpr051
DeBoer, J. J. (1940). The emotional responses of children to radio drama. Chicago: Universityof Chicago Libraries.
DiMaggio, P., Hargittai, E., Neuman, W. R., & Robinson, J. P. (2001). Social implications of theInternet. Annual Review of Sociology, 27, 307–336. doi: 10.1146/annurev.soc.27.1.307
Dimmick, J., & Wang, T. (2005). Toward an economic theory of media diffusion based onthe parameters of the logistic growth equation. Journal of Media Economics, 18, 233–246.doi: 10.1207/s15327736me1804_1

298 Journal of Broadcasting & Electronic Media/September 2013
Edwards, R. (1915). Popular amusements. New York, NY: Associated Press.Eisenberg, A. I. (1936). Children and radio programs. New York, NY: Columbia University
Press.Falconier, M. K., & Epstein, N. B. (2011). Couples experiencing financial strain: What we
know and what we can do. Family Relations, 60, 303–317. doi: 10.1111/j.1741-3729.2011.00650.x
Federal Communication Commission. (2011). Second international broadband data report.Retrieved from http://www.fcc.gov/reports/international-broadband-data-report-second
Flanagin, A. J. (2005). IM online: Instant messaging among college students. CommunicationResearch Reports, 22, 175–187. doi: 10.1080/00036810500206966
Flexner, S., & Flexner, D. (1993). Wise words and wives’ tales: The origins, meanings, andtime-honored wisdom of proverbs and folk sayings olde and new. New York, NY: AvonBooks.
Fullerton, H. S. (1988). Technology collides with relative constancy: The pattern of adoptionfor a new medium. Journal of Media Economics, 1(2), 75–84. doi: 10.1080/08997768809358173
Gulick, L. (1909). Popular recreation and public morality. Annals of the Academy of Politicaland Social Science, 34, 33–42. doi: 10.1177/000271620903400105
Hilderbrand, L. (2010). The art of distribution: Video on demand. Film Quarterly, 64(2), 24–28. doi: 10.1525/FQ.2010.64.2.24
Houdmont, J., Kerr, R., & Addley, K. (2012). Psychosocial factors and economic recession:The Stormont study. Occupational Medicine, 62, 98–104. doi: 10.1093/occmed/kqr216
Hutchinson, S. L., Balwin, C. K., & Oh, S. (2006). Adolescent coping: Exploring adolescents’leisure-based responses to stress. Leisure Sciences, 28, 115–131. doi: 10.1080/01490400500483984
Janusik, L. A., & Wolvin, A. D. (2009). 24 hours in a day: A listening update to the time studies.The International Journal of Listening, 23, 104–120. doi: 10.1080/10904010903014442
Jeong, S., Hwang, Y., & Fishbein, M. (2010). Effects of exposure to sexual content in the mediaon adolescent sexual behaviors: The moderating role of multitasking with media. MediaPsychology, 13, 222–242. doi: 10.1080/15213269.2010.502872
Jordan, A., Trentacoste, N., Henderson, V., Manganello, J., & Fishbein, M. (2007). Measuringthe time teens spend with media: Challenges and opportunities. Media Psychology, 9, 19–41. doi: 10.1080/15213260709336801
Kirchhoff, S. M. (2011). The U.S. newspaper industry in transition. Journal of Current Issues inMedia and Telecommunications, 2(1), 27–51.
Kramer, G. H. (1983). The ecological fallacy revisited: Aggregate- versus individual-level find-ings on economics and elections, and sociotropic voting. The American Political ScienceReview, 77, 92–111. doi: 10.2307/1956013
Krugman, D. M., & Johnson, K. F. (1991). Differences in the consumption of traditionalbroadcast and VCR movie rentals. Journal of Broadcasting & Electronic Media, 35, 213–232. doi: 10.1080/08838159109364119
Lohaus, A., Ball, J., Klein-Hessling, J., & Wild, M. (2005). Relations between media use andself-reported symptomatology in young adolescents. Anxiety Stress & Coping, 18, 333–341.doi: 10.1080/10615800500258123
McCombs, M. E. (1972). Mass media in the marketplace. Journalism Monographs, 24, 1–104.McDonald. D. G., & Dimmick, J. W. (2003). Time as a niche dimension: Competition between
the Internet and television. In A. B. Albarran & A. Arrese (Eds.), Time and media markets(pp. 29–47). Mahwah, NJ: Lawrence Erlbaum.
McDonald, D. G., & Meng, J. (2009). The multitasking of entertainment. In S. Kleinman (Ed.),The culture of efficiency (pp. 142–157). New York, NY: Peter Lang.
National Bureau of Economic Research (2010). Business cycle dating committee. Retrievedfrom http://www.nber.org/cycles/sept2010.html.
Nielsen. (2006, December 19). Nielsen study shows DVD players surpass VCRs. Retrievedfrom http://www.prnewswire.com/news-releases/nielsen-study-shows-dvd-players-surpass-vcrs-57201447.html

McDonald and Johnson/TIME, MONEY, AND TURBULENCE 299
Nielsen. (2009, September). With smartphone adoption on the rise, opportunity for mar-keters is calling. Retrieved from http://blog.nielsen.com/nielsenwire/online_mobile/with-smartphone-adoption-on-the-rise-opportunity-for-marketers-is-calling
Nielsen. (2010a, December). DVR use in the U.S. Retrieved from http://blog.nielsen.com/nielsenwire/wp-content/uploads/2010/12/DVR-State-of-the-Media-Report.pdf
Nielsen. (2010b, September). State of the media, September 2010. Retrieved from http://blog.nielsen.com/nielsenwire/wp-content/uploads/2010/09/Nielsen-State-of-TV-09232010.pdf
Riley, J. W., Cantwell, F. V., & Ruttiger, K. F. (1949). Some observations on the social effectsof television. Public Opinion Quarterly 13, 223–234. doi: 10.1086/266068
Robinson, J. P., Kestnbaum, M., Neustadtl, A., & Alvarez, A. (2000). Mass media use andsocial life among Internet users. Social Science Computer Review, 18, 490–501. doi:10.1177/089443930001800411
Rosenblatt, P. C., & Cunningham, M. R. (1976). Television watching and family tensions.Journal of Marriage and the Family, 38, 105–111. doi: 10.2307/350554
Skouteris, H., & McHardy, K. (2009). Television viewing habits and time use in Australianpreschool children. Journal of Children and Media, 3, 80–89. doi: 10.1080/17482790802577004
Son, J., & McCombs, M. E. (1993). A look at the constancy principle under changing marketconditions. Journal of Media Economics, 6(2), 23–36. doi: 10.1080/08997769309358236
Su, L. (2010). The relation between media expenditure and general economy. China MediaResearch, 6(3), 13–25.
Television Bureau of Advertising. (2011). TV basics 2011. Retrieved from http://www.tvb.org/media/file/TV_Basics.pdf
Tsai, F. J., & Chan, C. C. (2011). The impact of the 2008 financial crisis on psychologicalwork stress among financial workers and lawyers. International Archives of Occupationaland Environmental Health, 84, 445–452. doi: 10.1007/s00420-010-0609-0
U.S. Census Bureau. (2011). Statistical abstract of the United States, 2012.Valkenburg, P. (2007). Adolescents’ online communication and their well-being: Testing the
stimulation versus the displacement hypothesis. Journal of Computer-Mediated Communi-cation, 12(4). doi: 10.1111/j.1083-6101.2007.00368.x
Verma, S., & Larson, R. W. (2002). Television in Indian adolescents’ lives: A member of thefamily. Journal of Youth and Adolescence, 31, 177–183. doi: 10.1023/A:1015029118118
Vohs, K. D., & Faber, R. J. (2007). Spent resources: Self-regulatory resource availability affectsimpulse buying. Journal of Consumer Research, 33, 537–547. doi: 10.1086/510228
Williams, D. (n.d.). Psychological effects of the UK recession, 1990–94. Discussion papers onpsychology and society. Retrieved from http://www.eoslifework.co.uk/pdfs/uk90srecess.pdf
Wood, W. C., & O’Hare, S. L. (1991). Paying for the video revolution: Consumer spend-ing on the mass media. Journal of Communication, 41(1), 24–30. doi: 10.1111/j.1460-2466.1991.tb02290.x
Zillmann, D. (1993). Mental control of angry aggression. In D. M. Wegner & J. W. Pennebaker(Eds). Handbook of mental control (pp. 370–392). Englewood Cliffs, NJ: Prentice–Hall.
Zivin, K., Paczkowski, M., & Galea, S. (2011). Economic downturns and population mentalhealth: Research findings, gaps, challenges and priorities. Psychological Medicine, 41,1343–1348. doi: 10.1017/S003329171000173X