generalised head-discharge-inclination relationship for flow ...
Upload
independentCategory
view
0download
0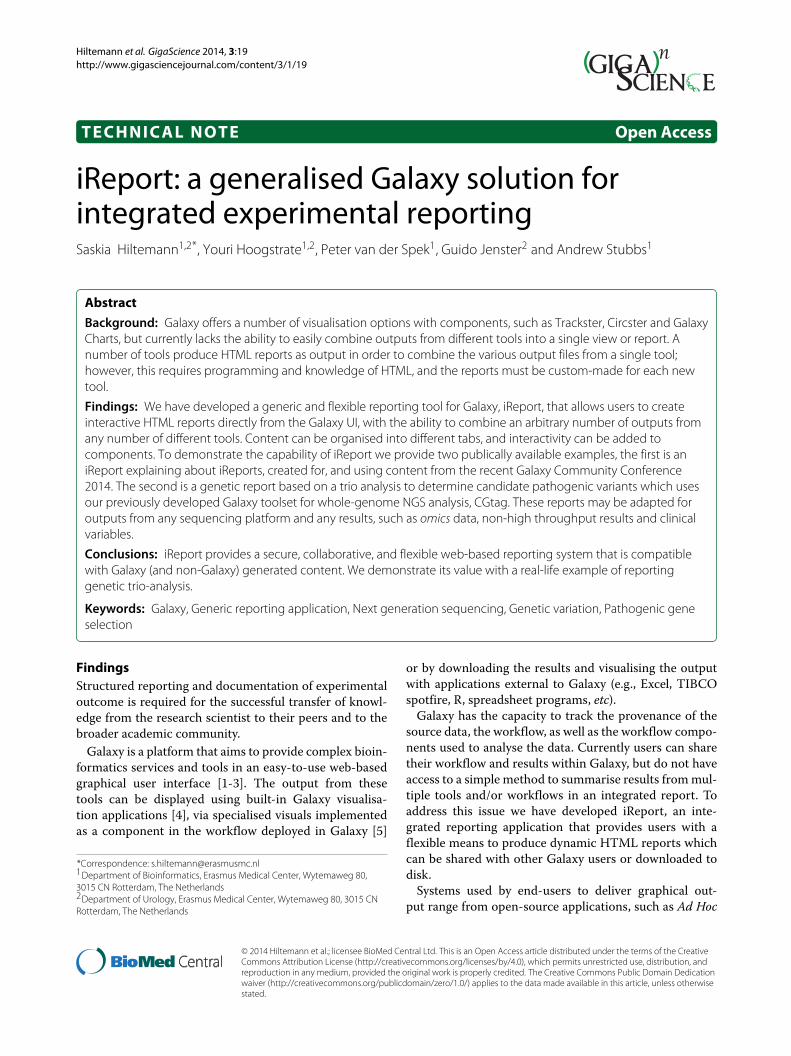
Hiltemann et al. GigaScience 2014, 3:19http://www.gigasciencejournal.com/content/3/1/19
TECHNICAL NOTE Open Access
iReport: a generalised Galaxy solution forintegrated experimental reportingSaskia Hiltemann1,2*, Youri Hoogstrate1,2, Peter van der Spek1, Guido Jenster2 and Andrew Stubbs1
Abstract
Background: Galaxy offers a number of visualisation options with components, such as Trackster, Circster and GalaxyCharts, but currently lacks the ability to easily combine outputs from different tools into a single view or report. Anumber of tools produce HTML reports as output in order to combine the various output files from a single tool;however, this requires programming and knowledge of HTML, and the reports must be custom-made for each newtool.
Findings: We have developed a generic and flexible reporting tool for Galaxy, iReport, that allows users to createinteractive HTML reports directly from the Galaxy UI, with the ability to combine an arbitrary number of outputs fromany number of different tools. Content can be organised into different tabs, and interactivity can be added tocomponents. To demonstrate the capability of iReport we provide two publically available examples, the first is aniReport explaining about iReports, created for, and using content from the recent Galaxy Community Conference2014. The second is a genetic report based on a trio analysis to determine candidate pathogenic variants which usesour previously developed Galaxy toolset for whole-genome NGS analysis, CGtag. These reports may be adapted foroutputs from any sequencing platform and any results, such as omics data, non-high throughput results and clinicalvariables.
Conclusions: iReport provides a secure, collaborative, and flexible web-based reporting system that is compatiblewith Galaxy (and non-Galaxy) generated content. We demonstrate its value with a real-life example of reportinggenetic trio-analysis.
Keywords: Galaxy, Generic reporting application, Next generation sequencing, Genetic variation, Pathogenic geneselection
FindingsStructured reporting and documentation of experimentaloutcome is required for the successful transfer of knowl-edge from the research scientist to their peers and to thebroader academic community.
Galaxy is a platform that aims to provide complex bioin-formatics services and tools in an easy-to-use web-basedgraphical user interface [1-3]. The output from thesetools can be displayed using built-in Galaxy visualisa-tion applications [4], via specialised visuals implementedas a component in the workflow deployed in Galaxy [5]
*Correspondence: [email protected] of Bioinformatics, Erasmus Medical Center, Wytemaweg 80,3015 CN Rotterdam, The Netherlands2Department of Urology, Erasmus Medical Center, Wytemaweg 80, 3015 CNRotterdam, The Netherlands
or by downloading the results and visualising the outputwith applications external to Galaxy (e.g., Excel, TIBCOspotfire, R, spreadsheet programs, etc).
Galaxy has the capacity to track the provenance of thesource data, the workflow, as well as the workflow compo-nents used to analyse the data. Currently users can sharetheir workflow and results within Galaxy, but do not haveaccess to a simple method to summarise results from mul-tiple tools and/or workflows in an integrated report. Toaddress this issue we have developed iReport, an inte-grated reporting application that provides users with aflexible means to produce dynamic HTML reports whichcan be shared with other Galaxy users or downloaded todisk.
Systems used by end-users to deliver graphical out-put range from open-source applications, such as Ad Hoc
© 2014 Hiltemann et al.; licensee BioMed Central Ltd. This is an Open Access article distributed under the terms of the CreativeCommons Attribution License (http://creativecommons.org/licenses/by/4.0), which permits unrestricted use, distribution, andreproduction in any medium, provided the original work is properly credited. The Creative Commons Public Domain Dedicationwaiver (http://creativecommons.org/publicdomain/zero/1.0/) applies to the data made available in this article, unless otherwisestated.

Hiltemann et al. GigaScience 2014, 3:19 Page 2 of 8http://www.gigasciencejournal.com/content/3/1/19
Figure 1 Example cover page. Example of a cover page with title Example Report and the default cover image. A link to download the entireiReport web page is also provided.
reports [6], Google charts (and docs) [7] and OpenOf-fice [8], to commercial applications such as MicrosoftOffice. Indeed scientific reporting applications both open-source (Bioconductor [9], Circos [10,11]) and commer-cial software (e.g., Omniviz [12], Partek [13]) include amultitude of visualisation capabilities with a focus on
data reporting and presentation of data in the contextof the experimental design and with associated meta-data. There are some applications, like TIBCO spotfire[14], which are capable of integrating results from multi-ple sources including associated text and meta-data andother applications which serve as an electronic lab note
Figure 2 iReport tool wrapper. iReport’s tool interface. Minimally a report title and at least 1 tab with 1 content item need to be specified.
Hiltemann et al. GigaScience 2014, 3:19 Page 3 of 8http://www.gigasciencejournal.com/content/3/1/19
Figure 3 Zoom effect. Images that have been scaled down can optionally be enhanced with a jQuery zoom-on-mouseover effect. In this example,the bottom image has this effect added, and when the user moves their mouse over the image, a zoomed version of that area of the image is shown.
book (e.g., IDBS [15]). Additionally there have been manyproducts developed to address the selection and reportingof variants for pathogenic variant selection including theworkflow to identify those variants (e.g., Gensight [16],Cartagenia [17], Clinical Genomicist [18]). For data gener-ated in R, dynamic reporting packages such as KnitR [19],Sweave [20] and R-Markdown [21], allow for the integra-tion of data-generating code within the report specifica-tion itself. Similar systems exist for other programminglanguages, for example Tangle [22] (JavaScript), ActiveMarkdown [23] (CoffeeScript) or IPython Notebooks [24](Python). These are very versatile tools, but require pro-gramming knowledge to use effectively. iReport offersan open-source application for both Galaxy and non-Galaxy produced results allowing for the generation ofcustomized integrated reports for any type of project orworkflow. The advantage to Galaxy users is that the outputfrom any application can be included into any report, andthat a report template can be reused for other projects.Also, the report may be securely shared with one or manyusers of that Galaxy instance or made publicly available.iReports can be completely configured from the tool webinterface, and requires no programming or knowledge ofthe underlying system.
We demonstrate iReport’s utility through an exam-ple where a genetic report is generated from outputsof an existing Galaxy next-generation sequencing (NGS)toolkit, CGtag [5]. iReport can also be used as an elec-tronic lab notebook by creating an iReport which linksout to various other iReports containing different analysisreports from various samples. It can be also be coupled tooutput from other Galaxy instances, for example outputgenerated by specialized Galaxy instances such as Confero[25], ORIONE [26], and Galaxy-P [27].
FunctionalityiReport dynamically generates HTML, and employsJavaScript and jQuery to create interactive compo-nents, such as searchable, sortable, paginated tables andzoomable images. iReport is ideally suited to use as thefinal step in a workflow; the pipeline developer config-ures the report once and end-users are then presentedwith a templated report each time users run the work-flow, while only needing to provide the input files for thepipeline [28]. iReport can also be used directly by end-users as a means of easily sharing their results with otherGalaxy users, or the public via Galaxy’s native sharingcapabilities.

Hiltemann et al. GigaScience 2014, 3:19 Page 4 of 8http://www.gigasciencejournal.com/content/3/1/19
Figure 4 Weblinks from table columns. A series of web links can be created within a table by specifying a prefix and suffix to be placed beforeand after each column entry.
The generic reporting functionality and usage of iRe-port is outlined below using an example iReport cre-ated for the recent Galaxy Community Conference,which is also available for viewing online [29]. It isfollowed by an example of a genetic report that canbe used for trio analysis, which can easily be modi-fied for any trio reporting or extended to quartets orlarger families, also available from our demo galaxy[30].
iReport structureiReport produced a report webpage consisting of one ormore subpages with one or multiple elements included oneach subpage. The primary output of iReport is:
1. A cover page
(a) Title of the report(b) Cover image
2. Main report page consisting of a set of tabs. Each tabconsisting of one or more content items. Eachcontent item can be one of the following types:
(a) Text(b) Images(c) Tables(d) PDF Files(e) Links
An iReport tutorial has been developed to demonstrateand explain the functionality of iReport, and is availableas a shared history from the CTMM-TraIT public Galaxyinstance [29]. The following sections describe each of thecomponents of iReport in more detail.
Cover pageThe cover page consists of a user-specified title anda cover image. The cover image parameter is optionaland when the field is left blank a default image is used

Hiltemann et al. GigaScience 2014, 3:19 Page 5 of 8http://www.gigasciencejournal.com/content/3/1/19
Figure 5 Embedded PDF files. iReports can also display PDF files. For browsers without PDF plug-in, a download link to the file will be createdinstead.
(Figure 1). By clicking on the image, or the link above it,the user can access the main report page. There is alsoa link to download the entire iReport webpage, includingall dependency files, for storing or viewing on differentsystems.
Main report pageAn arbitrary number of tabs may be added via a repeatparameter. Each tab can be labelled with a name speci-fied by the user. An arbitrary number of content items maythen be added to each tab in a repeat parameter. A typemust be specified for each content item (e.g., text, image,table etc.), as well as several other parameters dependingon the type chosen (Figure 2). Layout is mostly left up tothe browser, but users can explicitly add a line-break aftereach item to force items to appear underneath each other.
Content item: text field Text can be entered in a textfield in the tool interface, for example to create anintroduction paragraph and to give a description of theitems on the page. Text is printed verbatim, althougha small number of HTML tags are allowed in order togive the user some control over formatting (e.g., b,i,em, strong, h1-h6 tags). Text files can also be spec-ified, and the contents of the file will be printed to thescreen verbatim.
Content item: images Many tools produce images asoutput, which can also be displayed by iReport. Users
specify the image file from their Galaxy history, and thedesired image size. For images that have been scaleddown, an optional jQuery zoom-on-mouseover effect maybe added (Figure 3) [31]. Currently supported image for-mats are JPG, PNG and SVG.
Content item: tables iReport can also display tables. Theinput must be a tab-delimited file from the users’ Galaxyhistory, and the first nonempty line not starting with ahash symbol (#) is assumed to contain the column head-ers. The jQuery library DataTables [32] is used to createtables which can be searchable, sortable and paginated,if requested by the user. There is an option to createhyperlinks within the columns of a table by providing acolumn number, a URL prefix and a URL suffix. Thisis illustrated in Figure 4, where the first column con-tains gene names and by including the GeneCards [33,34]URL prefix “http://www.genecards.org/cgi-bin/carddisp.pl?gene=”. This generates a hyperlink to the correspond-ing GeneCards entry for every item in the column in thetable.
Content item: PDF files This is one of the simplestcontent items. The user provides a PDF file from theGalaxy history, which will be embedded in the page. If thebrowser does not have the necessary plug-ins installed,a download link for the file will be generated instead(Figure 5).

Hiltemann et al. GigaScience 2014, 3:19 Page 6 of 8http://www.gigasciencejournal.com/content/3/1/19
Figure 6 Links to all files in an archive. Given an archive of files, iReport can create a series of links to all files contained in the archive. Link textsare the filenames (without file extension).
Content item: links Users can create links to web loca-tions by specifying a URL and a link text. Links to datasetsin the history can also be created here by specifying adataset and a link text. Several tools create archives offiles as output (for example a zip file containing the plotsfor each chromosome). Links to all files contained in anarchive can also be created, and will be named with the filenames (excluding file extension). Currently the supportedarchive formats are zip, bz2, tar, gz and tar.gz. An examplecan be seen in Figure 6, where an archive with images wasused as input and a series of links to each contained filewas created. An option to create a link to an iReport is alsopresent. This allows users to create a kind of electronic labnotebook, by creating an overview of all their samples andlinking to one or more iReports for each sample.
Genetic report for a trio of HapMap individualsAccurate, reproducible and traceable reporting is anessentialrequirement to the evaluation of the genetic out-come from any assay [35], including those variations pre-dicted from NGS analysis. Since iReport is capable ofincluding many formats, we have used the outcome from
a trio analysis generated from the Complete Genomics[36] NGS platform to demonstrate its utility in represent-ing these data in a user-defined format, which containsthe provenance of the underlying analysis. In this examplewe use a trio of individuals sequenced in the InternationalHapMap Project [37,38], to demonstrate how to selectprotein affecting candidate variants based on a recessivegenetic model. All data in this example is freely avail-able for download from the Complete Genomics website[39].
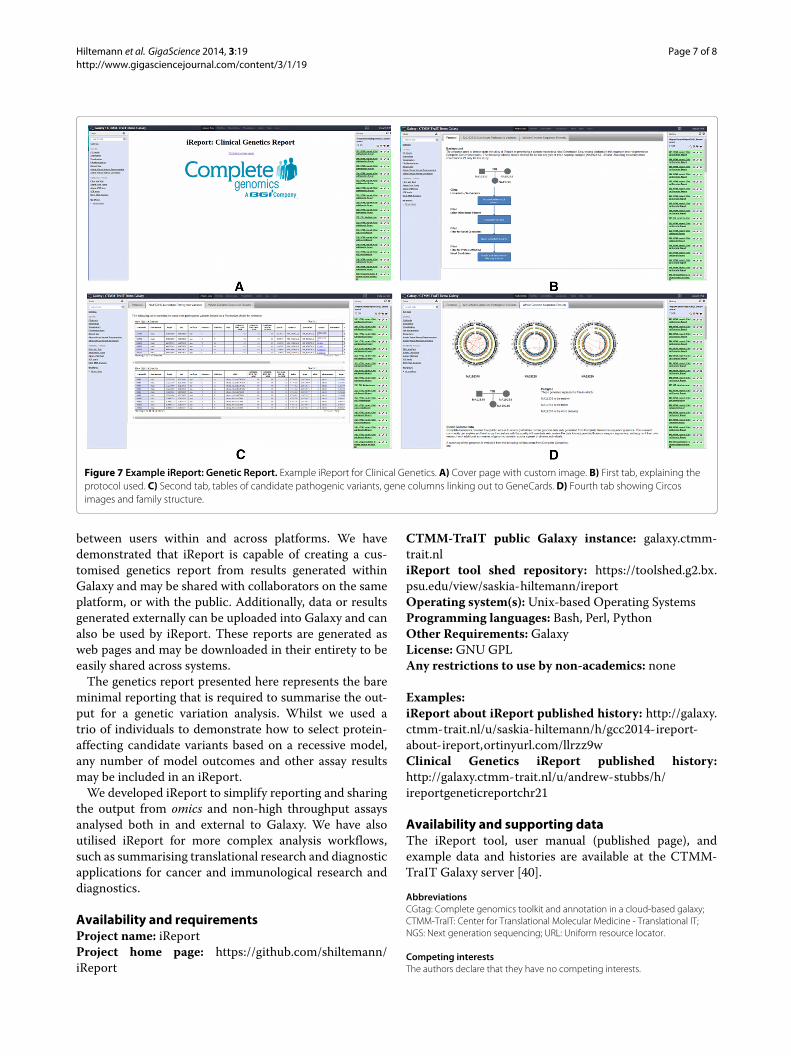
This example iReport has one tab devoted to explainingthe protocol used (Figure 7B), one tab with circos plotsand an explanation of the family structure (Figure 7D), andone tab with tables containing the candidate pathogenicvariants determined by the protocol based on a reces-sive model for selection. This iReport is also available asa published history on the TraIT-CTMM public Galaxy[40].
ConclusionsiReport is a easy-to-use, flexible tool for generatingtraceable, standardized reports which are easily shared
Hiltemann et al. GigaScience 2014, 3:19 Page 7 of 8http://www.gigasciencejournal.com/content/3/1/19
Figure 7 Example iReport: Genetic Report. Example iReport for Clinical Genetics. A) Cover page with custom image. B) First tab, explaining theprotocol used. C) Second tab, tables of candidate pathogenic variants, gene columns linking out to GeneCards. D) Fourth tab showing Circosimages and family structure.
between users within and across platforms. We havedemonstrated that iReport is capable of creating a cus-tomised genetics report from results generated withinGalaxy and may be shared with collaborators on the sameplatform, or with the public. Additionally, data or resultsgenerated externally can be uploaded into Galaxy and canalso be used by iReport. These reports are generated asweb pages and may be downloaded in their entirety to beeasily shared across systems.
The genetics report presented here represents the bareminimal reporting that is required to summarise the out-put for a genetic variation analysis. Whilst we used atrio of individuals to demonstrate how to select protein-affecting candidate variants based on a recessive model,any number of model outcomes and other assay resultsmay be included in an iReport.
We developed iReport to simplify reporting and sharingthe output from omics and non-high throughput assaysanalysed both in and external to Galaxy. We have alsoutilised iReport for more complex analysis workflows,such as summarising translational research and diagnosticapplications for cancer and immunological research anddiagnostics.
Availability and requirementsProject name: iReportProject home page: https://github.com/shiltemann/iReport
CTMM-TraIT public Galaxy instance: galaxy.ctmm-trait.nliReport tool shed repository: https://toolshed.g2.bx.psu.edu/view/saskia-hiltemann/ireportOperating system(s): Unix-based Operating SystemsProgramming languages: Bash, Perl, PythonOther Requirements: GalaxyLicense: GNU GPLAny restrictions to use by non-academics: none
Examples:iReport about iReport published history: http://galaxy.ctmm-trait.nl/u/saskia-hiltemann/h/gcc2014-ireport-about-ireport,ortinyurl.com/llrzz9wClinical Genetics iReport published history:http://galaxy.ctmm-trait.nl/u/andrew-stubbs/h/ireportgeneticreportchr21
Availability and supporting dataThe iReport tool, user manual (published page), andexample data and histories are available at the CTMM-TraIT Galaxy server [40].
AbbreviationsCGtag: Complete genomics toolkit and annotation in a cloud-based galaxy;CTMM-TraIT: Center for Translational Molecular Medicine - Translational IT;NGS: Next generation sequencing; URL: Uniform resource locator.
Competing interestsThe authors declare that they have no competing interests.
Hiltemann et al. GigaScience 2014, 3:19 Page 8 of 8http://www.gigasciencejournal.com/content/3/1/19
Authors’ contributionsSH, GJ, and AS contributed to the design and coordination of iReport andmanuscript preparation. SH and AS contributed to implementing iReport. SH,GJ, YH, PvdS and AS contributed to testing of iReport and all authors read andapproved the final manuscript.
AcknowledgementsThis study was performed within the framework of the Center for TranslationalMolecular Medicine (CTMM). TraIT project (grant 05T-401).This work was sponsored by the BiG Grid project for the use of the computingand storage facilities, with financial support from the Nederlandse Organisatievoor Wetenschappelijk Onderzoek (Netherlands Organisation for ScientificResearch, NWO).
Received: 30 July 2014 Accepted: 29 September 2014Published: 13 October 2014
References1. Goecks J, Nekrutenko A, Taylor J, The Galaxy Team: Galaxy: a
comprehensive approach for supporting accessible, reproducible,and transparent computational research in the life sciences. GenomeBiol 2010, 11(8):R86.
2. Blankenberg D, Von Kuster G, Coraor N, Ananda G, Lazarus R, Mangan M,Nekrutenko A, Taylor J: Galaxy: a web-based genome analysis tool forexperimentalists. Curr Protoc in Mol Biol 2010. Chap. 19.10.1–21.[https://wiki.galaxyproject.org/CitingGalaxy]
3. Giardine B, Riemer C, Hardison RC, Burhans R, Elnitski L, Shah P, Zhang Y,Blankenberg D, Albert I, Taylor J, Miller W, Kent WJ, Nekrutenko A: Galaxy:a platform for interactive large-scale genome analysis. Genome Res2005, 15(10):1451–1455.
4. Goecks J, Eberhard C, Too T, The Galaxy Team, Nekrutenko A, Taylor J:Web-based visual analysis for high-throughput genomics. BMCGenomics 2013, 14:397.
5. Hiltemann S, Mei H, de Hollander M, Palli I, van der Spek P, Jenster G,Stubbs A: CGtag: Complete Genomics toolkit and annotation in acloud-based Galaxy. GigaScience 2014, 3(1):1.
6. Ad Hoc Reporting [http://reporting.inetsoftware.de/public/remote/adhoc]
7. Google Charts [https://developers.google.com/chart/]8. Apache OpenOffice - The Free and Open Productivity Suite
[https://www.openoffice.org/]9. Bioconductor: Open Source Software for Bioinformatics
[http://www.bioconductor.org]10. Krzywinski M, Schein J, Birol I, Connors J, Gascoyne R, Horsman D, Jones
SJ, Marra MA: Circos: an information aesthetic for comparativegenomics. Genome Res 2009, 19(9):1639–1645.
11. Circos Circular Visualisation [http://circos.ca]12. OmniViz [http://www.instem.com/solutions/omniviz.html]13. Partek: NGS and Microarray Data Analysis Software
[www.partek.com]14. TIBCO Spotfire: Business Intelligence Analytics Software and Data
Visualization [spotfire.tibco.com]15. IDBS E-Workbook [http://www.idbs.com/en/platform-products/e-
workbook/inforsense-for-e-workbook/]16. GenSight: Enterprise Portfolio Management Solutions
[www.gensight.com]17. Cartagenia. Confidently Interpret, Report and Share Genomic
Variants. [www.cartagenia.com]18. Sharma MK, Philips J, Agarwal S, Wiggins WS, Shrivastava S, Koul SB,
Bhattacharjee M, Houchins CD, Kalakota RR, George B, Meyer RR, SpencerDH, Lockwood CM, Nguyen TT, Duncavage EJ, Al-Kateb H, Cottrell CE,Godala S, Lokineni R, Sawant SM, Chatti V, Surampudi S, Sunkishala RR,Darbha R, Macharla S, Milbrandt JD, Virgin HW, Mitra RD, Head RD,Kulkarni S, et al: Clinical genomicist workstation. AMIA Jt Summits TranslSci Proc 2013, 19(9):156–157.
19. KnitR: A General-purpose Package for Dynamic Report Generationin R [http://cran.r-project.org/web/packages/knitr/]
20. Leisch F: Sweave: Dynamic generation of statistical reports usingliterate data analysis. Proc Comp Stat 2002:575–580.
21. R-Markdown [http://shiny.rstudio.com/articles/rmarkdown.html]22. Tangle [http://worrydream.com/Tangle/]
23. Active Markdown [http://activemarkdown.org/]24. IPython Notebooks [http://ipython.org/notebook.html]25. Hermida L, Poussin C, Stadler MB, Gubian S, Sewer A, Gaidatzis D, Hotz
H-R, Martin F, Belcastro V, Cano S, Peitsch MC, Hoeng J: Confero: anintegrated contrast data and gene set platform for computationalanalysis and biological interpretation of omics data. BMC Genomics2013, 14:514.
26. Cuccuru G, Orsini M, Pinna A, Sbardellati A, Soranzo N, Travaglione A, UvaP, Zanetti G, Fotia G: Orione, a web-based framework for NGS analysisin microbiology. Bioinformatics 2014, 30(10):1928–1929.
27. Galaxy-P [https://usegalaxyp.org/]28. CGtag Pipeline with iReport as Final Step [http://galaxy.ctmm-trait.nl/
u/saskia-hiltemann/p/cgtag]29. iReport Example: Tutorial GCC2014. [http://galaxy.ctmm-trait.nl/u/
saskia-hiltemann/h/gcc2014-ireport-about-ireport]30. iReport Example: Genetic Report [http://galaxy-demo.trait-ctmm.
cloudlet.sara.nl/u/andrew-stubbs/h/ireportgeneticreportchr21]31. jQuery Zoom Library [http://www.jacklmoore.com/zoom/]32. DataTables | Table Plug-in for jQuery [https://datatables.net]33. Rebhan M, Chalifa-Caspi V, Prilusky J, Lancet D: GeneCards: A novel
functional genomics compendium with automated data mining andquery reformulation support. Bioinformatics 1998, 14(8):656–664.
34. GeneCards - The Human Gene Compendium[http://www.genecards.org]
35. MacLean B, Tomazela DM, Shulman N, Chambers M, Finney GL, Frewen B,Kern R, Tabb DL, Liebler DC, MacCoss MJ: Skyline: an open sourcedocument editor for creating and analyzing targeted proteomicsexperiments. Bioinformatics 2010, 26(7):966–968.
36. Drmanac R, Sparks A, Callow M, Halpern A, Burns N, Kermani B, CarnevaliP, Nazarenko I, GB Nilsen G, Yeung G, Dahl F, Fernandez A, Staker B, PantK, Baccash J, Borcherding A, Brownley A, Cedeno R, Chen L, Chernikoff D,Cheung A, Chirita R, Curson B, Ebert J, Hacker C, Hartlage R, Hauser B,Huang S, Jiang Y, Karpinchyk V, et al: Human genome sequencing usingunchained base reads on self-assembling dna nanoarrays. Science2010, 327(5961):78–81.
37. The International HapMap Consortium: The international hapmapconsortium. the international hapmap project. Nature 2003,426:789–796.
38. The International HapMap Consortium: Integrating common and raregenetic variation in diverse human populations. Nature 2010,467:52–58.
39. Complete Genomics Public Datasets [http://www.completegenomics.com/public-data/]
40. CTMM-TraIT Public Galaxy Instance [http://galaxy.ctmm-trait.nl]
doi:10.1186/2047-217X-3-19Cite this article as: Hiltemann et al.: iReport: a generalised Galaxy solutionfor integrated experimental reporting. GigaScience 2014 3:19.
Submit your next manuscript to BioMed Centraland take full advantage of:
• Convenient online submission
• Thorough peer review
• No space constraints or color figure charges
• Immediate publication on acceptance
• Inclusion in PubMed, CAS, Scopus and Google Scholar
• Research which is freely available for redistribution
Submit your manuscript at www.biomedcentral.com/submit
Copyright © 2022 FDOKUMEN