investigation report on shadows
11
Investigating shadows Introduction: - Light refers to visible light, which is electromagnetic radiation that is visible to human eyes. Light travels in straight lines. A shadow is formed when light is blocked by an opaque object. If the object is transparent then the light will just pass through it. Aim: - My aim is to investigate how the vertical length of the shadow is affected by the distance between light source and object. Research question: - How does the vertical length of the shadow (L S /cm) depend on the distance between light source and object (D LO /cm)? Hypothesis: - I think that when the distance between light source and object (D LO /cm) is increased, then the length of the shadow (L S /cm) will decrease. To predict the best fit graph I have used the diagram in figure 1. I can see that similar triangles are formed and the property of similar triangles is that the ratios of lengths of corresponding sides are equal. Using this I have derived an expression which I used to predict the best fit graph. The best fit predicted graph I got was a curved line graph.
-
Upload
independent -
Category
Documents
-
view
1 -
download
0
Transcript of investigation report on shadows

Investigating shadows
Introduction: - Light refers to visible light, which iselectromagnetic radiation that is visible to human eyes.Light travels in straight lines. A shadow is formed whenlight is blocked by an opaque object. If the object istransparent then the light will just pass through it.
Aim: - My aim is to investigate how the vertical lengthof the shadow is affected by the distance between lightsource and object.
Research question: - How does the vertical length of theshadow (LS/cm) depend on the distance between light sourceand object (DLO/cm)?
Hypothesis: - I think that when the distance betweenlight source and object (DLO/cm) is increased, then thelength of the shadow (LS/cm) will decrease. To predict thebest fit graph I have used the diagram in figure 1. I cansee that similar triangles are formed and the property ofsimilar triangles is that the ratios of lengths ofcorresponding sides are equal. Using this I have derivedan expression which I used to predict the best fit graph.The best fit predicted graph I got was a curved linegraph.
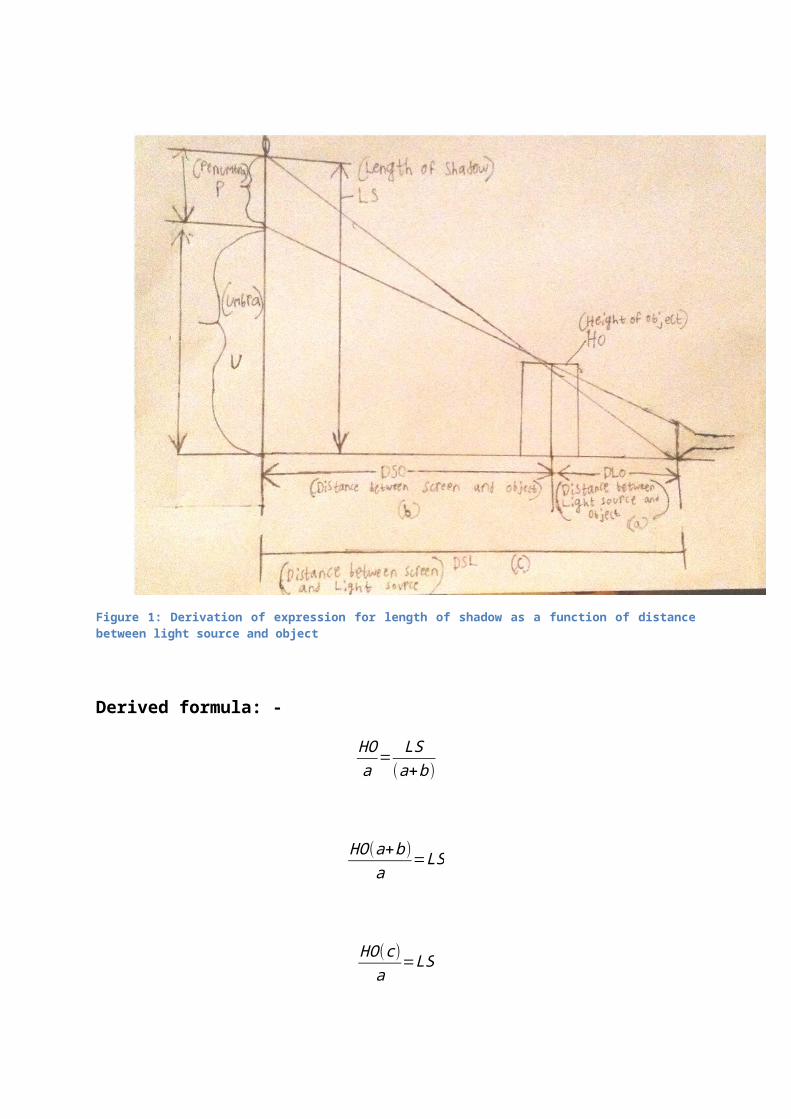
Figure 1: Derivation of expression for length of shadow as a function of distancebetween light source and object
Derived formula: -
HOa
=LS
(a+b)
HO(a+b)a
=LS
HO(c)a
=LS

Similar triangles -
The triangles are similar because the three correspondingangles are equal.
Symbol meanings: -
DLO – a – Distancebetween light source andobject (cm)
DSO – b – Distancebetween screen and object (cm)
DSL – c – Distance between screen and light source (cm)(47.0 cm)
HO – Height of object (cm) (8.5 cm)
LS – Vertical length of shadow (cm)
P – Penumbra (cm) (Lighter/Outer part of shadow)
U – Umbra (cm) (Darker/Inner part of shadow)
Predicted graph –
Sample calculation:-
Height of object – 8.5 cm
Distance between screen and light source – 47.0 cm
8.5×47.010.8
399.510.8

¿36.99074074
¿37.0
DLO (distance between objectand light source) / cm
predicted LS (vertical length of shadow) / cm
10.8 37.015.8 25.323.8 17.829.8 13.434.8 11.539.8 10.0
5 10 15 20 25 30 35 40 450
10
20
30
40
f(x) = NaN x^NaNR² = NaN Predicted Length of shadow vs
Distance between light source and object
predicted LS vs dLO
DLO ,Distance between light source and object/cm
LS,L
ength
of s
hadow/
cm

Figure 2 Experimental setup
To test my hypothesis I have conducted an experiment,first I created an experimental setup. I took an opticalbench and fixed a Thermocol board at the end of theoptical bench as the screen. Then I took a wooden boardand placed it 47 centimetres away from the Thermocolboard. I placed the torch light on the wooden board. ThenI took a metal board and placed it 1 centimetre away fromthe screen. Then I placed the needle at selectedpositions (10.8 cm, 15.8 cm, 23.8 cm, 29.8 cm, 34.8 cmand 39.8 cm) and measured the corresponding verticallengths of shadow using the vertical meter scale placednext to the shadow. Using the data, I filled the raw datatable and plotted a graph on MS excel.
Screen
Torch
Optical bench
Centimetre scale
Object (Needle)

Independent variable: - Distance between light source andobject (DLO/cm)
Dependent variable: - Vertical Length of shadow (LS/cm)
Control variables –
S.no Controlledvariable
How it iscontrolled
1 Vertical positionof torch light
Torch is kept atground level, sameas bottom ofobject, such thatlight emittingpart is are atground level
2 Angle of torch Torch is kepthorizontal
3 Vertical positionof object
Base of object,base of torchlight and screenare all on grounds
4 Aperture of light Same torch is used

source throughout theexperiment
5 Angle ofinclination ofscreen
Screen is keptvertical
6 Angle ofinclination ofobject
Object is keptvertical
7 Angle ofinclination oflight source
Light source iskept such that itproduces aparallel beam oflight horizontally
8 Horizontalposition of screen
Fixed
9 Horizontalposition of lightsource
Fixed for part 1of experiment,where horizontalposition of lightsource is changed
10 Horizontalposition of object
Fixed
Apparatus: -
Optical bench Torch light Needle (height: - 8.5 cm) Wooden board Metal board Centimetre scale Thermocol board Raw data table Research question Microsoft excel

Data table: -
Sample calculation of error in vertical length of shadow:-
MeasuredLS±PredictedLS
40.0±37.0
3.0
DLO (distance between object and light source) / cm
Measured LS (vertical length of shadow) / cm
predicted LS (vertical length of shadow) / cm
Error in LS /cm
10.8 40.0 37.0 3.015.8 28.0 25.3 2.723.8 20.0 16.8 3.229.8 16.0 13.4 2.634.8 14.0 11.5 2.539.8 12.0 10.0 2.0
Graph: -

5 10 15 20 25 30 35 40 450.010.020.030.040.050.0
f(x) = 347.17409350989 x^-0.907502591584353R² = 0.998770648100959
Length of shadow vs Distance between light
source and objectmeasured LS vs dLOPower (measured LS vs dLO)predicted LS vs dLO
DLO, Distance between light source and object/cm
LS,Length of shadow/cm
A plot of the log-log graph gave a linear fit aspredicted.
In (DLO) ln (LS)2.4 3.72.8 3.33.2 3.03.4 2.83.5 2.63.7 2.5
2.2 2.4 2.6 2.8 3.0 3.2 3.4 3.6 3.80.0
1.0
2.0
3.0
4.0f(x) = − 0.907502591584352 x + 5.84982636453541R² = 0.998770648100959
ln(LS) vs ln(DLO)
Series2predicted
ln(DLO)
ln(L
S)
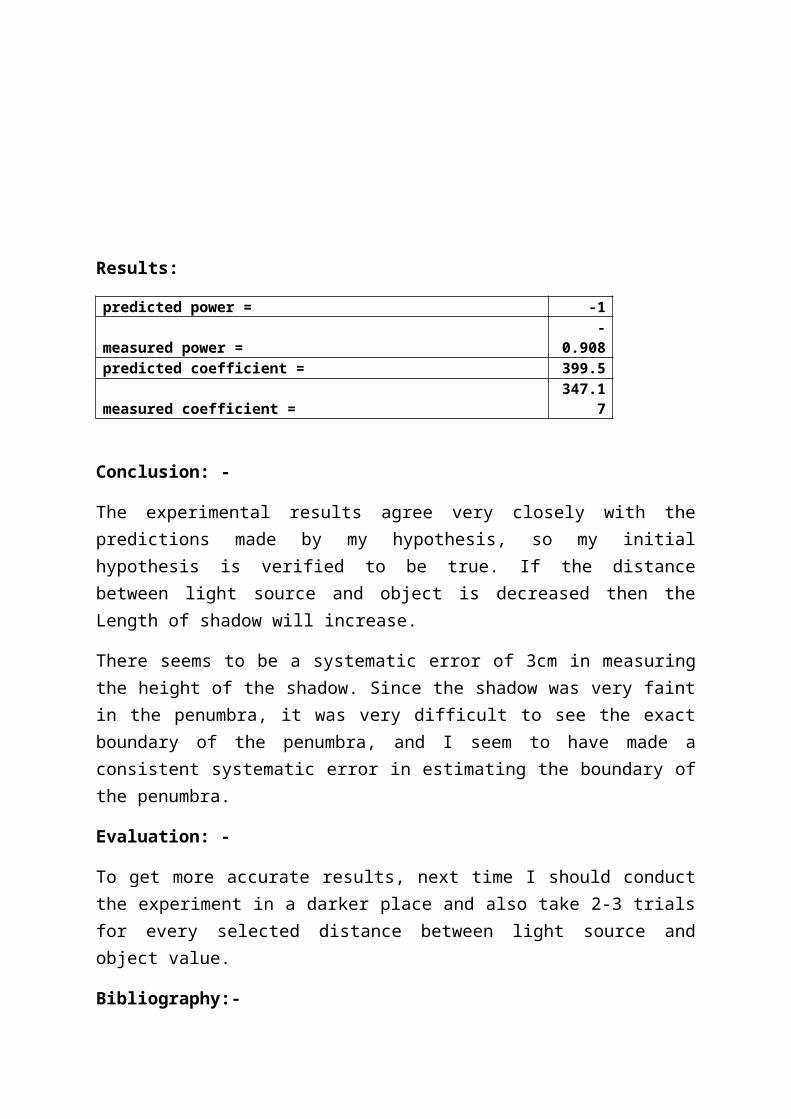
Results:
predicted power = -1
measured power =-
0.908predicted coefficient = 399.5
measured coefficient =347.1
7
Conclusion: -
The experimental results agree very closely with thepredictions made by my hypothesis, so my initialhypothesis is verified to be true. If the distancebetween light source and object is decreased then theLength of shadow will increase.
There seems to be a systematic error of 3cm in measuringthe height of the shadow. Since the shadow was very faintin the penumbra, it was very difficult to see the exactboundary of the penumbra, and I seem to have made aconsistent systematic error in estimating the boundary ofthe penumbra.
Evaluation: -
To get more accurate results, next time I should conductthe experiment in a darker place and also take 2-3 trialsfor every selected distance between light source andobject value.
Bibliography:-

"Light." Wikipedia. N.p., n.d. Web. 7 Feb. 2015.
< http://en.wikipedia.org/wiki/Light >
"Shadows." BBC - KS2 Bite size Science. BBC, n.d. Web. 9 Feb. 2015. <http://www.bbc.co.uk/bitesize/ks2/science/physical_processes/shadows/read/1>