
Investigation on the causes of failure of Tana Beles Weir ...
113
i Investigation on the causes of failure of Tana Beles Weir Master of Science Thesis By Seife Tadesse A thesis submitted to the school of graduate studies in partial fulfillment of the Requirements for the degree of Master of Science in Civil Engineering (Hydraulics) At Addis Ababa University July, 2019
-
Upload
khangminh22 -
Category
Documents
-
view
0 -
download
0
Transcript of Investigation on the causes of failure of Tana Beles Weir ...

i
Investigation on the causes of failure of Tana Beles Weir
Master of Science Thesis
By
Seife Tadesse
A thesis submitted to the school of graduate studies in partial
fulfillment of the
Requirements for the degree of
Master of Science in Civil Engineering
(Hydraulics)
At
Addis Ababa University
July, 2019

ii
Investigation on the causes of failure of Tana Beles Weir
By Seife Tadesse
Approved by the Board of Examiners;
_______________________ _________________
Chairman, Department Signature
______________________ _________________
Advisor Signature
______________________ ________________
External Examiner Signature
______________________ ________________
Internal Examiner Signature

iii
Declaration
I hereby declare that all information in this document has been obtained and presented in
accordance with academic rules and ethical conduct. I also declare that, a required by these
rules and conduct, I have fully cited and referenced all material and results that are not original
to this work.
Seife Tadesse
Signature………………………

iv
Abstract
An investigation on Tana Beles diversion head-work is carried out for this research work and
attempt is made to understand the failure problems encountered. This serve for different
purposes such as for construction of new diversion structure (either as replacement for existing
structures, or as an entirely new structure), rehabilitation of existing structures (from minor
repairs to complete re-engineering either to maintain existing function, or to meet new
requirements).
Hydrology and hydraulic analysis, structural analysis and evaluation of the foundation
condition of the weir has been made to investigate the causes for the failure of the weir.
The hydrology analyses is made by Hec-hms and the result shows that the peak flood used for
the design of the weir is smaller than the result obtained in this investigation, but the water way
of the weir built can accommodate the estimated peak flood. Models used for the hydrology
analysis include Global Mapper, Arc-GIS, Hec-Geohms and Hec-hms. On the other side,
hydraulic design is evaluated and the evaluation exposes the absence of concrete floor, absence
of energy dissipater and protection works on the hydraulic design of the weir and clogging of
under sluice as a cause for the failure of the weir. The structural analysis involves checking
stability analysis of the weir against overturning, sliding and shear. Surveying data upstream
and downstream of the weir is collected and foundation condition were investigated by
comparing the collected surveying data with the design bed level.in addition to this the applied
foundation treatment is evaluated by comparing it with standards and found that the main
structure was built on weak foundation which activates the weir failure. This investigation
shows that the main cause of Tana Beles weir failure is due to the weak foundation condition
of the weir and absence of the necessary concrete floor and energy dissipater on its design.
Finally, the remedial design for the weir is recommended.
Key words: Analysis, Concrete Floor, Diversion, Downstream, Energy Dissipater, Gates,
Head work, Regulator, Scour, Seepage, Silt, Stability, Upstream, Under-sluice, Weir.

v
Acknowledgements
First of all I would like to thank the almighty GOD for his unspeakable gift, help and protection
and I am heartily thankful to St. Virgin Mary and all Saints supporting and protecting me during
my work.
I would like to express my genuine gratitude and appreciation to Dr. Yilma Sileshi, whose
encouragement, guidance and support from the initial to the final level enabled me to develop
an understanding of the subject I was working and day to day follow up for the completion of
this master program.
My sincerely thanks goes to Ministry of Water, Irrigation and Electricity ,National
Meteorological Agency and Amhara Design and Supervision Works Enterprise(ADSWE) who
gave me the available data free of charge.
Last but not least I offer my regards and thanks to all my family members, friends and those
who supported me in any aspect for the completion of the study.
Seife. T
July, 2019
Addis Ababa, Ethiopia

vi
Contents Acknowledgements ................................................................................................................................. v
List of Tables .......................................................................................................................................... ix
List of Figures .......................................................................................................................................... x
List of Photos .......................................................................................................................................... xi
List of Symbols ....................................................................................................................................... xii
1 Introduction .................................................................................................................................... 1
1.1 General .................................................................................................................................... 1
1.2 Statement of the problem ...................................................................................................... 2
1.3 Research Question .................................................................................................................. 3
1.4 Objectives................................................................................................................................ 4
1.4.1 General Objectives .......................................................................................................... 4
1.4.2 Specific Objectives .......................................................................................................... 4
1.5 Significance of the research .................................................................................................... 4
1.6 Organization of the thesis ....................................................................................................... 5
2 Literature Review ............................................................................................................................ 6
2.1 Head work ............................................................................................................................... 6
2.2 Components of Head works: ................................................................................................... 7
2.3 Weir failure ........................................................................................................................... 10
2.3.1 Causes of weir failure .................................................................................................... 10
2.4 Previous studies on investigation of weir failure .................................................................. 13
2.4.1 Studies in Ethiopia ......................................................................................................... 13
2.4.2 Studies outside of Ethiopia ........................................................................................... 15
3 Method and Material .................................................................................................................... 19
3.1 Study Area ............................................................................................................................. 19
3.2 Description of TanaBeles Diversion Head-work.................................................................... 20
3.2.1 Operation methodology ................................................................................................ 29
3.3 Methodology, Data collection and analysis .......................................................................... 30
3.3.1 Data Collection .............................................................................................................. 30
3.3.2 Data Analysis ................................................................................................................. 31
4 Hydrologic analysis ........................................................................................................................ 44
5 Evaluation of the Foundation condition of the Weir .................................................................... 53
5.1 Evaluation of Geological Investigation report of the Weir Area ........................................... 53

vii
5.2 Evaluation of the Foundation Treatment of the weir ........................................................... 58
5.2.1 Surveying of the actual bed level upstream and downstream of the weir .................. 59
5.2.2 Comparison of the actual bed level with the original bed level ................................... 60
6 Hydraulic analysis .......................................................................................................................... 63
6.1 Clogging of under sluice ........................................................................................................ 63
6.2 Retrogression Negligence ..................................................................................................... 64
6.3 Absence of Concrete Floor .................................................................................................... 65
6.4 Absence of Upstream and downstream cut off .................................................................... 65
6.5 Absence of Upstream and downstream protection works ................................................... 66
6.6 Absence of Energy Dissipater................................................................................................ 66
6.7 Absence of river training work .............................................................................................. 67
7 Structural analysis ......................................................................................................................... 68
7.1 Forces acting on the weir ...................................................................................................... 68
7.2 Stability against Uplift ........................................................................................................... 68
7.3 Stability against Overturning ................................................................................................ 69
7.4 Stability against shear and Sliding......................................................................................... 69
7.5 Over all stability of the weir .................................................................................................. 69
8 Remedial design of the weir ......................................................................................................... 72
8.1 Design Flood Discharge ......................................................................................................... 72
8.2 Rating curve .......................................................................................................................... 72
8.3 Pond Level ............................................................................................................................. 73
8.4 Optimum water way and afflux ............................................................................................ 73
8.5 Adequacy of the waterway ................................................................................................... 74
8.6 Design of the ogee weir profile ............................................................................................. 75
8.7 Energy dissipation ................................................................................................................. 76
8.8 Sheet piles ............................................................................................................................. 78
8.9 Upstream and downstream Concrete floor .......................................................................... 79
8.10 Pressure calculation .............................................................................................................. 80
8.11 Floor Thickness ...................................................................................................................... 81
8.12 Protection works ................................................................................................................... 82
9 Conclusion and Recommendation ................................................................................................ 86
9.1 Conclusion ............................................................................................................................. 86
9.2 Recommendation .................................................................................................................. 89

viii
References ............................................................................................................................................ 90
APPENDICES .......................................................................................................................................... 92
APPENDIX A: Maximum Rainfall of main beles gauging station ....................................................... 92
Appendix B: Maximum flow of Main Beles ....................................................................................... 94
APPENDIX C: Maximum Rainfall of Weir site .................................................................................... 96
APPENDIX D: Hydrologic Analysis ..................................................................................................... 98
APPENDIX E: Rating Curve ............................................................................................................... 102

ix
List of Tables
Table 1: List of Rainfall station used for main beles ............................................................... 32
Table 2: Rainfall analysis of main beles guaging station ........................................................ 33
Table 3: incremental depth calculation of gauged station by alternate block method ............. 36
Table 4: List of Rainfall station used for Tana Beles weir site ................................................ 37
Table 5: Rainfall analysis of weir site unguaged station ......................................................... 38
Table 6: Flow analysis of main beles guaging station ............................................................. 42
Table 7: Simulation result ....................................................................................................... 50
Table 8: summary result table .................................................................................................. 52
Table 9: bed level surveying data collection for upstream and downstream of the weir ......... 60
Table 10: ogee weir profile ...................................................................................................... 75

x
List of Figures
Figure 1: Typical Layout of Diversion Headwork ..................................................................... 7
Figure 2 Geographical Location of TanaBeles Weir ............................................................... 21
Figure 3: Plan View of Tana Beles Headwork ........................................................................ 22
Figure 4: Plan View of Tana Beles Weir ................................................................................. 23
Figure 5: Sectional View of Tana Beles Weir ......................................................................... 24
Figure 6: Sectional View of the foundation of Tana Beles Weir ............................................. 25
Figure 7: main weir divide wall and under sluice section ....................................................... 26
Figure 12: Thiessen Polygon for Main Beles at Bridge ........................................................... 33
Figure 13: Thiessen Polygon of Tana Beles Weir site ............................................................. 38
Figure 8: Arc Hydro output 1................................................................................................... 46
Figure 9: Arc Hydro Output 2 .................................................................................................. 47
Figure 10: CN Grid and Sub basin ........................................................................................... 48
Figure 11: Hec-Geo Hms Output ............................................................................................. 49
Figure 18: Optimization result graph ....................................................................................... 51
Figure 19 : Geological cross section of the weir axis before and after excavation ............... 54
Figure 20: Bed level Cross-Section at the toe of the Weir ...................................................... 62
Figure 21: Upstream bed level comparison ............................................................................. 63
Figure 22: plan view of the weir .............................................................................................. 84
Figure 23: section view of the weir.......................................................................................... 85

xi
List of Photos
Photo 1: Fentale Head Work .................................................................................................... 14
Photo 2: Tana Beles diversion head work (Dec 2017) ........................................................... 28
Photo 3: Under-sluice and canal head regulator of Tana Beles irrigation development project
(Dec, 2017) .............................................................................................................................. 29
Photo 4: Cavity encountered at the center of the weir axis during foundation excavation .... 54
Photo 5: Left abutment d/s of the weir, one vertical joint intersecting in to the structure
foundation and one horizontal joint ......................................................................................... 55
Photo 6: Horizontal and vertical joints on right abutment d/s of the weir axis. ...................... 57
Photo 7: Seepage through sheared rock at right abutment at the side of the under sluice
structure.................................................................................................................................... 58

xii
List of Symbols
A = Area of opening
B = Total length of the floor
B =Width of the weir base.
Cd=Discharge coefficient
D =depth of downstream cut off below downstream floor level
e = eccentricity
f = Silt factor for foundation material
g = Gravity, 9.8 m/s
G =Density of construction material for apron
GE = Safe exit gradient
H = Maximum static head (pond level -downstream floor level)
Ef = specific energy
R = scour depth
D=depth of pile no.2
d=depth of pile no.1
b'=distance b/n two piles

1
1 Introduction
1.1 General Ethiopia has considerable development potentials and its land and water resources are adequate
relative to its population (Awulachew, 2010). However, crop production is not enough to fulfill
the food requirements of the country and most of the agricultural production is based on rain
fed farming (Lambiso, 2005). Variable rainfall and frequent drought conditions have adverse
effects on rain fed dependent farming, which has negative impacts on Ethiopia's economy. It is
reported that due to floods, droughts and lack of water infrastructures Ethiopia is at risk of
chronic food shortage . One of the best alternatives for achieving food security is expanding
irrigation on various scales through river diversion, constructing micro-dams and water
harvesting structures etc. (Awulachew, 2010)
As the demand for sugar is increasing at alarming rate as a result of improving living standard,
increasing global demand and its multipurpose application, encroach upon these lowland plains
for sugar production is inevitable. It is in this regard that the Government of Ethiopia set a program
to develop sugar industry that can satisfy the increasing demand and generate additional wealth to
help boost the economy. The plan demands preparation of biophysically suitable sites for irrigation
sugarcane plantation that is also favorable in their infrastructure development status. (Enterprise,
Feasibility and Design Study of Tana Beles Integrated Sugar Development Project Irrigation and
Drainage Report, 2013)
The Ethiopian Sugar Corporation with an objective of raising the sugar production of the country
planned to develop about 250,000 hectare of land for cane production in GTP I and II. One of the
potential sites selected for cane production is Tana Beles Integrated Sugar Development Project.
The project was initially started by Amhara National Regional State and later transferred to the
Sugar Corporation. The productivity of Sugar cane at Tana Beles Sugar Development project fully
depends on the hydraulic functioning of weirs and main canal structures. (Enterprise, Feasibility and Design
Study of Tana Beles Integrated Sugar Development Project Irrigation and Drainage Report, 2013)
Weirs are man-made barriers constructed across water courses for the benefit of mankind and have
been playing a vital role in the development of any country by meeting the water demand for

2
domestic use, irrigation, power generation, flood protection etc. they are one of the important
hydraulic structures which are considered as low-level dams constructed across a river to raise the
river sufficiently and to divert the flow in full, or in part, into a supplying canal or conduit for the
purposes of irrigation, power generation, flood control, domestic and industrial uses.
Construction of weirs has been a long-established practice with the oldest known weir, Mnjikaning
Fish Weirs built by the first nations people well before recorded history, dating to about 3,300 BCE
during the Archaic period in North America, according to carbon dating done on some of the
wooden remnants. (wikipedia, n.d.)
Functions of diversion headwork implemented for irrigation are to raise the water level on its
upstream side, regulate the supply of water in to canals, control entry of silt in to canals, creates a
small pond (not reservoir) on its upstream and provides some pondage, help in controlling the
fluctuation of water level in river during different seasons. (Garg, 2005)
The main constraints that contributed to the malfunctioning of the irrigation system in Ethiopia
were sedimentation at the headwork, damage of intakes and sluice gates, clogging of intakes,
damages of distribution systems and main body. Whereas accumulation of boulders, structural
failures of diversion weir, damages of the intake gates and main canals, and absence of the under
sluice were also observed in some schemes. Therefore, investigation on the causes of failure of
Weirs will help for the irrigation schemes to perform better and efficiently to increase agricultural
productivity in Ethiopia.
A number of river diversion structures have been designed and constructed in the previous years.
However, while some schemes are performing successfully, it has been observed in various reports
that some of the schemes have failed to serve the purpose for which they are intended (Lambiso,
2005). Therefore it is important to deal with the causes of failure of diversion head works
implemented for irrigation, hydropower and any other.
1.2 Statement of the problem
Tana Beles Integrated Sugar Development Project is located near Fendka Town, capital of Jawi
Woreda, found in the western periphery of ANRS (Amhara National Regional State), 145 km from
Bahir Dar. The project covers about 57,614 ha of land situated at Upper Ayma and Upper Beles

3
mainly emphasized on 38,334 ha of land placed at Right side of Beles River. The project overall
includes a total area of about 95,948 ha of land found in Jawi woreda of Amhara and Dangur
woreda of Benishangul National Regional States. (Enterprise, Feasibility and Design Study of
Tana Beles Integrated Sugar Development Project Head Work Design Report, 2011)
The diversion work for Tana Beles Integrated sugar Development Project is located at Beles River
at about 28 km from Jawi / Fendka. Geographically the weir is located at 247847.76 Easting and
1289961.39 Northing. (Enterprise, Feasibility and Design Study of Tana Beles Integrated Sugar
Development Project Head Work Design Report, 2011)
The Head Work is heavily damaged along the line of intersection between the weir and the divide
wall. In addition to this, a crack on the surface of the weir is observed and the plastering is detached
on some part of the weir.
The above problems would cause total failure of the head work structures, which eventually leads
to failure on the irrigation scheme, downstream flooding and other related problems.
Therefore, studying the investigation for the cause of failure of the weir will be advantageous in
taking the required measures so as to make the weir operational without further damage and to
design other weirs with better care on the expected causes of failure.
This research work is aimed to identify the major causes of failure of the diversion weir of Tana
Beles Irrigation Project and to recommend remedial measures. This will serve from minor repairs
to complete replacement, either to maintain existing function, or to meet new requirements.
1.3 Research Question
The following questions are the main factors that are dealt in this research work.
What are the reasons for the failure of the weir?
Is there any hydrologic, hydraulic and geotechnical problem which may cause the failure
of the weir?
Is there any structural problem such as failure due to uplift, overturning, shear and
sliding?
Is there any problem on the constructed diversion weir which may lead to failure?

4
This study will go deeper into scientific analysis to answer the above mentioned questions.
1.4 Objectives
1.4.1 General Objectives
The primary objective of this research work is
To identify the major causes of the failure of the Tana Beles Irrigation Development
Project diversion weir
To recommend remedial design of the Weir.
1.4.2 Specific Objectives
To estimate the peak flow and compare it with the design discharge of the weir
To check the capacity of the weir by using the estimated peak flood
To check the actual site condition of the headwork
To evaluate the hydraulic design of the weir
To evaluate the foundation condition of the weir
To check stability analysis
To recommend remedial design
1.5 Significance of the research
In Ethiopia recently lots of Irrigation projects were under construction and lot of design works
were done for the future expansion for food security of the increasing population. The country has
experienced many cases of failure of diversion head works and below capacity for many decades
but there is no any information for the causes of their failures (Awulachew, 2010).
The following are some of the uses of this research work
To identify the major causes of the failure of Tana Beles diversion headwork.
This research work aims to provide some information to parties engaged in maintenance
and improvement of the existing Tana Beles head work, so as to ensure that mistakes are
avoided and opportunities are not missed.
Investigation of the failure cause of diversion head works implemented for irrigation can
also serve for different purposes such as for construction of new diversion structures, either

5
as a replacement for an existing structure, or as an entirely new structure, rehabilitation of
existing structures, from minor repairs to complete re-engineering, either to maintain
existing function, or to meet new requirements, decommissioning of a structure.
1.6 Organization of the thesis
The thesis is organized in to five chapters. Chapter one deals with introduction that covers the
General background, the problem statement, objectives of the research, the research question,
Significance of the research, and organization of the study. Chapter two deals with Literature
review. Chapter three deals with the methods and materials used. Chapter four covers Hydrology
analysis. Chapter five deals with evaluation of the foundation condition of the weir. Chapter six
deals with hydraulic analysis. Chapter seven deals with structural analysis. Chapter eight deals
with remedial design of the weir. Chapter nine deals with conclusion and recommendations.
6
2 Literature Review
2.1 Head work
Head works are hydraulic structure which supplies water to the off taking canal. It can also be
defined as barriers across a river at the head of an off taking main canal. Head works can be either
diversion head works or storage headwork. Diversion head works is a structure constructed across
a river for the purpose of raising water level in the river so that it can be diverted into the off taking
canals. It is also known as canal head works. Diversion head works are constructed at the head of
the canal, in order to divert the river water towards the canal, so as to ensure a regulated continuous
supply of relatively silt free water with a certain minimum head in to the canal (Asawa, 2008).
Storage head work is a barrier constructed across the river valley to form the storage reservoir. The
water is supplied to the canal from the reservoir through the canal head regulator. This serve as
multipurpose functions like hydroelectric power generation, fishery, flood control, etc. (Garg,
2005).
Diversion headwork provides an obstruction across a river, so that the level of the water is raised
and water is diverted to the channel at required level. The flow of water in the canal is controlled
by the canal head regulator. This increased water level helps the flow of water by gravity and the
increasing the commanded area and reducing the water fluctuation in the river (Garg, 2005).
Diversion headwork serves the following purposes: (Garg, 2005)
To rise the water level at the head of the canal
To control the intake of water into the canal.
To control the entry of silt in to the canal and to control deposit of silt at the head of the
canal.
To store water for small period of time so that water is available throughout the year
To control the fluctuation of water level in the river during different season

7
2.2 Components of Head works:
The essential components of head works (s.k.sharma, 2002) are:
Weir
Under sluices
Canal head regulator
Divide wall or groyne
Piers and abutments
Protection works
River training works
Fish ladder
Silt excluder/silt prevention device
Figure 1: Typical Layout of Diversion Headwork
8
Below is definition about the essential component of diversion head work by (Mohanty, 2012).
Normally the water level of any perennial river is such that it cannot be diverted to the irrigation
canal. The bed level of the canal may be higher than the existing water level of the river. In such
cases weir is constructed across the river to raise the water level. Surplus water passes over the
crest of the weir. Adjustable shutters are provided on the crest to raise the water level to some
required height. When the water level on the upstream side of the weir is required to be raised to
different levels at different time, barrage is constructed. Barrage is an arrangement of adjustable
gates or shutters at different tiers over the weir.
Under sluices /scouring sluices are openings provided at the base of the weir or barrage. These
openings are provided with adjustable gates. Normally, the gates are kept closed. The suspended
silt goes on depositing in front of the canal head regulator. When the silt deposition becomes
appreciable the gates are opened and the deposited silt is loosened with an agitator mounting on a
boat. The muddy water flows towards the downstream through the scouring sluices so the gates
closed. But, at the period of flood, the gates are kept opened.
The divide wall is a long wall constructed at right angles in the weir or barrage; it may be
constructed with stone masonry or cement concrete. On the upstream side, the wall is extended
just to cover the canal head regulator and on the downstream side it is extended up to the launching
apron. To form a still water pocket in front of the canal head so that the suspended silt can be
settled down which then later be cleaned through the scouring sluices from time to time. It controls
the eddy current or cross current in front of the canal head. It provides a straight approach in front
of the canal head. It resists the overturning effect on the weir or barrage caused by the pressure of
the impounding water.
Fish ladder is provided just by the side of the divide wall for the free movement of fishes. Rivers
are important sources of fishes. The tendency of fish is to move from upstream to downstream in
winters and from downstream to upstream in monsoons. This movement is essential for their
survival. Due to construction of weir or barrage, this movement gets obstructed, and is determined
to the fishes. In the fish ladder, the fable walls are constructed in a zigzag manner so that the
velocity of flow within the ladder does not exceed 3 m/s. The width, length, and height of the fish
ladder depend on the nature of the river and type of weir or barrage.
9
A structure which is constructed at the head of the canal to regulate flow of water is known as
canal head regulator. It consists of a number of piers which divide the total width of the canal into
a number of spans which are known as bays. The pier consists of tiers on which the adjustable
gates are placed. The gates are operated from the top by suitable mechanical device. A platform is
provided on the top of the pier for the facility of operating the gates. Again some piers are
constructed on the downstream side of the canal head to support the roadway.
Functions of canal head regulator are (Mohanty, 2012).
It regulates the supply of water entering the canal,
It controls entry of silt in the canal,
It prevents the river flood from entering the canal.
Entry of silt in to canal which takes off from headwork’s can be reduced by constructed certain
special works called silt control works. These works may be classified in to two types, silt
excluders and silt ejectors (Mohanty, 2012).
Silt excluders are those works which are constructed on the bed of the river upstream of the head
regulator. The clearer water enters the head regulator and silted water enters the silt excluder. In
this type of works the silt is therefore removed from the water before it enters the canal.
Silt ejectors also called silt extractors are those devices which extract the silt from the canal water
after the silted water has travelled a certain distance in the off taking canal. These works are
therefore constructed on the bed of the canal and little distance downstream from the head
regulator.
River training works are required near the weir site in order to ensure a smooth and an axial flow
of water and thus to prevent the river from outflanking the works due to a change in its course.
The river training works required on a canal headwork are guide banks, marginal bunds, spurs
Or groynes.
10
2.3 Weir failure
Weir failure is a bad phenomenon that leads the constructed weir useless with respect to its main
purpose. The failure type can be exposed to the surface or may not be exposed depending on the
type of failure. There are different types of failure and Here, Some types of failure are listed
below.
Damage of floor
Deterioration of floor due to standing waves
Scour on upstream and downstream of the weir
Others
2.3.1 Causes of weir failure
Common causes of failure of weirs (Jamal, March 2017) include:
Excessive and progressive downstream erosion, both from within the stream and through
lateral erosion of the banks
Erosion of inadequately protected abutments
Hydraulic removal of fines and other support material from downstream protection
(gabions and aprons) resulting in erosion of the apron protection
Deterioration of the cutoff and subsequent loss of containment
Additional aspects specific to concrete, rock fill or steel structures
In addition to the above causes, the main causes of weir failure and there remedy is presented
below (Jamal, March 2017)
2.3.1.1 Piping
Piping is caused when groundwater seeps out of the bank face. Grains are detached and entrained
by the seepage flow and may be transported away from the bank face by surface runoff generated
by the seepage, if there is sufficient volume of flow. The exit gradient of water seeping under the
base of the weir at the downstream end may exceed a certain critical value of soil. As a result the
surface soil starts boiling and is washed away by percolating water. The progressive erosion back
wash at the upstream results in the formation of channel (pipe) underneath the floor of weir.
11
Since there is always a differential head between upstream and downstream, water is constantly
moving from upstream to downstream under the base of weir. However, if the hydraulic gradient
becomes big, greater than the critical value, then at the point of existence of water at the
downstream end, it begins to dislodge the soil particles and carry them away. In due course, when
this erosion continues, a sort of pipe or channel is formed within the floor through which more
particles are transported downstream which can bring about failure of weir.
Piping is especially likely in high banks backed by the valley side, a terrace, or some other high
ground. In these locations the high head of water can cause large seepage pressures to occur.
Evidence includes: Pronounced seep lines, especially along sand layers or lenses in the bank; pipe
shaped cavities in the bank; notches in the bank associated with seepage zones and layers; run-out
deposits of eroded material on the lower bank.
Remedies:
Decrease Hydraulic gradient i.e. increase path of percolation by providing sufficient
length of impervious floor
Providing curtains or piles both at upstream and downstream
2.3.1.2 Rupture of floor due to uplift
If the weight of the floor is insufficient to resist the uplift pressure, the floor may burst. This
bursting of the floor reduces the effective length of the impervious floor, which will increase exit
gradient, and can cause failure of the weir.
Remedies:
Providing impervious floor of sufficient length of appropriate thickness.
Pile at upstream to reduce uplift pressure downstream
2.3.1.3 Rupture of floor due to suction caused by standing waves
Hydraulic jump formed at the downstream of water
Remedies:
Additional thickness
Floor thickness in one concrete mass
12
2.3.1.4 Scour on the upstream and downstream of the weir
Occurs due to contraction of natural water way.
Remedies:
Piles at greater depth than scour level
Launching aprons
In addition to the above causes, there are also failures that will be caused due to the flow condition
and differ with respect to the flow type’s. Correspondingly, it is known that the flow types have
an effect on the type of weir failure. Surface and subsurface flow types can cause their own type
of failure as described below.
2.3.1.5 Failure due to subsurface flow
a. Failure by piping or undermining
The water from the upstream side continuously percolates through the bottom of the foundation
and emerges at the downstream end of the weir or barrage floor. The force of percolating water
removes the soil particles by scouring at the point of emergence. As the process of removal of soil
particles goes on continuously, a depression is formed which extends backwards towards the
upstream through the bottom of the foundation. A hollow pipe like formation thus develops under
the foundation due to which the weir or barrage may fail by subsiding. This phenomenon is known
as failure by piping or undermining.
b. Failure by direct uplift
The percolating water exerts an upward pressure on the foundation of the weir or barrage. If this
uplift pressure is not counterbalanced by the self-weight of the structure, it may fail by rapture.
2.3.1.6 Failure by surface flow
a. By hydraulic jump
When the water flows with a very high velocity over the crest of the weir or over the gates of the
barrage, then hydraulic jump develops. This hydraulic jump causes a suction pressure or negative
pressure on the downstream side which acts in the direction uplift pressure. If the thickness of the
impervious floor is insufficient, then the structure fails by rupture.
13
b. By scouring
During floods, the gates of the barrage are kept open and the water flows with high velocity. The
water may also flow with very high velocity over the crest of the weir. Both the cases can result in
scouring effect on the downstream and on the upstream side of the structure. Due to scouring of
the soil on both sides of the structure, its stability gets endangered by shearing.
2.4 Previous studies on investigation of weir failure
2.4.1 Studies in Ethiopia
A number of irrigation schemes have been designed and constructed here in Ethiopia in the
previous years. However, while some schemes are performing successfully, it has been observed
in various reports that some of the schemes have failed to serve the purpose for which they are
intended. With the ground that reviewing studies made on failed weir will help to choose the best
methodology to be used later in investigating causes of failure of Tana Beles weir, the following
studies are presented below after a simple review on their methodology used, result adopted and
recommendation, if any given by the author.
2.4.1.1 Performance Assessment of Fentalle head work, Ethiopia
The first thesis reviewed for this research is performance assessment of Fentale diversion head
Headwork (Fikru, 2015).
Fantale Irrigation Based Integrated Development Project is located on Awash River at about 50km
south west of Metehara town with a total command area of 27,000 hectares. The total water way
(four bays of the under sluice each 2.7m wide, three piers each 1.5m thick, one divide wall 2m
thick, width of un gated weir 128m) is 145.3m. Provided depth under sluice upstream cutoff and
downstream cutoff is 3.8m and 4.5m respectively. Depth of weir upstream cutoff and downstream
cutoff is 4.5m and 5.5m respectively. The under sluice sill level is 1173.1m (lowest river bed level
at the weir axis).
It has problems in regulating the supply of water in to the canal, in controlling entry of silt in to
the canal, and in controlling the fluctuation of water level in the river during different seasons. In
addition problem of sedimentation in and around the intake works is prevalent.
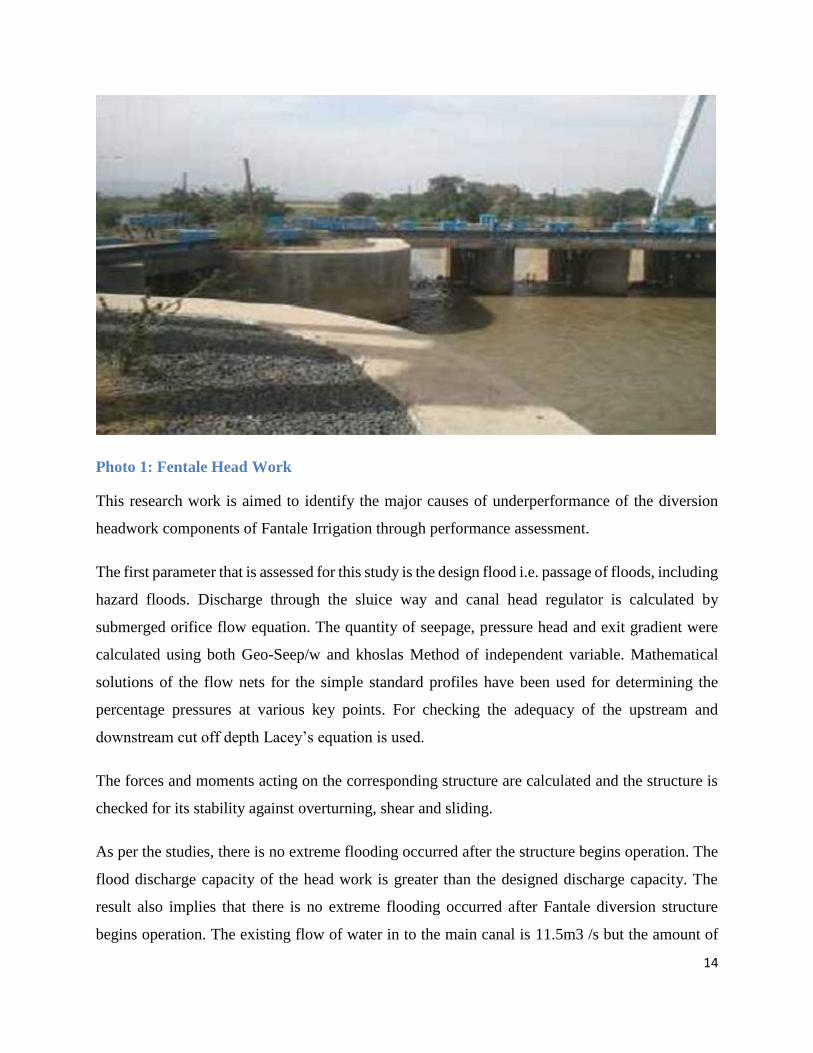
14
Photo 1: Fentale Head Work
This research work is aimed to identify the major causes of underperformance of the diversion
headwork components of Fantale Irrigation through performance assessment.
The first parameter that is assessed for this study is the design flood i.e. passage of floods, including
hazard floods. Discharge through the sluice way and canal head regulator is calculated by
submerged orifice flow equation. The quantity of seepage, pressure head and exit gradient were
calculated using both Geo-Seep/w and khoslas Method of independent variable. Mathematical
solutions of the flow nets for the simple standard profiles have been used for determining the
percentage pressures at various key points. For checking the adequacy of the upstream and
downstream cut off depth Lacey’s equation is used.
The forces and moments acting on the corresponding structure are calculated and the structure is
checked for its stability against overturning, shear and sliding.
As per the studies, there is no extreme flooding occurred after the structure begins operation. The
flood discharge capacity of the head work is greater than the designed discharge capacity. The
result also implies that there is no extreme flooding occurred after Fantale diversion structure
begins operation. The existing flow of water in to the main canal is 11.5m3 /s but the amount of

15
water required to be diverted to the main canal is 18m3 /s. This implies that there is a shortage of
water by an amount 6.5 m3/s to meet the demand of the command area. The above result is the
consequence of malfunctioning of the gates. To achieve the required 18m3/s discharge the two
gates should have to be opened by an amount 0.78m or one gate should have to be opened by an
amount 1.565m. But gates provided both on the under sluice and canal head regulator are not
functioning because of incomplete construction procedure and failure.
On the other side, The designed under sluice sill level that is the lowest river bed level at the weir
axis was 1173.10m but the existing under sluice level is raised to a level of 1174 i.e. about 0.9m
depth sediment deposited at the back of head regulator.
By using value of discharge intensity per unit width that is 4.75 for under sluice and 1.7 for the
weir portion. The calculated values of the cutoff depth are 3.76m and 2.95m for the under sluice
and weir portion respectively. There is not likely to be any appreciable scour on the downstream
of the under sluice bays and weir portion, no extra protection is therefore, provided on the upstream
and downstream side.
There is no lifting up of the structures heel and the structure is not susceptible to any tension on
the base. The diversion structure is safe against shear and sliding both for worst condition and
existing situation on the site at the time of investigation.
Henok Fikru finally recommends: Complete control on the river discharge is required with proper
regulation area in front of the headwork. This can be achieved by providing a barrage than the
weir, which is actually provided on the site. The gates should have to be repaired or changed to
mechanical operating system and trash racks should have to be provided for a good performance
of the head work. The design should consider transporting capacity of the design flow to prevent
the weir and especially sluice gates from damage.
2.4.2 Studies outside of Ethiopia
Reviewing study related to weir failure investigation made by foreign author is good and this will
help to know professional foreign engineers procedure and methodologies adopted in investigating
those failure causes. Out of those weirs, a study made on Singapore weir failure is discussed below
(Sharma, 2017)

16
2.4.2.1 Studies on Failure of Downstream Block Protection of Singapore Weir
The Singapore weir was constructed across the Tapi River in 1995 between Singapore village and
Rander, Surat (Gujarat). It was designed for a design discharge of 50-year return period of 24,000
m3/s.
The weir was constructed by Surat Municipal Corporation (SMC) for two purposes, namely
a) To provide a standing pool of water over infiltration wells of Varachha water works and
b) To provide a surface and sub-surface barrier to prevent tidal water from entering into
infiltration well areas.
The weir is divided into three spans,
I. Un gated weir first span from Ch. 40 to 310 m,
II. Un gated weir second span from Ch. 310 to 522 m, and
III. Gated under sluice third span from Ch. 522 to 620 m.
Ever since its construction, recurring damages were observed in the first span (Ch. 40–310 m) of
the weir. Further, significant damages were reported during recent floods in the years 2013 and
2014, wherein substantial scouring and settlement of the concrete blocks were observed, which
eventually posed a threat to the main structure of the weir.
The severe nature of settlement was reported in the first span (Ch.40–310 m) of the cement
concrete blocks, and failure of toe wall resulted in gully or channel formation.in addition to this,
there is significant scouring downstream and the heavy concrete blocks were dislodged from their
mean position on account of enormous disturbance (velocity) in the flow.
The investigation was made to ascertain the causes of failure of the first span of the weir as it
serves as the only source of freshwater for citizens of Surat city. The study investigates the likely
causes of the failure/disturbance of downstream block protection of the first span (Ch. 40–310 m)
of the weir through detailed hydraulic analyses. The detailed hydraulic analyses for existing weir
portion for the first span (Ch. 40–310 m) have been carried out at different discharge conditions
and investigated the likely causes of damage to the downstream concrete block and launching
apron.
From the detailed hydraulic jump analyses, it is observed that for discharges greater than 4000
m3/s, the hydraulic jump formation takes place within the concrete floor due to sufficiency of tail

17
water depth. However, at lower discharges (<4000 m3/s), the available tail water depth is not
enough for the formation of the jump within the concrete floor. as discharge reduces, the hydraulic
jump formation does not take place at the toe of weir and gets shifted further downstream, i.e., for
discharges less than 4000 m3/s, it is found that the jump gets shifted from concrete floor to the
block protection and further downstream in the river bed. Due to this, the energy dissipation does
not take place on the concrete floor, and thus, there is scouring of the soil underneath the concrete
blocks
Further, the toe wall was found broken due to flow concentration in the gully or channel .Also the
loose stone protection exhibited substantial settlement due to scouring of soil under the protection
work. If the foregoing condition persists for a longer duration, it would result in severe degradation
immediately downstream of the weir. It is also found that 60% of time the discharge was observed
to be less than 4000 m3/s during the flood of 2013, wherein significant damage was reported to
the weir. Thus, the analysis of hydraulic jumps on existing geometry of weir for Ch. 40–310 m
indicated the persistence of repelled hydraulic jump condition at lower discharges (deficient tail
water condition) which was the major reason for dislodging and settlement of downstream concrete
block and loose stone protection of the weir
The following key conclusions can be summarized on the basis of study undertaken in the paper:
i. The analysis of hydraulic jump for the first span of Singapore weir (Ch. 40–310 m) revealed
that, for lower discharges, i.e. less than 4000 m3/s there was shifting of hydraulic jump in the
downstream of concrete floor. At discharge 2000 m3/s, there is a significant shifting of jump,
even beyond the loose stone protection. The shifting of hydraulic jump for lower discharges is
due to deficient tail water condition in the river under these discharges. The formation of
hydraulic jump on launching apron/concrete block at lower discharges is the prime reason for
failure of protection works.
ii. The observation of previous flow data for the year 2013 validates the findings in the present
investigation. The observed data statistics revealed that 60% of time the discharge was
observed to be less than 4000 m3/s (which is the critical limit for the formation of hydraulic
jump within the concrete floor).Hence, the persistence of low discharges over the weir for a
longer time would be the possible cause of maximum damage of downstream concrete blocks
and protection works.

18
As it was illustrated above the thesis work by Henok Fikru did not incorporate hydrologic,
hydraulic and structural design analysis of the head work which will further help in reviewing the
respective designs.
On the other side the procedure used for identifying the causes of failure of Singapore Weir is
more specific to hydraulic jump analysis and energy dissipation.
Finally I decided to separate and select the best methodology part from the two and use it in my
own thesis. Accordingly, evaluation and analysis of Geotechnical, hydrologic, hydraulic and
structural design of the weir is a must to be incorporated in my methodology and further site
investigation will also help me to check the site condition in detail.

19
3 Method and Material
3.1 Study Area
Tana Beles Integrated Sugar Development Project is located near Fendika Town, capital of Jawi
Woreda, found in the western periphery of Amhara National Regional State (ANRS), 145 km from
Bahir Dar. The project covers about 57,614 ha of land situated at Upper Ayma and Upper Beles
mainly emphasized on 38,334 ha of land placed at Right side of Beles River (Enterprise, Feasibility
and Design Study of Tana Beles Integrated Sugar Development Project Irrigation and Drainage
Report, 2013).
The project overall includes a total area of about 95,948 ha of land found in Jawi woreda of Amhara
and Dangur woreda of Benishangul National Regional States. The study area has low to medium
relief differences with an altitude range of 806 to 1242 meters above sea level. The Upper Beles
(Right side) irrigation command area has an altitude ranged from 962 to 1,242 m.a.s.l, which is
characterized by flat topography (plain land),whereas the Upper Ayma irrigation command area is
between 806 to 1154 m.a.s.l, mainly characterized by undulating topography (Enterprise,
Feasibility and Design Study of Tana Beles Integrated Sugar Development Project Irrigation and
Drainage Report, 2013).
The Project is proposed to grow sugarcane in a total of about 50,000 ha for the two sugar factories
to be established at Upper Beles and Upper Ayma sites. To grow sugar cane in a total of 50000 ha,
60 m3/s of water is proposed to be diverted from Upper Beles River in to the main canal. For
diverting 60 m3/s of water, a diversion head works has been constructed on the Upper Beles River
at a distance of about 28 km from Fendika town. The diversion head work comprises of a weir,
under sluices and a head regulator. (Enterprise, Feasibility and Design Study of Tana Beles
Integrated Sugar Development Project Head Work Design Report, 2011)
The project under this study is Sugar Cane development schemes by diverting the available water
in Beles catchment and additional release of water through the Beles hydropower turbine which
will transfer more than 77 m³/s of water from the Lake Tana to Beles head water system. It is large-
scale irrigation project designed and constructed by Amhara Design Supervision Works Enterprise
and Amhara Water Works Construction Enterprise respectively.

20
3.2 Description of TanaBeles Diversion Head-work
The diversion weir for Tana Beles Integrated sugar Development Project is located at Beles River
at about 28 km from Jawi / Fendika. Geographically the weir is located at 247847.76 Easting and
1289961.39 Northing (Enterprise, Feasibility and Design Study of Tana Beles Integrated Sugar
Development Project Head Work Design Report, 2011) as shown on the figure below.

21
Figure 2 Geographical Location of TanaBeles Weir
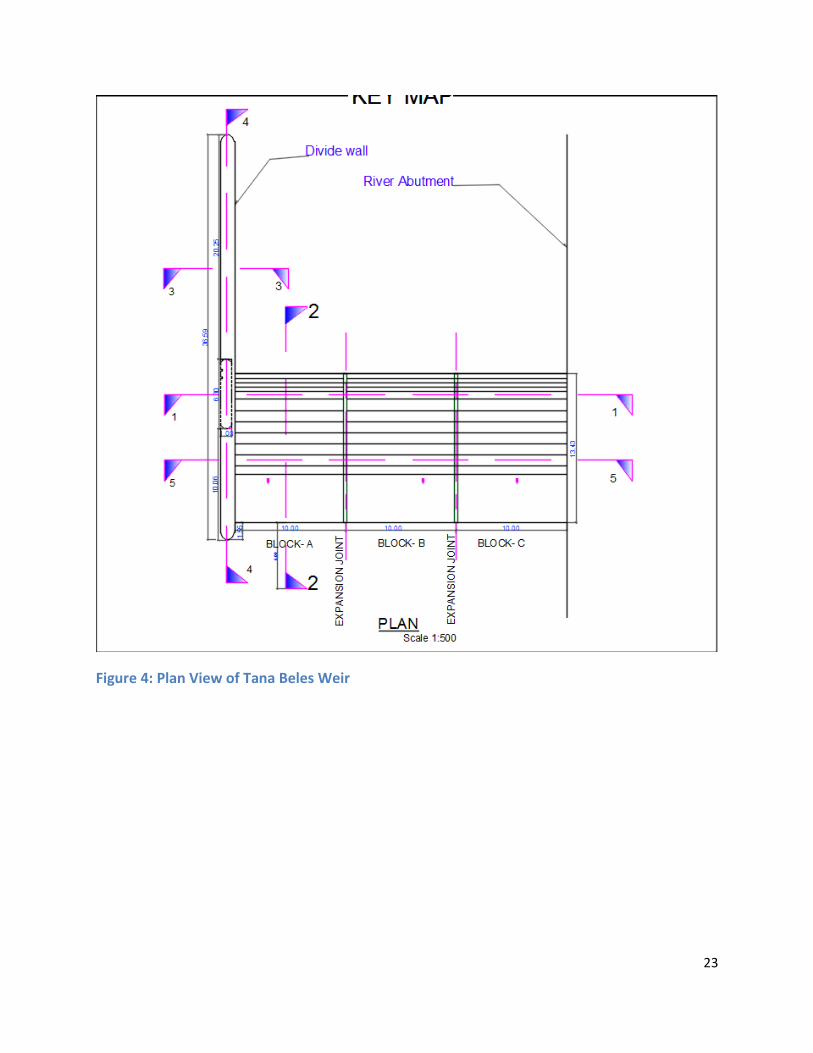
The main features of Tana Beles Irrigation diversion head work are weir, under sluices, divide
wall, and canal head regulator. The total water way (three bays of the under sluice each 3.3 m
wide, two piers each 1m thick, one divide wall 1.3m thick, width of ungated weir 30m) is 39.9m.

22
Figure 3: Plan View of Tana Beles Headwork
23
Figure 4: Plan View of Tana Beles Weir
24
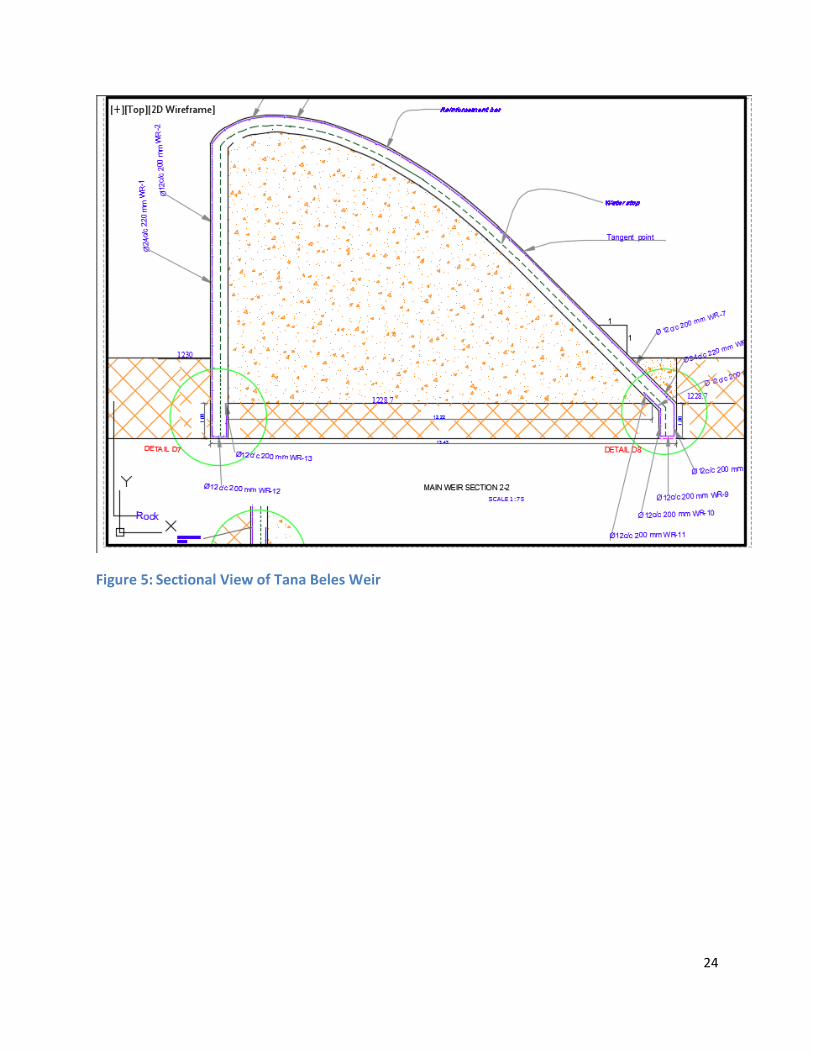
Figure 5: Sectional View of Tana Beles Weir
25
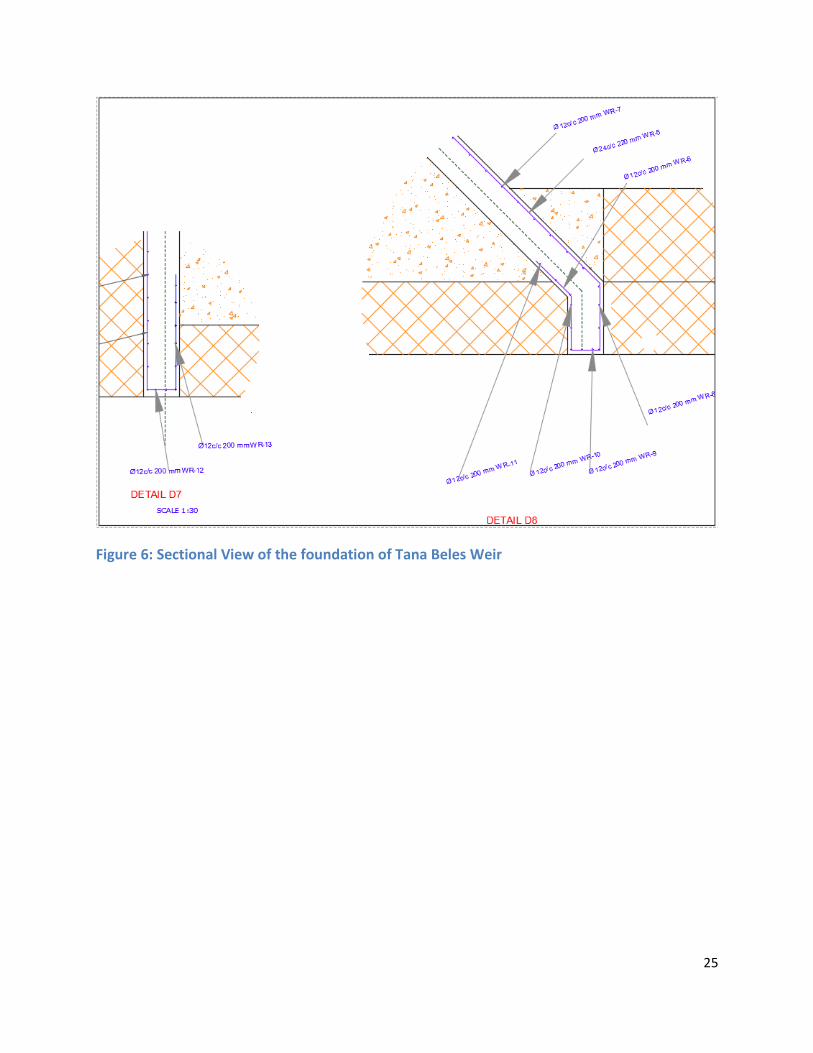
Figure 6: Sectional View of the foundation of Tana Beles Weir
26
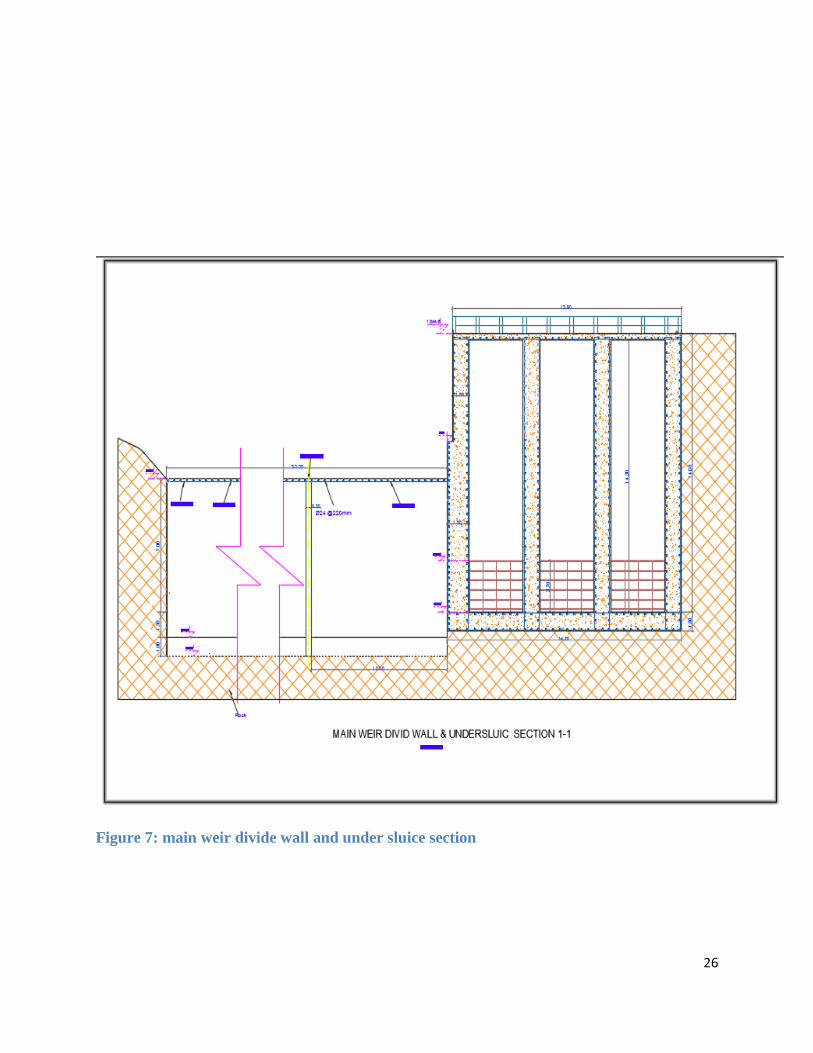
Figure 7: main weir divide wall and under sluice section
27
The total length of under sluice and weir part is 43.2m. Provided depth under sluice upstream
cutoff and downstream cutoff is 3.8m and 4.5m respectively.
Weir:
Length of the weir 30 m
Crest level of the weir 1235.80 mamsl
Type of weir Ogee Type
Slope of upstream face vertical
Slope of the downstream face 1:1
Design (1 in 100) flood discharge 1033 m3/sec
High flood level in the river 1236.57mamsl
Affluxed HFL/ Upstream HFL 1241.27mamsl
Bed Level of the river 1228.80 mamsl
Under- Sluice Bays:
Clear waterway (3 bays of 3.3 m each) 9.9 m
RCC piers 2nos each 1 m thick 2.0 m
over all water way 11.9 m
Crest level of the under sluice 1228.80
Thickness of the Divide wall 1.3 m
Total length of weir and under sluices 43.2 m
Gates: 3.3x2.7 m electrically operated vertical lift gates 3 in number.
28
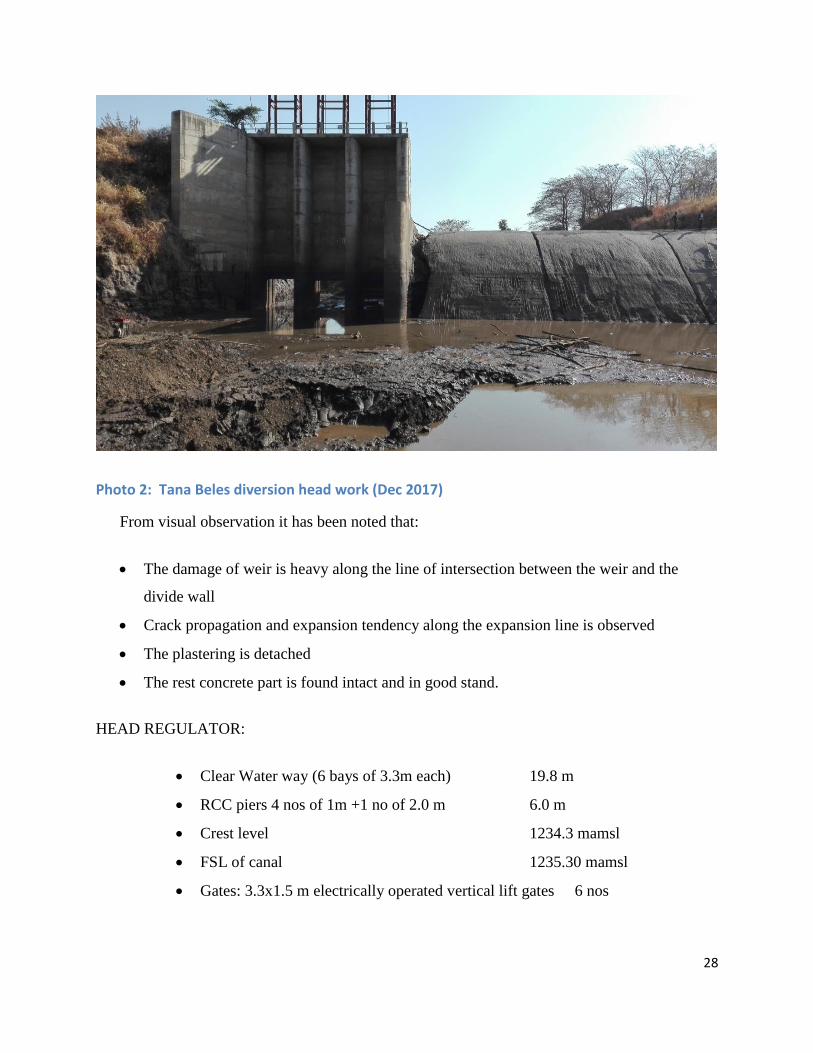
Photo 2: Tana Beles diversion head work (Dec 2017)
From visual observation it has been noted that:
The damage of weir is heavy along the line of intersection between the weir and the
divide wall
Crack propagation and expansion tendency along the expansion line is observed
The plastering is detached
The rest concrete part is found intact and in good stand.
HEAD REGULATOR:
Clear Water way (6 bays of 3.3m each) 19.8 m
RCC piers 4 nos of 1m +1 no of 2.0 m 6.0 m
Crest level 1234.3 mamsl
FSL of canal 1235.30 mamsl
Gates: 3.3x1.5 m electrically operated vertical lift gates 6 nos

29
Photo 3: Under-sluice and canal head regulator of Tana Beles irrigation development project
(Dec, 2017)
3.2.1 Operation methodology
The profile of the ogee (weir crest) is designed for the design head. The design head is generally
chosen to give the maximum practical hydraulic efficiency, in keeping with the operational
requirements, stability and economy. If the actual head is less than the design head, the pressure
on the crest will be positive (i.e. above atmospheric). However, for the actual heads greater than
the design head, the pressure on the crest will be negative (i.e. less than the atmospheric pressure)
and it may lead to cavitation. (Enterprise, Feasibility and Design Study of Tana Beles Integrated
Sugar Development Project Head Work Design Report, 2011)
To avoid any possibility of negative pressures on the crest, the ogee crest has been designed for a
design head in the condition, when the under sluices are inoperative and whole of the design flood
passes over the weir crest only (rarest of rare case).
The openings of the under sluice are provided with adjustable gates. Normally, the gates are kept
closed. The suspended silt goes on depositing in front of the canal head regulator. When the silt
deposition becomes appreciable the gates are opened and the deposited silt will move away. The

30
muddy water flows towards the downstream through the scouring sluices so the gates closed. But,
at the period of flood, the gates are kept opened.
In case of Tana Beles diversion headwork, out of the three bays of the under sluice two of them
were fully closed and cannot be opened freely due to malfunctioning of gate. The rest one was
opened by force but cannot be closed. Hence, Efficient flushing of the sediment from the under
sluice pocket is not ensured.
3.3 Methodology, Data collection and analysis
The methodologies to attain the objectives are described below:
Data collection
Data analysis
Peak discharge estimation
Evaluation of the actual foundation condition
Evaluation of the hydraulic design
Evaluation of the structural design
Recommend remedial design
3.3.1 Data Collection
The consultant on the project site, field measurements and observations are the primary sources of
data for the study. In order to achieve the objectives of the study secondary data is also used. These
data are obtained from the Ministry of Water, Irrigation and Electricity, Amhara design and
supervision work enterprise and Ethiopian Meteorological Agency. In addition to these literatures,
different project documents or proposals, project evaluation and completion reports are also
refereed.
On first stage previous studies, documents and papers related to diversion headwork have been
revised and desk study have been undertaken to identify the key issues. Accordingly, the available
relevant data on existing headwork is important to be collected from the concerned department.
Field visit surveys have been conducted for gathering out of data for the purpose of describing the
nature of existing conditions and to compare existing conditions with the design standard of the
diversion headwork. To assess the operation and functionality of constructed diversion head works
as well as operations of each component parts of the head work, field visit survey coupled with

31
primary data obtained by interviewing administrative officials at the project site have been
conducted. The secondary data’s are also collected from Amhara Design and Supervision Works
Enterprise design reports.
For the hydraulic and structural analysis of the head work, the survey data’s collected were of the
river cross section, upstream and downstream elevation of the headwork’s. Therefore these sets of
data’s were used for the hydraulic and structural analysis of the previously proposed design by the
consultant of the project.
3.3.1.1 Primary data collection
Field observation at Tana Beles Sugar Development project was made to identify where different
parameters of the head-work must be taken. Necessary Dimensions of the head work and related
data of the project were taken in collaboration with Amhara Design and Supervision Work
Enterprise workers. Surveying data upstream and downstream of the weir was also collected with
the help of Amhara Design and Supervision Work Enterprise workers.
3.3.1.2 Secondary data collection
Secondary data used for this research were collected from responsible bodies and officials. These
data include hydrology data, geological data, GIS data and design report of the headwork
components for the project. In general the design report was also revised to get some insight in to
the head work components and these help in identifying the sensitive parameters for the problems
on the head work.
3.3.2 Data Analysis
Ten or more stations with installation period going as far as 1950 can be identified in and around
the basin. It is not always easy to get data for all stations listed in the NMA list of stations.
However, the required rainfall data is collected from Ethiopian ministry of Electric, Energy and
Irrigation. The weir site is the place where the peak flood could be determined and it is known that
the weir site is ungauged.as a method before determining the peak flood at the ungauged station it
is necessary calibrate the gauged station, therefore the data analysis incorporate the rainfall
analysis at the gauged and ungauged station.

32
3.3.2.1 Rainfall analysis of main beles gauging station
The following three stations are selected for rainfall runoff analysis of the large gauged watershed
based on thiessen polygon and as it is shown on the figure the project area rainfall is represented
mostly by mandura, Bahir Dar and Pawe respectively. The Table below provides the list of stations
used in the rainfall runoff analysis of main beles at bridge.
Table 1: List of Rainfall station used for main beles
No Station
name
Latitude Longitude Altitude Data used Remark
1 Bahir Dar 11.36 37.24 1770 1980-2015
2 Mandura 11.07 36.25 1290 1980-2015
3 Pawe 11.09 36.23 1200 1980-2015
The three stations are selected based on thiessen polygon and as it is shown on the figure the project
area rainfall is represented mostly by mandura, Bahir Dar and Pawe respectively.
33
Figure 8: Thiessen Polygon for Main Beles at Bridge
Table 2: Rainfall analysis of main beles guaging station
24 Hr Duration Max. Rain fall(mm)
Year
24hr duration Max.
annual ppt (mm) Assending Y-logr
1985 54.74
85.12 1.93003
1986 52.08
81.36 1.91039
1987 47.05
67.63 1.83016
1988 58.95
64.86 1.81199
1989 67.63
62.39 1.79515
1990 49.79
58.95 1.77051
1991 54.22
54.74 1.73831
1992 50.16
54.39 1.73548
1993 37.88
54.22 1.73413
34
1994 52.93
53.21 1.72603
1995 62.39
52.99 1.72418
1996 52.99
52.93 1.72374
1997 81.36
52.08 1.71671
1998 50.29
50.87 1.70650
1999 37.10
50.59 1.70404
2000 49.75
50.29 1.70148
2001 50.59
50.16 1.70033
2002 42.17
50.01 1.69907
2003 54.39
49.79 1.69710
2004 47.02
49.75 1.69676
2005 47.18
47.18 1.67375
2006 42.96
47.05 1.67254
2007 38.74
47.02 1.67228
2008 53.21
46.31 1.66567
2009 50.87
42.96 1.63309
2010 50.01
42.17 1.62503
2011 35.02
38.74 1.58814
2012 46.31
37.95 1.57926
2013 64.86
37.88 1.57843
2014 85.12
37.10 1.56933
2015 37.95
35.02 1.54426
35
ave 51.80 51.80 1.70
Stan deva 11.45 11.45 0.09
Cs 0.543
K 0.091
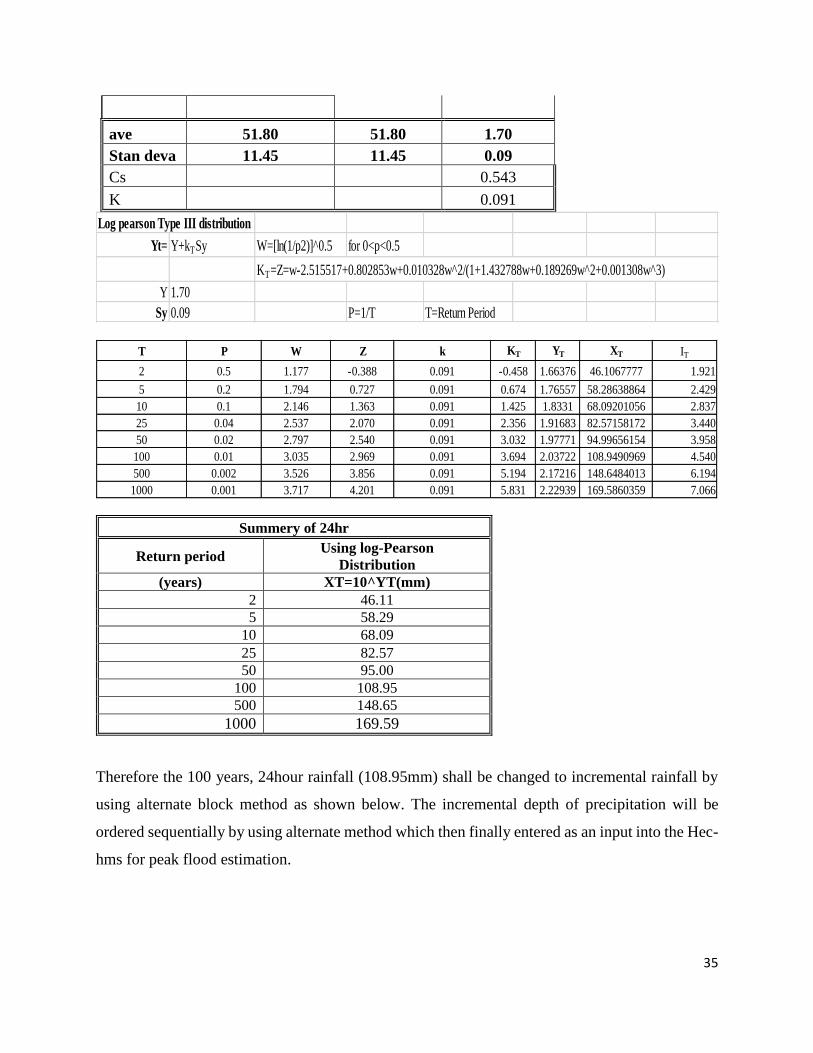
Summery of 24hr
Return period Using log-Pearson
Distribution
(years) XT=10^YT(mm)
2 46.11
5 58.29
10 68.09
25 82.57
50 95.00
100 108.95
500 148.65
1000 169.59
Therefore the 100 years, 24hour rainfall (108.95mm) shall be changed to incremental rainfall by
using alternate block method as shown below. The incremental depth of precipitation will be
ordered sequentially by using alternate method which then finally entered as an input into the Hec-
hms for peak flood estimation.
Log pearson Type III distribution
Yt= Y+kTSy W=[ln(1/p2)]^0.5 for 0<p<0.5
KT=Z=w-2.515517+0.802853w+0.010328w^2/(1+1.432788w+0.189269w^2+0.001308w^3)
Y 1.70
Sy 0.09 P=1/T T=Return Period
T P W Z k KT YT XT IT
2 0.5 1.177 -0.388 0.091 -0.458 1.66376 46.1067777 1.921
5 0.2 1.794 0.727 0.091 0.674 1.76557 58.28638864 2.429
10 0.1 2.146 1.363 0.091 1.425 1.8331 68.09201056 2.837
25 0.04 2.537 2.070 0.091 2.356 1.91683 82.57158172 3.440
50 0.02 2.797 2.540 0.091 3.032 1.97771 94.99656154 3.958
100 0.01 3.035 2.969 0.091 3.694 2.03722 108.9490969 4.540
500 0.002 3.526 3.856 0.091 5.194 2.17216 148.6484013 6.194
1000 0.001 3.717 4.201 0.091 5.831 2.22939 169.5860359 7.066
36
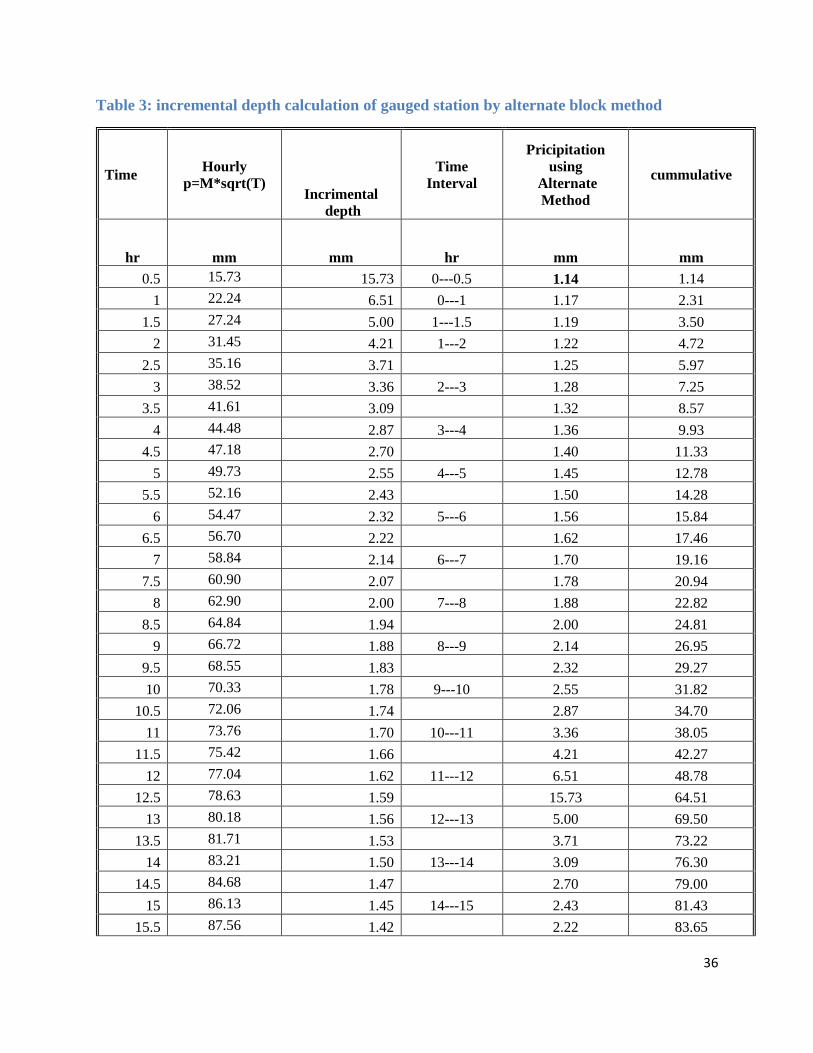
Table 3: incremental depth calculation of gauged station by alternate block method
Time Hourly
p=M*sqrt(T) Incrimental
depth
Time
Interval
Pricipitation
using
Alternate
Method
cummulative
hr mm mm hr mm mm
0.5 15.73 15.73 0---0.5 1.14 1.14
1 22.24 6.51 0---1 1.17 2.31
1.5 27.24 5.00 1---1.5 1.19 3.50
2 31.45 4.21 1---2 1.22 4.72
2.5 35.16 3.71 1.25 5.97
3 38.52 3.36 2---3 1.28 7.25
3.5 41.61 3.09 1.32 8.57
4 44.48 2.87 3---4 1.36 9.93
4.5 47.18 2.70 1.40 11.33
5 49.73 2.55 4---5 1.45 12.78
5.5 52.16 2.43 1.50 14.28
6 54.47 2.32 5---6 1.56 15.84
6.5 56.70 2.22 1.62 17.46
7 58.84 2.14 6---7 1.70 19.16
7.5 60.90 2.07 1.78 20.94
8 62.90 2.00 7---8 1.88 22.82
8.5 64.84 1.94 2.00 24.81
9 66.72 1.88 8---9 2.14 26.95
9.5 68.55 1.83 2.32 29.27
10 70.33 1.78 9---10 2.55 31.82
10.5 72.06 1.74 2.87 34.70
11 73.76 1.70 10---11 3.36 38.05
11.5 75.42 1.66 4.21 42.27
12 77.04 1.62 11---12 6.51 48.78
12.5 78.63 1.59 15.73 64.51
13 80.18 1.56 12---13 5.00 69.50
13.5 81.71 1.53 3.71 73.22
14 83.21 1.50 13---14 3.09 76.30
14.5 84.68 1.47 2.70 79.00
15 86.13 1.45 14---15 2.43 81.43
15.5 87.56 1.42 2.22 83.65
37
16 88.96 1.40 15---16 2.07 85.72
16.5 90.34 1.38 1.94 87.65
17 91.69 1.36 16---17 1.83 89.48
17.5 93.03 1.34 1.74 91.22
18 94.35 1.32 17---18 1.66 92.88
18.5 95.65 1.30 1.59 94.46
19 96.94 1.28 18---19 1.53 95.99
19.5 98.21 1.27 1.47 97.47
20 99.46 1.25 19---20 1.42 98.89
20.5 100.69 1.24 1.38 100.27
21 101.91 1.22 20---21 1.34 101.61
21.5 103.12 1.21 1.30 102.91
22 104.31 1.19 21---22 1.27 104.18
22.5 105.49 1.18 1.24 105.41
23 106.66 1.17 22---23 1.21 106.62
23.5 107.81 1.15 1.18 107.80
24 108.95 1.14 23---24 1.15 108.95
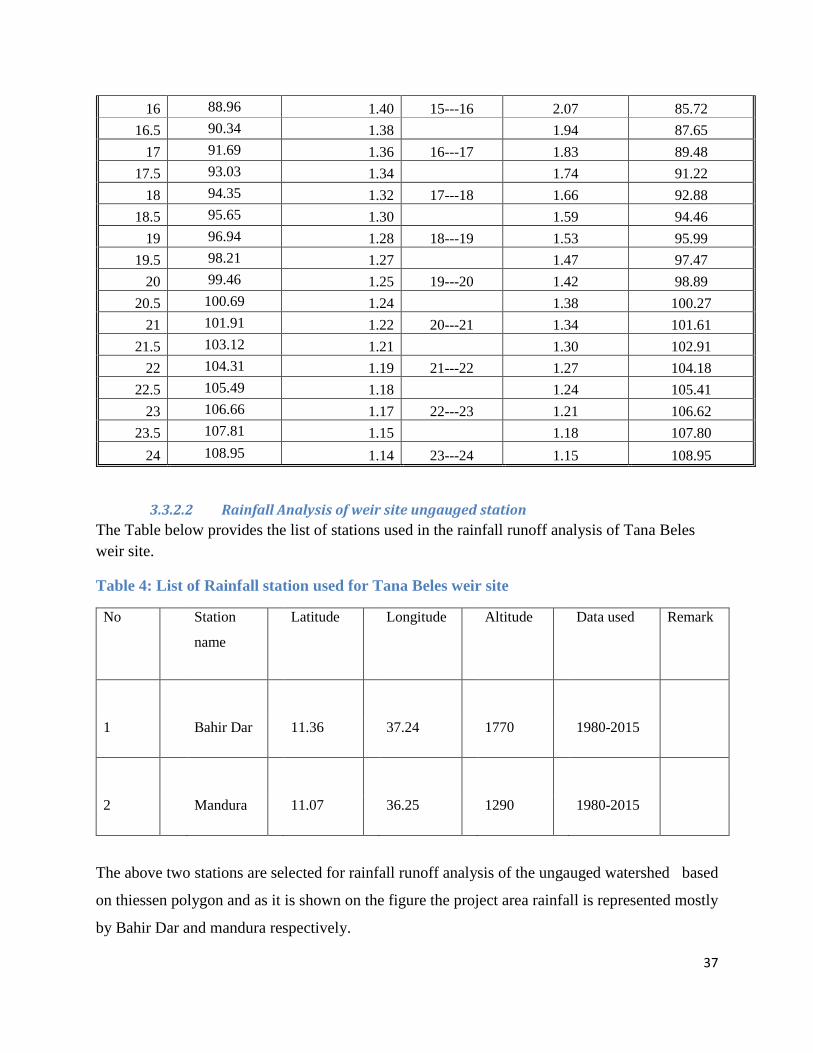
3.3.2.2 Rainfall Analysis of weir site ungauged station
The Table below provides the list of stations used in the rainfall runoff analysis of Tana Beles
weir site.
Table 4: List of Rainfall station used for Tana Beles weir site
No Station
name
Latitude Longitude Altitude Data used Remark
1 Bahir Dar 11.36 37.24 1770 1980-2015
2 Mandura 11.07 36.25 1290 1980-2015
The above two stations are selected for rainfall runoff analysis of the ungauged watershed based
on thiessen polygon and as it is shown on the figure the project area rainfall is represented mostly
by Bahir Dar and mandura respectively.
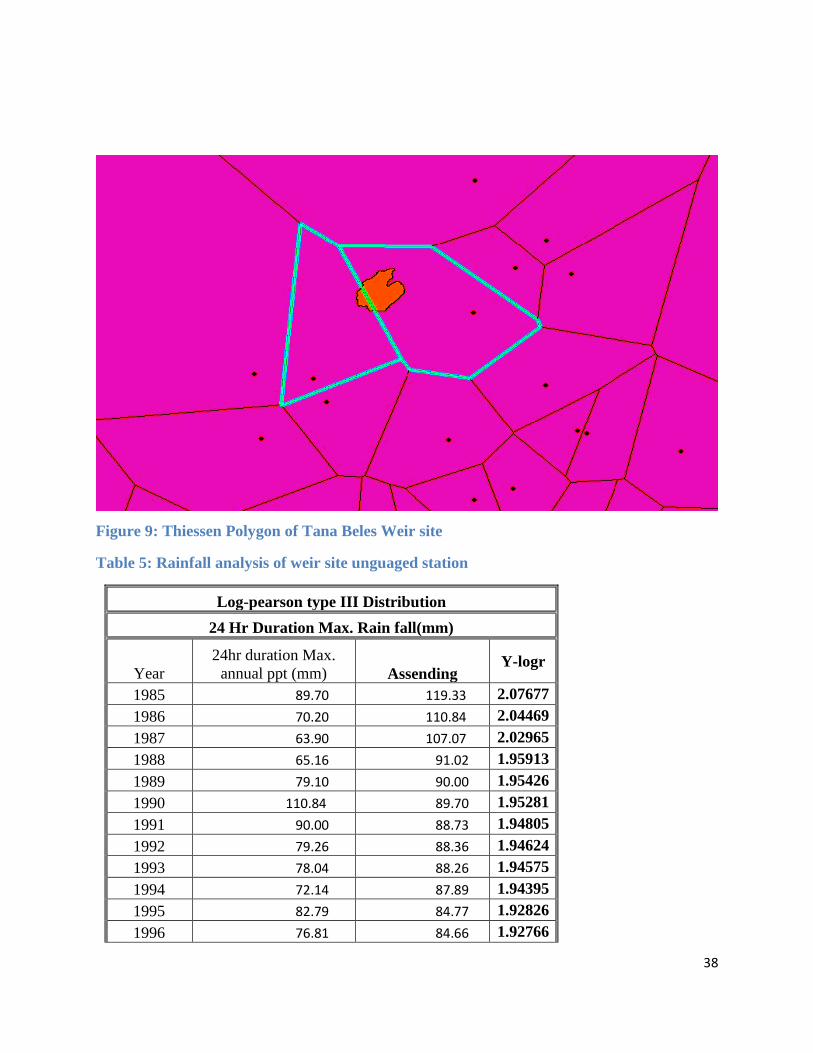
38
Figure 9: Thiessen Polygon of Tana Beles Weir site
Table 5: Rainfall analysis of weir site unguaged station
Log-pearson type III Distribution
24 Hr Duration Max. Rain fall(mm)
Year
24hr duration Max.
annual ppt (mm) Assending Y-logr
1985 89.70 119.33 2.07677
1986 70.20 110.84 2.04469
1987 63.90 107.07 2.02965
1988 65.16 91.02 1.95913
1989 79.10 90.00 1.95426
1990 110.84 89.70 1.95281
1991 90.00 88.73 1.94805
1992 79.26 88.36 1.94624
1993 78.04 88.26 1.94575
1994 72.14 87.89 1.94395
1995 82.79 84.77 1.92826
1996 76.81 84.66 1.92766

39
1997 88.36 84.13 1.92497
1998 76.87 82.79 1.91796
1999 91.02 80.36 1.90502
2000 107.07 79.55 1.90065
2001 119.33 79.26 1.89906
2002 84.66 79.10 1.89818
2003 79.55 78.04 1.89229
2004 84.13 76.87 1.88578
2005 87.89 76.84 1.88558
2006 76.84 76.81 1.88541
2007 84.77 75.10 1.87567
2008 88.26 72.14 1.85820
2009 66.61 70.20 1.84631
2010 64.49 67.37 1.82849
2011 75.10 66.61 1.82356
2012 88.73 65.16 1.81396
2013 80.36 64.49 1.80950
2014 67.37 63.90 1.80553
2015 59.11 59.11 1.77165
ave 81.56 81.56 1.91
Stan deva 13.58 13.58 0.07
Cs 0.386
K 0.064
Log pearson Type III distribution
Yt= Y+kTSy W=[ln(1/p2)]^0.5 for 0<p<0.5
KT=Z=w-2.515517+0.802853w+0.010328w^2/(1+1.432788w+0.189269w^2+0.001308w^3)
Y 1.91
Sy 0.07 P=1/T T=Return period
T P W Z k KT YT XT IT
2 0.5 1.177 -0.388 0.064 -0.439 1.87532 75.0452 3.127
5 0.2 1.794 0.727 0.064 0.691 1.95419 89.9883 3.750
10 0.1 2.146 1.363 0.064 1.410 2.00434 101.003 4.208
25 0.04 2.537 2.070 0.064 2.276 2.06473 116.074 4.836
50 0.02 2.797 2.540 0.064 2.891 2.10763 128.124 5.339
100 0.01 3.035 2.969 0.064 3.482 2.14888 140.889 5.870
500 0.002 3.526 3.856 0.064 4.792 2.24027 173.888 7.245
1000 0.001 3.717 4.201 0.064 5.337 2.27828 189.793 7.908
40
Summary of 24hr Rain fall
Return period Using log-Pearson
Distribution
(years) XT=10^YT(mm)
2 75.05
5 89.99
10 101.00
25 116.07
50 128.12
100 140.89
500 173.89
1000 189.79
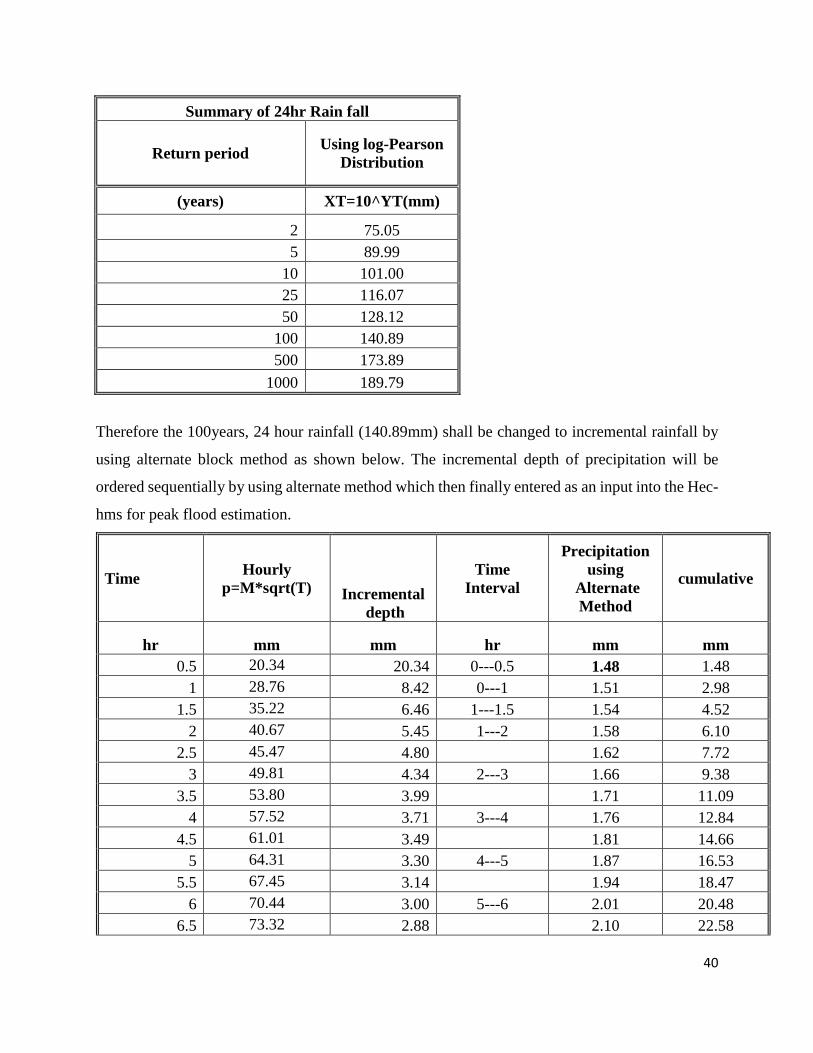
Therefore the 100years, 24 hour rainfall (140.89mm) shall be changed to incremental rainfall by
using alternate block method as shown below. The incremental depth of precipitation will be
ordered sequentially by using alternate method which then finally entered as an input into the Hec-
hms for peak flood estimation.
Time Hourly
p=M*sqrt(T) Incremental
depth
Time
Interval
Precipitation
using
Alternate
Method
cumulative
hr mm mm hr mm mm
0.5 20.34 20.34 0---0.5 1.48 1.48
1 28.76 8.42 0---1 1.51 2.98
1.5 35.22 6.46 1---1.5 1.54 4.52
2 40.67 5.45 1---2 1.58 6.10
2.5 45.47 4.80 1.62 7.72
3 49.81 4.34 2---3 1.66 9.38
3.5 53.80 3.99 1.71 11.09
4 57.52 3.71 3---4 1.76 12.84
4.5 61.01 3.49 1.81 14.66
5 64.31 3.30 4---5 1.87 16.53
5.5 67.45 3.14 1.94 18.47
6 70.44 3.00 5---6 2.01 20.48
6.5 73.32 2.88 2.10 22.58
41
7 76.09 2.77 6---7 2.19 24.77
7.5 78.76 2.67 2.30 27.07
8 81.34 2.58 7---8 2.43 29.50
8.5 83.85 2.50 2.58 32.09
9 86.28 2.43 8---9 2.77 34.86
9.5 88.64 2.36 3.00 37.85
10 90.94 2.30 9---10 3.30 41.15
10.5 93.19 2.25 3.71 44.87
11 95.38 2.19 10---11 4.34 49.21
11.5 97.53 2.14 5.45 54.66
12 99.62 2.10 11---12 8.42 63.08
12.5 101.68 2.05 20.34 83.42
13 103.69 2.01 12---13 6.46 89.88
13.5 105.67 1.98 4.80 94.68
14 107.61 1.94 13---14 3.99 98.67
14.5 109.51 1.90 3.49 102.16
15 111.38 1.87 14---15 3.14 105.30
15.5 113.22 1.84 2.88 108.18
16 115.04 1.81 15---16 2.67 110.85
16.5 116.82 1.78 2.50 113.35
17 118.58 1.76 16---17 2.36 115.71
17.5 120.31 1.73 2.25 117.96
18 122.01 1.71 17---18 2.14 120.10
18.5 123.70 1.68 2.05 122.16
19 125.36 1.66 18---19 1.98 124.13
19.5 127.00 1.64 1.90 126.04
20 128.61 1.62 19---20 1.84 127.88
20.5 130.21 1.60 1.78 129.66
21 131.79 1.58 20---21 1.73 131.39
21.5 133.35 1.56 1.68 133.08
22 134.89 1.54 21---22 1.64 134.72
22.5 136.41 1.52 1.60 136.31
23 137.92 1.51 22---23 1.56 137.87
23.5 139.41 1.49 1.52 139.40
24 140.89 1.48 23---24 1.49 140.89
The rainfall pattern in this part of Abay basin is distinctively uni-modal with peak rainfall located
in the July-August months. It appears the southern stations peak is located in August (such as
42
Pawe), while the peaks of the stations located north of the weir are in July (Bahir dar) (see Table3
and Figure 14). The mean annual rainfall around the irrigation scheme is represented by Pawe
station with mean annual rainfall of 1576 mm with the low variability during the wet season (CV
less than 0.3).
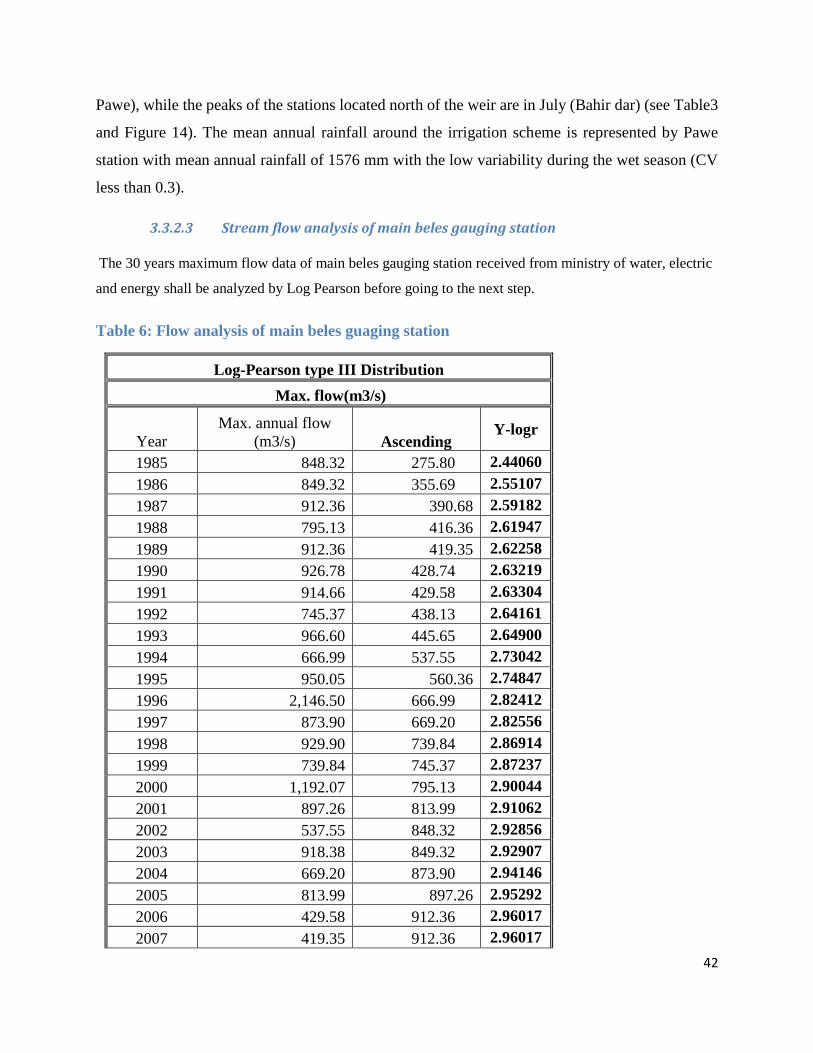
3.3.2.3 Stream flow analysis of main beles gauging station
The 30 years maximum flow data of main beles gauging station received from ministry of water, electric
and energy shall be analyzed by Log Pearson before going to the next step.
Table 6: Flow analysis of main beles guaging station
Log-Pearson type III Distribution
Max. flow(m3/s)
Year
Max. annual flow
(m3/s) Ascending Y-logr
1985 848.32 275.80 2.44060
1986 849.32 355.69 2.55107
1987 912.36 390.68 2.59182
1988 795.13 416.36 2.61947
1989 912.36 419.35 2.62258
1990 926.78 428.74 2.63219
1991 914.66 429.58 2.63304
1992 745.37 438.13 2.64161
1993 966.60 445.65 2.64900
1994 666.99 537.55 2.73042
1995 950.05 560.36 2.74847
1996 2,146.50 666.99 2.82412
1997 873.90 669.20 2.82556
1998 929.90 739.84 2.86914
1999 739.84 745.37 2.87237
2000 1,192.07 795.13 2.90044
2001 897.26 813.99 2.91062
2002 537.55 848.32 2.92856
2003 918.38 849.32 2.92907
2004 669.20 873.90 2.94146
2005 813.99 897.26 2.95292
2006 429.58 912.36 2.96017
2007 419.35 912.36 2.96017

43
2008 438.13 914.66 2.96126
2009 416.36 918.38 2.96302
2010 428.74 926.78 2.96698
2011 275.80 929.90 2.96843
2012 445.65 950.05 2.97775
2013 355.69 966.60 2.98525
2014 390.68 1,192.07 3.07630
2015 560.36 2,146.50 3.33173
ave 753.77 753.77 2.84
Stan deva 350.58 350.58 0.19
Cs 0.013
K 0.002
T P W Z k KT YT XT
2 0.5 1.177410023
-
0.38796883 0.002132544 -0.390 2.76428 581.142
5 0.2 1.794122578 0.72696149 0.002132544 0.726 2.97415 942.212
10 0.1 2.145966026 1.36293488 0.002132544 1.365 3.09431 1242.53
25 0.04 2.537272482 2.0701292 0.002132544 2.077 3.2283 1691.62
50 0.02 2.797149623 2.53973159 0.002132544 2.551 3.31751 2077.33
100 0.01 3.034854259 2.9692241 0.002132544 2.986 3.39924 2507.51
Summary of 24hr
Return
period
Using log-
Pearson
Distribution
(years) XT=10^YT(m3/s)
2 581.14
5 942.21
10 1242.53
25 1691.62
50 2077.33
100 2507.51
Log pearson Type III distribution
Yt=Y+kTSy W=[ln(1/p2)]^0.5 for 0<p<0.5 P=1/T,T is return period
KT=Z=w-2.515517+0.802853w+0.010328w^2/(1+1.432788w+0.189269w^2+0.001308w^3)
Y 2.84
Sy 0.19
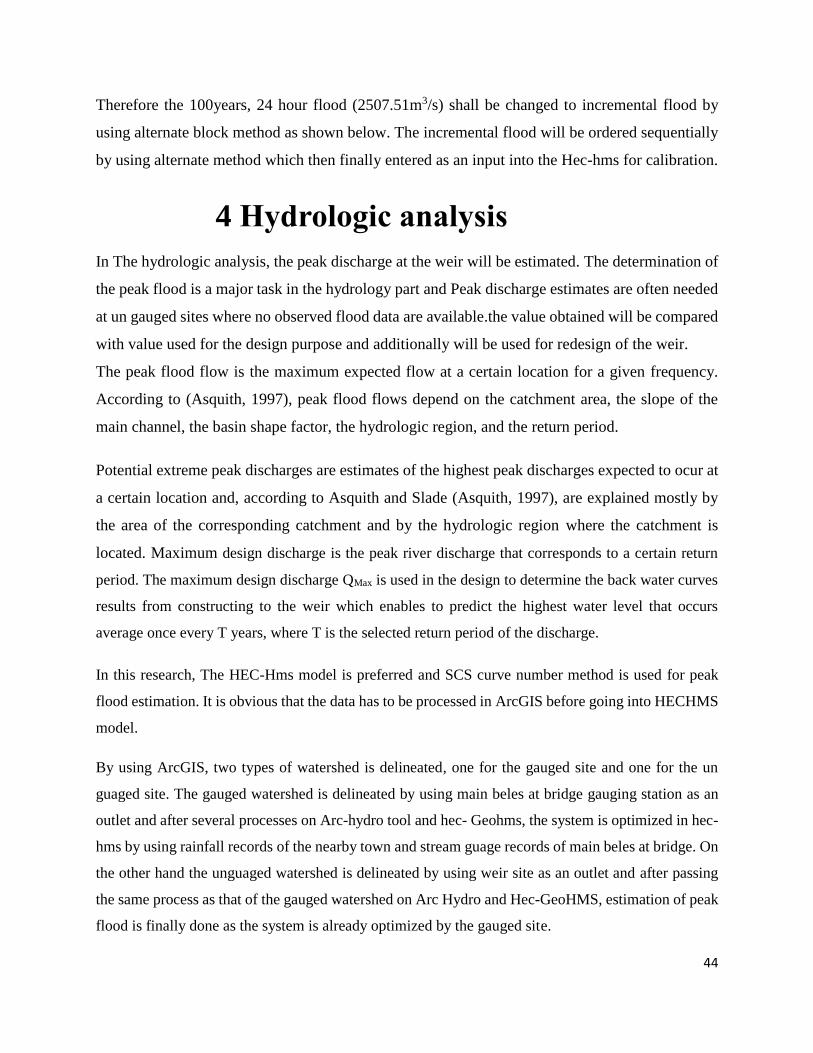
44
Therefore the 100years, 24 hour flood (2507.51m3/s) shall be changed to incremental flood by
using alternate block method as shown below. The incremental flood will be ordered sequentially
by using alternate method which then finally entered as an input into the Hec-hms for calibration.
4 Hydrologic analysis
In The hydrologic analysis, the peak discharge at the weir will be estimated. The determination of
the peak flood is a major task in the hydrology part and Peak discharge estimates are often needed
at un gauged sites where no observed flood data are available.the value obtained will be compared
with value used for the design purpose and additionally will be used for redesign of the weir.
The peak flood flow is the maximum expected flow at a certain location for a given frequency.
According to (Asquith, 1997), peak flood flows depend on the catchment area, the slope of the
main channel, the basin shape factor, the hydrologic region, and the return period.
Potential extreme peak discharges are estimates of the highest peak discharges expected to ocur at
a certain location and, according to Asquith and Slade (Asquith, 1997), are explained mostly by
the area of the corresponding catchment and by the hydrologic region where the catchment is
located. Maximum design discharge is the peak river discharge that corresponds to a certain return
period. The maximum design discharge QMax is used in the design to determine the back water curves
results from constructing to the weir which enables to predict the highest water level that occurs
average once every T years, where T is the selected return period of the discharge.
In this research, The HEC-Hms model is preferred and SCS curve number method is used for peak
flood estimation. It is obvious that the data has to be processed in ArcGIS before going into HECHMS
model.
By using ArcGIS, two types of watershed is delineated, one for the gauged site and one for the un
guaged site. The gauged watershed is delineated by using main beles at bridge gauging station as an
outlet and after several processes on Arc-hydro tool and hec- Geohms, the system is optimized in hec-
hms by using rainfall records of the nearby town and stream guage records of main beles at bridge. On
the other hand the unguaged watershed is delineated by using weir site as an outlet and after passing
the same process as that of the gauged watershed on Arc Hydro and Hec-GeoHMS, estimation of peak
flood is finally done as the system is already optimized by the gauged site.

45
On the other hand, the geological cross section of the weir and its treatment is evaluated. Surveying
data upstream and downstream of the weir is collected and used in order to compare the existing bed
level with the design bed level.
Finally, the peak flood estimated after using all the above hydrologic process is used on the remedial
redesign the weir.
The materials used include, but not limited to:
Global Mapper to obtain DEM and Shape file of the project area
Arc-GIS to obtain hydrological and physical parameters and spatial information and to
delineate the catchments of the study area.
30*30 DEM data is used as an input data for ArcGIS software for catchment delineation
and estimation of catchment characteristic.
HEC-HMS software to develop rainfall runoff model.
Hydrological and meteorological data etc.
In Arc GIS Terrain Preprocessing uses DEM to identify the surface drainage pattern. Once
preprocessed, the DEM and its derivatives can be used for efficient watershed delineation and
stream network generation (Ambaw, 2016). Taking the weir site as an outlet Clipped DEM of the
project area is created by using Global Mapper and mosaic of Ethiopia. The clipped DEM is used
as Raw DEM for terrain processing.
Using the digital elevation model (DEM) of the basin as input, the terrain preprocessing with a
series of steps is performed in HEC-Geo HMS to derive the drainage networks. The steps consist
of computing the flow direction, flow accumulation, stream definition, watershed delineation,
watershed polygon processing, stream processing, and watershed aggregation. Once these data sets
are developed, they are used in later steps for sub basin and stream delineation.
The Geo HMS tool is designed to have the output files from the Arc Hydro terrain preprocessing
tools as inputs. These Hydrographic features, which are already executed using Arc Hydro are:
Flow direction grid (Fdr), flow accumulation grid (Fac), stream grid (Str), stream link grid (Lnk),
catchment grid (Cat), curve number grid, slope grid.
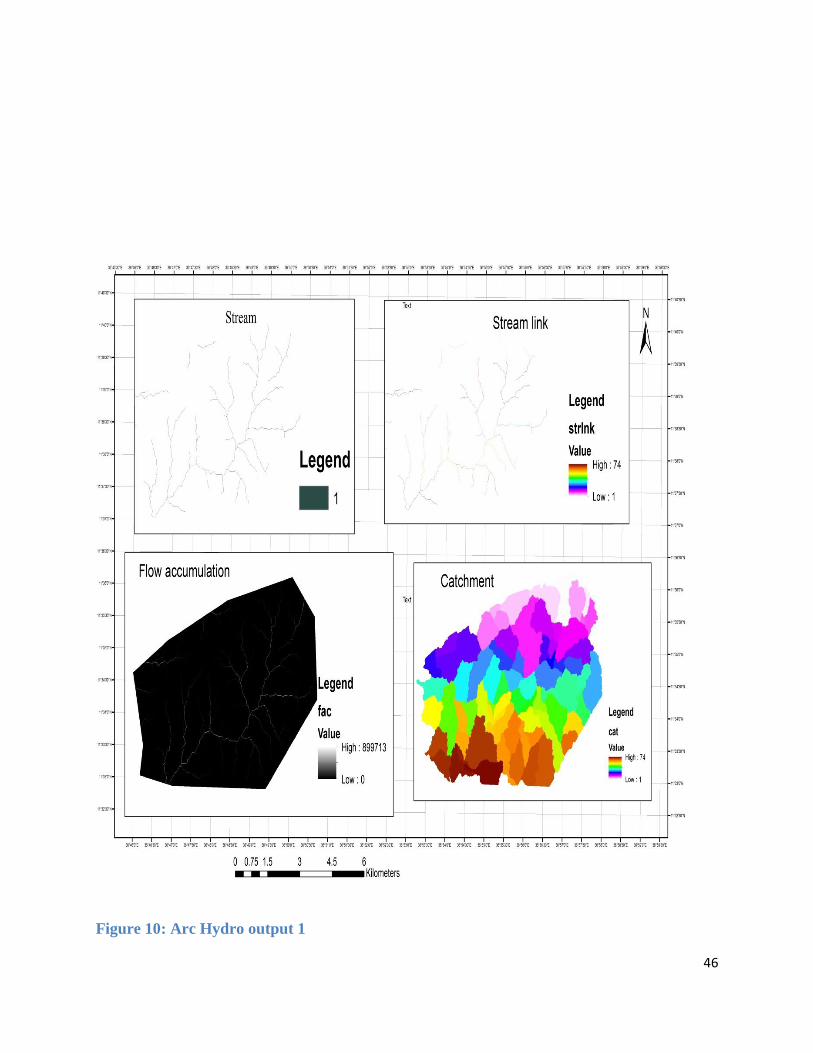
46
Figure 10: Arc Hydro output 1

47
Figure 11: Arc Hydro Output 2
The above output files from Arc Hydro are finally used to automatically create sub basins, longest
paths and basin centroids in HEC-Geo HMS. Additionally, parameters such as slope, length and
average curve number are assigned to flow lines and basins. In Geo HMS by using spatial analyst
tools geographic information is converted into parameters for each of the basins and flow lines.
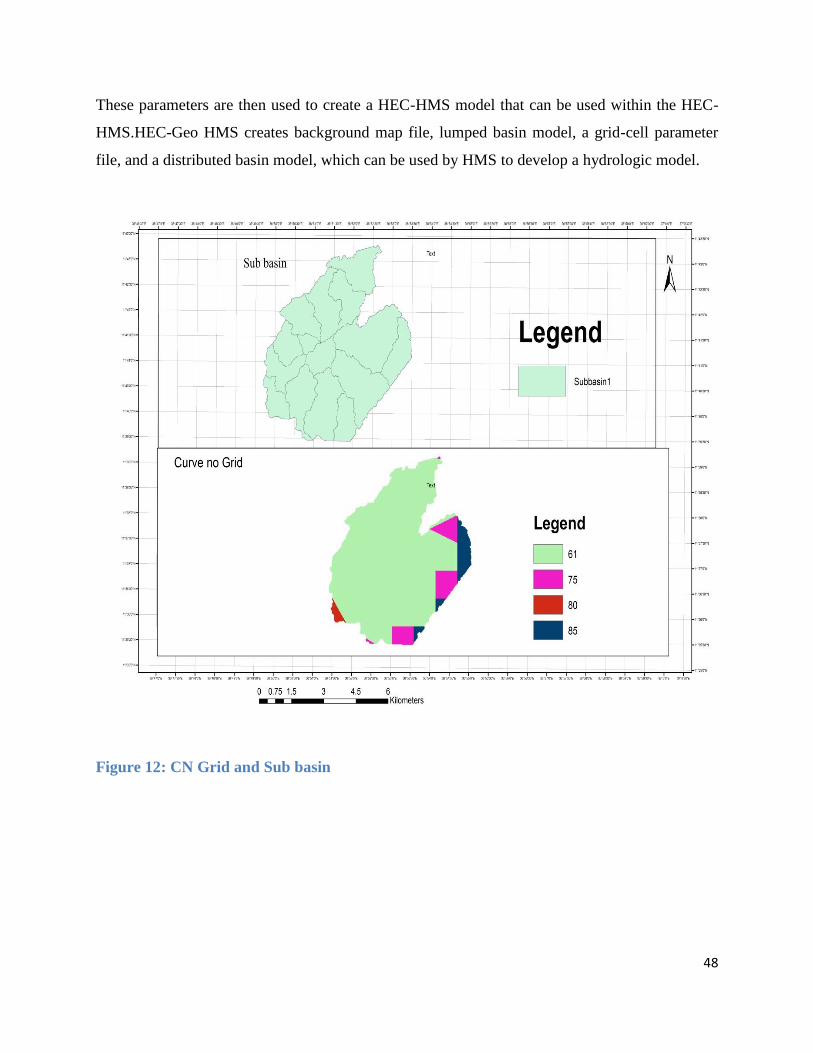
48
These parameters are then used to create a HEC-HMS model that can be used within the HEC-
HMS.HEC-Geo HMS creates background map file, lumped basin model, a grid-cell parameter
file, and a distributed basin model, which can be used by HMS to develop a hydrologic model.
Figure 12: CN Grid and Sub basin

49
Figure 13: Hec-Geo Hms Output
Maximum design discharge is the peak river discharge that corresponds to a certain return period.
The maximum design discharge Qmax is used in the design to predict the highest water level that
occurs average once every T years, where T is the selected return period of the discharge.
SCS curve number method is used to estimate the magnitude of peak flood in Hec Hms. The
maximum rainfall data was used for the hydrologic analysis to determine the maximum design
discharge and checking the consistency of the structures constructed for the design period. But
before estimating the peak flood the model has to be optimized (Yener, 2006) and the result is
shown in the output below.
The model result for peak flow is 989.5m3/s and According to the study by (halcrow, 2000), the
turbine release fluctuates between 64.78 and 80m3/s. Recent information provided by the Tana
Beles hydropower Station is that the minimum and maximum release between 77 and 158m3/s,
which appears to be the latest information available for the operation of the hydropower. Adding
the maximum value of 158 m3/s to the simulated result, the total peak flood will be 1147.5m3/s.
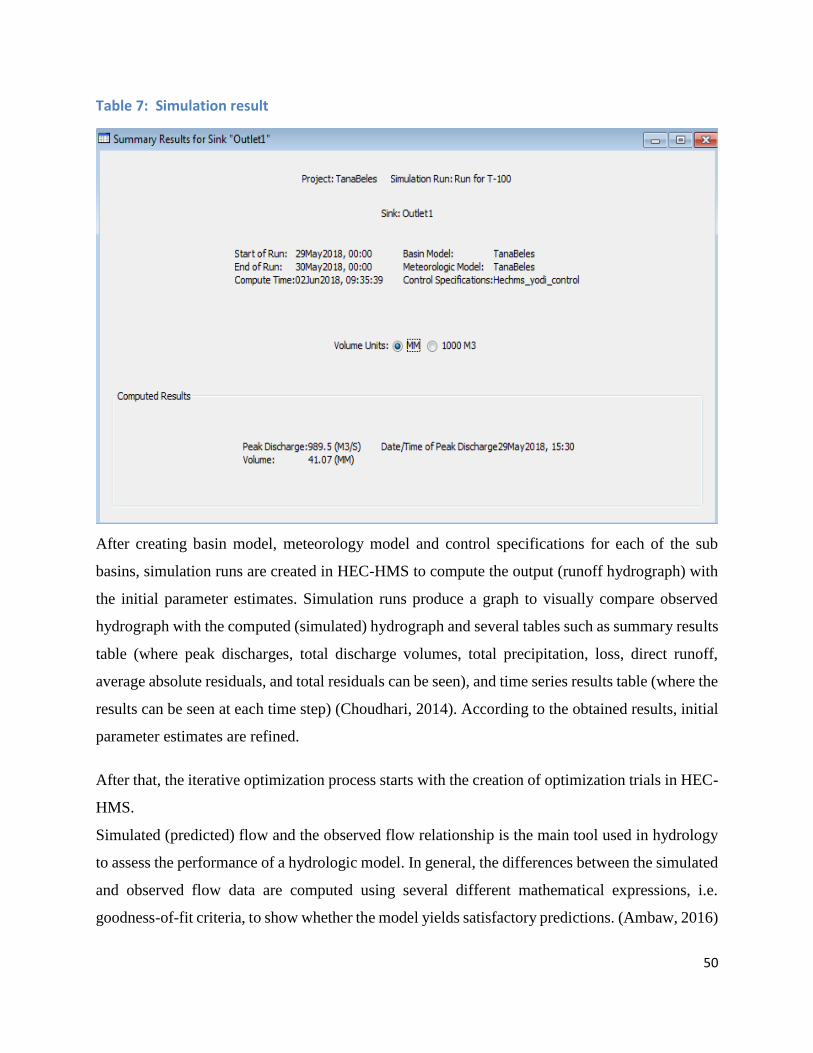
50
Table 7: Simulation result
After creating basin model, meteorology model and control specifications for each of the sub
basins, simulation runs are created in HEC-HMS to compute the output (runoff hydrograph) with
the initial parameter estimates. Simulation runs produce a graph to visually compare observed
hydrograph with the computed (simulated) hydrograph and several tables such as summary results
table (where peak discharges, total discharge volumes, total precipitation, loss, direct runoff,
average absolute residuals, and total residuals can be seen), and time series results table (where the
results can be seen at each time step) (Choudhari, 2014). According to the obtained results, initial
parameter estimates are refined.
After that, the iterative optimization process starts with the creation of optimization trials in HEC-
HMS.
Simulated (predicted) flow and the observed flow relationship is the main tool used in hydrology
to assess the performance of a hydrologic model. In general, the differences between the simulated
and observed flow data are computed using several different mathematical expressions, i.e.
goodness-of-fit criteria, to show whether the model yields satisfactory predictions. (Ambaw, 2016)

51
Figure 14: Optimization result graph

52
Table 8: summary result table
53
5 Evaluation of the Foundation
condition of the Weir
The material and the method used include the following:
The geotechnical investigation report of the weir site is evaluated
The foundation treatment of the weir is evaluated
The existing actual bed level for the upstream of the weir and downstream of the weir is
surveyed
Comparison of the surveyed bed level with the original bed level during design
5.1 Evaluation of Geological Investigation report of the Weir Area Foundation of the weir is basaltic rock excavated to the fresh surface. Loose depositions,
weathered and fractured materials were all avoided by blasting and jack hammering activities. On
the foundation, at the center of the river course unexpected deep cut cavity was encountered during
foundation excavation which led for modification of foundation design (geological cross section).
The cavity was filled by C35 cyclopean cement concrete before founding the weir structure as
shown on the drawing below (Enterprise, Feasibility and Design Study of Tana Beles Integrated
Sugar Development Project Head Work Design Report, 2011).
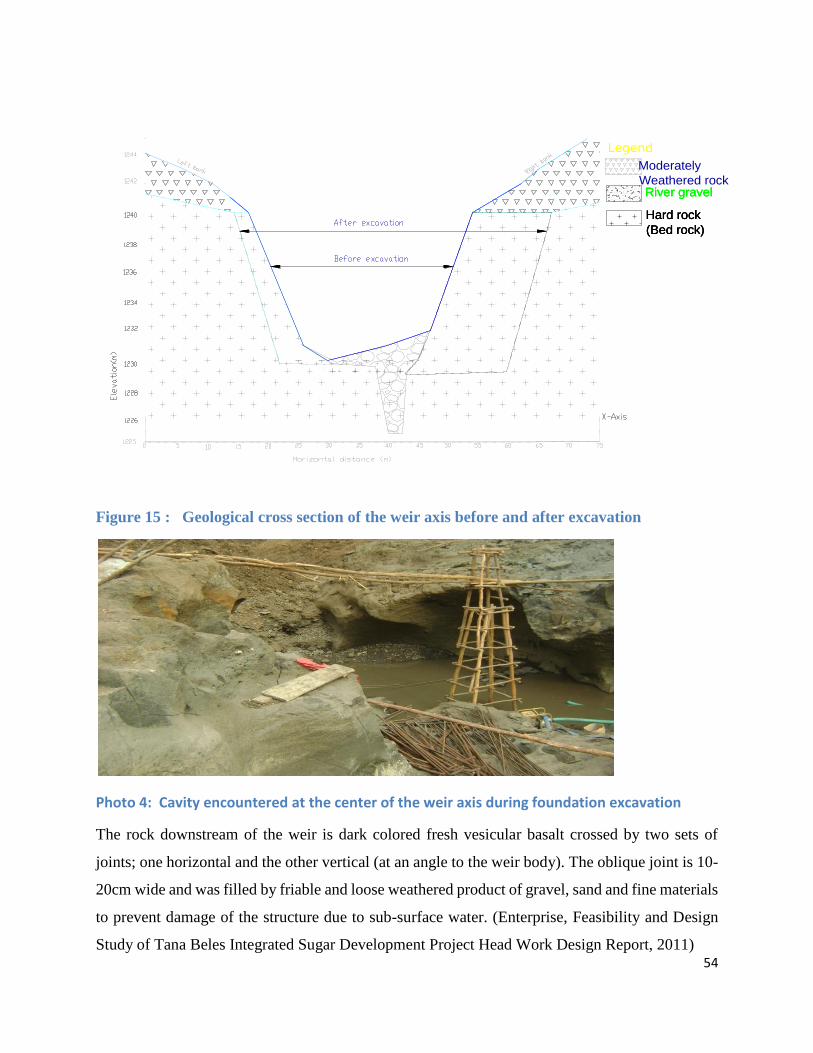
54
River gravel
Legend
Hard rock
(Bed rock)
Moderately
Weathered rockRiver gravel
Hard rock
(Bed rock)
River gravel
Hard rock
(Bed rock)
Figure 15 : Geological cross section of the weir axis before and after excavation
Photo 4: Cavity encountered at the center of the weir axis during foundation excavation
The rock downstream of the weir is dark colored fresh vesicular basalt crossed by two sets of
joints; one horizontal and the other vertical (at an angle to the weir body). The oblique joint is 10-
20cm wide and was filled by friable and loose weathered product of gravel, sand and fine materials
to prevent damage of the structure due to sub-surface water. (Enterprise, Feasibility and Design
Study of Tana Beles Integrated Sugar Development Project Head Work Design Report, 2011)

55
On the abutment the top most part is covered by red brown and dark brown color moderately
weathered and fractured rock. On this top weathered part there is one major horizontal joint about
3cm wide filled by weathered rock fragments of sand and gravel with few fines. Mostly the unit is
vesiculated and amygdaloidal textures of dark, red brown and grey colors. (Enterprise, Feasibility
and Design Study of Tana Beles Integrated Sugar Development Project Head Work Design Report,
2011)
The formation upstream of the weir on the same abutment is the same and the joints are less
pronounced on the excavated faces. While at the top crown of the weir body where the top weir
portion is keyed to the rock is found to have light in color and amygdaloidal texture. (Enterprise,
Feasibility and Design Study of Tana Beles Integrated Sugar Development Project Head Work
Design Report, 2011)
Photo 5: Left abutment d/s of the weir, one vertical joint intersecting in to the structure
foundation and one horizontal joint
Upstream side excavation wall of the gate structures, the rock is fresh vesicular and amygdaloidal
basalt intercalated with highly phorphiritic basalt. At this short excavation face there is one major
horizontal joint 3-5cm wide filled by weathered products. In addition there is one horizontal joint
2cm wide having the same feature. There are also some vertical joints tight to 2mm opening. Both
horizontal and vertical joint walls have weathered and stained surfaces which indicate sub-surface
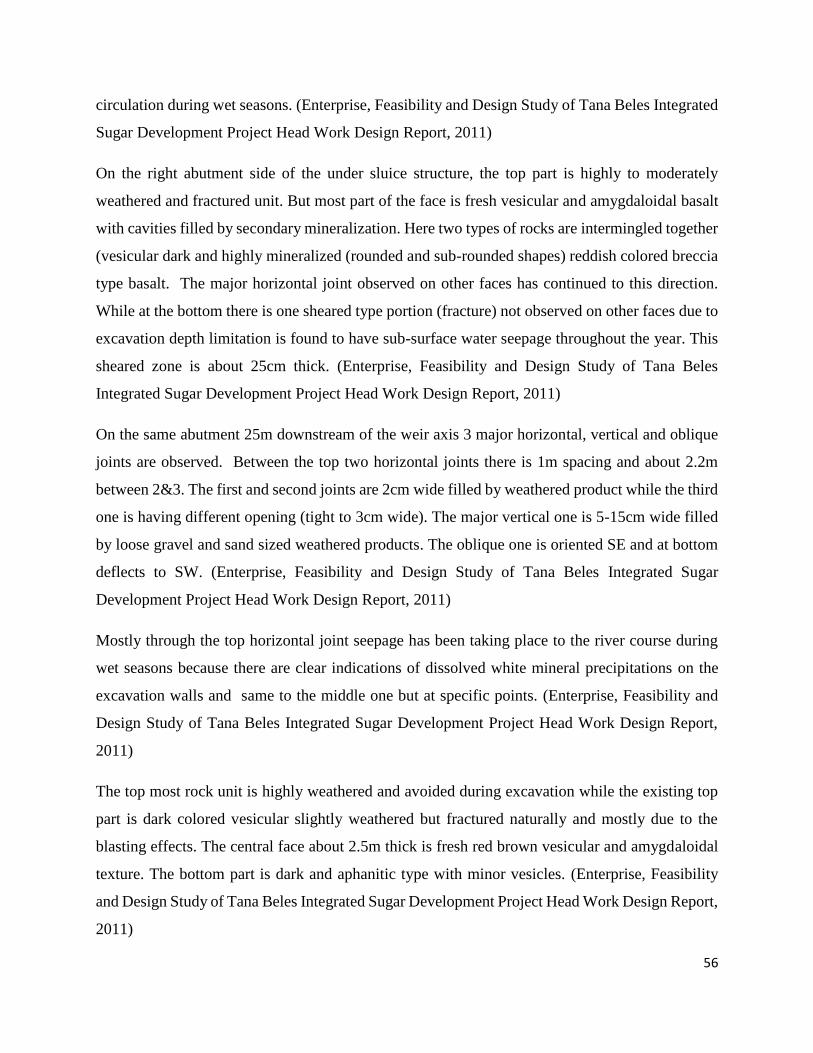
56
circulation during wet seasons. (Enterprise, Feasibility and Design Study of Tana Beles Integrated
Sugar Development Project Head Work Design Report, 2011)
On the right abutment side of the under sluice structure, the top part is highly to moderately
weathered and fractured unit. But most part of the face is fresh vesicular and amygdaloidal basalt
with cavities filled by secondary mineralization. Here two types of rocks are intermingled together
(vesicular dark and highly mineralized (rounded and sub-rounded shapes) reddish colored breccia
type basalt. The major horizontal joint observed on other faces has continued to this direction.
While at the bottom there is one sheared type portion (fracture) not observed on other faces due to
excavation depth limitation is found to have sub-surface water seepage throughout the year. This
sheared zone is about 25cm thick. (Enterprise, Feasibility and Design Study of Tana Beles
Integrated Sugar Development Project Head Work Design Report, 2011)
On the same abutment 25m downstream of the weir axis 3 major horizontal, vertical and oblique
joints are observed. Between the top two horizontal joints there is 1m spacing and about 2.2m
between 2&3. The first and second joints are 2cm wide filled by weathered product while the third
one is having different opening (tight to 3cm wide). The major vertical one is 5-15cm wide filled
by loose gravel and sand sized weathered products. The oblique one is oriented SE and at bottom
deflects to SW. (Enterprise, Feasibility and Design Study of Tana Beles Integrated Sugar
Development Project Head Work Design Report, 2011)
Mostly through the top horizontal joint seepage has been taking place to the river course during
wet seasons because there are clear indications of dissolved white mineral precipitations on the
excavation walls and same to the middle one but at specific points. (Enterprise, Feasibility and
Design Study of Tana Beles Integrated Sugar Development Project Head Work Design Report,
2011)
The top most rock unit is highly weathered and avoided during excavation while the existing top
part is dark colored vesicular slightly weathered but fractured naturally and mostly due to the
blasting effects. The central face about 2.5m thick is fresh red brown vesicular and amygdaloidal
texture. The bottom part is dark and aphanitic type with minor vesicles. (Enterprise, Feasibility
and Design Study of Tana Beles Integrated Sugar Development Project Head Work Design Report,
2011)
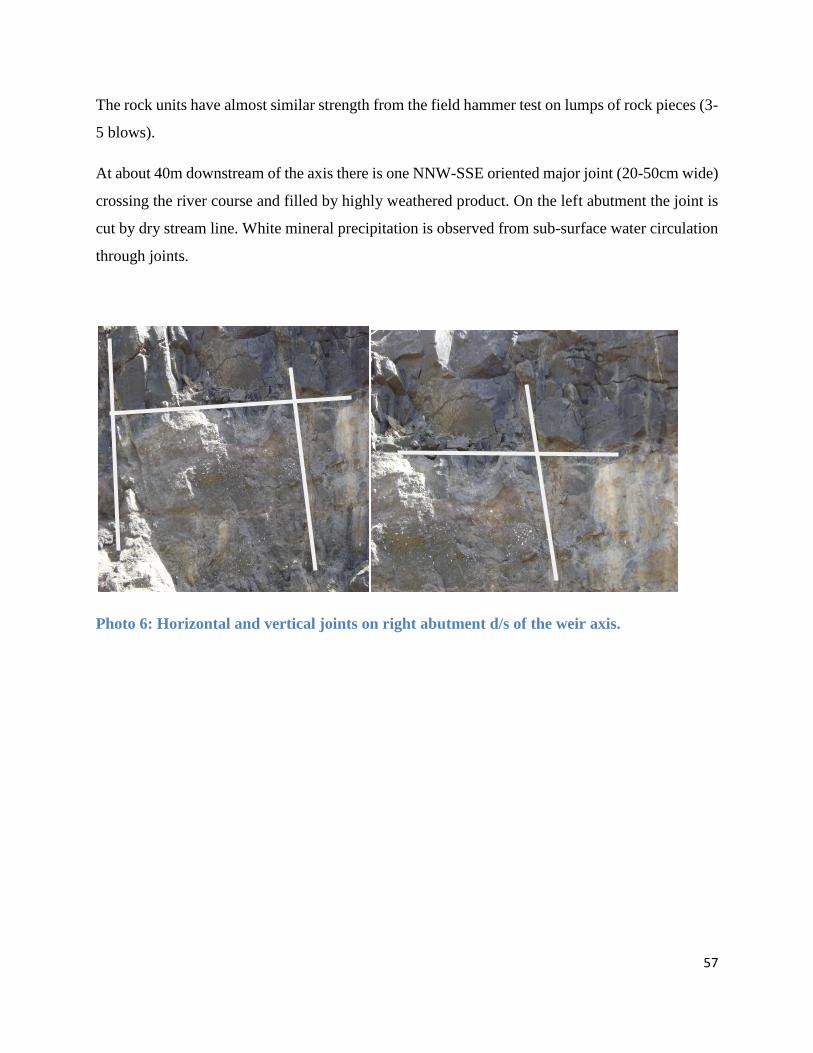
57
The rock units have almost similar strength from the field hammer test on lumps of rock pieces (3-
5 blows).
At about 40m downstream of the axis there is one NNW-SSE oriented major joint (20-50cm wide)
crossing the river course and filled by highly weathered product. On the left abutment the joint is
cut by dry stream line. White mineral precipitation is observed from sub-surface water circulation
through joints.
Photo 6: Horizontal and vertical joints on right abutment d/s of the weir axis.
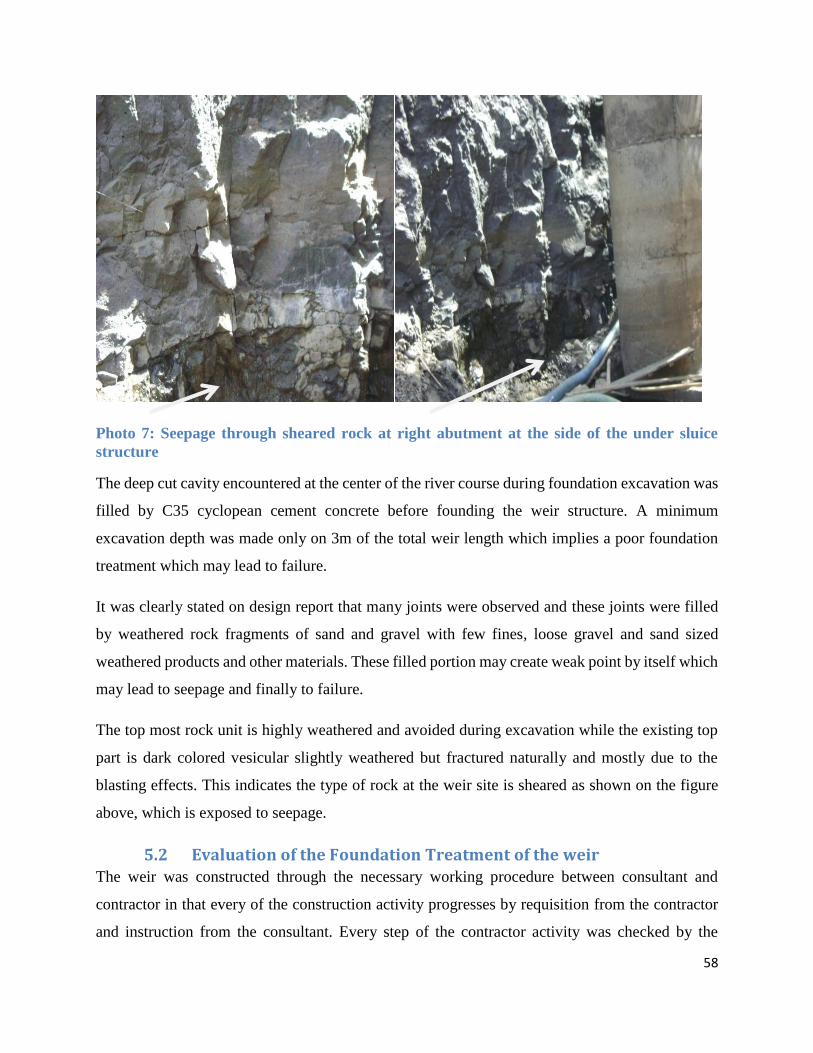
58
Photo 7: Seepage through sheared rock at right abutment at the side of the under sluice
structure
The deep cut cavity encountered at the center of the river course during foundation excavation was
filled by C35 cyclopean cement concrete before founding the weir structure. A minimum
excavation depth was made only on 3m of the total weir length which implies a poor foundation
treatment which may lead to failure.
It was clearly stated on design report that many joints were observed and these joints were filled
by weathered rock fragments of sand and gravel with few fines, loose gravel and sand sized
weathered products and other materials. These filled portion may create weak point by itself which
may lead to seepage and finally to failure.
The top most rock unit is highly weathered and avoided during excavation while the existing top
part is dark colored vesicular slightly weathered but fractured naturally and mostly due to the
blasting effects. This indicates the type of rock at the weir site is sheared as shown on the figure
above, which is exposed to seepage.
5.2 Evaluation of the Foundation Treatment of the weir The weir was constructed through the necessary working procedure between consultant and
contractor in that every of the construction activity progresses by requisition from the contractor
and instruction from the consultant. Every step of the contractor activity was checked by the

59
consultant and compressive strength test of the concrete has been executed as reported from the
contractor’s representative.
Foundation shall be excavated up to competent bedrock and in this excavated area; Roller
Compacted Concrete (RCC) has to be placed to create the weir foundation. The weir is not founded
on competent rock as shown in the geological cross section of the weir. The geological cross
section of the weir also shows an approximate smaller foundation excavation depth prior to this
type of weir construction. Over-excavation approximately in limited areas was required due to
presence of weathered, fractured, or faulted rock.
Geology played an integral role in determining depth of excavation. To build this type of weir, the
foundation shall be well treated to some depth (7-8m) and the treatment should also be up to the
downstream section.
The top most rock unit is highly weathered and avoided during excavation while the existing top
part is dark colored vesicular slightly weathered but fractured naturally and mostly due to the
blasting effects. The joint was filled by friable and loose weathered product of gravel, sand and
fine materials to prevent damage of the structure due to sub-surface water. Over-excavation has to
be made in zones of weathered rock and foundation should also be treated.
As discussed above the foundation is not treated as per the required standard which results
subsurface erosion to prevail.
On the other side, it was known that there is a direct release from the hydropower but scouring
was not expected during the design even though it was a must.in this situation Provision of energy
dissipater is necessary to prevent scouring.
5.2.1 Surveying of the actual bed level upstream and downstream of
the weir
Field visit surveys have been conducted for gathering out of data for the purpose of describing
the nature of existing conditions and to compare existing conditions with the design standard of
the diversion headwork.

60
Table 9: bed level surveying data
collection for upstream and downstream
of the weir
Easting Northing Elevation
247986.1 1290025 1236.771
247986.1 1290027 1236.667
247989.2 1290028 1236.569
247987.8 1290030 1236.464
247985.9 1290033 1236.138
247983.1 1290035 1236.314
247985.9 1290047 1236.254
247982.3 1290039 1236.183
247981.6 1290043 1235.649
247982.9 1290052 1235.758
248075.6 1290146 1236.067
248069.5 1290136 1236.052
248020.3 1290068 1235.647
248017.2 1290066 1235.568
247980 1290087 1235.261
247840.4 1289942 1228.044
247840.8 1289940 1228.306
247839.4 1289946 1227.994
247838.9 1289948 1227.996
247838.9 1289948 1227.996
247838.7 1289949 1227.989
247838.7 1289949 1227.989
247838.2 1289951 1227.902
247837.9 1289953 1227.88
247837.4 1289954 1227.821
247837 1289956 1227.789
247836.6 1289958 1227.714
247836 1289960 1227.698
247835.5 1289962 1227.697
247835.1 1289964 1225.597
247829.7 1289967 1225.756
247834.3 1289966 1227.46
5.2.2 Comparison of the actual bed level with the original bed level
For further conclusion about the foundation condition, it is important to check the existing
elevation of the rock which may help to understand whether it is weathered or not.
Surveying data downstream of the weir is used to compare the existing original ground level with
the river bed level during construction and reported on the chart below.

62
Figure 16: Bed level Cross-Section at the toe of the Weir
The chart clearly shows the existing bed level just downstream of the weir is lowered from the
original bed level (1228.8).The bed level of right side of the weir, which is near to major failure
area is highly reduced when compared with left side of the weir and the average scour depth is 2m.
The cross-section upstream of the weir is also the same with that of the downstream, which means
there is an elevation difference between the left and right side of the channel along the flow
direction.
It is also observed that the left side of the channel bed is rock and the right side is filled with
alluvial deposit. I can judge from the site condition that the alluvial deposit on the left side is due
to long term weathering.
Even though the right side has an alluvial deposit, the bed elevation is still lower than the left side.
Due to this the river flow will be more dominant on the right side of the channel than on the left
side. Consequently, as the water exert much pressure on that side, crack will prevail and become
potential failure cause of the weir.
Surveying data upstream of the weir is collected and used to compare the existing original ground
level of the right side of the channel and the left side of the channel along the flow direction.
1224
1224.5
1225
1225.5
1226
1226.5
1227
1227.5
1228
1228.5
1229
1 2 3 4 5 6 7 8 9 10 11 12 13 14 15 16 17 18 19 20 21 22 23 24 25 26 27 28 29 30 31 32 33 34 35
downstream bed level of the Weir from left to right bank
63
Figure 17: Upstream bed level comparison
The chart clearly shows the existing ground elevation of right side of the channel is lower than the
left side. In this situation the water will select to flow on the right side and excessive pressure will
be exerted on that side of the weir, which may cause failure of the structure.
6 Hydraulic analysis
In the hydraulic analysis, the Hydraulic design report is evaluated and the main factor which may
facilitate the failure of the weir is identified. The method and data used include:
The hydraulic design report has been evaluated
Field observation has been made to identify problems
Factors which facilitate the failure of the weir is identified
6.1 Clogging of under sluice
The under sluices are the gate controlled openings in the weir with crests at low level. They are
located on the same side as off taking canal. The usual functions of the under sluices are:
To preserve a clear and defined river channel approaching the canal head regulator
1234.5
1235
1235.5
1236
1236.5
1237
1 2 3 4 5 6 7 8 9 10 11 12 13 14 15
upstream bed level of weir from left to right bank

64
To scour silt deposited in front of canal regulator and control silt entry in the canal
To lower the highest flood level by providing greater discharge per meter length than the
weir.
Under sluices /scouring sluices are openings provided at the base of the weir or barrage. These
openings are provided with adjustable gates. Normally, the gates are kept closed. The suspended
silt goes on depositing in front of the canal head regulator. When the silt deposition becomes
appreciable the gates are opened and the deposited silt will be removed by different techniques.
The muddy water flows towards the downstream through the scouring sluices so the gates closed.
But, at the period of flood, the gates are kept opened.
The width of the under sluice portion is determined on the basis of the following considerations.
(Fikru, 2015)
• It should be capable of passing at least double the canal discharge to ensure good scouring
capacity
• It should be capable of passing about 10 to 20 percent of the maximum flood discharge at
high floods
• It should be wide enough to keep the approach velocities sufficiently lower than critical
velocities to ensure maximum settling of suspended silt load. .
In case of Tana Beles diversion headwork, out of the three bays of the under sluice two of them
were fully closed and cannot be opened freely due to malfunctioning of gate. The rest one was
opened by force but cannot be closed. hence, Efficient flushing of the sediment from the under
sluice pocket is not ensured.as a result sediment accumulation will be high around the under sluice
which increases its bed level and this cause the concentrated water to flow into weir finding lower
bed level. Consequently high water pressure will be exerted on the structure and this will have an
effect on the weir.
6.2 Retrogression Negligence Scour is a natural phenomenon caused due to the erosive action of flowing stream on alluvial beds
which removes the sediment around or near structures located in flowing water. These endanger
stability of the structure by shearing. Scouring occurs during floods and when the water flow with
very high velocity over the structure. These have been checked by physical observation.
65
In the alluvial rivers due to construction of weir the regime of the river is affected. Initially most
of the sediment is dropped in the pond and relatively clear water passes over it. This clear water
scours the downstream river bed to make up the deficiency in the silt load and causes a progressive
lowering or retrogression of downstream levels. If this retrogression or lowering of bed levels in
the early stages is not taken into account it may lead to undermining of the structure. A
retrogression of about 1.0 to 2.0 meters at low water levels and 0.3 to 0.5 m at high flood levels
has been observed on weirs in India. The actual design practice is to allow a retrogression of 0.5m
increasing linearly up to 2.0m at low discharges. In the case of Tana the Beles Weir, it was believed
that the strata at the downstream of the weir site is rocky (vesicular basalt), hence retrogression
/scour was not expected. No concrete floor is provided both on the upstream and downstream of
the weir. On my presence at the site I observed upstream and downstream of right side of the weir
which was previously concluded as rock is eroded.
Therefore negligence of retrogression may be taken as the potential cause for Tana Beles weir
failurity.
6.3 Absence of Concrete Floor
The head work site is founded on the naturally bedded basaltic rock, which extends upstream and
downstream of the weir site. The abutments of the river around the weir, downstream and upstream
of the weir axis are basaltic rocks, which has been considered to be quite competent to withstand
the forces due to design flood flowing over the weir and it was decided to dispense with the
lowering of floor up to EL. 1228 as a design standard and provision of concrete/ RCC floor on
upstream and downstream. But taking into account for the foundation, No concrete floor is
provided both on the upstream and downstream of the weir.
Physical observation of the weir site exposes part of downstream and upstream of the weir axis is
not basaltic rocks and design consideration does not guarantee for the actual site condition.
Absence of the concrete floor on the design should be taken as the potential cause for Tana Beles
weir failurity.
6.4 Absence of Upstream and downstream cut off Cut-off is barrier provided below the floor of the weir both at the upstream and the downstream
ends. It may be in the form of concrete lungs or steel sheet-piles. The cut-off extends from one end
66
up to the other end (on the other bank). The purpose of providing cut off is two-folds as explained
below.
During low-flow periods in rivers, when most of the gates are closed in order to maintain a pond
level, the differential pressure head between upstream and downstream may cause uplift of river
bed particles. A cut off increases the flow path and reduces the uplift pressure, ensuring stability
to the structure. During flood flows or some unnatural flow condition, when there is substantial
scour of the downstream riverbed, the cut offs or sheet piles protect the undermining of the
structures foundation.
The upstream and downstream cut offs should generally be provided to cater for scours up to 1 R
and 1.25R respectively where R is the depth of scour below water level and is given by :
R = 0.473 (Q/f) 1/3 or R = 1.35 (q/f2)1/3
However since the strata at Tana Beles weir site is taken as basalt rock and is considered to be un
erodible, no scour is expected to take place during design. On the design, since no concrete floor
has been provided, no cut offs at the end of floor is required.
In contrary to this, Physical observation of the weir site exposes part of downstream and upstream
of the weir axis is not basaltic rocks and design consideration does not guarantee for the actual site
condition. Absence of the cutoff on the design should be taken as the potential cause for Tana
Beles weir failurity.
6.5 Absence of Upstream and downstream protection works The impervious floor of a weir and head regulator is normally protected on the upstream as well
as downstream by loose aprons. However as the rock at the weir site is considered quite competent,
no scour is expected and hence no additional protection works have been provided on the design
of Tana Beles Weir.
6.6 Absence of Energy Dissipater The high energy loss that occurs in a hydraulic jump has led to its adoption as a part of high energy
dissipater system below a hydraulic structure. Three types of energy dissipaters (HAGER, 1992)
have been commonly used: stilling basins, flip buckets, and roller buckets. Each dissipater has
certain advantages and disadvantages and may be selected for a particular project depending upon
67
the site characteristic. Out of the three energy dissipaters types, flip bucket is commonly used on
weir design.
The flip bucket energy dissipater is suitable for sites where the tail water depth is low (which
would require a large amount of excavation if a hydraulic jump dissipater were used) and the rock
in the downstream area is good and resistant to erosion. It is also called ski-jump dissipater, throws
the jet at a sufficient distance away from the structure` where a large scour hole may be produced.
Initially, the jet impact causes the channel bottom to scour and erode. The scour hole is then
enlarged by a ball-mill motion of the eroded rock pieces in the scour hole. A small amount of the
energy of the jet is dissipated by the internal turbulence and the Shearing action of the surrounding
air as it travels in the air. However, most of the energy of the jet is dissipated in the plunge pool.
(HAGER, 1992)
In the case of Tana Beles weir design, as water flows by high energy down the sloping glacis and
this maximum energy is not dissipated by flip bucket due to absence on the design, the energy will
scour the downstream floor until the main weir and this may be taken as failure causes of Tana
Beles weir.
6.7 Absence of river training work
It is necessary at many instances to narrow down and restrict the course of the river through the
weir and it is achieved by the use of the river training works. Proper alignment of guide bunds is
essential to ensure satisfactory flow conditions in the vicinity of the weir. In case of wide alluvial
banks, the length and curvature at the head of the guide bunds should be kept such that the worst
meander loop is kept away from either the canal embankment or the approach embankment. If the
alluvial bank is close to the weir, the guide bunds may be connected to it by providing suitable
curvature, if necessary. If there is any out-crop of hard strata on the banks, it is advisable to tie the
guide bunds to such control points.
Because, no standard river training work adopted for Tana Beles weir design, flow conditions in
the vicinity of the weir is not satisfactory and right side of the weir is mostly affected by the flow
as compared to the left which apparently leads to its failure.
68
7 Structural analysis
In general, structural analysis includes stability analysis of the weir body. In this analysis, the
weir has been checked for stability against all modes of failure.
7.1 Forces acting on the weir A weir was considered to be subjected to the following main forces:
Self-weight of the weir
Water pressure
Sediment / silt pressure
Uplift pressure
Wave pressure
Wind pressure
Earth quake pressure
As the height of the weir is not much, the wave pressure and wind pressures are ignored. Since the
project area is in earth quake free zone, no earth quake pressure is considered.
Once a section of the weir has been designed, it has to be analyzed and checked, whether it satisfies
the safety requirements. Gravity method (or two dimensional methods) has been used for the analysis
of the weir. In this method of analysis the weir is considered as a two dimensional structure. A unit
length of the weir is considered for the analysis. The weir is assumed to consist of a series of vertical
cantilevers of unit length and fixed at the base. These cantilevers are assumed to be independent of one
another. The loads acting on the cantilevers are transferred to the foundation through the cantilever
action. The stability of these cantilevers is checked against all possible modes of failure.
7.2 Stability against Uplift The weir is laid on durable and fresh rock unit after removing the weathered and jointed rock and the
weir body is anchored in to foundation rock, so that weir and foundation behave as one unit. No uplift
pressure is, therefore, assumed to be created.
Physical observation of the actual site condition exposes the stability analysis against uplift have to be
checked. As the actual foundation condition shows that provision of impervious floor with cut off is
necessary to prevent failure due to uplift and piping and the structure has to be checked for its stability.
69
But from physical observation and evaluation of the foundation condition of the weir site, the structure
is subjected to uplift.
7.3 Stability against Overturning
Overturning failure occurs when the overturning moment exceeds the resisting moment. Thus,
failure of the weir by overturning is usually preceded by tension failure or crushing failure.
Therefore, a weir may be considered safe against overturning if the criterion of no tension at
any point in the weir body is satisfied and also the maximum compressive stress does not
exceed the allowable limit. To be on the safer side the resisting moment should exceed the
overturning moment at least by 100%.
The stabilizing moment is greater than destabilizing moment and Factor of safety against overturning
for weir section is 1.75 (>1.5). There is no lifting up of the structures heel and the structure is not
susceptible to any tension on the base.
7.4 Stability against shear and Sliding The sliding failure occurs when the weir slides over its base or when part of the weir lying
above the horizontal plane slides over that plane. To avoid this failure at any horizontal section or
at the base, the weir should be designed so that the sliding forces do not exceed the resisting force.
The weir structure is checked for stability against shear and sliding and the result (FS=1.6>1)
manifested that the diversion structure is safe against shear and sliding.
7.5 Over all stability of the weir The following procedure is used for checking the stability of the weir.
(i) All the forces , vertical and horizontal, acting on the weir are determined
(ii) The algebraic sum of all the horizontal forces(ΣH) and vertical forces(ΣV) is
determined
(iii) The moments of all the forces components about the downstream edge or toe is
determined. The algebraic sum (ΣMr) of resisting moments and algebraic sum (ΣMh)
of overturning moments is determined. Also the net moment (ΣM) about the toe is
computed. Thus,
ΣM = ΣMr- ΣMh
(iv) Determine the distance x of the point where the resultant R strikes the base.

70
X= ΣM/ΣV
Determine the eccentricity e =0.5B-x, ensure that the eccentricity is with in the middle
one third of the base width.
(v) Determine the Factor of safety against overturning (ΣMr/ΣMh)
(vi) Determine the factor of safety against sliding (µΣV/ΣH)
The overall stability analysis involves checking for the design margin for eccentricity, sliding,
overturning and bearing capacity.
The eccentricity of loads worked out is found to be within one third of the base implying thereby that
the pressure at the base shall always be positive and there shall be no tension. The factor of safety
against overturning and sliding work out as 1.75 and 1.6 respectively. These factor of safeties are
considered to be safe.
Stability Calculation
S.N Item Symbol Data Unit Remark
1 unit weight of concrete γc 24 KN/m3
2 unit weight of soil
affluxed
upstream
water
level
1241.27
dry γd 14.8 KN/m3 crest
level 1235.8
wet density γs 18 KN/m3 structure
bed level 1228.8
saturated unit weight γb 19.09 KN/m3 structure
bed level 1228.8
buoyant unit weight γf 9.28 KN/m3 bottom
width 12.22
3 unit weight of water γw 9.81 KN/m3 Area 9.15
4 friction coefficient f 0.55 35.75
5 internal friction angle of soil φ 30 12.675
6 affluxed upstream water level 1241.270
7 crest level 1235.800
8 structure bed level 1228.8 m
9 height B 7.00 m
10 bottom length C1 12.22 m
11 Area 1 A1 1.30 m
12 Area 2 A2 1.00 m
13 Area 3 A3 0.40 m

71
14 width of weir L 30.00 m
S.N desc.of acting force Acting direction Formula
calculation data unit
Moment arm Moment
1 self-weight U1 ↓ G=γc*B*A1 1,537.20 KN
2.29
3,516.35
self-weight U2 ↓ G=γc*B*A2 6,006.00 KN
3.58
21,471.45
self-weight U3 ↓ G=γc*B*A3 2,783.43 KN
8.84
24,605.52
2 water weight Gw ↓ Gw=γw*H*C1*B 10,464.17 KN
6.11
63,936.07
3 Upstream water pressure P1 → P1=1/2γwH2*B (5,339.12) KN
4.16
(22,192.96)
4 Uplift pressure W2 ↑ W2=1/2γwH*B*L (5,232.08) KN
8.15
(42,624.04)
∑m 48,712.38
∑Fv 15,558.71
∑Fh (5,339.12)
∑Fu (5,232.08)
anti-overturning moment 113,529.38
overturning moment (64,817.00)
Safety factor of anti-uplifting force 2.97
Safety factor of anti over turning force
1.75
Safety factor of anti-sliding force 1.60
eccentricity 2.98
Maximum stress 118.23
Minimum stress 29.94
72
8 Remedial design of the weir
The problem related to the weir failure has been investigated on the previous chapter.in this chapter
remedial design will be recommended.
As the design report indicates, for the design of Tana Beles weir a design flood of 1 in 100 year
frequency (1033 m3/s) for the hydraulic design is implemented and the corresponding value
estimated in this thesis is 1147.5 m3/s, which shows the value used for the design has a deficiency
of 114.5 m3/s when compared with the model simulation result.
The occurrence of a certain peak flood of given return period during the life time of a project is a
probability of a given flood that should be safely discharged from the diversion structures (weir
and under sluices). Particularly the structural safety as well as economic design of hydraulic
structures depends on the accuracy of the design flood which is a function of robustness of the
method of estimation and the available data.
8.1 Design Flood Discharge For the purposes of design of items other than free board, a design flood of 50 or 100 years
frequency may be considered sufficient for hydraulic design (IS:6966) of weir and under sluices.
For the design of free board a minimum of 500 year flood may be adopted. However for the
remedial redesign of weir a design flood of 1 in 100 year frequency (1147.5 m3/s) has been
adopted. It is noted that by using the HEC-Hms model, a peak flood of 1147.5 m3/s is obtained for
1 in 100 year frequency, which is significantly different from the one previously used during the
design (1033 m3/s).
8.2 Rating curve In the absence of detailed data a preliminary rating curve has been prepared by computing the
discharges at different water levels using the formula.
Q = 1/n A R 2/3Sf1/2
Where Q = discharge in cu m/ sec
n = Rugosity coefficient
A = Area of cross section of flow in m2
R = Hydraulic mean radius in m and
73
Sf= friction slope
The flood level for the design flood of 1 in 100 year frequency works out as 1236.91 m.
8.3 Pond Level Pond level in the under slice pocket upstream of the canal head regulator and upstream of weir
portion is generally obtained by adding the working head to the designed full supply level in the
canal. In the present case against a FSL of 1235.3m in the canal, a Pond level of 1235.80 has been
adopted.
8.4 Optimum water way and afflux The length of water way, corresponding discharge per meter and the afflux are co - related. Afflux
is generally limited to 1m but may be kept higher if permissible. In the present case, since the river
training is in consideration afflux of 0.26 is provided for a design flood of 1147.5 m3/s.
In deep and confined rivers with stable banks the overall water way of weir and under sluices
(between abutments) including thickness of piers should be approximately equal to the actual
width of river at the design flood.
The crest level of the under sluices is usually kept as near the bed level in the deepest channel as
is practically possible. The under sluice crest is kept lower to attract a deep current in front of
1228.00
1230.00
1232.00
1234.00
1236.00
1238.00
1240.00
0.00 500.00 1000.00 1500.00 2000.00
Series3

74
regulator so that dry weather current may remain near the regulator. It would be desirable to keep
the crest and upstream floor level in front of under sluices at the same level. The crest level of the
under sluices has been kept at 1229.3(the deepest bed level of the river at the weir site+
retrogression).
The crest level of the weir is kept at the pond level (1235.80), as no shutters or gates are proposed
to be provided on the weir crest.
8.5 Adequacy of the waterway Having tentatively decided the crest levels as well as the water way of the under sluice and the
weir proper, it is necessary to check that the maximum flood discharge passes down the works
without excessive afflux. The following discharge formulae have been used for this purpose. Since
Ogee type of crest has been proposed for the weir, the following discharge equation has been used,
Q=CBh1.5
Where,
Q: The discharge over the weir portion
B: The Effective water way of the weir portion
H: The Effective head (head + head due to velocity of approach)
C: The Coefficient of discharge for the ogee type crest (2.2)
Discharge Over the weir
crest level of the weir 1235.8 m
Affluxed High Flood Level 1241.27 m
Design for flow ,Q100 1147.50 m3/sec
Main Weir clear width, B 30.00 m
Depth of flow over main weir ,h1 5.47 m
take h1 5.47 m
Discharge 767.60 m3/sec
flow intensity ,q 25.59 m2/sec
Discharge through scour sluice
scour sluice width 3.30 m
scour sluice height 2.70 m
No of gates 3.00
Scour sluice total width, Bt 9.90 m
crest level of the Under sluice 1228.80 m
Depth invert below the main weir crest 4.30 m
depth of flow over scour sluice, h1 9.77 m
Discharge 604.65 m3/sec
75
flow intensity ,q 61.08 m2/sec
total flow over the weir 1372.25 m3/sec
Spare capacity 224.75 m3/sec
This show, the estimated flood (1147.5cum/s) can pass over the weir safely.
8.6 Design of the ogee weir profile The profile of the ogee (weir crest) is designed for the design head. The design head is generally
chosen to give the maximum practical hydraulic efficiency, in keeping with the operational
requirements, stability and economy. However, crack propagation and expansion tendency along
the expansion line is observed. Beside this, the plastering from the ogee weir surface is detached.
To avoid the cracks on the ogee weir surface it is required to cast a layer of C-35 reinforced
concrete after chiselling the top concrete surface. To cast a constant layer of reinforced concrete
on the chiselled surface, Surveying of the original elevation of the top surface of the weir is
necessary. Without changing the original ogee weir profile, a constant 50cm reinforced concrete
layer can be added on the original top surface of weir as shown below on the chart.
The type of ogee selected is vertical upstream face.
Table 10: ogee weir profile
y river bed Top ogee
level
6.75 1228.37 1235.12
7.08 1228.37 1235.45
7.25 1228.37 1235.62
7.33 1228.37 1235.7
7.35 1228.37 1235.72
7.3 1228.37 1235.67
7.22 1228.37 1235.59
7.1 1228.37 1235.47
6.94 1228.37 1235.31
6.75 1228.37 1235.12
6.52 1228.37 1234.89
6.27 1228.37 1234.64
5.98 1228.37 1234.35
5.68 1228.37 1234.05
5.32 1228.37 1233.69
4.94 1228.37 1233.31
4.52 1228.37 1232.89
4.08 1228.37 1232.45
3.61 1228.37 1231.98
3.12 1228.37 1231.49
2.63 1228.37 1231
2.21 1228.37 1230.58
1.89 1228.37 1230.26
1.65 1228.37 1230.02
1.46 1228.37 1229.83
1.34 1228.37 1229.71
1.27 1228.37 1229.64
1.25 1228.37 1229.62
1.28 1228.37 1229.65
1.36 1228.37 1229.73
1.5 1228.37 1229.87
1.69 1228.37 1230.06
1.95 1228.37 1230.32

76
2.29 1228.37 1230.66
2.69 1228.37 1231.06
1.85 1228.37 1230.22
1.99 1228.37 1230.36
2.13 1228.37 1230.5
8.7 Energy dissipation
ha
h
H
D2
D1
1226
1228
1230
1232
1234
1236
1238
1 2 3 4 5 6 7 8 9 10 11 12 13 14 15 16 17 18 19 20 21 22 23 24 25 26 27 28 29 30 31 32 33 34 35 36 37 38
Chart Title
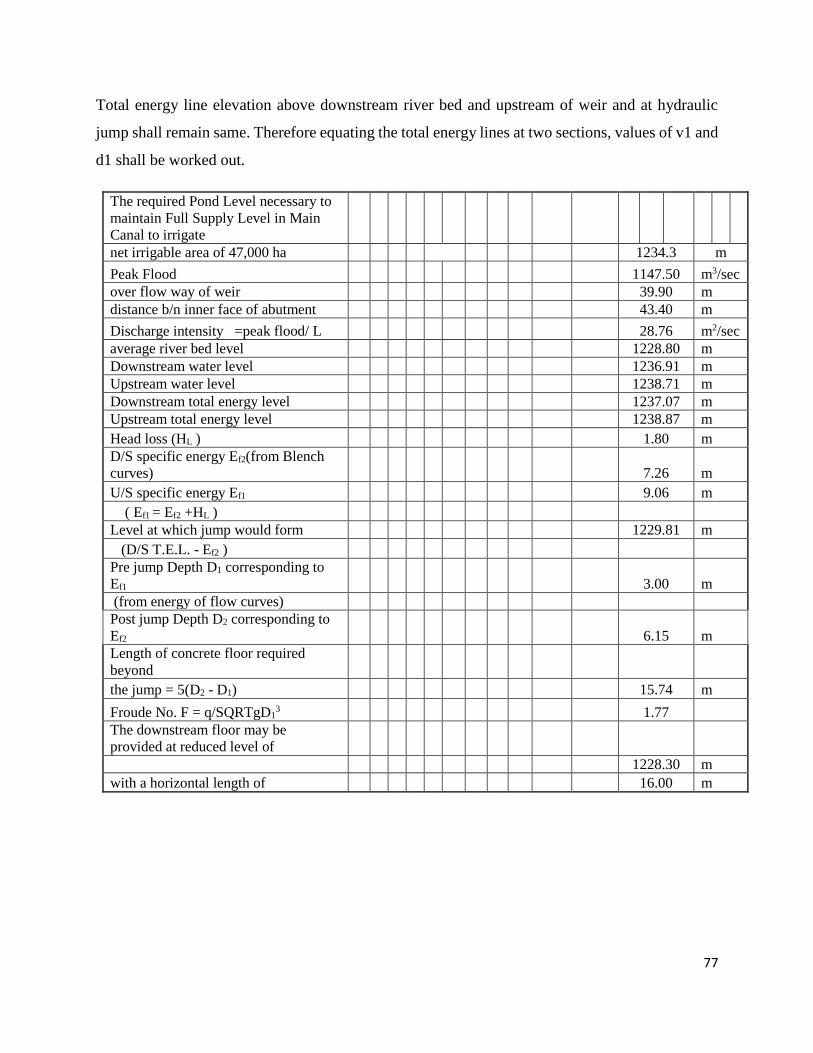
77
Total energy line elevation above downstream river bed and upstream of weir and at hydraulic
jump shall remain same. Therefore equating the total energy lines at two sections, values of v1 and
d1 shall be worked out.
The required Pond Level necessary to
maintain Full Supply Level in Main
Canal to irrigate
net irrigable area of 47,000 ha 1234.3 m
Peak Flood 1147.50 m3/sec
over flow way of weir 39.90 m
distance b/n inner face of abutment 43.40 m
Discharge intensity =peak flood/ L 28.76 m2/sec
average river bed level 1228.80 m
Downstream water level 1236.91 m
Upstream water level 1238.71 m
Downstream total energy level 1237.07 m
Upstream total energy level 1238.87 m
Head loss (HL ) 1.80 m
D/S specific energy Ef2(from Blench
curves) 7.26 m
U/S specific energy Ef1 9.06 m
( Ef1 = Ef2 +HL )
Level at which jump would form 1229.81 m
(D/S T.E.L. - Ef2 )
Pre jump Depth D1 corresponding to
Ef1 3.00 m
(from energy of flow curves)
Post jump Depth D2 corresponding to
Ef2 6.15 m
Length of concrete floor required
beyond
the jump = 5(D2 - D1) 15.74 m
Froude No. F = q/SQRTgD13 1.77
The downstream floor may be
provided at reduced level of
1228.30 m
with a horizontal length of 16.00 m
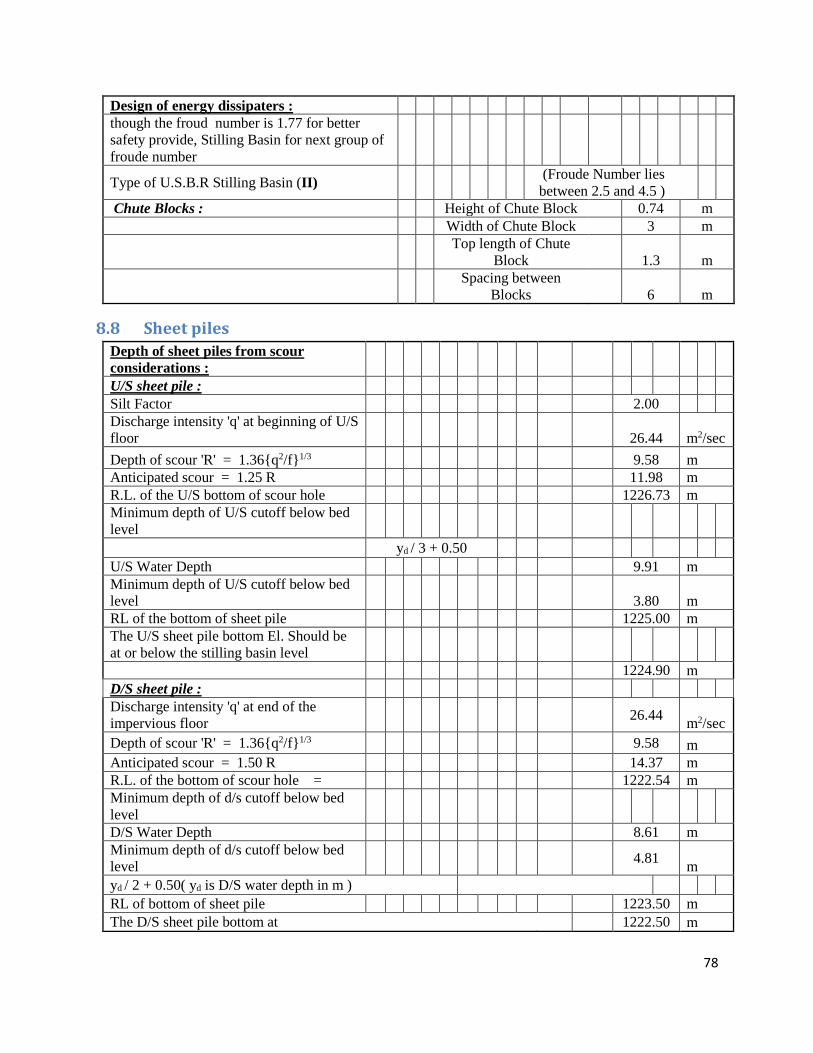
78
Design of energy dissipaters :
though the froud number is 1.77 for better
safety provide, Stilling Basin for next group of
froude number
Type of U.S.B.R Stilling Basin (II)
(Froude Number lies
between 2.5 and 4.5 )
Chute Blocks : Height of Chute Block 0.74 m
Width of Chute Block 3 m
Top length of Chute
Block 1.3 m
Spacing between
Blocks 6 m
8.8 Sheet piles
Depth of sheet piles from scour
considerations :
U/S sheet pile :
Silt Factor 2.00
Discharge intensity 'q' at beginning of U/S
floor 26.44 m2/sec
Depth of scour 'R' = 1.36{q2/f}1/3 9.58 m
Anticipated scour = 1.25 R 11.98 m
R.L. of the U/S bottom of scour hole 1226.73 m
Minimum depth of U/S cutoff below bed
level
yd / 3 + 0.50
U/S Water Depth 9.91 m
Minimum depth of U/S cutoff below bed
level 3.80 m
RL of the bottom of sheet pile 1225.00 m
The U/S sheet pile bottom El. Should be
at or below the stilling basin level
1224.90 m
D/S sheet pile :
Discharge intensity 'q' at end of the
impervious floor 26.44
m2/sec
Depth of scour 'R' = 1.36{q2/f}1/3 9.58 m
Anticipated scour = 1.50 R 14.37 m
R.L. of the bottom of scour hole = 1222.54 m
Minimum depth of d/s cutoff below bed
level
D/S Water Depth 8.61 m
Minimum depth of d/s cutoff below bed
level 4.81
m
yd / 2 + 0.50( yd is D/S water depth in m )
RL of bottom of sheet pile 1223.50 m
The D/S sheet pile bottom at 1222.50 m
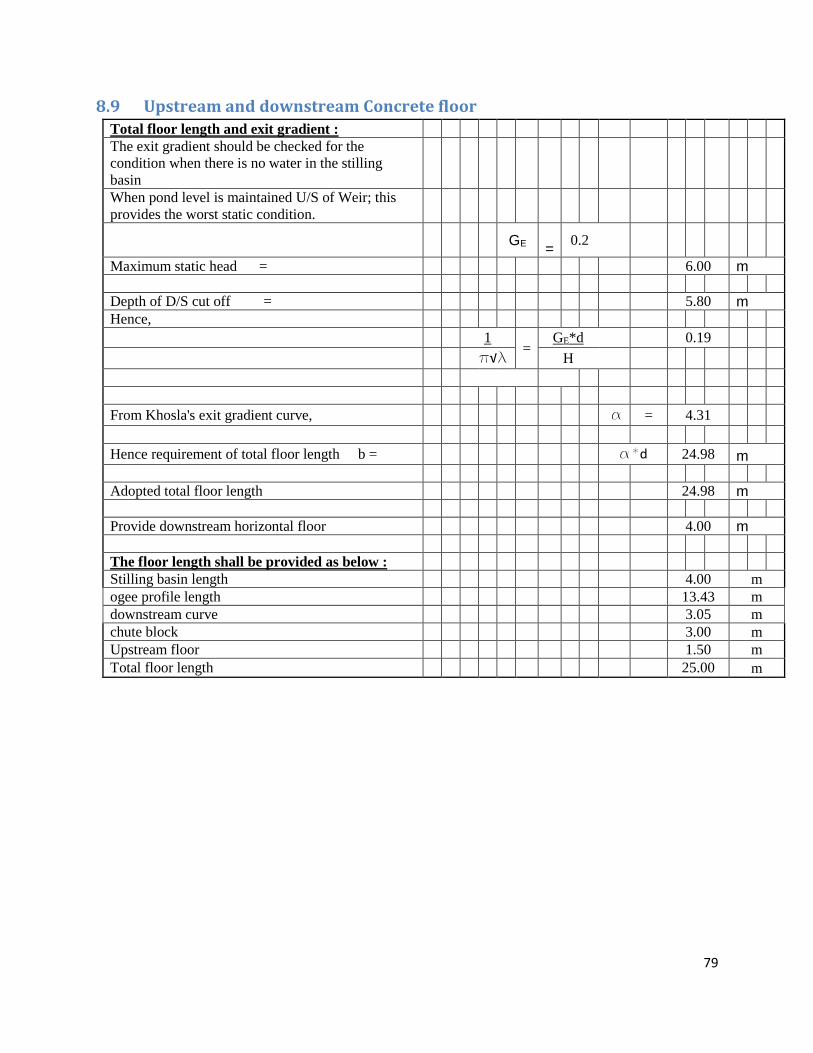
79
8.9 Upstream and downstream Concrete floor
Total floor length and exit gradient :
The exit gradient should be checked for the
condition when there is no water in the stilling
basin
When pond level is maintained U/S of Weir; this
provides the worst static condition.
GE =
0.2
Maximum static head = 6.00 m
Depth of D/S cut off = 5.80 m
Hence,
1 =
GE*d 0.19
p√l H
From Khosla's exit gradient curve, a = 4.31
Hence requirement of total floor length b = a*d 24.98 m
Adopted total floor length 24.98 m
Provide downstream horizontal floor 4.00 m
The floor length shall be provided as below :
Stilling basin length 4.00 m
ogee profile length 13.43 m
downstream curve 3.05 m
chute block 3.00 m
Upstream floor 1.50 m
Total floor length 25.00 m

80
8.10 Pressure calculation
Pressure calculations :
Let us assume the floor thickness in the U/S as 1.00 m
and near the downstream cutoff as 1.25 m
Upstream sheet pile
Let the thickness of cut off wall 0.30 m
d = 3.90 m
b = 25.00 m
1
=
d
b 0.16
From Khosla's Pressure curves
= 3.744
d 76%
C 65%
DC = 11%
Correction for floor thickness = 2.76% (+ ve)
Correction for interference due to d/s sheet pile line, C = 19√D/b'.(d+D)/b
where,
d = 1227.80 - 1224.9 2.90 m
D = 1227.80 - 1222.5 5.30 m
b' = 24.40 m
b = 25.00 m
Then,
C = 2.904% (+ ve)
Ccorrected = 71.09%
Downstream sheet pile
d 5.80 m
b 25.00 m
1
=
d 0.23
b
From Khosla's Pressure
curves
= 2.712
42%
D1 28%
D1 = 13%
Correction for floor thickness = 2.86% (- ve)
Correction for interference due to u/s sheet pile line, C = 19√D/b'.(d+D)/b
Where, d 1227.05 - 1222.50 4.55 m
D 1227.30 - 1224.90 2.40 m
b' 24.40 m
b 25.00 m
Then,'C = 1.657% (- ve)
corrected = 37.02%
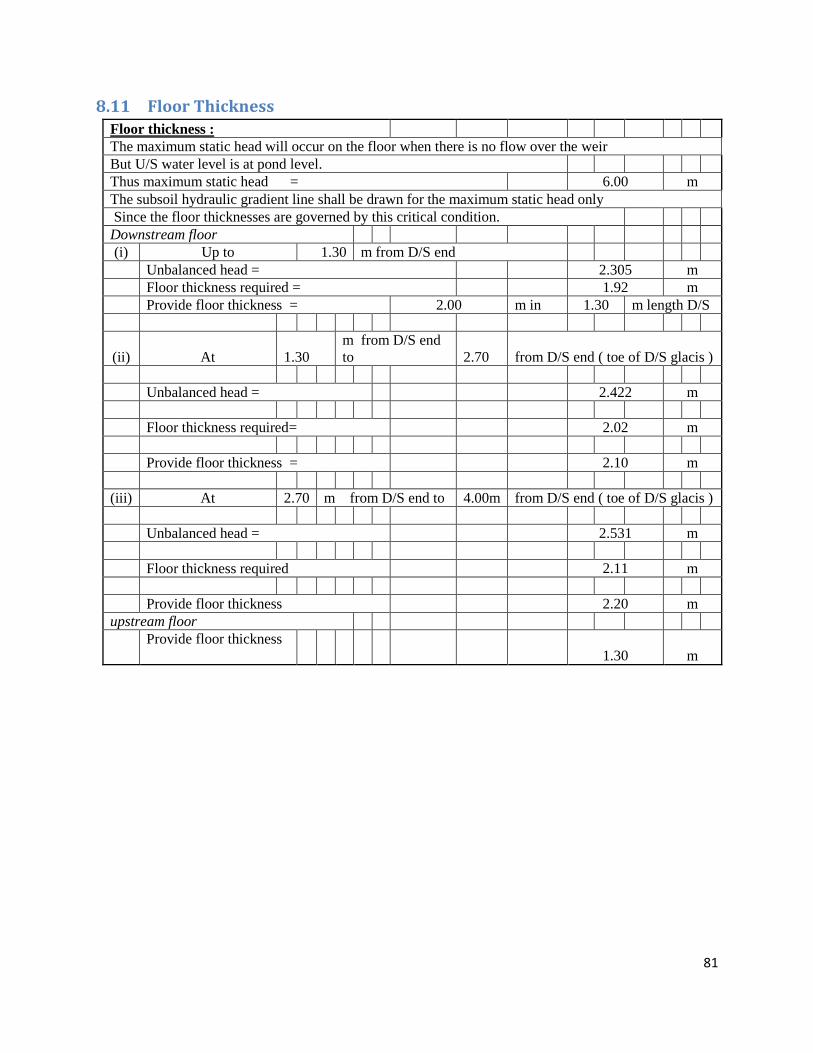
81
8.11 Floor Thickness
Floor thickness :
The maximum static head will occur on the floor when there is no flow over the weir
But U/S water level is at pond level.
Thus maximum static head = 6.00 m
The subsoil hydraulic gradient line shall be drawn for the maximum static head only
Since the floor thicknesses are governed by this critical condition.
Downstream floor
(i) Up to 1.30 m from D/S end
Unbalanced head = 2.305 m
Floor thickness required = 1.92 m
Provide floor thickness = 2.00 m in 1.30 m length D/S
(ii) At 1.30
m from D/S end
to 2.70 from D/S end ( toe of D/S glacis )
Unbalanced head = 2.422 m
Floor thickness required= 2.02 m
Provide floor thickness = 2.10 m
(iii) At 2.70 m from D/S end to 4.00m from D/S end ( toe of D/S glacis )
Unbalanced head = 2.531 m
Floor thickness required 2.11 m
Provide floor thickness 2.20 m
upstream floor
Provide floor thickness
1.30 m
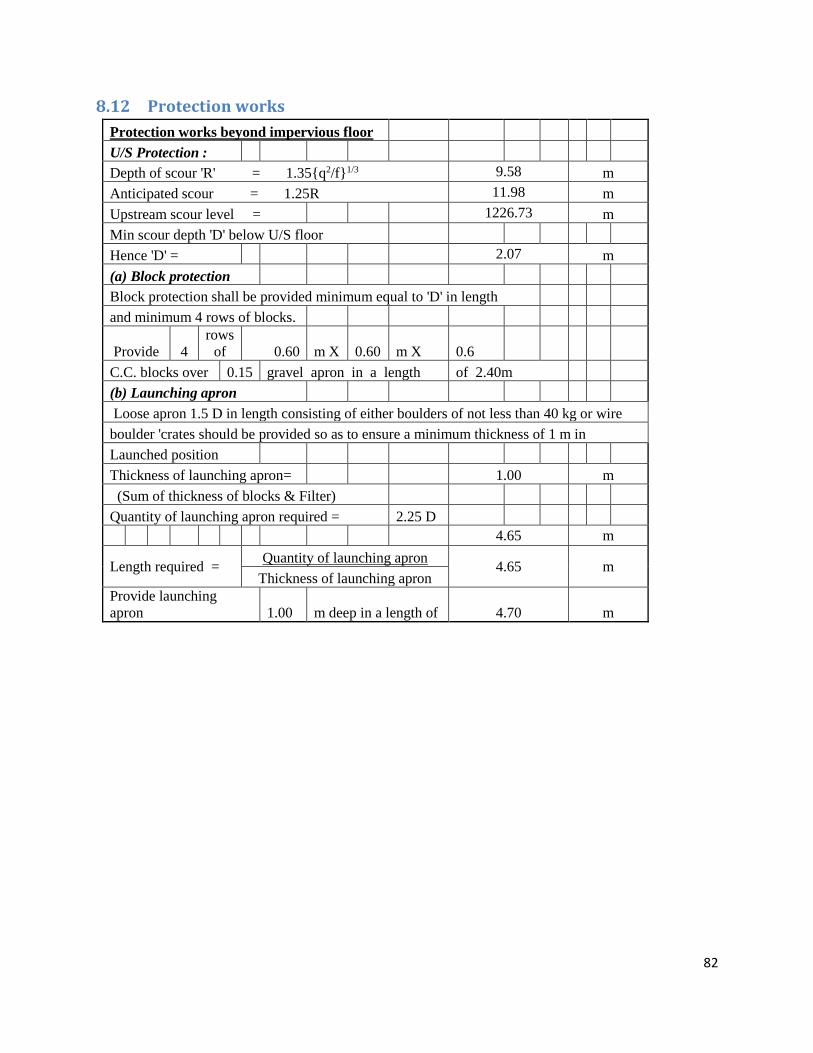
82
8.12 Protection works
Protection works beyond impervious floor
U/S Protection :
Depth of scour 'R' = 1.35{q2/f}1/3 9.58 m
Anticipated scour = 1.25R 11.98 m
Upstream scour level = 1226.73 m
Min scour depth 'D' below U/S floor
Hence 'D' = 2.07 m
(a) Block protection
Block protection shall be provided minimum equal to 'D' in length
and minimum 4 rows of blocks.
Provide 4
rows
of 0.60 m X 0.60 m X 0.6
C.C. blocks over 0.15 gravel apron in a length of 2.40m
(b) Launching apron
Loose apron 1.5 D in length consisting of either boulders of not less than 40 kg or wire
boulder 'crates should be provided so as to ensure a minimum thickness of 1 m in
Launched position
Thickness of launching apron= 1.00 m
(Sum of thickness of blocks & Filter)
Quantity of launching apron required = 2.25 D
4.65 m
Length required = Quantity of launching apron
4.65 m Thickness of launching apron
Provide launching
apron 1.00 m deep in a length of 4.70 m

83
D/S Protection :
Depth of scour 'R' = 1.35{q2/f}1/3 9.58 m2/sec
Anticipated Scour = 1.5R 14.37 m
Downstream scour level 1213.93 m
Scour depth 'D' below D/S floor 14.37 m
(a) Block protection
Block protection shall be provided in a minimum length equal to '2D' which comes
Provide 24 rows of 0.6 m X
0.6m X 0.6 m
C.C. blocks with 5 cm gap filled with Sand over 0.6
m
thick
graded filter in a length of 15.55 m.
(b) Inverted filter
AS per Code of Practice, Just at the end of concrete floor on the downstream an inverted
filter '1.5 to 2 D long (D being the depth of scour below bed ), is provided below the
Concrete block protection. The graded inverted filter of 0.6 m
thick is
proposed
to be provided below the concrete block in a length of 15.55 m
The graded inverted filter should conform to the following design criteria :
D 15 of filter <= 4 <=
D 15 of filter
D 15 of foundation D 85 of foundation
(c) Launching apron
Downstream of the inverted filter, loose apron 1.5 D in length consisting of either
less than 40 kg or wire boulder crates should be provided so as to ensure
a minimum thickness of 1 m in launched position.
Thickness of launching apron= 1.00 m
(Sum of thickness of blocks & Filter)
Quantity of launching apron required = 2.25 D 32.33
Length required = Quantity of launching apron
32.33 m Thickness of launching apron
Provide launching apron 1 m deep in a length of 32.40
because the area is rocky, provide launching apron in a length of 5m
Toe wall :
Also provide a 0.9m thick and 1.00m deep masonry toe wall between
the filter and the launching apron
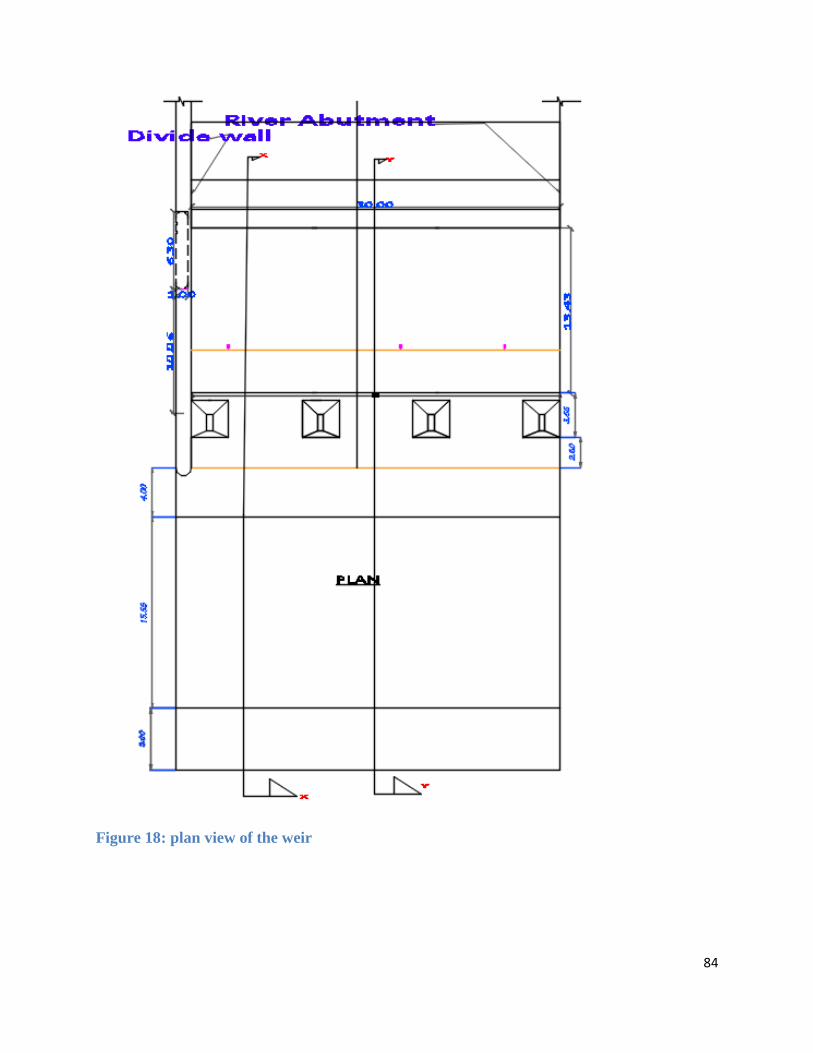
84
Figure 18: plan view of the weir

85
Figure 19: section view of the weir
86
9 Conclusion and Recommendation
9.1 Conclusion On the hydrology analysis, It is noted that by using the HEC-Hms model a peak flood of 1147.5
m3/s is obtained for 1 in 100 year frequency, which is significantly different from the one
previously used during the design (1033 m3/s). The model result for peak flow is 989.5m3/s and
According to the study by (halcrow, 2000), the turbine release fluctuates between 64.78 and
80m3/s. Recent information provided by the Tana Beles hydropower Station is that the maximum
release is 158m3/s, which appears to be the latest information available for the operation of the
hydropower. Adding the maximum value of 158 m3/s to the simulated result, the total peak flood
will be 1147.5m3/s.
The capacity to pass the estimated peak flood (1147.5m3/s) safely over the weir has been checked
and accordingly, the estimated peak flood can safely flow over the weir.
The hydraulic design evaluation shows the absence of the main components of hydraulic design
like concrete floor with its cutoff, upstream and downstream protection works, energy dissipation
and river training works plays a great role for the failure of Tana Beles weir.
The structural analysis shows that the uplift pressure was ignored in that the foundation will
balance it. But absence of sufficient weight of impervious floor and piles on the design created
failure due to uplift by subsurface flow.in addition to this, subsurface flow facilitate the failure by
piping or undermining due to the absence of sufficient length of impervious concrete floor.
The head work site is founded on the naturally bedded basaltic rock, which extends upstream and
downstream of the weir site. The abutments of the river around the weir, downstream and upstream
of the weir axis are basaltic rocks, which has been considered to be quite competent to withstand
the forces due to design flood flowing over the weir and it was decided to dispense with the
lowering of floor up to EL. 1228 as a design standard and provision of concrete/ RCC floor on
upstream and downstream. But taking into account for the foundation, concrete floor has to be
provided both on the upstream and downstream of the weir. Failure by subsurface flow (piping or

87
undermining) happen due to absence of sufficient length of impervious concrete floor and piles at
upstream and downstream end of the impervious floor.
Even though the design was recommended for a foundation with basaltic rock, Physical
observation of the weir site exposes part of downstream and upstream of the weir axis is not hard
rocks (because it is eroded as per surveying data comparison) and design consideration (like
missing of concrete floor) does not guarantee for the actual site condition. Absence of the concrete
floor on the design should be taken as the potential cause for Tana Beles weir failurity.
The foundation condition of the weir site during design was taken as basaltic rock. Accordingly,
No concrete floor and cutoff is provided both on the upstream and downstream of the constructed
weir. But it is observed on the collected surveying data that along the flow direction, the right side
of the channel bed rock foundation is eroded and replaced by alluvial deposit, which cannot
balance the uplift pressure below the structure. Thus, the absence of concrete floor and cutoff can
be taken as a failure cause of the weir.
As per evaluation of the foundation treatment, it is found that the foundation is not treated as per
the required standard which results subsurface erosion to prevail.
Even though there is a direct maximum release of 158m3/s from Tana Beles hydropower Station
no scour was expected during design. Additionally, it was believed that the strata at the
downstream of the weir site is rocky (vesicular basalt), hence retrogression /scour was not
expected. But, it is physically observed that plastering at the surface of the weir is detached due to
scour, which claims the provision of energy dissipater necessary.
In the case of Tana Beles weir design, as water flows by high energy down the sloping glacis, this
maximum energy is not dissipated by flip bucket due to absence on the design and the energy will
scour the downstream floor up to the main weir and this can be taken as a failure causes of Tana
Beles weir.
The rock at the weir site is considered quite competent, no scour is expected and hence no
additional protection works have been provided on the design of Tana Beles Weir. But, the actual
observation and the collected data exposes the rock considered as competent is false and it was
must to provide protection work for the actual condition. The design consideration does not

88
guarantee for the actual site condition and Absence of the protection work on the design should be
taken as the potential cause for Tana Beles weir failurity.
Malfunctioning of the Under sluice gates causes sediment deposition in front of the under sluice
which apparently increase the direct flow of accumulated water into right side of the weir in a way
to find low elevation and this will create pressure on the right side only. On that side of the weir,
the intensity of the failure is higher when compared with the opposite side of the weir. Therefore,
the Malfunctioning of the under sluice gates may be taken as a potential cause for the creation of
major failure on the right side than the left side of the weir.
89
9.2 Recommendation Impervious Concrete floor with piles at the upstream and downstream end of the weir
shall be included to prevent failure due to piping and uplift.
Provision of Energy dissipater like flip bucket, protection works and river training work
have to be included during maintenance of the weir.
The under sluice gates should have to be repaired or changed to electromechanical
operating system and trash racks should have to be provided for a good performance of
the head work.
Geological investigation of an area should be done with great care to get the actual output
which can represent the future long year’s geological condition.
The design should represent the actual site condition of that specific structure
To get accurate estimation of peak flood in the study area there is a need to use
representative meteorological and flow data for the Project site.
Proper hydrologic, hydraulic and structural analyses are very important which
contributes to the good performance and sustainability of the Hydraulic structure.
For future work, GIS Based Hydrologic Modeling using HEC-Geo HMS have to be done
for a better accuracy.
The peak flood estimated using any of the methods have to be considered for the design
of structure in rarest condition.

90
References
Ambaw, W. M. (2016). Hydrological modeling for the failurity Analysis of flow into the Elbeyih Dam
Reservoir, Jigjiga Ethiopia. Addis Ababa: Addis Ababa University Institute of Technology.
Asawa, G. (2008). Irrigation and Water Resource Engineering. New Dehi: New Delhi.
Asquith, W. a. (1997). Regional equations for estimation of peak-stream flow frequency for natural
basins in Texas: U.S. Geological Survey Water-Resources Investigations Report.
Awulachew, S. B. (2010). Irrigation potential in Ethiopia.Constraints and Opportunities for enhancing the
system. Addis Ababa: International Water Management Institute.
Choudhari, K. (2014). Simulation of rainfall-runoff process using HEC-HMS model for Balijore. Odisha,
India: Department of Soil and Water Conservation Engineering, Orissa University of Agriculture.
Enterprise, A. D. (2011). Feasibility and Design Study of Tana Beles Integrated Sugar Development
Project Head Work Design Report. Bahir Dar.
Enterprise, A. D. (2013). Feasibility and Design Study of Tana Beles Integrated Sugar Development
Project Irrigation and Drainage Report. Bahir Dar.
Fikru, H. (2015). performance assessment of diversion head work implemented for irrigation (a case
study on Fentalle Irrigation Based Integrated Development Project. Addis Ababa: Addis Ababa
University Institute os Technology.
Garg, s. (2005). Irrigation Engineering and Hydraulic Structures. Delhi: Khanna.
HAGER, W. H. (1992). Energy Dissipators and Hydraulic Jump. Water science and Technology Library.
halcrow. (2000). hydrology and climate study of Tana Beles.
Jamal, H. (March 2017). Causes of Failure of Weir and their remedy.
Lambiso, R. (2005). Assessment of Design Practices and Performance of Small Scale Irrigation Structures
in South Region,Msc Thesis. Arba Minch University,Ethiopia.
Mohanty, B. (2012). Diversion Head Work,Module. SAL Institute of Engineering and Research.
Richards, K. S. (2015). A Historical Perspective of Piping Theory on Narora and Khanki Weir.
s.k.sharma. (2002). design of irrigation structures. RSM Press.

91
Sharma, P. J. (2017). Identification of Causes of Failureof Downstream Block Protectionfor Singanpore
Weir-Cum-Causeway,Surat. surat: Priyank J. Sharma.
The Constructor.Org. (2013). Retrieved from The Constructor.Org.
wikipedia. (n.d.). Retrieved from /en.wikipedia.org:
https://en.wikipedia.org/wiki/Mnjikaning_Fish_Weirs
Yener, M. (2006). MODELING STUDIES WITH HEC-HMS AND RUNOFF SCENARIOS. Ankara,Turkey:
Department of Civil Engineering, Middle East Technical University, 06531 Ankara/Türkiye.

92
APPENDICES
APPENDIX A: Maximum Rainfall of main beles gauging station
24 Hr Duration Max. Rain fall(mm) for main beles basin
Year
24hr duration Max.
annual ppt (mm) Ascending Y-logr
1985 54.74 85.12 1.93003
1986 52.08 81.36 1.91039
1987 47.05 67.63 1.83016
1988 58.95 64.86 1.81199
1989 67.63 62.39 1.79515
1990 49.79 58.95 1.77051
1991 54.22 54.74 1.73831
1992 50.16 54.39 1.73548
1993 37.88 54.22 1.73413
1994 52.93 53.21 1.72603
1995 62.39 52.99 1.72418
1996 52.99 52.93 1.72374
1997 81.36 52.08 1.71671
1998 50.29 50.87 1.70650
1999 37.10 50.59 1.70404
2000 49.75 50.29 1.70148
2001 50.59 50.16 1.70033
2002 42.17 50.01 1.69907
2003 54.39 49.79 1.69710
2004 47.02 49.75 1.69676
2005 47.18 47.18 1.67375
2006 42.96 47.05 1.67254
2007 38.74 47.02 1.67228
2008 53.21 46.31 1.66567
2009 50.87 42.96 1.63309
2010 50.01 42.17 1.62503
2011 35.02 38.74 1.58814
2012 46.31 37.95 1.57926
2013 64.86 37.88 1.57843
2014 85.12 37.10 1.56933
2015 37.95 35.02 1.54426
ave 51.80 51.80 1.70
Stan deva 11.45 11.45 0.09
Cs 0.543
K 0.091

93
Summary of 24hr for main
beles basin
Return
period
Using log-
Pearson
Distribution
(years) XT=10^YT(mm)
2 46.11
5 58.29
10 68.09
25 82.57
50 95.00
100 108.95
500 148.65
1000 169.59
β λ ε k
13.55 0.024 1.374 0.091
Interval,i Range ni f s(xi) y=X-ε Fs(xi) F(xi) P(xi) Xc2
1 <1.6 5 0.161 0.226 0.161 0.110 0.110 0.741
2 1-6-1.7 9 0.290 0.326 0.452 0.514 0.404 0.993
3 1.7-1.8 13 0.419 0.426 0.871 0.855 0.341 0.559
4 1.8-1.9 2 0.065 0.526 0.935 0.973 0.118 0.760
5 >1.9 2 0.065 0.626 1.000 0.997 0.023 2.289
TOTAL 31 1.000 5.341
X2
31,0.95 44.985 >5.341
X2
31,0.99 52.191 >5.341
Therefore, in both case the hypothesis is accepted
Testing for the Goodness of Fit
Chi square test

94
Appendix B: Maximum flow of Main Beles
Max. flow(m3/s) for main beles basin
Year
Max. annual flow
(m3/s) Ascending Y-logr
1985 848.32 275.80 2.44060
1986 849.32 355.69 2.55107
1987 912.36 390.68 2.59182
1988 795.13 416.36 2.61947
1989 912.36 419.35 2.62258
1990 926.78 428.74 2.63219
1991 914.66 429.58 2.63304
1992 745.37 438.13 2.64161
1993 966.60 445.65 2.64900
1994 666.99 537.55 2.73042
1995 950.05 560.36 2.74847
1996 2,146.50 666.99 2.82412
1997 873.90 669.20 2.82556
1998 929.90 739.84 2.86914
1999 739.84 745.37 2.87237
2000 1,192.07 795.13 2.90044
2001 897.26 813.99 2.91062
2002 537.55 848.32 2.92856
2003 918.38 849.32 2.92907
2004 669.20 873.90 2.94146
2005 813.99 897.26 2.95292
2006 429.58 912.36 2.96017
2007 419.35 912.36 2.96017
2008 438.13 914.66 2.96126
2009 416.36 918.38 2.96302
2010 428.74 926.78 2.96698
2011 275.80 929.90 2.96843
2012 445.65 950.05 2.97775
2013 355.69 966.60 2.98525
2014 390.68 1,192.07 3.07630
2015 560.36 2,146.50 3.33173
ave 753.77 753.77 2.84
Stan deva 350.58 350.58 0.19
Cs 0.013
K 0.002

95
Summery of 24hr
Return
period
Using log-
Pearson
Distribution
(years) XT=10^YT(m3/s)
2 581.14
5 942.21
10 1242.53
25 1691.62
50 2077.33
100 2507.51
β λ ε k
24432.15 0.001 -26.564 0.002
Interval,i Range ni f s(xi) y=X-ε Fs(xi) F(xi) P(xi) Xc2
1 <2.5 1.00 0.032 29.064 0.032 0.036 0.036 0.012
2 2.5-2.6 2.00 0.065 29.164 0.097 0.103 0.067 0.003
3 2.6-2.7 6.00 0.194 29.264 0.290 0.233 0.129 0.982
4 2.7-2.8 2.00 0.065 29.364 0.355 0.422 0.189 2.543
5 2.8-2.9 4.00 0.129 29.464 0.226 0.631 0.528 9.335
6 2.9-3 14.00 0.452 29.564 0.742 0.806 0.574 0.805
7 3-3.3 1.00 0.032 29.664 0.387 0.918 0.497 13.460
10 >3.3 1.00 0.032 29.964 0.258 0.999 0.368 9.491
TOTAL 31 1.000 36.631
X2
31,0.95 44.985 > 36.631
X2
31,0.99 52.191 > 36.631 Difference 8.354 for log pearson for 95%
Therefore, in both case the hypothesis is accepted 15.560 for log pearson for 99%
Testing for the Goodness of Fit
Chi square test
96
APPENDIX C: Maximum Rainfall of Weir site
24 Hr Duration Max. Rain fall(mm) of Weir site
Year
24hr duration Max.
annual ppt (mm) Ascending
Y-logr
1985 89.70 119.33 2.07677
1986 70.20 110.84 2.04469
1987 63.90 107.07 2.02965
1988 65.16 91.02 1.95913
1989 79.10 90.00 1.95426
1990 110.84 89.70 1.95281
1991 90.00 88.73 1.94805
1992 79.26 88.36 1.94624
1993 78.04 88.26 1.94575
1994 72.14 87.89 1.94395
1995 82.79 84.77 1.92826
1996 76.81 84.66 1.92766
1997 88.36 84.13 1.92497
1998 76.87 82.79 1.91796
1999 91.02 80.36 1.90502
2000 107.07 79.55 1.90065
2001 119.33 79.26 1.89906
2002 84.66 79.10 1.89818
2003 79.55 78.04 1.89229
2004 84.13 76.87 1.88578
2005 87.89 76.84 1.88558
2006 76.84 76.81 1.88541
2007 84.77 75.10 1.87567
2008 88.26 72.14 1.85820
2009 66.61 70.20 1.84631
2010 64.49 67.37 1.82849
2011 75.10 66.61 1.82356
2012 88.73 65.16 1.81396
2013 80.36 64.49 1.80950
2014 67.37 63.90 1.80553
2015 59.11 59.11 1.77165
ave 81.56 81.56 1.91
Stan deva 13.58 13.58 0.07
Cs 0.386
K 0.064

97
Summary of 24hr
Return
period
Using log-
Pearson
Distribution
(years) XT=10^YT(mm)
2 75.05
5 89.99
10 101.00
25 116.07
50 128.12
100 140.89
500 173.89
1000 189.79
β λ ε k
26.78 0.013 1.545 0.064
Interval,i Range ni f s(xi) y=X-ε Fs(xi) F(xi) P(xi) Xc2
1 <1.8 1 0.032 0.255 0.032 0.051 0.051 0.216
2 1.8-1.85 6 0.194 0.305 0.226 0.217 0.166 0.145
3 1.85-1.9 8 0.258 0.355 0.484 0.491 0.275 0.031
4 1.9-1.95 10 0.323 0.405 0.806 0.749 0.257 0.510
5 1.95-2 3 0.097 0.455 0.903 0.905 0.156 0.694
6 >2 3 0.097 0.505 1.000 0.971 0.067 0.420
TOTAL 31 1.000 2.016
X2
31,0.95 44.985 >2.607
X2
31,0.99 52.191 >2.607
Therefore, in both case the hypothesis is accepted
Testing for the Goodness of Fit
Chi square test

98
APPENDIX D: Hydrologic Analysis 30 years of daily data for the nearby stations of the project site were collected from Ethiopian
National Meteorological Agency (NMA). Rainfall records of the selected catchments were
completed by correlating their long term flow rate records with other hydrological stations which
have similar characteristics. A number of stations in most of the Ethiopian river basin have
incomplete records. In order to make use of the partially recorded data, missing values need to be
filled in sequence. To fill the missing recorded stream flow gauging data various methods are
available. The missing values were filled with multiple station correlation.
Hydrologic processes such as Floods are excitedly complex natural events. They are result of a
number of component parameters and are therefore very difficult to model analytically. For
example the floods in a catchment depend upon the characteristics of the catchment, rainfall and
antecedent conditions, each one of these factors in turn depend upon a lots of constitute parameters.
This makes the estimation of flood peak a very complex problem leading to many different
approaches.
In the analysis of rainfall frequency the probability of occurrence of a particular extreme rainfall
(24 hr. maximum rainfall) is important and it is obtained by the frequency analysis of point rainfall
depth.
The prediction of peak flows from rainfall over a catchments involves estimation of daily
maximum rainfall for a given return period and conversion of the daily maximum rainfall to runoff
hydrograph at the desired location.
Representative Meteorological stations are selected by thiessen polygon in which maximum
rainfall data of meteorological stations located on each polygon surrounding the catchment will be
weighted and used for the model simulation. Accordingly, Bahir Dar and Mandura are the only
representative meteorological stations and their maximum rainfall data is converted into rainfall
data of project area by aerial weighted method.
To determine the mean areal rainfall, the rainfall amount of each station is multiplied by the area
of its polygon and the sum of these products is divided by the total area of the catchment.
Paver=P1A1+P2A2+P3A3+⋯PnAn
A1+A2+A3+⋯An……………………………………………..Eqn (1)
99
Table: maximum daily rainfall of project area
Year of record 1980 1981 1982 1983 1984 1985 1986 1987 1988
Maximum
daily rainfall
89.7 70.2 63.9 65.16
Year of record 1989 1990 1991 1992 1993 1994 1995 1996 1997
Maximum
daily rainfall
79.1 110.8
4
90 79.26 78.04 72.14 82.79 76.81 88.36
Year of record 1998 1999 2000 2001 2002 2003 2004 2005 2006
Maximum
daily rainfall
76.87 91.02 107.0
7
119.3
3
84.66 79.55 84.13 87.89 76.84
Year of record 2007 2008 2009 2010 2011 2012 2013 2014 2015
Maximum
daily rainfall
84.77 88.26 66.61 64.49 75.1 88.73 80.36 67.37 59.11
Out of the commonly used frequency distribution functions for the prediction of extreme maximum
values, Log Pearson is used to distribute maximum rainfall into hourly based values for each return
period.
In this method the flow data is first transformed into logarithmic form (base ten) and the
transformed data is then analyzed. If X is the variety of random flow series then the series of Z
varieties where are obtained for this series for any recurrence interval T.
𝐙=𝐥𝐨𝐠𝐗𝐓 …………………………………………………………………………….Eqn (1)
𝐙𝐓=Z̅+𝐊𝐙𝛅𝐙…………………………………………………………………………..Eqn (2)
Where, KZ= a frequency factor which is a function of T and the coefficient of skewness, Cs
δZ= standard deviation of Z variety sample
δZ=√Σ(Z−Z̅)2=0.07…….………………………………………………….……Eqn (3)
(N−1)
100
𝐂𝐬=𝐍Σ(𝐙−Z̅)𝟑=0.386……………………………………………………….….Eqn (4)
(𝐍−𝟏)(𝐍−𝟐)(𝛅𝐙)𝟑
Where Z̅= mean of the sample.
N= sample size = Number of year of record.
The variation of Kz =f (CS, T) is given the annex in table F
KZ =3.482
Z̅=1.91
𝐗𝐓=𝟏𝟎𝐙𝐓=140.89mm
Since the 100 year peak flood shall be computed for comparison and redesign of weir, the 100yrs,
24hr rain fall computed is 46.36mm and changed to incremental rainfall using alternate block
method as shown below.
Table: maximum hourly rainfall of study area
Time Hourly
p=M*sqrt(T) Incremental
depth
Time
Interval
Precipitation
using
Alternate
Method
cumulative
hr mm mm hr mm mm
0.5 6.69 6.69 0---0.5 1.48 0.49
1 9.46 2.77 0.5---1 1.51 0.98
1.5 11.59 2.13 1---1.5 1.54 1.49
2 13.38 1.79 1.5---2 1.58 2.01
2.5 14.96 1.58 2-2.5 1.62 2.54
3 16.39 1.43 2.5---3 1.66 3.09
3.5 17.70 1.31 3---3.5 1.71 3.65
4 18.92 1.22 3.5---4 1.76 4.23
4.5 20.07 1.15 4---4.5 1.81 4.82
5 21.16 1.09 4.5---5 1.87 5.44
5.5 22.19 1.03 5---5.5 1.94 6.08
6 23.18 0.99 5.5---6 2.01 6.74
6.5 24.12 0.95 6---6.5 2.10 7.43
7 25.04 0.91 6.5---7 2.19 8.15
7.5 25.91 0.88 7---7.5 2.30 8.91
8 26.76 0.85 7.5---8 2.43 9.71
8.5 27.59 0.82 8---8.5 2.58 10.56
9 28.39 0.80 8.5---9 2.77 11.47
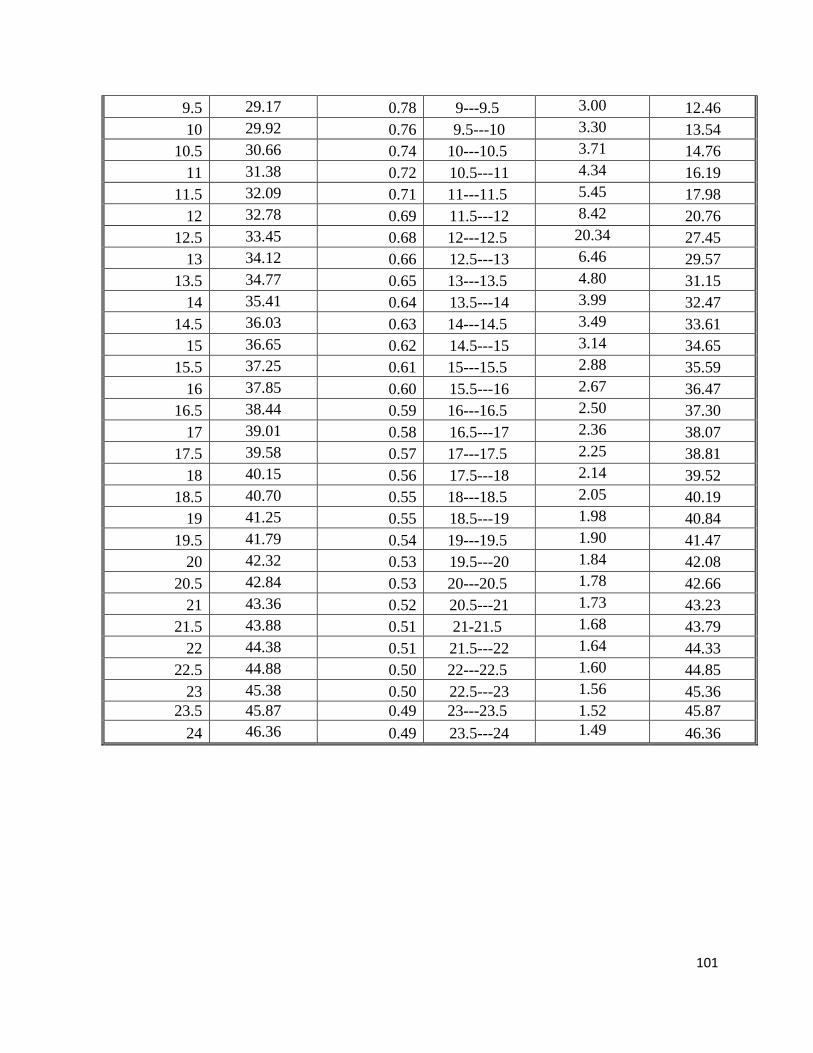
101
9.5 29.17 0.78 9---9.5 3.00 12.46
10 29.92 0.76 9.5---10 3.30 13.54
10.5 30.66 0.74 10---10.5 3.71 14.76
11 31.38 0.72 10.5---11 4.34 16.19
11.5 32.09 0.71 11---11.5 5.45 17.98
12 32.78 0.69 11.5---12 8.42 20.76
12.5 33.45 0.68 12---12.5 20.34 27.45
13 34.12 0.66 12.5---13 6.46 29.57
13.5 34.77 0.65 13---13.5 4.80 31.15
14 35.41 0.64 13.5---14 3.99 32.47
14.5 36.03 0.63 14---14.5 3.49 33.61
15 36.65 0.62 14.5---15 3.14 34.65
15.5 37.25 0.61 15---15.5 2.88 35.59
16 37.85 0.60 15.5---16 2.67 36.47
16.5 38.44 0.59 16---16.5 2.50 37.30
17 39.01 0.58 16.5---17 2.36 38.07
17.5 39.58 0.57 17---17.5 2.25 38.81
18 40.15 0.56 17.5---18 2.14 39.52
18.5 40.70 0.55 18---18.5 2.05 40.19
19 41.25 0.55 18.5---19 1.98 40.84
19.5 41.79 0.54 19---19.5 1.90 41.47
20 42.32 0.53 19.5---20 1.84 42.08
20.5 42.84 0.53 20---20.5 1.78 42.66
21 43.36 0.52 20.5---21 1.73 43.23
21.5 43.88 0.51 21-21.5 1.68 43.79
22 44.38 0.51 21.5---22 1.64 44.33
22.5 44.88 0.50 22---22.5 1.60 44.85
23 45.38 0.50 22.5---23 1.56 45.36
23.5 45.87 0.49 23---23.5 1.52 45.87
24 46.36 0.49 23.5---24 1.49 46.36

102
APPENDIX E: Rating Curve
1228.00
1230.00
1232.00
1234.00
1236.00
1238.00
1240.00
0 500 1000 1500 2000
Elev
atio
n (
mas
l)
Discharge (m3/s)
Rating Curve
Rating Curve