Inner ear histopathology in “nervous Pointer dogs” with severe hearing loss
Upload
khangminh22Category
view
3download
0
INVESTIGATION OF THE GENETIC CAUSE OF HEARING LOSS IN
NEWFOUNDLAND FAMILIES
by © Cindy Penney
Thesis submitted to the School of Graduate Studies
in partial fulfillment of the requirements for the degree of
Master of Science Medicine
Human Genetics/Faculty of Medicine
Memorial University of Newfoundland
May 2018
St. John’s Newfoundland and Labrador
ii
Abstract
The purpose of this study was to determine the genetic cause of hearing loss in a
seven-generation Newfoundland family. Twenty-nine family members were recruited
segregating autosomal dominant hearing loss. Genome-wide SNP genotyping and linkage
analysis showed significant linkage (LOD=4.77) to chromosome 13q34. The region
contained 26 genes and a known deafness locus (DFNA33). Exome sequencing identified
13 variants of interest within the linked region, but only 3 co-segregated with hearing
loss: F10 c.865+26C>T, ADPRHL1 c.380-17C>A and c.380-16T>G. All three were
absent from 81 population controls, yet the ADPRHL1 c.380-17C>A and c.380-16T>G
were identified in two other probands with hearing loss. All three were predicted to affect
splicing of nearby exons, however cDNA analysis of ADPRHL1 showed no effect.
F10 c.865+26C>T, ADPRHL1 c.380-17C>A and c.380-16T>G are rare, co-
segregate with hearing loss, and are possibly pathogenic. Conversely, they may help form
a disease haplotype and exist in linkage disequilibrium with the causal mutation.
However, the putative ADPRHL1 variants have been found in multiple families with
hearing loss and further investigations are necessary to elucidate their effect.
iii
Acknowledgements
My thesis project has been an exciting learning experience. It gave me the
opportunity to learn the latest molecular genetics techniques, to be involved in clinical
recruitment and testing and to meet the families our research impacts.
Over the course of my Master’s I have received an enormous amount of support and
there are many people I would like to thank. First, I would like to thank my supervisor,
Dr. Terry-Lynn Young, and my supervisory committee of Dr. Darren O’Rielly and Dr.
Susan Stanton, for their guidance throughout my Master’s program.
I would like to thank past and current members of the Young Lab who have taught
me a wide range of laboratory techniques, especially Mrs. Tammy Benteau, Mr. Justin
Pater, Mr. Dante Galutira, and Dr. Nelly Abdelfatah. I would also like to thank Mr. Jim
Houston for his help in troubleshooting difficult techniques as I could always rely on his
experience to guide me in the right direction. I am grateful to Ms. Sarah Predham and Dr.
Kathy Hodgkinson for their work in ascertaining more family members on our trip to
Deer Lake. I would like to thank Ms. Anne Griffin, for her help in recruitment,
audiological testing, and phenotyping.
I would like to thank members of the Rahman-O’Rielly Lab which were always
ready to offer technical expertise, especially during the development of the next-
generation sequencing (NGS) protocol.
I would like to thank the participants and their families, without which my research
would not be possible. I would also like to thank the Research & Development
iv
Corporation (RDC) of Newfoundland and Labrador, the Canadian Institutes of Health
Research (CIHR), and Memorial University of Newfoundland and Labrador (MUN) for
their financial support.
I would like to give a special thanks to the Janeway Children's Health and
Rehabilitation Centre, for use of their audiology testing space. Thanks to Nicole Roslin
and the Center for Applied Genomics in Toronto for completing the genome-wide SNP
genotyping and linkage analysis.
I would also like to thank the reviewers for their constructive criticisms and
insightful comments that have led to an improved thesis.
I would especially like to thank David Metcalfe, my husband, for his support
during my Master’s program and his assistance in editing my thesis. Lastly, I would like
to thank my parents for their unending support and encouragement throughout my
academic career.
v
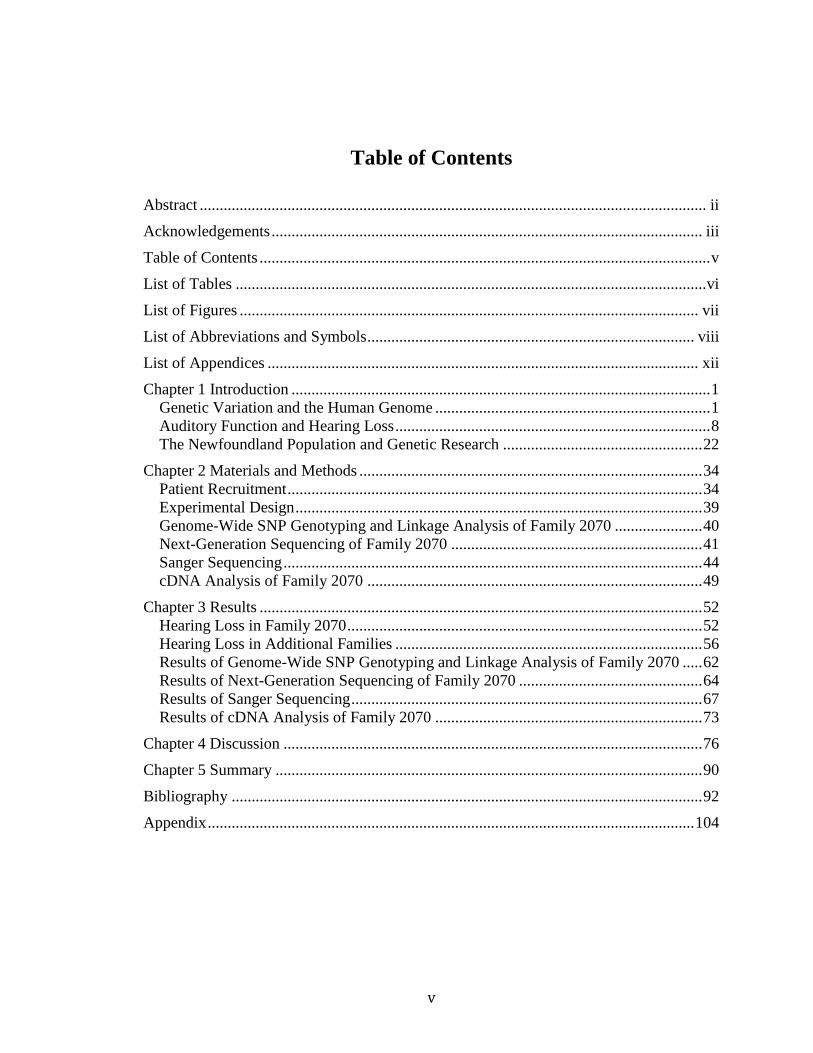
Table of Contents
Abstract ............................................................................................................................... ii
Acknowledgements ............................................................................................................ iii
Table of Contents ................................................................................................................. v
List of Tables ...................................................................................................................... vi
List of Figures ................................................................................................................... vii
List of Abbreviations and Symbols .................................................................................. viii
List of Appendices ............................................................................................................ xii
Chapter 1 Introduction ......................................................................................................... 1
Genetic Variation and the Human Genome ..................................................................... 1
Auditory Function and Hearing Loss ............................................................................... 8
The Newfoundland Population and Genetic Research .................................................. 22
Chapter 2 Materials and Methods ...................................................................................... 34
Patient Recruitment ........................................................................................................ 34
Experimental Design ...................................................................................................... 39
Genome-Wide SNP Genotyping and Linkage Analysis of Family 2070 ...................... 40
Next-Generation Sequencing of Family 2070 ............................................................... 41
Sanger Sequencing ......................................................................................................... 44
cDNA Analysis of Family 2070 .................................................................................... 49
Chapter 3 Results ............................................................................................................... 52
Hearing Loss in Family 2070 ......................................................................................... 52
Hearing Loss in Additional Families ............................................................................. 56
Results of Genome-Wide SNP Genotyping and Linkage Analysis of Family 2070 ..... 62
Results of Next-Generation Sequencing of Family 2070 .............................................. 64
Results of Sanger Sequencing ........................................................................................ 67
Results of cDNA Analysis of Family 2070 ................................................................... 73
Chapter 4 Discussion ......................................................................................................... 76
Chapter 5 Summary ........................................................................................................... 90
Bibliography ...................................................................................................................... 92
Appendix .......................................................................................................................... 104
vi
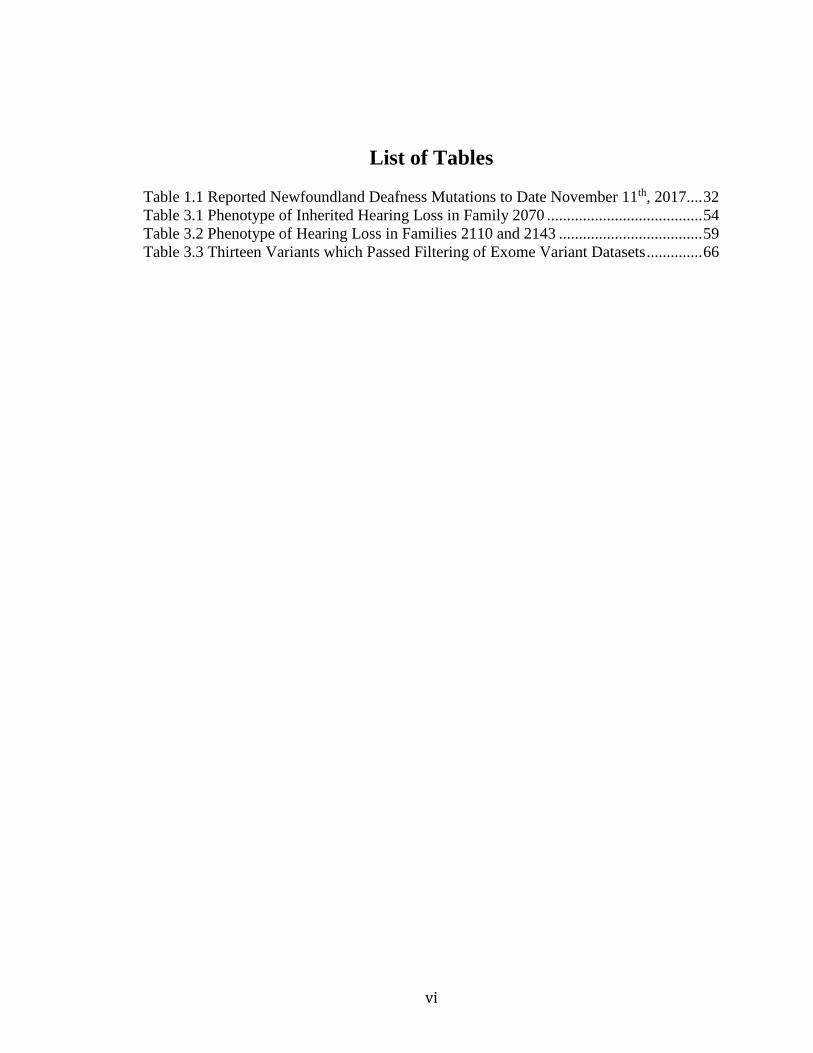
List of Tables
Table 1.1 Reported Newfoundland Deafness Mutations to Date November 11th, 2017 .... 32 Table 3.1 Phenotype of Inherited Hearing Loss in Family 2070 ....................................... 54 Table 3.2 Phenotype of Hearing Loss in Families 2110 and 2143 .................................... 59
Table 3.3 Thirteen Variants which Passed Filtering of Exome Variant Datasets .............. 66
vii
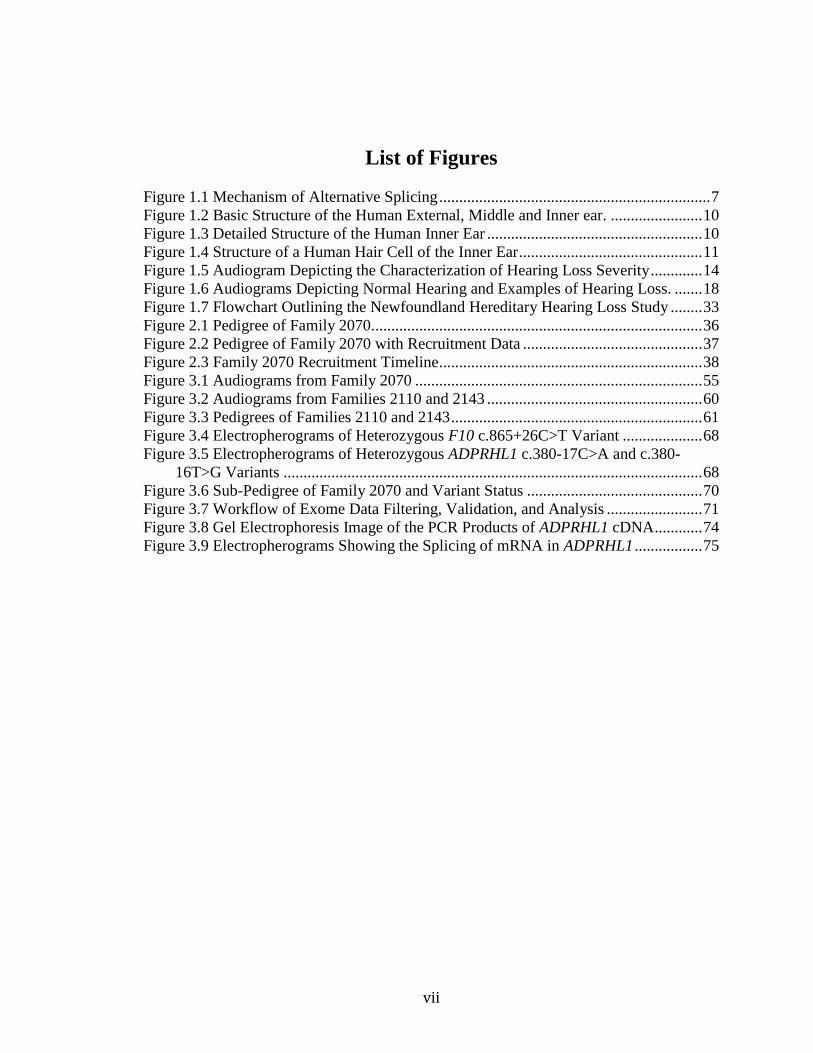
List of Figures
Figure 1.1 Mechanism of Alternative Splicing .................................................................... 7 Figure 1.2 Basic Structure of the Human External, Middle and Inner ear. ....................... 10 Figure 1.3 Detailed Structure of the Human Inner Ear ...................................................... 10
Figure 1.4 Structure of a Human Hair Cell of the Inner Ear .............................................. 11 Figure 1.5 Audiogram Depicting the Characterization of Hearing Loss Severity ............. 14 Figure 1.6 Audiograms Depicting Normal Hearing and Examples of Hearing Loss. ....... 18 Figure 1.7 Flowchart Outlining the Newfoundland Hereditary Hearing Loss Study ........ 33
Figure 2.1 Pedigree of Family 2070................................................................................... 36 Figure 2.2 Pedigree of Family 2070 with Recruitment Data ............................................. 37 Figure 2.3 Family 2070 Recruitment Timeline .................................................................. 38
Figure 3.1 Audiograms from Family 2070 ........................................................................ 55
Figure 3.2 Audiograms from Families 2110 and 2143 ...................................................... 60 Figure 3.3 Pedigrees of Families 2110 and 2143 ............................................................... 61 Figure 3.4 Electropherograms of Heterozygous F10 c.865+26C>T Variant .................... 68
Figure 3.5 Electropherograms of Heterozygous ADPRHL1 c.380-17C>A and c.380-
16T>G Variants ......................................................................................................... 68
Figure 3.6 Sub-Pedigree of Family 2070 and Variant Status ............................................ 70 Figure 3.7 Workflow of Exome Data Filtering, Validation, and Analysis ........................ 71 Figure 3.8 Gel Electrophoresis Image of the PCR Products of ADPRHL1 cDNA ............ 74
Figure 3.9 Electropherograms Showing the Splicing of mRNA in ADPRHL1 ................. 75
viii
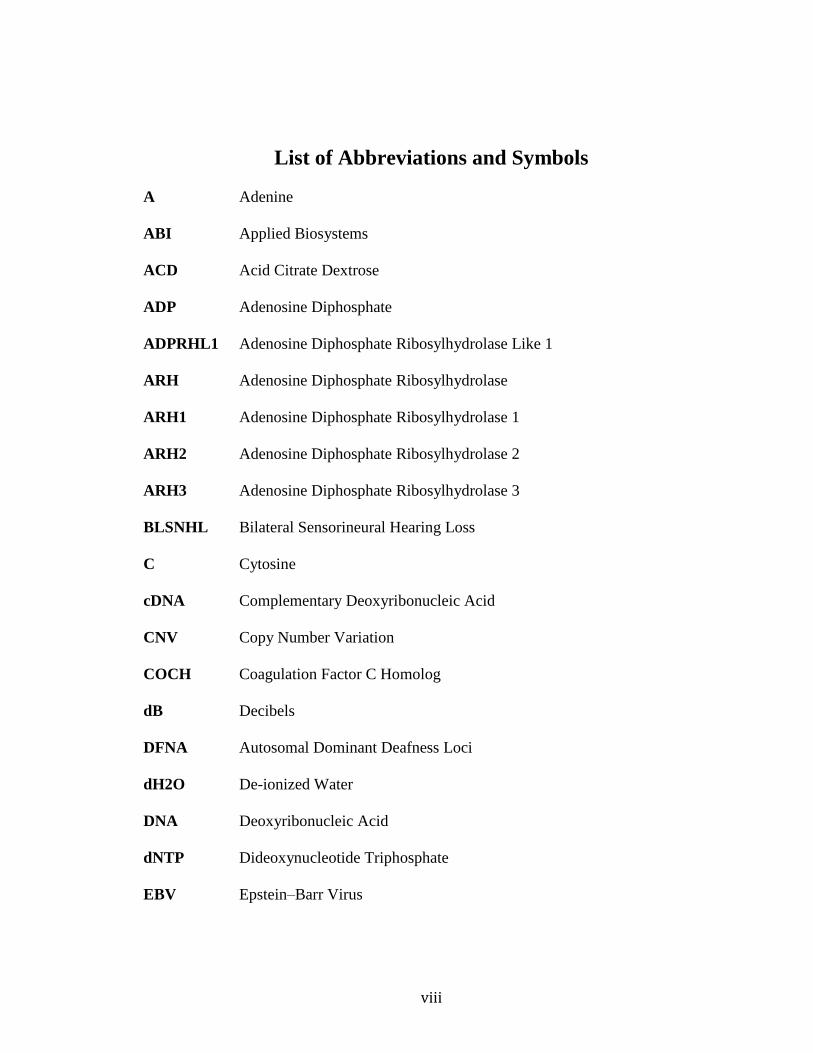
List of Abbreviations and Symbols
A Adenine
ABI Applied Biosystems
ACD Acid Citrate Dextrose
ADP Adenosine Diphosphate
ADPRHL1 Adenosine Diphosphate Ribosylhydrolase Like 1
ARH Adenosine Diphosphate Ribosylhydrolase
ARH1 Adenosine Diphosphate Ribosylhydrolase 1
ARH2 Adenosine Diphosphate Ribosylhydrolase 2
ARH3 Adenosine Diphosphate Ribosylhydrolase 3
BLSNHL Bilateral Sensorineural Hearing Loss
C Cytosine
cDNA Complementary Deoxyribonucleic Acid
CNV Copy Number Variation
COCH Coagulation Factor C Homolog
dB Decibels
DFNA Autosomal Dominant Deafness Loci
dH2O De-ionized Water
DNA Deoxyribonucleic Acid
dNTP Dideoxynucleotide Triphosphate
EBV Epstein–Barr Virus
ix
EDTA Ethylenediaminetetraacetic acid
ESE Exonic Splicing Enhancer
ExAC Exome Aggregation Consortium
F10 Coagulation Factor X
FOXL1 Forkhead Box L1
G Guanine
gDNA Genomic Deoxyribonucleic Acid
GJB2 Gap Junction, Beta 2
GJB6 Gap Junction, Beta 6
HNPCC Hereditary Non-Polyposis Colon Cancer
Hz Hertz
ISP Ion Sphere Particles
KCNQ4 Potassium Voltage-Gated Channel 4
L Litre
MAF Minor Allele Frequency
MgCl2 Magnesium Chloride
mM Millimolar
MSH2 MutS Homolog 2
Mt Mutant
MT-RNR1 Mitochondrially Encoded 12S RNA
mRNA Messenger Ribonucleic Acid
NCBI National Center for Biotechnology
ng Nanogram
x
NGS Next-Generation Sequencing
NL Newfoundland and Labrador
NMD Nonsense-Mediated Decay
NSHL Nonsyndromic Hearing Loss
OMIM Online Mendelian Inheritance of Man
PARP1 Poly (Adenosine Diphosphate-Ribose) Polymerase 1
PCDH15 Protocadherin-15
PCR Polymerase Chain Reaction
PID Patient Identification
pM Picomolar
RNA Ribonucleic Acid
RPMI Roswell Park Memorial Institute
rcf Relative Centrifugal Force
SMPX Small Muscle Protein, X-linked
SNHL Sensorineural Hearing Loss
SNP Single Nucleotide Polymorphism
T Thymine
Taq Thermus aquaticus DNA Polymerase
TBE Tris/Borate/EDTA Buffer
TCAG The Centre for Applied Genomics
TECTA Tectorin Alpha
TMPRSS3 Transmembrane Protease 3, Serine 3
U Uracil
xi
WFS1 Wolframin Syndrome 1 (wolframin)
Wt Wild-type
μL Microlitre
μM Micromolar
UV Ultraviolet
xii
List of Appendices
Appendix A GENDEAF Recommendations .................................................................. 105
Appendix B Consent Form for Hearing Loss Project ..................................................... 107 Appendix C Hearing Loss Study Medical Information Questionnaire ........................... 115 Appendix D Consent for Release of Audiological Records ........................................... 122 Appendix E Lab Requisition Form ................................................................................. 123 Appendix F Linkage Analysis Report for Family 2070.................................................. 124
Appendix G Polymerase Chain Reaction Master Mix. ................................................... 134 Appendix H Primer Sequences for Validation of NGS Dataset ..................................... 135
Appendix I Polymerase Chain Reaction Thermocycler Program ................................... 136
Appendix J ABI Cycle Sequencing Master Mix ............................................................. 137 Appendix K ABI Cycle Sequencing Thermocycler Program ......................................... 138 Appendix L Primer Sequences for cDNA Analysis of ADPRHL1 ................................. 139 Appendix M Phenotype of Unspecified Hearing Loss in Family 2070 .......................... 140
Appendix N Audiograms of Unspecified Hearing Loss in Family 2070........................ 141 Appendix O Audiograms of Inherited Hearing Loss in 4th Generation of Family 2070 142
Appendix P Audiograms of Inherited Hearing Loss in 5th Generation of Family 2070 . 143 Appendix Q Audiograms of Inherited Hearing Loss in 6th Generation of Family 2070 144 Appendix R Coverage of Exome Sequencing Panel Design in Linked Region ............. 145
Appendix S Coverage of Exome Sequencing Run of V-10 in Linked Region ............... 146
1
Chapter 1 Introduction
Genetic Variation and the Human Genome
DNA or deoxyribonucleic acid contains the molecular instructions necessary for
human life. Our DNA encodes approximately 20,000-25,000 genes and contains 2.85
billion nucleotides (International Human Genome Sequencing Consortium, 2004). The
base sequence of DNA is composed of adenine (A), guanine (G), cytosine (C), and
thymine (T), and provides the instructions for making proteins. A permanent change in
the DNA sequence is called a variant. Variants can be sporadic (spontaneous) or inherited
and there are several different types, ranging from small substitutions, insertions and
deletions, to large chromosomal rearrangements.
More than 10,000,000 variants have been identified in the human genome (Lek et
al., 2016). These genetic variations alter the DNA sequence and can have an effect on the
transcribed mRNA (messenger ribonucleic acid) and consequently the translated amino
acid sequence of the protein. Thankfully, most of these variants have little to no impact
and are considered benign but some are pathogenic and lead to disease.
A variant’s impact on phenotype is influenced by its sequence location. The
variant position is important because only 1.2% of the genome is translated into proteins
(International Human Genome Sequencing Consortium, 2004). Therefore, if the variant
occurs in a protein-coding exon (expressed sequence) it is more likely to have an effect
on protein function than if it occurs in an intron (intervening sequence). Not surprisingly,
2
85% of pathogenic mutations are located in the exome (Majewski, Schwartzentruber,
Lalonde, Montpetit, & Jabado, 2011).
It is important to note that on average the exome contains a variant every 8 base
pairs (bp), so not all exonic variants are pathogenic (Lek et al., 2016). Evolutionary
conservation of the amino acid across multiple species is a good indicator that it plays an
important role in protein function and that changes could have a devastating effect.
Bioinformatics software like SIFT (Sorting Intolerant From Tolerant) examine the degree
of conservation of amino acid residues and predict the effect of a change
(http://sift.jcvi.org/). Another aspect to consider is the actual amino acid substitution.
Programs like Polyphen-2 (Polymorphism Phenotyping v2) attempt to predict the
possible impact of an amino acid substitution on the structure and function of a protein
(http://genetics.bwh.harvard.edu/pph2/). Biochemical differences between the amino
acids, such as charged versus uncharged side chains, can cause a loss of function.
Furthermore, some genetic variations can lead to stop codons and premature truncation of
the protein.
Intronic variants can also be pathogenic. Part of mRNA processing is the removal
of introns and ligation of exons through RNA splicing (Wang et al., 2015). This process is
dependent on the recognition of conserved, intronic sequences like the splice donor and
acceptor sites which denote the boundary between intron and exon (Chen & Manley,
2009). RNA splicing is further aided by nearby exonic splicing enhancers (ESEs) that
encourage recognition of splice sites by aiding in the recruitment of splicing proteins
(Chen & Manley, 2009). Variants that occur within the intron-exon boundary or splicing
enhancer sites can affect mRNA processing and the resultant protein.
3
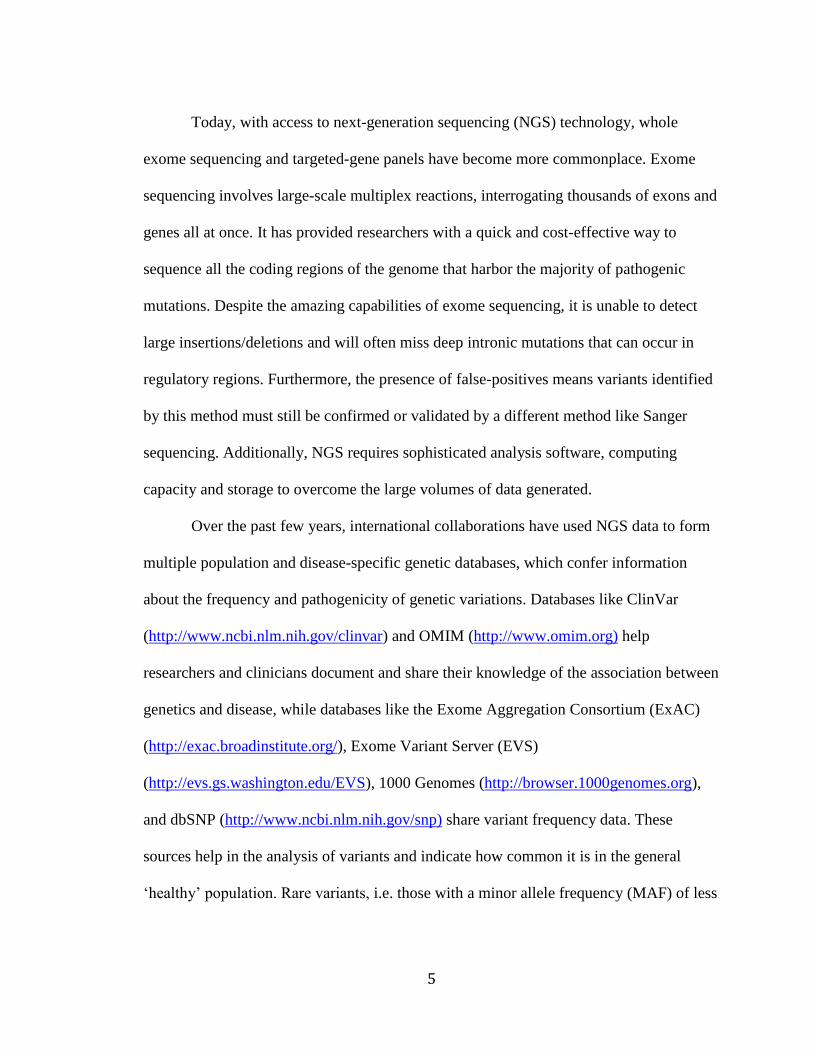
Mutations at splice sites can inhibit the recognition of the intron-exon boundary,
resulting in exon loss, intron inclusion or creation of alternative splice sites (cryptic splice
sites) (Figure 1.1) (Ward & Cooper, 2010). Altered transcripts may create truncated
proteins, contain incorrect amino acids or be targeted for nonsense-mediated decay
(NMD). Overall, splicing mutations can result in a loss of function, reduce the amount of
active protein or create an aberrant protein with dominant negative effects. Geneticists are
able to empirically evaluate the effect of splice site mutations by examining mRNA
transcripts. mRNA can be extracted from cells, reverse transcribed into cDNA
(complementary DNA) and amplified by polymerase chain reaction (PCR) to evaluate
splicing changes.
Several software programs have been developed that can predict splicing changes.
Programs like GeneSplicer
(http://www.cbcb.umd.edu/software/GeneSplicer/gene_spl.shtml), Human Splicing
Finder (http://www.umd.be/HSF) and MaxEntScan
(http://genes.mit.edu/burgelab/maxent/Xmaxentscan_scoreseq.html) examine the
variant’s effect on recognition of the intron-exon junction, the removal of introns and
splicing together of exons.
Researchers use a variety of molecular techniques to search for genetic variations,
however the gold standard has been Sanger sequencing since its development in the mid-
1970s. Sanger sequencing reads short sequences of DNA and can identify single
nucleotide polymorphisms (SNPs) or small insertions or deletions. Despite the pivotal
role it has played in genetic research, Sanger sequencing has a disadvantage in that it can
4
only effectively read sequences of less than 1,000 bp, meaning several reactions would be
necessary to analyze a single gene making the process long and costly.
With thousands of possible disease genes, researchers needed a way to narrow the
search region from the entire genome to a small number of candidate genes. For that
reason, genome-wide SNP genotyping and linkage analysis became the basis for disease
gene localization. Genotyped SNPs act as genetic markers for a particular locus or
position on a chromosome creating a genetic map. By comparing the genotypes of
affected and unaffected family members it was possible to see which SNPs were co-
segregating with a particular phenotype. The region surrounding the SNPs was assigned a
statistical measurement of linkage called a LOD (logarithm of odds) score. As the LOD
score increased linkage was more likely, but as it decreased the gene and trait were less
likely to be linked. Within Mendelian families, LOD scores greater than or equal to 3 are
statistically significant. A couple of disadvantages of this method are that it requires
multiple family members from different generations to be effective. It also requires
careful phenotyping to ensure the correct disease status is assigned.
The powerful combination of linkage analysis and Sanger sequencing has been
extremely effective in identifying disease-causing mutations. Ahmed and colleagues used
the duo in 2004 to identify TMPRSS3 mutations in a Newfoundland family (Ahmed et al.,
2004). However, the methods are not foolproof. Misdiagnosis or the presence of
phenocopies (samples that have a similar phenotype, but do not share the genotype) can
greatly reduce the LOD score of a disease gene location (Abdelfatah, McComiskey et al.,
2013).
5
Today, with access to next-generation sequencing (NGS) technology, whole
exome sequencing and targeted-gene panels have become more commonplace. Exome
sequencing involves large-scale multiplex reactions, interrogating thousands of exons and
genes all at once. It has provided researchers with a quick and cost-effective way to
sequence all the coding regions of the genome that harbor the majority of pathogenic
mutations. Despite the amazing capabilities of exome sequencing, it is unable to detect
large insertions/deletions and will often miss deep intronic mutations that can occur in
regulatory regions. Furthermore, the presence of false-positives means variants identified
by this method must still be confirmed or validated by a different method like Sanger
sequencing. Additionally, NGS requires sophisticated analysis software, computing
capacity and storage to overcome the large volumes of data generated.
Over the past few years, international collaborations have used NGS data to form
multiple population and disease-specific genetic databases, which confer information
about the frequency and pathogenicity of genetic variations. Databases like ClinVar
(http://www.ncbi.nlm.nih.gov/clinvar) and OMIM (http://www.omim.org) help
researchers and clinicians document and share their knowledge of the association between
genetics and disease, while databases like the Exome Aggregation Consortium (ExAC)
(http://exac.broadinstitute.org/), Exome Variant Server (EVS)
(http://evs.gs.washington.edu/EVS), 1000 Genomes (http://browser.1000genomes.org),
and dbSNP (http://www.ncbi.nlm.nih.gov/snp) share variant frequency data. These
sources help in the analysis of variants and indicate how common it is in the general
‘healthy’ population. Rare variants, i.e. those with a minor allele frequency (MAF) of less
6
than 1%, are more likely to be concerning since they have not been passed-on and
allowed to accumulate in the population.
Most researchers will rely on information from multiple databases and
bioinformatics tools to interpret the pathogenicity of a variant. For example, Alamut
(Interactive Biosoftware V 2.7.1) integrates multiple public databases like ExAC and
ClinVar with prediction tools like SIFT and PolyPhen.
In the last 150 years we have amassed a great volume of genetics data and seen a
rapid advancement in computing capacity. For example, the first human genome took
thirteen years to sequence whereas today it would only take one week (National Human
Genome Institute, 2014). It is exciting to imagine what will be possible in the next few
years and how it will increase our understanding of the relationship between human
genetics and disease. As researchers better understand the mechanism of disease, they can
implement preventative measures and develop new therapeutic targets.
7
Figure 1.1 Mechanism of Alternative Splicing
mRNA transcripts can undergo constitutive (shown in blue) or alternative (shown in pink)
exon splicing. Constitutive splicing simply removes all introns and ligates remaining
exons. However, genetic variations at natural splice sites can cause alternative splicing
resulting in exon skipping or inclusion, the creation of alternative splice sites or intron
retention.
8
Auditory Function and Hearing Loss
Hearing is one of the five major senses and is an important part of everyday life.
Audition is the process of hearing and begins with sound waves or vibrations in the air
that stimulate the auditory system. In essence, the human ear acts as an energy transducer
and the ability to hear is dependent on mechanotransduction - the conversion of
mechanical stimuli into electrical impulses, which the brain can then interpret. The human
auditory system is very versatile and is able to process frequencies ranging from 20 –
20,000 hertz (Hz) and detect minor changes in frequency and intensity (Seikel, King, &
Drumright, 2010).
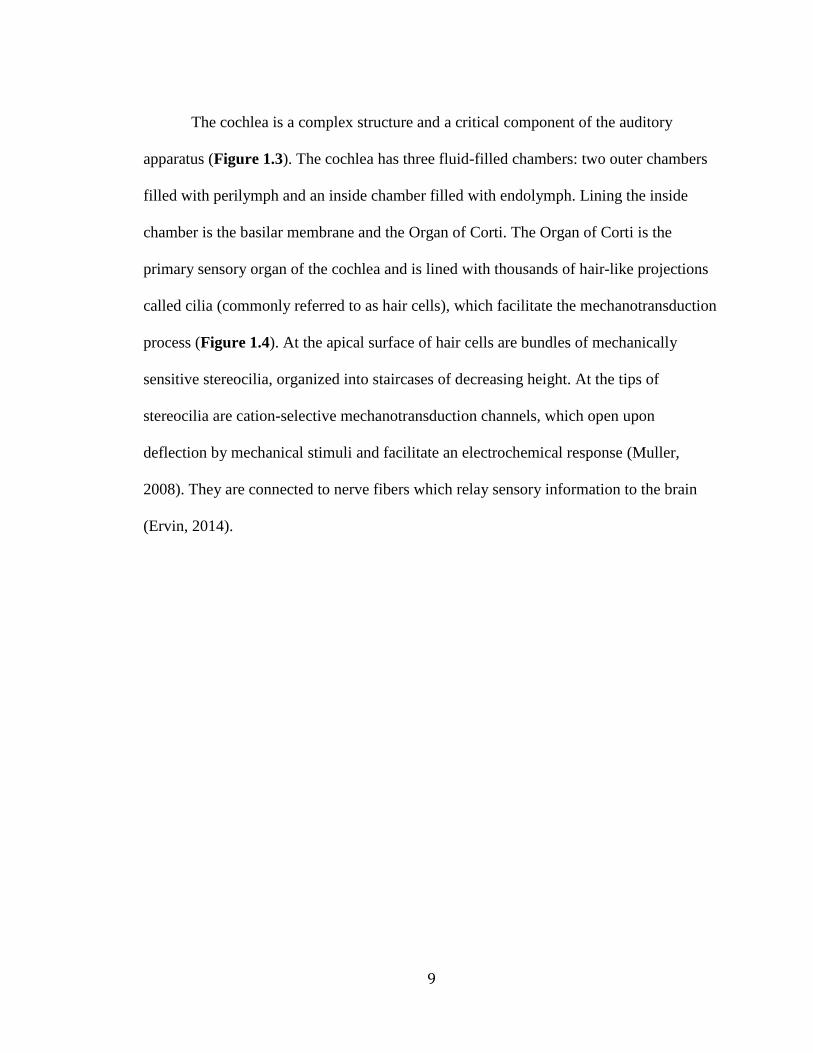
The human ear has an external, middle and inner component, each playing a role
in the perception of sound (Figure 1.2). The structure of the external ear includes the
auricle and ear canal. It collects sound waves, acting as a funnel and directs them toward
the middle ear. The structure of the middle ear includes: the tympanic membrane (ear
drum), tympanic cavity, Eustachian tube, and the ossicular chain (the bones of the middle
ear: the malleus, incus, and stapes). The middle ear transmits sound waves from the
external to inner ear. Sound waves strike against the tympanic membrane and send
vibrations through the ossicular chain and into the inner ear. The organ of the inner ear
involved in hearing is the cochlea. The cochlea converts the mechanical energy of sound
waves into electrical impulses that are then relayed by the 8th cranial nerve
(vestibulocochlear nerve) to the brain stem and auditory cortex in the temporal lobes of
the brain for processing (Ervin, 2014).
9
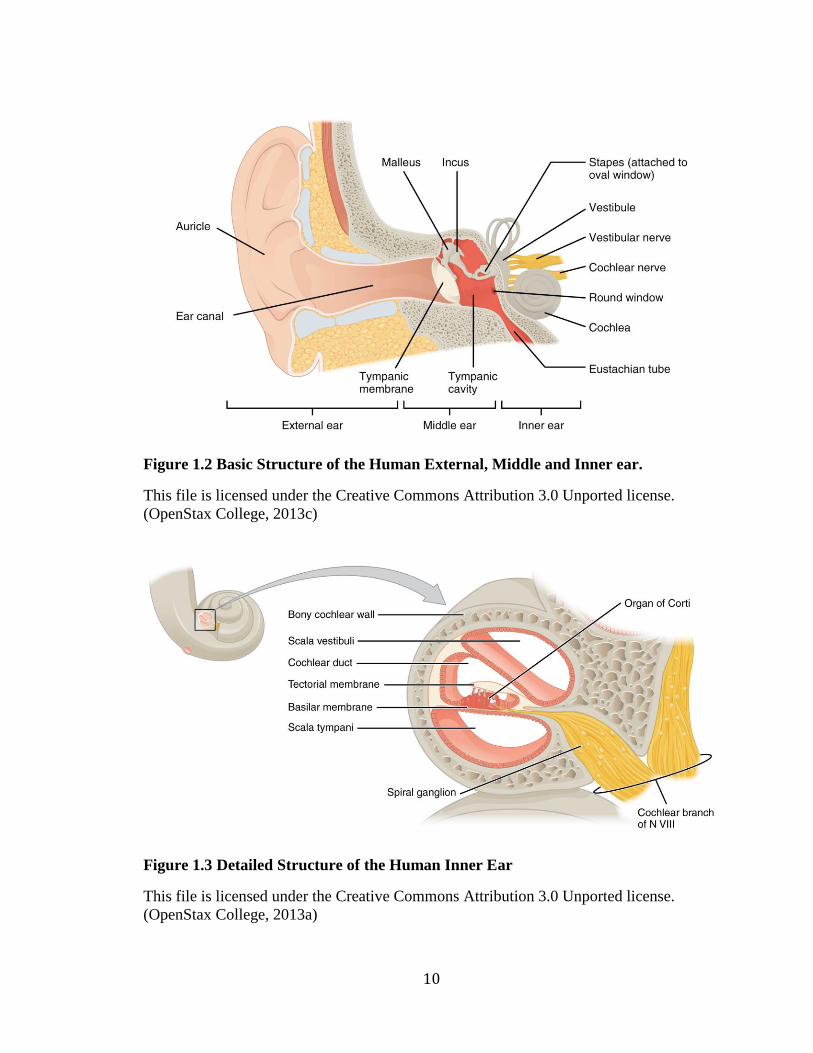
The cochlea is a complex structure and a critical component of the auditory
apparatus (Figure 1.3). The cochlea has three fluid-filled chambers: two outer chambers
filled with perilymph and an inside chamber filled with endolymph. Lining the inside
chamber is the basilar membrane and the Organ of Corti. The Organ of Corti is the
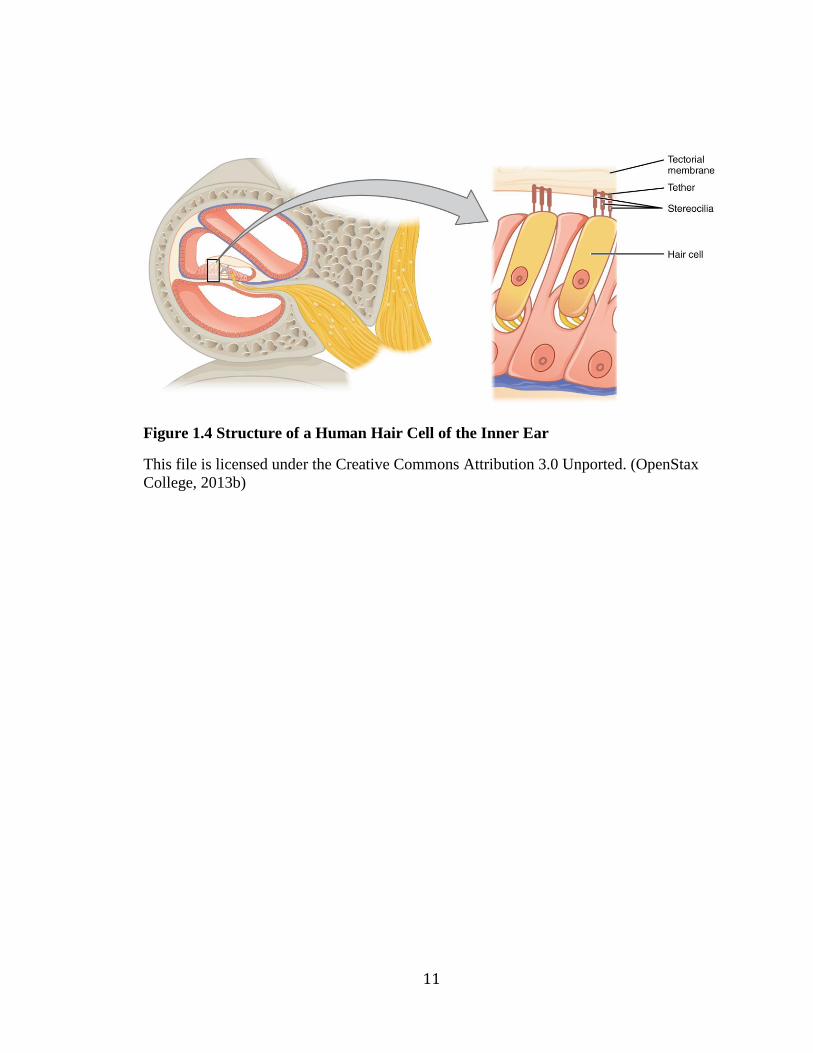
primary sensory organ of the cochlea and is lined with thousands of hair-like projections
called cilia (commonly referred to as hair cells), which facilitate the mechanotransduction
process (Figure 1.4). At the apical surface of hair cells are bundles of mechanically
sensitive stereocilia, organized into staircases of decreasing height. At the tips of
stereocilia are cation-selective mechanotransduction channels, which open upon
deflection by mechanical stimuli and facilitate an electrochemical response (Muller,
2008). They are connected to nerve fibers which relay sensory information to the brain
(Ervin, 2014).
10
Figure 1.2 Basic Structure of the Human External, Middle and Inner ear.
This file is licensed under the Creative Commons Attribution 3.0 Unported license.
(OpenStax College, 2013c)
Figure 1.3 Detailed Structure of the Human Inner Ear
This file is licensed under the Creative Commons Attribution 3.0 Unported license.
(OpenStax College, 2013a)
11
Figure 1.4 Structure of a Human Hair Cell of the Inner Ear
This file is licensed under the Creative Commons Attribution 3.0 Unported. (OpenStax
College, 2013b)
12
Hearing loss is the most common sensory defect and affects more than 870,000
Canadians aged 15 and older (Bizier, Contreras, & Walpole, 2016). Additionally, 360
million people worldwide have hearing loss and approximately 32 million of these are
children (World Health Organization, 2017a). The practice of audiology encompasses the
identification, differential diagnosis and the treatment of hearing loss and balance
disorders. Audiologists rely on a number of objective and behavioral exams to assess a
person’s auditory function. Part of that assessment is thinking of sound as both a physical
phenomenon and a psychological experience.
Sound is generated by vibrations that travel through the air as pressure waves.
Each wave consists of a region of compression, where air molecules are pushed together,
and refraction, where they pull apart. A single compression and refraction is called a
cycle and the number of cycles per second is the wave frequency. A single frequency is
defined as a pure-tone and is measured in hertz (Hz). Another characteristics of sound
waves is amplitude. “Loud sounds” apply a greater force to air molecules, leading to
greater compression/refraction, increasing the intensity and amplitude of the waves. The
amplitude is measured in decibels (dB) and is expressed on a logarithmic scale (Martin &
Clarke, 2014).
Audiologists use their knowledge of the physical characteristics of sound such as
pure-tone measurements to test auditory function. However, other features like sound
separation, perception and interpretation of sound, and the ability to distinguish unique
sounds from background noise are also important. Audiological exams can be behavioral,
and are influenced by patient response such as pure-tone audiometry and speech
13
audiometry, or objective like Auditory Brainstem Response (ABR), otoacoustic emissions
(OAEs) and immittance audiometry.
Pure-tone audiometry assesses a patient’s hearing sensitivity. Although humans
are capable of perceiving frequencies between 20 to 20,000 Hz, audiologists will often
test between 125 and 8000 Hz - the frequencies most important to human speech and
everyday activities. To measure air conduction (AC) thresholds, pure-tones are played
through head phones at increasing decibel levels (to a maximum level) until a patient
indicates the sound was heard. The audiologist is trying to determine a person’s auditory
threshold or the level at which a sound can only be perceived 50% of the time and is
barely audible. For this reason, testing is usually done in a sound-isolated chamber since
noise can mask and shift a person’s hearing threshold. The minimum detectable intensity
(referred to as hearing sensitivity) is measured in both the left and right ear independently
and plotted on a graph (audiogram) and expressed as the number of decibels above or
below the average normal threshold (defined as 0 dB HL).
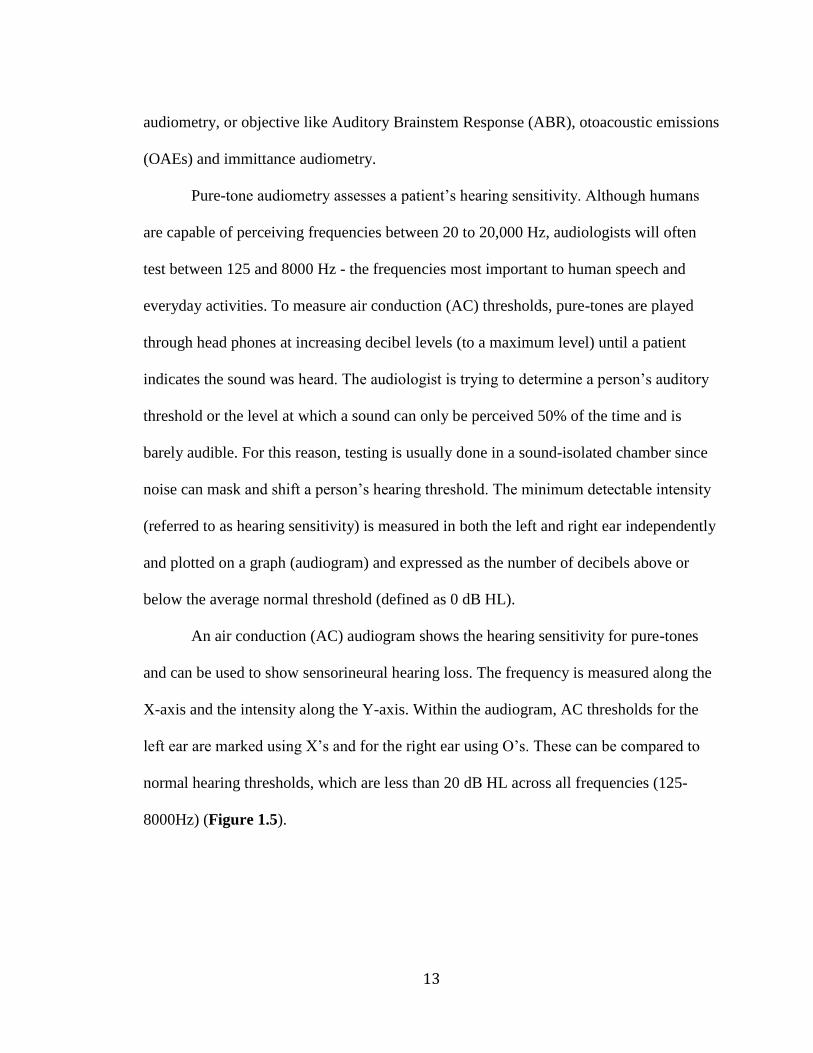
An air conduction (AC) audiogram shows the hearing sensitivity for pure-tones
and can be used to show sensorineural hearing loss. The frequency is measured along the
X-axis and the intensity along the Y-axis. Within the audiogram, AC thresholds for the
left ear are marked using X’s and for the right ear using O’s. These can be compared to
normal hearing thresholds, which are less than 20 dB HL across all frequencies (125-
8000Hz) (Figure 1.5).
14
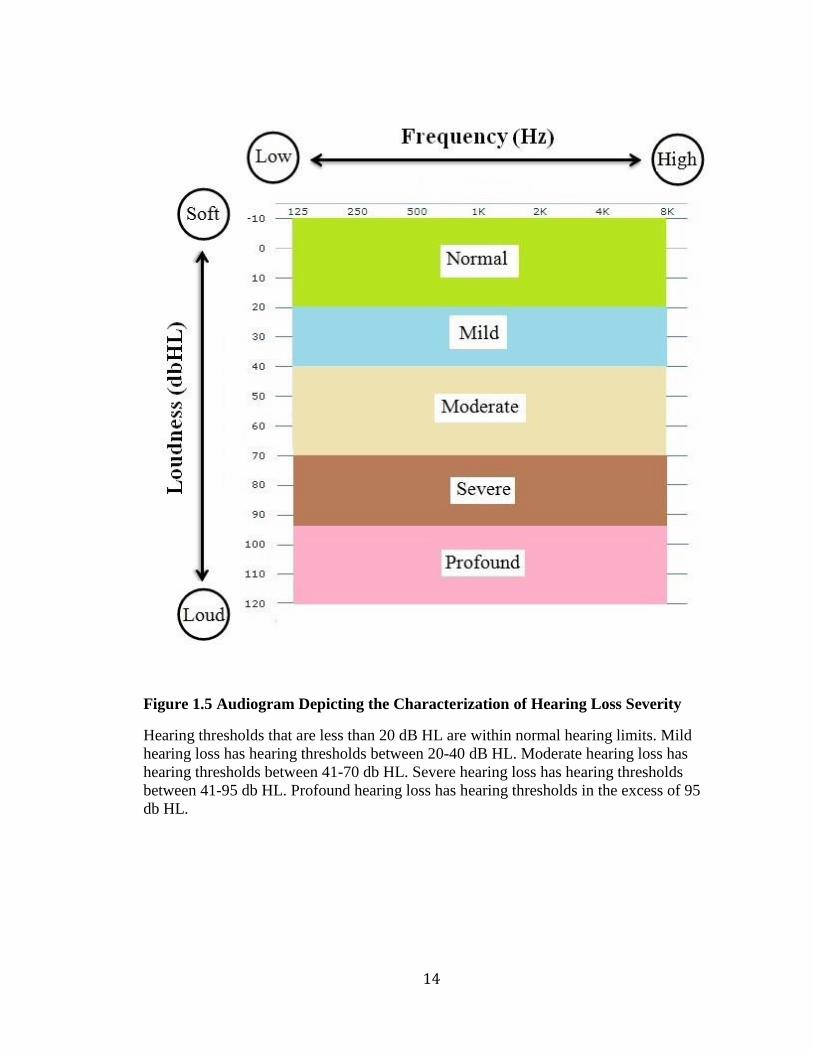
Figure 1.5 Audiogram Depicting the Characterization of Hearing Loss Severity
Hearing thresholds that are less than 20 dB HL are within normal hearing limits. Mild
hearing loss has hearing thresholds between 20-40 dB HL. Moderate hearing loss has
hearing thresholds between 41-70 db HL. Severe hearing loss has hearing thresholds
between 41-95 db HL. Profound hearing loss has hearing thresholds in the excess of 95
db HL.
15
Speech audiometry measures a patient’s speech-recognition threshold. It uses two
syllable words like “baseball” to assess the lowest level at which speech can be
understood. Words that contain high frequency sibilants like “s” “f” and “h” are more
difficult to understand than low frequency sibilants like “m” “d” and “b”. Speech
audiometry provides a method of comparing speech comprehension to pure-tone
thresholds. Poor correlation between the two may suggest a neural component to the
hearing loss.
Auditory evoked responses potentials (AEPs) are physiological measures of
auditory function and can be used to estimate hearing sensitivity in infants and those
unable to participate in behavioral audiometric tests. AEPs are derived from the cochlear
hair cells and auditory nerve. For example, the Auditory Brainstem Response (ABR) is
one type of AEP that is used to measure signals originating in the 8th cranial nerve and the
brainstem, and provide insight into neural integrity. Additional tests, such as otoacoustic
emissions (OAEs) and immittance audiometry that evaluate the inner and middle ear
functions respectively, can aide in the differential diagnosis of hearing loss.
Assessments of the patient’s height, craniofacial and musculoskeletal features,
neurological function, external ear abnormalities and their hair and skin may also be
included (Toriello & Smith, 2013). These examinations help to rule out syndromic
hearing loss that occurs with symptoms affecting other parts of the body. For example,
Usher syndrome, type 1F (OMIM 602083) is a disorder characterized by both vision loss
and hearing loss. Wolfram syndrome (OMIM 222300) affects multiple systems and is
characterized by having diabetes mellitus, diabetes insipidus, optic atrophy and deafness.
16
In Canada, hearing loss can be diagnosed at birth through the newborn hearing
screening program. If hearing loss develops during childhood it can be diagnosed by a
public health nurse before entry into school. However, if hearing loss develops later in
adulthood it may be diagnosed through a workplace screening test. Sometimes if the
impairment is severe enough, patients may self-refer for assessment. One of the problems
in diagnosing hearing loss is that it can progress slowly and may be masked as many
people may use visual cues and speech reading to adapt. Families with multiple cases of
hearing loss may have trouble recognizing their hearing thresholds as abnormal.
Therefore, it is critical to obtain up-to-date audiological tests and not rely on self-report.
Hearing loss phenotypes can be described by type, onset, progression, severity,
configuration and the presence of other auditory dysfunctions. Guidelines have been
established for describing hearing loss phenotypes based upon audiological data and are
called the GENDEAF recommendations (Appendix A)
There are four different types of hearing loss: conductive, sensorineural, mixed
and central auditory dysfunction. Conductive hearing loss is caused by abnormalities of
the outer or middle ear, whereas sensorineural hearing loss is caused by abnormalities of
the inner ear or auditory nerve. Mixed hearing loss is a combination of both and has
conductive and sensorineural components. Meanwhile, central auditory dysfunction is
associated with the central nervous system and affects the transmission and processing of
auditory information (Smith, Shearer, Hildebrand, & Van Camp, 2014). Hearing loss can
also present with other auditory dysfunctions such as tinnitus (described as a “ringing” in
the ears) or vestibular dysfunction like vertigo (Van Camp & Smith, 2014).
17
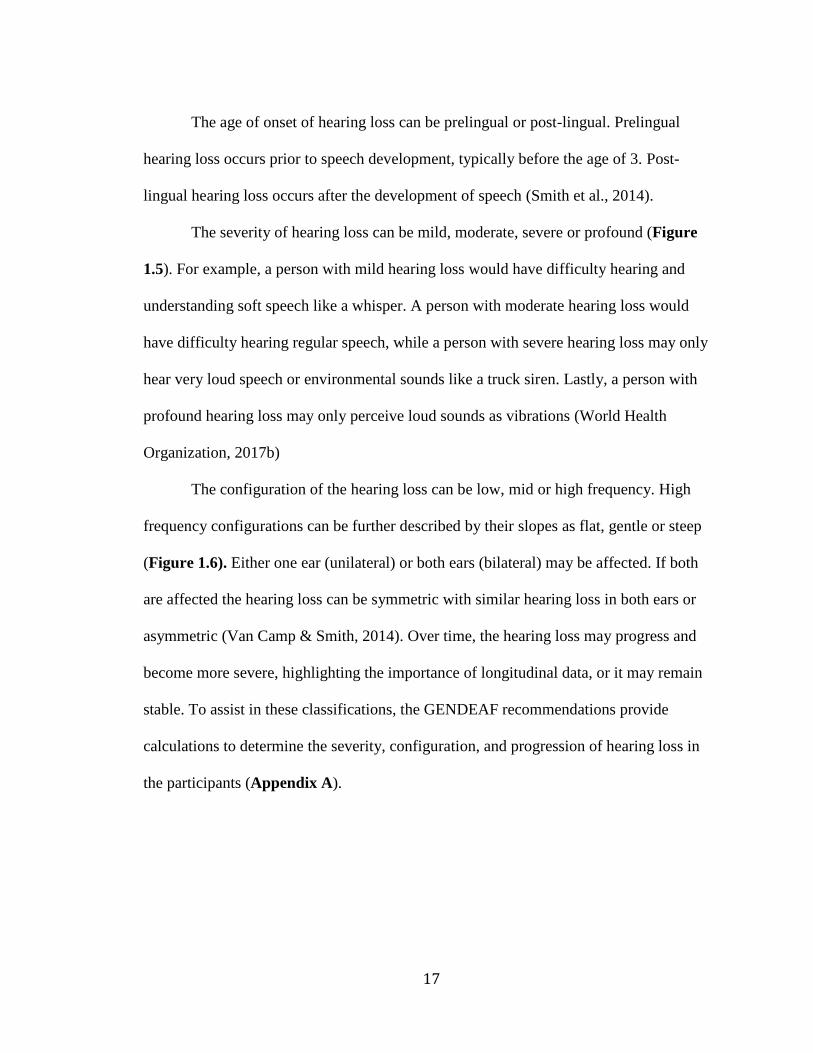
The age of onset of hearing loss can be prelingual or post-lingual. Prelingual
hearing loss occurs prior to speech development, typically before the age of 3. Post-
lingual hearing loss occurs after the development of speech (Smith et al., 2014).
The severity of hearing loss can be mild, moderate, severe or profound (Figure
1.5). For example, a person with mild hearing loss would have difficulty hearing and
understanding soft speech like a whisper. A person with moderate hearing loss would
have difficulty hearing regular speech, while a person with severe hearing loss may only
hear very loud speech or environmental sounds like a truck siren. Lastly, a person with
profound hearing loss may only perceive loud sounds as vibrations (World Health
Organization, 2017b)
The configuration of the hearing loss can be low, mid or high frequency. High
frequency configurations can be further described by their slopes as flat, gentle or steep
(Figure 1.6). Either one ear (unilateral) or both ears (bilateral) may be affected. If both
are affected the hearing loss can be symmetric with similar hearing loss in both ears or
asymmetric (Van Camp & Smith, 2014). Over time, the hearing loss may progress and
become more severe, highlighting the importance of longitudinal data, or it may remain
stable. To assist in these classifications, the GENDEAF recommendations provide
calculations to determine the severity, configuration, and progression of hearing loss in
the participants (Appendix A).
18
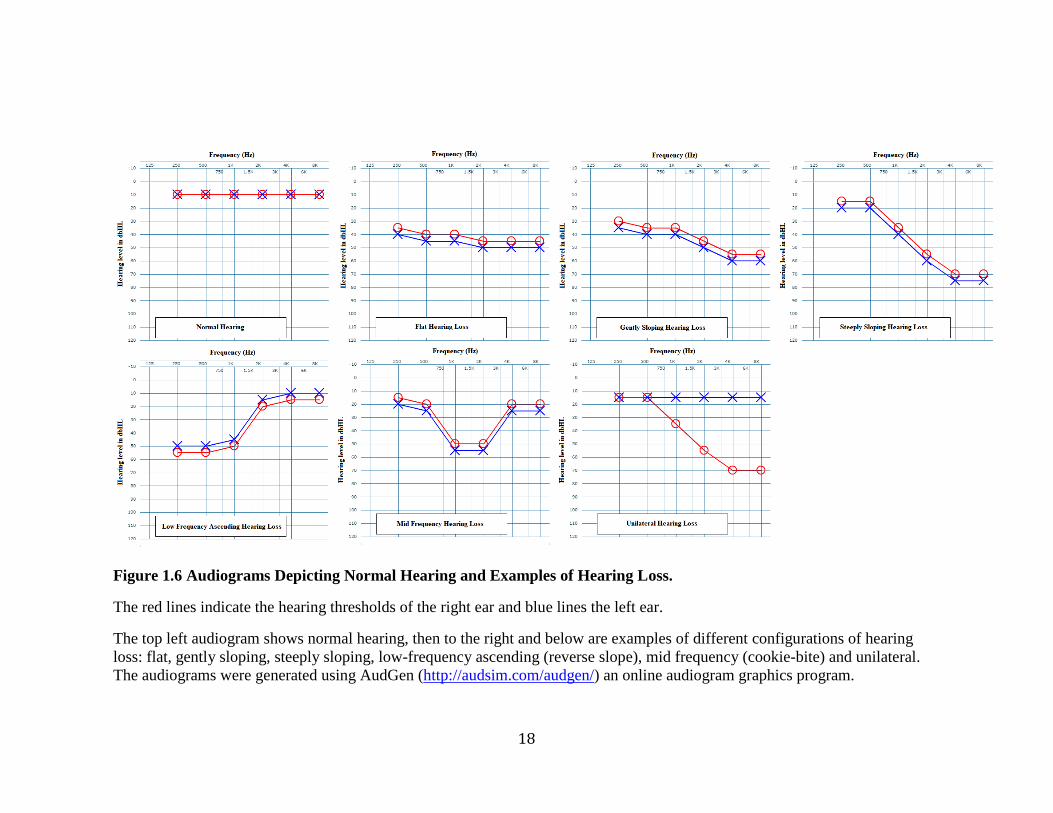
Figure 1.6 Audiograms Depicting Normal Hearing and Examples of Hearing Loss.
The red lines indicate the hearing thresholds of the right ear and blue lines the left ear.
The top left audiogram shows normal hearing, then to the right and below are examples of different configurations of hearing
loss: flat, gently sloping, steeply sloping, low-frequency ascending (reverse slope), mid frequency (cookie-bite) and unilateral.
The audiograms were generated using AudGen (http://audsim.com/audgen/) an online audiogram graphics program.
19
Hearing loss is clinically and genetically heterogeneous with a variety of
etiologies including genetics, ototoxic medications, noise exposure and aging (Bramhall,
Kallman, Verrall, & Street, 2008). Hearing loss can be a monogenic disease caused by a
single-gene mutation, or multifactorial with both genetic and environmental factors
affecting the phenotype. However, a study of school-aged children in the United States
found that up to 60% of prelingual or early-onset hearing loss was due to genetic factors
(Marazita et al., 1993).
Hereditary hearing loss can be syndromic presenting with symptoms involving
other organ systems, or nonsyndromic having no other associated medical disorders
(Smith et al., 2014). Nearly 30% of hereditary hearing loss is syndromic and has a
recognizable pattern like Usher or Wolfram syndrome. The more predominant form,
accounting for 70% of cases, is nonsyndromic hearing loss (NSHL). Researchers have
identified more than 158 nonsyndromic deafness loci and greater than 96 deafness-
associated genes (http://hereditaryhearingloss.org, 2017).
Nonsyndromic hearing loss is inherited in an autosomal recessive (80%),
autosomal dominant (15%), sex-linked (1%) or matrilineal (1%) pattern (Toriello &
Smith, 2013). The mode of inheritance is most likely autosomal dominant if each
generation is affected and both genders are equally likely to have hearing impairment.
Affected family members are typically heterozygotes (inherited one copy of a mutation)
and have a 50% chance of passing the deleterious allele onto their offspring. Nonetheless,
knowing the genotype is not enough to predict the phenotype. Variable expression and
reduced penetrance also play a role. Variable expression refers to the potential for
symptoms to differ among people with the same genotype. For example, the age of onset
20
and level of severity of hearing loss may vary. Penetrance refers to the probability that a
genotype will produce a given phenotype. In the case of incomplete penetrance, not all
family members with a pathogenic allele will have hearing loss. Other genetic factors and
environmental factors (infection, acoustic trauma, and ototoxic drugs), referred to as
modifiers can play a role in the hearing loss phenotype. Often the contribution of
modifiers is difficult to distinguish from the inherited phenotype. However, understanding
the relationship between the underlying genetic cause and potential modifiers is essential
to predicting the ultimate phenotype. Furthermore, a hearing loss phenotype can have of
combination of etiologies like age-related hearing loss (presbycusis) that occurs gradually
as we age and noise-induced hearing loss that is caused by long-term exposure to sounds
that are too loud for too long, causing damage to the sensory hair cells.
The correct classification of hearing loss is critical to the study of autosomal
dominant families. Variable expression, incomplete penetrance and the presence of
phenocopies hamper efforts to study autosomal dominant hearing loss. Through careful
analysis of audiological records, team audiologists work to establish the onset,
progression, and severity of the family’s hereditary hearing loss to distinguish it from
other unrelated etiologies.
The mode of inheritance is most likely autosomal recessive if there are only a few
hearing-impaired family members. Autosomal recessive disorders require two mutant
alleles to be inherited for a phenotype to be expressed and so heterozygotes (carriers) are
unaffected. Assuming complete penetrance, parents who are carriers have a 25% chance
of having a child who is affected, and as a result typically several generations often pass
before two carriers have an affected child.
21
The mode of inheritance is most likely X-linked if the distribution of males and
females with hearing loss is uneven. This occurs because males have an X and Y
chromosome whereas females have two X chromosomes. Since males receive their Y
chromosome from their father, X-linked inheritance is not possible between father and
son. Assuming complete penetrance and dominant X-linked inheritance, an affected
father will have all affected daughters but none of his sons will be affected. If the disorder
is X-linked recessive an affected mother will have all affected sons but her daughters will
only be carriers.
The mode of inheritance is most likely mitochondrial if hearing loss appears to be
transmitted maternally. Mitochondria are small organelles in the cytoplasm that are
responsible for producing energy in the cell and are transmitted maternally through the
ova. Mitochondria have their own DNA (mtDNA), which is 16,569 bp in length (NCBI
Reference Sequence: NC_012920.1). An important feature of mitochondrial genetics is
heteroplasmy and homoplasmy. Depending on the cell type, each cell has hundreds to
thousands of mitochondria. Homoplasmy means all the copies of the mitochondrial
genome are the same. Heteroplasmy means there is a mixture of mitochondrial genotypes.
The amount of mutant mtDNA becomes important because there is a threshold at which
normal mitochondria can compensate for those that are mutated. Mitochondrial mutations
affect the energy production of cells and often have a greater impact on cell types with
high energy demands like skeletal muscle, heart, eye, ear, and brain resulting in muscle
weakness, nervous system disorders, visual problems, hearing loss, and dementia (Keats,
Popper, & Fay, 2002).
22
The Newfoundland Population and Genetic Research
Over the past 30 years the Newfoundland population has become a focus of
human hereditary disorder research. As a founder population it has an advantage in
identifying disease genes linked to rare monogenic disorders over more heterogeneous
(ethnically diverse) populations. Compared to other founder populations, Newfoundland
is relatively young (<20 generations) making it an ideal population for the study of the
genetic etiologies of many diseases (e.g. Mendelian and complex).
Viking settlers arrived in Newfoundland around 1000 AD but abandoned their
settlements. Europeans then rediscovered the island in 1497 when an Italian explorer
named Giovanni Caboto (John Cabot) sailed to Newfoundland. The first English colony
was established in 1610. Newfoundland’s population continued to grow as settlers
immigrated to the island, drawn by the fishing industry. The majority of immigrants were
Protestant settlers from Southwest England and Roman Catholic settlers from Southern
Ireland (Mannion, 1977).
Over the past 400 years Newfoundland and Labrador’s population has increased
to 528,817. The majority of residents live in rural communities spread over
Newfoundland and Labrador’s (NL) vast territory of 370,510.76 square kilometers and
nearly 29,000 kilometers of coastline (Statistics Canada, 2012). Geographic and religious
segregation has led to the formation of genetic isolates with high inbreeding coefficients.
Studies by Bear and colleagues in 1987 and 1988 found a high degree of genetic
homogeneity (Bear et al., 1987; Bear et al., 1988). A recent study found the
Newfoundland population resembles the British population but can be divided into three
23
clusters of religious or ethnic origin: Protestant English, Roman Catholic Irish and North
American aboriginals (Zhai et al., 2015).
Several genetic disorders and causative mutations are more predominant in the
Newfoundland population than in its ancestral European population. For example, Bardet-
Biedl syndrome is 10 times more common in the Newfoundland population than admixed
Caucasian populations of northern European ancestry (Green et al., 1989; O'Dea et al.,
1996). Also, Hereditary Non-Polyposis Colon Cancer (HNPCC) is caused by a single
mutation in MSH2 in 50% of cases of HNPCC in Newfoundland, while it accounts for
only 8% of English HNPCC cases (Spirio et al., 1999).
Founder populations like Newfoundland have a unique advantage in mapping and
identifying rare disease genes (Kristiansson, Naukkarinen, & Peltonen, 2008). The limited
number of founders means disease alleles will have often arisen from a single ancestral
chromosome. Furthermore, Newfoundland families are large with deep genealogies and
participation from multiple generations. Many of the papers published from other parts of
the world are based upon probands or trios (child, mother and father), rather than whole
families. There is an undeniable advantage in being able to test co-segregation of
mutations and phenotype in a large family versus relying on a single person. By
examining the genetic differences between affected and unaffected family members, who
share much of their DNA sequence, geneticists are better able to narrow-in on the true
causative mutations.
Newfoundland has been a rich resource for genetic discoveries, especially in
regards to hereditary hearing loss. The Newfoundland Hereditary Hearing Loss project
began with Dr. Elizabeth Ives, who helped establish the Newfoundland Provincial
24
Genetics Program and was the first professor of Genetics at MUN’s Faculty of Medicine
(Gray, 2002). In the late 1980s, Dr. Catherine Neville-Smith, the Medical Health Officer
of the Central Health Unit, approached the Genetics program about the high frequency of
deafness in the Gaultois area. A subsequent visit to the Newfoundland School for the
Deaf by Dr. Ives and Dr. Neville-Smith provided further insight into the high occurrence
of severe childhood deafness on the South Coast of Newfoundland. These collaborative
efforts between the research team, local health authorities and the Newfoundland School
for the Deaf was the foundation of the Newfoundland Hereditary Hearing Loss study
In 1999, Dr. Terry-Lynn Young, a PhD candidate within the Discipline of
Genetics joined the Newfoundland Hereditary Hearing Loss Project. Since its launch,
more than 170 families with varying degrees and types of hearing impairment have been
recruited, first through the School for the Deaf (since closed), then as a result of a public
campaign through ENT (Ear Nose and Throat) clinics, Provincial Medical Genetics,
Provincial Audiology, CHHA (Canadian Hard of Hearing Association) and self-referrals.
Detailed medical histories were collected, including previous audiograms, and if possible
a current hearing assessment was completed. Further interviews generated family
pedigrees, developed family histories and lead to the recruitment of other family
members. Having additional members from multiple generations provided researchers
with the ability to distinguish the truly pathogenic mutations from the many thousands of
variants of unknown significance (VUS).
The pedigrees were created in Progeny (http://www.progenygenetics.com/).
The specialized software provided a visual representation of each family pedigree. It also
served as a database to store patient and family history information. At MUN the current
25
configuration is a web-based interface that is stored, administered, and maintained by the
Centre for Health Informatics and Analytics (CHIA).
The Hereditary Hearing Loss Project’s early scientific approach relied on
molecular genetics techniques like genome-wide SNP genotyping and linkage analysis,
followed by cascade gene sequencing to solve the first hearing loss families. Later, with
the advent of NGS technology, techniques like whole exome sequencing played a larger
role in mutation identification.
One of the first families to be solved was ‘Family C’, a six-generation family from
the South Coast of Newfoundland with an apparent autosomal dominant form of low
frequency hearing loss. Over several years of clinical work more than 300 family
members were recruited, many affected with low frequency, sensorineural hearing loss.
Employing an autosomal dominant mode of inheritance and genome-wide SNP
genotyping and linkage analysis, Dr. Young and her team identified a region associated
with the hearing loss phenotype on chromosome (chr)4p16 (LOD=11.58). This region
overlapped with three previously mapped deafness loci: DFNA38, DFNA14, and DFNA6.
Sanger sequencing of WFS1 yielded 11 variants: 5 polymorphisms and 6 novel variants.
Only one co-segregated with hearing loss: WFS1 c.2146G>A, p.Ala716Thr resulting in
the substitution of a conserved amino acid. Furthermore, it was absent from 150 controls.
Typically homozygous mutations in WFS1 cause Wolfram syndrome and this was the
first association of isolated hearing loss and a single heterozygous mutation in WFS1 (T.
L. Young et al., 2001).
In 2004, another large kindred (Family B) from the South Coast of Newfoundland
with hereditary hearing loss was solved. However, this family had a different clinical
26
presentation and segregated with apparent autosomal recessive, pre-lingual, severe to
profound sensorineural hearing loss. Linkage analysis revealed DFNB8/B10 was linked to
hearing loss in Family B. Subsequent sequencing of TMPRSS3, a deafness gene residing
within the mapped locus, identified two deletion mutations: TMPRSS3 c.207delC and
c.782+3delGAG. Careful segregation analysis showed that both mutant alleles co-
segregated with hearing loss in Family B, where the majority of affected relatives
inherited two copies of c.207delC and two affected relatives were compound
heterozygotes (Ahmed et al., 2004).
In 2009, another large family (Family A) from the South Coast of Newfoundland
with hereditary hearing loss was solved. Like Family B, this family presented with
apparent autosomal recessive, pre-lingual, profound sensorineural hearing loss. Due to
their close geographic location, they were initially screened for the three pathogenic
mutations identified in Families B and C, but were negative. Therefore, further studies
were needed. Genome-wide SNP genotyping and linkage analysis mapped the hearing
loss to chr10q21-22 (LOD=4.0). The linked region included a previously mapped
deafness locus, DFNB23, and a candidate gene, PCDH15, within this region on
chromosome 10q. Sequencing of PCDH15 revealed 33 sequence variants. However,
only the PCDH15 c.1583T>A, p.V528D mutation was also absent from the population
controls. The novel mutation within PCDH15 affected a highly conserved amino acid and
was predicted to be deleterious (Doucette et al., 2009).
The Southern Coast of Newfoundland is geographically isolated with limited road
access and ferry services, leading to the enrichment of rare pathogenic mutations in the
communities. So far, four different mutations causing hearing loss on the Southern Coast
27
of Newfoundland have been identified by the Young lab: WFS1 c.2146G>A, TMPRSS3
c.207delC and c.782+3delGAG, and PCDH15 c.1583T>A.
Autosomal recessive and dominant patterns of hearing loss are not the only types
observed in our collection of Newfoundland families. In 2012, Family 2024 presented
with the hallmarks of X-linked hearing loss such as absence of male-to-male transmission
and an earlier-onset, more severe phenotype in males compared to females (Abdelfatah,
Merner et al., 2013). Because this is an X-linked condition, only genes on the X
chromosome were examined. Haplotype analysis of informative markers residing on the
X chromosome on a subset of the family members narrowed the region of interest to 48
candidate genes, 13 of which were sequenced based on known mRNA expression, protein
function, and deafness-association. Sequencing yielded the novel deletion SMPX
c.99delC, which caused a frameshift and premature stop codon p.Arg34GlufxX47. The
mutation co-segregated with hearing loss in Family 2024. Subsequent screening of the
Newfoundland deafness probands showed a second family, Family 2196, which harbored
the deletion and pattern of hearing loss. Haplotype analysis further demonstrated the same
mutation resided on a shared haplotype across the two families, suggesting a common
ancestor.
As more families were recruited to the deafness research study, a targeted
mutation-screening protocol was developed and used as a ‘first pass’ for all new probands
recruited to the study. Each affected proband (the first family member recruited) was
screened for the most common hearing loss mutations, such as GJB2 c.35delG and a large
deletion in GJB6, followed by previously reported Newfoundland deafness mutations that
included WFS1 c.2146G>A, TMPRSS3 c.207delC and c.782+3delGAG, PCDH15
28
c.1583T>A, and SMPX c.99delC. Probands whose hearing loss could not be attributed to
these known deafness mutations were subsequently categorized based upon the
configuration of their hearing phenotype or audioprofile.
In 2012, this clinical work became the foundation of the Audioprofile study.
Eighty-two probands were selected and grouped based upon the configuration of their
hearing loss: low, mid or high. Audiograms with similar profiles were grouped and
submitted to AudioGene (http://audiogene.eng.uiowa.edu/), an online program that uses
audiometric data such as frequency affected, hearing loss in decibels, and age to identify
gene-specific types of hearing loss. For this next phase of the study, genomic DNA from
deafness probands underwent full gene sequencing for each gene predicted. For example,
probands with low frequency hearing loss were tested for mutations in WFS1, POU4F3,
and DIAPH. Those with mid frequency loss were Sanger sequenced for TECTA and
COL11A2. Lastly those with high frequency loss were sequenced for KCNQ4, COCH,
MYO6, GJB3, and TMC1. Variants identified through sequencing were checked against
prediction programs to assess pathogenicity, tested for co-segregation with hearing loss in
affected families, then screened in ethnically-matched population controls to determine
the frequency in the Newfoundland population. Part of this work was completed by Ms.
Jessica Squires, a Master’s student who deduced the cause of hearing loss in two families
with MT-RNR1 m.1555A>G mutations (Squires, 2015) and Mr. David McComiskey, a
Master’s student who solved a family with a COCH c.151 C>T mutation (McComiskey,
2010).
In another example, the investigation of Family 2071 also began with AudioGene
(Abdelfatah et al., 2013). In 2013, familial audiograms were submitted to AudioGene,
29
which linked them to known high-frequency deafness genes like COCH, KCNQ4, and
TMC1. Candidate gene sequencing of KCNQ4 revealed a possible pathogenic mutation at
c.806_808delCCT, p.S269del, although only half of the deaf-relatives (10/23) harbored
the mutation. Furthermore, linkage analysis of the region surrounding the mutation had
negative LOD scores suggesting the region was not associated with hearing loss in
Family 2071. It was also absent in the unaffected relatives and 90 ethnically-matched
population controls. However, the mutation did not co-segregate with hearing loss on the
left-hand side of the pedigree.
Perhaps there existed two or more genetic factors contributing to the phenotype in
this large multigenerational family, with KCNQ4 c.806_808delCCT being the cause of
hearing loss on one side of Family 2071. As a result the study changed focus to the
potential phenotypic differences between the two halves of the pedigree. Close
examination of familial audioprofiles showed that KCNQ4 deletion carriers had bilateral,
sloping sensorineural hearing loss while non-carriers had variable symmetry and
configuration. As confirmation, the linkage analysis was repeated excluding members
with differing audioprofiles and resulted in a statistically significant LOD score of 3.3.
This cemented the theory that there were at least two factors contributing to hearing loss
in Family 2071, with KCNQ4 c.806_808delCCT being the cause of hearing loss in half of
the family.
Another family, Family 2010, was highlighted during the Audioprofile study
because of its unique audiometric configuration. The characteristic pattern of normal low-
frequency thresholds that steeply slope to severe bilateral, sensorineural hearing loss was
unusual. In 2017, the Young lab took an extended field trip to revisit the family. With the
30
new blood samples and pedigree data collected, a whole exome sequencing strategy was
carried out. A PhD candidate, Mr. Justin Pater identified a homozygous mutation in
CLDN14 c.488C>T, p.Ala163Val. Three unrelated families (Family 2033, 2072, and
2075) were later shown to also harbor the exact same CLDN14 c.488C>T mutation.
Genealogical studies and haplotype analysis across the four unrelated families showed a
shared 1.4 Mb (megabase pairs) haplotype on chromosome 21 (DFNB29), suggesting
common ancestry. Subsequent interviews by a genetic counselor would connect families
2010, 2033, and 2075 to a single founding couple six generations back. Interestingly,
targeted sequencing of 175 population controls would indicate that the frequency of
CLDN14 c.488C>T is much higher in the Newfoundland population than worldwide (1%
versus 0.02564%), signifying a possible founder effect (Pater et al., 2017)
The Hereditary Hearing Loss Project also focused on specific conditions like
otosclerosis. Otosclerosis is a disease of the bones of the middle and inner ear causing
conductive or mixed hearing loss. In 2014, Dr. Nelly Abdelfatah’s PhD research in the
Young lab identified the first otosclerosis gene, FOXL1 (T. Young, Abdelfatah, &
Griffin, 2014). Through a combination of linkage analysis and candidate gene sequencing
she identified a novel 15 bp deletion, FOXL1 c.976_990del, in all affected members of
Family 2081, and thus the first ever identified otosclerosis gene.
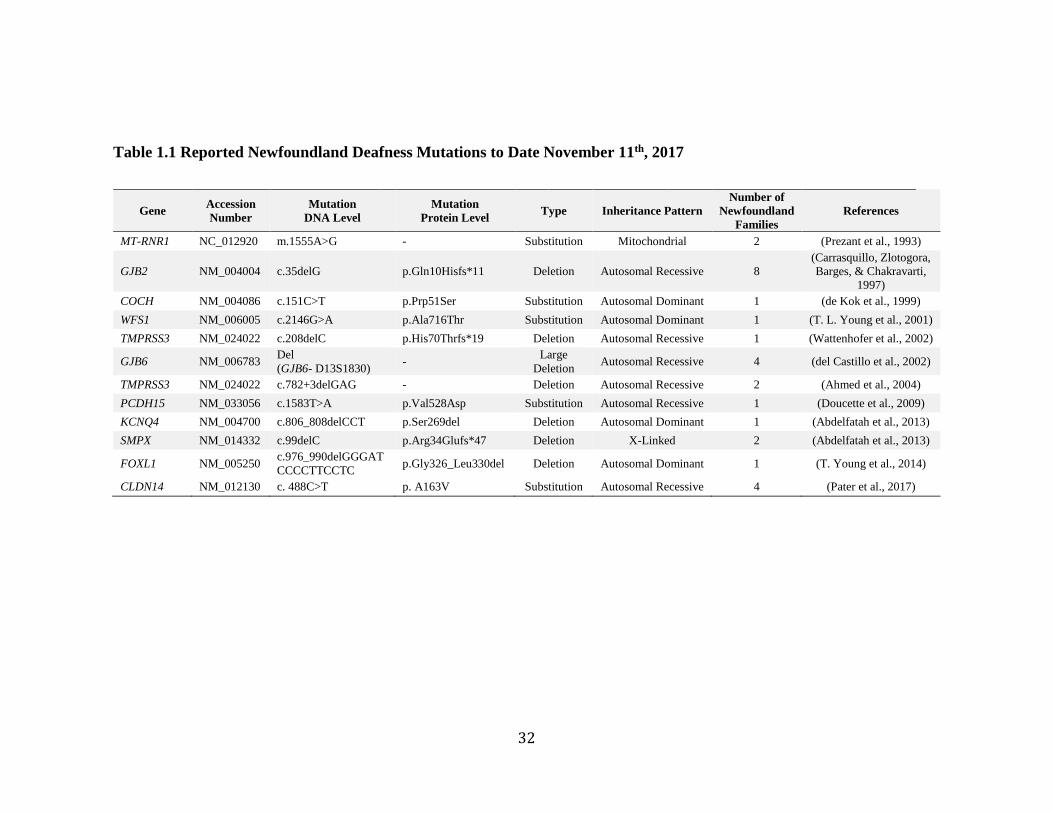
Genetic factors have made a significant impact on hearing loss in the
Newfoundland population. Over the past two decades, the Newfoundland Hearing Loss
Project has reported 12 different mutations in 11 genes that cause hearing loss (Table
1.1). Contained within the Newfoundland population are mutations like GJB2 c.35delG
and a large 342kb deletion in GJB6 which have been described frequently in the
31
literature. However, there are also novel mutations in known hearing loss genes like
WFS1 (T. L. Young et al., 2001) and PCDH15 (Doucette et al., 2009). Most interestingly,
there are mutations in genes that have never been associated with hearing loss, such as
FOXL1 c.976_990del (T. Young, Abdelfatah, & Griffin, 2014). It is likely that the
Newfoundland population will be key to discovering more deafness loci, genes and
pathogenic mutations.
As more deafness-associated mutations were identified (Table 1.1), the
Newfoundland deafness probands were screened in the hopes of solving other families.
The proband of Family 2070 was screened, but his results were negative, suggesting a
novel genetic etiology in the Newfoundland population. Since Family 2070 had
participation from multiple generations and several affected family members it was an
ideal candidate for further study and so the investigation of Family 2070 became the
focus of this thesis (Figure 1.7).
32
Table 1.1 Reported Newfoundland Deafness Mutations to Date November 11th, 2017
Gene Accession
Number
Mutation
DNA Level
Mutation
Protein Level Type Inheritance Pattern
Number of
Newfoundland
Families
References
MT-RNR1 NC_012920 m.1555A>G - Substitution Mitochondrial 2 (Prezant et al., 1993)
GJB2 NM_004004 c.35delG p.Gln10Hisfs*11 Deletion Autosomal Recessive 8
(Carrasquillo, Zlotogora,
Barges, & Chakravarti,
1997)
COCH NM_004086 c.151C>T p.Prp51Ser Substitution Autosomal Dominant 1 (de Kok et al., 1999)
WFS1 NM_006005 c.2146G>A p.Ala716Thr Substitution Autosomal Dominant 1 (T. L. Young et al., 2001)
TMPRSS3 NM_024022 c.208delC p.His70Thrfs*19 Deletion Autosomal Recessive 1 (Wattenhofer et al., 2002)
GJB6 NM_006783 Del
(GJB6- D13S1830) -
Large
Deletion Autosomal Recessive 4 (del Castillo et al., 2002)
TMPRSS3 NM_024022 c.782+3delGAG - Deletion Autosomal Recessive 2 (Ahmed et al., 2004)
PCDH15 NM_033056 c.1583T>A p.Val528Asp Substitution Autosomal Recessive 1 (Doucette et al., 2009)
KCNQ4 NM_004700 c.806_808delCCT p.Ser269del Deletion Autosomal Dominant 1 (Abdelfatah et al., 2013)
SMPX NM_014332 c.99delC p.Arg34Glufs*47 Deletion X-Linked 2 (Abdelfatah et al., 2013)
FOXL1 NM_005250 c.976_990delGGGAT
CCCCTTCCTC p.Gly326_Leu330del Deletion Autosomal Dominant 1 (T. Young et al., 2014)
CLDN14 NM_012130 c. 488C>T p. A163V Substitution Autosomal Recessive 4 (Pater et al., 2017)
33
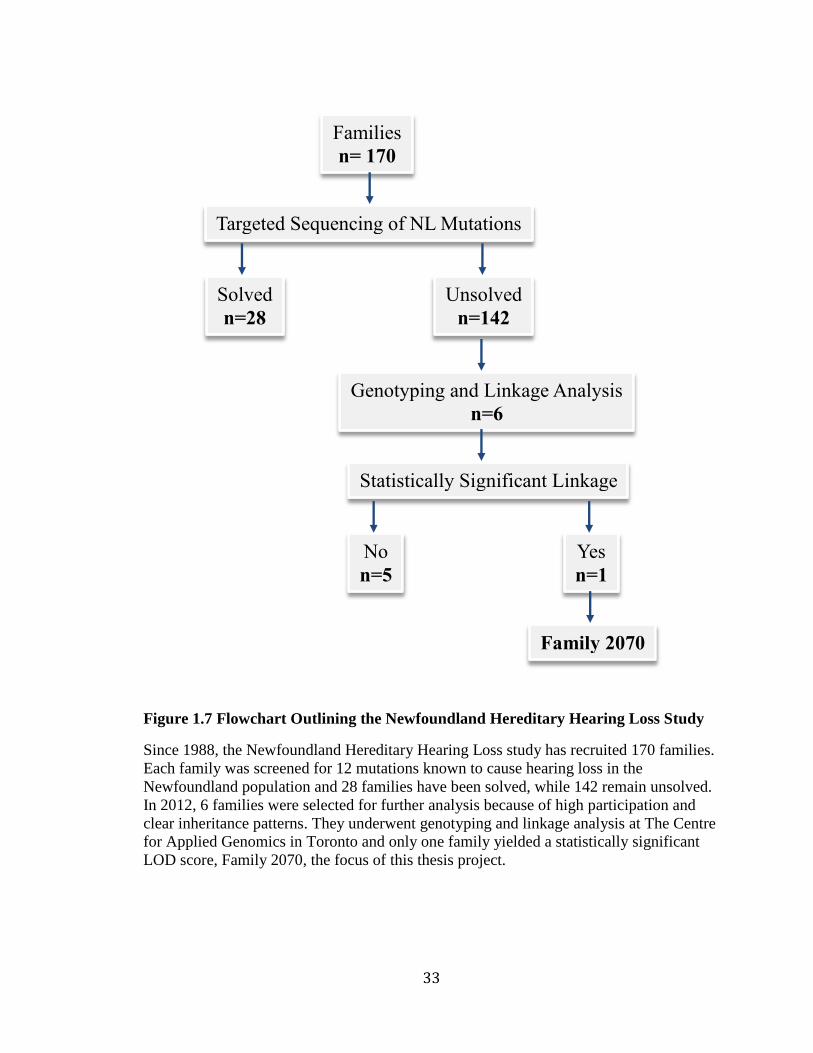
Figure 1.7 Flowchart Outlining the Newfoundland Hereditary Hearing Loss Study
Since 1988, the Newfoundland Hereditary Hearing Loss study has recruited 170 families.
Each family was screened for 12 mutations known to cause hearing loss in the
Newfoundland population and 28 families have been solved, while 142 remain unsolved.
In 2012, 6 families were selected for further analysis because of high participation and
clear inheritance patterns. They underwent genotyping and linkage analysis at The Centre
for Applied Genomics in Toronto and only one family yielded a statistically significant
LOD score, Family 2070, the focus of this thesis project.
Families
n= 170
Targeted Sequencing of NL Mutations
Solved
n=28
Unsolved
n=142
Family 2070
Genotyping and Linkage Analysis
n=6
Statistically Significant Linkage
Yes
n=1
No
n=5
34
Chapter 2 Materials and Methods
Patient Recruitment
Family 2070 is a seven-generation family from Western Newfoundland with
apparent autosomal dominant hearing loss (Figure 2.1). In 2004, the proband of Family
2070 was referred to the Provincial Medical Genetics Program because of his strong
family history of hearing loss. Shortly thereafter, the clinical director recruited him to the
hereditary hearing loss study. The Human Investigation Committee (HIC) (Research
Ethics Board, of St. John’s, NL, CANADA) (#01.186) approved the project.
Recruitment was conducted by a research assistant or team audiologist and
included obtaining patient consent to the Hereditary Hearing Loss project (Appendix B),
completing an interview using a medical information questionnaire (Appendix C),
obtaining consent for release of audiological data (Appendix D) and a request for blood
or saliva sample (Appendix E). If possible, the patient’s hearing was assessed during the
interview.
Data collected during the interviews was used to create a pedigree in Progeny. The
pedigree showed the affected status of each recruited family member and was used to
determine the mode of inheritance.
The team’s audiologist conducted prospective auditory exams, specifically pure-
tone, speech and immittance audiometry. They also examined previous hearing tests
conducted by hospitals and private clinics that had been collected to determine the likely
age of onset, audiometric configuration and progression of hearing loss in Family 2070.
35
The hearing loss phenotypes were then recorded following the GENDEAF
recommendations. Overall, twenty-four family members were accessed by the team’s
audiologist or provided consent for their audiological records (Figure 2.2 and Figure
2.3).
Venous blood samples were collected at local clinics and sent to the research
laboratory in St. John’s for DNA extraction. Genomic DNA was extracted from venous
blood samples through a salting out procedure (Miller, Dykes, & Polesky, 1988) or from
saliva following the Oragene DNA ethanol precipitation protocol
(http://www.dnagenotek.com/US/products/prepITL2P.html). In total, twenty-eight family
members provided DNA (Figure 2.2 and Figure 2.3). Another three family members
provided additional blood samples that were taken for cell line generation (Patient
Identification (PID) IV-2, IV-11, and IV-15) to be used in functional studies (Figure 2.2).
36
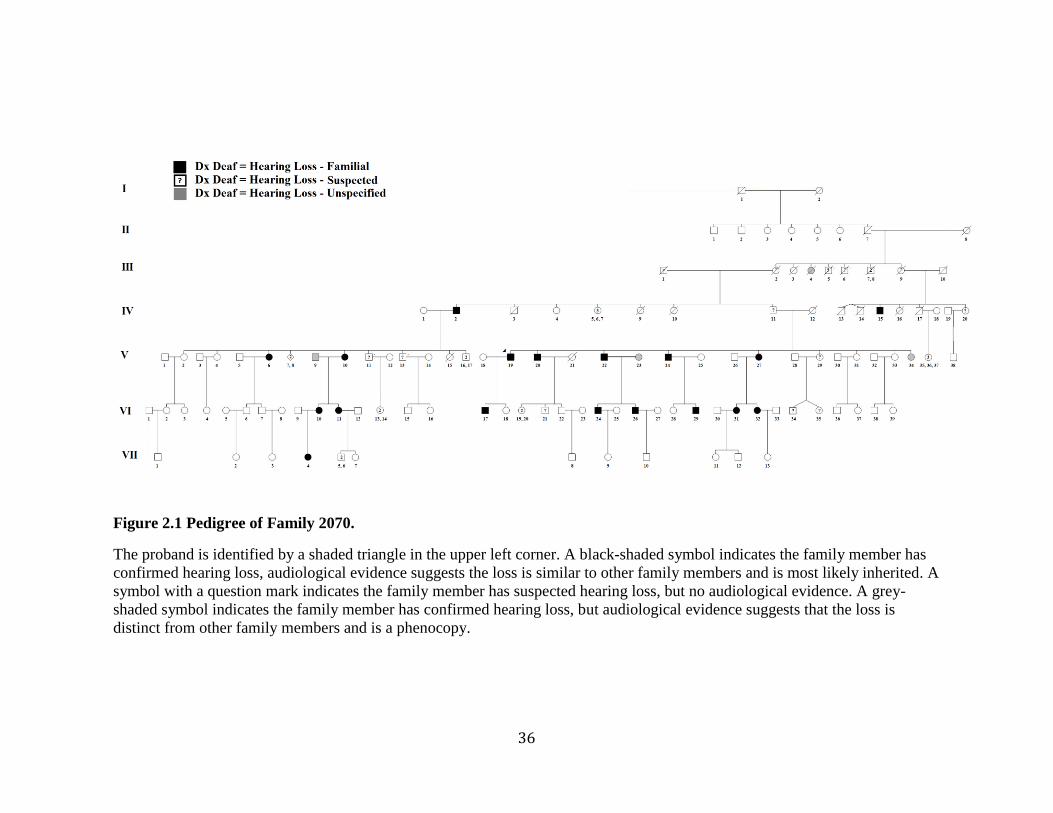
Figure 2.1 Pedigree of Family 2070.
The proband is identified by a shaded triangle in the upper left corner. A black-shaded symbol indicates the family member has
confirmed hearing loss, audiological evidence suggests the loss is similar to other family members and is most likely inherited. A
symbol with a question mark indicates the family member has suspected hearing loss, but no audiological evidence. A grey-
shaded symbol indicates the family member has confirmed hearing loss, but audiological evidence suggests that the loss is
distinct from other family members and is a phenocopy.
37
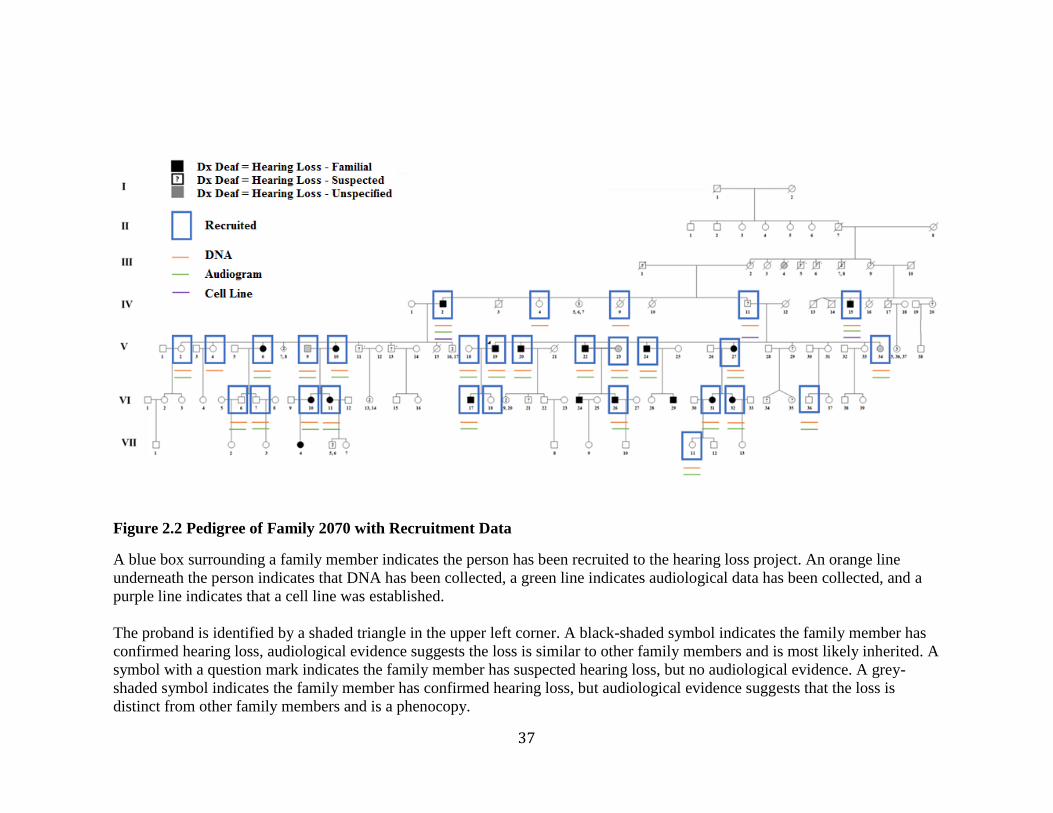
Figure 2.2 Pedigree of Family 2070 with Recruitment Data
A blue box surrounding a family member indicates the person has been recruited to the hearing loss project. An orange line
underneath the person indicates that DNA has been collected, a green line indicates audiological data has been collected, and a
purple line indicates that a cell line was established.
The proband is identified by a shaded triangle in the upper left corner. A black-shaded symbol indicates the family member has
confirmed hearing loss, audiological evidence suggests the loss is similar to other family members and is most likely inherited. A
symbol with a question mark indicates the family member has suspected hearing loss, but no audiological evidence. A grey-
shaded symbol indicates the family member has confirmed hearing loss, but audiological evidence suggests that the loss is
distinct from other family members and is a phenocopy.
38
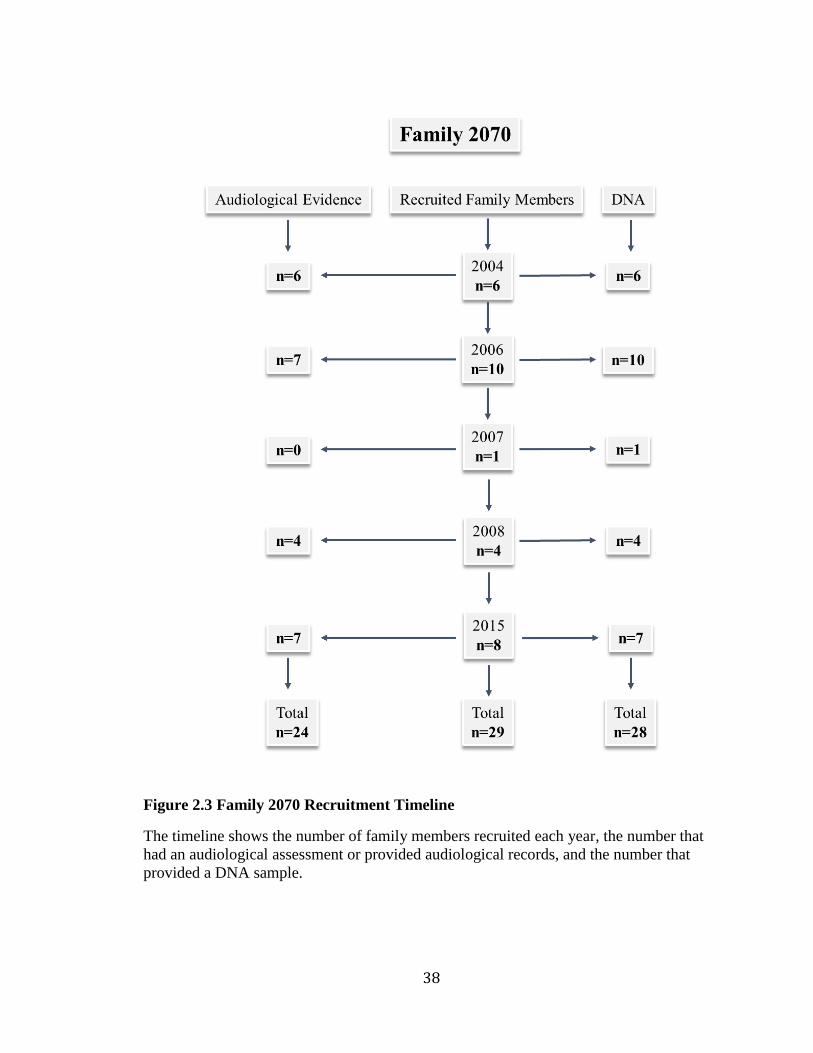
Figure 2.3 Family 2070 Recruitment Timeline
The timeline shows the number of family members recruited each year, the number that
had an audiological assessment or provided audiological records, and the number that
provided a DNA sample.
39
Experimental Design
The investigation into the genetic cause of hearing loss in Family 2070 used
several molecular genetics techniques, including: genome-wide SNP genotyping and
linkage analysis, NGS, bidirectional Sanger sequencing and cDNA analysis. Using a
combination of traditional and modern technology the genetic region of interest was
narrowed to a small locus and the variants contained within were quickly and efficiently
examined.
40
Genome-Wide SNP Genotyping and Linkage Analysis of Family 2070
Genome-wide SNP genotyping and linkage analysis was used to identify small
regions of the genome shared by members with hearing loss that were absent in those
with normal hearing. A PhD candidate in our lab selected twenty family members: eleven
with confirmed hearing loss, two with suspected hearing loss and seven with normal
hearing. Their DNA samples were sent to The Center for Applied Genomics (TCAG) in
Toronto for genome-wide SNP genotyping and linkage analysis (Appendix F).
41
Next-Generation Sequencing of Family 2070
NGS was used to identify and filter exome variants present in two family
members: PID V-10 (affected) and V-34 (unaffected). The Life Technologies Ion
Torrent™ Exome Sequencing solution was used for library construction, template
preparation and enrichment, sequencing and data analysis.
Next-Generation Sequencing Protocol
Library Construction
The exome libraries were constructed by following the Ion AmpliSeq™ Exome
RDY Library Preparation User Guide (Publication Number MAN0010084). A copy of the
protocol is available at https://www.thermofisher.com/ca/en/home.html. Libraries were
constructed using 200 ng of genomic DNA (gDNA). To amplify the exome target regions
the Ion AmpliSeq™ Exome RDY kit and an Eppendorf AG 22331 Hamburg thermal
cycler were used. To distinguish between the libraries, they were barcoded using Ion
Xpress™ Barcode Adapters. The libraries were then purified using the Agencourt
AMPure XP kit (Beckman Coulter) and quantified using the Ion Library Quantification
Kit (Cat. no. 4468802) and Life Technologies ViiA™7 System real-time PCR instrument.
42
Template Preparation and Enrichment
The template-positive Ion Sphere™ particles (ISPs) were prepared and enriched,
following the Ion PI™ Template OT2 200 kit v3 User Guide (publication number
MAN0009133). A copy of the protocol is available at
https://www.thermofisher.com/ca/en/home.html. The Ion OneTouch™ 2 System and the
Ion PI™ Template OT2 200 kit v3 were used to prepare template-positive Ion Sphere™
Particles (ISPs) by emulsion PCR. Next the Ion OneTouch™ ES instrument and the
Dynabeads® MyOne™ Streptavidin C1 Magnetic Beads were used to enrich the
template-positive ISPs for sequencing on the Ion Proton™ system. Finally, the percentage
of template ISPs were measured using the Qubit® 2.0 Fluorometer and the Ion Sphere™
Quality Control kit.
Sequencing
The exome libraries were sequenced following the Ion PI™ Sequencing 200 Kit
V3 User Guide (publication number MAN0009136). A copy of the protocol is available
at https://www.thermofisher.com/ca/en/home.html. The Torrent Suite™ Software was
used to plan and monitor the sequencing instrument runs and resultant data. The Ion PI™
Sequencing 200 Kit V3 was then used to clean and initialize the Ion Proton™ Sequencer.
Finally, the template-positive ISPs were prepared for sequencing, loaded onto two
calibrated Ion PI™ Chip V2 (Cat. no. 4485413) and then sequenced.
43
Data Analysis
The Torrent Suite™ Software and Torrent Server were used to analyze and store
the sequencing data from the Ion Proton™ system. Next the variant dataset was filtered
using Microsoft Excel to contain only variants within the linked region on chromosome
13, genomic positions 110,708,368-114,312,000 and further filtered to contain only
variants with a MAF of less than 1%. The remaining variants were sent to the next phase
for validation.
44
Sanger Sequencing
Bidirectional Sanger sequencing was an important technique employed throughout
the project. Below is a description of its multiple uses and the procedure that was
followed:
1) Validation of NGS Variant Dataset in Family 2070
After exome sequencing, 13 potentially pathogenic variants remained. To verify
the NGS base calls, Sanger sequencing was used to screen PID V-10 and V-34 for the 13
variants. This allowed for the validation of the variant dataset by a different method.
2) Assessment of Co-segregation with Hearing Loss in Family 2070
Following validation of the variant dataset, only 3/13 variants were verified. To
test co-segregation of the 3 variants with hearing loss in Family 2070, Sanger sequencing
was used to screen the remaining 26 family members.
3) Assessment of Population Frequency
Subsequently, all 3 variants co-segregated with hearing loss. Based upon the
previous filtering criteria, all 3 are rare and have a MAF of less than 1% (ExAC
Browser), but it is possible they are more common in the Newfoundland population. To
determine the variant frequencies in the Newfoundland population, Sanger sequencing
was used to screen more than 80 ethnically-matched population controls.
45
4) Identification of Additional Families
Consequently, all 3 variants were absent from the Newfoundland population controls.
To search for more evidence regarding the pathogenicity of the 3 variants, Sanger
sequencing was used to screen a cohort of 65 Newfoundland deafness probands. As a
founder population, it is possible that multiple Newfoundland families will share the same
pathogenic mutation and additional affected carriers will lend evidence to the
pathogencity of the variant or allow for co-segregation analysis with additional families.
5) cDNA Analysis
Since the variants identified were intronic, they could have an effect on gene
splicing and therefore resultant protein structure and function. Using polymerase chain
reactions (PCRs), gel electrophoresis, and Sanger sequencing, the cDNA of ADPRHL1
variant carriers and wild-type controls was analyzed.
46
Sanger Sequencing Protocol
Bidirectional Sanger sequencing involved three steps: PCR and electrophoresis,
preparation for ABI cycle sequencing and automated sequencing using the ABI 3130 XL
and ABI 3500 XL genetic analyzers.
Polymerase Chain Reaction and Electrophoresis
The region surrounding each variant was amplified by PCR using the master mix
in Appendix G and primers in Appendix H. The master mix was vortexed and
centrifuged and then 19 µL was aliquoted into each reaction well of a PCR plate,
followed by 1.0 µL of gDNA (10 ng/µL). The PCR plate was sealed using adhesive film,
labeled, balanced and centrifuged then placed in a GeneAmp PCR system 9700 for
amplification using the thermocycler program in Appendix I.
The PCR products (3 µL) were electrophoresed using a 1% agarose gel (0.5 g of
agarose and 50 mL of 1X TBE Buffer) containing 1.5 µL of Invitrogen SYBR Safe DNA
Gel stain and visualized under UV light using the KODAK Gel Logic 100 Imaging
System.
Preparation for ABI Cycle Sequencing
The PCR products that were successfully amplified were purified using Sephacryl
S 300 (GE Healthcare). The Sephacryl S 300 was re-suspended and 300 µL was added to
a Millipore Multiscreen HTS plate with a waste plate aligned underneath. Then the plate
was balanced and centrifuged at 1811 rcf for 5 min and the flow-through was discarded.
Next, the Multiscreen plate was positioned over a clean PCR plate, the remaining PCR
products were aliquoted into the wells containing Sephacryl and then balanced and
47
centrifuged at 1811 rcf for another 5 min. Lastly, the purified PCR products were
collected in the flow-through and used as template for the ABI cycle sequencing
reactions.
Two separate master mixes, one forward and one reverse, were prepared for ABI
cycle sequencing reactions, according to the master mix in Appendix J. Then 19 µL of
master mix was added to each well in a 96-well reaction plate followed by 1 µL of
purified PCR product in the appropriate wells. The reaction plate was sealed using a
silicone mat, balanced and centrifuged, then loaded onto a thermal cycler programed with
Appendix K.
The ABI cycle sequencing reaction products were purified through ethanol
precipitation. First the products were centrifuged, then 5 µL of 125 mM EDTA was added
to each well followed by 65 µL of 95% ethanol. The samples were incubated for at least
15 min at ambient temperature in the dark and then centrifuged for 30 min at 3000 rcf. To
decant the ethanol, the plate was inverted over a sink and paper towels were placed
beneath to catch the excess ethanol mixture. Then 150 µL of 70% ethanol was added, the
plate was covered with a silicone mat, and then balanced and centrifuged at 3000 rcf for
15 min. The ethanol removal procedure was repeated. Then to ensure all ethanol was
removed, the plate was placed inverted with paper towels underneath in the centrifuge
and spun at 8 rcf for 2 min. The plate was dried in the dark for at least 15 min at ambient
temperature.
Lastly, 15 µL of Hi Di formamide (Applied Biosystems) was added to each
reaction well and the plate was vortexed, balanced and centrifuged briefly, then placed on
48
a thermal cycler and denatured at 94 °C for 2 min. The plate was again balanced and
centrifuged then loaded onto the DNA analyzer.
Automated Sequencing Using the ABI 3130 and ABI 3500
Two DNA analyzers were used for automated sequencing, ABI 3130 XL Genetic
Analyzer and ABI 3500 XL Genetic Analyzer. Variants were identified in the resultant
sequences using Mutation Surveyor software (Version 4.0.9, SoftGenetics) and then their
pathogenicity was assessed using a mutation interpretation program called Alamut
(Interactive Biosoftware V 2.7.1).
49
cDNA Analysis of Family 2070
As mentioned previously, the 3 putative variants could have an effect on gene
splicing. Using PCR, gel electrophoresis and Sanger sequencing, the cDNA of ADPRHL1
mutation carriers and wild-type controls was analyzed. However, since F10 was not
significantly expressed in B-lymphocytes it was not possible to analyze the cDNA of F10
mutation carriers.
cDNA Analysis Protocol
Isolation, Culture, and Storage of Cell Pellets
Whole blood was collected from three family members and six population
controls in ACD (anticoagulant) containing tubes. B-lymphocytes were extracted,
cultured and transformed to create Epstein Barr virus (EBV)-immortalized cell lines. The
cell lines were than stored in liquid nitrogen (performed by a research assistant).
The frozen B-cell aliquots were re-suspended in RPMI (Roswell Park Memorial
Institute) medium, cultured, harvested as a cell pellet and stored at -80 °C (performed by
a research assistant).
Extraction of RNA from Cell Pellets
Total RNA was isolated from the cell pellets using TRIzol Reagent (Life
Technologies) following the protocols outlined in MAN0001271. Any remaining DNA
was digested using TURBO DNA-free™ kit (ThermoFisher), following the protocols
outlined in the user guide, publication number 1907M, revision G. A copy of the protocol
is available at https://www.thermofisher.com/ca/en/home.html.
50
Complementary DNA Synthesis
From total RNA, poly (A)+ selected RNA was used to synthesize cDNA using
SuperScript™ III Reverse Transcriptase (Invitrogen) following the protocols outlined in
MAN0001346. A copy of the protocol is available at
https://www.thermofisher.com/ca/en/home.html.
Polymerase Chain Reaction and Gel Electrophoresis of Target cDNA
To determine if ADPRHL1 c.380-17C>A and c.380-16T>G caused alternative
mRNA splicing, the region between exon 2-4 was amplified by PCR. The methods
described previously for PCR were used, except 2 µL of cDNA was used as template
instead of 1 µL of gDNA to amplify the region surrounding ADPRHL1 c.380-17C>A and
c.380-16T>G. The primer sequences are described in Appendix L.
The PCR product (10 µL) was electrophoresed using a 1.5% agarose gel (0.75 g
of agarose and 50 mL of 1X TBE Buffer) containing 1.5 µL of Invitrogen SYBR Safe
DNA Gel stain and visualized under UV light using the Syngene U:Genius imaging
system.
Preparation for ABI Cycle Sequencing
The methods previously described for purification and ABI cycle sequencing were
followed for the PCR products of ADPRHL1 exon-2-4.

51
Automated Sequencing Using the ABI 3130 and ABI 3500
The methods previously described for sequencing were followed for the PCR
products of ADPRHL1 Ex-2-4.
52
Chapter 3 Results
Hearing Loss in Family 2070
Family 2070 is a large seven-generation family with bilateral, sensorineural
hearing loss (BLSNHL). The estimated age of onset among family members is variable,
ranging from birth to early adulthood. It begins as a high frequency loss, producing a
sloping profile. Over time the loss progresses to affect all frequencies resulting in
profound hearing loss.
Since early audiometric data was limited, the estimated age of onset was based
upon self-report and factors like estimated age of hearing aid use. The onset of hearing
loss in Family 2070 is variable (Table 3.1). All affected family members describe having
hearing loss before age thirty but some describe hearing loss at birth (PID V-19), others
during childhood (PID VI-24) and some in early adulthood (PID VI-31).
The severity of hearing loss in Family 2070 is also variable. For instance, PID V-
19 had severe to profound hearing loss at age 34 whereas PID V-6 had moderate hearing
loss at age 58 (Table 3.1). Despite this variability, similar phenotypes were observed
among some family members; the proband (PID V-19), his son (PID V-17) and his uncle
(PID IV-2) all have severe to profound hearing loss (Figure 3.1).
Three family members PID V-9, V-23 and V-34 had hearing loss that was
attributed to other factors (Appendix M). It should be noted that PID V-9 and V-34 did
not meet the GENDEAF criteria for hearing loss (their hearing was within normal limits)
but upon examining their audiograms a mild loss was observed at specific frequencies.
53
Also, despite being married-into Family 2070, the phenotype of PID V-9 and V-23 was
important because they have affected children and it was necessary to compare their
phenotype to their children’s. The phenotype in these cases differed from their children in
severity and configuration, suggesting that factors like age or noise exposure may have
affected their hearing. For example, according to the GENDEAF recommendations, PID
V-9 has normal hearing and his daughters (PID VI-10 and VI-11) have moderate to
severe hearing loss. PID V-23 differs in symmetry from her sons (PID VI-24 and VI-26)
and has a unilateral loss. PID V-34 has normal hearing at 58 years of age, while her
siblings have severe to profound hearing loss.
The mode of inheritance of hearing loss in Family 2070 is most likely autosomal
dominant. Hearing loss is inherited vertically through the pedigree and there are a large
number of affected children. For example, in Figure 2.1: 55% (5/9) of PID IV-11’s
children have hearing loss. Furthermore, PID V-10, V-22, and V-27 have 100% (2/2)
affected children. Inheritance is not X-linked or mitochondrial because there are instances
of male-to-male transmission in the family, as shown in Figure 2.1 for PID V-19 to VI-
17. Moreover, the inheritance is not likely to be autosomal recessive because there are
multiple affected family members in each generation.
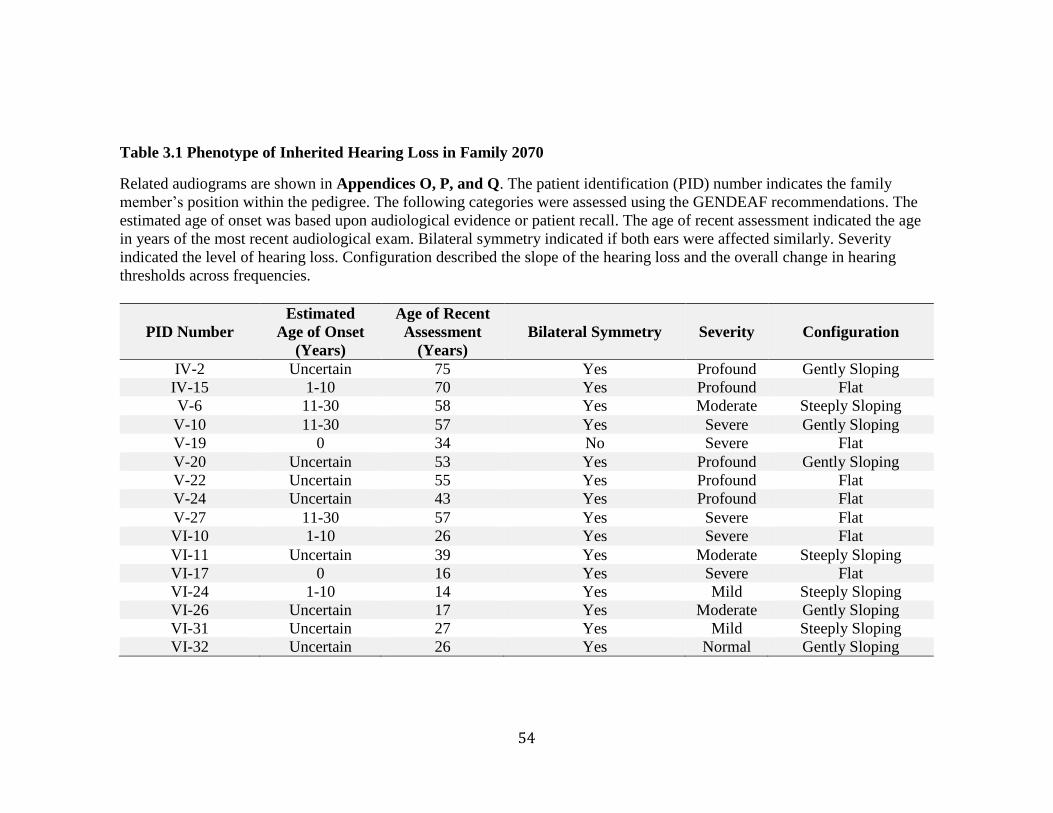
54
Table 3.1 Phenotype of Inherited Hearing Loss in Family 2070
Related audiograms are shown in Appendices O, P, and Q. The patient identification (PID) number indicates the family
member’s position within the pedigree. The following categories were assessed using the GENDEAF recommendations. The
estimated age of onset was based upon audiological evidence or patient recall. The age of recent assessment indicated the age
in years of the most recent audiological exam. Bilateral symmetry indicated if both ears were affected similarly. Severity
indicated the level of hearing loss. Configuration described the slope of the hearing loss and the overall change in hearing
thresholds across frequencies.
PID Number
Estimated
Age of Onset
(Years)
Age of Recent
Assessment
(Years)
Bilateral Symmetry Severity Configuration
IV-2 Uncertain 75 Yes Profound Gently Sloping
IV-15 1-10 70 Yes Profound Flat
V-6 11-30 58 Yes Moderate Steeply Sloping
V-10 11-30 57 Yes Severe Gently Sloping
V-19 0 34 No Severe Flat
V-20 Uncertain 53 Yes Profound Gently Sloping
V-22 Uncertain 55 Yes Profound Flat
V-24 Uncertain 43 Yes Profound Flat
V-27 11-30 57 Yes Severe Flat
VI-10 1-10 26 Yes Severe Flat
VI-11 Uncertain 39 Yes Moderate Steeply Sloping
VI-17 0 16 Yes Severe Flat
VI-24 1-10 14 Yes Mild Steeply Sloping
VI-26 Uncertain 17 Yes Moderate Gently Sloping
VI-31 Uncertain 27 Yes Mild Steeply Sloping
VI-32 Uncertain 26 Yes Normal Gently Sloping
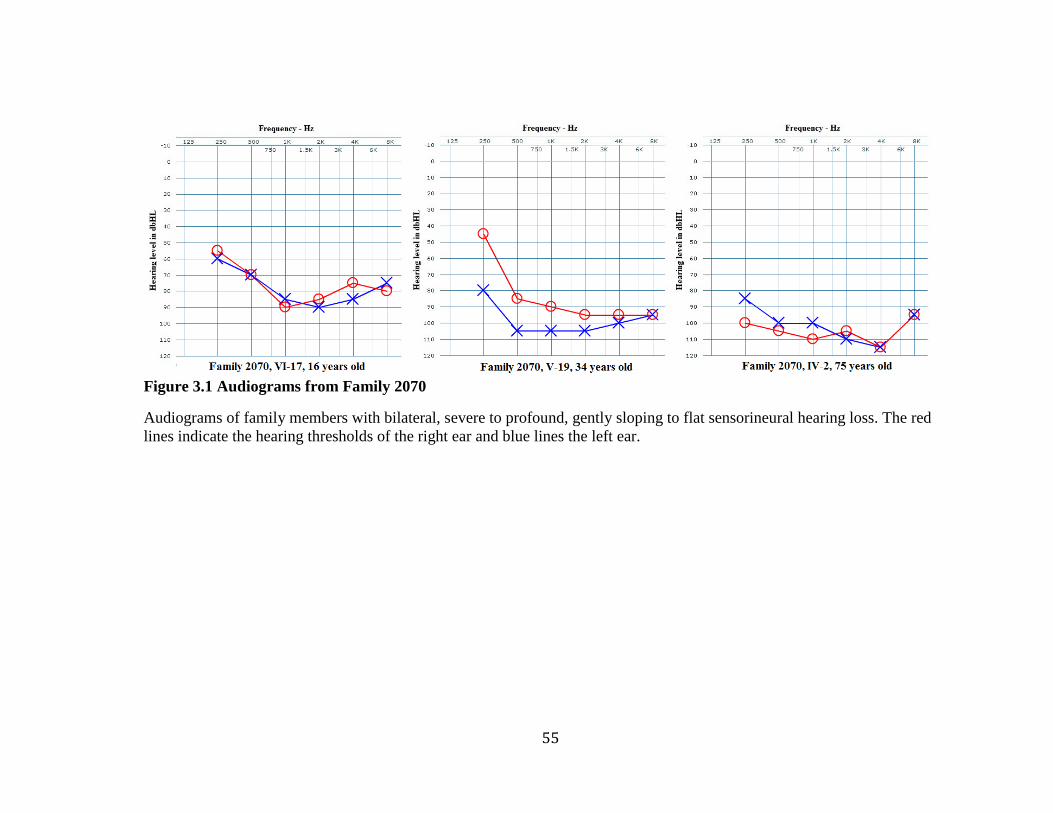
55
Figure 3.1 Audiograms from Family 2070
Audiograms of family members with bilateral, severe to profound, gently sloping to flat sensorineural hearing loss. The red
lines indicate the hearing thresholds of the right ear and blue lines the left ear.
56
Hearing Loss in Additional Families
Variants that co-segregated with hearing loss in Family 2070 were screened in 65
Newfoundland deafness probands. Two additional families were identified that shared the
ADPRHL1 variants: Family 2110 and 2143. Both have only one family member recruited
to the hearing loss project. The phenotype of the probands are described below, along
with potential inheritance patterns based upon interview data.
Hearing Loss in Family 2110
Family 2110 is a four-generation family from the North East Avalon Peninsula,
with a history of severe hearing loss. Since 2007, only the proband, PID III-1, has been
recruited (Table 3.2). It was difficult to determine the role genetics played in her hearing
loss since she had a history of ear infections, only recent audiograms were available and
at 78 years old there is likely an age-related component to her hearing loss. Her latest
audiogram showed bilateral, steeply sloping, moderate sensorineural hearing loss (Figure
3.2). These moderate losses in the mid and high frequencies would have a significant
effect on her ability to understand regular speech. Interestingly, the hearing loss
configuration and severity were similar to PID V-6 from Family 2070 (Table 3.1).
Without audiological records from other family members it is challenging to
determine the mode of inheritance. Based upon interview data from the proband of
Family 2110, the most likely mode of inheritance is autosomal dominant (Figure 3.3).
Several of her siblings 91% (10/11) were described as having hearing loss and reported
using hearing aids. These individuals (PID V-2, V-3, V-4, V-5, V-7, V-8, V-10, V-11,
57
and V-12) have been designated as having suspected hearing loss and their phenotype
was indicated on the pedigree using a “?”, as there was no audiological evidence to
confirm their status. The hearing loss appeared to be inherited vertically through the
pedigree. The father of the proband, PID II-1, and many of his children have suspected
hearing loss. Furthermore, both PID III-8 and her child PID IV-1 have suspected hearing
loss. With so many potentially affected family members the mode of inheritance is
unlikely to be autosomal recessive. It is also unlikely to be mitochondrial or X-linked
because there is possible male-to-male transmission of hearing loss, PID II-1 to III-4.
Hearing Loss in Family 2143
Family 2143 is a three-generation family from Central Newfoundland with a
history of hearing loss. Since 2008, only the proband, PID III-1, has been recruited
(Table 3.2). He was first assessed for hearing loss at age 28. At this age a conductive and
sensorineural component were present, resulting in a mixed type of hearing loss. His most
recent assessment at age 41 did not show a conductive component; instead a bilateral, flat
mild sensorineural loss (Figure 3.2). Also, despite the GENDEAF recommendations
describing his loss as being flat, at individual frequencies his audible thresholds are quite
different. For example, his right ear audible thresholds jump between 40-60 dB HL. It can
be seen that the configuration of the audiogram is irregular and lacks the bilateral
symmetry seen in Family 2070. Furthermore, conductive hearing loss was not observed in
Family 2070.
As in the case of Family 2110, without audiological records from other family
members it is challenging to assess the potential mode of inheritance of hearing loss.
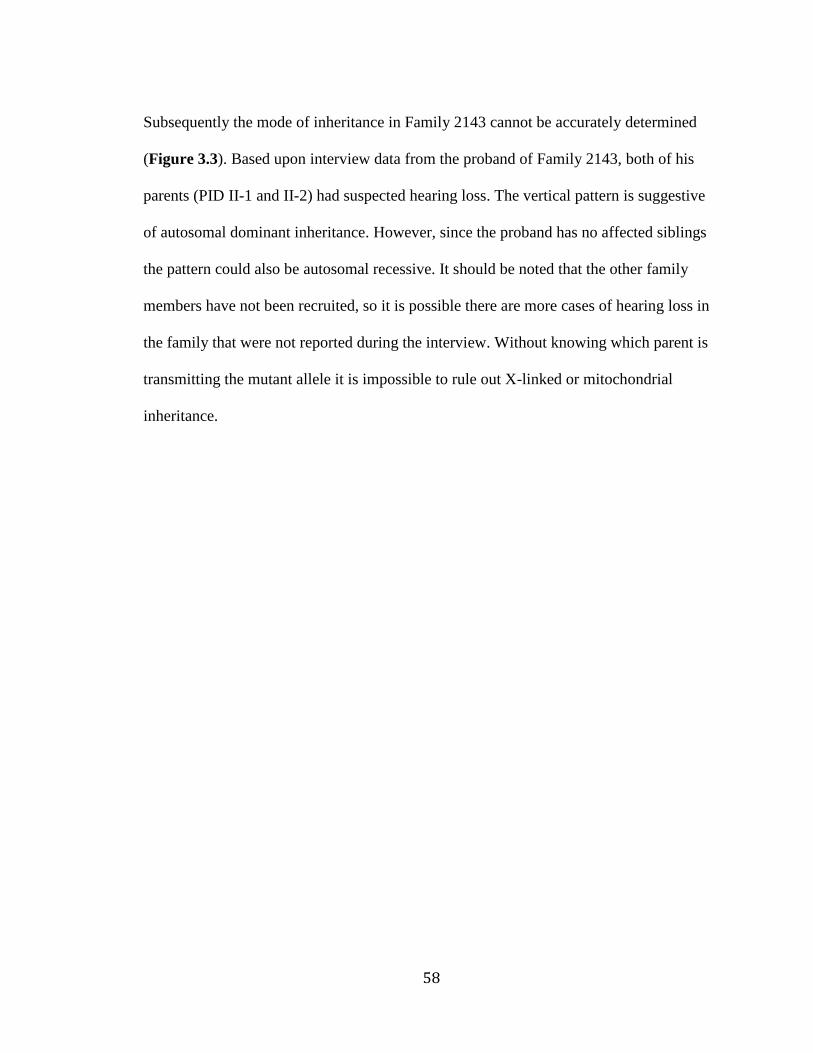
58
Subsequently the mode of inheritance in Family 2143 cannot be accurately determined
(Figure 3.3). Based upon interview data from the proband of Family 2143, both of his
parents (PID II-1 and II-2) had suspected hearing loss. The vertical pattern is suggestive
of autosomal dominant inheritance. However, since the proband has no affected siblings
the pattern could also be autosomal recessive. It should be noted that the other family
members have not been recruited, so it is possible there are more cases of hearing loss in
the family that were not reported during the interview. Without knowing which parent is
transmitting the mutant allele it is impossible to rule out X-linked or mitochondrial
inheritance.
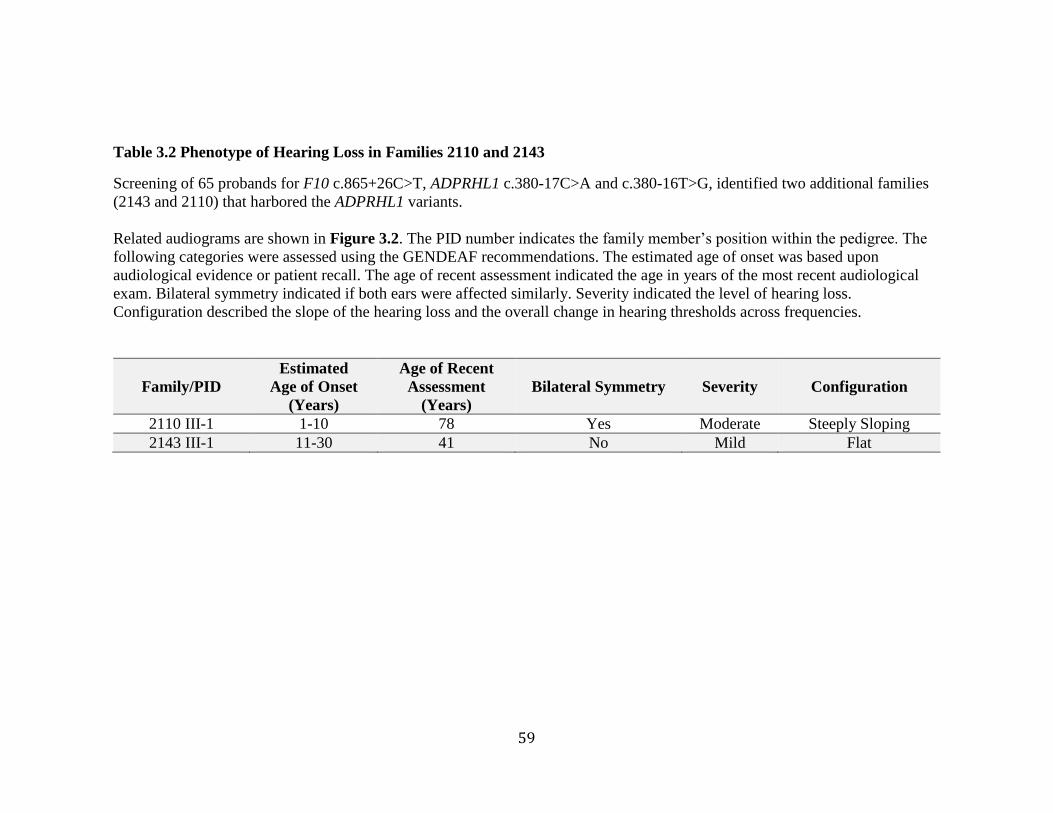
59
Table 3.2 Phenotype of Hearing Loss in Families 2110 and 2143
Screening of 65 probands for F10 c.865+26C>T, ADPRHL1 c.380-17C>A and c.380-16T>G, identified two additional families
(2143 and 2110) that harbored the ADPRHL1 variants.
Related audiograms are shown in Figure 3.2. The PID number indicates the family member’s position within the pedigree. The
following categories were assessed using the GENDEAF recommendations. The estimated age of onset was based upon
audiological evidence or patient recall. The age of recent assessment indicated the age in years of the most recent audiological
exam. Bilateral symmetry indicated if both ears were affected similarly. Severity indicated the level of hearing loss.
Configuration described the slope of the hearing loss and the overall change in hearing thresholds across frequencies.
Family/PID
Estimated
Age of Onset
(Years)
Age of Recent
Assessment
(Years)
Bilateral Symmetry Severity Configuration
2110 III-1 1-10 78 Yes Moderate Steeply Sloping
2143 III-1 11-30 41 No Mild Flat
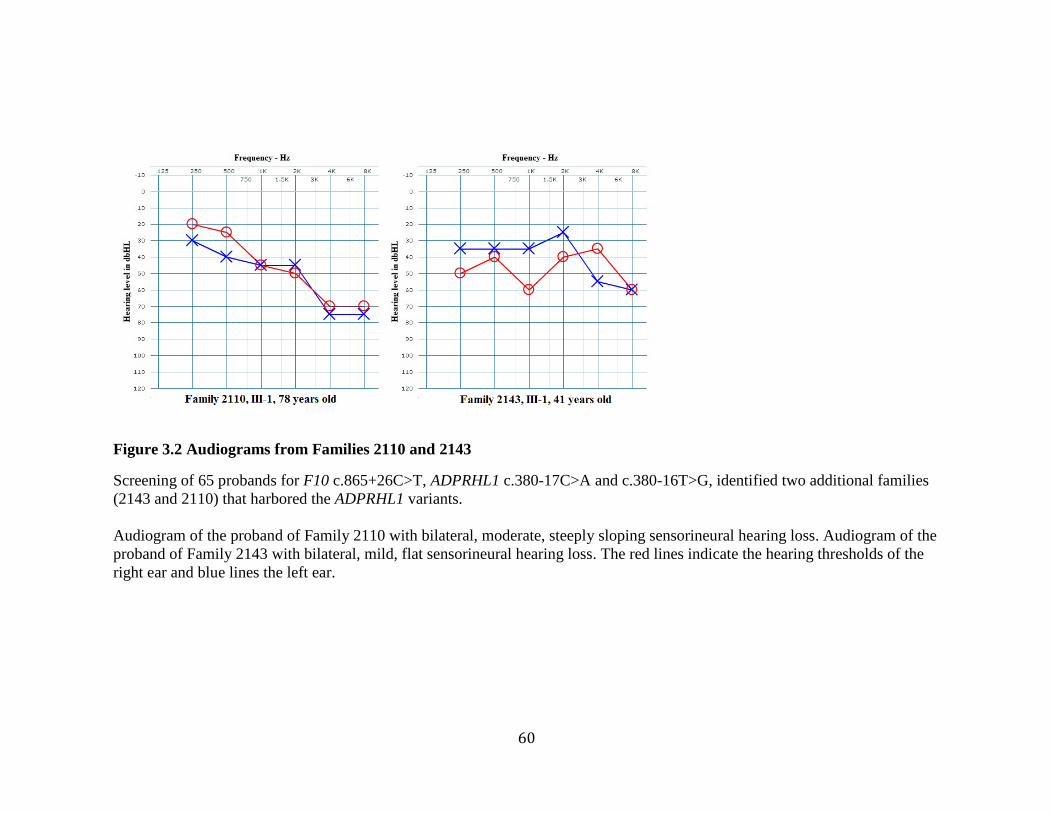
60
Figure 3.2 Audiograms from Families 2110 and 2143
Screening of 65 probands for F10 c.865+26C>T, ADPRHL1 c.380-17C>A and c.380-16T>G, identified two additional families
(2143 and 2110) that harbored the ADPRHL1 variants.
Audiogram of the proband of Family 2110 with bilateral, moderate, steeply sloping sensorineural hearing loss. Audiogram of the
proband of Family 2143 with bilateral, mild, flat sensorineural hearing loss. The red lines indicate the hearing thresholds of the
right ear and blue lines the left ear.
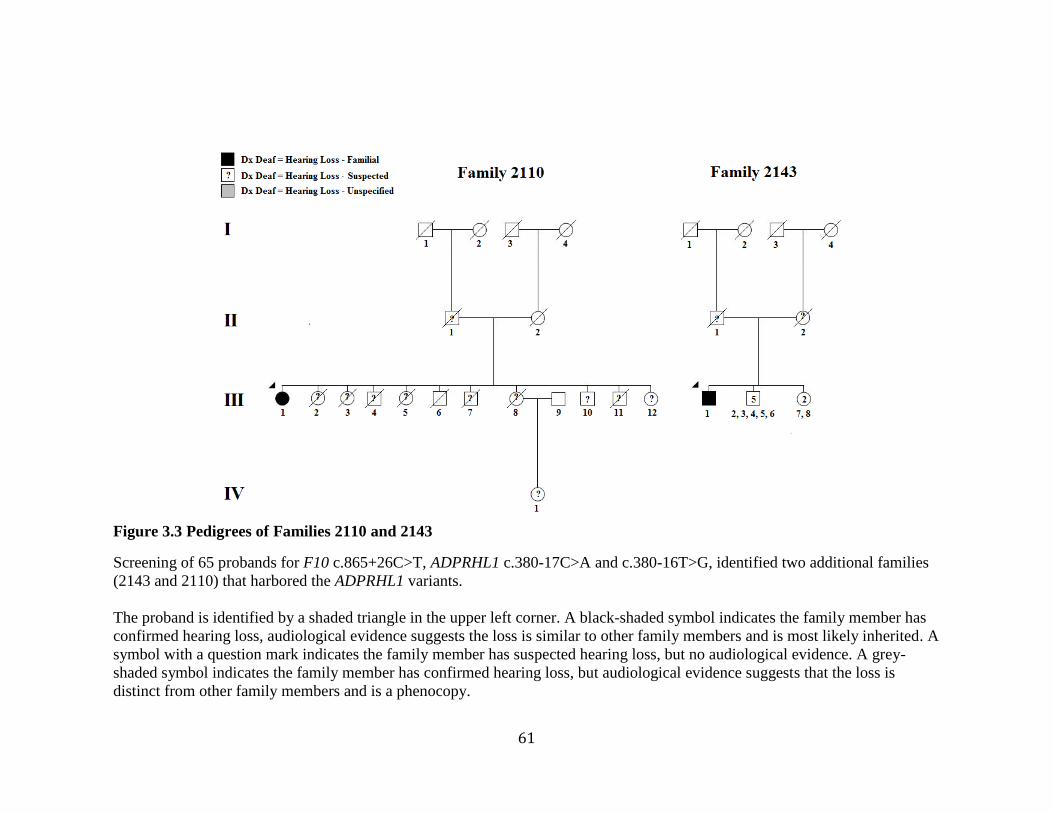
61
Figure 3.3 Pedigrees of Families 2110 and 2143
Screening of 65 probands for F10 c.865+26C>T, ADPRHL1 c.380-17C>A and c.380-16T>G, identified two additional families
(2143 and 2110) that harbored the ADPRHL1 variants.
The proband is identified by a shaded triangle in the upper left corner. A black-shaded symbol indicates the family member has
confirmed hearing loss, audiological evidence suggests the loss is similar to other family members and is most likely inherited. A
symbol with a question mark indicates the family member has suspected hearing loss, but no audiological evidence. A grey-
shaded symbol indicates the family member has confirmed hearing loss, but audiological evidence suggests that the loss is
distinct from other family members and is a phenocopy.
62
Results of Genome-Wide SNP Genotyping and Linkage Analysis of Family
2070
The genome-wide SNP genotyping data was analyzed under a dominant model,
using two-point and multipoint linkage analyses, with the results of both approaches
indicating the presence of a linked region on chromosome 13.
Multipoint linkage analysis
Analysis 1 included all thirteen family members with hearing loss and indicated
the presence of three linked regions on two chromosomes, with a LOD score >1
(Appendix F). As mentioned previously, a positive LOD score suggests linkage between
a trait (hearing loss) and a genetic region. Most noteworthy were the adjacent linked
regions on chromosome 13, which obtained a statistically significant LOD score of 3.2,
the maximum possible for Family 2070 using this model.
Analysis 2 included eleven family members with confirmed hearing loss and
indicated the same three regions and an additional one on chromosome 5, with a LOD
score >1 (Appendix F). Interestingly, the regions on chromosome 13 again obtained a
LOD score of 3.2.
Two-point linkage analysis
Analysis 1 included all thirteen family members with hearing loss and indicated
the presence of eight linked regions on four chromosomes, with a LOD score >1.5
(Appendix F). However, the only region to achieve a maximum LOD score was the
63
linked region on chromosome 13, which obtained a LOD score of 4.77, the maximum
possible for Family 2070, under this model. The results of Analysis 2 (not shown) were
nearly identical to Analysis 1.
Strikingly, both multipoint and two-point analyses obtained maximal LOD scores
for regions on chromosome 13 and overlapped between genomic positions 110,708,368 –
114,312,000. The critical region spanned approximately 3.6 Mb and encompassed 26
genes. These results strongly suggest the presence of a linked region on chromosome
13q34.
64
Results of Next-Generation Sequencing of Family 2070
Library construction
The exome libraries of PID V-10 and V-34 were quantified using the Ion Library
TaqMan™ quantification kit. The expected yields were between 100-500pM and PID V-
10 had a library yield of 380pM, while PID V-34 had 366pM. Both libraries had yields
within the expected range for the Ion AmpliSeq™ Exome kit.
Template preparation and enrichment
The exome libraries of PID V-10 and V-34 were used to generate template-
positive Ion PI™ Ion Sphere™ Particles. The optimal percentage of templated ISPs, prior
to enrichment is 10-30%. PID V-10 had 27% template-positive ISPs, while PID V-34 had
33%. A percentage of templated ISPs >30 is associated with a multi-templated ISPs and
therefore mixed reads. However, the recommended optimal range is not intended to be
pass-fail criteria, so the PID V-34 sample was used for sequencing.
Sequencing
The Ion AmpliSeq Ready-to-Use panel design had 95.69% coverage of coding
regions. Within the linked region, coverage was 98.74%, with more than half of the genes
(16/26) being 100% covered (Appendix R). The total number of reads generated by the
exomes of PID V-10 and V-34 was 69,182,853 and 73,821,872 respectively, well within
the expected yield at 60-80,000,000 reads. Moreover, the average number of reads per
amplicon was high at 205.4 and 185.9. The percentage of amplicons with at least 20
65
reads was 96.24% and 96.76% respectively. Furthermore, the percentage of amplicons
with at least 1 read was 99.70% and 99.65%. Within the linked region, PID V-10’s
percentage of amplicons with at least 1 read was 92.78%, with half of the genes (13/26)
being fully covered at 100% (Appendix S). Despite the high coverage of most genes,
SOX1 performed poorly in both exomes, at 14.3% coverage.
Data analysis
The Torrent Variant Server identified 58,341 variants in PID V-10 and 55,383 in
PID V-34. To narrow the results, variants within the linked region on chromosome 13
were selected, reducing the number of variants to 132 and 128 for PID V-10 and V-34
respectively. Since the mode of inheritance was presumed autosomal dominant, only the
variants found exclusively in the affected sample PID V-10 were considered, reducing the
number of variants to 55. Finally, since pathogenic variants are more likely to be rare,
only variants with a MAF of less than 1% were considered, reducing the number of
variants to 13 (Table 3.3).
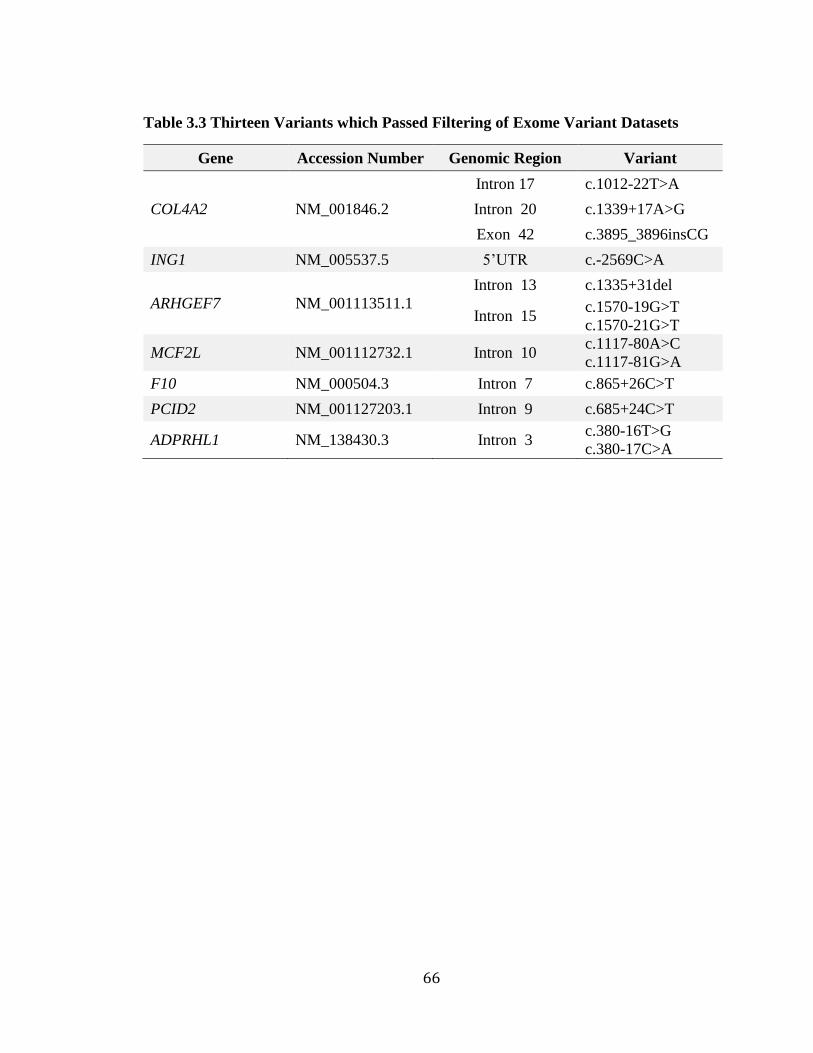
66
Table 3.3 Thirteen Variants which Passed Filtering of Exome Variant Datasets
Gene Accession Number Genomic Region Variant
COL4A2 NM_001846.2
Intron 17 c.1012-22T>A
Intron 20 c.1339+17A>G
Exon 42 c.3895_3896insCG
ING1 NM_005537.5 5’UTR c.-2569C>A
ARHGEF7 NM_001113511.1
Intron 13 c.1335+31del
Intron 15 c.1570-19G>T
c.1570-21G>T
MCF2L NM_001112732.1 Intron 10 c.1117-80A>C
c.1117-81G>A
F10 NM_000504.3 Intron 7 c.865+26C>T
PCID2 NM_001127203.1 Intron 9 c.685+24C>T
ADPRHL1 NM_138430.3 Intron 3 c.380-16T>G
c.380-17C>A
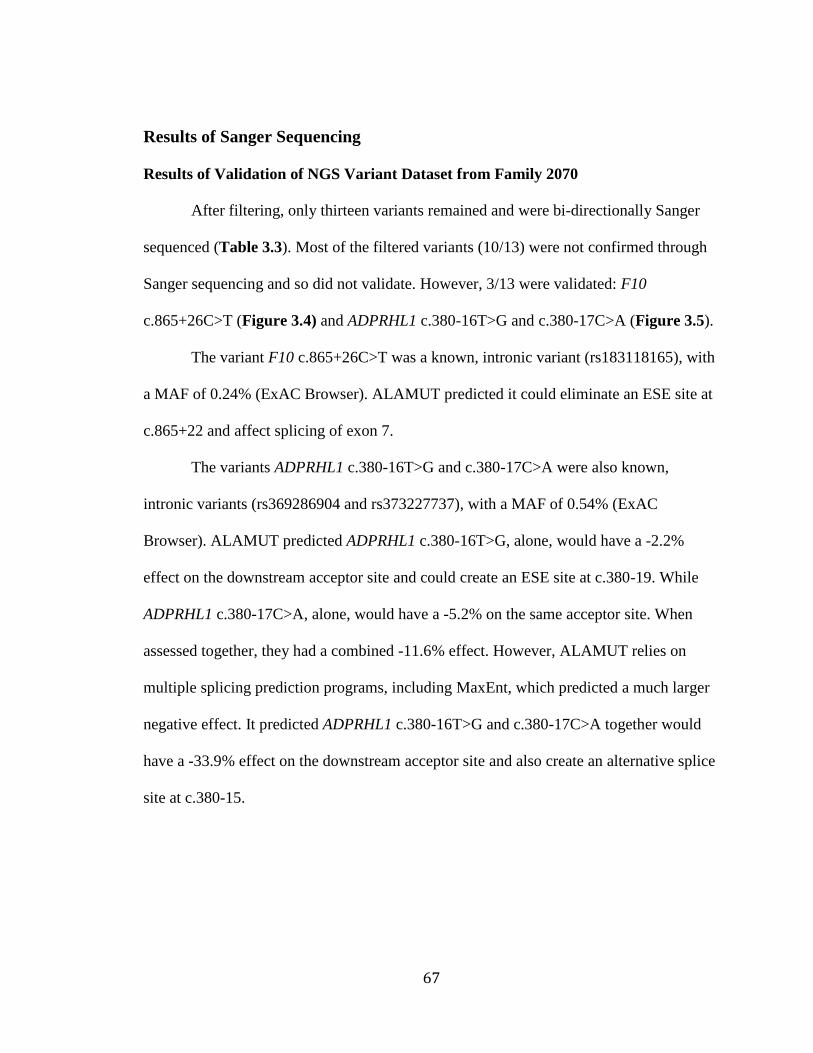
67
Results of Sanger Sequencing
Results of Validation of NGS Variant Dataset from Family 2070
After filtering, only thirteen variants remained and were bi-directionally Sanger
sequenced (Table 3.3). Most of the filtered variants (10/13) were not confirmed through
Sanger sequencing and so did not validate. However, 3/13 were validated: F10
c.865+26C>T (Figure 3.4) and ADPRHL1 c.380-16T>G and c.380-17C>A (Figure 3.5).
The variant F10 c.865+26C>T was a known, intronic variant (rs183118165), with
a MAF of 0.24% (ExAC Browser). ALAMUT predicted it could eliminate an ESE site at
c.865+22 and affect splicing of exon 7.
The variants ADPRHL1 c.380-16T>G and c.380-17C>A were also known,
intronic variants (rs369286904 and rs373227737), with a MAF of 0.54% (ExAC
Browser). ALAMUT predicted ADPRHL1 c.380-16T>G, alone, would have a -2.2%
effect on the downstream acceptor site and could create an ESE site at c.380-19. While
ADPRHL1 c.380-17C>A, alone, would have a -5.2% on the same acceptor site. When
assessed together, they had a combined -11.6% effect. However, ALAMUT relies on
multiple splicing prediction programs, including MaxEnt, which predicted a much larger
negative effect. It predicted ADPRHL1 c.380-16T>G and c.380-17C>A together would
have a -33.9% effect on the downstream acceptor site and also create an alternative splice
site at c.380-15.
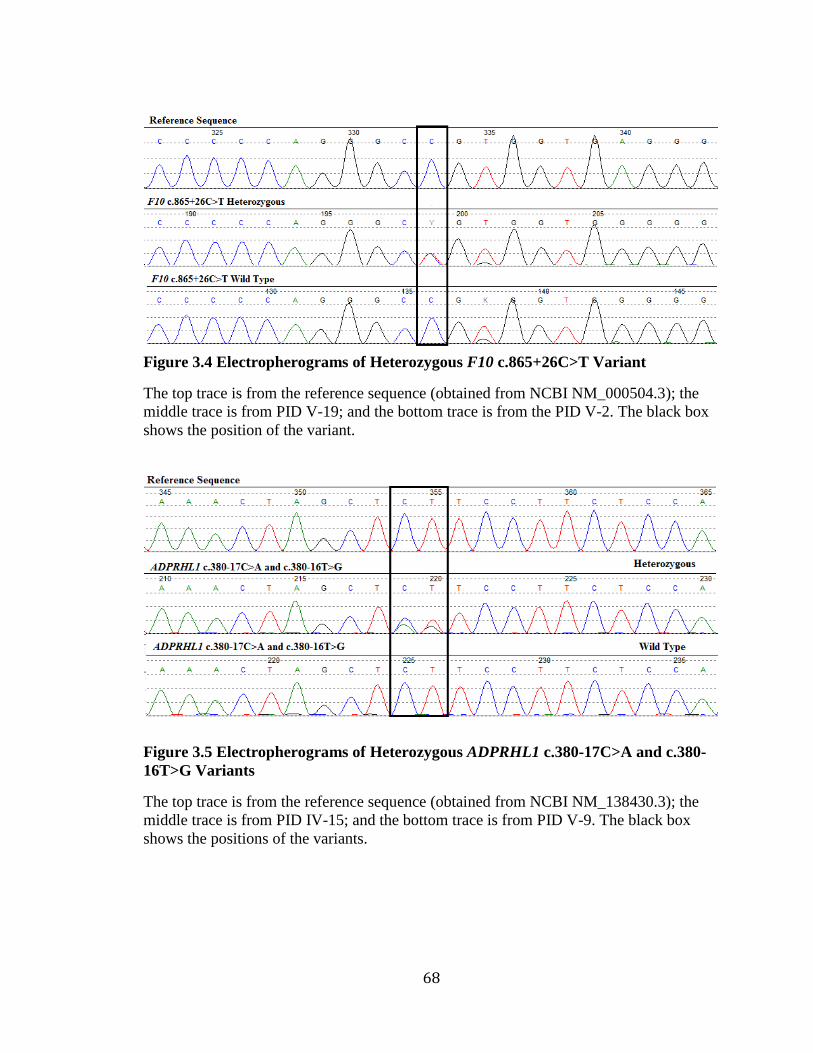
68
Figure 3.4 Electropherograms of Heterozygous F10 c.865+26C>T Variant
The top trace is from the reference sequence (obtained from NCBI NM_000504.3); the
middle trace is from PID V-19; and the bottom trace is from the PID V-2. The black box
shows the position of the variant.
Figure 3.5 Electropherograms of Heterozygous ADPRHL1 c.380-17C>A and c.380-
16T>G Variants
The top trace is from the reference sequence (obtained from NCBI NM_138430.3); the
middle trace is from PID IV-15; and the bottom trace is from PID V-9. The black box
shows the positions of the variants.
69
Results of Assessment of Co-Segregation with Hearing Loss in Family 2070
Twenty-eight family members were screened for the 3 validated NGS variants,
F10 c.865+26C>T and ADPRHL1 c.380-16T>G and c.380-17C>A, through bi-directional
Sanger sequencing.
F10 c.865+26C>T co-segregated with hearing loss in Family 2070 (Figure 3.6).
On the left side of the family pedigree, PID IV-2, his children PID V-6 and V-10 and his
grandchildren PID VI-10 and VI-11 all have hearing loss and are heterozygotes for the
F10 c.865+26C>T. On the right side of the pedigree, PID IV-11, his children PID V-19,
V-20, V-22, V-24, V-27 and his grandchildren PID V-17, V-26, V-31 and V-32 all have
hearing loss and are heterozygotes. Additionally, PID IV-15, the cousin of PID IV-2 and
IV-11, also has hearing loss and is a heterozygote. Meanwhile, 9 family members with
normal hearing from four generations were wild-type for F10 c.865+26C>T.
Additionally, 3 family members (PID V-34, V-9, and V-23) had hearing loss, which
could be attributed to other causes and were phenotypically different from the rest of the
family, were also wild type.
Similarly, both ADPRHL1 c.380-16T>G and c.380-17C>A co-segregated with
hearing loss in Family 2070 (Figure 3.6). In summary, all three variants co-segregated
with hearing loss in Family 2070 (Figure 3.7), suggesting the inheritance of a disease
haplotype whereby the variants are in linkage disequilibrium with each other and are
typically inherited together.
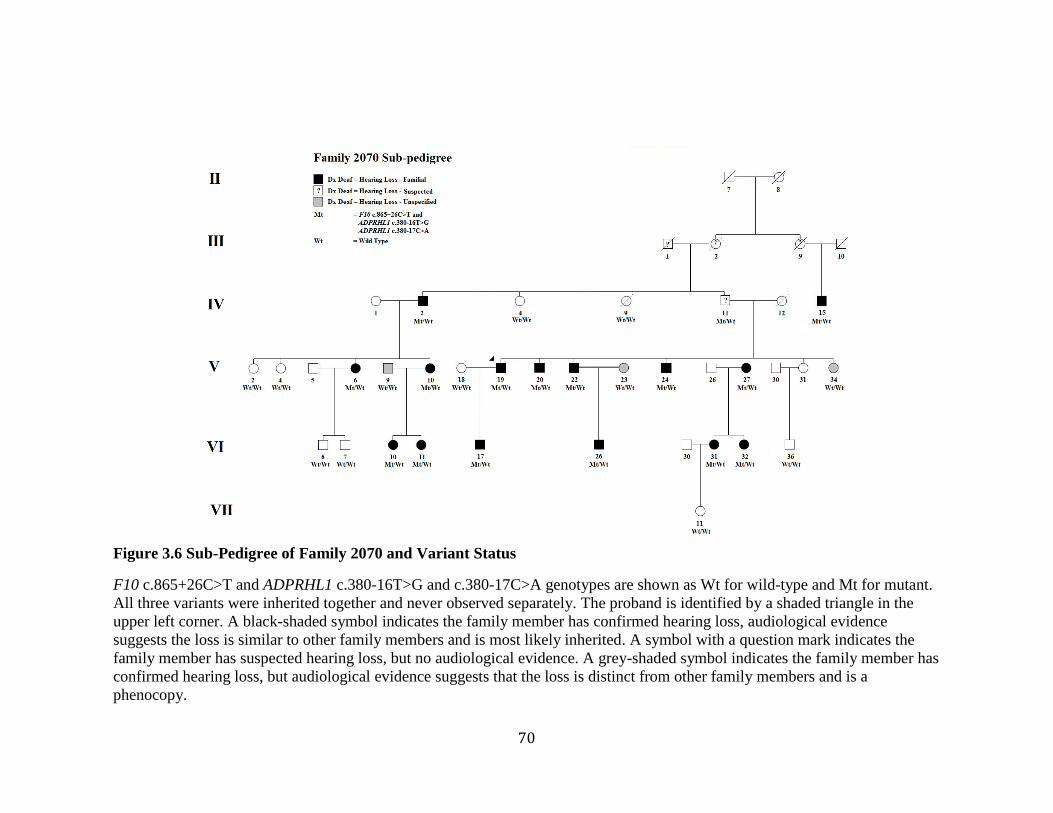
70
Figure 3.6 Sub-Pedigree of Family 2070 and Variant Status
F10 c.865+26C>T and ADPRHL1 c.380-16T>G and c.380-17C>A genotypes are shown as Wt for wild-type and Mt for mutant.
All three variants were inherited together and never observed separately. The proband is identified by a shaded triangle in the
upper left corner. A black-shaded symbol indicates the family member has confirmed hearing loss, audiological evidence
suggests the loss is similar to other family members and is most likely inherited. A symbol with a question mark indicates the
family member has suspected hearing loss, but no audiological evidence. A grey-shaded symbol indicates the family member has
confirmed hearing loss, but audiological evidence suggests that the loss is distinct from other family members and is a
phenocopy.
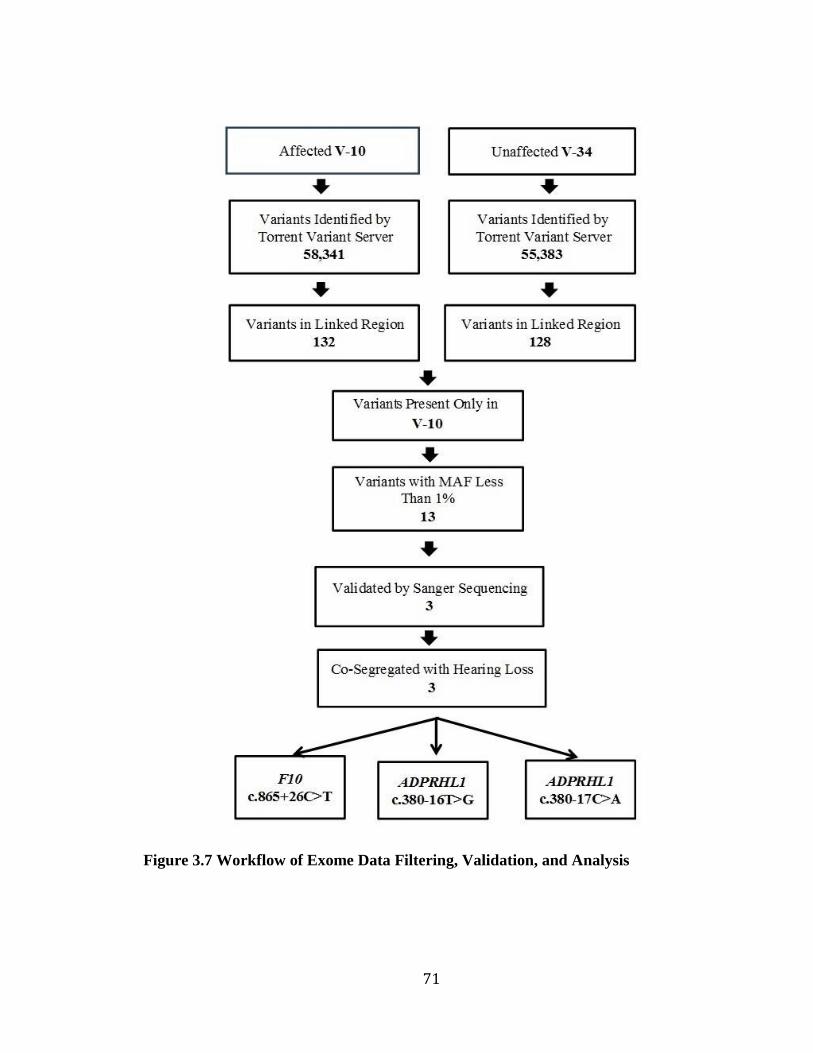
71
Figure 3.7 Workflow of Exome Data Filtering, Validation, and Analysis
72
Results of Assessment of Population Frequency
F10 c.865+26C>T was screened in 81 ethnically-matched population controls and
was absent in all samples. Likewise, ADPRHL1 c.380-16T>G and c.380-17C>A were
screened in 88 ethnically-matched population controls and were also absent from all
samples. All three variants were absent in at least 162 alleles, suggesting they are rare in
the Newfoundland population.
Results of Identification of Additional Families
All three variants were then screened in 65 probands of Newfoundland families
with hearing loss. F10 c.865+26C>T was not found in any of the Newfoundland deafness
probands. However, ADPRHL1 c.380-16T>G and c.380-17C>A were both found in two
probands, from Families 2110 and 2143, who were compound heterozygotes, meaning
ADPRHL1 c.380-16T>G and c.380-17C>A has been found in three Newfoundland
families with hearing loss.
73
Results of cDNA Analysis of Family 2070
To determine if ADPRHL1 c.380-17C>A and c.380-16T>G caused alternative
splicing of its mRNA, the region between exon 2-4 was examined. Figure 3.8 shows the
gel electrophoresis image of the PCR products of ADPHRL1 exon 2-4. Family 2070 (PID
IV-2, IV-11, and IV-15) alongside the wild-type controls produced a band at the expected
amplicon size of 390 bp. A second band, suggesting the creation of a cryptic splice site or
loss of exon 3, was not observed.
ALAMUT’s prediction programs suggested ADPRHL1 c.380-17C>A and c.380-
16T>G could create an alternative splice site at c.380-15. An additional 15 bp would
cause a frameshift that would not be differentiated from the 390 bp normal product on an
agarose gel. As a result, the PCR products of ADPRHL1 exon 2-4 were then
bidirectionally Sanger sequenced. Figure 3.9 shows the splice site sequence between
ADPRHL1 exon 2 and 3 CAATGAAAAAG/GCTCAGGGTTT and no insertions or
deletions were observed. This suggests that ADPRHL1 c.380-17C>A and c.380-16T>G
do not create an alternative splice site.
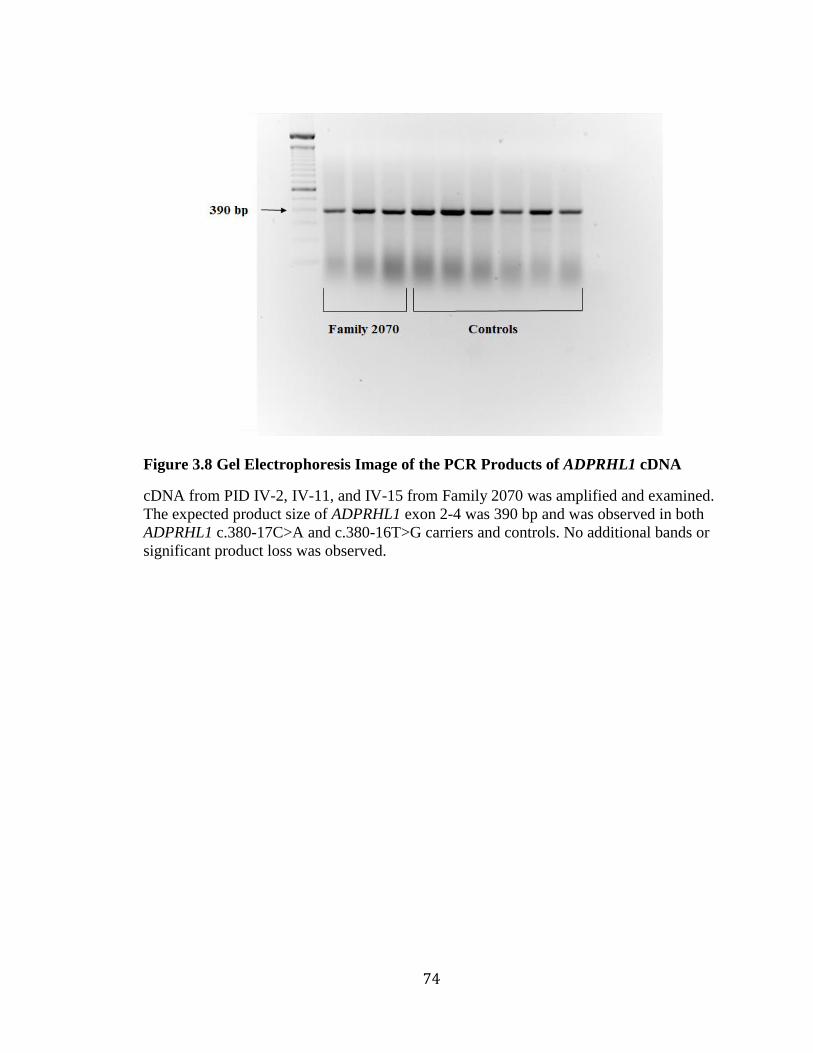
74
Figure 3.8 Gel Electrophoresis Image of the PCR Products of ADPRHL1 cDNA
cDNA from PID IV-2, IV-11, and IV-15 from Family 2070 was amplified and examined.
The expected product size of ADPRHL1 exon 2-4 was 390 bp and was observed in both
ADPRHL1 c.380-17C>A and c.380-16T>G carriers and controls. No additional bands or
significant product loss was observed.
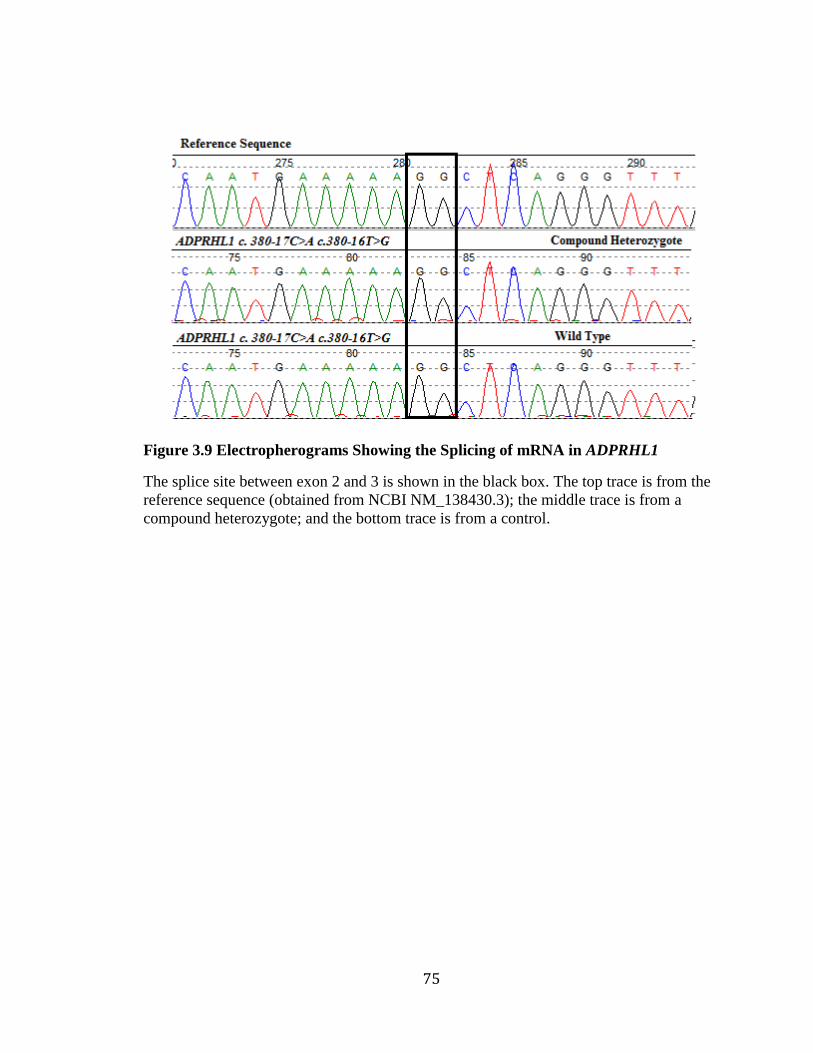
75
Figure 3.9 Electropherograms Showing the Splicing of mRNA in ADPRHL1
The splice site between exon 2 and 3 is shown in the black box. The top trace is from the
reference sequence (obtained from NCBI NM_138430.3); the middle trace is from a
compound heterozygote; and the bottom trace is from a control.
76
Chapter 4 Discussion
The purpose of this thesis project was to investigate the genetic cause of hearing
loss in a Newfoundland family. Through a mix of old and new molecular genetics
techniques three potentially pathogenic variants were identified which could either
individually or in conjunction cause hearing loss.
The first method employed was genome-wide SNP genotyping and linkage
analysis. The goal was to identify specific chromosomal regions associated with hearing
loss. It relied upon a statistical test called a LOD (logarithm of odds) score to determine
the likelihood that hearing loss and a genetic region were linked. Because positive LOD
scores favored linkage, while negative scores suggested absence of linkage, any region
with a LOD score greater than 1 was included. The regions that obtained the highest
scores were focused upon, especially those greater than 3.3, the threshold for genome-
wide significance. A single region on chromosome 13q34 achieved statistical significance
and had a LOD score of 4.77. At a LOD score of 4.77, the odds are nearly 60,000 to 1
that the region is linked to hearing loss.
The region on chromosome 13q34 was identified through two-point linkage
analysis. As an additional measure the analysis was performed including and excluding
two family members with suspected hearing loss. The results of the two analyses were
nearly identical suggesting the exclusion of the two family members with suspected
hearing loss did not strongly influence the results. Knowing that both family members
77
with suspected hearing loss have at least one child with confirmed hearing loss, under a
dominant model there is a high probability the parents were affected as well.
During the study, multipoint linkage analyses using a map of multiple markers
were also employed. Interestingly, multipoint linkage analysis identified an overlapping
region on chromosome 13, with a LOD score of 3.22 that was associated with hearing
loss. Both two-point and multipoint linkage analyses have their advantages. Two-point
analysis was more flexible and allowed inclusion of genotype data from all family
members. Multipoint analysis is generally more precise than two-point, but was limited
by computational constraints, as the number of markers and family members increased.
Since two-point and multipoint approaches both strongly indicated the presence of
a linked region at 13q34, this was the best place to focus the search for the genetic cause
of hearing loss in Family 2070. The region encompassed 26 genes, none of which had
been associated with hearing loss. Interestingly this region overlapped with a previously
identified deafness locus DFNA33. It was first identified in a German family with
autosomal dominant nonsyndromic hearing loss and mapped to chromosome 13q34-qter,
with a LOD score of 3.28 (Bonsch et al., 2009).
Since both the German and Newfoundland families shared a deafness locus, it is
possible they share a genetic etiology. Remarkably, both families were phenotypically
similar as both had apparent autosomal dominant, early onset, progressive, bilateral,
sensorineural hearing loss. They also shared similar audiogram configurations with
family members having a sloping profile progressing to a flat loss later in life. However,
the estimated age of onset was later in the German family compared to the Newfoundland
family (Family 2070). The German phenotype was based upon audiological evidence
78
from 7 family members with hearing loss, however the youngest affected family member
was 29 years old, suggesting an ascertainment bias that may have artificially raised the
age of onset. Similarly in Family 2070, the use of self-report to estimate age of onset and
a lack of early audiometric data for many individuals could have accounted for onset
variability. It is also possible that phenotypic differences observed could be caused by
environmental or genetic variation. Overall, the shared deafness locus and phenotype
similarities between the German and Newfoundland families led to a focus on
chromosome 13q34.
The second method used was whole exome sequencing. It identified 13 variants
within the linked region on chromosome 13q34. Only 3 out of 13 were validated by
Sanger sequencing: F10 c.865+26C>T and ADPRHL1 c.380-17C>A and c.380-16T>G.
The 23% concordance between whole exome sequencing and Sanger sequencing was
much lower than expected (Hamilton et al., 2016). The discrepancy could be explained by
variant filtering criteria. Setting minimum read depths, genotype quality and flanking
base scores could remove many of these variants from the final dataset. Some of the false
positives could also have been caused by homopolymer stretches (i.e. a string of T’s)
resulting in polymerase slippage during library preparation. The filtering aired on the side
of caution and included all variants rather than remove a potentially removing a
pathogenic variant.
All three validated variants co-segregated with hearing loss in Family 2070: F10
c.865+26C>T and ADPRHL1 c.380-17C>A and c.380-16T>G. Since they were located in
close proximity to one another it suggests the inheritance of a disease haplotype whereby
the variants are in linkage disequilibrium with each other and are typically inherited
79
together. All three were rare, intronic variants that were absent in the Newfoundland
population controls. Additionally, F10 c.865+26C>T and ADPRHL1 c.380-16T>G and
c.380-17C>A were predicted to affect splicing of their respective genes.
F10 c.865+26C>T was predicted to affect splicing of F10 mRNA by eliminating
an ESE site. Lost ESE sites can result in aberrant splicing and cause hearing loss. For
example, TECTA c.5331G>A. is thought to cause the loss of an ESE, resulting in the loss
of exon 16 and deletion of 37 amino acids from the α-tectorin protein and causing
autosomal dominant, mid-frequency/flat hearing loss (Collin et al., 2008). Since F10 is
not highly expressed in B-lymphocytes, we were unable to analyze the cDNA sequence
and assess aberrant splicing (Expression Atlas - European Bioinformatics Institute).
Mutations in F10 have not been associated with hearing loss. F10, also known as
coagulation factor X, encodes a vitamin K-dependent factor that converts prothrombin
into thrombin, as part of the blood coagulation cascade (National Center for
Biotechnology Information, 2015b). Mutations in F10 can cause factor X deficiency, an
autosomal recessive, hemorrhagic disorder characterized by prolonged and abnormal
bleeding (Millar et al., 2000). The severity is variable and reflective of the activity level
of factor X present in the blood plasma, with heterozygotes often being asymptomatic
carriers (Brown & Kouides, 2008). This is concurrent with the lack of presentation of
bleeding disorders in Family 2070, since they are heterozygotes.
The most common symptoms of factor X deficiency are epistaxis, menorrhagia,
and hematuria (OMIM, 2015). In more severe cases, mutations in F10 have been
associated with intracranial hemorrhage and sudden hearing loss (Herrmann et al., 2005).
Similarly, mutations in coagulation factor II (F2) have been associated with sudden
80
hearing loss due to impaired cochlear blood circulation (Mercier et al., 1999). However,
hearing loss in Family 2070 is progressive, not sudden. Furthermore, intracranial bleeding
is often associated with other neurological abnormalities or even death.
Hearing loss in Family 2070 is not likely to be caused by loss-of-function of F10.
The carrier rate of F10 mutations is thought to be 1 in 500 and often they are
asymptomatic (Brown & Kouides, 2008). Furthermore, it would be expected that
homozygotes of F10 mutations would also have severe hearing loss as a part of their
phenotype and only sudden hearing loss has been documented in rare cases.
ADPRHL1 c.380-16T>G and c.380-17C>A were screened in 65 probands and
were identified in two other families with hearing loss, Families 2143 and 2110. The
inheritance patterns, like Family 2070, were autosomal dominant. The audiogram
configuration of the proband of 2110 was also very similar to members of 2070,
suggesting a shared genetic etiology. However, the audiogram configuration of the
proband of 2143 was different than the other two families. Therefore, to firmly establish
the phenotypes of Families 2143 and 2110, longitudinal audiogram data from multiple
family members will be needed.
ADPRHL1 c.380-16T>G and c.380-17C>A are designated in dbSNP as two
independent variants, however the proper nomenclature could also be ADPRHL1 c.380-
17_380-16delinsAG, presenting them as one mutation event. Within ExAC browser they
have nearly identical minor allele frequencies 0.005369 and 0.005364 and the small
difference could be due to sample size, suggesting these variants always occur together.
Their pairing was also observed in Family 2070, whereas both variants co-segregated
together and were never seen independently. This is suggestive that ADPRHL1 c.380-
81
16T>G and c.380-17C>A are in cis, meaning they are travelling on the same
chromosome. This is important since cis-acting variants can have a combined negative
effect that is greater than it would be acting alone.
ADPRHL1 c.380-16T>G and c.380-17C>A were predicted to have an effect on
splicing. Combined, they may create a cryptic splice site at c.380-15 while reducing
preferential splicing of the natural splice site at c.380. If the cryptic splice site was active
it would add 15 bp to the mutant mRNA sequence causing a frameshift and resulting in a
truncated protein. Abnormal protein could have disastrous effects resulting in either gain-
of-function or dominant-negative activity. The results of cDNA analysis did not suggest
that ADPRHL1 c.380-16T>G and c.380-17C>A created a cryptic splice site. Amplified
cDNA appeared normal on an agarose gel and Sanger sequencing confirmed the lack of a
cryptic splice site in the affected samples. Overall, the ADPRHL1 cDNA from Family
2070 and the controls were all normal, suggesting c.380-16T>G and c.380-17C>A do not
affect splicing of ADPRHL1.
ADPRHL1 c.380-16T>G and c.380-17C>A may alter pre-mRNA splicing,
producing a mutant mRNA that is being destroyed. Furthermore, the reduction in normal
ADPRHL1 mRNA may not be visible using standard PCR and gel electrophoresis.
Quantification of cDNA would be necessary instead of visual inspection. Therefore, the
techniques used in this study may not detect the mutant ADPRHL1 mRNA.
ADPRHL1 c.380-16T>G and c.380-17C>A may also alter splicing, but the
aberrant transcript is not expressed within B-lymphocytes. ADPRHL1 is expressed
throughout the human body (Expression Atlas - European Bioinformatics Institute) and
there are two isoforms NM_138430 and NM_199162. The first isoform, NM_138430
82
encodes the longer isoform, while the second isoform NM_199162 has a shorter N-
terminus compared to isoform 1. Potentially, ADPRHL1 c.380-16T>G and c.380-17C>A
may affect splicing of transcripts expressed within the cochlea, rather than those in B-
lymphocytes. As a result, the method used to test for abnormal splicing in this thesis may
miss aberrant expression in the auditory system where it would have the greatest impact
on hearing.
Mutations in ADPRHL1 have not been previously associated with hearing loss.
However, a recent study suggests Adprhl1 is expressed in mouse inner ear, postnatal hair
cells during development (Scheffer, Shen, Corey, & Chen, 2015). Known deafness genes
like Tmc1 and Myo7a were also found in postnatal hair cells in this study. The mouse
model has been widely used to model human hereditary hearing disorders
(https://www.jax.org/research-and-faculty/tools/hereditary-hearing-impairment).
ADPRHL1, also known as adenosine diphosphate (ADP)-ribosylhydrolase like 1,
encodes an enzyme that is thought to be involved in the ADP-ribosylation cycle that
regulates protein function (National Center for Biotechnology Information, 2015a).
ADPRHL1 is a member of the ADP ribosylhydrolases gene family, called ARHs. The
ARH gene family consists of three genes: ARH1, ARH2 (ADPRHL1), and ARH3. All
three share sequence homology and bind ADP-ribose groups (Mashimo, Kato, & Moss,
2014) ARH1 targets mono-ADP ribosylated proteins and is involved in tumorigenesis,
while ARH3 targets poly-ADP-ribosylated proteins and suppresses PARP1 (Poly ADP-
ribose polymerase 1)-mediated cell death. The exact function of ARH2 is not known, but
it may serve a similar function ARH1 or ARH3 (Mashimo et al., 2014).
83
Neither ARH gene has been associated with hearing loss, but Parp1 has been
linked to sensorineural hearing loss in mice. Parp1 regulates inflammation within
cochlear cells and Parp1 mutant mice are less likely to have noise-induced hearing loss
(Shi & Nuttall, 2007). Since Arh3 suppresses the effect of Parp1, mutations in Arh3
would lead to less regulation of Parp1 and increased sensitivity to noise, through Parp1-
mediated cochlear hair cell death. If Arh2 (Adprhl1) shares a similar function to Arh3,
then its loss could have a similar effect.
84
Limitations of the study
Twenty-nine family members were recruited to this study and most had
audiological assessments. However, 5/29 did not and their phenotype was based upon
interview data rather than audiological evidence. Also, some family members had only
one audiological assessment so longitudinal data about onset or progression were
unavailable. Unless a family is being closely monitored, hearing loss may not be
identified until there is significant loss present meaning age of onset and progression
cannot be accurately determined. For example, Family 2070’s PID VI-31 and VI-32 did
not self-identify as having hearing loss, but a loss was noticed during their audiological
assessment, as part of recruitment to the study. It was mild and for PID VI-32 did not
meet the GENDEAF requirements for hearing loss, but would need to be closely
monitored for progression.
In recent years with the development of the newborn hearing screening tests
children with hearing loss are being identified earlier and more closely monitored with
regular hearing screening tests. In the past, children may not be identified until they
attended school. Furthermore, families living in rural communities may not have had
access to audiological testing. This would mean critical audiological data showing
hearing loss development and progression is missing.
The phenotypes of Families 2143 and 2110 were also not established because of
limited audiological data. For these families only a single person was recruited which
meant possible modes of inheritance were based upon phenotype reports given by the
proband, not direct audiological assessments. In the case of Family 2110, the proband was
78 at the time of recruitment, and many of her relatives were deceased. One of the
85
difficulties in this type of research is that following recruitment, many months or years
may pass before any progress is made on a family. It can then be difficult to reconnect
with the family and recruit more family members. At times there is no interest from the
family to participate. In the case of hearing loss, some family members may fear
participation in a hearing loss study may affect worker’s compensation claims for noise-
related hearing loss.
The genome-wide SNP genotyping and linkage analysis strongly indicated a
linked region on chromosome 13. However, multipoint linkage analysis identified two
other linked regions. Similarly, two-point linkage analysis identified seven other linked
regions. On the other hand, all other loci had much lower LOD scores than the region on
chromosome 13 (4.77).
Exome sequencing was used to identify variants within the linked region on
chromosome 13q34. Some of the limitations of exome sequencing are the inability to
detect large insertions/deletions or deep intronic mutations as only 5 bp of exon padding
is guaranteed. The panel design is also missing 1.26% of coding regions within 13q34,
possibly due to the lack of available primers in GC rich or repetitive regions.
Additionally, 7.22% of amplicons within the designed region were not sequenced. Since
the primers are based upon in silico data, some have low specificity, leading to off-target
reads and poor sequencing results. In particular, SOX1 had poor coverage, as both PID V-
10 and V-34 had similar missing regions the loss was most likely due to poorly
performing primers. Overall, these missing regions may contain pathogenic mutations not
identified by this study and would require further investigation.
86
Bioinformatics tools like Alamut were used to assess the pathogenicity of
identified variants. For example, Alamut predicted the alteration of a splice site, in
ADPRHL1 variant carriers. However, these predictions are based upon in silico rather
than empirical results. To be confident in ADPRHL1 c.380-16T>G and c.380-17C>A
effect on mRNA splicing, it would be necessary to examine the resultant protein within a
laboratory setting.
87
Strengths of the study
Dr. Terry-Lynn Young’s laboratory has a history of excellence in hereditary
hearing loss research and over the past two decades has identified of the genetic cause of
hearing loss in 28 Newfoundland families. This work includes 7 publications, reporting
12 different mutations, in 11 genes now associated with deafness. Described below are
several factors that have influenced the success of the Newfoundland Hereditary Hearing
Loss Project and have bolstered the efforts of this thesis.
Newfoundland is an ideal study population for human hereditary disease research.
As a founder population, it has an advantage in mapping and identifying rare disease
genes. The limited number of founders means disease alleles will have often arisen from a
single ancestral chromosome. As evidenced by the CLDN14 c.488C>T mutation, which
resided on a shared 1.4 Mb disease-associated haplotype, in four Newfoundland families
with hearing loss. Additionally through the collection of deep genealogies, three of these
families were connected to a single founding couple six-generations ago.
The success of the Newfoundland Hereditary Hearing Loss Project not only lies in
its study population, but also the variety of skill sets held by its team members. The
efforts of Dr. Young and her students are complemented by a team of research assistants
that perform complex laboratory experiments and an audiologist to assist in recruitment
and phenotyping.
Within Family 2070 the recruitment level was high, with 29 family members,
from 4 generations participating in the study. Nearly all of the participants (24/29) were
assessed by the team’s audiologist or provided consent for audiological records. Access to
longitudinal data, enabled the estimation of onset and progression of hearing loss.
88
Furthermore, by recruiting both affected and unaffected family members, it was possible
to test the co-segregation of potential mutations, F10 c.865+26C>T, ADPRHL1 c.380-
16T>G and c.380-17C>A, with hearing loss.
Together these factors lend strength to this research project and build evidence
that will hopefully lead to the discovery of the genetic cause of hearing loss in Family
2070.
89
Future Directions
The next step for this study would be to recruit additional family members from
Family 2070 and also Families 2110 and 2143 to test co-segregation of hearing loss with
ADPRHL1 c.380-16T>G and c.380-17C>A.
Furthermore, splicing of ADPRHL1 could be examined more closely, using
quantitative real-time PCR to test for a reduction in wild-type ADPRHL1 mRNA
suggesting the production of aberrant mRNA.
If analysis of ADPRHL1 determines the variants are benign, the regions missing
from the exome panel design and those poorly covered by the sequencing run could be
investigated. A custom next-generation sequencing panel could be designed to cover the
missing regions or they could be examined by Sanger sequencing. Additionally, a custom
microarray panel could be designed to investigate the 26 genes for exon duplications or
deletions.
90
Chapter 5 Summary
The goal of this thesis was to determine the genetic cause of hearing loss in a
large, seven-generation Newfoundland family. Following recruitment, the proband was
screened for 12 reported Newfoundland deafness mutations but none were identified,
suggesting the cause of hearing loss in Family 2070 was novel in the Newfoundland
population. Using genome-wide SNP genotyping and linkage analysis the focus was
narrowed to a single genetic locus on chromosome 13q34. The region overlapped with a
previously identified deafness locus in a German family with a similar phenotype. From
there, NGS was used to identify all variants within the coding region, filtering the data to
just 13 variants in the region of interest. Only 3/13 variants were validated by Sanger
sequencing and all co-segregated with hearing loss. Overall, 3 potentially pathogenic
variants were identified.
The most likely genetic cause of hearing loss in Families 2070, 2143, and 2110 is
ADPRHL1 c.380-16T>G and c.380-17C>A. The mutations were predicted to have a
negative effect on splicing of ADPRHL1 pre-mRNA, through the loss of an ESE and
creation of a cryptic splice site. Since Adprhl1 is expressed in mice cochleae, it likely has
a role in the development, maintenance, or function of the mouse auditory system.
Furthermore, mice have been used to model human hearing loss so it is possible
ADPRHL1 also plays a role in the human auditory system.
91
With recruitment of additional family members from Family 2070, 2143, and
2110 it will be possible to test co-segregation of hearing loss across all three families.
Quantitative analysis of ADPRHL1 cDNA would also provide a mechanism for variant
splicing effect and pathogenicity. The identification of a causal mutation will hopefully
provide future directions for clinical interventions and genetic counseling.
92
Bibliography
Abdelfatah, N., McComiskey, D. A., Doucette, L., Griffin, A., Moore, S. J., Negrijn, C.,
Hodgkinson, K.A., King, J. J., Larijani, M., Houston, J., Stanton, S. G., & Young, T.
L. (2013). Identification of a novel in-frame deletion in KCNQ4 (DFNA2A) and
evidence of multiple phenocopies of unknown origin in a family with ADSNHL.
European Journal of Human Genetics : EJHG, 21(10), 1112-1119.
10.1038/ejhg.2013.5; 10.1038/ejhg.2013.5
Abdelfatah, N., Merner, N., Houston, J., Benteau, T., Griffin, A., Doucette, L., Stockley,
T., Lauzon, J. L., & Young, T. L. (2013). A novel deletion in SMPX causes a rare
form of X-linked progressive hearing loss in two families due to a founder effect.
Human Mutation, 34(1), 66-69. 10.1002/humu.22205; 10.1002/humu.22205
Ahmed, Z. M., Li, X. C., Powell, S. D., Riazuddin, S., Young, T. L., Ramzan, K., Ahmad,
Z., Luscombe, S., Dhillon, K., MacLaren, L., Ploplis, B., Shotland, L. I., Ives, E.,
Riazuddin, S., Friedman, T. B., Morell, R. J., & Wilcox, E. R. (2004).
Characterization of a new full length TMPRSS3 isoform and identification of mutant
alleles responsible for nonsyndromic recessive deafness in newfoundland and
pakistan. BMC Medical Genetics, 5, 24. 10.1186/1471-2350-5-24
93
Bear, J. C., Nemec, T. F., Kennedy, J. C., Marshall, W. H., Power, A. A., Kolonel, V. M.,
& Burke, G. B. (1987). Persistent genetic isolation in outport newfoundland.
American Journal of Medical Genetics, 27(4), 807-830. 10.1002/ajmg.1320270410
Bear, J. C., Nemec, T. F., Kennedy, J. C., Marshall, W. H., Power, A. A., Kolonel, V. M.,
& Burke, G. B. (1988). Inbreeding in outport newfoundland. American Journal of
Medical Genetics, 29(3), 649-660. 10.1002/ajmg.1320290324
Bizier, C., Contreras, R. & Walpole, A. (2016). Hearing disabilities among canadians
aged 15 years and older, 2012. Retrieved from http://www.statcan.gc.ca/pub/89-654-
x/89-654-x2016002-eng.htm
Bonsch, D., Schmidt, C. M., Scheer, P., Bohlender, J., Neumann, C., Am Zehnhoff-
Dinnesen, A., & Deufel, T. (2009). A new gene locus for an autosomal-dominant
non-syndromic hearing impairment (DFNA 33) is situated on chromosome 13q34-
qter. [Ein neuer Genort fur eine autosomal-dominante, nichtsyndromale
Schwerhorigkeit (DFNA33) liegt auf Chromosom 13q34-qter] Hno, 57(4), 371-376.
10.1007/s00106-008-1832-9; 10.1007/s00106-008-1832-9
Bramhall, N. F., Kallman, J. C., Verrall, A. M., & Street, V. A. (2008). A novel WFS1
mutation in a family with dominant low frequency sensorineural hearing loss with
normal VEMP and EcochG findings. BMC Medical Genetics, 9, 48-2350-9-48.
10.1186/1471-2350-9-48; 10.1186/1471-2350-9-48
94
Brown, D. L., & Kouides, P. A. (2008). Diagnosis and treatment of inherited factor X
deficiency. Haemophilia : The Official Journal of the World Federation of
Hemophilia, 14(6), 1176-1182. 10.1111/j.1365-2516.2008.01856.x [doi]
Carrasquillo, M. M., Zlotogora, J., Barges, S., & Chakravarti, A. (1997). Two different
connexin 26 mutations in an inbred kindred segregating non-syndromic recessive
deafness: Implications for genetic studies in isolated populations. Human Molecular
Genetics, 6(12), 2163-2172.
Chen, M., & Manley, J. L. (2009). Mechanisms of alternative splicing regulation: Insights
from molecular and genomics approaches. Nature Reviews.Molecular Cell Biology,
10(11), 741-754. 10.1038/nrm2777 [doi]
Collin, R. W., de Heer, A. M., Oostrik, J., Pauw, R. J., Plantinga, R. F., Huygen, P. L.,
Admiraal, R., de Brouwer, A.P., Strom, T. M., Cremers, C. W., & Kremer, H.
(2008). Mid-frequency DFNA8/12 hearing loss caused by a synonymous TECTA
mutation that affects an exonic splice enhancer. European Journal of Human
Genetics : EJHG, 16(12), 1430-1436. 10.1038/ejhg.2008.110 [doi]
de Kok, Y. J., Bom, S. J., Brunt, T. M., Kemperman, M. H., van Beusekom, E., van der
Velde-Visser, S. D., Robertson, N. G., Morton, C. C., Huygen, P. L., Verhagen, W.
I., Brunner, H. G., Cremers, C. W., & Cremers, F. P. (1999). A Pro51Ser mutation in
the COCH gene is associated with late onset autosomal dominant progressive
sensorineural hearing loss with vestibular defects. Human Molecular Genetics, 8(2),
361-366.
95
del Castillo, I., Villamar, M., Moreno-Pelayo, M. A., del Castillo, F. J., Alvarez, A.,
Telleria, D., Menendez, I., & Moreno, F. (2002). A deletion involving the connexin
30 gene in nonsyndromic hearing impairment. The New England Journal of
Medicine, 346(4), 243-249. 10.1056/NEJMoa012052
Doucette, L., Merner, N. D., Cooke, S., Ives, E., Galutira, D., Walsh, V., MacLaren, L.,
Cater, T., Fernandez, B., Green, J. S., Wilcox, E. R., Shotland, L. I., Li, X. C., Lee,
M., King, M. C., & Young, T. L. (2009). Profound, prelingual nonsyndromic
deafness maps to chromosome 10q21 and is caused by a novel missense mutation in
the usher syndrome type IF gene PCDH15. European Journal of Human Genetics :
EJHG, 17(5), 554-564. 10.1038/ejhg.2008.231; 10.1038/ejhg.2008.231
Ervin, S. E. (2014). Assessment tools: Introduction to the anatomy and physiology of the
auditory system. Retrieved from http://www.workplaceintegra.com/hearing-
articles/Ear-anatomy.html
Gray, S. (2002, September 19). Gene for rare form of deafness discovered. Gazette
Retrieved from http://www.mun.ca/gazette/2002-2003/sept19/newspage6.html
Green, J. S., Parfrey, P. S., Harnett, J. D., Farid, N. R., Cramer, B. C., Johnson, G., Heath,
O., McManamon, P. J., O'Leary, E., & Pryse-Phillips, W. (1989). The cardinal
manifestations of bardet-biedl syndrome, a form of laurence-moon-biedl syndrome.
The New England Journal of Medicine, 321(15), 1002-1009.
10.1056/NEJM198910123211503 [doi]
96
Hamilton, A., Tetreault, M., Dyment, D. A., Zou, R., Kernohan, K., Geraghty, M. T.,
FORGE Canada Consortium, Care4Rare Canada Consortium, Hartley, T., &
Boycott, K. M. (2016). Concordance between whole-exome sequencing and clinical
sanger sequencing: Implications for patient care. Molecular Genetics & Genomic
Medicine, 4(5), 504-512. 10.1002/mgg3.223 [doi]
Herrmann, F. H., Navarette, M., Salazar-Sanchez, L., Carillo, J. M., Auerswald, G., &
Wulff, K. (2005). Homozygous factor X gene mutations Gly380Arg and
Tyr163delAT are associated with perinatal intracranial hemorrhage. The Journal of
Pediatrics, 146(1), 128-130. S0022347604007838 [pii]
International Human Genome Sequencing Consortium. (2004). Finishing the euchromatic
sequence of the human genome. Nature, 431(7011), 931-945. nature03001 [pii]
Keats, B., Popper, A., & Fay, R. (2002). In Keats B., Fay R. (Eds.), Genetics and auditory
disorders. New York: Springer.
Kristiansson, K., Naukkarinen, J., & Peltonen, L. (2008). Isolated populations and
complex disease gene identification. Genome Biology, 9(8), 109-2008-9-8-109. Epub
2008 Aug 26. 10.1186/gb-2008-9-8-109 [doi]
Lek, M., Karczewski, K. J., Minikel, E. V., Samocha, K. E., Banks, E., Fennell, T.,
O'Donnell-Luria, A. H., Ware, J. S., Hill, A. J., Cummings, B. B., Tukiainen, T.,
Birnbaum, D. P., Kosmicki, J. A., Duncan, L. E., Estrada, K., Zhao, F., Zou, J.,
Pierce-Hoffman, E., Berghout, J., Cooper, D. N., Deflaux, N., DePristo, M., Do, R.,
97
Flannick, J., Fromer, M., Gauthier, L., Goldstein, J., Gupta, N., Howrigan, D.,
Kiezun, A., Kurki, M. I., Moonshine, A. L., Natarajan, P., Orozco, L., Peloso, G. M.,
Poplin, R., Rivas, M.A., Ruano-Rubio, V., Rose, S. A., Ruderfer, D. M., Shakir, K.,
Stenson, P. D., Stevens, C., Thomas, B. P., Tiao, G., Tusie-Luna, M. T., Weisburd,
B., Won, H. H., Yu, D., Altshuler, D. M., Ardissino, D., Boehnke, M., Danesh, J.,
Donnelly, S., Elosua, R., Florez, J.C., Gabriel, S.B., Getz, G., Glatt, S. J., Hultman,
C. M., Kathiresan, S., Laakso, M., McCarroll, S., McCarthy, M. I., McGovern, D.,
McPherson, R., Neale, B. M., Palotie, A., Purcell, S. M., Saleheen D., Scharf, J. M.,
Sklar, P., Sullivan, P. F., Tuomilehto, J., Tsuang, M. T., Watkins, H. C., Wilson, J.
G., Daly, M. J., MacArthur, D. G., & Exome Aggregation Consortium. (2016).
Analysis of protein-coding genetic variation in 60,706 humans. Nature, 536(7616),
285-291. 10.1038/nature19057 [doi]
Majewski, J., Schwartzentruber, J., Lalonde, E., Montpetit, A., & Jabado, N. (2011).
What can exome sequencing do for you? Journal of Medical Genetics, 48(9), 580-
589. 10.1136/jmedgenet-2011-100223 [doi]
Mannion, J. J. (1977). The peopling of Newfoundland: Essays in historical geography. St.
John's: Institute of Social and Economic Research, Memorial University of
Newfoundland.
Marazita, M. L., Ploughman, L. M., Rawlings, B., Remington, E., Arnos, K. S., & Nance,
W. E. (1993). Genetic epidemiological studies of early-onset deafness in the U.S.
98
school-age population. American Journal of Medical Genetics, 46(5), 486-491.
10.1002/ajmg.1320460504 [doi]
Martin, F., & Clarke, J. (2014). In Johnston J., Davis A. (Eds.), Introduction to audiology
(12th ed.). United States of America: Pearson Education Inc.
Mashimo, M., Kato, J., & Moss, J. (2014). Structure and function of the ARH family of
ADP-ribosyl-acceptor hydrolases. DNA Repair, 23, 88-94.
10.1016/j.dnarep.2014.03.005 [doi]
McComiskey, D. (2010). (Masters). Retrieved from
http://collections.mun.ca/cdm/ref/collection/theses5/id/33081
Mercier, E., Quere, I., Chabert, R., Lallemant, J. G., Daures, J. P., Berlan, J., & Gris, J. P.
(1999). The 20210A allele of the prothrombin gene is an independent risk factor for
perception deafness in patients with venous thromboembolic antecedents. Blood,
93(9), 3150-3152.
Millar, D. S., Elliston, L., Deex, P., Krawczak, M., Wacey, A. I., Reynaud, J.,
Nieuwenhuis, H. K., Bolton-Maggs, P., Mannucci, P. M., Reverter, J. C., Cachia, P.,
Pasi, K. J., Layton, D. M., & Cooper, D. N. (2000). Molecular analysis of the
genotype-phenotype relationship in factor X deficiency. Human Genetics, 106(2),
249-257.
99
Miller, S. A., Dykes, D. D., & Polesky, H. F. (1988). A simple salting out procedure for
extracting DNA from human nucleated cells. Nucleic Acids Research, 16(3), 1215.
Muller, U. (2008). Cadherins and mechanotransduction by hair cells. Current Opinion in
Cell Biology, 20(5), 557-566. 10.1016/j.ceb.2008.06.004; 10.1016/j.ceb.2008.06.004
National Center for Biotechnology Information. (2015a). ADPRHL1 ADP-
ribosylhydrolase like 1. Retrieved from http://www.ncbi.nlm.nih.gov/gene/113622
National Center for Biotechnology Information. (2015b). F10 coagulation factor X.
Retrieved from http://www.ncbi.nlm.nih.gov/gene/2159
National Human Genome Institute. (2014). All about the human genome project (HGP).
Retrieved from http://www.genome.gov/10001772
O'Dea, D., Parfrey, P. S., Harnett, J. D., Hefferton, D., Cramer, B. C., & Green, J. (1996).
The importance of renal impairment in the natural history of bardet-biedl syndrome.
American Journal of Kidney Diseases : The Official Journal of the National Kidney
Foundation, 27(6), 776-783. S0272-6386(96)90513-2 [pii]
OMIM. (2015). Factor X deficiency. Retrieved from http://www.omim.org/entry/227600
OpenStax College. (2013a). Cochlea. Retrieved from
http://commons.wikimedia.org/wiki/File:1406_Cochlea.jpg
100
OpenStax College. (2013b). The hair cell. Retrieved from
http://commons.wikimedia.org/wiki/File:1407_The_Hair_Cell.jpg
OpenStax College. (2013c). The stuctures of the ear. Retrieved from
http://commons.wikimedia.org/wiki/File:1404_The_Structures_of_the_Ear.jpg
Pater, J. A., Benteau, T., Griffin, A., Penney, C., Stanton, S. G., Predham, S., Kielley, B.,
Squires, J., Zhou, J., Li, Q., Abdelfatah, N., O'Rielly, D. D., & Young, T. L. (2017).
A common variant in CLDN14 causes precipitous, prelingual sensorineural hearing
loss in multiple families due to founder effect. Human Genetics, 136(1), 107-118.
10.1007/s00439-016-1746-7 [doi]
Prezant, T. R., Agapian, J. V., Bohlman, M. C., Bu, X., Oztas, S., Qiu, W. Q., Arnos, K.
S., Cortopassi, G. A., Jaber, L., & Rotter, J. I. (1993). Mitochondrial ribosomal RNA
mutation associated with both antibiotic-induced and non-syndromic deafness.
Nature Genetics, 4(3), 289-294. 10.1038/ng0793-289
Scheffer, D. I., Shen, J., Corey, D. P., & Chen, Z. Y. (2015). Gene expression by mouse
inner ear hair cells during development. The Journal of Neuroscience : The Official
Journal of the Society for Neuroscience, 35(16), 6366-6380.
10.1523/JNEUROSCI.5126-14.2015 [doi]
Seikel, J. A., King, D. W., & Drumright, D. G. (2010). In Bellegarde M. (Ed.), Anatomy
and physiology for speech, language, and hearing (4th ed.). Clifton Park, NY, USA:
Delmar, Cengage Learning.
101
Shi, X., & Nuttall, A. L. (2007). Expression of adhesion molecular proteins in the
cochlear lateral wall of normal and PARP-1 mutant mice. Hearing Research, 224(1-
2), 1-14. S0378-5955(06)00304-2 [pii]
Smith, R. J. H., Shearer, A. E., Hildebrand, M. S., & Van Camp, G. (2014). Deafness and
hereditary hearing loss overview. In R. A. Pagon, M. P. Adam, H. H. Ardinger, T. D.
Bird, C. R. Dolan, C. T. Fong, Smith, R. J. H., & K. Stephens (Eds.),
GeneReviews(R) (). Seattle (WA): University of Washington, Seattle.
Spirio, L., Green, J., Robertson, J., Robertson, M., Otterud, B., Sheldon, J., Howse, E.,
Green, R., Groden, J., White, R., & Leppert, M. (1999). The identical 5' splice-site
acceptor mutation in five attenuated APC families from Newfoundland demonstrates
a founder effect. Human Genetics, 105(5), 388-398.
Squires, J. (2015). (Masters). Retrieved from http://research.library.mun.ca/8454/
Statistics Canada. (2012). Focus on geography series, 2011 census. Retrieved from
http://www12.statcan.gc.ca/census-recensement/2011/as-sa/fogs-spg/Facts-pr-
eng.cfm?Lang=Eng&GK=PR&GC=10
Toriello, H., & Smith, S. (2013). In Hall J., Harper P., Hudgkins L., Eichler E., Epstein C.
and Motulsky A. (Eds.), Hereditary hearing loss and its syndromes (3rd Edition ed.).
United States of America: Oxford University Press.
102
Van Camp, G., & Smith, R. (2014). Hereditary hearing loss homepage. Retrieved from
http://hereditaryhearingloss.org
Wang, Y., Liu, J., Huang, B. O., Xu, Y. M., Li, J., Huang, L. F., Lin, J., Zhang, J., Min,
Q. H., Yang, W. M., & Wang, X. Z. (2015). Mechanism of alternative splicing and
its regulation. Biomedical Reports, 3(2), 152-158. 10.3892/br.2014.407 [doi]
Ward, A. J., & Cooper, T. A. (2010). The pathobiology of splicing. The Journal of
Pathology, 220(2), 152-163. 10.1002/path.2649 [doi]
Wattenhofer, M., Di Iorio, M. V., Rabionet, R., Dougherty, L., Pampanos, A., Schwede,
T., Montserrat-Sentis, B., Arbones, M. L., Iliades, T., Pasquadibisceglie, A.,
D'Amelio, M., Alwan, S., Rossier, C., Dahl, H. H., Petersen, M. B., Estivill, X.,
Gasparini, P., Scott, H. S., & Antonarakis, S. E. (2002). Mutations in the TMPRSS3
gene are a rare cause of childhood nonsyndromic deafness in caucasian patients.
Journal of Molecular Medicine (Berlin, Germany), 80(2), 124-131. 10.1007/s00109-
001-0310-6
World Health Organization. (2017a). Deafness and hearing loss. Retrieved from
http://www.who.int/mediacentre/factsheets/fs300/en/
World Health Organization. (2017b). Grades of hearing impairment. Retrieved from
http://www.who.int/pbd/deafness/hearing_impairment_grades/en/
103
Young, T., Abdelfatah, N., & Griffin, A. (2014). Methods and compositions for detecting
progressive hearing loss (WO2014190422 A1 ed.). United States of America:
Retrieved from https://www.google.com/patents/WO2014190422A1?cl=en
Young, T. L., Ives, E., Lynch, E., Person, R., Snook, S., MacLaren, L., Cater, T., Griffin,
A., Fernandez, B., Lee, M. K., & King, M. C. (2001). Non-syndromic progressive
hearing loss DFNA38 is caused by heterozygous missense mutation in the wolfram
syndrome gene WFS1. Human Molecular Genetics, 10(22), 2509-2514.
Zhai, G., Zhou, J., Woods, M. O., Green, J. S., Parfrey, P., Rahman, P., & Green, R. C.
(2015). Genetic structure of the newfoundland and labrador population: Founder
effects modulate variability. European Journal of Human Genetics : EJHG,
10.1038/ejhg.2015.256 [doi]
104
Appendix
Appendix A GENDEAF Recommendations.................................................................... 105 Appendix B Consent Form for Hearing Loss Project ...................................................... 107
Appendix C Hearing Loss Study Medical Information Questionnaire ............................ 115 Appendix D Consent for Release of Audiological Records ............................................ 122 Appendix E Lab Requisition Form .................................................................................. 123 Appendix F Linkage Analysis Report for Family 2070 ................................................... 124
Appendix G Polymerase Chain Reaction Master Mix. .................................................... 134 Appendix H Primer Sequences for Validation of NGS Dataset ...................................... 135
Appendix I Polymerase Chain Reaction Thermocycler Program .................................... 136 Appendix J ABI Cycle Sequencing Master Mix .............................................................. 137
Appendix K ABI Cycle Sequencing Thermocycler Program .......................................... 138 Appendix L Primer Sequences for cDNA Analysis of ADPRHL1 .................................. 139 Appendix M Phenotype of Unspecified Hearing Loss in Family 2070 ........................... 140
Appendix N Audiograms of Unspecified Hearing Loss in Family 2070 ......................... 141 Appendix O Audiograms of Inherited Hearing Loss in 4th Generation of Family 2070 . 142
Appendix P Audiograms of Inherited Hearing Loss in 5th Generation of Family 2070 .. 143 Appendix Q Audiograms of Inherited Hearing Loss in 6th Generation of Family 2070 . 144 Appendix R Coverage of Exome Sequencing Panel Design in Linked Region .............. 145
Appendix S Coverage of Exome Sequencing Run of V-10 in Linked Region ................ 146
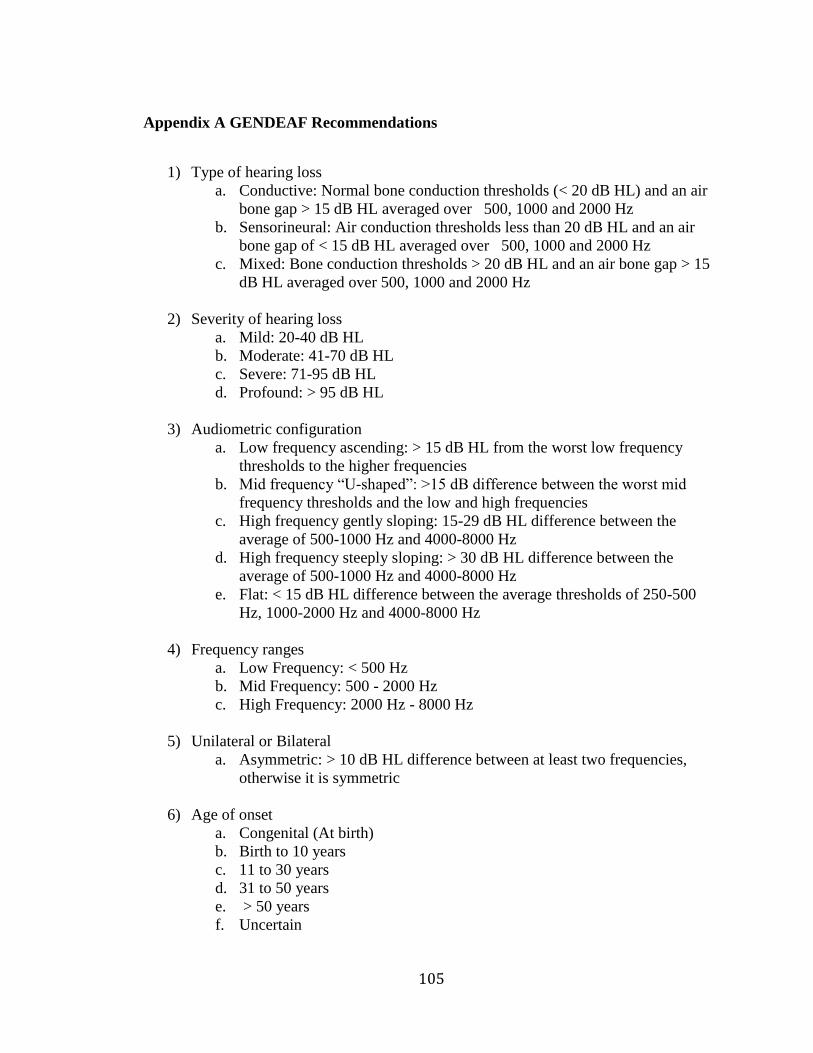
105
Appendix A GENDEAF Recommendations
1) Type of hearing loss
a. Conductive: Normal bone conduction thresholds (< 20 dB HL) and an air
bone gap > 15 dB HL averaged over 500, 1000 and 2000 Hz
b. Sensorineural: Air conduction thresholds less than 20 dB HL and an air
bone gap of < 15 dB HL averaged over 500, 1000 and 2000 Hz
c. Mixed: Bone conduction thresholds > 20 dB HL and an air bone gap > 15
dB HL averaged over 500, 1000 and 2000 Hz
2) Severity of hearing loss
a. Mild: 20-40 dB HL
b. Moderate: 41-70 dB HL
c. Severe: 71-95 dB HL
d. Profound: > 95 dB HL
3) Audiometric configuration
a. Low frequency ascending: > 15 dB HL from the worst low frequency
thresholds to the higher frequencies
b. Mid frequency “U-shaped”: >15 dB difference between the worst mid
frequency thresholds and the low and high frequencies
c. High frequency gently sloping: 15-29 dB HL difference between the
average of 500-1000 Hz and 4000-8000 Hz
d. High frequency steeply sloping: > 30 dB HL difference between the
average of 500-1000 Hz and 4000-8000 Hz
e. Flat: < 15 dB HL difference between the average thresholds of 250-500
Hz, 1000-2000 Hz and 4000-8000 Hz
4) Frequency ranges
a. Low Frequency: < 500 Hz
b. Mid Frequency: 500 - 2000 Hz
c. High Frequency: 2000 Hz - 8000 Hz
5) Unilateral or Bilateral
a. Asymmetric: > 10 dB HL difference between at least two frequencies,
otherwise it is symmetric
6) Age of onset
a. Congenital (At birth)
b. Birth to 10 years
c. 11 to 30 years
d. 31 to 50 years
e. > 50 years
f. Uncertain
106
7) Progression
a. Progressive: >15 dB HL average loss over 500 Hz, 1000 Hz and 2000 Hz
within a 10 year period, otherwise hearing loss is stable
8) Other auditory system dysfunction
a. Tinnitus: Present or Absent
b. Vestibular function: Normal or Abnormal
107
Appendix B Consent Form for Hearing Loss Project
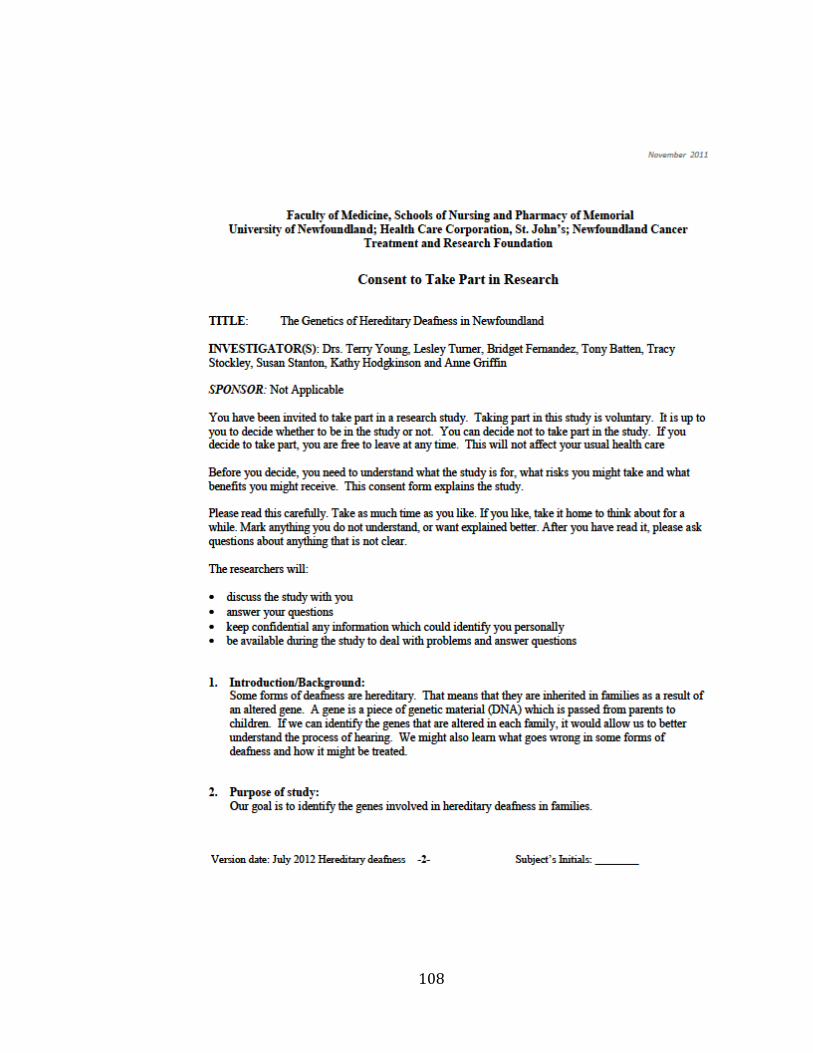
108
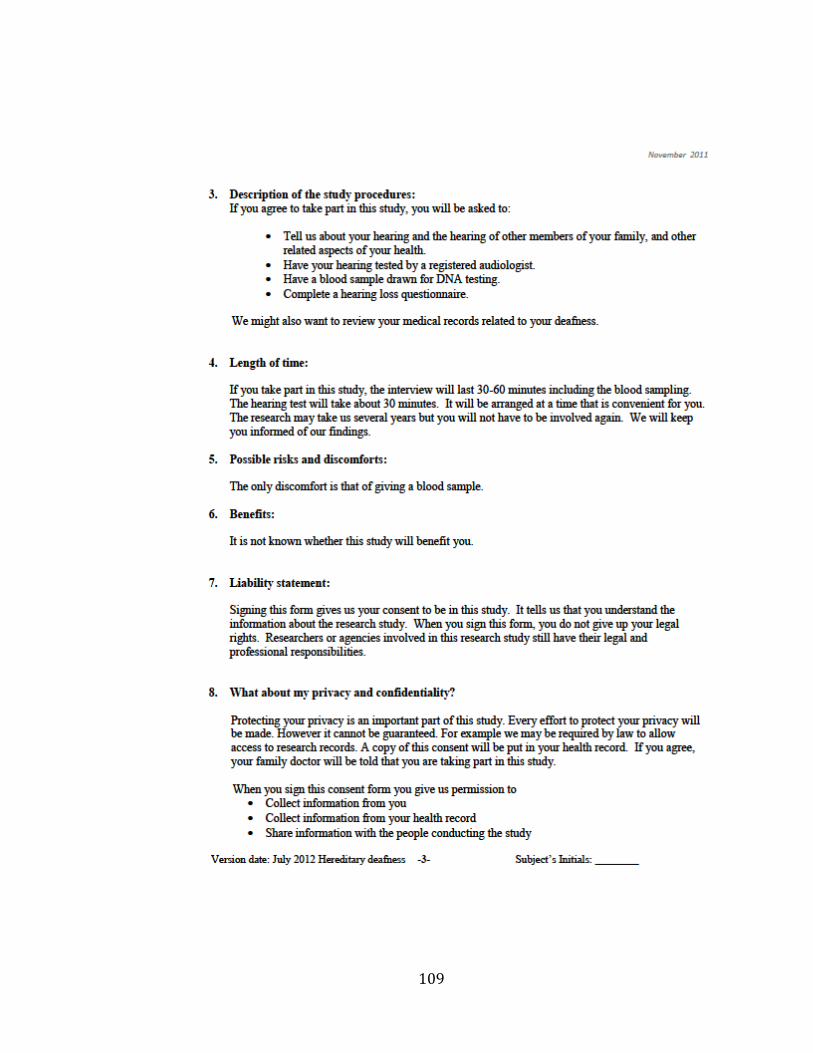
109
110
111
112
113
114
115
Appendix C Hearing Loss Study Medical Information Questionnaire
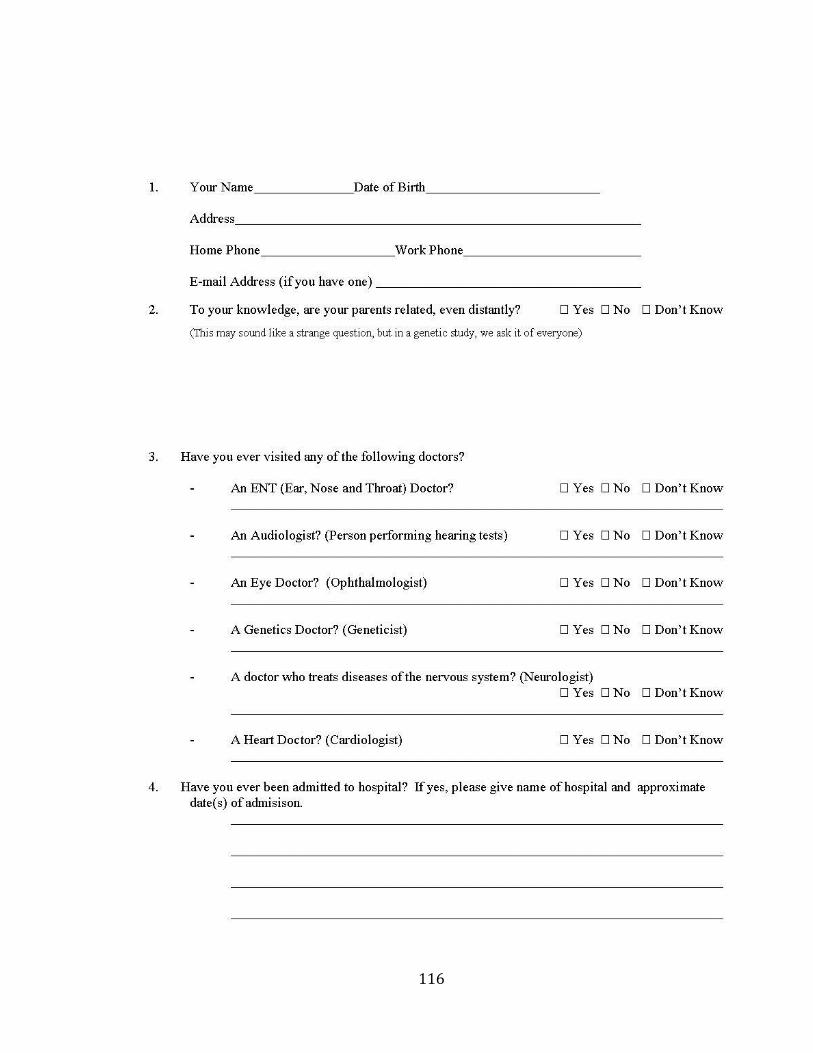
116
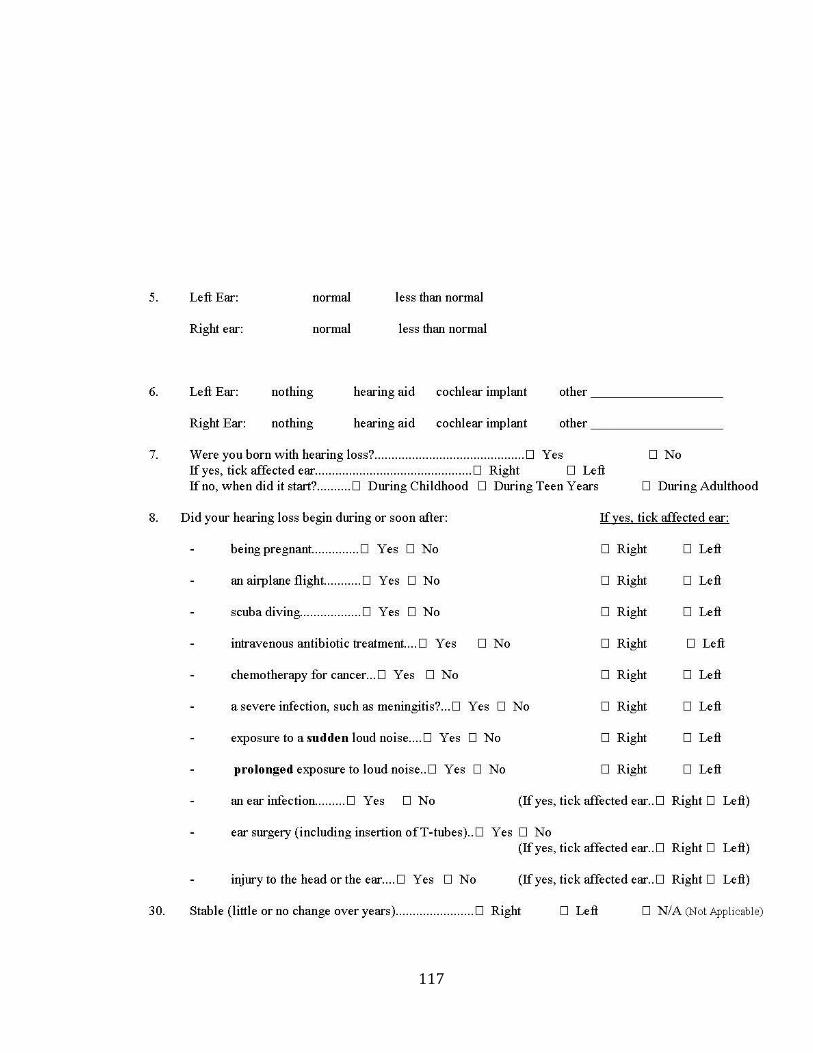
117
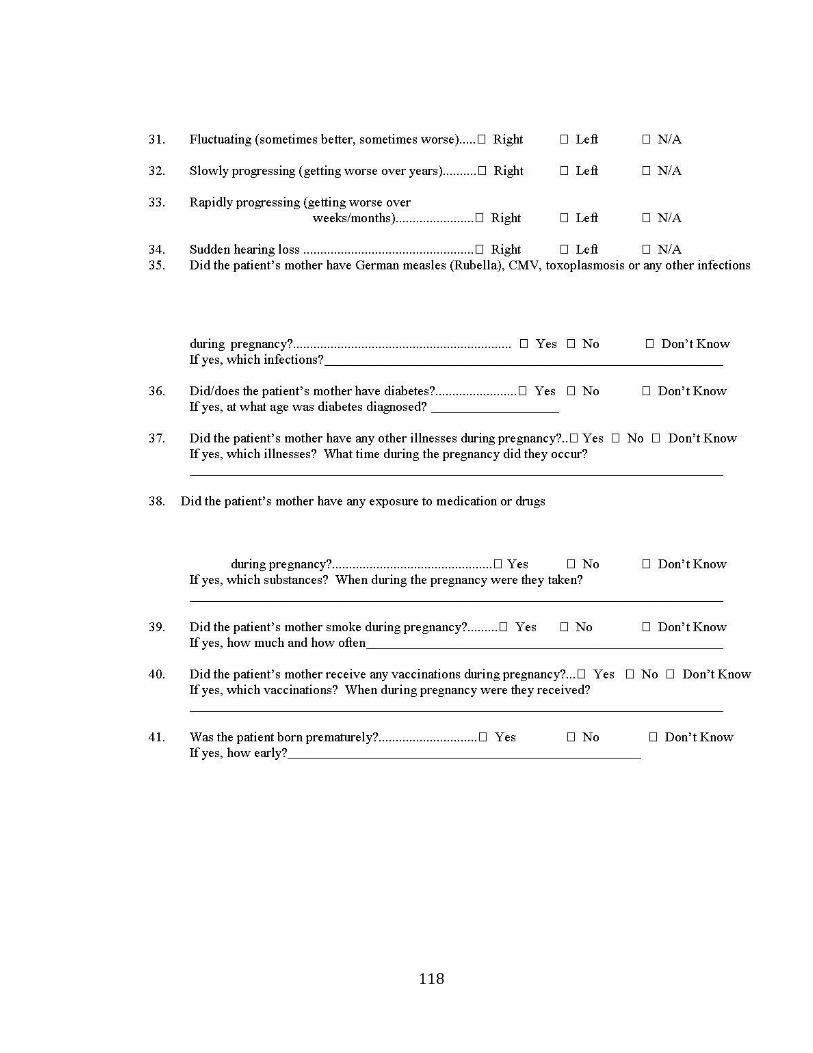
118
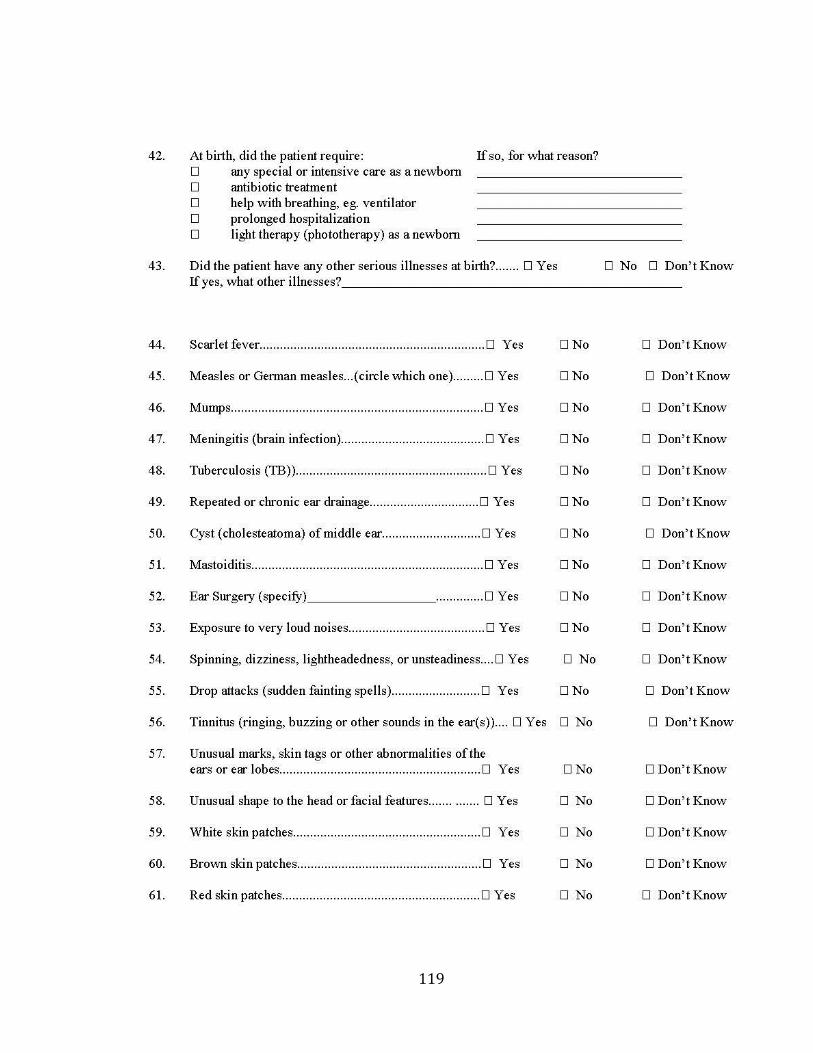
119
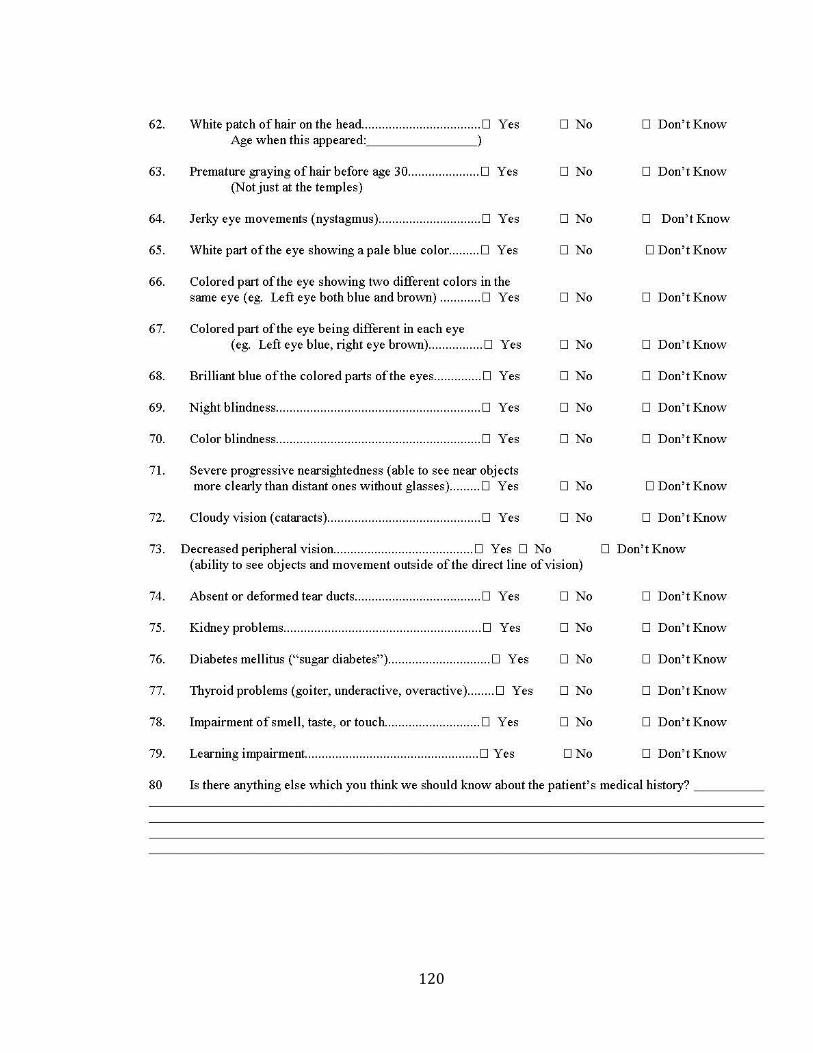
120
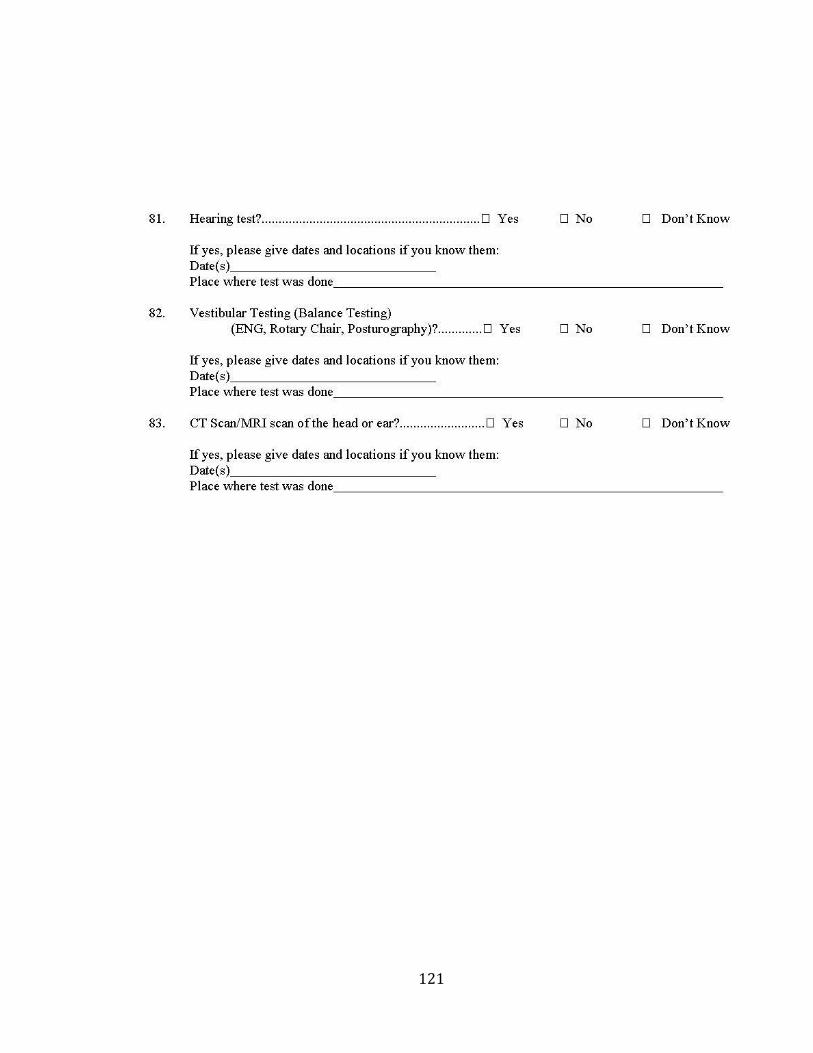
121
122
Appendix D Consent for Release of Audiological Records
REQUEST FOR AUDIOLOGICAL RECORDS
AUTHORIZATION FOR RELEASE OF INFORMATION
I ____________________________hereby consent to the release of information to the Hereditary Deafness Study, from the records of: Name: ____________________________________ MCP#: _______________________ Address: __________________________________ Date of Birth: _________________ __________________________________ Signature: ___________________________________________ Date: ___________ Witness: ____________________________________________ Date: ___________ Name and location of audiologist: ____________________________________________ Please check if you agree to share medical records with: _________________ Family members interested in genetic counseling/genetic testing _________________________________ [Write name(s) of specific individual(s)] ------------------------------------------------------------------------------------------------------------ Hereditary Deafness Study Use: NLMGP: _________________________________
Patient Name: _____________________________ Principal Investigator: Terry-Lynn Young Please return a copy of this form with the medical records to:
Anne Griffin Hearing Loss Project
Family Ascertainment and Gene Identification Memorial University of Newfoundland, Faculty of Medicine
7 Pinsent Drive, Grand Falls-Windsor, NL, A2A 2S8 Phone: 709-489-0569 or toll-free: 1-888-498-3880
Please have or next of kin complete all the information below. Please sign and send back in the envelope provided.
123
Appendix E Lab Requisition Form
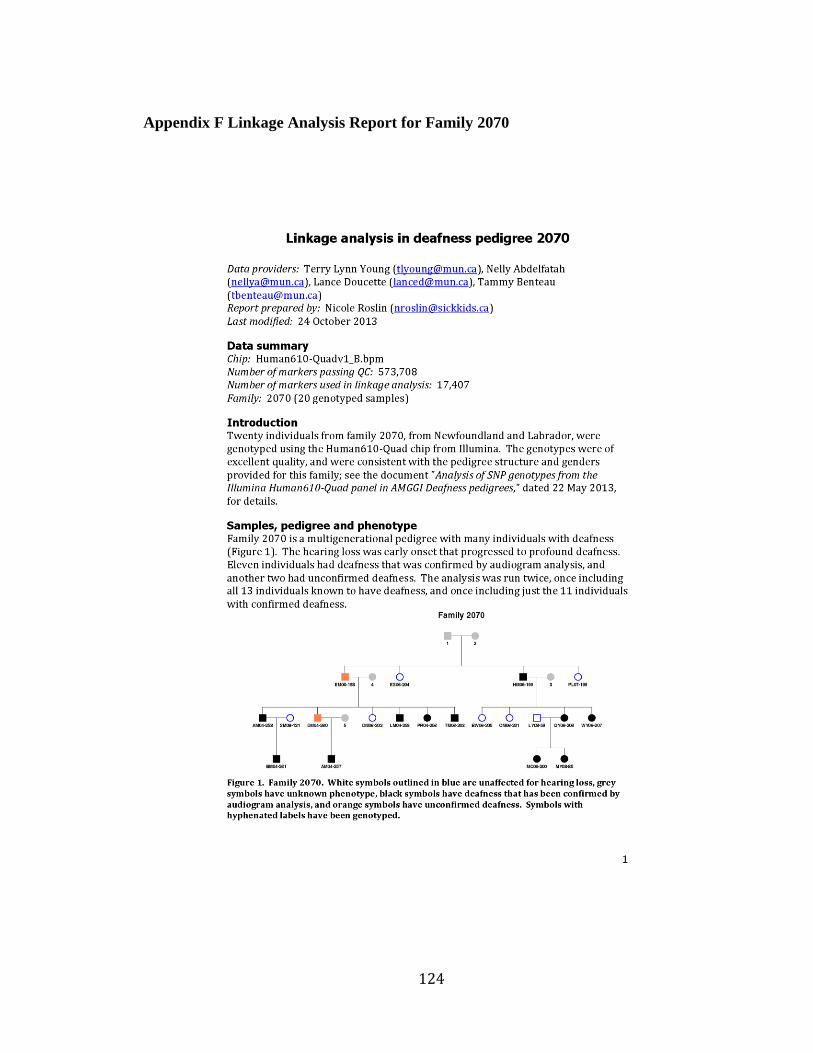
124
Appendix F Linkage Analysis Report for Family 2070
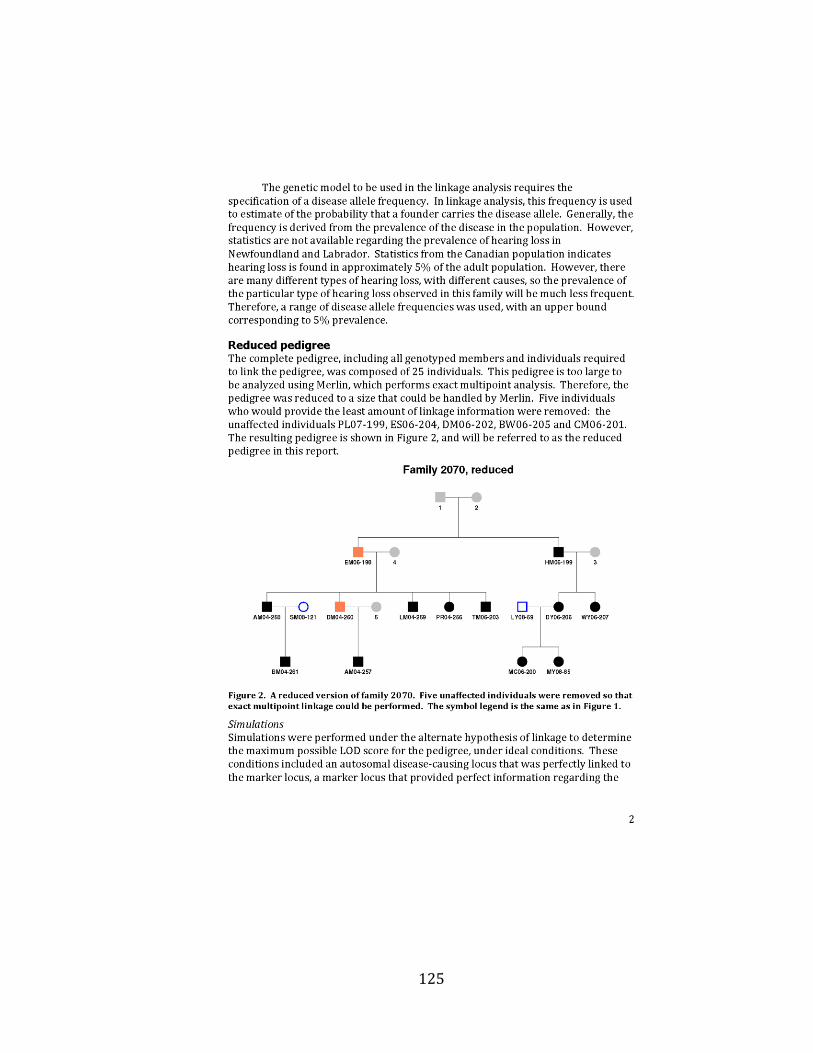
125
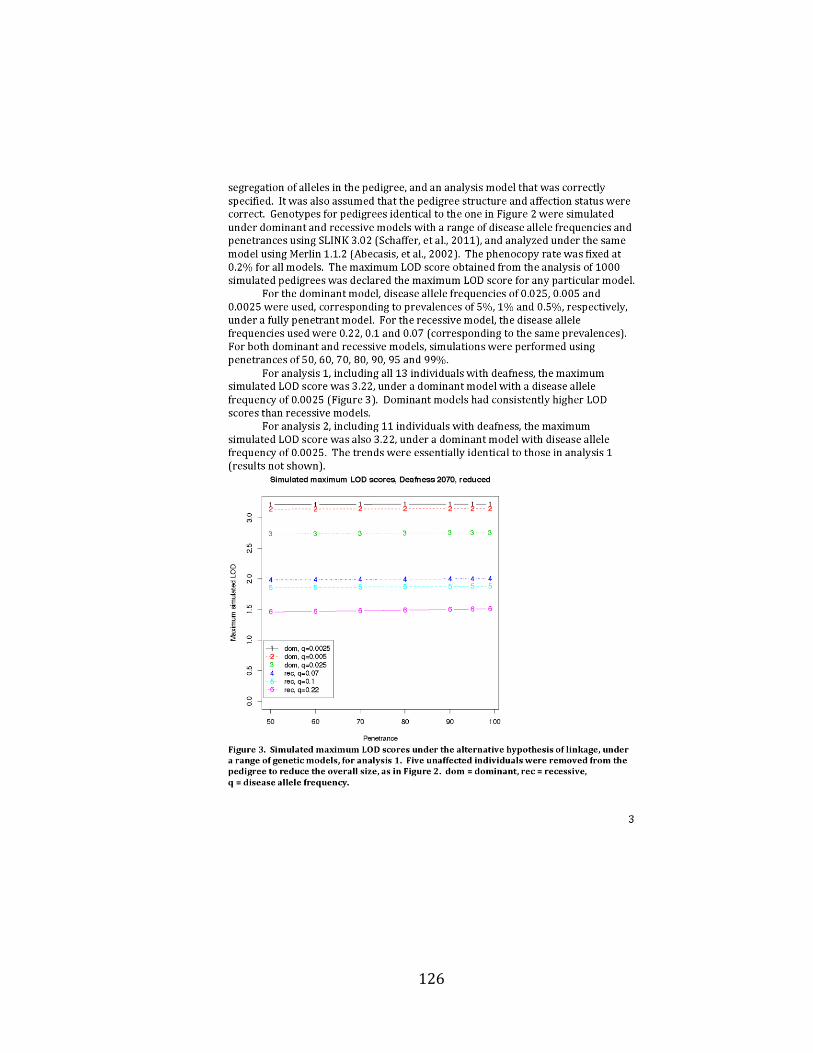
126
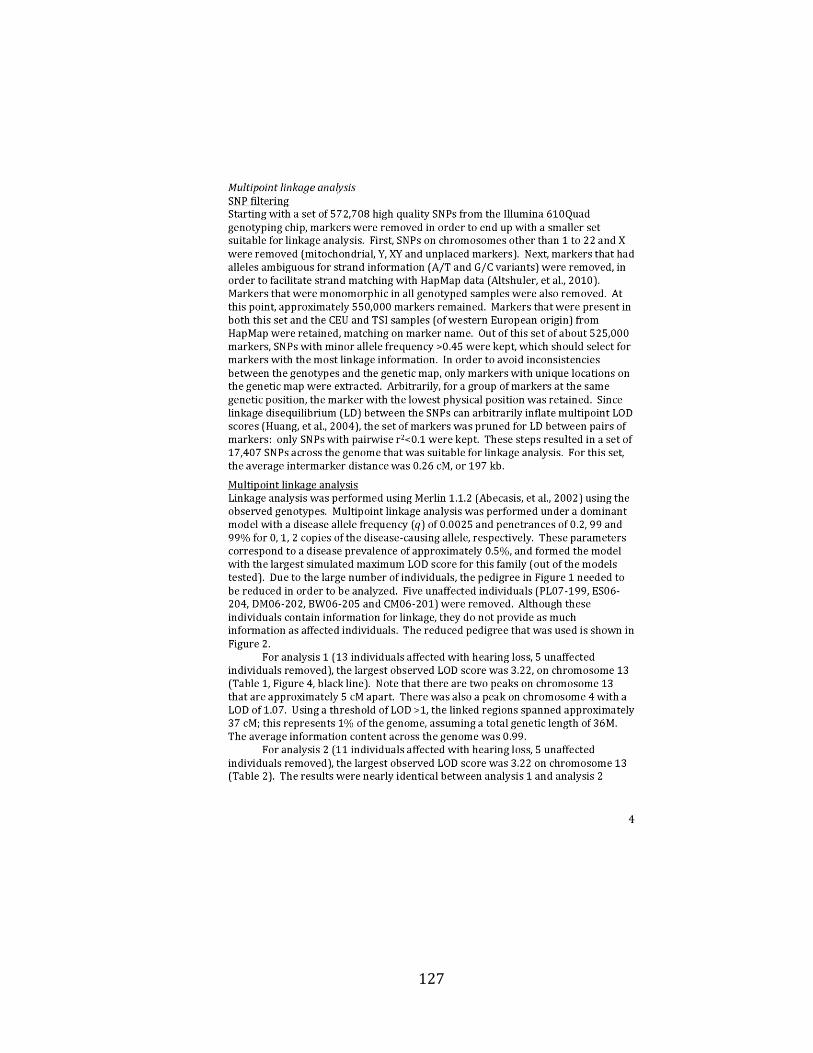
127
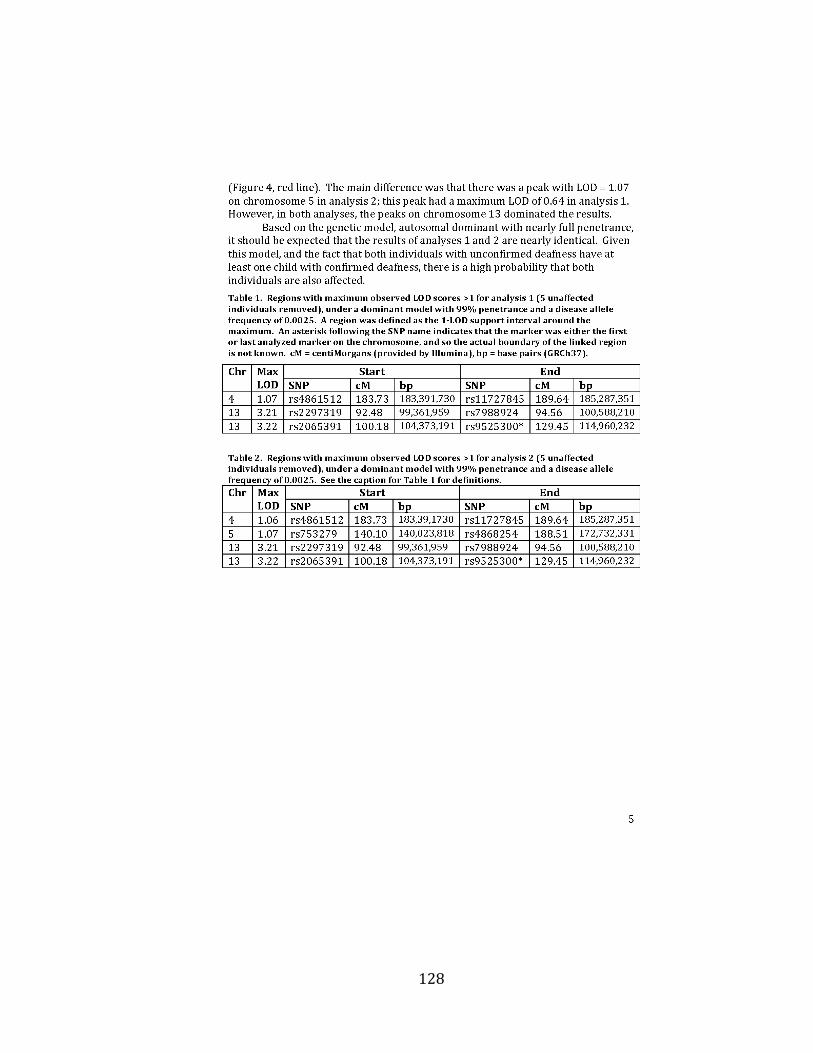
128
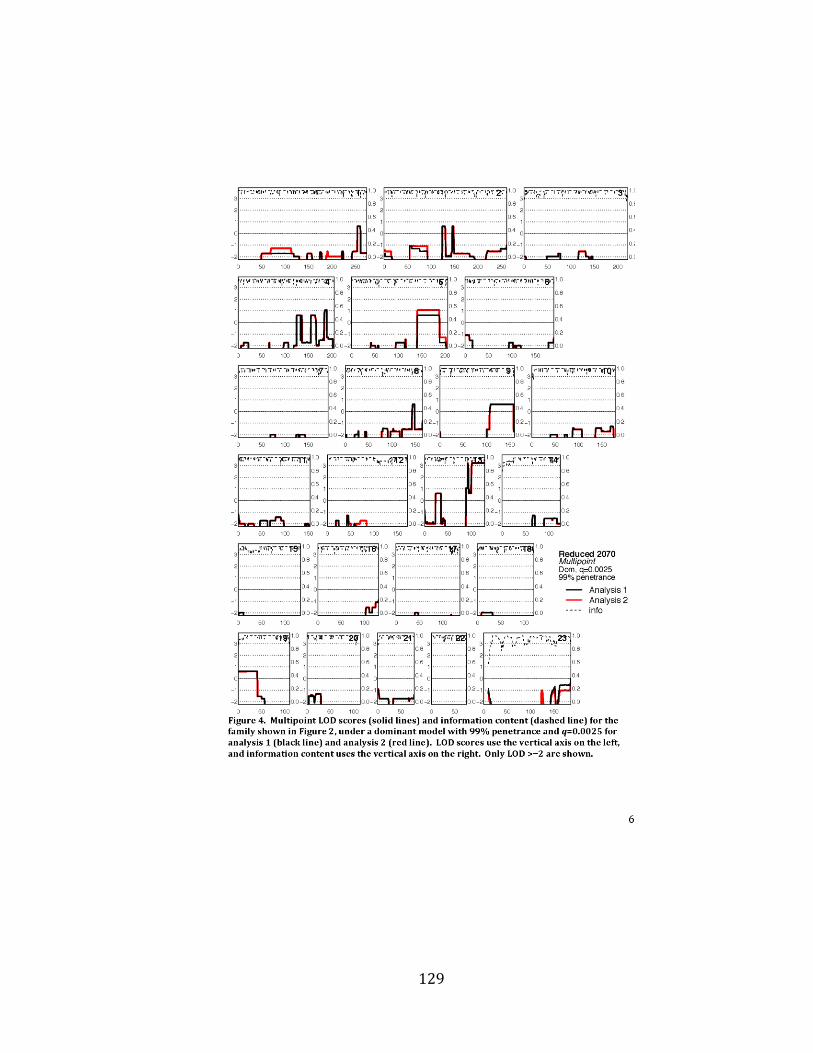
129
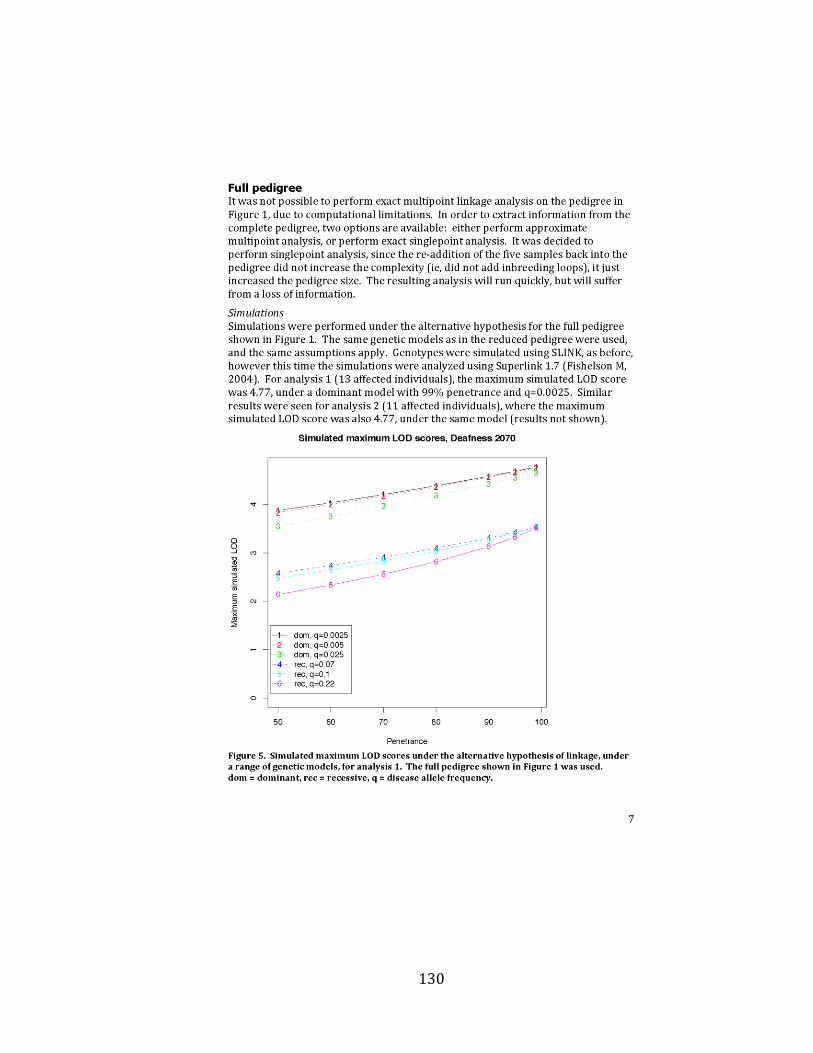
130
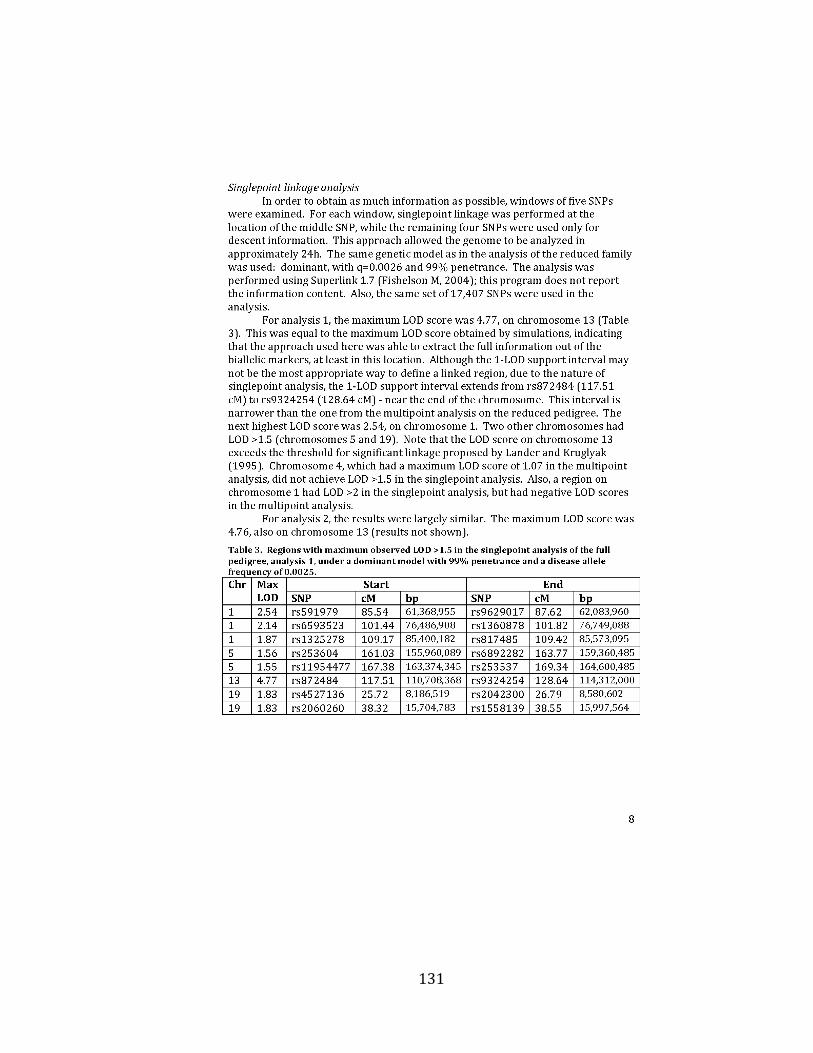
131
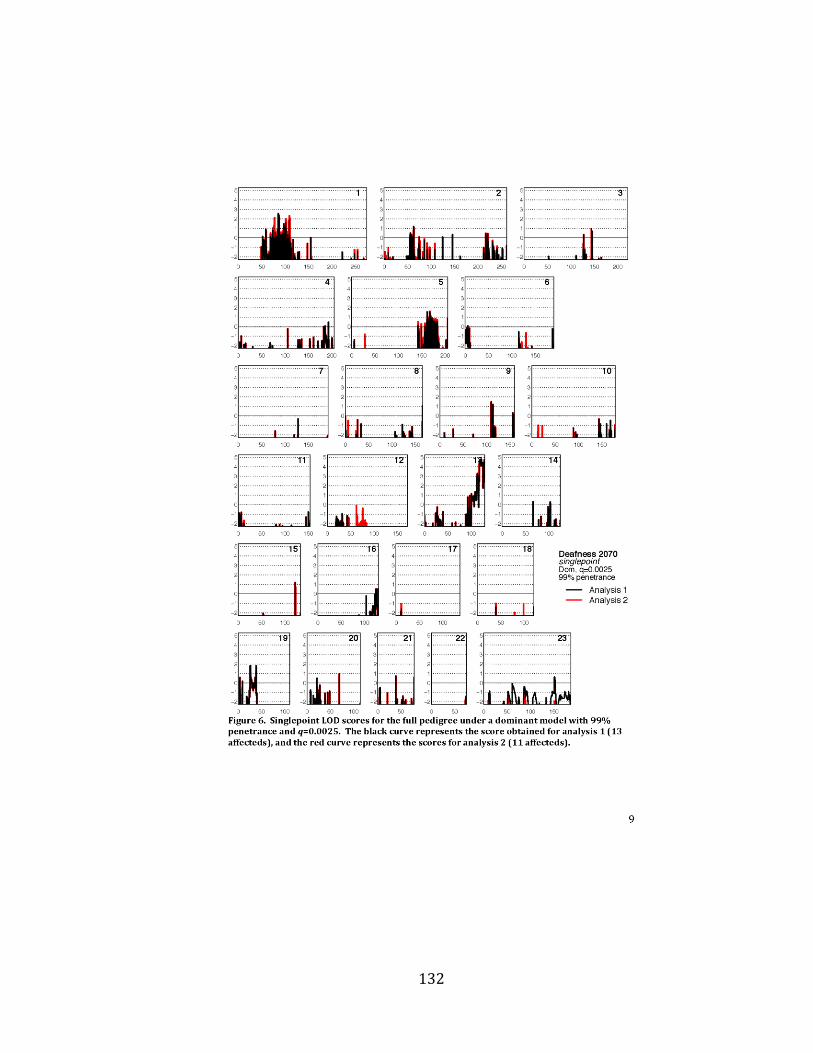
132
133
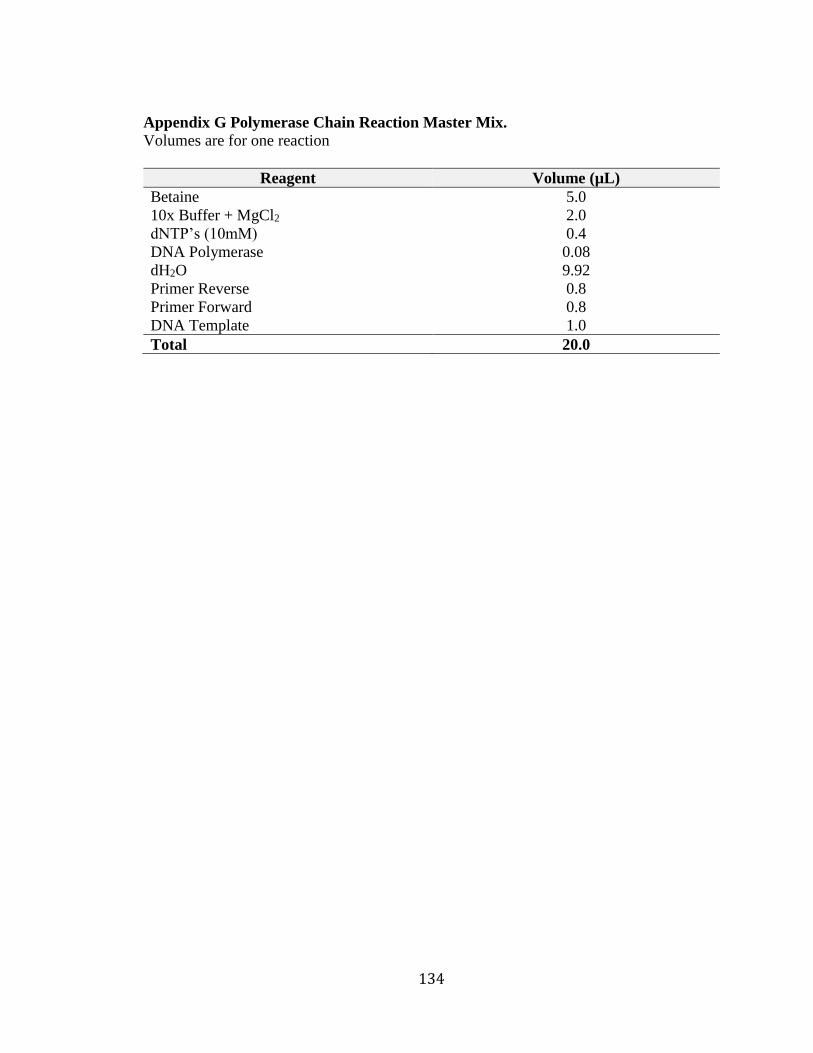
134
Appendix G Polymerase Chain Reaction Master Mix.
Volumes are for one reaction
Reagent Volume (µL)
Betaine 5.0
10x Buffer + MgCl2 2.0
dNTP’s (10mM) 0.4
DNA Polymerase 0.08
dH2O 9.92
Primer Reverse 0.8
Primer Forward 0.8
DNA Template 1.0
Total 20.0
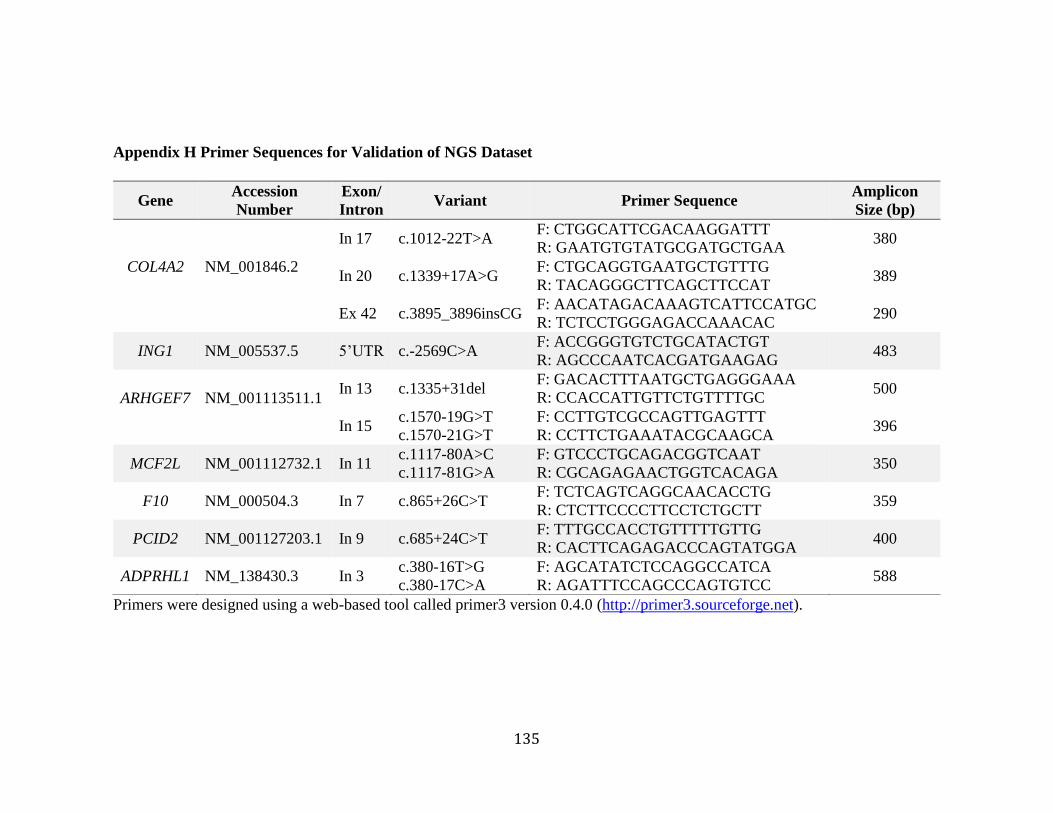
135
Appendix H Primer Sequences for Validation of NGS Dataset
Primers were designed using a web-based tool called primer3 version 0.4.0 (http://primer3.sourceforge.net).
Gene Accession
Number
Exon/
Intron Variant Primer Sequence
Amplicon
Size (bp)
COL4A2
NM_001846.2
In 17 c.1012-22T>A F: CTGGCATTCGACAAGGATTT
R: GAATGTGTATGCGATGCTGAA 380
In 20 c.1339+17A>G F: CTGCAGGTGAATGCTGTTTG
R: TACAGGGCTTCAGCTTCCAT 389
Ex 42 c.3895_3896insCG F: AACATAGACAAAGTCATTCCATGC
R: TCTCCTGGGAGACCAAACAC 290
ING1 NM_005537.5 5’UTR c.-2569C>A F: ACCGGGTGTCTGCATACTGT
R: AGCCCAATCACGATGAAGAG 483
ARHGEF7
NM_001113511.1
In 13 c.1335+31del F: GACACTTTAATGCTGAGGGAAA
R: CCACCATTGTTCTGTTTTGC 500
In 15 c.1570-19G>T
c.1570-21G>T
F: CCTTGTCGCCAGTTGAGTTT
R: CCTTCTGAAATACGCAAGCA 396
MCF2L NM_001112732.1 In 11 c.1117-80A>C
c.1117-81G>A
F: GTCCCTGCAGACGGTCAAT
R: CGCAGAGAACTGGTCACAGA 350
F10 NM_000504.3 In 7 c.865+26C>T F: TCTCAGTCAGGCAACACCTG
R: CTCTTCCCCTTCCTCTGCTT 359
PCID2 NM_001127203.1 In 9 c.685+24C>T F: TTTGCCACCTGTTTTTGTTG
R: CACTTCAGAGACCCAGTATGGA 400
ADPRHL1 NM_138430.3 In 3 c.380-16T>G
c.380-17C>A
F: AGCATATCTCCAGGCCATCA
R: AGATTTCCAGCCCAGTGTCC 588
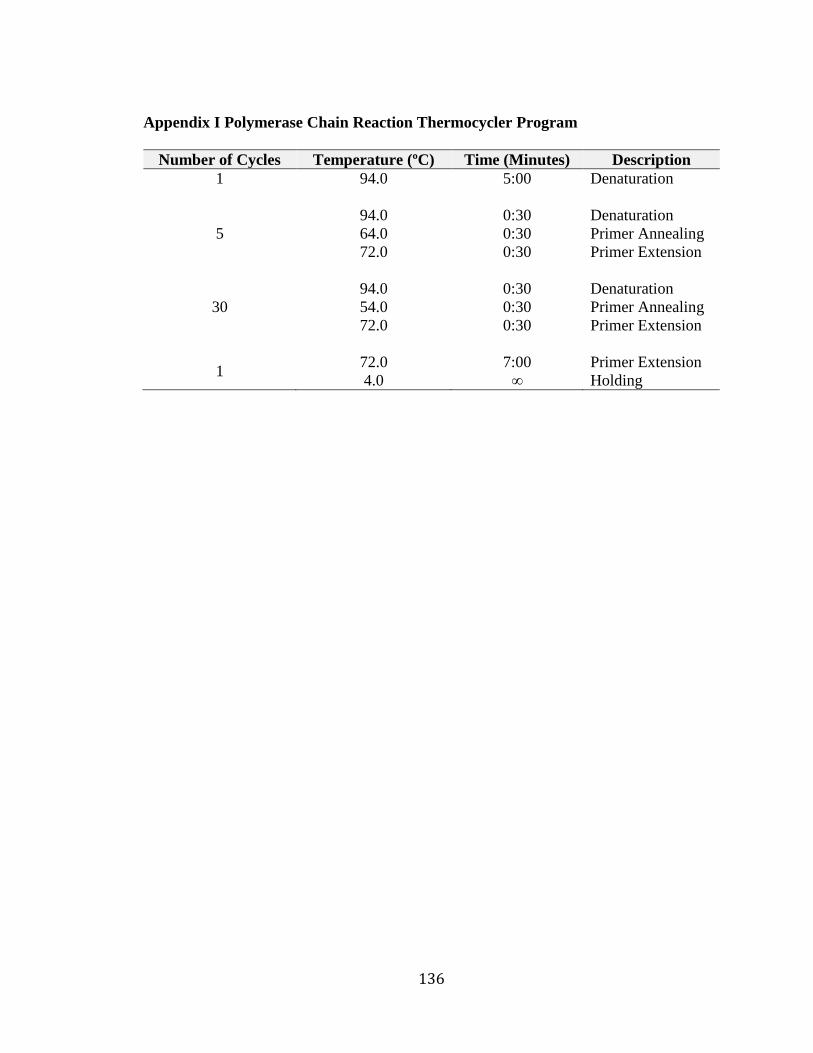
136
Appendix I Polymerase Chain Reaction Thermocycler Program
Number of Cycles Temperature (ºC) Time (Minutes) Description
1
94.0
5:00
Denaturation
5
94.0
64.0
72.0
0:30
0:30
0:30
Denaturation
Primer Annealing
Primer Extension
30
94.0
54.0
72.0
0:30
0:30
0:30
Denaturation
Primer Annealing
Primer Extension
1 72.0
4.0
7:00
∞
Primer Extension
Holding
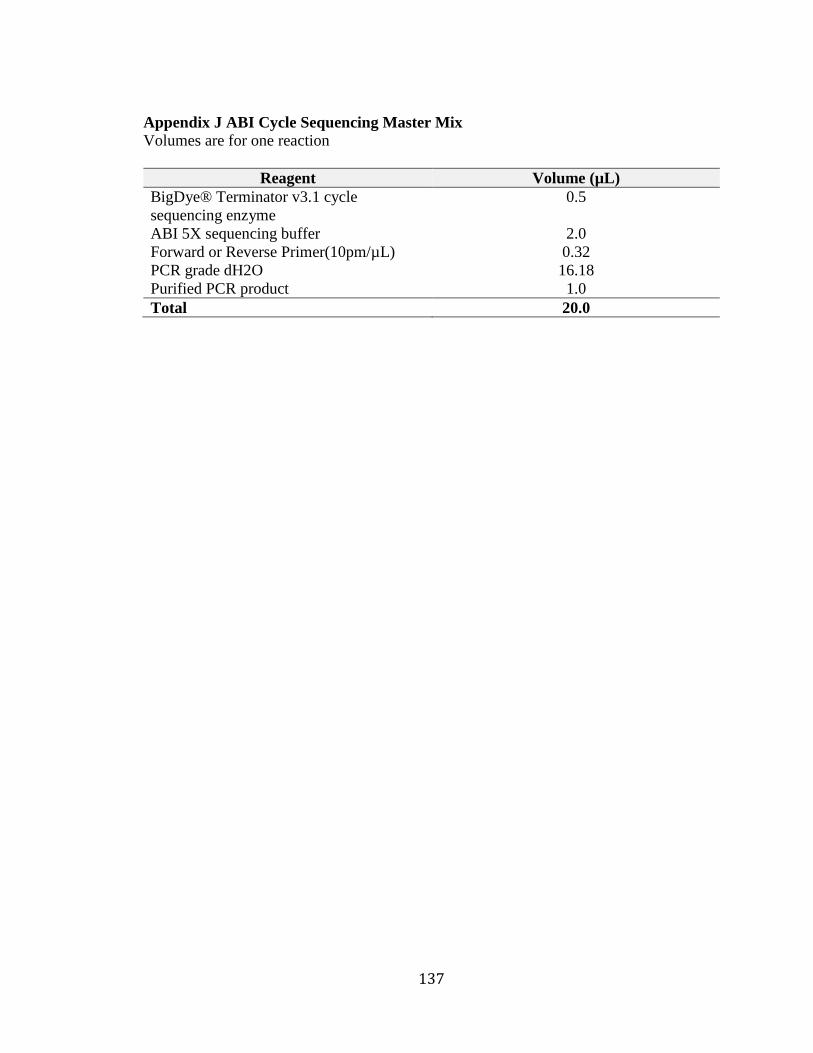
137
Appendix J ABI Cycle Sequencing Master Mix
Volumes are for one reaction
Reagent Volume (µL)
BigDye® Terminator v3.1 cycle
sequencing enzyme
0.5
ABI 5X sequencing buffer 2.0
Forward or Reverse Primer(10pm/µL) 0.32
PCR grade dH2O 16.18
Purified PCR product 1.0
Total 20.0
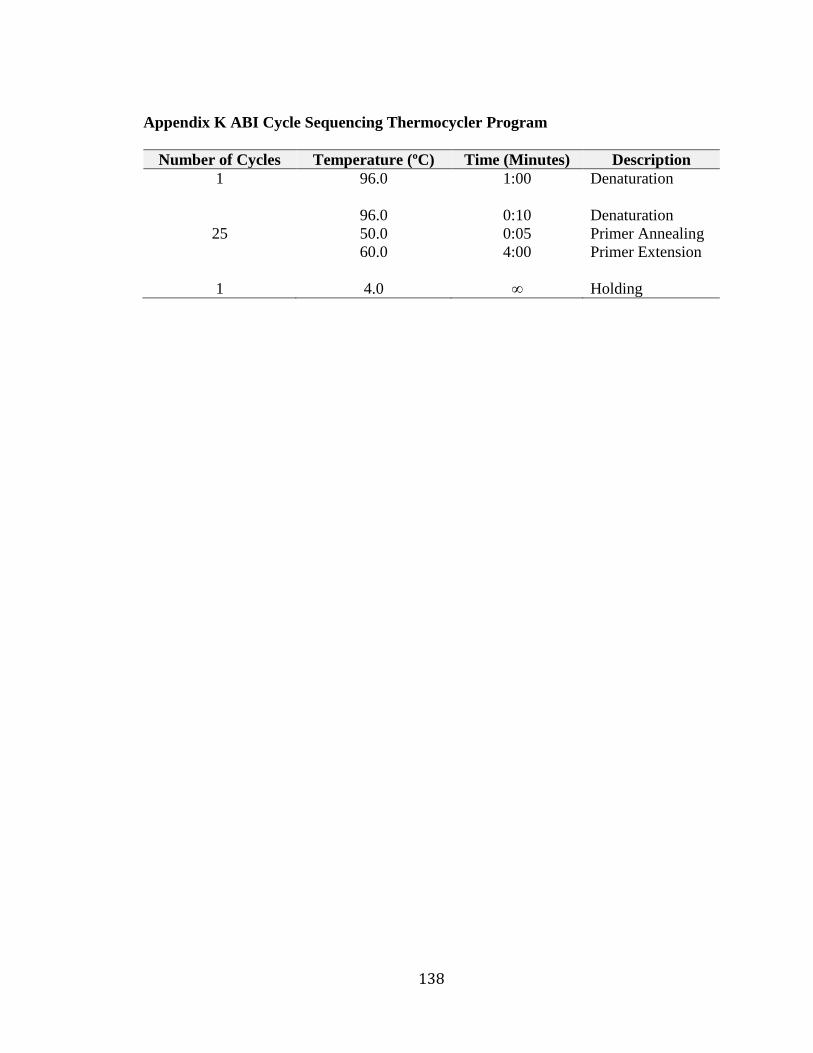
138
Appendix K ABI Cycle Sequencing Thermocycler Program
Number of Cycles Temperature (ºC) Time (Minutes) Description
1
96.0
1:00
Denaturation
25
96.0
50.0
60.0
0:10
0:05
4:00
Denaturation
Primer Annealing
Primer Extension
1 4.0 ∞ Holding
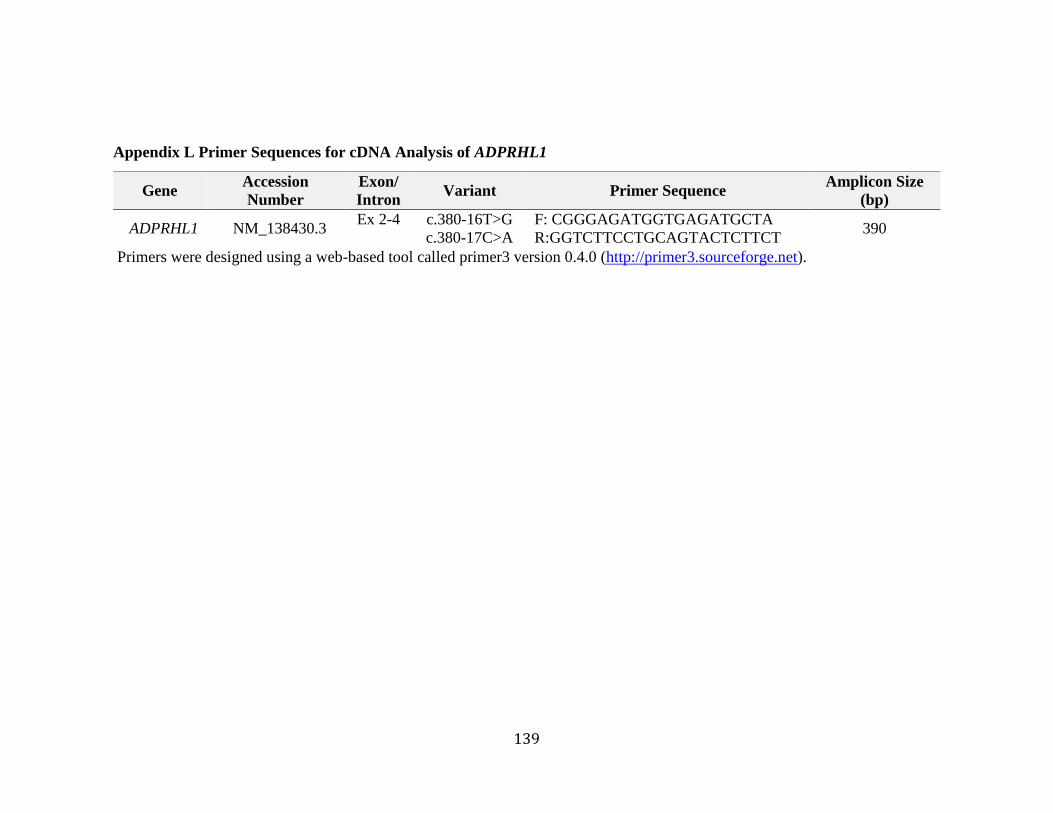
139
Appendix L Primer Sequences for cDNA Analysis of ADPRHL1
Primers were designed using a web-based tool called primer3 version 0.4.0 (http://primer3.sourceforge.net).
Gene Accession
Number
Exon/
Intron Variant Primer Sequence
Amplicon Size
(bp)
ADPRHL1 NM_138430.3 Ex 2-4
c.380-16T>G
c.380-17C>A
F: CGGGAGATGGTGAGATGCTA
R:GGTCTTCCTGCAGTACTCTTCT 390
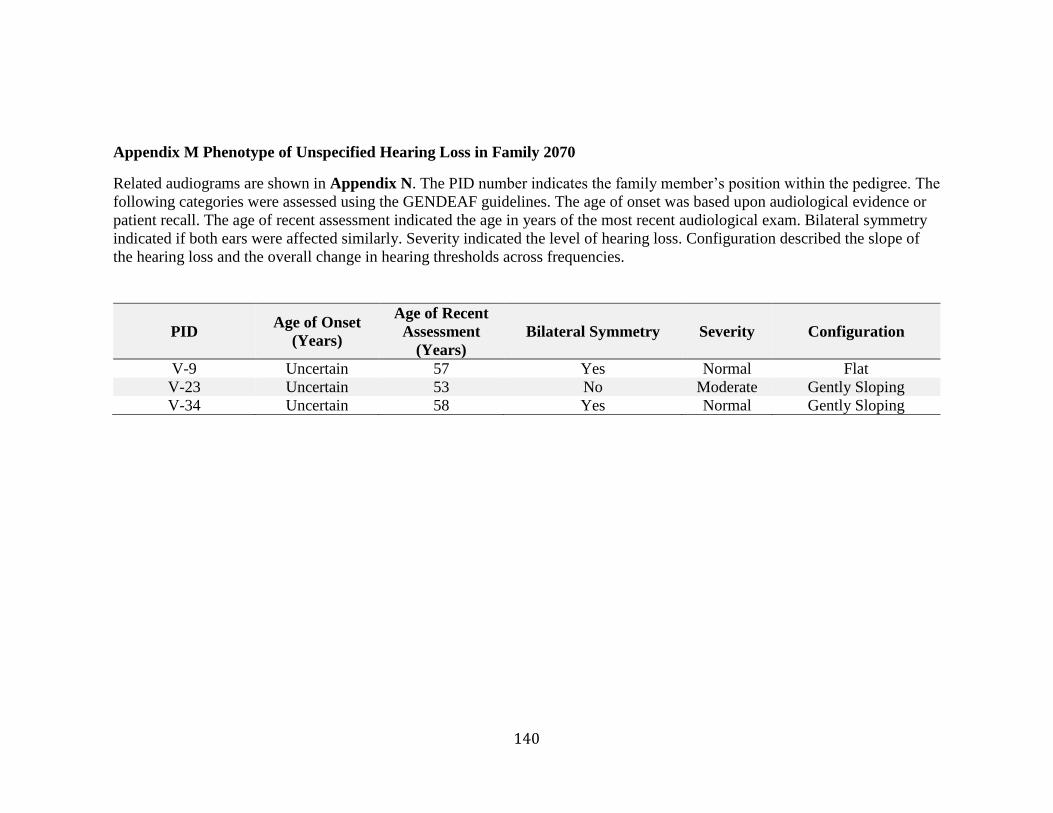
140
Appendix M Phenotype of Unspecified Hearing Loss in Family 2070
Related audiograms are shown in Appendix N. The PID number indicates the family member’s position within the pedigree. The
following categories were assessed using the GENDEAF guidelines. The age of onset was based upon audiological evidence or
patient recall. The age of recent assessment indicated the age in years of the most recent audiological exam. Bilateral symmetry
indicated if both ears were affected similarly. Severity indicated the level of hearing loss. Configuration described the slope of
the hearing loss and the overall change in hearing thresholds across frequencies.
PID Age of Onset
(Years)
Age of Recent
Assessment
(Years)
Bilateral Symmetry Severity Configuration
V-9 Uncertain 57 Yes Normal Flat
V-23 Uncertain 53 No Moderate Gently Sloping
V-34 Uncertain 58 Yes Normal Gently Sloping
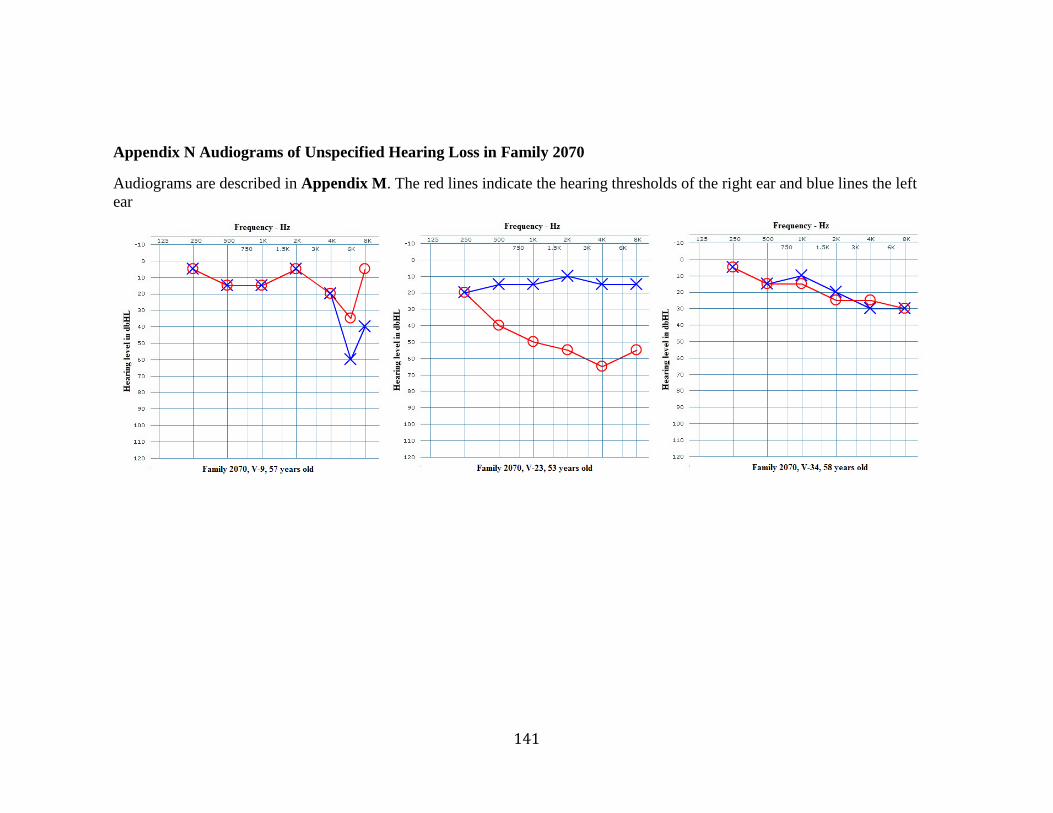
141
Appendix N Audiograms of Unspecified Hearing Loss in Family 2070
Audiograms are described in Appendix M. The red lines indicate the hearing thresholds of the right ear and blue lines the left
ear
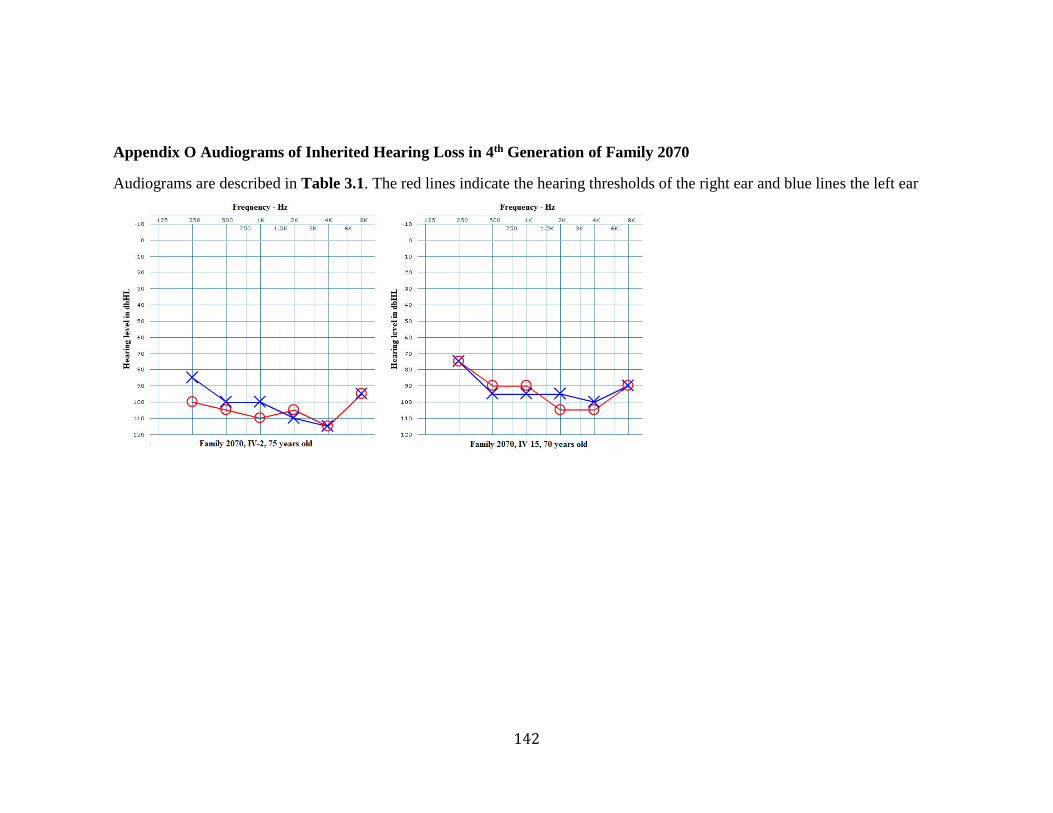
142
Appendix O Audiograms of Inherited Hearing Loss in 4th Generation of Family 2070
Audiograms are described in Table 3.1. The red lines indicate the hearing thresholds of the right ear and blue lines the left ear
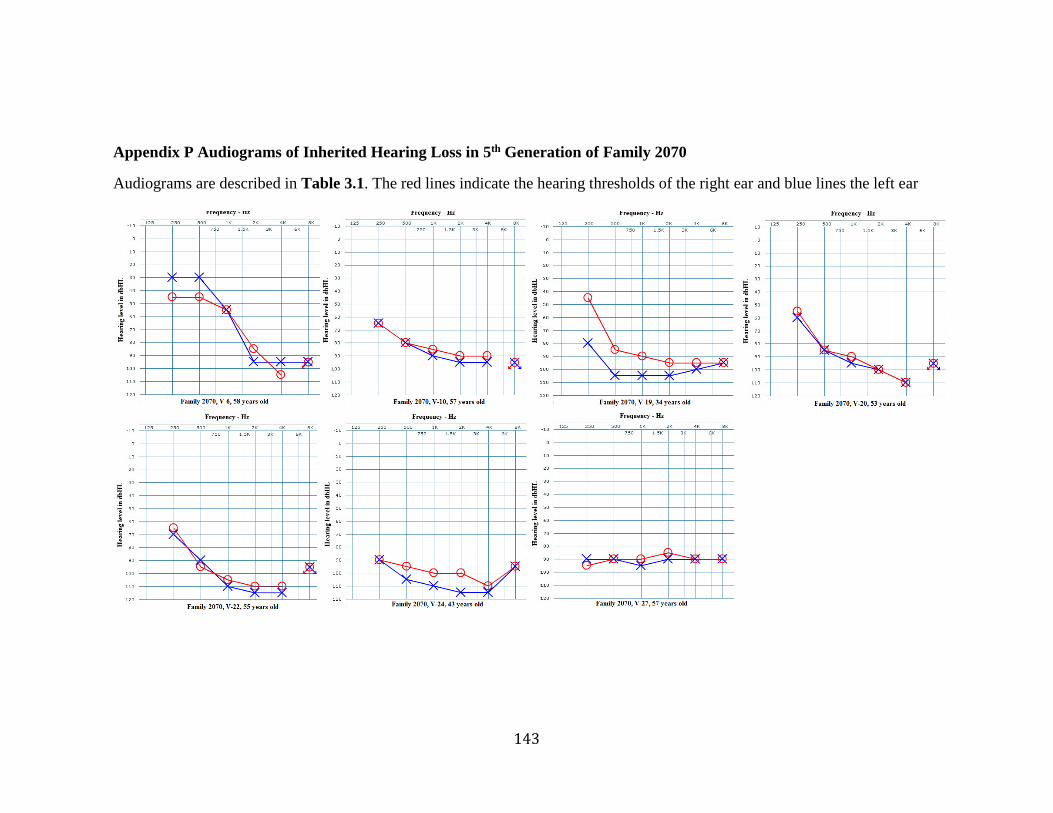
143
Appendix P Audiograms of Inherited Hearing Loss in 5th Generation of Family 2070
Audiograms are described in Table 3.1. The red lines indicate the hearing thresholds of the right ear and blue lines the left ear
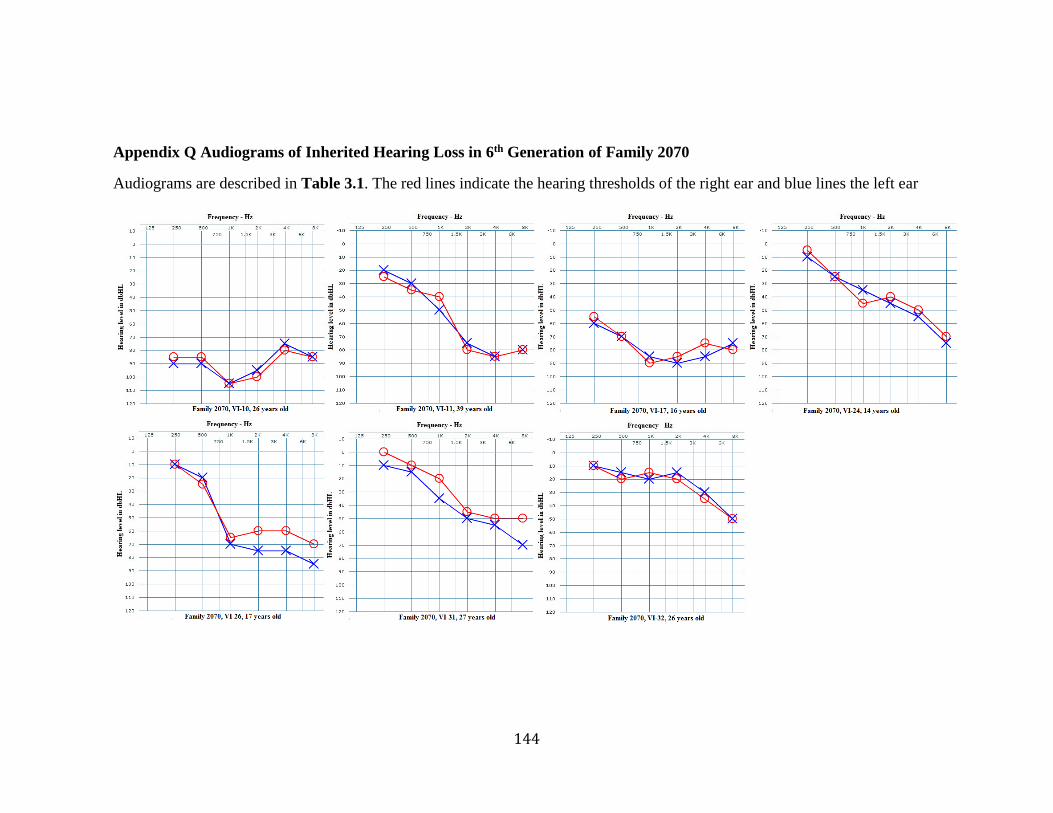
144
Appendix Q Audiograms of Inherited Hearing Loss in 6th Generation of Family 2070
Audiograms are described in Table 3.1. The red lines indicate the hearing thresholds of the right ear and blue lines the left ear
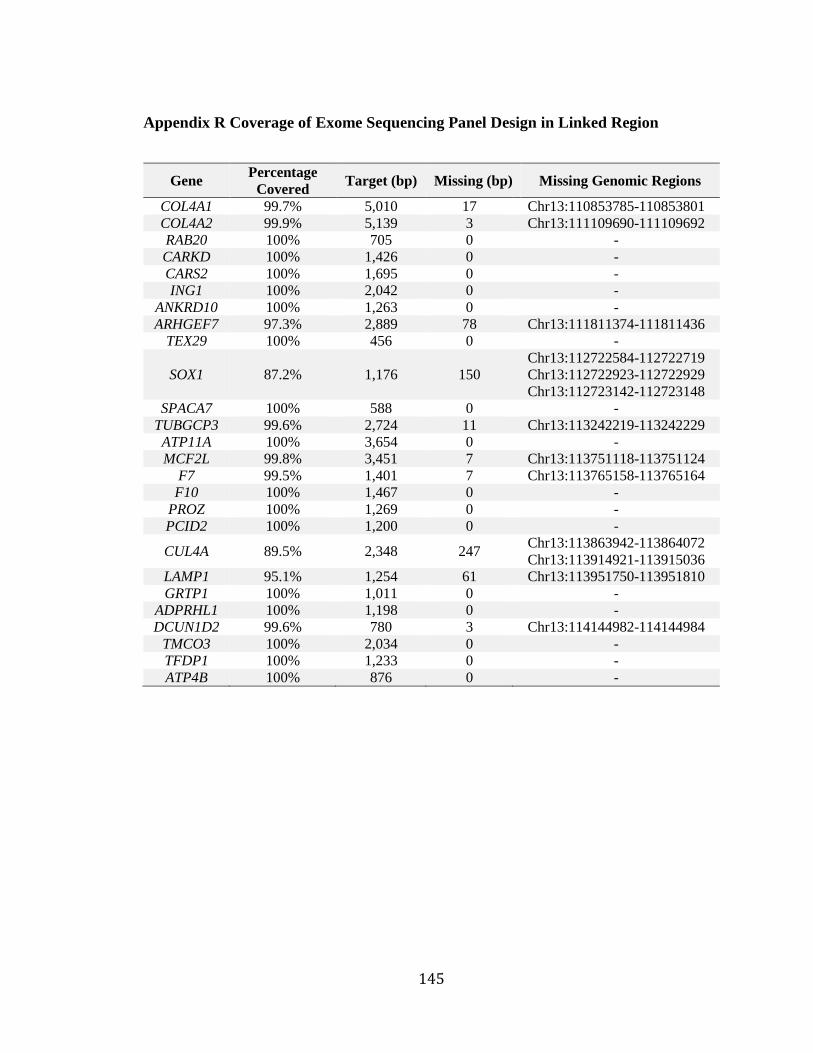
145
Appendix R Coverage of Exome Sequencing Panel Design in Linked Region
Gene Percentage
Covered Target (bp) Missing (bp) Missing Genomic Regions
COL4A1 99.7% 5,010 17 Chr13:110853785-110853801
COL4A2 99.9% 5,139 3 Chr13:111109690-111109692
RAB20 100% 705 0 -
CARKD 100% 1,426 0 -
CARS2 100% 1,695 0 -
ING1 100% 2,042 0 -
ANKRD10 100% 1,263 0 -
ARHGEF7 97.3% 2,889 78 Chr13:111811374-111811436
TEX29 100% 456 0 -
SOX1 87.2% 1,176 150
Chr13:112722584-112722719
Chr13:112722923-112722929
Chr13:112723142-112723148
SPACA7 100% 588 0 -
TUBGCP3 99.6% 2,724 11 Chr13:113242219-113242229
ATP11A 100% 3,654 0 -
MCF2L 99.8% 3,451 7 Chr13:113751118-113751124
F7 99.5% 1,401 7 Chr13:113765158-113765164
F10 100% 1,467 0 -
PROZ 100% 1,269 0 -
PCID2 100% 1,200 0 -
CUL4A 89.5% 2,348 247 Chr13:113863942-113864072
Chr13:113914921-113915036
LAMP1 95.1% 1,254 61 Chr13:113951750-113951810
GRTP1 100% 1,011 0 -
ADPRHL1 100% 1,198 0 -
DCUN1D2 99.6% 780 3 Chr13:114144982-114144984
TMCO3 100% 2,034 0 -
TFDP1 100% 1,233 0 -
ATP4B 100% 876 0 -
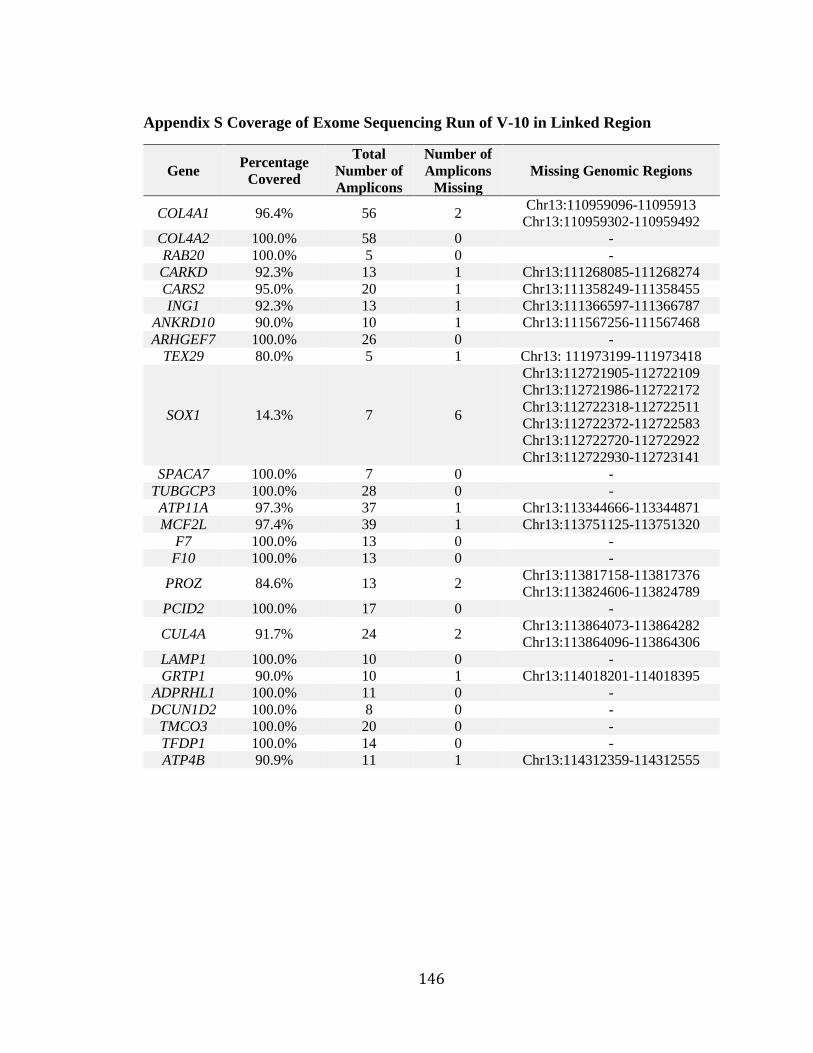
146
Appendix S Coverage of Exome Sequencing Run of V-10 in Linked Region
Gene Percentage
Covered
Total
Number of
Amplicons
Number of
Amplicons
Missing
Missing Genomic Regions
COL4A1 96.4% 56 2 Chr13:110959096-11095913
Chr13:110959302-110959492
COL4A2 100.0% 58 0 -
RAB20 100.0% 5 0 -
CARKD 92.3% 13 1 Chr13:111268085-111268274
CARS2 95.0% 20 1 Chr13:111358249-111358455
ING1 92.3% 13 1 Chr13:111366597-111366787
ANKRD10 90.0% 10 1 Chr13:111567256-111567468
ARHGEF7 100.0% 26 0 -
TEX29 80.0% 5 1 Chr13: 111973199-111973418
SOX1 14.3% 7 6
Chr13:112721905-112722109
Chr13:112721986-112722172
Chr13:112722318-112722511
Chr13:112722372-112722583
Chr13:112722720-112722922
Chr13:112722930-112723141
SPACA7 100.0% 7 0 -
TUBGCP3 100.0% 28 0 -
ATP11A 97.3% 37 1 Chr13:113344666-113344871
MCF2L 97.4% 39 1 Chr13:113751125-113751320
F7 100.0% 13 0 -
F10 100.0% 13 0 -
PROZ 84.6% 13 2 Chr13:113817158-113817376
Chr13:113824606-113824789
PCID2 100.0% 17 0 -
CUL4A 91.7% 24 2 Chr13:113864073-113864282
Chr13:113864096-113864306
LAMP1 100.0% 10 0 -
GRTP1 90.0% 10 1 Chr13:114018201-114018395
ADPRHL1 100.0% 11 0 -
DCUN1D2 100.0% 8 0 -
TMCO3 100.0% 20 0 -
TFDP1 100.0% 14 0 -
ATP4B 90.9% 11 1 Chr13:114312359-114312555
Copyright © 2022 FDOKUMEN