Low empathy in deaf and hard of hearing (pre)adolescents compared to normal hearing controls

www.elsevier.com/locate/cbpa
Comparative Biochemistry and Physio
The hearing abilities of the prawn Palaemon serratus
J.M. Lovella,*, M.M. Findlaya, R.M. Moateb, H.Y. Yanc
aSchool of Earth, Ocean and Environmental Sciences, University of Plymouth, Drake Circus, Plymouth PL4 8AA, United KingdombPlymouth Electron Microscopy Centre, University of Plymouth, Drake Circus, Plymouth PL4 8AA, United Kingdom
cResearch Station, Institute of Zoology, Academia Sinica, Jiashi, I-Lan 262, Taiwan
Received 5 August 2004; received in revised form 1 November 2004; accepted 2 November 2004
Abstract
The mechanism of sound reception and the hearing abilities of the prawn (Palaemon serratus) have been studied using a combination of
anatomical, electron microscopic and electrophysiological approaches, revealing that P. serratus is responsive to sounds ranging in frequency
from 100 to 3000 Hz. It is the first time that the Auditory Brainstem Response (ABR) recording technique has been used on invertebrates,
and the acquisition of hearing ability data from the present study adds valuable information to the inclusion of an entire sub-phylum of
animals when assessing the potential impact of anthropogenic underwater sounds on marine organisms. Auditory evoked potentials were
acquired from P. serratus, using two subcutaneous electrodes positioned in the carapace close to the supraesophageal ganglion and the
statocyst (a small gravistatic organ located below the eyestalk on the peduncle of the bilateral antennules). The morphology of the statocyst
receptors and the otic nerve pathways to the brain have also been studied, and reveal that P. serratus possesses an array of sensory hairs
projecting from the floor of the statocyst into a mass of sand granules embedded in a gelatinous substance. It is the purpose of this work to
show that the statocyst is responsive to sounds propagated through water from an air mounted transducer. The fundamental measure of the
hearing ability of any organism possessing the appropriate receptor mechanism is its audiogram, which presents the lowest level of sound that
the species can hear as a function of frequency. The statocyst of P. serratus is shown here to be sensitive to the motion of water particles
displaced by low-frequency sounds ranging from 100 Hz up to 3000 Hz, with a hearing acuity similar to that of a generalist fish. Also,
recorded neural waveforms were found to be similar in both amplitude and shape to those acquired from fish and higher vertebrates, when
stimulated with low-frequency sound, and complete ablation of the electrophysiological response was achieved by removal of the statocyst.
D 2004 Elsevier Inc. All rights reserved.
Keywords: Crustacean; Sensory system; Hair cell; Evoked potential; Hearing; Palaemon serratus
1. Introduction
The oceans are virtually transparent to sound, and opaque
to light and radio waves. At a wavelength of 1 m (1500 Hz),
water is nearly 1,000,000 times more transparent to sound
than to radio signals (Pilgrim and Lovell, 2002). This fact
underlies the intense interest currently being directed toward
the acoustical exploration of the ocean. Naturally produced
sounds arise from a number of sources, such as breaking
waves, heavy rain, volcanic activity or from marine animals
1095-6433/$ - see front matter D 2004 Elsevier Inc. All rights reserved.
doi:10.1016/j.cbpb.2004.11.003
* Corresponding author. Tel.: +44 1752 232411; fax: +44 1752
232400.
E-mail address: [email protected] (J.M. Lovell).
(bio-acoustic sources). Vocalisations such as whale song,
along with the grunts and whistles from sonic fish are
especially relevant for communication purposes, and during
predator prey interactions (Myrberg, 1981). There are
several types of anthropogenic sources used routinely that
produce intense levels of noise, such as the Low Frequency
Active Sonar (LFA) used by the military in anti-submarine
warfare, or from the airgun arrays used during a seismic
survey of the substrate beneath the seafloor by the
petroleum industry. These activities can generate noise
levels in excess of 253 dB (re 1 APa at 1 m) (Engas et al.,
1996), and are comparable to the noise levels generated by a
seafloor volcanic eruption, which can produce a source level
of in excess of 255 dB (re 1 APa) (Northrup, 1974). Recentconcerns regarding the impact of these anthropogenic
logy, Part A 140 (2005) 89–100

J.M. Lovell et al. / Comparative Biochemistry and Physiology, Part A 140 (2005) 89–10090
sounds on fish and other marine animals has prompted a
number of investigations into the effects of intense noise
exposure on the hearing systems of marine mammals (e.g.,
Costa et al., 2003; Richardson et al., 1995; Whitlow et al.,
1997). Additionally, several studies of the behaviour of free
living fish when exposed to intense noise have been
conducted (see Dalen and Knutsen, 1987; Engas et al.,
1996; Pearson et al., 1992; Pickett et al., 1994), and includes
the examination of log books from fishing vessels operating
within 5 km of a concurrent seismic survey (Lokkeborg and
Soldal, 1993).
It is known that several crustacean species produce
sound; for example, the pistol shrimp (Alpheus spp.)
produces a loud click by rapid closure of a specially
adapted claw (Schmitz and Herberholz, 1998). The spiny
lobster (Palinurus vulgaris) and the rock lobster (Panulirus
longipes) make alarm sounds by drawing the base of the
antenna across scale like ridges below the eyestalks; Patek,
2001; Meyer-Rochow et al., 1982). Additionally, P. long-
ipes has been shown to take longer emerging from a hide,
when feeding was preceded by a white noise (Meyer-
Rochow et al., 1982). The female cricket (Gryllus bimacu-
latus) has the ability to localise and respond to male chirp
sounds (Hedwig and Poulet, 2004; Schildberger and Horner,
1988), using specially adapted acoustic receptors (tympa-
num), located in the forelegs below the knee (Huber and
Thorson, 1985). On hearing the chirp, a receptive female
will orientate itself toward the sound using a behavioural
response known as phonotaxis (Schildberger and Horner,
1988).
The ability of an organism to orientate itself in the 3-D
marine environment requires the presence of a suitable
gravity receptor. These receptors occur in many diverse
organisms throughout the marine environment, and include
cephalopod (Dilly et al., 1975; Bettencourt and Guerra,
2000), crustaceans (Prentiss, 1901; Schone, 1971; Rose and
Stokes, 1981; Patton and Gove, 1992) and fish (Popper and
Platt, 1983; Bretschneider et al., 2001). In crustaceans, the
statocyst is located either at the anterior end of the animal in
the basal segment of each antennule, or posteriorly within
the uropods, abdomen or telson (Farre, 1843; Cohen and
Dijkgraaf, 1961; Finley and Macmillan, 2000). It has been
well-established that the crustacean statocyst functions as an
equilibrium organ by initiating corrective movements to
maintain the animal’s position in the water column, (Cohen
and Dijkgraaf, 1961; Sekiguchi and Terazawa, 1997; Finley
and Macmillan, 2000; Popper et al., 2001).
In this work, we study the electrophysiological response
of the statocyst in an underwater sound field, using the
Auditory Brainstem Response (ABR) recording technique
originally developed for use in clinical neurophysiology.
Until now, this method of acquiring hearing ability has only
been applied in the auditory assessments of vertebrates
(Corwin et al., 1982), though the presence of afferents in the
statocyst, and existence of a neural pathway terminating in
the supraesophageal ganglion, indicates that the physiology
of Palaemon serratus is suitable for an ABR type
investigation. An ABR waveform is acquired by averaging
conglomerate responses of peak potentials, arising from
nuclei in the auditory pathway during acoustic stimulation
(Corwin et al., 1982; Overbeck and Church, 1992). The
sweep records the generation of neural waveforms over a
user-defined time span termed the sweep velocity, and
measures activity prior to, during and after stimulation of
the receptor organ. Additional waveform generation by
neural activities other than those associated with hearing,
combined with muscular movements, ensure that recordings
have to be repeated over 1000–2000 presentations before
clear results can be obtained (Kenyon et al., 1998; Yan et al.,
2000). The recorded waveforms resulting from each sweep
are averaged together and produce a recognisable ABR
waveform, which is then overlaid on the first run, to show
that the evoked potentials are repeatable.
The nerves associated with the statocyst and the pathway
taken to the neuropil of the antennule in the supraesophageal
ganglion was examined to provide a detailed description of
how acoustic signals are perceived and transmitted by the
neuronal pathways. The aim of the present paper, therefore,
is to examine the morphology of the statocyst receptor array
of the prawn (P. serratus) using both scanning and trans-
mission electron microscopy (SEM and TEM). Measure-
ments of the electrophysiological response of the statocyst
and Central Nervous System (CNS) to acoustic stimuli were
also made, and by ablation, it was demonstrated that the
evoked response was generated in the statocyst organ.
2. Materials and methods
One hundred specimens of the prawn (P. serratus)
Phylum Crustacea and Class Eumalacostraca of mixed
sex, and ranging in length from 27 mm (0.1 g) to 71 mm
(1.9 g) were obtained from wild stock in the South West of
England using a dip net. Once captured, the prawns were
transferred to a marine tank divided by a fine mesh screen
into four equal sized compartments of 50 L each. An Eheim
type 2013 biological filter with a flow rate of 390 L/h
maintained water quality and provided aeration by spraying
filtered seawater back into the tank via the filter outlet pipe
located 60 mm above the water surface. The ambient noise
within the holding tank was measured using a hydrophone,
and the sound pressure level was calculated to be 102 dB (re
1 APa), with the Eheim pump active. In all of the
experiments, and in the holding tank, the ambient water
was kept at a temperature of 18 8C and a salinity of 34 psu.
When not under experimental protocols, the prawns were
provided with 14 h of light per day from a fluorescent tube
controlled by a mains timer switch. Prior to any exper-
imentation the prawns were divided by size into three
populations, and fed on a granulated feed at a daily rate of 6
g for the large prawns, 4 g for the medium and 2.5 g for the
small.

J.M. Lovell et al. / Comparative Biochemistry and Physiology, Part A 140 (2005) 89–100 91
2.1. Preparation methodology for general dissection and
electron microscopy
The pathway taken by the innervating nerves of the
statocyst to the supraesophageal ganglion or brain was
revealed by the anatomical investigation of a 54-mm P.
serratus. The prawnwas first immersed in 70% ethanol for 18
h, to bfixQ the specimen prior to the investigation. Exposure of
the brain and statocyst was achieved by the dissection and
removal of the dorsal–rostral section of carapace, the dorsal
cuticle layer of the peduncle, the left eye and the stomach.
Specimens of P. serratus selected for EM examination
were denied access to materials that could be used as otoliths,
primarily by having no substrate present in the tank. Addi-
tionally, uneaten feed and other waste products were removed
by ensuring that the return flow of water to the filtration
systemwas strongest at the base of the tank. Particulatematter
was drawn by the flow of water through a 5-mm gap under
each of the tank divisions, through which the prawns could
not pass. The denial treatment was applied to all 100 of the
prawns, with the exception of Fig. 4 which was prepared for
EM examination within 48 h of capture. Moulting was
induced in the remaining specimens over a 24-h period using
a method that involved not changing the ambient tank water
for 7 days, followed by a sudden change of all the water.
The statocyst capsules were removed by dissection from
12 of the specimens, and placed in a conical dish containing
2.5 mL of 0.9% sodium chloride. The capsules were opened
by making a lateral incision around the statocyst chamber
using a fine scalpel. Needlepoint tweezers were used to lift
the upper section of the capsule, thus exposing the sand
granules and ultrastructure. The sodium chloride solutionwas
removed using a pipette and replaced with a solution of 2.5%
S-Carboxymethyl-l-Cysteine in sodium chloride, which was
used to hydrolyse the mucus surrounding the statocyst
receptors. The contents of the dish were gently agitated for
2 min, after which the solution was removed and replaced
with chilled fixative (2.5% glutaraldehyde in 0.1 M cacody-
late buffer with 3.5% sodium chloride). The statocyst
capsules were then dehydrated through a graded ethanol
series ranging from 35% through 50%, 70% and 90% to
absolute ethanol, prior to desiccation using the critical point
drying method described by Platt (1977). Fully desiccated
statocyst capsules were subsequently mounted on a specimen
stub using a carbon tab, and coated with c. 8 nm of gold in an
Emitech K 550 sputter coater (working at approximately
5�10�6 torr). Finally, the processed specimens were inves-
tigated and photographed using a JEOL JSM 5600 scanning
electron microscope operated at 15 kV, and a 15-mmworking
distance. Images of the ultrastructure were captured using the
JEOL software, which saved the micrographs in a bitmap
format. All measurements were carried out on a PC using the
analySISR (Soft Imaging System) program. The hair cell
dimensions were measured using polygon length, and
measurements were recorded in micrometers (Am). Measure-
ments of hair cell dimensions (height, width, etc.) are
averages taken from at least 12 observations of a feature
within a similarly orientated cluster of cells, with the
exception of those in Fig. 4 which were taken from five
observations.
2.2. ABR methodology
In order to concisely answer the question of hearing by
crustaceans, 12 prawns were stimulated with sound ranging
in the frequency domain between 100 and 3000Hz, presented
at sound pressure levels from 132 dB (re 1 APa at 1 m) to
below 90 dB (re 1 APa at 1 m). The response of the prawn to
acoustic stimulation was measured using a well-established
audiometry technique, with the results expressed as an
audiogram or limen of sound spectral sensitivity. The ABR
measurements of hearing threshold were made using a
proprietary control and analysis programme, written in a
LabView 7 environment. This programme both generated the
stimulus signals and captured and analysed the response, and
was installed onto the PC shown in Fig. 1a. The stimulus used
was a sine train (sine wave pulse) which was presented to P.
serratus at a given frequency and sound pressure level, not
exceeding 130 dB (re 1 APa at 1m) for each of the frequencies
tested. For ABR recordings to be clear, it requires that short
duration tone bursts are used, especially for the low
frequencies. Kenyon et al. (1998) used a two-cycle burst
for frequencies between 100 and 300 Hz, a five-cycle burst
with a two-cycle attack decay for frequencies between 400
and 3000 Hz. Amplification of the sound was achieved using
a Pioneer type SA-420 amplifier and a 200-mm Eagle L032
loudspeaker with a frequency response range of 40–18,000
Hz. Additionally, the loudspeaker was placed inside a
Faraday cage and connected to a centralised earth point
located in an adjacent room where the PC, amplification and
analysis equipment was set up. Connecting wires were fed
through a 100-mm port in the partitioning wall.
The procedure used to acquire the acoustically evoked
potentials was approved by the United Kingdom Home
Office 11.03.03. The test subjects were placed into a flexible
cradle formed from a soft nylon mesh rectangle saturated
with seawater. Oxygenated water kept at a temperature of 18
8C was gravity fed at an adjustable flow rate of 3 mL/s and
directed toward the gills. The water was held in an aerated
reservoir positioned in an adjacent room, and fed to the
prawn through a 4-mm-diameter plastic tube. The prawn
was first placed lengthwise and centrally on an 80�60 mm
rectangle of fine nylon netting, which was wrapped firmly
around the cephalothorax and pleon, and the two sides of the
net were held together using the clip shown in Fig. 1b.
The clip was placed in a retort stand clamp fitted with ball
joint electrode manipulator arms, and the aerated water pipe
(detailed in Fig. 1b). During the procedure to position the
electrodes detailed in Fig. 2, the specimen and clamp were
suspended over a plastic tray, and aerated water was
supplied to the prawn. A retort stand and the experimental
tank (L 450 mm�W 300 mm�D 200 mm) were placed on a

Fig. 1. (a) Schematic of the ABR audiometry system, and (b) the clamp used to hold the prawn in position, and manipulate the electrodes during the
audiological tests.
J.M. Lovell et al. / Comparative Biochemistry and Physiology, Part A 140 (2005) 89–10092
table with vibration inhibiting properties, located in an
underground anechoic chamber L 3 m�W 2 m�H 2 m.
Working under a MEIJI binocular microscope, two small
holes were made in the cuticle layer using a lancet,
penetrating the carapace to a maximum depth of 0.3 mm.
The reference electrode was located behind the supra-orbital
spine, close to the neuropil of the antennule, and the record
electrode was located in the peduncle close to the statocyst,
at the junction between the lateral antennular and otic ganglia.
The clamp assembly with the specimen and sited electrodes
were then suspended from the retort stand positioned over
the experimental tank, and the prawn stationed 5 mm below
the surface of the water. After the hearing assessment, the
prawns were relocated to a holding tank for observation,
prior to being returned to the divided aquarium.
The electrophysiological response of the prawn to
acoustic stimulation was recorded using the two sub-
cutaneous electrodes (Fig. 2), which were connected to the
MS6 preamplifier by 1 m lengths of screened coaxial cable
with an external diameter of 1.5 mm. The outer insulating
layer of the coax was removed 15 mm from the end where
the electrode tip was to be fixed, and the screening layer
removed 10 mm from the cable end. The inner insulating
material was then trimmed by 2 mm, and the exposed inner
wire (0.5 mm diameter) was tinned with silver solder and
joined to a 10-mm-long silver wire (0.25 mm diameter),
Fig. 2. Schematic of the electrodes used to record the evoked potentials.
tapered to a fine point. The assemblage was pushed through a
100-mm glass pipette with an internal diameter of 4 mm,
until 0.4 mm of the gold wire was exposed. The remaining
space inside the pipette was filled with a clear epoxy resin,
and then trimmed to expose 0.3 mm of silver tip through
which the AEP could be conducted. The impedance of the
electrodes, both between the outer shielding and inner core,
and the silver tip and MS 6, were tested using an M 205
precision digital multimeter. The impedance between the tip
and pre-amplifier was found to be 0.2 V for both electrodes,
and an open circuit was recorded between the outer shielding
and inner core. The evoked response was amplified and
digitised to 12 bits resolution and recorded. This process was
repeated 2000 times and the response averaged to remove
electrical interference caused by neural activities other than
audition, and the myogenic noise generated by muscular
activity. Each measurement was repeated twice; this aids in
separating the evoked response, which is the same from trace
to trace, from the myogenic noise, which varies in two
successive measurements. After the averaging process, the
evoked potential could be detected, following the stimulus
by a short latency period of 5 ms or so. The latency is
accounted for by the time it takes the sound in air to travel the
1 m to the prawn, plus 1–2 ms response latency.
2.3. The sound field
The properties of the sound field are especially relevant
when comparing the audio capabilities of both pressure-
sensitive and motion-sensitive fish in the near field. In a
small laboratory set-up, the complexities associated with
independently measuring sound pressure and particle motion
are compounded by the reflectivity of the tank sides and
base. For this reason, a number of experiments have used air-
mounted transducers to successfully generate sounds under-

J.M. Lovell et al. / Comparative Biochemistry and Physiology, Part A 140 (2005) 89–100 93
water (e.g., Fay and Popper, 1975; Yan et al., 2000;
Akamatsu et al., 2002). The principal advantage of such a
system is that as the sound source is located at a distance of 1
m from the air/water interface, the moving part of the
transducer does not contact the water and generates near-
field displacements. In this situation, the pressure and motion
of the water adjacent to the fish ear can be considered as
being equal (Hawkins, 1981). The stimulus tones presented
from the loudspeaker to the prawn were calibrated using an
insertion calibration. A calibrated Bruel and Kjaer Type 8106
Hydrophone (Serial Number 2256725) was placed in the
tank and positioned adjacent to the shrimp cephalothorax
region. The signal from the hydrophone was amplified using
a PE6 preamplifier and digitised using a National Instru-
ments DAQ-6062e interface card at a sample rate of 300 kS/
s. In case of non-proportionality of the response of the
loudspeaker, measurements of the sound pressure were taken
for each amplitude and frequency setting used. Conse-
quently, a total of 110 individual calibration measurements
were taken in the calibration process. These calibrated levels
were then applied to the threshold defined by ABR
measurement to provide calibrated audiograms with pressure
levels traceable to International Standards.
2.4. Ablation
Specimens of P. serratus selected for the ablation
procedure were first tested for an electrophysiological
response to a 500-Hz sound presented at 110 dB (re 1 APaat 1 m). Removal of the statocyst was achieved by making a
circular cut in the cuticle layer above the chamber, and
withdrawing the capsule using needle point tweezers (a
procedure that took a few seconds). A sham operation was
Fig. 3. (a) Dorsal view of the supraesophageal ganglion and lateral antennular and
removed). fbr.o. peripheral otic nerve fibres, gc. commissural ganglion, gla. later
ganglion, go. otic ganglion, lu. lumen of the statocyst, pa.r,l. peduncle of the rig
dissected from P. serratus. gs. supraesophageal ganglion, gla. lateral antennular g
Rostral direction.
also performed, and the prawns were retested 1 h after
cutting around the chamber, prior to removal of the
statocyst. The prawns were then placed into an empty
compartment of the holding tank and allowed to recover for
24 h, prior to being retested on the electrophysiology
apparatus. The post ablation recovery period was included
to give the prawn’s time to settle after the procedure, as the
metabolic state of the organism can have a detrimental affect
on the evoked potential (Corwin et al., 1982).
3. Results
3.1. Innervation of the statocyst
In decapod crustaceans, the lateral antenular and otic
nerves extend with bi-lateral symmetry from the neuropil of
the antennule; a region located centrally in the brain
(Prentiss, 1901), to the statocyst and tactile bristles of the
antennules. The brain of P. serratus lies close to the rostral
extremities of the carapace, ventral to the eyestalks and
posterior to the antennules. On leaving the anterior region of
the brain (detailed in Fig. 3a and b), the lateral antennular
(gla.) and otic ganglia (go.) project forward, and enter the
antennule close to the inside edge of the peduncle. From
there, the otic ganglia branches outward away from the main
antennular nerve, which continues to project forward to the
tactile receptors.
3.2. Scanning electron microscopy
The examination of the complete statocyst (prior to
removal of the sand granules) revealed ultrastructural cell
otic ganglia from P. serratus (with the statocyst capsules and optic neuropil
al antennular ganglion, na. neuropil of the antennule, gs. supraesophageal
ht and left antennule. (b) Dorsal view of the brain and major nerve ganglia
anglion, go. otic ganglion, on. optic nerve, gc. commissural ganglion. Ro.
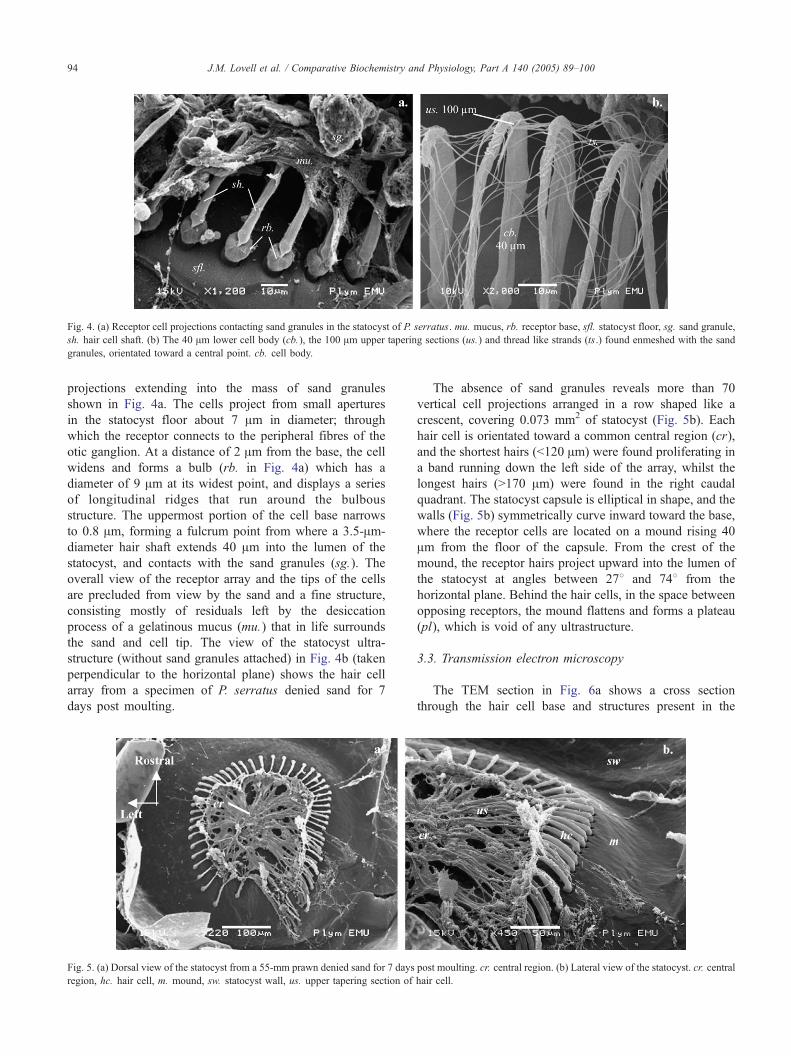
Fig. 4. (a) Receptor cell projections contacting sand granules in the statocyst of P. serratus. mu. mucus, rb. receptor base, sfl. statocyst floor, sg. sand granule,
sh. hair cell shaft. (b) The 40 Am lower cell body (cb.), the 100 Am upper tapering sections (us.) and thread like strands (ts.) found enmeshed with the sand
granules, orientated toward a central point. cb. cell body.
J.M. Lovell et al. / Comparative Biochemistry and Physiology, Part A 140 (2005) 89–10094
projections extending into the mass of sand granules
shown in Fig. 4a. The cells project from small apertures
in the statocyst floor about 7 Am in diameter; through
which the receptor connects to the peripheral fibres of the
otic ganglion. At a distance of 2 Am from the base, the cell
widens and forms a bulb (rb. in Fig. 4a) which has a
diameter of 9 Am at its widest point, and displays a series
of longitudinal ridges that run around the bulbous
structure. The uppermost portion of the cell base narrows
to 0.8 Am, forming a fulcrum point from where a 3.5-Am-
diameter hair shaft extends 40 Am into the lumen of the
statocyst, and contacts with the sand granules (sg.). The
overall view of the receptor array and the tips of the cells
are precluded from view by the sand and a fine structure,
consisting mostly of residuals left by the desiccation
process of a gelatinous mucus (mu.) that in life surrounds
the sand and cell tip. The view of the statocyst ultra-
structure (without sand granules attached) in Fig. 4b (taken
perpendicular to the horizontal plane) shows the hair cell
array from a specimen of P. serratus denied sand for 7
days post moulting.
Fig. 5. (a) Dorsal view of the statocyst from a 55-mm prawn denied sand for 7 days
region, hc. hair cell, m. mound, sw. statocyst wall, us. upper tapering section of
The absence of sand granules reveals more than 70
vertical cell projections arranged in a row shaped like a
crescent, covering 0.073 mm2 of statocyst (Fig. 5b). Each
hair cell is orientated toward a common central region (cr),
and the shortest hairs (b120 Am) were found proliferating in
a band running down the left side of the array, whilst the
longest hairs (N170 Am) were found in the right caudal
quadrant. The statocyst capsule is elliptical in shape, and the
walls (Fig. 5b) symmetrically curve inward toward the base,
where the receptor cells are located on a mound rising 40
Am from the floor of the capsule. From the crest of the
mound, the receptor hairs project upward into the lumen of
the statocyst at angles between 278 and 748 from the
horizontal plane. Behind the hair cells, in the space between
opposing receptors, the mound flattens and forms a plateau
(pl), which is void of any ultrastructure.
3.3. Transmission electron microscopy
The TEM section in Fig. 6a shows a cross section
through the hair cell base and structures present in the
post moulting. cr. central region. (b) Lateral view of the statocyst. cr. central
hair cell.

Fig. 6. (a) TEM micrograph of the hair cell base from the statocyst of P. serratus, fs. fibrous strands, cl. cuticle layer, cno. cuticular notch, n. nuclei, pnf.
peripheral nerve fibre, sv. synaptic vesicles. (b) Saccular hair cell and innervating nerve fibres from the ear of D. labrax (from Lovell et al., in preparation), cb.
cell body, cp. cuticular plate, k. kinocilia, n. nucleus, pnf. peripheral nerve fibres, s. stereocilia. (c) SEM micrograph of the statocyst hair cell from P. serratus,
cb. cell base ts. tapering section. (d) SEM micrograph of the ciliary bundles projecting from the epithelial surface of D. labrax (From Lovell et al., in
preparation), k. kinocilia, s. stereocilia. Bars=5 Am.
Fig. 7. (a) TEM section through the cell base from P. serratus, showing the cell nucleus (n.), and the beginning of the angled cell tip (ct.), and vesicles (v.)
which appear to be associated with the fibrous strands (hatched area). (b) Fibrous strands (fs.) of the cell root, and the synaptic vesicles (sv.) located in the
peripheral nerve bed.
J.M. Lovell et al. / Comparative Biochemistry and Physiology, Part A 140 (2005) 89–100 95

Fig. 8. Audiogram for P. serratus, determined visually from the sequential
ABR waveform data, and by calculating the RMS of threshold SPL values
of the stimulus sounds, presented at 100, 300, 500 750, 1000, 1500, 2000
and 3000 Hz tone bursts.
Fig. 9. ABR waveforms from P. serratus in response to a 500-Hz tone burst
attenuated in 2-dB steps. Averaged traces of two runs (2000 sweeps each),
for each intensity are overlaid and arranged sequentially. Bar=1 Av.
J.M. Lovell et al. / Comparative Biochemistry and Physiology, Part A 140 (2005) 89–10096
peripheral nerve bed, from the statocyst of P. serratus.
Fig. 6b shows a cross section through a hair cell from
the saccule of the European sea bass (Dicentrarchus
labrax), which has been included in this section along
with the SEM of the hair cell (Fig. 6d) for comparative
purposes. The two hatched lines drawn on the prawn hair
cell SEM micrograph presented in Fig. 6c shows the
locations from where the statocyst TEM sections in Fig.
6a was taken.
The brootQ of the statocyst hair cell is buttressed by
supporting cells with large nuclei (n.), and fibrous strands
(fs.) resembling actin filaments, which can be seen extending
into the peripheral nerve bed through the cuticular plate. The
filaments may help anchor the hair cell into position, and
work in conjunction with a small notch in the cuticle layer
(cno.) containing part of the lower cell body. The filament
strands terminate 15 Am below the cuticle layer, in a region
containing rounded structures less than 0.75 Am in diameter,
which are thought to be the synaptic vesicles between the hair
cell and the peripheral otic nerve fibres (pnf.). Close
examination of the TEM section through the statocyst hair
cell body (Fig. 7a) reveals that it contains a single nucleus (n.)
positioned at the top of the cell. The hatched line in the basal
region of the cell marks the perimeter of two vesicles, which
appear to be associated with the fibres in the cell root. Fig. 7b
shows the fibrous strands as they terminate in the synaptic
vesicles (sv.) located 15 Am below the cell base.
3.4. Electrophysiological response to auditory stimuli
In order to concisely answer the question of hearing by
crustaceans, 12 prawns of mixed sex were stimulated with
sound ranging in the frequency domain between 100 and
3000 Hz, presented at sound pressure levels from 130 dB
(re 1 APa at 1 m) to below 90 dB (re 1 APa at 1 m). The
ABR recording technique has been successfully applied in
the auditory assessments of both mammalian and non-
mammalian vertebrates. An ABR waveform is acquired by
averaging conglomerate responses of peak potentials,
arising from nuclei in the auditory pathway during acoustic
stimulation. The AEPs presented in Fig. 7 were recorded
using the Medelec MS 6 biological amplifier with
subcutaneous electrodes positioned using a jointed clamp
assembly, and the prawn held in place using a fine mesh
nylon cradle. The reference electrode was located in
proximity to the neuropil of the antennule, and the record
electrode located at the junction between the lateral
antennular and otic ganglia. The acoustically evoked
neural waveforms presented in Fig. 7, were recorded from
P. serratus in response to tone bursts ranging in frequency
from 500 to 3000 Hz, and averaged over 2000 stimulus
presentations (100 and 300 Hz have not been included for
scaling reasons). The waveforms show a series of peaks
contiguous with the stimulus sound.
3.4.1. Threshold determination
Threshold responses from twelve 50–55 mm (medium)
prawns were determined visually from the sequentially
arranged waveforms for each frequency tested, in accord-
ance with Kenyon et al. (1998). Fig. 6 shows ABR
waveforms evoked from P. serratus in response to a 500-
Hz tone burst, presented initially at between 120 and 132 dB
(re 1 APa at 1 m), and attenuated in steps of 4 dB (re 1 APa at1 m) ordinarily, and 2 dB (re 1 APa at 1 m) as the hearing
threshold was approached. When two replicates of wave-
forms showed opposite polarities (see 110 dB traces in Fig.
6), the response was considered as being below threshold
(cf. Kenyon et al., 1998).

Fig. 10. ABR waveforms in response to a 500-Hz sound presented 10 dB (re 1 APa at 1 m) above threshold. Run Awas recorded prior to the sham operation,
and run B was recorded 1 h after cutting the cuticle layer covering the statocyst capsule as a sham operation. Y axis scale=Av�100.
J.M. Lovell et al. / Comparative Biochemistry and Physiology, Part A 140 (2005) 89–100 97
3.4.2. Audiogram for P. serratus
The audiogram shown in Fig. 8 was produced using
sequential ABR waveform threshold data, acquired from
frequencies of 100–3000 Hz, presented in steps between
Fig. 11. Evoked potentials from P. serratus to a 500-Hz tone presented 10 dB abo
with the statocyst present, after cutting round the cuticle layer; whilst c and d were
replaced between each run). Y axis scale=Av�100.
200 and 500 Hz. The hearing thresholds of 12 mixed-sex P.
serratus was measured, and follows a ramp like profile,
determined by calculating the lowest intensity stimulus
sounds (recorded underwater using the hydrophone located
ve threshold and averaged over 2000 sweeps. Runs a and b were recorded
recorded 24 h after removal of the organ (the electrodes were removed and
J.M. Lovell et al. / Comparative Biochemistry and Physiology, Part A 140 (2005) 89–10098
adjacent to the antennule) that evoked a repeatable ABR
response (112 dB in Fig. 9). The profile follows a steady
downward gradient to 100 Hz (the lowest frequency tested),
and indicates that the bbestQ frequency in terms of threshold
could be below this frequency.
3.5. Ablation
Removal of the statocyst was achieved by making a
circular cut in the cuticle layer above the chamber, and
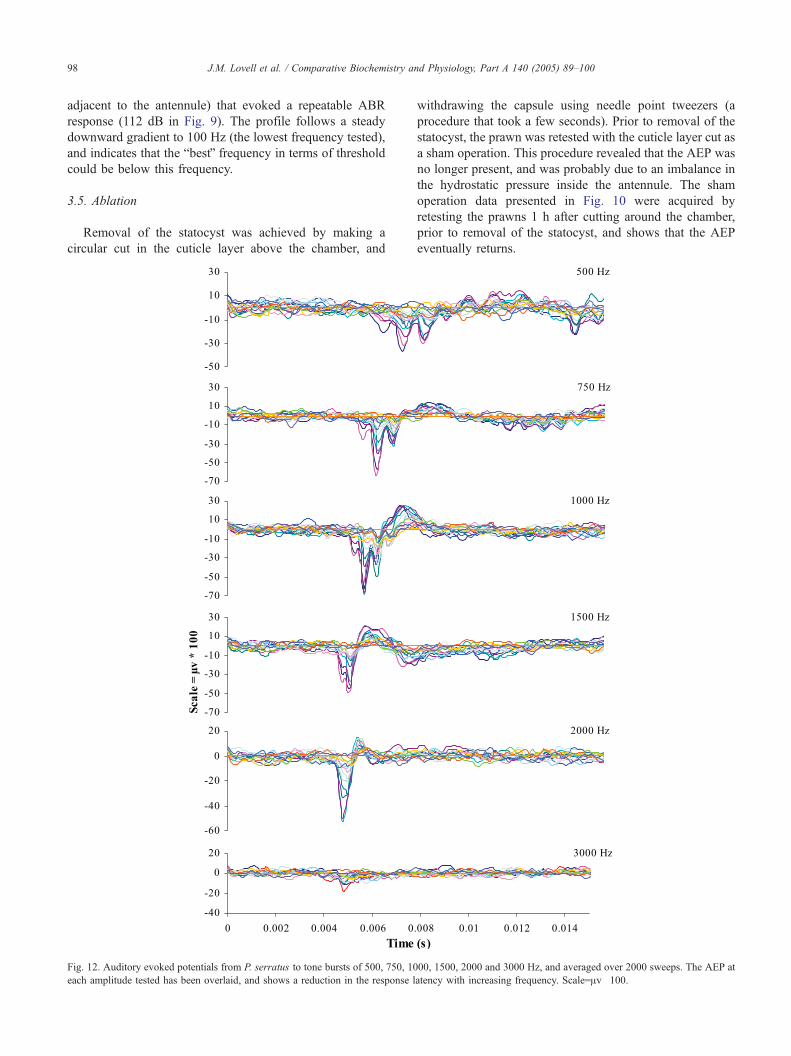
Fig. 12. Auditory evoked potentials from P. serratus to tone bursts of 500, 750, 10
each amplitude tested has been overlaid, and shows a reduction in the response l
withdrawing the capsule using needle point tweezers (a
procedure that took a few seconds). Prior to removal of the
statocyst, the prawn was retested with the cuticle layer cut as
a sham operation. This procedure revealed that the AEP was
no longer present, and was probably due to an imbalance in
the hydrostatic pressure inside the antennule. The sham
operation data presented in Fig. 10 were acquired by
retesting the prawns 1 h after cutting around the chamber,
prior to removal of the statocyst, and shows that the AEP
eventually returns.
00, 1500, 2000 and 3000 Hz, and averaged over 2000 sweeps. The AEP at
atency with increasing frequency. Scale=Av�100.

J.M. Lovell et al. / Comparative Biochemistry and Physiology, Part A 140 (2005) 89–100 99
On removal of the statocyst, the prawns were placed in the
empty fourth compartment of the holding tank, and allowed
to recover for 24 h, prior to being retested on the electro-
physiology apparatus. The post ablation recovery period was
included to give the prawn’s time to settle after the procedure,
as the metabolic state of the organism can have a detrimental
affect on the evoked potential (Corwin et al., 1982). Addi-
tionally, the recovery period was included to allow for the
equalisation of the hydrostatic pressure within the antennule.
The evoked potentials shown in Fig. 11 were recorded from a
45-mm prawn, in response to a 300-Hz tone, presented at an
intensity 10 dB above threshold. The first two runs (A and B,
with two replicates of each run) were acquired from the prawn
prior to the ablation procedure, and the subsequent two runs
(C and D, with two replicates of each run) were recorded 24 h
later. The electrodes were removed and replaced between
each run, to confirm that the response was consistently
repeatable, and to ensure that the absent responses in runs C
and D was due to the ablation experiment, and not an
extraneous factor associated with electrode placement.
Fig. 13. Schematic of the statocyst receptor array and nerve pathway to the
supraesophageal ganglion from P. serratus.
4. Discussion
The hearing ability of the prawn (P. serratus) has been
clearly demonstrated by this work using ABR audiometry,
and offers conclusive evidence of low-frequency sound
detection of frequencies ranging from 100 to 3000 Hz by an
invertebrate from the sub-phylum crustacea. For hearing in
the strictest sense to be attributed to an organism, the
physiological response sound should be initiated by a
specialised receptor mechanism (Myrberg, 1981), shown
by this work to be generated in the statocyst. Current
literature states that this organ is purely responsive to
angular rotations and strong vibrations propagated directly
through a solid medium, and is not responsive to sounds
propagated in either air or water (Cohen and Dijkgraaf,
1961). It is highly probable that Cohen and Dijkgraaf did
not find evidence of hearing due to masking of the AEP by
neural activities other than audition; and from myogenic
noise generated by muscular activity. To produce clear
waveforms of an auditory response, it is recommended that
AEP recordings be averaged for at least 1000–2000 stimulus
presentations (Kenyon et al., 1998; Yan et al., 2000). The
amplitude and shape of the electrophysiological response
from P. serratus shown in Figs. 9 and 12 bear a remarkable
similarity to AEPs generated by fish and higher vertebrates
(see Corwin et al., 1982; Kenyon et al., 1998; Yan, 2002).
The two statocyst organs found in P. serratus lie adjacent
to one another with medial symmetry, in the basal peduncle
segment of the antennule. As can be seen in Figs. 4 and 5a,
the statocyst is innervated by the otic ganglion, which
emanates from a bed of peripheral nerve fibres lying under
the mound directly beneath the receptor array (see Fig. 6a).
The otic nerve terminates in the neuropil of the antennule,
which is located in the ventral/anterior region of the brain.
The dissection of the 54-mm prawn in Fig. 3a shows that the
total length of the neuronal pathway taken by the otic nerve,
from the centre of the statocyst organ to the centre of the
supraesophageal ganglion, is approximately 600 Am. How-
ever, the direct distance between the neuropil and the
peripheral nerve fibres located below the statocyst, was
found to be 500 Am. This is due to the curved pathway taken
by the otic nerve, which first projects forward with the
lateral antennular ganglion along the inside edge of the
peduncle for 300 Am. From here, the otic ganglion branches
away from the antennular ganglion at angles approaching
458 either side of the midline, from where it extends for a
further 300 Am to the centre of the peripheral otic nerve bed.
The schematic in Fig. 13 summarises the physiological
work and shows the hair cells and the sand granule otoliths,
along with the pathway taken by the otic ganglion, to the
neuropil of the antennule and supraesophageal ganglion.
It is clear by the evidence presented in this work that the
perception of sound in the frequency domain by P. serratus
is similar in range to hearing in generalist fish, which is
capable of both hearing and responding to sounds within a
frequency bandwidth of 30 Hz to around 2000 Hz
(Bretschneider et al., 2001), and is reliant on the phase
variance between the three otolithic organs and the
surrounding flesh to stimulate the sensory hairs of the inner
ear (Lu, 2004). The audiogram presented in Fig. 8 follows a
similar ramp like profile to those obtained from the cichlid
A. ocellatus, which is considered to detect a best frequency
of 100 Hz (Kenyon et al., 1998); however, lower frequen-
cies were not tested. We therefore conclude that at least one
species from the invertebrate sub-phylum of crustacea, is
sensitive to the motion of water particles displaced by low-
frequency sounds ranging from 100 Hz up to 3000 Hz.
Although a number of physiological and behavioural
experiments have been conducted on fish to assess the
impact of noise on the auditory system none have, so far,

J.M. Lovell et al. / Comparative Biochemistry and Physiology, Part A 140 (2005) 89–100100
been directed toward the crustaceans, a major link in the
oceanic food chain. The long-term effects of intense low-
frequency sounds on the shrimp hearing ability and ecology
is not known, but the data presented here shows that there is
a need to include crustaceans in such an assessment, in order
to gain a more insightful perspective of the effect of intense
noise in the marine ecosystem.
Acknowledgements
The authors would like to thank John Langworthy for the
development of the ABR software, and Glen Harper of the
Plymouth EMU for his invaluable help with the TEM
sectioning.
References
Akamatsu, T., Okumura, T., Novarini, N., Yan, H.Y., 2002. Empirical
refinements applicable to the recording of fish sounds in small tanks. J.
Acoust. Soc. Am. 112, 3073–3082.
Bettencourt, V., Guerra, A., 2000. Growth increments and biomineralization
process in cephalopod statoliths. J. Exp. Mar. Bio. Eco. 248, 191–205.
Bretschneider, F., van den Berg, A.V., Peters, R.C., 2001. In: Kapoor, B.G.,
Hara, T.J. (Eds.), Sensory Biology of Jawed Fishes. Science Publishers,
Enfield, NH, USA. ISBN: 1-57808-099-1.
Cohen, M.J., Dijkgraaf, S., 1961. In: Waterman, T.H. (Ed.), The Physiology
of Crustacea, vol. II. Academic Press, New York, pp. 65–108.
Corwin, J.T., Bullock, T.H., Schweitzer, J., 1982. The auditory brainstem
response in 5 vertebrate classes. Electroencephalogr. Clin. Neurophysiol.
54, 629–641.
Costa, D.P., Crocker, D.E., Gedamke, J., Webb, P.M., Houser, D.S.,
Blackwell, S.B., Waples, D., Hayes, S.A., Le Boeuf, B.J., 2003. The
effect of a low-frequency sound source (acoustic thermometry of the
ocean climate) on the diving behavior of juvenile northern elephant
seals, Mirounga angustirostris. J. Acoust. Soc. Am. 113, 1155–1165.
Dalen, J., Knutsen, G.M., 1987. Scaring effects on fish and harmful effects on
eggs, larvae and fry by offshore seismic exploration. In: Merklinger,
H.M. (Ed.), Progress in Underwater Acoustics. Plenum Publishing Corp,
pp. 93–102.
Dilly, P.N., Stevens, P.R., Young, J.Z., 1975. Receptors in the statocysts of
squid. J. Physiol. 249, 59–61.
Eng3s, A., Lbkkeborg, S., Ona, E., Soldal, A.V., 1996. Effects of seismic
shooting on local abundance and catch rates of cod (Gadus morhua)
and haddock (Melanogrammus aeglefinus). Can. J. Fish Aquat. Sci. 53,
2238–2249.
Farre, A., 1843. On the organ of hearing in crustacean. Philos. Trans. 133,
233–242.
Fay, R.R., Popper, A.N., 1975. Modes of stimulation of the teleost ear. J.
Exp. Biol. 62, 370–387.
Finley, L., Macmillan, D., 2000. The structure and growth of the statocyst
in the Australian crayfish Cherax destructor. Biol. Bull. 199, 251–256.
Hawkins, A.D., 1981. The hearing abilities of fish. In: Tavolga, W.N.,
Popper, A.N., Fay, R.R. (Eds.), Hearing and Sound Communication in
Fishes. Springer, Berlin.
Hedwig, B., Poulet, J.F.A., 2004. Complex auditory behaviour emerges
from simple reactive steering. Nature 430, 781–785.
Huber, F., Thorson, J., 1985. Cricket auditory communication. Sci. Am.
253, 60–68.
Kenyon, T.N., Ladich, F., Yan, H.Y., 1998. A comparative study of hearing
ability in fishes: the auditory brainstem response approach. J. Comp.
Physiol., A Sens. Neural Behav. Physiol. 182, 307–318.
Lokkeborg, S., Soldal, A.V., 1993. The influence of seismic exploration
with airguns on cod (Gadus morhua) behaviour and catch rates. ICES
Mar. Sci. Symp. 196, 62–67.
Lu, Z., 2004. Neural mechanisms of hearing in fish. In: von der Emde, G.,
Mogdans, J., Kapoor, B.G. (Eds.), The Senses of Fishes: Adaptations
for the Reception of Natural Stimuli. Narosa Publishing House, New
Delhi, India.
Meyer-Rochow, V.B., Penrose, J.D., Oldfield, B.P., Baily, W.J., 1982.
Phonoreception in the rock lobster Panulirus longipes. Behav. Neural
Biol. 34, 331–336.
Myrberg, A.A., 1981. Sound communication and interception in fishes. In:
Tovolga, W.N., Popper, A.N., Fay, R.R. (Eds.), Hearing and Sound
Communication in Fishes. Springer, Berlin.
Northrup, J., 1974. Detection of low-frequency underwater sounds from a
submarine volcano in the western Pacific. J. Acoust. Soc. Am. 56,
837–841.
Overbeck, G.W., Church, M.W., 1992. Effects of tone burst frequency and
intensity on the auditory brainstem response (ABR) from albino and
pigmented rats. Hear. Res. 59, 129–137.
Patek, S.N., 2001. Spiny lobsters stick and slip to make sound. Nature
411, 153.
Patton, M.L., Gove, R.F., 1992. The response of statocyst receptors of the
lobster Homarus americanus to movements of statolith hairs. Comp.
Biochem. Physiol., A 101, 249–257.
Pearson, W.H., Skalski, J.R., Malme, C.I., 1992. Effects of sounds from a
geophysical survey device on behavior of captive rockfish (Sebastes
spp). Can. J. Fish Aquat. Sci. 49, 1343–1356.
Pickett, G., Eaton, D., Seaby, R., Arnold, G., 1994. Results of Bass Tagging
in Poole Bay During 1992. MAFF Laboratory Leaflet, vol. 74.
Lowestoft.
Pilgrim, D.A., Lovell, J.M., 2002. A review of current publications dealing
with the impact of low frequency sounds upon fish. Report to Devon
Sea Fishing Association.
Platt, C., 1977. Hair cell distribution and orientation in goldfish otolith
organs. J. Comp. Neurol. 172, 283.
Popper, A.N., Platt, C., 1983. Sensory surface of the saccule and lagena in
the ears of ostariophysan fishes. J. Morphol. 176, 121–129.
Popper, A.N., Salmon, M., Horch, K.W., 2001. Acoustic detection and
communication by decapod crustaceans. J. Comp. Physiol. 187, 83–89.
Prentiss, C.W., 1901. The otocyst of decapod crustacea: its structure,
development and functions. Bull. Comp. Zoo 7, 167–251.
Richardson, W.J., Greene Jr., C.R., Malme, C.I., Thomson, D.H., 1995.
Marine Mammals and Noise. Academic Press, San Diego, pp. 576.
Rose, R.D., Stokes, D.R., 1981. A crustacean statocyst with only
three hairs: light and scanning electron microscopy. J. Morph.
169, 21–28.
Schildberger, K., Hfrner, M., 1988. The function of auditory neurons in
cricket phonotaxis. J. Comp. Physiol., A Sens. Neural Behav. Physiol.
163, 621–631.
Schmitz, B., Herberholz, J., 1998. Snapping behaviour in intraspecific
agonistic encounters in the snapping shrimp (Alpheus heterochaelis).
J. Biosci. 23, 623–632.
Schfne, H., 1971. Gravity receptors and gravity orientation in crustacea. In:
Gordon, S.A., Cohen, M.J. (Eds.), Gravity and the Organism.
University of Chicago Press, Chicago, pp. 223–235.
Sekiguchi, H., Terazawa, T., 1997. Statocyst of Jasus edwardsii, pueruli
(crustacea, palinuridae), with a review of crustacean statocysts. Mar.
Freshw. Res. 48, 715–719.
Whitlow, W., Au, W., Nachtigall, P., Pawloski, J., 1997. Acoutic effects of
the ATOC signal (75 Hz, 195 dB) on dolphins and whales. J. Acoust.
Soc., 101.
Yan, H.Y., 2002. The use of acoustically evoked potentials for the study of
enhanced hearing in fishes. Bioacoustics 12, 325–328.
Yan, H.Y., Fine, M.L., Horn, N.S., Colon, W.E., 2000. Variability in the role
of the gasbladder in fish audition. J. Comp. Physiol., A Sens. Neural
Behav. Physiol. 186, 435–445.
Copyright © 2022 FDOKUMEN