Hearing Loss and Driving: Does Auditory Distraction Have a ...
332
Hearing Loss and Driving: Does Auditory Distraction Have a Disproportionate Effect on the Hearing Impaired? by Nicholas Charles Herbert Submitted in accordance with the requirements for the degree of Doctor of Philosophy The University of Leeds Institute for Transport Studies & School of Healthcare September 2015
-
Upload
khangminh22 -
Category
Documents
-
view
1 -
download
0
Transcript of Hearing Loss and Driving: Does Auditory Distraction Have a ...

Hearing Loss and Driving: Does AuditoryDistraction Have a Disproportionate Effect on the
Hearing Impaired?
by
Nicholas Charles Herbert
Submitted in accordance with the requirementsfor the degree of Doctor of Philosophy
The University of LeedsInstitute for Transport Studies & School of Healthcare
September 2015


The candidate confirms that the work submitted is his own and that appropriatecredit has been given where reference has been made to the work of others.
This copy has been supplied on the understanding that it is copyright material andthat no quotation from the thesis may be published without proper
acknowledgement
c© 2015 The University of Leeds and Nicholas Charles Herbert
The right of Nicholas Charles Herbert to be identified as Author of this work hasbeen asserted by him in accordance with the Copyright, Designs and Patents Act
1988.


Acknowledgements
This thesis has been a substantial undertaking and one which has been made possiblethrough the help and support of many. I’d like to take this opportunity to express myheartfelt thanks to those who have been particularly supportive and benevolent over thepast four years.
First and foremost, profound thanks to my supervisors Natasha Merat, Nick Thyerand Sarah Isherwood. Having your expertise, advice and encouragement behind me hasmade the completion of this thesis an enjoyable experience. You have been patient, helpfuland understanding, and your input has allowed for my development as an independentresearcher.
Thanks to all of my friends at the Institute for Transport Studies. In particular, thanksto you for all of your support Daz - neither one of us could count the amount of time youhave spent selflessly listening and reassuring.
Steve and Dini - it has been an absolute pleasure sharing this experience from thebeginning with you. I know that without your support (and the welcome ‘coffee breaks’)this would have been a much more difficult undertaking. Thanks for being there and formaking this such an enjoyable experience.
Thanks to my parents, who have been there for me not only during this PhD, butthroughout the nine years I have spent at the University of Leeds. I can’t express myappreciation for your support in a single paragraph, but you have provided the platformfor me to be able to pursue this PhD and stuck by me throughout. Without your help,input and support this quite simply would not have been possible.
And thanks finally to you Ananya - I am so very lucky to have had your encouragement,support and understanding whilst writing this thesis. You don’t know how importantyou’ve been in the latter stages of this undertaking, but I couldn’t have done it withoutyou.
To everybody that has helped, influenced and guided me during this process - thankyou. You have made this an undertaking which I will always look back on with fondmemories.
v


Abstract
Research showing differences between the driving outcomes of hearing impaired andnormally hearing individuals (such as raised road traffic accidents), proposes this hasoccurred due to two main reasons: (1) that sound present in the driving environment isinaudible for hearing impaired drivers, and (2) that audible sound is disproportionatelydistracting for the hearing impaired driver.
This thesis reports on a series of experiments which investigated the latter of theseproposals. A questionnaire study was used to explore driving patterns and experiencesof hearing impaired individuals. Empirical studies were also conducted to investigate theeffect of hearing loss on driving performance and visual attention, under auditory taskconditions.
Questionnaire responses suggested that hearing impaired individuals did not perceivehearing loss as problematic for driving performance. However, the self-reported hearingof respondents predicted reports of driving difficulty better than any other independentvariable. A laboratory-based study hinted that extra visual task performance decrementsas a result of auditory engagement occurred in hearing impaired individuals.
Since these findings were in older adults, the influence of factors co-existing withhearing loss (such as cognitive decline) were questioned. These confounds were removedby presenting an auditory task subject to simulated hearing loss in a dual-task drivingsimulator experiment; allowing for a young, normally hearing sample, and within-subjectsdesign. The resulting data showed no disproportionate effect of hearing loss on drivingperformance during the concurrent auditory task.
Accordingly, distortion to sound arising from hearing loss may not be entirely responsiblefor the disproportionate effects of auditory distraction in hearing impaired drivers. Otherfactors, co-existing with hearing loss, appear to act synergistically to cause problems.Future work should investigate further the aspects of hearing loss (and co-existing factors)responsible for changes in driving outcomes, by, for instance, using a group of young hearingimpaired participants.
vii


Contents
Acknowledgements v
Abstract vii
List of Figures xv
List of Tables xviii
Abbreviations xix
1 Introduction: The Effect of Hearing Loss on Driving 11.1 Introduction . . . . . . . . . . . . . . . . . . . . . . . . . . . . . . . . . . . . 1
1.1.1 Hearing loss and driving performance . . . . . . . . . . . . . . . . . 31.1.2 Hearing loss and driver licensing . . . . . . . . . . . . . . . . . . . . 51.1.3 The importance of driving for hearing impaired individuals . . . . . 71.1.4 Thesis focus . . . . . . . . . . . . . . . . . . . . . . . . . . . . . . . . 8
2 Literature Review 112.1 Introduction . . . . . . . . . . . . . . . . . . . . . . . . . . . . . . . . . . . . 112.2 A brief overview of hearing loss . . . . . . . . . . . . . . . . . . . . . . . . . 11
2.2.1 A brief overview of human hearing . . . . . . . . . . . . . . . . . . . 122.2.2 The measurement of hearing loss . . . . . . . . . . . . . . . . . . . . 152.2.3 The perceptual consequences of hearing loss . . . . . . . . . . . . . . 20
2.3 Current evidence regarding hearing loss and driving outcomes . . . . . . . . 262.3.1 The effect of hearing loss on road traffic accident rates . . . . . . . . 272.3.2 Driving cessation habits in hearing impaired individuals . . . . . . . 32
2.4 Reasons for altered driving trends in hearing impaired individuals . . . . . . 342.4.1 Missing driving-relevant auditory information . . . . . . . . . . . . . 352.4.2 A disproportionate distracting effect of acoustic information . . . . . 39
2.5 Summary of past research . . . . . . . . . . . . . . . . . . . . . . . . . . . . 572.6 Thesis aims . . . . . . . . . . . . . . . . . . . . . . . . . . . . . . . . . . . . 59
ix

x CONTENTS
3 Models of Human Task Performance and Listening Effort 633.1 Introduction . . . . . . . . . . . . . . . . . . . . . . . . . . . . . . . . . . . . 633.2 Human task performance . . . . . . . . . . . . . . . . . . . . . . . . . . . . 64
3.2.1 Theories of information processing . . . . . . . . . . . . . . . . . . . 643.3 Cognitive consequences of hearing loss . . . . . . . . . . . . . . . . . . . . . 73
3.3.1 The Ease of Language Understanding model . . . . . . . . . . . . . 753.4 The effect of age on auditory perception and task performance . . . . . . . 813.5 Summary . . . . . . . . . . . . . . . . . . . . . . . . . . . . . . . . . . . . . 85
4 Self-Reported Data On Driving Performance and Hearing Loss 874.1 Introduction and study aims . . . . . . . . . . . . . . . . . . . . . . . . . . . 874.2 Experimental hypotheses . . . . . . . . . . . . . . . . . . . . . . . . . . . . . 884.3 Method . . . . . . . . . . . . . . . . . . . . . . . . . . . . . . . . . . . . . . 89
4.3.1 Questionnaire creation . . . . . . . . . . . . . . . . . . . . . . . . . . 894.3.2 Procedure . . . . . . . . . . . . . . . . . . . . . . . . . . . . . . . . . 98
4.4 Results . . . . . . . . . . . . . . . . . . . . . . . . . . . . . . . . . . . . . . . 994.4.1 Demographics . . . . . . . . . . . . . . . . . . . . . . . . . . . . . . . 994.4.2 Driver Behaviour Questionnaire . . . . . . . . . . . . . . . . . . . . . 1024.4.3 Driving and Hearing Loss Questionnaire . . . . . . . . . . . . . . . . 109
4.5 Discussion . . . . . . . . . . . . . . . . . . . . . . . . . . . . . . . . . . . . . 1184.5.1 Driver Behaviour Questionnaire . . . . . . . . . . . . . . . . . . . . . 1184.5.2 Driving and Hearing Loss Questionnaire . . . . . . . . . . . . . . . . 1204.5.3 Study direction and limitations . . . . . . . . . . . . . . . . . . . . . 123
4.6 Conclusions . . . . . . . . . . . . . . . . . . . . . . . . . . . . . . . . . . . . 1254.7 Acknowledgements . . . . . . . . . . . . . . . . . . . . . . . . . . . . . . . . 126
5 The Effect of Hearing Impairment on the Useful Field of View TestPerformed Concurrently with an Auditory Task 1275.1 Introduction . . . . . . . . . . . . . . . . . . . . . . . . . . . . . . . . . . . . 127
5.1.1 The functional visual field . . . . . . . . . . . . . . . . . . . . . . . . 1285.1.2 The rationale for a computerised assessment of the useful field of view1295.1.3 Study aims and hypotheses . . . . . . . . . . . . . . . . . . . . . . . 134
5.2 Method . . . . . . . . . . . . . . . . . . . . . . . . . . . . . . . . . . . . . . 1355.2.1 Participants . . . . . . . . . . . . . . . . . . . . . . . . . . . . . . . . 1355.2.2 Materials . . . . . . . . . . . . . . . . . . . . . . . . . . . . . . . . . 1365.2.3 Procedure . . . . . . . . . . . . . . . . . . . . . . . . . . . . . . . . . 142
5.3 Results . . . . . . . . . . . . . . . . . . . . . . . . . . . . . . . . . . . . . . . 1435.3.1 Visual task . . . . . . . . . . . . . . . . . . . . . . . . . . . . . . . . 1435.3.2 Auditory task . . . . . . . . . . . . . . . . . . . . . . . . . . . . . . . 1455.3.3 Multivariate analysis . . . . . . . . . . . . . . . . . . . . . . . . . . . 1475.3.4 Cognitive tests . . . . . . . . . . . . . . . . . . . . . . . . . . . . . . 147

CONTENTS xi
5.4 Discussion . . . . . . . . . . . . . . . . . . . . . . . . . . . . . . . . . . . . . 1485.4.1 Visual task . . . . . . . . . . . . . . . . . . . . . . . . . . . . . . . . 1485.4.2 Auditory task . . . . . . . . . . . . . . . . . . . . . . . . . . . . . . . 1515.4.3 Cognitive tests . . . . . . . . . . . . . . . . . . . . . . . . . . . . . . 1515.4.4 Study limitations . . . . . . . . . . . . . . . . . . . . . . . . . . . . . 153
5.5 Conclusions . . . . . . . . . . . . . . . . . . . . . . . . . . . . . . . . . . . . 153
6 Hearing Loss Simulation: Explanation and Validation Studies 1556.1 Introduction . . . . . . . . . . . . . . . . . . . . . . . . . . . . . . . . . . . . 1556.2 Hearing loss simulation . . . . . . . . . . . . . . . . . . . . . . . . . . . . . . 156
6.2.1 Why use hearing loss simulation? . . . . . . . . . . . . . . . . . . . . 1566.2.2 Methods of simulating hearing loss . . . . . . . . . . . . . . . . . . . 158
6.3 The simulator chosen for use . . . . . . . . . . . . . . . . . . . . . . . . . . 1646.3.1 Overview . . . . . . . . . . . . . . . . . . . . . . . . . . . . . . . . . 1646.3.2 How the simulator functions . . . . . . . . . . . . . . . . . . . . . . . 164
6.4 Validation of the simulation . . . . . . . . . . . . . . . . . . . . . . . . . . . 1696.4.1 Objective analysis . . . . . . . . . . . . . . . . . . . . . . . . . . . . 1706.4.2 Subjective analysis . . . . . . . . . . . . . . . . . . . . . . . . . . . . 174
6.5 Conclusions . . . . . . . . . . . . . . . . . . . . . . . . . . . . . . . . . . . . 179
7 Analysing the Effect of Simulated Hearing Loss on Auditory MemoryTasks 1817.1 Introduction . . . . . . . . . . . . . . . . . . . . . . . . . . . . . . . . . . . . 1817.2 Study aims . . . . . . . . . . . . . . . . . . . . . . . . . . . . . . . . . . . . 1827.3 Experimental hypotheses . . . . . . . . . . . . . . . . . . . . . . . . . . . . . 1837.4 Experiment A . . . . . . . . . . . . . . . . . . . . . . . . . . . . . . . . . . . 183
7.4.1 Method . . . . . . . . . . . . . . . . . . . . . . . . . . . . . . . . . . 1847.4.2 Results . . . . . . . . . . . . . . . . . . . . . . . . . . . . . . . . . . 1917.4.3 Discussion . . . . . . . . . . . . . . . . . . . . . . . . . . . . . . . . . 194
7.5 Experiment B . . . . . . . . . . . . . . . . . . . . . . . . . . . . . . . . . . . 1967.5.1 Method . . . . . . . . . . . . . . . . . . . . . . . . . . . . . . . . . . 1967.5.2 Results . . . . . . . . . . . . . . . . . . . . . . . . . . . . . . . . . . 1997.5.3 Discussion . . . . . . . . . . . . . . . . . . . . . . . . . . . . . . . . . 204
7.6 Study direction and limitations . . . . . . . . . . . . . . . . . . . . . . . . . 2077.7 Conclusions . . . . . . . . . . . . . . . . . . . . . . . . . . . . . . . . . . . . 209
8 The Effect of Simulated Hearing Loss on the Performance of AurallyPresented Cognitive Tasks whilst Driving 2118.1 Introduction . . . . . . . . . . . . . . . . . . . . . . . . . . . . . . . . . . . . 211
8.1.1 The Detection Response Task . . . . . . . . . . . . . . . . . . . . . . 2138.2 Study aims and hypotheses . . . . . . . . . . . . . . . . . . . . . . . . . . . 217

xii CONTENTS
8.3 Method . . . . . . . . . . . . . . . . . . . . . . . . . . . . . . . . . . . . . . 2178.3.1 Participants . . . . . . . . . . . . . . . . . . . . . . . . . . . . . . . . 2178.3.2 Materials . . . . . . . . . . . . . . . . . . . . . . . . . . . . . . . . . 2188.3.3 Procedure . . . . . . . . . . . . . . . . . . . . . . . . . . . . . . . . . 2258.3.4 Derivation of dependent variables . . . . . . . . . . . . . . . . . . . . 2288.3.5 Statistical analysis . . . . . . . . . . . . . . . . . . . . . . . . . . . . 231
8.4 Results . . . . . . . . . . . . . . . . . . . . . . . . . . . . . . . . . . . . . . . 2328.4.1 Driving behaviour . . . . . . . . . . . . . . . . . . . . . . . . . . . . 2328.4.2 Eye tracking data . . . . . . . . . . . . . . . . . . . . . . . . . . . . 2358.4.3 Visual Detection Response Task . . . . . . . . . . . . . . . . . . . . 2388.4.4 Auditory tasks . . . . . . . . . . . . . . . . . . . . . . . . . . . . . . 2408.4.5 Summary . . . . . . . . . . . . . . . . . . . . . . . . . . . . . . . . . 241
8.5 Discussion . . . . . . . . . . . . . . . . . . . . . . . . . . . . . . . . . . . . . 2418.5.1 Driving performance measures . . . . . . . . . . . . . . . . . . . . . 2418.5.2 Eye movement behaviour . . . . . . . . . . . . . . . . . . . . . . . . 2458.5.3 Visual Detection Response Task performance . . . . . . . . . . . . . 2468.5.4 Auditory task performance . . . . . . . . . . . . . . . . . . . . . . . 2488.5.5 General considerations . . . . . . . . . . . . . . . . . . . . . . . . . . 2508.5.6 Study limitations . . . . . . . . . . . . . . . . . . . . . . . . . . . . . 251
8.6 Conclusions . . . . . . . . . . . . . . . . . . . . . . . . . . . . . . . . . . . . 252
9 Final Discussion 2559.1 Main findings . . . . . . . . . . . . . . . . . . . . . . . . . . . . . . . . . . . 2559.2 Real-world application . . . . . . . . . . . . . . . . . . . . . . . . . . . . . . 2609.3 Contribution to the field . . . . . . . . . . . . . . . . . . . . . . . . . . . . . 2629.4 Further research . . . . . . . . . . . . . . . . . . . . . . . . . . . . . . . . . 2649.5 Dissemination . . . . . . . . . . . . . . . . . . . . . . . . . . . . . . . . . . . 2669.6 Conclusion . . . . . . . . . . . . . . . . . . . . . . . . . . . . . . . . . . . . 266
Publications 269
References 271
Appendix 309

List of Figures
1.1 Countries in which deaf individuals cannot drive . . . . . . . . . . . . . . . 6
2.1 The anatomy of the human ear . . . . . . . . . . . . . . . . . . . . . . . . . 132.2 The physiology of the cochlea . . . . . . . . . . . . . . . . . . . . . . . . . . 142.3 The Organ of Corti . . . . . . . . . . . . . . . . . . . . . . . . . . . . . . . . 142.4 The propagation of sound through the cochlea . . . . . . . . . . . . . . . . 152.5 An example audiogram . . . . . . . . . . . . . . . . . . . . . . . . . . . . . . 162.6 Audiometric descriptors for hearing loss severity used in the United Kingdom 172.7 An example speech audiogram . . . . . . . . . . . . . . . . . . . . . . . . . 182.8 The Hearing Handicap Inventory for the Elderly . . . . . . . . . . . . . . . 192.9 An example of loudness recruitment . . . . . . . . . . . . . . . . . . . . . . 212.10 A psychophysical tuning curve . . . . . . . . . . . . . . . . . . . . . . . . . 232.11 Psychophysical tuning curves measured for a range of stimulus frequencies . 232.12 The shape of psychophisical tuning curves for different types of hearing loss 242.13 A photograph taken by Mary Evans entitled ‘deaf cyclist in the 1930’s’ . . . 362.14 A model of situation awareness and how it links to decision making . . . . . 372.15 How eye fixations are affected by the performance of an auditory task whilst
driving . . . . . . . . . . . . . . . . . . . . . . . . . . . . . . . . . . . . . . . 432.16 The results of a study performed by Hickson et al. (2010) . . . . . . . . . . 50
3.1 The Multiple Resources Model proposed by Wickens (2008) . . . . . . . . . 683.2 How the tasks used in Hickson et al. (2010) relate to the Multiple Resources
Theory (Wickens, 2008) . . . . . . . . . . . . . . . . . . . . . . . . . . . . . 703.3 How the tasks used in Thorslund et al. (2013b) relate to the multiple
resources model (Wickens, 2008) . . . . . . . . . . . . . . . . . . . . . . . . 703.4 The Working Memory model proposed by Baddeley (2000) . . . . . . . . . 723.5 How the Working Memory model (Baddeley, 2000) could be affected by
hearing loss . . . . . . . . . . . . . . . . . . . . . . . . . . . . . . . . . . . . 743.6 A generalized model for bottom-up and top-down processing of auditory input 763.7 A Working Memory system for ease of language understanding proposed by
Rönnberg et al. (2008) . . . . . . . . . . . . . . . . . . . . . . . . . . . . . . 77
xiii

xiv LIST OF FIGURES
3.8 A Working Memory system for ease of language understanding proposed byRönnberg et al. (2013) . . . . . . . . . . . . . . . . . . . . . . . . . . . . . . 81
3.9 The synergistic influence of age-related cognitive decline on driving performance 833.10 The operations required for successful recognition of a speech message . . . 83
4.1 A single item from the Driver Behaviour Questionnaire . . . . . . . . . . . . 914.2 An example question from the Driving and Hearing Loss Questionnaire . . 934.3 Recruitment data from individual National Health Service sites in Chapter 41004.4 Audiometric data for participants in Chapter 4 . . . . . . . . . . . . . . . . 1004.5 Hearing aid usage in the sample in Chapter 4 . . . . . . . . . . . . . . . . . 1024.6 A scree plot of the factor analysis performed in Chapter 4 . . . . . . . . . . 1034.7 Agreement as to whether hearing loss presents a problem for driving . . . . 1104.8 Agreement as to whether hearing loss increases listening effort . . . . . . . . 1114.9 Agreement as to whether hearing loss limits audibility whilst driving . . . . 1124.10 Agreement as to whether hearing loss prevents use of in-car electronic devices1124.11 Agreement as to whether hearing aids help with driving . . . . . . . . . . . 113
5.1 Depiction of a functional visual field reduction . . . . . . . . . . . . . . . . 1285.2 The progression of a single UFOV trial . . . . . . . . . . . . . . . . . . . . . 1305.3 The three subtests of the Useful Field of View test . . . . . . . . . . . . . . 1315.4 Results from the study of Wood et al. (2006) . . . . . . . . . . . . . . . . . 1335.5 Mean scores on the Useful Field of View in Chapter 5 . . . . . . . . . . . . 1435.6 Mean auditory task scores recorded in Chapter 5 . . . . . . . . . . . . . . . 1465.7 Reductions in auditory task scores from baseline in Chapter 5 . . . . . . . . 1465.8 Cognitive test scores recorded in Chapter 5 . . . . . . . . . . . . . . . . . . 147
6.1 Depiction of simulating hearing loss with a noise masker . . . . . . . . . . . 1596.2 Depiction of a ‘smeared’ or ‘smoothed’ frequency spectrum . . . . . . . . . 1606.3 An example of a loudness growth function . . . . . . . . . . . . . . . . . . . 1626.4 A flow diagram of the hearing loss simulation method used . . . . . . . . . 1656.5 The transfer functions used by the hearing loss simulation . . . . . . . . . . 1666.6 An example of how to calculate the excitation pattern of a sound on the
basilar membrane . . . . . . . . . . . . . . . . . . . . . . . . . . . . . . . . . 1676.7 Depiction of the envelope and temporal fine structure of sound . . . . . . . 1686.8 The loudness growth model used by the hearing loss simulation method . . 1716.9 White noise in the frequency domain . . . . . . . . . . . . . . . . . . . . . . 1726.10 Frequency spectra resulting from white noise being run through different
levels of hearing loss simulation . . . . . . . . . . . . . . . . . . . . . . . . . 1736.11 Typical speech audiogram shapes . . . . . . . . . . . . . . . . . . . . . . . . 1746.12 Typical speech audiogram results using sentences as stimuli . . . . . . . . . 1756.13 The three audiograms used to simulate hearing loss for speech testing purposes176

LIST OF FIGURES xv
6.14 The calibration procedure for speech testing using simulated hearing lossstimuli . . . . . . . . . . . . . . . . . . . . . . . . . . . . . . . . . . . . . . . 177
6.15 Speech test results obtained in Chapter 6 . . . . . . . . . . . . . . . . . . . 178
7.1 Percentage correct scores and response times recorded in experiment one ofChapter 7 . . . . . . . . . . . . . . . . . . . . . . . . . . . . . . . . . . . . . 191
7.2 Self-reported difficulties of auditory tasks in experiment one of Chapter 7 . 1937.3 Hearing threshold range of individuals aged 48–92 years based on Cruick-
shanks et al. (1998) . . . . . . . . . . . . . . . . . . . . . . . . . . . . . . . . 1977.4 Percentage correct scores and response times recorded in experiment two of
Chapter 7 . . . . . . . . . . . . . . . . . . . . . . . . . . . . . . . . . . . . . 1997.5 Self-reported difficulties of auditory tasks in experiment two of Chapter 7 . 203
8.1 Detection response task apparatus . . . . . . . . . . . . . . . . . . . . . . . 2148.2 The presentation paradigm of the Detection Response Task . . . . . . . . . 2158.3 The setup of the Peripheral Detection Task . . . . . . . . . . . . . . . . . . 2158.4 Outside view of The University of Leeds Driving Simulator . . . . . . . . . 2198.5 Inside view of The University of Leeds Driving Simulator . . . . . . . . . . 2198.6 A flow diagram of the University of Leeds Driving Simulator computer network2208.7 A diagram of the experimental drive used in Chapter 8 . . . . . . . . . . . . 2218.8 Screenshots of the driving scene used in Chapter 8 . . . . . . . . . . . . . . 2218.9 The two hearing loss conditions used in Chapter 8 . . . . . . . . . . . . . . 2248.10 A participant driving The University of Leeds Driving Simulator . . . . . . 2248.11 The lead vehicle used in Chapter 8 . . . . . . . . . . . . . . . . . . . . . . . 2278.12 The experimental conditions in Chapter 8 . . . . . . . . . . . . . . . . . . . 2288.13 Depiction of the data recording epoch in Chapter 8 . . . . . . . . . . . . . . 2298.14 A depiction of the 2 x 2 x 2 x 2 ANOVA used to investigate the effect of
different auditory tasks in Chapter 8 . . . . . . . . . . . . . . . . . . . . . . 2318.15 A depiction of the two separate ANOVAs used to investigate the effect of
different listening conditions in Chapter 8 . . . . . . . . . . . . . . . . . . . 2328.16 Standard deviation of lane positions recorded in Chapter 8 . . . . . . . . . 2348.17 Percent Road Centres recorded in Chapter 8 . . . . . . . . . . . . . . . . . . 2368.18 Gaze concentrations recorded in Chapter 8 . . . . . . . . . . . . . . . . . . 2378.19 Hit rate data recorded in Chapter 8 . . . . . . . . . . . . . . . . . . . . . . 2388.20 Auditory task accuracy recorded in Chapter 8 . . . . . . . . . . . . . . . . . 2408.21 Auditory task adherence recorded in Chapter 8 . . . . . . . . . . . . . . . . 241
9.1 A preliminary schematic explaining how hearing loss might affect drivingperformance . . . . . . . . . . . . . . . . . . . . . . . . . . . . . . . . . . . . 264


List of Tables
2.1 Risk factors of driving performance outcomes for those with hearing loss . . 302.2 Risk factors of driving cessation for those with hearing loss . . . . . . . . . 342.3 A summary of the outcomes of Thorslund et al. (2013b) . . . . . . . . . . . 532.4 Research questions and their corresponding studies . . . . . . . . . . . . . . 62
4.1 Demographics of the sample in Chapter 4 compared against Parker et al.(2000) . . . . . . . . . . . . . . . . . . . . . . . . . . . . . . . . . . . . . . . 101
4.2 Hearing loss severities of the sample in Chapter 4 . . . . . . . . . . . . . . . 1014.3 Factor structure derived in Chapter 4 . . . . . . . . . . . . . . . . . . . . . 1044.4 Scores on the Driving Behaviour Questionnaire in Chapter 4 compared
against Parker et al. (2000) . . . . . . . . . . . . . . . . . . . . . . . . . . . 1054.5 Variables submitted to the logistic ordinal regression performed in Chapter 41064.6 Significant associations of variables with questionnaire items regarding
violations in Chapter 4 . . . . . . . . . . . . . . . . . . . . . . . . . . . . . . 1074.7 Significant associations of variables with questionnaire items regarding
concentration lapses in Chapter 4 . . . . . . . . . . . . . . . . . . . . . . . . 1084.8 Driving avoidance reported by the sample in Chapter 4 . . . . . . . . . . . 1104.9 Significant associations of variables with items regarding general information
and listening effort in Chapter 4 . . . . . . . . . . . . . . . . . . . . . . . . 1144.10 Significant associations of variables with questionnaire items regarding
inaudible sound in Chapter 4 . . . . . . . . . . . . . . . . . . . . . . . . . . 1154.11 Significant associations of variables with questionnaire items regarding in-car
technology and hearing aids in Chapter 4 . . . . . . . . . . . . . . . . . . . 116
5.1 Demographic information for the sample in Chapter 5 . . . . . . . . . . . . 1365.2 A discussion of auditory task types that could be used in Chapter 5 . . . . 1385.3 Analysis of whether auditory tasks meet the criteria set out in Chapter 5 . 1405.4 Statistical analyses for Useful Field of View scores across subtests in Chapter 51445.5 Statistical analyses for Useful Field of View scores across experimental
groups in Chapter 5 . . . . . . . . . . . . . . . . . . . . . . . . . . . . . . . 1445.6 Statistical analyses for auditory task scores across subtests in Chapter 5 . . 146
xvii

xviii LIST OF TABLES
6.1 Issues associated with using actual sensory impairment in studies investigat-ing the effect of hearing loss on driving performance . . . . . . . . . . . . . 157
6.2 The broadening factors for the lower and upper limits of auditory filtersapplied by the hearing loss simulation for different degrees of impairment. . 167
6.3 Specification of a hearing loss condition in the study of Moore and Glasberg(1993) and the power by which they expected the envelope to be raised byin each auditory channel. . . . . . . . . . . . . . . . . . . . . . . . . . . . . 169
6.4 The approximate gradient of the averaged speech test curves for each hearingloss condition. . . . . . . . . . . . . . . . . . . . . . . . . . . . . . . . . . . . 179
7.1 Example auditory task types which have been used in past driver safetyexperiments . . . . . . . . . . . . . . . . . . . . . . . . . . . . . . . . . . . . 185
7.2 Statistical analyses for differences in accuracy between auditory tasks inexperiment one of Chapter 7 . . . . . . . . . . . . . . . . . . . . . . . . . . 192
7.3 Statistical analyses for differences in response time between auditory tasksin experiment one of Chapter 7 . . . . . . . . . . . . . . . . . . . . . . . . . 192
7.4 Statistical analyses for differences in NASA-TLX scores between auditorytasks in experiment one of Chapter 7 . . . . . . . . . . . . . . . . . . . . . . 193
7.5 Statistical analyses for differences in self-reported difficulty between auditorytasks in experiment one of Chapter 7 . . . . . . . . . . . . . . . . . . . . . . 193
7.6 Difficulty hierarchy for auditory tasks in experiment one of Chapter 7 . . . 1947.7 Difficulty hierarchy for auditory tasks in experiment two of Chapter 7 . . . 2007.8 Statistical analyses of the effect of simulated hearing loss on differences in
accuracy and response times in experiment two of Chapter 7 . . . . . . . . 2007.9 Statistical analyses of differences between simulated moderate hearing loss
and normal hearing for accuracy and response times in experiment two ofChapter 7 . . . . . . . . . . . . . . . . . . . . . . . . . . . . . . . . . . . . . 201
7.10 Statistical analyses of the effect of simulated hearing loss on differences inself-reported difficulties in experiment two of Chapter 7 . . . . . . . . . . . 203
8.1 Hypothesised changes to measures of driving behaviour as a result of auditorydistraction . . . . . . . . . . . . . . . . . . . . . . . . . . . . . . . . . . . . . 218
8.2 A summary of the significant main effects and interactions in Chapter 8 . . 242

Abbreviations
aCMT Auditory Continuous Memory Task.
DBQ Driver Behaviour Questionnaire.
dCMT Digit Continuous Memory Task.
DHLQ Driving and Hearing Loss Questionnaire.
DRT Detection Response Task.
DSP Digital Signal Processing.
ELU Ease of Language Understanding Model.
HASTE The Human Machine Interface And the Safety of Traffic in Europe Project.
HFC High Frequency Component of Steering Angle.
HHIA Hearing Handicap Inventory for Adults.
HHIE Hearing Handicap Inventory for the Elderly.
HHIE-S Hearing Handicap Inventory for the Elderly (screening version).
IHCs Inner Hair Cells.
KIPS Clinical Information Processing System.
LED Light Emitting Diode.
MMSE Mini Mental State Exam.
MRT Multiple Resources Theory.
NASA-TLX National Aeronautics and Space Administration Task Load Index.
NHS National Health Service.
xix

xx ABBREVIATIONS
OHCs Outer Hair Cells.
PASAT Paced Auditory Serial Addition Task.
PDT Peripheral Detection Task.
PRC Percent Road Centre.
PTA Pure Tone Audiometry.
PTC Psychophysical Tuning Curve.
RMS Root-Mean Squared.
RTAs Road Traffic Accidents.
SCP Stimulus Cycle Period.
SDLP Standard Deviation of Lane Position.
SimHL Simulated Hearing Loss.
SNHL Sensorineural Hearing Loss.
SRT Speech Reception Threshold.
SSW Staggered Spondaic Word test.
tCMT Tone Continuous Memory Task.
TTLC Time to Line Crossing.
UFOV A computerised assessment of the useful field of view.
UoLDS University of Leeds Driving Simulator.
vDRT Visual Detection Response Task.
Chapter 1
Introduction: The Effect ofHearing Loss on Driving
1.1 Introduction
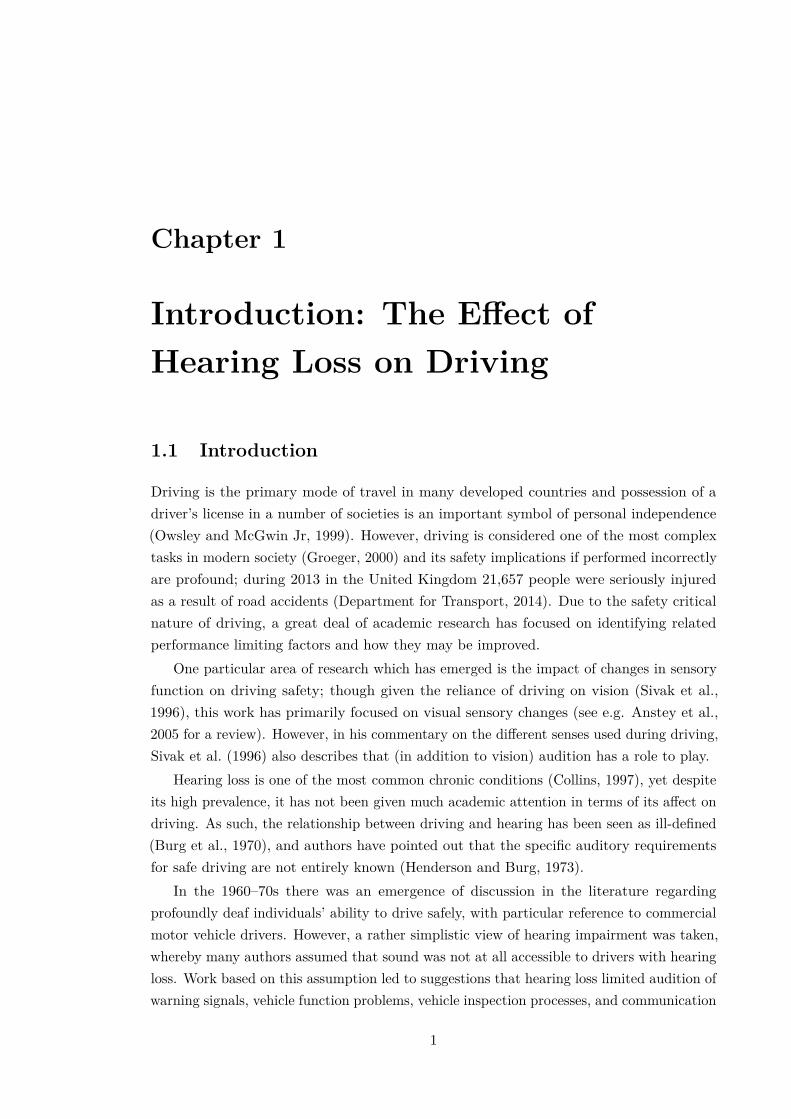
Driving is the primary mode of travel in many developed countries and possession of adriver’s license in a number of societies is an important symbol of personal independence(Owsley and McGwin Jr, 1999). However, driving is considered one of the most complextasks in modern society (Groeger, 2000) and its safety implications if performed incorrectlyare profound; during 2013 in the United Kingdom 21,657 people were seriously injuredas a result of road accidents (Department for Transport, 2014). Due to the safety criticalnature of driving, a great deal of academic research has focused on identifying relatedperformance limiting factors and how they may be improved.
One particular area of research which has emerged is the impact of changes in sensoryfunction on driving safety; though given the reliance of driving on vision (Sivak et al.,1996), this work has primarily focused on visual sensory changes (see e.g. Anstey et al.,2005 for a review). However, in his commentary on the different senses used during driving,Sivak et al. (1996) also describes that (in addition to vision) audition has a role to play.
Hearing loss is one of the most common chronic conditions (Collins, 1997), yet despiteits high prevalence, it has not been given much academic attention in terms of its affect ondriving. As such, the relationship between driving and hearing has been seen as ill-defined(Burg et al., 1970), and authors have pointed out that the specific auditory requirementsfor safe driving are not entirely known (Henderson and Burg, 1973).
In the 1960–70s there was an emergence of discussion in the literature regardingprofoundly deaf individuals’ ability to drive safely, with particular reference to commercialmotor vehicle drivers. However, a rather simplistic view of hearing impairment was taken,whereby many authors assumed that sound was not at all accessible to drivers with hearingloss. Work based on this assumption led to suggestions that hearing loss limited audition ofwarning signals, vehicle function problems, vehicle inspection processes, and communication
1

2 CHAPTER 1. INTRODUCTION
with other road users (Wagner, 1962; Henderson and Burg, 1973, 1974).
Since the debate of this topic in the 1960–70’s there has not been a concerted effort toempirically investigate the driving habits or ability of the hearing impaired demographic.Indeed, Songer (1993) carried out a risk assessment of hearing disorders for driving abilityon behalf of the US Department of Transportation Federal Highway Administration. Hisreview of the existing literature referenced one unpublished study which had investigatedroad traffic accident risk in hearing impaired individuals since 1974; some 19 years earlier.
All of the work cited by Songer (1993) related to profoundly deaf individuals. Whilst itis important that driving behaviour in this group of individuals is studied, the exclusiveinvestigation of driving performance in this demographic group prior to 1993 meant theneglect of those who had a hearing loss, but were not profoundly deaf. Indeed, Burget al. (1970, p. 289) pointed out that “deafness is not an all or none phenomenon” andthat “there are degrees of hearing impairment”, leading him to the conclusion that “manyvariables are involved in evaluating the driving capability of the hard of hearing”.
After the publication of the report by Songer (1993), however, results of studies into the effect of partial hearing loss (rather than profound deafness) on driving began tobe published, although these were far from exhaustive. Furthermore, the methodologiesadopted usually incorporated a wide range of age-related conditions as explanatory variablesfor driving outcomes. Thus they were not aimed explicitly at investigating the effect ofhearing impairment (McCloskey et al., 1994; Ivers et al., 1999; Sims et al., 2000; Gilhotraet al., 2001; Unsworth et al., 2007; Green et al., 2013). This has made it difficult to isolatethe exact influence of hearing impairment on driving performance and outcomes. However,some research has recently been carried out which explicitly investigates hearing loss as afactor for driving performance (Hickson et al., 2010; Thorslund et al., 2013a,b,c, 2014).
The publications arising in the 1960–70s were not in agreement on whether deafnesshad a negative effect on driving. Some studies found an increase in road traffic accidentlikelihood (Coppin and Peck, 1963, 1965), whereas others found a decrease (Finesilver, 1962;Wagner, 1962; Ysander, 1966; Roydhouse, 1967; Schein, 1968). More recent work on thosewith partial hearing impairments has exhibited the same disagreement between studies,with some showing no effect of hearing loss (McCloskey et al., 1994; Sims et al., 2000; Greenet al., 2013), but others showing an increased risk of road traffic accident (Barreto et al.,1997; Ivers et al., 1999; Picard et al., 2008). This disagreement in the literature, twinnedwith the general lack of investigation in this area has led to disjointed legislation regardingthe acceptability of driving in the deaf and hearing impaired demographics around theworld. The studies which have been performed in this area and their findings, an overviewof current legislation, and the importance of driving for hearing impaired individuals isprovided in the next section.

CHAPTER 1. INTRODUCTION 3
1.1.1 Hearing loss and driving performance
In the examination of the effect of deafness on driving, much of the historic evidencedraws on observations of individual cases. For example, Songer (1993) cites authors whopublished in the magazine The Deaf American, providing case studies of deaf drivers whohad not had an accident history over long periods of time. Observations on larger sampleswho had been involved in road traffic accidents were also carried out, and results suggestedthat only a very small proportion of those experiencing an accident were deaf (McFarlandand Moore, 1955; Finesilver, 1962; Norman, 1962; Grattan and Jeffcoate, 1968). Thissuggested that deafness did not have a significant bearing on driving performance.
Early case-control studies also found no effect of deafness on driving (Finesilver, 1962;Wagner, 1962; Ysander, 1966; Roydhouse, 1967; Schein, 1968). In fact, the results ofhis study led Wagner (1962) to conclude that “Deaf-Mutes are the safest motorists onPennsylvania’s highway system”. However, interspersed with these findings, other case-control research was showing that deafness was associated with a higher accident risk(Coppin and Peck, 1963, 1965).
Coppin and Peck (1963) produced a report for the California Department of MotorVehicles and, using a case-control methodology, found that profoundly deaf drivers differedfrom those with normal hearing across a number of variables: (1) the deaf had moreaccidents and violations on their driving records, (2) the deaf drove a greater number ofmiles per year, (3) the distribution of deaf drivers among occupational categories differedfrom that of the non-deaf, and (4) the deaf and normally hearing drivers differed withrespect to the shape of their age distributions. However, because cases and controls werenot adequately matched on variables such as annual mileage, occupation or age it couldnot be inferred that the finding of an increased number of accidents in the deaf samplewas as a direct result of sensory loss. In fact, it is a fair criticism of the majority of thisearly work studying the driving outcomes of deaf individuals that annual mileage was notcontrolled (Songer, 1993).
Coppin and Peck (1965) later addressed the limitations of their previous study (Coppinand Peck, 1963) in a new observational study and controlled for the previously omittedvariables, and showed that deaf males had a significantly higher number of road trafficaccidents than normally hearing drivers (Coppin and Peck, 1965). The results are curious,and the authors themselves questioned why gender should interact with hearing impairment.Their conclusion was that deaf males may spend more time driving in situations wherehearing is important, such as during rush hour or in heavy traffic. However, this was in noway suggested by their data, which did not investigate the types of roads driven by deafindividuals.
The work carried out in the 1960–70s is now approximately 50 years old, and focusednot on hearing impairment, as does this thesis, but on profound deafness. However, thework investigating the effect of hearing impairment on driving performance has found asimilar trend of disagreement. Case-control methodologies have been used in order to

4 CHAPTER 1. INTRODUCTION
establish the influence of partial hearing loss on various measures of driving safety (e.g.road traffic accident risk, speeding citations). Whilst some suggest a higher risk of roadtraffic accidents in the hearing impaired demographic (Barreto et al., 1997; Ivers et al.,1999; Picard et al., 2008), others exhibit no such association (McCloskey et al., 1994; Simset al., 2000; Green et al., 2013).
Other authors have used similar case-control designs, showing that hearing impairmentmay encourage people to cease driving, or alter their driving habits (Gilhotra et al., 2001;Unsworth et al., 2007). A recent questionnaire study has also highlighted some differencesin transportation habits between hearing impaired and normally hearing individuals(Thorslund et al., 2013c).
More detailed research carried out during on-road and simulated environments hasshown that hearing loss significantly alters driving behaviour whilst under dual-taskconditions: hearing impaired individuals appear more distracted by concurrent tasksperformed whilst driving (Hickson et al., 2010), tend to drive slower than their hearingcounterparts (Thorslund et al., 2013b), have altered eye movement behaviour (Thorslundet al., 2014), and are less inclined to engage in secondary tasks whilst driving (Thorslundet al., 2013b).
These findings have been explained in terms of an ‘effortfulness hypothesis’ (Rabbitt,1991); whereby hearing impaired individuals have to use more cognitive resources in theprocessing of auditory information than their normally hearing counterparts, thus leavingfewer available for the completion of other tasks. Accordingly, tasks performed whilstprocessing auditory information will experience greater performance decrements. Variouseffects of auditory task engagement on driving have been shown in normally hearingindividuals (Jamson and Merat, 2005; Engström et al., 2005b; Victor et al., 2008), andHickson et al. (2010) hypothesise that these effects will be magnified for hearing impaireddrivers, given that extra cognitive resources will be required for the processing of theauditory task.
However, alterations in eye movement behaviour and travelling speed in the hearingimpaired demographic have also been replicated in an on-road study not using a dual-taskmethodology, suggesting that an adaptation to driving style may be, at least in part,responsible (Thorslund et al., 2013a).
Though noteworthy, the above studies involve a number of methodological limitations.Amongst these are the use of self-reported hearing loss as a method of classifying hearingimpaired individuals (McCloskey et al., 1994; Ivers et al., 1999; Gilhotra et al., 2001;Unsworth et al., 2007; Green et al., 2013), limited sample diversity (Barreto et al., 1997;Picard et al., 2008), and uncertainty regarding how well matched the experimental groupswere (Hickson et al., 2010). Accordingly, whilst the possibility of negative effects ofhearing loss on aspects of driving are suggested by this work, the results derived cannot beconsidered entirely conclusive.
A more detailed discussion of each individual study cited is given in Chapter 2, where

CHAPTER 1. INTRODUCTION 5
limitations will be discussed in greater depth, and the results of each study will be reviewedto give an overview of the current state of knowledge in this area. These studies allcontribute to the wider picture on the effect of hearing loss on driving, and show a muchmore complex situation than simply a distinction between profoundly deaf drivers, andthose who can hear, as was inferred by earlier work performed during the 1960–70s.
In this regard, a key consideration is that the consequences of partial hearing impairmentmay be very different to profound deafness for driving performance (see Chapter 2).Profound deafness means a complete loss of audibility (e.g. hearing warning signals),whereas hearing impairment presents a partial loss of audibility, giving rise to issues whichmay occur as a result of sound which is audible (e.g. distraction as a result of speaking ona mobile phone). It is important to consider, for example, that improved visual perceptionin the deaf demographic might actually lead to an increased awareness whilst driving(Bavelier et al., 2000; Bosworth and Dobkins, 2002; Bavelier et al., 2006). Furthermore,considerations regarding driving performance may not only be governed by the magnitudeof hearing loss, but may also be intertwined with other co-existing factors given the ageprofile of the hearing impaired demographic (Davis, 1995).
It is also important that other factors are considered, such as how hearing impairedindividuals might alter their driving behaviour in order to counteract any negative effectson their driving performance; a suggestion which Burg et al. made as early as 1970. Forexample, one research group (Thorslund et al., 2013a,b, 2014) have argued that theyobserved adaptive driving behaviour by which hearing impaired individuals nullified thenegative consequences of hearing loss on driving performance. Whether or not this approachto driving is successful is unclear, though the studies which have found an increased accidentrate in the hearing impaired demographic would tend to suggest not (Barreto et al., 1997;Ivers et al., 1999; Picard et al., 2008).
The heterogeneous nature of the methodologies and outcomes of past research in thisarea has made it difficult to infer whether hearing loss does have an effect on drivingperformance. This has lead to disjointed policy decisions which are summarised in thefollowing section.
1.1.2 Hearing loss and driver licensing
As a result of the uncertainty over whether hearing loss has an effect on driving performance,the licensing of hearing impaired drivers is entrenched in debate, some of which continuestoday. In the 1920’s deaf individuals were banned from driving in a number of U.S.states, a piece of legislation which was met angrily by the deaf community (Burch, 2004).Subsequent action from the National Association of the Deaf, supported by accidentstatistics and reasoned arguments, was highly successful in overturning all bans (Tabak,2006). Nevertheless, there is some evidence that deaf drivers are still discriminated againsttoday. For example, in the United States of America a case was successfully broughtagainst the United Parcel Service in 2007 for discriminating against hearing impaired

6 CHAPTER 1. INTRODUCTION
individuals by not allowing them to be employed as drivers (Bates vs. United Parcel Serv.,Inc., 04-17295). Furthermore, as recently as 2010 there was legislation in place in Jamaicarequiring deaf individuals to install special systems in their cars to alert them to externalvehicular sounds. These two examples highlight that some view deafness as a barrier forsafe driving, despite a lack of empirical support for this assumption.
Current licensing regulations worldwide appear to be somewhat varied. For instance,in a number of developing countries profoundly deaf individuals are not allowed to drive.In a report for the World Federation of the Deaf and Swedish National Association of theDeaf, Haualand and Allen (2009) surveyed 93 countries regarding their stance on deafdrivers. Although not all of the countries responded, 31 indicated that they did not allowprofoundly deaf individuals to obtain a driving license (see Figure 1.1 for locations). Insome of these cases, there was no written legislation in place, but responses from respectivecountries indicated that suitable infrastructure was not in place for deaf people to beable to drive and/or authorities saw deaf drivers as dangerous and prevented them frompracticing this behaviour.
Figure 1.1 Countries in which deaf individuals are prevented from obtaining a drivinglicense (shown in red). N.B. These are the countries known to ban deaf people from driving,there may be others. Source: World Federation of the Deaf and the Swedish NationalAssociation of the Deaf (2008).
There appear to be no such prohibitions in place in the developed world. In the UnitedKingdom, people with a hearing loss are not currently required to report their sensoryimpairment to the Driver and Vehicle Licensing Agency unless they are a commerciallyemployed driver (Driver and Vehicle Licensing Agency, 2012). There is no explanation asto why this is the case, or what potential effect this type of sensory impairment may haveon licensing. However, it appears that the main concern is with regard to an ability tocommunicate over the telephone in emergencies. The questions asked are:

CHAPTER 1. INTRODUCTION 7
1. Is your hearing good enough to receive information using a telephone, with orwithout the use of a special appliance? e.g. Minicom
2. Do you have access to an alternative means of communication in an emergency?e.g. Text telephone
Similarly, in Australia, commercial drivers are the only group who need to declaretheir hearing loss, though it appears that this is more because of safety concerns. Thelegislation states that drivers must have an awareness of changes in engine or road noise andexternal warning signals, and that this may be compromised by a hearing loss. Accordingly,commercial drivers must have a clinical evaluation and may only be granted a conditionallicense if their hearing reaches a certain standard, though hearing aids can be employed inorder to reach this standard (Austroads and the National Transport Commission Australia,2014). The licensing agency in Australia are, therefore, mainly concerned with the problemsof audibility for hearing impaired drivers, suggesting that they do not view milder forms ofhearing impairment as a problem for driving.
1.1.3 The importance of driving for hearing impaired individuals
Driving is considered an important factor in the maintenance of independence and islinked to other activities which are important for daily living (Persson, 1993; Retchin andAnapolle, 1993). The continuation of driving may, therefore, guard against some of the socialconsequences of hearing loss such as social isolation, increased dependence and depression(Marottoli and Drickamer, 1993; Sindhusake et al., 2001; Tambs, 2004). Conversely,retirement from driving, which increases the risk of isolation and depression (Wiseman andSouder, 1996), may exacerbate these problems for hearing impaired individuals. Thus, theability to drive contributes strongly to the concept of health-related quality of life (Patrickand Deyo, 1989). Accordingly it is important for people with hearing loss to be able tocontinue driving.
The previously described legislation, and the lack of research and debate surroundingthis topic threatens the ease with which the hearing impaired can continue to drive. Indeed,some authors have questioned the provisions in place for deaf drivers in terms of the easewith which they can learn to drive. Steinhardt and Wishart (2006) carried out a reviewof licensing practices for deaf individuals across Australia, the United Kingdom, Ireland,New Zealand and Canada, concluding that there is significant variation in the supportprovided for deaf learner drivers across licensing authorities. In certain areas, licensingtest materials do not cater for deaf individuals, and support from outside parties is notpermitted during assessments; a highly problematic situation given that literacy rates inthis demographic can be low (Mayer, 2007). Other authors have highlighted the safety

8 CHAPTER 1. INTRODUCTION
considerations in terms of communicating with the police once deaf drivers have obtainedtheir license, pointing out that many officers are inept at communicating effectively withthe deaf demographic (Ohene-Djan et al., 2010). Research regarding this topic is, therefore,of paramount importance not only for the development of knowledge, but also in termsof identifying measures which can be taken to improve these considerations for deaf andhearing impaired drivers.
1.1.4 Thesis focus
The aim of the work presented in this thesis is to begin to unpick the effect of partialhearing loss on driving in order to inform knowledge in this area. Most of the existing worklooking at the effect of partial hearing loss on driving has simply investigated accidentor cessation rates; it does not inform on the specific driving practices of people witha hearing loss. Whilst it is important to assess the accident risk arising as a result ofhearing impairment, this information does not provide knowledge regarding the underlyingreasoning behind potential driving complications. This depth of information could be usedto inform the development of suitable countermeasures, which may aid the continued safedriving of hearing impaired individuals.
The work presented here is primarily concerned with expanding the understanding ofhow partial hearing loss specifically affects driving performance. In line with the thinking ofHickson et al. (2010), the studies described are interested in whether auditory distractionhas a disproportionate effect on hearing impaired drivers. Only one prior study hasinvestigated the effect of hearing loss on driving whilst subjects performed a concurrentauditory task (Hickson et al., 2010). Indeed, data regarding the specific driving practicesof those with a hearing loss is sparse, and so the course of study described in this thesisfills an important gap in the academic literature on this topic. This new knowledge shouldcontribute to more informed decisions for policy makers and practitioners when consideringthe driving performance of hearing impaired individuals.
Chapters two and three provide a detailed overview of the different manners bywhich hearing loss might affect driving performance. However, it is the disproportionatelydistracting effect of sound for hearing impaired drivers, described by Hickson et al. (2010),which becomes the focus of this thesis. This document reports on a series of experimentsaimed at investigating the effect of auditory distraction on driving in partially hearingimpaired individuals.
Chapter four reports on a questionnaire study which was performed on hearingimpaired individuals to gather self-reported problems related to everyday driving. Thiswas a novel approach which has been entirely neglected by previous research in this area.Having investigated what hearing impaired individuals identified as being problematicfor driving, objective work in which the distracting effect of speech comprehension wascompared between normally hearing and hearing impaired individuals. Research suggeststhat the efficiency with which visual information is processed can be affected by the

CHAPTER 1. INTRODUCTION 9
concurrent performance of an auditory/cognitive task (Pomplun et al., 2001; Wood et al.,2006). Thus chapter five describes a laboratory-based experiment was performed wherenormally hearing and hearing impaired individuals were asked to simultaneously perform acomputer-based visual task with a speech comprehension task. This study was suggestiveof a disproportionate reduction in the functional visual processing abilities of the hearingimpaired sample. However, there was some concern that factors co-existing with hearingloss may be having an effect on study outcomes.
Chapters six and seven describe a method of hearing loss simulation which wasselected for continuing work in this area, in order to control extraneous factors. Thismethod was analysed in terms of its accuracy, validity, and effect on listening-based workingmemory tasks. The simulation provided an accurate representation of hearing loss, and assuch was employed in a final study assessing the effect of hearing loss on driving using theUniversity of Leeds Driving Simulator (UoLDS). Chapter eight reports on this study, inwhich participants were asked to drive whilst performing some of the working memory tasksboth under normally hearing and Simulated Hearing Loss (SimHL) conditions. Variousmeasures of driving performance, eye movement behaviour and cognitive workload wereused in order to establish the effect of hearing loss on driving ability. Chapter ninesummarises and discusses the work described in this thesis, and provides some questionsand directions for future work which have arisen from undertaking this project.


Chapter 2
Literature Review
2.1 Introduction
This chapter provides a review of existing literature relevant to how hearing loss affectsdriving. However, it will begin by giving a brief overview of what hearing loss is, whateffect it has on various aspects of the perception of sound, an explanation of how it ismeasured, and defining certain technical terms which will be used throughout this thesis.Following this overview, studies which have explicitly investigated the effect of partialhearing loss on driving will be reviewed, and literature which is relevant to this topic willbe discussed. Finally a summary of the current state of knowledge in this area will bepresented, as well as the research questions addressed by work described in this thesis.
2.2 A brief overview of hearing loss
Hearing loss is a highly prevalent condition (Roth et al., 2011) which is considered toaffect one in twelve people aged 18–80 in the United Kingdom (Akeroyd et al., 2014). Asa commonly age-related condition (Davis, 1995), the prevalence of hearing loss appearsto be growing in accordance with an aging population (Laplante-Lévesque et al., 2010).Furthermore, the emerging leisure activities of adolescents (e.g. prolonged personal stereouse) are suggesting that hearing impairment may become a problem for the youngerdemographic (Niskar et al., 2001; Crandell et al., 2004; Chung et al., 2005). Research onthe implications of hearing loss and management strategies for its effects are, therefore,more pertinent than ever.
The Oxford Dictionary 2012 defines the phrase hearing impaired as ‘partially or com-pletely deaf’, and the term deaf as ‘lacking the power of hearing or having impaired hearing’.In this thesis a distinction is made between those who are ‘completely deaf’ and thosewho are ‘partially deaf’, given that the considerations for driving are likely to be differentfor each group. Henceforth, in accordance with the World Health Organization (2015)classifications, the term ‘deaf’ will be used to describe individuals who can hear no sound
11

12 CHAPTER 2. LITERATURE REVIEW
and rely entirely on lip-reading and/or sign language in order to communicate. Conversely,individuals who have the ability to hear sound, but subject to distortions and reducedsensitivity associated with damage to the auditory system will be described as ‘hearingimpaired’ or having a ‘hearing loss’. The focus of this thesis is the driving performanceof hearing impaired individuals.
Although the dictionary definitions of ‘deaf’ and ‘hearing impaired’ are accurate, theyfail to indicate the vast number of problems that arise from such a sensory loss (Graham andBaguley, 2009). Plomp (1986) discusses two separate facets of hearing loss: (1) attenuationto sounds, which arises as a result of loss of sensitivity within the auditory system, and (2)distortion to sounds, a degradation in the quality of sounds which are above the thresholdof hearing. This distortion to sounds is not accounted for if hearing loss is simply seen assomething which limits audibility in the driving environment.
The effect of sound distortion is important, given that its implications cannot bereversed. Rehabilitative interventions such as hearing aids provide greater audibility.However, despite aiming to minimise the influence of distortion to sounds (Moore, 1996),problems with speech understanding persist, even when sound is audible. This is trueespecially in unfavourable listening conditions, such as in background noise (Ricketts, 2001).In fact, in some cases, the louder the sound, the less information can be extracted fromthe signal by an individual with hearing loss (Studebaker et al., 1999).
There are a number of pathologies which can cause hearing loss (e.g. noise exposure,aging, the use of ototoxic drugs), though it is beyond the scope of this thesis to provide anin depth discussion of them all. Accordingly, the main complications that arise as a resultof generic sensory hearing loss will be discussed. The following section will provide a briefoverview of how human hearing operates, and how it can be tested in order to establishnormal functioning.
2.2.1 A brief overview of human hearing
The human ear is a complex system consisting of multiple structures which can be broadlyclassified in to three main components: the outer, middle, and inner ears (see Figure 2.1).
Sound is heard through a series of sequential events: vibrations of the air are focusedby the pinna and are propagated down the external auditory canal where they strike the‘tympanic membrane’, which vibrates according to the waveform of a sound. Attached tothe tympanic membrane is a chain of three bones in the air-filled middle ear (the malleus,incus and stapes; collectively known as the ‘ossicles’) which move in accordance withvibrations of the tympanic membrane. The last of the three ossicles in the chain, the stapes,is attached to the fluid-filled sensory organ of hearing (the cochlea) via a structure knownas the ‘oval window’, a flexible membrane which separates the inner and middle ears.
The function of the ossicles (in conjunction with the tympanic membrane) is to overcomean ‘impedance mismatch’ between the air-filled middle ear and fluid-filled inner ear andensure efficient transfer of sound to the inner ear (Moore, 2007). The term ‘impedance

CHAPTER 2. LITERATURE REVIEW 13
Figure 2.1 The anatomy of the human ear, how each part operates and their respectivefunctions. Source: Yost (2000).
mismatch’ refers to the difference in resistance between air (low-impedance) and the fluidof the inner ear (high-impedance), meaning that if sound impinged directly on the ovalwindow, most would simply be reflected back, leading to a large loss (between 30–40 dB)of acoustic energy (Goode, 1986).
The oval window is attached to one of three chambers (or scalae) within the cochlea, the‘scala vestibuli’ (see Figure 2.2). Lateral movement of the stapes causes waves, congruentwith the acoustic source, to travel through the fluid within the cochlea. These waves followthe path shown in Figure 2.3, causing movement of the various membranes within thecochlea, and terminate at the ‘round window’.
As can be seen, the cochlea is essentially a tube which is divided in half along itslength by a structure known as the ‘Organ of Corti’. The Organ of Corti contains rowsof two different types of hair cell (stereocillia), which are positioned along the length ofthe cochlea: (1) Inner Hair Cells (IHCs), and (2) Outer Hair Cells (OHCs). The structureof the Organ of Corti, and the progressive nature of the stereocillia continuing along thelength of the cochlea can be seen in Figure 2.3.
The motion of the fluid within the cochlea causes the ‘basilar membrane’ (a structurewithin the Organ of Corti on which the stereocillia are located) to vibrate, and these differenttypes of stereocillia to deflect. The physiology of the basilar membrane progressivelychanges from the base of the cochlea to the apex; at the base the basilar membrane is

14 CHAPTER 2. LITERATURE REVIEW
(a) A magnified cross section of the cochlear duct (b) A schematic diagram of the cochlear duct de-picted as unrolled. The path of vibrations is shown
Figure 2.2 The physiology of the human cochlea. Source: Pickles (2012).
(a) Cross section of the Organ of Corti (b) Scanning electron micrograph of a cross sectionof the Organ of Corti
Figure 2.3 The physiology of the Organ of Corti. MP: marginal pillars, OHC: outer haircell, CC: claudius cell, OP: outer pillar cell, HP: habenula perforata, IHC: inner hair cell,TM: tectoral membrane, OSL: osseous spiral lamina, HS: Hensen’s stripe. Source: Pickles(2012).
relatively narrow and stiff, whereas at the apex it is wider and less stiff. Due to themechanical properties of travelling waves this means that different frequencies producepeaks at different points on the basilar membrane (see Figure 2.4). This is known as a‘tonotopic’ arrangement, meaning that the cochlea is arranged in a progressive, (high–low)frequency-specific manner.
The deflection of the IHCs activates them to depolarise, causing action potentials to besent along the cochlear nerve to higher auditory centres. Given the frequency-specific natureof the cochlea’s physiology, IHCs will respond to a specific frequency, depending on theirlocation within the cochlea. OHCs are also frequency specific, depending on their location,but instead of relaying auditory information to higher auditory centres, are involved inan active process within the cochlea whereby, as part of an efferent feedback loop, theyutilise somatic electromotility (oscillate their own length through active vibrations of the

CHAPTER 2. LITERATURE REVIEW 15
Figure 2.4 A depiction of the physiological differences in the basilar membrane at the baseand apex of the human cochlea. These differences produce distinct vibratory patterns bysounds of different frequencies (shown on the right with the cochlea unwound). This leadsto frequency specificity at certain points in the cochlea, the regions of maximal vibrationfor different frequencies (Hz) are provided on the left. Source: Chiras (2013).
cell body; Brownell, 1990). The motion produced by OHCs increases basilar membranevibration at specific frequencies, thus acting as an amplifier and fine tuning frequencyresponse within the cochlea. Therefore, IHCs can be described as the ‘true sensory cells ofthe inner ear’, as OHCs do not provide sensory information about sound to higher auditorycentres (Yanz, 2002).
Hearing impairment can arise from damage to, or abnormalities associated with, anyof the structures within the outer, middle, or inner ear, or at higher auditory centres.Loss of hearing occurring at the gross division of the inner ear or thereafter is known asSensorineural Hearing Loss (SNHL), whereas ‘conductive’ hearing loss occurs at, or priorto, the gross division of the middle ear.
Given the function of associated structures, the perceptual consequences of SNHLare more complex than conductive hearing loss (Moore, 2007). Conductive hearing lossgenerally only subjects a listener to a loss of auditory sensitivity, given that the auditorysystem is compromised in terms of its ability to overcome the impedance mismatch betweenthe air-filled middle ear and fluid-filled inner ear. Within the inner ear, however, an ‘activemechanism’ is at work (Moore, 1996), meaning that damage to these structures not onlyreduces audibility, but also distorts other aspects of sound; this is discussed further insubsection 2.2.3.
The common clinical methods used to measure hearing function are discussed in thefollowing section.
2.2.2 The measurement of hearing loss
The standard method of assessing hearing in clinical practice is a technique known as‘pure tone audiometry’. Using an ‘audiometer’, a calibrated device capable of producingsinusoidal pure tones at a known intensity across different frequencies, the quietest soundsthat a subject can hear across the frequency range 250–8000 Hz are established; these

16 CHAPTER 2. LITERATURE REVIEW
are known as ’absolute thresholds’. Pure tones of different frequency and intensity areproduced (each lasting 1–3 seconds), and subjects are asked to indicate when they are ableto hear these sounds via a button press. Generally, patients are tested at frequencies of0.25, 0.5, 1, 2, 4, and 8 kHz, one ear at a time. A staircase method is used to establisheach respective absolute threshold.
This assessment is normally carried out in a sound-proofed booth, minimising theinfluence of background noise. Plotting these absolute thresholds for each ear produces agraph known as an ‘audiogram’. Figure 2.5 shows an example audiogram for a patient, withthe absolute thresholds for both ears. Note that ‘air conduction’ and ‘bone conduction’values are shown. Air conduction is measured using headphones that pass sound throughthe entire auditory system (outer, middle, and inner ears), whereas bone conduction isperformed by using a vibrating pad placed on the mastoid bone behind the outer ear.This propagates sound through vibration of the skull, bypassing the outer and middleear, sending sounds straight to the inner ear, thus testing underlying sensory ability. Adifference in the air and bone conduction absolute thresholds is, therefore, indicative of aconductive hearing loss.
Figure 2.5 An example audiogram. Source: Stach (2008).
From these hearing thresholds an average (usually from data at 250, 500, 1000, 2000,and 4000 Hz) is taken to classify the degree to which an individual has an impairment; thecommon clinical classification guidelines for the United Kingdom are shown in Figure 2.6.These are the descriptors which will be used throughout this document.
Though it provides a measure of physiological function, pure tone audiometry cannotprovide information about the level of damage to different types of hair cell within the

CHAPTER 2. LITERATURE REVIEW 17
cochlea (i.e. differentiate between OHC and IHC damage), nor can it discern whether thereis an influence of any central auditory processing deficit. Given the variety of functionsassociated with these different types of structure within the auditory system (e.g. frequency,temporal and loudness processing), it is not possible to predict the extent to which anindividual will experience issues in day-to-day living as a result of their sensory impairment.For example, the extent to which an ear is able to distinguish between two differentfrequencies is not very well predicted by audiometric thresholds (Simon and Yund, 1993).Indeed, measures of hearing sensitivity, such as pure tone audiometry, are often not verywell correlated with more subjective reports of hearing ability (Weinstein and Ventry, 1983;Newman et al., 1990; Stephens and Zhao, 1996; Nondahl et al., 1998).
Figure 2.6 Audiometric descriptors for hearing loss severity used in the United Kingdom.Mean thresholds are calculated from data at 0.25, 0.5, 1, 2, and 4 kHz, and are specified foreach ear individually. Source: British Society of Audiology (2011).
In order to establish what effect hearing loss has in a more ecologically valid manner,two main approaches have been taken: speech testing and self-reported experiences ofindividuals.
During speech testing, a pre-defined list of words or sentences are played at differentintensities to the subject, who is asked to repeat back aloud what was heard. A percentagecorrect score as a function of intensity can then be plotted, resulting in what is known as a‘speech audiogram’ (see Figure 2.7). Further validity can be incorporated by testing speechperception in noise, thus providing a measure of the ability to extract auditory informationof interest from a background masker. A speech audiogram sometimes highlights thedistortion to sound brought about by SNHL. The example shown in Figure 2.7 exhibitswhat is termed ‘rollover’ - above a certain threshold, the louder a sound is made, the lessintelligible it becomes.

18 CHAPTER 2. LITERATURE REVIEW
Figure 2.7 An example speech audiogram. The percentage of correct words in a list, orphonemes in a set of words, are plotted against the intensity of the signal used. Source:Stach (2008).
Self-reported experiences of hearing loss are also used to measure the extent to which anindividual has a problem with their hearing. This assessment technique is usually carriedout in a structured manner through the use of a validated questionnaire. One of the mostcommonly used examples of this is the Hearing Handicap Inventory for the Elderly (HHIE),which is shown in Figure 2.8.
Self-reported hearing loss, assessed in this manner, measures a different construct tospeech or pure tone audiometry, a distinction which is highlighted by the use of the word‘handicap’ in the title of the questionnaire. The term ‘handicap’ was defined by the WorldHealth Organization (1980) as: “a disadvantage for a given individual resulting from animpairment or a disability, that limits or prevents the fulfilment of a role that is normal(depending on age, sex, and social and cultural factors) for that individual”. Impairment wasdefined as “any loss or abnormality of psychological, physiological, or anatomical structureor function” and disability as “any restriction or lack (resulting from an impairment) ofability to perform an activity in the manner or within the range considered normal for ahuman being”.
Though this document has since been superseded (World Health Organization, 2000),and the terms replaced, the notion remains that the extent to which an individual isaffected by a sensory impairment is not entirely governed by the characteristics of theirdisability, but more so by the associated social and environmental factors.
Accordingly, self-reported hearing loss establishes the extent to which loss of hearingimpacts upon the performance of other activities and roles. This distinction can, therefore,explain the fact that objective and subjective measures of hearing function are not alwaysrelated, as might perhaps be expected (Weinstein and Ventry, 1983; Newman et al., 1990;

CHAPTER 2. LITERATURE REVIEW 19
The Hearing Handicap Inventory for the ElderlyPlease answer all of the following questions with either (1) ‘yes’, (2) ‘no’, or (3) ‘maybe’.
1. Does a hearing problem cause you to use the phone less often than you would like?2. Does a hearing problem cause you to feel embarrassed when meeting new people?*3. Does a hearing problem cause you to avoid groups of people?4. Does a hearing problem make you irritable?5. Does a hearing problem cause you to feel frustrated when talking to members of your
family?*6. Does a hearing problem cause you difficulty when attending a party?7. Does a hearing problem cause you to feel “stupid” or “dumb”?8. Do you have difficulty hearing when someone speaks in a whisper?*9. Do you feel handicapped by a hearing problem?*10. Does a hearing problem cause you difficulty when visiting friends, relatives, or neigh-
bours?*11. Does a hearing problem cause you to attend religious services less often than you would
like?*12. Does a hearing problem cause you to be nervous?13. Does a hearing problem cause you to visit friends, relatives, or neighbours less often than
you would like?14. Does a hearing problem cause you to have arguments with family members?*15. Does a hearing problem cause you difficulty when listening to TV or radio?*16. Does a hearing problem cause you to go shopping less often than you would like?17. Does any problem or difficulty with your hearing upset you at all?18. Does a hearing problem cause you to want to be by yourself?19. Does a hearing problem cause you to talk to family members less often than you would
like?20. Do you feel that any difficulty with your hearing limits or hampers your personal or
social life?*21. Does a hearing problem cause you difficulty when in a restaurant with relatives or
friends?*22. Does a hearing problem cause you to feel depressed?23. Does a hearing problem cause you to listen to TV or radio less often than you would
like?24. Does a hearing problem cause you to feel uncomfortable when talking to friends?
25. Does a hearing problem cause you to feel left out when you are with a group of people?
Figure 2.8 The Hearing Handicap Inventory for the Elderly (Ventry and Weinstein, 1983);the screening version (Weinstein et al., 1986) is highlighted with asterisks.

20 CHAPTER 2. LITERATURE REVIEW
Stephens and Zhao, 1996; Nondahl et al., 1998).
Since the development of the HHIE, its correlation with absolute thresholds has beenassessed (Weinstein and Ventry, 1983), in order to establish if it can be used as a screeningtool to identify individuals with a hearing loss. Data suggested that the absolute thresholdsof 100 elderly subjects accounted for less than 50% of the variance in their HHIE scores,and word recognition accounted for less than 20%. This weak correlation with pure toneaudiometry and word recognition data has also been shown for a version of the HHIEadapted for younger adults, the Hearing Handicap Inventory for Adults (HHIA) (Newmanet al., 1990). Both Weinstein and Ventry (1983) and Newman et al. (1990) argue thataudiometric data alone is insufficient to gauge an individual’s reaction to their own personalhearing impairment. Though this is the case, given the test-retest repeatability of the HHIEand HHIA (Weinstein et al., 1986; Newman et al., 1991), and the ease of administration, ithas been suggested that these measures may identify individuals in a community settingin need of more thorough audiological examination. To this end, a shorter version of theHHIE was produced; the Hearing Handicap Inventory for the Elderly (screening version)(HHIE-S) (Ventry and Weinstein, 1983). This version contained 10 of the original 25 HHIEitems (see Figure 2.8), and retained its validity (Weinstein, 1986).
Differences in the impact of hearing loss can arise, even when individuals exhibit identicalabsolute thresholds (Halpin and Rauch, 2009). This is because pure tone audiometrycannot distinguish between the damage that has occurred to different structures withinthe auditory system, rather it provides a measure of overall function. Different perceptualconsequences can arise as a result of damage to different parts of the auditory system (e.g.the complete loss of IHCs would have very different outcomes compared to the complete lossof OHCs). The next section will provide a brief overview of the perceptual consequenceswhich arise as a result of SNHL.
2.2.3 The perceptual consequences of hearing loss
It is beyond the scope of this document to cover all of the perceptual consequencesassociated with SNHL (for a detailed overview see Moore, 2007). However, four of themain perceptual consequences, ‘elevation of absolute threshold’, ‘loudness recruitment’,‘reduced frequency selectivity and discrimination’, and ‘impaired temporal processing’ arekey concepts which are referred to extensively later in this thesis. They are describedbelow.
2.2.3.1 Elevation of absolute threshold and loudness recruitment
Elevation of absolute threshold is the aspect of hearing loss that is measured by pure toneaudiometry. It refers to the fact that sounds have to be made louder before they can beperceived by somebody with a hearing loss, i.e. the auditory system has a lower sensitivity.This reduction in sensitivity can manifest in a frequency specific manner. For example,

CHAPTER 2. LITERATURE REVIEW 21
noise induced hearing loss causes a sharp dip in sensitivity at 3–6 kHz (Rabinowitz, 2000),and age-related hearing loss exhibits progressively less sensitivity with increasing frequency(Gates and Mills, 2005). Although the elevation of absolute threshold also occurs forconductive hearing loss, SNHL has the added complication of ‘loudness recruitment’.
Loudness recruitment is a well-established and extensively studied phenomenon whichmost (if not all) individuals with SNHL exhibit to some extent (Moore, 2007). It describesan abnormal growth of (perceived) loudness level with increasing (physical) sound levelat intensities above absolute threshold. This abnormal growth of loudness continues forsounds up to a level of between 90-100 dB SPL, after which loudness growth returns tonormal (Moore, 2007). This is depicted in Figure 2.9, which shows what would be expectedif somebody with a unilateral SNHL was asked to match the loudness of a tone played totheir normal ear (the reference tone) against another tone played to their impaired ear(the comparison tone) (Moore and Glasberg, 1997, 2004; Moore et al., 1999).
Figure 2.9 An example of loudness recruitment for a hearing loss of absolute threshold 50dB HL. The graph reflects the expectation if a subject with unilateral SNHL were asked tomatch the loudness of a tone played to their normal ear against the loudness of a tone intheir impaired ear.
In some cases, hearing impaired individuals can experience what is termed ‘overrecruitment’, where loudness growth does not return to normal at high sound intensities(Moore, 2007). This can lead to a reduction in the loudest comfortable noise intensity forthose with a hearing loss.
There are a number of practical implications of elevated absolute thresholds andloudness recruitment:
1. Missing auditory information.A loss of sensitivity in the auditory system means that certain sounds are simplynot heard by the listener. This applies to complete sounds, but also gives rise toproblems in speech perception as phonemes or whole words within a passage may

22 CHAPTER 2. LITERATURE REVIEW
be missed. Of particular concern in this regard is the fact that certain consonantsounds are often weak or are easily masked by other content, and are thus missedmore often (Moore, 2007). This presents problems as consonants are the part ofspeech which tend to carry most meaning (Yost, 2000), and as such people with ahearing impairment may often mishear words.
2. A reduced ‘dynamic range’.Due to the abnormal growth of loudness, reduced sensitivity in the auditory sys-tem, and over recruitment, a reduced ‘dynamic range’ (the range between absolutethreshold and the highest comfortable level) is sometimes noted (Moore et al., 1992;Moore, 2003b). This reduced dynamic range may present problems for rehabilitativeinterventions such as hearing aids, as a certain degree of amplification may causesome sounds to be uncomfortably loud, whilst still not providing enough amplificationfor other sounds to be heard.
3. Altered loudness cues used in the perception of speech.The loudness relationships between components of speech sounds are thought to beimportant for speech intelligibility (Plomp, 1988; Shannon et al., 1995). However,loudness recruitment leads to a distortion of these loudness relationships, as thedifference in level between soft and loud phonemes of speech will be exacerbated(Moore, 2003b). Thus, the intelligibility of speech will be compromised.
2.2.3.2 Reduced frequency selectivity and discrimination
‘Frequency selectivity’ refers to the ability of the auditory system to separate out theelements in a sound made up of many components (Moore, 2007). For example, if twopure tones of distinct frequency were played to somebody with normal hearing, they wouldbe able to hear each tone individually. This is an important feature of the auditory system,as frequency selectivity plays an important role in many aspects of auditory perception(Moore, 2007).
Frequency selectivity can be measured using masking experiments. In these experimentsa stimulus tone of a fixed low intensity is played simultaneously with a masker noise coveringa specific band of frequencies. The masker is played at different intensities until the subjectindicates he/she can no longer hear the stimulus tone. The procedure of establishing thequietest masker noise needed to cease perception of the stimulus is repeated for maskingnoises of various frequency bands, and the results are plotted to produce a graph called aPsychophysical Tuning Curve (PTC), an example of which is shown in Figure 2.10.
The masker provides less interference with the perception of the stimulus tone as itscentre frequency is moved away from the frequency of the tone. This is because, due tothe tonotopic arrangement of the cochlea, different IHCs are activated by the two sounds.Given the specificity of IHCs, and the fine tuning provided by OHCs, however, it can

CHAPTER 2. LITERATURE REVIEW 23
Figure 2.10 A PTC measured at a stimulus frequency of 1 kHz (shown by the dot). Adaptedfrom: Gelfand (2009).
be seen that the stimulus tone is perceived even when its frequency is very close to thefrequency content of the masker, hence this example exhibits good frequency selectivity.
When PTCs are recorded for a range of frequencies, the result is a number of overlappingPTCs (see Figure 2.11). These results have led to the cochlea being modelled as a bank ofoverlapping ‘bandpass filters’, which are able to pass sound information of interest andfilter out interfering off-frequency noise (Moore, 2003a).
Figure 2.11 PTCs measured for a range of stimulus frequencies. The solid line representsthe masking level required to halt perception of the signal. The dashed line is the subject’sabsolute threshold, and the dots below each PTC represent the various stimuli tones. Source:Moore (2003a).
In individuals with SNHL, these auditory filters sometimes appear to be broader thanthey are for normally hearing subjects (see Figure 2.12); thus showing a reduction in

24 CHAPTER 2. LITERATURE REVIEW
frequency selectivity, because two pieces of auditory information are more likely to fallwithin the same auditory filter. Furthermore, in some cases, all of the IHCs at a certainplace within the cochlea may be absent, or non-functioning, rendering the ear incapable ofresponding to corresponding frequencies (Moore, 2001). In this case, off-frequency listeningoccurs whereby IHCs from a different region in the cochlea relay information about thesound to higher auditory centres (see Figure 2.12); this causes distortion to the quality ofsound.
Figure 2.12 Hypothetical PTCs measured to a 2 kHz stimulus from three ears: (1) normalhearing - the PTC shows sharp tuning; (2) an ear with OHCs damage - a broader shape isnoted with less frequency specificity; (3) an ear that has no functioning IHCss correspondingto 2 kHz, the tone is perceived by IHCs at a different place along the basilar membrane.Adapted from: Yanz (2002).
A reduction in frequency selectivity can have a number of practical implications:
1. Extraneous masking sounds have a greater influence on successful listening.Because auditory filters are wider in those with SNHL, sounds extraneous to thesource of interest are more likely to have a masking effect. This may lead to anincreased difficulty in listening during very noisy conditions. In addition to this,complications with temporal resolution1, another common perceptual consequenceof SNHL, mean that hearing impaired individuals are less able to take advantageof dynamic gaps in a masking noise and ‘listen in the gaps’ in order to maintainsuccessful speech understanding (Moore, 2003b).
2. Reduced perception of spectral components in a sound.The output of the auditory filters in the cochlea resembles a blurred version of
1The ability to resolve sounds with respect to time.

CHAPTER 2. LITERATURE REVIEW 25
the input spectrum (Moore and Glasberg, 1997). The perception of this spectralshape is important for speech recognition, but in cases of SNHL, auditory filters arebroader, and as such the spectrum is more ‘smoothed’ or less distinct (Moore, 2003b).Accordingly in some cases, small spectral details of a sound may be imperceptible,and the addition of a background noise may exacerbate this problem by reducingthis spectral detail further, thus degrading speech understanding.
3. Impaired ‘timbre perception’.Timbre is often referred to as the quality of a sound, and allows for distinctionbetween sources of sounds, e.g. which instrument has played a note (Halpern et al.,2004). Certain abilities associated with timbre perception, such as the differentia-tion of steady-state vowels, are heavily reliant on the subtle spectral differences insounds (Moore, 2007). As such SNHL, which makes it difficult to pick-up on thesespectral differences as a result of impaired frequency selectivity, hinders successfulunderstanding of speech in this regard.
2.2.3.3 Impaired temporal resolution
‘Temporal resolution’ refers to an ability to detect changes in sound over time (Moore,2007). Individuals with SNHL often exhibit poor temporal resolution, as damage tosome of the structures in the cochlea alter aspects of temporal processing. For example,loudness recruitment leads to altered loudness relationships between sounds (Moore, 2007).Therefore, natural fluctuations in the waveform of a sound (e.g. white noise) can beconfused as gaps within it, rather than natural variation (Glasberg and Moore, 1992).Phenomena such as this may lead to an impaired ability of hearing impaired individuals todetect gaps in a sound relative to those with normal hearing (Fitzgibbons and Wightman,1982).
Temporal cues such as the above are thought to be important for speech understanding.For example, fricatives2, such as ‘f’, rely on the ability to accurately detect durationto distinguish them from affricatives, such as ‘ch’ (Raphael and Isenberg, 1980). Theconfusion of these two types of sound has obvious implications for speech recognition andunderstanding. Likewise the duration of gaps in speech is thought to be important for theidentification of phonemes (Rawool, 2006). Duration detection, however, appears to beimpaired in those with a hearing loss (Irwin and Purdy, 1982), presenting difficulties forprocessing the temporal aspects of sound.
Another common observation in hearing impaired individuals is that it takes themlonger to recover from ‘forward masking’ (Kidd Jr et al., 1984). Forward masking is aphenomenon whereby a masker sound played shortly before a stimulus can stop perceptionof the stimulus (Moore, 2007). This is thought to occur as a result of a reduction in
2A speech sound characterised by audible friction produced by forcing the breath through a constricted orpartially obstructed passage in the vocal tract.

26 CHAPTER 2. LITERATURE REVIEW
sensitivity of recently stimulated cells, or a persistence in the pattern of neural activityevoked by the masker (Moore, 2012). Thus, a loud sound quickly followed by a quieter one(i.e. as commonly occurs in speech) would be less perceptible for those with SNHL thanit would for an individual with normal hearing, and thus portions of a sound of interestwould not be heard.
These impairments to temporal processing ability render hearing impaired individuals ata greater disadvantage when perceiving speech, particularly in the presence of backgroundnoise. Moore (2007) argues that most sounds in everyday life are characterised by rapidfluctuations in amplitude from moment to moment, and because of inefficiencies in temporalprocessing, those with a hearing loss will be at a disadvantage in following the temporalprofile of these sounds. Furthermore, in acoustically adverse environments, such as inexcessive background noise, the ability to temporally resolve a sound source of interestmay be hampered by the presence of fluctuating competing noise.
2.2.3.4 Summary of the perceptual consequences of sensorineural hearing loss
The overview of perceptual consequences associated with SNHL given here is far fromexhaustive. However, this section has shown that the effect of SNHL goes far beyonda simple loss of sensitivity within the auditory system. Although SNHL manifests as areduced ability to hear acoustic information, it also presents a number of problems for theperception of sound once it is at an audible level.
It is this difficulty in processing and understanding auditory information that has ledauthors to hypothesise that those with a SNHL have to employ more ‘listening effort’ inorder to achieve successful auditory perception (Hornsby, 2013). The increased listeningeffort in hearing impaired individuals is highly pertinent in the context of this thesis. Thus,this consideration is discussed further in Chapter 3.
Given that various technical terms and concepts have now been introduced, the followingsection provides an overview of the work which has been carried out investigating the effectof hearing loss on driving. A review of directly related work is included, but there is alsosome discussion regarding work which has looked at the effect of auditory information onnormally hearing drivers. These factors are considered in terms of their transferability tothe hearing impaired demographic.
2.3 Current evidence regarding hearing loss and driving out-comes
Chapter 1 has summarised the limited evidence available regarding the effect of hearingloss on driving, and the disjointed policy decisions in the area. The following sectionsprovides a more detailed review the existing literature in this area. These studies fall in toone of three categories with respect to the effect of hearing loss on driving: (1) road trafficaccident rates, (2) driving cessation rates, and (3) measures of driving performance. This

CHAPTER 2. LITERATURE REVIEW 27
section will discuss Road Traffic Accidents (RTAs) and driving cessation rates that havebeen observed in hearing impaired individuals, section 2.4 then goes on to suggest whythese observations might have occurred.
2.3.1 The effect of hearing loss on road traffic accident rates
A number of studies have investigated road traffic accident rates in hearing impaired drivers,and do not form a strong consensus.
2.3.1.1 Ivers et al. (1999)
Ivers et al. (1999) collected data from an older population (≥ 49 years old) using aquestionnaire administered to a large sample (n = 2, 326) by trained researchers in aninterview setting. The questionnaire included information regarding driving habits, RTAsduring the past year, and level of hearing loss. Hearing loss was stratified into fourcategories: none, mild, moderate, and severe. Ivers et al. (1999) calculated prevalenceratios for RTAs relative to normally hearing individuals, which were adjusted for age andsex, and found that self-reported severe hearing loss was associated with a significantincrease in the likelihood of self-reported car accidents. They also found that a hearingimpairment in the right ear was significantly associated with accidents, and argued that ina country with right-hand drive vehicles (Australia), this ear may aid with hazard detection.These conclusions must be considered taking in to account that a propensity to self-reportone variable (e.g. hearing loss) may be reflective of a participant’s willingness to reportanother (e.g. driving accidents). As such, the relationship between hearing loss and RTAsmay be inflated as a result of using self-reported measures.
2.3.1.2 McCloskey et al. (1994)
However, McCloskey et al. (1994) also investigated road traffic accident risk in thispopulation, but found no effect of hearing loss. They performed a matched case-controlstudy investigating the motor vehicle collision injuries of older drivers and their associationwith certain sensory impairments. They identified cases as older drivers (65 years orolder) who had been involved in at least one road traffic accident reported to the police inWashington, USA between 1987 – 1988. The authors then assigned two controls to each oftheir cases, using age, sex and county of residence as matching criteria. They were ableto access pure tone audiometry and speech test data, but found no significant effect ofeither on the risk of RTAs. Contrary to the results of Ivers et al. (1999), this would suggestthat an inability to hear sounds whilst driving does not have a bearing on road trafficaccident risk. McCloskey et al. (1994) did, however, find that hearing aid ownership wassignificantly associated with an increased risk of road traffic accidents. They also notedthat those who reported wearing their hearing aids whilst driving were more at risk ofhaving an accident, and that those who reported not wearing their hearing aids whilst

28 CHAPTER 2. LITERATURE REVIEW
driving also had an increased risk of accidents, though the latter of these trends did notreach significance. The authors suggested that extraneous sounds emitted from hearinginstruments (e.g. feedback) might serve to distract drivers wearing hearing aids.
2.3.1.3 Sims et al. (2000)
Sims et al. (2000) also found no link between hearing loss and RTAs. They undertooka prospective cohort study in which a source population of older drivers (≥ 55 years)was assembled and followed for five years. Information about the number of crashes thatsubjects had experienced during the study period was collected from state records. Theirprimary aim was to develop a structural equation model which predicted crash frequencyaccording to visual and cognitive data, but they also collected self-reported hearing lossdata using the HHIE-S and information regarding subjects’ hearing aid use. Their datashowed no significant association between hearing loss or hearing aid use and the frequencyof road traffic accidents during the five year observation period.
2.3.1.4 Green et al. (2013)
More recently Green et al. (2013) have replicated the finding that hearing impairedindividuals were not at an increased risk of RTAs. They performed an observational studyusing an elderly demographic aged 70 or older. The authors asked participants whetherthey had ever been diagnosed with a hearing impairment, and used this to classify peopleinto a ‘yes/no’ hearing impairment group. Driving accident records from the past fiveyears were obtained and participants were asked to complete a questionnaire regardingtheir driving habits. Again, contrary to Ivers et al. (1999), Green et al. (2013) found nosignificant association between hearing loss and an increased risk of motor vehicle collisions.However, they did find a significant increase of road traffic accidents in people who hadboth hearing and visual acuity impairments. Green et al. (2013) conclude that older driverswith dual sensory impairment are more at risk of road traffic accidents.
The above studies were all carried out in an older demographic, and investigated the riskassociated with road traffic accidents for hearing impaired individuals alongside a numberof other variables (e.g. visual acuity). However, two studies have explicitly investigated theeffect of occupational noise exposure on RTAs, one of which specifically investigated theeffect of noise induced hearing loss on accident rates (Barreto et al., 1997; Picard et al.,2008). These studies were performed on younger cohorts than the previously cited studies,thus reducing potentially confounding factors which are present in older drivers’ accidentrecords, e.g. an increased likelihood of injury from RTAs or a low-mileage bias (Langfordet al., 2006).
2.3.1.5 Barreto et al. (1997)
Barreto et al. (1997) undertook a nested case-control study in a cohort of Brazilian

CHAPTER 2. LITERATURE REVIEW 29
steelworkers employed at a single mining plant. They investigated the socio-demographic,medical and occupational risk factors underlying an increased likelihood of mortality frommotor vehicle injury (Barreto et al., 1996). The authors classified a case as workers whohad died as a result of a motor vehicle accident whilst under employment at the miningplant within a given epoch. They do not present the age of their sample, but do divulgethat 50% of cases were under the age of 35 years. Four controls were selected at randomfrom all workers that were under employment at the same time, and born in the same year,as each respective case. Barreto et al. (1997) were able to collect medical data from routinemeasurements that the Occupational Health Department had made, and amongst these waswhether the employee had a hearing deficit - although the authors provide no explanationof the criteria for this classification. When calculating odds ratios for death from roadtraffic accidents, they found a significant inflation of death risk in those diagnosed with ahearing deficiency.
2.3.1.6 Picard et al. (2008)
More recently, Picard et al. (2008) built upon the results of Barreto et al. (1997) byperforming a retrospective case-control study on the very specific demographic of workersexposed to daily noise levels of over 80 LAeq8hr in Québec, Canada (age range = 16–64).They wished specifically to establish whether noise induced hearing loss was associatedwith an increased risk of road traffic accidents and/or violations. They linked state drivingto public health records, and analysed the factors underlying road traffic accidents andviolations during a five year study period. The public health records contained individuallymeasured audiograms, as well as the level of occupational noise that workers were beingexposed to. Picard et al. (2008) only analysed noise induced hearing losses. The authorsfound that hearing loss significantly increased the risk of having at least one road trafficaccident in the five year period studied. The results also showed an increasing prevalenceof road traffic accidents with increasing hearing loss severity, suggesting that the degree ofhearing impairment is positively associated with accident risk. Picard et al. (2008) alsofound that speeding violations were less frequent in those with a hearing loss, and hearingloss severity was negatively correlated with speeding offences. However, traffic offences notrelated to speeding were positively correlated with hearing loss. Thus the data showed thatthose with a hearing impairment were more likely to commit traffic offences than theirhearing counterparts, whereas they were less likely to be caught speeding.
In summary, it is clear that there is disagreement between the studies performed in thisarea, an overview of which is provided in Table 2.1. Some have found that hearing lossinflates accident risk (Barreto et al., 1997; Ivers et al., 1999; Picard et al., 2008), whereasothers have found no such trend (McCloskey et al., 1994; Sims et al., 2000; Green et al.,2013). One striking difference in the methodologies of these studies might explain thisdifference in outcomes; all of the studies finding an effect of hearing loss on driving failedto control for driving experience or annual mileage, whereas those which did not, had

30 CHAPTER 2. LITERATURE REVIEWTa
ble
2.1Statist
ically
significan
tris
kfactors(relativeto
controlc
onditio
ns)associated
with
diffe
rent
drivingpe
rforman
ceindicators
forthe
hearingim
paire
ddemograph
ic.
Referen
ceTrend
noted
Dem
ograph
icgrou
pOdd
sRatio
(OR)/
Prevalenc
eRatio
(PR)
(95%
CI)
McC
loskey
etal.
(1994)
Increasedris
kof
road
traffi
caccident
injury
Hearin
gaidow
ners
PR:1
.8(1.1–2.8)
Hearin
gaiduserswhilst
driving
PR:2
.1(1.2–3.8)
Barreto
etal.
(1997)
Increasedris
kof
deathfrom
motor
vehicleinjury
Tho
sewith
ahearingloss
OR:2
.36(1.15–2.85)
Iverset
al.
(1999)
Increasedris
kof
aself-repo
rted
car
accident
intheprecedingyear
Tho
sewith
aself-repo
rted
severe
hearingloss
OR:1
.5(0.7–3.4)
Simset
al.
(2000)
Non
e-
-
Picard
etal.
(2008)
Increase
inris
kof
having
atleaston
eaccident
intheprecedingfiv
eyears
Just
notic
eablehearingloss
PR:1
.06(1.01–1.11)
Mild
hearingloss
PR:1
.13(1.05–1.21)
Mod
eratehearingloss
PR:1
.18(1.08–1.27)
Severe
hearingloss
PR:1
.31(1.20–1.42)
Reduced
riskof
atleaston
espeeding
citatio
nin
theprecedingfiv
eyears
Barelyno
ticeablehearingloss
PR:0
.90(0.86–0.94)
Mild
hearingloss
PR:0
.87(0.81–0.93)
Mod
eratehearingloss
PR:0
.89(0.82–0.97)
Severe
hearingloss
PR:0
.80(0.73–0.87)
Increasedris
kof
atleaston
eno
n-speeding
citatio
nin
thepreceding
fiveyears
Barelyno
ticeablehearingloss
PR:1
.04(1.01–1.07)
Mild
hearingloss
PR:1
.06(1.02–1.10)
Mod
eratehearingloss
PR:1
.08(1.03–1.13)
Severe
hearingloss
PR:1
.10(1.05–1.16)
Green
etal.
(2013)
Non
e-
-

CHAPTER 2. LITERATURE REVIEW 31
accounted for these factors.
Hole (2013) notes that one of the main limitations of accident rate data is the difficulty indetermining the exposure rate of people involved in recorded crashes. This is a complicationbecause those who drive more miles per year have a greater exposure to involvement inaccidents, yet those with a lower annual mileage tend to be less experienced drivers, andso have a higher crash risk when calculated per kilometre driven (Langford et al., 2006).Accordingly, it is of paramount importance to control for this factor in analyses of RTAs.The fact that certain studies cited here did not, casts doubt over their accuracy (Barretoet al., 1997; Ivers et al., 1999; Picard et al., 2008).
In addition, Ivers et al. (1999) used self-reports of accident involvement, which can beeasily biased by intentional or unintentional misrepresentation (Elander et al., 1993). Thisis thought to be a particular problem in samples of older adults (McGwin Jr et al., 1998;Boufous et al., 2010); the demographic being studied by Ivers et al. (1999). Furthermore,Ivers et al. (1999) quantified hearing loss through self-reports, rather than audiometric data.This method is apparent in other cited studies (Sims et al., 2000; Green et al., 2013), whereassome have used pure tone audiometry data in order to confirm hearing loss (McCloskeyet al., 1994; Barreto et al., 1997; Picard et al., 2008). The use of different assessments ofhearing loss does not appear to have a bearing on study outcomes, because studies usingself-reported hearing loss do not form a consensus regarding driving outcomes, and likewisethis is the case for studies using pure tone audiometry data. However, as mentioned insubsection 2.2.2, these two assessment types do not measure the same constructs, and assuch it is implausible to compare results from them.
The study of Barreto et al. (1997) used a small number of observations, which is oftena complication in accident rate data (Hole, 2007). They identified only 13 individualswith a hearing loss who had been killed as a result of a road traffic accident, but 132 whodid not have a hearing loss. This very low sample size may have artificially inflated theirestimation of accident risk in the hearing impaired sample, thus bringing their findingsunder further scrutiny.
The sample size of 11,683 hearing impaired participants used by Picard et al. (2008)was much greater, and they also used state-recorded accident data which are not proneto misrepresentation. However, although Picard et al. (2008) controlled for a number ofvariables in their analyses (age, noise exposure levels, and the length of noise exposure incareer), annual mileage and driving experience were not amongst these. This, again, callsthe results of this study in to doubt, just as was the case for Ivers et al. (1999) and Barretoet al. (1997).
Thus, all of the studies which have found an effect of hearing loss on road traffic accidentrates are questionable because of methodological oversights. Other studies which have beencited tend to have stronger methodologies. In particular, Green et al. (2013) based theircalculations on accidents per kilometre driven, and controlled for a number of extraneousvariables (race, gender, age, number of medical conditions, and three measures of cognitive

32 CHAPTER 2. LITERATURE REVIEW
abilities). The latter three of these variables are considered important, given the olderdemographic in the majority of studies investigating the effect of hearing loss on RTAs.Hearing loss is heavily correlated with age, and so other age-related factors (e.g. cognitiveslowing; Salthouse, 1991) should be sufficiently accounted for in analyses. Particularly asmany age-related changes in function are considered important factors in the maintenanceof driving safety (Anstey et al., 2005).
A number of studies did not investigate accident involvement as a function of hearingloss severity, instead simply classifying hearing loss as ‘present’ or ‘absent’ (Barreto et al.,1997; Sims et al., 2000; Green et al., 2013). Of the studies which did investigate hearing lossseverity, one found an increase in road traffic accidents only as a result of severe hearingloss (Ivers et al., 1999), one found that all degrees of hearing loss (classified as ≥ 15 dB inboth ears at 3, 4, and 6 kHz) resulted in an increase in accident risk, and that this accidentrisk was positively correlated with hearing loss severity (Picard et al., 2008), and one studydid not find an increase in accident rate regardless of severity (McCloskey et al., 1994).Thus it cannot be concluded that the severity of hearing loss is an important considerationfor changes in driving performance.
Studies which did not find a distinct effect of hearing loss on driving, did identify twooutcomes of interest. The first is that, when co-existing with a vision impairment (definedeither in terms of contrast sensitivity of visual acuity), hearing loss did cause a significantincrease in road traffic accident risk (Green et al., 2013). The authors do not provide anexplanation as to why this may have been the case, but it is considered here that it mayhave arisen as a result of a ‘common cause’ theory, which essentially postulates that sensoryfunctioning is an indicator of the overall condition of an individual’s neurological status(Baldwin, 2002). The presence of a dual-sensory impairment may, therefore, predispose anindividual who has less ability to perform complex mental tasks (such as driving). This isan idea which will be discussed in more detail later (see Chapter 3).
The second finding of interest is that hearing aid owners and hearing aid users aremore at risk of having a road traffic accident (McCloskey et al., 1994). This finding cannotbe considered conclusive, particularly as Sims et al. (2000) found no significant effect ofhearing aid use on the number of road traffic accidents. However, McCloskey et al. (1994)claim that extraneous noise produced by hearing aids may serve to distract the driver fromthe primary task of driving. This is an important consideration, and one which will bediscussed in depth later in this chapter (see subsection 2.4.2).
There are three studies which have investigated driving cessation as a result of hearingloss, though they also do not reach a consensus. These studies are reviewed in the followingsection.
2.3.2 Driving cessation habits in hearing impaired individuals
Gilhotra et al. (2001) ran an observational study similar to that of Ivers et al. (1999) usingdata collected as part of the same survey, thus their age demographic was similar (partici-

CHAPTER 2. LITERATURE REVIEW 33
pants aged ≥ 49 years). However, instead of studying road traffic accident involvement,they investigated the likelihood of individuals relinquishing their driving license as a resultof various sensory impairments and medical conditions. One of these impairments washearing loss, which was self-rated and categorised as ‘none/mild’, ‘moderate’, or ‘severe’.Results showed that those with a severe hearing loss were significantly more likely to ceasedriving than those who reported no/mild hearing loss, thus suggesting that severe hearingloss has a bearing on individuals’ decision to stop driving.
Unsworth et al. (2007) performed a longitudinal study investigating factors associatedwith driving cessation in an elderly demographic. They drew a sample of people aged65 years or older from an existing baseline survey (The Melbourne Longitudinal Studieson Healthy Ageing Program). The survey gathered information on a range of variablesincluding information about driving habits, and a self-rated measure of hearing whichwas scored on a four-point Likert scale (‘excellent’, ‘good’, ‘fair’, or ‘poor’). From thequestions about driving habits, participants were classified in to one of three driving groups:‘continuers’, ‘modifiers’, or ‘relinquishers’, pertaining to their driving status. The authorsfound that poor self-rated hearing was related to an increase in people’s decision to modifyor relinquish their driving. However, Unsworth et al. (2007) noted that the independentvariables used in the study were correlated, and performed a logistic regression, buildinga model in order to establish which independent variables could be used to predict thecategorical outcome of driving cessation. In this analysis, hearing loss status was not foundto be a significant factor in peoples’ decision to modify their driving behaviour or relinquishdriving. This suggests that other factors inextricably linked with hearing loss (e.g. age;Davis, 1995) may be more responsible for the earlier significant findings of Unsworth et al.(2007).
Although not explicitly investigating causes of driving cessation, Thorslund et al.(2013c) performed a questionnaire study with hearing impaired individuals, aiming toderive their transport safety and mobility concerns. Their survey included informationregarding driving licence ownership, whether people had stopped driving recently, annualmileage, the avoidance of driving under certain conditions, and how often people droveas opposed to being a passenger. They were able to link survey responses to audiometricdata for each respondent, thus allowing the measurement the influence of hearing loss onthis data.
Although Thorslund et al. (2013c) found that profound hearing loss was associated withan increased likelihood of not owning a driving licence, they clarify that the reasons for thiswere related to other medical motives such as vision disorders or disabilities. This lowerlicense ownership in profoundly hearing impaired respondents is also partly contradictedby annual mileage, which was significantly higher for those with a profound hearing loss.Hearing loss status was not significantly associated with items asking whether people hadstopped driving recently, whether they preferred being a passenger or driver, or whetherthey actively avoided driving under certain road conditions.

34 CHAPTER 2. LITERATURE REVIEW
Table 2.2 Statistically significant odds ratios associated with driving participation for thehearing impaired demographic.
Reference Trend noted Demographic group Odds Ratio(95% CI)
Gilhotra et al.(2001)
Increased risk of earlierdriving cessation
Those with a self-reportedsevere hearing loss 1.6 (1.0–2.5)
Unsworth et al.(2007)
Higher likelihood ofdriving cessation
Those with relatively poorself-reported hearing Not calculated
Thorslund et al.(2013c)
Higher annual mileage Those with a profoundhearing loss
6.49(1.07–42.5)
Higher ownership ofdriving license versuspeople with a profoundhearing loss
Those with normalhearing
5.42(1.00–29.2)
Those with a mild hearingloss
9.42(2.11–42.0)
Those with a moderatehearing loss
6.45(1.86–22.4)
Those with a severehearing loss
4.22(1.04–17.1)
These results (summarised in Table 2.2) are, therefore, similar to the accident ratestudies in that they exhibit a mixture of conclusions. The most important point in theconsideration of these results is the same highlighted by the study of Unsworth et al.(2007), that hearing loss increases driving cessation, but that a number of other factorsalso contribute.
Regardless of their methodological limitations, these observational studies investigatingcrash risk and cessation rates identify trends which warrant further investigation. It is onlypossible to speculate the reason behind these observed trends, as studies in the area do notinvestigate the underpinning driving behaviour changes which occur as a result of hearingloss. The next section outlines the possible reasons why hearing loss might alter drivingbehaviour, and thus result in a potential increase in road traffic accidents and drivingcessation.
2.4 Reasons for altered driving trends in hearing impairedindividuals
A number of studies suggest two broad presupposed manners by which hearing loss is likelyto pose problems for skills relevant to driving:
1. Hearing loss causes a failure to perceive relevant auditory information in the drivingenvironment, and this impacts on overall driving ability.
2. SNHL distorts auditory signals (even at audible levels), leading to a disproportionatelydistracting effect of acoustic information in the driving domain.

CHAPTER 2. LITERATURE REVIEW 35
These two considerations will be discussed in this section, although there is limitedresearch that can be drawn upon. Therefore, some of the research that has been carriedout in normally hearing individuals investigating the effect of reduced audibility on drivingperformance will also be discussed. This work is considered applicable as it replicates oneof the perceptual consequences of SNHL; threshold elevation.
2.4.1 Missing driving-relevant auditory information
Artificial reductions of auditory information in driving relevant situations have been shownto affect aspects of driving performance in normally hearing individuals. These situationsare outlined in this section because it follows that a reduction in audition as a result ofhearing loss would likely result in the same observations.
It should be noted, however, that unless an individual has a hearing loss of a moresevere nature, access to road-relevant auditory information will be reduced, rather thaneradicated. For example, the pass/fail criteria for police sirens being tested in the UK is alevel of 97 dB recorded at a distance of 50 metres (Metropolitan Police, 2014), a level whichis well above threshold for people with a mild or moderate hearing loss, and should also beaudible for some people with a severe hearing impairment (British Society of Audiology,2011). Thus a lack of auditory information is something which is likely to primarily affectprofoundly deaf individuals, rather than those with a hearing loss.
2.4.1.1 The ability to hear warning signals
A consequence of an inability to hear auditory information in the car is the lack of access towarning sounds such as sirens from emergency services vehicles, or the horns of other carson the road. This consideration was cited by early work investigating the driving habitsof deaf individuals (Coppin and Peck, 1963, 1965), and has recently been pointed out byauthors investigating the safety consequences of listening to loud music whilst cycling (e.g.de Waard et al., 2011). It also gains anecdotal support from situations such as that shownin Figure 2.13, depicting a deaf cyclist pointing out to other road users that he does nothave access to auditory information. However, there have been no formal investigations onto the ability of those with a hearing loss to hear external auditory warning signals, orhow this may affect their driving performance.
2.4.1.2 Reductions in situation awareness
Hearing is a sense which offers highly important information about the surroundingenvironment, but is often ignored at a conscious level (Horowitz, 2012). Humans are ableto perform the complex task of organising sounds from the surrounding environment intoperceptually meaningful elements in an automatic fashion (Bregman, 1994). This makesit possible to form a rich, conscious experience of the surrounding environment (Snyderet al., 2012). As such, the inability to hear sound, or a difficulty in doing so, is likely to

36 CHAPTER 2. LITERATURE REVIEW
Figure 2.13 A photograph taken by Mary Evans entitled ‘deaf cyclist in the 1930’s’. Thesign on the riders back reads: ‘Beware, I am deaf’. Source: Ohene-Djan et al. (2010).
impact on this formation of auditory scenes and awareness of the surrounding environment.It follows that situation awareness, and its related processes, may be affected by hearingloss. Situation awareness is a key element of real-time tasks (Gugerty, 1997), and evensmall disruptions to this psychological state can have profound safety implications in termsof crash risk (Fisher and Strayer, 2014). The investigation of whether impaired hearingaffects successful situation awareness is, therefore, of importance.
The term ‘situation awareness’ has been given a number of definitions, but is mostsimply put as “what is going on around you” Endsley (2000). In earlier work, Endsley(1988) described situation awareness as “the perception of the elements in the environmentwithin a volume of time and space, the comprehension of their meaning and the projectionof their status in the near future”. She subsequently published a conceptual model of howsituation awareness informs dynamic decision making (Endsley, 1995; see Figure 2.14). Themodel suggests that a person’s perception of relevant elements in the environment formthe basis of situation awareness. Specifically Endsley (1995) notes that this information isgauged via in-vehicle system displays, or directly from the senses.
To date, one study has linked a lack of sound in the driving environment to reducedsituation awareness (Walker et al., 2008). The function of the two-part experiment was todetermine which vehicle characteristics had a bearing on the situation awareness of drivers.Walker et al. (2008) hypothesised that feedback from vehicles is important for drivers tounderstand what has been accomplished from their actions whilst driving, and pointedout that a body of research has shown sensitivity of drivers to vehicle feedback whetherit be vibratory, tactile or auditory. Thus, in line with Endsley (1995), their suggestionwas that if perception of relevant elements in the environment were removed, situationawareness would be reduced. This standpoint was compounded by their first experimentin which participants drove their own vehicles (classified as high- or low-feedback from

CHAPTER 2. LITERATURE REVIEW 37
Figure 2.14 A model of situation awareness and how it links to decision making. Source:Endsley (1995).
characteristics such as power to weight ratio, drive, instrumentation and dynamics) andgave a running commentary of their thoughts whilst driving. Walker et al. (2008) performeda thematic analysis on these verbalisations and classified them in to four themes: ownbehaviour, behaviour of the car, road environment, and other traffic. They found thatparticipants with higher feedback cars supplied significantly more information about theroad environment.
Walker et al. (2008) went on to use a driving simulator under a number of differentconditions in which auditory, steering force, and tactile feedback were entirely removedboth individually, and simultaneously, at various points during a drive. They used a‘freeze probe technique’, whereby the simulated environment was randomly frozen, displayscreens were blanked, and participants were asked to rate how confident (on a scale of1–7) they were regarding the presence or absence of probed information in the drivingenvironment. The authors paused the driving scene 36 times during a 30 minute drive,and during each pause 7 relevant probes were selected from a pool of 47 individual itemswhich were developed from a ‘hierarchical task analysis’ of driving (Walker et al., 2001).This process involves the identification of information necessary for the completion ofoperational aspects of driving. Probe items consisted of statements such as: “there’s [somesalient feature] on the [right/left]”, “the road conditions there had a significant effecton the car’s performance”, or “the car felt like it was losing grip”. Results showed that

38 CHAPTER 2. LITERATURE REVIEW
the inclusion of vehicle feedback information in modalities other than visual resulted insignificant improvements in sensitivity to information in the driving environment. Analysesshowed that applying vibratory and steering feedback on top of auditory feedback yieldedno significant improvement in situation awareness over and above simply providing auditoryfeedback alone. The authors argue that these results promote auditory feedback fromvehicles as an important source of environmental information whilst driving.
It is, however, unclear how situation awareness may be impacted by SNHL. In thisexperiment, auditory information was entirely removed, rather than being attenuated,presenting a situation which more closely resembles how profoundly deaf individuals wouldperceive the driving environment. Furthermore, it may be that adaptive driving behaviourswould negate any issues posed by this potential reduction in situational awareness. Thusthe consideration of a reduced situation awareness whilst driving for hearing impairedindividuals is more complex than is suggested by the experimental paradigm used byWalker et al. (2008).
2.4.1.3 Perception of travelling speed
Vehicles inherently create internal noise whilst in motion (Eisele et al., 2005), and pastresearch suggests that the level of noise present reflects our perception of travelling speed.The ability to estimate travelling speed under normal listening conditions appears to beaccurate up to a threshold velocity (approximately 90 km/h), but above this level, speedis increasingly underestimated (Wang and Wang, 2012). However, a number of studiesusing on-road (Evans, 1970; Matthews and Cousins, 1980), driving simulator (Merat andJamson, 2011; Hellier et al., 2011), or video clip methodologies (Horswill and McKenna,1999; Horswill and Plooy, 2008) have generally shown that the louder the noise levelsduring driving, the faster the perception of travelling speed.
Typically these studies have manipulated the level of engine noise present whilst driving,either by attenuating it in some manner, or by removing it completely. When enginenoise is reduced, participants estimate a slower speed (Evans, 1970; Horswill and Plooy,2008), and consequently choose to drive at a faster speed (Matthews and Cousins, 1980;Horswill and McKenna, 1999; Merat and Jamson, 2011; Hellier et al., 2011). This argumentis feasibly transferable to the case of hearing loss, in that the level of car noise is likelyto be lower than it is for a normally hearing individual (given the reduction in hearingsensitivity). As a result, the perception of this demographic should be of a slower travellingspeed, and so this is likely to manifest in an increase in travelling speed.
However, this inference may not hold true when the reduction in vehicle noise is broughtabout by SNHL, which usually occurs in a frequency-specific manner; sensitivity to allfrequencies of sound are not reduced to the same extent, resulting in the equivalent of anaudio filter3 applied to sound. Particularly in the case of age-related, and noise-induced3An audio filter is a device which applies frequency dependent gain/attenuation to a sound source, such thatthe frequency response of a signal can be manipulated. A low-pass filter applies attenuation to frequencies

CHAPTER 2. LITERATURE REVIEW 39
hearing loss, low frequency information will be largely preserved, whereas high-frequencyinformation will be degraded (Gates and Mills, 2005).
This is relevant because recent results suggest that the frequency content of noisein the car can alter the perception of travelling speed; in some cases the reduction ofsound at certain frequencies can actually improve the accuracy with which travellingspeed is estimated. Wang and Wang (2012) performed a video-clip based study wherebythey dubbed real-world recordings of engine noise at different speeds over the top of avisually simulated driving scene. They applied two filters to their sound recordings; low-and high-pass filters using a cut-off frequency of 600 Hz and a third condition providingattenuation across all frequencies. They also collected data from a baseline conditionwhere sound was congruent with the video clips used. Their results exhibited poorer speedestimation when sound was attenuated across all frequencies, but little difference betweenthe other three conditions up to a speed of 100 km/h. Above this threshold speed, however,the high-pass filter condition resulted in an improved accuracy in speed estimation, whereasthe control and low-pass conditions remained similar. Wang and Wang (2012) argue thatspeed estimation has a relationship with the frequency content of interior vehicle noise,and therefore measures aimed at attenuating certain frequencies may actually improvevelocity estimation. The fact that a cut in high-frequency information causes an improvedperception of travelling speed would agree with data which shows that speeding violationsare not significantly higher in the hearing impaired demographic (Picard et al., 2008).
2.4.1.4 Summary of an inability to hear driving-relevant auditory information
The removal of auditory feedback in the driving environment has been shown to leadto reduced situation awareness and an alteration in the perception of travelling speedin normally hearing individuals. It is also suggested that hearing will lead to a reducedaudibility of warning sounds. This work may be applicable to those with hearing loss, ashearing impairment results in a loss of audibility. However, it should be noted that hearingloss does not lead to a complete reduction in audibility, nor does it always manifest in anon-frequency specific manner. Accordingly, these trends may not be entirely replicated asa result of hearing loss.
2.4.2 A disproportionate distracting effect of acoustic information
Alongside an inability to hear auditory information in the driving environment, thereis also concern that sound information which is audible causes a problem for hearingimpaired individuals. McCloskey et al. (1994) touch on this when explaining their findingthat hearing aid ownership increases the risk of road traffic accidents. They argue thatsuperfluous sound emitted by hearing aids may distract hearing impaired drivers. Theirexact reasoning behind this suggestion is not entirely clear, though they cite hearing aid
above a certain cut-off, and a high-pass filter applies attenuation to frequencies below that cut-off.

40 CHAPTER 2. LITERATURE REVIEW
feedback as a source of this disturbance. This would appear to suggest that they viewtransient, non-speech sounds as the most problematic for driver distraction. However,correctly fitted hearing aids should not produce extraneous noise such as feedback (Dillon,2001), particularly given novel techniques aimed at reducing this issue (Guo et al., 2012).
Other authors have argued that the processing of auditory information can be dispro-portionately distracting for the hearing impaired demographic, regardless of hearing aiduse (Hickson et al., 2010; Thorslund et al., 2013b). This line of thinking relies on twounderpinning assumptions: (1) that cognitive engagement in auditory tasks (e.g. conversingon a mobile phone) whilst driving causes changes in driving performance, and (2) thatauditory processing is more ‘effortful’ for people with a hearing loss (Rabbitt, 1991), causingthe performance of auditory-based tasks to be more cognitively demanding. Thus, it issuggested that the extra cognitive demand associated with auditory task performance inhearing impaired individuals will lead to a more marked propensity for driving behaviourchanges compared to normally hearing individuals (Hickson et al., 2010; Thorslund et al.,2013b).
The hypothesis that auditory processing is more effortful for hearing impaired individualsis discussed in depth in Chapter 3, but this section will present work relevant to the specificchanges in driving performance which have been observed in normally hearing individualsas a result of auditory task engagement. It is considered that these changes will be moremarked in the hearing impaired demographic.
2.4.2.1 The effect of auditory task engagement on driving in normally hearingindividuals
A wealth of research has been undertaken to quantify the effect of various auditorydistractions on driving performance in normally hearing individuals. A prime example ismobile phone conversations and their affect on driving performance (e.g. McKnight andMcKnight, 1993; Redelmeier and Tibshirani, 1997; Haigney et al., 2000; Hancock et al.,2003; Strayer et al., 2003; McEvoy et al., 2005; Törnros and Bolling, 2005; Horberry et al.,2006; Horrey and Wickens, 2006; Drews et al., 2008). Young et al. (2007) summarisethat early work in this area suggested an effect of mobile phone conversation on drivingperformance as a result of physical interference caused by handling and manipulating thephone. However, subsequent research has shown that hands-free phone use can also haveserious safety implications as a result of the cognitive demands of engaging in a conversation(Ho and Spence, 2012).
The effects of performing auditory-based cognitive tasks on driving performance wereactually observed as early as 1969 by Brown et al. They asked 24 male drivers to judgewhether a vehicle could be manoeuvred through a set of twenty openings that they hadlaid out on a test track. Some of the openings were just wider than the car, whereas otherswere slightly narrower. At the same time as performing this task, participants were alsoasked to complete a secondary task which involved listening to a statement regarding the

CHAPTER 2. LITERATURE REVIEW 41
order of two letters (e.g. “A follows B - B A”) and answering whether it was true or false.They found that, when completing the auditory task, participants’ judgement of the gapswas impaired, though their ability to steer through them was not. The authors concludedthat automated aspects of driving (such as steering) were not affected by the simultaneousperformance of a cognitive task, whereas perception and decision making abilities were.They hypothesised that this was as a result of repeated attention-switching between visualand auditory modalities. The majority of work which has been performed in this area sincethe study of Brown et al. (1969) has supported their early conclusions (Ho and Spence,2012).
In this vein, Logan and Crump (2009) present a hierarchical control model which Cooperet al. (2013) argue is applicable to driving processes. The model makes a distinction betweenautomated and attentionally controlled processes, suggesting that skilled performance issubsumed by two separate control loops (outer and inner) which are encapsulated (i.e.do not monitor each other). The outer loop is resource demanding, and plays a pivotalrole during the initial learning of a task, whereas the inner loop is automatic and doesnot require attention or effort. This account explains the findings of Brown et al. (1969),because it follows that more automated aspects of driving (e.g. lateral vehicle control;Michon, 1985) will not be affected by cognitive task engagement, as they do not requireattentional control in the first instance. However, the hierarchical control model proposed byLogan and Crump (2009) predicts that when attention is allocated to inner loop processes,their performance actually decreases. It follows that when cognitively engaging tasks areperformed during driving, there will be a reduction in attention that can be allocated toinner loop process, and their performance will actually ‘improve’. Conversely, the reductionin attention allocated to outer loop processes will result in a decrement to their performance.Indeed, a specific pattern of results has been observed in dual-task driving studies wherebyspecific behaviours are observed as a result of auditory task engagement; some exhibiting‘improvements’ in driving skills, and others exhibiting decrements.
One such behaviour that has been established is an increase in gaze concentrationto the road centre, or a decrease in visual scanning (Cooper et al., 2013). For example,Victor et al. (2005) reports a study, performed as part of The Human Machine InterfaceAnd the Safety of Traffic in Europe Project (HASTE), in which participants were askedto perform a continuous memory task whilst driving at three different experimental sites(two fixed-base simulators, and one on-road instrumented vehicle). The task consisted ofremembering a set of target numbers and counting how many times they occurred in arandomly generated list. Eye tracking technology was used to establish where participantswere looking during each experimental condition. The results showed that during auditorytask engagement participants spent significantly more time looking at the road centre, andthe standard deviation of gaze was also significantly reduced under the same conditions.
Similar results of concentrated spatial gaze whilst under auditory task conditions havebeen obtained from a wider set of experimental studies performed in on-road driving settings.

42 CHAPTER 2. LITERATURE REVIEW
Nunes and Recarte (2002), for example, asked participants to drive an instrumented vehicleunder a number of different auditory/cognitive task conditions. They offer little descriptionof the tasks, but do divulge that: “...there were listening and learning audio messages,several verbal production tasks with either abstract or spatial imagery contents, memory,arithmetical calculation etc.” They found that when a demanding secondary task was used,the gaze pattern of participants was significantly more focused on the road centre, andthat this pattern became more marked as the difficulty of the cognitive demand of theauditory task was increased.
Similarly, Harbluk et al. (2007) performed an on-road study of the effects of auditorydistraction on visual behaviour whilst driving. They asked participants to perform a mentalarithmetic task whilst driving, and used two levels of difficulty (single-digit and double-digitnumbers). They also found a propensity for their participants to fixate directly aheadsignificantly more often when performing the secondary task. Additionally they noted thatthe more difficult the cognitive task, the greater the effect on visual attention. Figure 2.15exhibits the results obtained, showing an increased rate of fixations on central visual areaswith a concomitant decrease in monitoring of peripheral areas, mirrors and the drivinginstruments. They also exhibit an exacerbation of this trend under more difficult taskconditions.
In explanation of this phenomenon, Jamson and Merat (2005) argue that “drivers,either consciously or subconsciously [develop] a strategy to reduce primary task load whilstperforming concurrent secondary tasks” in order to “[attempt] to free up resources for thesecondary task by simplifying the primary task”. They go on to infer that auditory taskengagement leads to ‘cognitive narrowing’, whereby visual resources are focused more tothe area of greatest interest and hazard likelihood - the lead vehicle. This explains theresults summarised here that show a reduced span of visual scanning during auditory taskengagement.
Visual scanning whilst driving is, however, of paramount importance given that theperformance of several visual functions degrade towards the periphery of the visual field(Findlay and Gilchrist, 2003). Victor et al. (2005) therefore state that delays in reactiontimes to critical events strongly depend on instances of looking away from the immediateroad scene and scanning for such occurrences. Indeed, the reduction in visual scanningtriggered by cognitive task engagement whilst driving appears to lead to failures of visualattention.
Strayer et al. (2003) examined how mobile phone conversations affected drivers’ attentionto objects encountered whist driving. They used a car following paradigm in a high-fidelitydriving simulator. During their experiment, a lead vehicle would suddenly brake at randomintervals, and when participants applied their brake, sped back up to its constant travellingspeed. At points in the experiment, participants were asked to hold a hands-free mobilephone conversation with an experimenter. The density of traffic on the road was alsomanipulated to give two different conditions: low and high density. Participants drove

CHAPTER 2. LITERATURE REVIEW 43
Figure 2.15 The change in the proportion of time drivers spend looking at areas of interestas a result of performing an auditory task whilst driving. Source: Harbluk et al. (2007).
this simulated environment, without prior knowledge that their recall of objects in thedriving scene would be subsequently tested. Once the drive had finished, the authors askedparticipants to discriminate billboards which had been present in the driving scene fromfoils which were not. They contrasted the successful recall of billboards in a conditionwhere participants were conversing on a mobile phone against a control condition, andfound a significantly lower successful recall rate in the auditory task condition.
The ramification of such failures of visual attention is that drivers will be unable to reactto salient events as quickly as they might without a cognitive task simultaneously present.It should be noted, however, that some work has suggested that cognitive distraction maynot interfere will all types of salient event. Specifically, cognitive distraction may focusattention toward the road centre, reducing the number of glances away from the roadway(see e.g. Jamson and Merat, 2005). This potentially has the capacity to cause some eventsto become more salient in the presence of cognitive distraction, in turn decreasing reactiontimes to them (see e.g. Victor et al., 2015). However, Strayer et al. (2003) found thatparticipants were more likely to crash in to the lead vehicle whilst conversing on themobile phone during high traffic density situations. They also found that, regardless oftraffic density, brake reaction times were slower during the phone conversation condition.An increased traffic density exacerbated this trend. Other research has also shown thatengagement in cognitively demanding auditory tasks leads to a reduced reaction to eventsin the driving environment.
Lamble et al. (1999) investigated drivers’ ability to detect the deceleration of a lead carwhist undertaking mobile phone related tasks. They performed an on-road study in which

44 CHAPTER 2. LITERATURE REVIEW
they asked participants to follow a lead vehicle (driven by an assistant) on a 30km section ofmotorway. The experimental vehicle was equipped with dual-controls, and an experimenter(seated in the passenger seat) positioned the vehicle 50m behind the lead vehicle andengaged cruise control prior to the start of each experimental trial. The participant wasasked to follow the lead vehicle, whilst cruise control was still engaged, with his or her footabove the brake pedal, and to brake as soon as the lead vehicle started to decelerate. Theyasked participants to perform a number of different tasks whilst driving, one of which wasthe Paced Auditory Serial Addition Task (PASAT) in which the experimenter sat in thepassenger seat called out random integers between 1–9 one at a time, and the participanthad to add the two most recent numbers together. A significantly smaller time to collisionwas noted when participants performed PASAT whilst driving than when they drove in asingle-task condition. Brake reaction times were also significantly slower for participantswhen they performed PASAT.
As part of HASTE, Jamson and Merat (2005) examined the alterations to drivingperformance that were brought about by the performance of a visual or a non-visual(auditory) cognitive task in a simulated driving environment. They asked 48 participantsto drive a simulator whilst simultaneously completing an auditory secondary task, theAuditory Continuous Memory Task (aCMT), which involved memorising a number ofcomplex sounds and keeping a mental tally of how many times each occurred within a list.This was an adaptation of an earlier visual version of this task (Veltman and Gaillard, 1998).Participants were asked to follow a lead vehicle on a single-carriageway, the time headway ofwhich was manipulated to be 3s. At some points during the drive, the lead vehicle rapidlyreduced its speed, meaning that participants had to brake to avoid a collision. Jamson andMerat (2005) found that, as this auditory task was made more difficult (by increasing thenumber of target sounds), participants had increasingly slower brake reaction times, andwere therefore increasingly closer to colliding with the lead vehicle. However, they alsofound that participants adopted an increasingly longer headway. Alm and Nilsson (1995),argue that longer following distances can be associated with an increased ‘safety buffer’, asthey give drivers more time to react to sudden changes in behaviour of the lead vehicle.
Other authors appear to share a similar viewpoint, providing similar explanations afterhaving noted more variable longitudinal vehicle control during cognitive task engagement.Haigney et al. (2000), for example, asked thirty participants to undertake four simulateddrives whilst they performed a grammatical reasoning task. The auditory task led tosignificantly slower mean speeds and less standard deviation of accelerator travel. Haigneyet al. (2000) argue that this speed reduction was a compensatory strategy to minimiserisk which had arisen as a result of an increased mental workload during the auditorytask. They also hypothesise that the reduction in deviation of accelerator pedal travel isindicative of a reduction in driver reactivity to road or traffic conditions during cognitivetask engagement.
Strayer and Drew (2004) noted a similar trend. In a driving simulator, the authors

CHAPTER 2. LITERATURE REVIEW 45
asked participants to follow a lead vehicle whilst conversing on a hands-free mobile phonewith an experimenter. The lead vehicle was programmed to brake at random intervalsthroughout the drive, and when participants deployed the brake to avoid a collision, thelead vehicle accelerated back to travelling speed. If a participant did not deploy the brake, acollision would take place. Strayer and Drew (2004) found that, during periods of auditorytask engagement, their sample adopted a longer headway to the lead vehicle. They arguethat this was a compensatory strategy to give drivers an additional buffer for respondingto unpredictable events.
These compensatory behaviours may have the capacity to nullify negative effects ofauditory task engagement whilst driving. As a result of the increased accident risk that hasbeen identified by laboratory studies investigating the effect of mobile phone conversationon RTAs, legislation has been implemented outlawing the use of hand-held mobile phoneswhilst driving. However, recent results from naturalistic driving studies, where driversare able to make their own decisions about when to engage in mobile phone conversation,actually support a ‘protective’ effect of hands-free mobile phone use, whereby drivers havebeen found to be at lesser risk of RTAs whilst conversing hands-free (Dingus et al., 2006;Olson et al., 2009; Hickman et al., 2010). There are a number of explanations why thistrend may have emerged, but one explanation is that drivers adapt their driving behaviourin order to negate negative effects of mobile phone conversation (Metz et al., 2015).
As well as longitudinal vehicle control, it appears that the reduction in visual scanningoccurring as a result of cognitive task engagement also affects lateral vehicle control. Asresearch has shown a concurrence between an increased gaze concentration on the roadcentre and improved lateral vehicle control (Engström et al., 2005b), Jamson and Merat(2005) suggest that this cognitive narrowing “indirectly leads to a superior perception ofthe roadway, allowing an improvement to the lane keeping performance of the driver”.Cooper et al. (2013) questioned whether the improvement in lateral vehicle control mightresult from drivers’ propensity to steer in the direction of gaze; straight ahead underconditions of cognitive workload. However, their subsequent investigation, in which theymanipulated workload and eye movements independently, suggested that eye movementsonly have a small role to play in the improvement of lateral vehicle control. Thus, theyconcluded that the effect of cognitive workload on lateral vehicle control is independent ofeye movements. Regardless, there are examples of lateral vehicle control improvements asa result of cognitive task engagement in previous studies.
Brookhuis et al. (1991) performed an on-road experiment using an instrumented vehicleto study the effects of operating hand-held and hands-free mobile phones whilst at the sametime driving in three different traffic situations: light traffic on a relatively quiet motorway,heavy traffic on a four-lane ring-road, and in city traffic. The authors asked participantsto perform the PASAT task, which was presented aurally. As a result of performing theauditory task, participants had a smaller standard deviation of lane position, particularlywhilst driving on the motorway.

46 CHAPTER 2. LITERATURE REVIEW
Jamson and Merat (2005) showed a similar trend in their simulator experiment. Al-though they noted a reduced reaction time which concurred with an increase in demand oftheir auditory task, they also noticed a greater stability of lateral position within theirlane. Their results showed that, as the demand of the auditory task was systematicallyincreased, the standard deviation of lane position was increasingly decreased. Furthermore,Jamson and Merat (2005) noted a similar trend for minimum time to line crossing data,suggesting that auditory task engagement reduces the likelihood that drivers will deviatefrom their lane of travel.
Engström et al. (2005b) also noted the trend of a reduced degree of lateral deviationduring periods when drivers were under conditions of auditory task engagement. As partof HASTE, they used two different driving simulators (fixed-base and moving-base) anda field study in order to investigate the effect of in-vehicle information systems on eyemovements and vehicle control measures. In all three cases, participants were asked todrive a motorway route whilst concurrently undertaking supplementary tasks. One of thetasks they asked participants to perform whilst driving the simulator was a memory taskpresented in the auditory modality; memorising a number of target sounds and keeping amental tally of how many times these occurred throughout a list. Results from the twosimulator studies showed a significant reduction in lane deviation, and the field trial showeda propensity for this to be the case, although the data did not reach significance.
Cooper et al. (2013) summarises that perceived unsafe or dangerous driving practices(such as driving and conversing on a mobile phone) actually lead to an “improvement” inlateral vehicle control.
Summary of driving outcomes as a result of auditory task engagement in nor-mally hearing individuals
Research shows that auditory task engagement leads to a number of effects on measures ofdrivers’ performance and behaviour. These effects all appear to be linked, and arise froman alteration in visual behaviour, whereby visual scanning is reduced and individuals fixatemore exclusively on the point directly in front of their vehicle.
1. Reduced visual scanning, which leads to;
2. Failures of visual attention, causing;
3. Reduced reaction times, which mean that drivers adopt;
4. Lower speeds and longer following distances;
5. But this visual behaviour also leads to improved lateral vehicle control.
Increasing the demands of the auditory task leads to a more marked trend of someof these observations (Jamson and Merat, 2005; Harbluk et al., 2007). It follows thatthe increased demand posed by SNHL will also lead to a more marked trend of these

CHAPTER 2. LITERATURE REVIEW 47
observations, as it will essentially raise the demands of the auditory task being undertakenconcurrently with driving. There is very little work, however, that has been performed toinvestigate this inference. A number of authors have raised the demands of an auditorytask by making the cognitive processing associated with it more difficult; e.g. Harbluk et al.(2007) asked participants to add together double-digit, rather than single-digit, numbers.However, very little work has assessed the effect of making the perception of sound thesource of increased task difficulty; this is the primary concern for hearing impaired drivers.Some research has been carried out to this end, but it largely neglects suprathresholdcomplications associated with SNHL, and does not assess the above aspects of drivingexplicitly (Baldwin and Struckman-Johnson, 2002; Baldwin, 2007). Regardless, this work isof interest because it assesses the effect of stimulus presentation level, essentially emulatingthe reduction in sensitivity aspect of SNHL.
The effect of reduced auditory stimulus presentation level on auditory distrac-tion whilst driving
In a dual-task, low-fidelity driving simulator study, Baldwin and Struckman-Johnson (2002)investigated the alteration in mental workload by different presentation levels of auditorystimuli (in the range 45–65 dB). They argued that an optimal presentation level range forauditory-based systems has been established, but that variations within this range mighthave an impact on cognitive workload. Accordingly, they asked 28 participants with normalhearing to drive a vehicle on a computer game at a steady speed, whilst they simultaneouslyperformed an auditory task. The auditory task consisted of 3–4 word statements, andparticipants were required to decide whether they made sense (e.g. stimulus: “dogs havefive legs”; response: “false”). Baldwin and Struckman-Johnson (2002) measured the numberof crashes and off-road occurrences (defined as the number of times the participant ranoff the road) during dual-task conditions. They found no significant effect of stimuluspresentation level on these measures of driving performance. They did, however, findthat at higher presentation levels, participants made fewer sentence processing errors andresponded faster than they did at lower presentation levels. However, when the listeningtask was performed as a single-task paradigm, this trend was not apparent. This suggeststhat hearing impaired individuals, who have a lower auditory sensitivity, are likely to makemore auditory processing errors and respond more slowly to auditory information whilstdriving.
Baldwin (2007) investigated the effect of altering stimulus presentation level (in therange 60–70 dB SPL) on the reaction time to-, and accuracy of, a tone matching task inwhich participants had to say whether musical notes presented differed from a referencestored in memory. The main aim of her study was to examine the effect of stimulusintensity of echoic persistence, but she used a concurrent simulated driving task to loadparticipants’ processing resources. A low-fidelity driving simulator was used, and Baldwin(2007) recorded the number of times a single tire crossed a lane demarcation (a minor

48 CHAPTER 2. LITERATURE REVIEW
lane deviation), the number of times the vehicle’s centre-line crossed a lane demarcation(a major lane deviation), and the number of times more than one major lane deviationtook place within a single instance (e.g. the centre of the car crossed the left and thenright lane demarcations). Again, none of these measures were significantly altered by achange in the presentation level of auditory stimuli, but performance on the auditory taskwas; participants performed more quickly when stimuli were presented at higher levels.Baldwin (2007) argued that echoic persistence is related to presentation intensity, and thatbecause of this, under low presentation level conditions, extra effort needs to be applied tospeech processing. In turn, this will reduce the resources available for the performance ofconcurrent tasks, and may manifest in their performance being affected. This suggests thathearing impaired individuals, who have a lower auditory sensitivity, are likely to experiencethis type of performance decrement more often than their normally hearing counterparts.
This work does not explicitly link to all of the driving behaviour changes describedabove, but the measurement of lane deviations does link to an improvement in lateralvehicle control. Because Baldwin and Struckman-Johnson (2002) or Baldwin (2007) didnot find a change in this variable as a result of auditory task presentation level, it suggeststhat a reduction in auditory sensitivity is unlikely to manifest in changes to lateral vehiclecontrol. As the improvement in lateral vehicle control is possibly linked to changes in eyemovement behaviour, it also suggests that auditory sensitivity will not have a bearing oneye movement behaviour, and its associated driving behaviour outcomes. Taken in isolation,this study could, therefore, be evidence that increased task difficulty as a result of perceptualchanges may not affect driving performance. However, it may be that lane deviationsmay not be a sufficiently sensitive measure to show this improvement in lateral control.Furthermore, the reduction in presentation level might relate to a reduction in auditorysensitivity, but it does not incorporate the array of sensory problems which SNHL presents.This aspect is considered pertinent, given the influence that suprathreshold complicationsassociated with SNHL have on speech understanding. Some work has, however, begun toinvestigate the effect of cognitive task engagement on driving performance and behaviourin individuals with a SNHL. This work does take in to account all of the perceptualconsequences associated with SNHL, and presents a different outcome.
2.4.2.2 The effect of hearing loss on auditory task engagement whilst driving
Hickson et al. (2010) investigated the effect of distraction on the driving of hearing impairedindividuals and hypothesised that auditory task performance would have a disproportionateeffect on them. They recruited 107 drivers aged between 62–88 years and undertook threedifferent measures of hearing impairment: audiometry, speech testing, and self-reportedproblems (measured using the HHIE). The sample constituted a range of hearing losses, witha mean better-ear pure tone average of 27.0 ± 14.5 dB HL (range 2.5–82.5) at frequencies of500, 1000, 2000, and 4000 Hz. 45% of the sample had some degree of hearing impairment,while fewer than 5% had a hearing loss of a severe or profound nature. 78% of the sample

CHAPTER 2. LITERATURE REVIEW 49
had bilaterally symmetrical hearing thresholds. Of the 48 participants who had somedegree of hearing loss in the study, Hickson et al. (2010) identified 46 of them as having asensorineural origin, thus the results of the study largely reflect the effects of SNHL ratherthan conductive hearing loss.
The experimental closed-road circuit used by Hickson et al. (2010) was 5-km long andwas representative of a rural road, free of other vehicles. Along this course three tasks wereincluded for completion by participants:
1. 54 road signs were located along the driving course containing a total of 77 piecesof information (e.g. stop, give way). Participants were asked to report back thisinformation as and when it occurred;
2. Large, low-contrast foam rubber pads were placed across the centre of the drivinglane to act as hazards. Participants were asked to report the presence of these pads,and avoid hitting them;
3. Pairs of cones were strategically placed in the roadway to create ‘gates’ for thevehicle. These gaps varied in their width producing gates which were not wideenough, just wide enough, and obviously wide enough for the test vehicle to passthrough. Participants were asked to report whether gaps were big enough to fit theirvehicle, and (if so) to drive through. Where the gaps were perceived to not be bigenough, participants were instructed to drive around the pair of cones.
Hickson et al. (2010) used success on these three tasks, alongside the time taken to completethe road course as measures of driving performance. They also derived an overall drivingz-score, which was a composite of the previous four measures (with each given an equalweighting). Participants were asked to drive this course three times in a randomisedorder; once without distraction, once with an auditory distraction, and once with a visualdistraction. The distraction task was similar between the visual and auditory conditions,requiring participants to add two random numbers together. In the auditory conditionthese numbers were presented in the auditory domain at a comfortable listening level(the authors did not divulge the method of presentation), and in the visual condition thenumbers were presented on a liquid crystal display mounted on the dashboard of the vehicle(just to the left of the steering wheel, slightly below driver eye height).
Although both the visual and auditory tasks required cognitive effort, it was hypothe-sised that hearing impaired individuals would require a greater cognitive effort than theirnormally hearing counterparts to complete the auditory task, given the listening demandsthat hearing loss poses (see e.g. Sarampalis et al., 2009). However, a similar level ofcognitive effort was expected on the visual task for both normally hearing, and hearingimpaired individuals. The authors therefore expected that, as a result of an increase ineffort required to perform the auditory task, hearing impaired participants would be moreaffected by auditory task engagement than normally hearing participants, but affected tothe same extent as their hearing counterparts by the visual task.

50 CHAPTER 2. LITERATURE REVIEW
In order to establish the most predictive measure of hearing loss for driving performance,bivariate correlations between the overall driving z-score and the different measures ofhearing function were performed. Although no single measure significantly predicted overalldriving performance when controlling for age, better-ear pure tone average thresholds werefound to be most strongly correlated with the driving z-score. As a result, subsequentanalyses were performed between two groups which were established through better-earpure tone audiometry data: those with normal hearing/mild hearing loss and those whohad a moderate/severe hearing loss.
The authors found a main effect of distraction, in that overall z-scores were reducedduring the performance of either the visual or auditory secondary task (see Figure 2.16).However, there was no difference between the visual and auditory conditions, suggestingthat the auditory and visual tasks had a comparable effect on overall driving performance.An effect of hearing loss level was also apparent, such that those with a moderate-severehearing loss were compromised to a far greater extent when required to undertake either ofthe secondary tasks whilst driving. However, there was no interaction between hearing lossand secondary task type, meaning that the visual distraction had just as much of a negativeeffect on the driving performance of hearing impaired individuals as did the auditorysecondary task. These results are curious, as they suggest that the driving performance ofhearing impaired individuals is compromised to a greater extent than normally hearingindividuals as a result of visual distraction. This was not expected, given the hypothesisthat it is an increased effort in processing auditory information which underpins drivingperformance decrements. However, the authors offer no explanation as to why this mayhave been the case, but it is considered that there must have been some differences betweenthe two experimental groups beyond their hearing capabilities.
(a) Overall Z-score (b) Number of signs recognised
Figure 2.16 The overall Z-scores and number of road signs recognised by the two exper-imental groups under different conditions in the study of Hickson et al. (2010). Source:Hickson et al. (2010).
The time taken to complete the course was significantly increased by visual distraction(but not by auditory distraction). The number of road signs recognised was also significantly

CHAPTER 2. LITERATURE REVIEW 51
decreased by visual distraction, but to an even greater extent by auditory distraction forall participants. This is in line with the previously noted patterns of failures in visualattention as a result of auditory task engagement in normally hearing individuals. Furtherto this trend, a significant influence of hearing loss on road sign recognition was also noted,whereby significantly fewer road signs were recognised by the hearing impaired group whilstperforming either the visual or auditory secondary tasks.
However, for the hearing impaired group, the difference in road sign recognition wasnot significantly different between the visual and auditory distracter conditions, thoughthe trend for fewer signs to be recognised in the auditory task condition did approachsignificance (p = .08). Again these results are curious as they exhibit a disproportionateeffect of visual task engagement in the hearing impaired sample, a trend which was nothypothesised.
Hickson et al. (2010) argue that their results show driving performance decrementsfor people with a moderate to severe hearing loss when they perform concurrent tasks.Accordingly, they suggest that this demographic should be advised not to engage incognitively challenging tasks whilst driving.
This study only used older participants, so it is likely that the demographic studiedconsisted primarily of those with an age-related hearing loss. This assertion fits with themajority of the sample exhibiting a SNHL. Age-related hearing loss may have some uniquephysiological features, such as the development of central auditory processing problems(Humes et al., 2012), and so information from Hickson et al. (2010) cannot be generalisedto the hearing impaired population as a whole who may not exhibit these physiologicalchanges. Accordingly, whilst these shortcomings in driving performance could explain theresults of studies which have shown an increased accident risk in older hearing impairedindividuals (Ivers et al., 1999), they may not necessarily be relevant to the younger hearingimpaired demographic (Barreto et al., 1997; Picard et al., 2008).
Furthermore, it is unclear how these findings may transfer to a more ecologically validsituation. These findings were apparent in a driving environment void of any other traffic,or real risk of crashing. Thus, participants may have been more inclined to engage fullywith the secondary task. Indeed, the results suggest that people obliged in performingthe secondary task reliably, with an overall accuracy of 67% on all sums presented. Theperformance decrements associated with secondary task engagement may lead hearingimpaired individuals to withdraw from this behaviour whilst on the road, or adapt theirdriving style so that it is more cautious (e.g. slower speeds, more vigilant visual behaviouretc). This could potentially negate the effect of distraction noted by Hickson et al. (2010)so that it is no longer an issue.
This notion has, in fact, been observed by another research group investigating drivingperformance decrements as a result of hearing loss (Thorslund et al., 2013a,b, 2014),suggesting that hearing impaired individuals exhibit an altered driving behaviour in orderto counteract the negative consequences of hearing loss for driving.

52 CHAPTER 2. LITERATURE REVIEW
Thorslund et al. (2013b) performed a study which investigated the effect of cognitiveworkload on driving in situations of varying complexity. The authors asked a normallyhearing group (n = 24) and a hearing impaired group (n = 24) to drive a simulatedenvironment in which they presented drivers with impending near-collision events. Thiswas achieved in one of two manners:
1. Critical event: participants had their visual attention taken away from the roadscene by performing a secondary task on a screen placed at a large downward angle(40◦–45◦). Whilst this happened a manipulation of the steering angle was introducedinto the simulated vehicle such that it was ‘pushed’ towards an oncoming vehicle.This presented participants with a situation in which they needed to take evasiveaction quickly.
2. Parked car event: A parked car with its warning lights flashing was seen at a distanceof 360m and (for trials incorporating the secondary task) when the distance from thecar reached 70m, participants were asked to perform a secondary task.
In both of these situations, the secondary task consisted of four letters presented in sequenceon a screen in the car cabin, with participants asked to repeat them back in order. Thedifficulty of the task was manipulated through the phonological similarity effect (Conradand Hull, 1964), such that some lists were phonologically alike (e.g. B-D-P-T) and otherswere not (e.g. R-K-N-J).
It is curious that the authors used a visually delivered secondary task, but hypothesisedthat persons with a hearing loss should be more distracted by this secondary task, giventhat aspects of the auditory processing system deteriorate as a function of poor auditorystimulation (Andersson, 2002). Therefore, Thorslund et al. (2013b) reasoned that thestorage of these letters in memory and their subsequent retrieval would be compromised,particularly when the letters being stored were phonologically similar. The secondary taskwas also administered during baseline driving, when neither the parked car or critical eventwas present.
Driving performance measures were compared between both experimental groupsduring the critical and parked car events, but also during baseline driving (driving whilstperforming the secondary task, but without the critical or parked car event occurring).
Thorslund et al. (2013b) outlined a number of expected observations. They hypothesisedthat hearing impaired participants would show a more cautious driving style in which speedand the motivation to perform the secondary task would be lower, and safety marginswould be larger. They also thought that increasing the demand of the secondary taskwould have a greater effect on the hearing impaired participants. Finally, they expectedthat increasing the complexity of the driving situation (e.g. as a result of the parked car orcritical event) would have more of an effect in the hearing impaired participants such thattheir brake distance before the parked car would be longer, their driving speed around itwould be slower and secondary task performance would be worse. Performance correlates

CHAPTER 2. LITERATURE REVIEW 53
for these three main hypotheses are shown in Table 2.3, which also shows the authors’observed results in relation to these hypotheses.
Table 2.3 The experimental expectations of Thorslund et al. (2013b) and a summary ofwhether their results support these as a result of significant statistical tests.
ExpectationPerformance correlatesfor hearing impairedparticipants
Significantdifferenceobservedfrom data?
Hearing impaired drivers will show a morecautious driving behaviour
Lower driving speed Yes
Larger safety margins withintravelling lane No
Lower motivation to performsecondary task Yes
The effect of increasing the complexity ofdriving situations will be larger for thehearing impaired participants
Braking distance beforeparked car longer No
Driving speed around theparked car slower Yes
Worse secondary taskperformance when underdual-task conditions
Yes
Increasing secondary task complexity willhave more of an effect on hearing impairedparticipants
Effect of phonologicalsimilarity effect greater forthose with hearing loss
Yes
When performing the secondary task under baseline driving conditions (with a con-current secondary task, but no critical or parked car event), hearing loss was found tosignificantly reduce the speed at which participants drove by an average of 6 km/h. Hearingimpaired drivers also had a significantly smaller time to line crossing when performing thesecondary task than did the normally hearing group (by approximately 1 second).
In terms of the performance on the secondary task itself during baseline driving, thenormally hearing group had a significantly higher percentage of correct responses comparedto the hearing impaired group. The hearing impaired group also skipped significantly moreletters than their normally hearing counterparts.
Whilst driving around the parked car and performing the secondary task, hearingimpaired individuals drove significantly slower, on average, than their hearing counterparts.This difference in speed was approximately 5 km/h. Under this driving condition therewere no differences noted in the performance of the secondary task, itself, between thehearing loss and normally hearing groups.
Thorslund et al. (2013b) did not present driving variables during the critical event,

54 CHAPTER 2. LITERATURE REVIEW
but did present the effect this driving event had on secondary task performance; hearingimpaired drivers were significantly poorer in their performance of the secondary task,skipping more of the letters presented and recalling less correct letters. Furthermore,when the difficulty of the secondary task increased (through the phonological similarityeffect), the hearing impaired participants were affected more than the normally hearingparticipants. This was evidenced by the statistical interaction between hearing loss andtask difficulty, when the number of skipped letters was analysed.
The results of Thorslund et al. (2013b) corroborate those of Hickson et al. (2010), inthat secondary task engagement had a disproportionately negative effect on the drivingof hearing impaired individuals. However, the specific measures which differed did notmatch between the two studies; whilst Thorslund et al. (2013b) found an effect of cognitivetask engagement on travelling speed, Hickson et al. (2010) did not. Furthermore, whilstHickson et al. (2010) found no difference in the performance of their secondary task betweenexperimental groups, Thorslund et al. (2013b) found that hearing impaired drivers wereless able to perform the secondary task whilst driving.
These differences are not likely to have occurred as a result of the variation in drivingscenarios used. Although Thorslund et al. (2013b) used two specific near-collision events,they also measured driving performance in a baseline condition in which no near-collisionevents were presented, and participants were simply required to drive and perform thesecondary task. During this condition participants still exhibited reduced driving speedand less engagement in the cognitive task. This condition was considered comparable tothe situation studied by Hickson et al. (2010), which involved general driving with somespecific tasks (related to everyday driving) interspersed.
A possible reason for the discrepancy in findings between these two studies might havebeen a distinct difference in the delivery of cognitive tasks used. Whilst both studiesinvolved secondary tasks which involved phonological processing, the task used by Hicksonet al. (2010) was delivered in the auditory modality, whereas Thorslund et al. (2013b)delivered theirs in the visual modality. However, Hickson et al. (2010) also includeda visually presented version of their secondary task and assessed its effect on drivingperformance. Participants took significantly longer to complete the course in the visualdistracter condition, but, contrary to the results of Thorslund et al. (2013b), there was nosignificant interaction of hearing loss with this dependent variable.
The fact that a visually presented distracter had a disproportionate effect on the roadsign recognition task (Hickson et al., 2010), and on the travelling speed and secondarytask performance (Thorslund et al., 2013b) of hearing impaired participants is of concern;as perception in the visual modality should be comparable between hearing impaired andnormally hearing subjects. Thus it is possible that factors extraneous to hearing lossmay have had an influence on study outcomes, or that the premise behind the hypothesisproposed by Hickson et al. (2010) is incorrect.
Thorslund et al. (2013b) cite work performed by Andersson (2002) as their reason

CHAPTER 2. LITERATURE REVIEW 55
for expecting a difference in the driving performance of hearing impaired and normallyhearing individuals. Andersson (2002) showed that a small number of participants (n = 16)with an acquired severe hearing loss in older adulthood (average thresholds at 0.5, 1,and 2 kHz were all greater than 85 dB HL) were significantly slower and less accuratethan a normally hearing group at rhyme judgement and generation. He argued that thiswas because the hearing impaired participants had poor phonological representations intheir mental lexicons. Lyxell et al. (2003) went on to summarise that the deteriorationof these representations is progressive; indeed Classon et al. (2013) state that mentalrepresentations of both speech sounds and non-speech sounds become less well-defined as aresult of cumulative years with an impoverished auditory input.
However, the serial recall task used by Thorslund et al. (2013b) is incongruent withthe findings of Andersson (2002). Andersson (2002) showed no difference between theirhearing impaired and normally hearing participants on a letter span task, regardless ofthe phonological similarity of stimuli, and concluded that the verbal working memory ofhearing impaired individuals was intact. Accordingly, there should have been no differencein the groups studied by Thorslund et al. (2013b), as the task used was not explicitlytapping phonological representations in the lexicon. Furthermore, Thorslund et al. (2013b)specifically recruited participants with a moderate hearing loss (average absolute thresholdsof 41–70 dB HL), whereas the results of Andersson (2002) were only apparent in subjectswho had pure tone thresholds of ≥ 85 dB HL. These discrepancies cast doubt over thehypothesis presented by Thorslund et al. (2013b).
In a subsequent investigation, Thorslund et al. (2014) analysed eye tracking datacollected during their earlier study (Thorslund et al., 2013b). Eye movements duringbaseline driving, and during periods of driving where they had asked participants to performa secondary task were analysed. They found that during secondary task engagement, hearingimpaired drivers made significantly more glances to their rear view mirrors than underbaseline driving conditions (in this case twice as much). This was also noted to be thecase for glances in the left and right wing mirrors. None of these trends were apparent fornormally hearing participants.
Thorslund et al. (2014) also showed that during the critical event (which required adeviation of gaze from the driving scene), hearing impaired drivers looked away from theroad more often than those with normal hearing. However, these glances away from theroad were shorter for the hearing impaired group than the normally hearing group. Theauthors suggested that this type of visual behaviour occurred because hearing impairedindividuals are reluctant to look away from the driving scene, given that they are likely tocompensate for a lack of audibility by visually checking for potential hazards which normallyhearing individuals might be aware of aurally. However, although differences in visualscanning were not entirely evident from the data, the authors did notice a propensity fortheir hearing impaired sample to spend more time checking all directions before deviatingtheir view from the straight ahead position. They argue that this is a cautious approach

56 CHAPTER 2. LITERATURE REVIEW
to driving during secondary task engagement, again because hearing impaired individualsappeared to be visually scanning for hazards which could otherwise be aurally perceived.Interestingly, this cautious approach to driving was also apparent during baseline driving(without a concurrent secondary task). Thorslund et al. (2014) found that hearing impairedparticipants made significantly more glances towards their rear view mirrors than did thenormally hearing participants whilst under baseline driving conditions. The significantdifference in eye movement behaviour under baseline driving conditions, and the results ofan earlier field trial in which no secondary task was used (Thorslund et al., 2013a; discussedin the following section), suggest that adaptive driving behaviour may be present in thehearing impaired demographic when there is no concurrent cognitively engaging auditorytask present.
A change in baseline driving behaviour as a result of hearing loss
In one study, Thorslund et al. (2013a) investigated the driving performance of hearingimpaired individuals to understand the design needs of support systems for hearing impaireddrivers by contrasting driver preferences and performance metrics associated with a stand-alone visual route guidance system, and the same system supplemented by a tactilesignal.
A normally hearing and hearing impaired group (16 participants in each) with meanages of 56.4 years and 52.5 years respectively, were asked to drive an instrumented vehiclearound a pre-defined road course in Linköping, Sweden. The course was indicated toparticipants either via either of the two route guidance systems. The authors wishedto establish whether there were differences in driving behaviour between each systemconfiguration.
An experimenter, seated in the passenger seat of the car, recorded driving behaviour andperformance using a previously developed protocol (Selander et al., 2011). This protocolcomprised of a matrix which covered driving behaviours regarding: manoeuvres, attention,position, speed adjustment, interaction and planning. These behaviours were graded in anumber of driving scenarios: roundabouts, crossings, traffic lights, straights, speed bumps,and “other”. Each time a driving error was made, the experimenter noted this in therelevant position on the matrix. It should be noted that the protocol is unpublished, butis in use at a driving assessment centre in Stockholm, Sweden.
Participants also wore eye-tracking SMI ETG glasses (SensoMotoricInstruments, 2013)for all conditions, and a frame-by-frame analysis of the eye tracking video data (30 Hz)was undertaken by an assessor blinded to the groups and task. Data was coded by theexperimenters to identify the percentage of time participants spent looking at, the durationand frequency of glances towards specific regions of interest: windscreen, speedometer,navigation system, rear view mirror, left window and mirror, right window and mirror, and‘other’. A hardware GPS-based data logger was also used to collect objective speed dataabout the drive.

CHAPTER 2. LITERATURE REVIEW 57
Results showed that hearing impaired drivers travelled significantly slower than thenormally hearing participants (approximately 4 km/h less) during 70 km/h speed limitedsections of road. Although a similar trend was noted in 50 km/h speed limited sections(hearing impaired drivers were approximately 2 km/h slower), this difference did not reachstatistical significance. The experimenter also rated hearing impaired drivers as beingsignificantly more likely to drive too slow, and have an uneven speed control. Additionally,hearing impaired drivers spent a significantly greater percentage of their time in the vehiclelooking in their rear view mirror than normally hearing participants (1.4% more) andperformed this action on average three times more frequently (0.3 compared to 0.1 timesper minute).
The authors maintain that their results support an alteration in driving behaviourin hearing impaired individuals, whereby a more cautious approach to driving is taken.Although a measure of situation awareness was not made in this experiment, Thorslundet al. (2013a) comment that it is a reduced situation awareness in the driving environmentwhich causes an adaptation in driving behaviour as a compensatory method.
It is unclear whether this adaptive driving behaviour is undertaken consciously orsubconsciously, however one study can inform this consideration. Holland and Rabbitt(1992) evaluated older individuals’ (age range 50–80 years) awareness of their sensoryabilities and the extent to which these govern changes to driving behaviour and self-reported accident rates. Alongside collecting pure tone audiometry data, Holland andRabbitt (1992) asked 68 participants whether they thought their hearing had worsened overthe prior ten years, whether they found it difficult hearing in background noise, and whetherthey often misheard speech in conversations. They also gathered information about howfar people drove in a year, their driving experience, motorway use, whether any changes todriving patterns had been made, whether various errors (such as misreading signs) werecommonly experienced during driving, and the anxiety of participants when driving incertain situations. Self-reported accident data was also included on the questionnaire, aswas a section addressing attitudes toward certain issues such as what they thought werethe causes of increased accident rates amongst older drivers.
Results showed a significant correlation between pure tone audiometry data and answersto self-assessments of hearing. However, those reporting that they had poor hearing didnot report making any changes to their driving behaviour or an increase in road trafficaccidents. Thus, the adaptive driving behaviour of which Thorslund et al. (2013b,a, 2014)talk appears to be subconscious in nature, as those with a hearing loss do not divulgeknowingly making changes to their driving behaviour.
2.5 Summary of past research
The results obtained from studies in this expanding area do not definitively inform onthe effect of hearing loss on driving; results are varied and, in some cases, contradictory.

58 CHAPTER 2. LITERATURE REVIEW
Despite noted methodological limitations, however, the reviewed literature does providesome potential differences in driving outcomes as a result of hearing loss which warrantfurther investigation:
• Driving with a hearing loss might raise the risk of having a motor vehiclecollision.This has been shown in an elderly demographic (Ivers et al., 1999) and in youngerpopulations likely to have sustained a hearing impairment as a result of noiseexposure (Barreto et al., 1997; Picard et al., 2008). However, three studies withstronger methodologies exhibited no such associations (McCloskey et al., 1994; Simset al., 2000; Green et al., 2013).
• Hearing loss may cause people to consider to stop driving, or adapt theirdriving habits.Two studies suggest that elderly individuals with a hearing loss are more likely tocease driving compared to those with normal hearing (Gilhotra et al., 2001; Unsworthet al., 2007). This is supported by other work which has shown a lower driving licenseownership in the hearing impaired demographic (Thorslund et al., 2013c).
• Those with a hearing loss may be less likely to commit speeding offences,but are more likely to commit other traffic offences.Hearing loss severity has been shown to be negatively correlated with the number ofspeeding tickets (Picard et al., 2008). A few behavioural studies have also exhibited aslower driving speed in the hearing impaired demographic (Thorslund et al., 2013a,b).However, Picard et al. (2008) also noted a positive association between hearing lossand other types of traffic offences, though they do not detail exactly what these were.
The observation of these trends is not compounded by any information about why theyhave arisen. However, two possibilities about how hearing loss might affect driving havebeen identified:
1. There will be a loss of auditory sensitivity, which may have a deleteriouseffect on certain road-relevant auditory information:
• Warning signals such as sirens and horns may be missed by the hearing impaireddemographic.
• Sound information that raises awareness of the surrounding environment mightbe absent, or reduced, for people with a hearing impairment.
• Aerodynamic and vehicular noise that aids the perception of travelling speedmay be altered for people with a hearing loss.
2. Sound which is audible causes a problem for hearing impaired individuals:Hickson et al. (2010) found that, when asked to perform a superfluous auditory task

CHAPTER 2. LITERATURE REVIEW 59
in the driving environment, the number of road signs recognised and overall drivingperformance of their hearing impaired participants was more affected than for thosewith normal hearing. The authors argue that this arises as a result of the extrademand that hearing loss places on auditory task completion.
Also,driving performance, and related measures, are affected by auditory task en-gagement in normally hearing individuals. Reduced reaction times to events, failuresof visual attention, reductions in visual scanning, changes in longitudinal vehiclecontrol and an improvement in lateral vehicle control are all noted in the drivingenvironment. Varying the difficulty of the auditory task results in a more markedobservation of some of these trends. Thus it is suggested that hearing impairmentwill have the same effect.
As a result of the two above considerations (Thorslund et al., 2013a,b, 2014) suggest thathearing impaired drivers exhibit an adaptation of driving behaviour, whereby a morecautious driving style is adopted:
• Hearing impaired drivers make more frequent glances at mirrors.
• Hearing impaired individuals tend to drive at slower speeds.
• Individuals with a hearing loss seem to have a disinclination to look awayfrom the roadway during driving.
• Hearing impaired individuals exhibit a reluctance to engage in other taskswhilst driving.
These outcomes have been noted as a result of a number of studies in the area, some ofwhich are subject to limitation, but the research is far from extensive. Indeed, some ofthese assertions have been made from research performed within a single research group.It is clear that further work is required in order to establish more definitively what effecthearing loss has on driving ability. The aim of the work described in this thesis was tobegin to investigate this topic. The specific aims of the work are identified in the followingsection.
2.6 Thesis aims
Clearly the effect of hearing loss on driving is a contentious issue, and one which presentsa number of important considerations. These considerations are diverse and complex, andare likely to be dependent on a variety of variables (hearing loss type and severity, thespecific driving situation etc). Work carried out to investigate driving behaviour in thehearing impaired demographic is sparse, and therefore presents an unclear picture of howhearing loss interacts with driving performance. Regardless, the literature review providedin this chapter has identified two manners by which a loss of hearing might have an impact

60 CHAPTER 2. LITERATURE REVIEW
on driving performance: (1) an inability to hear sound, and (2) a disproportionatelydistracting effect of sound which is audible. However, only the former of these suggestionsis relevant for deaf individuals, and a majority of studies have concluded deaf drivers arenot at an increased road traffic accident risk (Finesilver, 1962; Wagner, 1962; Ysander,1966; Roydhouse, 1967; Schein, 1968). In contrast, other work has shown that partiallyhearing impaired drivers might be at an increased risk of road traffic accidents (Barretoet al., 1997; Ivers et al., 1999; Picard et al., 2008), and further study has exhibited drivingbehaviour changes in hearing impaired individuals (Hickson et al., 2010; Thorslund et al.,2013a,b, 2014). Thus, those with a loss of hearing who were not profoundly deaf were thesubject of investigation in this programme of research.
Limited work has investigated the effect of auditory distraction on driving performancein hearing impaired individuals (Hickson et al., 2010). Accordingly, the second of the twoassertions given above was the focus of work described in this thesis: “Certain types ofhearing loss distort auditory signals (even at easily audible levels), and this leads to adisproportionately distracting effect of acoustic information in the driving domain.”
The potentially disproportionate effect of driver distraction for those with a hearing lossis an important consideration given that the driving environment is becoming increasinglyintricate due to the development and incorporation of complicated in-car technologies(Hickson et al., 2010). A number of these systems function in the auditory modality,and so driving can often involve the simultaneous performance of multiple, cognitivelydemanding tasks, some of which are presented in the auditory modality. Existing workin this area has shown that auditory distraction affects aspects of driving performance,but it is curious that visual distraction also seems to be disproportionately distractingfor hearing impaired drivers (Hickson et al., 2010; Thorslund et al., 2013b). This findingrequires further investigation, given that it is incongruent with the hypothesis used toexplain why hearing impaired individuals are more affected by engagement in cognitivetasks whilst driving.
Furthermore, the only study assessing the effect of auditory distraction on driving inhearing impaired individuals did so in an older sample (≥ 62 years old). This makes itdifficult to generalise results to other age groups of hearing impaired individuals, but alsobrings about potential influences from confounding factors, as is discussed in Chapter 3.
Hickson et al.’s (2010) study also used very few objective measures of driving performanceand related skills. Driving research has identified a specific set of observations which ariseas a result of cognitive task engagement: improvement in lateral vehicle control, reducedreaction times, visual attention failures, reductions in visual scanning, and changes inlongitudinal vehicle control. The hypothesis that SNHL increases the cognitive demandsassociated with auditory processing suggests that a more marked observation of thesetrends should be apparent. However, none of these performance metrics were explicitlystudied by Hickson et al. (2010).
The overarching aim of this thesis is, therefore, to investigate whether hear-

CHAPTER 2. LITERATURE REVIEW 61
ing impairment has an effect on driving, and especially whether engagementwith simultaneous auditory tasks whilst driving has a disproportionate effecton performance, when results are compared to those with normal hearing.Through the course of research described in this thesis, an attempt is made to address theresearch questions detailed in Table 2.4.
In order to answer the research questions posed it is useful to refer to theoreticalframeworks/models which can explain how hearing impaired individuals might be at adisadvantage whilst driving under conditions of distraction. Whilst this chapter has alludedto the fact that auditory processing is more effortful for those with SNHL, it does notdivulge why or how it interacts with the performance of other tasks. Understanding thisrelationship is key, as it can provide insights about the types of tasks, and the drivingconditions which are particularly challenging for hearing impaired individuals.
Thus, in the next chapter, models of human multi-task performance are presented anddiscussed in order to provide an overview of how dual-task performance is undertaken,what might affect it and in what way. A model of listening effort, and how it is affected byhearing impairment will then be discussed, in order to establish why the hearing impaireddemographic need to exert more effort in order to ensure successful listening. How thislistening effort model feeds in to the model of human task performance will then bediscussed, in order to identify the specific situations which may be problematic for thosewith a hearing loss.

62 CHAPTER 2. LITERATURE REVIEWTa
ble
2.4The
research
questio
nspo
sedin
this
documentan
dstud
ieswhich
have
addressedthem
.
Researchqu
estion
Description
ofstud
y
1.Is
hearingim
pairm
entseen
asacauseof
any
prob
lemsfordrivingby
peop
lewith
ahearingloss?
Cha
pter
4repo
rtson
astud
ywhich
investigated
theself-repo
rted
driving
beha
viou
rsof
hearingim
paire
dindividu
als.
Anexist
ing,
valid
ated
measure
ofdrivingbe
haviou
r(the
Driv
erBeh
aviour
Que
stionn
aire;R
easonet
al.,19
90)an
da
questio
nnaire
which
hadbe
encreatedto
investigatespecificdrivingiss
uesrelevant
todrivingan
dhearingloss
wereused.Stud
iesinvestigatingroad
traffi
caccident
riskin
hearingim
paire
dindividu
alsha
vemixed
theuseof
self-repo
rted
and
objectivemeasuresof
hearingloss,s
odiffe
rences
inou
tcom
esbe
tweenthesetw
omeasureswerecontrasted.
2.Dope
ople
with
ahearingloss
repo
rtan
yalteratio
nsto
theirow
ndrivingbe
haviou
r?
3.Is
thereadiffe
rencebe
tweenself-repo
rted
andpu
retone
audiom
etry
measuresof
hearingloss
interm
sof
theiraff
ecton
expe
rienced
drivingprob
lems?
4.Doeshearingim
pairm
entdispropo
rtiona
tely
alter
visual
processin
geffi
ciency
durin
gau
ditory
task
engagement?
Aud
itory
task
engagementwhist
drivinglead
sto
visual
attentionerrors
(Richa
rdet
al.,2002;S
trayer
etal.,2003;M
cCarleyet
al.,2004),
this
appe
arsto
affectthe
hearingim
paire
ddemograph
icdispropo
rtiona
tely
(Hickson
etal.,2010).
Cha
pter
5repo
rtson
anexpe
rimentwhich
explicitlyassessed
thevisual
attention
ofhearingim
paire
dindividu
alswhilst
performingasim
ultaneou
sau
ditory
task.
5.Is
thepe
rforman
ceof
auditory-based
cogn
itively
deman
ding
tasksmad
emoredifficultby
soun
ddistortio
nrepresentativ
eof
hearingloss?
ASimHLwas
used
inorderto
isolate
theeff
ectof
perip
heralh
earin
gloss
from
otherconfou
ndingfactors.
Cha
pter
7repo
rtson
astud
ywhich
assessed
theeff
ect
ofSimHLon
thepe
rforman
ceof
anu
mbe
rof
auditory
basedmem
orytasks.
This
inform
edon
how
listening
effortrequ
irements
areaff
ectedby
perip
heralh
earin
gloss.
6.Doesthedistortio
nto
soun
dbrou
ghtab
outby
hearingim
pairm
entat
aperipheral
levelh
avethe
capa
city
toaff
ectdrivingpe
rforman
cewhena
simultaneou
sau
ditory
task
ispresent?
ByusingaSimHLin
youn
ger,
norm
ally
hearingad
ults
itwas
possible
toiso
late
theeff
ectof
perip
heralh
earin
gloss
ondrivingpe
rforman
ce.Pa
rticipan
tswere
askedto
driveasim
ulator
whilst
simultane
ously
perfo
rmingtw
odiffe
rent
auditory
tasks.
Driv
ingpe
rforman
cemeasurements
correspo
ndingto
previous
research
finding
swereused
inorderto
investigatetheinflu
ence
ofSN
HL.
Ameasure
ofworkloadwas
also
includ
edin
orderto
investigatewhether
SNHLraise
dthe
cogn
itive
deman
dsof
perfo
rmingasim
ultane
oustask
whilst
driving.
The
results
ofthis
stud
yarerepo
rted
inCha
pter
8.
7.W
hatarethemeasurablevehiclecontrola
ndbe
haviou
ralc
orrelatesof
this
effecton
driving
performan
ce?
8.Dope
ople
limit
engagementin
second
arytasksin
orderto
maintainsuccessful
drivingpe
rforman
ce?

Chapter 3
Models of Human TaskPerformance and Listening Effort
3.1 Introduction
Chapter 2 has provided an overview of research which has specifically investigated theeffect of hearing loss on driving, and has also summarised how hearing loss might affectdriving. The main focus of this thesis is the investigation of whether auditory distractionhas a disproportionately distracting effect on drivers with a SNHL. The premise underwhich this hypothesis has been suggested is that hearing impairment raises the processingdemands of auditory-based cognitive tasks, and that this manifests as a disproportionatedegradation in various facets of driving performance.
But why should an alteration in the processing demand of a listening task affect theperformance of the predominantly visual task (Sivak et al., 1996) of driving? This questioncan be answered by drawing upon theoretical models of dual-task performance in humans.These models have been informed by experiments which have investigated performancedecrements as a result of undertaking different types of tasks simultaneously (e.g. Pashler,1994). Therefore, they can provide information regarding the extent to which tasks ofdifferent modalities interact (e.g. auditory and visual tasks).
The focus of this chapter is to consider the dual-task performance of individuals with aSNHL in the context of these models. Various models which have been used to explaindual-task performance in humans will be summarised, and the implications of an increasedlistening effort on the most valid model, in terms of its ability to explain past experimentalfindings (e.g. Hickson et al., 2010; Thorslund et al., 2013b), will be discussed. The outcomeof this chapter is the identification of models of task performance and listening effortwhich can be used to predict outcomes from experiments performed in this programme ofresearch.
63

64 CHAPTER 3. TASK PERFORMANCE AND LISTENING EFFORT
3.2 Human task performance
The distracting nature of engaging in concurrent auditory-based activities whilst driving hasbeen shown to have an impact on various measures of driving performance (see Chapter 2).It has long been the focus of driver safety research to investigate what types of secondarytasks impair driver performance, to what extent, and how their effect can be minimised.To this end, a plethora of dual-task experiments have been undertaken in laboratory,driving simulator, and field driving settings. These experiments usually take a format inwhich subjects are asked to perform two or more separate tasks at the same time (e.g.driving and conversing on a mobile telephone). Their performance in either (or both)task(s) is then calculated, and inferences are drawn about the extent to which certain taskcombinations/types limit performance.
Normally the understanding of results derived from these studies is aided by modelsof dual-task performance. These models are used to predict what effect a certain typeof distracter might have on a primary task (such as driving). There are a number ofdistinct models of multi-task information processing which have been suggested, and abrief overview will be given in this section.
In order to understand how hearing impairment might affect driving in terms of itssusceptibility to the effects of distraction, an empirically supported, pre-existing model ofhuman task performance which can explain past research results (e.g. Hickson et al., 2010;Thorslund et al., 2013b) will be identified. This will allow for an easier understanding ofthe implications of hearing loss for driving, and will provide information as to why listeningeffort is increased in hearing impaired individuals. Therefore, the types of auditory taskwhich are likely to impact on driving performance in this demographic, can be identified.
3.2.1 Theories of information processing
Two main approaches have been used for modelling dual-task interference in the past:those that focus on processing in serial and those that focus on it in parallel.
Serial-processing models (e.g. Broadbent, 1958; Treisman, 1960) take the view thatparallel processing of tasks is not possible, i.e. there is a limitation in processing capacityat a single, serial processing stage - a bottleneck. At this bottleneck, processing resourcescan only be allocated to a single task at any given time, and so it is presumed that atsome point one task will have to be prioritised over another for processing, whilst theother is briefly held in a sensory store1 before being completed. As such, if tasks occursimultaneously then they cannot be performed together, and this will manifest in a delayedresponse to one or both of the tasks.
A number of authors have suggested theories as to the location of this bottleneck withinthe processing chain. Broadbent (1958) proposed an early filter theory whereby he inferred
1A temporary buffer from which information can be accessed for a short time after a stimulus has ceased(Winkler and Cowan, 2004).

CHAPTER 3. TASK PERFORMANCE AND LISTENING EFFORT 65
that a sensory buffer in the processing chain would select a single stimulus to pass at atime, based on the physical characteristics of all incoming stimuli. He argued that this filterprevented overloading of a hypothesised limited capacity mechanism located thereafter. Alarge amount of evidence for this theory was derived from work performed by Cherry (1953)who found that listeners could not separate out two different spoken messages played toseparate ears when they had similar physical characteristics.
However, Treisman (1960) proposed an alternative to this filter theory, whereby unat-tended information is attenuated rather than filtered out. This was supported by herfinding that single words played to the unattended ear of listeners were sometimes recalled,particularly if they were probable in the context of the attended message. Deutsch andDeutsch (1963) postulated that the processing bottleneck is nearer the response portion ofthe processing system. They argued that all incoming stimuli are processed semanticallybefore the most relevant one is selected for further in-depth processing.
More recently Lavie (2005) has argued for a combination of these early- and late-selection models in her ‘perceptual load’ model. This model proposes that everybody has alimited attentional capacity, and that the amount of attentional capacity allocated to themain task depends on its perceptual load. Beyond this, remaining capacity is automaticallyallocated to irrelevant stimuli. Accordingly, early selection occurs when perceptual load ishigh, and when it is low, late selection is preferred. Whilst this model has gained supportfrom experimental evidence (e.g. Lavie, 1995), it is mainly limited to presentation withinthe visual modality (Eysenck, 2000). Contrary to this, recent evidence suggests that ‘load’does not modulate auditory distracter processing (e.g. Murphy et al., 2013). As such,this model is considered inapplicable for the work described in this thesis, as it does notadequately explain the processes underlying auditory distraction.
Whilst serial-processing models have gained some empirical support, they fail toadequately explain why some tasks can be time-shared with seemingly no decrementin performance (Edwards, 2010). Well-cited examples of this are the ability of trainedpianists to successfully shadow a spoken message whilst playing sight read music (Allportet al., 1972), expert typists who can sight-type whilst shadowing speech (Shaffer, 1975), orindividuals who could be trained to read and write down dictated words simultaneously(Spelke et al., 1976).
Parallel processing models (e.g. Kahneman, 1973; Wickens, 1984), on the otherhand, postulate that two tasks can be time shared, but view mental resources as a limitedentity which are shared amongst these various tasks. It is supposed that, if two tasks arecompeting for resources, performance in one or both of the tasks suffers. Central-resourcemodels are, therefore, seen as a manner in which this ‘time-sharing’ of certain tasks can besuccessfully accounted for. Two types of parallel processing model have been proposed inpast literature:
Single resource models of attention suppose that humans have a single limited ‘pool’ ofprocessing resources, and that the performance of any task imposes a demand on these.

66 CHAPTER 3. TASK PERFORMANCE AND LISTENING EFFORT
Therefore, when the processing demands of tasks are greater than the finite resourcespossessed, a performance decrement results. One such model was suggested by Kahneman(1973), who postulated that an undifferentiated pool of resources could be allocated toany task or processing stage. As such, this model does not predict that tasks of differentmodalities can be time-shared entirely efficiently, rather that if the overall demands of anyconcurrently performed tasks exceed the available resources, performance decrements willoccur. The relative simplicity of this model has caused it to be largely dismissed, withsome authors doubting whether it can explain the complex nature of attention (Neisser,1976; Allport et al., 1993). Another problem is the prominence of task similarity as a majorfactor in dual-task studies. Whilst distinct modality tasks can suffer a dual-task cost, thedual-task cost is greater when two tasks of the same modality are being performed (Lund,2002). This type of finding is better explained by models which envisage informationprocessing comprising of multiple resources.
The existence of a number of single processing pools, multiple resources, has beensuggested by other authors. These processing pools have been conceptualised as ‘specialisedmental resources’ (Navon and Gopher, 1979) or ‘modules’ (Allport, 1980); distinct, limited-capacity processing resources which deal with a particular skill or ability (Lund, 2002). Inthis case, it is thought that if two tasks differ in terms of their modality (e.g. a visual andan auditory task) they can successfully be performed simultaneously, as they do not sharecommon resources.
Whilst the concept of modules suggested by Allport (1980) does support some studieswhich have found successful time sharing in separate modality tasks (e.g. Allport et al.,1972; Shaffer, 1975; Spelke et al., 1976), it cannot explain findings that exhibit a dual-taskcost associated with two modality specific tasks (e.g. Hickson et al., 2010), as, theoretically,these tasks should draw upon distinct processing resources. Furthermore, these accounts ofinformation processing do not specify the number of modules that exist, or precisely whatthe modules deal with. Accordingly, testing models of this type is problematic, as resultscan be explained by simply suggesting the existence of a new, distinct module (i.e. themodel is non-falsifiable). There is also no explanation as to how the modules interact witheach other; tasks require co-ordination from senses, but the module account of informationprocessing does not explain how information from these modules is interrelated. The notionof Navon and Gopher (1979) is more accomplished in this manner. They maintain the viewof specialised modules, but view information processing in economic terms, suggesting thatperformance in one modality can be traded for performance in another, depending on thedemands and priorities of the situation.
These theories, however, do not explain how it is that separate resources co-ordinate(Lund, 2002). Indeed, Ho and Spence (2012) comment that, in attention research, therehas been a great deal of focus on establishing independent sensory modality resources.However, the authors postulate that incoming sensory information is integrated in order toprovide a multisensory perceptual representation of the external world. These apparent

CHAPTER 3. TASK PERFORMANCE AND LISTENING EFFORT 67
cross modal links have been used to explain the finding that mobile phone conversationleads to difficulties in driving cars; as people will find it hard to visually attend to the roadscene whilst simultaneously attending to a sound source which is incongruent in terms ofits spatial location (Spence and Driver, 2004).
Whilst the assertion that dual-task decrements are exacerbated by incongruent spatiallocations of stimuli is interesting, it fails to explain why it is that SNHL has a dispropor-tionate effect on driving performance in the presence of a simultaneous auditory task. Inthe study of Hickson et al. (2010), hearing impaired and normally hearing individuals werepresented with visual and auditory tasks that originated from the same spatial location,yet the tasks had a more distracting effect on the hearing impaired demographic. Hearingloss may cause disturbances in auditory localisation (Moore, 2007), but this cannot explainHickson et al.’s 2010 results; an alteration in the perceived source of auditory stimuli intheir experiment would have resulted in one of two outcomes: (1) a perceived sound sourcethat was comparable to that for normally hearing individuals - one which was incongruentwith the visual area of interest (the windscreen), or (2) a perceived sound source whichwas congruent with the windscreen - thus theoretically improving driving performance.Accordingly, models of cross modal attention cannot be used to explain greater drivingperformance decrements in hearing impaired individuals compared to normally hearingindividuals.
Contrary to the theory of cross modal attention, Wickens (1984) also supports the ideaof ‘modules’ (Navon and Gopher, 1979; Allport, 1980), though he suggests an alteration inthe manner by which these modules are used in that they may deal with different aspectsof a particular task. His Multiple Resources Theory (MRT) (Wickens, 1984, 2002, 2008)proposes that modules exist for distinct stages of task processing: input mode, processingmechanism, and output mode. This model is reviewed in more detail below.
3.2.1.1 Multiple Resources Theory
Wickens (1984; 2002; 2008) developed the MRT to account for the differences found indual-task performance across different modalities. The model proposes that the humanprocessing system consists of independent processing mechanisms across five dichotomousresource pools (see Figure 3.1):
1. Input modality (visual/auditory);
2. Processing code (spatial/verbal);
3. Visual processing (focal/ambient);
4. Processing stage (perception-cognition/response selection);
5. Response type (manual spatial/vocal verbal).
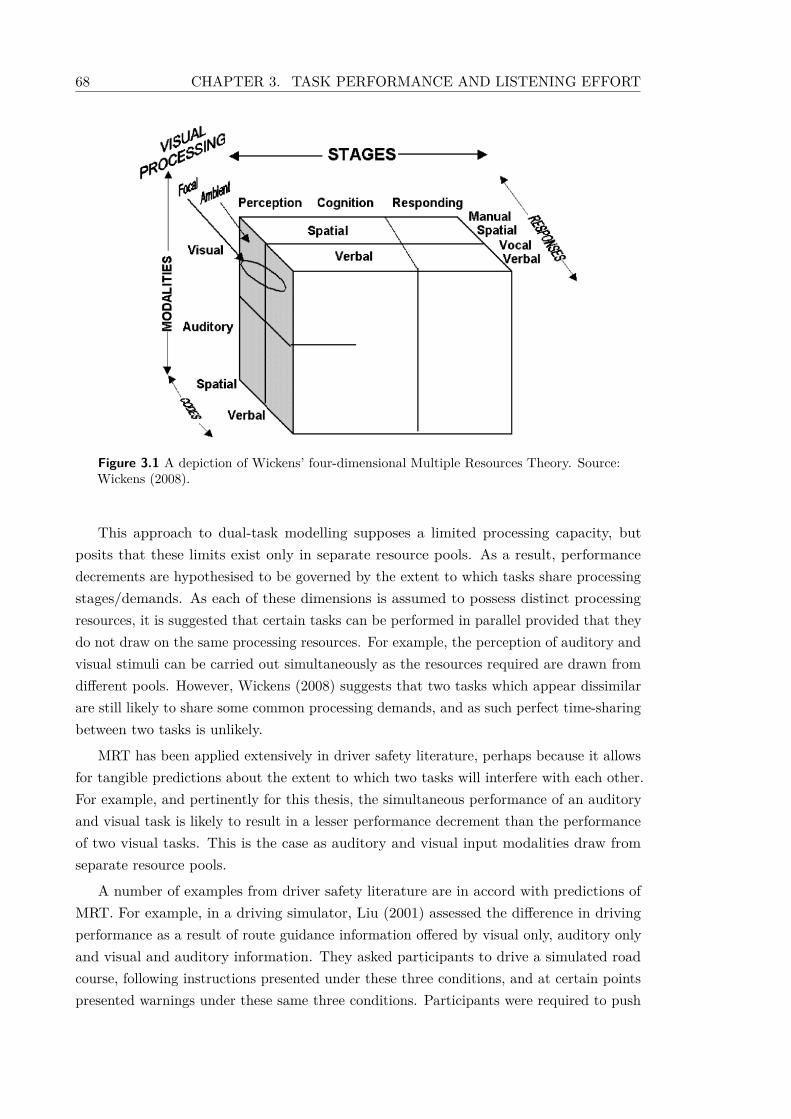
68 CHAPTER 3. TASK PERFORMANCE AND LISTENING EFFORT
Figure 3.1 A depiction of Wickens’ four-dimensional Multiple Resources Theory. Source:Wickens (2008).
This approach to dual-task modelling supposes a limited processing capacity, butposits that these limits exist only in separate resource pools. As a result, performancedecrements are hypothesised to be governed by the extent to which tasks share processingstages/demands. As each of these dimensions is assumed to possess distinct processingresources, it is suggested that certain tasks can be performed in parallel provided that theydo not draw on the same processing resources. For example, the perception of auditory andvisual stimuli can be carried out simultaneously as the resources required are drawn fromdifferent pools. However, Wickens (2008) suggests that two tasks which appear dissimilarare still likely to share some common processing demands, and as such perfect time-sharingbetween two tasks is unlikely.
MRT has been applied extensively in driver safety literature, perhaps because it allowsfor tangible predictions about the extent to which two tasks will interfere with each other.For example, and pertinently for this thesis, the simultaneous performance of an auditoryand visual task is likely to result in a lesser performance decrement than the performanceof two visual tasks. This is the case as auditory and visual input modalities draw fromseparate resource pools.
A number of examples from driver safety literature are in accord with predictions ofMRT. For example, in a driving simulator, Liu (2001) assessed the difference in drivingperformance as a result of route guidance information offered by visual only, auditory onlyand visual and auditory information. They asked participants to drive a simulated roadcourse, following instructions presented under these three conditions, and at certain pointspresented warnings under these same three conditions. Participants were required to push

CHAPTER 3. TASK PERFORMANCE AND LISTENING EFFORT 69
one of two buttons (corresponding to the type of information presented) in response to thesewarnings. The authors found that response times to the warnings, the number of correctturns, and subjective workload ratings were all better under auditory, or auditory-visualconditions. Thus it was suggested that visual information conflicted more with driving thandid auditory information. This is in agreement with MRT, as driving can be considered avisual-spatial-manual task across MRT dimensions (Jamson and Merat, 2005). In the studyof Liu (2001), the visual task (visual-spatial-manual) shared more common processingresources with driving than did the auditory task (auditory-spatial-manual), thus morecompetition for resources was present in the visual task, leading to driving performancedecrements.
However, when applying MRT in the domain of hearing loss and driving performance,it cannot fully explain the outcomes of previous research. The hypothesis proposedby Hickson et al. (2010) was that hearing impairment increases the cognitive resourcesrequired to understand a spoken message, and that it is this extra perceptual load whichinterferes with the primary task of driving. According to MRT, this extra perceptualeffort in the auditory modality should not interfere with driving, because the input stageof driving can be considered predominantly visual (Jamson and Merat, 2005), and soin Hickson et al.’s (2010) study their driving and secondary tasks should have drawnupon separate input modality processing pools. However, the authors found that hearingimpaired individuals’ driving performance was disproportionately affected in relation tonormally hearing individuals as a result of performing an addition sum presented in theauditory modality. Whilst perceptual differences were likely to be present between thetwo experimental groups at this processing stage in MRT, the driving and auditory taskswere drawing from distinct processing pools, and so driving decrements should not haveoccurred as a result (see Figure 3.2).
In accordance with MRT, some of the driving outcomes measured by Hickson et al.(2010) must have been due to conflicts at the cognition and response portions of MRT. Theynoted a reduction in the number of road signs recognised in their hearing impaired sample.This primarily draws upon the verbal pool of resources at the cognition and response stagesof processing, as did the performance of their auditory task (see Figure 3.2). Accordingly,using MRT as a model to explain outcomes, it is clear that the hearing impaired group muststruggle to a greater extent with verbal processing at either the cognition or response stageof processing, as these are the only stages at which a dual-task cost should be apparent.This does not fit with the explanation offered by Hickson et al. (2010) as to why it is thathearing impaired individuals are more affected by an auditory task.
MRT also fails to adequately explain the findings of Thorslund et al. (2013b). Thisstudy asked participants to perform a visual task which drew upon verbal processing(repeating back visually presented letters), which was hypothesised to be less efficientin hearing impaired individuals (Andersson, 2002). They noted a difference in variousdriving performance measures (e.g. increased gap around other vehicles, slower driving

70 CHAPTER 3. TASK PERFORMANCE AND LISTENING EFFORT
Figure 3.2 The resource pools used (with reference to Multiple Resources Theory) at eachstage of processing during the study of Hickson et al. (2010). The task of recognising roadsignage whilst driving was performed simultaneously with a mental arithmetic task whichwas either visually or aurally presented. In each condition a significant decrease in thenumber of signs recognised was noted for the hearing impaired participants.
speed) between normally hearing and hearing impaired individuals when performing thistask. However, Thorslund et al. (2013b) hypothesised that normally hearing and hearingimpaired individuals would differ from each other in terms of the cognition portion oftheir secondary task. However, at this stage of MRT, the secondary and driving tasksused different processing resources (i.e. verbal and spatial respectively; see Figure 3.3).One would, therefore, not expect the secondary task used to have different outcomes forhearing impaired and normally hearing individuals. Accordingly it would appear thatWickens’ MRT may not be the best model in the explanation of differences in distractionsusceptibility for hearing impaired drivers.
Figure 3.3 The resource pools used at each stage of processing during the study of Thorslundet al. (2013b). The task of driving was performed simultaneously with a secondary taskwhich was visually presented.

CHAPTER 3. TASK PERFORMANCE AND LISTENING EFFORT 71
The inconsistency between the results of Thorslund et al. (2013b) and MRT can perhapsbe explained by a criticism of the model, in that it accounts only for bottom-up processes,whereas top-down processes can also have a significant impact on the performance ofdual-task paradigms (Engström, 2011). For example, self-regulation of attentional efforthas the capacity to interfere with bottom-up processes. Van der Hulst et al. (1998)suggest that drivers allocate their attention to tasks based on how task performance meetstheir overall goals of driving safely. Indeed, Thorslund et al. (2013b) argue that hearingimpaired individuals adapt their driving behaviour in order to counteract problems whichthey experience. Their top-down influence on driving processes may, therefore, alter theoutcomes which would be predicted by MRT. Models such as MRT do not take this factorin to account, and so they must be considered when making predictions based on themodel.
3.2.1.2 Working memory
Baddeley and Hitch (1974); Baddeley (1992, 2000, 2003) have favoured an approach toattention and performance limitations which resembles a synthesis of central capacityand multiple-resource models: the ‘Working Memory’ model, which is proposed to beresponsible for the temporary storage and manipulation of information. However, WorkingMemory was originally borne out of a link between perception, long-term memory andaction (Baddeley and Hitch, 1974; Baddeley, 2003), and as such can be thought of in termsof predicting processing performance on one or more tasks.
Working Memory is seen as a limited capacity model which is arranged in a hierarchicalstructure and is used to temporarily store and process information required to carry outcomplex cognitive tasks (Rönnberg et al., 2013). However, it postulates the co-existence ofmodality specific limited capacity pools as well as a general limited capacity store (Eysenck,2000). The modality specific resource pools are envisaged as two, non-interfering slavesystems which are coordinated by the general resource pool known as the central executive(see Figure 3.4):
1. A phonological loop, which holds speech-based information for a period of one to twoseconds before being lost. This loss of verbal material can be avoided if sub vocalrehearsal is undertaken (Baddeley, 1997).
2. A visuospatial sketchpad, which manipulates and processes spatial and visual informa-tion.
A third slave system, the ‘episodic buffer’, which is also controlled by the central executive,was a later addition to the model by Baddeley (2000), and is considered a non-modality-specific temporary storage system. It is thought to integrate information from the othertwo slave systems and long-term memory.
Admittedly, the structure of Working Memory mirrors MRT to a certain extent, butdiffers in the fact that it encompasses the central executive (a general resource pool). This

72 CHAPTER 3. TASK PERFORMANCE AND LISTENING EFFORT
Figure 3.4 A version of the multi-component Working Memory model. Source: Baddeley(2000).
aspect of Working Memory was, until recently, a relatively unknown entity. Indeed, uponthe conception of this model Baddeley et al. (1986) described this portion of the model asa ‘ragbag’ which dealt with any poorly grasped, or complex, phenomenon. The functionof this system is now better understood, and it is thought to be responsible for focusing,dividing, or switching attention (Baddeley, 2003). As such, although the phonologicalloop and visuospatial sketchpad are distinct subsystems which do not interfere with eachother, both systems are coordinated by the central executive. Thus, in order to functionefficiently, they rely on the general pool of resources possessed by the central executive notbeing depleted or otherwise engaged.
As the central executive is responsible for attention switching between the two slavesystems, it is considered that it might be the source of a performance decrement if morethan one subsystem requires its input simultaneously, or the central executive itself is underload. It is this aspect of Working Memory that allows it to explain dual-task interference,even when two distinct subsystems are performing concurrent tasks. This addresses theproblems associated with MRTs ability to account for the findings of Hickson et al. (2010)and Thorslund et al. (2013b). The dual-task paradigm presented by Hickson et al. (2010)included mental arithmetic, which requires extensive involvement from the central executive(de Rammelaere et al., 2001; Seitz and Schumann-Hengsteler, 2002). The inability of thecentral executive to efficiently carry out other necessary functions for satisfactory drivingperformance may, therefore, have been the source of interference on aspects of the drivingtask. Although the primary task of driving, and particularly the road sign recognition task(which showed a decrement in hearing impaired individuals), relies heavily on the modalityspecific visuospatial sketchpad, this subsystem is coordinated by the central executive.In the complex environment devised by Hickson et al. (2010), where participants hadto navigate a number of highly complex tasks simultaneously, success would have beendependent upon successful attentional control. Given that the central executive was undera high load (from coordinating the subsystems and completing a mental arithmetic task),it is likely that this attentional control was compromised to an extent, and resulted in

CHAPTER 3. TASK PERFORMANCE AND LISTENING EFFORT 73
decrements in performance on various aspects of each task. Therefore, hearing impairedparticipants would have struggled to a greater extent with the driving task than those withnormal hearing, since their perception of auditory stimuli would have been impaired. Thiswould have required more attentional control to be placed on their phonological loop, aprocess mediated by the central executive. The implications of hearing loss for WorkingMemory processes will be covered later in this chapter, and the discourse shows that explicitprocessing undertaken by a construct similar to the central executive is hypothesised tobe used more often in hearing impaired individuals than normally hearing individuals.Thus hearing impairment is proposed to engage central executive resources for listeningprocesses, which would otherwise be used to aid other concurrent processes such as driving.
In a similar vein, the results of Thorslund et al. (2013b) can be explained under thepremise that phonological loop operations are less efficient in persons with an acquiredhearing loss (Andersson, 2002). Presenting their participants with a task which reliedheavily on the phonological loop portion of Working Memory may have, again, instilledmore explicit processing, placing a load on the central executive during periods of secondarytask engagement. This may have impaired the ability of the central executive to adequatelycontrol visuospatial sketchpad operations, and as a result driving performance suffered.This explanation is also relevant to the study of Hickson et al. (2010), who found thata visually presented task which uses phonological loop operations (the addition of twonumbers presented visually) impaired driving performance disproportionately in theirhearing impaired sample.
The ability of Working Memory to explain past results in the field of hearing lossand driving, and results which have shown an effect of auditory task engagement ondriving performance, suggest that it is a more applicable model in this programme ofresearch than MRT. To summarise, it is hypothesised that the phonological loop portion ofWorking Memory requires greater mediation from the central executive in hearing impairedindividuals in order to successfully process auditory information. This will lead to a reducedattentional control of the visuospatial sketchpad and episodic buffer, and less efficiency intasks which explicitly use the central executive (see Figure 3.5). The consequence is thatdecrements in tasks which make use of any of these constructs (of which driving is one)are likely to be observed.
An assumption has been made, however, that hearing impairment does, indeed, lead toa disproportionate engagement of the central executive. This assumption is discussed inthe following section.
3.3 Cognitive consequences of hearing loss
Hearing loss leads to a loss of audibility, but also distortion to sound once it is abovethe threshold of hearing (see Chapter 2). Speech understanding is a complex multi-stagetask which draws upon a number of different cognitive processes (Fritz et al., 2007).

74 CHAPTER 3. TASK PERFORMANCE AND LISTENING EFFORT
Figure 3.5 How Working Memory processes might be adversely affected by hearing loss.Phonological loop processes are put under more demand by the hearing loss, thus demandingmore input from the central executive. This may lead to erratic control of the visual-spatialsketchpad and episodic buffer.
However, perception is only one of these processes; Craik (2007, p. 545) stresses that“attention, perception, comprehension, memory and thinking are all aspects of the samecognitive system and that, as such, deficiencies in one aspect will have consequences forother aspects”. Despite the complexities of listening described by Craik (2007), speechunderstanding is often automatic and effortless for young adults with normal hearingsensitivity. However, this is often not the case for those with a SNHL (Pichora-Fuller et al.,1995), and cannot simply be rectified by the use of hearing aids because the perceptualconsequences associated with SNHL mean that simply increasing sound level does notrestore efficient listening processes (Killion et al., 2004).
However, although SNHL will lead to imperceptibility of portions of an auditory signal,or a distortion beyond recognition, linguistic knowledge can be used to reconstruct aspoken message drawing on contextual support. For example, Warren et al. (1970) askedsubjects to listen to recordings of sentences which had single phonemes replaced by acough. After listening they were asked to circle, on a typewritten version of the sentence,where the cough had occurred, and whether it completely replaced their circled section.All but one of their twenty subjects said that the sentences had been complete, and theone who did not, incorrectly indicated the position of the cough. Thus participants had‘perceptually completed’ the missing portion of speech, a phenomenon which the authorstermed ‘phonemic restoration’. It has since been shown that this perceptual filling occursfor non-speech sounds, and is known as ‘auditory induction’ (Warren, 1982).
Linguistic knowledge is well preserved into older adulthood (Wingfield et al., 2005) and,as such, phonemic restoration is a manner in which SNHL can be adapted to. However, anumber of studies have shown that individuals with greater levels of hearing loss are unableto perform phonemic restoration as efficiently as those with normal hearing (Başkent et al.,2010). Furthermore, the retrieval and employment of linguistic knowledge to inform current

CHAPTER 3. TASK PERFORMANCE AND LISTENING EFFORT 75
discourse requires cognitive resources (Baddeley, 2003). Indeed, a number of authors haveagreed that the perceptual decrements associated with hearing loss lead to an increasein the required cognitive resources to understand an auditory message (Pichora-Fulleret al., 1995; Edwards, 2007; Stenfelt and Rönnberg, 2009). It is not surprising, therefore,that cognitive skills are related to speech understanding when listening conditions are notoptimal. Akeroyd (2008) reviewed twenty papers published since 1989 which investigated alink between speech understanding in noise and some measure of cognitive function. Hesummarised that there was a link between cognition and speech understanding, secondaryto the predictive power of hearing loss. He found that measures of Working Memory, suchas reading span, were most related to speech understanding, whereas measures of generalability (e.g. IQ) were less predictive.
Stenfelt and Rönnberg (2009) explain this link between hearing loss and cognitionby suggesting that that listening under optimal conditions is fast and implicit, whereasdistortion to a signal (e.g. through hearing loss or masking) leads to an additional top-downstrategy, whereby attention and explicit decoding of phonological content is necessary(see Figure 3.6), raising the cognitive resource requirements. Top-down processing refersto a voluntary allocation of selective attention (Klingberg, 2010), thus (in terms of theWorking Memory model) engaging the central executive, and drawing from its general poolof resources. The obvious implications of SNHL are, therefore, that a top-down listeningstrategy will be more extensively used than it would for a person with normal hearing.Therefore, in order to maintain understanding of an auditory message, those with a hearingloss must allocate more cognitive resources to processing sound than do people with normalhearing (Hornsby, 2013).
Stenfelt and Rönnberg (2009) base their arguments on a model of language under-standing, which has been reported in recent literature, to explain this increase in cognitiveresource requirements for successful listening in terms of Working Memory: the Ease ofLanguage Understanding Model (ELU) Ronnberg (2003); Rönnberg et al. (2008, 2013).This model envisages language understanding as a Working Memory system which candescribe and predict the dynamic interplay between explicit and implicit cognitive functions,particularly in the case of poorly perceived acoustic signals. Accordingly, it is considered auseful tool in the development and explanation of the studies performed in this programmeof research, and is discussed in further detail in the following section.
3.3.1 The Ease of Language Understanding model
The ELU (see Figure 3.7) has been developed based on a programme of work performedover the past thirty years. Rönnberg et al. (2008) argue that Working Memory is highlyrelated to language comprehension, and as such the ELU is heavily based on WorkingMemory processes. This inference arises from work whereby Working Memory capacity hasbeen shown to be a significant predictor of speech understanding. For example, Lyxell andRönnberg (1989) asked participants to perform a number of language tasks whereby parts

76 CHAPTER 3. TASK PERFORMANCE AND LISTENING EFFORT
Figure 3.6 A generalized model for bottom-up and top-down processing of auditory input.Source: Stenfelt and Rönnberg (2009).
of written words or sentences were deleted and subjects were asked to fill in the gaps toderive what the word or sentence was. They found that successful inference making aboutthese excerpts of language was highly predicted by Working Memory capacity, as measuredby a Working Memory span test. They argued that a capacious Working Memory allowsinformation to be buffered up until there is enough to make an inference about the contentof the message.
Lunner (2003) reports similar findings, whereby the speech recognition in noise offirst-time hearing aid users was significantly correlated with reading span and verbalinformation processing speed. This correlation remained even when controlling for age,degree of hearing loss and regardless of hearing aid use.
Accordingly, Rönnberg et al. (2013) argue that during conversations, those with ahearing loss must coordinate the interplay between a distorted perceptual input, long-termmemory and contextual cues. They suggest that the skills reflected in complex WorkingMemory tasks are central to the performance of these compensatory interactions in peoplewith hearing loss. This explains why Lunner (2003) found a correlation between WorkingMemory skills and speech recognition in noise.
Pichora-Fuller (1996) also suggests that language comprehension is related to Working

CHAPTER 3. TASK PERFORMANCE AND LISTENING EFFORT 77
Figure 3.7 AWorking Memory system for ease of language understanding. Source: Rönnberget al. (2008).
Memory, requiring the perception and recognition of words, though the on-going uptakeof information must also be interpreted with reference to information stored in long-termmemory and recently stored information derived from earlier portions of the signal. Inparticular she points out that in adverse listening conditions (when listening is effortful),mental resources are allocated with priority to word recognition, thus leaving fewer resourcesavailable for storage and deeper processing of the information; an inference which she baseson findings that word recall is poorer when stimuli are presented at low signal-to-noiseratios (Rabbitt, 1968; Pichora-Fuller et al., 1995).
Rabbitt (1968) performed an experiment in which participants were asked to remembera list of eight digits presented either in isolation or through a masking noise. He foundthat, although his participants were able to correctly transcribe the numbers with nearlyno errors in both conditions, their aptitude for remembering them in the masked conditionwas significantly lower. He argued that this may have been because digits in noise areless discriminable, or that the process of recognising the digits overloaded the availableprocessing capacity, which had an effect on immediate memory processes.
He tested the second of these theories by playing only half of the digit lists throughnoise and asking for recall. Results showed that if the second half of the list was played insilence, recall of the first half of the list was significantly better regardless of whether ithad been in the presence of masking noise, or not. When the second half of the list waspresented in the presence of a background noise, this effect was not apparent. Because ofthis finding, Rabbitt (1968) concluded that channel capacity was being pre-empted by theperceptual effort associated with recognising digits in noise, rather than the digits beinginaudible.
Pichora-Fuller et al. (1995) showed a similar pattern of results when asking participantsto listen to a set of sentences played at different signal-to-noise ratios, repeating whatthey had heard and then recalling each of the sentence-final words. She found that there

78 CHAPTER 3. TASK PERFORMANCE AND LISTENING EFFORT
was no difference between the recall of the words in quiet and at high signal-to-noiseratios (easy listening conditions). However, when the signal-to-noise ratio was loweredsuch that it became challenging to hear the stimuli, word recall was significantly reduced,despite participants’ ability to successfully shadow the words. Pichora-Fuller et al. (1995)concluded that re-allocable processing resources were used to support auditory processingwhen listening became difficult because of noise.
Pichora-Fuller (1996) therefore reasons that, whilst reduced perception and consequentfailures in recognition jeopardise comprehension, Working Memory abilities are likely toaccount for the ability of people to comprehend language. Because of the reallocation ofprocessing resources in acoustically adverse situations, those with better Working Memoryabilities are better equipped for a reduction in resources available for processes after theperceptual stage. Thus, those with good working memory skills are likely to be able toperform other cognitively demanding tasks better than those with poor working memoryskills in adverse acoustic environments, or in the presence of sensory loss.
The ELU essentially encapsulates the sentiments of Pichora-Fuller (1996), describing howand when Working Memory is engaged to support listening in adverse conditions. Rönnberget al. (2008) assume that multimodal speech information is Rapidly, Automatically, andMultimodally Bound into a PHOnological representation in an episodic buffer; a processthey refer to as ‘RAMBPHO’. They go on to assume that this representation is thenmatched against phonological representations held in semantic long-term memory. Thisassumption appears to be based loosely on findings such as those reported by Poeppelet al. (2008) and Bendixen et al. (2009), where it has been shown that the auditory systemexhibits ‘predictability’; it can ‘predict’ a sound that is about to occur, based on contextualfactors. If RAMBPHO corresponds to phonological representations, lexical access andspeech understanding is successful with no need for top-down processing. In this case,lexical retrieval occurs implicitly and at a rapid rate, explaining why young, normallyhearing adults are able to perform effortless speech understanding in acoustically favourableenvironments.
However, if information from RAMBPHO is unclear and cannot be immediately orunambiguously related to phonological representations held in semantic long term memory,a mismatch occurs and top-down processing strategies are employed in order to aid languageunderstanding. This assertion is supported by studies such as that performed by Fooet al. (2007). The authors altered the compression settings of habitual hearing aid users’hearing aids, thus inducing a mismatch between RAMBPHO and phonological-lexicalrepresentation. The authors tested participants’ speech recognition thresholds in noisewhilst they wore the altered hearing aids, and found that successful perception with thenew settings was predicted by a measure of Working Memory ability (reading span). Thusthe study suggested that the ability to overcome mismatches between RAMBPHO andphonological-lexical representations was dependent on Working Memory abilities, inferringthat the mismatch had invoked a more explicit method of processing.

CHAPTER 3. TASK PERFORMANCE AND LISTENING EFFORT 79
Likewise, it is also possible that phonological representations in long-term memory areless precise, causing a mismatch between RAMBPHO and phonological-lexical representa-tions. For example, Andersson (2002) showed that severely hearing impaired individualsare less accurate and slower at rhyme judgements and generations than normally hearingindividuals, arguing that this is because they have poor representations of words in theirmental lexicons.
Giving an overview of the ELU, Rönnberg et al. (2008) point out that it functions asa system separate from the Working Memory model under optimal listening conditions.However, when listening conditions become suboptimal, a more explicit approach tolanguage understanding that more closely resembles the Working Memory model is employed.The authors claim that this highlights maximisation of resource economy, in that theprocessing of language capitalises on implicit processing where it is possible, and onlyswitches to more effortful processing in cases where listening conditions are suboptimal.
This advocates that, according to the ELU, suboptimal listening conditions will have aprofound effect on the performance of concurrent Working Memory processes, as cognitiveresources will be reallocated to aid speech understanding. Given the cognitive processesthat ELU postulates will be employed in cases of RAMBPHO mismatch (inference-making,semantic integration, switching of attention, storing of information, and inhibiting irrel-evant information), Rönnberg et al. (2013) clearly envisage a substantial input of thecentral executive in aiding language understanding. Indeed, the original suggestion of themodel shows ‘explicit processes’ are drawn from a general capacity store (see Figure 3.7).Therefore, when Working Memory processes are employed to aid speech understanding,other concurrently performed tasks will suffer performance decrements as a result of centralexecutive input being otherwise engaged.
Given the variable conditions under which communication usually takes place withregard to ambient noise, speech level, or acoustic environment, the relative contributionsof implicit and explicit processes are likely to fluctuate continuously during a dialogue.However, in the case of hearing loss it is assumed that mismatches between RAMBPHOand long term memory stores will be more common still, given the decreased quality andaudibility of the acoustic input. Accordingly, it can be argued that those with a hearing losswill have to employ explicit, effortful processing to a greater extent during conversation thanwill somebody with normal hearing. For some people with good Working Memory abilitiesthis may not be an issue, as they are able to account for the mismatch of RAMBPHOand phonological representations using the explicit processing that Rönnberg et al. (2008)suggest is employed in suboptimal listening conditions. However, for those whose cognitiveabilities are less efficient, it may present a problem in language understanding. This maygo some way towards explaining why the experienced perceptual consequences of certainhearing losses are varied, even if they exhibit identical clinical hearing test results (Stephensand Zhao, 1996).
The theory that hearing loss has the capacity to introduce sufficient distortion to an

80 CHAPTER 3. TASK PERFORMANCE AND LISTENING EFFORT
auditory signal to evoke apparent effects on Working Memory processes is supported byempirical work. Rabbitt (1991), in a manipulation of his earlier study (Rabbitt, 1968),hypothesised that the effect he had found by using masking noise to degrade an auditorystimulus would remain for participants with a hearing loss in the absence of any maskingnoise. Indeed, he found this to be the case, and concluded from his results that “hearingloss will cause recognition errors, but may also impose an additional load on informationprocessing capacity which prevents individuals from optimally rehearsing even those wordsthat they have correctly heard.” His results also support the inference that successfullanguage understanding is reliant on cognitive abilities, given that he found an interactionbetween hearing loss and age, suggesting older adults are less able to cope with thecognitive consequences of hearing loss. This is in keeping with age-related declines inWorking Memory processes (Salthouse, 1991), a topic which will be discussed later in thischapter.
A study, subsequent to the work of Rabbitt (1991), also showed that degraded auditoryinformation had a profound effect on Working Memory processes. McCoy et al. (2005)asked older normally hearing and hearing impaired participants to listen to lists consistingof fifteen words. Lists were stopped at random points, and participants were asked torepeat the last three words that they had heard. Whilst the recall of the final word wascomparable between the two experimental groups, the preceding two words were morepoorly recalled by the hearing loss group, despite all words being presented at an audiblelevel (as indicated by a word shadowing check).
The ELU, therefore, offers an explanation about how degraded auditory informationmay pose extraneous strain on Working Memory processes, and tie in to a disproportionatelynegative effect on concurrently performed tasks (such as driving) in the hearing impaireddemographic. A new, updated model of the ELU has now been suggested (Rönnberget al., 2013). The new model incorporates an explicit processing loop which feeds-backinformation to early stages of language understanding, informing RAMBPHO informationuntil a degree of gist or understanding is obtained. Rönnberg et al. (2013) state that thisgist induces a semantic ‘framing’ of the next processing loop, in other words providingcontext from which understanding can be achieved. However, the basic premise of themodel remains, in that RAMBPHO information is matched against lexical informationheld in long term memory, and when a mismatch occurs, explicit processing is employed(see Figure 3.8). This is the salient point for this thesis; the model shows a load placedon Working Memory processes in cases where an auditory stimulus is degraded. It is thisaspect of the model which explains why hearing loss may pose extraneous effects for drivingwhilst under dual-task conditions.
However, it should be noted that a number of studies have shown a reduced propensityfor using contextual support in language understanding in older adults (e.g. Pichora-Fulleret al., 1995). Considering the ELU, this may be as a result of less efficient WorkingMemory processes in this demographic (Salthouse, 1991). For example, Rönnberg et al.

CHAPTER 3. TASK PERFORMANCE AND LISTENING EFFORT 81
Figure 3.8 AWorking Memory system for ease of language understanding. Source: Rönnberget al. (2013).
(2008) argue that chronological age has no bearing on the RAMBPHO mismatch portionof the ELU, but does on associated explicit functions. In this regard, it is a concern thatthe degree of hearing loss is positively correlated with age (Davis, 1995), because whenRAMBPHO mismatches do occur as a result of age-related hearing loss, explicit cognitiveprocesses will be less efficient in restoring language understanding. Of further concernis that some studies have identified an association between sensory impairments and theslowing of cognitive functions, such as Working Memory processes, meaning that theseexplicit processing abilities may be reduced to a greater extent in older hearing impairedindividuals than older normally hearing individuals. The next section will provide a briefoverview of the evidence in this domain, as it is considered a potential concern in thedesign of experiments carried out in this programme of research.
3.4 The effect of age on auditory perception and task per-formance
An important consideration for hearing research is the influence of age, given its strongcorrelation with hearing loss (Davis, 1995). Indeed, it has already been pointed out thatmost research in the field of hearing loss and its effect on driving performance has beenundertaken in an older demographic (McCloskey et al., 1994; Ivers et al., 1999; Gilhotraet al., 2001; Hickson et al., 2010; Green et al., 2013; Thorslund et al., 2013a,b,c, 2014). Intwo specific cases it is questioned whether factors co-existing with hearing loss (of whichage is one) may be significantly confounding, given that visual task performance had adisproportionate effect on the driving performance of hearing impaired individuals (Hicksonet al., 2010; Thorslund et al., 2013b), thus suggesting that hearing loss was not the onlydifference between the two experimental groups studied.
Increasing age has been shown to reduce cognitive skills (e.g. Salthouse, 1991; Lin-denberger et al., 1993; Craik, 1994; Salthouse, 1994; Craik, 2000; Cepeda et al., 2001),and Salthouse (2000) summarises that this effect is most apparent for skills related to

82 CHAPTER 3. TASK PERFORMANCE AND LISTENING EFFORT
fluid intelligence2, but less so for those related to crystallised intelligence3. This change incognitive abilities appears to lead to a degradation of dual-task performance (Verhaeghenet al., 2003). In fact, as early as 1977, Craik wrote that older subjects are penalised whenthey must divide their attention between two tasks.
There are now numerous examples of dual-task performance decrements in the olderdemographic. In an example relevant to the content of this thesis, Baldwin and Schieber(1995) investigated the dual-task performance of younger and older participants (mean agesof 19.1 and 72.7 years respectively) by asking them to perform mental arithmetic whilstundertaking a steering (tracking) task. The mental arithmetic task required participantsto subtract the larger of two aurally-presented, double-digit numbers from the smaller,and verbally report the answer. The difficulty of the tracking task was manipulatedby increasing the apparent speed and curvature of the simulated roadway. The authorsmeasured the reaction times to the auditory task, and the Root-Mean Squared (RMS)of tracking error to reflect participants’ steering performance. Although auditory taskperformance was comparable between groups in the low tracking difficulty condition, theyfound that reaction times to auditory stimuli were significantly increased for some of theolder participants when the difficulty of the tracking task was increased. This was not thecase for the younger group of participants.
Examples of age-related difficulties in dual-task performance such as this are thought toreflect impaired cognitive functions, such as slowed information processing or a decreasedWorking Memory/attentional capacity (Baldwin and Ash, 2011). The link between ageand reductions in Working Memory abilities is highly pertinent for this thesis, given thatWorking Memory can be used to explain driving performance decrements as a result of dual-tasking. Hearing impairment has been hypothesised to disproportionately degrade drivingperformance during auditory task engagement, but the added dimension of age-relatedcognitive decline may exacerbate this problem by affecting dual-tasking skills directly,regardless of hearing status.
A Working Memory model has also been used to explain an increase in the cognitivedemands of listening for hearing impaired individuals. Therefore, age-related cognitivedecline not only has the capacity to affect driving performance directly (by reducingdual-tasking ability), but also by increasing the difficulty of sensory perception, leading toa reduced ability to perform dual-task paradigms (see Figure 3.9).
Indeed, Wingfield et al. (2005) explicitly envisage age related changes in processingcapabilities as a synergistic influence which adds to the burden of sensory decline onmental processes (see Figure 3.10). In other words, as a result of sensory impairment, moreexplicit perceptual operations must be undertaken in order to aid speech perception, butthe efficiency of these mental processes is already compromised by age-related changes inprocessing ability. This would suggest that certain hearing loss pathologies may be more2The capacity to think logically and solve problems in novel situations, independent of acquired knowledge(Cattell, 1987).
3The ability to use skills, knowledge, and experience (Cattell, 1987).
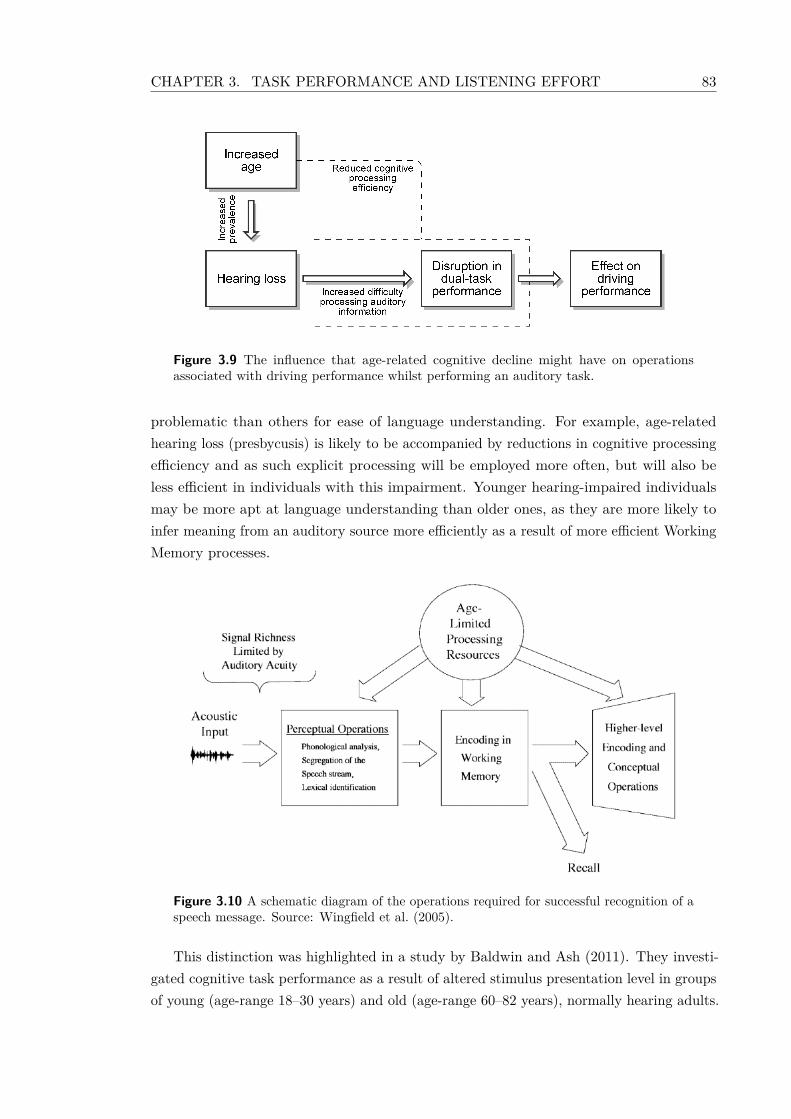
CHAPTER 3. TASK PERFORMANCE AND LISTENING EFFORT 83
Figure 3.9 The influence that age-related cognitive decline might have on operationsassociated with driving performance whilst performing an auditory task.
problematic than others for ease of language understanding. For example, age-relatedhearing loss (presbycusis) is likely to be accompanied by reductions in cognitive processingefficiency and as such explicit processing will be employed more often, but will also beless efficient in individuals with this impairment. Younger hearing-impaired individualsmay be more apt at language understanding than older ones, as they are more likely toinfer meaning from an auditory source more efficiently as a result of more efficient WorkingMemory processes.
Figure 3.10 A schematic diagram of the operations required for successful recognition of aspeech message. Source: Wingfield et al. (2005).
This distinction was highlighted in a study by Baldwin and Ash (2011). They investi-gated cognitive task performance as a result of altered stimulus presentation level in groupsof young (age-range 18–30 years) and old (age-range 60–82 years), normally hearing adults.
84 CHAPTER 3. TASK PERFORMANCE AND LISTENING EFFORT
They asked the two groups to complete a number of cognitive tasks with stimuli deliveredat varied presentation levels above absolute threshold. Their tasks comprised measures ofWorking Memory capacity, processing speed, and auditory Working Memory span. Theirresults showed that, compared to the young group, the performance of older adults onthe auditory Working Memory span task was significantly more affected by reductions instimulus presentation levels.
Baldwin and Ash (2011) suggest that declining acuity plays an important role inage-related declines in cognitive ability. However, they also point out that the interactionbetween sensory and cognitive processes should be considered. They point to a common-cause hypothesis, whereby sensory decline reflects a general age-related degradation ofthe central nervous system that affects all functions (Li and Lindenberger, 2002). Thishas also been proposed by Lindenberger and Baltes (1994), who suggested that sensoryacuity may act as an index of the physiological integrity of the aging brain. However,Baldwin and Ash (2011) argue that their data supports a modality-specific associationin this regard, given that their visual Working Memory span task was not significantlydifferent between their young and old group, whereas the auditory version was. This agreeswith research which has shown a degradation of verbally administered cognitive tests inhearing (but not visually) impaired participants (Van Boxtel et al., 2001), and deficitsin visually administered cognitive tests in visually (but not hearing) impaired subjects(Gussekloo et al., 2005).
In support of a link between sensory acuity and cognitive functioning, associations havebeen shown in the literature between the development of age-related hearing impairmentsand a higher prevalence of cognitive decline. When considering cognitive changes in thiscontext, it is important to note that it is not with explicit reference to disorders suchas dementia, rather age-related changes in cognition that occur in many older adults asa result of ‘healthy aging’ (Humes et al., 2012). Some authors have noted a correlationbetween the presence of hearing loss and measures of cognitive functioning. For example,Baltes and Lindenberger (1997) present data where they measured the auditory acuity of alarge participant group (n = 687), as well as administering a total of fourteen cognitivetests aimed at measuring five intellectual abilities: perceptual speed, reasoning, memory,knowledge and fluency. Their analysis supported an earlier inference (Lindenberger andBaltes, 1994) that age-based changes in the central nervous system affect both cognitive andsensory systems of functioning, noting that a large amount of variance (31%) in cognitivescores could be accounted for by sensory impairment in their older sample.
The link between cognitive status and sensory acuity is a contentious issue, and itis unclear whether changes in sensory abilities cause cognitive slowing, or whether thedevelopment of these problems is as a result of more global cognitive changes. Regardless,Humes et al. (2012) points out that central auditory declines in aging are often intertwinedwith age-related changes in peripheral hearing, cognition, or both. Notwithstanding theunderlying aetiology of such a problem, the possibility of a naturally higher prevalence of

CHAPTER 3. TASK PERFORMANCE AND LISTENING EFFORT 85
cognitive slowing in the hearing impaired demographic was considered in the design andanalysis of experiments carried out during this programme of research. This was achievedinitially through the use of a cognitive test battery in order to assess the underlyingcognitive differences between the normally hearing and hearing impaired individuals beingrecruited. This made it possible to establish whether one experimental group was morepredisposed to cognitive slowing, thus potentially affecting their performance on tasks beingundertaken. Thereafter, age-related cognitive concerns were removed from experimentalparadigms used by simulating a hearing loss for young, normally-hearing individuals. Thismeant that a within-subjects design could be used, meaning that the cognitive capabilitiesof both experimental groups (hearing loss and normal hearing) were identical, and olderparticipants did not have to be recruited.
Undoubtedly, not controlling for the issue of cognitive decline would have a dispropor-tionate effect on the interpretation of results in this research programme, particularly sincethe overarching hypothesis driving this research was that driving is affected by peripheraldistortions to a sound source, and not central complications which co-exist with hearingloss.
3.5 Summary
The potential implications of hearing loss for driving and related tasks have already beendiscussed (see Chapter 2). One key area identified was the potential disproportionate effectof concurrent auditory task performance on driving and relevant skills. In the currentchapter, the Working Memory model has been used to explain why auditory tasks affectdriving in normally hearing individuals. However, cognitive requirements for successfulauditory perception are increased in the hearing impaired demographic, and this is likelyto have a further effect on concurrent driving performance. Therefore, this chapter hasalso presented the likely reasons why this increased listening effort will manifest, and itsimplications for task performance have been discussed by linking it with the WorkingMemory model.
According to the model, driving decrements as a result of auditory task engagementwill occur in the normally hearing population if the auditory task places sufficient demandon the central executive. The ELU suggests that hearing impaired individuals have toemploy more explicit processing in order to understand an auditory message, and thatthis explicit processing arises from a construct similar to the central executive of WorkingMemory. Accordingly, greater driving decrements will occur as a result of concurrentauditory task engagement for hearing impaired individuals, as the central executive willbe under a greater load and will, thus be less efficient at carrying out its own explicitprocesses, including attention switching between the phonological loop and visuospatialsketchpad.
Finally, age has been identified as a potentially confounding factor in studies that have

86 CHAPTER 3. TASK PERFORMANCE AND LISTENING EFFORT
been outlined in this thesis. Age leads to a reduction in Working Memory capabilitiesand explicit processing abilities, which the ELU postulates will be employed more often inhearing impaired individuals.

Chapter 4
Self-Reported Data On DrivingPerformance and Hearing Loss
4.1 Introduction and study aims
This chapter reports on the first study of this programme of research, which aimed toaddress the first three research questions presented in Chapter 2:
1. Is hearing loss seen as a cause of any problem for driving by people with a hearingloss?
2. Do people with a hearing loss report any alterations to their own driving behaviour?
3. Is there a difference between self-reported hearing loss and measured hearing sensi-tivity in terms of its affect on driving?
There is currently little evidence in existence from which to answer these questions.Despite a growing body of research starting to link hearing loss to a number of drivingvariables (see Chapter 2), the majority of these studies have been hypothesis-driven andwere not informed by information taken directly from individuals with a hearing loss.
There are only two reports of driving habits of individuals with a hearing loss:
1. Holland and Rabbitt (1992), who investigated reports of altered driving behaviourin hearing impaired individuals, but found no association between their measuresof hearing loss and outcomes. Their study was under-powered (n = 68), did notexplicitly focus on hearing loss (they also investigated visual deficits), and they onlyasked simple questions regarding themes such as avoiding driving on certain types ofroad, or at certain times of day, rather than driving-specific behaviours.
2. Thorslund et al. (2013c) who also did not exclusively ask about the effect of hearingloss on driving (and specific driving skills), but did gather some information regardingannual mileage and license ownership. Their data suggested a lower likelihood of
87

88 CHAPTER 4. QUESTIONNAIRE STUDY
license ownership in those with a profound hearing loss, but also a higher annualmileage; these results are considered inconclusive (see Chapter 2).
The study reported in this chapter consisted of a self-report questionnaire, exclusivelydesigned to understand the effect of hearing loss on driving, administered to a large sampleof hearing impaired individuals. The questions were concerned with driving behaviour,and specific situations in which hearing impairment might have an effect on driving. Thequestionnaire aimed to establish an insight into whether this demographic experienced anyproblems in terms of their own individual driving with a hearing loss, and if so, which issueswere most problematic for them. The collection of various measures related to hearing lossallowed for the analysis of whether increasing severities of hearing impairment or functionalhearing loss, and different types/lateralities of hearing loss affected the manner by whichdriving outcomes were reported.
Establishing the opinion of hearing impaired individuals with regard to driving be-haviours is important, particularly as one research group has identified that there maybe a behavioural adaptation in driving style adopted in this group of drivers (Thorslundet al., 2013a,b, 2014). Whether or not this driving style is intentionally or unintentionallyused can only be informed by the limited study of Holland and Rabbitt (1992). However,this information is of value, as the opinions of hearing impaired individuals are likely to behighly correlated with the uptake of any potential rehabilitative measures. If, for example,an individual with hearing loss does not perceive any ill-effects of hearing impairment ondriving, he or she will be reluctant to engage with any treatment proposed. A questionnaireis a valid manner by which to investigate this theme; Lajunen and Summala (2003) arguethat questionnaires are often used to study driver behaviour, and have several advantagesincluding the ability to collect large amounts of data, and access to driving behaviourswhich would otherwise be difficult or impossible to study. However, questionnaires arealso subject to some limitations, such as self-deception (Lindeman and Verkasalo, 1995),over-confidence in one’s own skills (Lajunen et al., 1997), and giving socially desirableresponses (Lajunen and Summala, 2003). Furthermore, there may be issues with the recallof relevant information (Gallo et al., 1999); a driver may experience an episode whilstdriving and be oblivious to it at the time, or subsequently forget it, meaning that it cannotbe recorded through the use of a self-report methodology. Provided that these limitationsare acknowledged, a questionnaire approach was considered an ideal manner in which toexplore the perceptions of the hearing impaired demographic themselves with regard todriving.
4.2 Experimental hypotheses
Past literature was used to inform the items that were included in the questionnaire; itwas considered that responses would follow trends previously described in the literature.Hearing impaired individuals were expected to report a generally cautious approach to

CHAPTER 4. QUESTIONNAIRE STUDY 89
driving, whereby purposeful violation behaviour (such as disregarding speed limits) wouldnot be apparent (Picard et al., 2008; Thorslund et al., 2013a,b). On the other hand itwas considered that hearing impaired individuals may exhibit an increase in errors whilstdriving, induced by lapses in concentration, given that they are hypothesised to be moreprone to the effects of auditory distraction (Hickson et al., 2010). These trends werehypothesised to become more marked with increasing degree of functional hearing loss,and pure tone audiometry thresholds (Picard et al., 2008; Hickson et al., 2010).
4.3 Method
4.3.1 Questionnaire creation
The questionnaire was self-administered at National Health Service (NHS) audiologydepartments. This approach ensured the capture of individuals with a hearing impairmentand the ability to access recent, reliably measured pure tone audiometry data from thesepatients. A self-report format was considered desirable as it removed differences that mayhave occurred as a result of administration (and therefore influence) by different researchers.Furthermore, it allowed patients to complete information anonymously, which removed thepossibility of ‘impression management’, whereby individuals give answers that are sociallyacceptable as opposed to those which are more reflective of the truth (Lajunen et al., 1997).
A prototype questionnaire was created, which consisted of four sections:
1. A 24-item adapted version of an existing, validated measure of aberrant drivingbehaviours; the Driver Behaviour Questionnaire (DBQ) (Reason et al., 1990);
2. A newly-created 23-item survey regarding specific driving concerns related to hearingloss; the Driving and Hearing Loss Questionnaire (DHLQ);
3. Hearing loss information;
4. Demographic information.
Sections 2–4 were developed through discussion and pilot work with a number ofstakeholders. This approach ensured the ‘face’ and ‘content’ validity of the survey toolused; ‘face validity’ refers to the ‘appropriateness’ of items in the questionnaire as judgedby untrained observers, and ‘content validity’ as judged by reviewers with some knowledgeof the subject area (Litwin, 1995).
Firstly the questionnaire was discussed with two individuals who had a long-standinghearing impairment (1|/1~, 67 and 54 years respectively; both possessed a current, validUK driver’s license). Feedback regarding the questionnaire was positive, and only minorchanges in terms of the wording of questions was necessary for better comprehension. Nochanges to the content of the questions were made.
Following these discussions, the questionnaire was administered in person to twelvehearing impaired individuals (all of whom held a current valid driver’s licence) attending a

90 CHAPTER 4. QUESTIONNAIRE STUDY
lip-reading class held at the ‘Deaf Across Leeds Enablement Service’1. The purpose of thisexercise was to gain a further insight into problems not addressed by the questionnaire,and to assess any ambiguity in the wording of questions. All twelve participants reportedno problems in understanding the questionnaire, completed the survey without issue, andagreed that all relevant information was covered.
Finally the questionnaire was presented to audiologists at two NHS audiology depart-ments in the United Kingdom (Coventry Teaching Hospitals NHS Trust and UniversityHospitals North Staffordshire NHS Trust). This approach was taken in order to checkwhether there were any additional items which had been neglected, either as a result ofthe audiologists’ knowledge of hearing science, or as a result of experiences with patients.Furthermore, it was hoped that a group of clinicians might point out issues with the type ofhearing loss-related measures used, or the manner in which the questionnaire was plannedfor implementation at NHS departments. No issues with regard to the content of thequestionnaire were noted, but this step aided the design of the experimental protocol withrespect to patient recruitment.
The resulting final survey was presented such that it could be completed without thehelp of an outside party (see Appendix). This was considered a superior approach interms of potential recruitment success, as suggested by the audiologists consulted, giventhat participants could complete the questionnaire whilst waiting for their appointment.Furthermore, it was thought that patients would be more inclined to report certain typesof driving behaviour in the absence of an outside party, rather than having to admit it toan unfamiliar researcher (Lajunen and Summala, 2003).
A discussion of each of the four sections of the questionnaire and rationale of the contentis given below.
4.3.1.1 Section one: the Driver Behaviour Questionnaire
The DBQ, has been used abundantly in past academic research to examine differences inthe driving behaviour of different demographic groups. For example, the cultural differencesin driving behaviour between individuals from different countries (e.g. Lajunen et al., 2004;Özkan et al., 2006a; Bener et al., 2008). The DBQ is a self-report tool which considersdifferent types of aberrant driving behaviour; respondents indicate (using a 6-point Likertscale) the extent to which they encounter 50 different situations during their driving(de Winter and Dodou, 2010). An example of an item in the DBQ is shown below inFigure 4.1.
The DBQ was originally developed by Reason et al. (1990) to establish whether adistinction between errors and violations was justified for self-reported driver behaviour,1‘Deaf Across Leeds Enablement Service’ is a service based in Leeds for people aged 18+ and are Deaf,hard of hearing or Deaf blind. N.B. The group with which the questionnaire was piloted were all hearingimpaired individuals (not profoundly deaf individuals).

CHAPTER 4. QUESTIONNAIRE STUDY 91
Never Hardlyever
Occa-sionally
Quiteoften
Fre-quently
All thetime
Become impatient with aslow driver in the outer laneand overtake on the inside
1 2 3 4 5 6
Figure 4.1 A single item from the DBQ
since the two are thought to have different psychological underpinnings. Errors reflectperformance limits of the driver such as those related to perceptual, attentional, andinformation processing abilities; violations represent the style in which the driver choosesto drive and habits established after years of driving (de Winter and Dodou, 2010).
Responses to DBQ items are analysed using factor analysis, a statistical techniquedescribed by Child (2006) as the orderly simplification of several interrelated measures(‘factors’). These factors are ‘latent constructs’ as they are immeasurable in their ownright. Instead, related individual questions are used to provide information about factors.So in the context of the 50-item DBQ, Reason et al. (1990) hypothesised that a factoranalysis on the questionnaire data would form two groups: one with items correspondingto violation behaviour, and the other describing error behaviour.
However, analysis of data collected from a number of studies (e.g. Reason et al., 1990;Parker et al., 1995a; Åberg and Rimmö, 1998; Rimmö and Åberg, 1999) has shown thatthe DBQ often results in three factors. It is, therefore, argued that the DBQ can decipherbetween more than two types of bad driving:
• Errors - mistakes with potentially dangerous consequences;
• Lapses - attentional failures which cause embarrassment but are unlikely to impactdirectly on safety;
• Violations - risky behaviours which are engaged in deliberately.
The DBQ has been validated and extensively used in past research; de Winter andDodou (2010) point out that the DBQ has been used in at least 174 studies, and it is arepeatable measure (Parker et al., 1995a).
There is some discussion as to whether the DBQ is correlated with road traffic accidentinvolvement, though there is some disagreement regarding the specific factors which arepredictive of RTAs (see e.g. Stradling et al., 2000; DeLucia et al., 2003; Sümer, 2003;Özkan and Lajunen, 2005; Freeman et al., 2009; af Wåhlberg et al., 2011). The aim of thisstudy was, however, not to assess accident risk, but to understand the driving behaviour ofhearing impaired individuals. The DBQ has been shown to be sensitive to differences inthe driving behaviour of different demographic groups (West et al., 1993; Lajunen et al.,1998; Parker et al., 1998), without incorporating excessive influence of socially desirableresponse patterns (Lajunen and Summala, 2003). Thus, by employing this questionnaire

92 CHAPTER 4. QUESTIONNAIRE STUDY
it was possible to reliably examine lapse, error and violation type driving behaviours forindividuals with differing levels of hearing loss.
Parker et al. (2000) applied a shortened version of the DBQ in an elderly populationin order to investigate the relationship between DBQ answers and accident rates. Theyadministered the DBQ to 1,989 drivers aged 50 and above. Although the current study didnot have the same aim of establishing a relationship between DBQ answers and accidentrate, it was expected that the demographic attributes of the sample in Parker et al. (2000)would be similar to the sample recruited in this study, given the positive correlation betweenhearing loss and age (Davis, 1995). Parker et al. (2000) report mean and standard deviationscores for their sample on each of the DBQ items, thus their study gave normative dataagainst which the results of the current study could be compared, using statistical analyses.
The likely similarity between the two study samples meant that the previously identifiedproblem of heterogeneous data would be partly controlled, particularly as both studysamples were drawn from the same country of residence. Because of this, the demographicinformation collected in this study was chosen to reflect that collected by Parker et al.(2000). The version of the DBQ used was also matched to that developed by Parker et al.(2000), which was a shortened 24-item version (see Appendix).
4.3.1.2 Section two: the Driving and Hearing Loss Questionnaire
There is currently no questionnaire which can be used to examine the effect of hearingimpairment on specific driving behaviours. Accordingly, the creation of a new set ofquestions was required. This section will describe the synthesis and development of thispart of the questionnaire - the DHLQ.
The sparse evidence in the area of hearing loss and driving (see Chapter 2) has identifiedtwo underpinning principles regarding how hearing loss might have an effect on driving:
• An inability to hear sound (Ivers et al., 1999; Slawinski and MacNeil, 2002; Picardet al., 2008; Ohene-Djan et al., 2010);
• An increase in required listening effort to understand/perceive sound sources, which,in turn, has an effect on attentional control (Hickson et al., 2010).
The majority of items included in the DHLQ were driven by these principles. Specificsituations which might be troublesome for drivers with a hearing loss were identified fromexamples which have been reported in the literature, and from discussion with people whohave a hearing loss, as well as clinicians (audiologists). Participants’ agreement regardingwhether these specific situations are troublesome were sought, as well as their stancegenerally on whether hearing loss affects driving.
Research on the acceptability of in-car technologies for the hearing impaired demographichas suggested additional difficulties (Thorslund et al., 2013a,c). For example, navigationsystems using the auditory modality may be less suited to the hearing impaired demographic

CHAPTER 4. QUESTIONNAIRE STUDY 93
(Thorslund et al., 2013a). The DHLQ also explored this theme by asking about in-carsystems using the auditory modality.
Finally, there has been some concern with regard to the effect of hearing aids on drivingperformance (McCloskey et al., 1994). However, hearing aids are aimed at overcomingdeficiencies posed by SNHL (Moore, 1996; Dillon, 2001) and so it is feasible to considerthat they may provide benefit in the driving environment, particularly in light of theirability to reduce listening effort requirements (Sarampalis et al., 2009). Therefore, itemsregarding hearing aid use and acceptability whilst driving were also included in the DHLQin order to explore this theme.
The questions associated with these themes, and a rationale for inclusion, are presentedbelow. A Likert (1932) scoring system was used.
Stronglydisagree Disagree Neutral Agree Strongly
agreeI have considered limiting theamount I drive because of myhearing loss.
1 2 3 4 5
Figure 4.2 An example question from the DHLQ showing the Likert response type used.
4.3.1.3 Section three: demographic information
Age, gender, annual mileage, length of licence ownership, professional driver status, drivingtest history, and occupation data were collected and included in the analysis. Previousresearch indicates that gender and age differences are evident in self-report driving behaviourdata (Rimmö, 2002), but that differences can be explained when driving experience (interms of annual mileage and the number of years for which a licence has been held) iscontrolled (Groeger and Brown, 1989). Furthermore, age, gender, and driving experienceare generally included in studies employing the DBQ (e.g. Reason et al., 1990; Parkeret al., 1995b; Bener et al., 2008; af Wåhlberg et al., 2011.
The DBQ was used as a comparison against published data from a similar grouppresumed to consist of a majority of normally hearing individuals (Parker et al., 2000).Although Parker et al. (2000) did not measure hearing in their sample, it was presumedthat the majority of participants they recruited would have normal hearing, given thatthe prevalence of hearing loss for the mean age of their sample is approximately 44%(Cruickshanks et al., 1998). Thus, the representation of hearing impaired individuals in thesample collected in this study, where this demographic was being purposefully sampled,would be greater. Because data was being compared against Parker et al.’s (2000) study, itwas necessary to collect analogous demographic information in this study. It was, therefore,possible to accurately evaluate the similarities between the two separate samples, andhighlight any significant differences which may have had a bearing on the results of the

94 CHAPTER 4. QUESTIONNAIRE STUDYQue
stionn
aire
item
Rationa
le
General
questio
ns
Ihaveconsidered
limiting
theam
ount
Idrivebe
causeof
myhearingloss.
Twopa
ststud
iesh
avefoun
dthat
hearingim
paire
dindividu
alsa
remorelik
elyto
ceasedrivingcompa
redto
their
hearingcoun
terparts
(Gilh
otra
etal.,2001;U
nsworth
etal.,2007).
Thisqu
estio
naimed
toun
coverwhe
ther
thereareman
yrepo
rtsof
peop
lekn
owinglylim
iting
theirdrivingas
aresult
ofhearingloss.
Ithink
that
hearing
loss
presents
someprob
lemsfordriving.
Hearin
gim
pairm
entmight
have
aneff
ecton
drivingbe
haviou
ran
dsafety
(e.g.Barreto
etal.,19
97;Ivers
etal.,
1999
;Picardet
al.,20
08;H
icksonet
al.,20
10;T
horslund
etal.,20
13a,b,
2014
).Untilno
w,t
here
hasbe
enon
lyasm
alla
mou
ntof
work
assessingtheop
inions
ofhe
aringim
paire
ddriversthem
selves
(e.g.Holland
andRab
bitt,
1992
;Tho
rslund
etal.,20
13c).A
skingthis
questio
nindicatedtheexpe
rienc
esof
this
demog
raph
icon
driving
prob
lems.
Ifeelt
hatmyhe
aringloss
sometim
esmakes
drivingmoredifficultforme.
Insteadof
asking
participan
tswhether
they
thinkhearingim
pairm
entis
alim
iting
factor
forsafe
driving
gene
rally
,thisqu
estio
naskedpa
rticipan
tsto
expressthou
ghts
regardingtheirow
nindividu
aldriving.
This
provided
ameasure
oftheextent
towhich
peop
lemay
infla
tetheirow
ndrivingab
ility
(Farrand
andMcK
enna
,2001;H
orsw
illet
al.,2004)an
dan
swer
favourab
lyforthem
selves.
Use
ofin-car
techno
logy
Ifeel
that
somein-car
electron
icde-
vicesw
hich
makeuseof
soun
dareno
taccessible
tome.
In-car
system
smay
notbe
accessible
forhearingim
paire
ddrivers,
andsomeinvestigationinto
alternatives
has
been
unde
rtaken
(Tho
rslund
etal.,20
13a,c).Thisidea
isba
sedon
scan
tevidence,a
lthou
ghin-car
techno
logy
isgrow
ingin
popu
larit
yan
dcomplexity
,and
someau
thorsa
resugg
estin
gthat
hearingim
paire
dindividu
alss
hould
refrainfrom
usingthesedevices(H
ickson
etal.,2010).
Therefore,t
hisqu
estio
naimed
tofurtherestablish
the
attit
udes
ofhearingim
paire
dindividu
alstowards
in-car
techno
logies
(e.g.satellite
navigatio
n).
Ifin
ditdifficultto
hear
soun
dspro-
ducedby
electron
icde
vicesin
mycar
(e.g.satellite
navigatio
ninstructions,
parkingsensorsetc).
Thisqu
estio
naimed
toestablish
whether
peop
leareun
able
tohear
in-car
techno
logies.Thisis
impo
rtan
tas
peop
lemay
feel
thistype
oftechno
logy
isaccessible,b
utstill
struggle
tohear
it.It
stan
dsto
reason
that
partially
inau
diblesystem
sarelik
elyto
have
moreof
acogn
itively-degrading
effect,
asthelistening
task
isbe
ingmad
emoredifficult
(see
Cha
pter
3).
Ifin
dthat
talkingon
aha
nds-free
mob
ileph
onewhilst
Idriveis
very
difficultbe
causeof
myhearingloss.
One
ofthemostcommon
form
sof
techno
logy
used
invehicles
isthemob
ileph
one(P
öystie
tal.,20
05).
This
questio
naimed
toestablish
whether
hearingim
paire
dindividu
alsstruggle
tousetheirmob
ileph
one.
Pho
neconv
ersatio
nisaprim
aryexam
pleof
anau
ditory
distractionwhich
canlead
toan
increasedroad
traffi
caccide
ntris
k,even
whenused
hand
s-free
(e.g.Redelmeier
andTibshira
ni,1
997).

CHAPTER 4. QUESTIONNAIRE STUDY 95
Que
stionn
aire
item
Rationa
le
Inability
tohear
soun
d
Being
able
tohear
whenem
ergency
services
vehicles
arenear
isdifficult
forme.
Itha
sbe
ensuggestedthat
hearingim
paire
dindividu
alsareun
able
tohear
auditory
warning
signa
lseasily,
impa
ctingon
theirdrivingsafety
(Cop
pinan
dPe
ck,1
965;
Miyazak
iand
Ishida
,198
7;Iverset
al.,19
99;P
icard
etal.,20
08;O
hene
-Djanet
al.,20
10).
Hearin
gem
ergenc
yservices
vehicles’s
irens
may
bedifficu
lt,pa
rticularly
fortheelderly
hearingim
paire
ddemograph
ic(Slawinskia
ndMacNeil,2002).
Working
outt
hedirectionfro
mwhich
emergencyservices
vehicles
areap
-proachingis
difficult
becauseof
my
hearingloss.
Perceiving
theap
proa
chingdirectionof
emergencyservices
vehicles
isim
portan
tfor
taking
evasiveactio
nshou
lditbe
necessary(deLo
renz
oan
dEilers,1
991).Fo
rdriverswith
ahe
aringloss,t
helocalisationof
soun
dsmay
bedifficu
lt;localisationskillsareoftenim
paire
dby
SNHL(M
oore,2
007),s
oit
islik
elythat
this
will
beaprob
lem
forhearingim
paire
ddrivers.
Ifeelt
hatbe
causeof
myhe
aringloss
Iam
sometim
esless
awareof
wha
tis
goingon
arou
ndmewhen
Iam
driving.
Thisqu
estio
naimed
toderiv
egeneralinformationab
outaw
arenessof
allr
oadusersan
dsit
uatio
nsforpe
ople
with
ahe
aringloss.The
reis
eviden
cesugg
estin
gthat
soun
dis
impo
rtan
tforsit
uatio
naw
aren
ess(W
alkeret
al.,
2008),thereforetheredu
ctionof
soun
dby
SNHLmay
hind
erthis
aspe
ctof
driving.
Myhearingloss
sometim
esmakes
itdifficu
ltform
eto
judg
eho
wfast
Iam
driving.
Itis
thou
ghtthat
thequ
ieterba
ckgrou
ndno
iselevels
are,
theslo
wer
ourpe
rceptio
nof
travellin
gspeed.
This
may
lead
toun
witt
ingspeeding
beha
viou
r(E
vans,1
970;
Matthew
san
dCou
sins,
1980;W
alkeret
al.,2006;
Horsw
illan
dPloo
y,20
08;H
ellie
ret
al.,20
11;W
angan
dWan
g,20
12).
Itfollo
wsthat
hearingim
pairm
entmay
redu
cetheintensity
ofba
ckgrou
ndno
ise,t
husresulting
inasim
ilarph
enom
enon
.How
ever,n
umerou
sau
thors
have
notedalowe
rdrivingspeedin
thehe
aringim
paire
ddemog
raph
icwhich
contradictsthispred
ictio
n(P
icard
etal.,2008;H
ickson
etal.,2010;T
horslund
etal.,2013a,b).
Ithink
that
soun
dsfro
mtheen
gine
ofthecara
reim
portan
tfor
safe
driving.
Soun
dsfrom
thecarengine
arepe
rceivedas
impo
rtan
tby
theAustraliandriver
licensin
gbo
dy,w
hostatethat
commercial
vehicledriversha
veto
have
alevelo
fhearin
gwhich
allowsthem
tobe
awareof
chan
gesin
engine
orroad
noise
san
dexternal
warning
signa
ls.Ifvehicularno
iseis
notpe
rceivedas
impo
rtan
tby
hearingim
paire
dindividu
als,
they
areun
likelyto
adop
treha
bilitativemeasuresto
improvethesit
uatio
n.
My
hearing
loss
makes
me
worry
abou
tpa
rking
my
vehiclein
close
prox
imity
toother
obstacles
(e.g.
othercars,fences,
walls
etc).
Duringpilotwo
rk,a
numbe
rof
hearingim
paire
dindividu
alsexpressedconc
ernwith
man
oeuv
ringtheirvehicle
incloseproxim
ityto
objects.
Thisqu
estio
naimed
toestablish
whether
this
isacommon
feelingam
ongstthis
demograph
ic.

96 CHAPTER 4. QUESTIONNAIRE STUDYQue
stionn
aire
item
Rationa
le
Indicators
oflistening
effort
Ihaveprob
lemshearingwha
tpa
ssen
-gers
saywhilst
Iam
drivingmycar.
Passen
gerconv
ersatio
nisapo
tentialsou
rceof
distractionwhilst
driving(L
aberge
etal.,20
04),an
das
such
this
distractioneff
ectmay
begreaterifthelistening
task
ismad
emoredifficult(e.g.as
aresultof
hearingloss).
Passengers
may
compe
nsateforthis
bymediatin
gtheirconv
ersatio
nsdu
ringpe
riods
ofdeman
ding
driving
(Drewset
al.,20
08),or
altertheirspeech
ifthey
know
thedriver
ishe
aringim
paire
d.Thisqu
estio
naimed
toestablish
whether
passengerconv
ersatio
nis
particularly
difficultforhearingim
paire
ddriversto
hear.
WhenIam
talkingto
peop
lein
my
carIfin
dit
difficult
toconcentrate
ontheroad
.
Thisqu
estio
nattempted
toga
ininform
ationab
outtheextent
towhich
passen
gerconv
ersatio
nisdistractingfor
hearingim
paire
dindividu
als.
Rathe
rtha
ntrying
toestablish
thedifficu
ltyof
listening
topa
ssen
gerc
onversation,
itmoredirectly
assessed
thedistractiveim
pact
that
passengerconv
ersatio
nmay
have.
Hav
ingthestereo
onwhilst
Idrive
hasanegativ
eeff
ecton
mydriving.
Listen
ingto
thestereo
whilst
drivingha
sgenerally
been
foun
dto
have
ane
gligible
effecto
ndrivingpe
rform
ance
inno
rmally
hearingindividu
als(B
ellin
geret
al.,2009).
Hearin
gloss
may
have
abe
aringon
thepe
rceptio
nof
soun
dfro
mcars
tereos,a
ndso
itmight
bethat
listening
tothestereo
does
have
aneff
ectinthehe
aringim
paire
ddemograph
ic.The
questio
nalso
relatedto
amasking
effecton
otherau
ditory
inform
ation,
whereby
thestereo
soun
d‘coversup
’other
environm
entals
ound
.Hearin
gim
pairm
entredu
cestempo
ralr
esolution(M
oore,2
007),
thus
itis
moredifficultto
hear
soun
dof
interest
durin
gthe‘gap
s’of
amasking
soun
d.
When
Iam
paying
attention
tosoun
dsprod
uced
byelectron
icdevices
inthecarIfin
ddrivingmorediffi-
cult
(e.g.satellite
navigatio
ninstruc-
tions).
The
reha
sbe
enresearch
rega
rdingtheeff
ects
ofdiffe
rent
type
sof
auditory
cues
ondrivingpe
rforman
ce(see
e.g.
Hoan
dSp
ence,2
012).Thisresearch
haslargelyne
glectedtheeff
ectof
attenu
ationan
dfilterin
gof
soun
ds.
Aspe
rthereason
ingforpa
ssen
gerconv
ersatio
nan
dstereo
use,
listening
toau
ditory
inform
ationprov
ided
byelectron
icdevicesmay
also
have
adistractingeff
ectin
hearingim
paire
ddrivers.
Importan
ceof
environm
entals
ound
Ithink
that
soun
dsfro
mthes
urroun
d-ing
environm
entareim
portan
tfor
safe
driving.
Thisqu
estio
nexplored
theop
inions
ofhe
aringim
paire
ddriversrega
rdingthesugg
estio
nthat
environm
ental
soun
dis
impo
rtan
tin
driving(W
alkeret
al.,20
06).
Anindividu
alwith
amild
hearingloss
may
belie
vethat
environm
entals
ound
isim
portan
tfordriving,
becausethey
canstill
hear
andmakeuseof
it.So
meb
odywith
asevere
impa
irment,ho
wever,m
ayno
tha
veaccess
tothat
soun
d,an
dmay
adap
ttheirdrivingstylerelyingon
othercues.

CHAPTER 4. QUESTIONNAIRE STUDY 97
Que
stionn
aire
item
Rationa
le
Efficacy
ofhearingaidusein
thecar
Ido
n’tfin
dthat
myhearingaid(s)
improvemyab
ility
todrive.
Hearin
gaids
may
have
somesuccessin
improvingdrivingcomfort
andsafety
inthat
they
canincrease
audibility
(Moo
re,1
996;
Dillon
,2001),a
nddecrease
listening
effortrequ
irements
(Saram
palis
etal.,20
09).
Thisqu
estio
naskedwhether
this
demograph
icno
tices
anydrivingim
provem
entas
aresultof
wearin
ghearingaids.
Myhearingaid(s)
dono
tallow
me
tocommun
icatemoreeasilywith
pas-
seng
ersinthecarw
hilst
Iam
driving.
Intheprevious
sections,respon
dentswereaskedab
outthedifficulty
they
expe
rienced
inconv
ersin
gwith
passengers.It
was
argu
edthat
themoredifficult
thepe
rceptio
nof
passengerconv
ersatio
n,thegreaterthe
impa
ctitwill
have
ondrivingas
aresultof
distraction.
Ashe
aringaids
areaimed
atincreasin
gtheau
dibilityof
soun
dsan
dspeech
recogn
ition
(Dillon
,200
1),itislikelythat
usingthem
will
improvethisaspe
ctof
driving.
This
questio
nwa
s,therefore,
aimed
atestablish
ingwhether
anyrespon
dentsha
vean
yexpe
rienc
eof
this
sugg
estio
n.
Myhearingaid(s)
dono
tmakeme
feel
moreaw
areof
mysurrou
ndings
whilst
driving.
Simila
rto
theab
overeason
ing,
this
questio
naimed
toestablish
whe
ther
theincreasedau
dibilityprov
ided
byhearingaids
coun
teractsthepo
tentialissue
ofbe
ingun
able
tohear
driving-relatedenvironm
entals
ound
.
Usin
gmyhe
aringaid(s)
does
notal-
low
meto
usede
vicesin
mycarmore
easily.
Aga
in,itis
possible
that
amplificatio
nprov
ided
byhe
aringaids
means
that
in-car
system
sfunc
tioning
using
theau
ditory
mod
ality
may
beloud
er.Ifpe
ople
rate
thesesystem
sas
having
alow
accessibility,itwou
ldbe
beneficialt
odeciph
erwhether
hearingaids
have
thecapa
city
toim
provethesit
uatio
n.
Ifeel
that
wearin
gmyhearingaid(s)
disorie
ntates
mewhilst
driving.
Despite
thepo
sitiveim
pact
oflistening
instruments,itis
common
placeforthosefittedwith
hearingaids
torepo
rtnegativ
easpe
ctsto
theiruse(C
ox,2
005).There
issomeevidence
that
wearin
gasin
glehearingaid
disrup
tsape
rson
’sab
ility
tolocalisesoun
d(N
oble,2
006).Thismay
meanthat
adriver
couldpe
rceive
asoun
das
comingfrom
onedirection,
whenit
isactually
from
acompletelydiffe
rent
direction.
Wearin
gmy
hearing
aid(s)
whilst
drivingmakes
soun
dsun
comfortab
lyloud
.
Acommon
repo
rtfrom
peop
lewearin
ghearingaids
interm
ittently
isthat
they
aretooloud
,sometim
esun
comfortab
lyso
(Smeds,
2004).
Given
thehigh
levelo
fbackg
roun
dno
iselevelincarcabins
(Evans,1
970;
Matthew
san
dCou
sins,
1980
),this
prob
lem
may
beexcessivelyrepo
rted
whe
nusinghe
aringaids
invehicles.
Furtherm
ore,
Unsworth
etal.(2007)suggestthat
they
note
anincreasedroad
traffi
caccident
riskin
peop
leusinghearingaids
whilst
drivingas
aresult
ofloud
,dist
ractingsoun
dsmad
eby
hearingaids.

98 CHAPTER 4. QUESTIONNAIRE STUDY
questionnaire. This was particularly important given that de Winter and Dodou (2010)regard differences in DBQ outcomes as a product of sample heterogeneity. In addition toinformation regarding age, gender and driving experience, Parker et al. (2000) also askedparticipants their occupation, whether they took a test in order to obtain their drivinglicence, and whether they had ever been a professional driver.
Participants were also asked whether their driving had increased, decreased or remainedconstant over the previous three years, in an attempt to understand whether certain typesof hearing loss, or hearing loss severity was related to retirement from driving. Finallyparticipants were asked if they avoided driving on certain types of road or at certain times,as visual sensory impairments have been shown to cause people to limit their drivingunder certain circumstances (Kosnik et al., 1990; Holland and Rabbitt, 1992; Ball et al.,1998; Hakamies-Blomqvist and Wahlström, 1998). Thus it was considered that the sensoryimpairment of hearing loss may also result in similar behaviour of avoiding driving atcertain times, or on certain roads.
4.3.1.4 Section four: hearing loss information
Self-reported hearing loss and pure tone audiometry data were collected in this study. Theuse of these two measures in past work investigating the effect of hearing loss on drivinghas been mixed, and this is a concern given that the two measure different constructs (seeChapter 2). Accordingly, it was thought that relationships between questionnaire outcomesand these two measures of hearing loss would vary. It was one of the aims of this study toinvestigate these differences.
Each participant’s most recent pure tone audiogram (from within the past three years)was collated with their completed questionnaire and they were asked to complete the HHIE-S (Ventry and Weinstein, 1983), a widely used, reliable and valid survey tool (Lichtensteinet al., 1988) to measure functional hearing loss.
In addition to these measures of hearing loss, information about hearing aid ownershipand use in different circumstances was also collected. Participants were asked if they owneda hearing aid, and if so for how long. They were asked if they used their hearing aids, andhow often this was the case (a) generally, and (b) whilst driving. This information wasconsidered pertinent, as it may have had a bearing on certain questionnaire items. Forexample, those who drive with hearing aids may have no problem hearing what passengerssay, whereas those who do not wear hearing aids in the car may struggle to a greaterextent.
4.3.2 Procedure
Initially, two separate NHS audiology departments were approached and asked if they wouldbe involved with data collection for this study. Details of the project were also publishedon the NHS United Kingdom Clinical Research Network database, an online searchable

CHAPTER 4. QUESTIONNAIRE STUDY 99
database of research projects that allows hospital research and development departmentsto identify projects to which they can contribute. Contact through the Clinical ResearchNetwork led to the inclusion of six more sites in the study. The author liaised individuallywith each department’s lead prior to data collection to explain the experimental procedure,what was required, and to answer any outstanding questions that arose.
Individuals were considered eligible for participation in the study if they had a hearingloss of any degree (> 20 dB in either ear; British Society of Audiology, 2011) and owned acurrent driver’s license. At each participating site, administrative staff posted informationsheets about the study to patients, along with routine appointment letters. The informationsheet gave a brief description and rationale of the study, and informed patients that theywould be invited to participate upon attendance of their appointment. On the day of theirappointment, patients were asked by their audiologist if they would like to take part, andan opportunity was given to review the information or ask the audiologist any questionsthey may have had about the study.
Participants completed their questionnaire in the waiting room, and were instructed tohand it to their audiologist at the start of their appointment, so that their most recentaudiogram could be added to the form. Participants were required to sign informed consentfor the inclusion of this test result, and this was taken by the audiologist.
Ethical approval for this study was obtained through the NHS National Research EthicsService Research Ethics Committee (reference: 12/NW/0721).
4.4 Results
4.4.1 Demographics
Data collection for this study was run over a fifteen month period from February 2013to June 2014. From the eight NHS departments included in the study, a total of 393completed questionnaires were collected, which is considered sufficient to draw validconclusions regarding the wider hearing impaired population, according to a simple powercalculation suggested by Krejcie and Morgan (1970). A breakdown of the number ofparticipants recruited at each site is shown in Figure 4.3. Table 4.1 shows a summaryof the demographic information, and compares it against Parker et al.’s (2000) studydemographic.
The mean pure tone audiometry thresholds across all participants for left and rightears are shown in Figure 4.4. Although the audiograms collected from respondents weresuggestive of a range of underlying causes and degrees of hearing loss, the majority of casessuggested acquired, age-related hearing loss, reflected in the sloping, high-frequency natureof the mean audiograms shown. Indeed, the mean age of hearing loss onset was 54.28 (SD =19.92). Table 4.2 shows that participants had a range of hearing loss severities (as classifiedusing recommended guidelines; British Society of Audiology, 2011), and functional hearingloss severities (using a commonplace categorisation technique for the HHIE-S; Lichtenstein

100 CHAPTER 4. QUESTIONNAIRE STUDY
Coordinating NHS trust Number ofrespondents
1. Dorset County HospitalFoundation Trust 185
2. Royal Wolverhampton NHS Trust 100
3. University Hospitals NorthStaffordshire NHS Trust 34
4. Newcastle upon Tyne HospitalsNHS Foundation Trust 25
5. City Hospitals Sunderland NHSFoundation Trust 20
6. Cambridge University HospitalsFoundation Trust 14
7. Shrewsbury and Telford HospitalNHS Trust 13
8. Leeds Teaching Hospitals NHSTrust 2
Figure 4.3 The breakdown of respondents recruited from each NHS trust involved in thestudy and their location.
et al., 1988).
Figure 4.4 Mean audiometric results (± one standard deviation) across the entire sampleshown for respondents left and right ears.
In terms of hearing aid use and ownership, 52% of participants owned bilateral hearingaids, 25% owned unilateral hearing aids, and 23% did not own a hearing aid. Of those thatdid own hearing aids, they had sought rehabilitative help an average of 17.19 years (SD=16.34; range = 0–87) following the onset of their hearing loss. Only 1% of the samplewho owned a hearing aid reported not using it. In terms of the extent to which participants

CHAPTER 4. QUESTIONNAIRE STUDY 101
Table 4.1 Summary demographic information for the study sample compared against thatof Parker et al. (2000).
Demographic info Current study Parker et al. (2000)
Number of participants 393(|= 73%; ~= 27%)
1989(|= 62%; ~= 38%)
Age 69.59 (SD = 12.29;range = 23–94)
66(range = 49–90)
Years driving licence held for 46.05 (SD = 13.99;range = 0–75) N/A
Estimated annual mileage 7,800 (SD = 7, 300;range = 0–60,000)
8,540(range = 10–40,000)
Proportion of sampleincreasing/decreasing driving in thepast three years
11% increased;39% decreased;
50% stayed the same
9% increased;32% decreased;
59% stayed the same
Proportion of sample reportingactive/passive crashes in theprevious five years
14% passive;7% active;2% both
23% passive;25% active;7% both
Table 4.2 The proportion of respondents fitting the criteria for different types of hearingdescriptors.
Descriptor Proportion of sample
BSA audiometric descriptor Normal 11%Mild 43%
Moderate 33%Severe 7%
Profound 6%
HHIE-S rated handicap No 20%Mild-moderate 45%
Severe 35%
Laterality of hearing loss Bilateral 5%Unilateral 95%
Site of lesion Sensorineural 62%Conductive 13%
Mixed 25%
reported using their hearing aid(s) both generally and whilst in the car, the proportionof the samples are shown in Figure 4.5. The majority of respondents generally reportedusing their hearing aids either most or all of the time. There was a significant increase in

102 CHAPTER 4. QUESTIONNAIRE STUDY
the number of respondents wearing their hearing aids ‘all of the time’ whilst driving (65%of the sample) compared to general use (47% of the sample), Z = −3.692, p < .001. It isimportant to note, however, that there was also an increase in people reporting ‘never’ or‘rarely’ wearing their hearing aids whilst driving, perhaps suggesting that there is a split inopinion within the group regarding their efficacy in the car.
Figure 4.5 The proportion of participants who owned a hearing aid reporting the amountthey use it both generally, and whilst driving.
4.4.2 Driver Behaviour Questionnaire
4.4.2.1 Factor analysis
A factor analysis with principal axis factoring (Costello and Osborne, 2005) was performedon the data collected in this study in order to explore the underlying factor structure.The Kaiser-Meyer Olkin measure of sampling adequacy (KMO = .891) (Hutcheson andSofroniou, 1999), and Bartlett’s test of sphericity
(χ2 = 8676.712, p < .001
), performed
on the dataset (Field, 2013), together suggested that the data was suitable for a factoranalysis. The direct oblimin (oblique) method of rotation was used, given the likelihoodthat extracted factors would be correlated in some manner (Costello and Osborne, 2005).Indeed this was the case, with the correlation matrix between items showing a moderateto high degree of association.
Factor analysis results in a number of different components, each of which explains aproportion of variance in the overall dataset (Field, 2013). This variance can be plottedin a ‘scree plot’ (see Figure 4.6). Commonly, the number of underlying factors presentin the dataset is identified by those which have eigenvalues of greater than one (Costelloand Osborne, 2005; Field, 2013). This method suggested a five-factor structure in thisstudy. However, Field (2013) suggested that applying a simple criterion such as ‘eigenvaluesgreater than one’ can be problematic in some cases, and an alternative method of factorextraction should be employed. For example, the shape of the scree plot can be examined

CHAPTER 4. QUESTIONNAIRE STUDY 103
to identify the ‘point of inflection’ (the point at which factors begin to explain very littlemore of the overall variance), and factors scrutinised for their interpretability, e.g. dothe items within a factor appear to have a common theme (Field, 2013). The resultingscree plot in this study suggested a two-factor structure was best suited to the data (seeFigure 4.6), this solution was found to be more interpretable than the five factor solution.The resulting correlation between the two identified factors was 0.46, suggesting that anoblique method of rotation was applicable (Costello and Osborne, 2005).
Figure 4.6 A scree plot exhibiting the components generated during the factor analysisperformed on the DBQ data.
The two factor structure accounted for 35.4% of the total variance present in the dataset. The factor structure and loadings of each individual questionnaire item is shown inTable 4.3 where loadings of less than 0.32 have been omitted for clarity, as this is theminimum value which indicates the loading of an item on to a factor (Tabachnick andFidell, 2013). It would appear that the commonly derived ‘violation’ factor is upheld,although two of the items that might be expected to load on to that factor do not (values< 0.32 ). Conversely, the other two expected factors (‘lapses’ and ‘errors’) appear to havebeen combined into one single factor.
4.4.2.2 Comparison against Parker et al.’s (2000) study
Though DBQ items are rated on a 6-point Likert scale, it is commonplace to treat thesevalues as continuous data (see e.g. Reason et al., 1990; Parker et al., 1995a,b, 2000; Lajunenet al., 2004; Özkan et al., 2006b). Multiple t-tests (using a Bonferroni correction) wereperformed on questionnaire items to test for significant differences in the reports betweenthe two studies; Table 4.4 shows the mean values of DBQ items which differed significantly.
Parker et al.’s (2000) participants reported the majority of items more frequently thandid respondents from the current study. There were a number of significant differencesbetween the two groups, these were all in the direction of a lesser frequency in the current

104 CHAPTER 4. QUESTIONNAIRE STUDY
Table 4.3 The factor structure derived from performing principal axis factoring on theDBQ data collected in this study. Factor loadings of < .32 are removed for clarity; thisresulted in two DBQ items not loading on to either derived factor.
DBQ item Error &lapse factor
Violationfactor
Misread signs and take the wrong turning off a roundabout .700Get into the wrong lane approaching a roundabout orjunction .674
Switch on the wrong thing on the instrument panel byaccident .672
Drive to a more usual destination through force of habit .600Forget where car is parked in a car park .526Fail to check rear view mirror before manoeuvres .525Miss give way signs and narrowly avoid collision .514Realise that you have no recollection of road along whichtravelling .477
Underestimate speed of oncoming vehicle when overtaking .468Hit something when reversing that you had not previouslyseen .465
Fail to notice pedestrians crossing on turning into side road .435Attempt to overtake someone you had not noticed to besignalling a right turn .422
Brake too quickly on a slippery road or steer wrong wayinto skid .404
Pay such close attention to the main stream of traffic younearly hit a queuing car .393
Drive away from traffic lights in too high a gear .377On turning left nearly hit a cyclist .371
Drive especially close to the car in front as a signal to moveout of the way .578
Become impatient and perform an undertake .573Disregard speed limits early in the morning or late at night .515Have an aversion to a particular road user and indicatehostility .454
Run a red light knowingly .439Drive even though potentially over the blood-alcohol limit .410
Give chase to another driver who has angered youGet involved in unofficial ‘races’ with other drivers
study. By far the biggest discrepancy was with the frequency of reported speeding behaviourlate at night and early in the morning. Respondents in this study were significantly lesslikely to report speeding behaviour (M = 1.67, S.D. = .62) than are those in the study ofParker et al. (2000) (M = 2.17, S.D. = 1.03), t = 12.88, p < .001.

CHAPTER 4. QUESTIONNAIRE STUDY 105
Table 4.4 The mean scores and standard deviation to DBQ items on which there was asignificant difference between this study and Parker et al.’s (2000) study.
DBQ item Mean (S.D.) ∆Currentstudy
Parker et al.(2000)
Disregard the speed limits late at night or earlyon in the morning.
1.67 (0.62) 2.17 (1.03) 0.50
Misread signs and take the wrong turning off aroundabout.
2.13 (1.03) 2.40 (0.64) 0.27
Realise that you have no recollection of the roadalong which you have just been travelling.
1.83 (0.99) 2.08 (0.92) 0.25
Forget where you left your car in a car park. 1.92 (0.66) 2.08 (0.87) 0.16Switch on one thing, such as the headlights, whenyou meant to switch on something else such as thewipers.
1.82 (0.88) 1.97 (0.78) 0.15
Underestimate the speed of an oncoming vehiclewhen overtaking.
1.57 (0.62) 1.70 (0.64) 0.13
Brake too quickly on a slippery road, or steer thewrong way into a skid.
1.43 (0.36) 1.51 (0.60) 0.08
The other significant differences between the two groups were lapse of concentrationbehaviours: misreading road signs on a roundabout, driving without any recollection ofthe road being driven on, switching on the wrong instrumentation in the vehicle, andforgetting the location of a vehicle in a car park. However, the difference in mean valuesfor these items were not as large as for the difference in speeding behaviour. There were afew significant differences in terms of dangerous error behaviour, though the difference inmean scores between the two groups was even smaller in these cases: underestimating thespeed of oncoming vehicles whilst overtaking, and braking too quickly on slippery roads orsteering the wrong way in to a skid.
4.4.2.3 Logistic ordinal regression
It was of interest to decipher which underlying factors (if any) were the best predictorsof participants responses to the DBQ. Accordingly, a logistic ordinal regression was runfor each individual DBQ item. This allowed for the derivation of an ‘odds ratio’ (OR); anassessment of how much influence an independent variable (e.g. hearing loss classification)has on a dependent variable (e.g. the frequency of speeding behaviour) (Szklo and Nieto,2012). The frequency with which participants reported each of the individual DBQ itemswas submitted as the outcome to the logistic ordinal regression, and a number of predictorvariables were chosen for investigation (see Table 4.5). This allowed some of the researchquestions posed to be adequately answered (e.g. are driving behaviour patterns and/ordriving problems more prevalent in certain types/durations/severities of hearing loss?).

106 CHAPTER 4. QUESTIONNAIRE STUDY
Table 4.5 The variables submitted to the logistic continuous regression.
Fixed factors Continuous variables
• Gender • Age• History of being a professional driver • Annual mileage• Hearing loss bilateral or unilateral • Driving experience• Conductive element to hearing loss • Duration of hearing loss• Hearing aid owner • Duration of hearing aid ownership
• General frequency of hearing aid use• Frequency of hearing aid use in the car• HHIE-S score• Average air conduction threshold of best ear• Average air conduction threshold of worst ear
In establishing whether a logistic ordinal regression model could be used for eachquestion in the DBQ, a number of criteria were considered. The -2 log-likelihood valuesfor the final model and one containing no explanatory variables were compared usingthe χ2 statistic (Quinn and Keough, 2002). The Nagelkerke pseudo R2 statistic was alsochecked to establish the amount of variance explained by the independent variables used(Nagelkerke, 1991). Finally, the test of parallel lines was used to check that the assumptionof proportional odds had not been violated; however this statistic is highly sensitive tomultiple explanatory variables (Brant, 1990), the use of continuous independent variables(Allinson, 2001) and large sample sizes (Clogg and Shihadeh, 1994; Allinson, 2001), and wasconsidered accordingly. The goodness-of-fit statistic was also considered in this manner, asit is highly sensitive to large sample sizes.
Where a regression model was considered applicable, independent variables were assessedfor their respective influence on the dependant variable of interest. The resulting significantpredictors (at the α = 0.05) level are shown in Table 4.6 and Table 4.7. Hearing loss wassignificantly associated with some error (3/9) and lapse (4/7) items, but no violation basedbehaviour.
Self-reported hearing loss (as measured by the HHIE-S) appears to be related to agreater number of outcomes on questionnaire items than measures of hearing sensitivity.Indeed, HHIE-S score was found to be a significant predictor on 7/24 DBQ items, whereashearing sensitivity was not significantly associated with any. Similarly, other data relatedto hearing loss (laterality, site of lesion, hearing aid ownership and use, duration of hearingloss) appeared to have no bearing on the answers participants gave to the DBQ. Theassociation of extraneous factors (see Table 4.5) with DBQ answers also appeared weakerthan that of HHIE-S score. Age, gender and driving experience were the only variablesassociated with any DBQ outcomes, and these variables were only significant predictors ofthree, two, and one DBQ items respectively.
In terms of the specific driving behaviours which self-reported hearing loss predicted,those with higher HHIE-S scores had a higher likelihood of knowingly running red lights,disregarding speed limits early in the morning or late at night, missing pedestrians on

CHAPTER 4. QUESTIONNAIRE STUDY 107
Tabl
e4.
6Indepe
ndentvaria
bles
significan
tlyassociated
with
DBQ
itemsin
the‘violatio
ns’a
nd‘dan
gerous
errors’c
ategoriesarising
from
the
logistic
ordina
lregressionpe
rformed.Anasteris
k(*)indicatesan
indepe
ndentvaria
blerelatedto
hearing.
DBQ
item
Trend
Odd
sRatio
95%
CI
p-value
Violatio
ns
Becom
eim
patie
ntwith
aslo
wdriver
intheou
terlane
and
overtake
ontheinsid
eMorelik
elyin
males
2.28
1.24–4.21
.008
Driv
eespe
cially
closeto
thecarin
fron
tas
asig
naltoits
driver
togo
faster
orgetou
tof
theway
Decreasewith
age
0.94
0.90–0.99
.018
Dan
gerous
errors
Cross
ajunctio
nkn
owingthetraffi
clig
htsha
vealread
yturned
againstyo
uIncrease
with
HHIE
-Sscore*
1.02
1.00–1.05
.050
Disr
egardthespeedlim
itslate
atnigh
tor
early
onin
the
morning
Decreasewith
age
0.96
0.93–0.99
.005
Increase
with
HHIE
-Sscore*
1.02
1.00–1.04
.019
Queuing
toturn
left
onto
mainroad
,you
paysuch
close
attentionto
themainstream
oftraffi
cthat
youne
arly
hit
thecarin
fron
t
Increase
with
HHIE
-Sscore*
1.03
1.02–1.05
<.0
01
Morelik
elyin
males
2.31
1.23–4.34
.009
Failto
notic
epe
destria
nscrossin
gon
turninginto
asid
eroad
Increase
with
HHIE
-Sscore*
1.03
1.01–1.05
.017

108 CHAPTER 4. QUESTIONNAIRE STUDYTa
ble
4.7Inde
pend
entvaria
bles
signific
antly
associated
with
DHLQ
itemsin
the‘la
pseof
conc
entration’
catego
ryarising
from
thelogistic
ordina
lregressio
npe
rformed.Anasteris
k(*)indicatesan
indepe
ndentvaria
blerelatedto
hearing.
DBQ
item
Trend
Odd
sRatio
95%
CI
p-value
Lapses
ofconcentration
Attem
ptto
driveaw
ayfrom
traffi
clig
htsin
toohigh
agear
Decreasewith
drivingexpe
rience
0.97
0.95–1.00
.034
Increase
with
HHIE
-Sscore*
1.02
1.00–1.04
.028
Switc
hon
onething,
such
asthehead
lights,
whenyo
umeant
tosw
itchon
something
else
such
asthewipers
Increase
with
age
1.03
1.00–1.05
.025
Increase
with
HHIE
-Sscore*
1.03
1.01–1.04
.002
Realiz
ethat
youha
veno
recolle
ctionof
theroad
alon
gwhich
youha
vejust
been
travellin
gIncrease
with
HHIE
-Sscore*
1.03
1.01–1.04
.001
Get
into
thewrong
lane
approachingaroun
dabo
utor
ajunctio
nIncrease
with
HHIE
-Sscore*
1.03
1.01–1.04
<.0
01

CHAPTER 4. QUESTIONNAIRE STUDY 109
turning left, nearly hitting cars in front whilst queuing, switching on the wrong vehicleinstrumentation, having no recollection along the road of travel, getting in to the wronglane at a junction, and driving away from traffic lights in too high a gear. Whilst thefirst of these two behaviours are violations, the rest appear to be attention-based lapses inconcentration, some of which are dangerous in nature.
4.4.3 Driving and Hearing Loss Questionnaire
Chronbach’s alpha was used to calculate the internal consistency (reliability) of the DHLQ(Field, 2013). A suitable degree (α = .772) of reliability was found (Lance et al., 2006),thus it was considered that the DHLQ had taken reliable responses.
The trend of answers to the questions asked in the DHLQ are summarised in Figure 4.7–Figure 4.11. In order to clearly see the split of opinion, ‘neutral’ responses have beenremoved. Questions are presented under the categories: general effect of hearing loss ondriving, listening effort concerns, inability to hear relevant information, barriers for in-cardevice use, and usefulness of hearing aids during driving.
4.4.3.1 General effect of hearing loss on driving
Figure 4.7 shows respondents generally maintain that hearing loss does not present aproblem for their own driving, with only 19% agreeing that hearing loss makes drivingmore difficult for them, compared to 73% who held the opposite opinion. Accordingly, itcomes as no surprise that very few respondents (5%) report limiting their driving timeas a result of their hearing loss. A logistic multinomial regression analysis with drivingincrease/decrease as the dependant variable showed no significant associations with any ofthe measured hearing loss outcome measures in this study.
However, there was a greater split in opinion when more general questions regardingthe effect of hearing on driving were asked. 40% of participants agreed that hearing losspresents some problems for driving, but a similarly sized proportion (43%) disagreed withthis statement. This differs from the trend exhibited in people’s opinions when they wereasked about their own driving, with the majority reporting no difficulty. However, 31%of participants reported avoiding driving under certain conditions. These responses aresummarised in Table 4.8, though note that some participants indicated more than onesituation they avoided driving in. Therefore, the sum of the ‘proportion of entire sample’column is greater than 31%. The majority of these reports were of participants not drivingin the dark, on motorways and during busy periods.
4.4.3.2 Listening effort
Figure 4.8 indicates that the majority of participants do not experience an increase indriving difficulty under conditions of auditory distraction. A large proportion of the sampleindicated that they undertook passenger conversations (92%), listened to the stereo (75%),

110 CHAPTER 4. QUESTIONNAIRE STUDY
Table 4.8 The number and proportion of participants avoiding driving under certaincircumstances.
Driving situation Number ofparticipants
Proportion ofentire sample
In the dark/at night 43 10.9%On motorways 35 8.9%During rush hour/busy periods 35 8.9%During bad weather 11 2.8%In city centres/busy urban areas 8 2.0%On A-roads 5 1.3%In new places 4 1.0%On country roads 3 0.8%On roads with speed bumps 1 0.3%On bank holidays 1 0.3%
Figure 4.7 Proportion of responses to questions about whether hearing loss presents aproblem for driving generally.
and used electronic devices (74%) whilst driving. Of those, 71% and 78% of respondentsdisagreed with, or were neutral to, the suggestion that driving was made any more difficultby passenger conversations or listening to in-car systems respectively. Likewise, only 31%of people reporting in-car device use believed that these systems were difficult to hear.However a greater proportion of the sample (50%) reported a difficulty in ability to hearpassenger conversation. Similarly, the majority of the sample (65%) either disagreed withor were indifferent to the idea that stereo use affected their driving performance (seeFigure 4.10). Fewer respondents reported using mobile phones whilst driving (31%), and ofthose that did, a small proportion reported there being no problem hearing mobile phoneconversation (31%).

CHAPTER 4. QUESTIONNAIRE STUDY 111
Figure 4.8 Proportion of responses to questions about whether hearing loss increaseslistening effort on tasks associated with driving.
4.4.3.3 Inability to hear relevant information
Participants disagreed that hearing loss limits relevant auditory information in the drivingenvironment (see Figure 4.9). A large proportion of respondents agreed that auditoryinformation is important for safe driving; only 20% disagree that sounds from the engineof the car are important for safe driving, and 26% disagree that environmental sound isimportant for safe driving. Despite this result, respondents did not generally considerhearing loss as a limiting factor in accessing driving-related auditory information. 58%disagreed that hearing emergency services vehicles is difficult, although 40% of peopledid agree that deciphering the direction of approach of these vehicles is difficult. Largeproportions of the sample disagreed that hearing loss reduced awareness of the surroundingenvironment whilst driving (63%), affects the ability to judge travelling speed (88%), andincreases anxiety about parking a vehicle (83%).
4.4.3.4 Barriers for in-car device use
In terms of in-car technology use, respondents generally did not appear to feel that hearingloss was a barrier. Indeed, only 17% agreed that sound-based in-car devices were inaccessibleto them. Furthermore, few respondents reported having difficulty in hearing mobile phoneconversations or sounds produced by electronic in-car devices (31% in each case). Twothirds of the sample indicated that the question regarding mobile phone use in the car wasnot applicable to them, suggesting that only a third of people used this type of technologywhilst driving. In contrast, a greater proportion of the sample answered questions aboutthe use of other types of in-car technology, with only 26% of participants indicating thatthis question was not applicable to them.

112 CHAPTER 4. QUESTIONNAIRE STUDY
Figure 4.9 Proportion of responses to questions about whether hearing loss limits theamount of auditory information relevant to driving.
Figure 4.10 Proportion of responses to questions about whether hearing loss presentsa problem for the successful use of in-car electronic devices using sound as a means tocommunicate information.
4.4.3.5 The usefulness of hearing aids during driving
The majority of respondents were positive regarding the use of hearing aids in the car. 62%of the sample disagreed that hearing aids made sounds uncomfortably loud whilst using

CHAPTER 4. QUESTIONNAIRE STUDY 113
them in the car, and even more respondents (82%) disagreed that hearing aids served todisorientate whilst driving. In terms of their ability to improve certain aspects of driving,respondents appeared to suggest that hearing aids had some efficacy. Only 17% of thesample agreed that hearing aids did not allow for easier use of in-car devices. A similarproportion (18%) agreed that hearing aids do not increase awareness of surroundings whilstdriving. Moreover, only 9% of respondents agreed that hearing aids did not provide anybenefit in terms of conversation with passengers in the car. However, a slightly largerproportion of the sample (24%) agreed that hearing aids do not improve driving abilitygenerally.
Figure 4.11 Proportion of responses to questions about whether hearing aids provide anybenefit whilst driving.
4.4.3.6 Logistic ordinal regression analysis to establish the best predictors ofdriving difficulties
In order to establish which underlying factors caused people to report specific issues withdriving, each of the individual DHLQ items were submitted to a logistic ordinal regression,using the same independent variables detailed in Table 4.5 as explanatory variables. Thisprovided an indication of which independent variables were the best predictors of reportedproblems with driving.
In establishing whether a logistic ordinal regression model could be applied for eachquestion on the DHLQ, the same criteria detailed in subsubsection 4.4.2.3 were considered.The resulting significant interactions (at the α = .05 level) are shown in Table 4.9–Table 4.11,along with their ORs and 95% confidence intervals.

114 CHAPTER 4. QUESTIONNAIRE STUDYTa
ble
4.9Indepe
ndentvaria
bles
significan
tlyassociated
with
DHLQ
itemsin
the‘general
questio
ns’a
nd‘in
dicators
oflistening
effort’
categorie
sarising
from
thelogistic
ordina
lregressionpe
rformed.Anasteris
k(*)indicatesan
indepe
ndentvaria
blerelatedto
hearing.
DHLQ
item
Trend
Odd
sRatio
95%
CI
p-value
General
questio
ns
Hearin
gloss
presents
prob
lemsfordriving
Increase
with
AC
thresholdof
best
ear*
1.01
1.00–1.03
.026
Decreasewith
drivingexpe
rience
0.75
0.62–0.69
.004
Ifeel
that
myhearingloss
sometim
esmak
esdrivingmoredifficult
forme
Increase
with
HHIE
-Sscore*
1.03
1.01–1.05
.001
Indicators
oflistening
effort
WhenI’m
talkingto
peop
leit
isdifficult
toconcentrateon
driving
Increase
with
HHIE
-Sscore*
1.02
1.01–1.03
.010
Less
likelyin
thosewho
have
been
aprofessio
nald
river
0.59
0.38–0.90
.016
WhenIam
paying
attentionto
soun
dspro-
ducedby
electron
icdevicesin
thecarIfin
ddrivingmoredifficult
Increase
with
HHIE
-Sscore*
1.03
1.01–1.05
.003
Efficacy
ofhearingaidusein
thecar
Wearin
gmy
hearing
aid(s)
whilst
driving
makes
soun
dsun
comfortab
lyloud
Less
likelyin
thosewho
have
been
aprofessio
nald
river
0.64
0.41–0.99
.044
Ifin
dthat
myhearingaid(s)
dono
tim
prove
myab
ility
todrive
Decreasewith
HHIE
-Sscore*
0.99
0.97–1.00
.050
Ifeel
that
wearin
gmyhearingaid(s)
disorie
n-tatesmewhilst
driving
Decreasewith
annu
almile
age
0.96
0.92–0.99
.013
Hearin
gaid(s)
dono
tallow
fortheeasie
ruse
ofin-car
devices
Decreasewith
thedu
ratio
nof
hearingloss*
0.98
0.96–0.99
.007

CHAPTER 4. QUESTIONNAIRE STUDY 115
Tabl
e4.
10Indepe
ndentvaria
bles
significan
tlyassociated
with
DHLQ
itemsin
the‘in
ability
tohear
soun
d’category
arising
from
thelogistic
ordina
lregressionpe
rformed.Anasteris
k(*)indicatesan
indepe
ndentvaria
blerelatedto
hearing.
DHLQ
item
Trend
Odd
sRatio
95%
CI
p-value
Inability
tohear
soun
d
Working
outthedirectionof
emergencyser-
vicesis
difficult
forme
Decreasewith
age
0.98
0.96–1.00
.038
Increase
with
HHIE
-Sscore*
1.02
1.01–1.04
.002
Being
able
tohear
whenem
ergencyservices
vehicles
arenear
isdifficultforme
Increase
with
AC
thresholdof
best
ear*
1.02
1.01–1.03
.014
Increase
with
HHIE
-Sscore*
1.02
1.00–1.03
.024
Decreasewith
generalh
earin
gaiduse
0.67
0.50–0.90
.007
Iha
veaprob
lem
hearingwha
tpa
ssengers
say
whilst
I’mdrivingmycar
Increase
with
HHIE
-Sscore*
1.02
1.01–1.04
.001
Ifeeltha
tbecau
seof
myhe
aringloss
Iam
some-
times
less
awareof
wha
tisg
oing
onarou
ndme
whenIam
driving
Decreasewith
theleng
thof
hearingaidow
nership*
0.97
0.95–0.99
.011
Increase
with
thehearingloss
duratio
n*1.02
1.01–1.03
.005
Increase
with
HHIE
-Sscore*
1.03
1.01–1.04
.001
Soun
dsfro
mthee
ngineo
fthe
cara
reim
portan
tforsafe
driving
Increase
with
annu
almile
age
1.04
1.02–1.06
<.0
01
Increase
with
HHIE
-Sscore*
1.02
1.00–1.03
.021
Myhe
aringloss
makes
mewo
rryab
outp
arking
myvehiclein
closeproxim
ityto
othe
robstacles
Decreasewith
annu
almile
age
.096
0.93–1.00
.026
Increase
with
HHIE
-Sscore*
1.02
1.00–1.04
.032
Decreasewith
hearingaiduse*
0.71
0.51–0.99
.044
Less
likelyforthosewho
have
been
aprofessio
nald
river
0.54
0.33–0.89
.017
Less
likelyforthosewith
aun
ilateralh
earin
gloss*
0.21
0.08–0.59
.003

116 CHAPTER 4. QUESTIONNAIRE STUDYTa
ble
4.11
Inde
pend
entvaria
bles
signific
antly
associated
with
DHLQ
itemsin
the‘use
ofin-car
techno
logy
’and
‘efficacy
ofhearingaidusein
the
car’
categorie
sarising
from
thelogistic
ordina
lregressionpe
rformed.Anasteris
k(*)indicatesan
indepe
ndentvaria
blerelatedto
hearing.
DHLQ
item
Trend
Odd
sRatio
95%
CI
p-value
Use
ofin-car
techno
logy
Ifin
dit
difficult
tohear
soun
dsprod
uced
byelectron
icdevicesin
thecar
Increase
with
HHIE
-Sscore*
1.04
1.02–1.06
<.001
Ifind
that
talkingon
aha
nds-fre
emob
ileph
one
whilst
Idriveis
very
difficult
becauseof
my
hearingloss
Decreasewith
age
0.95
0.90–1.00
.037
Increase
with
thedu
ratio
nof
hearingloss
1.03
1.01–1.05
.045
Decreasewith
annu
almile
age
0.91
0.86–0.97
.006
Decreasewith
hearingaidusagein
car*
0.57
0.38–0.86
.007
Less
likelyin
thosewho
have
been
professio
nald
river
0.43
0.21–0.89
.024
Ifeeltha
tsomein-car
electron
icde
viceswhich
makeuseof
soun
dareno
taccessible
tome
Increase
with
AC
thresholdof
best
ear*
1.03
1.01–1.05
<.0
01
Decreasewith
hearingaiduse*
0.95
0.49–0.93
.017

CHAPTER 4. QUESTIONNAIRE STUDY 117
It is evident from these data that self-reported hearing impairment (as measured bythe HHIE-S) appears to predict the outcome of more items than hearing sensitivity (asmeasured by Pure Tone Audiometry). Results showed that, 11/23 of the responses toDHLQ items are significantly associated with HHIE-S scores, whereas clinically measuredhearing sensitivity is only associated with outcomes on 3/23 items. Similarly, hearing lossaetiology was not significantly associated with any items, and whether the hearing losswas of a unilateral nature was only significantly associated with 1/23 items.
Other factors outside of hearing loss status were significantly associated with a numberof items on the DHLQ (annual mileage, driving experience, history of being a professionaldriver), although none as frequently as HHIE-S score. None of the measures of hearingloss appear to occur as a significant predictor variable exclusively in any single category ofthe questionnaire; rather they appear to be spread throughout the survey items.
Interestingly, items associated with HHIE-S scores appear to suggest that individualswith a high degree of functional hearing loss experience problems with their driving. Forexample, higher HHIE-S scores are significant predictors of people agreeing that: (1) hearingloss sometimes makes driving more difficult, (2) talking to passengers or listening to in-cardevices makes driving more difficult, (3) deciphering when emergency services vehicles arenear and from which direction they are approaching is difficult, (4) as a result of hearingloss sometimes awareness of surroundings is reduced, (5) following passenger conversationin the vehicle is difficult, (6) parking in close proximity to obstacles is concerning, and(7) sounds produced by electronic devices are difficult to hear. The results also suggestthat hearing aids are a source of rectifying these problems, with higher HHIE-S scoresassociated with an increased feeling that hearing aids improve driving ability.
Indeed, hearing aid use appears to have a positive influence on driving ability. Peoplewho report using their hearing aids more often are less likely to report problems such as:(1) hearing when emergency services vehicles are near, (2) worrying about parking theirvehicle, (3) using a mobile phone hands-free whilst driving, and (4) the accessibility ofin-car devices. The length of hearing aid ownership was also negatively associated withreports of feeling less aware of surroundings; e.g. more experienced hearing aid users wereless likely to report being unaware of their surroundings.
Finally, increasing pure tone thresholds are significantly associated with a number ofdriving outcomes. People with less sensitivity are (1) more likely to agree that hearingloss presents problems for driving, (2) more likely to struggle with hearing the presence ofemergency services vehicles, and (3) feel that in-car systems functioning in the auditorymodality are not accessible to them.

118 CHAPTER 4. QUESTIONNAIRE STUDY
4.5 Discussion
4.5.1 Driver Behaviour Questionnaire
The DBQ was administered in this study to investigate the types of aberrant drivingbehaviour commonly undertaken by those with a hearing loss. A factor analysis performedon the data collected in this study revealed a two factor structure. This contradicts alarge number of past studies which have indicated a three factor structure (Reason et al.,1990; Parker et al., 1995a; Åberg and Rimmö, 1998; Rimmö and Åberg, 1999), or greater(Lawton et al., 1997; Özkan et al., 2006b). Generally the DBQ is able to differentiatebetween (non-serious) lapses of concentration and (more serious) dangerous errors, howeverthis was not the case in the current study. Instead, both of these behaviours loaded onto the same factor, suggesting that a distinction could not be made between them inthis sample. It might, therefore, be construed that hearing impaired individuals cannotdistinguish between driving errors which are not dangerous and those which have moreserious consequences. This may go some way towards explaining why their prevalenceof highway safety code infringements is higher than the normally hearing demographic(Picard et al., 2008), and may also explain the higher road traffic accident rates noted inelderly hearing impaired drivers (Ivers et al., 1999).
Further, self-reported functional hearing loss appeared to be most related to reportsof lapse and error behaviour, whereas it was not highly predictive of violation behaviour.Hearing loss may, therefore, have no bearing on people’s propensity for knowingly commit-ting driving violations, rather unwitting mistakes. Accordingly, the higher rate of drivinginfringements found by Picard et al. (2008) may be a result of errors whilst driving, ratherthan planned deviations from safe driving practice. This highlights the possibility thatthe performance of introspection is not possible with regard to the effect of hearing losson driving, or is perhaps reflective of an apprehension to provide entirely honest answers.Thus, self-reports may not be the most useful manner to measure the effect of hearing losson driving.
Regression analysis on the DBQ revealed that self-reported hearing loss was the bestpredictor of questionnaire outcomes. HHIE-S score was a significant predictor of eight DBQitems, no other independent variables related to hearing impairment were associated withDBQ outcomes. This suggests that objectively measured hearing sensitivity is not highlyrelated to changes in driving behaviour, rather it is the day-to-day difficulty experiencedas a result of a loss of hearing sensitivity. This questions the influence of a loss of hearingsensitivity alone as the issue for driving, and suggests that other factors which coexist maybe (at least in part) responsible for difficulties experienced with driving.
One of the driving behaviours predicted by self-reported hearing loss partly conflictswith past research: those with increased self-reported hearing loss were more likely toreport knowingly running red lights and disregarding speed limits early in the morning orlate at night. Picard et al. (2008) noted a higher prevalence of general traffic violations in

CHAPTER 4. QUESTIONNAIRE STUDY 119
their hearing impaired demographic, but also found a lower prevalence of speeding citations.The discrepancy between the increase in reports of speeding behaviour in the current studyand the decrease in the study of Picard et al. (2008) highlights the possibility that thosewho self-report a hearing loss may simply more readily report other outcomes, such asviolation behaviour on the DBQ.
A different explanation is that hearing impairment exaggerates cognitive workloadwhilst tasks are being undertaken concurrently with driving (Hickson et al., 2010; Thorslundet al., 2013b).The majority of the other behaviours that HHIE-S scores predicted wererelated to errors whilst driving: missing pedestrians on turning left, nearly hitting cars infront whilst queuing, switching on the wrong vehicle instrumentation, having no recollectionalong the road of travel, getting in to the wrong lane at a junction, and driving away fromtraffic lights in too high a gear. Thus, errors whilst driving may be more prevalent in thosewith a hearing loss. The fact that functional hearing status and not hearing sensitivitypredicted these reports of errors is of interest. It suggests that it is not the peripheraldistortion to sound brought about by hearing loss which is responsible for driving difficulty,rather it is the higher order processes associated with successful listening that are havingan impact; hence the link with HHIE-S scores.
There was very little difference in reported driving behaviour between the hearingimpaired sample in this study and the normally hearing sample in the study of Parker et al.(2000). However, one main area where this sample appeared to differ was a lower frequencyof reported speeding behaviour. However, this finding contradicts the trend that increasingHHIE-S scores were associated with a greater likelihood of reports on disregarding speedlimits; reiterating the possibility that those self-reporting a hearing loss are simply morelikely to self-report other types of behaviour.
It is unclear why the hearing impaired demographic should be more prone to drivingslower than those with normal hearing. It has already been discussed in Chapter 2 ofthis thesis that, if anything, driving speeds may be faster in this demographic due to thechanged auditory feedback they receive from the vehicle and surrounding environment.However, one potential suggestion is that, because of a perceived lower situation awareness(Walker et al., 2008), people with a hearing impairment navigate the driving environmentmore carefully, and a reduced driving speed is one facet of this alteration in behaviour(Thorslund et al., 2013a,b). Caution should, however, be exercised when analysing thisparticular result. There has been an improvement in compliance with speed limits in recentyears (McKenna, 2007), and behaviour change of this type has the capacity to confoundanalyses made between the current study and that of Parker et al. (2000), given that theywere performed 12 years apart. This change in speeding behaviour over time may be areason why a lower propensity to speed was found in this study; simply because behaviourhas changed over time, and the hearing impaired sample’s self-reports of speeding behaviourwere taken at a much later stage than their normally hearing counterparts’.
The majority of DBQ items (18/24) had a lower mean score than was recorded from

120 CHAPTER 4. QUESTIONNAIRE STUDY
a similarly-aged sample in the study of Parker et al. (2000), meaning that the hearingimpaired sample in this study reported performing the DBQ behaviours less often. Thismay suggest a tendency for hearing impaired people to be more cautious in terms of theirdriving behaviour than their normally hearing counterparts. Despite this, the reportedtrends of DBQ behaviours are in line with those of Parker et al. (2000), in that they exhibita lower frequency of violation and error behaviours than younger samples (Parker et al.,1995a,b). Lapse in concentration behaviour is generally the most frequently reported inthis sample, which is typical of the age range being studied (Parker et al., 2000).
It is curious that violation items were not reported differently to the sample in Parkeret al.’s (2000) study. This might have been expected, given the finding that people witha hearing loss are at a greater risk of receiving driving citations for highway safety codeinfringements not related to speeding (Picard et al., 2008), or the suggestion that hearingimpaired individuals adopt a more cautious driving style (Thorslund et al., 2013a,b, 2014).The results here, therefore, highlight the need for further research in this regard, or showthat people with a hearing loss unintentionally commit highway safety code infringementsmore often than their hearing counterparts. Picard et al.’s (2008) data should, however, beconsidered carefully, given that their sample was collected from a very specific demographicgroup, likely to exhibit a high prevalence of noise-induced hearing loss, in contrast to thepredominantly age-related hearing loss sample in this study.
4.5.2 Driving and Hearing Loss Questionnaire
One purpose of this study was to gain an insight on whether hearing impaired individualsthemselves notice any problems associated with driving as a result of their hearing loss. Tothis end, a questionnaire (the DHLQ) tailored to investigate this theme was administeredalong with the other three sections of the questionnaire. Results from the DHLQ generallysuggest that people do not see hearing impairment as having a disproportionate effect ontheir own driving ability, with the majority of respondents disagreeing that hearing lossmakes driving more difficult, and even more disagreeing that they had considered limitingtheir driving as a result of hearing impairment. Furthermore, although all participants inthis study were still drivers, data regarding increasing or decreasing driving over a threeyear window prior to questioning was not significantly associated with any measures ofhearing function.
This outcome was not expected, given past research which has suggested people witha hearing impairment are more likely to have ceased driving earlier than their hearingcounterparts (Gilhotra et al., 2001). This study suggests that individuals are not consciouslylimiting their driving as a direct result of hearing loss, or that it is not the difficultiesassociated with hearing loss alone that are causing people to relinquish driving; ratherother co-existing factors may contribute to these findings. A feasible example wouldbe the influence of age, which is positively correlated with hearing loss severity (Davis,1995). Indeed, age was a significant explanatory factor in both of the studies exhibiting

CHAPTER 4. QUESTIONNAIRE STUDY 121
a greater risk of driving cessation in the hearing impaired demographic (Gilhotra et al.,2001; Thorslund et al., 2013a).
Despite a low number of respondents reporting on problems associated with hearing lossfor their individual driving, a greater proportion of the sample were open to the suggestionthat hearing loss might present problems for driving more generally. It is of little surprisethat individuals are less accepting of problems with their own driving, given that it isa common occurrence for people to exaggerate their own driving ability in self-reporteddriving literature (see e.g. Farrand and McKenna, 2001; Horswill et al., 2004). Furthermore,it is suggested that mental models used for driving are implicit and are thus inaccessibleby introspection (Underwood et al., 2002). This may be extendible to the effect of hearingloss on those models, in that hearing impaired individuals cannot identify hearing loss ashaving an affect on their driving. This is an important consideration for continuing workin this area, as it casts doubt over the use of self-reported methodologies on this theme ofstudy.
There is not an entirely clear picture which emerges from these data in terms of the mostprevalently reported aspects of driving which are affected by hearing loss. The greatestproblem reported by this sample is hearing passenger conversation. This is of little surprisegiven that speech is one of the most problematic auditory signals to understand for peoplewith a sensory hearing loss, particularly in adverse listening conditions (Moore, 2007).However, it is uncertain from this data whether it is only hearing loss which is affectingthe ability to hear conversation; there is no data from normally hearing people againstwhich reports can be compared, and anecdotally it is thought that speech listening in thecar may also be problematic for people with normal hearing. Furthermore, the majorityof respondents did not report any difficulty in concentrating on driving whilst conversingwith passengers.
It has been discussed in Chapter 3 that an increased difficulty in speech listening whilstdriving will have a disproportionately negative affect on aspects of driving performance.However, whilst the current study has identified that speech listening for those with hearingimpairment may be difficult, there is little evidence that this makes driving any morechallenging for hearing impaired individuals. Suggestions that hearing impaired individualsshould limit auditory engagement whilst driving (Hickson et al., 2010) have arisen fromthe negative effect that auditory based tasks can have whilst driving (see Chapter 2).Therefore, the apparent discrepancy with regard to the distracting nature of passengerconversation identified in this study would benefit from further work.
Compared to passenger conversation, there are fewer reports of an inability to hearsound information from in-car systems. Given the overarching hypothesis presented inthis thesis that listening effort is related to driving decrements, this finding suggests alesser likelihood that in-car systems will have a distracting effect on driving. Although notsuggested by this data, a potential reason may be the ability to withdraw more easily fromusing the systems, or the easier manipulation of the level of sounds. These are options

122 CHAPTER 4. QUESTIONNAIRE STUDY
which are not so credible in terms of passenger conversation (Merat and Jamson, 2005).
Access to auditory information in the driving domain does not appear to be greatlyaffected by hearing impairment. The majority of respondents agree that sounds from theenvironment and engine of the car are important for safe driving, suggesting that theybelieve drivers should be able to access these sounds; but do not report any disproportionateproblems with hearing sounds associated with travelling speed, parking cars, the presenceof emergency services vehicles, the direction of approach of these vehicles, or generalawareness sound-based of the driving environment. This finding appears to contradict theviews of a number of authors who have cited an inability to hear auditory information as areason for a higher accident risk in the hearing impaired demographic (Ivers et al., 1999;Picard et al., 2008).
The data suggest that there is a positive reaction to the efficacy of hearing aids whilstdriving. Indeed, there is a significant increase in hearing aid use whilst driving comparedto general day-to-day use, and the majority of respondents disagreed with statementsregarding the redundancy of hearing aids in the car. The only split in opinion regarding thistopic was that people were unsure whether hearing aids improved driving ability generally.This may have been because the majority of respondents did not foresee a problem fordriving as a result of hearing impairment, and thus there could be no improvement bywearing hearing aids.
During the development of this questionnaire, there was a consensus amongst clinicalprofessionals that hearing aids may be viewed in a negative light in terms of their efficacywhilst driving. This arose mainly from the fact that uptake of and adherence to hearing aidsis notoriously low (Cox, 2005; Laplante-Lévesque et al., 2010), and that people generallydo not derive benefit from hearing aids in acoustically adverse conditions (Kochkin, 1992),unless certain settings (such as directional microphones/noise cancellation) are activated(Bronkhorst, 2000; Cord et al., 2002). It is encouraging, therefore, that hearing aidshave received a positive review in this study, and this finding provides evidence thatrehabilitative interventions such as hearing aids have the capacity to improve listening,even in acoustically problematic situations. However, it should be noted that the sample inthis study may be disproportionately positive with regard to their opinions about hearingaids generally, because hearing aid ownership and use figures in this sample were a lothigher than expected in the general population. This is likely explained by the recruitmentprocedure used; seeking participants who are attending NHS services allied to hearing aidprovision. Nevertheless, 75% of participants reported owning at least one hearing aid, andof these only 4% reported not using their hearing aids. This is in contrast to researchwhich has shown only around 25% of adults who could benefit from hearing aids own them(Jenstad and Moon, 2011), and, in those that do, only less than half use them (Knudsenet al., 2010). Furthermore, the issue of acclimatisation to newly fitted hearing aids, whichcan disproportionately affect derived benefit from hearing instruments (Gatehouse, 1993;Willott, 1996; Cox et al., 1996; Mueller and Powers, 2001), will be practically nullified as
CHAPTER 4. QUESTIONNAIRE STUDY 123
the majority of the sample were experienced hearing aid users. For these reasons, opinionsregarding the usefulness of hearing aids whilst driving in this study should be consideredcarefully, and future research should also investigate the opinions of hearing impairedindividuals who are new to hearing aids, or are not seeking rehabilitative help for theirhearing loss.
As for DBQ data, the hearing-related measure most associated with DHLQ items wasself-reported hearing status (HHIE-S score), whereas clinically measured sensitivity wasless predictive. Past research in the area of hearing loss and driving has hypothesisedthat it is the distortion to sound brought about by peripheral hearing loss which causesa downstream disruption in driving performance (Hickson et al., 2010). The fact thatclinical audiometric test results (which simply measure hearing sensitivity) were not highlypredictive of outcomes in this study questions this assertion, and suggests that it is not thequality of sound alone which is disrupting driving performance. Instead, it is suggestedthat outcomes are more reliant on functional hearing loss; an amalgamation of numerousfactors (of which sensitivity is just one) which govern ease of listening (Wingfield et al.,2005; Rönnberg et al., 2008). One such factor is the cognitive ability of the individualwith hearing loss (Martin and Jerger, 2005). It is the summative effect of these factorswhich the HHIE-S measures, thus it must take in to account the effect of cognitive skills. Itfollows, therefore, that the HHIE-S has been shown to be the best predictor of the amountof difficulty people will experience in driving; a specifically cognitively demanding task(Groeger, 2000).
4.5.3 Study direction and limitations
Applying the DBQ in this demographic has been successful in highlighting driving be-haviours in hearing impaired individuals. However, some of the intricacies of drivingbehaviour reports may have been lost by the use of a shortened version of the DBQ.The original survey is a 50-item questionnaire, whereas in this study a shortened 24-itemversion was chosen to mirror that used by Parker et al. (2000). Although this approachmanaged to capture a similarly aged demographic group, the use of a shortened version ofthe questionnaire in both studies might have limited the specificity of the research tool.In addition, the study of Parker et al. (2000) did not collect any data regarding hearingimpairment, and as such it is impossible to know whether hearing loss was prevalent intheir sample. Thus, caution must be observed when contrasting the results of the currentstudy against that of Parker et al. (2000).
It should be noted that the sample in this study was drawn from clinical settings wherethe majority of people would be seeking rehabilitative help for their hearing impairment,leading to recruitment bias. This may predispose them to report more difficulty with theirhearing loss, as they are presumably more troubled by the effects of auditory impairmentthan those who have not sought such rehabilitative help. Thus, the reports of drivingdifficulties in this study may be somewhat greater than are experienced by the wider

124 CHAPTER 4. QUESTIONNAIRE STUDY
hearing impaired population. It would be of interest in future work to establish whatthe opinions of people with hearing loss who have not sought rehabilitative help are, asthis group of individuals potentially makes up a large proportion of the hearing impaireddemographic in wider society (Laplante-Lévesque et al., 2010).
The possibility that those more readily self-reporting problems with their hearing mightself-report other behaviours more easily should be considered. Questionnaires can besubject to socially desirable responses (Nederhof, 1985; Paulhus, 1991). Tools such asthose used in the current study are reliant on respondents honesty and ability to giveaccurate, reliable answers to questionnaire items regarding their driving (Lajunen andSummala, 2003). Indeed, self-reports of driving ability can be subject to self-deception(a positively biased, but subjectively honest self description; Lindeman and Verkasalo,1995) which leads to over-trust in one’s own driving skills (Lajunen et al., 1997). Inthis study, the manner in which the questionnaire was administered adhered to somepast suggestions of how accuracy of self-reports of driving behaviour could be maximised:responses were anonymous, instructions stressed the importance of honest answers, and thesurvey was carried out in settings where the respondent could not be ‘singled out’ (Lajunenand Summala, 2003). Despite these steps being taken, there is still some concern thatself-deception may have influenced the responses given by participants to a certain extent.As such, in order to compound the trends noted in this study it would be beneficial toapply more objective research aimed at establishing the driving behaviour of people withhearing loss. Answers may also have been influenced by respondents’ understanding of thestudy’s purpose; they may have thought its motivation was to argue for punitive measuresfor licensing hearing impaired drivers
Despite these limitations, this study has brought to light a distinction which may beof great importance for this line of research; hearing impairment does not appear to bethe most important factor for predicting the effect which hearing loss will have on drivingperformance. This provides an alternative consideration to previous research suggestingthat the severity of hearing sensitivity loss is correlated with negative driving outcomes(Picard et al., 2008; Hickson et al., 2010). Rather it advocates higher-order listeningabilities (the manner in which somebody copes with their hearing loss) as being particularlyresponsible for a disturbance on tasks relevant to driving. This is apparent through thepredictive power of HHIE-S scores for increased reports of driving problems. HHIE-S scoresare reliant on a number of factors which reflect an individual’s ability to cope with theirsensory impairment. A simple measure of auditory sensitivity does not capture this samerichness of information, and provides only a limited view of the amount of damage anindividual’s auditory system has sustained.
A factor which is thought to be measured by self-reports of hearing loss is cognitiveability (Martin and Jerger, 2005). Experimental evidence suggests that cognitive factorsbecome progressively more important under difficult listening conditions (Foo et al., 2007;Humes, 2007; Lunner and Sundewall-Thorén, 2007; Baldwin and Ash, 2011), and so those

CHAPTER 4. QUESTIONNAIRE STUDY 125
who have greater cognitive abilities will be more apt at counteracting the negative effectsof their hearing impairment. This is a possible reason why some people exhibiting identicalclinical test results can sometimes have very different perceptual consequences as a resultof their impairment (Stephens and Zhao, 1996).
Accordingly, one person might have a more severe hearing loss than another accordingto audiometric test results, but self-report less problem because they are better equippedto deal with this loss of auditory sensitivity. It is this distinction which is considered to beexhibited in the current study by the greater predictive power of HHIE-S scores comparedto audiometric thresholds. In this vein, it might be that other ecologically valid measuresof hearing ability (e.g. a speech-in-noise test; Killion et al., 2004) show more of an abilityto predict driving difficulties than audiometric thresholds, as they are also likely to bemore reliant on higher-order listening abilities (Akeroyd, 2008).
This is not to say that peripheral auditory function has no influence on processesimportant for driving performance, but that other factors which co-exist with hearing lossmay have a synergystic bearing. Thus it appears that the relationship between audibilityand its effect on driving performance is highly complex and relies on inextricably linkedfactors. In the remainder of the studies described in this thesis, measures of hearingsensitivity and their relationship with driving performance were studied, regardless of thepredictive power of self-reported hearing impairment found in the current study. This wasbecause the main aim of this programme of research was to assess the impact of peripheralhearing loss on driving performance and related tasks. The use of other measures ofhearing loss may have introduced extraneous factors (such as cognitive abilities) whichcould have confounded investigations about the effect of peripheral hearing loss on drivingperformance.
Nevertheless, the finding related to self-reported hearing loss being a good predictor ofdriving problems in the current study contributes important knowledge to the topic of theeffect of hearing loss on driving as a whole. Lending to the design and execution of thisstudy, it is considered that the sample accurately reflects the wider population of hearingimpaired individuals, and thus it was considered that reliable and generalisable data hadbeen collected.
4.6 Conclusions
This study was successful in terms of understanding the extent to which people with ahearing loss believe that hearing impairment presents problems for driving. It establisheda number of areas in which hearing loss appears most problematic for driving-related skills,and these were, to an extent, in agreement with past research. The study has served topresent a complex picture of the manner in which hearing loss may affect driving in termsof its synergistic effect with co-existent factors. This is suggested as a result of the findingthat it is self-reported hearing loss and not objectively measured impairment which is the

126 CHAPTER 4. QUESTIONNAIRE STUDY
best predictor of experienced driving problems. Functional hearing loss is more reliant onother factors (e.g. cognitive capabilities) than hearing sensitivity, and as such it might besuggested that these may have a bearing on outcomes alongside hearing sensitivity. In thepast it has been hypothesised that the distortion to sound brought about by hearing lossis responsible for changes in driving performance, this study has suggested that it maywell be other factors which are (at least in part) responsible. This calls in to question theresults of previous work suggesting that it is hearing loss alone which has a negative effecton driving performance.
Future work as part of this thesis will be aimed at investigating the effect of hearing lossin a more objective, experimentally controlled fashion, given that this study relies heavilyon self-reports of driving behaviour. The commonly held view that hearing loss causes noproblems for driving, uncovered in this study, is in contrast to past experimental findingswhich have shown an apparent effect of hearing loss on driving. Thus it is considered thatintrospection in order to establish these problems may not be possible, or that participantsare inclined to give socially desirable responses, or ones which present no licensing issues forthe hearing impaired demographic. The study described in the next chapter begins to tryand investigate the effect of hearing loss on driving-related skills in a more experimentallycontrolled fashion. The effect of auditory distraction on a measure of visual attention,which has been linked to driving performance outcomes, was compared between a normallyhearing and hearing impaired group.
4.7 Acknowledgements
The support of the National Institute for Health Research, through the ComprehensiveClinical Research Network is acknowledged. I would also like to thank all NHS departmentswho helped with the data collection for this study.

Chapter 5
The Effect of Hearing Impairmenton the Useful Field of View TestPerformed Concurrently with anAuditory Task
5.1 Introduction
This chapter reports on a laboratory-based experiment which investigated the difference inperformance on a visual task, between normally-hearing and hearing-impaired individuals.This more objective methodological approach was taken given the findings that arose inChapter 4, that self-reported data may be subject to limitations in terms of introspectionand socially desirable responses.
Chapter 4 identified specific problems for driving reported by those with hearingproblems: (1) problems detecting the presence of emergency service vehicles, (2) a reductionin general awareness whilst driving, and (3) the performance of simultaneous tasks whilstdriving. The former two are related primarily to the audibility of sound, whereas the latterarises as a result of sound which is audible, but distorted. It is the effect of cognitivedistraction that distorted sound brings about that is of interest in this thesis, primarilydue to the findings of Hickson et al. (2010), that moderate-severe hearing impairmentdegrades hearing impaired individuals’ ability to recognise road signs whilst driving andconcurrently performing an auditory task.
A lack of audibility has been discussed as an overly simplistic view of hearing loss. Lossof hearing sensitivity might well be a problem (e.g. for the perception of emergency servicesvehicles), but can potentially be rectified through the use of hearing aids. Furthermore, itis easily predicted that if somebody has a loss of sensitivity they will obviously requiresounds (such as sirens) to be louder before they are heard, as has been shown, for example,by Slawinski and MacNeil (2002). The effect of sound which is audible is less predictable,
127

128 CHAPTER 5. USEFUL FIELD OF VIEW STUDY
requiring more extensive investigation. Thus, the current study was concerned with theinvestigation of auditory distraction on a measure of visual attention which has been linkedto driving-relevant skills in past work; the Useful Field of View test. This is a test which isbased on a construct called the ‘functional visual field’ or ‘visual span’, as outlined below.
5.1.1 The functional visual field
Hickson et al. (2010) explain their finding of a reduction in road sign recognition underconditions of auditory task engagement by linking it to evidence which has shown a reducedor restricted ‘useful field of view’ under auditory task conditions. The useful field of viewis a construct originally named the ‘functional visual field’ by Sanders (1970) and can bedefined as “the visual field area over which information can be acquired in a brief glancewithout eye or head movements” (Edwards et al., 2006, p.275). The importance of thisconstruct for safe driving is apparent from Figure 5.1, which presents what a reduction inthe useful field of view might resemble for drivers.
Hickson et al. (2010) hypothesised that the functional visual field is reduced to a greaterextent in those with a hearing impairment, under conditions of auditory distraction. Thisis thought to be because the cognitive requirements for successful listening are greater inthose with a hearing loss (see Chapter 3).
Figure 5.1 A depiction of what a reduction in the functional visual field might resemble.This may lead to the driver being unaware of salient information (e.g. the pedestrianscrossing from the right hand side in this scene).
A computerised assessment of the useful field of view (UFOV) (Sekuler and Ball, 1986;Ball and Owsley, 1991; Ball et al., 1993), tests the efficiency with which visual informationin the functional visual field can be accurately processed. The aim of the study reported inthis chapter was to establish whether UFOV performance in hearing impaired individualswas disproportionately affected by auditory distraction in comparison to normally hearingindividuals. Accordingly, the foundations of UFOV, its format, what it predicts and how itis affected by auditory distraction are discussed below.

CHAPTER 5. USEFUL FIELD OF VIEW STUDY 129
5.1.2 The rationale for UFOV
In past driver safety literature a counter-intuitive trend has been noted suggesting thatvisual deficits are not correlated with vehicle crashes (Owsley et al., 1991; Gresset andMeyer, 1994; Marottoli et al., 1994; McCloskey et al., 1994; Johansson et al., 1996; Iverset al., 1999), or only show a weak correlation (Hofstetter, 1976; Davison, 1985; Humphries,1987; Ball et al., 1993; Marottoli et al., 1998). Ball et al. (1993) argue that this mayhave arisen as this research predominantly assessed sensory ability (e.g. measures ofstatic visual acuity) and neglected higher-order perceptual and cognitive components (e.g.visual processing speed, attentional resources, the ability to ignore distracting information).Accordingly UFOV was developed to take these factors in to account (Edwards et al.,2005, 2006). It was originally administered using a dedicated computer system, but hasnow evolved to include touch-screen and mouse-based versions, both of which can beadministered on a personal computer (Edwards et al., 2005). The test format of UFOV isdescribed below.
5.1.2.1 A description of UFOV
The UFOV assessment involves identifying the location and appearance of a set of visualstimuli. It incorporates a number of single trials which all follow the same format (shownin Figure 5.2). Each stage of the trial is as follows:
1. The trial begins with a black screen containing a central white square on whichparticipants are asked to fixate.
2. A certain set of stimuli (governed by the subtest type) will then briefly flash up onthe screen, and will then disappear.
3. These stimuli are replaced by a ‘random noise mask’. The function of this maskingscreen is to eliminate the visibility of brief stimuli after their presentation (Breitmeyerand Ogmen, 2006).
4. Participants are then asked about the appearance of the stimulus in the centre square(the ‘central target’), which is either a car or a truck (the distinction between thesetwo stimuli can be seen in Figure 5.3).
5. Upon providing a response to the central target, participants are asked about thelocation of the ‘peripheral target’, which is always a car. The peripheral target occursat one of eight locations outside the centre square; in place of the outermost trianglelocated at angles of 0◦, 45◦, 90◦, 135◦, 180◦, 225◦, 270◦, and 315◦ from the centrepoint.
Task difficulty is altered by changing the length of time that the stimuli are presented onthe screen. If a participant provides a correct response to both questions, the presentation

130 CHAPTER 5. USEFUL FIELD OF VIEW STUDY
Figure 5.2 The progression of a single UFOV trial.
epoch is shortened, whereas an incorrect response to either question results in a lengtheningof the presentation epoch. Thus the participant must be attentive to both foveal andperipheral stimuli. The presentation period ranges between 17-500 ms, and the times arealtered using a double staircase method1 until a level is reached at which a participantis repeatably obtaining a score of 75% on all trials. This threshold presentation time isthen recorded as the participant score, so scores range between 17-500, with higher scoresreflecting poorer performance.
The exact visual stimuli presented are manipulated resulting in three subtests whichassess: (1) processing speed, (2) divided attention, and (3) selective attention (Ball et al.,1993; Myers et al., 2000). The presentation paradigms of these subtests are describedbelow, and examples of these stimuli are shown in Figure 5.3.
1. Processing speed: only the central target is presented in each trial. The participantsimply needs to indicate whether he/she saw a picture of a car or truck in the centresquare.
2. Divided attention: both the central target and peripheral target are flashed upsimultaneously. The participant has to report whether the central target was a car
1A single staircase involves presenting the stimulus at a suprathreshold epoch, and then reducing it until anincorrect response is given, at which point the epoch will be increased again. This process will be repeateduntil a set criterion is reached; in this case the participant is reliably obtaining a score of 75% on all trials.The double staircase adaptation of this incorporates two such series, the trials of which are randomlyinterspersed with each other (see e.g. Cornsweet, 1962; Nachmias and Steinman, 1965).

CHAPTER 5. USEFUL FIELD OF VIEW STUDY 131
or truck, and the location of the car flashed up in their peripheral vision.
3. Selective attention: this task is the same as the divided attention task, but thistime a visual distracter array of forty-seven triangles is flashed up simultaneouslywith the stimuli. The participant is required to ignore the distracters and, again,report whether the central target was a car or truck, and the location of peripheraltarget.
Figure 5.3 Examples of the three UFOV subtests. The difference between stimuli formscan be seen: a truck is being presented centrally with a car in the periphery.
5.1.2.2 What does UFOV measure?
Studies suggest that UFOV is likely to reflect attentional and cognitive abilities, ratherthan relying solely on visual sensory function (Owsley, 1994; McDowd and Shaw, 2000).Indeed, although UFOV incorporates stimuli at peripheral visual locations, Sekuler et al.(2000) argue that poor performance on UFOV should be conceptualised not as reflecting ashrinking of the visual field, but as a diminished efficiency in extracting visual informationfrom cluttered scenes. In this regard, Ball et al. (2007) argue that UFOV is essentially ameasure of speed of processing difficulties.
Abilities measured by UFOV are thought to reflect those which are relevant to driving.For example, driving requires the simultaneous use of central and peripheral vision, andrequires the detection of salient stimuli which occur at uncertain times in the visual field(Ball et al., 1993). UFOV has, therefore, been employed in studies investigating the drivingability of older adults, who may exhibit changes in higher-order perceptual and cognitivecomponents of vision (Ball et al., 1988; Owsley et al., 1991; Goode et al., 1998). Studieshave shown that UFOV performance is predictive of both prospective and retrospectivevehicle crashes (Ball et al., 1993; Owsley, 1994; Owsley et al., 1998; Clay et al., 2005; Ballet al., 2006), and driving performance during field-trials (Myers et al., 2000; Wood, 2002).
Indeed, Clay et al. (2005) performed a meta-analysis of eight studies which hadinvestigated the ability of UFOV to predict a number of different driving outcomes. Theirstudy included work which had employed either driving records, on-road driving, or driving

132 CHAPTER 5. USEFUL FIELD OF VIEW STUDY
simulator studies as their measure of driving performance. They argue that poorer UFOVtest performance is associated with poorer driving performance. They also point out thatUFOV appears to be a particularly robust measure, as the same outcome is preservedregardless of driving measure, or the laboratory in which it is being administered.
These results advocate UFOV as a powerful index of on-road driving performance, andas such some authors have suggested it as a suitable tool for assessing driver suitability inlicensing settings (Myers et al., 2000). However, some criticisms of UFOV have arisen, andthese should be considered when using this test. Firstly, the test has been extensively usedin the elderly demographic, but little research has been carried out with younger subjects.As such it is unknown how UFOV performance interacts with driving performance in theyounger demographic. This is not of great concern for the current line of study, given thatolder adults have been identified as the demographic of interest (see Chapter 4), in linewith the link between hearing loss and age (Davis, 1995). Furthermore, a number of studieshave documented a ceiling effect on the processing speed and divided attention subtests ofUFOV (see e.g. Richards et al., 2006; Bentley et al., 2012; McManus et al., 2015). Thisis also not of concern for the current study; a worsening of performance is predicted as aresult of auditory task engagement - a ceiling effect will not hide a trend in this direction.Additionally, no such ceiling effect is apparent for the divided attention subtest, and soresults on this portion of UFOV should still be indicative of the hypothesised trend. Thetest uses two separate two-choice forced response paradigms, therefore participants havea 25% chance of giving a correct answer, even in cases where they randomly guess. Thedouble-staircase method of presentation nullifies this problem, as evidenced by the hightest-retest reliability of UFOV which has been exhibited in past work (Edwards et al.,2005).
The study reported here was concerned with how auditory distraction affects UFOVperformance in normally hearing and hearing impaired individuals. Accordingly, the nextsection provides an overview of work which has assessed the effect of auditory distractionon UFOV performance.
5.1.2.3 The effect of concurrent auditory tasks on the useful field of view
Driving requires the performance of multiple simultaneous tasks (Clay et al., 2005), andthis sometimes incorporates the performance of concurrent auditory tasks in the drivingdomain. There is evidence suggesting that during periods of auditory distraction, theefficiency with which visual information in the functional visual field can be processed isreduced.
For example, Wood et al. (2006) presented young normally-hearing participants with atask aimed at measuring the useful field of view, very similar to UFOV. This task, however,had a fixed presentation period of 90 ms, rather than varying this parameter depending onresponse. Furthermore, the eccentricity of the peripheral target could be altered such thatperipheral targets were presented at visual angles of 10 ◦, 20◦, and 30◦. As the presentation

CHAPTER 5. USEFUL FIELD OF VIEW STUDY 133
period was fixed, the outcome measure was the number of errors made. Wood et al. (2006)only incorporated two visual conditions in their study, which resembled the UFOV subtestsof divided attention and selective attention. They asked their participants to completethese subtests under three auditory task conditions: (1) with no auditory task, (2) listeningto a concurrent auditory task, and (3) responding to a concurrent auditory task.
The results showed that, during visually complex subtests (incorporating an array ofvisual distracters), when participants were required to respond to the concurrent auditorytask, they made significantly more central errors than when they either had to listen tothe auditory task alone, or when there was no auditory task present. Additionally, therewas an increase in the number of errors made at far peripheral locations as a result ofresponding to the auditory task rather than just listening to it (see Figure 5.4). Therefore,it appeared that the type of auditory task affected the magnitude of effect on concurrentvisual tasks. Wood et al. (2006) draw attention to the implications of their results in thedriving domain, and the finding that listening did not affect visual task performance is inaccord with previous research showing that passive listening is likely to have little effecton driving performance (Strayer et al., 2003), whereas more cognitively demanding taskswhich require some sort of response formation do (Brown et al., 1969).
Figure 5.4 Results from the study of Wood et al. (2006). The mean number of errors (±standard error where applicable) made on the central and peripheral tasks as a functionof auditory and visual conditions. N.B. visual distracters refers to the array of trianglespresented in the visual field.
Results from studies investigating the effect of auditory distraction on visual attentionin laboratory settings also support the findings of Wood et al. (2006). For example, a studyby Pomplun et al. (2001) concludes that auditory distraction degrades visual search, andthat if the difficulty of the auditory task is increased (i.e. more listening effort is required),visual tasks suffer further decreases in performance. The authors used the aCMT task inwhich participants listened for the occurrence of targets in a list of numbers. The difficultyof this task was raised by increasing the number of targets which had to be held in memory.Other studies investigating the effect of auditory task engagement on the functional visualfield have produced similar results, which have then been extrapolated to the driving

134 CHAPTER 5. USEFUL FIELD OF VIEW STUDY
domain (Atchley and Dressel, 2004).Based on these results, it was hypothesised that hearing impairment would exacerbate
the performance decrements on UFOV during concurrent auditory task engagement, becauseSNHL would increase the difficulty of the listening task for hearing impaired relative tonormally hearing individuals. This notion was the basis for the performance of the currentstudy.
5.1.3 Study aims and hypotheses
The aim of this study was to establish whether hearing loss exacerbated the effect ofauditory distraction on visual attention, over and above the difficulty experienced by thenormally hearing subjects. A number of specific research questions were posed:
1. Is UFOV performance negatively influenced by the simultaneous performance of anauditory task?
2. Is the reduction in UFOV performance as a result of auditory distraction greater inthose with a hearing loss?
3. Does auditory task performance suffer as a result of simultaneous performance withUFOV?
4. Are auditory task performance decrements as a result of simultaneous performancewith UFOV greater in those with a hearing impairment?
It was hypothesised that the performance of hearing impaired and normally hearingparticipants would be comparable under all conditions where there was no simultaneousauditory task present. If auditory processing demands are responsible for disturbancesin visual processing, as noted by Hickson et al. (2010), then it would be expected that aconcurrent auditory task would degrade visual performance to a greater extent in hearingimpaired individuals. This is because extra cognitive processing required to listen to,understand, and perform an auditory task with a SNHL would be required
This trend was hypothesised to occur for both the divided and selective attentionsubtests of UFOV, given that central errors significantly increase as a result of auditorytask engagement when two visual targets are presented in this type of task (Wood et al.,2006). A greater magnitude of task disturbance was expected for the selective attentionsubtest than the divided attention subtest, given that the presence of visual distractersleads to an increase in the number of peripheral errors, particularly in the presence ofa concurrent auditory task (Wood et al., 2006). However, it was difficult to predict theoutcome for the processing speed subtest, because the visual task used by Wood et al.(2006) always included two concurrent stimuli.
Wood et al. (2006) did not record the accuracy rate of auditory responses in theirstudy. However, provided that participants placed equal importance on both tasks (as they

CHAPTER 5. USEFUL FIELD OF VIEW STUDY 135
were instructed to), it was hypothesised that auditory task performance would becomeincreasingly poorer as the difficulty of the visual task increased. In terms of the workingmemory model, this is because the more demanding the visual task, the more mediationrequired from central executive processes for visuospatial sketchpad operations, thusdegrading the efficiency of phonological loop operations. This reduction in performance islikely to be greater in hearing impaired individuals; they require more listening effort thannormally hearing individuals in order to perform auditory operations successfully, and sothe reduction in central executive processes from the phonological loop is likely to have agreater effect on this demographic.
5.2 Method
The experiment reported in this chapter was run as part of a collaborative study performedat the Swedish National Road and Transport Research Institute (VTI) in Linköping,Sweden. The study arose as a result of discussions with colleagues at the 5th InternationalConference on Traffic and Transport Psychology held in Groningen, the Netherlands.As our two forthcoming study protocols required the recruitment of hearing impairedindividuals, a collaborative study was agreed using the same participants to undertake ourtwo separate experimental protocols.
5.2.1 Participants
Thirty-two participants in good general health, and free from eye and ear disease wererecruited to this study from the local community and from a University Hospital audiologydepartment in Linköping, Sweden. Sixteen of these participants were known to have ahearing impairment (identified through routine clinical testing at Linköping UniversityHospital), and the other sixteen were presumed to have normal hearing (as there hadbeen no prior history of ear disease and/or concerns about loss of hearing). Pure toneaudiometry was conducted on each participant in accordance with the British Society ofAudiology guidelines (2011) and participants were split by hearing status into two groups:those with a mild-severe hearing loss, and those with normal hearing, again as defined bythe British Society of Audiology (2011).
As a result of these tests, it transpired that one of the participants recruited for inclusionin the normally hearing group had a mild hearing impairment, and as such was includedin the hearing loss group. Of the hearing impaired participants, three had a congenitalhearing loss, the other fourteen had acquired their hearing impairment. The audiometricattributes of the hearing loss group suggested the majority had developed an age-relatedhearing loss. Fourteen of the group owned bilateral hearing aids, two owned unilateralhearing aids, only one participant with a hearing loss did not own a hearing aid. Of thesixteen participants who owned hearing aids, eleven wore them all of the time, three worethem occasionally, and two did not wear them. Nobody reported differing behaviour with

136 CHAPTER 5. USEFUL FIELD OF VIEW STUDY
regard to hearing aid use whilst driving and during their normal day-to-day routine. Allparticipants held a current valid driver’s licence and wore any optical correction that theynormally wore for driving. Demographic information for each group is given in Table 5.1.
Table 5.1 Summary demographic information for each group in study one.
Experimental group Number ofparticipants Mean age (± S.D.) Level of education
Hearing impaired 17 (8|; 9~) 57.88 (± 12.67) 8 School; 9University
Normal hearing 15 (5|; 10~) 51.20 (± 9.31) 8 School; 7University
5.2.2 Materials
5.2.2.1 Visual task
UFOV test software (version 6.1.1), run on a personal computer, was used in this experiment.Responses were given using a computer mouse, a response method which has been shownto have a high test-retest repeatability (Edwards et al., 2005). All three UFOV subtests(processing speed, divided attention and selective attention) were used in this experiment,and were administered with and without a concurrent auditory task.
Possible visual task scores were in the range 17–500 ms, and were calculated by theUFOV software as the stimulus epoch required to achieve 75% successful performance oftrials. Thus, better subtest performance on UFOV translated as a lower score. The UFOVsoftware derived visual task scores by varying the stimulus presentation duration dependingupon the accuracy of responses, presenting stimuli using a double staircase method. Acorrect response was only recorded when both the peripheral and central visual tasks werecompleted correctly. Subtests ended automatically once the software had a stable estimateof the required stimulus epoch. It should be noted that the processing speed subtest doesnot incorporate a peripheral visual stimulus, as such scores on this subtest are derived fromthe accuracy of responses to the central target only. This ensured that participants werefixating on the point of stimulus presentation, providing an isolated measure of processingspeed.
5.2.2.2 Auditory task
Task selection
The choice of auditory task to be used in this study required consideration, given that therehave been a wealth of such tasks used in past research employing dual-task methodologies(see e.g. Pashler, 1994). Past work has shown that cognitively challenging auditory taskswhich require a participant response have an effect on concurrently performed tasks (Strayer

CHAPTER 5. USEFUL FIELD OF VIEW STUDY 137
and Johnston, 2001; Pomplun et al., 2001; Wood et al., 2006; Hickson et al., 2010). Thusthe task had to require a participant response.
Speech stimuli were considered suitable as they are likely to reflect a number ofdistractions that may occur whilst driving, particularly for people with a hearing loss. Thisis not to say that non-speech stimuli do not occur in the driving environment, quite theopposite. However, speech is one of the most difficult signals for people with SNHL toprocess, particularly in the presence of masking noise (Moore, 2007). Alongside in-carsystems which use non-speech sounds, speech stimuli can also have a negative effect ondriving performance through their distractive nature (see Chapter 2). Accordingly, it isprobable that a speech stimulus would be more distracting than a non-speech stimulus forsomebody with a cochlear hearing loss, and provides a suitable level of face validity for thepurposes of this study.
The task also had to be suitable for employment in the experimental design. As theUFOV software was free-standing, timing the presentation of auditory stimuli so that theyexactly matched the presentation epoch of visual trials was not possible; stimuli thus hadto last long enough to account for this limitation.
Using a longer auditory stimulus, therefore, had the benefit of ensuring that an auditorytask was always present during the presentation of visual stimuli. Using a shorter stimulusmay have led to discrepancies in presentation such that some trials may effectively becometwo single tasks (e.g. a visual task followed by an auditory task), instead of one dual-task(e.g. concurrent visual and auditory tasks). Although a longer auditory task time isdesirable, it is important to note that it should not be too long. The task had to beconcise enough to span a single UFOV presentation, but not so long that it carried on fora disproportionate time following that trial. This may have led to issues in the amount oftime the experiment took, perhaps giving rise to fatigue problems, and would also havepresented issues for participants keeping the location of UFOV stimuli in their WorkingMemory whilst the auditory task finished.
Thus the criteria for a suitable auditory task were:
1. Valid in terms of applicability to the driving environment;
2. Speech-based;
3. In the Swedish language (given that it was the mother-tongue of all participants);
4. Suitable presentation epoch;
5. Requires a participant response.
When selecting a task which satisfied these criteria, previous studies that had usedsimilar experimental paradigms were identified, and the auditory tasks that had beenemployed were scrutinised in terms of their suitability for this experiment. The consideredtasks are described and discussed in Table 5.2.

138 CHAPTER 5. USEFUL FIELD OF VIEW STUDYTa
ble
5.2A
descrip
tionof
auditory
task
type
san
dtheirsuita
bilityin
relatio
nto
thecurrentstud
y.
Task
Description
anddiscussion
SSW
Sing
lespon
deewords
arepresentedsim
ultaneou
slyto
each
ear,
butthepresentatio
nis
staggeredsuch
that
onewordbe
gins
before,a
ndends
soon
erthan
theother.
Woo
det
al.(2006)used
this
task,a
ndit
affectedthepe
rforman
ceof
ayo
ung,
norm
ally
hearingsampleon
atask
analog
ousto
UFO
V.T
hetest
hasade
gree
ofecolog
ical
valid
ity;itis
speech
based,
andis
reminisc
entof
taskswhich
arepe
rformed
inthecar(e.g.listening
topa
ssengers
andtheradiosim
ultaneou
sly).
How
ever,
stim
ulia
refairlyqu
icklyoccurring
(≈60
0m
s).
Dicho
ticsentences
Asentence
ispresentedsim
ultaneou
slyto
each
ear.
Thistask
isvery
simila
rto
theSS
Wan
dis,
thus,likelyto
causea
disturba
nceon
visual
tasksan
alog
ousto
that
used
byWoo
det
al.(
2006
).W
hereas
theSS
Wha
sashortpresentatio
nep
och,
dichotic
senten
cesarelong
er(la
sting
≈3–
4s).Dich
otic
sentencesareconsidered
ecolog
ically
valid
,asthey
arereminisc
entof
thesamein-car
situa
tions
astheSS
W.
Und
erstan
d-ingof
aprose
passage
Inthestud
yof
Gherria
ndEimer
(2011),p
artic
ipan
tslistenedto
aprosepa
ssagewhilst
performingavisual
task.The
authorsaskedpa
rticipan
tsqu
estio
nsab
outthepa
ssag
efollo
wingcompletionof
thevisual
task
trial.
Thisau
ditory
task
type
offersagreatdegree
ofecological
valid
ity,e
.g.listening
toapa
ssenger’s
discou
rsean
drespon
ding
.How
ever,p
rose
passages
used
were21/2
minutes
long
.Fu
rtherm
ore,
itis
difficultto
mon
itortheeff
ortexertedon
theau
ditory
task
atan
ygiven
mom
ent.
Forexam
ple,
pauses
atcertainstages
inthestim
ulus
may
coincide
with
thepresentatio
nof
visual
stim
uli.
Mem
oryspan
tasks
Pomplun
etal.(
2001
)askedpa
rticipan
tsto
mem
orise
four
rand
omdigits
andthen
indicate
whe
nthey
heardon
eplayed
back
durin
gvisual
task
trials.
The
task
affectedvisual
task
performan
cein
thesestud
ies.
Atface
valuethesetestsdo
notap
pear
tooff
erecological
valid
ity,a
lthou
ghthesetype
sof
task
may
reflect
theman
nerin
which
mod
ernin-vehicle
system
sfunctio
n(e.g.mem
orising
/und
erstan
ding
inform
ationpresentedby
in-car
system
ssuch
assatellite
navigatio
n).How
ever,thistask
type
testsworking
mem
orycapa
city
andab
ility,h
ence
may
introd
uceextran
eous
factors(e.g.cogn
itive
skills)
which
may
confou
ndtheresults
.Thisis
particularly
true
giventhat
thedemograph
icbe
ingrecruitedto
this
stud
yis
likelyto
beold,
andage-relatedchan
gesin
working
mem
orycapa
bilitiesarewelld
ocum
ented(e.g.Sa
lthou
se,1
991).
CHAPTER 5. USEFUL FIELD OF VIEW STUDY 139
The suitability of these tasks in terms of the criteria set out is summarised in Table 5.3.The preceding list of tasks is by no means exhaustive. However, it does provide possibilitiesfor consideration. The most suitable tasks for employment in this study appear to becompeting sentences, which is very similar to the Staggered Spondaic Word test (SSW)used in a dual-task study of auditory and visual attention (Wood et al., 2006), or a memoryspan task (Pomplun et al., 2001). However, there is some concern regarding the potentialinfluence that individual cognitive factors might have on the performance of memory spantasks. Given this concern the decision was taken to use dichotic sentences as the auditorytask used in this experiment.
The specific dichotic sentence test used was developed by Hällgren et al. (1998), andconsisted of two five-word, low-redundancy2 sentences, simultaneously played to opposingears. The test materials were recorded in Swedish by a native speaker.
An audiometer, calibrated to the dichotic sentence test, was used to present auditorystimuli through Telephonics TDH-39P headphones; this ensured an accurate presentationintensity of 50 dB HL sensation level. Sensation level refers to the decibel value abovethreshold (in this case at 1 kHz), such that if a participant had an absolute threshold of 20dB HL at 1kHz the value at 50 dB HL sensation level would be 70 dB HL (20 dB HL +50 dB HL = 70 dB HL). Auditory stimuli were presented at a sensation level, rather thanset intensity, so that sounds were played at an audible level for all participants, regardlessof hearing loss status.
As these stimuli were presented through headphones, and because stimuli were presentedat a sensation level, participants were not permitted to wear hearing aids during theexperiment, even if they did so under normal driving conditions. In cases where the extentof hearing loss made this sensation level uncomfortably loud, stimuli were adjusted to anintensity which was deemed comfortable by participants.
A single dichotic sentence trial (two sentences played simultaneously) started just priorto each visual stimulus presentation, ensuring that the sentences were playing throughthe period that the visual stimuli were present. Subjects were required to listen to thesentences in full before repeating back as much of both sentences as they had heard.
A percentage correct score for the auditory task was calculated for each participant,during each subtest, by counting the number of correct words repeated following eachstimulus presentation. As there were five words in each sentence, the maximum score foreach dichotic stimulus was ten. A similar approach to marking this auditory task has beentaken in past research, which asked participants to report the sentence from one ear only(Hällgren et al., 2001). However, the current study asked participants to recall as muchof both sentences as possible. This approach was taken in order to avoid the possibilityof cueing participants towards a certain side of their visual field as a result of directedauditory stimuli (Ho et al., 2006). Accordingly, sentences were analysed such that if a2Redundancy refers to the likelihood of being able to predict the content of a sentence because of itssemantics. In this case (low-redundancy), listeners would not be able to predict the content of a wholesentence based on the successful perception of a fraction of the message.

140 CHAPTER 5. USEFUL FIELD OF VIEW STUDY
Table 5.3 Analysis of whether tasks discussed meet the various criteria set out. A tickindicates a particular task fulfils the respective criterion.
Criterion SSW Dichoticsentences
Understandingof prosepassage
Memoryspan task
Valid in terms ofapplicability to thedriving environment
X X X X
Speech-based X X X X
Suitable presentationepoch × X × X
Requires a participantresponse X X X X
participant only responded with one-sentence, marks were not awarded for words fromboth sentences. Instead marks were only given from the sentence that scored highest. Forexample:
Stimulus: “Elsa borrowed three dark gloves” and “Bosse owned six beautiful rings”Response one: “Bosse owned six beautiful rings” and *no response*. Score given =5/10
Response two: “Bosse borrowed three beautiful rings” and *no response*. Scoregiven = 3/10
Response one scores 5/10, as the participant has repeated only one sentence in itsentirety, but the sentence given is correct. Response two only scores 3/10, as the participanthas only repeated one sentence, and the answer given is a mixture of the two sentences.The three marks given are, therefore, for the participant saying ‘Bosse’, ‘beautiful’ and‘rings’, all three of which are present in the second sentence. Marks are awarded from thisparticular sentence as the responses recorded to the other sentence would have resultedin a lower score of 2/10. This approach was taken in order to reflect the difficulty of thelistening task; it was not considered feasible to give the same mark to somebody repeatinga mixture of the two sentences, and another person successfully ignoring an interferingstimulus, listening to one of the sentences, and repeating it in its entirety.
5.2.2.3 Cognitive testing
A cognitive test battery was employed in order to control for cognitive differences betweenthe two experimental groups. This was considered important given that UFOV is thoughtto rely on higher-order processing abilities (Edwards et al., 2006).

CHAPTER 5. USEFUL FIELD OF VIEW STUDY 141
The Clinical Information Processing System (KIPS) test battery, a developed, abbre-viated version of the cognitive test ‘Text Information Processing System’ (Lyxell et al.,1998), was administered to each participant. KIPS assesses working memory capacity,lexical access speed and phonological skills (Borg et al., 2008), and is administered (inSwedish) on a personal computer, requiring responses using the mouse and keyboard.
KIPS consists of four sections, and lasts approximately twenty minutes in total:
1. Physical matching: participants had to decide whether two letters appearing onthe monitor looked the same or different.
2. Lexical text: participants had to decide whether words that appeared on the screenone at a time were real, or invented.
3. Rhyme: participants had to decide whether two words displayed simultaneously onthe monitor rhymed with each other or not.
4. Reading span: sets of two 3–5 word sentences were displayed on the monitor oneword at a time. Participants had to decide whether or not each sentence made senseor was nonsense. Once this choice had been made, the participant was asked to recalleither the first or the last word in both preceding sentences.
This cognitive test battery was chosen as it offered measures of constructs consideredimportant for UFOV performance. For example, it is thought that the reading span sectionof KIPS is heavily reliant on the central executive portion of working memory (Lobleyet al., 2005). It is this component of the Working Memory model that is hypothesisedto control attention switching and mediated focused and divided attention (Baddeley,2002), skills which are likely to be central to the successful performance of UFOV. Ina similar vein, there is some discussion that rhyme judgements originate from a similarregion of the brain as Working Memory tasks, given that both are affected by articulatorysuppression (Besner, 1987; Gathercole and Baddeley, 1993), and may, therefore, relyon similar physiological systems. Therefore, the rhyme portion of KIPS provided someinsight into whether cognitive deficits were present in any particular participant, as well assupporting results obtained from the reading span subtest.
Central to success on UFOV is the recognition of an icon from two, almost identical,options (see Figure 5.2). The physical matching portion of KIPS provided some insightinto whether individual participants are able to accurately identify, on a computer screen,whether there was a subtle difference between two physical shapes. Thus, any issuesregarding a participant’s inability to physically decipher the difference between the car andtruck presented in UFOV was accurately identified by performance on this aspect of KIPS.
Though the lexical test portion of KIPS was not considered to bear any importance forpredicting success on the UFOV test itself, it was considered important for the predictionof auditory task performance. The auditory task involved the recognition of simultaneoussentences containing words which could not be accurately predicted by the semantic

142 CHAPTER 5. USEFUL FIELD OF VIEW STUDY
content of stimuli. Thus, success on this task was likely to be related to the lexical skills ofparticipants, i.e. their ability to perceive and identify words (Balota and Chumbley, 1984).
At this juncture it is also worth noting that those tasks included in KIPS, which relyon central executive skills (reading span, and perhaps rhyme) not only provide informationregarding potential performance of the visual task, but also the auditory task. It isknown that the performance of spondaic tasks relies heavily on central auditory processes(Katz and Smith, 1991), and so an inability to effectively switch and focus attention (asis measured by the reading span, and potentially rhyme, sections of KIPS) may haveimpacted on the performance of the auditory task also.
The KIPS software measured participant performance (percentage correct) on eachof the cognitive battery subtests. Each individual section of the test battery was markedindividually and thus could be analysed independently.
5.2.3 Procedure
Pure tone audiometry testing and KIPS were both undertaken prior to UFOV performance.Participants’ hearing was assessed using pure tone audiometry according to the BritishSociety of Audiology guidelines (2011). Following the hearing test, participants were askedto perform KIPS on a personal computer with a 17 inch screen. Participant responsesin all subtests were a two-choice forced response task, and answers were given using thekeyboard. In the reading span test, participants also had to recall the first/last word ofthe preceding sentence, this answer was also a two-choice forced response task and wasgiven using the computer mouse.
For UFOV testing, participants were seated 60 cm away from a 17 inch computermonitor. They were instructed on how to perform UFOV with the aid of sample stimuliand were then given a practice as per the test instructions (Visual Awareness Inc., 2003).This consisted of performing four practice trials for each subtest using long presentationepochs; if the correct response rate was lower than 3/4, a further four practice trials werepresented, and so forth. Practice continued until 3/4 trials were correctly performed, oruntil 16 trials had been presented (Visual Awareness Inc., 2003). Participants were all ableto perform the practice task successfully before 16 trials had been presented.
Following training on UFOV as a standalone single task, participants were given theopportunity to practice UFOV simultaneously with the auditory task. Participants wereasked to give equal priority to both the visual and auditory tasks. Practice was carried outin a similar manner to UFOV as a standalone task, and was stopped once 3/4 trials hadbeen successfully completed, or a total of 16 trials had been presented, and responses tothe auditory task were consistent with an understanding of the task. Again, participantswere all able to perform the practice task successfully before 16 trials had been presented.
After the training and practice session, participants went on to complete the three UFOVsubtests described above, both with and without the auditory task presented simultaneously.This resulted in six experimental conditions, which were partially counterbalanced using

CHAPTER 5. USEFUL FIELD OF VIEW STUDY 143
the balanced Latin Square method (Bradley, 1958). This method was chosen in order toremove any potential order effects which may have arisen as a result of all participantscarrying out all of the conditions in a set order. A baseline measure of auditory taskperformance on its own was also taken, whereby participants responded to ten auditorystimuli in the absence of any visual task. Half of each experimental group undertookthis baseline measure before performing the six experimental conditions, the other halfperformed it at the end of the experimental session.
Ethical approval for this study was obtained through the National Health ServiceNational Research Ethics Service Research Ethics Committee (reference: 12/YH/0076).
5.3 Results
Prior to analysis, all data in this experiment was subjected to a Kolmogorov-Smirnov testper group in order to ascertain whether they conformed to a normal distribution. Wherethis was not the case, non-parametric testing was employed to investigate trends in thedata (Field, 2013). At numerous points in the analysis multiple comparisons were made,leading to a potential increase in the familywise error rate (i.e. the probability of making atype I error; Shaffer, 1995). In order to counteract this confound, the Bonferroni Correctionwas applied (Field, 2013).
5.3.1 Visual task
Kolmogorov-Smirnov tests exhibited that the majority of UFOV data was not normallydistributed, and as such the decision to use non-parametric test methods was taken. Themean UFOV test scores for both groups in each individual experimental condition areshown in Figure 5.5.
(a) Processing speed (b) Divided attention (c) Selective attention
Figure 5.5 Mean UFOV scores (± standard error) for the two experimental groups on eachindividual subtest under different auditory task conditions.
UFOV performance decreased as the visual task became more complex (i.e. as morestimuli were included), and through the use of Friedman Tests this decrease in performance

144 CHAPTER 5. USEFUL FIELD OF VIEW STUDY
was shown to be statistically significant both with(χ2 (2) = 47.226,p < .001
)and without(
χ2 (2) = 54.264, p < .001)a simultaneous auditory task. Further post-hoc analysis using
Wilcoxon signed-rank tests and Bonferroni corrections exhibited that there were significantdifferences between all of the UFOV subtest scores (see Table 5.4). Furthermore, theintroduction of a concurrent auditory task had a significantly degrading effect on theperformance of UFOV for the processing speed subtest (z = -3.201, p = .001, r = .57),the divided attention subtest (z = -3.690, p = .000, r = .65), and the selective attentionsubtest (z = -4.937, p < .001, r = .87). Effect sizes (r) for this trend suggest that the morecomplex the visual task, the more degradation from a concurrent auditory task.
Table 5.4 Wilcoxon test results for comparisons between UFOVscores across differentsubtests.
Comparison subtestsNo auditory task Auditory task present
Medians p− value Medians p− value
Processing speedDivided attention
17.00 ms23.00 ms < .001 23.00 ms
82.00 ms < .001
Processing speedSelective attention
17.00 ms146.50 ms < .001 23.00 ms
208.50 ms < .001
Divided attentionSelective attention
23.00 ms146.50 ms < .001 82.00 ms
208.50 ms < .001
The Mann Witney-U test was utilised to test for possible differences between the twoexperimental groups on UFOV, though no significant differences on any of the three UFOVsubtests arose (see Table 5.5).
Table 5.5 Mann-Witney U test results for a comparison between the two experimentalgroups in terms of their UFOVscores.
Subtest Normal hearingmedian
Hearing lossmedian p− value
Processing speed (no auditory task) 17.00 ms 17.00 ms .360Divided attention (no auditory task) 23.00 ms 27.00 ms .178Selective attention (no auditory task) 110.00 ms 157.00 ms .249
Processing speed (auditory task present) 23.00 ms 23.00 ms .812Divided attention (auditory task present) 67.00 ms 97.00 ms .688Selective attention (auditory task present) 197.00 ms 267.00 ms .282
In order to examine whether the inclusion of an auditory task disproportionately affectedthe UFOV performance of either experimental group, for each participant a difference valuewas calculated between the auditory task present and auditory task absent conditions ofindividual subtests. Discrepancies between the two experimental groups on these individualsubtest difference values were investigated through Mann-Whitney U tests. No significantdifferences were found between normally hearing and hearing impaired participants on the

CHAPTER 5. USEFUL FIELD OF VIEW STUDY 145
processing speed (p = .31), divided attention (p = .48), or selective attention (p = .63)subtests.
As non-parametric testing was performed, the inclusion of covariates in analyses wasnot possible. Thus, the influence of age, gender, and education level on UFOV scoreswas established by performing Mann-Whitney U tests between groups for each respectiveindependent variable. As age data is continuous, the sample was split into two groups,one of the younger members (≤ 57 years; mean age = 47 years), one of the older (≥ 58years; mean age = 65 years), enabling the quantification of any age-related differences inthe results obtained.
A significant difference was found for the older vs younger comparison for the selectiveattention subtest of UFOV, completed in the absence of an auditory task (U = 61.5, z =-2.508, p = 0.011). Curiously, when the same subtest was performed with a concurrentauditory task, this difference between the older and younger group showed no significantdifference in scores (U = 96.0, z = -1.207, p = .235). No significant effects of educationlevel or gender were found on UFOV scores.
5.3.2 Auditory task
The mean percentage scores for the auditory task performed as a baseline measure (in theabsence of a concurrent visual task) and during each UFOV subtest are shown in Figure 5.6.Kolmogorov-Smirnov tests again showed that the auditory task response data was notnormally distributed. It can be seen that, for both groups, as the visual task becomesmore complex, accuracy on the auditory task decreases. Indeed, a Friedman test exhibiteda statistically significant decrease in auditory task scores as a function of the concurrentUFOV subtest
(χ2(3) = 12.343, p = .005
). Post-hoc analysis of these values using Wilcoxon
signed rank tests and the Bonferroni correction exhibited that this interaction arose mainlyfrom the difference between the baseline measure of the auditory task, and the performancemeasured whilst the auditory task was performed simultaneously with the divided attention(Z = -2.952, p = .002) and selective attention (Z = -3.178, p = .001) subtests of UFOV.
Auditory task scores of the hearing impaired group are marginally lower than thoseof their hearing counterparts at baseline, and across every UFOV subtest. However,when the differences in auditory task scores between the hearing impaired and normallyhearing groups were examined under each condition using Mann-Whitney U tests and theBonferroni correction, no significant differences arose (see Table 5.6). In fact, the dataactually showed that the auditory task performance of normally hearing participants wasmore affected by UFOV performance than the hearing impaired group. The normal hearinggroup exhibit a greater reduction in auditory task scores than the hearing impaired groupfor each UFOV subtest (see Figure 5.7). Auditory task scores were also analysed in termsof their difference amongst different demographic groups (age, education level, and gender)using Mann-Whitney U tests. This testing revealed no significant differences in any ofthe comparisons, suggesting no influence of these demographic variables on auditory task

146 CHAPTER 5. USEFUL FIELD OF VIEW STUDY
Figure 5.6 Mean auditory task scores (± standard error) for the two experimental groupsacross UFOV subtests and at baseline.
scores.
Figure 5.7 Mean reduction in auditory task scores from baseline (± standard error) for thetwo experimental groups across UFOV subtests.
Table 5.6 Mann-Witney U test results for a comparison between the two experimentalgroups in terms of their auditory task scores across UFOV conditions.
Subtest Medianp− valueNormal hearing Hearing loss
Baseline (no visual task) 48.18 46.84 .198Processing speed 46.47 46.50 .476Divided attention 45.20 44.51 .816Selective attention 44.76 42.11 .773

CHAPTER 5. USEFUL FIELD OF VIEW STUDY 147
5.3.3 Multivariate analysis
Although the visual and auditory tasks did not show a significant difference between thenormally hearing and hearing impaired groups, it was considered that there might be adual-task cost. As such, there may have been a decrement in both the visual and auditorytasks under a certain experimental condition that differed significantly between the twogroups. Accordingly, a MANOVA was run between the two experimental groups for eachsubtest of UFOV, submitting UFOV subtest score and the corresponding auditory taskscore as dependent variables. There was no significant difference between the hearingimpaired and normally hearing groups for the processing speed (p = .43), divided attention(p = .76), or selective attention (p = .36) subtests of UFOV.
5.3.4 Cognitive tests
The mean scores obtained by both experimental groups on KIPS are shown in Figure 5.8.Accuracy on the majority of these tests was high, with mean scores of 80% or above.However, ‘reading span’ scores were generally lower than the other three subtests forparticipants of both groups. This would be expected, given the complex nature of the taskwhich requires participants to hold words in working memory whilst piecing them together.
Scores on each KIPS subtest were not normally distributed. A Mann-Whitney Utest showed no significant differences between the hearing impaired and normally hearinggroups for the physical matching (p = .65) or lexical test (p = .70) subtests of KIPS. Thedifference in rhyme (p = .069) scores between the hearing impaired (M = 82.88, SEM =2.77) and normally hearing groups (M = 90.07, SEM = 2.76) tended towards significance,U = 79.5, z = -1.829, p = .067. One significant difference arose between the groups, withreading span scores shown to be lower in the hearing impaired group (M = 51.65, SEM =2.65) than the normally hearing group (M = 61.07, SEM = 2.53), U = 69.0, z = -2.223, p= .025. This suggests that some aspects of working memory ability were poorer in the
Figure 5.8 Mean results (± standard error) for the two experimental groups on eachindividual KIPS subtest.

148 CHAPTER 5. USEFUL FIELD OF VIEW STUDY
hearing impaired sample than the normally hearing sample in the current study.
5.4 Discussion
5.4.1 Visual task
The results show that the performance of a simultaneous auditory task degrades performanceon UFOV, and the more complex the visual task, the greater the effect of an auditorydistracter. However, the main aim of this study was to assess the effect of auditorydistraction on the performance of a complex visual task (which has been related to variousdriving outcomes), and to test whether this effect was more pronounced in hearing impairedcompared to normally hearing participants.
The data suggest that hearing loss does not lead to an exacerbation of the negative effectof auditory distraction on UFOV, as no significant differences between the UFOV scores ofthe two experimental groups were found. Nor was there a significant difference betweenthe effect that auditory task engagement had on the individual subtest performance ofthe two groups. Despite this, differences between the mean UFOV scores were apparentbetween the two experimental groups, with hearing impaired individuals scoring lowerthan normally hearing participants on the UFOV divided and selective attention subtestsin the presence of a concurrent auditory task. These differences did not reach statisticalsignificance, but the notion that hearing loss causes a disturbance on UFOV in the presenceof a concurrent auditory task cannot be categorically discounted; there are a number oftangible explanations for the lack of statistical significance.
Severe hearing impairments were not widely represented in this study. Hickson et al.(2010) noted that the degree of hearing impairment was the best predictor of overalldriving ability in their study sample. However, their results suggested that mild hearingimpairment is less associated with poorer driving ability in the presence of distracters. Thismay have been a possible reason why a statistically significant difference was not observedfor UFOV performance between the two groups. Over half (10 out of 17) of the hearingloss group in the current study had an impairment classified as mild, leaving relatively littledata from those with a moderate hearing impairment (7 out of 17). However, post-hocexamination of the data showed no significant differences between the UFOV scores of themildly hearing impaired participants and the moderately hearing impaired participants. Infact, mean values suggested that the performance of the moderately hearing impaired groupwas, contrary to what past work would suggest (Hickson et al., 2010), marginally betterthan that of the mildly hearing impaired participants. This discrepancy may, however,have arisen as a result of the very low, and unmatched sample sizes in these groups, henceno formal statistical testing was reported in this regard.
One manner by which listening effort requirements have been reduced for those witha hearing impairment in the past is the use of hearing aids (Downs, 1982; Sarampaliset al., 2009). The current experiment did not permit participants to wear their hearing

CHAPTER 5. USEFUL FIELD OF VIEW STUDY 149
aids for the completion of the auditory task. Whilst this could potentially have caused anincrease in the required listening effort of the hearing impaired group, auditory stimuliwere presented at a specified sensation level, meaning that sounds were presented at anamplified level, achieving the basic aim of hearing aids. This may be a supplementaryreason why the results in this study did not reach statistical significance. The attenuationto sound brought about by hearing loss could be responsible for the majority of listeningeffort increase, and by amplifying sounds for this demographic this difficulty is nullified.Hickson et al. (2010) allowed their participants to wear a hearing aid whilst driving, if theynormally did so. However, only around 15% of their sample reported doing so, meaningthe benefit of hearing aids would have been largely diluted by their participants who didnot wear them. In future studies it may, therefore, be of interest to present sounds ata single, pre-defined level (rather than a sensation level) in order to capture this extradifficulty associated with hearing loss. This would also have the added benefit of reflectingthe situation experienced by the large majority of people with hearing loss who do not seekrehabilitative help, or use hearing aids (Laplante-Lévesque et al., 2010).
Although not statistically significant, an interesting trend identified in this study is thepattern of results for UFOV involving no simultaneous auditory task. A lower baselinescore on the selective attention subtest of UFOV (incorporating visual, but no auditorydistracters) was noted in the hearing impaired group compared to the normally hearingparticipants. This was not expected, as it was hypothesised that extra attention to theauditory task would bring about a disturbance on UFOV in the hearing impaired sample.A lower score on a particular UFOV subtest in the absence of any auditory informationcannot, therefore, be explained by this hypothesis. Interestingly, a similar phenomenon,whereby hearing impaired individuals appear to be more distracted by visual informationin the absence of an auditory task has been noted in past research. The data presented byHickson et al. (2010) suggests that visual distraction had a negative influence equal to thatof auditory distraction on overall measured driving performance in their hearing impairedparticipants. However, there is no explanation as to why this may have been the case fromthe authors. Thorslund et al. (2013b) also found that their hearing impaired sample weredisproportionately affected by visual distraction compared to a normally hearing group.This point requires some consideration, given that a similar trend has been replicated inthis study.
A possibility is that there is a difference in the baseline cognitive abilities betweenthe hearing impaired and normally hearing demographics. As UFOV performance (whenundertaken without a concurrent auditory distracter) reflects the attentional and cognitiveabilities of respondents (Owsley, 1994; McDowd and Shaw, 2000), it is feasible to suggestthat those who perform worse on a cognitive test battery will also perform more poorly onUFOV than those who have shown themselves more able on the same cognitive tests. Infact, UFOV itself is considered a measure of speed of processing difficulties (Ball et al.,2007). The hearing impaired group in this experiment were significantly poorer at a reading

150 CHAPTER 5. USEFUL FIELD OF VIEW STUDY
span task and showed a tendency to perform the selective attention subtest of UFOV morepoorly in the absence of any auditory stimuli. These two factors, taken together, hint thatthere may be a higher prevalence of processing speed deficits, or Working Memory deficits inthe hearing impaired individuals in this study. There were no significant differences betweenthe ages of the two experimental groups, therefore age is unlikely to be a contributoryfactor for these results.
The possibility of cognitive deficits in the hearing impaired group is supported byprevious work showing deficits in cognitive skills associated with sensory impairment (e.g.Uhlmann et al., 1989; Lindenberger and Baltes, 1994; Baltes and Lindenberger, 1997;Lindenberger and Baltes, 1997; Cacciatore et al., 1999; Naramura et al., 1999; Arlinger,2003), and is of concern for this line of research; if those with an age-related hearingimpairment are predisposed to have deficiencies in cognitive skills, the ability to performcomplex tasks may be compromised even before the influence of an increased listeningeffort is introduced. Given that the samples recruited for both studies described thus farin this thesis have been reflective of an older demographic with age-related hearing loss,it is possible that the outcomes have been influenced by the disproportionate presence ofcognitive skill decrements. Likewise, higher-order cognitive factors may also have affectedprevious work in the area (McCloskey et al., 1994; Ivers et al., 1999; Gilhotra et al., 2001;Unsworth et al., 2007; Hickson et al., 2010; Thorslund et al., 2013a,b,c; Green et al., 2013;Thorslund et al., 2014). Whilst it should not (and cannot) be construed that this study hasproven a reduced efficiency of processing in the hearing impaired demographic, it has raiseda feasible concern. This concern should be fully accounted for in future work in this area,given the overwhelming reliance of the dependent variables used on higher-order cognitiveskills. Controlling for this possibility is the only manner in which the true influence ofhearing sensitivity alone on driving can be investigated.
Wood et al. (2006) argue that reductions in visual processing as a result of auditory taskengagement are of great practical importance for driving as they suggest poor hazard andsign detection. Indeed, UFOV is linked with various measures of driving performance andsafety (Clay et al., 2005). The results of this study, therefore, suggest that auditory taskengagement whilst driving may decrease road safety, and that caution should be exercisedwith regard to complex auditory task engagement whilst driving. Given the increasingavailability and use of in-car systems which function using the auditory modality, thesefindings are of clear practical importance. Further, this experiment explicitly suggeststhat this consideration is particularly pertinent for visually complex situations (e.g. whilstdriving through busy urban areas). Effect sizes suggested that the degrading effect ofauditory distraction became greater with increasingly complex visual scenes. However,although the data suggests that hearing impaired individuals might be at a furtherdisadvantage in this regard, it cannot be explicitly inferred from the results of this study,since there were no statistically significant differences on UFOV performance between thetwo experimental groups.

CHAPTER 5. USEFUL FIELD OF VIEW STUDY 151
5.4.2 Auditory task
Auditory task scores worsened when performed concurrently with UFOV. However, perfor-mance of the hearing impaired group was not found to be significantly poorer than thenormally hearing group on the auditory task under any of the UFOV subtests. In fact,the auditory task performance of normally hearing participants appeared more affected byconcurrent performance of UFOV than that of the hearing impaired group.
It is not clear why this may have been the case, but one explanation is that theincrease in required listening effort in hearing impaired individuals counteracts a significantdecrease in auditory task performance. If this trend is considered in the context of theWorking Memory model presented in Chapter 3 of this thesis, it might be that the centralexecutive is more involved with mediating phonological loop processes than it is withvisuospatial sketchpad processes in the hearing impaired sample. The Ease of LanguageUnderstanding model stipulates that explicit processing is called in to action more often inhearing impaired individuals than in normally hearing individuals (Rönnberg et al., 2008,2013). This explicit processing arises from an analogous construct to the central executive,and is required in order to mediate phonological operations, which are undertaken implicitlyby those with normal hearing. As a result, in normally hearing individuals the centralexecutive can allocate more resources to aiding visuospatial sketchpad operations, henceresulting in better UFOV performance.
However, in hearing impaired individuals the central executive cannot dedicate such aproportion of resources to the visual task as the phonological loop is under greater load. Itis possible that the extra resources assigned to the phonological loop may actually preventa stark decrease in auditory task performance, something which may not happen in thecase of the normally hearing individual.
Another reason for analysing auditory task data was to ensure that participants wereengaging with it, and did not neglect the auditory task in favour of performing UFOV. Thedata suggests that participants did not neglect the auditory task in favour of maintainingUFOV performance. At baseline, participants were able to successfully repeat approximatelyone of the two sentences with a suitable degree of accuracy, thus the hearing impairedand normal hearing groups had mean accuracies of 46% and 50%, respectively. This trendcontinued throughout each of the UFOV subtests, with accuracy rates never droppingbelow 40%, suggesting that participants continued to engage in the listening task whilstperforming the visual task.
5.4.3 Cognitive tests
Studying any differences in the cognitive abilities of the hearing impaired and normallyhearing groups in this study gave rise to an interesting finding. Despite the fact that bothgroups were closely matched in terms of age, gender, and the level of formal educationundertaken, there was a significant difference between the two groups for the reading span

152 CHAPTER 5. USEFUL FIELD OF VIEW STUDY
subtest of KIPS. This task is thought to rely heavily on the central executive of workingmemory (Lobley et al., 2005). Importantly, this effect was found in the absence of anyauditory task, suggesting that it is related to a general inability to process informationefficiently, rather than it stemming from auditory distraction. The rhyme section of theKIPS test battery is likely to be performed by a similar area of the brain to workingmemory tasks (Besner, 1987; Gathercole and Baddeley, 1993), and although performance ofthis subtest was not significantly different between the groups, it did tend towards it. Thisis of concern, given that the central executive (or a comparable construct) is hypothesisedto be the site of increased dual-task interference for the hearing impaired demographic.Thus, it is possible that the hearing impaired sample in the current study may have beencognitively predisposed to perform more poorly under dual-task conditions, regardless ofhearing loss.
These apparent differences in the cognitive capabilities of the two experimental groupscast a new perspective over the previous research conducted in this area. No explicitcognitive testing is included in the study of Hickson et al. (2010), simply a paper-basedquestionnaire regarding cognitive ability used to indicate more severe forms of cognitivedecline, such as dementia (the Mini Mental State Exam (MMSE); Kochhann et al., 2010).Hickson et al. (2010) found that their hearing impaired experimental group were lesscapable of efficiently dividing their attention between driving and auditory tasks. Thisdifference may have arisen because of a discrepancy in listening effort between participants,as was hypothesised. However, the authors also found that performing two simultaneousvisual tasks had a disproportionate effect on their hearing impaired sample, somethingwhich was also shown by Thorslund et al. (2013b). This is not in accord with the hypothesisthat an increased listening effort leads to a poorer driving performance, instead (in lightof the results of this study) it perhaps suggests that there may be a lesser processingcapability in their hearing impaired group.
A study linking hearing loss with an increased risk of road traffic accidents (Iverset al., 1999) also failed to control for cognitive factors and relied solely on self-reportedhearing loss, which is linked with respondents’ mental capabilities (Salonen et al., 2011).Self-reported measures of hearing impairment have also been linked with an increasedlikelihood of driving cessation (Gilhotra et al., 2001; Unsworth et al., 2007), and have beenshown to be the best predictor of reports of driving difficulty (see Chapter 4). The salientpoint here is that it is not possible to ascertain whether these results have arisen as a resultof hearing impairment, cognitive factors or an interaction of the two. Taking this researchforward in a useful manner will require a methodology by which the respective influence ofeach problem can be successfully differentiated.
This may be problematic, given the possibility that, by seeking a hearing impairedsample for participation, what is actually being obtained is a sample which has significantlydifferent cognitive abilities compared to a normally hearing sample. The ability to splitthe influence of hearing loss and cognitive factors apart is of paramount importance in

CHAPTER 5. USEFUL FIELD OF VIEW STUDY 153
establishing the effect of hearing impairment on driving performance. Accordingly, thefollowing chapter describes a technique that attempted to achieve this distinction. Onemanner in which the influence of cognition could be negated is through the employment ofa more extensive cognitive test battery. One of the cognitive tests used in this study was ameasure of Working Memory capacity (the reading span subtest), which is thought to predictperformance on higher-order cognitive tasks (Engle, 2002). Alternative or supplementarymeasures of complex Working Memory span are available (see e.g. Conway et al., 2005),and might be suitable for inclusion in future studies in this area. However, it might notbe possible to measure all relevant aspects of cognitive processing experimentally for anumber of reasons (e.g. insufficiently sensitive tests, lengthy experimental protocols). Forexample, the cognitive test battery undertaken here was not entirely diagnostic with regardto processing speed. As a result there may be unmeasured factors, which are potentiallymore prevalent in the elderly hearing impaired demographic, perhaps confounding theresults obtained. Accordingly, an experimental approach which avoids the use of olderhearing impaired individuals as participants is considered preferable. This would entirelyremove the confound of cognitive changes being more prevalent in those with an age-relatedhearing loss.
5.4.4 Study limitations
There are some methodological limitations which should be considered when interpretingthe results of the current study. For example, the small sample size is a possible reasonfor the results not reaching statistical significance. It is also important to note thatalthough UFOV has been exhibited as a good predictor of accident involvement in pastwork (Ball et al., 1993; Owsley, 1994; Owsley et al., 1998; Clay et al., 2005; Ball et al.,2006), this association has been shown through test scores which have been recordedwithout a concurrent auditory task. The association between UFOV scores under auditorydistraction conditions and driving behaviour is unknown, therefore conclusions in thisregard cannot be feasibly drawn. For example, those who have issues with multi-taskingmay well adapt their behaviour and withdraw from the auditory task in order to increasetheir road safety. This is particularly relevant for those with a hearing loss, who it isthough adapt their driving behaviour in order to negate any driving decrements occurringas a result of their sensory impairment (Thorslund et al., 2013a,b, 2014). More ecologicallyvalid studies of the driving of hearing impaired individuals would, therefore, be of greatvalue in determining if these adaptations in behaviour are likely to be the case.
5.5 Conclusions
This study has shown that the simultaneous performance of a cognitively demandingauditory task and UFOV decreases performance on both tasks. These results are ofpractical importance, as they indicate that aspects of visual attention are compromised

154 CHAPTER 5. USEFUL FIELD OF VIEW STUDY
during periods of auditory engagement. Furthermore, the results exhibit a propensityfor this visual processing problem to be exacerbated in more visually complex situations,providing an insight in to the most troublesome situations for auditory task engagementwhilst driving.
The results also indicate that hearing impairment might exacerbate this problem,although the difference between hearing impaired and normally hearing individuals in thisstudy did not reach statistical significance. A number of feasible reasons for this havebeen suggested, and two major concerns inform the methodological approach to be takenin future work. The first is that the study primarily reflected the performance of mildlyhearing impaired individuals, so a wider range of hearing loss severities is required inorder to generalise any conclusions, given that moderate or severe hearing losses betterpredict driving performance (Hickson et al., 2010). The second is that it is unclear whetherthe pattern of results observed actually arose as a result of a difference in the measuredcognitive abilities of the two experimental groups. The separation of hearing and cognitiveimpairments is of paramount importance to establish the effect that hearing loss has ondriving performance. Thus, continuing work must be planned with these two issues inmind. The next chapter provides a methodological approach by which the effect of hearingimpairment can be differentiated from other extraneous factors, and details how it will beemployed in the remainder of the studies which are reported in this thesis.

Chapter 6
Hearing Loss Simulation:Explanation and ValidationStudies
6.1 Introduction
This chapter reports on a method by which peripheral hearing loss can be controlled andisolated from other factors which may co-exist. This is necessary because, the previouslydescribed studies (see Chapter 4 and Chapter 5) have raised concerns regarding the abilityto:
1. Differentiate the effects of hearing loss and cognitive factors, which may be intertwinedin cases of age-related hearing loss;
2. Focus on a specific level of hearing loss;
3. Determine specifically whether it is the distortion to sound, caused by damage toperipheral auditory structures, which is responsible for the driving decrements inhearing impaired individuals.
These have been identified as issues for the continuing experimental work in this area,but also as confounding factors which may have impacted on past research in the area(e.g. McCloskey et al., 1994; Ivers et al., 1999; Gilhotra et al., 2001; Unsworth et al., 2007;Hickson et al., 2010; Green et al., 2013; Thorslund et al., 2013a,b,c, 2014). As a result, theneed for a methodological approach which accounts for these factors is warranted.
Accordingly for the remaining studies in this programme of research, a simulation ofSNHL was used to address these concerns. This chapter will provide a brief overviewof the methods by which valid hearing loss emulation might be achieved, and the ad-vantages/disadvantages of these approaches. The method of simulation chosen will thenbe described, and objective and subjective analyses will be performed to ascertain the
155

156 CHAPTER 6. HEARING LOSS SIMULATION
simulation’s appropriate functioning and suitability for use in experiments described in theremainder of this thesis.
6.2 Hearing loss simulation
SNHL results in a number of suprathreshold effects on the auditory system (see Chap-ter 2). The main effects identified can be summarised as: loudness recruitment, reducedtemporal resolution, and reduced frequency selectivity. Of course, these suprathresholdphenomena occur concurrently with a loss of sensitivity in the auditory system, resulting inelevated absolute thresholds. There have been numerous attempts to study suprathresholdcomplications elicited by hearing impairment using SimHL (Moore and Glasberg, 1993).This approach, provided the simulation is accurate, is a useful manner by which thepsychoacoustic effects of SNHL can be studied in normally hearing individuals, given thatindividual psychoacoustic aspects of hearing loss can be isolated and manipulated (Baerand Moore, 1993).
6.2.1 Why use hearing loss simulation?
Until now, the studies described in this thesis and other work in the area (McCloskey et al.,1994; Barreto et al., 1997; Ivers et al., 1999; Gilhotra et al., 2001; Unsworth et al., 2007;Hickson et al., 2010; Green et al., 2013; Thorslund et al., 2013a,b,c, 2014) have investigatedthe effect of hearing loss on driving by recruiting participants with a ‘real’ hearing loss.This approach, whilst valid, has given rise to a number of methodological concerns whichhave been highlighted by the first two studies described in this thesis. SimHL has thecapacity to address these individual considerations, as outlined in Table 6.1.
Simulating hearing loss, therefore, has three distinct advantages for use in the continuingdevelopment of studies in this area:
1. Cognitive and other age-related factors can be easily controlled in future studies, soit is highly unlikely that they will have an influence on the results;
2. The degree of hearing impairment can be customised to whatever is desired and keptconstant for each participant;
3. The power of studies can be improved by using a within-subjects design, rather thanhaving to rely on a between-subjects methodology.
Therefore, SimHL was considered a suitable experimental approach for continuing work inthis area.
However, despite its positives, it should also be considered that hearing loss simulationis subject to some limitations for application in this work. These limitations must beacknowledged, and any results arising from the use of SimHL considered accordingly.First and foremost, using a SimHL removes ecological validity from studies in which it

CHAPTER 6. HEARING LOSS SIMULATION 157
Tabl
e6.
1The
identifi
ediss
uesassociated
with
using‘re
al’s
ensory
impa
irmentin
stud
iesinvestigatingtheeff
ectof
hearingloss
ondriving
performan
ce,a
ndho
wSimHLcanovercomethese.
Problem
with‘real’he
aringloss
Ben
efitof
SimHL
Apo
tentialmismatch
inthecogn
itivecapa
bilitiesof
expe
r-im
entalgrou
ps:Results
from
theprevious
expe
rimentsuggested
that
therewas
asig
nifican
tdiffe
rencein
working
mem
orybe
tween
hearingim
paire
dan
dno
rmally
hearingindividu
als.
Cog
nitio
nis
im-
portan
tfordriving(W
ithaaret
al.,2000),acomplex
task
requ
iring
theintegrationof
anu
mbe
rofv
isual,c
ognitiv
ean
dpsycho
motor
skills
(Stuttset
al.,19
98).
Thu
sapo
tentially
high
erprevalen
ceof
cogn
itive
slowingin
thehearingim
paire
ddemograph
icis
ofconcern.
Ayoun
gno
rmally-hearin
gsamplecanbe
used
inexpe
riments,thu
sremoving
thepo
ssibility
ofage-relatedan
dhearingloss-correlatedincreasesof
cogn
itive
slowing.
SimHLrequ
irestheuseof
norm
ally-hearin
gsubjects
asDigita
lSigna
lPr
ocessin
g(D
SP)techniqu
eswill
presentstim
ulir
elativeto
ano
rmally
hearing
baselin
e.
An
inab
ility
todiffe
rentiate
betw
een
high
er-order
and
pe-
riph
eral
listening
processes:
‘Real’he
aringim
pairm
entintrodu
ces
high
er-order
listening
complications
which
govern
theim
pact
agiven
perip
heralh
earin
gloss
has.
Cha
pter
4suggestedthat
thesehigh
er-
orde
rlistening
processescaninflu
ence
expe
rienc
eddrivingprob
lems.
In‘re
al’h
earin
gloss
itis
notpo
ssible
todiffe
rentiate
perip
herallis-
tening
andhigh
er-order
compo
nents.
Thu
sthehy
pothesis
that
adispropo
rtiona
teeff
ectof
auditory
distractionin
hearingim
paire
dindividu
alsarise
sas
aresult
ofpe
ripherald
istortio
nto
soun
dcann
otbe
successfully
investigated.
Awith
in-sub
jectsexpe
rimentaldesig
ncanbe
used
ashearingloss
isbe
ing
artifi
cially
administ
ered
tono
rmally-hearin
gindividu
als.
Inthis
case,t
hesame
participan
tis
both
thecontrola
ndcase
cond
ition
,meaning
that
theindividu
alhigh
er-order
listening
processesremainidentic
al,regardless
ofhearingloss
cond
ition
.According
ly,t
heinflu
ence
ofpe
ripherallist
eningcompo
nentscan
beiso
lated,
astheSimHLon
lyalters
this
aspe
ctof
thesoun
d,with
noother
varia
bilityarising
intheexpe
rimentald
esign.
Awith
in-sub
jectsde
signalso
has
thebe
nefit
ofincreasin
gexpe
rimentalp
ower
(Field,2
013).
Awiderang
eof
hearingloss
severities:Pa
stwo
rkha
sshow
na
diffe
rencein
drivingou
tcom
esas
afunctio
nof
hearingloss
severit
y(Ivers
etal.,1999;P
icardet
al.,2008;H
ickson
etal.,2010);
greater
severit
iesa
regene
rally
associated
with
moren
egatived
rivingou
tcom
es.
Becau
seof
this,
itwas
suggestedthat
theresults
ofthepreviously
describ
edstud
y(see
Cha
pter
5)didno
tshow
statist
ical
signific
ance
becauseof
theinclusionof
anu
mbe
rofe
xperim
entalp
artic
ipan
tswith
amild
hearingloss.
Ade
sired
degree
ofhearingloss,inafre
quen
cy-spe
cific
man
nerc
anbe
specified
,an
dap
pliedacross
allp
artic
ipan
tstaking
part
inan
expe
riment(provide
dthat
they
have
norm
alau
ditory
func
tionthem
selves).
Thisn
ullifi
esan
yvaria
ncethat
may
arise
from
subtle
diffe
rences
intheau
diom
etric
data
ofpa
rticipan
ts,a
ndalso
allowsforthestud
yof
diffe
ringde
grees,
andconfi
guratio
nsof
hearingloss.
Forexam
ple,
itispo
ssible
toem
ulatetheau
diom
etric
patternof
anag
e-related
hearingloss,t
husprov
idingthepo
ssibility
tostud
ythepe
ripherale
ffectsof
this
form
ofhearingim
pairm
ent,with
outthecogn
itive
complications
that
are
associated
with
anolderstud
ysample.

158 CHAPTER 6. HEARING LOSS SIMULATION
is being applied. There is some suggestion that hearing impaired individuals adapt theirdriving behaviour in response to a reduced auditory input over time (Thorslund et al.,2013a,b, 2014). It is unlikely that applying an instantaneous SimHL will capture thisaspect of driving with a hearing impairment. This was not seen as an issue for this line ofresearch, in which the effect of peripheral sound distortion on distraction whilst drivingwas being investigated. Thus, removing behavioural change which could confound thisaspect of driving was not considered problematic for these studies, though the possibilitythat behavioural change might counteract the distracting effect of peripheral hearing lossshould be considered.
The inability of SimHL to capture every aspect of SNHL should also be considered.Although Moore (2007) suggests that the facets of SNHL covered by SimHL are the mostproblematic for speech understanding, the influence of those not covered should not bediscounted. Hearing loss simulation cannot accurately emulate reductions in temporalresolution, nor can it approximate central auditory processing decrements. Either of theseaspects of SNHL may cause problems for driving performance, so caution must be exercisedin the analysis of results.
Accordingly, provided that these limitations are considered thoroughly in conclusionsarising from work employing SimHL, this methodological approach is ideal for continuingwork being described in this thesis. The remainder of this chapter will go on to discusshow simulation is achieved and the specific method which was chosen for employment inthis programme of research. The testing performed on the simulation in order to ascertainits proper functioning is then discussed.
6.2.2 Methods of simulating hearing loss
In the past, there have been two broad approaches to simulating the effects of certainaspects of hearing loss:
1. Using a filtered noise masker so that the masked absolute thresholds of a normal earare the same as an unmasked audiogram of an impaired ear (Fabry and Van Tasell,1986; Humes et al., 1987; Zurek and Delhorne, 1987; Dubno and Schaefer, 1992).
2. Applying DSP techniques in order to alter sound so that it resembles that whichwould be perceived by an impaired ear (ter Keurs et al., 1992, 1993; Baer and Moore,1993; Moore and Glasberg, 1993; Baer and Moore, 1994; Moore and Glasberg, 1997;Nejime and Moore, 1997).
6.2.2.1 The use of a filtered noise masker
A filtered noise masker is applied so that the masked audiogram of a normal ear resemblesan unmasked audiogram of an impaired ear. A depiction of how this method works is givenin Figure 6.1.

CHAPTER 6. HEARING LOSS SIMULATION 159
Figure 6.1 An example of how hearing loss simulation is achieved by using a filtered noisemasker. Any extraneous sound which falls inside the range of the masker noise is unlikelyto be heard.
Moore and Glasberg (1993) summarise that, generally, results obtained from normalears using this method are similar to those measured from unprocessed stimuli in impairedears. However, in some cases subjects with ‘real’ SNHL exhibit worse test performancethan is recorded as a result of the simulation. They argue that this approach to simulationproduces a loudness recruitment effect, but one which is not comparable to that arising asa result of SNHL, because it is of a central (not peripheral) origin (Phillips, 1987) and islimited to a small range of sound levels around the masked threshold (Stevens and Guirao,1967). This type of simulation, therefore, provides an emulation of frequency specificthreshold elevation, but does not accurately represent frequency selectivity (as a functionof broadened auditory filters), or loudness recruitment. Additionally, the simulation ofhearing loss through the use of a masker noise is limited to mild-moderate hearing losses,as the level of the masking noise required to produce a severe hearing impairment wouldbe uncomfortably loud (and potentially damaging) for a normal ear to listen to (Mooreand Glasberg, 1993; Baer and Moore, 1993).
6.2.2.2 The use of Digital Signal Processing techniques
More recently DSP has been used to alter a sound so that it resembles that which isperceived by an impaired ear. Different DSP techniques have been used to emulate distincteffects of cochlear hearing loss: (1) frequency selectivity, and (2) loudness recruitmentand threshold elevation (see Chapter 2 for an explanation of these phenomena). These

160 CHAPTER 6. HEARING LOSS SIMULATION
techniques are summarised below.
1. Frequency selectivityReduced frequency selectivity refers to an inability to successfully resolve the differentcomponents of a complex sound (see Chapter 2). For those with a SNHL, it can lead to aless distinct representation of sound, which impacts on successful auditory perception (e.g.speech intelligibility) (Moore, 1996). Commonly, reduced frequency selectivity is simulatedby ‘smearing’ or ‘smoothing’ the frequency spectra of stimuli on a moment-to-momentbasis, so that the cochlear excitation pattern in a normal ear resembles that of an impairedear as a result of broadened auditory filters (Moore, 2007). An example of this techniqueis shown in Figure 6.2. A number of experiments have taken this simulation approachwhen investigating the suprathreshold effects of reduced frequency selectivity, and haveexhibited results that one might expect from ‘real’ hearing impaired subjects (ter Keurset al., 1992, 1993; Baer and Moore, 1993, 1994).
Figure 6.2 The difference between a normal input signal and a ‘smeared’ or ‘smoothed’output signal in the frequency domain. Source: Baer and Moore (1993).
ter Keurs et al. (1992, 1993), for example, measured the Speech Reception Thresholds(SRTs)1 of subjects listening to smeared stimuli in the presence of different types of maskingnoise. They found that smeared speech resulted in higher SRTs when the filter bandwidthused in their simulation was at least doubled, suggesting that speech intelligibility had beensignificantly affected by their smearing paradigm. They also found that the increase inSRTs remained when the noise was a single competing speaker as opposed to speech-shapednoise for processed stimuli (i.e. SimHL conditions). This was not the case for unprocessedstimuli (i.e. normally hearing conditions), and SRTs were reduced when the masker was asingle competing speaker. This is exactly what would be expected as those with normalhearing are less susceptible to masking by a single-speaker compared to hearing impairedindividuals (Festen and Plomp, 1990; Moore et al., 1991; Peters et al., 1998).
Baer and Moore (1993) used a more advanced smearing algorithm which incorporatedthe ability to alter the degree of broadening and asymmetry of auditory filter shapes. They
1The sound level at which 50% of speech can be successfully understood (American Speech-Language-HearingAssociation, 1988).

CHAPTER 6. HEARING LOSS SIMULATION 161
found that, when using a speech-shaped noise masker at low signal to noise ratios, wideningthe auditory filters used in the smearing paradigm progressively reduced SRTs. The resultsof a later study were also in accord with this finding (Baer and Moore, 1994), and agreedwith the finding of ter Keurs et al. (1993) that the difference between speech intelligibilityin noise and single speaker conditions was smaller for SimHL than it was for unprocessedstimuli.
These results exhibit DSP as a good approximation of the loss of frequency selectivityassociated with SNHL.
2. Loudness recruitmentLoudness recruitment refers to an abnormal growth of loudness with an increase in stimulusintensity (see Chapter 2). This leads to a ‘reduced dynamic range’ in individuals with aSNHL; the difference in level between sounds which are just audible and uncomfortablyloud is much smaller than it is for individuals with normal hearing (Moore, 1996). Loudnessrecruitment has also been simulated (in conjunction with threshold elevation) by employingDSP (Moore and Glasberg, 1993; Moore et al., 1995; Duchnowski and Zurek, 1995; Mooreet al., 1997). Commonly a signal is split into various frequency bands (corresponding tothe auditory filters on the basilar membrane), the range of levels in each band is thenexpanded, and the bands are recombined to form a processed waveform. This approachcan be used to model a larger range of hearing loss severities (accurately to around 90 dBSPL; Moore and Glasberg, 1993), given that the technique is not reliant on a maskingnoise which may become uncomfortably loud.
This process of simulating loudness recruitment is performed accurately by using aloudness model; if an individual with a unilateral hearing loss is asked to match the loudnessof a reference tone in their normal ear to a test tone in their impaired ear (see Figure 6.3)for a given input level, it is then possible to derive the perceived loudness in dB for thosewith SNHL. By applying a loudness model which has been derived in this manner, it ispossible to re-create the loudness sensations that would be experienced in an impaired earin a normally hearing ear (Moore, 2007).
There is some evidence regarding the validity of using this approach to simulate loudnessrecruitment and threshold elevation in normally hearing listeners. Duchnowski and Zurek(1995) used DSP to examine the effects of loudness recruitment and threshold elevationon syllables heard in quiet and in speech. Their algorithm was set up to reflect thecharacteristics of hearing impaired subjects that had been tested in a prior study (Zurekand Delhorne, 1987), and they presented these simulations to normally hearing subjects.Their results taken from normally hearing subjects matched the pattern that had beenexhibited in hearing impaired subjects during the previous study. This suggested thattheir emulation of auditory dysfunction accurately reflected the subjective experiences ofhearing impaired individuals.
Additionally Moore et al. (1997) recruited subjects with a unilateral moderate-severe

162 CHAPTER 6. HEARING LOSS SIMULATION
Figure 6.3 An example of a loudness growth function, derived by asking a subject withunilateral hearing loss to match the level of a reference tone in their normal ear, to theloudness of a test tone in their impaired ear.
sensorineural hearing loss and presented simulations of cochlear impairment to their normalears. The subjects tended to report that these stimuli were appropriate in terms of theirloudness and dynamics. However, they did state that the speech appeared a lot clearer forthe simulated stimuli in their normal ear, and results showed a markedly worse performancein speech recognition for the impaired ear than for the normal ear when listening to thesimulation.
This discrepancy in results was explained by the phenomenon of neglect2, but it was alsoargued that loudness recruitment and threshold elevation alone do not account for the speechunderstanding difficulties that hearing impaired individuals experience. Rather, there isa cumulative effect of different aspects of cochlear hearing loss causing a disturbance inspeech recognition. Moore (2007) suggests that, based on available data, the most involvedaspects affecting speech recognition (for moderate, severe and profound hearing losses) areaudibility, frequency selectivity and, to a lesser extent, loudness recruitment. Therefore,when only one (or a selection) of these psychoacoustic phenomena is emulated, there islikely to be a lesser effect on test results compared to if they were all applied simultaneously.
3. Complete simulation of Sensorineural Hearing Loss by Digital Signal Pro-cessingOne study has attempted to simulate all of the above aspects of cochlear hearing loss(threshold elevation, loudness recruitment and reduced frequency selectivity) in one DSP2‘Neglect’ is a phenomenon whereby subjects with a unilateral or asymmetric loss often rely on perceptionfrom their ‘good’ ear (Hood, 1984).

CHAPTER 6. HEARING LOSS SIMULATION 163
paradigm, and assess its effect on the intelligibility of speech in noise (Nejime and Moore,1997). The simulation paradigm used in this study was a concatenation of the methodolo-gies used in past hearing loss simulations by the same research group (Moore and Glasberg,1993; Baer and Moore, 1993). However, it improves previous emulations by taking intoaccount the fact that the broadening of auditory filters is frequency dependent (Faulkneret al., 1990), and that changes in frequency selectivity with level are less pronounced inhearing impaired ears compared to normally hearing ears (Stelmachowicz et al., 1987;Murnane and Turner, 1991). When comparing their results for a simulated moderatehearing loss against a control condition, Nejime and Moore’s (1997) results reflected whatone might expect in a ‘real’ case of SNHL. This is the only study that has simultaneouslysimulated all of these aspects of cochlear hearing loss.
6.2.2.3 Summary
In summary, although DSP and noise masking methods have produced results that arecomparable with what one might expect from those with a ‘real’ hearing loss, applying DSPappears to be a superior approach as it can emulate some aspects of cochlear hearing lossmore accurately than a noise masker method can (e.g. loudness recruitment and frequencyselectivity). In addition, DSP can be used for a wider range of hearing loss severities.
The emulation approach of DSP has been used to simulate numerous facets of cochlearhearing loss simultaneously, giving a more valid reflection of SNHL than isolated psychoa-coustic phenomenon. This is ideal for use in work in this area, given that an ecologicallyvalid approximation of SNHL is sought. It is important to note, however, that SimHL canonly provide an approximation of SNHL, and there are some aspects of this impairmentwhich it cannot emulate (e.g. temporal resolution, central auditory processing decrements).Additionally, there are various aspects of damage to the auditory system which it is notpossible to emulate simply by employing DSP (e.g. auditory nerve firing patterns).
Whilst these aspects are unaccounted for by SimHL, the aspects of SNHL which aretargeted by this methodology (loudness recruitment, threshold elevation and reducedfrequency selectivity) are considered the most important for speech understanding (Moore,2007), and are thus most likely to be responsible for the increase in the required listeningeffort in the hearing impaired demographic. These psychoacoustic properties can bereplicated to a high degree of accuracy, and so if this simulation is used on normally hearingsubjects in experiments assessing the effect of hearing loss, the outcomes are likely to behighly reflective of what might be expected from ‘real’ hearing impaired subjects. However,it is important that the noted omissions are considered when drawing conclusions frommethodologies employing SimHL.

164 CHAPTER 6. HEARING LOSS SIMULATION
6.3 The simulator chosen for use
This section reports on the specific method of simulation that was employed for experimentsdescribed in the remainder of this thesis. The evidence suggests DSP is a better approachto modelling a complete hearing loss than the employment of a filtered masking noise.Accordingly, the DSP method described by Nejime and Moore (1997) was implementedusing MATLAB (2010).
The following section provides a brief overview of Nejime and Moore’s (1997) simulationmethod, and thereafter testing which was carried out to ensure its accuracy and validity isreported.
6.3.1 Overview
The basic premise of the SimHL is that it applies various DSP techniques to an acousticwaveform, and produces an audio file which is representative of how the original wouldbe perceived by somebody with a SNHL. The basic stages involved in this process aresummarised in Figure 6.4, and each of these stages is explained in the following section.However, in order to produce a simulation of a desired level and configuration, variousinput parameters must first be specified. These include:
• The audiogram of the hearing loss that is to be simulated;
• The calibration dB SPL, in order to accurately apply a loudness model based on thelevel of the input sound;
• The desired dB SPL of the output file: the user can specify whether the output fileshould be amplified or attenuated (separate from any effect of the hearing loss beingsimulated) in relation to the level of the input file.
6.3.2 How the simulator functions
This method of simulation tries to address and emulate three aspects of SNHL: (1) thresholdelevation, (2) loudness recruitment, and (3) reduced frequency selectivity. The incorporationof these three psychoacoustic phenomena requires two broad processing steps: one whichapplies a loudness model, thus emulating threshold elevation and loudness recruitment, andone which applies a smearing function in order to emulate reduced frequency selectivity.However, first the input file must be prepared for these two functions to be applied.
1. File preparation
The RMS value of sound contained within the input file is measured, essentially providingan accurate representation of how intense the waveform is over its duration, removing theeffect of natural fluctuations in pressure over time (Rosen and Howell, 2011).

CHAPTER 6. HEARING LOSS SIMULATION 165
Figure 6.4 A flow diagram depicting how hearing loss simulation is achieved by the chosenmethodology.
The RMS value of the input file is then assigned an arbitrary dB value, which wasspecified as the calibration dB SPL value. Two calibration sounds are then appended to thestart of the file: (1) a 520 Hz tone, and (2) a short bust of noise reflective of the frequenciescontained in speech (ANSI, 1997). Both of these calibration noises are produced with thesame RMS value as that measured from the input file, so that the two correspond to thesame level. These will eventually be used in order to ensure that the stimuli are presentedto participants at the correct level.
The input file is then sent through a filter which simulates the change in frequencycharacteristics of a sound as it passes from free field to the cochlea; characteristics of theouter and middle ear mean that sound is attenuated at certain frequencies relative toothers before it reaches the cochlea (Yost, 2000). These changes have been quantified inpast studies and are known as transfer functions, two of which are applied: (1) a head

166 CHAPTER 6. HEARING LOSS SIMULATION
related transfer function, which describes the acoustic changes to a sound arising from itspropagation through the air, into and down the ear canal until it reaches the eardrum(Shaw, 1974), and (2) a middle ear transfer function, which describes the acoustic changesto a sound which occur as a result of its passage through the middle ear to the ovalwindow at the entrance to the cochlea (Killion, 1978). The combination of these twotransfer functions generally results in attenuation at lower frequencies, and a slight boostat mid-range frequencies (see Figure 6.5).
Figure 6.5 The overall gain characteristics of the two transfer functions applied in thesimulation to replicate the passage of a sound from free field to the cochlea. Data from:Shaw (1974) and Killion (1978).
2. Spectral smearing
With the calibration sounds appended and the frequency ‘stamp’ of the two transferfunctions applied, smearing is then applied in order to emulate a reduction in frequencyselectivity. The degree of smearing to be applied is calculated by averaging the suppliedhearing thresholds between 2–8 kHz. Values of 57 dB HL and above are classed as beingsubject to ‘severe’ smearing, between 36–56 dB HL are ‘moderately’ smeared, 16–35 dBHL are ‘mildly’ smeared, and 15 dB HL and below are not subjected to smearing. Thedegree of smearing governs the degree of auditory filter widening; the greater the degree ofimpairment, the greater the broadening, and, thus, the greater the amount of smearing.Table 6.2 shows the factor by which each auditory filter will be widened for differing degreesof hearing loss.
The input file is split into segments, and each segment is transferred from the timedomain (i.e. changes in pressure over time) into the frequency domain (i.e. the relativepower of the frequencies contained in the waveform). For successive, overlapping frames,the simulation takes the calculated excitation pattern on the basilar membrane of the earbeing simulated (i.e. with the filters broadened by the pre-defined factor). This excitation

CHAPTER 6. HEARING LOSS SIMULATION 167
Table 6.2 The broadening factors for the lower and upper limits of auditory filters appliedby the hearing loss simulation for different degrees of impairment.
Degree of impairment Lower filter broadening factor Upper filter broadening factor
Normal 1.0 1.0Mild 1.6 1.1
Moderate 2.4 1.6Severe 4.0 2.0
pattern can be defined as the output from the auditory filters as a function of the filtercentre frequency (Moore and Glasberg, 1983; see Figure 6.6 for an example).
As auditory filter bandwidths increase with rising frequency, these excitation patternshave an upwards ‘tilt’ (i.e. the excitation pattern is greater at high frequencies) becausethe wider filters at higher frequencies register more energy than thinner filters spanning asmaller bandwidth. This ‘tilt’ is removed by deriving a power per hertz estimation in eachfrequency band. This is necessary as the resulting simulated signal will be passed througha bank of auditory filters in a normal subject’s ears during experimental trials, which willhave the effect of ‘tilting’ the excitation pattern itself.
Figure 6.6 An example of the derivation of an excitation pattern from auditory filters. Thesimplified filter bank for a range of centre frequencies is shown on the right, along with therepresentation of a 1000 Hz tone (dashed line). The excitation pattern shown on the left isobtained by calculating the output of each filter as a function of centre frequency. Source:Moore and Glasberg (1983).
Following the removal of this ‘tilt’ at higher frequencies, the resulting excitation patternsare then separated into power and phase components and the power is convolved using asmearing function, whereby each spectral component is replaced by a weighted sum of itssurrounding components. This has the effect of ‘smoothing’ or ‘smearing’ the frequencyspectrum; decreasing the contrast between the peaks and valleys. The smeared powerspectrum and the original phase spectrum are then recombined and the signal is convertedback from the frequency to the time domain. The frames are then overlapped and addedback together to create a signal the same length of the input signal, but with the spectrumhaving been smeared.

168 CHAPTER 6. HEARING LOSS SIMULATION
3. Application of loudness model
Following the spectral smearing of the input signal, an emulation of threshold elevation andloudness recruitment is applied. Stimuli are again passed through a broadened auditoryfilter bank which is modelled on the widths and shapes of those measured from subjectswith moderate to severe hearing loss. In order to have as little effect as possible on thespectral components of the sound being processed (these have already been addressedand altered by the spectral smearing algorithm), the envelope component of the sound isaltered, rather than the whole waveform. The envelope of a sound is conveyed by amplitudemodulations over time, whereas the temporal fine structure refers to rapid oscillations witha rate close to the centre frequency of the auditory band (Moore, 2008; see Figure 6.7),conveying frequency modulations over time (Loughlin and Tacer, 1996; Stickney et al.,2004). Broadly speaking, the envelope holds information about the amplitude (or power)of a signal, whereas the temporal fine structure provides information about the frequencycontent of that signal. It is for this reason that, when simulating loudness recruitment,changes in the envelope of the sound are desired.
Figure 6.7 A depiction of the envelope of three different sounds, and the temporal finestructure contained within. Source: Moore (2008).
A loudness growth function is then emulated by raising the envelope of the signal foreach auditory filter to the power N , which has the effect of magnifying fluctuations inthe envelope. Applying independent values of N for different filters means that loudnessgrowth can be simulated in a frequency-dependant manner, allowing for the accuraterepresentation of loudness growth for hearing losses which vary across frequency. Forexample, Moore and Glasberg (1993) applied different values of N in each frequency bandfor such sloping, high-frequency hearing losses (the values are shown in Table 6.3).
At some point the loudness perception of an impaired ear usually ‘catches up’ with

CHAPTER 6. HEARING LOSS SIMULATION 169
Table 6.3 Specification of a hearing loss condition in the study of Moore and Glasberg(1993) and the power by which they expected the envelope to be raised by in each auditorychannel.
Channel centrefrequency (Hz) <879 879 1184 1579 2067 2698 3503 4529 5837
Hearing threshold(dB HL) 33 33 38 44 50 57 64 67 67
Value of N 1.5 1.5 1.6 1.8 2.0 2.35 2.75 3.0 3.0
that of a normal ear (see Figure 6.3). This point is usually considered to occur between 90- 100 dB (Moore, 2007). At sound levels above this ‘catch up’ point, loudness growth isusually comparable between hearing impaired and normally hearing individuals. Thus theamplitude of the waveform is scaled so that it equals the amplitude of the unprocessedsound when the calculated output level is equal to or greater than the loudness perception‘catch up’ level. Without this scaling, loudness would continue to grow in the same mannerpast this ‘catch up’ point.
Following the processing of the envelope it is multiplied by the fine structure in eachchannel to give a resulting waveform, which reflects the loudness sensations associated withSNHL.
4. Simulation output
Finally, a reverse of the two transfer functions originally applied to the input file isemployed in order to remove the frequency effects previously applied. This is necessaryas the transfer functions will be applied in real time when a subject is asked to listen tothe stimuli. This concludes the simulation process and the resulting waveform, completewith the appended calibration sounds, reflects the psychoacoustic phenomenon of loudnessrecruitment, threshold elevation, and reduced frequency selectivity. In theory, the resultingwaveform therefore presents the perception of a sound subject to SNHL to those withnormal hearing.
6.4 Validation of the simulation
In order to draw meaningful conclusions from any results obtained using this simulation asthe source of hearing loss, it is of paramount importance that the accuracy and validity ofthe emulation is assessed. This section will provide a description of how the simulationwas subjectively and objectively tested in order to ascertain its suitability for applicationin this research.

170 CHAPTER 6. HEARING LOSS SIMULATION
6.4.1 Objective analysis
Objective analysis was carried out in two manners: (1) ensuring the simulation produced aloudness model which accurately reflected what would be expected from a ‘real’ hearing loss,and (2) ensuring that the simulation applied independent levels of loudness recruitmentand threshold elevation across different frequency bands.
6.4.1.1 Derivation of the loudness model
The reduction in level of a two second burst of white noise which had been processed usingthe hearing loss simulation, relative to a reference sound, was ascertained for a range ofinput levels (0–120 dB in 5 dB increments), and different severities of flat hearing loss(the same Pure Tone Audiometry (PTA) thresholds across all frequencies; 10–90 dB in 10dB increments). The reduction in level from the reference file was calculated using theformula:
dB = 20 log10
(V
Vref
)where V was the RMS absolute voltage of the sound processed with the hearing loss andVref was an RMS reference voltage against which V was compared. Vref was obtained bytaking the RMS value of the white noise processed with a SimHL of 0 dB HL across allfrequencies.
For example, if the white noise was run through the simulation for a normal hearingand hearing loss condition using an input SPL of 60 dB SPL, and the RMS voltage valuesof 0.8 and 0.4 were measured, the change in dB corresponding to the waveform in thehearing loss condition would be:
20 log10
(0.40.8
)= −6.02 dB
Therefore, the dB level in the hearing loss condition would be 54 dB (60 dB − 6.02 dB).It was this type of calculation which was performed for a number of hearing loss severities
over a wide range of input sound intensities, enabling the production of a loudness model.The model was then scrutinised to assess whether the simulation had accurately representedabnormal loudness growth across a range of input intensities.
The simulation functioned as expected in terms of loudness recruitment and thresholdelevation across a range of hearing loss severities (see Figure 6.8). The dB values producedwere accurate to within ±3 dB at threshold level. For each level of hearing loss, sounds at(or near to) threshold crossed the X-axis at 0 dB, signalling that this is the level at whichthey could no longer be heard (i.e. the wave file contained no sound). For example, for aflat hearing loss of 20 dB the figure shows that an input sound intensity of 20 dB is notheard - the output sound file was at a level of 0 dB, or in other words, contained no sound.
Above the absolute threshold point, there was an abnormal growth of loudness up to aconvergence point, after which loudness grew normally. This convergence, or ‘catch up’,

CHAPTER 6. HEARING LOSS SIMULATION 171
Figure 6.8 An estimation of the loudness model being used by the simulation software forvarying degrees of hearing loss. Each solid line represents the loudness growth for a givenflat hearing loss across all frequencies. The dotted line exhibits reference processing carriedout for a flat 0 dB hearing loss (i.e. normal hearing).
point was 100 dB for the majority of hearing loss severities, and was adhered to in mostcases, although at very high degrees of hearing loss the pattern became less predictable. Infact, the linearity of loudness growth exhibited was not present in the most severe hearingloss that was simulated (a flat 90 dB HL hearing loss). Furthermore, the representation ofloudness perception at levels around threshold were inaccurate, and so it is pertinent todiscount hearing losses of greater than 80 dB from any experiments using this method ofsimulation.
The gradient of the loudness growth slopes corresponded to those described previouslyby Moore and Glasberg (1993). For example, the gradient of loudness growth for a hearingloss of 50 dB HL was approximately two, indicating that loudness grew at a rate twice asfast as the reference (normal hearing) condition. The gradient decreased for hearing lossesof a milder nature and increased for those of a more severe nature, as would be predictedby models of loudness perception for individuals with a SNHL (Moore and Glasberg, 1993).Thus, in terms of loudness recruitment and threshold elevation, it was shown, throughobjective testing, that the simulation was accurate to a high degree for a range of hearinglosses and input sound pressure levels.
6.4.1.2 Differing sensitivity across frequencies
Although the simulation produced a set of results that might be expected in terms ofloudness recruitment and threshold elevation, it did so given a set of simple flat hearing

172 CHAPTER 6. HEARING LOSS SIMULATION
losses across all frequencies. However, individuals with an age-related hearing loss (whichprevious demographic data suggests is the group of interest in this programme of research;see Chapter 4 and Chapter 5), predominantly have an increasingly reduced auditorysensitivity at higher frequencies (Gates and Mills, 2005). It is unclear, given the validationtests described thus far, whether the method of SimHL is able to accurately emulatethreshold elevation when given a hearing loss with differing absolute thresholds acrossfrequencies. This aspect of the hearing loss simulation was assessed by processing abroadband noise under different hearing loss conditions.
Two seconds of white noise, containing equal energy at all frequencies (see Figure 6.9),was generated to act as a test stimulus. The input level of the sound created was definedas 80 dB SPL, as was the desired output level. Four hypothetical hearing losses reflectiveof differing degrees of age-related sensory decline were created (see Figure 6.10), and thetest signal was run through the simulation under each of these conditions. The output ofthe simulator was then transformed to the frequency domain, and the resulting magnitudespectra were scrutinised in terms of how accurately they reflected the hearing lossessimulated.
Figure 6.9 The white noise signal generated for use in this validation procedure, shown inthe frequency domain.
The expectation was not for the frequency magnitude of processed signals to match theaudiogram exactly; rather, at input levels close to threshold it was expected that perceivedloudness would be close to 0 dB, but at higher sensation levels there would be abnormalgrowth of loudness, so output levels from the simulator should have exceeded what mightbe expected from a linear relationship with the hearing loss magnitude. This was indeed

CHAPTER 6. HEARING LOSS SIMULATION 173
the observation (see Figure 6.10). The resulting frequency spectra accurately reflected thechanges in frequency thresholds shown in each respective audiogram. It was also possibleto observe the influence of loudness recruitment in these results; at frequencies wherethresholds are below the 80 dB SPL level of the input sound, the frequency spectrumfollowed the audiogram, but not by the same gradient.
Figure 6.10 The frequency spectra derived from running white noise through the hearingimpairment simulation under different hearing loss conditions. Each respective audiogram(dotted line) is included with its resulting spectrum (solid line) for comparison.
This piece of analysis suggests that accuracy of the method of simulation remains forsloped hearing losses. In all examples, where the 80 dB input sound reached threshold athigher frequencies, the relative magnitude of the frequency response became (or was veryclose to) zero, as should be expected. Where thresholds at higher frequencies were reduced,but not to the extent where they exceed the presentation level of the input sound, therelative magnitude of the frequency response curve did not reach zero. This indicates thesound should be heard, but at a reduced level at these specific frequencies. Additionally, thefact that the frequency response had a different gradient to the absolute hearing thresholdsshows that abnormal loudness growth was successfully applied in separate frequency bands.These results, twinned with those obtained using flat hearing losses, support the accuracyof the simulation in terms of its ability to accurately reproduce the modelled effects ofloudness recruitment and threshold elevation brought about by SNHL, regardless of hearing

174 CHAPTER 6. HEARING LOSS SIMULATION
loss configuration.
6.4.2 Subjective analysis
The theoretical accuracy of the simulation is important, however, the subjective experienceof the SimHL must also be representative of ‘real’ SNHL. Accordingly speech testingwas carried out in order to assess the ecological validity of the simulation’s output. Bysimulating a hearing loss it should be possible to elicit a ‘speech audiogram’ from a normallyhearing subject that resembles what one might expect from somebody with an actualcorresponding SNHL. This is the basis for conducting speech testing, with a view to provingor disproving the subjective validity of the simulation being used. This will not only giveinsight into the ecological validity of using hearing loss simulation, but it will also providefurther grounds for concluding that the simulation behaves as desired in terms of thresholdelevation (sound will need to be louder before being heard). Furthermore it will provideinformation as to the success with which the simulation is able to ‘smear’ stimuli in orderto emulate the reduced frequency selectivity associated with SNHL. Even when sounds areloud enough to be perceived, they may still be unintelligible for some degrees of hearingloss, given the extent of distortion that is brought about by the ‘smearing’ paradigm.
Speech testing is a common clinical procedure aimed at estimating a person’s ability tounderstand conversational speech (Bess et al., 1995). Patients are asked to repeat wordsor sentences played to them at a given sound level, and are then given a mark for eachstimulus. Their scores on a set of words are then summed and calculated as a percentagecorrect score, which is plotted as a function of the stimulus presentation level, producing aspeech audiogram. This typically takes on an ‘S’ shape, though the exact form of this ‘S’depends upon the type of speech material being used (see Figure 6.11).
Figure 6.11 Typical speech audiogram results obtained from using different types of speechstimuli. Source: Martin (1987).
The ‘S’ usually shifts positively along the X-axis as a function of increasing hearing

CHAPTER 6. HEARING LOSS SIMULATION 175
impairment and, in some cases of SNHL, the tip of the ‘S’ will ‘tail-off’ at high presentationlevels, such that it would appear a one-hundred percent speech recognition score is neverattainable (Graham and Baguley, 2009). This is not the case for hearing losses of aconductive nature, as the distortion brought about by cochlear damage is not present inthese instances (see Figure 6.12).
Figure 6.12 Typical speech audiogram results using sentences as the stimuli. Source: Martin(1987).
6.4.2.1 Method
Participants
Speech testing was conducted on twelve English-speaking subjects (6|; 6~) in the age range20-28 years (M = 23.08, S.D. = 2.54). All participants underwent pure tone audiometrytesting (as per the British Society of Audiology, 2011), and were confirmed as havingbilateral normal hearing; in fact no single absolute threshold of any participant was > 15dB HL.
Materials
Arthur Boothroyd word lists (Boothroyd, 1968) were used, presented through TelephonicsTDH-39P headphones, under three auditory conditions: (1) a reference condition with nohearing loss present, (2) a simulated mild hearing loss condition with a mean threshold of29 dB HL (250 - 4000 Hz), and (3) a simulated moderate hearing loss condition with amean threshold of 55 dB HL (250 - 4000 Hz). Both hearing loss conditions were reflectiveof an age-related hearing impairment; an increasing loss of sensitivity with frequency(see Figure 6.13), as previous work has shown this work is most relevant for individualsexhibiting this type of hearing loss (see Chapter 4 and Chapter 5).
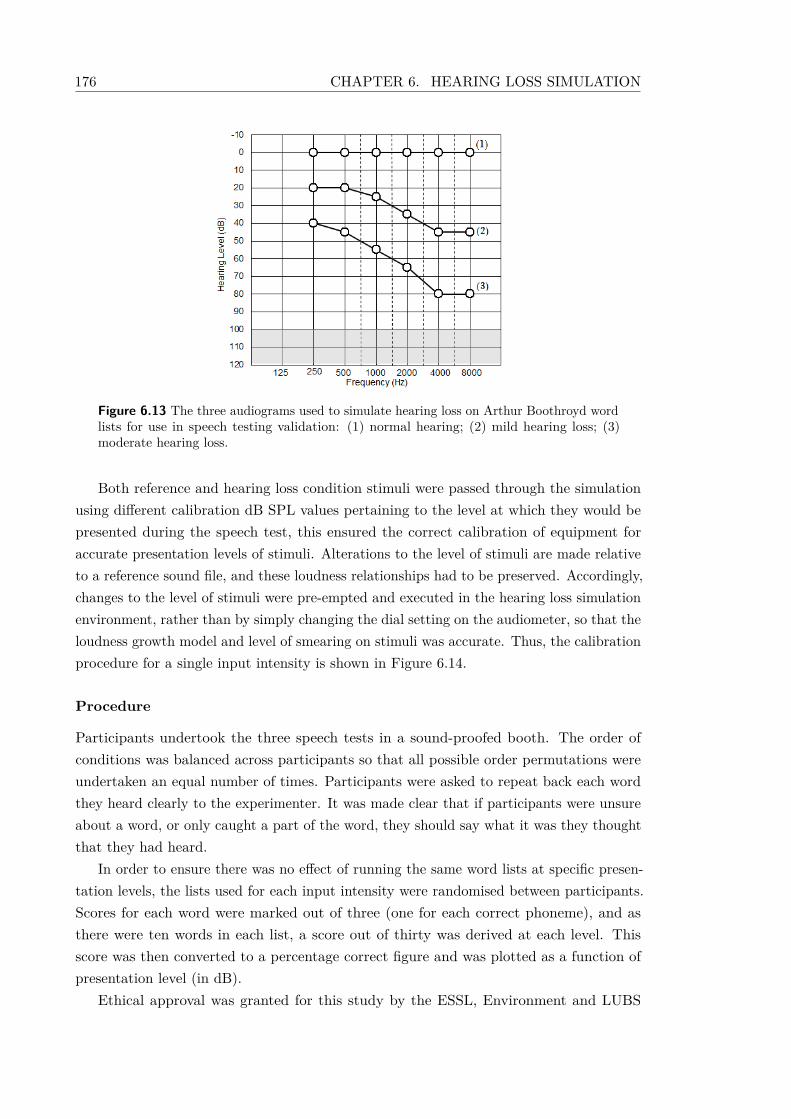
176 CHAPTER 6. HEARING LOSS SIMULATION
Figure 6.13 The three audiograms used to simulate hearing loss on Arthur Boothroyd wordlists for use in speech testing validation: (1) normal hearing; (2) mild hearing loss; (3)moderate hearing loss.
Both reference and hearing loss condition stimuli were passed through the simulationusing different calibration dB SPL values pertaining to the level at which they would bepresented during the speech test, this ensured the correct calibration of equipment foraccurate presentation levels of stimuli. Alterations to the level of stimuli are made relativeto a reference sound file, and these loudness relationships had to be preserved. Accordingly,changes to the level of stimuli were pre-empted and executed in the hearing loss simulationenvironment, rather than by simply changing the dial setting on the audiometer, so that theloudness growth model and level of smearing on stimuli was accurate. Thus, the calibrationprocedure for a single input intensity is shown in Figure 6.14.
Procedure
Participants undertook the three speech tests in a sound-proofed booth. The order ofconditions was balanced across participants so that all possible order permutations wereundertaken an equal number of times. Participants were asked to repeat back each wordthey heard clearly to the experimenter. It was made clear that if participants were unsureabout a word, or only caught a part of the word, they should say what it was they thoughtthat they had heard.
In order to ensure there was no effect of running the same word lists at specific presen-tation levels, the lists used for each input intensity were randomised between participants.Scores for each word were marked out of three (one for each correct phoneme), and asthere were ten words in each list, a score out of thirty was derived at each level. Thisscore was then converted to a percentage correct figure and was plotted as a function ofpresentation level (in dB).
Ethical approval was granted for this study by the ESSL, Environment and LUBS

CHAPTER 6. HEARING LOSS SIMULATION 177
Figure 6.14 The calibration procedure for speech testing with a SimHL. This calibrationprocedure must be adhered to for each change in input SPL.
(AREA) Faculty Research Ethics Committee at the University of Leeds (reference: LTTRAN-036).
6.4.2.2 Results
The resulting speech audiograms for each separate participant are shown in Figure 6.15. Apattern which approximated data that would be expected from a clinical test with a hearingimpaired individual was observed for each participant. One indicator of the simulation’ssuccess is its ability to ‘shift’ the test results positively along the X-axis as a function ofhearing impairment severity. This aspect of the speech test results reflects the simulation’sability to accurately emulate threshold elevation; words have to be made louder beforesubjects are able to detect them and establish what they are. Indeed, the amount by whichthe graph was shifted along the X-axis approximated to the hearing loss level at between500–1000 Hz for almost all subjects. Thus the simulation resulted in a similar subjectiveexperience of SNHL regardless of who it was played to, or what slight variations they hadin their baseline absolute thresholds across different frequencies.
Another indicator of the simulator’s success in subjectively emulating SNHL was itsability to diminish speech recognition, even at levels where participants reported the level

178 CHAPTER 6. HEARING LOSS SIMULATION
Figure 6.15 Speech test results for each of the twelve participants who completed speechtesting under the three hearing loss conditions shown in Figure 6.13.
of stimuli becoming uncomfortably loud. In the current study, no single participant wasable to tolerate stimuli presented at a level greater than 90 dB HL. However, Figure 6.15shows that no single participant scored above 90% for any of the word lists at any level inthe moderate hearing loss condition. Similarly, at high dial settings for some participants,it was observed that there was a ‘roll-off’ of percentage correct scores for the mild andmoderate conditions. This is a phenomenon that is apparent in ‘real’ test data and isthought to occur as a result of distortion brought about by the hearing loss at loud inputlevels (Martin, 1987).
The distortion as a result of the SimHL also had an effect on the gradient of the speechtest curve. That is, for a 10 dB HL increase in dial setting, a greater improvement inperformance was seen for the normal condition as opposed to the mild and moderateconditions. Indeed, after collating and averaging the speech test results, the approximategradients of the speech test curves showed a decrease as a function of increasing hearingloss severity (see Table 6.4). This is a phenomenon that has been shown in past speech testdata (Martin, 1987), and suggests that an aspect of hearing loss other than attenuationof sound is having a bearing on the ability of participants to recognise speech. Again,this advocates the successful emulation of reduced frequency selectivity through spectralsmearing, which is the only aspect of SNHL other than threshold elevation and loudness

CHAPTER 6. HEARING LOSS SIMULATION 179
recruitment that was simulated.
Table 6.4 The approximate gradient of the averaged speech test curves for each hearingloss condition.
Degree of impairment Approximate gradient
Normal 2.50Mild 1.67
Moderate 1.20
These subjective results are further testament to the simulation’s accuracy in replicatingthe perceptual consequences of SNHL, also adding support in terms of the simulation’secological validity. The DSP being undertaken, regardless of the underpinning rationale,produced stimuli which are subjectively similar to what might arise as a result of ‘real’cochlear hearing impairment, as evidenced by these behavioural results.
6.5 Conclusions
A clear case for the use of hearing loss simulation in future work has been made, and itsrelative advantages and disadvantages have been discussed. The method of emulationidentified appears to have a high degree of accuracy and validity according to testingconducted:
1. It has been shown to accurately reproduce threshold elevation for a range of hearingloss severities (up to 90 dB HL).
2. This threshold elevation can be accurately applied in a frequency specific manner,allowing for the emulation of age-related hearing loss.
3. The simulation reliably exhibits the phenomenon of loudness recruitment across awide range of input intensities.
4. This loudness recruitment is reflective of ‘real’ loudness perception models (it reliablyincorporates a loudness ‘catch-up point’ with normal hearing).
5. The loudness recruitment model reliably changes depending on the degree of hearingimpairment.
6. Furthermore, these changes in loudness recruitment as a result of hearing loss severitycan be applied in specific frequency bands.
7. Subjectively, the simulation method ensures that speech stimuli have to be madelouder by a relative level before they are perceived.
8. A given increase in level does not result in a comparable increase in intelligibility forthe normal hearing and SimHL conditions.

180 CHAPTER 6. HEARING LOSS SIMULATION
9. Speech is not entirely intelligible, even at clearly audible levels, as a result of thefrequency smearing it applies to stimuli.
Thus, the simulation is objectively sound, and can produce results in normally hearingindividuals that mirror what would be expected from unprocessed stimuli in those with a‘real’ SNHL.
Given the increase in experimental power and control that this method offers, as well asthe ability to eradicate extraneous variables (such as cognitive capabilities and age), SimHLwas used in the study described in the next chapter to investigate the effect that hearingloss had on the performance of auditory memory tasks. This work is applicable as it canprovide information regarding the extent to which peripheral hearing loss increases requiredlistening effort, and may, therefore, have a bearing on other concurrently performed tasks(such as driving).

Chapter 7
Analysing the Effect of SimulatedHearing Loss on Auditory MemoryTasks
7.1 Introduction
For normally hearing individuals, during optimal listening conditions, hearing and under-standing audible speech is considered a mostly effortless task (Pichora-Fuller et al., 1995).However, when in suboptimal auditory environments, increased listening effort (and thusan increase in the cognitive resources being used) occurs (see Chapter 3). This may reducethe available resources for completion of other, concurrent tasks or cognitive processes.For example, it has been shown that the ability to store and recall auditory informationis adversely affected when presented in the presence of background noise (Rabbitt, 1968;Murphy et al., 2000), presumably because more effort, and thus cognitive resources, arerequired to understand the auditory signal, taking resources away from the ability toperform other cognitive functions.
The distortion to sound associated with SNHL also has the potential to disrupt cognitiveprocessing and impact on the performance of everyday tasks (Shinn-Cunningham and Best,2008). This is because SNHL too increases the required listening effort to understandauditory signals, even in quiet conditions (Kramer et al., 1997; Stenfelt and Rönnberg,2009; Zekveld et al., 2011). Further, this effect is likely to be exacerbated in the presenceof background noise (Kramer et al., 2006). This inference has already been explainedin accordance with an ELU model (see Chapter 3), which postulates that explicit (moreeffortful) processing is employed when an auditory signal is mismatched against storedphonological representations. This process is thought to happen more often in those with ahearing loss, thus, more effortful processing is used disproportionately in this demographic.
Research agrees with this theory. Rabbitt (1991) showed that auditory distortion, as aresult of hearing loss, impaired the recall of words in a hearing impaired sample compared
181

182 CHAPTER 7. AUDITORY TASKS STUDY
to a normally hearing sample. The effect of hearing loss on recall has also been apparentin other laboratory-based experiments (McCoy et al., 2005; Wingfield et al., 2005). Thesefindings suggest that degradations to an auditory signal, as a result of hearing loss, havethe capacity to make the performance of auditory tasks more difficult. This has importantpractical ramifications, raising questions about the difficulty of everyday tasks in theauditory modality for hearing impaired individuals.
In addition to the difficulty posed for performing an auditory task by stimulus deliveryor perception, research has shown that increasing the demand of the task itself resultsin decreased performance of other concurrent tasks (Pomplun et al., 2001; Strayer et al.,2003; Wood et al., 2006). However, simply listening to an auditory stream has little impacton dual-task performance, whereas auditory tasks which require a participant responsedegrade performance (e.g. Pomplun et al., 2001; Wood et al., 2006). This suggests thatthe amount of interference from a concurrent task may also be governed by the demandsof the auditory task, regardless of the presence of hearing loss.
It is not yet known how hearing impairment interacts with the difficulty of a concurrentlyperformed auditory task. Some research in normally hearing individuals has involvedalterations in the difficulty of concurrently performed auditory tasks by simply askingparticipants to either listen or respond to a sound message (e.g. Wood et al., 2006).Whilst this approach undoubtedly alters the difficulty associated with a single task, itdoes not contrast the difficulty between task types, nor does it account for the possibilitythat a participant could pay no attention to the ‘just listening’ condition. A variety ofauditory tasks are now commonly used in studies investigating the performance decrementsassociated with undertaking two tasks simultaneously (see e.g. Pashler, 1994). However,there is little data regarding the individual demands and perceived difficulties that theseauditory task impose.
The lack of data on the absolute demands associated with individual auditory tasksmakes the investigation of auditory distraction on driving in those with SNHL challenging.It is desirable to investigate the effect of different levels of auditory task difficulty on driving,as the relative cognitive workload from these may interact with the demand imposed byhearing loss.
The purpose of this study was to obtain a hierarchy of difficulty for five auditorytasks performed under normally hearing conditions. Performance on three of these tasks(reflecting ‘low’, ‘medium’, and ‘high’ degrees of difficulty) was then analysed when stimuliwere presented under conditions of SimHL.
7.2 Study aims
This study consisted of two experiments.The aim of Experiment A in the current study was to gather normative data on the
difficulty associated with a number of auditory-based memory tasks in terms of response

CHAPTER 7. AUDITORY TASKS STUDY 183
accuracy, time and self-rated difficulty. It was hoped that a hierarchy of task difficultycould be derived, such that ‘low’, ‘medium’, and ‘high’ demand tasks could be selected totake forward to Experiment B. The aim of Experiment B was to test performance undernormal, mild SimHL, and moderate SimHL conditions in order to establish how hearingloss affected performance on auditory tasks of different difficulties.
It was hoped that the results of this study would inform the design of the study reportedin Chapter 8, which asked participants to perform different auditory tasks under SimHLconditions whilst driving a simulator.
7.3 Experimental hypotheses
In Experiment A, the aim was to establish a clear hierarchy of task difficulty (indexedby task response time, accuracy, and self-reported difficulty). Tasks that were perceivedto vary in terms of their difficulty were, therefore, chosen; a decision which was basedon the extent of cognitive processing required. For example, a task which requires thestorage of two numbers in memory was considered easier than a task which required thestorage of two numbers, and their addition, simply because the latter involved an extralevel of cognitive processing. A more extensive discussion of the difficulty of chosen tasksis provided in the next section. However, the general hypothesis was that, where a taskwas thought to be easier, accuracy would increase, and reaction time and self-reporteddifficulty would decrease.
In Experiment B, the effect of two levels of SimHL (mild and moderate) on three tasks(reflecting a high- medium- and low-demand tasks) was assessed. It was hypothesised thatSimHL would increase the difficulty of the three tasks, thus accuracy would decrease andresponse time and self-rated difficulty would increase. Furthermore, it was consideredthat an interaction may exist such that the harder the type of auditory task, the strongerthe effect of SimHL (i.e. there may be worse performance on more difficult task typeswith a SimHL compared to normal hearing). This is because SimHL is likely to resultin more explicit processing (arising from a construct similar to the central executive) inorder for listeners to understand the stimuli (see Chapter 3). Therefore, when an easytask is performed, there will be a small effect as the amount of central executive mediationrequired to complete the baseline task is relatively little. However, when a more difficulttask is performed, there will be greater competition for central executive mediation, asthe difficult task will require more cognitive processing. Therefore, listening and taskperformance are likely to both suffer to a greater extent.
7.4 Experiment A
The two parts of this study shared very similar methodologies. As such, the methodology forExperiment A is reported in this section, however a large proportion of this information is

184 CHAPTER 7. AUDITORY TASKS STUDY
applicable for Experiment B. Thus, only the alterations that were made to this experimentalparadigm are reported later in Experiment B.
7.4.1 Method
7.4.1.1 Participants
Young, normally-hearing participants were asked to participate in this study, therebyexcluding the influence of age-related declines in processing ability. Participants wererecruited via advertisement at the University of Leeds and were screened for normalhearing in a sound-proofed room using pure tone audiometry (as per the British Societyof Audiology, 2011). Individuals were excluded from participation if they had hearingthresholds of ≥ 15 dB HL at frequencies of 250–8000 Hz. Twenty-five participants (13~/12|,mean age = 28.44 ± 4.75 years) were recruited.
Ethical approval was granted for this study by the ESSL, Environment and LUBS(AREA) Faculty Research Ethics Committee at the University of Leeds (reference: LTTRAN-036). Participants were reimbursed £10 for taking part in this experiment.
7.4.1.2 Materials
Auditory tasks
The eventual aim of this study was to identify suitable tasks for employment in the studyreported in Chapter 8. As such, auditory tasks which have typically been used in drivingsafety literature were considered. Five tasks were selected to be used in this study, witha main criterion that response paradigms could be comparable. This was consideredimportant as comparisons between reaction times to tasks were being made. Since soundperception is affected by hearing impairment, tasks with an emphasis on listening were used.Some studies have employed auditory-based cognitive tasks such as counting backwardsin multiples of seven (e.g. Merat and Jamson, 2007); this type of task should not havea disproportionate effect on hearing impaired individuals as it does not rely on auditoryperception. In addition, because an emphasis was being placed on the listening aspectof the task, response paradigms were required not to be too complex, as this may haveintroduced extraneous factors which could have affected study outcomes. For example,Merat and Jamson (2007) used a task in which participants had to listen to a phonenumber, but were then asked to type it in to an in-vehicle system.
Therefore, Table 7.1 shows a non-exhaustive list of the considered tasks, and it can beseen that only certain tasks were applicable given their response parameters.
Tasks were chosen if they incorporated responses that could be single digits in therange 1–9, this was considered ideal as reaction times could be measured from buttonpresses given on a computer keyboard. This discounted a number of task types detailedin Table 7.1: general knowledge questions, working memory span test, and conversationwith experimenter. Furthermore, whilst the memory task and grammatical reasoning test

CHAPTER 7. AUDITORY TASKS STUDY 185
Table 7.1 Example auditory task types which have been used in past driver safety experi-ments.
Study Description of task
Engström et al.(2005b); Jamsonand Merat (2005);Victor et al. (2005)
aCMT: Participants had to hold in memory two, three, or four targetsounds and count how many times each target occurred during a stim-ulus list, reporting back their answers at the end of the presentation.
Horberry et al.(2006)
General knowledge questions: Participants were asked to answergeneral knowledge questions from two options whilst driving.
Reimer (2009) N-back task: This task has been widely used in Working Memoryliterature (Baddeley, 2003). A participant is presented with a list ofnumbers and is asked to report the number that was read n positionsago. For example, if n = 0 the participant would repeat the last digitread out, if n = 1 the participant would repeat the penultimate digitread out.
Haigney et al.(2000)
Grammatical Reasoning Test: Participants were presented withfive stimulus letters and were asked a question about the order of twoof these letters (e.g. the letter ‘D’ was read out before the letter ‘A’;true or false?)
Alm and Nilsson(1994)
Working Memory Span Test: Participants were presented with anumber of sentences which contained 3–5 words and took the form“X does Y”. Participants were asked to indicate whether the sentencemade sense, and then after five sentences were asked to recall the lastword in each, in order.
Brookhuis et al.(1991); Törnrosand Bolling (2005)
Paced Auditory Serial Addition Task: Participants were pre-sented a list of digits and had to add the most recently heard twonumbers together, continually stating their answers. McKnight andMcKnight (1993) also had a similar task whereby they asked partici-pants to continually perform a string of mental arithmetic sums.
McKnight andMcKnight (1993);Strayer andJohnston (2001)
Conversation with experimenter: The experimenter conversedwith participants about various pre-defined topics whilst they drove.
McKnight andMcKnight (1993)
Memory task: Participants were read a list of five or six digits andwere asked if certain numbers were contained within that list.
may have been adapted to incorporate responses as a digit in the range 1–9, they involve atwo choice forced response paradigm, which gives a 50% chance of a correct response, evenwhen guessing. The rejection of these tasks left the following: aCMT, N-back task, andPASAT.
Adaptations to the tasks were made to vary the predicted processing demand theyimposed, and to ensure the response paradigm of a single digit in the range 1–9. A

186 CHAPTER 7. AUDITORY TASKS STUDY
description of each individual task selected, and the associated difficulties of each, is givenbelow (in order of hypothesised difficulty):
1. 0-back: In this study a list of 5–9 single digits was presented to participants at 1second intervals. The length of the list was randomly assigned, and participantswere not aware of the list length prior to completing the task. Participants were notrequired to respond throughout the list but were instructed to listen and at the endof the list key in the last number in the list. For example:
Stimulus: 8 4 7 4 9Correct response: 9
This task requires the storage of the most recent digit in memory, requiring nomanipulation of this memory trace. It is unlikely, therefore, that it will place agreat demand on working memory, as there is likely to be little interference withrehearsal processes associated with the ‘phonological loop’ portion of this informationprocessing model (Baddeley, 2000).
2. Digit Continuous Memory Task (dCMT): this task is very similar to the aCMTwhich has been applied in past driving safety research assessing the effect of auditorydistraction whilst driving (Jamson and Merat, 2005; Victor et al., 2005; Engströmet al., 2005b). The task is an auditory manipulation of a visual version (the VisualContinuous Memory Task; Veltman and Gaillard, 1998), whereby participants aregiven a target icon and are then required to watch a stream of icons containing arandom number of the targets. The task is to count the number of occurrences ofthe target and then report back this number at the end of the stimulus list. Thedemand of this particular task can be altered by increasing the number of targetsthat participants have to remember and match against the string of stimuli (Jamsonand Merat, 2005; Victor et al., 2005; Engström et al., 2005b). In the manipulation ofthe aCMT used in this experiment, participants were given one randomly assignedtarget (between 1–9), to reduce the processing demands relative to other tasks. Aftera 5 second pause, a list of 10 random digits was presented to participants at 1 secondintervals. Participants were required to listen for the number of occurrences of thetarget and then key in the answer at the end of the list. For example:
Target number: 6Stimulus: 6 1 6 6 2Correct response: 3

CHAPTER 7. AUDITORY TASKS STUDY 187
In terms of the mental processes involved with this task it is somewhat similar tothe 0-back in that it requires only one target digit to be held in memory. However,it requires this digit to be matched against a number of others which occur in thelist. Unlike the 0-back, this task is more likely to be prone to interference, in thatother digits contained within the list may affect the rehearsal processes involved withkeeping relevant auditory information in memory (Baddeley, 2000).
3. Tone Continuous Memory Task (tCMT): the parameters of tCMT were almostidentical to dCMT, except for participants were assigned a random target tone (asinusoidal wave at one of the discreet frequencies: .25, .5, 1, 2, 4 kHz) instead ofa digit. As with the dCMT, this task was played to participants aurally, with atarget tone, followed by a 5 second pause, then a list of 10 random tones at 1 secondintervals. Participants were again required to listen for the number of occurrences ofthe target and then key in the answer at the end of the list. For example:
Target (kHz): 1Stimulus (kHz): 2 1 1 1 1Correct response: 4
This task was chosen in an attempt to provide a further level of difficulty in the taskhierarchy. It was thought that in performing the dCMT participants identified theirtarget by recognising and naming the stimulus. It was considered that the majority ofparticipants would not, however, recognise and name the frequency of certain tones.This constant matching of stimuli against an un-named perceptual trace makes tCMThighly subject to interference from competing stimuli. As such, the performance ofthis task was hypothesised to be more challenging than the completion of dCMT.
4. 2-back: this task was similar to the 0-back, but instead of recalling the final numberin the digit list, participants were required to report the third from last number.Increasing the value of n in the n-back task increases its difficulty (Reimer, 2009).Thus it was considered that applying a different value for n would result in anotherlevel of difficulty on the task hierarchy. As for the 0-back, a list of 5–9 single digits waspresented to participants at 1 second intervals. The length of the list was randomlyassigned, and participants were not aware of how long the list would be prior tocompleting the task. For example:
Stimulus: 8 4 7 4 9Correct response: 7

188 CHAPTER 7. AUDITORY TASKS STUDY
This task is likely to be made more difficult because it requires the storage of moreinformation in Working Memory than any other task used. The 0-back required thestorage of only one digit, and tCMT and dCMT required the storage of only twopieces of information. As the list was able to stop at any random point, it was notpossible to identify the specific position at which the target digit would occur. Assuch, participants needed to constantly remember the past three digits in order toperform the 2-back successfully. This was considered to put more of a demand onthe phonological loop portion of working memory, as the rehearsal of all the mostrecent three digits would be required in order to keep all of the required informationin a short-term memory store without decay. This rehearsal process may also haveprovided some interference for digits being read out as part of the stimulus list. Forexample, a participant rehearsing three digits repeatedly may hear the next digitbeing presented, but mix it up with one being rehearsed as part of the most recentthree. Accordingly it is feasible that mistakes may occur when updating the digitsbeing held in short-term memory.
5. Paced Auditory Serial Addition Task (PASAT): the premise of the PASATis that random numbers are presented aurally at set intervals, and participants arerequired to continually add the last two numbers that they have heard together(Royan et al., 2004). For example:
Stimulus list: 2 3 1 3 6Correct response: 5 4 4 9
A visual version of the PASAT was originally developed by Sampson (1956) to examinetemporal integration. This task was adapted to be presented aurally (Gronwall andSampson, 1974; Gronwall and Wrightson, 1974), and has become an importantneurophysiological test to measure attention and concentration (Gordon and Zillmer,1997), working memory and speed of information processing (Roman et al., 1991;Diehr et al., 1998). In this experiment there is an emphasis on recording responsetimes to stimuli, as such it was decided that this task should be run at a self-pacedrate, rather than having the digit presentations system-paced. Accordingly, randomdigits between 1–5 were presented to the participant, this meant that answers werenever greater than 9, and therefore a single-digit answer was always required. Thiswas considered important in the ability to equate response parameters between tasktypes. Initially two digits were presented at an interval of 1 second, thereafter onlyonce an answer had been given by the participant was a new number presented. Thisprocess continued until the list had finished; in total the list was eleven digits long,meaning that in one trial a participant performed ten sums.

CHAPTER 7. AUDITORY TASKS STUDY 189
The difficulty associated with PASAT is likely to arise primarily from the extracognitive process of mental arithmetic. As opposed to all other tasks, PASATrequired the use of not only short-term memory, but cognitive processes associatedwith the manipulation of those short-term memory traces (the performance of sums).This is an additional demand which is not imposed by any of the other tasks, simplyrequiring the storage of information in memory, rather than any extraneous cognitivetasks. In addition, the fact that participants had to add two numbers together toproduce their own answer (unrelated to the digit list entirely) increased the chanceof interference between stimuli and responses.
Experimental setting
Both experiments were developed and run on a personal computer in a sound-proofedbooth, using MATLAB (2010) software with the Psychophysics Toolbox extensions (Pelli,1997; Brainard, 1997; Kleiner et al., 2007). For use in all tasks except tCMT, audio filesof individual numbers from 1–9 were obtained from an open source repository (VoxeoCorporation, 2013), and were normalised in terms of amplitude and duration. For usein the tCMT task, pure tones were generated using MATLAB (2010) software, againeach was equated in terms of amplitude and duration. All stimuli were presented usingTelephonics TDH-39P headphones at an intensity of 60 dB HL, which corresponds to anormal conversational level (Skinner et al., 1997). The end of digit lists were signalled bya 1 kHz tone, and the end of tone lists were signalled by a burst of white noise (as toneswere being used as task stimuli), both of which lasted 0.1 seconds. Participant responseswere collected using the number pad of a keyboard, and response times were measuredfrom the end of the 1 kHz tone or burst of white noise.
7.4.1.3 Procedure
Participants were presented with information about the study, and were given the opportu-nity to ask any questions prior to signing informed consent to take part. After consenting,participants were screened for normal hearing using pure tone audiometry (as per theBritish Society of Audiology, 2011). Participants were then given a short practice session inwhich they were presented with two full trials of each task. Following the practice session,participants were asked if they were happy to continue and perform the ten experimentaltrials, which were run at a self-paced rate (no participants requested extra practice trials).Participants were asked to perform each of the five tasks as quickly and accurately aspossible, the order of which were counterbalanced using the balanced latin square method.Each task was performed ten times, and prior to beginning each task participants weregiven a rest. Participants were informed that they were allowed a break of any durationat any point during the experiment. Immediately following each task, participants wereasked to rate how difficult they had found it on a 7-point Likert scale and also on the

190 CHAPTER 7. AUDITORY TASKS STUDY
National Aeronautics and Space Administration Task Load Index (NASA-TLX) (Hartand Staveland, 1988; Hart, 2006), before continuing with the next task. Two self-reportedmeasures were included in order to provide complex (NASA-TLX) and simple (Likert)measures of perceived difficulty.
Given its increased simplicity of application and comparable sensitivity, ‘Raw TLX’ wasemployed rather than the original NASA-TLX by eliminating the sub-scale weighting process(Hart, 2006). Whilst the Likert score recorded how challenged participants felt generally,the NASA-TLX has been specifically developed to measure perceived demands across anumber of different subscales, thus analysis could be carried out on these individually ifdesired, although detailed analysis of this nature was eventually considered unnecessary.This was the case because some sub-scales confounded results, given that they were notrelated to the simple auditory tasks used. For example, the physical demands of the taskswere similar, given that they simply required a key to be pressed on a keyboard. Likewise,the temporal demands of each task were similar; to give an answer as quickly as possible.In these cases, ratings of perceived difficulty were similar between tasks, but this wasnot considered a fair reflection of the experience of the participant. Furthermore, initialstatistical analysis of the sub-scales that did differ between tasks showed an identical trendto pooling all of the sub-scales. Thus, it was considered that individual analysis of sub-scalescores offered no additional, useful information.
7.4.1.4 Statistical analysis
Performance in these experiments was measured in terms of accuracy and response time,given that they are a simple method of assessing on-line cognitive processing (Salthouseand Hedden, 2002). For each task, accuracy was calculated as the percentage correct overall ten trials. Mean response times were calculated from all of the responses given over theentirety of trials. In past work, mean response times have been calculated after removingincorrect responses from the data (e.g. Salthouse and Hedden, 2002). However, if incorrectresponses were removed the task difficulty may have essentially been negated, because itis likely that the tasks participants found most difficult would be more likely to producemore errors, but would also have a longer response time (Larsby et al., 2005; Gosselinand Gagné, 2010). As such, removing incorrect trials would discount a large number ofthe most difficult trials for participants, thus impacting on the stability of the estimate ofreaction time.
As a general measurement of perceived task difficulty was sought, NASA-TLX scoreswere summed to give a score across subscales. Shapiro-Wilk tests showed that the datacollected was not normally distributed, and, in the case of Likert scores not continuous,thus non-parametric statistical tests of significance were used to analyse the variables:accuracy, response time and perceived difficulty across different tasks.
Accuracy, reaction time, NASA-TLX, and Likert scale data were submitted to separateFriedman tests in order to investigate significant differences across tasks. Where a significant

CHAPTER 7. AUDITORY TASKS STUDY 191
difference was found, Wilcoxon signed rank tests were used to test each pair of tasks forsignificant differences. These tests were subject to the Bonferroni correction in order toreduce the occurrence of type-I errors (Field, 2013).
7.4.2 Results
7.4.2.1 Objective measures
The mean accuracy rates and response times to each auditory task are shown in Figure 7.1.A Friedman test showed a significant effect of task type on accuracy (χ2(4) = 46.69, p <.001). Further post-hoc comparisons between the accuracies of tasks resulted in statisticallysignificant differences between some tasks (see Table 7.2). Performance of the 0-back was100% accurate across trials, and similarly very few errors were made on the dCMT task,where the mean correct response rate was 98.8%. Accordingly, no statistically significantdifference between accuracy rates on these two tasks was found. Accuracy rates on thetCMT and PASAT were also similar, reaching 93.6% and 95.3% respectively; this differencewas not significant. The most poorly performed task in terms of accuracy was the 2-back,with a correct response rate of 85.6%. This task was performed significantly worse thanany other except tCMT, though the difference in performance between these two tasks didtend towards significance (see Table 7.2). There appeared to be a large degree of variabilityin the accuracy of the tCMT task (S.D. = 10.36%) compared to the PASAT task (S.D.= 5.06%). In some cases, this variability may have led to statistical tests only tendingtowards significance, rather than reaching it at the α = .05 level (e.g. tCMT vs dCMTand tCMT vs 2-back; see Table 7.2).
(a) Accuracy (b) Response time
Figure 7.1 Mean percentage correct scores and response times (± 1 standard error) foreach auditory task.
Clear differences in response times to different auditory tasks are also evident from thedata, with 0-back performed most quickly, followed by dCMT, tCMT, PASAT and 2-backrespectively (see Figure 7.1). Generally, as response time increased, accuracy decreased.This speed/accuracy trade-off was apparent across all tasks except for PASAT which was,on average, slightly more accurately (but more slowly) performed than tCMT.

192 CHAPTER 7. AUDITORY TASKS STUDY
Table 7.2 p-values derived from Wilcoxon signed rank tests for differences in accuracybetween the different task types. Significant results at the α = .05 level (after applying aBonferroni correction) are highlighted (*).
0-back dCMT tCMT PASAT
dCMT .083 N/A N/A N/A
tCMT .004* .013 N/A N/A
PASAT <.001* <.001* .657 N/A
2-back <.001* <.001* .020 .002*
A further Friedman test showed that there was also a significant effect of task type onresponse time data (χ2(4) = 63.42, p < .001). Post-hoc testing showed that the differencesin response times were statistically significant between all tasks except for PASAT vs2-back (see Table 7.3). In terms of the variability in results, 2-back had the most variationin response times (S.D. = 1.23 ms), whereas the other tasks all provided a more stableresponse time across participants (S.D. ≤ 0.60 ms in all cases).
Table 7.3 p-values derived from Wilcoxon signed rank tests for differences in response timebetween the different task types. Significant results at the α = .05 level (after applying aBonferroni correction) are highlighted (*).
0-back dCMT tCMT PASAT
dCMT <.001* N/A N/A N/A
tCMT <.001* <.001* N/A N/A
PASAT <.001* .001* .001* N/A
2-back <.001* <.001* .002* .443
7.4.2.2 Subjective measures
Subjective scores on the difficulty of the chosen tasks were also collected (see Figure 7.2).PASAT was rated as the most demanding task followed in order of decreasing difficultyby 2-back, tCMT, dCMT and 0-back. Friedman tests showed that task type had aneffect on both NASA-TLX (χ2(4) = 66.88, p < .001) and Likert data (χ2(4) = 70.96, p <.001). The differences in post-hoc pairwise comparisons between all tasks were found to besignificant for both NASA-TLX and Likert scores, except for 2-back vs PASAT, thoughthis comparison tended strongly towards significance for both NASA-TLX and Likert data(see Table 7.4 and Table 7.5).
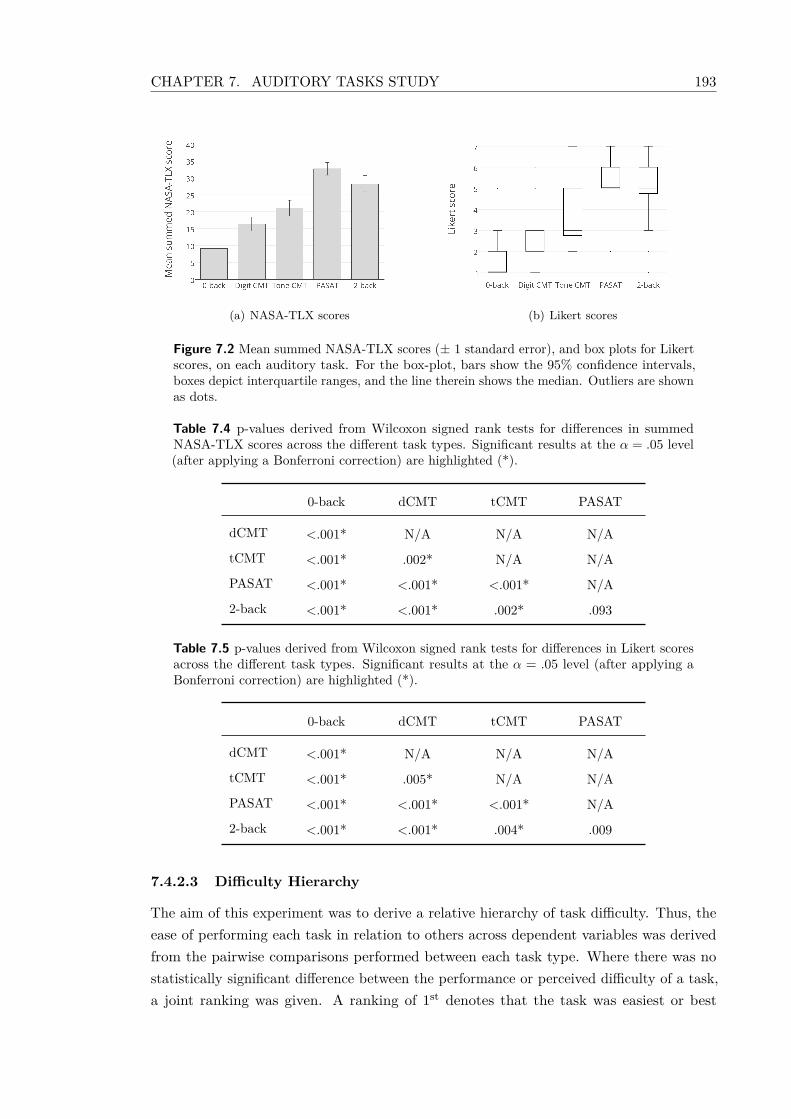
CHAPTER 7. AUDITORY TASKS STUDY 193
(a) NASA-TLX scores (b) Likert scores
Figure 7.2 Mean summed NASA-TLX scores (± 1 standard error), and box plots for Likertscores, on each auditory task. For the box-plot, bars show the 95% confidence intervals,boxes depict interquartile ranges, and the line therein shows the median. Outliers are shownas dots.
Table 7.4 p-values derived from Wilcoxon signed rank tests for differences in summedNASA-TLX scores across the different task types. Significant results at the α = .05 level(after applying a Bonferroni correction) are highlighted (*).
0-back dCMT tCMT PASAT
dCMT <.001* N/A N/A N/A
tCMT <.001* .002* N/A N/A
PASAT <.001* <.001* <.001* N/A
2-back <.001* <.001* .002* .093
Table 7.5 p-values derived from Wilcoxon signed rank tests for differences in Likert scoresacross the different task types. Significant results at the α = .05 level (after applying aBonferroni correction) are highlighted (*).
0-back dCMT tCMT PASAT
dCMT <.001* N/A N/A N/A
tCMT <.001* .005* N/A N/A
PASAT <.001* <.001* <.001* N/A
2-back <.001* <.001* .004* .009
7.4.2.3 Difficulty Hierarchy
The aim of this experiment was to derive a relative hierarchy of task difficulty. Thus, theease of performing each task in relation to others across dependent variables was derivedfrom the pairwise comparisons performed between each task type. Where there was nostatistically significant difference between the performance or perceived difficulty of a task,a joint ranking was given. A ranking of 1st denotes that the task was easiest or best

194 CHAPTER 7. AUDITORY TASKS STUDY
performed, a ranking of 2nd, that the task was second easiest or best performed, and soforth. Table 7.6 shows the ranking of each outcome measure in relation to others.
Table 7.6 The ranking of each task type in relation to others across dependent variables.A ranking of 1st denotes that the task was easiest or best performed.
Accuracy Reaction time NASA-TLX score Likert score Overall
0-back 1st 1st 1st 1st 1st
dCMT 1st 2nd 2nd 2nd 2nd
tCMT 2nd 3rd 3rd 3rd 3rd
PASAT 2nd 4th 4th 4th 4th
2-back 3rd 4th 4th 4th 4th
7.4.3 Discussion
The aim of this experiment was to investigate whether a set of five auditory tasks differedfrom each other in terms of accuracy, response time, and subjective difficulty. This wasundertaken in order to derive a task hierarchy, so that tasks of ‘low’, ‘medium’ and ‘high’difficulty could be identified for further testing in Experiment B, using a SimHL.
In this regard, the study has been successful; given the statistically significant differencesthat have arisen across dependent variables, a general order of task difficulty was established.Despite this, it was not possible to order PASAT and 2-back in terms of their relativedifficulty. Although 2-back was less accurately performed, response times were similarbetween the tasks, and ratings suggested that participants found the PASAT more difficult.Thus it is unclear whether it is PASAT or 2-back which was more challenging. Whilstother tasks are equal in terms of their accuracy (i.e. 0-back vs dCMT; tCMT vs PASAT),the other dependent variables measured follow a clear pattern, showing response timeswhich became slower in line with reports of more task difficulty. This is not the case forPASAT vs 2-back, and so these tasks were considered as being inextricable in terms ofdifficulty. The order of task difficulty generally reflects the hypothesised difficulty of eachtask presented during the methods section of this chapter.
Although analysis of this experiment has allowed for the derivation of a general hierarchyof task difficulty, this does not take in to account intricacies associated with the responsesto each task. A key consideration that has arisen from the results is that some tasksappear much more variable for some dependent variables than do others. A prime exampleof this is the variability shown for accuracy and response time on the 2-back task. Thestandard deviation for these measures appears a lot higher than was noted across themajority of other tasks. This is an important consideration, given that these tasks arebeing considered for application in dual-task experimental paradigms, and thus requirea stable and predictable level of demand. It is this variability which may, in fact, have

CHAPTER 7. AUDITORY TASKS STUDY 195
given rise to the lack of statistical significance between the accuracy rates of tCMT (whichwas also variable) and 2-back, and the reaction times of PASAT and 2-back, despite meandata showing 2-back as the least accurately and most slowly performed task. Another taskwhich appears to show a high degree of variability in outcomes is the tCMT. This task,whilst stable in terms of response time, appears to be variable in terms of its accuracy anddifficulty rating. Thus, like the 2-back, it appears less applicable for dual-task research.
The remaining three tasks (0-back, dCMT, and PASAT) all appear to be stable acrossall dependent variables. In the case of PASAT, this may have been due to the increasednumber of responses that were required for this task. All tasks, except PASAT, requiredonly one participant response per trial (at the end of the stimulus list) leading to a totalnumber of ten responses. In contrast, PASAT involved ten answers per digit list, and meantthat participants were giving one-hundred answers in total for this particular task. Thisgreater number of responses for PASAT may have led to a better estimate of the mean anda smaller standard error. Incorrect responses on the 2-back may have skewed the meanvalue more than they would on the PASAT, as there were fewer responses given overall.Thus it is considered that altering the response paradigm of tasks such that participantshad to give ten answers per trial (and ≈ 100 in total) would allow for a more stablemeasurement of reaction times and accuracy rates.
This argument does not apply to self-reports of difficulty associated with each taskhowever. Each task has an identical amount of data for both NASA-TLX and Likertvariables, though more variability is apparent for tCMT in its Likert scores, suggestingthat participants disagree with each other in terms of how much difficulty they experiencedon this task. One consideration for these self-reports of difficulty, however, is the greaternumber of required answers on PASAT. This may have led participants to feel that theywere exerting more effort in this task. Perhaps if other tasks had incorporated a greaternumber of responses there may have been a feeling amongst participants that they weremore demanding. Thus the case to equate the number of responses required in future workis also considered applicable in this regard.
The purpose of this study was to identify three tasks of ‘low’, ‘medium’, and ‘high’difficulty to take forward to Experiment B. This study has provided a clear hierarchyof task difficulty, which can be used to select tasks fitting this criterion. Taking in toaccount that accuracy and response time was most variable for 2-back, and accuracy andself-reported difficulty was variable for tCMT, these tasks were considered problematic forExperiment B. Stable responses were considered more desirable as they allowed for a moreaccurate comparison across experimental conditions.
The three tasks with least variability were 0-back, dCMT, and PASAT, and thesethree tasks could also be successfully classified as ‘low’, ‘medium’, and ‘high’ difficulty, asthey differed significantly from each other in a hierarchical manner in terms of accuracy,response time, NASA-TLX score, and Likert score. Thus, these were the three tasks whichwere used in Experiment B.

196 CHAPTER 7. AUDITORY TASKS STUDY
7.5 Experiment B
7.5.1 Method
A large proportion of the methodology for Experiment B matched that used in ExperimentA, besides the alterations noted below.
7.5.1.1 Participants
Twenty-seven, young, normally hearing participants (18~/9|, mean age = 21.85 ± 3.47years) were recruited via advertisement at the University of Leeds.
7.5.1.2 Materials
This experiment was designed to assess the effect of SimHL on the performance of threedifferent auditory tasks. Participants were asked to complete the three auditory tasks underthree different listening conditions: (1) no hearing loss, (2) simulated mild hearing loss,and (3) simulated moderate hearing loss. The derivation of these conditions is discussedbelow.
Hearing loss conditions
In driving and hearing loss literature, there is some evidence that the severity of hearingloss is correlated with accident risk (Picard et al., 2008), and that milder degrees of hearingloss do not significantly affect driving ability/safety (Ivers et al., 1999; Hickson et al., 2010).Furthermore, in the experiment investigating the effect of auditory distraction on the UFOVtest described in Chapter 5, the inclusion of a large proportion of those with a mild hearingloss was identified as a potential reason for the lack of statistical significance betweenexperimental groups. This evidence questions the disproportionate effect of hearing losson task performance in those with a mild hearing loss, and suggests that those with amoderate or severe hearing loss might be most affected. However, this hypothesis cannotbe explicitly inferred from past data. Accordingly, in this experiment, a range of hearinglosses were studied to assess whether certain degrees of hearing impairment had an effecton cognitive tasks. These findings would then inform the methodology used in Chapter 8to assesses the effect of SimHL on driving performance.
Research performed in this area has mainly focused on drivers with an age-relatedhearing loss (Ivers et al., 1999; Gilhotra et al., 2001; Unsworth et al., 2007; Hickson et al.,2010; Thorslund et al., 2013a,b,c; Green et al., 2013; Thorslund et al., 2014), and it isthrough this work that a disproportionate effect of auditory distraction on driving skillshas been suggested. Furthermore, recruitment for prior experiments described in thisthesis resulted in older samples (see Chapter 4 and Chapter 5), even though this particulardemographic was not purposively sought.

CHAPTER 7. AUDITORY TASKS STUDY 197
Accordingly, the configurations of hearing loss studied were selected to reflect age-relatedhearing loss (Gates and Mills, 2005). As the method of SimHL used cannot accuratelyemulate hearing loss of a severe or profound nature, only mild and moderate hearingloss conditions were tested. Although these two conditions had to represent ecologicallyvalid degrees of hearing loss, there also had to be a clear distinction between the two, sothat a continuum of hearing loss severity could be studied. Levels of SimHL were basedon an epidemiological study of hearing thresholds in the older population (Cruickshankset al., 1998). The data presented by Cruickshanks et al. (1998) details the mean absolutethresholds (with standard deviation) measured in a large sample (n = 3,753) of malesand females for different age groups: 48–59 years, 60–69 years, 70–79 years, and 80–92years. This allowed for the derivation of a range within which hearing thresholds arelikely to fall for individuals aged 48–92 years (see Figure 7.3). The range is reflective ofage-related hearing loss, exhibiting a greater reduction in hearing thresholds, and, mostlikely, corresponding widening of auditory filters, at higher frequencies.
Figure 7.3 The range within which absolute hearing thresholds are likely to fall for in-dividuals aged 48–92 years, according to data produced by Cruickshanks et al. (1998).Superimposed are the three audiograms used to simulate hearing loss for the listeningconditions (no hearing loss, mild hearing loss, and moderate hearing loss).
The levels of hearing loss chosen for simulation attempted to replicate this reductionin high-frequency thresholds, as well as reflecting thresholds which spanned the entireidentified range. The resulting audiograms which were simulated are superimposed overthis range in Figure 7.3. The no hearing loss (control) condition does not reflect thisreduction in thresholds at higher frequencies, because this condition was used to evaluatethe performance of tasks without any influence of the SimHL. Thus the control condition

198 CHAPTER 7. AUDITORY TASKS STUDY
was set to a flat 0 dB hearing loss, so that no DSP would be applied to the stimuli.Audio files of individual digits were processed using the method described in Chapter 6
at an input level of 60 dB (reflecting the level at which they would be presented - a normallevel of conversational speech; Skinner et al., 1997). These variables were used to providedigit lists for the SimHL experimental conditions.
Auditory tasks
Three of the tasks studied in Experiment A were used in this second experiment: 0-back,dCMT, and PASAT. However, some minor changes to task response parameters were made.Results from Experiment A showed that differences in the number of responses betweentasks may have led to an increased perception of workload, and an increase in the spread ofdependent variables (e.g. accuracy and response time). Accordingly, increasing the numberof participant responses during each task, was considered to have the benefit of providinga more stable estimate of accuracy and response time data. It also helped to equate thenumber of responses given, such that participants were not experiencing a difference inperceived difficulty simply as a result differences of the response requirements from differenttasks. Thus 0-back and dCMT were adapted in the following manner:
0-back required participants to respond after every digit presentation, for example:
Stimulus: 8 7 1 4Correct response: 8 7 1 4
dCMT required participants to respond each time they heard a target digit, by ‘countingalong’ with the stimulus list using the keyboard number pad (i.e. after the first occurrencepress one, after the second occurrence press 2 etc). For example:
Target digit: 4
Stimulus: 8 4 7 4 9 4Correct response: 1 2 3
These alterations were not considered likely to alter the task difficulty that had beenestablished during Experiment A, as the hypothesised reason for their difficulty was notmanipulated. 0-back still required only the most recent digit to be held in memory, it justrequired a response to be made more often than previously. dCMT also remained a similartask - the amount of information held in memory was still the same; participants stillhad to remember the target digit and the number of times that it had already occurred.Furthermore, it was previously discussed that interference between these two pieces of

CHAPTER 7. AUDITORY TASKS STUDY 199
information may lead to disruption in rehearsal processes, causing confusion between thetarget digit and number of target occurrences. Even after the task response manipulation,this possibility would still be present.
7.5.2 Results
7.5.2.1 Baseline task performance
The mean accuracy rates for tasks under each auditory condition are shown in Figure 7.4.A Friedman test again showed an effect of task type on accuracy (χ2(2) = 33.78, p <.001). Post-hoc comparisons exhibited that under normally hearing (control) conditions,as in Experiment A, there was no difference in accuracy between the 0-back and dCMT,although the comparison did tend towards significance (p = .057). The PASAT was, again,less accurately performed than the 0-back (p = < .001) and the dCMT (p = < .001).
(a) Accuracy (b) Response time
Figure 7.4 Mean percent correct scores and response times (± 1 standard error) to eachauditory task under each listening condition.
A Friedman test also showed that reaction times differed between the tasks (χ2(2) =48.67, p < .001). In Experiment A, the dCMT was performed significantly slower thanthe 0-back, but the opposite trend was found in this experiment; with the dCMT beingperformed faster than the 0-back (p < .001). PASAT was performed significantly slowerthan the other two tasks (p < .001 in both cases).
Friedman tests showed that self-reported difficulty differed between auditory tasks forboth Likert (χ2(2) = 46.54, p < .001) and NASA-TLX (χ2(2) = 37.85, p < .001) data.Post-hoc comparisons showed that PASAT was perceived as the most difficult task byparticipants, rated as harder than both the 0-back (p < .001) and dCMT (p <.001) onboth NASA-TLX and Likert scores. dCMT was also, again, rated as being more difficultthan the 0-back for both NASA-TLX (p = .004) and Likert (p = .001) data. Thus, underbaseline (normally hearing) conditions, the task rankings (derived in the same manner asExperiment A) are shown in Table 7.7.

200 CHAPTER 7. AUDITORY TASKS STUDY
Table 7.7 The ranking of each task type in relation to others across dependent variables.A ranking of 1st denotes that the task was easiest or best performed.
Accuracy Reaction time NASA-TLX score Likert score Overall
0-back 1st 2nd 1st 1st 1st
dCMT 1st 1st 2nd 2nd 1st
PASAT 2nd 3rd 3rd 3rd 2nd
7.5.2.2 Effect of SimHL on performance
Objective measures
Comparisons between the objective dependent variables were made within tasks betweenauditory conditions. Friedman tests showed a significant effect of auditory condition onthe accuracy of the 0-back (χ2(2) = 69.88, p < .001) and PASAT (χ2(2) = 24.804, p <.001), whereas the differences in dCMT accuracy as a result of auditory condition onlytended towards significance (χ2(2) = 5.494, p = .064). Post-hoc pairwise comparisonsusing Wilcoxon signed rank tests and the Bonferroni correction exhibited that it was thescores under moderate hearing loss conditions that were responsible for these significantand near-significant results; there were no significant differences between the scores in thenormal hearing and mild hearing loss conditions (see Table 7.8). Indeed, for each task thegreatest reduction in accuracy occurred when the task was performed under a simulatedmoderate hearing loss, and there was no effect of simulated mild hearing loss on any of thethree tasks (see Figure 7.4).
The reduction in accuracy is most clearly shown in the case of PASAT, where theaccuracy rate under the moderate hearing loss condition is 84%, as opposed to 95% inboth the no hearing loss and mild hearing loss conditions. For the 0-back task, accuracywas 97% in the moderate hearing loss condition vs 100% in the no hearing loss and mild
Table 7.8 p-values derived from Wilcoxon signed rank tests on the accuracy and responsetime measures made in this experiment. Significant differences, after using the Bonferronicorrection, are highlighted (*).
0-back dCMT PASAT
Accuracy
No hearing loss vs mild hearing loss .232 .357 .896No hearing loss vs moderate hearing loss <.001* .026* <.001*Mild hearing loss vs moderate hearing loss <.001* .043 <.001*
Response time
No hearing loss vs mild hearing loss .614 .313 .631No hearing loss vs moderate hearing loss <.001* <.001* <.001*Mild hearing loss vs moderate hearing loss .002* .010* <.001*

CHAPTER 7. AUDITORY TASKS STUDY 201
hearing loss conditions, and on dCMT the accuracy rate was 97% compared to 99% in theother two auditory conditions.
In order to establish which tasks were most associated with the biggest effect of SimHL,the calculation of effect sizes for each pairwise comparison was considered. However, thereappeared to be a ceiling effect under baseline conditions for accuracy on the 0-back anddCMT tasks (99.5% and 99.0% respectively), both of these tasks showed very little variationunder baseline conditions (S.D. of 0.75% and 1.57% respectively). This is in contrast tobaseline data for PASAT, which was less accurate (95%) and more variable (S.D. = 6.87%).As such, effect size data may be misreprasentative, as these ceiling effects may have reducedstandard deviation under baseline conditions. Accordingly, the effect size of SimHL acrosstasks was analysed by inspecting the individual raw difference in accuracy between nohearing loss and moderate hearing loss conditions.
A Friedman test on the individual raw difference scores in accuracy between normalhearing and moderate hearing loss suggested that there was a significant difference betweentask types (χ2(2) = 15.61, p < .001). Post-hoc pairwise comparisons using Wilcoxon Signedrank tests exhibited that this was because of the difference in accuracy reductions as aresult of SimHL on PASAT, but not the 0-back or dCMT (see Table 7.9). This suggeststhat the reduction in performance as a result of moderate hearing loss is significantlygreater on the PASAT task than either of the other two tasks studied.
Comparisons were also made for response times across the three auditory conditions(see Figure 7.4). The longest response time in each task occurred under conditions ofmoderate hearing loss, and there is little difference between response times recorded in thenormal hearing and mild hearing loss conditions. Friedman tests showed that significantdifferences in the reaction times to PASAT (χ2(2) = 18.07, p < .001), 0-back (χ2(2) =14.00, p = .001) and dCMT (χ2(2) = 21.63, p < .001) occurred as a result of auditory taskcondition. Post-hoc pairwise comparisons using Wilcoxon signed rank tests showed thatthese differences occurred as a result of the increase in reaction time brought about bysimulated moderate hearing loss. Again there were no differences in reaction time broughtabout as a result of mild hearing loss (see Table 7.8).
Although there is a significant difference between response times recorded in themoderate hearing loss and the other two auditory conditions across all task types, there
Table 7.9 p-values derived from Wilcoxon signed rank tests on the individual differencesbetween the normal hearing and moderate hearing loss conditions for accuracy and responsetime measures made in this experiment. Significant differences, after using the Bonferronicorrection, are highlighted (*).
0-back vsdCMT
0-back vsPASAT
dCMT vsPASAT
Accuracy .071 .004* .001*Response time .072 .034 .010*

202 CHAPTER 7. AUDITORY TASKS STUDY
appears to be a greater effect for the PASAT, compared to the other two tasks. Althoughcalculated effect sizes reflect PASAT (r = .67) as being more affected by moderate hearingloss than 0-back (r =.58) or dCMT (r =.49), these estimates may, again inflate effect sizefor the 0-back and dCMT, given their small degree of variation under normal hearingconditions (S.D. of .06 ms and .04 ms respectively) in comparison to PASAT (S.D. = .17ms). This difference in variation was also apparent for the moderate hearing loss conditionin which standard deviations were, again, smaller for 0-back and dCMT (.06 ms and .05ms respectively) than they were for PASAT (.23 ms). Accordingly the same approach toanalysing the effect of moderate hearing loss across task types was taken for reaction timedata as was used for accuracy data.
Individual raw difference values between the no hearing loss and moderate hearing lossconditions were calculated for interpretation. Pairwise comparisons highlighted that theeffect of moderate hearing loss on the reaction times to PASAT was significantly greaterthan on the dCMT, and the comparison between PASAT and 0-back tended towardssignificance (see Table 7.9). This suggests that decrements to reaction times as a result ofmoderate hearing loss are also the greatest on the PASAT task.
Subjective measures
The mean overall summed NASA-TLX scores are shown in Figure 7.5. Comparisons weremade between auditory conditions within each individual task for NASA-TLX and Likertscores. Friedman tests showed that alterations in the perception of task difficulty, asmeasured using the NASA-TLX, occurred as a result of auditory condition for dCMT(χ2(2) = 11.06, p = .003), 0-back (χ2(2) = 29.15, p < .001), and PASAT (χ2(2) = 7.15,p = .028). Likewise, Likert scores also showed a significant alteration in the perceptionof task difficulty as a result of auditory condition for 0-back (χ2(2) = 30.91, p < .001)and dCMT (χ2(2) = 11.62, p = .003). However, no such difference was found when usingLikert score as the metric for perceived difficulty of PASAT (χ2(2) = 4.03, p = .133).
Post-hoc pairwise comparisons with Wilcoxon signed-rank tests showed that thesesignificant differences occurred as a result of the perceived difficulty in the moderatehearing loss condition (see Table 7.10). When using NASA-TLX score as the metric forperceived difficulty, the performance of each task with a moderate SimHL significantlyincreased the perception of task difficulty over and above that experienced with no hearingloss. Moderate hearing loss also significantly raised the perceived difficulty of taskscompared to mild hearing loss, although this trend only tended towards significance forPASAT. In line with the objective measurements, NASA-TLX results suggested that mildhearing loss did not significantly raise the difficulty of any given task above that experiencedunder the control condition of no hearing loss.
Box plots of the Likert scores are shown in Figure 7.5. The plots exhibit an increase inperceived difficulty during the moderate hearing loss condition compared to the mild andno hearing loss conditions for 0-back and dCMT. Indeed, for these two task types, median

CHAPTER 7. AUDITORY TASKS STUDY 203
(a) NASA-TLX scores (b) Likert scores
Figure 7.5 Mean summed NASA-TLX scores (± 1 standard error), and box-plots for Likertscores, on each auditory task under each auditory condition. For the box-plot, Bars showthe 95% confidence intervals, boxes depict interquartile ranges, and the line therein showsthe median. Outliers are shown as dots.
Table 7.10 p-values derived from Wilcoxon signed rank tests on the NASA-TLX and Likertself-report measures of task difficulty made in this experiment. Significant differences, afterusing the Bonferroni correction, are highlighted (*).
0-back dCMT PASAT
NASA-TLX
No hearing loss vs mild hearing loss .764 .875 .167No hearing loss vs moderate hearing loss <.001* .017* .003*Mild hearing loss vs moderate hearing loss <.001* .005* .042
Likert score
No hearing loss vs mild hearing loss .567 .658 .559No hearing loss vs moderate hearing loss <.001* .076 .244Mild hearing loss vs moderate hearing loss <.001* .001* .077
values for the mild and no hearing loss conditions were comparable (0-back median = 1;dCMT median = 2), and increased for the moderate hearing loss condition (0-back median= 2 dCMT median = 3). This is not the case for PASAT which had a stable median (5)across all of the auditory conditions in this experiment. However, Likert scores suggest thatthe perception of difficulty associated with PASAT became more variable in the moderatehearing loss condition. This was not the case for any of the other tasks, suggesting thatthe performance of this task in the moderate hearing loss condition was more troublesomefor some participants than others.
Post-hoc pairwise comparisons using Wilcoxon signed-rank tests were used to establishany significant differences in the Likert scores of auditory conditions for each individual task.There were no significant differences in the perception of difficulty between normal hearingand moderate hearing loss conditions for PASAT (p = .244) or dCMT (p = .076). However,the significant difference between these two auditory conditions on 0-back remained (p <.001), and the difference in the perception of difficulty between mild and moderate hearing

204 CHAPTER 7. AUDITORY TASKS STUDY
loss conditions remained for 0-back (p < .001) and dCMT (p < .001). The differencebetween mild and moderate hearing loss conditions was also absent for PASAT (p = .077).
The magnitude of the increased perception of difficulty as a result of hearing loss wasalso analysed for each task, in order to investigate whether there was a difference acrossdifferent tasks. Again, the calculation of effect size was not considered applicable, giventhat there was a floor effect on the 0-back task, whereby the majority of participantsconsistently rated this task as very easy under no hearing loss conditions, resulting in avery low degree of variability for both NASA-TLX and Likert data. Accordingly analysison the raw difference values between the moderate and no hearing loss conditions wascarried out. However, Friedman tests showed that there were no significant differencesin these raw difference values across task type for either NASA-TLX (χ2(2) = 2.89, p =.236) or Likert (χ2(2) = 3.89, p = .143) data. This suggests that the increase in perceiveddifficulty as a result of moderate hearing loss is stable across tasks of varying difficulty.
7.5.3 Discussion
Experiment B assessed the effect of different degrees of SimHL on auditory tasks of varieddifficulty. This information was considered valuable in predicting the effect that differenttypes of auditory task might have on the performance of driving in the hearing impaireddemographic. In order to establish the effect of hearing loss across task difficulties, itwas first necessary to evaluate whether the previously noted hierarchy in task difficultyremained in this study.
7.5.3.1 Baseline task performance
In this experiment, the original hierarchy of task difficulty was not replicated completely.However, as was the case in Experiment A, the accuracy of PASAT was the lowest ofthe three tasks studied, its response times were longest, and its perceived difficulty washighest for both NASA-TLX and Likert scores. This task was, therefore, still considered asreflecting the highest degree of difficulty. The relationship of dependent variables betweenthe 0-back and dCMT largely remained the same, with a difference between accuracy rateswhich tended towards significance, and a significantly higher perception of difficulty forthe dCMT across NASA-TLX and Likert data. However, an alteration in the ranking ofresponse times was noted, whereby the 0-back was performed more slowly than dCMT;whereas the opposite had been true in Experiment A. The most likely reason for this wasthe alteration in response paradigm between Experiment A and Experiment B for thesetwo tasks.
A plausible explanation is as follows: Experiment A highlighted that a responseparadigm incorporating more responses was preferable in providing a more stable estimateof mean values, and to make perceived demands more comparable between different tasks.Accordingly, the 0-back and dCMT were adapted so that participants had to respond

CHAPTER 7. AUDITORY TASKS STUDY 205
throughout the stimulus list. Responses were made on the number pad of a computerkeyboard, and as such a fraction of the response time measured consisted of the physicalresponse (pressing a key). In the case of the 0-back, the exact response was not known inadvance; it depended upon the random digit which was presented. Accordingly, once a digitwas heard, the participant may have moved his/her finger to the relevant key, and pressed.However, for the dCMT the specific response was known in advance; participants wererequired to ‘count along’ the number of targets which they heard, thus all answers wereconsecutive, ascending numbers. Therefore, it is possible that participants had alreadymoved their finger to the relevant key to provide their next response, allowing for shorterresponse times compared to 0-back.
Therefore, it is considered that the difference in response times to dCMT betweenExperiments A and B were not as a result of a reduction in task difficulty. Regardless,because of the inconsistencies in the ranking of 0-back and dCMT across dependentvariables, it was not considered possible to state whether 0-back or dCMT was the moredifficult task in Experiment B. Thus, the effect of SimHL can only be considered in termsof its effect on two levels of task difficulty: 0-back/dCMT vs PASAT.
7.5.3.2 Differences in task performance as a result of SimHL
Objective measures showed that moderate SimHL significantly increased the difficulty ofall three tasks over and above that experienced when the same tasks were undertaken witha mild SimHL or normal hearing. Mild SimHL does not appear to show any difference interms of performance when compared against normal hearing. This suggests that moderatehearing loss has the capacity to affect auditory task performance, and could therefore havea disproportionate impact on other concurrently performed tasks, such as driving. Thisdoes not appear to be a consideration for mild hearing loss, which had little bearing onauditory task performance. However, these results were obtained in single task conditions,and it might be that more challenging dual-task conditions reveal performance costs formild hearing loss as well.
It is argued that an effect of moderate hearing loss on auditory task performance wasnot simply due to an inability to hear or understand auditory stimuli in the moderatehearing loss condition. An accuracy rate of 97% was recorded for the moderate hearing losscondition of the 0-back task, which required participants to simply shadow the stimulusdigit list. This would suggest that, on average, at least 97% of the stimuli were at anaudible level for participants and without excess distortion causing unintelligibility. Thusit is argued that the performance decrements noted were most likely associated with anincrease in the effort exerted to understand the aurally presented numbers.
The results of this experiment mirror those of past work using participants with a‘real’ hearing loss (Rabbitt, 1991; McCoy et al., 2005). However, this experiment used aSimHL, suggesting that the peripheral representation of a sound source is, at least in part,responsible for an increase in the listening effort requirements on auditory tasks. The ability

206 CHAPTER 7. AUDITORY TASKS STUDY
to separate the effect of peripheral hearing loss from other co-existing factors on drivinghas been questioned in this thesis. However, this experiment has removed the influenceof co-existing factors, and as such suggests that simulated psychoacoustic phenomenaassociated with SNHL (i.e. threshold elevation, loudness recruitment, and reduced frequencyselectivity) have the potential to engage cognitive resources to a disproportionate extent,potentially impacting on other concurrent tasks (e.g. driving).
The fact that only an effect of moderate hearing loss on task performance was foundin this experiment is of practical importance, as it suggests that mild hearing loss maynot be problematic in terms of its effect on listening effort and, thus, other concurrentlyperformed operations. This finding has been replicated by Rabbitt (1991), who found adisproportionate effect of hearing loss on encoding operations for participants with averagehearing thresholds of 35–50 dB HL, a level close to the criteria used in this study to classifymoderate hearing impairment (≥ 40 dB HL; British Society of Audiology, 2011). However,(McCoy et al., 2005) found that hearing losses of 25 dB HL and greater were associated withprocessing decrements, which questions Rabbitt (1991) and the results of this experiment.
This discrepancy may have been due to the differences in the manners by which hearingloss was classified. McCoy et al. (2005) measured hearing impairment by taking the meanthreshold at three discreet frequencies (1, 2 and 4 kHz), whereas Rabbitt (1991) took anaverage over the frequency range 300–10,000 Hz. This extended higher frequency range inthe study of Rabbitt (1991) is likely to have incorporated thresholds which were raised toa greater extent than those at mid- and low-range frequencies (Gates and Mills, 2005), andthus may have positively skewed the average thresholds of participants who had milderhearing losses at the frequencies used by McCoy et al. (2005).
However, the frequencies used to calculate hearing loss severity in this study (the meanof thresholds at 500, 1000, 2000 and 4000 Hz; as per the British Society of Audiology,2011) are comparable to those used by (McCoy et al., 2005). The argument for using thesediscreet frequencies is that they are considered highly important for speech recognition(Humes, 1996). Therefore, the difference in outcomes between this experiment and thework of McCoy et al. (2005) might be explained by the sensory-cognitive interaction theory(Baldwin, 2002).
Baldwin and Ash (2011) showed that whilst younger adults were affected by a reductionin stimulus presentation level, older adults were affected to a greater extent. This ledthem to conclude that peripheral and central issues impact speech understanding in olderadults; because working memory skills are reduced in this demographic, they are less ableto compensate for reductions in the clarity of auditory stimulation. Thus there appears tobe a synergistic effect of age and hearing loss on the performance of auditory cognitivetasks.
McCoy et al. (2005) studied an older sample than was used in this experiment (meanage 72.9 years vs 21.9 years). Therefore, according to the theory discussed by Baldwin(2002), McCoy et al.’s (2005) sample were less equipped to compensate for a reduction in

CHAPTER 7. AUDITORY TASKS STUDY 207
stimulus presentation level. Baldwin and Ash (2011) found a linear decrease in performanceas presentation level decreased (in increments of 5 dB), but also that effect size of reducingpresentation level was much greater in their older sample. Thus it is argued that evensmall reductions in the presentation level of stimuli may have a profound effect on theperformance of the older demographic, hence supporting the finding of McCoy et al. (2005)that their older mildly hearing impaired sample showed a significant reduction in auditorytask performance. However, in the current study the effect of mild hearing loss wasnegligible, it was only once the SimHL reached a greater level (moderate hearing loss) thatthe younger sample started to exhibit auditory task decrements.
The difficulty of the auditory task had a bearing on the effect size of simulated moderatehearing loss, such that the most difficult task suffered from a greater reduction in accuracyand increase in reaction time as a result of SimHL than did any of the other tasks studied.No such distinction was apparent between the two other tasks (0-back and target digit).This suggests that SimHL may have an effect on all auditory-based tasks, but that themost difficult auditory tasks are disproportionately affected by hearing losses of a moderatenature. Participants also reported perceiving a greater degree of difficulty whilst underconditions of moderate SimHL. However, this increase in difficulty did not appear to differacross tasks. This suggests that, although performance decrements as a result of hearing lossare tied to the difficulty of auditory tasks, this is not apparent to participants themselves.It should be noted, however, that an inability to successfully perform introspection as tothe demand of certain tasks was raised in Chapter 4. The finding here that self-reports ofdifficulty to not entirely corroborate the increase of demand associated with a moderatehearing loss validates the decision to use more objective methodologies further.
7.6 Study direction and limitations
Though the SimHL used in this experiment has differentiated the effect of peripheralhearing loss, some thought should still be given to the complications that co-existingfactors might present. No comparison was made between young and older participants, asit was not the aim of this experiment, thus the influence of a sensory-cognitive interaction(Baldwin, 2002) across task difficulties cannot be derived from this experiment. This wouldbe of interest in quantifying the extent to which hearing loss and co-existing factors eachaffect task performance. This is an important consideration because the combination ofthese two factors is a true reflection for the majority of hearing impaired drivers, who areolder.
Furthermore, whilst the study has used two varied levels of SimHL they are bothreflective of a single type of hearing loss. It would have been of interest to examine theeffect of a more severe level of hearing loss in order to establish whether the effect size ofauditory task degradation increases with the severity of hearing loss. However, this wasnot possible given that the method of hearing loss simulation cannot accurately emulate

208 CHAPTER 7. AUDITORY TASKS STUDY
hearing loss levels of ≥ 90 dB. Furthermore, the investigation of different configurations ofhearing loss would also have been of interest (e.g. a noise-induced hearing loss, given thefindings of Barreto et al., 1997 and Picard et al., 2008).
The purpose of this study was to establish how SimHL affected the performance ofauditory tasks in order to predict how their performance might impact on driving. Whilstan effect of hearing loss on task performance has been shown, the experiment has notassessed how these tasks are performed as part of a dual-task paradigm. Thus, it is unclearwhether there will be any extraneous effect of performing these tasks in a SimHL conditionwhilst dual-tasking. However, it might be argued that single-task performance should beeasier than dual-task performance as it does not incorporate any extraneous processingdemands or the coordination of resources. Accordingly, the increased difficulty of thesetasks as a result of hearing loss may be exacerbated when under dual-task conditions, aswell as reducing the performance of the concurrent task.
The experiment described in the following chapter investigated the effect of theseauditory tasks in a dual-task paradigm; specifically whilst driving. Indeed it was thepurpose of this study to establish the effect of different degrees of SimHL on these tasks tobe able to predict the influence they might have on driving performance; thus the resultswere used to inform the experimental design. Because no effect of mild hearing loss on theperformance of auditory tasks was found in the current experiment, it was hypothesisedthat listening effort demands associated with this level of hearing loss would not be raisedsufficiently to result in dual-task decrements in young participants. Moderate hearing loss,on the other hand, appeared to require a greater degree of explicit processing comparedto a no hearing loss condition. As such, moderate hearing loss was selected as the onlyalternative auditory condition in the study described in Chapter 8.
The next study also required the employment of two tasks, distinct in their demands.The decision was to use the dCMT and PASAT. PASAT was chosen, because it was clearlya more difficult task than the other two used in Experiment B. The decision between 0-backand dCMT was, however, more problematic. Task response metrics were considered to beslightly in favour of dCMT. Although dCMT showed a very high degree of accuracy and alow level of self-reported difficulty, it did not exhibit the strong ceiling and floor effects (onaccuracy and self-reported difficulty, respectively) that 0-back did under the no hearingloss condition in both Experiments A and B. It was considered that floor and ceiling effectsmay be problematic for statistical testing performed on 0-back, given that baseline datawould exhibit little to no variability, potentially inflating effect sizes. In addition to thisreasoning, dCMT has been used during past driver safety research, albeit in a differentformat, and affected certain driving outcomes (Jamson and Merat, 2005; Engström et al.,2005b).
Accordingly, in order to investigate the effect of a concurrent auditory task on drivingperformance in the presence of a SimHL, dCMT and PASAT were chosen as two tasksof distinct (low and high) difficulty, and the moderate hearing loss condition was chosen

CHAPTER 7. AUDITORY TASKS STUDY 209
as the only listening condition (besides a control), given that a SimHL of this degree isthought to be required in order to raise listening effort demands.
7.7 Conclusions
The aim of this two-part study was to establish a hierarchy of difficulty for a set of auditorytasks, and to then investigate how different levels of SimHL affected the performance of aselection of these tasks. This was undertaken in order to identify tasks for application in adriving simulator study assessing the effect of auditory task engagement on driving, andwhether a disproportionate effect of SimHL was apparent.
Experiment A identified a hierarchy of difficulty in five auditory tasks, and allowed tasksof low-, medium- and high- difficulty forward to Experiment B. Experiment B assessedthe effect of simulating two levels of hearing loss on the performance of the selected tasks.Simulated moderate hearing loss significantly reduced the accuracies, and increased theresponse times and perceived difficulties of each task tested. Furthermore, the negativeeffect of moderate hearing loss on task performance was greater for more difficult tasks.Conversely, simulated mild hearing loss showed no effects on task performance.
Given that a SimHL was used in this study, the source of this performance decrement islikely to be the degradation in the perceptual representation of sound stimuli, rather thanany other age-related confound. This is something which has been queried in prior discourse.This finding has important ramifications in terms of how peripheral hearing loss mightaffect performance in more ecologically valid situations. Performance on more challengingeveryday tasks is likely to be less accurate and slower for people with a moderate SNHL,and it is also likely to be perceived as more difficult by that individual. Furthermore, if atask is being performed concurrently with another, moderate hearing loss is likely to causea disproportionate disruption on one, or both tasks. In the context of this thesis, this maymean that the performance of an auditory task whilst driving is an unsafe practice forthose with a moderate hearing impairment.
To this end, the final experiment described in this thesis will investigate the effect ofsimulated moderate hearing loss on driving performance in the presence of auditory tasksof differing difficulty. The current two part experiment has identified that this level ofhearing loss is most likely to cause disturbances to driving under this condition, it hasalso identified two suitable auditory tasks for use in the following experiment (dCMT andPASAT).


Chapter 8
The Effect of Simulated HearingLoss on the Performance ofAurally Presented Cognitive Taskswhilst Driving
8.1 Introduction
The majority of work reported in this thesis has focused on the potential for hearingimpairment to cause issues for driving whilst under conditions of auditory task engagement.It has done so using self-reported data (see Chapter 4) or abstract experimental paradigmsinvestigating effects of hearing loss on task performance (see Chapter 5 and Chapter 7).Now that a valid method of differentiating peripheral hearing loss from other co-existingfactors has been identified (see Chapter 6), this study will investigate the effect of peripheralhearing loss on driving in a more ecologically valid manner, by applying an experimentalparadigm in a high-fidelity driving simulator.
Research suggests that a greater perceptual effort associated with listening to anauditory signal in the hearing impaired presents a dual-task cost for skills relevant todriving (Hickson et al., 2010). This argument has been explained in the context of anELU model, which proposes that a more explicit processing strategy will be employedwhen an auditory signal is mismatched with phonological representations in long-termmemory; something which is likely to happen more often in hearing impaired individuals(see Chapter 3). This explicit processing strategy is derived from a structure similar tothe central executive described in Baddeley’s Working Memory model (1974), which isresponsible for attention switching between the visuospatial sketchpad and phonologicalloop. Thus it was reasoned that attention switching would be less efficient in those with ahearing loss, as a result of a disproportionate strain on the central executive. This wouldthen be problematic for hearing impaired drivers in a dual-task set-up, when driving is
211

212 CHAPTER 8. DRIVING SIMULATOR STUDY
concurrent with an auditory task (see Chapter 2).
Data from the study reported in Chapter 7 suggests that SimHL does, indeed, reduceperformance on auditory tasks. Therefore, it is likely that tasks performed under SimHLconditions would have more of an effect on driving than those which are performed undernormally hearing conditions. This is proposed to arise (at least in part) as a result ofperipheral distortion to a sound source. The assumption that this disruption is due tothe peripheral representation of a sound source is important because it is unclear how,and to what extent, factors co-existing with hearing impairment might affect cognitiveperformance (see e.g. Baldwin, 2002). This idea was considered particularly pertinent giventhere was a significant difference in the reading span of hearing impaired and normallyhearing individuals in Chapter 5, thus suggesting that the two groups have a baselinedifference in some Working Memory abilities.
Further to this, previously described findings of Thorslund et al. (2013a,b, 2014) suggestthat a behavioural adaptation to driving takes place over time as a result of hearingloss. It is, therefore, unclear whether behavioural changes may have been one of theseco-existing factors responsible for previously reported results investigating the effect ofauditory distraction on driving behaviour (e.g. Hickson et al., 2010).
The interaction between auditory distraction and adaptive driving behaviour in thehearing impaired demographic, and their effect on driving performance is likely to becomplex. Medeiros-Ward et al. (2014) propose that driving is coordinated by a hierarchicalcontrol network. In line with Fodor (1983), they argue that automatic, encapsulatedaspects of driving operate outside of awareness, whereas processes under attentional controlare easily brought in to conscious awareness. Medeiros-Ward et al. (2014) suggest that, asmore attention is allocated to attentional control tasks, their performance will increase.On the other hand, when more attention is allocated to automatic, encapsulated tasks,their performance will actually decrease. Thus the authors argue that auditory taskengagement whilst driving will lead to some performance decrements, whilst “improving”other aspects of driving. This theory explains past experimental findings which haveexhibited a degradation in certain aspects of driving whilst concurrent demanding auditorytasks are performed. For example, longer reaction times to critical events (Lamble et al.,1999; Strayer et al., 2003), but an ‘improvement’ in lane keeping (Brookhuis et al., 1991;Jamson and Merat, 2005; Engström et al., 2005b). This is explained because steeringis considered an automated aspect of driving (Michon, 1985), and as such is will notbe affected by the diversion of cognitive resources to the secondary task. However, analternative explanation, backed by a considerable literature, is that gaze concentration tothe road centre is increased by extraneous cognitive load (e.g. Nunes and Recarte, 2002;Engström et al., 2005b; Jamson and Merat, 2005; Victor et al., 2005; Harbluk et al., 2007),and as drivers ‘steer where they look’ (Wilkie et al., 2010), this naturally leads to animprovement in peoples’ propensity for steady lane-keeping.
Because hearing loss increases the degree of workload required to perform an auditory

CHAPTER 8. DRIVING SIMULATOR STUDY 213
task (Rabbitt, 1991), it is hypothesised that performing a difficult auditory task duringdriving will exacerbate the decrement in attentionally-controlled aspects of driving, such asreactions to critical events, whilst leading to a further ‘improvement’ of the encapsulatedaspects, such as lateral vehicle control. The current experiment, therefore, investigatedthis hypothesis by asking participants to perform two auditory tasks (the dCMT andPASAT) whilst completing a short drive in the UoLDS. To assess the effect of hearingloss on driving performance, in this dual-task setting the two tasks were presented eitherat normal hearing levels or a simulated moderate hearing loss condition. As outlined inChapter 7, these two auditory tasks imposed different levels of cognitive demand, and thesimulated moderate hearing loss provided a listening condition which increased cognitiveworkload. Thus the effect of hearing loss on driving performance in the presence of anauditory task could be evaluated for auditory tasks of varied difficulties.
To assess whether SimHL raises the cognitive workload of drivers over and above thatduring normally hearing conditions, a visual version of the Detection Response Task (DRT)was also incorporated at designated sections in the experiment. The DRT is described inthe next section.
8.1.1 The DRT
The DRT has evolved from a measure known as the Peripheral Detection Task (PDT),which was based on original work carried out by Miura (1986), and was more formallydeveloped by van Winsum et al. (1999). The DRT is regarded as a promising measure ofcognitive load and its effects on attentional control and functions (McGehee, 2014). It hasbeen developed primarily to assess the demands associated with specific secondary tasks inthe driving domain. The DRT involves the repeated presentation of a single stimulus whichrecurs with temporal uncertainty, requiring a response via a button attached to the indexfinger (see Figure 8.1). The stimulus presented is either visual (an LED), sound-based, ortactile (McGehee, 2014; see Figure 8.1). Each stimulus presentation has an epoch withinwhich a response must be given, or a missed response is recorded and the DRT continueswith the presentation of the following stimulus. The DRT can, therefore, produce data on‘hit rate’ and response time and is analysed on these two measures under the premise thatthe greater the level of cognitive load, the longer the response time and the lower the hitrate.
The DRT is currently being developed by a working group with a view to present anISO standard regarding its presentation and response parameters (ISO, TBA). A pre-draftballot has produced a set of suggested stimulus parameters, which are shown for a singleStimulus Cycle Period (SCP) in Figure 8.2. A series of these SCPs, each lasting from 3–5seconds, are presented to the participant under various experimental conditions.
The work described in this chapter only used the DRT as a visually-oriented task, whichis henceforth referred to as the Visual Detection Response Task (vDRT). In the vDRT, alight stimulus is presented at a single point in a subject’s peripheral vision, either via a

214 CHAPTER 8. DRIVING SIMULATOR STUDY
(a) Tactile stimulus (b) Head-mounted visual stimulus
(c) Remote visual stimulus (d) Response button
Figure 8.1 Different apparatus involved with the DRT. Source: McGehee (2014).
remotely mounted Light Emitting Diode (LED) or a head mounted LED (see Figure 8.1).The head mounted version holds the advantage that it will always occur in the sameposition in the participant’s vision, whereas the position of a remotely mounted LED invision will be dependent on the position of the subject’s head.
8.1.1.1 Development of the DRT
Miura (1986) investigated the effect of driving task demand on the detection of an array oflights projected onto a vehicle windscreen (e.g. see Figure 8.3). He found that responsetime to the light stimuli increased with driving demand (which was indexed as an increasein traffic density). In addition, he found that an increase in driving demand decreased theresponse eccentricity (the distance between the gaze fixation and the stimulus). Miura(1986) interpreted this pattern of results as a reduction in the driver’s functional visualfield; because subjects were less able to detect stimuli in their peripheral vision, they hadto look more directly at light array in order to respond to a stimulus.
The PDT aimed to exploit this narrowing of the visual field to obtain a methodwhich was sensitive to workload, but did not interfere with concurrent tasks (Victoret al., 2008). van Winsum et al. (1999) formally developed the method using a PDTparadigm in which they presented light targets in the upper-left visual field with temporal

CHAPTER 8. DRIVING SIMULATOR STUDY 215
Figure 8.2 The presentation paradigm of a single DRT stimulus cycle. Adapted fromMcGehee (2014). The top panel shows a SCP in which the subject does not respond, andthe bottom panel shows an instance where the subject does respond.
Figure 8.3 An example experimental setup showing the PDT task incorporating an arrayof LEDs which are projected on to the windscreen. Source: (Olsson and Burns, 2000).
and spatial uncertainty; the stimulus presentation region spanned 11–23◦ vertically and2–4◦ horizontally, and stimuli were presented randomly at intervals of between 3–5 seconds.
Although van Winsum et al. (1999) showed that their version of the PDT was sensitiveto workload (responses were slower during high demand traffic situations), in contrast tothe work of Miura (1986), they found no effect of eccentricity, with detection performance

216 CHAPTER 8. DRIVING SIMULATOR STUDY
being the same regardless of stimulus position.A number of other studies have also shown that the horizontal angle of the PDT
stimulus did not have any bearing on the results obtained (Martens and Van Winsum,2000; Nunes and Recarte, 2002). Because of this, it is thought the PDT actually measuresa general, amodal interference in attention selection, rather than a modality-specific visualperceptual narrowing (van Winsum et al., 1999; Merat and Jamson, 2008; Victor et al.,2008).
As such, the PDT has been adapted to present a stimulus at a single location, ratherthan as part of an array, which has the advantage of providing a pure measure of generalattentional interference, rather than being contaminated by modality-specific factors, suchas visual eccentricity (Victor et al., 2008). Accordingly, the DRT can be presented in avariety of modalities; visual, auditory, and tactile. Early work showed that there was nodifference in response parameters between different presentation modalities (Engströmet al., 2005a; Merat and Jamson, 2008), supporting the general attention interferencetheory.
8.1.1.2 Considerations for the DRT
Although the purpose of the DRT is to measure the cognitive workload associated withperforming concurrent tasks whilst driving, it is a task in its own right. However, it isunclear whether the DRT is an unobtrusive method of assessment. Anecdotally, Olssonand Burns (2000) noted from their position in the passenger seat of the car, that therewas no degradation in driving performance as a result of PDT performance. All of theirparticipants also anecdotally reported that the PDT was acceptable to be performedsimultaneously whilst driving. Merat and Jamson (2008) also used the DRT in a drivingsimulator study and noted that its performance whilst driving resulted in no significanteffect on the measures of vehicle control such as: speed, headway, standard deviation oflane position, even in the presence of an additional cognitive task (counting backwards inmultiples of seven). Thus it would appear that vehicular control aspects of driving remainunaffected by the simultaneous performance of the DRT.
Some studies have, however, exhibited that eye movement behaviour can be altered bythe inclusion of the PDT, in that the stimuli are frequently fixated upon (Miura, 1986).Recarte and Nunes (2003) noted a higher dispersion of spatial gaze when their visual task(analogous to the PDT) was performed, and argued that this reflected their participantsglancing to look for, and identify, visual targets. However, the DRT differs from thePDT in that it only incorporates a single stimulus location. It is unknown whether thisadaptation leads to a reduction in such visual search for stimuli. Given these findings, it isan important consideration in experiments using the DRT that eye movement behaviourmight be altered to a certain extent. Because eye movements were also recorded in thecurrent experiment, they were analysed whilst the vDRT was absent and present in orderto counter this potential confound.

CHAPTER 8. DRIVING SIMULATOR STUDY 217
It should also be noted that, although primarily considered a metric of workload(McGehee, 2014), the visual version of the DRT may also be reflective of hazard perception.This is because salient DRT stimuli are presented in the periphery of vision, where anumber of hazards (such as pedestrians) or information (such as road signs) that requireexpedited action from the driver also occur. As such there is a functional correspondencethat lends construct validity to this method of workload assessment (van Winsum et al.,1999). Indeed, data pertaining to the PDT version of the task collected by Olsson andBurns (2000) supports this inference, with a number of participants reporting false-hitswhilst confusing external events such as traffic lights with the PDT stimuli. The DRT mayalso, therefore, exhibit drivers’ ability to detect hazards during periods of workload also.
8.2 Study aims and hypotheses
The aim of this study was to assess the effect of SimHL on driving performance, cognitiveworkload and eye movements whilst performing a cognitively engaging auditory task.Participants were asked to drive a simulator and perform two auditory tasks of variabledemand, presented with and without a SimHL.
A specific set of changes in driving behaviour were hypothesised to arise as a result ofauditory task engagement whilst driving. These behaviours were in line with past researchfindings and are summarised in Table 8.1. It was hypothesised that, as a result of theauditory task being presented in a SimHL condition, these changes in driving behaviourwould be even more marked as the demand of the auditory task would be raised as a resultof the attenuation and distortion to auditory stimuli provided by the SimHL.
8.3 Method
8.3.1 Participants
36 young, normally-hearing participants (16~; 20|) were recruited from the UoLDSparticipant database to take part in this study. The sample was aged between 20–40years and had a mean age of 28.3 (S.D. = 5.7) years. This age range was selected giventhat some authors have suggested cognitive decline may start at ages as early as 45 years(Singh-Manoux et al., 2012).
Participants had between 1–22 years of driving experience, with a mean of 9.5 years (S.D.= 6.3 years), and drove on average 6,900 miles per year (S.D. = 4,400 miles). Participantswere reimbursed £15 for taking part in the experiment, and were screened for normalhearing (absolute thresholds of ≤ 20 dB HL at frequencies of 0.25, 0.5, 1, 2, 4 and 8 kHzin both ears) using pure tone audiometry.

218 CHAPTER 8. DRIVING SIMULATOR STUDY
Table 8.1 The hypothesised changes to dependent variables as a result of auditory taskengagement in the current study.
Change in driv-ing behaviouras a result ofauditory taskengagement
Related depen-dent variables
Evidence
Reduced visualscanning
· Increase in theproportion of timelooking at theroad centre
A perceptual narrowing/cognitive tunnellingeffect has been suggested by previous work,whereby drivers spend more time focussed onthe road centre under conditions of auditorytask engagement (Jamson and Merat, 2005;Engström et al., 2005b; Victor et al., 2005).
· Increase in gazeconcentrationaround the roadcentre
Reduction invDRT perfor-mance
· Decreased vDRThit-rate
The vDRT measures cognitive workload. Theperformance of an auditory task will increasethe cognitive workload experienced byparticipants, given that they aremulti-tasking rather than driving in asingle-task paradigm.
· Increased vDRTreaction times
“Improvement” inlateral vehicle con-trol
· Reduced standarddeviation of laneposition
The performance of an auditory task whilstdriving has been shown to improve lateralvehicle control, as indexed by the standarddeviation of lane position, and minimum timeto line crossing (Brookhuis et al., 1991;Jamson and Merat, 2005).
· Increased mini-mum time to linecrossing
Altered longitudi-nal vehicle control
· Decreased drivingspeed
Studies have shown that, during auditorytask engagement, travelling speed is reduced(Haigney et al., 2000; Rakauskas et al., 2004;Jamson and Merat, 2005), and headway isincreased (Haigney et al., 2000). This isperhaps in order to provide a larger safetymargin (Haigney et al., 2000).
· Increased head-way
8.3.2 Materials
8.3.2.1 The driving simulator
This study was conducted on the UoLDS, which is a second-generation, moving-base, highfidelity driving simulator (see Figure 8.4). The simulator vehicle (a 2005 Jaguar S-type) issuspended inside a projection dome offering a near seamless total horizontal field of viewof 250◦. The forward vertical field of view is 45◦, and the 60◦ rear channel can be viewedthrough the vehicle’s rear-view mirror. Images on liquid crystal displays built into thewing mirrors also offer information on the simulated environment for the driver.
The car is a right-hand drive vehicle, and its controls function as they would in a fully-

CHAPTER 8. DRIVING SIMULATOR STUDY 219
Figure 8.4 The UoLDS projection dome and motion system shown from the outside.
operational vehicle. Participants view the simulated environment through the windscreenand windows of the vehicle, as well as via the rear-view and wing mirrors (see Figure 8.5).Participants have full control of the vehicle’s longitudinal and lateral motion. The vehicleuses an automatic transmission and so participants are not required to interact with thegear lever once the car is in motion.
Figure 8.5 The University of Leeds Driving Simulator shown from inside the vehicle cab.

220 CHAPTER 8. DRIVING SIMULATOR STUDY
The simulation is run on a network of local PCs (see Figure 8.6). The vehicle’s ControlArea Network transmits information about driver control of the vehicle to each node ofthe managing PC network, where it is assessed for relevance. This information is fed to avehicle dynamics model, which simulates realistic driving cues such as the visual dashboarddisplay, tactile cues and auditory stimuli (delivered via an 80 watt 4.1 sound system). Thisresults in an ecologically valid simulation of various sensory components of the drivingenvironment.
Figure 8.6 A flow diagram of the UoLDS computer network.
The projection dome is four metres in diameter and creates an immersive drivingenvironment by reducing interference from external auditory and visual stimuli. Imagesgenerated are rendered at 60 frames per second and are presented over eight channels tocreate a real-time, fully textured three-dimensional graphical scene of the virtual world.Six of these channels are projected onto the inner surface of the dome, three forward facing(resolution 1920 × 1200; pixel density 2.1 arcmin per pixel), two side facing (resolution1920 × 1200; pixel density 4.1 arcmin per pixel), and one rear facing (resolution 1024 × 768;pixel density 4.1 arcmin per pixel). All channels are frame locked in order to avoidinconsistencies arising in the image. The composite image is corrected and colour balancedprior to display. The 7” liquid crystal display wing mirrors use a resolution of 800 pixels.
Also visible in Figure 8.4 is the eight degree-of-freedom motion system which is responsi-ble for moving the dome and vehicle cab to simulate the linear and rotational accelerationsof the vehicle. This is controlled via a dedicated PC which sends information to the motionsystem in a timely fashion over Ethernet.
8.3.2.2 The driving environment
The simulated scene was based on the UK road system, with participants required todrive on the left hand side of the road. For the entirety of the drive the road was a

CHAPTER 8. DRIVING SIMULATOR STUDY 221
single carriageway which proceeded through a village setting, with a speed limit of 40mph, onto a rural road of 60 mph speed limit. This format was repeated four times foreach of the experimental drives undertaken; thus a depiction of an entire drive is shownin Figure 8.7, and there are example screenshots of the driving environment shown inFigure 8.8. The road consisted of straight and curved sections (see Figure 8.7). The curvedsections comprised a gently winding road with alternating left and right turns. Besidesthe curvature of the road, all other driving conditions remained identical to the straightroad condition. Whilst driving the course, participants were required to perform a numberof tasks (auditory and visual). The experiment required the performance of these tasksat various points during the drive; sometimes in isolation, and sometimes simultaneously.Each of the tasks are described below.
Figure 8.7 A depiction of one of the experimental drives that participants undertook inthis study. The order of the conditions being presented was counterbalanced and no taskswere presented whilst driving in the village.
(a) The start of the rural section (b) Curved rural section
(c) Straight rural section (d) End of the rural section
Figure 8.8 Screenshots of the driving scene in this experiment.

222 CHAPTER 8. DRIVING SIMULATOR STUDY
8.3.2.3 Auditory tasks
The dCMT and PASAT were selected for inclusion in this study, based on the findings ofthe study presented in Chapter 7, with dCMT regarded as an ‘easy’ task, and PASAT asa ‘difficult’ task. The task presentation paradigms were very similar to those reported inChapter 7; however there were some minor changes. The PASAT was adapted slightly sothat in the current study it was system-paced, as opposed to self-paced. This change wasmade for two main reasons:
1. There were a number of set 30 second epochs within which the PASAT would bepresented during the experimental drives. This epoch was stable across participants,so that there was an identical amount of driving, eye tracking and vDRT data foreach participant under each condition. Using a self-paced PASAT task would haveresulted in variable epochs, leading to inconsistencies in the amount of data betweenand within each participant.
2. Responses to auditory tasks were given vocally in this study, as opposed to manuallyon a computer keyboard number pad. It was, therefore, not possible to presenta stimulus upon submission of a response. As such, the stimuli had to flow at apre-defined rate. The change was not considered problematic; the original decisionto use a self-paced presentation rate was because there was a focus on recordingreaction time data. This was not the case in this study, in which only accuracy on,and adherence to, the auditory tasks was analysed.
Because the PASAT was a system-paced task, a suitable presentation rate for stimulihad to be considered. This decision was based on normative data presented in Chapter 7.Data from these experiments showed that mean response times plus standard error toPASAT were consistently under two seconds. Thus it was considered that participantsshould be able to perform the majority of sums presented at a pace of one digit every twoseconds. In order to coincide with this, the dCMT was also presented at this pace. Ifa stimulus number was missed by the participant they were instructed to simply ignorethat number and continue listening to the list, counting targets as they would have donewithout the mistake.
For the dCMT, participants were, again, required to only respond at the end of thedigit list. There was very little difference in accuracy rates, or perceived difficulty, as aresult of the ‘counting along’ alteration used in Experiment B of Chapter 7. Requiring oneresponse at the end of the list reduced the chance of participants vocalising their answerover stimuli and masking them so that they were inaudible.
Stimuli were played using the car speakers, which had been calibrated to providean accurate presentation level of 80 dB(A). The calibration process was as follows. Asound level meter was attached to a tripod placed on the driver’s seat of the car, withthe microphone positioned at a representative level of a driver’s ear. A calibration speech-shaped noise, corresponding to the amplitude of the waveforms of the normal hearing and

CHAPTER 8. DRIVING SIMULATOR STUDY 223
simulated moderate hearing loss conditions, was then played and the volume of the carspeaker system was manipulated until a reading of 80 dB(A) was obtained.
The experiment described in Chapter 7 used a stimulus presentation level of 60 dB(A).The choice of 80 dB(A) as a presentation level in this study was deemed necessary as itprovided audibility of stimuli over and above background road and vehicle noise. Duringpilot work, the background vehicle noise in the simulator cabin was measured at a level of77 dB(A), thus it was considered that auditory stimuli played at 60 dB(A) would be largelymasked. Further pilot work was performed in which a 28 year old male participant withnormal hearing was asked to shadow number lists in the simulated moderate hearing losscondition, presented at levels of 60–80 dB(A) in increments of 5 dB(A). The participantreported difficulties in perceiving the sound source at any presentation level other than 80dB(A). Thus to ensure audibility of stimuli, this presentation level was chosen.
Answers to the auditory tasks were recorded via a digital Dictaphone with a lapelmicrophone attachment. Participants were requested to clearly vocalise responses to eachauditory task to ensure that the microphone picked up their responses to the individualtrials. The digit presentations in each auditory task were also software-recorded so that anoverall accuracy score for each trial could be derived.
The auditory tasks were presented in one of three listening conditions: (1) no sound(baseline), (2) normal hearing, and (3) simulated moderate hearing loss (henceforth referredto as ‘SimHL’). Given the findings presented in Chapter 7, that performance on theseauditory tasks did not differ significantly from normal hearing for a mild hearing loss,and previous experimental results which suggest the same trend (Hickson et al., 2010),mild hearing loss was not included in this study. The magnitude and configuration of themoderate hearing loss was kept the same as for the previous experiments (see Figure 8.9),given that it produced a significant effect on performance, and is representative of whatmight be expected of an age-related decline in hearing.
8.3.2.4 The vDRT
This experiment also used the vDRT to assess the effect of auditory task engagement onthe workload experienced by subjects whilst driving.
The specific version of vDRT used was head-mounted, and consisted of a red LEDsuspended on a headset worn by the participant at an angle of approximately 20◦ to theleft and 10◦ above the participants left eye (McGehee, 2014; see Figure 8.10). The LEDilluminated at intervals of between 3–5 seconds, requiring a response from the participant.The presentation paradigm was summarised earlier in Figure 8.2, which shows the timeperiods associated with different stages of the vDRT presentation. The maximum value forthe stimulus duration (SD) was set as one second.
Participants responded using a button placed on their thumb, such that it could bepressed against the steering wheel without having any influence on participants’ ability tomanipulate the vehicle controls. Where the vDRT was presented simultaneously with a

224 CHAPTER 8. DRIVING SIMULATOR STUDY
Figure 8.9 The two hearing loss conditions used in this study: (1) normal hearing; (2)moderate hearing loss.
Figure 8.10 A participant pictured whilst completing his practice drive. The picture showshim wearing the vDRT headset and response button which is positioned ready to respondby pushing it against the steering wheel.

CHAPTER 8. DRIVING SIMULATOR STUDY 225
listening task, vDRT trials began 15 seconds prior to the digit list, and continued until 15seconds after the digit list had finished. This ensured that participants were given chanceto perform the tasks reliably, without having to start numerous tasks at the same time.Furthermore, it was considered that after 15 seconds of vDRT performance, participantswere adequately engaged to provide a stable measure of the effect of driving and/or auditorytask on the performance of the vDRT. Analysis was only performed on the 30 second epochwhere the two tasks overlapped.
8.3.3 Procedure
Upon attendance at the driving simulator, participants were welcomed to the facility andwere given an information sheet explaining the purpose of the study and what would berequired of them. Participants were left to read the information sheet and were asked ifthey had any questions regarding the protocol, prior to signing their consent to participate.Once registered for the study, participants were asked to provide information about theirage, driving experience, and annual mileage.
Once this process was completed, participants were shown the setup of the equipmentin order to understand where they would be driving and how to enter/exit the simulatorvehicle and projection dome. If any questions arose the experimenter was on hand toprovide answers. Following this familiarisation period, subjects were provided with apractice session (described in the following section). Upon successful completion of thepractice session, participants performed two experimental drives (lasting approximatelythirty minutes each) separated by a brief rest period.
Ethical approval was granted for this study by the University of Leeds ESSL, Environ-ment and LUBS (AREA) Faculty Research Ethics Committee (reference: LTTRAN-048),and participants were required to sign informed consent prior to participating.
8.3.3.1 Practice session
The function of the practice session was to allow participants to familiarise themselveswith the apparatus, and the tasks which would be used in the experiment.
Participants were fully briefed on the operation of the simulator and were asked tofamiliarise themselves with the vehicle. This included changing the position of the seat toobtain a comfortable driving position, and testing the vDRT response button in order toestablish it could be pressed successfully with ease at every attempt. The experimenterfitted the head mounted LED to the participant, and adjusted the head strap so that itwas comfortable.
Participants were then given fifteen vDRT presentations in isolation (i.e. without anydriving task) to ensure successful understanding of the task. Two digit lists for each typeof auditory task were then played over the car speakers, and the participant was asked tocomplete them in order to ensure understanding. Again this was performed in isolation

226 CHAPTER 8. DRIVING SIMULATOR STUDY
(i.e. without any driving task). Two more lists for each task were then played, but underthe moderate hearing loss condition. Again the participant was asked to respond in orderto ensure audibility and understanding. In no case was the auditory task too quiet to hear,and as such participants were able to complete the listening tasks with a high level ofsuccess, regardless of the listening condition.
Participants were then provided with a practice drive. For the practice drive, theexperimenter was seated in the vehicle with the participant in order to instruct, and answerany questions which arose. To begin with, there was a ten minute section of road in whichno extraneous tasks were presented. As such, the participant was given ample opportunityto become used to the vehicle and driving environment. This section concluded with theparticipant drawing up behind a parked car at a set of traffic lights. It was stressed thatthey were to try and follow this vehicle and try to maintain a stable headway, withoutovertaking, regardless of task engagement. There was no following distance specified, ratherparticipants were told to “follow at a distance with which they felt comfortable, and wouldadopt during normal everyday driving”.
For the remainder of the practice drive, the participant was told to observe this vehiclefollowing behaviour, and that a number of tasks would start at random intervals. For thepractice drive the experimenter pointed out when a task was about to begin, and informedthe participant what type of auditory task he/she should perform. In the practice sessionall auditory tasks were presented simultaneously with the vDRT under normally hearingand SimHL conditions. This decision was taken as it was considered the most complextask type, and so if participants were able to perform this condition successfully it wasthought that they would also be able to perform all others. This approach also limitedfatigue by keeping the session as short as possible. In its entirety, the practice sessionlasted approximately 25 minutes and the road length was 20km.
8.3.3.2 Experimental drive
Once the practice session was complete, and the experimenter was satisfied that theparticipant understood the experimental protocol, subjects were asked to complete twoexperimental drives in the vehicle on their own.
Prior to beginning each 60km drive participants were informed about the listeningtask they would perform for the proceeding drive, this was counterbalanced across driversin order to avoid any order effects. Participants were given a break between the twoexperimental drives in order to reduce fatigue whilst driving.
The drive began with the participant pulling away and reaching the target speed. Aftera short free drive they stopped at a set of traffic lights, where the lead vehicle was stationary.The lead vehicle then pulled away and kept a consistent speed (governed by the speedlimit imposed) ahead of the participant for the remainder of the drive (see Figure 8.11). Aconstant contra flow of traffic was present in order to make it difficult for the participantto attempt to overtake the lead vehicle, and as such they were consistently bound by the

CHAPTER 8. DRIVING SIMULATOR STUDY 227
behaviour of the vehicle that they were following.
Figure 8.11 The typical driving scene from this experiment showing the vehicle thatparticipants were asked to follow at a set distance.
8.3.3.3 Experimental design
In this experiment, only straight sections of road were analysed for clarity. Accordingly, thisresulted in a 2×3×2 within-subjects experimental design incorporating the factors: auditorytask type (PASAT vs dCMT), listening condition (no sound, normal hearing, SimHL),vDRT presence (yes vs no). Thus, a schematic diagram of all experimental conditions isshown in Figure 8.12. The ‘no sound’ condition was a baseline against which the effect ofauditory tasks in the normal hearing and SimHL conditions could be compared. As such, itwas possible to establish the effect of an increasing difficulty of auditory task engagement ondependent variables. Because of the experimental design, there was a ‘no sound’ conditionunder both the dCMT and PASAT, as shown in Figure 8.12. These conditions actuallyreflected baseline performance in two separate drives, because, for clarity, participantsperformed two separate experimental drives and only one single auditory task type perdrive, i.e. were instructed to perform PASAT for the entirety of their first drive and dCMTfor the second drive, or vice versa. The implications of these duplicated experimentalconditions for statistical analysis are addressed later in subsection 8.3.5.
Within each drive, conditions were counterbalanced using the Latin square method,and the drive order was also counterbalanced between participants in order to negate anyorder effects which may have arisen. During periods of rural driving, simultaneous taskswere fired for the participant to perform whilst continuing along the road. Participantswere asked to focus equal attention on their performance of all tasks undertaken (driving,auditory and visual). Each task section lasted thirty seconds, and was followed by aninterval, again of thirty seconds, before the next task was presented. This led to three taskconditions performed per rural driving section, thus in a whole drive six task conditionswere performed.

228 CHAPTER 8. DRIVING SIMULATOR STUDY
Figure 8.12 A schematic diagram of all experimental conditions undertaken by participants.Each participant undertook two drives; one in which PASAT was performed the other inwhich dCMT was performed. The shaded conditions essentially highlight a duplication.
8.3.4 Derivation of dependent variables
Data for a number of dependent variables was collected during this experiment from anumber of sources. These are described in detail below.
8.3.4.1 Driving performance
Data on lateral and longitudinal position of the simulated vehicle, and its position inrelation to other vehicles on the road, was recorded at a resolution of 60 Hz. For eachcondition, the data from each variable was identified as a 28 second period correspondingto the time between the first number presented in an auditory task, and the beep to signalthe end of that list (see Figure 8.13). Thus measurements were reflective of vehicle controlwhilst the participant was fully engaged in performing the auditory task. A number ofdependent variables were derived from the simulator and used for analysis in this study;these measures were based around those used in previous literature for the measurement ofcognitive workload and its effect on driving (see e.g. Roskam et al., 2002; Knappe et al.,2007). A description of how each measure was calculated is given below.
1. Speed. Instantaneous speed values were derived for each participant. Minimum,maximum, mean and standard deviation values were then established for eachparticipant during each of these periods.
2. Headway (i.e. the distance in time separating the participant and lead vehicles).Instantaneous headway values were recorded for each participant, and minimum,maximum, mean and standard deviation values were derived during each experimentalcondition. This gave an idea about the distance at which participants were followingthe lead vehicle, but also their ability to maintain a steady distance.
3. Standard Deviation of Lane Position (SDLP). This was calculated using theposition of the centre of the car in the lane in relation to the left-hand lane edge.Instantaneous position values were isolated for each condition, and a standarddeviation was calculated to give a measure of the stability of the vehicle within itslane of travel.
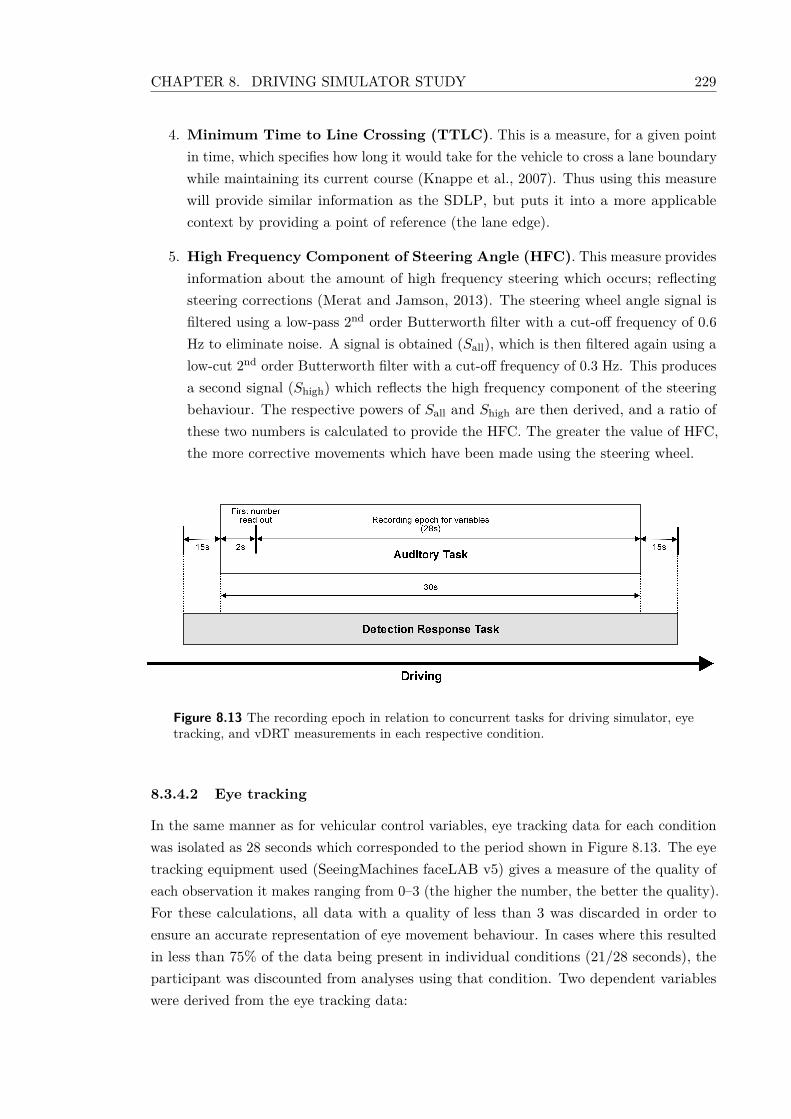
CHAPTER 8. DRIVING SIMULATOR STUDY 229
4. Minimum Time to Line Crossing (TTLC). This is a measure, for a given pointin time, which specifies how long it would take for the vehicle to cross a lane boundarywhile maintaining its current course (Knappe et al., 2007). Thus using this measurewill provide similar information as the SDLP, but puts it into a more applicablecontext by providing a point of reference (the lane edge).
5. High Frequency Component of Steering Angle (HFC). This measure providesinformation about the amount of high frequency steering which occurs; reflectingsteering corrections (Merat and Jamson, 2013). The steering wheel angle signal isfiltered using a low-pass 2nd order Butterworth filter with a cut-off frequency of 0.6Hz to eliminate noise. A signal is obtained (Sall), which is then filtered again using alow-cut 2nd order Butterworth filter with a cut-off frequency of 0.3 Hz. This producesa second signal (Shigh) which reflects the high frequency component of the steeringbehaviour. The respective powers of Sall and Shigh are then derived, and a ratio ofthese two numbers is calculated to provide the HFC. The greater the value of HFC,the more corrective movements which have been made using the steering wheel.
Figure 8.13 The recording epoch in relation to concurrent tasks for driving simulator, eyetracking, and vDRT measurements in each respective condition.
8.3.4.2 Eye tracking
In the same manner as for vehicular control variables, eye tracking data for each conditionwas isolated as 28 seconds which corresponded to the period shown in Figure 8.13. The eyetracking equipment used (SeeingMachines faceLAB v5) gives a measure of the quality ofeach observation it makes ranging from 0–3 (the higher the number, the better the quality).For these calculations, all data with a quality of less than 3 was discarded in order toensure an accurate representation of eye movement behaviour. In cases where this resultedin less than 75% of the data being present in individual conditions (21/28 seconds), theparticipant was discounted from analyses using that condition. Two dependent variableswere derived from the eye tracking data:

230 CHAPTER 8. DRIVING SIMULATOR STUDY
1. Percent Road Centre (PRC); the proportion of time spent looking at the centreof the road. Pitch and yaw angles were taken as the average of data recorded fromthe left and right eyes. PRC was calculated by first rounding all instantaneous pitchand yaw gaze angles for the whole drive to the nearest whole number and finding themode value of each. The mode gaze angle was assumed to be the road centre, as it isconsidered that this is the area in the driving scene people will look at most of thetime (Ahlstrom et al., 2009).
Within each condition, instantaneous yaw and pitch angles were then subtractedfrom the respective mode values in order to give a set of data centred on zero (i.e.their distance from the mode gaze). The road centre region was defined as a 6◦ circlesurrounding the road centre, as has been the case for previous work using the samedriving simulator (Jamson et al., 2011, 2013). The number of observations occurringwithin this region was then found, giving the percentage of observations occurring inthe road centre region as a proportion of the total number of observations. A similarmethodological approach has been described previously by Ahlstrom et al. (2009).
2. The gaze concentration around the road centre was defined as the standarddeviation of linear distances in a given epoch from the assumed road centre. Theroad centre was established as above, taking the mode pitch and yaw angles for theentire drive. Instantaneous pitch and yaw angles were then subtracted from thesevalues to centre the data set around zero (i.e. the distance from the road centre).Linear distances from the road centre were then calculated for each instantaneousobservation. The standard deviation of these values was then calculated to give agaze concentration for each experimental condition. Thus the higher the value, theless concentrated the gaze behaviour.
8.3.4.3 Detection Response Task
As can be seen in Figure 8.13, when present, the vDRT started prior to the auditory taskcommencing, and carried on past the completion of the auditory task. The rationale forincluding the vDRT was to investigate the effect of auditory task engagement on cognitiveworkload. Thus it was necessary to isolate just the vDRT responses which had beenrecorded during the 28 second window of auditory task engagement. Once this had beendone for each condition, the variables of interest could be calculated:
1. The hit-rate of responses in each experimental condition (i.e. how many correctresponses were given as a proportion of the number of stimulus presentations).
2. The mean response time for correct responses in each experimental condition.
8.3.4.4 Auditory tasks
Finally, auditory task responses resulted in two variables:

CHAPTER 8. DRIVING SIMULATOR STUDY 231
1. The accuracy of responses given in each experimental condition (i.e. how manyanswers were correct as a proportion of the number of stimuli).
2. Participants’ adherence to the task, by counting the number of responses given(regardless of whether they were correct) as a proportion of the number of stimuli.
8.3.5 Statistical analysis
Prior to analysis, Shapiro-Wilk tests were used to establish the normality of each variables’distribution; where a non-normal distribution was noted, equivalent non-parametric testingwas carried out. The experimental design used necessitated a number of comparisons to bemade in order to answer the research questions posed. Because there was a duplication of‘no sound’ conditions, and the fact that these did not reflect a level of auditory task difficulty(because they essentially presented no auditory task), performing a simple 2 (PASAT,dCMT) × 3 (no sound, normal hearing, SimHL) × 2 (no vDRT, vDRT) repeated measuresANOVA was not considered applicable. Accordingly, in order to investigate differencesarising between dependent variables as a result of different auditory task types (dCMTvs. PASAT), a 2 (PASAT, dCMT) × 2 (normal hearing, SimHL) × 2 (no vDRT, vDRT)repeated measures ANOVA was performed on each dependent variable (see Figure 8.14).
Figure 8.14 A depiction of the two ANOVAs used to investigate the effect of auditory tasktype on driving performance.
In order to test for differences in dependent variables as a result of different listeningconditions (no sound vs. normal hearing vs. SimHL), two separate repeated measuresANOVAs of the same design were run on dCMT and PASAT drives respectively. TheseANOVAs were a 3 (no sound, normal hearing, SimHL) × 2 (no vDRT, vDRT) design.Because no comparison was being made between conditions within dCMT and PASAT, noduplication occurred (see Figure 8.15).
Where applicable, Mauchly’s test was carried out in order to establish whether theassumption of sphericity had been violated. Where this was the case the Greenhouse-Geisserestimates of sphericity were used in cases where ε < .75, and the Hyuhn-Feldt estimates of

232 CHAPTER 8. DRIVING SIMULATOR STUDY
Figure 8.15 A depiction of the two ANOVAs used to investigate the effect of differentlistening conditions on driving performance.
sphericity were used in cases where ε > .75 (Field, 2013). In cases of a significant resulton ANOVA testing, post-hoc pairwise comparisons were carried out using the Bonferronicorrection to account for the increased possibility of type I errors occurring in the analysis(Field, 2013).
8.4 Results
Analysis of the results is presented in this section under the four main headings: (1) Drivingbehaviour; (2) Eye tracking; (3) Detection Response Task; and (4) Auditory tasks.
8.4.1 Driving behaviour
8.4.1.1 Longitudinal vehicle control
Speed
A 3 (no sound, normal hearing, SimHL) × 2 (no vDRT, vDRT) repeated measures ANOVAwas performed for each of mean, maximum, minimum and standard deviation of speeddata recorded during the performance of dCMT. No main effects of hearing loss condition,or vDRT presence were shown in any of the analyses. No significant interactions wereobserved. Thus, the performance of vDRT did not have an effect on driving speed, nor didhearing loss have an effect on driving speed during the performance of dCMT.
A 3 (no sound, normal hearing, SimHL) × 2 (no vDRT, vDRT) repeated measuresANOVA was performed for each of mean, maximum, minimum and standard deviationof speed data recorded during the performance of PASAT. No main effects of listeningcondition, or vDRT presence were shown in any of these analyses. No significant interactionswere observed. Thus, suggesting that the performance of vDRT did not have an effect ondriving speed, nor did hearing loss have an effect on driving speed during the performanceof PASAT.
A 2 (dCMT, PASAT) × 2 (normal hearing, SimHL) × 2 (no vDRT, vDRT) repeatedmeasures ANOVA was performed on each of mean, maximum, minimum and standard

CHAPTER 8. DRIVING SIMULATOR STUDY 233
deviation of speed data. No main effects of auditory task type, listening condition, or vDRTpresence were shown in any of the analyses. No significant interactions were observed.There was no difference, therefore, in driving speeds between driving and performing dCMTor driving and performing PASAT.
Headway
A 3 (no sound, normal hearing, SimHL) × 2 (no vDRT, vDRT) repeated measures ANOVAwas performed on each of mean, maximum, minimum and standard deviation of headwaydata recorded during the performance of dCMT. For mean, minimum, and standarddeviation of headway data, no main effects of listening condition, or vDRT presence wereshown in any of the analyses. No significant interactions were observed. However, a 3 (nosound, normal hearing, SimHL) × 2 (no vDRT, vDRT) repeated measures ANOVA ofmaximum headway data recorded during the performance of dCMT showed a main effect oflistening condition (F(1.7,59.4) = 3.68, p = .038). Post-hoc pairwise comparisons, however,showed no significant differences between the three listening conditions (no sound, normalhearing and SimHL). Thus, the performance of vDRT did not have an effect on headway,nor did SimHL have an effect, over and above that of the normal hearing condition, onheadway during the performance of dCMT.
A 3 (no sound, normal hearing, SimHL) × 2 (no vDRT, vDRT) repeated measuresANOVA was performed on each of mean, maximum, minimum and standard deviation ofheadway data recorded during the performance of PASAT. No main effects of listeningcondition, or vDRT presence were shown in any of the analyses. No significant interactionswere observed. Thus, the performance of vDRT did not have an effect on headway, nor didthe SimHL condition have a greater effect than the normal hearing condition on headwayduring the performance of PASAT.
A 2 (dCMT, PASAT) × 2 (normal hearing, SimHL) × 2 (no vDRT, vDRT) repeatedmeasures ANOVA was performed on each of mean, maximum, minimum and standarddeviation of headway data. No main effects of task type, hearing loss condition, or vDRTpresence were shown for mean, maximum, or minimum headway data. No significantinteractions were observed. However, a 2 (dCMT, PASAT) × 2 (normal hearing, SimHL) ×2 (no vDRT, vDRT) repeated measures ANOVA of standard deviation of headway showeda main effect of task type (F(1,35) = 4.40, p = .043). Post-hoc analysis confirmed thatheadway was more variable during the performance of PASAT (M = 4.94 s) than it wasduring dCMT performance (M = 4.05 s).
8.4.1.2 Lateral vehicle control
Standard deviation of lane position
The mean SDLP for each experimental condition is shown in Figure 8.16. A 3 (no sound,normal hearing, SimHL) × 2 (no vDRT, vDRT) repeated measures ANOVA of SDLP data

234 CHAPTER 8. DRIVING SIMULATOR STUDY
recorded during the performance of dCMT showed a main effect of listening condition(F(2,70) = 4.75, p = .012). Post-hoc analysis confirmed that lane position was less variablewhen dCMT was present. During the no sound condition SDLP was greater (M = .13m) than it was during the normal hearing condition (M = .11 m; p = .055), and wassignificantly greater than in the SimHL condition (M = .13 m; p = .023). No significantdifference was found between the normal hearing and SimHL conditions (p = 1.00). Nomain effect of vDRT presence was found, nor were any significant interactions observed.
(a) vDRT absent (b) vDRT present
Figure 8.16 The mean SDLP (±SE) under different study conditions.
A 3 (no sound, normal hearing, SimHL) × 2 (no vDRT, vDRT) repeated measuresANOVA of SDLP data recorded during the performance of PASAT showed a main effectof listening condition (F(2,70) = 19.04, p < .001). Post-hoc analysis confirmed that laneposition was less variable when PASAT was present. During the no sound condition SDLPwas significantly greater (M = .12 m) than it was during the normally hearing (M = .09 m;p < .001), and SimHL conditions (M = .09; p < .001). No significant difference was foundbetween the normal hearing and SimHL condition (p = 1.00). No main effect of vDRTpresence was found, nor were any significant interactions observed.
A 2 (dCMT, PASAT) × 2 (normal hearing, SimHL) × 2 (no vDRT, vDRT) repeatedmeasures ANOVA of SDLP showed a main effect of task type (F(1,35) = 6.10, p = .019).Post-hoc analysis confirmed that lane variation was higher during the performance ofdCMT (M = .11 m) than it was during the performance of PASAT (M = .09 m). A maineffect of vDRT presence also tended towards significance (F(1,35) = 4.01, p = .053), withpost-hoc analysis showing that lane position was more variable when the vDRT was absent(M = .104 m), as opposed to when it was present (M = .096 m). No significant interactionswere observed.

CHAPTER 8. DRIVING SIMULATOR STUDY 235
Minimum time to line crossing
A 3 (no sound, normal hearing, SimHL) × 2 (no vDRT, vDRT) repeated measures ANOVAof TTLC data recorded during the performance of dCMT showed no main effect of listeningcondition or vDRT presence, nor were any significant interactions observed.
Likewise, a 3 (no sound, normal hearing, SimHL) × 2 (no vDRT, vDRT) repeatedmeasures ANOVA of TTLC data recorded during the performance of PASAT showed nomain effect of listening condition or vDRT presence, nor were any significant interactionsobserved.
A 2 (dCMT, PASAT) × 2 (normal hearing, SimHL) × 2 (no vDRT, vDRT) repeatedmeasures ANOVA of TTLC data showed no main effect of auditory task type, listeningcondition or vDRT presence, nor were any significant interactions observed.
High frequency component of steering
A 3 (no sound, normal hearing, SimHL) × 2 (no vDRT, vDRT) repeated measures ANOVAof HFC data recorded during the performance of dCMT showed no main effect of listeningcondition or vDRT presence, nor were any significant interactions observed.
Likewise, a 3 (no sound, normal hearing, SimHL) × 2 (no vDRT, vDRT) repeatedmeasures ANOVA of HFC data recorded during the performance of PASAT showed nomain effect of listening condition or vDRT presence, nor were any significant interactionsobserved.
A 2 (dCMT, PASAT) × 2 (normal hearing, SimHL) × 2 (no vDRT, vDRT) repeatedmeasures ANOVA of HFC data showed no main effect of auditory task type, hearing losscondition or vDRT presence, nor were any significant interactions observed.
8.4.2 Eye tracking data
Percent road centre
Mean PRC values are shown in Figure 8.17. A 3 (no sound, normal hearing, SimHL)× 2 (no vDRT, vDRT) repeated measures ANOVA of PRC data recorded during theperformance of dCMT showed a main effect of listening condition (F(1.4,47.9) = 21.48, p <.001). Post-hoc analysis confirmed that PRC was higher when dCMT was being performed.PRC was significantly lower in the no sound condition (M = 90.95%) than it was in thenormally hearing (M = 95.22%; p < .001) or SimHL (M = 96.03%) conditions. However,the normally hearing and SimHL conditions did not significantly differ from each other(p = .364). A main effect of vDRT presence was also observed (F(1.4,47.9) = 21.48, p <.001), with post-hoc testing showing that PRC was higher when the vDRT was present (M= 95.46%) as opposed to absent (M = 92.67%). An interaction between listening conditionand vDRT presence was also observed (F(1.8,61.1) = 21.48, p = .001). Post-hoc pairedt-tests suggested that this was because, as the listening difficulty of dCMT decreased, theeffect size associated with the increase in PRC grew. That is to say, the increase in PRC

236 CHAPTER 8. DRIVING SIMULATOR STUDY
as a result of vDRT presence was greater for the no sound condition (M = 5.35%), t(35) =5.28; p < .001, than it was for the normal hearing condition (M = 1.83%), t(35) = 2.58; p= .019, and to an even greater extent than the SimHL condition (M = 1.19%), t(35) =2.15; p = .039.
(a) vDRT absent (b) vDRT present
Figure 8.17 The mean PRC (±SE) under different study conditions.
A 3 (no sound, normal hearing, SimHL) × 2 (no vDRT, vDRT) repeated measuresANOVA of PRC data recorded during the performance of PASAT showed a main effect ofvDRT presence (F(1,35) = 27.87, p < .001), with post-hoc testing showing that PRC washigher when the vDRT was present (M = 92.41%) as opposed to absent (M = 89.11%). Nomain effect of listening condition was observed, nor was an interaction between listeningcondition and vDRT presence.
A 2 (dCMT, PASAT) × 2 (normal hearing, SimHL) × 2 (no vDRT, vDRT) repeatedmeasures ANOVA of PRC data showed a main effect of auditory task type (F(1,35) =12.77, p = .001). Post-hoc analysis showed that PRC was higher when dCMT was beingperformed (M = 95.62%) than it was during PASAT performance (M = 90.27%). A maineffect of vDRT presence was also observed (F(1,35) = 21.42, p < .001). Post-hoc analysisshowed that PRC was higher when the vDRT was present (M = 93.92) than it was whenthe vDRT was absent (M = 91.97). No significant interactions were observed.
Gaze concentration
Gaze concentration to the road centre is shown in Figure 8.18. A 3 (no sound, normalhearing, SimHL) × 2 (no vDRT, vDRT) repeated measures ANOVA of gaze concentrationdata recorded during the performance of dCMT showed a main effect of listening condition(F(1.8,61.5) = 29.58, p < .001). Post-hoc analysis confirmed that gaze was less variablewhen dCMT was being performed. Gaze variability was significantly higher in the nosound condition (M = 3.02◦) than it was in the normally hearing (M = 2.09◦; p < .001)

CHAPTER 8. DRIVING SIMULATOR STUDY 237
or SimHL conditions (M = 1.91◦; p < .001). However, the normally hearing and SimHLconditions did not significantly differ from each other (p = .558). A main effect of vDRTpresence was also observed (F(1,35) = 40.00, p < .001), with post-hoc testing showing thatgaze was less variable when the vDRT was present (M = 2.10◦) as opposed to absent (M =2.58◦). An interaction between listening condition and vDRT presence was also observed(F(2,70) = 4.04, p = .022). In concurrence with PRC data, post-hoc t-tests suggested thatthis was because a progressive decrease in listening difficulty resulted in an increase in gazevariation as a result of the vDRT being present. The decrease in gaze concentration as aresult of vDRT presence was greater for the no sound condition (M = .79◦), t(35) = 5.19;p < .001, than it was for the normal hearing condition (M = .43◦), t(35) = 3.03; p = .005,and to an even greater extent than the SimHL condition (M = .22◦), t(35) = 1.72; p =.094.
(a) vDRT absent (b) vDRT present
Figure 8.18 The mean gaze concentration (±SE) under different study conditions.
A 3 (no sound, normal hearing, SimHL) × 2 (no vDRT, vDRT) repeated measuresANOVA of gaze concentration data recorded during the performance of PASAT showed amain effect of vDRT presence (F(1,35) = 28.35, p < .001), with post-hoc testing showingthat gaze was less variable when the vDRT was present (M = 2.34◦) as opposed to absent(M = 2.80◦). No main effect of listening condition was apparent, although the ANOVAdid tend towards significance (F(1.4,47.7) = 3.11, p = .072). An interaction betweenlistening condition and vDRT presence was also observed (F(1.7,60.9) = 6.72, p = .003).As previously, post-hoc t-tests suggested that this was because a progressive decrease inlistening difficulty resulted in greater decreases in gaze variation as a result of the vDRTbeing present. The decrease in gaze concentration as a result of vDRT presence was greaterfor the no sound condition (M = .98◦), t(35) =4.67; p < .001, than it was for the normalhearing condition (M = .19◦), t(35) = 1.42; p = .164, and to an even greater extent thanthe SimHL condition (M = .20◦), t(35) = 1.37; p = .179.

238 CHAPTER 8. DRIVING SIMULATOR STUDY
A 2 (dCMT, PASAT) × 2 (normal hearing, dCMT) × 2 (no vDRT, vDRT) repeatedmeasures ANOVA of gaze concentration data showed a main effect of auditory task type(F(1,35) = 6.29, p = .017). Post-hoc analysis showed that gaze was more variable whenPASAT was being performed (M = 2.44◦) than it was during dCMT performance (M =1.20◦). A main effect of vDRT presence was also observed (F(1,35) = 16.36, p < .001).Post-hoc analysis showed that gaze was more variable when the vDRT was absent (M =2.35◦) than it was when the vDRT was present (M = 2.09◦). No significant interactionswere observed.
8.4.3 Visual Detection Response Task
Hit rate
The hit rates on vDRT are shown across experimental conditions in Figure 8.19. Shapiro-Wilk tests showed that vDRT accuracy data was not normally distributed, as such equivalentnon-parametric statistical testing was employed for this dependent variable. A Friedmantest performed on the three listening conditions in dCMT drives showed a significantdifference in vDRT hit rates
(χ2(2) = 11.09, p < .001
). Subsequent Wilcoxon signed rank
tests showed that vDRT hit rates were lower when dCMT was being performed. There wasa significant difference in hit rates between the no sound and normal hearing conditions(Z = -2.99, p = .003), and the no sound and SimHL conditions (Z = -1.96, p = .050).However, the normal hearing and SimHL conditions did not significantly differ from eachother (p = .868).
Figure 8.19 The mean hit-rate (±SE) on the vDRT for each experimental condition.
A Friedman test performed on the three listening conditions in PASAT drives showeda significant difference in vDRT hit rates (χ2(2) = 31.66, p < .001). Subsequent Wilcoxonsigned rank tests showed that vDRT hit rates were lower when PASAT was being performed.There was a significant difference in hit rates between the no sound and normal hearingconditions (Z = -3.74, p < .001), and the no sound and SimHL conditions (Z = -4.20, p

CHAPTER 8. DRIVING SIMULATOR STUDY 239
< .001). However, again the normal hearing and SimHL conditions did not significantlydiffer from each other (p = .113).
A Friedman test performed between matched PASAT and dCMT experimental condi-tions showed a significant difference in vDRT hit rates
(χ2(3) = 21.72, p < .001
). Subse-
quent Wilcoxon signed rank tests showed that vDRT hit rates were lower when PASATwas being performed than when dCMT was being performed. Hit rates were significantlylower during PASAT for both the normal hearing (Z = -2.78, p = .005), and SimHL (Z =-3.32, p = .001) conditions.
Response time
Unlike hit rate data, vDRT response times conformed to a normal distribution, thusparametric testing was carried out for this variable. A one-way ANOVA showed a significantdifference in vDRT response times between listening conditions during dCMT drives(F(1.7,58.8) = 67.98, p < .001). Post-hoc analysis showed that response times were slowerwhen the dCMT was present (either in the normal hearing or SimHL condition). Whenno task was present, response times to vDRT were faster in the no sound condition (M =303.92 ms) than they were during the performance of dCMT in the normal hearing (M= 433.13 ms, p < .001), or SimHL (M = 445.02 ms; p < .001) conditions. However, thenormally hearing and SimHL conditions did not differ from each other ( p = 1.00).
A one-way ANOVA showed a significant difference in vDRT response times betweenlistening conditions during PASAT drives (F(2,70) = 63.57, p < .001). Post-hoc analysisshowed that response times were slower during the performance of PASAT (regardless ofwhether it was presented in the normal hearing or SimHL condition). When no task waspresent, response times to vDRT were faster (M = 294.56 ms) than they were during theperformance of PASAT in the normally hearing (M = 464.36 ms, p < .001), or SimHLcondition (M = 449.26 ms; p < .001). However, the normally hearing and SimHL conditionsdid not differ from each other ( p = 1.00).
A 2 (dCMT, PASAT) × 2 (normal hearing) repeated measures ANOVA of vDRTresponse time data showed no significant main effects or interactions.
Multivariate analysis
There was some evidence of the SimHL reducing vDRT hit-rate during the performance ofPASAT, however this reduction was not significantly different from the hit-rate obtainedduring the normally hearing condition. In order to investigate whether SimHL might affectvDRT hit-rate and response time to a statistically significant extent when taken together,a MANOVA was run with both hit-rate and response time as dependent variables, andlistening condition as the independent variable. No significant effect of listening conditionwas found (p = .57), reiterating that SimHL does not affect performance on vDRT.

240 CHAPTER 8. DRIVING SIMULATOR STUDY
8.4.4 Auditory tasks
Accuracy
Shapiro-Wilk tests exhibited that data regarding the accuracy on PASAT was not normallydistributed, and in the case of dCMT data was non-parametric, thus non-parametricstatistical testing was employed to analyse auditory task accuracy data. Response paradigmswere different between PASAT and dCMT, so their respective results were not contrasted.
A Friedman test performed on the four conditions in dCMT drives was not statisticallysignificant, thus no further testing was carried out on data regarding the accuracy of dCMT.The mean accuracy for PASAT in each relevant experimental condition is thus shown inFigure 8.20.
A Friedman test performed on the four conditions in PASAT drives showed a significantdifference in PASAT accuracy across experimental conditions
(χ2(3) = 10.02, p = .018
).
Subsequent Wilcoxon signed rank tests showed that PASAT accuracy was lower in theSimHL condition, but only when vDRT was absent. Pairwise comparisons between the novDRT and vDRT conditions within normally hearing and SimHL conditions revealed nosignificant differences. Pairwise comparisons between normal hearing and SimHL conditions,however, showed a significant difference in the case of the vDRT absent condition (Z =-2.86, p = .004).
Figure 8.20 Auditory task accuracies for answers given to PASAT with and without thevDRT.
Adherence
In terms of the number of answers given to the auditory tasks, no participant missed ananswer to dCMT under any experimental condition, thus it was considered that engagementin this task was optimal. Shapiro-Wilk tests showed that adherence data for PASAT wasnot normally distributed, and so non-parametric statistical analysis was used. Adherenceto PASAT is summarised in Figure 8.21.

CHAPTER 8. DRIVING SIMULATOR STUDY 241
Figure 8.21 Auditory task adherence for answers given to PASAT with and without thevDRT.
A Friedman test performed on the four conditions in PASAT drives was not statisticallysignificant. Thus, the number of answers being given to PASAT across experimentalconditions were considered comparable. Accordingly, no further statistical testing onadherence to PASAT was carried out.
8.4.5 Summary
A summary of the statistically significant results which have arisen in this study are shownin Table 8.2, and are discussed in the following section with a particular focus on the mostrelevant to this thesis; the influence of SimHL on driving.
8.5 Discussion
This study investigated the influence of two cognitively engaging auditory tasks, whichhave already been shown to vary in the demand they impose (see Chapter 7), on drivingperformance, eye movements and cognitive load whilst driving. The main aim was toestablish if the inclusion of a SimHL on auditory stimuli increased the difficulty of auditorytasks sufficiently to affect driving performance measures, eye movement behaviour, or vDRTperformance. In this section the results in relation to the effect of SimHL will primarily bediscussed. The effect of vDRT performance and the difference between auditory task typeswill be given less attention, given that they were not the main focus of this study.
8.5.1 Driving performance measures
No extraneous effect of SimHL on any of the measures of longitudinal or lateral vehiclecontrol used in this experiment was observed. This suggests that SimHL did not raisethe demands of the auditory task sufficiently to have an effect on measures of drivingperformance. This finding does not support the hypothesis that hearing impaired individuals

242 CHAPTER 8. DRIVING SIMULATOR STUDY
Table 8.2 Significant main effects and interactions suggested from the analysis of thisexperiment.
Dependentvariable
Significant findings
Speed · No effect observed
Headway · More variable during PASAT than dCMT
SDLP · Less SDLP during PASAT than dCMT· Greater SDLP when no auditory task is being performed
Minimum TTLC · No effect observed
HFC · No effect observed
PRC · Less when no auditory task is being performed· Greater during dCMT· Greater during vDRT· During dCMT: increase as a result of vDRT presence greater with
decreasing listening difficulty
Gaze · Less when no auditory task is being performedconcentration · Less for PASAT than dCMT
· Less for vDRT absent· During both dCMT and PASAT: increase as a result of vDRT presence
greater with decreasing listening difficulty
vDRT · Lower hit rate when an auditory task is being performed· Lower hit rate for PASAT than dCMT· Longer response time when an auditory task is being performed
Auditory task · Less accurate in SimHL condition when vDRT absent
are disproportionately affected, in terms of their driving performance, whilst driving underconditions of auditory task load. However, there are a number of factors which areimportant in the analysis of this experiment, and these require careful consideration beforeinferences are made.
Longitudinal vehicle control
It was hypothesised that speed would be disproportionately reduced by the presentationof an auditory task in the SimHL condition, because past work has found a reduction intravelling speed during periods of high cognitive load imposed by auditory tasks (Lansdownet al., 2004; Jamson and Merat, 2005; Lewis-Evans et al., 2011). As cognitive load washypothesised to be greater under the SimHL condition, it was thought that driving speedswould be slowest under the SimHL condition. The fact that this has not been shown,questions whether peripheral hearing impairment causes enough of a cognitive load to havean effect on driving behaviour of this type.
Likewise, it was considered that headway would follow a similar pattern, with anincreased following distance during the SimHL condition, given that past work has shown

CHAPTER 8. DRIVING SIMULATOR STUDY 243
participants adopt an increased headway during auditory task engagement (Strayer andDrew, 2004; Jamson and Merat, 2005). However, this study showed that headway wasnot significantly affected by the presentation of auditory tasks in the SimHL condition.Whilst there was some evidence that the performance of PASAT increased the variabilityof headway when under normally hearing conditions, there was no effect when this taskwas presented in the SimHL condition.
Small headways have been associated with an increased crash risk (Evans andWasielewski,1982; Risto and Martens, 2014). Alm and Nilsson (1995), therefore argue that longer follow-ing distances can be associated with an increased ‘safety buffer’, as they give drivers moretime to react to sudden changes in behaviour of the lead vehicle. The authors suggest thatdrivers may be aware of dangers associated with performing secondary tasks whilst driving(e.g. a delay in detecting salient visual information; Strayer et al., 2003), and increaseheadway in order to account for this. Similarly, Jamson and Merat (2005) explain slowerdriving speeds during task engagement (Brown et al., 1969; Haigney et al., 2000; Strayerand Drew, 2004; Rakauskas et al., 2004; Jamson and Merat, 2005) as a simplification ofthe primary driving task in order to ‘free-up’ resources for the performance of a secondarytask. The fact that participants’ longitudinal vehicle control was not disproportionatelyaffected by auditory tasks presented in the SimHL condition, suggests that they perceivedno extraneous demand as a result of stimulus clarity, and did not alter their speed orheadway accordingly.
Thorslund et al. (2013b) argue that changes in driving speeds of hearing impaired driversare also undertaken in order to provide an increased ‘safety buffer’. The fact that this studyhas shown no such behaviour as a result of SimHL suggests that factors outside of peripheralhearing loss have an effect on hearing impaired drivers’ longitudinal vehicle control. Giventhat Thorslund et al.’s (2013b) sample had a mean age of over 60 years, the differentresults exhibited in this study lead to the suggestion that factors co-existing with hearingloss (e.g. age-related cognitive decline) may raise the cognitive workload requirements ofperforming a task whilst driving, and this may lead to an increased ‘safety buffer’ beingadopted by slowing driving speeds and maintaining an increased headway. However, it isnot clear from the results of Thorslund et al. (2013a,b) whether this adaptation to drivingspeed occurs simply in situations where participants are engaged with a secondary task, orwhether hearing impaired drivers have developed a slower driving speed more generally.The authors have found a slower driving speed during periods of secondary task engagement(Thorslund et al., 2013b), and during the absence of a secondary task (Thorslund et al.,2013a).
Although Hickson et al. (2010) did not find an effect of hearing loss on driving speedin their experiment, this result does not contradict the assertion that adaptive drivingbehaviour is responsible for changes in the speed choice of hearing impaired drivers. Theauthors did not incorporate any interaction with other vehicles in their experiment, thusan increased ‘safety buffer’ would not have been required. It could, therefore, be that the

244 CHAPTER 8. DRIVING SIMULATOR STUDY
increased propensity of slower driving speed in hearing impaired noted by Thorslund et al.(2013a,b) is only apparent during driving environments where other vehicles or obstaclesare present.
Lateral Vehicle Control
Lateral vehicle control was hypothesised to be ‘improved’ by the performance of an auditorytask, and the addition of a SimHL was hypothesised to further ‘improve’ this aspect ofdriving performance. Previous work has exhibited a decrease in SDLP as a result ofauditory task engagement (Brookhuis et al., 1991; Engström et al., 2005b; Jamson andMerat, 2005). Thus, lateral vehicle control appears to be an ‘encapsulated’ part of driving,as described by Medeiros-Ward et al. (2014). Accordingly, a diversion of attention awayfrom this task would actually lead to its improvement. As SimHL was hypothesised todisproportionately increase cognitive load on the auditory task, the allocation of moreattention away from the driving task should have resulted in a more marked improvementin lane-keeping ability.
The current study showed less lateral deviation of the vehicle during auditory taskengagement, and this increased when the type of auditory task being performed was mademore challenging (e.g. PASAT was performed as opposed to dCMT). However, there was noextraneous increase in lane-keeping ability as a result of SimHL, again suggesting that thedemand imposed as a result of SimHL was not significantly increased. By Medeiros-Wardet al.’s (2014) reasoning, it would, therefore, appear that SimHL did not require theallocation of more attention to the auditory task, and so there was no difference in SDLPnoted between the SimHL and normally hearing conditions.
Minimum TTLC and HFC were also used as measures of lateral vehicle control in thisstudy. However, no significant differences in these dependent variables were found as aresult of auditory task engagement. This was expected given that they are measuringsimilar constructs to SDLP. Accordingly, it would appear that, whilst the driver is able tomaintain a more stable position within the lane of travel during auditory task engagement,this does not arise as a result of more corrective steering wheel manoeuvres, nor does itresult in a significantly decreased risk of crossing the road marking into the next lane.
There is no prior evidence to suggest that lane-keeping is improved for hearing impairedindividuals during auditory task engagement, it is simply a hypothesis based on pastexperimental findings in normally hearing individuals (Brookhuis et al., 1991; Engströmet al., 2005b; Jamson and Merat, 2005). However, it might be that an effect was absent inthis study as a result of using a young, normally hearing sample. Again, factors which co-exist with hearing loss may be responsible for an increased cognitive demand of performingauditory tasks whilst driving. The use of a young, normally hearing sample in this studymay have removed these co-existing factors and reduced the extraneous demand thathearing loss and these extraneous factors together pose for auditory task performance.
Contrary to the findings in the current study with regard to speed and headway, the

CHAPTER 8. DRIVING SIMULATOR STUDY 245
absence of an increased lane-keeping ability cannot be simply explained by an adapteddriving style in response to a long-standing hearing loss. Because lateral vehicle control isthought to be an encapsulated, automatic component of driving (Medeiros-Ward et al.,2014) it is likely to be made worse by directed attentional control from the driver. Therefore,whilst alterations in longitudinal vehicle control may arise from behavioural changes in thehearing impaired demographic, it is not considered that lateral aspects of vehicle controlcan be altered as a result of goal-directed behaviour. Thus, the absence of adaptive drivingbehaviour which is exhibited by ‘real’ hearing impaired drivers (e.g. slower driving speeds;Thorslund et al., 2013a,b) in this young, normally-hearing sample does not explain theabsence of the hypothesised changes in lateral vehicle control under SimHL conditions.
8.5.2 Eye movement behaviour
In this study it was hypothesised that PRC would be greater when auditory tasks werepresented in the SimHL condition, and that gaze concentration to the road centre wouldalso be increased. This is because previous work has shown that engagement in auditorytasks decreases the spread of visual search, increasing PRC in normally hearing individuals(Victor et al., 2005; Engström et al., 2005b; Victor et al., 2008). The extra demand imposedon the auditory task by SimHL was hypothesised to make this trend more marked, andshow a further reduction in visual search and an increase in PRC from the normal hearingcondition. A trend of this type would explain Hickson et al.’s (2010) findings of a reductionin road sign recognition (visual information which was presented in the periphery).
PRC and gaze concentration were significantly increased by the addition of an auditorytask, and this trend became more marked as a result of increasing the demand of thetype of auditory task being performed (e.g. PRC was increased to a greater extent duringPASAT than it was during dCMT). However, there was no extraneous effect of SimHLnoted on either dependent variable. In the context of SDLP results, this is unsurprising. Adecrease in SDLP as a result of auditory task engagement whilst driving (e.g. Brookhuiset al., 1991) has been explained through an increase in gaze concentration to the roadcentre (Engström et al., 2005b). This pattern of eye movement behaviour is thought toarise because the most likely area in which an obstacle will arise whilst driving is in theforward position (Jamson and Merat, 2005). It is argued that the increased gaze to the roadcentre gives a superior perception of the roadway, in turn leading to improved lane-keeping(Jamson and Merat, 2005). Because, improved lane-keeping as a result of SimHL was notapparent in this study, it follows that PRC and gaze concentration were also comparablebetween normally hearing and SimHL conditions.
Although no previous study has explicitly investigated the effect of auditory distractionon eye movements whilst driving in the hearing impaired demographic, some research hasnoted that eye movement behaviour is altered during normal driving in these individuals.Importantly these findings have arisen from studies either using no task secondary todriving (Thorslund et al., 2013a), or a secondary visual task (Thorslund et al., 2014).

246 CHAPTER 8. DRIVING SIMULATOR STUDY
However, manipulations in eye movement behaviour noted by Thorslund et al. (2013b,2014) were explained by hearing impaired drivers adopting a more careful approach todriving. The authors noted that hearing impaired drivers adopt an increased propensityfor using their rear and side view mirrors. They envisaged that this type of behaviouroccurred as an acclimatisation effect, stating that hearing impaired drivers may be lessaware of their surroundings whilst driving, and accordingly compensate by increasing theirvisual scanning of the surrounding environment. Again, this type of behaviour is unlikelyto have been observed in this experiment, in a young, normally hearing sample who havebeen suddenly presented with a SimHL.
The changes to eye movement behaviour that were expected in this study were differentfrom the type of adaptive eye movement behaviour Thorslund et al. (2013a) observed.Instead, alterations were expected as a direct consequence of engaging with an auditorytask. Both of these underlying reasons for altered eye movement behaviour in hearingimpaired drivers can explain the results of Hickson et al. (2010). The authors did notmeasure eye movements during their experiment, and explain their finding as a reductionin the functional visual field as a result of a disproportionate increase in cognitive workload.It is, however, not possible to infer if this is correct through the data they collected.Their results could, in addition to a visual field reduction or adapted driving style, alsobe explained by a failure of general attention selection, rather than a specific perceptualnarrowing (Victor et al., 2008). This was expected in this study, and was measured byusing the vDRT during auditory task engagement.
The current experiment did not assess a visual field reduction in hearing impaireddrivers whilst engaging in an auditory task, but the possibility that perceptual narrowingmay be affected by hearing loss (Hickson et al., 2010) should not be discounted. Indeed,the study described in Chapter 5 hinted that the performance of UFOV, which measuresvisual processing efficiency in the functional visual field, might be reduced in ‘real’ hearingimpaired individuals whilst they perform an auditory task. Further research using a tasksuch as the PDT, which can measure visual responses at varied eccentricities, may beapplicable in this regard. What the results of the current study do suggest, however, isthat SimHL did not increase the cognitive demands of driving with an auditory task overand above those imposed during the normal hearing condition.
8.5.3 Visual Detection Response Task performance
vDRT performance also supported the finding that SimHL does not raise cognitive workloadof driving whilst performing an auditory task over and above a normal hearing condition.The vDRT was included in this study as a sensitive measure of cognitive workload, and wasseen as an applicable manner in which to test the inference that cognitive load would behigher under SimHL conditions. The vDRT is hypothesised to measure general attentionalcontrol (Victor et al., 2008), providing an indirect measure of a reduction in attentionswitching ability between the visuospatial sketchpad and phonological loop. This was

CHAPTER 8. DRIVING SIMULATOR STUDY 247
hypothesised to occur more often in hearing impaired individuals (see Chapter 3).It was expected that SimHL would make auditory information less distinct, engaging
the central executive more, and thus reducing the ability to switch between the phonologicalloop (for the performance of the auditory task) and the visuospatial sketchpad (for theperformance of the vDRT and driving). By this reasoning, vDRT hit rate should havedecreased and response time increased during auditory task engagement with a SimHL. Hitrate and response time to the vDRT was negatively affected by the concurrent performanceof an auditory task, and increasing the difficulty of the task type being performed resultedin further decrements (e.g. response times were slower and hit rates higher during PASAT).However, the addition of a SimHL on either auditory task type had no extraneous affecton either hit rate or response time.
This finding suggests that cognitive workload was no greater as a result of performingauditory tasks in the SimHL condition whilst driving. Again, this reiterates the suggestionthat the peripheral representation of a sound source does not disproportionately increasecognitive load. Instead, factors which co-exist and interact with hearing loss, or an adaptivedriving style, are likely to be responsible for previous experimental findings exhibitingdriving changes as a result of hearing loss.
In fact, if the vDRT were being undertaken by a driver with an actual hearing loss,performance could be subject to complications arising as a result of an adaptive drivingstyle. Thorslund et al. (2013b) cite a withdrawal from secondary task engagement inhearing impaired drivers as part of their hypothesised adaptive driving style. Thus, it isconsidered that an increase in cognitive load experienced by those with actual hearingimpairment may lead them to shed performance of secondary tasks (e.g. the vDRT) whilstdriving. Thus the measurement of vDRT performance whilst driving in those with anactual hearing loss would be of interest.
One interesting trend arose, in that during the performance of PASAT, SimHL tended toreduce the hit-rate achieved by participants. This trend was not significant, but does raisequestions over whether there may have been a small effect of SimHL on the performanceof vDRT. This was the only measure used in this study which showed a trend of beingaffected by SimHL. Therefore, there is a possibility that peripheral hearing loss mightlead to an increase in cognitive workload whilst an auditory task is being undertaken.Likewise, if the vDRT is considered as a metric of peripheral hazard detection (as wasdiscussed earlier), this may suggest that some hazards are seen less often as a result ofhearing impairment during the performance of an auditory task. Although this cannot beinferred from the current data, given the lack of statistical significance, this possibilityshould not be discounted. This is particularly true, because it ties in with the results ofHickson et al. (2010), who found a reduced propensity of their hearing impaired drivers innoticing peripheral road signs during auditory task engagement.
It should also be noted that a main effect of vDRT presence on gaze concentrationand PRC was found. This is an important methodological consideration for future work

248 CHAPTER 8. DRIVING SIMULATOR STUDY
in the area, because it exhibits that vDRT is not a completely unobtrusive measure ofworkload. This concurs with the interaction that was also present between listeningcondition and vDRT absence for PASAT accuracy, suggesting that vDRT has a bearingon the performance of independent variables. In fact, the significant interactions betweenlistening condition and vDRT presence for PRC and gaze concentration data are consideredartefacts, and have not, therefore, been analysed in any further detail. The increase ingaze concentration as a result of vDRT being present was shown to become greater withdecreasing listening difficulty. However, closer inspection of the results suggests that thishad occurred simply because there was a hierarchy of differences in eye movement behaviouras a result of listening difficulty, which was then masked by vDRT causing a similar patternof eye movement behaviour across listening conditions. This gave the false impression thatvDRT presence and listening condition had interacted, whereas listening condition was theindependent variable responsible for the statistical significance. Statistical outcomes suchas these highlight the caution that should be exercised when using vDRT in experimentalstudies of this type.
Prior to the performance of this study, it was considered that undertaking the vDRTmight alter eye movement behaviour, as past work using the similar PDT task resulted inparticipants fixating on visual stimuli presented in the periphery of vision (Miura, 1986).Accordingly, the experimental design accounted for this possibility, so that eye movementbehaviour could be analysed independently of vDRT presence. Thus, this effect of vDRTon dependent variables associated with eye movement behaviour did not have a impact onanalyses concerned with answering the research questions posed.
8.5.4 Auditory task performance
dCMT and PASAT results were analysed in this study to check whether participants hadwithdrawn from performing the auditory tasks in order to simplify the driving task. Thiswould have reduced the cognitive workload imposed by the SimHL and was, as such, notdesirable in answering the research questions posed. There was, however, no evidence tosuggest that this was the case. There was no significant difference between the number ofanswers given to either auditory task in the normal hearing and SimHL conditions.
However, when the vDRT was absent, PASAT accuracy was significantly decreasedduring the SimHL condition. The absence of a reduction in PASAT accuracy in the SimHLcondition during the presence of the vDRT requires explanation. It may have been thatduring what were effectively triple task conditions (driving, auditory task, and vDRT),a raised cognitive workload led to task performance being highly variable, reducing thepower of the statistical analysis undertaken. Indeed, the standard deviation of auditorytask accuracy during PASAT trials with vDRT present was greater (S.D. = 6.0) than itwas when the vDRT was absent (S.D. = 4.6).
The finding of a lower PASAT accuracy in the SimHL condition raises two importantpossibilities:

CHAPTER 8. DRIVING SIMULATOR STUDY 249
1. A dual-task cost as a result of performing PASAT in the SimHL condition whilstdriving was observed, and accordingly auditory task performance was reduced.
2. Participants managed their cognitive load in order to maintain driving performanceby decreasing attention to the performance of auditory tasks once demand reached acertain level.
The adherence data for the auditory tasks suggests that it is the first of these twopossibilities which is most likely. Furthermore, whilst the second of these two suggestionscan explain why driving performance decrements as a result of SimHL were not observedin some instances, it cannot for others. PASAT was the only task which was affected bySimHL in terms of its accuracy, dCMT was not. Some dependent variables were affected toa greater extent by dCMT than PASAT (PRC and gaze concentration), and others were stillaffected by the performance of dCMT even if not to a greater extent than PASAT (SDLPand vDRT). SimHL is thought to raise the processing demands required to complete thedCMT task successfully (see Chapter 7). Thus, because participants engaged in this taskregardless of the listening condition, its performance in the SimHL should have resulted insome driving behaviour changes, but did not.
Accordingly, it was concluded that participants did not simply withdraw from performingthe PASAT under difficult listening conditions in order to maintain driving performance.Rather, it is argued that a dual-task cost was observed, such that when the listeningtask became more difficult (as a result of SimHL), the cognitive demands imposed byundertaking the auditory task whilst driving were sufficient to cause a disruption onperformance of the auditory task. Whilst the auditory task appeared sensitive to thisincreased cognitive load, measures of driving performance and the vDRT did not.
Hickson et al. (2010) is the only other study which has investigated the effect of auditorydistraction whilst driving in hearing impaired individuals. They employed a task verysimilar to PASAT, whereby participants were presented with two numbers in the auditorymodality, and had to add them together. Data regarding the accuracy on this auditorytask during driving was presented, and suggested that there was no significant differencein the number of answers being given, or the accuracy on sums, between normally hearingand hearing impaired participants. However, their presentation rate for stimuli was 3.5seconds, compared to the 2 seconds used in this study, thus giving participants extratime in order to be able to formulate a response. It should be noted that this differencein presentation rate was also more likely to make the task in the current study morechallenging, yet a significant effect on driving as a result of SimHL was still not found.This further compounds the inference that factors co-existing with hearing loss which werepresent in the experiment of Hickson et al. (2010) are likely to be mostly responsible fordriving performance decrements.

250 CHAPTER 8. DRIVING SIMULATOR STUDY
8.5.5 General considerations
The results of this study suggest that hearing loss does not disproportionately affect drivingperformance whilst a concurrent auditory task is being undertaken. An ecologically validSimHL (see Chapter 6) has been applied and compared against a normal hearing conditionin a simulated driving environment whilst performing an auditory task, and no differencein any of the dependent variables used has been observed. Previous research which hasfound an effect of hearing loss on driving contradicts these results (Hickson et al., 2010)and prompts considerations regarding the reasons for no effect of SimHL being observed inthis experiment. Given the methodology used, a number of explanations for the differencesin outcomes against previous research can be suggested:
1. Aspects of SNHL not emulated by the SimHL are responsible for driving decrements.
2. Factors which co-exist with SNHL are, at least in part, responsible for drivingdecrements.
3. An adapted driving style, which has been developed over a long period of time isresponsible for certain observations regarding driving performance.
These factors are all feasible, and it is entirely possible that they may all (or a number ofthem) account for the lack of an effect of SimHL on dependent variables in this experiment.
However, it is considered that the SimHL used replicates the most troublesome aspectsof SNHL for speech understanding (Moore, 2007), and in an ecologically valid and accuratemanner, as has been suggested by the work described in Chapter 6. Thus it was consideredthat the SimHL used provided a fair approximation of actual hearing loss, and wasapplicable for use in the current study. However, the possibility that it has not capturedall pertinent aspects of SNHL should not be discounted, and further research with youngindividuals with an actual hearing impairment should be undertaken in order to expandthe research findings presented here.
However, in support of the hearing loss simulation, the experiments described inChapter 7 showed that listening effort demands imposed by a moderate SimHL causedauditory tasks of all difficulties to be more poorly performed than they were under normallyhearing conditions. This suggests that cognitive workload is higher as a result of performingan auditory task in the presence of a moderate SimHL.
One difference in the presentation paradigm of auditory tasks in this study should,however, be pointed out. Whereas in the previous study auditory stimuli were processed atan input level of 60 dB, in this experiment they were processed at a reference level of 80 dB.The reason for this change was to provide audibility of the auditory tasks. Furthermore, ineach case the selected levels were considered ecologically valid in terms of the environmentsin which they were being presented; a normal conversational level of speech equates to 60dB (Skinner et al., 1997), and the background level of noise in car cabins is such that itwould require an increase in this level in order to ensure audibility (Wang and Wang, 2012).

CHAPTER 8. DRIVING SIMULATOR STUDY 251
The change to input level would have had no effect on the spectral smearing portion of theSimHL and would, therefore, not have changed the clarity of the auditory signal. It would,however, have made subtle changes to the loudness recruitment portion of the SimHL.These changes may have restored some of the loudness relationships between phonemeswhich were absent at a 60 dB input level, potentially reducing the amount of explicitprocessing required in order to perform the auditory task. However, an increase in explicitprocessing would still be expected as a result of just the spectral smearing paradigm, asstimuli were being presented in a background noise (Baer and Moore, 1993). Accordingly,an effect on experimental outcomes would still have been expected. Future work should,however, assess whether different presentation levels of auditory stimuli have an effect ondriving under the same experimental conditions.
Besides limitations of the hearing loss simulation, the two possibilities for differences inexperimental outcomes between the current study and past research are that differencesin driving in hearing impaired individuals may occur as a result of adaptive drivingbehaviour which is developed over time, or that factors which co-exist with hearing loss areresponsible (at least in part) for driving decrements. These two suggestions can feasiblyboth occur simultaneously, in fact they can both explain outcomes in previous research.This study employed a SimHL in young, normally-hearing participants, whereas previousstudy investigated older individuals with a ‘real’ SNHL (Hickson et al., 2010). SimHLwas used in order to isolate the effect of sensory acuity as a result of hearing impairmentfrom other age-related factors which co-exist with hearing loss. The difference in outcomesappears to suggest that it is co-existing factors, present in the study of Hickson et al.(2010), but not in this study, which are mostly responsible for noted driving decrementswhilst concurrently performing an auditory task in those with a hearing loss.
Thorslund et al. (2013a,b, 2014) did not investigate the effect of auditory distractionon driving, but did assess the driving of those with an actual hearing loss. This work wascarried out with an older demographic, primarily experiencing acquired hearing losses, andalso found alterations in driving outcomes. In these experiments no auditory distraction(and thus increase in cognitive load as a result of listening effort) was present, and sothe research group argue that these outcomes have been observed as a result of adaptivedriving behaviour. Something which, the authors argue, has been adopted in response to alack of situation awareness whilst driving. This adaptive driving behaviour would certainlynot have been present in the sample used in this study, and so might be a further reasonwhy changes in driving performance were not observed under SimHL conditions.
8.5.6 Study limitations
This study has investigated the effect of hearing loss on driving under one specific set ofcircumstances. This approach was taken in order to ensure experimental control, and hasresulted in a number of important outcomes, which enhance knowledge regarding the effectof hearing loss on driving performance. However, its findings should not necessarily be

252 CHAPTER 8. DRIVING SIMULATOR STUDY
considered as transferable to all driving situations.The experiment was run in a simulator, and the environment consisted of a single
carriageway road and a car-following scenario. Hickson et al. (2010) found their resultsduring a field trial, meaning that discrepancies between simulator and ‘real world’ drivingmight justify differences in experimental outcomes. Furthermore, the complexity of thedriving scenario was not considered to be significantly challenging.
A wide variety of driving scenarios were not covered in this experiment (e.g. complexmanoeuvres, driving in heavy traffic, motorway driving). SimHL could have an effect onthe dependent variables used in this experiment during more visually demanding situations,though it is not possible to say whether this is the case from the design of this study.If the visual demand of the driving task is increased, disproportionate central executiveengagement with auditory operations may have more of a negative effect on the efficiencywith which visual processes can be carried out. The study of Hickson et al. (2010) didnot incorporate any other traffic, but it did present participants with a number of tasksthey had to complete whilst driving, some of which were visual in nature (e.g. road signrecognition, perception of obstacles). Thus, the difference in findings noted here mayhave been as a result of a lower primary driving demand. Further research employing theexperimental paradigm used here, but in environments with different driving demands,would, therefore, be of interest in the development of knowledge in this area.
Furthermore, only a single degree and configuration of hearing loss has been investigated.A moderate SimHL was chosen for investigation, given that this level of impairment hasaffected driving performance in past study (Hickson et al., 2010). The configuration of theSimHL condition was chosen to be reflective of age-related hearing loss (Gates and Mills,2005), and will have, therefore, provided similar perceptual consequences as have beenapparent in previous work, given that an elderly sample was studied (Hickson et al., 2010).Without investigating different hearing loss severities and types, it is not possible to saywhether SimHLs of greater magnitudes would produce an effect on driving performance.According to the ELU model, the greater the degree of hearing loss, the greater the amountof explicit processing required, and the greater the effect on concurrently performed tasks.Investigation of greater hearing loss severities was not possible using the type of SimHLemployed in this experiment. Future work investigating more severe SimHL would be ofinterest in the development of work in this area.
8.6 Conclusions
It was hypothesised that a SimHL would cause an increase in the listening effort required toperform aurally presented tasks. This increased listening effort was postulated to manifestin an exacerbation of driving performance changes which occur as a result of auditorytask performance. This study has not presented evidence to support this hypothesis. Nodifference in measures of longitudinal or lateral vehicle control, eye movement behaviour,

CHAPTER 8. DRIVING SIMULATOR STUDY 253
or cognitive workload were apparent between normal hearing and SimHL conditions. Theseoutcomes remained regardless of the difficulty of the auditory task being undertaken.However, there is some evidence that auditory task performance whilst driving might sufferas a result of hearing loss. Thus, research into the applicability of in-car systems whichmake use of auditory information for hearing impaired individuals is considered important.
A failure to observe these hypothesised outcomes has led to the conclusion that a facetof hearing impairment not captured by the SimHL used is responsible for previously notedchanges in driving behaviour. These factors have been identified as: (1) physiologicalaspects of SNHL which the SimHL did not address, (2) complications which co-exist withhearing loss, such as age-related changes in cognitive function, and (3) the development of‘coping strategies’ in hearing impaired drivers in order to negate these driving performancedecrements. Further work is required in order to establish to what extent each of theseissues plays a part in driving performance alterations. Thus, the results of this study presentnovel information regarding the effect of hearing impairment on driving and related tasks,though they should not be considered entirely conclusive. Rather, they raise importantquestions which require further investigation. The most pertinent questions which ariseare discussed in the final chapter of this thesis (see Chapter 9).


Chapter 9
Final Discussion andRecommendations
In this chapter, the results obtained from the programme of research reported in this thesisare discussed in relation to the research questions posed in Chapter 2 (see Table 2.4). Theimplications of the research are also discussed, and recommendations made regarding thedirection of future research.
9.1 Main findings
Eight specific research questions were posed for investigation in Chapter 2, and the seriesof experiments reported in this thesis have answered these, as follows:
1. Is hearing impairment seen as a cause of any problems for driving bypeople with a hearing loss?
2. Do people with a hearing loss report any alterations to their own drivingbehaviour?
3. Is there a difference between self-reported and pure tone audiometrymeasures of hearing loss in terms of their affect on experienced drivingproblems?
These questions were all addressed by the study described in Chapter 4, which found thathearing impaired individuals did not see hearing loss as a cause of any driving problems.Although some respondents did suggest that hearing loss might present a problem fordriving generally, this was certainly not the majority view, nor was there a consensusregarding specific manners in which this might be the case. Accordingly, the study alsoshowed no significant alterations in driving behaviour in hearing impaired individuals,except for some reporting that they drive more slowly than a comparable normally hearinggroup. This finding concurred with past research in the area (Picard et al., 2008; Thorslund
255

256 CHAPTER 9. FINAL DISCUSSION
et al., 2013a,b), and suggested that hearing impaired drivers might alter their driving speedin order to account for driving decrements. Although it should be considered that this maysimply have been due to a general increase in speed limit compliance over time.
Furthermore, it was shown that self-reported hearing loss was a better predictor ofreports of driving difficulties/behaviour changes than pure tone audiometry data. Thissuggested that functional hearing ability (the extent to which somebody struggles withtheir auditory impairment) governs the extent to which somebody experiences drivingproblems as a result of hearing loss, rather than an individual’s auditory sensitivity. Thisdid not entirely agree with recent hypotheses regarding why hearing loss affects driving,because auditory sensitivity has previously been considered the most important factor(Hickson et al., 2010). Thus, questions were raised about the influence of other factorswhich are linked to functional hearing ability (e.g. cognitive skills; Salonen et al., 2011).
Given the disconnect between reports of hearing loss affecting driving and changes indriving speed, there was some concern that introspection had not been possible to establishwhat effect hearing loss was having on driving. i.e. although past driving decrementshad been shown in hearing impaired individuals (Hickson et al., 2010), this happenedsubconsciously and therefore respondents were unaware and unable to report the behaviour.Another possible explanation for this was that those who self-reported a hearing loss weresimply more likely to self-report other problems (e.g. experiencing an affect of their hearingloss on driving), hence the association between self-reports of driving difficulty/behaviourfrequency and hearing loss.
Because of the uncertainty regarding the efficacy of self-reports, a more objective courseof research was implemented in order to identify whether hearing loss was subconsciouslypresenting problems for driving performance. Chapter 4 did not present any specificdriving concerns for investigation, given that the majority of hearing impaired respondentshad indicated no effect of hearing loss on driving. Accordingly, findings from previousresearch informed the direction of the first objective study. Past evidence had suggestedthat hearing impaired individuals were less visually aware than their hearing counterpartswhilst concurrently performing an auditory task and driving (Hickson et al., 2010). Thiswas an interesting finding because it concurred with research showing an effect of auditorydistraction whilst driving on failures of visual attention (e.g. Strayer et al., 2003) andalterations in eye movement behaviour (e.g. Victor et al., 2005). Therefore, it wasconsidered that visual attention may be one of the manners in which hearing impairmentpresented problems for driving performance in the presence of a concurrent auditory task.Accordingly, the next research question posed was:
4. Does hearing impairment disproportionately alter visual processing effi-ciency during auditory task engagement?
The study described in Chapter 5 investigated this possibility in a laboratory setting. Inline with previous work (Wood et al., 2006), the results showed that visual processing

CHAPTER 9. FINAL DISCUSSION 257
within the useful field of view is significantly less efficient when a concurrent auditory taskis being undertaken. The results also suggested that this effect was more pronounced inhearing impaired individuals, but the results did not reach statistical significance.
Interestingly, some other differences between normally hearing and hearing impairedindividuals arose, although they were not expected. For example, hearing impaired partici-pants appeared to have poorer Working Memory abilities than their hearing counterparts; areading span task was significantly more poorly performed by the hearing impaired sample.Furthermore, the results hinted that hearing impaired individuals performed a rhyme taskmore poorly than their hearing counterparts, and were also worse at performing the dividedattention subtest of UFOV in the absence of any auditory task. These results were curious,because the only variation expected between the hearing impaired and normally hearingindividuals was a difference in outcomes as a result of auditory task engagement.
This evidence, arising from Chapter 5, highlighted concerns that the only differencebetween hearing impaired and normally hearing individuals was not auditory perception.Rather, poorer Working Memory abilities, which data suggested were more prevalent inhearing impaired individuals, were suggested as having an effect on study outcomes. Thispotential reliance on factors extraneous to hearing loss was of particular concern, becausehearing loss is an age-related sensory impairment (Davis, 1995), and as such brings withit a range of other age-related considerations. An important example being cognitivedecline (Salthouse, 1991), a factor which becomes even more pertinent in light of theissue that hearing loss might be associated with cognitive decline (see Chapter 3). Suchexamples of discrepancies in the baseline abilities of hearing impaired and normally hearingindividuals may go some way towards explaining why past research investigating the effectof hearing loss on driving has reached mixed outcomes. For example, past work has givencontradictory conclusions in terms of road traffic accident rates (Barreto et al., 1997; Iverset al., 1999; Picard et al., 2008 vs. McCloskey et al., 1994; Sims et al., 2000; Green et al.,2013), and has shown visual distraction to affect hearing impaired individuals to a greaterextent than normally hearing drivers (Thorslund et al., 2013b, 2014) when it should not,according to the hypothesis of other authors (Hickson et al., 2010).
This problem led to the identification of a method which could control for theseextraneous variables which were potentially having an effect on study outcomes. A methodof simulating hearing loss in young, normally hearing individuals was identified andtested, and showed that hearing loss could be administered in an accurate and ecologicallyvalid manner (see Chapter 6). Applying this simulation allowed for a within-subjectsexperimental design to be used so that the only difference between experimental conditionswould be auditory perception. However, it was unclear whether a simulation of hearingloss would result in increased listening effort, as is hypothesised to occur in individualswith an actual hearing loss (Rabbitt, 1991). In order to test this assumption, the nextresearch question posed was:

258 CHAPTER 9. FINAL DISCUSSION
5. Is the performance of auditory-based cognitively demanding tasks mademore difficult by sound distortion representative of hearing loss?
The study described in Chapter 7 tested whether this SimHL resulted in performancedecrements on auditory-based cognitive tasks. The results showed that tasks of varieddifficulty were negatively affected by the inclusion of a SimHL, thus suggesting thatauditory sensitivity has the capacity to affect cognitive performance as a result of perceptualdifficulties. This finding concurred with the hypothesis of past work that sound distortionhas a downstream effect on cognitive processes (e.g. Rabbitt, 1991).
Hickson et al. (2010) had previously extended this thinking to show that the effect ofincreased listening effort in hearing impaired individuals impacts on driving performance.However, their findings arose from a sample of older adults, which would have incorporatedthe extraneous factors suggested in Chapter 5. Accordingly, it was questioned whetherSimHL would show an effect on driving performance in the presence of an auditory task.This would establish the extent to which hearing loss alone affected driving performance,and so the next research questions addressed were:
6. Does the distortion to sound brought about by hearing impairment at aperipheral level have the capacity to affect driving performance when asimultaneous auditory task is present?
7. What are the measurable vehicle control and behavioural correlates ofthis effect on driving performance?
8. Do people limit engagement in secondary tasks in order to maintain suc-cessful driving performance?
The study reported in Chapter 8 confirmed that auditory task engagement whilst drivingleads to a previously observed set of driving performance outcomes (see Chapter 2).However, it was shown that this trend did not become more marked as a result of SimHL.Therefore, the data gathered suggested no vehicle control or behavioural correlates whichare affected by peripheral hearing loss when driving and concurrently performing anauditory task. There was also little tangible suggestion that this observation had arisenas a result of withdrawal from auditory task performance in order to maintain drivingperformance.
Therefore, this work has suggested that mild or moderate, age-related hearing loss in itsown right does not have the capacity to impair driving performance to a disproportionateextent as a result of auditory distraction. This is contrary to past work which has observedan effect of hearing loss on driving; whether it be implied by road traffic accident rates(Barreto et al., 1997; Ivers et al., 1999; Picard et al., 2008), or as a result of measureddriving performance (Hickson et al., 2010; Thorslund et al., 2013a,b, 2014). Given thatthese studies all used participants with actual hearing loss, and did not extensively control

CHAPTER 9. FINAL DISCUSSION 259
for cognitive abilities, it can be concluded that cognitive factors are (at least in part)responsible for driving decrements in the hearing impaired.
Furthermore, some of the studies which have found an effect of hearing loss on drivingsafety have been carried out in specific demographic groups, which may have confoundedtheir outcomes. Both Barreto et al. (1997) and Picard et al. (2008) studied individuals withnoise-induced hearing losses who worked in noisy, industrial environments. It is consideredthat those who develop a significant noise-induced hearing loss in such an environment mayhave undertaken risky behaviour such as neglecting to wear hearing protection providedby their employer. Behaviour of this type may predispose other risky behaviour which islinked with road traffic accident frequency, such as speeding (Aarts and Van Schagen, 2006).Likewise, pre-existing cognitive impairments resulting in individuals not understanding theimportance of hearing protection may also have led to the development of a noise-inducedhearing loss. These potential confounds highlight the possibility that other factors tied tohearing loss may have inflated the effect found on driving performance in previous studies.
It is important to note, however, that the potential susceptibility of past work tothe influence of these co-existing factors does not render it flawed. In fact, quite theopposite - the work is highly valuable because it provides an ecologically valid view ofdriving in the hearing impaired demographic. Given the link between hearing loss andage (Davis, 1995), those with a hearing loss will often exhibit age-related informationprocessing declines which may cause driving performance decrements, and as such thecumulative effect of all of these factors should (and appears to be) reflected in experimentaldata. However, whilst this ecological approach to research in this area can say somethingabout the driving performance of hearing impaired individuals, it cannot explicitly sayanything about driving performance considerations as a direct result of hearing impairment.This distinction is highly important because the latter provides information about whydriving performance decrements occur, how they might be remedied, behaviours whichmay exacerbate these problems, and suitable procedures for identifying drivers who areat-risk. It is this information which the work described in this thesis has begun to unravel.
Thus, this programme of novel research has significantly contributed to evidence neededto answer the overarching research question posed by this thesis: “does hearing impairmentaffect driving performance?” The message arising from prior research is that auditorydistraction does have an effect on hearing impaired drivers’ performance (Hickson et al.,2010). However, the work described in this thesis has shown that damage to the peripheralauditory system (in line with with mild or moderate, age-related hearing loss) in isolationis not likely to be responsible for significant changes in the measures of driving performancewhich were recorded in this programme of research. It should, however, be noted thatthe driving and auditory tasks employed in the final investigation described in this thesiswere of low complexity. The use of either more complex driving situations (e.g. traversingintersections, lane changing tasks etc) or more complex auditory processing tasks (e.g.sentence or prose processing) may have revealed significant impacts of SimHL on driving.

260 CHAPTER 9. FINAL DISCUSSION
Thus, further research is required before the above suggestions can be more definitivelyproven. Further, since severe hearing loss could not be adequately simulated, it was notexamined in the studies described in this thesis. Therefore, no strong conclusions regardingthe effect of severe hearing impairment on driving performance can be made.
Given the discrepancy between the findings of the research described in this thesis, andthat which has been previously performed, it appears that the presence of other co-existingfactors, such as age-related changes in cognitive function, may have the capacity to interactwith hearing loss and potentially affect driving performance. This consideration has beenbrought to light by the findings of this programme of research. However, the extent towhich these co-existing factors influence and interact with driving performance cannot beexplicitly inferred from my studies. This is because the focus of this work was to extractthe influence of peripheral hearing loss alone on driving, rather than investigate the effectof other co-existing factors.
9.2 Real-world application
The primary concern of this line of research is road safety; i.e. the consideration thathearing impaired individuals may be less safe drivers than normally hearing individuals.This was one of the main motivations for my research, given that some authors havehypothesised a decrease in driver safety for this demographic (Barreto et al., 1997; Iverset al., 1999; Picard et al., 2008; Hickson et al., 2010), and that certain licensing authoritiesdo not allow people with a severe hearing impairment to drive, under the perception thattheir (and others’) safety is affected by this impairment (World Federation of the Deafand the Swedish National Association of the Deaf, 2008). In contrast to these opinions,the work reported in this thesis suggests that hearing loss alone does not predispose adriver to be more affected by auditory distraction, and is thus not necessarily any less asafe driver than a normally hearing individual in this regard. Therefore, the sentiments ofHickson et al. (2010) that hearing impaired individuals should limit their engagement within-vehicle devices whilst driving appears to be an overly-simplistic one. The implicationof my work is that other co-existing factors must be considered alongside hearing loss inorder to gauge potential driving performance decrements.
A great deal of attention has been paid to identifying at-risk drivers in terms ofvisual sensory impairment (see e.g. Anstey et al., 2005 for a review), and there arestrict sensory criteria that must be met for an individual to be granted a driver’s licence.Currently, no such licensing criteria exist for hearing impaired individuals in the UnitedKingdom. However, objective hearing tests are required by certain licensing authorities(e.g. Australia) to ensure their commercial drivers meet a minimum hearing standard.Because the work presented in this thesis has shown no extra effect of auditory distractionon the driving of hearing impaired individuals as a result of hearing loss alone, tests ofhearing sensitivity used in isolation are unlikely to predict driving decrements as a result

CHAPTER 9. FINAL DISCUSSION 261
of auditory distraction. Much like evidence regarding visual sensory problems and driving,the effect of hearing loss on driving appears to be reliant on higher-order cognitive processeswhich are not specifically targeted by objective measures of sensory functioning (e.g. puretone audiometry, or static visual acuity for a visual parallel). Thus, any assessment to bedeveloped in this regard must reflect higher-order cognitive capabilities, much like UFOVhas attempted to achieve in the realms of assessment in terms of visual function. Of course,an extension to UFOV incorporating auditory distraction would require validation.
However, it would appear that the main focus of licensing authorities with regardto hearing loss is the inability to hear acoustic information in the car, rather than anadditional effect of auditory distraction. It is difficult to comment on this aspect of theresearch topic, because this project did not aim to investigate the effect of unheard auditoryinformation in the driving environment. An absence or attenuation of auditory cues inthe driving environment may cause problems for the hearing impaired, but this is anintuitively predicted issue, and one which could be remedied by adaptive mechanisms suchas an improvement in visual processing ability (Bavelier et al., 2000, 2006). This problemmay also be improved through the use of hearing aids. Indeed, the Australian licensingauthority themselves allow the use of hearing aids in order to allow an individual to meettheir minimum hearing requirements for the issue of a commercial license.
Hearing aids may also be applicable in minimising the effect of auditory distraction, asthey are thought to reduce listening effort (Sarampalis et al., 2009). However, this shouldbe considered carefully because emerging evidence suggests that the benefit derived fromhearing aids is linked to Working Memory abilities, such that those with better cognitiveabilities will derive more benefit from hearing instruments (Lunner et al., 2009; Rudneret al., 2011). This is concerning because an assertion arising from the work reported inthis thesis is that cognitive skills interact with hearing loss to produce an effect on drivingperformance; thus those with lesser cognitive abilities will be the ones who experienceproblems with their driving, as well as being those who do not gain optimal benefit fromhearing instruments. Furthermore, the efficacy and acceptance of hearing aid use in thecar has been previously considered a concern (McCloskey et al., 1994), particularly asthe acoustic environment is not particularly favourable for their success (with high levelsof background noise and an inability to face the speaker). Indeed, this was mentionedanecdotally by audiological clinicians in my study reported in Chapter 4.
Chapter 4, however, also showed a very positive attitude from hearing impairedindividuals about the use and benefit of hearing aids during driving. Contrary to theperceptions of clinicians, patients reported using their hearing aids more often whilst drivingthan during everyday situations and noted no negative impact of their hearing instrumentson driving performance. Audiologists often inform patients of acoustic environments inwhich hearing aids may or may not be beneficial, managing patient expectations of hearinginstruments in order to maximise the benefit from rehabilitation (Knudsen et al., 2010). Apreconception that hearing aids would not work well whilst driving may, therefore, lead

262 CHAPTER 9. FINAL DISCUSSION
to inaccurate use of hearing aids by patients, and should be reconsidered in light of thefindings reported in Chapter 4.
However, the commonly held view that hearing loss does not affect driving (see Chap-ter 4) tends to suggest that employing rehabilitative measures aimed at improving thedriving performance of hearing impaired individuals may be difficult. This is because thosewith a hearing loss will not wish to employ a measure aimed at improving something whichis not perceived as a problem in the first instance. Thus, a challenge which faces cliniciansis how hearing impaired individuals can be persuaded to accept advice with regard toimproving driving performance.
Another potential manner in which the effects of hearing loss on driving performancecan be counteracted is by adopting a driving style accounting for driving performanceshortcomings. It is suggested that adaptive driving behaviour is undertaken in those witha hearing loss (Thorslund et al., 2013a,b, 2014), though it is uncertain whether this drivingbehaviour is as a result of hearing loss, co-existing factors, or an amalgamation of the two.What is clear, from the results presented in Chapter 4, is that this phenomenon is likely tobe of a subconscious nature; hearing impaired individuals do not see hearing impairmentas a barrier for successful driving performance, and so why would they adapt their drivingbehaviour accordingly? Despite this rationale, there have been multiple observations ofdifferences between the behaviour of hearing impaired and normally hearing individuals,even in the absence of auditory distraction. This adaptive behaviour is likely to have beendeveloped over a prolonged period of hearing loss, and would therefore not have beenobserved in Chapter 8 which involved participants who did not have a hearing loss. Indeed,no behaviour comparable to that noted by Thorslund et al. (2013a,b, 2014) was observedin the work described in this thesis, suggesting that alterations in driving behaviour do notarise as an instantaneous reaction to hearing loss.
The finding in Chapter 4 that hearing impaired individuals reported a slower drivingspeed is applicable in this regard. A slower driving speed is one of the adaptive behaviourswhich Thorslund et al. (2013a,b) argue they have observed in hearing impaired individuals.This is corroborated by the data that I collected using the DBQ in a sample who largelyhad an acquired, age-related hearing loss. It follows that this adaptive driving style ispresent in individuals who experience hearing loss over a long period, but not in those whohave a sudden hearing loss, given that SimHL resulted in no alteration in driving speed ina normally hearing sample (see Chapter 8).
9.3 Contribution to the field
Investigating the effect of hearing loss on driving is a complex problem. The researchpresented in this thesis has suggested that there are a range of potential issues, which canbe confounded by a number of different parameters related to hearing loss (e.g. hearing lossseverity and type), but also by cognitive abilities. Furthermore there is little experimental

CHAPTER 9. FINAL DISCUSSION 263
evidence in the area, and research to date has not reached a consensus (see Chapter 2). Itis important to note that my work does not describe the effect of all aspects of hearingloss on driving performance, and that other factors (i.e. audibility) may also play a role.Further work is required to understand the exact contribution of these factors, although asummary of my proposition is given in Figure 9.1.
The work described in this thesis suggests that hearing loss is likely to be a considerationfor auditory distraction in the driving domain only when it is paired with co-existingfactors such as age-related cognitive decline. Accordingly, the schematic makes a primarydistinction between younger and older hearing impaired individuals, because these co-existing factors (e.g. cognitive decline) are more likely to occur in older adults. Of course,the distinction between ‘young’ and ‘old’ is not unambiguous, and the schematic shouldnot be considered in this way. Instead, the influence of cognitive factors is likely to increasewith age in a continuous fashion, though for ease of understanding the schematic hasbeen presented making a clear categorical distinction between the two. Because, youngerhearing impaired individuals are less likely to exhibit cognitive deficits, they are shownas mostly being subject to lack of audibility issues whilst driving, whereas older hearingimpaired individuals may also experience a disproportionate effect of auditory distraction,as suggested by Hickson et al. (2010). The aim of this work was not, however, to establishwhether co-existing factors act alone, or in conjunction with hearing loss, to cause drivingdecrements in the elderly. Thus, the schematic does not specify the exact origin of thedisproportionate effect of auditory distraction in the older hearing impaired demographic.
Two potential barriers to successful driving performance in hearing impaired individualswere identified in Chapter 2 (reduced audibility and increased effect of auditory distraction).In this schematic, they are both hypothesised to lead to an effect on driving performance.However, there is no evidence to suggest that reduced audibility has a direct effect on drivingperformance, this has simply been hypothesised by some authors (Coppin and Peck, 1963,1965; Slawinski and MacNeil, 2002). In contrast, there is evidence for a disproportionateeffect of distraction in hearing impaired drivers, whether it be as a result of auditory(Hickson et al., 2010) or visual (Thorslund et al., 2013b, 2014) task engagement. There isalso evidence that adaptive driving behaviour is undertaken in hearing impaired individualsin order to negate driving performance decrements (Thorslund et al., 2013a,b, 2014). Thesechanges in driving behaviour also have the capacity to alter driving performance. Thus,the use of a neutral term (‘effect on driving performance’) as an outcome for the schematicis deliberate, because adaptive behaviour countering any negative effects may well resultin a positive influence on driving performance.
I envisage this schematic as a common framework for future research in this area. Theuncertain relationships between particular nodes (highlighted by the use of a broken line),are key areas that require further research in order to build a more complete picture ofhow hearing loss interacts with driving performance. This serves as a common baselinefrom which researchers can work - a tool which is not currently available in this area.

264 CHAPTER 9. FINAL DISCUSSION
Figure 9.1 A preliminary schematic which explains how hearing impairment might affectdriving performance. Aspects of the model substantiated by work described in this thesisand published research are shown with solid lines, whereas those which have simply beenhypothesised by authors are shown with broken lines.
9.4 Further research
This research has generated a number of questions, and some limitations have beenhighlighted. Accordingly, further study is required in order to carry the investigation ofthis topic forward. I would argue that there are three pertinent areas for further researchin this novel area, which have arisen as a result of my studies:
1. The investigation of the effect of SimHL on driving whilst under auditorytask conditions in a wider variety of driving environments.The research described in this thesis has taken a novel approach to investigate theeffect of hearing loss on driving. However, this is a vast topic and driving is a highlycomplex task (Groeger, 2000). The work described in this thesis has identified someinteresting and important trends. However, it is not exhaustive - it has investigateda specific driving situation within a specific environment, and has used a specific setof dependent variables as a measure of driving performance. It would be beneficialto extend the work in some manners in order to provide further data regarding theeffect of different levels of SimHL on driving performance.
For example, the dependent variables measured in my driving simulator studywere specific to driving behaviour that had been affected as a result of auditorytask engagement in normally hearing individuals (e.g. PRC, SDLP). However, apropensity for visual information to be less efficiently processed in the hearing

CHAPTER 9. FINAL DISCUSSION 265
impaired demographic has been suggested by past work (Hickson et al., 2010) andwork undertaken in this thesis (see Chapter 5). Whilst the experiment described inChapter 8 looked at eye movement behaviour and reactions to visual stimuli, it did notevaluate subjects’ ability to perceive and manipulate visual information whilst drivingduring auditory task engagement. Therefore, the use of other objective measuresrelated to driving performance, such as the recognition of road signs, might be usefulin identifying other specific problems that arise as a result of SimHL. Again, thiswill go some way towards confirming that hearing loss alone does not affect drivingperformance, and will inform on the ‘effect on driving’ portion of the schematic whichI have proposed.
2. Establishing the extent to which co-existing factors account for drivingdecrements in hearing impaired individuals.Another consideration for the work described in this thesis is that it has only measureddriving performance in younger, normally-hearing individuals. The evidence suggeststhat the cognitive capabilities of this group of individuals are sufficient to be able todeal with a degraded auditory input, thus hearing loss does not have an effect onthe driving of this demographic. However, it is unknown how this transfers to theolder demographic, and the relative influence that co-existing factors and hearing losshave on driving performance in this group of individuals. To investigate this, drivingperformance during auditory task engagement could be compared between a largesample of age-matched normally hearing and hearing impaired older adults. However,recruitment for a study of this type might be challenging, and so the extent to whicholder and younger normally hearing individuals are affected by SimHL could also becompared to inform on the same consideration.
Furthermore, it should be considered that a SimHL has been used as part of workdescribed in this thesis. Evidence suggested that this method provided a reasonableapproximation of actual hearing loss (see Chapter 6). However, the method ofsimulation used cannot, and did not, emulate every aspect of SNHL and so thereis a possibility that factors associated with hearing loss outside of those simulatedmight have an effect on driving performance. It would, therefore, be of interest toobserve the effect of auditory distraction on the driving performance of young hearingimpaired individuals, in order to inform on this prospect.
3. Investigating the best manner of reducing auditory distraction in hearingimpaired drivers.The work described in this thesis has suggested that co-existing factors must bepresent for hearing loss to affect driving as a result of auditory distraction. However, amajority of hearing impaired individuals will have some age-related cognitive decline,given the association between hearing loss and age (Davis, 1995). Accordingly, there isa need to investigate how the additional effect of hearing loss on driving performance

266 CHAPTER 9. FINAL DISCUSSION
in the presence of an auditory task can be remedied. The use of hearing aids in thecar has already been discussed in this chapter, but despite the positive view of theiruse whilst driving held by hearing impaired individuals, their efficacy is unproven, andsome concerns have been raised (e.g. their success being reliant on Working Memoryabilities). Accordingly research should focus on establishing if hearing aids are ofbenefit in reducing auditory distraction during driving in a more objective manner,because there is currently no data available on this. If it transpires that hearingaids do not help to decrease auditory distraction in hearing impaired drivers, otherrehabilitative measures should be considered, for example improving the acousticenvironment in vehicles, using assistive listening devices such as loop-systems, ordiscouraging engagement with auditory tasks whilst driving.
9.5 Dissemination
It is now my intention to further disseminate the findings from this course of research. Youwill see in the following ‘publications’ section of this thesis that I have already begun topublicise my work through conference presentations and publication in academic journals.However, I also feel that it is important to engage practitioners and clinicians in thedissemination of this work, given that the outcomes are highly relevant to a specific patientgroup. Accordingly, I have arranged a visit to University Hospitals North StaffordshireNHS Trust in order to present the findings of the questionnaire study reported in Chapter 4.I also hope to be able to arrange further presentations at some of the other sites involved indata collection for this project. As I continue research in this area, I would like to maintainthis method of dissemination; the work has been carried out in order to inform cliniciansabout, what I believe, is a very important, applicable, and novel topic.
9.6 Conclusion
Hearing is an important sensory modality for driving. A range of information in the drivingenvironment can be portrayed acoustically; we can hear sirens of emergency service vehiclesor can have our attention drawn to an impending collision by the piercing sound of a horn.We can hear mechanical sounds of our vehicle which inform on its health or current speed,and can converse with other road users or policemen in the case of an emergency situationarising.
Not having access to this information might be problematic, but there are mechanismsin place which can ameliorate these potential problems. A hearing impaired individual canwear hearing aids, visual awareness can increase over time, and an individual can adapthis/her driving behaviour in order to accommodate a lack of information. What thesechanges cannot alter, however, is the distortion to sound that SNHL presents. Past authorshave suggested that this aspect of hearing loss might make audible auditory information in

CHAPTER 9. FINAL DISCUSSION 267
the car more distracting for hearing impaired individuals.Work described in this thesis has, however, shown this not to be the case when the
influence of hearing loss on driving is isolated from other co-existing factors. Thus, it issuggested that hearing loss alone is not responsible for driving decrements as a result ofauditory distraction, rather it is as a result of synergy between hearing loss and theseco-existing factors, or directly because of the co-existing factors. This inference needsto be confirmed through the performance of similar research on the effects of real andsimulated hearing loss, but varying the driving demand, degree of hearing loss and typeof measures used to indicate driving performance. However, this initial conclusion hasallowed for the development of a preliminary schematic of how hearing loss affects driving.This schematic can be used as a framework to inform continuing research in the area, andit is hoped that, as more research becomes available, this schematic will evolve until athorough understanding of the topic is reached.
Research in the immediate future should focus on identifying the specific factors co-existing with hearing loss which present problems for driving, and whether/the extent towhich they interact with hearing loss to cause driving decrements. Attention should alsobe paid to establishing the effect of missed auditory information as a result of hearing losson driving performance. The generation of this data will allow for the development of theschematic proposed in this chapter, and will contribute greatly towards our understanding ofhow hearing loss affects driving generally, allowing sensible, evidence-based policy decisionsto be made.


Publications
Journal articles (published)
Herbert, N. C., Thyer, N. J., Isherwood, S. J. & Merat, N. 2016. The Effect of AuditoryDistraction on the Useful Field of View in Hearing Impaired Individuals and its Implications forDriving. Cognition, Technology & Work, 18(2), p393–402.
Thorslund, B., Peters, B., Herbert, N., Holmqvist, K., Lidestam, B., Black, A. &Lyxell, B. 2013. Hearing loss and a supportive tactile signal in a navigation system: effects ondriving behavior and eye movements. Journal of Eye Movement Research, 6(5), p1–9.
Journal articles (under review)
Herbert, N. C., Thyer, N. J., Isherwood, S. J. & Merat, N. The Effect of a SimulatedHearing Loss on Performance of an Auditory Memory Task in Driving. Submitted to TransportationResearch Part F: Traffic Psychology.
Journal articles (in preparation)
Herbert, N. C., Thyer, N. J., Isherwood, S. J. & Merat, N. Self-Reported DrivingBehaviours in Hearing Impaired Individuals. For submission to International Journal of Audiology.
Conference presentations
Herbert, N. C., Merat, N., Thyer, N. J. & Isherwood, S. J. 2014. Comparing Performanceon a Number of Auditory Memory Tasks: Implications for How Auditory Information is Perceivedin Vehicles. The 5th International Conference on Applied Human Factors & Ergonomics, 19th–23rdJuly 2014, Krakow, Poland.
Herbert, N. C., Merat, N., Thyer, N. J. & Isherwood, S. J. 2012. Is the ‘Useful Field ofView’ Affected by Hearing Impairment? The 5th International Conference on Traffic & TransportPsychology, 29–31st August 2012, Groningen, Netherlands.Herbert, N. C. & Merat, N. 2011. Deafness and its Relevance to the Driving Task. The BritishAcademy of Audiology Annual Conference, 8–11th November, Llandudno, UK.
269

270 CHAPTER 9. PUBLICATIONS
Herbert, N. C. & Merat, N. 2011. Deafness and its Relevance to the Driving Task. HumanFactors and Ergonomics Society European Chapter Conference, 19–21st October 2011, Leeds, UK.

References
Aarts, L. and Van Schagen, I. (2006). Driving Speed and the Risk of Road Crashes: aReview. Accident Analysis & Prevention, 38(2):215–224.
Åberg, L. and Rimmö, P.-A. (1998). Dimensions of Aberrant Driver Behaviour. Ergonomics,41(1):39–56.
af Wåhlberg, A., Dorn, L., and Kline, T. (2011). The Manchester Driver BehaviourQuestionnaire as a Predictor of Road Traffic Accidents. Theoretical Issues in ErgonomicsScience, 12(1):66–86.
Ahlstrom, C., Kircher, K., and Kircher, A. (2009). Considerations When CalculatingPercent Road Centre from Eye Movement Data in Driver Distraction Monitoring. InProceedings of the Fifth International Driving Symposium on Human Factors in DriverAssessment, Training and Vehicle Design, pages 132–139.
Akeroyd, M. A. (2008). Are Individual Differences in Speech Reception Related to IndividualDifferences in Cognitive Ability? A Survey of Twenty Experimental Studies with Normaland Hearing-Impaired Adults. International Journal of Audiology, 47(S2):S53–S71.
Akeroyd, M. A., Foreman, K., and Holman, J. A. (2014). Estimates of the Number ofAdults in England, Wales, and Scotland with a Hearing Loss. International Journal ofAudiology, 53(1):60–61.
Allinson, P. D. (2001). Logistic Regression Using the SAS System: Theory and Application.In Meyer, D. E. and Kornblum, S., editors, Attention and Performance XIV, pages183–218. MIT Press.
Allport, A. (1980). Patterns and Actions: Cognitive Mechanisms are Content-Specific. InClaxton, G., editor, Cognitive Psychology: New Directions, pages 26–64. Routledge andKegan Paul.
Allport, A., Meyer, D., and Kornblum, S. (1993). Attention and Control: Have We BeenAsking the Wrong Questions? A critical review of twenty-five years. In Meyer, D. E.and Kornblum, S., editors, Attention and Performance XIV, pages 183–218. MIT Press.
271

272 REFERENCES
Allport, D. A., Antonis, B., and Reynolds, P. (1972). On the Division of Attention: ADisproof of the Single Channel Hypothesis. The Quarterly Journal of ExperimentalPsychology, 24(2):225–235.
Alm, H. and Nilsson, L. (1994). Changes in Driver Behaviour as a Function of HandsfreeMobile Phones - a Simulator Study. Accident Analysis and Prevention, 26(4):441–451.
Alm, H. and Nilsson, L. (1995). The effects of a mobile telephone task on driver behaviourin a car following situation. Accident Analysis and Prevention, 27(5):707–715.
American Speech-Language-Hearing Association (1988). Guidelines for determining thresh-old level for speech. ASHA, 30(3):85–89.
Andersson, U. (2002). Deterioration of the Phonological Processing Skills in Adults with anAcquired Severe Hearing Loss. European Journal of Cognitive Psychology, 14(3):335–352.
ANSI (1997). American National Standard Methods for Calculation of the Speech Intelligi-bility Index.
Anstey, K. J., Wood, J., Lord, S., and Walker, J. G. (2005). Cognitive, Sensory andPhysical Factors Enabling Driving Safety in Older Adults. Clinical Psychology Review,25(1):45–65.
Arlinger, S. (2003). Negative Consequences of Uncorrected Hearing Loss: A Review.International Journal of Audiology, 42:2S17–2S20.
Atchley, P. and Dressel, J. (2004). Conversation Limits the Functional Field of View. HumanFactors: The Journal of the Human Factors and Ergonomics Society, 46(4):664–673.
Austroads and the National Transport Commission Australia (2014). Assessing Fitness toDrive for Commercial and Private Vehicle Drivers. Online. Available from: https://www.onlinepublications.austroads.com.au/items/AP-G56-13. [Last accessed: 08/01/2016].
Baddeley, A. (1992). Working Memory. Science, 255(5044):556–559.
Baddeley, A. (2000). The Episodic Buffer: A New Component of Working Memory?Trends in Cognitive Sciences, 4(11):417–423.
Baddeley, A. (2003). Working Memory: Looking Back and Looking Forward. NatureReviews. Neuroscience, 4(10):829–839.
Baddeley, A., Logie, R., Bressi, S., Sala, S. D., and Spinnler, H. (1986). Dementia andWorking Memory. The Quarterly Journal of Experimental Psychology, 38(4):603–618.
Baddeley, A. D. (1997). Human Memory: Theory and Practice. Psychology Press.
Baddeley, A. D. (2002). Is Working Memory Still Working? European Psychologist,7(2):85–97.

REFERENCES 273
Baddeley, A. D. and Hitch, G. (1974). Working Memory. Psychology of Learning andMotivation, 8:47–89.
Baer, T. and Moore, B. C. (1993). Effects of Spectral Smearing on the Intelligibility ofSentences in Noise. The Journal of the Acoustical Society of America, 94(3):1229–1241.
Baer, T. and Moore, B. C. (1994). Effects of Spectral Smearing on the Intelligibility ofSentences in the Presence of Interfering Speech. The Journal of the Acoustical Societyof America, 95(4):2277–2280.
Baldwin, C. L. (2002). Designing in-Vehicle Technologies for Older Drivers: Applicationof Sensory-Cognitive Interaction Theory. Theoretical Issues in Ergonomics Science,3(4):307–329.
Baldwin, C. L. (2007). Cognitive Implications of Facilitating Echoic Persistence. Memoryand Cognition, 35(4):774–780.
Baldwin, C. L. and Ash, I. K. (2011). Impact of Sensory Acuity on Auditory WorkingMemory Span in Young and Older Adults. Psychology and Aging, 26(1):85.
Baldwin, C. L. and Schieber, F. (1995). Dual Task Assessment of Age Differences inMental Workload with Implications for Driving. In Proceedings of the Human Factorsand Ergonomics Society Annual Meeting, volume 39(2), pages 167–171.
Baldwin, C. L. and Struckman-Johnson, D. (2002). Impact of Speech Presentation Levelon Cognitive Task Performance: Implications for Auditory Display Design. Ergonomics,45(1):61–74.
Ball, K., Edwards, J. D., and Ross, L. A. (2007). The Impact of Speed of ProcessingTraining On Cognitive and Everyday Functions. The Journals of Gerontology Series B:Psychological Sciences and Social Sciences, 62(Special Issue 1):19–31.
Ball, K. and Owsley, C. (1991). Identifying Correlates of Accident Involvement for theOlder Driver. Human Factors: The Journal of the Human Factors and ErgonomicsSociety, 33(5):583–595.
Ball, K., Owsley, C., Sloane, M. E., Roenker, D. L., and Bruni, J. R. (1993). VisualAttention Problems as a Predictor of Vehicle Crashes in Older Drivers. InvestigativeOphthalmology and Visual Science, 34(11):3110–3123.
Ball, K., Owsley, C., Stalvey, B., Roenker, D. L., Sloane, M. E., and Graves, M. (1998).Driving Avoidance and Functional Impairment in Older Drivers. Accident Analysis andPrevention, 30(3):313–322.
Ball, K. K., Beard, B. L., Roenker, D. L., Miller, R. L., and Griggs, D. S. (1988). Age andVisual Search: Expanding the Useful Field of View. Journal of the Optical Society ofAmerica A: Optics and Image Science, 5(12):2210–2219.

274 REFERENCES
Ball, K. K., Roenker, D. L., Wadley, V. G., Edwards, J. D., Roth, D. L., McGwin, G.,Raleigh, R., Joyce, J. J., Cissell, G. M., and Dube, T. (2006). Can High-Risk OlderDrivers be Identified Through Performance-Based Measures in a Department of MotorVehicles Setting? Journal of the American Geriatrics Society, 54(1):77–84.
Balota, D. A. and Chumbley, J. I. (1984). Are Lexical Decisions a Good Measure of LexicalAccess? The Role of Word Frequency in the Neglected Decision Stage. Journal ofExperimental Psychology: Human Perception and Performance, 10(3):340–357.
Baltes, P. B. and Lindenberger, U. (1997). Emergence of a Powerful Connection BetweenSensory and Cognitive Functions Across the Adult Life Span: A New Window to theStudy of Cognitive Aging? Psychology and Aging, 12(1):12–21.
Barreto, S., Swerdlow, A., Smith, P., and Higgins, C. (1997). Risk of Death From Motor-Vehicle Injury in Brazilian Steelworkers: A Nested Case-Control Study. InternationalJournal of Epidemiology, 26(4):814–821.
Barreto, S., Swerdlow, A., Smith, P., Higgins, C., and Andrade, A. (1996). Mortality FromInjuries and Other Causes in a Cohort of 21,800 Brazilian Steel Workers. Occupationaland Environmental Medicine, 53(5):343–350.
Başkent, D., Eiler, C. L., and Edwards, B. (2010). Phonemic Restoration by Hearing-Impaired Listeners with Mild to Moderate Sensorineural Hearing Loss. Hearing Research,260(1):54–62.
Bavelier, D., Dye, M. W., and Hauser, P. C. (2006). Do Deaf Individuals See Better?Trends in Cognitive Sciences, 10(11):512–518.
Bavelier, D., Tomann, A., Hutton, C., Mitchell, T., Corina, D., Liu, G., and Neville, H.(2000). Visual Attention to the Periphery is Enhanced in Congenitally Deaf Individuals.The Journal of Neuroscience, 20(17):RC93.
Bellinger, D. B., Budde, B. M., Machida, M., Richardson, G. B., and Berg, W. P. (2009).The Effect of Cellular Telephone Conversation and Music Listening on Response Time inBraking. Transportation Research Part F: Traffic Psychology and Behaviour, 12(6):441–451.
Bendixen, A., Schröger, E., and Winkler, I. (2009). I Heard That Coming: Event-relatedPotential Evidence for Stimulus-driven Prediction in the Auditory System. The Journalof Neuroscience, 29(26):8447–8451.
Bener, A., Özkan, T., and Lajunen, T. (2008). The Driver Behaviour Questionnaire in ArabGulf Countries: Qatar and United Arab Emirates. Accident Analysis and Prevention,40(4):1411–1417.

REFERENCES 275
Bentley, S. A., LeBlanc, R. P., Nicolela, M. T., and Chauhan, B. C. (2012). Validity,Reliability, and Repeatability of the Useful Field of View Test in Persons with NormalVision and Patients with Glaucoma. Investigative ophthalmology and visual science,53(11):6763–6769.
Besner, D. (1987). Phonology, Lexical Access in Reading, and Articulatory Suppression: ACritical Review. The Quarterly Journal of Experimental Psychology, 39(3):467–478.
Bess, F. H., Humes, L., and Towsend, T. (1995). Audiology: The Fundamentals. Williamsand Wilkins Baltimore, MD.
Boothroyd, A. (1968). Developments in Speech Audiometry. British Journal of Audiology,2(1):3–10.
Borg, E., Bergkvist, C., Olsson, I.-S., Wikström, C., and Borg, B. (2008). Communicationas an Ecological System. International Journal of Audiology, 47(S2):S131–S138.
Bosworth, R. G. and Dobkins, K. R. (2002). Visual Field Asymmetries for MotionProcessing in Deaf and Hearing Signers. Brain and Cognition, 49(1):170–181.
Boufous, S., Ivers, R., Senserrick, T., Stevenson, M., Norton, R., and Williamson, A. (2010).Accuracy of Self-Report of On-Road Crashes and Traffic Offences in a Cohort of YoungDrivers: The DRIVE Study. Injury Prevention, 16(4):275–277.
Bradley, J. V. (1958). Complete Counterbalancing of Immediate Sequential Effects in aLatin Square Design. Journal of The American Statistical Association, 53(282):525–528.
Brainard, D. H. (1997). The Psychophysics Toolbox. Spatial Vision, 10(4):433–436.
Brant, R. (1990). Assessing Proportionality in the Proportional Odds Model for OrdinalLogistic Regression. Biometrics, 46(4):1171–1178.
Bregman, A. S. (1994). Auditory Scene Analysis: The Perceptual Organization of Sound.MIT press.
Breitmeyer, B. and Ogmen, H. (2006). Visual Masking: Time Slices Through Consciousand Unconscious Vision. Oxford University Press.
British Society of Audiology (2011). Recommended Procedure: Pure-Tone Air-Conductionand Bone-Conduction Threshold Audiometry with and Without Masking. Online.Available from: http://www.thebsa.org.uk/wp-content/uploads/2014/04/BSA_RP_PTA_FINAL_24Sept11_MinorAmend06Feb12.pdf. [Last accessed: 27/09/2015].
Broadbent, D. (1958). Perception and Communication. Pergamon.
Bronkhorst, A. W. (2000). The Cocktail Party Phenomenon: A Review of Research onSpeech Intelligibility in Multiple-Talker Conditions. Acta Acustica united with Acustica,86(1):117–128.

276 REFERENCES
Brookhuis, K. A., de Vries, G., and de Waard, D. (1991). The Effects of Mobile Telephoningon Driving Performance. Accident Analysis and Prevention, 23(4):309–316.
Brown, I., Tickner, A., and Simmonds, D. (1969). Interference Between Concurrent Tasksof Driving and Telephoning. Journal of Applied Psychology, 53(5):419.
Brownell, W. E. (1990). Outer Hair Cell Electromotility and Otoacoustic Emissions. Earand Hearing, 11(2):82.
Burch, S. (2004). Signs of Resistance: American Deaf Cultural History, 1900 to WorldWar II. NYU Press.
Burg, F. D., Stock, M. S., Light, W. O., and Douglass, J. M. (1970). Licensing the DeafDriver. Archives of Otolaryngology, 91(3):289–290.
Cacciatore, F., Napoli, C., Abete, P., Marciano, E., Triassi, M., and Rengo, F. (1999). Qual-ity of Life Determinants and Hearing Function in an Elderly Population: OsservatorioGeriatrico Campano Study Group. Gerontology, 45(6):323–328.
Cattell, R. B. (1987). Intelligence: Its Structure, Growth and Action. Elsevier.
Cepeda, N. J., Kramer, A. F., and Gonzalez de Sather, J. (2001). Changes in ExecutiveControl across the life span: Examination of task-switching performance. DevelopmentalPsychology, 37(5):715.
Cherry, E. C. (1953). Some Experiments On the Recognition of Speech, with One andwith Two Ears. The Journal of the Acoustical Society of America, 25(5):975–979.
Child, D. (2006). The Essentials of Factor Analysis. Continuum.
Chiras, D. D. (2013). Human Biology. Jones and Bartlett Publishers.
Chung, J. H., Des Roches, C. M., Meunier, J., and Eavey, R. D. (2005). Evaluation ofNoise-Induced Hearing Loss in Young People Using a Web-Based Survey Technique.Pediatrics, 115(4):861–867.
Classon, E., Rudner, M., and Rönnberg, J. (2013). Working Memory Compensates forhearing related phonological processing deficit. Journal of Communication Disorders,46(1):17–29.
Clay, O. J., Wadley, V. G., Edwards, J. D., Roth, D. L., Roenker, D. L., and Ball, K. K.(2005). Cumulative Meta-Analysis of the Relationship Between Useful Field of View andDriving Performance in Older Adults: Current and Future Implications. Optometry andVision Science, 82(8):724–731.
Clogg, C. C. and Shihadeh, E. S. (1994). Statistical Models for Ordinal Variables. SagePublications Inc.

REFERENCES 277
Collins, J. G. (1997). Prevalence of Selected Chronic Conditions: United States, 1990-1992.Vital and (H]ealth Statistics. Series 10, Data from the National Health Survey, 194:1–89.
Conrad, R. and Hull, A. J. (1964). Information, Acoustic Confusion and Memory Span.British Journal of Psychology, 55(4):429–432.
Conway, A. R., Kane, M. J., Bunting, M. F., Hambrick, D. Z., Wilhelm, O., and Engle,R. W. (2005). Working Memory Span Tasks: A Methodological Review and User’sGuide. Psychonomic bulletin and review, 12(5):769–786.
Cooper, J. M., Medeiros-Ward, N., and Strayer, D. L. (2013). The impact of Eye Movementsand cognitive workload on lateral position variability in driving. Human Factors: TheJournal of the Human Factors and Ergonomics Society, 55(5):1001–1014.
Coppin, R. S. and Peck, R. C. (1963). The Totally Deaf Driver in California, Part I.Technical report, California Department of Motor Vehicles.
Coppin, R. S. and Peck, R. C. (1965). The Totally Deaf Driver in California. HighwayResearch Record, 79:35–44.
Cord, M. T., Surr, R. K., Walden, B. E., and Olson, L. (2002). Performance of DirectionalMicrophone Hearing Aids in Everyday Life. Journal of the American Academy ofAudiology, 13(6):295–307.
Cornsweet, T. N. (1962). The Staircase-Method in Psychophysics. The American Journalof Psychology, 75(3):485–491.
Costello, A. and Osborne, J. (2005). Best Practices in Exploratory Factor Analysis: FourRecommendations for Getting the Most From Your Analysis. Practical Assessesment,Research and Evaluation, 10(7):1–9.
Cox, R., Alexander, G., Taylor, I., and Gray, G. (1996). Benefit Acclimatization in ElderlyHearing Aid Users. Journal of the American Academy of Audiology, 7(6):428–441.
Cox, R. M. (2005). Evidence-Based Practice in Provision of Amplification. Journal of theAmerican Academy of Audiology, 16(7):419–438.
Craik, F. I. (1977). Age Differences in Human Memory. In Birren, J. E. and Schaie, K. W.,editors, Handbook of the Psychology of Aging, pages 384–420. Van Nostrand Reinhold.
Craik, F. I. (1994). Memory Changes in Normal Aging. Current Directions in PsychologicalScience, 3(5):155–158.
Craik, F. I. (2000). Age-related Changes in Human Memory. In Park, D. and Schwarz, N.,editors, Cognitive Aging: A Primer, pages 75–92. Psychology Press.

278 REFERENCES
Craik, F. I. (2007). The Role of Cognition in Age-Related Hearing Loss. Journal of theAmerican Academy of Audiology, 18(7):539–547.
Crandell, C., Mills, T. L., and Gauthier, R. (2004). Knowledge, Behaviors, and AttitudesAbout Hearing Loss and Hearing Protection Among Racial/Ethnically Diverse YoungAdults. Journal of the National Medical Association, 96(2):176.
Cruickshanks, K. J., Wiley, T. L., Tweed, T. S., Klein, B. E., Klein, R., Mares-Perlman,J. A., and Nondahl, D. M. (1998). Prevalence of Hearing Loss in Older Adults inBeaver Dam, Wisconsin the Epidemiology of Hearing Loss Study. American Journal ofEpidemiology, 148(9):879–886.
Davis, A. (1995). Hearing in Adults: The Prevalence and Distribution of Hearing Im-pairment and Reported Hearing Disability in the MRC Institute of Hearing Research’sNational Study of Hearing. Whurr.
Davison, P. A. (1985). Inter-relationships Between British Drivers’ Visual Abilities, Ageand Road Accident Histories. Ophthalmic and Physiological Optics, 5(2):195–204.
de Lorenzo, R. A. and Eilers, M. A. (1991). Lights and Siren: A Review of EmergencyVehicle Warning Systems. Annals of Emergency Medicine, 20(12):1331–1335.
de Rammelaere, S., Stuyven, E., and Vandierendonck, A. (2001). Verifying SimpleArithmetic Sums and Products: Are the Phonological Loop and the Central ExecutiveInvolved? Memory and Cognition, 29(2):267–273.
de Waard, D., Edlinger, K., and Brookhuis, K. (2011). Effects of Listening to Music, andof Using a Handheld and Handsfree Telephone on Cycling Behaviour. TransportationResearch Part F: Traffic Psychology and Behaviour, 14(6):626–637.
de Winter, J. and Dodou, D. (2010). The Driver Behaviour Questionnaire as a Predictorof Accidents: A Meta-Analysis. Journal of Safety Research, 41(6):463–470.
DeLucia, P. R., Kathryn Bleckley, M., Meyer, L. E., and Bush, J. M. (2003). JudgmentsAbout Collision in Younger and Older Drivers. Transportation Research Part F: TrafficPsychology and Behaviour, 6(1):63–80.
Department for Transport (2014). Reported Road Casualties in Great Britain: MainResults 2013. Technical report, Office for National Statistics.
Deutsch, J. A. and Deutsch, D. (1963). Attention: Some Theoretical Considerations.Psychological Review, 70(1):80–90.
Diehr, M. C., Heaton, R. K., Miller, W., and Grant, I. (1998). The Paced AuditorySerial Addition Task (PASAT): Norms for Age, Education, and Ethnicity. Assessment,5(4):375–387.

REFERENCES 279
Dillon, H. (2001). Hearing Aids. Thieme.
Dingus, T. A., Klauer, S., Neale, V., Petersen, A., Lee, S., Sudweeks, J., Perez, M., Hankey,J., Ramsey, D., Gupta, S., Bucher, C., Doerzaph, Z., Jermeland, J., and Knipling,R. (2006). The 100-car naturalistic driving study, phase II-results of the 100-car fieldexperiment. Technical report, National Highways Traffic Safety Administration.
Downs, D. W. (1982). Effects of Hearing Aid Use on Speech Discrimination and ListeningEffort. Journal of Speech and Hearing Disorders, 47(2):189–193.
Drews, F. A., Pasupathi, M., and Strayer, D. L. (2008). Passenger and Cell PhoneConversations in Simulated Driving. Journal of Experimental Psychology: Applied,14(4):392.
Driver and Vehicle Licensing Agency (2012). AUD1 Online: Confidential Medical Informa-tion. Online. Available from: https://www.gov.uk/government/uploads/system/uploads/attachment_data/file/320704/AUD1.pdf. [Last accessed: 08/01/2016].
Dubno, J. R. and Schaefer, A. B. (1992). Comparison of Frequency Selectivity andConsonant Recognition Among Hearing-Impaired and Masked Normal-Hearing Listeners.The Journal of the Acoustical Society of America, 91(4):2110–2121.
Duchnowski, P. and Zurek, P. M. (1995). Villchur Revisited: Another Look at AutomaticGain Control Simulation of Recruiting Hearing Loss. The Journal of the AcousticalSociety of America, 98(6):3170–3181.
Edwards, B. (2007). The Future of Hearing Aid Technology. Trends in Amplification,11(1):31–46.
Edwards, J. D., Ross, L. A., Wadley, V. G., Clay, O. J., Crowe, M., Roenker, D. L., andBall, K. K. (2006). The Useful Field of View Test: Normative Data for Older Adults.Archives of Clinical Neuropsychology, 21(4):275–286.
Edwards, J. D., Vance, D. E., Wadley, V. G., Cissell, G. M., Roenker, D. L., and Ball, K. K.(2005). Reliability and Validity of Useful Field of View Test Scores As Administered byPersonal Computer. Journal of Clinical and Experimental Neuropsychology, 27(5):529–543.
Edwards, W. (2010). Motor Learning and Control: From Theory to Practice. CengageLearning.
Eisele, G., Wolff, K., Alt, N., and Hüser, M. (2005). Application of Vehicle InteriorNoise Simulation (VINS) for NVH Analysis of a Passenger Car. Technical report, SAETechnical Paper.

280 REFERENCES
Elander, J., West, R., and French, D. (1993). Behavioral Correlates of Individual Differencesin Road-Traffic Crash Risk: An Examination of Methods and Findings. PsychologicalBulletin, 113(2):279.
Endsley, M. R. (1988). Design and Evaluation for Situation Awareness Enhancement. InProceedings of the Human Factors and Ergonomics Society Annual Meeting, volume32(2), pages 97–101. SAGE Publications.
Endsley, M. R. (1995). Toward a Theory of Situation Awareness in Dynamic Systems.Human Factors: The Journal of the Human Factors and Ergonomics Society, 37(1):32–64.
Endsley, M. R. (2000). Theoretical Underpinnings of Situation Awareness: A CriticalReview. In R., E. M., editor, Situation Awareness Analysis and Measurement, pages3–32. Lawrence Erlbaum Associates.
Engle, R. W. (2002). Working Memory Capacity as Executive Attention. Current Directionsin Psychological Science, 11(1):19–23.
Engström, J. (2011). Understanding Attention Selection in Driving: From Limited Capacityto Adaptive Behaviour. PhD thesis, Chalmers University of Technology.
Engström, J., Åberg, N., Johansson, E., and Hammarbäck, J. (2005a). Comparison BetweenVisual and Tactile Signal Detection Tasks Applied to the Safety Assessment of in-VehicleInformation Systems. In Proceedings of the Third International Driving Symposium onHuman Factors in Driver Assessment, Training and Vehicle Design, pages 232–239.
Engström, J., Johansson, E., and Östlund, J. (2005b). Effects of Visual and CognitiveLoad in Real and Simulated Motorway Driving. Transportation Research Part F: TrafficPsychology and Behaviour, 8(2):97–120.
Evans, L. (1970). Speed Estimation from a Moving Automobile. Ergonomics, 13(2):219–230.
Evans, L. and Wasielewski, P. (1982). Do accident-involved drivers exhibit riskier everydaydriving behavior? Accident Analysis and Prevention, 14(1):57–64.
Eysenck, M. W. (2000). Cognitive Psychology: A Student’s Handbook. Taylor and Francis.
Fabry, D. A. and Van Tasell, D. J. (1986). Masked and Filtered Simulation of HearingLoss: Effects on Consonant Recognition. Journal of Speech and Hearing Research,29(2):170–178.
Farrand, P. and McKenna, F. P. (2001). Risk Perception in Novice Drivers: The RelationshipBetween Questionnaire Measures and Response Latency. Transportation Research PartF: Traffic Psychology and Behaviour, 4(3):201–212.
REFERENCES 281
Faulkner, A., Rosen, S., and Moore, B. C. (1990). Residual Frequency Selectivity in theProfoundly Hearing-Impaired Listener. British Journal of Audiology, 24(6):381–392.
Festen, J. M. and Plomp, R. (1990). Effects of Fluctuating Noise and Interfering SpeechOn the Speech-Reception Threshold for Impaired and Normal Hearing. The Journal ofthe Acoustical Society of America, 88(4):1725–1736.
Field, A. (2013). Discovering Statistics Using IBM SPSS Statistics. Sage.
Findlay, J. M. and Gilchrist, I. D. (2003). Active Vision: The Psychology of Looking andSeeing. Oxford University Press.
Finesilver, S. G. (1962). They Can’t Hear, but They Get the Message. California News,77(8):1–5.
Fisher, D. L. and Strayer, D. L. (2014). Modeling Situation Awareness and Crash Risk.Annals of Advances in Automotive Medicine, 58:33–39.
Fitzgibbons, P. J. and Wightman, F. L. (1982). Gap detection in Normal and Hearing-impaired listeners. The Journal of the Acoustical Society of America, 72(3):761–765.
Fodor, J. A. (1983). The Modularity of Mind: An Essay on Faculty Psychology. MIT press.
Foo, C., Rudner, M., Rönnberg, J., and Lunner, T. (2007). Recognition of Speech in Noisewith New Hearing Instrument Compression Release Settings Requires Explicit CognitiveStorage and Processing Capacity. Journal of the American Academy of Audiology,18(7):618–631.
Freeman, J. E., Wishart, D. E., Davey, J. D., Rowland, B. D., and Williams, R. (2009).Utilising the Driver Behaviour Questionnaire in an Australian Organisational FleetSetting: Can it Identify Risky Drivers? Journal of the Australasian College of RoadSafety, 20(2):38–45.
Fritz, J. B., Elhilali, M., David, S. V., and Shamma, S. A. (2007). Auditory Atten-tion—Focusing the Searchlight on Sound. Current Opinion in Neurobiology, 17(4):437–455.
Gallo, J. J., Rebok, G. W., and Lesikar, S. E. (1999). The Driving Habits of Adults Aged60 Years and Older. Journal of the American Geriatrics Society, 47(3):335–341.
Gatehouse, S. (1993). Role of Perceptual Acclimatization in the Selection of FrequencyResponses for Hearing Aids. Journal of the American Academy of Audiology, 4(5):296–306.
Gates, G. A. and Mills, J. H. (2005). Presbycusis. The Lancet, 366(9491):1111–1120.

282 REFERENCES
Gathercole, S. E. and Baddeley, A. D. (1993). Working Memory and Language. LawrenceErlbaum Associates.
Gelfand, S. A. (2009). Essentials of Audiology. Thieme.
Gherri, E. and Eimer, M. (2011). Active Listening Impairs Visual Perception and Selectivity:An ERP Study of Auditory Dual-Task Costs on Visual Attention. Journal of CognitiveNeuroscience, 23(4):832–844.
Gilhotra, J. S., Mitchell, P., Ivers, R., and Cumming, R. G. (2001). Impaired Vision andOther Factors Associated with Driving Cessation in the Elderly: The Blue MountainsEye Study. Clinical and Experimental Ophthalmology, 29(3):104–107.
Glasberg, B. R. and Moore, B. C. (1992). Effects of Envelope Fluctuations on GapDetection. Hearing Research, 64(1):81–92.
Goode, K. T., Ball, K. K., Sloane, M., Roenker, D. L., Roth, D. L., Myers, R. S., andOwsley, C. (1998). Useful Field of View and Other Neurocognitive Indicators of CrashRisk in Older Adults. Journal of Clinical Psychology in Medical Settings, 5(4):425–440.
Goode, R. L. (1986). Middle Ear Function, Biologic Variation, and Otosurgical Alchemy:Can We Turn Tin Ears Into Gold? Archives of Otolaryngology–Head and Neck Surgery,112(9):923–924.
Gordon, A. and Zillmer, E. (1997). Integrating the MMPI and Neuropsychology: A Surveyof NAN Membership. Archives of Clinical Neuropsychology, 12(4):325–326.
Gosselin, P. A. and Gagné, J.-P. (2010). Use of a Dual-Task Paradigm to Measure ListeningEffort. Canadian Journal of Speech-Language Pathology and Audiology, 34(1):43–51.
Graham, J. and Baguley, D. (2009). Ballantyne’s Deafness. John Wiley and Sons.
Grattan, E. and Jeffcoate, G. (1968). Medical Factors and Road Accidents. BMJ: BritishMedical Journal, 1(5584):75–79.
Green, K. A., McGwin, G., and Owsley, C. (2013). Associations Between Visual, Hearing,and Dual Sensory Impairments and History of Motor Vehicle Collision Involvement ofOlder Drivers. Journal of the American Geriatrics Society, 61(2):252–257.
Gresset, J. A. and Meyer, F. M. (1994). Risk of Accidents Among Elderly Car Driverswith Visual Acuity Equal to 6/12 or 6/15 and Lack of Binocular Vision. Ophthalmicand Physiological Optics, 14(1):33–37.
Groeger, J. A. (2000). Understanding Driving: Applying Cognitive Psychology to a ComplexEveryday Task. Psychology Press.

REFERENCES 283
Groeger, J. A. and Brown, I. (1989). Assessing One’s Own and Others’ Driving Ability:Influences of Sex, Age, and Experience. Accident Analysis and Prevention, 21(2):155–168.
Gronwall, D. and Sampson, H. (1974). The Psychological Effects of Concussion. OxfordUniversity Press.
Gronwall, D. and Wrightson, P. (1974). Delayed Recovery of Intellectual Function AfterMinor Head Injury. The Lancet, 304(7881):605–609.
Gugerty, L. J. (1997). Situation Awareness During Driving: Explicit and Implicit Knowledgein Dynamic Spatial Memory. Journal of Experimental Psychology: Applied, 3(1):42–66.
Guo, M., Jensen, S. H., and Jensen, J. (2012). Novel Acoustic Feedback Cancellation Ap-proaches in Hearing Aid Applications Using Probe Noise and Probe Noise Enhancement.IEEE Transactions on Acoustics Speech and Signal Processing, 20(9):2549–2563.
Gussekloo, J., de Craen, A. J., Oduber, C., van Boxtel, M. P., and Westendorp, R. G.(2005). Sensory Impairment and Cognitive Functioning in Oldest-old Subjects: TheLeiden 85+ Study. The American Journal of Geriatric Psychiatry, 13(9):781–786.
Haigney, D., Taylor, R., and Westerman, S. (2000). Concurrent Mobile (Cellular) Phone Useand Driving Performance: Task Demand Characteristics and Compensatory Processes.Transportation Research Part F: Traffic Psychology and Behaviour, 3(3):113–121.
Hakamies-Blomqvist, L. and Wahlström, B. (1998). Why Do Older Drivers Give UpDriving? Accident Analysis and Prevention, 30(3):305–312.
Hällgren, M., Johansson, M., Larsby, B., and Arlinger, S. (1998). Dichotic Speech Tests.Scandinavian Audiology, 27(4):35–39.
Hällgren, M., Larsby, B., Lyxell, B., and Arlinger, S. (2001). Cognitive Effects in DichoticSpeech Testing in Elderly Persons. Ear and Hearing, 22(2):120–129.
Halpern, A. R., Zatorre, R. J., Bouffard, M., and Johnson, J. A. (2004). Behavioraland Neural Correlates of Perceived and Imagined Musical Timbre. Neuropsychologia,42(9):1281–1292.
Halpin, C. and Rauch, S. D. (2009). Article Commentary: Hearing Aids and CochlearDamage: The Case Against Fitting the Pure Tone Audiogram. Otolaryngology–Headand Neck Surgery, 140(5):629–632.
Hancock, P., Lesch, M., and Simmons, L. (2003). The Distraction Effects of Phone UseDuring a Crucial Driving Maneuver. Accident Analysis and Prevention, 35(4):501–514.
Harbluk, J. L., Noy, Y. I., Trbovich, P. L., and Eizenman, M. (2007). An On-RoadAssessment of Cognitive Distraction: Impacts on Drivers’ Visual Behavior and BrakingPerformance. Accident Analysis and Prevention, 39(2):372–379.

284 REFERENCES
Hart, S. G. (2006). NASA-Task Load Index (NASA-TLX); 20 Years Later. In Proceedingsof the Human Factors and Ergonomics Society Annual Meeting, volume 50(9), pages904–908.
Hart, S. G. and Staveland, L. E. (1988). Development of NASA-TLX (Task Load Index):Results of Empirical and Theoretical Research. Advances in Psychology, 52:139–183.
Haualand, H. and Allen, C. (2009). Deaf People and Human Rights.Available from: http://www.wfdeaf.org/wp-content/uploads/2011/06/Deaf-People-and-Human-Rights-Report.pdf. [Last accessed: 23/09/2015].
Hellier, E., Naweed, A., Walker, G., Husband, P., and Edworthy, J. (2011). The Influenceof Auditory Feedback on Speed Choice, Violations and Comfort in a Driving SimulationGame. Transportation Research Part F: Traffic Psychology and Behaviour, 14(6):591–599.
Henderson, R. L. and Burg, A. (1973). The Role of Vision and Audition in Truck and BusDriving. Technical report, National Highway Traffic Safety Administation.
Henderson, R. L. and Burg, A. (1974). Vision and Audition in Driving. System DevelopmentCorporation.
Hickman, J. S., Hanowski, R. J., and Bocanegra, J. (2010). Distraction in CommercialTrucks and Buses: Assessing Prevalence and Risk in Conjunction with Crashes andNear-crashes. Technical report, Federal Motor Carrier Safety Administration.
Hickson, L., Wood, J., Chaparro, A., Lacherez, P., and Marszalek, R. (2010). HearingImpairment Affects Older People’s Ability to Drive in the Presence of Distracters. Journalof the American Geriatrics Society, 58(6):1097–1103.
Ho, C. and Spence, C. (2012). The Multisensory Driver: Implications for Ergonomic CarInterface Design. Ashgate Publishing.
Ho, C., Tan, H. Z., and Spence, C. (2006). The Differential Effect of Vibrotactile andAuditory Cues on Visual Spatial Attention. Ergonomics, 49(7):724–738.
Hofstetter, H. (1976). Visual Acuity and Highway Accidents. Journal of the AmericanOptometric Association, 47(7):887–893.
Hole, G. (2007). The Psychology of Driving. Psychology Press.
Holland, C. A. and Rabbitt, P. (1992). People’s Awareness of Their Age-Related Sensoryand Cognitive Deficits and the Implications for Road Safety. Applied Cognitive Psychology,6(3):217–231.
Hood, J. (1984). Speech Discrimination in Bilateral and Unilateral Hearing Loss Due toMeniere’s Disease. British Journal of Audiology, 18(3):173–177.

REFERENCES 285
Horberry, T., Anderson, J., Regan, M. A., Triggs, T. J., and Brown, J. (2006). DriverDistraction: The Effects of Concurrent in-Vehicle Tasks, Road Environment Complexityand Age on Driving Performance. Accident Analysis and Prevention, 38(1):185–191.
Hornsby, B. W. (2013). The Effects of Hearing Aid Use On Listening Effort and MentalFatigue Associated with Sustained Speech Processing Demands. Ear and Hearing,34(5):523–534.
Horowitz, S. S. (2012). The Universal Sense: How Hearing Shapes the Mind. BloomsburyPublishing.
Horrey, W. J. andWickens, C. D. (2006). Examining the Impact of Cell Phone Conversationson Driving Using Meta-Analytic Techniques. Human Factors: The Journal of the HumanFactors and Ergonomics Society, 48(1):196–205.
Horswill, M. S. and McKenna, F. P. (1999). The Development, Validation, and Applicationof a Video-Based Technique for Measuring an Everyday Risk-Taking Behavior: Drivers’Speed Choice. Journal of Applied Psychology, 84(6):977–985.
Horswill, M. S. and Plooy, A. M. (2008). Auditory Feedback Influences Perceived DrivingSpeeds. Perception, 37(7):1037–1043.
Horswill, M. S., Waylen, A. E., and Tofield, M. I. (2004). Drivers’ Ratings of DifferentComponents of Their Own Driving Skill: A Greater Illusion of Superiority for Skills ThatRelate to Accident Involvement. Journal of Applied Social Psychology, 34(1):177–195.
Humes, L. E. (1996). Speech Understanding in the Elderly. Journal of the AmericanAcademy of Audiology, 7(3):161–167.
Humes, L. E. (2007). The Contributions of Audibility and Cognitive Factors to the BenefitProvided by Amplified Speech to Older Adults. Journal of the American Academy ofAudiology, 18(7):590–603.
Humes, L. E., Dirks, D. D., Bell, T. S., and Kincaid, G. E. (1987). Recognition of NonsenseSyllables by Hearing-Impaired Listeners and by Noise-Masked Normal Hearers. TheJournal of the Acoustical Society of America, 81(3):765–773.
Humes, L. E., Dubno, J. R., Gordon-Salant, S., Lister, J. J., Cacace, A. T., Cruickshanks,K. J., Gates, G. A., Wilson, R. H., and Wingfield, A. (2012). Central Presbycusis: AReview and Evaluation of the Evidence. Journal of the American Academy of Audiology,23(8):635–666.
Humphries, D. (1987). Three South African Studies on the Relation Between RoadAccidents and Drivers Vision. Ophthalmic and Physiological Optics, 7(1):73–79.

286 REFERENCES
Hutcheson, G. D. and Sofroniou, N. (1999). The Multivariate Social Scientist: IntroductoryStatistics Using Generalized Linear Models. Sage.
Irwin, R. and Purdy, S. C. (1982). The Minimum Detectable Duration of Auditory Signalsfor Normal and Hearing-impaired Listeners. The Journal of the Acoustical Society ofAmerica, 71(4):967–974.
ISO (TBA). Detection-Response Task (DRT) for Assessing Attentional Effects of CognitiveLoad in Driving. ISO 17488, International Organization for Standardization, Geneva,Switzerland.
Ivers, R. Q., Mitchell, P., and Cumming, R. G. (1999). Sensory Impairment and Driving:The Blue Mountains Eye Study. American Journal of Public Health, 89(1):85–87.
Jamson, A. H., Merat, N., Carsten, O. M., and Lai, F. C. (2013). Behavioural Changes inDrivers Experiencing Highly-Automated Vehicle Control in Varying Traffic Conditions.Transportation Research Part C: Emerging Technologies, 30:116–125.
Jamson, H., Merat, N., Carsten, O., and Lai, F. (2011). Fully-Automated Driving: TheRoad to Future Vehicles. In Proceedings of the Sixth International Driving Symposiumon Human Factors in Driver Assessment, Training, and Vehicle Design.
Jamson, H. A. and Merat, N. (2005). Surrogate in-Vehicle Information Systems andDriver Behaviour: Effects of Visual and Cognitive Load in Simulated Rural Driving.Transportation Research Part F: Traffic Psychology and Behaviour, 8(2):79–96.
Jenstad, L. and Moon, J. (2011). Systematic Review of Barriers and Facilitators to HearingAid Uptake in Older Adults. Audiology Research, 1(1):25.
Johansson, K., Bronge, L., Lundberg, C., Persson, A., Seideman, M., and Viitanen, M.(1996). Can a Physician Recognize an Older Driver with Increased Crash Risk Potential?Journal of the American Geriatrics Society, 44(10):1198–1204.
Kahneman, D. (1973). Attention and Effort. Prentice Hall.
Katz, J. and Smith, P. S. (1991). The Staggered Spondaic Word Test. Annals of the NewYork Academy of Sciences, 620(1):233–251.
Kidd Jr, G., Mason, C. R., and Feth, L. L. (1984). Temporal Integration of ForwardMasking in Listeners having Sensorineural Hearing Loss. The Journal of the AcousticalSociety of America, 75(3):937–944.
Killion, M. C. (1978). Revised Estimate of Minimum Audible Pressure: Where is the“Missing 6 dB”? The Journal of the Acoustical Society of America, 63(5):1501–1508.

REFERENCES 287
Killion, M. C., Niquette, P. A., Gudmundsen, G. I., Revit, L. J., and Banerjee, S. (2004).Development of a Quick Speech-in-Noise Test for Measuring Signal-to-Noise Ratio Loss inNormal-Hearing and Hearing-Impaired Listeners. The Journal of the Acoustical Societyof America, 116(4):2395–2405.
Kleiner, M., Brainard, D., Pelli, D., Ingling, A., Murray, R., and Broussard, C. (2007).What’s New in Psychtoolbox-3. Perception, 36(14):1–1.
Klingberg, T. (2010). Training and Plasticity of Working Memory. Trends in CognitiveSciences, 14(7):317–324.
Knappe, G., Keinath, A., and Bengler, K. (2007). Driving Simulator as an Evaluation Tool- Assessment of the Influence of Field of View and Secondary Tasks on Lane Keepingand Steering Performance. Technical report, Friedrich Alexander Universit’at Erlangenand BMW Group Forschung und Technik.
Knudsen, L. V., Öberg, M., Nielsen, C., Naylor, G., and Kramer, S. E. (2010). FactorsInfluencing Help Seeking, Hearing Aid Uptake, Hearing Aid Use and Satisfaction withHearing Aids: A Review of the Literature. Trends in Amplification, 14(3):127–154.
Kochhann, R., Varela, J. S., de Macedo Lisboa, C. S., and Chaves, M. L. F. (2010). Themini mental state examination review of cutoff points adjusted for schooling in a largesouthern brazilian sample. Demntia and Neurophsycholigia, 4(5):35–41.
Kochkin, S. (1992). MarkeTrak III Identifies Key Factors in Determining ConsumerSatisfaction. Hearing Journal, 45:39–39.
Kosnik, W. D., Sekuler, R., and Kline, D. W. (1990). Self-Reported Visual Problems ofOlder Drivers. Human Factors: The Journal of the Human Factors and ErgonomicsSociety, 32(5):597–608.
Kramer, A. F., Wiegmann, D. A., and Kirlik, A. (2006). Attention: From Theory toPractice. Oxford University Press.
Kramer, S. E., Kapteyn, T. S., Festen, J. M., and Kuik, D. J. (1997). Assessing Aspects ofAuditory Handicap by Means of Pupil Dilatation. International Journal of Audiology,36(3):155–164.
Krejcie, R. V. and Morgan, D. W. (1970). Determining Sample Size for Research Activities.Educational and Psychological Measurement, 30(3):607–610.
Laberge, J., Scialfa, C., White, C., and Caird, J. (2004). Effects of Passenger and CellularPhone Conversations on Driver Distraction. Transportation Research Record: Journalof the Transportation Research Board, 1899(1):109–116.

288 REFERENCES
Lajunen, T., Corry, A., Summala, H., and Hartley, L. (1997). Impression Management andSelf-Deception in Traffic Behaviour Inventories. Personality and Individual Differences,22(3):341–353.
Lajunen, T., Parker, D., and Stradling, S. G. (1998). Dimensions of Driver Anger, Aggressiveand Highway Code Violations and Their Mediation by Safety Orientation in UK Drivers.Transportation Research Part F: Traffic Psychology and Behaviour, 1(2):107–121.
Lajunen, T., Parker, D., and Summala, H. (2004). The Manchester Driver BehaviourQuestionnaire: A Cross-Cultural Study. Accident Analysis and Prevention, 36(2):231–238.
Lajunen, T. and Summala, H. (2003). Can we Trust Self-Reports of Driving? Effects ofImpression Management on Driver Behaviour Questionnaire Responses. TransportationResearch Part F: Traffic Psychology and Behaviour, 6(2):97–107.
Lamble, D., Kauranen, T., Laakso, M., and Summala, H. (1999). Cognitive Load andDetection Thresholds in Car Following Situations: Safety Implications for Using Mobile(Cellular) Telephones While Driving. Accident Analysis and Prevention, 31(6):617–623.
Lance, C. E., Butts, M. M., and Michels, L. C. (2006). The Sources of Four CommonlyReported Cutoff Criteria: What Did They Really Say? Organizational Research Methods,9(2):202–220.
Langford, J., Methorst, R., and Hakamies-Blomqvist, L. (2006). Older Drivers Do NotHave a High Crash Risk—A Replication of Low Mileage Bias. Accident Analysis andPrevention, 38(3):574–578.
Lansdown, T. C., Brook-Carter, N., and Kersloot, T. (2004). Distraction From Multiplein-Vehicle Secondary Tasks: Vehicle Performance and Mental Workload Implications.Ergonomics, 47(1):91–104.
Laplante-Lévesque, A., Hickson, L., and Worrall, L. (2010). Rehabilitation of OlderAdults with Hearing Impairment: A Critical Review. Journal of Aging and Health,22(2):143–153.
Larsby, B., Hällgren, M., Lyxell, B., and Arlinger, S. (2005). Cognitive Performance andPerceived Effort in Speech Processing Tasks: Effects of Different Noise Backgrounds inNormal-Hearing and Hearing-Impaired Subjects. International Journal of Audiology,44(3):131–143.
Lavie, N. (1995). Perceptual Load as a Necessary Condition for Selective Attention. Journalof Experimental Psychology: Human Perception and Performance, 21(3):451.
Lavie, N. (2005). Distracted and Confused?: Selective Attention Under Load. Trends inCognitive Sciences, 9(2):75–82.

REFERENCES 289
Lawton, R., Parker, D., Manstead, A. S., and Stradling, S. G. (1997). The Role of Affectin Predicting Social Behaviors: The Case of Road Traffic Violations. Journal of AppliedSocial Psychology, 27(14):1258–1276.
Lewis-Evans, B., De Waard, D., and Brookhuis, K. A. (2011). Speed Maintenance UnderCognitive Load–Implications for Theories of Driver Behaviour. Accident Analysis andPrevention, 43(4):1497–1507.
Li, K. Z. and Lindenberger, U. (2002). Relations between Aging Sensory/Sensorimotorand Cognitive Functions. Neuroscience and Biobehavioral Reviews, 26(7):777–783.
Lichtenstein, M. J., Bess, F. H., and Logan, S. A. (1988). Validation of Screening Toolsfor Identifying Hearing-Impaired Elderly in Primary Care. The Journal of the AmericanMedical Association, 259(19):2875–2878.
Likert, R. (1932). A Technique for the Measurement of Attitudes. Archives of Psychology,140:44–60.
Lindeman, M. and Verkasalo, M. (1995). Personality, Situation, and Positive–NegativeAsymmetry in Socially Desirable Responding. European Journal of Personality, 9(2):125–134.
Lindenberger, U. and Baltes, P. B. (1994). Sensory Functioning and Intelligence in OldAge: A Strong Connection. Psychology and Aging, 9(3):339–355.
Lindenberger, U. and Baltes, P. B. (1997). Intellectual Functioning in Old and VeryOld Age: Cross-Sectional Results from the Berlin Aging Study. Psychology and Aging,12(3):410–432.
Lindenberger, U., Mayr, U., and Kliegl, R. (1993). Speed and Intelligence in Old Age.Psychology and Aging, 8(2):207–220.
Litwin, M. S. (1995). How to Measure Survey Reliability and Validity. Sage.
Liu, Y.-C. (2001). Comparative Study of the Effects of Auditory, Visual and Multi-modality Displays on Drivers’ Performance in Advanced Traveller Information Systems.Ergonomics, 44(4):425–442.
Lobley, K. J., Baddeley, A. D., and Gathercole, S. E. (2005). Phonological SimilarityEffects in Verbal Complex Span. The Quarterly Journal of Experimental PsychologySection A, 58(8):1462–1478.
Logan, G. D. and Crump, M. J. (2009). The Left Hand Doesn’t Know What the RightHand is Doing: The Disruptive Effects of Attention to the Hands in Skilled Typewriting.Psychological Science, 20(10):1296–1300.

290 REFERENCES
Loughlin, P. J. and Tacer, B. (1996). On the Amplitude-and Frequency-ModulationDecomposition of Signals. The Journal of the Acoustical Society of America, 100(3):1594–1601.
Lund, N. (2002). Attention and Pattern Recognition. Routledge.
Lunner, T. (2003). Cognitive Function in Relation to Hearing Aid Use. InternationalJournal of Audiology, 42:S49–S58.
Lunner, T., Rudner, M., and Rönnberg, J. (2009). Cognition and Hearing Aids. Scandina-vian Journal of Psychology, 50(5):395–403.
Lunner, T. and Sundewall-Thorén, E. (2007). Interactions Between Cognition, Compression,and Listening Conditions: Effects on Speech-in-Noise Performance in a Two-ChannelHearing Aid. Journal of the American Academy of Audiology, 18(7):604–617.
Lyxell, B., Andersson, J., Andersson, U., Arlinger, S., Bredberg, G., and Harder, H.(1998). Phonological Representation and Speech Understanding with Cochlear Implantsin Deafened Adults. Scandinavian Journal of Psychology, 39(3):175–179.
Lyxell, B., Andersson, U., Borg, E., and Ohlsson, I.-S. (2003). Working-memory Capacityand Phonological Processing in Deafened Adults and Individuals with a Severe HearingImpairment. International Journal of Audiology, 42(S1):S86–S89.
Lyxell, B. and Rönnberg, J. (1989). Information-Processing Skill and Speech-Reading.British Journal of Audiology, 23(4):339–347.
Marottoli, R. and Drickamer, M. (1993). Psychomotor Mobility and the Elderly Driver.Clinics in Geriatric Medicine, 9(2):403–411.
Marottoli, R. A., Cooney, L. M., Wagner, D. R., Doucette, J., and Tinetti, M. E. (1994).Predictors of Automobile Crashes and Moving Violations Among Elderly Drivers. Annalsof Internal Medicine, 121(11):842–846.
Marottoli, R. A., Richardson, E. D., Stowe, M. H., Miller, E. G., Brass, L. M., Cooney Jr,L. M., and Tinetti, M. E. (1998). Development of a Test Battery to Identify OlderDrivers at Risk for Self-Reported Adverse Driving Events. Journal of the AmericanGeriatrics Society, 46(5):562–568.
Martens, M. and Van Winsum, W. (2000). Measuring Distraction: The Peripheral DetectionTask. TNO Human Factors.
Martin, J. S. and Jerger, J. F. (2005). Some Effects of Aging on Central Auditory Processing.Journal of Rehabilitation Research and Development, 42(4):25.
Martin, M. (1987). Practical Aspects of Audiology: Speech Audiometry. Whurr, London.

REFERENCES 291
MATLAB (2010). Version 7.10.0 (R2010a).
Matthews, M. L. and Cousins, L. R. (1980). The Influence of Vehicle Type on theEstimation of Velocity While Driving. Ergonomics, 23(12):1151–1160.
Mayer, C. (2007). What Really Matters in the Early Literacy Development of Deaf Children.Journal of Deaf Studies and Deaf Education, 12(4):411–431.
McCarley, J. S., Vais, M., Pringle, H., Kramer, A. F., Irwin, D. E., and Strayer, D. L.(2004). Conversation Disrupts change detection in complex traffic scenes. Human Factors,46(3):424–436.
McCloskey, L. W., Koepsell, T. D., Wolf, M. E., and Buchner, D. M. (1994). MotorVehicle Collision Injuries and Sensory Impairments of Older Drivers. Age and Ageing,23(4):267–273.
McCoy, S. L., Tun, P. A., Cox, L. C., Colangelo, M., Stewart, R. A., and Wingfield,A. (2005). Hearing Loss and Perceptual Effort: Downstream Effects on Older Adults’Memory for Speech. The Quarterly Journal of Experimental Psychology Section A,58(1):22–33.
McDowd, J. and Shaw, R. (2000). Attention and Aging: A Functional Perspective. In Craik,F. I. and Salthouse, T. A., editors, The Handbook of Aging and Cognition. LawrenceErlbaum.
McEvoy, S. P., Stevenson, M. R., McCartt, A. T., Woodward, M., Haworth, C., Palamara,P., and Cercarelli, R. (2005). Role of Mobile Phones in Motor Vehicle Crashes Resultingin Hospital Attendance: A Case-Crossover Study. British Medical Journal, 331(7514):428–433.
McFarland, R. and Moore, R. (1955). Human Variables in Motor Vehicle Accidents: AReview of the Literature. Technical report, Harvard School of Public Health.
McGehee, D. V. (2014). Visual and Cognitive Distraction Metrics in the Age of the SmartPhone: A Basic Review. Annals of Advances in Automotive Medicine, 58:15–23.
McGwin Jr, G., Owsley, C., and Ball, K. (1998). Identifying Crash Involvement AmongOlder Drivers: Agreement Between Self-Report and State Records. Accident Analysisand Prevention, 30(6):781–791.
McKenna, F. P. (2007). Do Attitudes and Intentions Change Across a Speed AwarenessWorkshop? In 17th Seminar Proceedings: Behavioural Research in Road Safety, pages265–276.
McKnight, A. J. and McKnight, A. S. (1993). The Effect of Cellular Phone Use UponDriver Attention. Accident Analysis and Prevention, 25(3):259–265.

292 REFERENCES
McManus, B., Cox, M. K., Vance, D. E., and Stavrinos, D. (2015). Predicting MotorVehicle Collisions in a Driving Simulator in Young Adults Using the Useful Field ofView Assessment. Traffic Injury Prevention, 16(8):818–823.
Medeiros-Ward, N., Cooper, J. M., and Strayer, D. L. (2014). Hierarchical Control andDriving. Journal of Experimental Psychology: General, 143(3):953–958.
Merat, N. and Jamson, A. (2007). Multisensory signal detection: How does driving andIVIS management affect performance. In Proceedings of the 4th International DrivingSymposium on Human Factors in Driver Assessement, Training and Vehicle Design,pages 351–357.
Merat, N. and Jamson, A. H. (2005). Shut Up I’m Driving! Is Talking to an InconsideratePassenger the Same as Talking On a Mobile Telephone. In Proceedings of the ThirdInternational Driving Symposium on Human Factors in Driver Assessment, Trainingand Vehicle Design, pages 426–432.
Merat, N. and Jamson, A. H. (2008). The Effect of Stimulus Modality on Signal Detection:Implications for Assessing the Safety of in-Vehicle Technology. Human Factors: TheJournal of the Human Factors and Ergonomics Society, 50(1):145–158.
Merat, N. and Jamson, A. H. (2013). The Effect of Three Low-Cost Engineering Treatmentson Driver Fatigue: A Driving Simulator Study. Accident Analysis and Prevention, 50:8–15.
Merat, N. and Jamson, H. (2011). A Driving Simulator Study to Examine the Role ofVehicle Acoustics on Drivers’ Speed Perception. In Proceedings of the sixth internationalsymposium on Human Factors in Driver Assessment, Training and Vehicle Design, pages226–232.
Metropolitan Police (2014). Metropolitan Police Response to a Freedom of InformationRequest. Available from: http://www.met.police.uk/foi/pdfs/disclosure_2014/June_2014/2014060000016.pdf. [Last accessed: 20/01/2015].
Metz, B., Landau, A., and Hargutt, V. (2015). Frequency and Impact of Hands-FreeTelephoning while Driving - Results from Naturalistic Driving Data. TransportationResearch Part F: Traffic Psychology and Behaviour, 29:1–13.
Michon, J. A. (1985). A critical view of driver behavior models: what do we know, whatshould we do? In Evans, L. and Schwing, R. C., editors, Human behavior and trafficsafety, pages 485–524. Springer.
Miura, T. (1986). Coping with Situational Demands: A Study of Eye Movements andPeripheral Vision Performance. In Gale, A., Brown, I., Haselgrave, C., Smith, P., andTaylor, S., editors, Proceedings of Vision in Vehicles. Elsevier, Amsterdam.

REFERENCES 293
Miyazaki, S. and Ishida, A. (1987). Traffic-Alarm Sound Monitor for Aurally HandicappedDrivers. Medical and Biological Engineering and Computing, 25(1):68–74.
Moore, B. and Glasberg, B. (1997). A Model of Loudness Perception Applied to CochlearHearing Loss. Auditory Neuroscience, 3(3):289–311.
Moore, B. C. (1996). Perceptual Consequences of Cochlear Hearing Loss and TheirImplications for the Design of Hearing Aids. Ear and Hearing, 17(2):133–161.
Moore, B. C. (2001). Dead Regions in the Cochlea: Diagnosis, Perceptual Consequences,and Implications for the Fitting of Hearing Aids. Trends in Amplification, 5(1):1–34.
Moore, B. C. (2003a). An Introduction to the Psychology of Hearing. Academic Press.
Moore, B. C. (2003b). Speech Processing for the Hearing-Impaired: Successes, Failures,and Implications for Speech Mechanisms. Speech Communication, 41(1):81–91.
Moore, B. C. (2007). Cochlear Hearing Loss: Physiological, Psychological and TechnicalIssues. John Wiley and Sons.
Moore, B. C. (2008). The Role of Temporal Fine Structure Processing in Pitch Perception,Masking, and Speech Perception for Normal-Hearing and Hearing-Impaired People.Journal of the Association for Research in Otolaryngology, 9(4):399–406.
Moore, B. C. (2012). An introduction to the psychology of hearing. Brill.
Moore, B. C. and Glasberg, B. R. (1983). Suggested Formulae for Calculating Auditory-Filter Bandwidths and Excitation Patterns. The Journal of the Acoustical Society ofAmerica, 74(3):750–753.
Moore, B. C. and Glasberg, B. R. (1993). Simulation of the Effects of Loudness Recruitmentand Threshold Elevation on the Intelligibility of Speech in Quiet and in a Background ofSpeech. The Journal of the Acoustical Society of America, 94(4):2050–2062.
Moore, B. C. and Glasberg, B. R. (2004). A Revised Model of Loudness Perception Appliedto Cochlear Hearing Loss. Hearing Research, 188(1):70–88.
Moore, B. C., Glasberg, B. R., and Stone, M. A. (1991). Optimization of a Slow-ActingAutomatic Gain Control System for Use in Hearing Aids. British Journal of Audiology,25(3):171–182.
Moore, B. C., Glasberg, B. R., and Vickers, D. A. (1995). Simulation of the Effectsof Loudness Recruitment on the Intelligibility of Speech in Noise. British Journal ofAudiology, 29(3):131–143.
Moore, B. C., Glasberg, B. R., and Vickers, D. A. (1999). Further Evaluation of a Modelof Loudness Perception Applied to Cochlear Hearing Loss. The Journal of the AcousticalSociety of America, 106(2):898–907.

294 REFERENCES
Moore, B. C., Johnson, J. S., Clark, T. M., and Pluvinage, V. (1992). Evaluation of aDual-Channel Full Dynamic Range Compression System for People with SensorineuralHearing Loss. Ear and Hearing, 13(5):349–370.
Moore, B. C., Vickers, D. A., Glasberg, B. R., and Baer, T. (1997). Comparison of Realand Simulated Hearing Impairment in Subjects with Unilateral and Bilateral CochlearHearing Loss. British Journal of Audiology, 31(4):227–245.
Mueller, H. G. and Powers, T. A. (2001). Consideration of Auditory Acclimatization inthe Prescriptive Fitting of Hearing Aids. Seminars in Hearing, 22(2):103–124.
Murnane, O. and Turner, C. W. (1991). Growth of Masking in Sensorineural Hearing Loss.International Journal of Audiology, 30(5):275–285.
Murphy, D. R., Craik, F. I., Li, K. Z., and Schneider, B. A. (2000). Comparing the Effectsof Aging and Background Noise of Short-Term Memory Performance. Psychology andAging, 15(2):323–334.
Murphy, S., Fraenkel, N., and Dalton, P. (2013). Perceptual Load does not ModulateAuditory Distractor Processing. Cognition, 129(2):345–355.
Myers, R. S., Ball, K. K., Kalina, T. D., Roth, D. L., and Goode, K. T. (2000). Relationof Useful Field of View and Other Screening Tests to On-Road Driving Performance.Perceptual and Motor Skills, 91(1):279–290.
Nachmias, J. and Steinman, R. M. (1965). An Experimental Comparison of the Methodof Limits and the Double Staircase-Method. The American Journal of Psychology,78(1):112–115.
Nagelkerke, N. J. (1991). A Note on a General Definition of the Coefficient of Determination.Biometrika, 78(3):691–692.
Naramura, H., Nakanishi, N., Tatara, K., Ishiyama, M., Shiraishi, H., and Yamamoto, A.(1999). Physical and Mental Correlates of Hearing Impairment in the Elderly in Japan.International Journal of Audiology, 38(1):24–29.
Navon, D. and Gopher, D. (1979). On the Economy of the Human-Processing System.Psychological Review, 86(3):214–255.
Nederhof, A. J. (1985). Methods of Coping with Social Desirability Bias: A Review.European Journal of Social Psychology, 15(3):263–280.
Neisser, U. (1976). Cognition and Reality: Principles and Implications of CognitivePsychology. W. H. Freeman.

REFERENCES 295
Nejime, Y. and Moore, B. C. (1997). Simulation of the Effect of Threshold Elevation andLoudness Recruitment Combined with Reduced Frequency Selectivity on the Intelligibilityof Speech in Noise. The Journal of the Acoustical Society of America, 102(1):603–615.
Newman, C. W., Weinstein, B. E., Jacobson, G. P., and Hug, G. A. (1990). The HearingHandicap Inventory for Adults: Psychometric Adequacy and Audiometric Correlates.Ear and Hearing, 11(6):430–433.
Newman, C. W., Weinstein, B. E., Jacobson, G. P., and Hug, G. A. (1991). Test-RetestReliability of the Hearing Handicap Inventory for Adults. Ear and Hearing, 12(5):355–357.
Niskar, A. S., Kieszak, S. M., Holmes, A. E., Esteban, E., Rubin, C., and Brody, D. J.(2001). Estimated Prevalence of Noise-Induced Hearing Threshold Shifts Among Children6 to 19 Years of Age: The Third National Health and Nutrition Examination Survey,1988–1994, United States. Pediatrics, 108(1):40–43.
Noble, W. (2006). Bilateral Hearing Aids: A Review of Self-Reports of Benefit in Compari-son with Unilateral Fitting. International Journal of Audiology, 45(S1):63–71.
Nondahl, D. M., Cruickshanks, K. J., Wiley, T. L., Tweed, T. S., Klein, R., and Klein,B. E. K. (1998). Accuracy of Self-Reported Hearing Loss. International Journal ofAudiology, 37(5):295–301.
Norman, L. (1962). Driving and Medical Fitness. The Journal of the Royal Institute ofPublic Health and Hygiene, 25:288–292.
Nunes, L. and Recarte, M. A. (2002). Cognitive Demands of Hands-Free-Phone Conversa-tion While Driving. Transportation Research Part F: Traffic Psychology and Behaviour,5(2):133–144.
Ohene-Djan, J., Hersh, M., and Naqvi, S. (2010). Investigating Road Safety Issues and DeafPeople in the United Kingdom: An Empirical Study and Recommendations for GoodPractice. Journal of Prevention and Intervention in the Community, 38(4):290–305.
Olson, R. L., Hanowski, R. J., Hickman, J. S., and Bocanegra, J. L. (2009). Driverdistraction in commercial vehicle operations. Technical report, Federal Motor CarrierSafety Administration.
Olsson, S. and Burns, P. (2000). Measuring Driver Visual Distraction with a PeripheralDetection Task. Technical report, National Highway Traffic Safety Administration.
Owsley, C. (1994). Vision and Driving in the Elderly. Optometry and Vision Science,71(12):727–735.

296 REFERENCES
Owsley, C., Ball, K., McGwin Jr, G., Sloane, M. E., Roenker, D. L., White, M. F., andOverley, E. T. (1998). Visual Processing Impairment and Risk of Motor Vehicle CrashAmong Older Adults. The Journal of the American Medical Association, 279(14):1083–1088.
Owsley, C., Ball, K., Sloane, M. E., Roenker, D. L., and Bruni, J. R. (1991). Vi-sual/Cognitive Correlates of Vehicle Accidents in Older Drivers. Psychology and Aging,6(3):403.
Owsley, C. and McGwin Jr, G. (1999). Vision Impairment and Driving. Survey ofOphthalmology, 43(6):535–550.
Oxford Dictionaries (2012). Oxford English Dictionary. Oxford University Press.
Özkan, T. and Lajunen, T. (2005). A New Addition to DBQ: Positive Driver BehavioursScale. Transportation Research Part F: Traffic Psychology and Behaviour, 8(4):355–368.
Özkan, T., Lajunen, T., Chliaoutakis, J. E., Parker, D., and Summala, H. (2006a).Cross-Cultural Differences in Driving Behaviours: A Comparison of Six Countries.Transportation Research Part F: Traffic Psychology and Behaviour, 9(3):227–242.
Özkan, T., Lajunen, T., and Summala, H. (2006b). Driver Behaviour Questionnaire: AFollow-Up Study. Accident Analysis and Prevention, 38(2):386–395.
Parker, D., Lajunen, T., and Stradling, S. (1998). Attitudinal Predictors of InterpersonallyAggressive Violations On the Road. Transportation Research Part F: Traffic Psychologyand Behaviour, 1(1):11–24.
Parker, D., McDonald, L., Rabbitt, P., and Sutcliffe, P. (2000). Elderly Drivers andTheir Accidents: The Aging Driver Questionnaire. Accident Analysis and Prevention,32(6):751–759.
Parker, D., Reason, J. T., Manstead, A. S., and Stradling, S. G. (1995a). Driving Errors,Driving Violations and Accident Involvement. Ergonomics, 38(5):1036–1048.
Parker, D., West, R., Stradling, S., and Manstead, A. S. (1995b). Behavioural Character-istics and Involvement in Different Types of Traffic Accident. Accident Analysis andPrevention, 27(4):571–581.
Pashler, H. (1994). Dual-Task Interference in Simple Tasks: Data and Theory. PsychologicalBulletin, 116(2):220.
Patrick, D. L. and Deyo, R. A. (1989). Generic and Disease-Specific Measures in AssessingHealth Status and Quality of Life. Medical Care, 27(Suppliment 3):S217–S232.

REFERENCES 297
Paulhus, D. L. (1991). Measurement and Control of Response Bias. In Robinson, J.,Shaver, P., and Wrightsman, L., editors, Measures of Personality and Social PsychologicalAttitudes: Volume 1: Measures of Social Psychological Attitudes Series, pages 17–59.Academic Press.
Pelli, D. G. (1997). The VideoToolbox Software for Visual Psychophysics: TransformingNumbers Into Movies. Spatial Vision, 10(4):437–442.
Persson, D. (1993). The Elderly Driver: Deciding When to Stop. The Gerontologist,33(1):88–91.
Peters, R. W., Moore, B. C., and Baer, T. (1998). Speech Reception Thresholds in Noisewith and Without Spectral and Temporal Dips for Hearing-Impaired and NormallyHearing People. The Journal of the Acoustical Society of America, 103(1):577–587.
Phillips, D. (1987). Stimulus Intensity and Loudness Recruitment: Neural Correlates. TheJournal of the Acoustical Society of America, 82(1):1–12.
Picard, M., Girard, S. A., Courteau, M., Leroux, T., Larocque, R., Turcotte, F., Lavoie,M., and Simard, M. (2008). Could Driving Safety be Compromised by Noise Exposureat Work and Noise-Induced Hearing Loss? Traffic Injury Prevention, 9(5):489–499.
Pichora-Fuller, M. K. (1996). Working Memory and Speechreading. In Stork, D. G.and Hennecke, M. E., editors, Speechreading by Humans and Machines, pages 257–274.Springer.
Pichora-Fuller, M. K., Schneider, B. A., and Daneman, M. (1995). How Young and OldAdults Listen to and Remember Speech in Noise. The Journal of the Acoustical Societyof America, 97(1):593–608.
Pickles, J. O. (2012). An Introduction to the Physiology of Hearing. Brill.
Plomp, R. (1986). A Signal-to-Noise Ratio Model for the Speech-Reception Threshold of theHearing Impaired. Journal of Speech, Language, and Hearing Research, 29(2):146–154.
Plomp, R. (1988). The Negative Effect of Amplitude Compression in Multichannel HearingAids in the Light of the Modulation-Transfer Function. The Journal of the AcousticalSociety of America, 83(6):2322–2327.
Poeppel, D., Idsardi, W. J., and van Wassenhove, V. (2008). Speech Perception at theInterface of Neurobiology and Linguistics. Philosophical Transactions of the Royal SocietyB: Biological Sciences, 363(1493):1071–1086.
Pomplun, M., Reingold, E. M., and Shen, J. (2001). Investigating the Visual Span inComparative Search: The Effects of Task Difficulty and Divided Attention. Cognition,81(2):B57–B67.

298 REFERENCES
Pöysti, L., Rajalin, S., and Summala, H. (2005). Factors Influencing the Use of Cellular(Mobile) Phone During Driving and Hazards While Using it. Accident Analysis andPrevention, 37(1):47–51.
Quinn, G. P. and Keough, M. J. (2002). Experimental Design and Data Analysis forBiologists. Cambridge University Press.
Rabbitt, P. (1991). Mild Hearing Loss Can Cause Apparent Memory Failures WhichIncrease with Age and Reduce with IQ. Acta Oto-Laryngologica, 111(S476):167–176.
Rabbitt, P. M. (1968). Channel-Capacity, Intelligibility and Immediate Memory. TheQuarterly Journal of Experimental Psychology, 20(3):241–248.
Rabinowitz, P. M. (2000). Noise-Induced Hearing Loss. American Family Physician,61(9):2759–2760.
Rakauskas, M. E., Gugerty, L. J., and Ward, N. J. (2004). Effects of Naturalistic Cell PhoneConversations on Driving Performance. Journal of Safety Research, 35(4):453–464.
Raphael, L. J. and Isenberg, D. (1980). Acoustic Cues for a Fricative-Affricate Contrast inWord-Final Position. Journal of Phonetics, 8(4):397–405.
Rawool, V. W. (2006). The Effects of Hearing Loss on Temporal Processing. HearingReview, 13(6):42.
Reason, J., Manstead, A., Stradling, S., Baxter, J., and Campbell, K. (1990). Errors andViolations On the Roads: A Real Distinction? Ergonomics, 33(10-11):1315–1332.
Recarte, M. A. and Nunes, L. M. (2003). Mental Workload While Driving: Effects onVisual Search, Discrimination, and Decision Making. Journal of Experimental Psychology:Applied, 9(2):119–137.
Redelmeier, D. A. and Tibshirani, R. J. (1997). Association Between Cellular-TelephoneCalls and Motor Vehicle Collisions. New England Journal of Medicine, 336(7):453–458.
Reimer, B. (2009). Impact of Cognitive Task Complexity on Drivers’ Visual Tunnel-ing. Transportation Research Record: Journal of the Transportation Research Board,2138(1):13–19.
Retchin, S. M. and Anapolle, J. (1993). An Overview of the Older Driver. Clinics inGeriatric Medicine, 9(2):279–296.
Richard, C. M., Wright, R. D., Ee, C., Prime, S. L., Shimizu, Y., and Vavrik, J. (2002).Effect of a Concurrent Auditory Task on Visual Search Performance in a Driving-RelatedImage-Flicker Task. Human Factors: The Journal of the Human Factors and ErgonomicsSociety, 44(1):108–119.

REFERENCES 299
Richards, E., Bennett, P. J., and Sekuler, A. B. (2006). Age Related Differences in Learningwith the Useful Field of View. Vision Research, 46(25):4217–4231.
Ricketts, T. A. (2001). Directional Hearing Aids. Trends in Amplification, 5(4):139–176.
Rimmö, P.-A. (2002). Aberrant Driving Behaviour: Homogeneity of a Four-Factor Structurein Samples Differing in Age and Gender. Ergonomics, 45(8):569–582.
Rimmö, P.-A. and Åberg, L. (1999). On the Distinction Between Violations and Errors:Sensation Seeking Associations. Transportation Research Part F: Traffic Psychologyand Behaviour, 2(3):151–166.
Risto, M. and Martens, M. H. (2014). Supporting Driver Headway Choice: The Effects ofDiscrete Headway Feedback when Following Headway Instructions. Applied Ergonomics,45(4):1167–1173.
Roman, D. D., Edwall, G. E., Buchanan, R. J., and Patton, J. H. (1991). Extended Normsfor the Paced Auditory Serial Addition Task. The Clinical Neuropsychologist, 5(1):33–40.
Ronnberg, J. (2003). Cognition in the Hearing Impaired and Deaf as a Bridge BetweenSignal and Dialogue: A Framework and a Model. International Journal of Audiology,42:S68–S76.
Rönnberg, J., Lunner, T., Zekveld, A., Sörqvist, P., Danielsson, H., Lyxell, B., Dahlström,Ö., Signoret, C., Stenfelt, S., Pichora-Fuller, M. K., et al. (2013). The Ease of LanguageUnderstanding (ELU) Model: Theoretical, Empirical, and Clinical Advances. Frontiersin Systems Neuroscience, 7(31):1–17.
Rönnberg, J., Rudner, M., Foo, C., and Lunner, T. (2008). Cognition Counts: A WorkingMemory System for Ease of Language Understanding (ELU). International Journal ofAudiology, 47(S2):S99–S105.
Rosen, S. and Howell, P. (2011). Signals and Systems for Speech and Hearing. Brill.
Roskam, A., Brookhuis, K., de Waard, D., Carsten, O., Read, L., Jamson, S., Ostlund, J.,Bolling, A., Nilsson, L., Antilla, V., Hoedemaker, M., W, J., J, H., Johansson, E., Tevell,M., Fowkes, M., Engstr’om, J., and Victor, T. (2002). Development of ExperimentalProtocol. Deliverable 1. eu project HASTE, project number GRD1/2000/25361. Availablefrom: http://www.its.leeds.ac.uk/projects/haste/HASTE%20Deliverable%201%20v1.1.pdf. [Last accessed: 27/09/2015].
Roth, T. N., Hanebuth, D., and Probst, R. (2011). Prevalence of Age-Related Hearing Lossin Europe: A Review. European Archives of Oto-Rhino-Laryngology, 268(8):1101–1107.
Royan, J., Tombaugh, T., Rees, L., and Francis, M. (2004). The Adjusting-Paced Se-rial Addition Test (Adjusting-PSAT): Thresholds for Speed of Information Processing

300 REFERENCES
As a Function of Stimulus Modality and Problem Complexity. Archives of ClinicalNeuropsychology, 19(1):131–143.
Roydhouse, N. (1967). Deafness and Driving. The New Zealand Medical Journal,66(425):878–881.
Rudner, M., Rönnberg, J., and Lunner, T. (2011). Working Memory Supports Llisteningin Noise for Persons with Hearing Impairment. Journal of the American Academy ofAudiology, 22(3):156–167.
Salonen, J., Johansson, R., Karjalainen, S., Vahlberg, T., and Isoaho, R. (2011). Relation-ship Between Self-Reported Hearing and Measured Hearing Impairment in an ElderlyPopulation in Finland. International Journal of Audiology, 50(5):297–302.
Salthouse, T. (2000). A Theory of Cognitive Aging. Elsevier.
Salthouse, T. A. (1991). Mediation of Adult Age Differences in Cognition by Reductionsin Working Memory and Speed of Processing. Psychological Science, 2(3):179–183.
Salthouse, T. A. (1994). The Aging of Working Memory. Neuropsychology, 8(4):535–543.
Salthouse, T. A. and Hedden, T. (2002). Interpreting Reaction Time Measures in Between-Group Comparisons. Journal of Clinical and Experimental Neuropsychology, 24(7):858–872.
Sampson, H. (1956). Pacing and Performance on a Serial Addition Task. Canadian Journalof Psychology, 10(4):219–225.
Sanders, A. F. (1970). Some Aspects of the Selective Process in the Functional VisualField. Ergonomics, 13(1):101–117.
Sarampalis, A., Kalluri, S., Edwards, B., and Hafter, E. (2009). Objective Measures ofListening Effort: Effects of Background Noise and Noise Reduction. Journal of Speech,Language, and Hearing Research, 52(5):1230–1240.
Schein, J. D. (1968). The Deaf Community: Studies in the Social Psychology of Deafness.Gallaudet College Press.
Seitz, K. and Schumann-Hengsteler, R. (2002). Phonological Loop and Central ExecutiveProcesses in Mental Addition and Multiplication. Psychologische Beitrage, 44(2):275–302.
Sekuler, B., Bennett, P. J., and Mortimer Mamelak, A. (2000). Effects of Aging on theUseful Field of View. Experimental Aging Research, 26(2):103–120.
Sekuler, R. and Ball, K. (1986). Visual Localization: Age and Practice. Journal of theOptical Society of America A, Optics and Image Science, 3(6):864–867.

REFERENCES 301
Selander, H., Lee, H. C., Johansson, K., and Falkmer, T. (2011). Older Drivers: On-Roadand Off-Road Test Results. Accident Analysis and Prevention, 43(4):1348–1354.
Shaffer, J. P. (1995). Multiple Hypothesis Testing. Annual Review of Psychology, 46(1):561–584.
Shaffer, L. H. (1975). Multiple attention in continuous verbal tasks. In Rabbitt, P. andDornic, S., editors, Attention and Performance V, pages 157–167. Academic Press.
Shannon, R. V., Zeng, F.-G., Kamath, V., Wygonski, J., and Ekelid, M. (1995). SpeechRecognition with Primarily Temporal Cues. Science, 270(5234):303–304.
Shaw, E. (1974). Transformation of Sound Pressure Level From the Free Field to theEardrum in the Horizontal Plane. The Journal of the Acoustical Society of America,56(6):1848–1861.
Shinn-Cunningham, B. G. and Best, V. (2008). Selective Attention in Normal and ImpairedHearing. Trends in Amplification, 12(4):283–299.
Simon, H. J. and Yund, E. W. (1993). Frequency Discrimination in Listeners withSensorineural Hearing Loss. Ear and Hearing, 14(3):190–201.
Sims, R. V., McGwin Jr, G., Allman, R. M., Ball, K., and Owsley, C. (2000). ExploratoryStudy of Incident Vehicle Crashes Among Older Drivers. Journals of Gerontology-Biological Sciences and Medical Sciences, 55(1):M22.
Sindhusake, D., Mitchell, P., Smith, W., Golding, M., Newall, P., Hartley, D., and Rubin,G. (2001). Validation of Self-Reported Hearing Loss. The Blue Mountains Hearing Study.International Journal of Epidemiology, 30(6):1371–1378.
Singh-Manoux, A., Kivimaki, M., Glymour, M. M., Elbaz, A., Berr, C., Ebmeier, K. P.,Ferrie, J. E., Dugravot, A., et al. (2012). Timing of Onset of Cognitive Decline: Resultsfrom Whitehall II Prospective Cohort Study. British Medical Journal, 344:1–8.
Sivak, M. et al. (1996). The Information That Drivers Use: Is It Indeed 90% Visual?Perception, 25(9):1081–1090.
Skinner, M. W., Holden, L. K., Holden, T. A., Demorest, M. E., and Fourakis, M. S. (1997).Speech Recognition at Simulated Soft, Conversational, and Raised-to-Loud Vocal Effortsby Adults with Cochlear Implants. The Journal of the Acoustical Society of America,101(6):3766–3782.
Slawinski, E. B. and MacNeil, J. F. (2002). Age, Music, and Driving Performance.Psychomusicology: Music, Mind and Brain, 18(1):123–131.
Smeds, K. (2004). Is Normal or Less Than Normal Overall Loudness Preferred by First-TimeHearing Aid Users? Ear and Hearing, 25(2):159–172.

302 REFERENCES
Snyder, J. S., Gregg, M. K., Weintraub, D. M., and Alain, C. (2012). Attention, Awareness,and the Perception of Auditory Scenes. Frontiers in psychology, 3(15):1–17.
Songer, T. J. (1993). Hearing Disorders and Commercial Motor Vehicle Drivers. Technicalreport, Federal Highway Administration, Office of Motor Carriers.
Spelke, E., Hirst, W., and Neisser, U. (1976). Skills of divided attention. Cognition,4(3):215–230.
Spence, C. and Driver, J. (2004). Crossmodal Space and Crossmodal Attention. OxfordUniversity Press.
Stach, B. (2008). Clinical Audiology: An Introduction. Cengage Learning.
Steinhardt, D. A. and Wishart, D. E. (2006). Driver and Rider Licensing Provisions forClients Who Are d/Deaf. Journal of the Australasian College of Road Safety, 17(3):34–39.
Stelmachowicz, P. G., Lewis, D. E., Larson, L. L., and Jesteadt, W. (1987). Growth ofMasking as a Measure of Response Growth in Hearing-Impaired Listeners. The Journalof the Acoustical Society of America, 81(6):1881–1887.
Stenfelt, S. and Rönnberg, J. (2009). The Signal-Cognition Interface: Interactions BetweenDegraded Auditory Signals and Cognitive Processes. Scandinavian Journal of Psychology,50(5):385–393.
Stephens, D. and Zhao, F. (1996). Hearing Impairment: Special Needs of the Elderly. FoliaPhoniatrica et Logopaedica, 48(3):137–142.
Stevens, S. and Guirao, M. (1967). Loudness Functions Under Inhibition. Perception andPsychophysics, 2(10):459–465.
Stickney, G., Nie, K., Kong, Y.-Y., Chen, H., and Zeng, F.-G. (2004). Temporal FineStructure: The Missing Component in Speech Processing Algorithms. In InternationalCongress Series, volume 1273, pages 23–26. Elsevier.
Stradling, S. G., Parker, D., Lajunen, T., Meadows, M. L., and Xiel, C. Q. (2000). NormalBehavior and Traffic Safety: Violations, Errors, Lapses and Crashes. In von Holst,H., Nygren, A., and Andersson, A. E., editors, Transportation, Traffic Safety andHealth—Human Behavior, pages 279–295. Springer.
Strayer, D. L. and Drew, F. A. (2004). Profiles in Driver Distraction: Effects of Cell PhoneConversations On Younger and Older Drivers. Human Factors: The Journal of theHuman Factors and Ergonomics Society, 46(4):640–649.
Strayer, D. L., Drews, F. A., and Johnston, W. A. (2003). Cell Phone-Induced Failuresof Visual Attention During Simulated Driving. Journal of Experimental Psychology:Applied, 9(1):23–32.

REFERENCES 303
Strayer, D. L. and Johnston, W. A. (2001). Driven to Distraction: Dual-Task Studiesof Simulated Driving and Conversing On a Cellular Telephone. Psychological science,12(6):462–466.
Studebaker, G. A., Sherbecoe, R. L., McDaniel, D. M., and Gwaltney, C. A. (1999).Monosyllabic Word Recognition at Higher-than-Normal Speech and Noise Levels. TheJournal of the Acoustical Society of America, 105(4):2431–2444.
Stutts, J. C., Stewart, J. R., and Martell, C. (1998). Cognitive Test Performance and CrashRisk in an Older Driver Population. Accident Analysis and Prevention, 30(3):337–346.
Sümer, N. (2003). Personality and Behavioral Predictors of Traffic Accidents: Testing aContextual Mediated Model. Accident Analysis and Prevention, 35(6):949–964.
Szklo, M. and Nieto, F. J. (2012). Epidemiology: Beyond the Basics. Jones and BartlettPublishers.
Tabachnick, B. G. and Fidell, L. S. (2013). Using Multivariate Statistics. Pearson.
Tabak, J. (2006). Significant Gestures: A History of American Sign Language. GreenwoodPublishing Group.
Tambs, K. (2004). Moderate Effects of Hearing Loss on Mental Health and SubjectiveWell-Being: Results From the Nord-Trøndelag Hearing Loss Study. PsychosomaticMedicine, 66(5):776–782.
ter Keurs, M., Festen, J. M., and Plomp, R. (1992). Effect of Spectral Envelope Smearing onSpeech Reception. I. The Journal of the Acoustical Society of America, 91(5):2872–2880.
ter Keurs, M., Festen, J. M., and Plomp, R. (1993). Effect of Spectral Envelope Smearing onSpeech Reception. II. The Journal of the Acoustical Society of America, 93(3):1547–1552.
Thorslund, B., Ahlström, C., Peters, B., Eriksson, O., Lidestam, B., and Lyxell, B. (2014).Cognitive Workload and Visual Behavior in Elderly Drivers with Hearing Loss. EuropeanTransport Research Review, 6:377–385.
Thorslund, B., Peters, B., Herbert, N., Holmqvist, K., Lidestam, B., Black, A., and Lyxell,B. (2013a). Hearing Loss and a Supportive Tactile Signal in a Navigation System: Effectson Driving Behavior and Eye Movements. Journal of Eye Movement Research, 6(5):1–9.
Thorslund, B., Peters, B., Lidestam, B., and Lyxell, B. (2013b). Cognitive Workload andDriving Behavior in Persons with Hearing Loss. Transportation Research Part F: TrafficPsychology and Behaviour, 21:113–121.
Thorslund, B., Peters, B., Lyxell, B., and Lidestam, B. (2013c). The Influence of HearingLoss On Transport Safety and Mobility. European Transport Research Review, 5(3):117–127.

304 REFERENCES
Törnros, J. E. and Bolling, A. K. (2005). Mobile Phone Use—Effects of Handheld andHandsfree Phones On Driving Performance. Accident Analysis and Prevention, 37(5):902–909.
Treisman, A. M. (1960). Contextual Cues in Selective Listening. Quarterly Journal ofExperimental Psychology, 12(4):242–248.
Uhlmann, R. F., Larson, E. B., Rees, T. S., Koepsell, T. D., and Duckert, L. G. (1989).Relationship of Hearing Impairment to Dementia and Cognitive Dysfunction in OlderAdults. Journal of the American Medical Association, 261(13):1916–1919.
Underwood, G., Chapman, P., Bowden, K., and Crundall, D. (2002). Visual Search WhileDriving: Skill and Awareness During Inspection of the Scene. Transportation ResearchPart F: Traffic Psychology and Behaviour, 5(2):87–97.
Unsworth, C. A., Wells, Y., Browning, C., Thomas, S. A., and Kendig, H. (2007). ToContinue, Modify or Relinquish Driving: Findings from a Longitudinal Study of HealthyAgeing. Gerontology, 53(6):423–431.
Van Boxtel, M., Ten Tusscher, M., Metsemakers, J., Willems, B., and Jolles, J. (2001).Visual Determinants of Reduced Performance on the Stroop Color-word Test in NormalAging Individuals. Journal of Clinical and Experimental Neuropsychology, 23(5):620–627.
Van der Hulst, M., Rothengatter, T., and Meijman, T. (1998). Strategic Adaptations toLack of Preview in Driving. Transportation Research Part F: Traffic Psychology andBehaviour, 1(1):59–75.
van Winsum, W., Martens, M., and Herland, L. (1999). The Effects of Speech VersusTactile Driver Support Messages On Workload Driver Behaviour and User Acceptance:TNO-Report, TM-99-C043. Technical report, TNO Human Factors Research Institute.
Veltman, J. and Gaillard, A. (1998). Physiological Workload Reactions to Increasing Levelsof Task Difficulty. Ergonomics, 41(5):656–669.
Ventry, I. and Weinstein, B. (1983). Identification of Elderly People with Hearing Problems.ASHA, 25(7):37–42.
Verhaeghen, P., Steitz, D. W., Sliwinski, M. J., and Cerella, J. (2003). Aging and Dual-TaskPerformance: A Meta-Analysis. Psychology and Aging, 18(3):443.
Victor, T., Dozza, M., Bärgman, J., Boda, C.-N., Engström, J., Flannagan, C., Lee, J. D.,and Markkula, G. (2015). Analysis of Naturalistic Driving Study Data: Safer Glances,Driver Inattention, and Crash Risk. Technical report, Transportation Research Board.
Victor, T. W., Engström, J., and Harbluk, J. L. (2008). Distraction Assessment MethodsBased On Visual Behavior and Event Detection. In Regan, M. A., Lee, J. D., and Young,

REFERENCES 305
K. L., editors, Driver Distraction: Theory, Effects, and Mitigation, pages 135–165. CRCPress.
Victor, T. W., Harbluk, J. L., and Engström, J. A. (2005). Sensitivity of Eye-MovementMeasures to In-Vehicle Task Difficulty. Transportation Research Part F: Traffic Psy-chology and Behaviour, 8(2):167–190.
Visual Awareness Inc. (2003). UFOV User’s Guide.
Voxeo Corporation (2013). Pre-Recorded Audio Files. Available from: http://evolution.voxeo.com/library/audio/prompts/numbers/index.jsp. [Last accessed: 18/11/2013].
Wagner, T. (1962). Licensing Restrictions and the Deaf Driver. In Finesilver, S. G.,editor, National Symposium on the Deaf Driving and Employability, pages 118–127. USDepartment of Health, Education and Welfare.
Walker, G. H., Stanton, N. A., and Young, M. S. (2001). Hierarchical Task Analysisof Driving: A New Research Tool. In Proceedings of the Annual Conference of theErgonomics Society, Cirencester, April 2001, pages 435–440. Taylor and Francis.
Walker, G. H., Stanton, N. A., and Young, M. S. (2006). The Ironies of Vehicle Feedbackin Car Design. Ergonomics, 49(2):161–179.
Walker, G. H., Stanton, N. A., and Young, M. S. (2008). Feedback and Driver SituationAwareness (SA): A Comparison of SA Measures and Contexts. Transportation ResearchPart F: Traffic Psychology and Behaviour, 11(4):282–299.
Wang, E. Y.-N. and Wang, E. M.-Y. (2012). In-Car Sound Analysis and Driving SpeedEstimation Using Sounds with Different Frequencies as Cues. International Journal ofIndustrial Ergonomics, 42(1):34–40.
Warren, R. M. (1982). Auditory Perception: A New Synthesis. Elsevier.
Warren, R. M. et al. (1970). Perceptual Restoration of Missing Speech Sounds. Science,167(3917):392–393.
Weinstein, B. (1986). Validity of a Screening Protocol for Identifying Elderly People withHearing Problems. ASHA, 28(5):41–45.
Weinstein, B. E., Spitzer, J. B., and Ventry, I. M. (1986). Test-Retest Reliability of theHearing Handicap Inventory for the Elderly. Ear and Hearing, 7(5):295–299.
Weinstein, B. E. and Ventry, I. M. (1983). Audiometric Correlates of the Hearing HandicapInventory for the Elderly. Journal of Speech and Hearing Disorders, 48(4):379–384.
West, R., French, D., Kemp, R., and Elander, J. (1993). Direct Observation of Driving, SelfReports of Driver Behaviour, and Accident Involvement. Ergonomics, 36(5):557–567.

306 REFERENCES
Wickens, C. D. (1984). Processing Resources in Attention. In Parasuraman, R. and Davies,D., editors, Varieties of Attention. Academic Press, New York.
Wickens, C. D. (2002). Multiple Resources and Performance Prediction. Theoretical Issuesin Ergonomics Science, 3(2):159–177.
Wickens, C. D. (2008). Multiple Resources and Mental Workload. Human Factors: TheJournal of the Human Factors and Ergonomics Society, 50(3):449–455.
Wilkie, R., Kountouriotis, G., Merat, N., and Wann, J. (2010). Using Vision to ControlLocomotion: Looking where you want to go. Experimental Brain Research, 204(4):539–547.
Willott, J. F. (1996). Physiological Plasticity in the Auditory System and its PossibleRelevance to Hearing Aid Use, Deprivation Effects, and Acclimatization. Ear andHearing, 17(Suppl. 3):66S–77S.
Wingfield, A., Tun, P. A., and McCoy, S. L. (2005). Hearing Loss in Older AdulthoodWhat it is and how it Interacts With Cognitive Performance. Current Directions inPsychological Science, 14(3):144–148.
Winkler, I. and Cowan, N. (2004). From Sensory to Long-Term Memory: Evidence fromAuditory Memory Reactivation Studies. Experimental Psychology, 51(3):1–17.
Wiseman, E. and Souder, E. (1996). The Older Driver: A Handy Tool to Assess CompetenceBehind the Wheel. Geriatrics, 51(7):36–8.
Withaar, F. K., Brouwer, W. H., and Van Zomeren, A. H. (2000). Fitness to Drive in OlderDrivers with Cognitive Impairment. Journal of the International NeuropsychologicalSociety, 6(4):480–490.
Wood, J., Chaparro, A., Hickson, L., Thyer, N., Carter, P., Hancock, J., Hoe, A., Le, I.,Sahetapy, L., and Ybarzabal, F. (2006). The Effect of Auditory and Visual Distracters onthe Useful Field of View: Implications for the Driving Task. Investigative Ophthalmologyand Visual Science, 47(10):4646–4650.
Wood, J. M. (2002). Age and Visual Impairment Decrease Driving Performance as Measuredon a Closed-Road Circuit. Human Factors: The Journal of the Human Factors andErgonomics Society, 44(3):482–494.
World Federation of the Deaf and the Swedish National Association of the Deaf (2008).Global Survey Reports 1–7 by the World Federation of the Deaf and the Swedish Na-tional Association of the Deaf, 2008. Available from: http://wfdeaf.org/our-work/development-cooperation/project. [Last accessed: 27/09/2015].

REFERENCES 307
World Health Organization (1980). International Classification of Impairments, Disabilities,and Handicaps: A Manual of Classification Relating to the Consequences of Disease,Published in Accordance with Resolution WHA29. 35 of the Twenty-Ninth World HealthAssembly, May 1976. Available from: http://apps.who.int/iris/bitstream/10665/41003/1/9241541261_eng.pdf. [Last accessed: 23/09/2015].
World Health Organization (2000). ICIDH-2: International Classification of Func-tioning, Disability and Health: Prefinal Draft Full Version. Available from: http://www.sustainable-design.ie/arch/ICIDH-2Final.pdf. [Last accessed: 23/09/2015].
World Health Organization (2015). Deafness and Hearing Loss. Available from: http://www.who.int/mediacentre/factsheets/fs300/en/. [Last accessed: 23/09/2015].
Yanz, J. L. (2002). Cochlear Dead Regions and Practical Implications for High FrequencyAmplification. Hearing Review, 9(4):58–63.
Yost, W. (2000). Fundamentals of Hearing an Introduction. Academic Press.
Young, K., Regan, M., and Hammer, M. (2007). Driver distraction: A review of theliterature. technical report 206. Technical report, Monash University, Accident ResearchCentre, Victoria, Australia.
Ysander, L. (1966). The Safety of Drivers with Chronic Disease. British Journal ofIndustrial Medicine, 23(1):28–36.
Zekveld, A. A., Kramer, S. E., and Festen, J. M. (2011). Cognitive Load During SpeechPerception in Noise: The Influence of Age, Hearing Loss, and Cognition On the PupilResponse. Ear and Hearing, 32(4):498–510.
Zurek, P. and Delhorne, L. (1987). Consonant Reception in Noise by Listeners with Mildand Moderate Sensorineural Hearing Impairment. The Journal of the Acoustical Societyof America, 82(5):1548–1559.


Appendix
The questions administered to participants in Chapter 4
Section A: Demographic information
General
1. Age:
2. Gender:
3. Occupation:
Driving
4. For how long have you held your driver’s licence?
5. Did you have to perform an official test to initially obtain your driver’s licence?
6. Have you ever been a professional driver?
7. Approximately how many miles do you drive in a year?
8.Do you tend to avoid driving on certain types of road, or at certain times during theday (if so please give details)?
9.Over the past three years, has the amount you drive increased, decreased, or stayedthe same?
10.How many times in the past five years have you been crashed into by another drivers’vehicle whilst driving?
11.How many times in the past five years have you crashed your car into another vehiclewhilst driving?
12. How many times in the past year have you almost been involved in an accident?
309

310 APPENDIX
Section B: Driver Behaviour Questionnaire (Parker et al., 2000 version)
Please rate the extent to which the following situations arise during your driving from 1–6,with 1 denoting that it never happens and 6 denoting that it always happens:
1. Attempt to drive away from traffic lights in too high a gear
2. Forget where you left your car in a car park
3. Become impatient with a slow driver in the outer lane and overtake on the inside
4.Drive especially close to the car in front as a signal to its driver to go faster or get outof the way
5.Switch on one thing, such as the headlights, when you meant to switch on somethingelse such as the wipers
6.Realize that you have no recollection of the road along which you have just beentravelling
7.Intending to drive to destination A, you suddenly notice that you are on the road todestination B, perhaps because B is your more usual destination
8. Cross a junction knowing the traffic lights have already turned against you
9.Angered by another driver’s behaviour, you give chase with the intention of givinghim/her a piece of your mind
10. Disregard the speed limits late at night or early on in the morning
11. On turning left, nearly hit a cyclist who has come up on your inside
12.Queuing to turn left onto main road, you pay such close attention to the main streamof traffic that you nearly hit the car in front
13. Drive even though you realize that you may be over the legal blood alcohol limit
14.Have an aversion to a particular class of road user, and indicate your hostility bywhatever means you can
15. Underestimate the speed of an oncoming vehicle when overtaking
16. Hit something when reversing that you had not previously seen
17. Get into the wrong lane approaching a roundabout or a junction
18. Misread signs and take the wrong turning off a roundabout
19. Miss give way signs and narrowly avoid colliding with traffic having right of way
20. Fail to check your rear-view mirror before pulling out, changing lanes, turning, etc.
21. Attempt to overtake someone you had not noticed to be signalling a right turn
22. Fail to notice pedestrians crossing on turning into a side road
23. Get involved in unofficial ‘races’ with other drivers
24. Brake too quickly on a slippery road, or steer the wrong way into a skid

APPENDIX 311
Section C: The Driving and Hearing Loss Questionnaire
Please rate the extent to which you agree with each of the following situations from 1–5, with1 denoting that you strongly disagree, and 5 denoting that you strongly agree:
1. I have considered limiting the amount I drive because of my hearing loss
2. I think that hearing loss presents some problems for driving
3. I feel that my hearing loss sometimes makes driving more difficult for me
4. I think that sounds from the surrounding environment are important for safe driving
5.Working out the direction from which emergency services vehicles are approaching isdifficult because of my hearing loss
6. Having the stereo on whilst I drive has a negative effect on my driving
7.I find it difficult to hear sounds produced by electronic devices in my car (e.g.satellite navigation instructions, parking sensors etc)
8. My hearing loss sometimes makes it difficult for me to judge how fast I am driving
9. When I am talking to people in my car I find it difficult to concentrate on the road
10.When I am paying attention to sounds produced by electronic devices in the car I finddriving more difficult (e.g. satellite navigation instructions)
11. Being able to hear when emergency services vehicles are near is difficult for me
12. I have a problem hearing what passengers say whilst I’m driving my car
13.I feel that because of my hearing loss I am sometimes less aware of what is going onaround me when I am driving
14.I find that talking on a hands-free mobile phone whilst I drive is very difficult becauseof my hearing loss
15. I think that sounds from the engine of the car are important for safe driving
16.My hearing loss makes me worry about parking my vehicle in close proximity to otherobstacles (e.g. other cars, fences, walls etc)
17.I feel that some in-car electronic devices which make use of sound are not accessibleto me
18.My hearing aid(s) do not allow me to communicate more easily with passengers in thecar whilst I am driving
19. Wearing my hearing aid(s) whilst driving makes sounds uncomfortably loud
20. My hearing aid(s) do not improve my ability to drive
21. My hearing aid(s) do not make me feel more aware of my surroundings whilst driving
22. I feel that wearing my hearing aid(s) disorientates me whilst driving
23. Using my hearing aid(s) does not allow me to use devices in my car more easily

312 APPENDIX
Section D: Hearing information
General
1. For how long have you had a hearing loss?
2. Do you own a hearing aid?
3. For how long have you owned your hearing aid(s)?
4. Do you ever use your hearing aid(s)?
5. How often do you usually wear your hearing aid(s)?
6. How often do you usually wear your hearing aid(s) whilst driving?
HHIE-S (Ventry and Weinstein, 1983)
Please answer ‘yes’, ‘sometimes’, or ‘no’ for each of the following questions:
1. Does a hearing problem cause you to feel embarrassed when you meet new people?
2.Does a hearing problem cause you to feel frustrated when talking to members of yourown family?
3. Do you have difficulty hearing/understanding co-workers, clients or customers?
4. Do you feel handicapped by a hearing problem?
5.Does a hearing problem cause you difficulty when visiting friends, relatives orneighbours?
6. Does a hearing problem cause you difficulty in the cinema or theatre?
7. Does a hearing problem cause you to have arguments with family members?
8. Does a hearing problem cause you difficulty when listening to TV or radio?
9.Do you feel that any difficulty with your hearing limits or hampers your personal orsocial life?
10.Does a hearing problem cause you difficulty when in a restaurant with relatives orfriends?