Investigating the crystallization process in a FeCrB metallic glass by combining magnetic and...
7
This content has been downloaded from IOPscience. Please scroll down to see the full text. Download details: IP Address: 156.35.110.98 This content was downloaded on 17/11/2014 at 18:23 Please note that terms and conditions apply. Investigating the crystallization process in a FeCrB metallic glass by combining magnetic and neutron thermo-diffraction experiments View the table of contents for this issue, or go to the journal homepage for more 2014 J. Phys.: Conf. Ser. 549 012018 (http://iopscience.iop.org/1742-6596/549/1/012018) Home Search Collections Journals About Contact us My IOPscience
Transcript of Investigating the crystallization process in a FeCrB metallic glass by combining magnetic and...
This content has been downloaded from IOPscience. Please scroll down to see the full text.
Download details:
IP Address: 156.35.110.98
This content was downloaded on 17/11/2014 at 18:23
Please note that terms and conditions apply.
Investigating the crystallization process in a FeCrB metallic glass by combining magnetic and
neutron thermo-diffraction experiments
View the table of contents for this issue, or go to the journal homepage for more
2014 J. Phys.: Conf. Ser. 549 012018
(http://iopscience.iop.org/1742-6596/549/1/012018)
Home Search Collections Journals About Contact us My IOPscience
Investigating the crystallization process in a FeCrB metallic glass by combining magnetic and neutron thermo-diffraction experiments
Pedro Gorria1,*, Alejandro Fernández-Martínez2, J. D. Santos3, María J. Pérez3, and Gabriel J. Cuello4. 1Departamento de Física, EPI, Universidad de Oviedo, 33203 Gijón, Spain.
2Institut des Sciences de la Terre, Université Joseph-Fourier Grenoble I & CNRS, B.P. 53 38041 Grenoble Cedex 9, France. 3Departamento de Física, Universidad de Oviedo, Calvo Sotelo, s/n, 33007 Oviedo, Spain. 4Institut Laue Langevin, 6 rue Jules Horowitz, 38042 Grenoble, France
Abstract. The structural evolution of a Fe70Cr10B20 metallic glass was followed by means of in situ high-temperature neutron thermo-diffraction and magnetization measurements. Above 723 K the crystallization of bcc-Fe together with a metastable (FeCr)3B phase with tetragonal crystal structure (space group I4 ) is observed. Further heating gives rise to the transformation of the (FeCr)3B phase into another tetragonal (FeCr)2B phase (space group I4 /mcm ) + bcc-Fe. On cooling down to room temperature no additional structural transformations occurred. This two-step crystallization process allows understanding quantitatively the intricate variation of the magnetization at high-temperature
1. Introduction Fe-B based metallic glasses have been widely investigated, due to their technological interest derived from the excellent magnetic and mechanical properties [1], as well as from a basic point of view coming from the relationship between magnetism and the absence of long-range crystalline order [2]. Moreover, it is well known that adding small amounts of transition metal elements, such as Nb, Zr, Mo and others, to the Fe-B metallic glasses gives rise to the formation of a nanocrystalline state after adequate heat treatments, thus improving the soft magnetic response of these alloys [1,3,4]. On the other hand, chromium is usually added to the Fe-B based alloys to enhance the corrosion resistance [5], although it produces a decrease in the values of both the Curie temperature, TC, and saturation magnetization, MS [6], in the same way as it occurs in FeCr alloys [7]. Moreover, FeCrB metallic glasses exhibit invar-like features [8] similar to those found in FeZrB alloys [9,10]. Therefore, a good knowledge of the crystallization processes of Fe-B based metallic glasses and the crystallization products is of great importance in order to control their magnetic properties [11].
The crystallization process in binary Fe-B metallic glasses usually takes place in two steps [12-14]. The first step begins when the sample is heated above 650 K, the initial amorphous phase transforms into two crystalline phases, α-Fe with body centered cubic crystal structure (BCC) and Im3m
6th Meeting of the Spanish Neutron Scattering Association (SETN2012) IOP PublishingJournal of Physics: Conference Series 549 (2014) 012018 doi:10.1088/1742-6596/549/1/012018
Content from this work may be used under the terms of the Creative Commons Attribution 3.0 licence. Any further distributionof this work must maintain attribution to the author(s) and the title of the work, journal citation and DOI.
Published under licence by IOP Publishing Ltd 1
symmetry, and metastable Fe3B with
€
I4 tetragonal symmetry. The latter is a crystalline phase that only can be stabilized at RT by crystallization of FeB metallic glasses. Heating up at higher temperatures gives rise to a polymorphic transformation which consists in a segregation of Fe atoms from the Fe3B metastable phase, thus increasing the amount of α-Fe phase, and the transformation of Fe3B into Fe2B, also with tetragonal crystalline structure but with higher symmetry (
€
I4 /mcm). Hence, the final crystallization products are α-Fe and Fe2B with relative percentages depending on the initial composition of the amorphous as-cast sample.
In this article we describe the connection between the change in the magnetic properties and the crystallization kinetics of a Fe70Cr10B20 metallic glass, through a combined study using in situ neutron thermo-diffraction experiments and thermo-magnetization measurements. The identification of the crystalline stable and metastable Fe(Cr)B phases appearing along the whole process provides an explanation for the irreversibility of the magnetization vs. temperature curves on heating-cooling cycles.
2. Experimental Amorphous ribbons with Fe70Cr10B20 nominal composition and 5 mm × 25 µm cross section were fabricated by means of a melt spinning setup in a vacuum chamber and using a copper wheel at a speed of 25 ms-1. The amorphous state of the as-cast ribbons was checked by room temperature x-ray powder diffraction (λ = 1.542 Å). The crystallization kinetics of the amorphous ribbons was followed by in situ neutron thermo-diffraction at the high-flux D20 two-axis diffractometer (Institute Laue-Langevin, Grenoble, France). The ribbons were cut into 2 cm-long strips (total mass around 200 mg) and introduced into a cylindrical vanadium sample holder for the neutron experiments. Diffraction patterns were collected each 5 min during controlled heating-cooling cycles between 300 and 1073 K at constant rate of 1 K/min, more details concerning similar experiments can be found elsewhere [15,16]. The neutron wavelength was λ = 1.3 Å and the angular range in 2θ was 25-100º. The refinement of the patterns was performed using the Fullprof package [17] based on the Rietveld method. The peak-profile analysis of the diffraction patterns corresponding to the sample already crystallized does not show any broadening originated from small crystals and/or microstrain effects [18]. The magnetization vs. temperature, M(T), curves between 293 and 1073 K were measured in a Faraday susceptometer under an applied magnetic field of 1 kOe. Room temperature hysteresis loops of as-quenched ribbon and several ribbons previously heated up to some selected temperatures were recorded in a conventional homemade induction setup applying a triangular-wave drive field of H = ± 200 Oe.
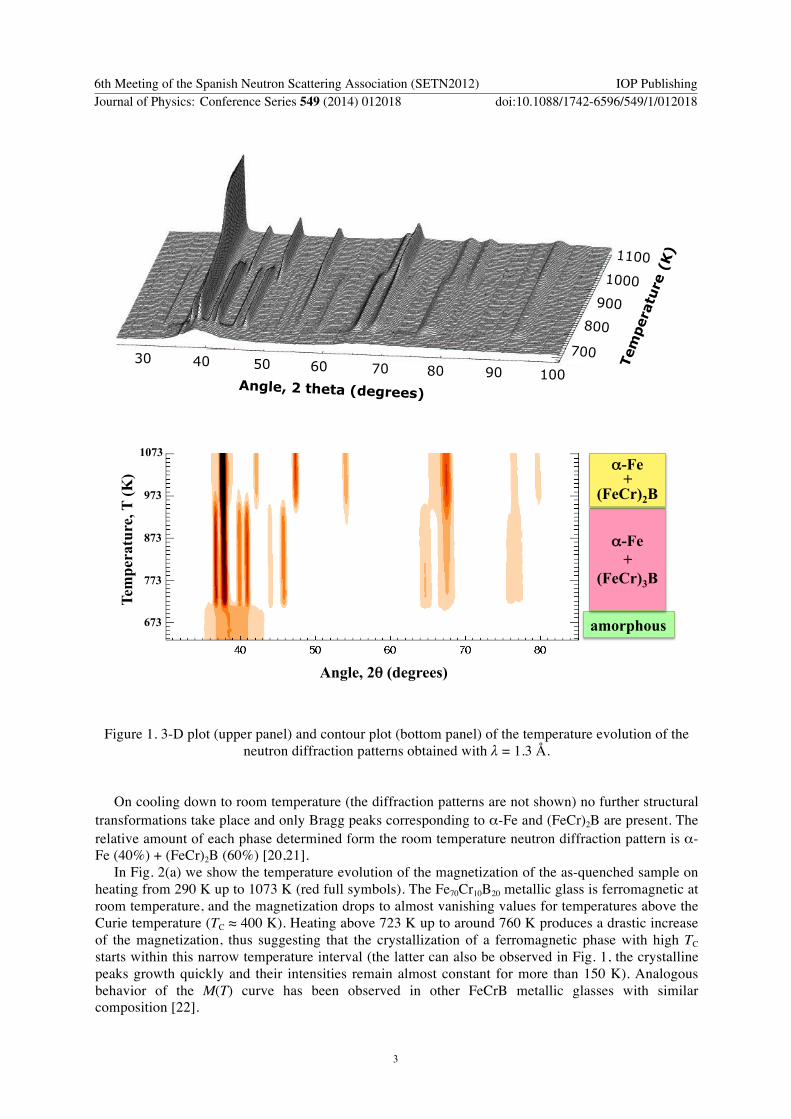
3. Results and Discussion The 3D image and the 2D contour plot of Fig. 1 show the temperature evolution of the neutron powder diffraction patterns between 650 and 1073 K. Below 723 K the diffraction patterns only show broad intensity haloes, thus confirming the amorphous state of the ribbon below such temperature. On heating up above 723 K several intensity peaks begin to grow superimposed to the amorphous contribution, clearly indicating that the crystallization process starts. These peaks can be indexed as the Bragg reflections belonging to α-Fe and (FeCr)3B phases with body centred cubic (space group Im3m , a = 2.88±0.01 Å) and tetragonal (space group
€
I4 , a = 8.65 ± 0.01 Å and c = 4.29 ± 0.01 Å) crystalline structures, respectively. This primary crystallization is similar to that occurring in binary Fe-rich FeB metallic glasses, where α-Fe plus metastable Fe3B are formed [17]. Further heating above 920 K shows that several peaks disappear and new ones emerge (see Fig. 1), denoting that a secondary polymorphic transformation involving the remaining amorphous phase and the (FeCr)3B crystalline phase takes place. The (FeCr)3B phase transforms into a stable (FeCr)2B one with higher tetragonal symmetry (space group I4 /mcm , a = 5.19 ± 0.01 Å and c = 4.23 ± 0.01 Å). Besides, additional α-Fe is formed during this second transformation as it can be clearly observed in Fig. 1, where the intensity of the Bragg peak situated at around 40º in 2θ suddenly increases.
6th Meeting of the Spanish Neutron Scattering Association (SETN2012) IOP PublishingJournal of Physics: Conference Series 549 (2014) 012018 doi:10.1088/1742-6596/549/1/012018
2
1100 1000
900 800
700 30 40 50 60 70 80 90 100 Angle, 2 theta (degrees)
Angle, 2θ (degrees)
Tem
pera
ture
, T (K
)
673
773
873
973
1073
amorphous
"α-Fe
+ (FeCr)3B
α-Fe +
(FeCr)2B
Figure 1. 3-D plot (upper panel) and contour plot (bottom panel) of the temperature evolution of the
neutron diffraction patterns obtained with λ = 1.3 Å.
On cooling down to room temperature (the diffraction patterns are not shown) no further structural
transformations take place and only Bragg peaks corresponding to α-Fe and (FeCr)2B are present. The relative amount of each phase determined form the room temperature neutron diffraction pattern is α-Fe (40%) + (FeCr)2B (60%) [20,21].
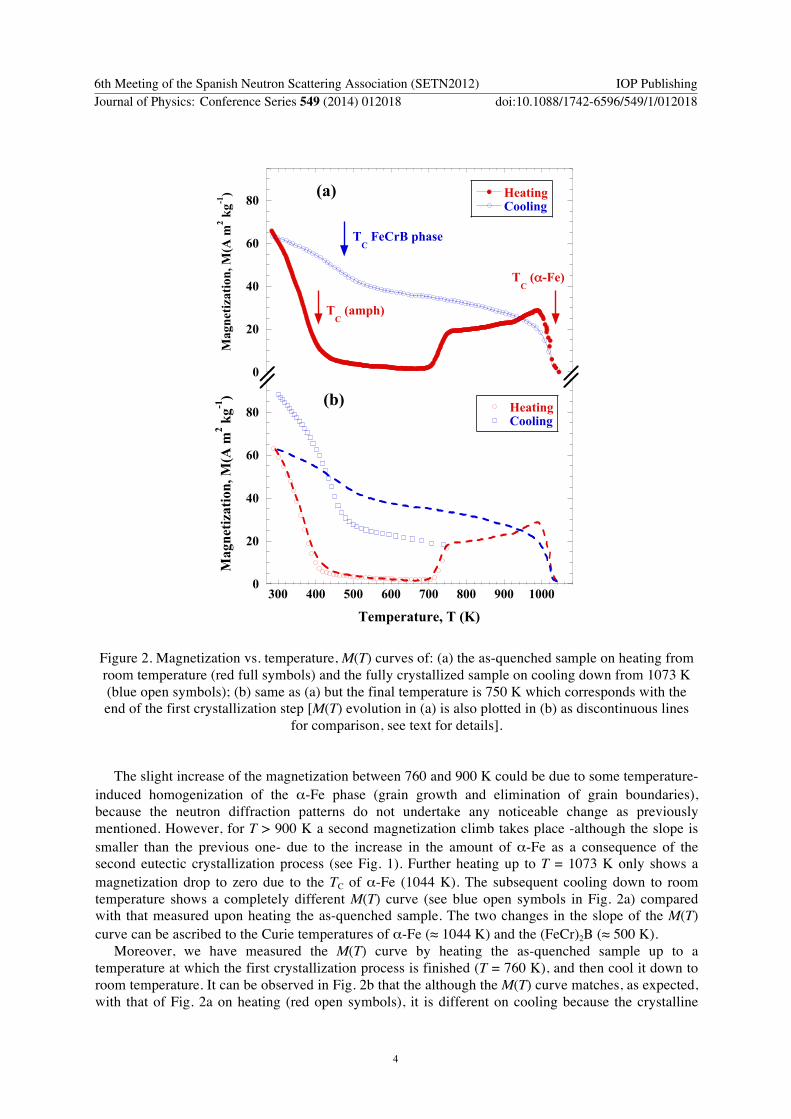
In Fig. 2(a) we show the temperature evolution of the magnetization of the as-quenched sample on heating from 290 K up to 1073 K (red full symbols). The Fe70Cr10B20 metallic glass is ferromagnetic at room temperature, and the magnetization drops to almost vanishing values for temperatures above the Curie temperature (TC ≈ 400 K). Heating above 723 K up to around 760 K produces a drastic increase of the magnetization, thus suggesting that the crystallization of a ferromagnetic phase with high TC starts within this narrow temperature interval (the latter can also be observed in Fig. 1, the crystalline peaks growth quickly and their intensities remain almost constant for more than 150 K). Analogous behavior of the M(T) curve has been observed in other FeCrB metallic glasses with similar composition [22].
6th Meeting of the Spanish Neutron Scattering Association (SETN2012) IOP PublishingJournal of Physics: Conference Series 549 (2014) 012018 doi:10.1088/1742-6596/549/1/012018
3
0
20
40
60
80 HeatingCooling
Mag
netiz
atio
n, M
(A m
2 kg-1
)
TC (amph)
TC (α-Fe)
TC FeCrB phase
(a)
0
20
40
60
80
300 400 500 600 700 800 900 1000
HeatingCooling
Mag
netiz
atio
n, M
(A m
2 kg-1
)
Temperature, T (K)
(b)
Figure 2. Magnetization vs. temperature, M(T) curves of: (a) the as-quenched sample on heating from room temperature (red full symbols) and the fully crystallized sample on cooling down from 1073 K (blue open symbols); (b) same as (a) but the final temperature is 750 K which corresponds with the end of the first crystallization step [M(T) evolution in (a) is also plotted in (b) as discontinuous lines
for comparison, see text for details].
The slight increase of the magnetization between 760 and 900 K could be due to some temperature-induced homogenization of the α-Fe phase (grain growth and elimination of grain boundaries), because the neutron diffraction patterns do not undertake any noticeable change as previously mentioned. However, for T > 900 K a second magnetization climb takes place -although the slope is smaller than the previous one- due to the increase in the amount of α-Fe as a consequence of the second eutectic crystallization process (see Fig. 1). Further heating up to T = 1073 K only shows a magnetization drop to zero due to the TC of α-Fe (1044 K). The subsequent cooling down to room temperature shows a completely different M(T) curve (see blue open symbols in Fig. 2a) compared with that measured upon heating the as-quenched sample. The two changes in the slope of the M(T) curve can be ascribed to the Curie temperatures of α-Fe (≈ 1044 K) and the (FeCr)2B (≈ 500 K).
Moreover, we have measured the M(T) curve by heating the as-quenched sample up to a temperature at which the first crystallization process is finished (T = 760 K), and then cool it down to room temperature. It can be observed in Fig. 2b that the although the M(T) curve matches, as expected, with that of Fig. 2a on heating (red open symbols), it is different on cooling because the crystalline
6th Meeting of the Spanish Neutron Scattering Association (SETN2012) IOP PublishingJournal of Physics: Conference Series 549 (2014) 012018 doi:10.1088/1742-6596/549/1/012018
4
phases present in the sample and its relative amount is different. From the neutron diffraction pattern collected at 760 K, we have estimated that the relative amount between α-Fe and (FeCr)3B is around 20 and 80%, respectively.
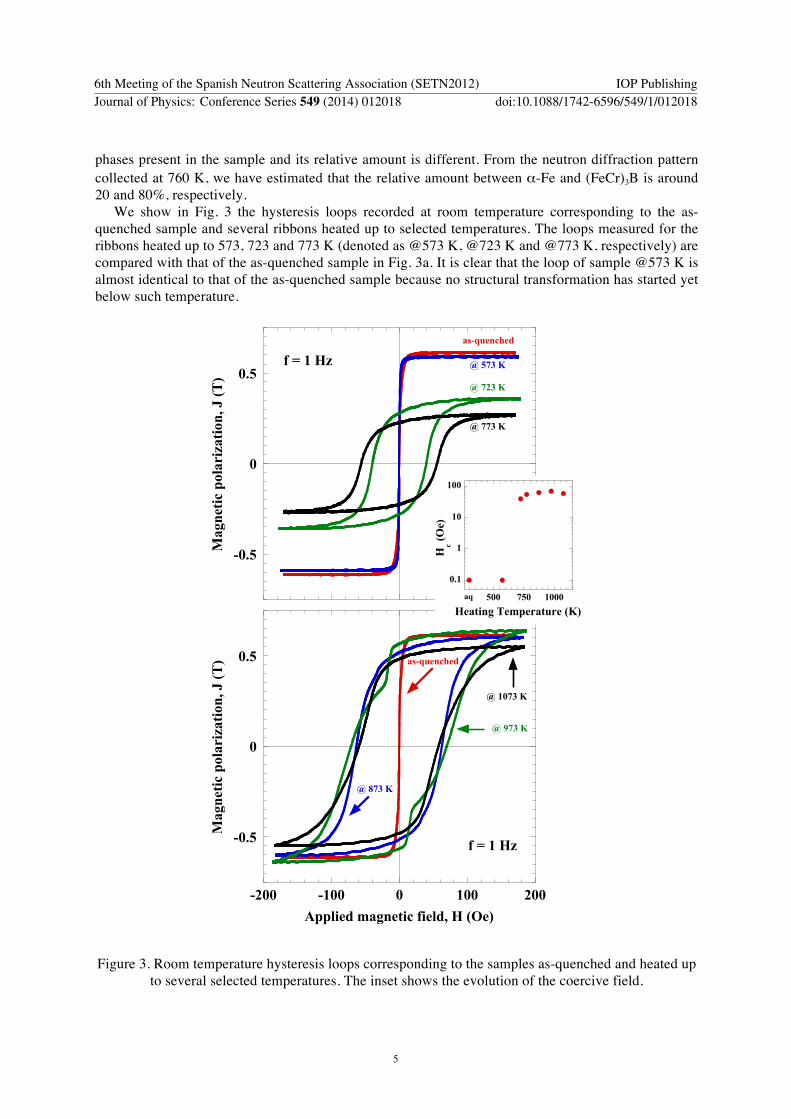
We show in Fig. 3 the hysteresis loops recorded at room temperature corresponding to the as-quenched sample and several ribbons heated up to selected temperatures. The loops measured for the ribbons heated up to 573, 723 and 773 K (denoted as @573 K, @723 K and @773 K, respectively) are compared with that of the as-quenched sample in Fig. 3a. It is clear that the loop of sample @573 K is almost identical to that of the as-quenched sample because no structural transformation has started yet below such temperature.
-0.5
0
0.5
-200 -100 0 100 200
Mag
netic
pol
ariz
atio
n, J
(T)
Applied magnetic field, H (Oe)
as-quenched
@ 873 K
@ 973 K
@ 1073 K
f = 1 Hz
-0.5
0
0.5
Mag
netic
pol
ariz
atio
n, J
(T)
as-quenched
@ 573 K
@ 723 K
@ 773 K
f = 1 Hz
0.1
1
10
100
500 750 1000
Hc (O
e)
Heating Temperature (K)aq
Figure 3. Room temperature hysteresis loops corresponding to the samples as-quenched and heated up
to several selected temperatures. The inset shows the evolution of the coercive field.
6th Meeting of the Spanish Neutron Scattering Association (SETN2012) IOP PublishingJournal of Physics: Conference Series 549 (2014) 012018 doi:10.1088/1742-6596/549/1/012018
5
Samples @723 K and @773 K exhibits a large increase in coercitivity (almost three orders of magnitude) that can be explained on the basis of the crystallization of (FeCr)3B ferromagnetic phase but with high magnetic anisotropy due to its lower symmetry. Heating at higher temperatures (see Fig. 3b for the hysteresis loops corresponding to the samples heated up to 873, 973 and 1073 K compared that of the as-quenched one) gives rise to an increase in the magnetic polarization because the amount of a-Fe increases, however, as the new (FeCr)2B formed phase is also highly anisotropic, the coercivity remains very high compared with that of the starting amorphous alloy. The evolution of the coercivity with the temperature of heating is depicted in Fig. 3c.
Conclusions In summary, we have shown that the Fe70Cr10B20 amorphous ribbons undergo a complex crystallization processes on heating from room temperature up to 1073 K, with two differentiated eutectic transformations starting at around 723 K [amorphous à α-Fe + (FeCr)3B are formed] and 900 K [(FeCr)3B + remaining amorphous à α-Fe + (FeCr)2B]. Moreover, the combined use of neutron thermo-diffraction and thermo-magnetometry techniques permits the complete understanding of both the irreversible temperature dependence of the magnetization during the heating-cooling processes, and the great increase of around three orders of magnitude in the coercive field values due to the formation of tetragonal FeCrB phases with large magnetic anisotropy. These findings could open new perspectives in the study of the crystallization routes followed by Fe-based metallic glasses with potential interest in technological applications.
Acknowledgments We thank the Spanish MICINN and FEDER program for financial support under project MAT2011-27573-C04-02. We also thank ILL and Spanish CRG for the allocation of neutron beamtime.
References [1] McHenry M E et al. 1999 Prog. Mater. Sci. 44 291. [2] Amorphous Metallic Alloys 1983, ed F E Luborsky (Butheworths, London, UK). [3] Gorria P et al. 1993 J. Appl. Phys. 73 6600. [4] Suzuki K and Kadogan J M 2000, J. Appl. Phys. 87 7097. [5] Zhang L and Manthiram A 1997 J. Magn. Magn. Mater. 168 85. [6] Güntzel U and Westerholt K 1990 Phys. Rev. B 41 740. [7] Martínez-Blanco D et al. 2011 J. Alloys Compd. 509S S397. [8] Fukamichi K et al. 1982 J. Appl. Phys. 53 2246. [9] Barandiarán J M et al. 1996 Phys. Rev. B 54 3026. [10] Martínez A et al. 2010 Phys. Rev. B 82 012406. [11] Gorria P et al. 1996 J. Phys: Condens. Matter. 8 5925. [12] Battezzati L et al. 1997 J. Alloys Compd. 247 164. [13] Duhaj P and Švec P 1997 Mater. Sci. Eng. A 226-228 245 [14] Palumbo M et al. 2003 Intermetallics 11 1293. [15] Fernández Barquín L et al. 1998 J. Phys: Condens. Matter 10 5047. [16] Gorria P et al. 2009 Phys. Status Solidi (RRL) 3 28. [17] Rodríguez Carvajal J 1993 Physica B 192 55. [18] Martinez-Blanco D et al. 2008 J. Phys: Condens. Matter 20 335213. [19] Günterhodt H J et al. 1981 Glassy Metals I, Topics in Applied Physics vol 46, (Springer,
Heidelberg, Germany). [20] Fernández-Martínez A et al. 2005 J. Magn. Magn. Mater. 294 e155. [21] Fernández-Martínez A et al. 2007 J. Non-Cryst. Solids 353 855. [22] Sort J et al. 2010 Small 6 1543.
6th Meeting of the Spanish Neutron Scattering Association (SETN2012) IOP PublishingJournal of Physics: Conference Series 549 (2014) 012018 doi:10.1088/1742-6596/549/1/012018
6