Investigating effects of ball size on the performance of gas lift ...
13
HAL Id: hal-01803774 https://hal.archives-ouvertes.fr/hal-01803774 Submitted on 30 May 2018 HAL is a multi-disciplinary open access archive for the deposit and dissemination of sci- entific research documents, whether they are pub- lished or not. The documents may come from teaching and research institutions in France or abroad, or from public or private research centers. L’archive ouverte pluridisciplinaire HAL, est destinée au dépôt et à la diffusion de documents scientifiques de niveau recherche, publiés ou non, émanant des établissements d’enseignement et de recherche français ou étrangers, des laboratoires publics ou privés. Investigating effects of ball size on the performance of gas lift valve for both modified and optimized seats Ehsanul Kabir, Hossein Emadi, Fathi Elldakli, Matt Young To cite this version: Ehsanul Kabir, Hossein Emadi, Fathi Elldakli, Matt Young. Investigating effects of ball size on the performance of gas lift valve for both modified and optimized seats. Oil & Gas Science and Technology - Revue d’IFP Energies nouvelles, Institut Français du Pétrole (IFP), 2018, 73, pp.15. 10.2516/ogst/2018002. hal-01803774
-
Upload
khangminh22 -
Category
Documents
-
view
4 -
download
0
Transcript of Investigating effects of ball size on the performance of gas lift ...

HAL Id: hal-01803774https://hal.archives-ouvertes.fr/hal-01803774
Submitted on 30 May 2018
HAL is a multi-disciplinary open accessarchive for the deposit and dissemination of sci-entific research documents, whether they are pub-lished or not. The documents may come fromteaching and research institutions in France orabroad, or from public or private research centers.
L’archive ouverte pluridisciplinaire HAL, estdestinée au dépôt et à la diffusion de documentsscientifiques de niveau recherche, publiés ou non,émanant des établissements d’enseignement et derecherche français ou étrangers, des laboratoirespublics ou privés.
Investigating effects of ball size on the performance ofgas lift valve for both modified and optimized seats
Ehsanul Kabir, Hossein Emadi, Fathi Elldakli, Matt Young
To cite this version:Ehsanul Kabir, Hossein Emadi, Fathi Elldakli, Matt Young. Investigating effects of ball size onthe performance of gas lift valve for both modified and optimized seats. Oil & Gas Science andTechnology - Revue d’IFP Energies nouvelles, Institut Français du Pétrole (IFP), 2018, 73, pp.15.�10.2516/ogst/2018002�. �hal-01803774�

Oil & Gas Science and Technology - Rev. IFP Energies nouvelles 73, 15 (2018)© E. Kabir et al., published by IFP Energies nouvelles, 2018https://doi.org/10.2516/ogst/2018002
Available online at:www.ogst.ifpenergiesnouvelles.fr
RESEARCH ARTICLE
Investigating effects of ball size on the performance of gas liftvalve for both modified and optimized seatsEhsanul Kabir1, Hossein Emadi1,*, Fathi Elldakli1, and Matt Young2
1 TexasTech University, 2500 Broadway, TX 79409, Lubbock - USA2 Flowco Solutions, 18511 Imperial Valley Dr., TX 77073, Houston - USA
* Correspo
This is an O
Received: 20 September 2017 / Accepted: 23 January 2018
Abstract. The seat and the ball are the only two components of a Gas Lift Valve (GLV) that can be switchedout to meet changing gas throughput requirements. For this reason, individual pairings of balls and seats mustbe designed to meet the particular requirements of specific situations. While conventional GLV seats have sharpedges, a modified seat design with partially beveled edges has been shown to improve gas throughput. Thisdesign was then tested using benchmark valve and was optimized by beveling the entire port of the seat. Theseexperiments were conducted using a ball diameter that was 0.0016m larger than the diameter of the port top,although the effects of even larger ball sizes have also been studied using benchmark valves with conventionalseats. Researchers have yet to explore the effects of ball diameters smaller than the Port Top Diameter (PTD)and larger than the Port Bottom Diameter (PBD) for modified and optimized seat designs. In this paper, theeffects of smaller ball size on the GLV gas throughput have been analyzed using both modified and optimizedseat designs and actual GLV. The ball was 0.0016m smaller than the PTD of the seats. Geometric models havebeen deduced to calculate the generated upstream area (frustum area) open to flow. This frustum area is afunction of stem travel, and the dimensions of the seat and ball. Theoretical calculations have been comparedwith results obtained through robust experimental methods. The entire experimental program was divided intofour individual experiments. The static testing was used to fix the dome pressure and the opening pressure. Thehysteresis effect associated with the bellows assembly wasminimized using the aging procedure. Probe tester wasused to measure the stem travel. Finally, the gas throughput of the GLV was measured using dynamic testing.The smaller ball sizes were found to significantly improve the gas throughput of actual GLV. This improvementwas as high as 179% for large PBD seats. However, the frustum area practically decreased for these cases. Thisresult suggests that the flow coefficient has more effect on GLV gas throughput compared to frustum area.
1 Introduction
Artificial lift covers approximately 96% of the US oil wellmarket of which roughly 10% uses gas lift for production(Salinas and Xu, 2014). Gas lift is a simple and flexibleartificial lift method in which external gas is injectedcontinuously or intermittently from the casing-tubingannulus into the tubing string through specially designedvalves (GLV) (Winkler and Blann, 2007). The entireobjective is to reduce the flowing bottomhole pressure,thereby increasing the inflow of produced fluids (Lea et al.,2008). Although sophisticated gas lift technologies such assmart GLV (Xu et al., 2013) and advanced Gas-Lift InsertSystem (GLIS) (Aliyeva and Novruzaliyev, 2015) havebeen developed, all GLVs are still being manufacturedbased on King’s design (King, 1940). This design consists of
nding author: [email protected]
pen Access article distributed under the terms of the Creative Comwhich permits unrestricted use, distribution, and reproduction
a nitrogen-charged dome section and bellows assembly.Benchmark GLV is another type of GLV in which thenitrogen-charged dome and bellows assembly are absent.Laboratory testing is the primary use of this type of GLV.However, Winkler and Camp (1987) successfully usedbenchmark valve in field applications. The basic compo-nents of both types of GLV are shown in Figure 1.
For pressure charging and discharging purposes, a domeseal is present on the top of the GLV. A loading element isattached to the dome section (Brown, 1967). A nitrogen-charged bellows assembly is predominantly used as theloading element. However, a spring or a combination of bothspring and bellows is also available. The bellows assemblyacts very similar to a helical spring and is connected to thestem, which is attached to a ball at its end. Movement of allthese sections takes place as a single unit. The ball is seatedonto a sized-portwhen theGLV is closed. In order to preventthe backflow from either the tubing or casing, a check valveis installed on the downstream side of the port.
mons Attribution License (http://creativecommons.org/licenses/by/4.0),in any medium, provided the original work is properly cited.

Dome
Bellows
Stem
Check Valve
Stem tip
Seat
Adjustable Stem
Valve body, stem, tip, and seat are actual
valve parts
Adapter for encapsulating
tester base
Fig. 1. Basic components of an actual (left) and a benchmark(right) GLV.
Sharp-edge seat Modified design seat
Optimized design seat
Fig. 2. Three types of seat designs.
Minor area of the frustum
Generated frustum
Major area of the frustum
Fig. 3. Generated frustum area for larger ball.
2 E. Kabir et al.: Oil & Gas Science and Technology - Rev. IFP Energies nouvelles 73, 15 (2018)
Three different types of seat designs are shown inFigure 2. Sharp edge seat design has been the standardpractice in the industry for a long time. However, Elldakliet al. (2014b) found out that a beveled seat design(modified design) results in as much as 30% improvementof gas throughput capacity of the benchmark GLVdepending on the beveled angle. The beveled angle isgenerally measured with respect to the bottom edge of theseat. Based on the results of the beveled seat design, detailCFD simulations were run by Elldakli and Soliman (2017)and the modified seat design was optimized to give the bestperformance. The optimized design has completely beveledport as opposed to modified design which has partlybeveled and partly sharp edge port.
The Injection Pressure Operated (IPO) GLV isprimarily controlled by the injection pressure. Thereare two pressures which cause a valve to open: injection orcasing pressure and production or tubing pressure. Theinjection pressure, operating on the effective bellows areaminus the port area, produces the first opening force. Thesecond opening force is produced by the productionpressure acting on the valve port area. The closing forcemainly comes from the nitrogen-charged dome pressurewhichacts on the effectivebellowsarea.The stemtip (ball) is
also acted upon by a small fraction of the injection pressurewhich pushes the stem down. Ball surface area governs thisfractional amount of closing force. When the total openingforce exceeds the total closing force, theGLV initially beginsto open. The opening mechanism is incremental. Thedifference between the opening and closing forces, and thebellows assembly load rate dictates the stem travel in theactual GLV system.
One of the most important parameters in each GLV isthe upstream flowing area. This area is generated by thestemmovement away from the seat. A larger upstream flowarea is expected to deliver a better gas throughput. Thelateral surface area of the frustum of a right circular conedefines the flow area for a partially open valve. This frustumarea is generated between the ball surface and the valveseat, and increases as the valve stem moves away from theseat (Fig. 3). The GLV fully opens when the frustum areabecomes equal to the port bottom area and providesmaximum gas throughput (Winkler and Camp, 1987).Since a GLV is a flow restriction, coefficient of dischargeand flow coefficient also affect the gas throughput.However, as indicated in Decker (1993), flow coefficientis the preferred method of quantifying GLV’s flow capacity.
In an actual GLV, the bellows assembly performs themost important function by allowing the valve stem tip tomove on and off the seat while maintaining the dome-charged pressure (Takacs, 2005). When the GLV starts toopen (theball starts tomoveup),metal bellows connected tothe stem begins to get compressed because of axial loading.At some point, the bellows assembly might get completelystacked (Fig. 4). At this point, the ball can no longer moveupward, and the frustum area ceases to increase.
1.1 Effects of ball size
As recommended by Gas-lift Valve Performance TestingAPI Recommended Practice 11V2 (Gas-lift Valve Perfor-mance Testing API Recommended Practice 11V2, 2001),
Original shape Stacked bellows
Fig. 4. Bellows stacking phenomenon.
Minor area of the frustum
Major area of the frustum
Fig. 5. Generated frustum area for smaller ball.
E. Kabir et al.: Oil & Gas Science and Technology - Rev. IFP Energies nouvelles 73, 15 (2018) 3
the diameter of the ball should be 0.0016m larger than thePort Top Diameter (PTD) of the seat. The effects of evenlarger balls have also been studied by Elldakli et al. (2014a)for benchmark GLV. When the ball is seated on the porttop (ball diameter larger than the PTD), the ball/seatcontact area, which remains constant, is the major area ofthe frustum (Fig. 3). The top plane of the frustum is theminor area, which decreases with an increase in stem travelas the ball moves away from the seat. When the ball isseated below the port top (ball diameter smaller than thePTD but larger than the PBD), both the major and theminor frustum areas change with the ball’s upwardmovement (Fig. 5).
The generated frustum area is controlled by threeparameters: (i) the major area of the frustum governed bythe PTD of the seat, (ii) the minor area of the frustumgoverned by the ball size and the PTD of the seat, and (iii)the stem travel. Larger balls inherently experience asmaller stem travel compared to smaller balls because oflarger size and being seated on top of the seat. However, asshown in Figures 3 and 5, the larger ball might have largermajor and minor frustum areas than those of the smallerball depending on the location of the smaller ball. So, twoopposing factors, working at the same time, determine themagnitude of the generated frustum area. Flow coefficientis also expected to have a significant effect on gas
throughput. The combining effects of the generatedfrustum area and the flow coefficient of the ball/seatcombination determines the overall gas throughput of theGLV.
In this paper, we attempt to investigate the relativeeffects of these two factors and determine the dominantone. Optimizing the dominant factor will result in a betterGLV performance. A set of equations considering thephysical parameters of ball and seat has been derived tocalculate the frustum area generated for any stem travelboth for smaller balls. The calculated frustum areas arethen compared against the experimental gas throughput todetermine which of the two factors dominantly affects theGLV performance.
1.2 GLV dynamic performance
For a long time, GLVs were considered as fixed orifice andthe Thornhill-Craver (T-C) equation (Beggs, 1984) wasused to calculate the gas flow rate through GLVs. Theoriginal T-C equation (Cook and Dotterweich, 1946) wasdeveloped for 6-inch bean choke and was not meant to beused for GLVs. A GLV acts as a fixed orifice only when thevalve is fully open which rarely happens. Consequently,using the T-C equation would produce erroneous results asindicated by Decker (2008) and Almeida (2011).
One of the first approaches to investigate the orificenature of the GLV was by Neely et al. (1974). In this study,theGLVwas identifiedasaventuriwithvariableorifice.Thisresearchwas further advancedbyTUALP(TulsaUniversityArtificial Lift Project). Several papers related to themodeling of dynamic nature of GLV were published underTUALP between 1992 and 1993. Finally, in 2001, the APIRecommended Practice 11V2 (Gas-lift Valve PerformanceTesting API Recommended Practice 11V2, 2001) wasintroduced combining the results of TUALP publicationsto provide a complete method for dynamic testing of GLVs.The API method is not included in this paper to avoidsuperfluity. A brief description of this method can also befound in Takacs (2005).
In this paper, a pressure decay method, which isalso called the “Blowdown test” is used to determine theGLV dynamic performance. The objective of this methodis to rapidly measure the flow rate capabilities of thevalves under simulated well conditions. As indicated in

Fig. 6. Ball diameter larger than PTD.
h2
Q
B
M
P
N
D
L
I
G
H
EF
α
θ
S
A
C
K
J
M
h
Fig. 7. The perpendicular drawn from the center of the ball tothe edge of the seat is inside the seat (smaller ball).
4 E. Kabir et al.: Oil & Gas Science and Technology - Rev. IFP Energies nouvelles 73, 15 (2018)
Shahri (2011), this method does not substitute the currentmethod mentioned in the API Recommended Practice11V2 (Gas-lift Valve Performance Testing API Recom-mended Practice 11V2, 2001) and is recommended wherethe flow regime of gas injection is critical or supersonic. Theadvantage of using blowdown test as the dynamic testing isits rapidity. Since the objective of this work requiressignificant number of flow tests, the authors chose to useblowdown test. The validity of this method was verified byShahri andWinkler (2011) and Kulkarni (2005). The detailmethodology is explained in Section 2.1.
1.3 Equations to calculate frustum area as a functionof stem travel
In this section, predictive models to calculate frustum arededuced for two possible cases:
– Case 1: Ball diameter larger than the PTD. – Case 2: Ball diameter smaller than the PTD.The models presented here are based on stem travel,and dimensions of the seat and the ball. Geometricprincipals were used to derive the equations.
1.3.1 Case 1: Ball diameter larger than PTD
In this case (Fig. 6), the major area of the frustum is basedon the PTD and it remains constant regardless of the stemmovement. The minor frustum area changes as the stemmoves upward and is dependent on PTD, stem travel, andball diameter:
Frustumarea ¼ pzPTD
22� z
zþ rb
� �: ð1Þ
In this equation
z ¼ffiffiffiffiffiffiffiffiffiffiffiffiffiffiffiffiffiffiffiffiffiffiffiffiffiffiffiffiffiffiffix2 þ PTD
2
� �2s
� rb; ð2Þ
and
x ¼ yþffiffiffiffiffiffiffiffiffiffiffiffiffiffiffiffiffiffiffiffiffiffiffiffiffiffiffiffiffiffiffiffirb2 � PTD
2
� �2s
; ð3Þ
here PTD=Port Top Diameter, m; rb=ball radius, m;y= linear stem travel, m.
Similar equation to calculate the frustum area wasderived by (Elldakli et al., 2014b).
1.3.2 Case 2: Ball diameter smaller than PTD
When the ball diameter is smaller than PTD, the ballcontacts the seat at a level lower than the top edge of theseat. In this case, there can be two subcases: (i) when theperpendicular drawn from the center of the ball to the edgeof the seat is inside the seat (Fig. 7), and (ii) when theperpendicular drawn from the center of the ball to the edgeof the seat is outside the seat. For the first subcase, both themajor and minor areas of the frustum change as the stemmoves. The second subcase is similar to that of the largerball where the major frustum area is constant and based onthe PTD, and the minor frustum area changes with thestem movement.
1.3.2.1 First subcase: When the perpendicular drawn fromthe center of the ball to the edge of the seat is inside theseat (Fig. 7)
For this subcase, the generated frustum area is a function ofPBD, PTD, ball diameter, stem travel, depth of the beveledsection of the seat, and the diameter of the contact between

h2
T
Q
B
J
K
A
C
I
GH
EF
h
P V
N
S
D
LU
α
θ
Fig. 8. When the perpendicular drawn from the center of the ballto the edge of the seat is outside the seat (smaller ball).
E. Kabir et al.: Oil & Gas Science and Technology - Rev. IFP Energies nouvelles 73, 15 (2018) 5
the ball and the seat (CCD):
Frustumarea ¼ yrb2a
CCDþ 2rb 1þ y
a
� �sinðbÞ
n o: ð4Þ
In this equation
a ¼ rbcosðbÞ þ eþ f; ð5Þ
b ¼ tan�1 2h
PTD� PBD
� �; ð6Þ
e ¼ hðCCD� PBDÞPTD� PBD
; ð7Þ
and
f ¼ h � PBD
PTD� PBD; ð8Þ
here y= linear stem travel, m; rb=ball radius, m; CCD=Contact Circle Diameter for smaller balls, m; h=depth ofthe beveled part of the seat, m; PBD=Port BottomDiameter, m; PTD=Port Top Diameter, m.
1.3.2.2 Second subcase: When the perpendicular drawnfrom the center of the ball to the edge of the seat isoutside the seat (Fig. 8)
For this subcase, the generated frustum area is a function ofPBD, PTD, ball diameter, stem travel, and the diameter ofthe contact between the ball and the seat (CCD):
Frustumarea ¼ j� rb2
PTDþ rbPTD
j
� �: ð9Þ
In this equation
j ¼ffiffiffiffiffiffiffiffiffiffiffiffiffiffiffiffiffiffiffiffiffiffiffiffiffiffiffiffiffiffiffiffiffiffiffiffiffiffiffiffiffiffiffiffiffiffiffiffiffiffiffiffiffiffiffiffiffiffiffiffiffiffiffiffiffiffiffiðy� jg� rbcosðdÞj2Þ þ PTD
2
� �2s
; ð10Þ
and
g ¼ hðPTD� CCDÞPTD� PBD
; ð11Þ
here rb=ball radius, m; PTD=Port Top Diameter, m;y= linear stem travel, m; h=depth of the beveled part ofthe seat, m; PBD=Port Bottom Diameter, m; CCD=Contact Circle Diameter for smaller balls, m.
In Section 2, the individual experiments conducted inthis study are explained. In Section 3, the cases used in thisstudy are laid out. The plots of probe testing and dynamictesting for selected cases are also presented in this section.In Section 4, the frustum areas calculated using Equations(1), (4), and (9) are compared with the gas throughputsmeasured using dynamic testing. The trends of frustumarea and gas throughput are analyzed in this section.Finally, conclusions are made based on the analyses.
2 Experimental procedures
The main aim of the entire experimental program is to testgas lift valve under dynamic conditions by employing“blowdown” or “pressure decay” concept as explained indetail in Kulkarni (2005) and Shahri (2011). The entireprogram is divided into the following four parts:
1. Static testing 2. Aging 3. Probe testing 4. Dynamic testing (Blowdown)Parts 1, 2, and 3 are well documented in the APIRecommended Practice 11V2 (Gas-lift Valve PerformanceTesting API Recommended Practice 11V2, 2001). Only thePart 4 (dynamic testing) is described here.
2.1 Dynamic testing (Blowdown test)
The methodology behind this technique is simply dis-charging a certain volume of gas at a certain time until theupstream pressure reaches the final downstream pressurewhich is ambient pressure. The initial pressure issignificantly higher than the test rack opening pressureto ensure a fully open GLV.
The apparatus for this test (Figs. 9 and 10) includessome compartments such as source of high pressurenitrogen gas, upstream and downstream pressureregulators, an extra empty volume with known internalcapacity (surge tank), an encapsulated vessel whichholds the GLV, the GLV, high-speed pressure trans-ducers, high speed temperature recorder, and a Data-Acquisition System (DAQ) which might be integratedwith the pressure transducers.
The procedure for running the dynamic testing is asfollows:
– the GLV is attached inside the encapsulating vessel andthe vessel is closed;–
the upstream pressure is set at a very high valuecompared to the test rack opening pressure;–
the main feeding valve that is attached to the high-pressure nitrogen source is shut-in;
Table 1. Experimental cases.
Case # Seat type PBD(meter)
PTD(meter)
Ball diameter(meter)
Ptro(Pa)
1
Modifieddesign
0.0048
0.0127
0.0143
2169752
2 0.0048 0.0111
3 0.0064 0.0143
4 0.0064 0.0111
5 0.0079 0.0143
6 0.0079 0.0111
7 0.0095 0.0143
8 0.0095 0.0111
9
Optimizeddesign
0.0064 0.0143
10 0.0064 0.0111
11 0.0079 0.0143
12 0.0079 0.0111
13 0.0095 0.014314 0.0095 0.0111
High PressureNitrogen Source
Transducer
EncapsulatedVessel
Surge Tank
DownstreamValve
Fig. 9. Actual picture of the blowdown tester.
High PressureNitrogen Source
SurgeTank
Upstream Pressure
Transducer
KnownVolume
EncapsulatingChamber
GLV
Downstream Pressure
Transducer
DataStorage
Fig. 10. Schematic of the blowdown tester.
6 E. Kabir et al.: Oil & Gas Science and Technology - Rev. IFP Energies nouvelles 73, 15 (2018)
–
wait until the upstream pressure is stabilized; – the temperature is recorded using a laser temperaturegun;–
the pressure and corresponding time recording are started;–
the downstream valve is kicked open as fast as possible; – the temperature is recorded again using the lasertemperature gun.Temperature is not expected to change much for such ashort period of time and for small volume of gas discharged.However, a temperature variation of as small as ±2°F wasreported to change the flowrate by almost 30% (Sagar, 1991).That is why temperatures were measured and recorded bothimmediately before and after discharging the gas. The reason

0
500000
1000000
1500000
2000000
2500000
3000000
0 0.001 0.002 0.003 0.004 0.005 0.006 0.007 0.008
Inje
ctio
n P
ress
ure
(Pa)
Stem Travel (meter)
Increasing Decreasing
Fig. 12. Probe test (case 9).
0
500000
1000000
1500000
2000000
2500000
3000000
0 0.001 0.002 0.003 0.004 0.005 0.006 0.007
Inje
ctio
n P
ress
ure
(Pa)
Stem Travel (meter)
Increasing Decreasing
Fig. 11. Probe test (case 3).
0
0.05
0.1
0.15
0.2
0.25
0
500000
1000000
1500000
2000000
2500000
3000000
3500000
0 0.1 0.2 0.3 0.4 0.5 0.6 0.7 0.8
Q (
SC
M/s
)
Fitt
ed P
ress
ure
(Pa)
Time (s)
P vs. t Q vs. t
Fig. 13. Blowdown test (case 3).
0
0.05
0.1
0.15
0.2
0.25
0.3
0
500000
1000000
1500000
2000000
2500000
3000000
3500000
0 0.2 0.4 0.6 0.8 1 1.2
Q (
SC
M/s
)
Fitt
ed P
ress
ure
(Pa)
Time (s)
P vs. t Q vs. t
Fig. 14. Blowdown test (case 9).
E. Kabir et al.: Oil & Gas Science and Technology - Rev. IFP Energies nouvelles 73, 15 (2018) 7
for starting data recording before opening the downstreamvalve is to be able to detect the starting point of pressuredecay with time. Once the pressure decay data are recorded,the gas flow rate is calculated using the real gas law. The T-Cequation was not used in any part of the calculation becauseof the reasons mentioned in Section 1.2.
3 Experimental results
The fourteen cases mentioned in Table 1 are considered forall the experiments and calculations:
3.1 Measuring stem travel
For measuring stem travel, four different modified designseats and three optimized design seats are used withincreasing PBD but the same PTD to eliminate the effect ofPTD, each with an 0.0016m larger and an 0.0016m smallerball. A probe tester is used for this experiment. For the sakeof brevity, the results for case 3 and case 9 are presentedhere (Figs. 11 and 12 respectively).
In these probe test charts, a hysteresis in betweenincreasing and decreasing injection pressure paths isobserved in the effective stem travel region. For aparticular injection pressure, the stem travel is more fordecreasing pressure compared to injection pressure. Thereason is � during decreasing pressure, the compressedbellows tries to return to its uncompressed state and bydoing so it helps the stem to move even further. As aresult, a larger stem travel is observed during decreasingpressure.
Using Equations (1), (4), (9), and the measured stemtravel, the corresponding frustum areas are calculated forall fourteen cases.
3.2 Measuring gas throughput
The same fourteen cases as in probe tester are used tomeasure the gas throughput using blowdown tester andpressure decay method. Each blowdown test is repeatedtwo times to eliminate any experimental error. Case 3 andcase 9 are presented here (Figs. 13 and 14 respectively).

Table 2. Comparing change in frustum area with change in gas throughput.
Case # Seat type PBD(meter)
PTD(meter)
Balldiameter(meter)
Stemtravel(meter)
Frustumarea(meter2)
% Increasein frustumarea
% Fullyopen
Gasthroughput(SCM/s)
% Increasein gasthroughput
1
ModifiedDesign
0.0048
0.0127
0.0143 0.0014 2.7993E-051
157 0.133742 0.0048 0.0111 0.0051 2.8380E-05 159 0.1386
3 0.0064 0.0143 0.0013 2.6252E-057
83 0.1917264 0.0064 0.0111 0.0056 2.8058E-05 89 0.2415
5 0.0079 0.0143 0.0014 2.8638E-05-2
58 0.2160756 0.0079 0.0111 0.0064 2.7929E-05 56 0.3769
7 0.0095 0.0143 0.0014 2.8380E-05-4
40 0.21401798 0.0095 0.0111 0.0078 2.7219E-05 38 0.5971
9
OptimizedDesign
0.0064 0.0143 0.0017 3.5024E-05-17
111 0.21341610 0.0064 0.0111 0.0070 2.9213E-05 92 0.2465
11 0.0079 0.0143 0.0016 3.3218E-05-15
67 0.23075412 0.0079 0.0111 0.0078 2.8187E-05 57 0.3549
13 0.0095 0.0143 0.0017 3.3605E-05-19
47 0.24028414 0.0095 0.0111 0.0078 2.7090E-05 38 0.4428
0.1370
0.1380
0.1390
2.8250E-05
2.8300E-05
2.8350E-05
2.8400E-05
(SC
M/s
)
met
er2 )
Ball0.0111 m
8 E. Kabir et al.: Oil & Gas Science and Technology - Rev. IFP Energies nouvelles 73, 15 (2018)
4 Result comparison
The results of all the probe tests and blowdown tests arepresented Table 2. In all of these fourteen cases, theobserved common trends are:
0.1360
2.8200E-05
hput
rea
(
– 2.8150E-05hrou
g
um A
For the same PBD and PTD, with increasing ball size,the gas throughput decreases.
0.13502.8100E-05 as T
Fru
st
–G
With increasing PBD, the effect of smaller ball sizebecomes more prominent.
2.8050E-05 Ball0.0143 m
–0.1330
0.1340
2.7950E-05
2.8000E-05
0.0100 0.0110 0.0120 0.0130 0.0140 0.0150
Ball Diameter (meter)
Frustum Area Flowrate
Fig. 15. Effect of ball size (case 1 and case 2).
0.0000
0.0500
0.1000
0.1500
0.2000
0.2500
0.3000
2.6000E-05
2.6200E-05
2.6400E-05
2.6600E-05
2.6800E-05
2.7000E-05
2.7200E-05
2.7400E-05
2.7600E-05
2.7800E-05
2.8000E-05
2.8200E-05
0.0100 0.0110 0.0120 0.0130 0.0140 0.0150
Gas
Thr
ough
put
(SC
M/s
)
Fru
stum
Are
a (m
eter
2 )
Ball Diameter (meter)
Frustum Area Flowrate
Ball0.0111 m
Ball0.0143 m
Fig. 16. Effect of ball size (case 3 and case 4).
This effect of smaller ball size is more prominent in themodified design of the seat.
These trends are explained in Sections 4.1 and 4.2.
4.1 Effect of ball size
4.1.1 Case 1 and Case 2 (Fig. 15)
In cases 1 and 2, decreasing the ball diameter from 0.0016mlarger than the PTD to 0.0016m smaller than the PTDresults in 1% increase in frustum area and 4% increase gasthroughput. This means for these two cases, flow coefficientis also increasing in addition to the increase in frustumarea. The change in gas throughput as a result of changingthe ball size is very small because of small port bottom area.The increase in gas flowrate with decreasing ball size can beattributed to the fact that with smaller ball size, comessmaller flow restriction. Also, the fractional injectionpressure acting downward on the ball decreases as the ballsize decreases. With increasing PBD, this phenomenon isexpected to be more noticeable.
4.1.2 Case 3 and Case 4 (Fig. 16)
For cases 3 and 4, decreasing the ball diameter from0.0016m larger than the PTD to 0.0016m smaller than thePTD results in 7% increase in frustum area and 21%

0.0000
0.0500
0.1000
0.1500
0.2000
0.2500
0.3000
0.3500
0.4000
2.7800E-05
2.7900E-05
2.8000E-05
2.8100E-05
2.8200E-05
2.8300E-05
2.8400E-05
2.8500E-05
2.8600E-05
2.8700E-05
0.0100 0.0110 0.0120 0.0130 0.0140 0.0150
Gas
Thr
ough
put
(SC
M/s
)
Fru
stum
Are
a (m
eter
2 )
Ball Diameter (meter)
Frustum Area Flowrate
Ball0.0111 m
Ball0.0143 m
Fig. 17. Effect of ball size (case 5 and case 6).
0.0000
0.1000
0.2000
0.3000
0.4000
0.5000
0.6000
0.7000
2.7000E-05
2.7200E-05
2.7400E-05
2.7600E-05
2.7800E-05
2.8000E-05
2.8200E-05
2.8400E-05
2.8600E-05
0.0100 0.0110 0.0120 0.0130 0.0140 0.0150
Gas
Thr
ough
put
(SC
M/s
)
Fru
stum
Are
a (m
eter
2 )
Ball Diameter (meter)
Frustum Area Flowrate
Ball0.0111 m
Ball0.0143 m
Fig. 18. Effect of ball size (case 7 and case 8).
0.2100
0.2150
0.2200
0.2250
0.2300
0.2350
0.2400
0.2450
0.2500
2.8000E-05
2.9000E-05
3.0000E-05
3.1000E-05
3.2000E-05
3.3000E-05
3.4000E-05
3.5000E-05
3.6000E-05
0.0100 0.0110 0.0120 0.0130 0.0140 0.0150
Gas
Thr
ough
put
(SC
M/s
)
Fru
stum
Are
a (m
eter
2 )
Ball Diameter (meter)
Frustum Area Flowrate
Ball0.0111 m
Ball0.0143 m
Fig. 19. Effect of ball size (case 9 and case 10).
E. Kabir et al.: Oil & Gas Science and Technology - Rev. IFP Energies nouvelles 73, 15 (2018) 9
increase in gas throughput. This means in this case, theflow coefficient is affecting the flowrate more than thefrustum area and this effect of flow coefficient is larger thancases 1 and 2. The increase in gas throughput is largercompared to cases 1 and 2. Also, the gas flowrates aresignificantly higher for both cases 3 and 4 compared tocases 1 and 2. The reason for this is a larger port bottomarea. The increase in gas flowrate as a result of decreasingball size is more evident in these cases. The reasons areexplained in Section 4.1.1.
4.1.3 Case 5 and Case 6 (Fig. 17)
For cases 5 and 6, decreasing the ball size decreases thefrustum area by 2% while increases the flowrate by 75%.This means the effect of frustum area on gas throughput isvery limited in these two cases. The dominant factoraffecting the gas throughput is the flow coefficient and the
effect is larger compared to the previous four cases. Theincrease in gas flowrate is more evident compared to all theprecious four cases as well.
4.1.4 Case 7 and Case 8 (Fig. 18)
For cases 7 and 8, decreasing the ball size decreases thefrustum area by 4% while increases the flowrate by 179%.This means the frustum area is affecting the gasthroughput to an even smaller extent in these two cases.The dominant factor affecting the gas throughput is theflow coefficient and the effect is larger compared to theprevious six cases. The trend of increasing gas flowrate withdecreasing ball size is alsomanifested in these cases. Amongall the modified seat design cases, case 7 and case 8 presentthe largest difference in gas flowrates between smaller andlarger ball sizes. This means, with increasing PBD, theeffect of ball size becomes more evident.
4.1.5 Case 9 and Case 10 (Fig. 19)
Cases 9 and 10 are optimized seats. For these cases,decreasing the ball size decreases the frustum area by 17%while increases the flowrate by 16%. This means the effectof frustum area is also very small in these two cases. Thedominant factor affecting the gas throughput is the flowcoefficient. As observed in all the modified seat designcases, the phenomenon of larger gas flowrate with smallerball size is also evident in these two cases.
4.1.6 Case 11 and Case 12 (Fig. 20)
Cases 11 and 12 are optimized seats as well. For these cases,decreasing the ball size decreases the frustum area by 15%while increases the flowrate by 54%. The effect of frustumarea on gas throughput is insignificant. The dominantfactor affecting the gas throughput is the flow coefficientand the effect is larger compared to the previous two cases

0.0000
0.0500
0.1000
0.1500
0.2000
0.2500
0.3000
0.3500
0.4000
0.4500
0.5000
0.0000E+00
5.0000E-06
1.0000E-05
1.5000E-05
2.0000E-05
2.5000E-05
3.0000E-05
3.5000E-05
4.0000E-05
0.0100 0.0110 0.0120 0.0130 0.0140 0.0150
Gas
Thr
ough
put
(SC
M/s
)
Fru
stum
Are
a (m
eter
2 )
Ball Diameter (meter)
Frustum Area Flowrate
Ball0.0111 m
Ball0.0143 m
Fig. 21. Effect of ball size (case 13 and case 14).
0
0.1
0.2
0.3
0.4
0.5
0.6
0.7
0.004 0.005 0.006 0.007 0.008 0.009 0.01
Gas
Thr
ough
put
(SC
M/s
)
PBD (meter)
Smaller Ball Larger Ball
PBD 0.0048 m
PBD 0.0064 m
PBD 0.0079 m
PBD 0.0095 m
Fig. 22. Effect of port bottom diameter for modified seat design.
0.0000
0.0500
0.1000
0.1500
0.2000
0.2500
0.3000
0.3500
0.4000
2.7000E-05
2.8000E-05
2.9000E-05
3.0000E-05
3.1000E-05
3.2000E-05
3.3000E-05
3.4000E-05
0.0100 0.0110 0.0120 0.0130 0.0140 0.0150
Gas
Thr
ough
put
(SC
M/s
)
Fru
stum
Are
a (m
eter
2 )
Ball Diameter (meter)
Frustum Area Flowrate
Ball0.0111 m
Ball0.0143 m
Fig. 20. Effect of ball size (case 11 and case 12).
Table 3. Effect of port bottom diameter for modified seat design with smaller ball.
Case # PBD(meter)
PTD(meter)
Ball diameter(meter)
Frustum area(meter2)
% Increase infrustum areafrom prevous case
% Fullyopen
Gasthroughput(SCM/s)
% Increasein gasthroughput
2 0.0048
0.0127 0.0111
2.8380E-05 159 0.13864 0.0064 2.6252E-05 -8 83 0.2415 746 0.0079 2.8638E-05 9 58 0.3769 568 0.0095 2.8380E-05 -1 40 0.5971 58
10 E. Kabir et al.: Oil & Gas Science and Technology - Rev. IFP Energies nouvelles 73, 15 (2018)
(case 9 and case 10) of optimized design seats. Thephenomenon of higher gas flowrate with smaller ball size isalso observed with a larger extent.
4.1.7 Case 13 and Case 14 (Fig. 21)
Cases 13 and 14 are also optimized seats. For these cases,decreasing the ball size decreases the frustum area by 19%
while increases the flowrate by 84%. The effect of frustumarea on gas throughput is also insignificant. The dominantfactor affecting the gas throughput is theflow coefficient andthe effect is larger compared to the previous four cases ofoptimized design seats. Among all the optimized seat designcases, case 13 and case 14 present the largest difference in gasflowrates between smaller and larger ball sizes.
4.2 Effect of port bottom diameter with respect toball size
In this section, the effect of PBD on gas throughputregarding ball size is explained for both modified andoptimized seat designs.
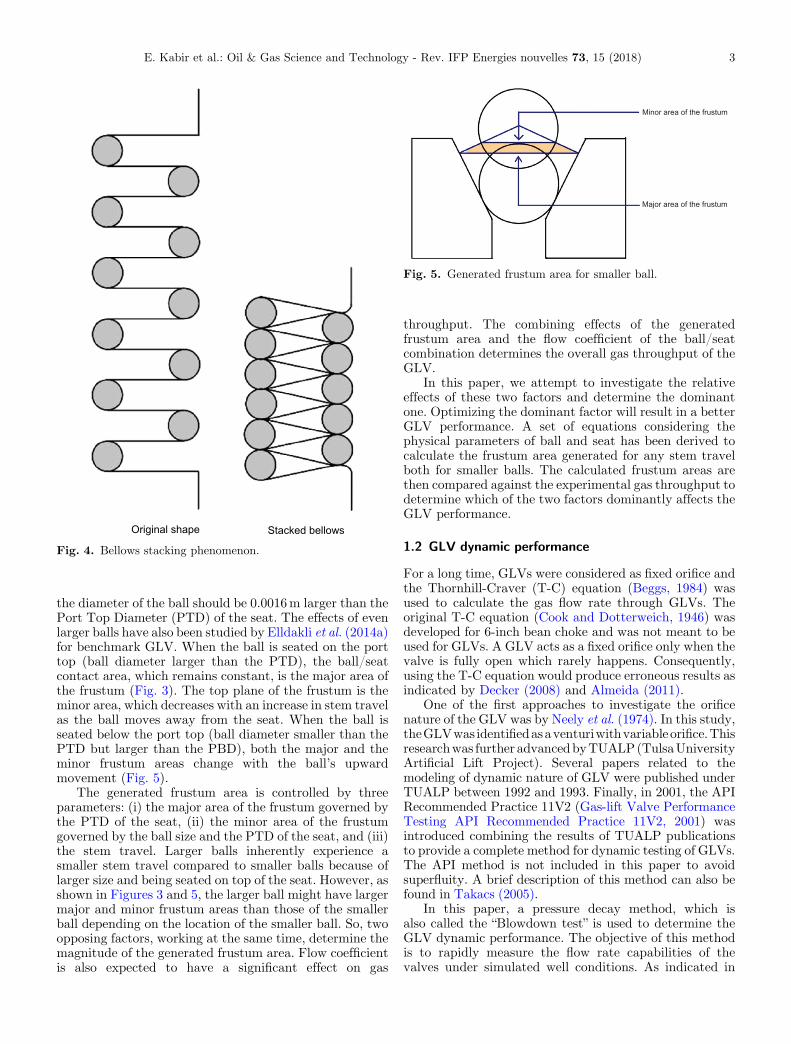
Increasing port bottom diameter is expected to resultin increasing gas throughput. However, this increase is notin the same proportion for smaller balls and larger balls.As seen in Table 3, Table 4, and Figure 22, the increase ingas throughput becomes less and less significant as PBDincreases for the cases where larger balls were used (cases1, 3, 5, and 7). However, for the cases where smaller ballswere used (cases 2, 4, 6, and 8), the gas throughput keepsincreasing at almost the same percentage with increasingPBD. Similar trend is observed for optimized seat designsas well. This is presented in Table 5, Table 6, andFigure 23.
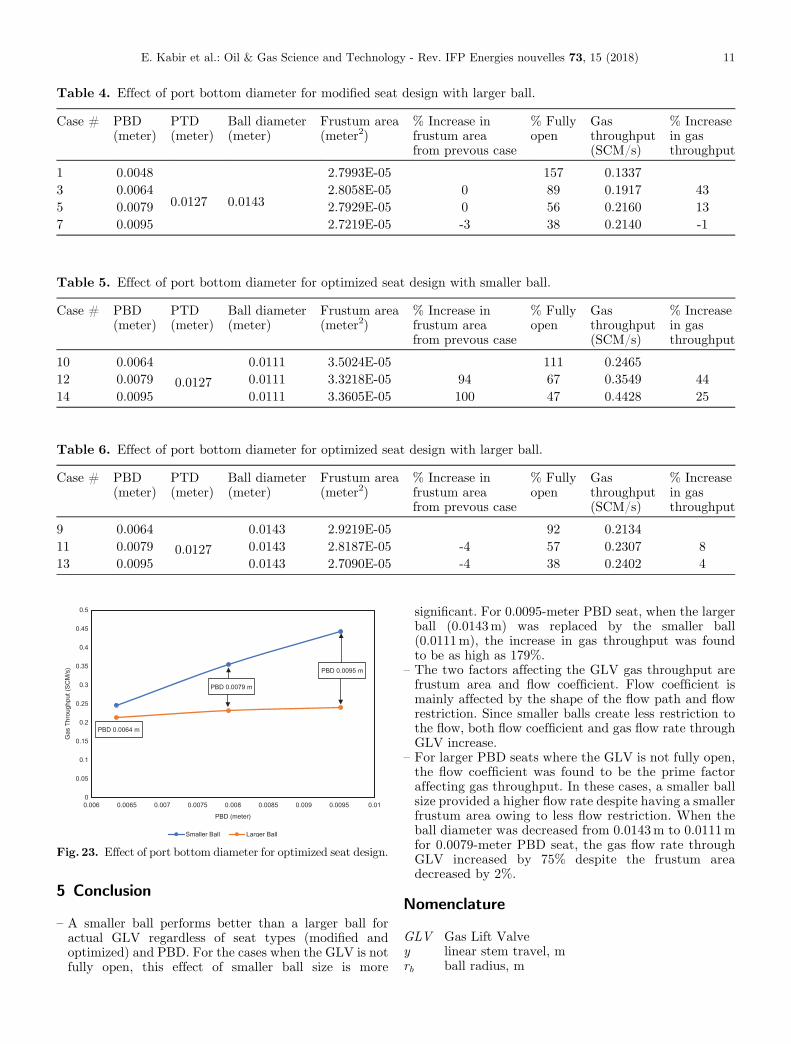
Table 4. Effect of port bottom diameter for modified seat design with larger ball.
Case # PBD(meter)
PTD(meter)
Ball diameter(meter)
Frustum area(meter2)
% Increase infrustum areafrom prevous case
% Fullyopen
Gasthroughput(SCM/s)
% Increasein gasthroughput
1 0.0048
0.0127 0.0143
2.7993E-05 157 0.13373 0.0064 2.8058E-05 0 89 0.1917 435 0.0079 2.7929E-05 0 56 0.2160 137 0.0095 2.7219E-05 -3 38 0.2140 -1
Table 5. Effect of port bottom diameter for optimized seat design with smaller ball.
Case # PBD(meter)
PTD(meter)
Ball diameter(meter)
Frustum area(meter2)
% Increase infrustum areafrom prevous case
% Fullyopen
Gasthroughput(SCM/s)
% Increasein gasthroughput
10 0.0064
0.0127
0.0111 3.5024E-05 111 0.246512 0.0079 0.0111 3.3218E-05 94 67 0.3549 4414 0.0095 0.0111 3.3605E-05 100 47 0.4428 25
Table 6. Effect of port bottom diameter for optimized seat design with larger ball.
Case # PBD(meter)
PTD(meter)
Ball diameter(meter)
Frustum area(meter2)
% Increase infrustum areafrom prevous case
% Fullyopen
Gasthroughput(SCM/s)
% Increasein gasthroughput
9 0.0064
0.0127
0.0143 2.9219E-05 92 0.213411 0.0079 0.0143 2.8187E-05 -4 57 0.2307 813 0.0095 0.0143 2.7090E-05 -4 38 0.2402 4
0
0.05
0.1
0.15
0.2
0.25
0.3
0.35
0.4
0.45
0.5
0.006 0.0065 0.007 0.0075 0.008 0.0085 0.009 0.0095 0.01
Gas
Thr
ough
put
(SC
M/s
)
PBD (meter)
Smaller Ball Larger Ball
PBD 0.0064 m
PBD 0.0079 m
PBD 0.0095 m
Fig. 23. Effect of port bottom diameter for optimized seat design.
E. Kabir et al.: Oil & Gas Science and Technology - Rev. IFP Energies nouvelles 73, 15 (2018) 11
5 Conclusion
–
A smaller ball performs better than a larger ball foractual GLV regardless of seat types (modified andoptimized) and PBD. For the cases when the GLV is notfully open, this effect of smaller ball size is moresignificant. For 0.0095-meter PBD seat, when the largerball (0.0143m) was replaced by the smaller ball(0.0111m), the increase in gas throughput was foundto be as high as 179%.
–
The two factors affecting the GLV gas throughput arefrustum area and flow coefficient. Flow coefficient ismainly affected by the shape of the flow path and flowrestriction. Since smaller balls create less restriction tothe flow, both flow coefficient and gas flow rate throughGLV increase.–
For larger PBD seats where the GLV is not fully open,the flow coefficient was found to be the prime factoraffecting gas throughput. In these cases, a smaller ballsize provided a higher flow rate despite having a smallerfrustum area owing to less flow restriction. When theball diameter was decreased from 0.0143m to 0.0111mfor 0.0079-meter PBD seat, the gas flow rate throughGLV increased by 75% despite the frustum areadecreased by 2%.Nomenclature
GLV
Gas Lift Valve y linear stem travel, m rb ball radius, m
12 E. Kabir et al.: Oil & Gas Science and Technology - Rev. IFP Energies nouvelles 73, 15 (2018)
PTD
Port Top Diameter, m PBD Port Bottom Diameter, m CCD Contact Circle Diameter for smaller balls, m h depth of the beveled part of the seat, m h2 seat height, m u central angle created at the center of the ball,degrees
a angle of the beveled edge of the seat with respect tohorizontal, degrees
Ptro test rack opening pressure, Pa Pvc valve closing pressure, Pa Ct nitrogen temperature correction factor, dimension-less
Ap port area, m2Ab
effective bellows area, m2D
frustum area, m2Q
gasflowrate, StandardCubicMeter/second (SCM/s)References
Aliyeva F., Novruzaliyev B. (2015) Gas lift � fast and furious,SPE Annual Caspian Technical Conference & Exhibition,Baku, Azerbaijan, SPE-177359-MS. DOI:10.2118/177359-MS.
Almeida A. (2011) A model to calculate the theoretical criticalflow rate through venturi gas lift valves (includes Addendum),SPE J., 16, 01, 134–147. DOI:10.2118/126184-PA.
Beggs H. (1984)Gas Production Operations, Tulsa, Gulf Pub Co.Brown K. (1967) Gas Lift: Theory and Practice, Prentice-Hall.Cook H., Dotterweich F. (1946) Report on the Calibration ofPositive Flow Beans as Manufactured by Thornhill-CraverCompany, Houston, Texas, USA, Department of Engineering,Texas College of Arts and Industries.
Decker K. (1993) Gas-lift valve performance testing, OklahomaCity, Society of Petroleum Engineers. DOI:10.2118/25444-MS.
Decker K. (2008) IPO gas lift design with valve performance, SPEProd. Oper., 23, 04, 464–467. DOI:10.2118/109694-PA.
Elldakli F., Soliman M. (2017) Optimum design for new gas liftvalve seat, J. Petrol. Sci. Eng., 149, 456–464. Retrieved fromhttp://www.sciencedirect.com/science/article/pii/S0920410516308804.
Elldakli F., Soliman M., Shahri M. (2014a) Enhanced Gas LiftValve Performance for Sharp Edged Seat using Larger BallSizes, Southwestern Petroleum Short Course.
Elldakli F., SolimanM., ShahriM.,WinklerH.,GamadiT. (2014b)Improved gas lift valve performance using a modified design forGLV seat, Artificial Lift Conference North America, Houston,Society of Petroleum Engineers. DOI:10.2118/171342-MS.
Gas-lift Valve Performance Testing API Recommended Practice11V2. (2001) API Recommended Practice 11V2, 2, AmericanPetroleum Institute.
King W. (1940) United States of America Patent No. 2,339,487.Kulkarni R. (2005) Modeling of gas lift valve performance byregressing model parameters to rapidly obtain blowdown data,M.S. Thesis, Texas Tech University, Bob L. Herd Departmentof Petroleum Engineering, Lubbock.
Lea J., Nickens H., Wells M. (2008) Gas lift, in: Gas WellDeliquification (2 ed.), Gulf Professional Publishing, p. 333.
Neely A., Montgomery J., Vogel J. (1974) A field test andanalytical study of intermittent gas lift, Soc. Petrol. Eng. J.,14, 05, 502–512. DOI:10.2118/4538-PA.
Sagar R. (1991) Improved dynamic model of gas-lift valve perfor-mance,Master of Science Thesis, University of Tulsa, Tulsa.
Salinas B., Xu Z. (2014) Optimizing gas lift operations usingdisintegrable gas lift valve plugs, SPE Artificial Lift Conferene& Exhibition-North America, Houston, SPE-171374-MS.DOI:10.2118/171374-MS.
Shahri M. (2011) Simplified and rapid method for determiningflow characteristics of every gas-lift valve (GLV), Ph.D.Dissertation, Texas Tech University, Bob L. Herd Departmentof Petroleum Engineering, Lubbock.
Shahri M., Winkler H. (2011) Practical method for measurementof injection-gas throughput of each, SPE Production andOperations Symposium, Oklahoma City, SPE-141055-MS.
Takacs G. (2005) Gas lift valves, in: Gas Lift Manual, PennWellCorp, p. 182.
Winkler H., Blann J. (2007) Gas lift, in: Clegg J.D. (ed.),Petroleum Engineering Handbook (Vol. 4), Society of Petro-leum Engineers, p. 521.
Winkler H., Camp G. (1987) Dynamic performance testing ofsingle-element unbalanced gas-lift valves, USA, SPE-14348-PA. DOI:10.2118/14348-PA.
Xu Z., Richard B., Kritzler J. (2013) Smart gas lift valves enhanceoperation efficiency of offshore wells, SPE Annual TechnicalConference and Exhibition, New Orleans, SPE-166291-MS.DOI:10.2118/166291-MS.