inventory management practices and financial
74
INVENTORY MANAGEMENT PRACTICES AND FINANCIAL PERFORMANCE OF MANUFACTURING FIRMS IN KENYA: CASE OF AGROCHEMICAL FIRMS BY ARTHUR MULUMBA A PROJECT SUBMITTED IN PARTIAL FULFILMENT OF THE COURSE REQUIREMENT OF MASTER OF SCIENCE IN COMMERCE (FINANCE AND ACCOUNTING) AT KCA UNIVERSITY SEPTEMBER, 2016
-
Upload
khangminh22 -
Category
Documents
-
view
4 -
download
0
Transcript of inventory management practices and financial
INVENTORY MANAGEMENT PRACTICES AND FINANCIAL
PERFORMANCE OF MANUFACTURING FIRMS IN KENYA: CASE OF
AGROCHEMICAL FIRMS
BY
ARTHUR MULUMBA
A PROJECT SUBMITTED IN PARTIAL FULFILMENT OF THE COURSE
REQUIREMENT OF MASTER OF SCIENCE IN COMMERCE (FINANCE AND
ACCOUNTING) AT KCA UNIVERSITY
SEPTEMBER, 2016

ii
DECLARATION
I, Arthur Mulumba, hereby submit my research project for examination, entitled “Inventory
Management Practices and performance of manufacturing firms in Kenya: Case of
Agrochemical Firms” and truthfully declare that the above-titled paper is a product of my
original research investigation and has not been presented for a degree award in any other
institution.
I further declare that, should the faculty eventually discover that a substantial portion of
my paper is lifted, in total, from original sources, using exactly the words of the author in
more than 50% of the whole content, I reserve the right to KCA University to recall my
M.Sc. and cancel the degree granted to me.
Signed this day of __________________________ at KCA University.
ARTHUR MULUMBA
Registration No:

iii
TABLE OF CONTENT
DECLARATION............................................................................................................... ii
TABLE OF CONTENT ................................................................................................... iii
LIST OF TABLE ............................................................................................................. vi
LIST OF FIGURES ........................................................................................................ vii
ABBREVIATIONS AND ACRONYMS ...................................................................... viii
ABSTRACT ...................................................................................................................... ix
CHAPTER ONE ................................................................................................................1
INTRODUCTION..............................................................................................................1
1.1 Background of the Study .......................................................................................... 1
1.2 Statement of the Problem .......................................................................................... 7
1.3 Objectives of the Study ............................................................................................. 8
1.3.1 General Objective .............................................................................................. 8
1.3.2 Specific Objectives ............................................................................................ 9
1.4 Research Questions ................................................................................................... 9
1.5 Significance of the Study .......................................................................................... 9
1.6 Scope of the Study .................................................................................................. 10
1.7 Justification of the Study ........................................................................................ 10
1.8 Limitations of the Study.......................................................................................... 11
1.9 Assumptions ............................................................................................................ 11
1.10 Definition of Terms............................................................................................... 11
CHAPTER TWO .............................................................................................................13
LITERATURE REVIEW ...............................................................................................13
2.1 Introduction ............................................................................................................. 13
2.2 Theoretical Review ................................................................................................. 13
2.3 Empirical Review.................................................................................................... 15
2.4 Conceptual framework ............................................................................................ 24
2.5 Hypothesis of the study ........................................................................................... 25

iv
2.6 Operationalization ................................................................................................... 25
2.7 Summary ................................................................................................................. 26
CHAPTER THREE .........................................................................................................27
RESEARCH METHODOLOGY ...................................................................................27
3.1 Introduction ............................................................................................................. 27
3.2 Research Design...................................................................................................... 27
3.3 Target Population .................................................................................................... 27
3.4 Sample Size and Sampling procedures ................................................................... 28
3.5 Instrumentation ....................................................................................................... 28
3.6 Data Collection Procedure ...................................................................................... 29
3.7 Diagnostic Tests ...................................................................................................... 29
3.8 Data Analysis and Presentation .............................................................................. 29
CHAPTER FOUR ............................................................................................................31
DATA ANALYSIS AND PRESENTATION .................................................................31
4.1 Introduction ............................................................................................................. 31
4.2 General Information ................................................................................................ 31
4.3 Effects of Net Transactions Approach on Financial Performance .......................... 33
4.4 Effects of Just in Time (JIT) Purchasing Policy on Financial Performance ........... 35
4.5 Effects of Vendor Managed Inventory (VMI) on Financial Performance .............. 37
4.6 Influence of Forecasting and Replenishment on Financial Performance ............... 39
4.7 Effects of Financial Performance ............................................................................ 41
4.8 Diagnostic Tests ...................................................................................................... 42
4.9 Regression Analysis ................................................................................................ 43
CHAPTER FIVE .............................................................................................................46
SUMMARY, CONCLUSION AND RECOMMENDATIONS ...................................46
5.1 Introduction ............................................................................................................. 46
5.2 Summary of the Findings ........................................................................................ 46
5.3 Discussions ............................................................................................................. 49

v
5.4 Conclusion .............................................................................................................. 50
5.5 Recommendations for the Study ............................................................................. 51
5.6 Recommendations for Further Studies.................................................................... 52
REFERENCES .................................................................................................................53
APPENDICES ..................................................................................................................59
Appendix I: Questionnaire ............................................................................................ 59
Appendix II: Budget ..................................................................................................... 64
Appendix III: Work Plan .............................................................................................. 65
vi
LIST OF TABLE
Table 4. 1: Response Rate ................................................................................................. 31
Table 4. 2: Gender of Respondents ................................................................................... 32
Table 4. 3: Level of Education .......................................................................................... 32
Table 4. 4: Number of Years Worked ............................................................................... 33
Table 4. 5: Position Held .................................................................................................. 33
Table 4. 6: Effects of Net Transactions Approach on Financial Performance ................. 34
Table 4. 7: Effects Of Just In Time (JIT) Purchasing Policy On Financial Performance . 35
Table 4. 8: Vendor Managed Inventory (VMI) on Financial Performance ...................... 37
Table 4. 9: Influence of Forecasting and Replenishment on Financial Performance ....... 39
Table 4. 10: Effects of Financial Performance ................................................................. 41
Table 4. 11: Multicollinearity Test .................................................................................. 42
Table 4. 12: Normality Test .............................................................................................. 43
Table 4. 13: Model Summary ........................................................................................... 43
Table 4. 14: ANOVA ........................................................................................................ 44
Table 4.15: Regression Coefficients ................................................................................. 44

vii
LIST OF FIGURES
Figure 2. 1: Conceptual Framework ................................................................................. 24

viii
ABBREVIATIONS AND ACRONYMS
EDP Electronic Data Processing
EOQ Economic order quantity
GDP Gross Domestic Product
JIT Just-in-time
KAM Kenya Association of Manufactures
SPSS Statistical Package for Social Sciences
VMI vendor managed inventory

ix
ABSTRACT
Inventories occupy the most strategic position in the structure of working capital of most
firms and enterprises and are an important component to the success and expenditure
reduction of a firm. They make up an important part of a manufacturing firm’s production
process as they facilitate continued production. The general objective of this study is to
assess the relationship between inventory management practices and performance of
manufacturing firms in Kenya using a case of agro-chemical firms. To achieve this
objective, the study will be guided by four specific objectives: to determine the effects of
net transactions approach to inventory management on performance of manufacturing
firms in Kenya; To establish the effects of the Just in Time (JIT) on performance of
manufacturing firms in Kenya; To establish the effects of Vendor Managed
Inventory(VMI) on performance of manufacturing firms in Kenya and to determine the
influence of forecasting and replenishment on performance of manufacturing firms in
Kenya. The study will adopt a descriptive survey design on a population of 65 Agro-
chemicals in Kenya. The respondents will collect data from operation managers,
procurement managers, procurement officers and stores managers. This study will employ
a survey of all the 65 existing firms. The study will target the procurement managers,
operations managers and stores managers at the agro-chemical firms. 30% of the target
population will be sampled to get 98 respondents for the study. The study will collect
primary data using a questionnaire. The collected data will be analyzed using mean,
standard deviation, frequencies and percentages. Regression analysis will be used to test
for the relationship between the independent variable and the dependent variable. The study
concludes that net transactions approach’s main concern is planning for all the resources
that the organization needs to run its operations and hence improve its performance. The
study further concludes that implementation of JIT in a company leads to cost reductions
in the production system. The study also concludes that VMI is guided by contracts that
guide the inventory of the agrochemical firm aimed at improving its performance. The
study further concludes that ROE of agrochemical firms had improved due to inventory.
The study recommends that the top management of all Manufacturing firms in Kenya
should strengthen their abilities of re-planning in order to improve performance. The top
management of manufacturing firms in Kenya should adopt pull method whereby goods
are produced in each manufacturing stage only as they are needed. Vendor managed
inventory systems should be adopted in order to enable manufactures to reduce or exclude
inventory leading to higher performance. Forecasting should be geared towards making
prediction of the future demand ensuring that performance is high.

CHAPTER ONE
INTRODUCTION
1.1 Background of the Study
There is a paradigm shift in operations of most organizations due to globalization and
increased competition in business environment. Today, businesses face more threats from
competitors than ever before. The forces of globalization have reduced the world to small
village. In order to stay competitive and enhance financial performance, a greater emphasis
is paid on inventory management. Today, advancement in technology has improved the
way inventories are managed and therefore enhanced performance. Organizations are
leveraging on several technologies to manage their inventories as a way of enhancing their
performance. The most common types of technologies being applied in management of
inventories by businesses include barcode technology, Radio Frequency Identification
(RFID), Distribution Requirement planning (DRP), Automated Inventory tracking system
(AITS), the Just-in-Time System, Automatic Identification (Auto ID), vendor managed
inventory (VMI) systems (Raviv & Kolka, 2013).
Inventories comprise stocks of raw materials, work in progress, finished goods and supplies
held by a business organization to facilitate operations in the production process (Buxey,
2006). Inventory management is concerned with maintaining stock levels of a given group
of items with the aim of minimizing the inventory handling and ordering costs consistent
with other relevant targets and objectives set by management (Obura, 2015). They
represent those items which are either accumulated for sale or they are in the process of
manufacturing or in the form of materials, which are yet to be utilized (Stevenson, 2010).
Inventories make up an important part of a manufacturing firm’s production process as
they facilitate continued production. The manner in which inventories are managed affects
the performance of an organization because it contributes to the cost of production which
later affects profitability. In order to manage inventories efficiently and optimize
organization performance, organizations normally have an inventory management system
which monitors the flow of inventories so as to ensure that there is neither oversupply nor
undersupply in the production process of a manufacturing firm.
2
Etim, John and Ime (2014) established that inventory management practices can improve
the operational performance of a firm through efficiency in capital utilization, increased
service level, and reduced lead time and that firms that implement inventory management
models are able to handle material shortages, product stock outs, and component pile up.
But this study did not research on how inventory management practices impacts on firm’s
productivity. While Brealy, Myers and Marcus (2007) state that there are prerequisite for
production, inventories can be expensive to store as they tie up capital. Inventory
management therefore calls for tradeoff between these costs and benefits. The cost of
holding inventory includes not only the opportunity cost but also the storage and insurance
costs, and the risk of spoilage or obsolescence. All these carrying costs encourage firms to
hold current assets to the minimum. Inventory mismanagement will adversely affect an
organization’s operations by arresting financial resources that could have been channeled
to other profitable sectors and/or activities.
Several studies have been conducted on inventory management and organizational
performance. For instance, Nsikan, Etim and Imec (2015) examined inventory
management practices and operational performance of flour milling firms in Lagos,
Nigeria. The findings indicated that most of the medium-sized flour milling firms adopted
different inventory management strategies from the scientific models with the exception of
the large manufacturing companies. The inventory management strategies and policies
adopted by the flour milling firms were based on factors such as prevailing industry
practices, changing level of customer demand, forecast estimates and guesses, and
available production capacity. Adeyemi and Salami (2010) identified several inventory
management best practices including: just in time, vendor managed inventory,
collaborative planning, forecasting and replenishment, automatic replenishment, agile
system, and material requirement planning.
According to Koumanakos (2008), the tradeoff between ordering costs and holding costs
characterizes the transactions approach to inventory management represented by the
Economic order quantity EOQ models of inventory. In another study, Lwiki, Ojera,
Mugenda and Wachira (2013) examined the impact of inventory management practices on

3
financial performance of sugar manufacturing firms in Kenya. The results indicate that
there exists a positive correlation between inventory management and Return on Sales.
Mukopi and Iravo (2015) conducted an analysis of the effects of inventory management on
the performance of the procurement function of sugar manufacturing companies in the
Western Kenya Sugar Belt. The findings show a strong relationship between the four
variables; lean inventory systems, strategic supplier partnerships, information technology,
legal policies and the effect of inventory management on performance of the procurement
function of sugar manufacturing companies in the western sugar belt.
As seen from the above discussions, the existing studies have concentrated on inventory
management and organization performance from other economies. For those conducted in
Kenya, they concentrated mainly on sugar firms whose operating environment cannot be
compared with the chemicals manufacturing firms. This study therefore sought to provide
in-depth information on the relationship of inventory management practices among
chemical manufacturing firms in Kenya using a case of Henkel Chemicals.
1.1 Inventory Management Practices
Organization’s inventory is an important component and its management is vital to the
success and expenditure reduction of a firm. Consequently, other operational costs may
increase inventory management costs like through the balance of ordering costs, holding
costs, safety stock and stock outs (Palevich, 2012) and (Leong,Wisner & Tan, 2011). Once
an organization realizes this, it can develop online inventory management tool that
monitors its inventory information by breaking it down into groups by correlating the
categories with its customers.
Wild (2004) recommends, proper warehousing of inventory so that when goods are
ordered, they are held at the warehouse for the least time possible minimizing holding cost
of inventory. Bacchetti, Plebani, Saccani and Syntetos (2010) argue that inventory
management needs to be organized in a logical way to facilitate the organization knowledge
of when to order and quantity to order. Economic order quantity enables organizations plan
their inventory replenishment on a timely basis such as monthly, quarterly, half yearly or
yearly basis.

4
Just-in-Time (JIT) is a philosophy of manufacturing based on planned elimination of all
waste and continuous improvement of productivity. Just-in-time (JIT) contributes greatly
to an organization’s positive performance and customer satisfaction. JIT production
according to Eckert (2007) is making what the customer needs, when it is needed and in
the quantity needed using the minimum resources of people, material, and machinery. The
primary elements of JIT include having only the required inventory when needed; to
improve quality to zero defects; to reduce lead time by reducing set-up times, queue lengths
and lot sizes; and to accomplish these things at minimum cost. In order to achieve this, the
process must have signals of what is going on everywhere within that process. JIT
emphasizes that production should create items that arrive when needed, neither earlier nor
later. Quick communication of the consumption of old stock, which triggers new stock to
be ordered, is key to JIT and inventory reduction. Keeping moderate inventory is good and
it enables an organization operate minimal expenses of holding and setup costs, eliminate
unwanted lead time and produce goods as per customers order. This saves up warehouse
space and costs.
Some organizations have resorted to vendor managed inventory (VMI) systems which aid
the supplier to monitor customer’s inventory usage. Vendor-managed Inventory (VMI) is
a practice in which inventory replacement decisions are centralized with upstream
manufacturers or distributors (Frahm, 2003). It is a new feature of supplier partnership in
which emphasis is on good working relations and communication between customers and
suppliers. Through this VMI system, customers will avoid stock outs because the suppliers
will have already replenished their inventory. The manufacturer enters into a collaborative
or partnership agreement with the distributor, under which the latter agrees to stock a
specified range of items and meet specified service levels. In return, the customer
undertakes to buy the specified items solely from the distributor and no longer keeps the
items in stock. It enhances working capital due to the elimination of the need for customers
to reorder, reduce or exclude inventory and obviate stock outs. It relieves the customer of
much of the expense of ordering, shipping the materials, counting inventory and stocking
low-value items. By passing these costs normally managed by the customer on the supplier,
the customer is able to reduce the overall cost of product and increase on margins. There’s

5
also reduced lead times with enhanced sales and a reduction of lost sales due to stock outs
(Irungu & Wanjau, 2011).
Forecasting and replenishment helps to develop free flowing order fulfillment and delivery
systems, so that pipeline inventories can be substantially reduced (Baily, Farmer, Barry,
Jessop & David, 2008). According Lysons and Farrington (2006), influential thinkers in
supply chain management have suggested that inventory is waste and should be avoided
wherever possible. The reasons behind this view are stocks of material can adversely
impact any organization because they tie up capital. However they did not clarify the
solution to excess inventory held by business firm. It is also argued that stocks are
frequently held for wrong reasons sometimes to mask inefficiencies in the management of
organization (Rushton, Croucher & Baker, 2011)
1.1.2 Financial Performance
Organizational performance refers to how well an organization meets its financial goals
and market criteria (Li, Rao, Ragu-Nathan & Ragu-Nathan, 2005). Organizational
performance is how well an organization achieves its market oriented goals as well as the
financial goals. Maduenyi, Oke, Fadeyi and Ajagbe (2015) define organizational
performance as a set of financial and nonfinancial indicators which offer information on
the degree of achievement of objectives and results). Organizational performance concerns
both effectiveness and efficiency; the quality and quantity of work (Olumuyiwa, Adelaja
& Chukwuemeka, 2012). The relevant items adapted to measure organizational
performance includes higher sales, higher accuracy in costing, and improved coordination
between departments, improved coordination with suppliers, and improved coordination
with customers. Any organizational initiative, including supply chain management should
ultimately lead to enhanced organizational performance (Maduenyi et al., 2015).
Organization performance is measured in different ways depending on the purpose of
measurement. Kaplan and Norton (2004) classify organization performance into financial
and non-financial using the Balanced Scorecard. Demirbag, Koh, Tatoglu and Zaim (2006)
also note that organizational performance can be measured from both financial and non-
financial criteria. The measures of financial goals include profit, return on investment, sales
6
growth, business performance, and organization effectiveness. On the other hand, the
measures of non-financial criteria are innovation performance and market share (Demirbag
et al., 2006), quality improvement, innovativeness and resource planning. Most
organizations view their performance in terms of "effectiveness" in achieving their
mission, purpose or goals (Koh, Nam, Prybutok & Lee, 2007). Performance is a summary
measure of the quantity and quality of work done, with resource utilization taken into
account. It can be measured at the individual, group, or organizations level. Performance
may be expressed as success into dimensions of organizations productivity, effectiveness
and efficiency (Olumuyiwa et al., 2012). To define the concept of performance is necessary
to know its elements characteristic to each area of responsibility. Organizational
performance could also refer to any job related activities expected of a worker and how
well those activities are executed. This study applied financial performance measures that
are derived from the recorded profitability.
1.1.3 Manufacturing firms in Kenya
The manufacturing is very important sector in Kenya as it makes a substantial contribution
to the country’s economic development. The sector is one of the key economic pillars in
the vision 2030 geared to make the nation a middle level income country by the year 2030.
Kenya has a large manufacturing firm serving both the local market and exports to the East
African region and the rest of the world. Manufacturing firms in Kenya are characterized
by elongated or overextended chains of retailers which, in turn, mean long chains of
transactions between chain members and consumers (Amoro, 2011). World firm (2007)
showed that leading manufacturing firms in Kenya are faced with problems of wrong
forecasting due to lack of enough inventory management information
According Kenya Association of Manufactures (KAM, 2014) there are 700 registered
manufacturing firms in Kenya. Some of the most common manufacturing industries in
Kenya include small-scale consumer goods (plastic, furniture, batteries, textiles, clothing,
soap, cigarettes and flour), agricultural products, horticultural products, oil refining,
aluminum and steel industries, lead industries and cement industries. Manufacturing is one
of the key sectors expected to deliver the economic growth rate per annum for Kenya, by
increasing and sustaining its contribution to Gross Domestic Product (GDP). The sector

7
also supports the country’s social development agenda through creation of jobs, poverty
alleviation, and generation of foreign exchange and attraction of local and foreign
investment.
1.1.4 The Agrochemical industry in Kenya
The agrochemical industry in Kenya is controlled by the government through the Pest
Control Products Board (PCPB). The industry is valued at a rough estimate of 80m USD
at cost insurance and Freight value because majority of their chemicals used in the
production of their products are imported (Croplife Kenya 2010 ). The industry is inhabited
by big multinational Research and Development companies like Syngenta, Bayer, Dow
Agroscience, Monsanto and Dupont. The multinationals control about 60 – 70 % of the
total global market (Croplife, 2009). These companies heavily rely on global sourcing and
supply chain management for their input which means that they have to have a strong
inventory management practice to ensure that they do not overstock nor they experience
shortages as it may take long for the supply to arrive for continued production. The
inventory management practices need to be appropriate in order for them to achieve
reductions in costs and thus meet market demand.
1.2 Statement of the Problem
Inventories occupy the most strategic position in the structure of working capital of most
firms and enterprises (Ndunge, 2013). Good inventory management in any manufacturing
organization saves the organization from poor quality production, disappointment of
seasoned customers, loss of profit and good social responsibility. One of the key factors
for the success of a firm is effective flow management in supply chains. The biggest
challenge in managing inventory is to balance the supply of inventory with demand. A firm
would ideally want to have enough inventories to satisfy the demands of its customers and
avoid lost sales due to inventory stock-outs. Also, the firm does not want to have too much
inventory staying on hand because of the cost of carrying inventory. Enough but not too
much is the ultimate objective (Coyle & Bardi, 2003)
A good inventory control system is attained in balancing the two objectives to a firms’
optimum advantage. Eshun (2014) point out that despite the benefits of inventory

8
management, organizations have continuously ignored the potential savings from proper
inventory management and end up having more funds invested in inventory than necessary.
They are therefore not able to meet customer demands because of poor distribution of
investment among inventory items hence the basis of this study. In majority of
manufacturing industries, inventory constitutes the most significant part of current assets
(Songet, 2006). Manufacturing firms attain significant savings from effective inventory
management which amounts between 50% - 60% of total costs. A potential 6% saving on
total cost through effective inventory management is achievable. In this view, the study
wishes to assess the effect of inventory management practices on the performance of
manufacturing firms in Kenya.
A number of studies have been carried out in this area. Globally, Bai and Zhong (2008)
studied on improving inventory management in small business in Sweden Koumanakos
(2008) studied the effect of inventory management on firm performance in manufacturing
firms in Greece. Regionally, Asare and Prempeh (2016) studied the impact of efficient
inventory management on profitability in selected manufacturing firms in Ghana.
Augustine and Agu (2013) examined the effect of Inventory Management on
organizational effectiveness in Nigeria.
Locally, Ndunge (2013) examined inventory management and productivity of large
manufacturing firms. Mwangi (2013) examined inventory management and supply chain
performance of non-governmental organizations in the agricultural sector. This study
therefore sought to answer the following research question: what is the relationship
between inventory management practices and financial performance of manufacturing
firms in Kenya?
1.3 Objectives of the Study
1.3.1 General Objective
The general objective of this study was to assess the relationship between inventory
management practices and financial performance of manufacturing firms in Kenya using a
case of agro-chemical firms
9
1.3.2 Specific Objectives
The study was guided by the following specific research objectives
i. To determine the effects of net transactions approach to inventory management on
financial performance of manufacturing agrochemical firms in Kenya.
ii. To establish the effects of the Just in Time (JIT) on financial performance of
manufacturing agrochemical firms in Kenya
iii. To establish the effects of Vendor Managed Inventory(VMI) on financial
performance of manufacturing agrochemical firms in Kenya
iv. To determine the influence of forecasting and replenishment on financial
performance of manufacturing agrochemical firms in Kenya
1.4 Research Questions
i. What is the effect of net transactions approach to inventory management on
financial performance of manufacturing agrochemical firms in Kenya?
ii. How does the Just in Time (JIT) affect financial performance of manufacturing
agrochemical firms in Kenya?
iii. What is the effect of vendor managed inventory on financial performance of
manufacturing agrochemical firms in Kenya?
iv. How does forecasting and replenishment influence financial performance of
manufacturing agrochemical firms in Kenya?
1.5 Significance of the Study
The study would be beneficial to manufacturing firms as it would provide information that
will help in understanding inventory management practices, their mode of application and
their practical relevance in the firm. The top management of manufacturing firms in Kenya
would rely on the findings of the study in establishment of sound inventory management
practices geared towards improvement in financial performance. The findings of the study
would provide a framework for top management of manufacturing firms to make good and
wise decisions concerning inventory management practices.
10
Policy makers would be guided in formulating appropriate policies to will regulate the
industry. Some of the policy makers include relevant regulatory bodies like the Kenya
Association of Manufacturers a lobby group of manufacturing firms in Kenya. In
formulation of policies, the study would offer meaningful findings especially in regard to
inventories, replenishment and ordering that maximizes revenues.
Future scholars and academicians would also benefit since the study would form a basis
for further studies in the field of inventory management and performance of organizations,
especially in the manufacturing sector. They may find relevant information that may fit in
with their study of inventory management. The study would establish areas for further
research that would be of great help to these scholars.
1.6 Scope of the Study
The study was to be carried out in manufacturing companies in Kenya. The study was
carried out in July 2016 and the respondents included inventory managers, procurement
managers, procurement officers and the purchasing managers. It focused on the effects of
net the transactions approach, Just in Time (JIT) purchasing policy, Vendor Managed
Inventory (VMI), forecasting and replenishment on the performance of manufacturing
firms in Kenya.
1.7 Justification of the Study
The importance of Manufacturing Firms is now widely accepted in both developed and
developing economies. The inherent strength of Manufacturing Firms is to efficiently
manage their inventories to enhance their performance. Efficient management of
inventories in manufacturing firms shall minimize wastage and therefore increased
efficiency which leads to financial performance. This shall have a significant influence on
economic growth as indicated by job creation.
The study would not only be useful to manufacturing firms in Kenya. The findings of the
study would also be applicable across firms in different sectors of the economy that
accumulate inventories. Such companies would be in position to tailor manage their
inventories in line with the production/operation schedules and make targeted marketing
decisions that enhances profitability.

11
1.8 Limitations of the Study
The study anticipated that the managers and officers might be too busy to take part in the
study. This may be taken care of by using the ‘drop and pick later’ method to administer
the research instruments to enable the participants to fill them at their time. There study
would also experience difficulties when selecting a sample population form the entire
population
1.9 Assumptions
The study assumed that the respondents are knowledgeable about the inventory
management practices being carried out in the manufacturing companies and they clearly
understand the areas covered in the questionnaire well enough to provide relevant answers.
It also assumed that information given is correct devoid of any alterations.
1.10 Definition of Terms
Inventory: Assets that help an organization to facilitate operations in the production
process and include raw materials, work in progress, finished goods parts and components
(Axsäter, 2015).
Inventory Management Practices: Measures put in place to ensure adequate stock of raw
materials, work in progress, finished goods parts and components are in place to enhance
the operations of an organization (Barrett, 2015).
Financial Performance: A measure of the output of an organization versus the inputs. It
shows how resources of an organization including inventories have been utilized to by an
organization to create value for shareholders (Epstein, Buhovac & Yuthas, 2015).
Just in Time: Is a philosophy in management where production is in response to demand.
It is geared towards elimination of non value adding activities (Vokurka & Lummus, 2000).
Vendor Managed Inventories: Describes a situation where all decisions on inventories
for example replenishment are made by suppliers on behalf of the business (Stadtler, 2015).

12
Forecasting: Is predetermination of future status of an activity for enhanced decision
making especially planning (Box et al., 2015).
Replenishment: Refers to restocking or refilling of items that are out of stock in an
organization to facilitate normal operations (Taleizadeh et al., 2015).

13
CHAPTER TWO
LITERATURE REVIEW
2.1 Introduction
This chapter contained the theoretical review where theories explaining inventory
management were explained, the empirical review where previous studies carried out on
the topic were looked at and the conceptual framework stating the independent and the
dependent variables.
2.2 Theoretical Review
2.2.1 Inventory Control Theory
Zappone (2014) stated that managing all kinds of assets in an organization can be viewed
as an inventory problem. For the large companies they use a variety of inventory control
theories and mathematical formulas to help them optimize the production and storage of
many thousands of units of products and to help them minimize costs. At the same time
the small-business owners can use ideas from several inventory control methods to manage
their production and storage based on their cost-containment and customer service needs.
Any inventory manager’s goal within an organization is to minimize cost and maximize
profit while satisfying customer’s demands. Too much inventory consumes physical space,
creates a financial burden, and increases the possibility of damage, spoilage and loss
(Zappone, 2014) further explains that excessive inventory frequently compensates for
sloppy and inefficient management, poor forecasting, haphazard scheduling, and
inadequate attention to process and procedures. Too little inventory often disrupts
manufacturing operations, and increases the likelihood of poor customer service. In many
cases good customers may become dissatisfied and take their business elsewhere if the
desired product is not immediately available. Companies with very high inventory ratios
have more possibilities to be bad financial performers. Shah and Shin (2007), reported a
strong negative relationship between the cash conversion cycle and corporate profitability
for a large sample of public American firms.

14
Firms with abnormally high inventories have abnormally poor stock returns, firms with
abnormally low inventories have ordinary stock returns while firms with slightly lower
than average inventories perform best over time. Shah and Shin (2007) also stated that
reducing inventories has a significant and direct relationship with a firm’s financial and
operational performance.
2.2.2 Lean Theory
Lean theory is an extension of ideas of Just-in-Time. The theory eliminates buffer stock
and minimizes waste in production process (Green & Inman, 2005). Inventory leanness
positively affects the profitability of a business firm and is the best inventory control tool.
Firms that are leaner than industry average generally see positive returns to leanness
(Eroglu & Hofer, 2011). The theory elaborates on how manufacturers gain flexibility in
their ordering decisions, reduce the stocks of inventory held on site and eliminate inventory
carrying costs. Scholarly studies indicate that companies successfully optimize inventory
through lean supply chains practices to achieve high levels of asset utilization and customer
satisfaction leading to improved growth, profitability and market share. Criticism leveled
against the theory is that it can only be applicable when there is a close and long-term
collaboration and sharing of information between a firm and its trading partners.
According to Trujillo-Barrera (2014) leanness involves five principles: value whereby
before business practices are changed it is first determined whether applying lean inventory
techniques will actually generate business value. The second principle involves flow where
to determine both your business value and the economic value you offer customers; you
must understand how inventory flows in your warehouse. The third principle involves pull
and it states that once you are fully aware of how your inventory flows and you’ve worked
to eliminate inventory waste, pulling inventory only when requested by your customer, will
become a natural outcome. The fourth principle is responsiveness and it involves a
continuous and rigorous evaluation of your inventory flow along with effective demand
management allows you to respond and adapt quickly to changes in the market. It will also
keep the inventory at appropriate levels, preventing unnecessary storage costs and obsolete
inventory. The last principle is perfection. It requires you to commit to a continuous
15
refinement of your inventory management processes; doing so will result in improved
quality, cycle time, efficiency and cost.
2.2.3 Theory of Constraints
This is a management philosophy that seeks to increase manufacturing through identifying
the limiting factors constraining the process and systematically improving that constraint
until it is no longer the limiting factor. Some of the limiting factors that may exist in the
manufacturing process include: very long lead times, large number of unfulfilled orders,
high level of unnecessary inventories or lack of relevant inventories, wrong materials order,
large number of emergency orders and expedition levels, lack of customers engagement,
absence of control related to priority orders which implies on schedule conflicts of the
resources (Boyd & Gupta, 2004). The theory emphasizes focus on effectively managing
the capacity and capability of these constraints to improve productivity and this can be
achieved by manufacturing firms applying appropriate inventory control practices. Theory
of constraints is a methodology whose basis is applied to production for the minimization
of the inventory (Cooper & Ellram, 1993).
2.3 Empirical Review
2.3.1 Effects of Net Transactions Approach on Financial Performance
Net transactions approach also referred to as net change is a form of material requirements
planning. This approach main concern is planning for all the resources that the organization
needs to run its operations and hence improve its performance. Labadi and Chen (2010) in
a journal on modeling, analysis and optimization of supply chains by using Petri net
models: the state-of-the-art. They found out that this approach offers the user the ability to
re-plan at high frequency, or continuously in a transaction-driven system. The net change
approach calls for partial explosion and will relate only to those items affected by a change
since the last explosion. The approach is transaction-driven rather that time-driven and is
often processed daily or in some situations on a real-time. With net change the planned
orders and their associated requirements are not erased but will be rebalanced if a
transaction has affected the inventory, bills of material or requirements. Net change has the
advantage of being more responsive to change, being continually up to date and evening
16
out the work load due to less output per run (Labadi & Chen, 2010). The study however
did not clearly outline the methodologies, neither are the objectives made clear. The current
study examined how net transaction approach affected performance.
Atali, Lee and Özer, (2009) in the study ‘If the inventory manager knew: Value of visibility
and RFID under imperfect inventory information’ state that netting inventory transactions
is an extremely important since the warehouse staff uses it to continually update the
accuracy of its inventory records. Inventory record accuracy is needed to ensure that
replacement items are ordered in a timely manner, that inventory is properly valued, and
that parts are available for sale or production when needed. Netting inventory transactions
is also needed to ensure that the actual and recorded inventory amounts are the same at the
end of the year, so that there will be no issues when the inventory is audited. Reconciling
inventory transactions is not as simple as adjusting the book balance to match the physical
count. There may be other reasons why there is a difference between the two numbers that
cannot be corrected with such an adjustment (Atali, Lee & Özer, 2009). It is not clear
whether net transaction was one of the objectives of the study by Atali, Lee and Özer,
(2009), as objective of the study have not been explicitly stated.
According to Reinhard (2015) netting all available inventory transactions helps firms to
identify transaction errors, uncover irregularities, provides added comfort that the
transactions are recorded correctly and also assists in monitoring all the transactions of a
business. This approach is very crucial as managing inventory transactions is made easier
and more focus put to achieving the organizational goals and objectives.
Nebart (2010) examined the management of inventories in Kenya with a case of a case of
the horticultural industry. The study objective was to determine the various inventory
management practices used by in the Kenyan horticultural industry. The study used
questionnaires as the preferred data collection tool. These questionnaires had both closed
and open ended questions. The study findings revealed that horticultural firms adopt
various inventory management practices so as enhance performance. The study was done
in horticultural sector, but the current study was done in manufacturing firms.
17
Thige (2010) studied netting as an inventory management practice as adopted by MFI`s in
Kenya. The researcher established that a majority of the studied MFI`s manage inventories
through various strategies for instance netting. Avutswa (2009) in a study of exporting
horticultural firms concluded that the studied horticultural firms adopt netting so as to
effectively manage their inventories and therefore performance. The adoption of netting
was found to be effective against inventory management. This study was conducted in
financial sector, which forms the larger service sector. Need a similar study in
manufacturing sector.
2.3.2 Effects of Just in Time (JIT) Purchasing Policy on Financial Performance
JIT is a system that enables companies to produce products in required amounts and just
when demanded. Implementation of JIT in a company will lead to cost reductions in the
production system. In fact, a JIT production system is very effective in eliminating mainly
non value-added activities and thus, non-value added costs. The non-value-added activities
are the activities such as moving materials and parts from one place to another; setting up
a machine; storing materials, parts and finished goods; inspection, rework and purchasing.
These activities, although consume resources, do not add value to a product produced
(Dalci & Tanis, 2006).
In a JIT environment, products are produced only when they are demanded by the
customers. In this case, equipment only produce products when there is an actual demand
for them. At other times equipment are idle. In the JIT environment, the aim is to reduce
inventory, increase flexibility, and maximize customer satisfaction by reducing lead-time
and increasing quality. Therefore, these (reduction in inventory, defect rates, lead and set
up times, increase in quality) will be the appropriate performance measures applicable in a
JIT environment. JIT manufacturing system is one of the tools that can be used to enhance
competitive advantage. The use of this new production system reduces inventory related
costs, increases quality, reduces lead-time, and reduces manufacturing costs by minimizing
non-value-added activities and their costs. All these represent the benefits offered by the
implementation of JIT production system. By reducing costs and reducing lead-time,
company’s response to customer needs increases (Inman, Sale, Green & Whitten, 2011).

18
Kamakia (2015) noted that the widespread adoption of just-in-time (JIT) inventory
principles undoubtedly makes production operations more efficient, cost effective and
customer responsive. Companies’ effectively implementing JIT principles have substantial
competitive advantages over competitors that have not. The trick is figuring out how to
apply JIT principles to gain competitive advantages in your specific industry and business
situation. The basic premise of JIT is to have just the right amount of inventory, whether
raw materials or finished goods, available to meet the demands of your production process
and the demands of your end customers. No more, nor less.
Dalci and Tanis (2006) explain that JIT aims at minimizing work-in-progress and finished
goods inventory, reducing lead time and increasing product quality. The Pull method is
used whereby goods are produced in each manufacturing stage only as they are needed. In
the pull system machine operators do not produce according to schedule or material
availability. Instead, production does not begin until goods are needed by the end customer.
When additional materials or supplies are needed for manufacturing, a message is sent to
the preceding work center immediately to send the amount of materials that will be needed.
The closer you get to operating JIT situation, the more responsive you are to your customers
– and the less capital you have tied up in raw materials and finished goods inventory. The
less you spend to store and carry inventory, the less obsolescence you have to write off,
and the better you can optimize your transportation and logistics operations. Ultimately,
this all translates into saving your company real money (Kamakia, 2015)
JIT production system causes some changes in the company implementing it. First of all,
JIT has emerged as an effective cost management tool because it helps to achieve
significant costs savings. In a JIT environment there is little or no work-in-process and
finished-goods inventories. Performance measures based on production efficiency should
be replaced by measures based on lead-time reduction, setup reduction, increased quality
and others that help the JIT system to function in the best way (Dalci & Tanis, 2006).
The effects of JIT can be summarized as: Funds that were tied up in inventories can be
used elsewhere; areas previously used to store inventories can be used for other more
productive uses; throughput time is reduced, resulting in greater potential output and

19
quicker response to customers and defect rates are reduced, resulting in less waste and
greater customer satisfaction.
2.3.3 Effects of Vendor Managed Inventory (VMI) on Financial Performance
Vendor Managed Inventory (VMI) which can also be referred to as Supplier Managed
Inventory (SMI) or direct replenishment can be defined as a means of optimizing supply
chain performance in which the supplier has access to the customer’s inventory data and is
responsible for maintaining inventory level required by the customer (Shafie, 2004). In a
VMI partnership, the supplier makes the inventory replenishment decision for the firms.
This means that the supplier will monitor firm’s inventory level (physically or via
Electronic Data Processing – EDP) and make periodic re-supply decision, on behalf of the
firm, such as order quantities, shipping mode and timing. A company also relinquishes
control of its re-supply decision and also transfers financial responsibility for the inventory
to the supplier (Kemunto, 2014).
Increased complexity and highly integrated supply chain in current business environment
has increased pressure for companies to adapt to current competitive pressure. One of the
supply chain tools in addressing these issues is by implementing Vendor Managed
Inventory (VMI). Under the VMI arrangement, supplier takes on the responsibility of
managing the firm’s inventory, which normally includes monitoring, planning and directly
replenish inventory at firms’ warehouse, for all the products that it supplies. From the
operational perspective, under the VMI strategy, suppliers are responsible for firms’
inventory control (Disney & Towill, 2003). The supplier normally receives actual data on
firm’s inventory, sales of goods and demand forecasting based on electronic data
interchanges from the firm. Based on this data and information, supplier will determine the
maximum and minimum limits of inventory that should be at the firm’s site or firm’s
warehouse at any point of time. Most of the time, this limit will be stated in VMI agreement
signed by both parties. The firms will not pay for the goods that were shipped by supplier
until the goods were sold to the customer. Under the VMI arrangement, it is the supplier
who determines when stocks are to be replenished and in what quantities, instead of
passively responding to orders placed by the firm. This arrangement is usually guided by a
contract, which specifies the financial terms, inventory constraints and performance target
20
and expectation such as service measures, firm’s and supplier liability and duration of the
program.
The main problems faced by manufacturer are long lead-time in sourcing material from
international material supplier or producer and also high variability of incoming order from
the customer. From customer perspectives, the key issues are high stocks and often delay
in replenishment or delivery from manufacturer (Rajagopalan, Lawrence &
Krishnadevarajan, 2007). Implementing VMI will enable customer and manufacturer to
close this gap. The customer can ensure it will not be short of any parts that is required for
its operations, while at the same time allow the reduction in inventory level, which will
lead to better cash management. The benefit of the reduced delivery and administration
costs, then, is transferred to the end-consumer.
Eventually, both manufacturer and customer have secured competitive advantage through
the introduction of VMI Strategic partnership, however, is able to mitigate the above
problem and ensure smooth operational performance (Waller, Johnson & Davis, 1999).
Quite a number of researches have been conducted to explain how important demand
sharing is in ensuring the effectiveness of supply chain management. VMI embodies with
some basic understanding between the firms and the supplier. In VMI, the firm will transfer
its inventory planning to the supplier while at the same time, the supplier will take
ownership managing firm inventory and ensure that firm is able to deliver all that is
required to its end-customer. With demand uncertainties from end-customer, shortening
product life cycle and increasing request for product customization, making strategic
partnership is far more important (Tyan & Wee, 2003).
From operational perspective, using VMI, firms are relieved from the burden to specify,
place and monitor purchase order to the supplier while at the same time focus on meeting
all end-customer requirement and deliver fullest service level to the end-customer. VMI,
from the supplier point of view, could benefit a firm from reducing forecast uncertainties
by the firms, reducing logistic costs, reducing overall lead-times, improving service level
and reduction of transportation costs (Yao, Evers & Dresner, 2007). Several case studies
have indicated that the benefit of VMI in the area of planning and inventory control can be

21
quite significant. Kaipia, Holmstrom and Tanskanen (2002) demonstrated that VMI has
enabled a substantial inventory reduction as well as changing production style from make
to stock to make to order production. Through VMI, the supplier can make replenishment
decisions according to operating needs and also highlighting of trends in demand. The firm
will gain benefit from lower cycle stocks, not just low end–of-month inventories intended
to increase firm performance. VMI also helps to make the administration of the delivery
process more efficient.
VMI practices enables manufactures or distributors to eliminate the need for customers to
reorder, reduce or exclude inventory and obviate stock outs. It relieves the customer of
much of the expense of ordering, shipping the materials, counting inventory and stocking
low-value items. By passing these costs normally managed by the customer on the supplier,
the customer is able to reduce the overall cost of product and increase on margins
(Rajagopalan, et al., 2007). There’s also reduced lead times with enhanced sales and a
reduction of lost sales due to stock outs (Irungu & Wanjau, 2011).
2.3.4 Influence of Forecasting and Replenishment on Financial Performance
Forecasting is a central piece of the operations of a modern firm. It is a decision making
tool which considers different factors and justifies decisions. The main idea is to make the
prediction and estimations of the future demand and consequently determinate the potential
markets for the product or services for the following period (Sundberg, 2009). It is
important to understand what happens in the environment as well as know about the
company’s own activities (Sundberg, 2009). A demand forecast states the needed inventory
that helps to overcome the fluctuations in demand. According to the information, a firm
can start to plan its upcoming activities in a way that they can most efficiently transform
their inputs into outputs.
Additionally, a forecasting enables a corporation to provide its customer higher value. It
distributes the operations the information including the needed products and stock keeping
units (SKU), their quantities and the facilities required to fulfill the future needs. This way,
the firm can gain better profit as forecast offers them a chance to lower their costs.
According to Sundberg (2009) forecasting creates a data bank that helps decision makers
22
settle targets, create plans and demonstrate the changes in environment. Moreover, it guides
a firm to act in the best possible way to increase the efficiency without decreasing the
service value offered to the customers (Plinere & Borisov, 2015).
According to Hennel (2016) manufacturers may not be able to predict the future with 100%
accuracy, but they need to get as close to perfect as possible if they want to ensure the right
amount of inventory and production rates at all times. Manufacturers can use planning
applications and statistical forecasting engines that leverage all of their operational data to
better accommodate seasonal demand, product hierarchies, product promotions, slow-
moving items, causal variables and outliers.
Replenishment also known as reordering is filling again by supplying what has been used
up. Chandrika (2015) established that (inventory) replenishment is an operation that
consists in making the stock full again in order to avoid stock-out. Replenishment is
typically initiated by a backorder passed to a supplier or to a manufacturer. According to
Sundberg (2009) replenishment is the movement of inventory from upstream or reserve
product storage locations to downstream or primary storage, picking and shipment
locations. Min, Zhou, Liu and Wang (2012) stated that some of the replenishment
challenges for manufacturing industries may include variability of supplier lead times,
maintenance of safety stock, maximum/minimum order level quantities, excess stock level,
stock outs and stock obsolescence. These can be countered by replenishment tactics to
increase profits and performance. They include; know when to order more inventories;
know exactly how much inventory to order and monitor and measure vendor performance:
use multi-location inventory redistribution.
The purpose of replenishment is to keep inventory flowing through the supply chain by
maintaining efficient order and line item fill rates. The process helps prevent costly
inventory overstocking. Sehgal (2008) stated that the steps to be followed in the process
include defining the review period for reordering and an ordering quantity. Next are the
inventory parameters to determine whether an order for replenishment should be placed at
the time of review or not. Reviews either be continuous (done continuously as soon as
stocks fall below a predetermined level) or periodic (done when stocks fall below at a

23
predetermined level at a certain set frequency). Based on how the review period and order
quantities are defined, there are a few options to drive the reordering.
Automation of replenishment is also getting very popular to manufacturers. Chandrika
(2015) identified that in order to increase productivity; most inventory management
systems implement replenishment rules to automate operations to some extent.
Replenishment is typically triggered when the inventory level hits the reorder point also
known as reorder trigger level, a setting from the system. Chandrika (2015) further added
that forecasts are implicitly defined through replenishment rules. Indeed, defining a reorder
point is roughly equivalent to producing a demand forecast. From the reorder point it is
possible to some extent to compute the underlying implicit demand forecast. Forecasting
comes into play within the replenishment rules.
2.3.5 Inventory Management and Financial Performance
Singhal (2005) studied the effect of excess inventory on long term organizational
performance. Singhal found evidence suggesting that stock market partially anticipates
excess inventory situations and that firm do not recover quickly from negative effects of
excess inventory. He further noted that the negative effect of excess inventory is
economically and statistically significant. Agus and Noor (2006) examined the relationship
between inventory management practices and financial performance. The study measured
the manager’s perceptions of inventory and supply chain management practices and the
level of performance in the industry. The findings suggest that inventory management
practices have significant correlations with profitability and return on sales (ROS) which
enormously contribute to organizational performance.
Augustine, Trenkel, Wood and Lorance (2013) reports on investigation of the impact of
proper inventory management on organizational performances. The study suggests a link
between inventory management and productivity and concludes that highly positive
correction between good inventory management and organizational cost reduction.
However, he noted that management should closely monitor and manipulate inventory
system to maintain production consistency for organizational productivity.

24
Eckert (2007) examined inventory management and role it plays in improving customer
satisfaction. He found a positive relationship between customer satisfaction and supplier
partnerships. Koumanakos (2008) studied the effect of inventory management on firm
performance. The findings suggested that the higher the level of inventories preserved by
a firm, the lower the rate of return. Despite all these studies that have been done, little
attempt has been made to find out about the impact of inventory management practices on
a firm’s financial performance. This study therefore sought to investigate the impact of
inventory
2.4 Conceptual framework
Figure 2. 1: Conceptual Framework
Source: Author (2016)
Net transactions approach
Reconciling of transactions
Transaction monitoring made easier
Error identification and adjustment
Just-in-Time approach
Production on demand
Eliminate non-value added costs
Increased quality
Vendor-Managed-Inventory
Firm relieves inventory burden to
supplier
Efficient delivery process
Improved service level
Forecasting and replenishment
Cost reductions
Higher value for customers
Future demands are cared for
Financial
Performance
Organization profits
(Return on Asset)
Independent variables
Dependent variable

25
2.5 Hypothesis of the study
H01: Net transactions approach as an inventory management practice has a significant
effect on performance of manufacturing firms in Kenya.
H02: Just-in-Time (JIT) purchasing policy as an inventory management practice has a
significant effect on performance of manufacturing firms in Kenya.
H03: Vendor Managed Inventory (VMI) as an inventory management practice has a
significant effect on performance of manufacturing firms in Kenya.
H04: Forecasting and replenishment as inventory management practices have a significant
effect on performance of manufacturing firms in Kenya.
2.6 Operationalization
Table 2.1: Operationalization
Objective Variable
Type
Indicators Type of data
analysis
To determine the effects of
net transactions approach to
inventory management on
performance of
manufacturing firms in
Kenya.
Independent Reconciling of
transactions
Transaction
monitoring made easier
Error identification and
adjustment
Ordinal
Nominal
Regression
To establish the effects of the
Just in Time (JIT) purchasing
policy on performance of
manufacturing firms in
Kenya.
Independent Production on demand
Eliminate non-value
added costs
Increased quality
Ordinal
Nominal
Regression
To establish the effects of
vendor managed inventory on
performance of
manufacturing firms in
Kenya
Independent Firm relieves inventory
burden to supplier
Efficient delivery
process
Improved service level
Ordinal
Nominal
Regression
To determine the influence of
forecasting and
replenishment on
performance of
manufacturing firms in
Kenya
Independent Cost reductions
Higher value for
customers
Future demands are
cared for
Ordinal
Nominal
Regression
Financial Performance Dependent Organization profits
(Return on Assets)
Ordinal
Nominal
Regression

26
2.7 Summary
Chapter two looked at the theoretical framework of the study and the empirical literature
covering the four independent variables (net the transactions approach, Just-in-Time,
Vendor Managed Inventory and Forecasting & Replenishment). It also covered the
conceptual framework, hypothesis and operationalization of the study.

27
CHAPTER THREE
RESEARCH METHODOLOGY
3.1 Introduction
In this chapter, the researcher discussed the intended research design, target population,
sampling technique and sampling size, data collection, data analysis and the ethical
considerations for the study.
3.2 Research Design
The study adopted a descriptive survey design and focused on manufacturing firms in
Kenya. A descriptive research design determines and reports the way things are (Mugenda
& Mugenda, 2003). Maxwell (2012) observed that a descriptive research design is used
when data is collected to describe persons, organizations, settings or phenomena. The
design also has enough provision for protection of bias and maximized reliability
(Creswell, 2012).
Descriptive research design was used because it appropriately enabled the researcher to
describe how inventory management practices affected financial performance of
manufacturing firms in Kenya using a case of agro-chemical firms. In this, the specific
objective of the study would have been achieved. The design also helped the researcher to
collect quantitative data that was analyzed to establish relationship between inventory
management practices and financial performance of manufacturing firms in Kenya using a
case of agro-chemical firms.
3.3 Target Population
The target population is a group of elements to which the researcher wants to make
inference to make conclusion on characteristic of the whole population (Mugenda &
Mugenda, 2003). The target population of this study was 65 Agro-chemicals in Kenya. The
respondents included operation managers, procurement managers, procurement officers
and stores managers

28
Table 3.1: Target Population
Target Group Target Population
Procurement managers 130
Operation managers 130
Stores managers 65
Total 325
3.4 Sample Size and Sampling procedures
Sampling technique involve the procedures applied to get the representative sample from
the target population (Mugenda & Mugenda, 2003). The study adapted purposive sampling
technique. In purposive sampling the person who is selecting the sample tries to make the
sample representative, depending on his opinion or purpose of the study (Barreiro &
Albandoz, 2001). This study employed a survey of all the 65 existing firms. The study will
target the procurement managers, operations managers and stores managers at the agro-
chemical firms. 30% of the target population was sampled to get 98 respondents for the
study.
Table 3. 2: Sample Size
Target Group Target Population Proportion of
population
Sample
Size
Procurement
managers
130 30% 39
Operation managers 130 30% 39
Stores managers 65 30% 20
Total 325 98
3.5 Instrumentation
The study collected data from the respondents by the use of the questionnaire. The
questionnaire was structured and divided into sections covering each of the objectives of
the study. According to Nichols, Mitchell, Nichols, Chalmers and Begley (2013) they
observed that, a questionnaire is simply a tool for collecting and recording information
about a particular issue of interest to an individual. It is mainly made up of a list of
questions, having clear instructions and space for answering the questions. The structured
questions were used in an effort to conserve time and to facilitate easier analysis as they
are in immediate usable form. This would help in easy data analysis.

29
3.5.1 Validity and Reliability of Instruments
Validity is the accuracy and meaningfulness of inferences based on the research results. It
is the degree to which results obtained from the analysis of the data actually represent the
phenomenon under study. Kothari (2004) states that validity indicates the degree to which
an instrument measures what it is supposed to measure, that is the extent to which
differences found with a measuring instrument reflect true differences among those being
tested. To enhance validity of the instruments, the questionnaire was reviewed by the
supervisor to find out whether the questions achieved the research objectives and answer
the research questions.
According to O'Connor and Kleyner (2011) reliability is defined as a measure of how
consistent a research method is. A pilot study was conducted which allowed for pre-testing
of the research instruments for reliability. 10 respondents were used to test the validity and
reliability of the research instrument –the question; they were in the light industries of the
manufacturing sector. After pre-testing the questionnaire any inconsistencies in the
instrument are corrected.
3.6 Data Collection Procedure
Questionnaires were administered to the respondents at the agro-chemical firms and the
researcher applied the ‘drop and pick later' technique since they are expected to be busy
and the researcher gave them one week to fill the questionnaire before coming to collect it.
The researcher did follow up by telephone.
3.7 Diagnostic Tests
The study used the F Statistic to determine the validity of the regression model adopted.
This statistic was compared to the F Critical value where the regression model would be
referred to as valid if F Statistic is greater than F Critical. Otherwise, the conclusion made
will be that the model is invalid. This was based from the results in ANOVA Table.
3.8 Data Analysis and Presentation
Before the collected data is processed, data preparation was done on the completed
questionnaires by editing, coding, entering and cleaning the data. This would help in
checking for completion and accuracy of the responses. Data was analyzed using

30
descriptive statistics and multiple regression analysis with the help of SPSS and MS
EXCEL.
Regression analysis was used to test for the relationship between the independent variable
(Net transactions approach; Just-in-Time approach; Vendor-Managed-Inventory and
Forecasting and replenishment) and the dependent variable (Performance)
The multiple regression model was as follows:
Y= a1 + β1X1+β2X2+β3X3 + β4X4 + ε
Where Y= Performance
a1 = Constant
β1, β2, β3 and β4 are Coefficients of the determinants of the relationship between inventory
management practices and performance of manufacturing firms in Kenya using a case of
agro-chemical firms
ε = error term
X1= Net transactions approach
X2= Just-in-Time approach
X3= Vendor-Managed-Inventory
X4 = Forecasting and replenishment
The findings from the analysis were presented in charts, pie charts, figures, graphs and
tables.

31
CHAPTER FOUR
DATA ANALYSIS AND PRESENTATION
4.1 Introduction
This chapter presented results of data analysis from the collected data from the field,
presentation as well as interpretation of findings. The purpose of the study was to analyse
the relationship between inventory management practices and financial performance of
manufacturing firms in Kenya: case of Agrochemical firms. The research data was
collected using a questionnaire. Data was analyzed using SPSS version 22.0. The
presentation of research findings was be carried out by use of frequency tables.
4.1.1 Response Rate
The target population of this study was the 65 Agro-chemicals in Kenya. Out of the 325
questionnaires distributed, a total of 247 filled questionnaires were collected by the
researcher and used for analysis. This translated to a response rate of 76%. The response
rate conforms to stipulations by Mugenda (1999), that a response rate of 50% is adequate
for analysis and reporting; a rate of 60% is good and a response rate of 70% and above is
excellent for analysis. The response rate is as illustrated in Table 4.1
Table 4. 1: Response Rate
4.2 General Information
General information about the respondents was collected during the study and this section
sought to present the demographics of the respondents relevant to this study. This includes
their gender, level of education, years worked at the Agro-chemicals manufacturing
industry in Kenya and position held at the company.
4.2.1 Gender of the Respondents
The study sought to establish the number of men and women working at Agrochemical
Firms. The findings of the study are as indicated in Table 4.2
Response Rate Frequency Percentage
Response 247 76
Non Response 78 24
Total 325 100

32
Table 4. 2: Gender of Respondents
Gender Frequency Percentage
Male 133 53.8
Female 114 46.2
Total 247 100.0
From Table 4.2, the study found that 53.8% of the respondents were male and 46.2% were
female. The finding indicates that males form the largest number of workers at
Agrochemical Firms in comparison to females. Therefore, measures should be put in place
to attract more female workers.
4.2.2 Level of Education
The highest level of education attained by the respondents was also sought by the study.
The findings are presented in Table 4.3
Table 4. 3: Level of Education
Level of Education Frequency Percent
Certificate 26 10.5
Diploma 60 24.3
Degree 132 53.4
Masters 27 10.9
PhD 2 .8
Total 247 100.0
The findings from Table 4.2 show that majority of the respondents had obtained a degree
as shown by 53.4%, 24.3% of the respondents had a diploma, 10.9% of the respondents
had a Masters Degree, certificate holders composed of 10.5% of the respondents while only
0.8% of the respondents had a PhD.
4.2.3 Number of Years Worked
The study sought to determine the number of years the respondents had worked at
Agrochemical Firms. The findings are shown in Table 4.4

33
Table 4. 4: Number of Years Worked
The study established that majority of the workers had worked between 3-6 years as shown
with 49%, 22.7% of the respondents had worked between 6-9 years at 22.7%, 23.5% of the
respondents had worked between 1-3 years and 4.9% has worked for more than 10 years
at 4.9%. Therefore were aware of inventory management practices and financial
performance of manufacturing firms.
4.2.3 Position Held at the Company
The study sought to determine the positions of the respondents in Agrochemical Firms.
The findings are shown in Table 4.4
Table 4. 5: Position Held
Position Held Frequency Percentage
Procurement managers 70 28.3
Operations Manager 86 34.8
Stores Managers 91 36.8
Total 247 100.0
The findings indicate that 36.8% of the respondents are store managers, 34.8% of the
respondents are operations managers 34.8% and 28.3% are procurement managers. The
findings indicate that the study involved participants from across all the fields.
4.3 Effects of Net Transactions Approach on Financial Performance
Several statements net transactions approach and its effect on inventory management were
asked and respondents required to rate the extent of agreement with the following statement
on its applicability in agrochemical firms. Using the Likert scale of 1-5 where 1= strongly
disagree, 2= Disagree, 3= Neither Agree nor Disagree, 4=Agree and 5=Strongly Agree.
The findings are as shown in Table 4.6
Number of years worked Frequency Percent
1-3 years 58 23.5
3-6 years 121 49.0
6-9 years 56 22.7
Above 10 years 12 4.9
Total 247 100.0

34
Table 4. 6: Effects of Net Transactions Approach on Financial Performance
Effects of Net Transactions Approach on Financial
Performance
Mean Std. Dev
Net transactions approach’s main concern is planning for all the
resources that the organization needs to run its operations and
hence improve its performance
4.1336 .60011
Net transactions is a transaction-driven system which leads to
higher performance 4.4615 .50760
The ability to re-plan improves performance of agrochemical
firms 3.3482 .65660
Netting all inventory transactions helps firms to identify
transaction errors thus high performance is guaranteed 3.768 .7871
Orders are not erased and in case of changes, the inventory can
be rebalanced leading to high performance 4.0732 .81986
transactions ensures that the actual and recorded inventory
amounts are the same improving performance 3.9838 1.05525
Uncover irregularities ensuring high performance of the
agrochemical firm. 3.5870 1.03177
Ensures transactions are recorded correctly leading to high
performance 4.0243 1.14383
Managing inventory transactions leads to high performance
through achieving organizational goals 3.7368 .70967
Extent does net transactions approach affect the inventory
management performance 4.0243 1.14383
The respondents agreed that net transactions approach’s main concern is planning for all
the resources that the organization needs to run its operations and hence improve its
performance with mean of 4.1336 and std. deviation of 0.60011. On whether a Net
transaction is a transaction-driven system which leads to higher performance the
respondents agreed with a mean of 4.4615 and std. deviation of 0.50760. On whether the
ability to re-plan improves performance of agrochemical firms the respondents neither
agreed nor disagreed had a mean of 3.3482 and standard deviation of 0.65660.
Netting all inventory transactions helps firms to identify transaction errors thus high
performance is guaranteed had a mean of 3.768 and standard deviation of .7871. Orders
are not erased and in case of changes, the inventory can be rebalanced leading to high
performance had a mean of 4.0732 and standard deviation of .8198. Transactions ensure
that the actual and recorded inventory amounts are the same improving performance had a
mean of 3.9838 and standard deviation of 1.05525. Uncover irregularities ensuring high

35
performance of the agrochemical firm had a mean of 3.5870 and standard deviation of
1.03177. Ensures transactions are recorded correctly leading to high performance with
mean of 4.0243 and standard deviation of 1.14383. Managing inventory transactions leads
to high performance through achieving organizational goals had a mean of 3.7368 and
standard deviation of .70967. The Extent net transactions approach affects the inventory
management performance had a mean of 4.0405 and standard deviation of 1.12906.
These findings concur with that of Reinhard (2015) netting all available inventory
transactions helps firms to identify transaction errors, uncover irregularities, provides
added comfort that the transactions are recorded correctly and also assists in monitoring all
the transactions of a business.
4.4 Effects of Just in Time (JIT) Purchasing Policy on Financial Performance
Several statements on Just in Time (JIT) purchasing policy and its effect on inventory
management performance were asked and the Rate the extent of agreement with the
following statement. Use the Likert scale of 1-5 where 1= strongly disagree, 2= Disagree,
3= Neither Agree nor Disagree, 4=Agree and 5=Strongly Agree. The results are shown in
Table 4.7
Table 4. 7: Just In Time (JIT) Purchasing Policy and Financial Performance
Statements on Just In Time (JIT) Purchasing Policy Mean Std. Dev
Enables companies to produce products in required amounts and
just when demanded. 3.6154 .82260
Implementation of JIT in a company leads to cost reductions 3.4089 .84992
JIT reduces inventory leading to higher productivity 3.5385 .75273
Maximizes customer satisfaction by increasing quality of
products at the agrochemical firms 3.6073 .76750
Increases flexibility in production 3.6356 .74136
Manufacturing system is a tool that our agrochemical firms use
to enhance competitive advantage. 3.8381 .99495
Basic premise of JIT is having just the right amount of inventory 3.5668 .83288
Pull method is used whereby goods are produced in each
manufacturing stage only as they are needed 3.4534 .77358
Uses performance measures based on lead-time reduction to
enhance its productivity 3.5061 .82576
Our firm uses set-up reduction measures for performance 3.5547 .79381
Performance measures is based increased quality 3.5506 .74112
Our firm effects it by releasing held-up funds, space and time 3.6397 .72955
Extent that just in time (JIT) purchasing policy affect inventory
management performance 3.6842 .70816

36
The study established that JIT enables companies to produce products in required amounts
and just when demanded with a mean of 3.6154 and std. deviation of 0.82260.
Implementation of JIT in a company leads to cost reductions in the production system had
a mean of 3.4089 and standard deviation of 0.84992. The study found that JIT reduces
inventory leading to higher productivity in the agrochemical firms with a mean of 3.5385
and standard deviation of 0.75273. Maximizes Customer Satisfaction by increasing quality
of products at the Agrochemical Firms had a mean of 3.6073 and standard deviation of
0.76750.
The respondents agreed that increases flexibility in production thus improving the
performance of the agrochemical firm had a mean of 3.6356 and standard deviation of
.74136. Manufacturing System is a tool that our agrochemical firm use to enhance
competitive advantage had a mean of 3.8826 and standard deviation of 0.83288. Basic
Premise of JIT is having just the right amount of inventory i.e. raw materials or finished
goods had a mean of 3.5668 and standard deviation of 0.83288.
Pull method is used whereby goods are produced in each manufacturing stage only as they
are needed had a mean of 3.4534 and standard deviation of 0.77358. Uses performance
measures based on lead-time reduction to enhance its productivity had a mean of 3.5061
and standard deviation of 0.82576. Firm uses set-up reduction measures for performance
had a mean of 3.5547 and standard deviation of 0.79381. A performance measure in our
agrochemical firm is based increased quality 3.5506 and standard deviation of 0.74112.
Our firm affects it by releasing held-up funds, space and time leading to increased output
had a mean of 3.6397 and standard deviation of 0.72955. The extent to which just in time
(JIT) purchasing policy affect inventory management performance was found to have a
mean of 3.6842 and standard deviation of 0.70816.
The findings are in agreement with that of Kamakia (2015) who noted that Companies’
effectively implementing JIT principles have substantial competitive advantages over
competitors that have not. The trick is figuring out how to apply JIT principles to gain
competitive advantages in your specific industry and business situation.

37
4.5 Effects of Vendor Managed Inventory (VMI) on Financial Performance
Several statements vendor managed inventory (VMI) and its effect on performance of
inventory management. Rate of extent of respondent’s agreement to the statement using
the Likert scale of 1-5 where 1= strongly disagree, 2= Disagree, 3= Neither Agree nor
Disagree, 4=Agree and 5=Strongly Agree. The findings were shown in Table 4.8
Table 4. 8: Vendor Managed Inventory (VMI) on Financial Performance
Vendor Managed Inventory (VMI) on
Financial Performance
Mean Std. Dev
Vendor management optimizes supply
chain leading to high performance 3.9960 .72973
Suppliers have access to customer’s
inventory data 3.8300 .76737
The supplier monitors agrochemical firm’s
inventory level for re-supply aiming at
improving performance
3.6073 .84321
Decisions on re-supply are made on behalf
of the agrochemical firm to improve its
production lead time
3.6194 .78146
The supplier determines the maximum or
minimum limits of inventory that should be
at the firm’s site for effective performance
3.9150 .89537
VMI is guided by a contracts that guide the
inventory of the agrochemical firm aimed
at improving its performance
3.6559 .97478
VMI clears inventory constraints to meet
performance target and expectations. 3.5466 .79433
Implementing VMI enable customer
reduce high stocks 3.6680 .81843
Financial terms are clearly stated in
contracts to enhance productivity of the
agrochemical firm
3.6073 .75683
Implementing VMI leads to high
variability of incoming order from the
customer
3.5749 .89344
VMI practices enables manufactures to
reduce or exclude inventory leading to
higher performance
3.3927 .72389
VMI practices enables agrochemical firms
to obviate stock outs hence higher
productivity
3.4858 .79044

38
what extent does vendor managed
inventory (VMI) influence the
performance of inventory management
3.5425 .76324
From Table 4.8, Vendor management at agrochemical firm optimizes supply chain leading
to high performance had a mean of 3.9960 and standard deviation of 0.72973. The supplier
determines the maximum or minimum limits of inventory that should be at the firm’s site
for effective performance had a mean of 3.8300 and standard deviation of 0.76737. The
supplier monitors agrochemical firm’s inventory level for re-supply aiming at improving
performance had a mean of 3.6073 and standard deviation of 0.84321. Decisions on re-
supply are made on behalf of the agrochemical firm to improve its production lead time
had a mean of 3.6194 and standard deviation of 0.78146. The supplier determines the
maximum or minimum limits of inventory that should be at the firm’s site for effective
performance and had a mean of 3.9150 and standard deviation of 0.89537.
VMI is guided by a contract that guide the inventory of the agrochemical firm aimed at
improving its performance had a mean of 3.6559 and standard deviation of 0.97478. VMI
clears inventory constraints to meet performance target and expectations had a mean of
3.5466 and standard deviation of 0.79433. Implementing VMI will enable customer reduce
high stocks leading to higher performance with better production levels had a mean of
3.6680 and standard deviation of 0.81843. The Financial terms are clearly stated in
contracts to enhance productivity of the agrochemical firm and had a mean of 3.6073 and
standard deviation of 0.75683. Implementing VMI leads to high variability of incoming
order from the customer had a mean of 3.5749 and standard deviation of 0.89344.
VMI practices enables manufactures to reduce or exclude inventory leading to higher
performance had a mean of 3.3927 and standard deviation of 0.72389. VMI practices
enable agrochemical firms to obviate stock outs hence higher productivity had a mean of
3.4858 and standard deviation of 0.79044. It was found that vendor managed inventory
(VMI) influence the performance of inventory management with a mean of 3.5425 and
standard deviation of 0.76324.
The findings are in agreement with those of (Rajagopalan et al., 2007 ) VMI practices
enables manufactures or distributors to eliminate the need for customers to reorder, reduce

39
or exclude inventory and obviate stock outs. It relieves the customer of much of the expense
of ordering, shipping the materials, counting inventory and stocking low-value items
4.6 Influence of Forecasting and Replenishment on Financial Performance
Several statements on forecasting and replenishment and how it impacts the performance
of inventory management were asked. Rate of extent of respondent’s agreement with the
following statement using the Likert scale of 1-5 where 1= strongly disagree, 2= Disagree,
3= Neither Agree nor Disagree, 4=Agree and 5=Strongly Agree. The findings are as
indicated in Table 4.9
Table 4. 9: Influence of Forecasting and Replenishment on Financial Performance
Influence of Forecasting and Replenishment on Financial
Performance
Mean Std. Dev
Forecasting makes prediction of the future demand ensuring performance
is high in our agrochemical firm 3.4130 .84555
Forecasting estimates markets for agrochemical firm products so that
performance is enhanced 3.5709 .75037
A demand forecast states the needed inventory that helps to overcome the
fluctuations in demand for our firm 3.4656 .76365
Forecasting enables our firm to provide its customer higher value by
increasing our efficiency 3.5263 .70877
Forecasting creates a data bank that helps decision makers in our firm to
create plans to meet targets through improve performance 3.5587 .77800
Forecasting demonstrates the changes in environment to improve
performance in our firm 3.8259 .78996
Use of statistical forecasting engines by our firm helps it make predictions
while improve firms’ performance 3.6113 .87580
Our firm uses inventory replenishment in operation to enhance our
performance 3.5425 .77905
Frequent replenishment at our agrochemical firm reduces stock
obsolescence hence improves performance 3.5182 .75350
Our agrochemical firm maintains efficient order to improve organizational
performance 3.4656 .79495
Our firm uses automation in replenishment process to increase our
productivity 3.5506 .73561
what extent does forecasting and replenishment influence the inventory
management performance 3.5304 .75310

40
From table 4.9, it was agreed that Forecasting makes prediction of the future demand
ensuring performance is high in our agrochemical firm with a mean of 3.4130 and standard
deviation of 0.84555. Forecasting estimates markets for agrochemical firm products so that
performance is enhanced had a mean of 3.5709 and standard deviation of 0.75037.
A demand forecast states the needed inventory that helps to overcome the fluctuations in
demand for our firm had a mean of 3.4656 and standard deviation of 0. 76365. Forecasting
enables our firm to provide its customer higher value by increasing our efficiency had a
mean of 3.5263 and standard deviation of 0.70877. Forecasting creates a data bank that
helps decision makers in our firm to create plans to meet targets through improve
performance had a mean of 3.4656 and standard deviation of 0.76365.
Forecasting demonstrates the changes in environment to improve performance in our firm
had a mean of 3.5263 and standard deviation of 0.70877. Forecasting enables our firm to
provide its customer higher value by increasing our efficiency had a mean of 3.5263 and
standard deviation of 0.70877. Forecasting creates a data bank that helps decision makers
in our firm to create plans to meet targets through improve performance had a mean of
3.5587 and standard deviation of 0.77800. Forecasting demonstrates the changes in
environment to improve performance in our firm had a mean of 3.8259 and standard
deviation of 0.78996.
Use of statistical forecasting engines by our firm helps it make predictions while improve
firms’ performance had a mean of 3.6113 and standard deviation of 0.87580. Our firm uses
inventory replenishment in operation to enhance our performance had a mean of 3.5425
and standard deviation of 0.77905. Frequent replenishment at our agrochemical firm
reduces stock obsolescence hence improves performance had a mean of 3.5182 and
standard deviation of 0.75350. The agrochemical firm maintains efficient order to improve
organizational performance had a mean of 3.4656 and standard deviation of 0.79495. The
firm use automation in replenishment process to increase our productivity had a mean of
3.5506 and standard deviation of 0.73561. The extent forecasting and replenishment
influence the inventory management performance was found to have a mean of 3.5304 and
standard deviation of 0.75310.

41
The results concur with Sehgal (2008) who stated that the steps to be followed in the
process include defining the review period for reordering and an ordering quantity.
Forecasting creates a data bank that helps decision makers settle targets, create plans and
demonstrate the changes in environment.
4.7 Effects of Financial Performance
Several statements on the financial performance of inventory management were
formulated. Rate of extent of respondent’s agreement with the following statement using
the Likert scale of 1-5 where 1= strongly disagree, 2= Disagree, 3= Neither Agree nor
Disagree, 4=Agree and 5=Strongly Agree. The findings are as indicated in Table 4.10
Table 4. 10: Effects of Financial Performance
Effects of Financial Performance Mean Std. Dev
ROE has improved due to inventory management 3.5466 .73588
Inventory management improves ROA 3.5182 .76421
After implementing inventory management practices profits have
increased 3.6316 .71985
Growth in sales has improved due to inventory management 3.6235 .75972
The performance of the business has improved 3.8907 .79646
The findings from Table 4.9 indicate that ROE had improved due to inventory management
had a mean of 3.5466 and standard deviation of 0.73588. Inventory management improved
ROA with a mean of 3.5182 and standard deviation of 0.76421. After implementing
inventory management practices profits have increased with a mean of 3.6316 and standard
deviation of 0.71985. Growth in sales has improved due to inventory management had a
mean of 3.6235 and standard deviation of 0.75972. Performance business had improved
with a mean of 3.8907 and standard deviation of 0.79646.
The study is in agreement with that of Augustine, Trenkel, Wood & Lorance (2013) re the
impact of proper inventory management on organizational performances. The study
suggests a link between inventory management and productivity and concludes that highly
positive correction between good inventory management and organizational cost reduction.
However, management should closely monitor and manipulate inventory system to
maintain production consistency for organizational productivity.

42
4.8 Diagnostic Tests
Before conducting regression analysis, the researcher carried out diagnostic tests to test the
suitability of the dataset for regressing. The specific tests conducted in this context
included; multicollinearity and normality. VIF was used to test for Multicollinearity,
Skewness and Kurtosis tested Normality.
4.8.1 Multicollinearity Test
Variance of Inflation Factor VIF was used to test for Multicollinearity. The findings are
indicated in Table 4.11.
Table 4. 11: Multicollinearity Test
Collinearity Statistics
Tolerance VIF
Net transactions .996 1.004
Just in time .933 1.072
Vendor-Managed-Inventory .918 1.090
Forecasting and
replenishment .969 1.032
As indicated in Table 4.11, Net transaction approach had VIF of 1.004; Just-in-Time had
1.072, Vendor Managed Inventory had 1.090 and Forecasting and replenishment had
1.032. As VIF lies between 1 and 10, this shows that there was no Multicollinearity in the
dataset.

43
4.8.2 Normality Test
Normality Test was done using Skewness and Kurtosis. The findings are indicated in Table
4.12.
Table 4.12: Normality Test
N Maximum Skewness Kurtosis
Statistic Statistic Statistic Std. Error Statistic Std. Error
Financial
performance 247 25.00 -.185 .155 .877 .309
Net transactions 246 47.00 -.661 .155 .399 .309
Just in time 247 60.00 .034 .155 1.045 .309
Vendor-Managed-
Inventory 247 65.00 .280 .155 .157 .309
Forecasting and
replenishment 247 53.00 .339 .155 .191 .309
From Table 4.12, financial performance had skewness of -0.185 and Kurtosis of 0.877, Net
transaction approach had -0.661 and 0.399, Just-in-Time had 0.034 and 1.045, Vendor
Managed Inventory had 0.280 and 0.157 while Forecasting and replenishment had 0.339
and 0.191 as Skewness and Kurtosis respectively. According to Kothari (2004) data
analysis proceeds if Kurtosis and Skewness are not greater than +/-2. In this context, the
data set was normally distributed and therefore suitable to regress.
4.9 Regression Analysis
A multiple linear regression analysis was conducted to investigate on the relationship
between the independent variables and customer satisfaction. The coefficient of
determination (R-Square) resulting from the linear regression was used to determine the
goodness of fit and R-square greater than 0.7 indicated a very good fit. P-values for the t-
test statistics were used to determine the significance of the independent variables in the
regression model. The findings are presented in subsequent sections.
Table 4.13: Model Summary
Model R R Square Adjusted R Square Std. Error of the
Estimate
.340a .116 .101 2.38171

44
The findings of the model summary indicate that the value of R is 0.116 R square is 0.116
and adjusted R square is 0.101. The findings indicate that 11.6% change in financial
performance is accounted for by the independent variable. The rest percent is explained by
the variables in the error term.
Table 4.14: ANOVA
Model Sum of Squares df Mean Square F Sig.
Regression 178.996 4 44.749 7.889 .000b
Residual 1367.085 241 5.673
Total 1546.081 245
The ANOVA results at 5% level of significance indicate that F calculated is 7.889 while F
critical is 2.4091. Since F calculated is greater than F Critical (7.889 > 2.4091), this
indicates that the overall model was significant.
Table 4.15: Regression Coefficients
Model Unstandardized Coefficients Standardized
Coefficients
t Sig.
B Std. Error Beta
(Constant) 11.167 2.660 4.198 .000
Net transactions -.002 .044 -.003 -.052 .958
Just in time -.028 .029 -.060 -.958 .339
Vendor-Managed-
Inventory .018 .034 .034 .530 .596
Forecasting and
replenishment .194 .036 .335 5.444 .000
The resultant equation becomes:
Y= 11.167 -0.002X1- 0.028X2 + 0.018X3 + 0.194 X4 + ε Where: X1= Net transactions
approach, X2= Just-in-Time approach, X3= Vendor-Managed-Inventory and X4 =
Forecasting and replenishment.
Therefore, when are held constant, performance would be at 11.167, a unit decrease in net
transactions approach would increase financial performance by 0.02, a unit decrease in JIT
holding other variable constant would decrease financial performance of agrochemical
firms by 0.028, a unit decrease in vendor managed inventor holding other variables
constant would increase financial performance by 0.018 and a unit increase in forecasting

45
and replenishment holding other variables constant would increase performance of
agrochemical firms by 0.194. The P- value of forecasting and replenishment 0.010 is less
than 0.05 and therefore there is statistically significant association with performance of the
Agrochemical firms. From the findings we therefore accept the hypothesis that Forecasting
and replenishment as inventory management practices have an effect on performance of
manufacturing firms in Kenya.
Based on the findings, study rejects hypotheses; H01, H02 and H03 and accepts hypothesis
H04 that forecasting and replenishment as inventory management practices have a
significant effect on performance of manufacturing firms in Kenya. According to
Chandrika (2015), in order to increase productivity; most inventory management systems
implement replenishment rules to automate operations to some extent.
It was surprising to note that net transactions approach, Just-in-Time (JIT) purchasing
policy and Vendor Managed Inventory (VMI) all had no significant effect on performance
of manufacturing firms. These findings contradicts with Dalci and Tanis (2006) who
explained that JIT aims at minimizing work-in-progress and finished goods inventory,
reducing lead time and increasing product quality. The findings further contradicts with
Kaipia, Holmstrom and Tanskanen (2002) who demonstrated that VMI has enabled a
substantial inventory reduction as well as changing production style from make to stock to
make to order production.

46
CHAPTER FIVE
SUMMARY, CONCLUSION AND RECOMMENDATIONS
5.1 Introduction
This chapter presents the summary of the results of the analyzed data on each variable of
the study. The chapter further presents the conclusion of the study in line with the
objectives. The chapter also presents recommendations of the study based on the findings
of the analyzed data. There is also a recommendation for further research that opens an
opportunity for future scholars and researcher to add more knowledge.
5.2 Summary of the Findings
This subsection presents a brief summary of the research findings on each variable of the
study.
5.2.1 Net Transactions Approach and Financial Performance
The respondents agreed that net transactions approach’s main concern is planning for all
the resources that the organization needs to run its operations and hence improve its
performance. On whether a Net transaction is a transaction-driven system which leads to
higher performance the respondents agreed .The ability to re-plan improves performance
of agrochemical firms the respondents neither agreed nor disagreed .Netting all inventory
transactions helps firms to identify transaction errors thus high performance is guaranteed.
Orders are not erased and in case of changes, the inventory can be rebalanced leading to
high performance.
Transactions ensured that the actual and recorded inventory amounts are the same
improving performance. The study found that the firms uncover irregularities ensuring high
performance of the agrochemical firm. The firms also ensured transactions are recorded
correctly leading to high performance. Managing inventory transactions leads to high
performance through achieving organizational goals. The net transactions approach affects
the inventory management performance to a moderate extent

47
5.2.2 Just in Time Purchasing Policy and Financial Performance
The study established that JIT enables companies to produce products in required amounts
and just when demanded. Implementation of JIT in a company leads to cost reductions in
the production system .The study found that JIT reduces inventory leading to higher
productivity in the agrochemical firms. JIT maximizes Customer Satisfaction by increasing
quality of products at the Agrochemical Firms. The respondents agreed that increases
flexibility in production thus improving the performance of the agrochemical firms.
Manufacturing System is a tool that agrochemical firms use to enhance competitive
advantage. Basic Premise of JIT is having just the right amount of inventory i.e. raw
materials or finished goods.
Pull method is used whereby goods are produced in each manufacturing stage only as they
are needed. The firms use performance measures based on lead-time reduction to enhance
its productivity. Firms use set-up reduction measures for performance had a performance
measure in our agrochemical firm is based increased quality. The findings showed that the
firm affects it by releasing held-up funds, space and time leading to increased output. The
just in time (JIT) purchasing policy affect inventory management performance to a
moderate extent.
5.2.3 Vendor Managed Inventory (VMI) and Financial Performance
Vendor management at agrochemical firm optimizes supply chain leading to high
performance and suppliers determine the maximum or minimum limits of inventory that
should be at the firm’s site for effective performance. The supplier monitors agrochemical
firm’s inventory level for re-supply aiming at improving performance. Decisions on re-
supply are made on behalf of the agrochemical firm to improve its production lead time.
The supplier determines the maximum or minimum limits of inventory that should be at
the firm’s site for effective performance.
VMI is guided by a contract that guide the inventory of the agrochemical firm aimed at
improving its performance it was also found that VMI clears inventory constraints to meet
performance target and expectations. Implementing VMI will enable customer reduce high
stocks leading to higher performance with better production levels. The Financial terms are

48
clearly stated in contracts to enhance productivity of the agrochemical firm and
implementing VMI leads to high variability of incoming order from the customer. VMI
practices enables manufactures to reduce or exclude inventory leading to higher
performance and also enable agrochemical firms to obviate stock outs hence higher
productivity. It was found that vendor managed inventory (VMI) influence the
performance of inventory.
5.2.4 Forecasting, Replenishment and Financial Performance
The findings showed that Forecasting makes prediction of the future demand ensuring
performance is high in agrochemical firms. Forecasting estimates markets for
agrochemical firm products so that performance is enhanced. A demand forecast states the
needed inventory that helps to overcome the fluctuations in demand for our firm.
Forecasting enables our firm to provide its customer higher value by increasing our
efficiency. It was also established that Forecasting creates a data bank that helps decision
makers in firms to create plans to meet targets through improve performance.
Forecasting demonstrates the changes in environment to improve performance in the
Agrochemical firms and that forecasting enable the agrochemical firms to provide its
customer higher value by increasing our efficiency. Forecasting creates a data bank that
helps decision makers in our firm to create plans to meet targets through improve
performance. Forecasting demonstrates the changes in environment to improve
performance.
Use of statistical forecasting engines by our firm helps it make predictions while improve
firms’ performance and that firms uses inventory replenishment in operation to enhance
performance. Frequent replenishment at agrochemical firm reduces stock obsolescence
hence improves performance .The agrochemical firm maintains efficient order to improve
organizational performance and the firm use automation in replenishment process to
increase our productivity. The forecasting and replenishment influence the inventory
management performance to a moderate extent.

49
5.2.5 Financial Performance
The study revealed that ROE had improved due to inventory management as the mean.
Furthermore, after implementing inventory management practices profits have increased.
It was also established that the growth in sales has improved due to inventory management
Moreover, performance business had improved as indicated.
5.3 Discussions
The study revealed that net transaction is a transaction-driven system which leads to higher
performance the respondents agreed with a mean of 4.4615 and standard deviation of
0.50760. Net transactions approach’s main concern is planning for all the resources that
the organization needs to run its operations and hence improve its performance with mean
of 4.1336 and std. deviation of 0.60011. The finding is in line with Labadi and Chen (2010)
who established that the main concern of netting is planning for all the resources that the
organization needs to run its operations and hence improve its performance.
From the findings, manufacturing system is a tool that our agrochemical firm use to
enhance competitive advantage had a mean of 3.8826 and standard deviation of 0.83288.
The finding concurs with Inman, Sale, Green and Whitten (2011) who held that JIT
manufacturing system is one of the tools that can be used to enhance competitive
advantage. JIT enables companies to produce products in required amounts and just when
demanded with a mean of 3.6154 and std. deviation of 0.82260. The observation was
echoed by Dalci and Tanis (2006) that JIT is a system that enables companies to produce
products in required amounts and just when demanded.
The findings of the study indicated that Vendor management at agrochemical firm
optimizes supply chain leading to high performance had a mean of 3.9960 and standard
deviation of 0.72973. According to Shafie (2004), Vendor Managed Inventory (VMI) can
be defined as a means of optimizing supply chain performance in which the supplier has
access to the customer’s inventory data and is responsible for maintaining inventory level
required by the customer.
50
From the findings, forecasting demonstrates the changes in environment to improve
performance in our firm had a mean of 3.8259 and standard deviation of 0.78996.
According to Sundberg (2009, it is important to understand what happens in the
environment as well as know about the company’s own activities. Use of statistical
forecasting engines by our firm helps it make predictions while improve firms’
performance had a mean of 3.6113 and standard deviation of 0.87580. In view of this
finding, Sundberg (2009) established that the main idea of forecasting is to make the
prediction and estimations of the future demand and consequently determinate the potential
markets for the product or services for the following period. Forecasting creates a data
bank that helps decision makers in our firm to create plans to meet targets through improve
performance had a mean of 3.5587 and standard deviation of 0.77800. This finding is in
line with to Sundberg (2009) that forecasting creates a data bank that helps decision makers
settle targets, create plans and demonstrate the changes in environment.
5.4 Conclusion
The study concludes that net transactions approach’s main concern is planning for all the
resources that the organization needs to run its operations and hence improve its
performance. Net transaction is a transaction-driven system which leads to higher
performance. Orders are not erased and in case of changes, the inventory can be rebalanced
leading to high performance. Net transactions also ensure transactions are recorded
correctly leading to high performance.
The study further concludes that implementation of JIT in a company leads to cost
reductions in the production system. JIT also reduces inventory leading to higher
productivity in the agrochemical. JIT further increases flexibility in production thus
improving the performance of the agrochemical firm. Firm uses set-up reduction measures
for performance. JIT affects the firm by releasing held-up funds, space and time leading to
increased output.
The study also concludes that VMI is guided by contracts that guide the inventory of the
agrochemical firm aimed at improving its performance. VMI practices enables
manufactures to reduce or exclude inventory leading to higher performance. VMI practices

51
enable agrochemical firms to obviate stock outs hence higher productivity. Furthermore,
vendor managed inventory (VMI) influence the performance of inventory management.
The study concludes that forecasting makes prediction of the future demand ensuring
performance is high in our agrochemical firm. Forecasting estimates markets for
agrochemical firm products so that performance is enhanced. A demand forecast states the
needed inventory that helps to overcome the fluctuations in demand for our firm.
Forecasting enables our firm to provide its customer higher value by increasing our
efficiency. Furthermore, agrochemical firm maintains efficient order to improve
organizational performance.
The study further concludes that ROE of agrochemical firms had improved due to
inventory. Furthermore, after implementing inventory management practices profits have
increased. Growth in sales has also improved due to inventory management. Performance
business has also improved due to inventory management practices.
5.5 Recommendations for the Study
The top management of all Manufacturing firms in Kenya should strengthen their abilities
of re-planning in order to improve performance. The accounting and procurement
departments of this agrochemical firms should ensure that the actual and recorded
inventory amounts are the same.
The top management of manufacturing firms in Kenya should adopt pull method whereby
goods are produced in each manufacturing stage only as they are needed. Just in Time
system of production should be adopted among all manufacturing firms in Kenya for cost
reductions in their production systems.
Vendor managed inventory systems should be adopted in order to enable manufactures to
reduce or exclude inventory leading to higher performance. VMI should also be adopted
among manufacturing firms in order to obviate stock outs hence higher productivity.
Forecasting should be geared towards making prediction of the future demand ensuring
that performance is high. All manufacturing firms should maintain efficient orders to
improve their organizational performance. Demand forecasts in all manufacturing firms in

52
Kenya should state the needed inventories that help to overcome fluctuations in demands.
Forecasting in manufacturing firms should also create data banks that help decision makers
to create plans to meet targets through improved performance.
5.6 Recommendations for Further Studies
This study on inventory management practices and financial performance of manufacturing
firms in Kenya was conducted in agrochemical industry. The study used primary data that
was gathered exclusively using a questionnaire. Future studies ought to be conducted to
cover other sectors like technology, insurance and banking. Future studies should also be
conducted using both primary and secondary data. There is also need to carry out future
studies by review of empirical studies.

53
REFERENCES
Adeyemi, S. L., & Salami, A. O. (2010). Inventory management: A tool of optimizing
resources in a manufacturing industry a case study of Coca-Cola Bottling
Company, Ilorin Plant. Journal of Social Sciences, 23(2), 135-142.
Agus, A., & Noor, Z. M. (2006). Supply chain management and performance. An
Empirical Study. A working paper university of Malaysia.
Amoro, D. N. (2015). The effect of macroeconomic factors and political events on the
performance of Nairobi Securities Exchange in Kenya (Doctoral
dissertation, University of Nairobi).
Inman, R. A., Sale, R. S., Green, K. W., & Whitten, D. (2011). Agile manufacturing:
relation to JIT, operational performance and firm performance. Journal of
Operations Management, 29(4), 343-355.
Raviv, T., & Kolka, O. (2013). Optimal inventory management of a bike-sharing
station. IIE Transactions, 45(10), 1077-1093.
Atali, A., Lee, H. L., & Özer, Ö. (2009). If the inventory manager knew: Value of
visibility and RFID under imperfect inventory information. Available at
SSRN 1351606.
Augustin, N. H., Trenkel, V. M., Wood, S. N., & Lorance, P. (2013). Space‐time
modelling of blue ling for fisheries stock management. Environmetrics,
24(2), 109-119.
Augustine, A. N., & Agu, O. A. Effects of Classical Management Theories on the
Current Management Practice in Nigeria.
Axsäter, S. (2015). Inventory control (Vol. 225). Springer.
Bacchetti, A., Plebani, R., Saccani, N., & Syntetos, A. (2010). Spare parts classification
and inventory management: a case study. Salford Business School Working
Papers Series, 408.
Bai, L., & Zhong, Y. (2008). Improving Inventory Management in Small Business: A
Case Study.
Baily, P., Farmer, D., Crocker, B., Jessop, D., & Jones, D. (2008). Procurement
principles and management. Pearson Education.
54
Barreiro, P. L., & Albandoz, J. P. (2001). Population and sample. Sampling techniques.
Management Mathematics for European Schools MaMaEusch (994342-
CP-1- 2001-1-DECOMENIUS-C21.
Barrett-Lennard, G. T. (2015). The relationship inventory. John Wiley & Sons Inc.
Box, G. E., Jenkins, G. M., Reinsel, G. C., & Ljung, G. M. (2015). Time series analysis:
forecasting and control. John Wiley & Sons.
Boyd, L., & Gupta, M. (2004). Constraints management: what is the theory? International
Journal of Operations & Production Management, 24(4), 350-371.
Brealey, R. A., Myers, S. C., & Marcus, A. J. (2007). Fundamentals of Corporate
Finance. McGraw-Hill.
Buxey, G. (2006). Reconstructing inventory management theory. International Journal of
Operations & Production Management, 26(9), 996-1012.
Chandrika, V. S. (2015). A Simulation Based Inventory Optimization Heuristic for a
Retail Supply Chain (Doctoral dissertation, University of Cincinnati).
Cooper, M. C., & Ellram, L. M. (1993). Characteristics of supply chain management and
the implications for purchasing and logistics strategy. The International
Journal of Logistics Management, 4(2), 13-24.
Coyle John, J., & Bardi Edward, J. (2003). Langley John Jr. The management of business
logistics. A supply chain perspective. South-Western devise of Thomson
Harming.
Creswell, J. W. (2012). Qualitative inquiry and research design: Choosing among five
approaches. Sage.
Dalci, I., & Tanis, V. N. (2006). The Effects of Just-In-Time Production Systems from
Cost and Management Accounting Perspective. Journal of Çukurova
University Institute of Social Sciences, 15(1), 109-124.
Demirbag, M., Lenny Koh, S. C., Tatoglu, E., & Zaim, S. (2006). TQM and market
orientation's impact on SMEs' performance. Industrial Management & Data
Systems, 106(8), 1206-1228.
Disney, S. M., & Towill, D. R. (2003). The effect of vendor managed inventory (VMI)
dynamics on the Bullwhip Effect in supply chains. International journal of
production economics, 85(2), 199-215.
55
Eckert, S. G. (2007). Inventory management and its effects on customer satisfaction.
Journal of Business and Public Policy (ISSN: 1936-9794), 1(3), 1.
Epstein, M. J., Buhovac, A. R., & Yuthas, K. (2015). Managing social, environmental and
financial performance simultaneously. Long range planning, 48(1), 35-45.
Eroglu, C., & Hofer, C. (2011). Lean, leaner, too lean? The inventory-performance link
revisited. Journal of Operations Management, 29(4), 356-369.
Eshun, E. V. (2014). Inventory control problem of a single warehouse and a multi-
retailer distribution system (a case of Chocho Industry) (Doctoral
dissertation).
Frahm, S. (2003). Vendor managed inventory (VMI): Three steps in making it work.
Retrieved May, 12, 2013.
Green, K. W., & Inman*, R. A. (2005). Using a just-in-time selling strategy to strengthen
supply chain linkages. International Journal of Production Research,
43(16), 3437-3453.
Irungu, B. K., & Wanjau, K. L. (2011). Effectiveness of vendor managed inventory
systems in retail supermarkets in Kenya. International journal of business
and public management, 1(1), 85-89.
John, N. E., Etim, J. J., & Ime, T. U. (2015). Inventory management practices and
operational performance of flour milling firms in Lagos, Nigeria.
International Journal of Supply and Operations Management, 1(4), 392-
406.
Kaipia, R., Holmström, J., & Tanskanen, K. (2002). VMI: What are you losing if you let
your customer place orders? Production Planning & Control, 13(1), 17-25.
Kamakia, C. W. (2015). Inventory management and supply chain performance of
petroleum marketing firms in Nairobi (Doctoral dissertation, University of
Nairobi).
Kavulya, J. M. (2004). Challenges in the provision of library services for distance
education: A case study of selected universities in Kenya. African Journal
of Library, Archives and Information Science, 14(1), 15-28.
Kemunto, R. S. (2014). Supply chain integration practices and organizational
performance of multinational firms in Kenya (Doctoral dissertation, School
of Business, University of Nairobi).
56
Koh, C. E., “Ted” Nam, K., Prybutok, V. R., & Lee, S. (2007). A value chain perspective
of internet practices, e-readiness and organizational performance: A
comparison of US and South Korean firms. Industrial Management &
Data Systems, 107(4), 519-536.
Kothari, C. R. (2004). Research methodology: Methods and techniques. New Age
International.
Koumanakos, D. P. (2008). The effect of inventory management on firm performance.
International journal of productivity and performance management, 57(5),
355- 369.
Labadi, K., & Chen, H. (2010). Modelling, analysis and optimisation of supply chains by
using Petri net models: the state-of-the-art. International Journal of
Business Performance and Supply Chain Modelling, 2(3-4), 188-215.
Leong, K., Wisner, J. D., & Tan, K. C. (2011). Joel D. Wisner, Principles of Supply
Chain Management: A Balanced Approach by G.
Li, S., Rao, S. S., Ragu-Nathan, T. S., & Ragu-Nathan, B. (2005). Development and
validation of a measurement instrument for studying supply chain
management practices. Journal of Operations Management, 23(6), 618-
641.
Lwiki, T., Ojera, B. P. Mugenda, N. G. and Wachira, V. K. (2013). The Impact of
Inventory Management Practices on Financial Performance of Sugar
Manufacturing Firms in Kenya. International Journal of Business,
Humanities and Technology, 3(5), 75-85
Lysons, K., & Farrington, B. (2006). Purchasing and supply chain management. Pearson
Education.
Maduenyi, S., Oke, A. O., Fadeyi, O., & Ajagbe, A. M. (2015). Impact of Organisational
Structure on Organisational Performance.
Maxwell, J. A. (2012). Qualitative research design: An interactive approach: An
interactive approach. Sage.
Min, J., Zhou, Y. W., Liu, G. Q., & Wang, S. D. (2012). An EPQ model for deteriorating
items with inventory-level-dependent demand and permissible delay in
payments. International Journal of Systems Science, 43(6), 1039-1053.
Mugenda, O., & Mugenda, A. (2003). Research Methods: Quantitative and
Qualitative methods. Nairobi, ACTs.

57
Mukopi,, M. C. P. and Iravo, M. A. (2015). An Analysis of the Effects of Inventory
Management on the Performance of the Procurement Function of Sugar
Manufacturing Companies in the Western Kenya Sugar, International
Journal of Scientific and Research Publications, 5(5),1-14
Munyao, G. Omulo, K. Mwithiga, M. and Chepkulei, H. (2015). Role of inventory
management practices on performance of production department’ a case
of manufacturing firms, International Journal of Economics, Commerce and
Management, 3(5), 1625-1656
Mwangi, A. G. (2013). Inventory Management and Supply Chain Performance Of
Non-Governmental Organizations In The Agricultural Sector, Kenya
(Doctoral
Ndunge, N. M. (2013). The relationship between inventory management and firm's
performance: the case of edible oil industry in Kenya (Doctoral
dissertation).
Nsiah A., E., & Prempeh, K. B. (2016). The State of Supply Chain Management
Practices within SMEs in Ghana: A Case Study of Selected Agrochemical
Companies in Kumasi.
Nsikan, E. J. Etimb, J. J. and Imec, T. U. (2015). Inventory management practices and
operational performance of flour milling firms in Lagos, Nigeria,
International Journal of Supply and Operations Management, 1(4), 392-406.
Obura, C. O. (2015). Influence of vendor managed inventory on organization
performance in a manufacturing industry: A case of Unilever Kenya
limited. International Journal of Social Sciences and Project Planning
Management, 1(4), 18-29.
O'Connor, P., & Kleyner, A. (2011). Practical reliability engineering. John Wiley & Sons.
Olumuyiwa, O. S. and Adelaja, A. S and chukwuemeka, E., O. (2012). Effective Planning
and Organizational Productivity. IOSR Journal of Humanities and Social
science (JHSS), 5(5), 2279-0837.
Palevich, R. (2012). The lean sustainable supply chain.
Plinere, D., & Borisov, A. (2015). Case Study on Inventory Management Improvement.
Information Technology and Management Science, 18(1), 91-96.
Rajagopalan, S., Lawrence, F. B., & Krishnadevarajan, P. (2007). Vendor managed
inventory best practices in a distribution environment. Review of the Electronic
& Industrial Distribution Industries, 6(1), 564-572.

58
Rushton, A., Croucher, P., & Baker, P. (2014). The handbook of logistics and distribution
management: Understanding the supply chain. Kogan Page Publishers.
Shafie, S. (2004). The Effectiveness of Vendor Managed Inventory (Vmi) Towards
Improving Supply Chain Management (Scm)-A Contract Manufacturer
Perspective (Doctoral dissertation, Universiti Sains Malaysia).
Shah, R., & Shin, H. (2007). Relationships among information technology, inventory, and
profitability: an investigation of level invariance using sector level data.
Journal of Operations Management, 25(4), 768-784.
Shardeo, V. (2015). Impact of Inventory Management on the Financial Performance of the
firm, Journal of Business and Management, 17(4), 1-12
Singhal, V. R. (2005). Excess inventory and long-term stock price performance. College
of Management, Georgia Institute of Technology.
Stadtler, H. (2015). Supply chain management: An overview. In Supply chain management
and advanced planning (pp. 3-28). Springer Berlin Heidelberg.
Sundberg, M. (2009). Essays on spatial economies and organization.
Taleizadeh, A. A., Kalantari, S. S., & Eduardo Cardenas-Barron, L. (2015). Determining
optimal price, replenishment lot size and number of shipments for an EPQ
model with rework and multiple shipments. Journal of Industrial and
Management Optimization, 11(4), 1059-1071.
Trujillo-Barrera, A. (2014). Essays on commodity price variability (Doctoral dissertation,
University of Illinois at Urbana-Champaign).
Tyan, J., & Wee, H. M. (2003). Vendor managed inventory: a survey of the Taiwanese
grocery industry. Journal of Purchasing and Supply Management, 9(1), 11-18.
Vokurka, R. J., & Lummus, R. R. (2000). The role of just-in-time in supply chain
management. The International Journal of Logistics Management, 11(1), 89-
98.
Wild, A. (2004). Improving inventory record accuracy: getting your stock information
right. Routledge.
Yao, Y., Evers, P. T., & Dresner, M. E. (2007). Supply chain integration in vendor managed
inventory. Decision support systems, 43(2), 663-674.
Zappone, J. A. I. M. E. (2014). Inventory theory. Retrieved on 11th July.

59
APPENDICES
Appendix I: QUESTIONNAIRE
This is a study on the seeking: INVENTORY MANAGEMENT PRACTICES AND
PERFORMANCE OF MANUFACTURING FIRMS IN KENYA: CASE OF
AGROCHEMICAL FIRMS
Kindly answer all questions by putting a tick (√) in the appropriate bracket
SECTION A: GENERAL INFORMATION
1. What is your gender?
Male [ ] Female [ ]
2. What is your highest level of education attained?
Certificate [ ] Diploma [ ]
Bachelor’s Degree [ ] Masters [ ]
PhD [ ]
3. How long have you been working in the Agro-chemicals in the manufacturing
industry in Kenya?
1-3 year [ ] 3-6 years [ ]
6-9 years [ ] Above 10 years [ ]
4. What is your position in this Agro-chemicals firm?
Procurement Managers [ ]
Operations Manager [ ]
Stores Managers [ ]
SECTION B NET TRANSACTIONS
5. Below are several statements net transactions approach and its effect on inventory
management. Rate your extent of agreement with the following statement on its
applicability in agrochemical firms. Use the Likert scale of 1-5 where 1= strongly
disagree, 2= Disagree, 3= Neither Agree nor Disagree, 4=Agree and 5=Strongly
Agree.
Statement 1 2 3 4 5

60
Net transactions approach’s main concern is planning for all the
resources that the organization needs to run its operations and
hence improve its performance
Net transactions is a transaction-driven system which leads to
higher performance
The ability to re-plan improves performance of agrochemical
firms
Netting all inventory transactions helps firms to identify
transaction errors thus high performance is guaranteed
Orders are not erased and in case of changes, the inventory can be
rebalanced leading to high performance
Netting inventory transactions ensures that the actual and recorded
inventory amounts are the same improving performance
Netting all inventory transactions uncover irregularities ensuring
high performance of the agrochemical firm.
Netting all inventory transactions at our agrochemical firm
ensures transactions are recorded correctly leading to high
performance
Netting approach is crucial to managing inventory transactions lea
high performance through achieving organizational goals
6. To what extent does net transactions approach affect the inventory management
performance?
Not at all [ ]
Little Extent [ ]
Moderate Extent [ ]
Large Extent [ ]
Very Large Extent [ ]
SECTION C: JUST IN TIME (JIT)
7. Below are several statements on just in time (JIT) purchasing policy and its effect on
inventory management performance. Rate your extent of agreement with the
following statement. Use the Likert scale of 1-5 where 1= strongly disagree, 2=
Disagree, 3= Neither Agree nor Disagree, 4=Agree and 5=Strongly Agree.
Statement 1 2 3 4 5
JIT enables companies to produce products in required amounts
and just when demanded.
Implementation of JIT in a company leads to cost reductions in
the production system
JIT reduces inventory leading to higher productivity in the
agrochemical firms
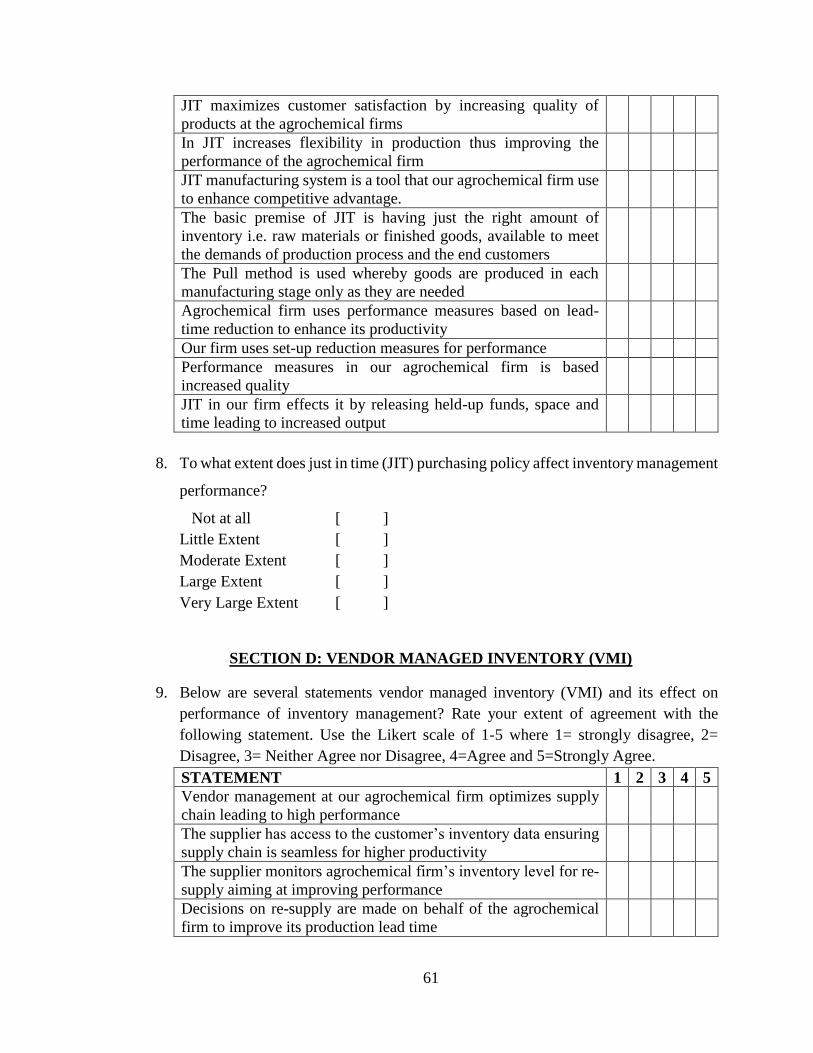
61
JIT maximizes customer satisfaction by increasing quality of
products at the agrochemical firms
In JIT increases flexibility in production thus improving the
performance of the agrochemical firm
JIT manufacturing system is a tool that our agrochemical firm use
to enhance competitive advantage.
The basic premise of JIT is having just the right amount of
inventory i.e. raw materials or finished goods, available to meet
the demands of production process and the end customers
The Pull method is used whereby goods are produced in each
manufacturing stage only as they are needed
Agrochemical firm uses performance measures based on lead-
time reduction to enhance its productivity
Our firm uses set-up reduction measures for performance
Performance measures in our agrochemical firm is based
increased quality
JIT in our firm effects it by releasing held-up funds, space and
time leading to increased output
8. To what extent does just in time (JIT) purchasing policy affect inventory management
performance?
Not at all [ ]
Little Extent [ ]
Moderate Extent [ ]
Large Extent [ ]
Very Large Extent [ ]
SECTION D: VENDOR MANAGED INVENTORY (VMI)
9. Below are several statements vendor managed inventory (VMI) and its effect on
performance of inventory management? Rate your extent of agreement with the
following statement. Use the Likert scale of 1-5 where 1= strongly disagree, 2=
Disagree, 3= Neither Agree nor Disagree, 4=Agree and 5=Strongly Agree.
STATEMENT 1 2 3 4 5
Vendor management at our agrochemical firm optimizes supply
chain leading to high performance
The supplier has access to the customer’s inventory data ensuring
supply chain is seamless for higher productivity
The supplier monitors agrochemical firm’s inventory level for re-
supply aiming at improving performance
Decisions on re-supply are made on behalf of the agrochemical
firm to improve its production lead time
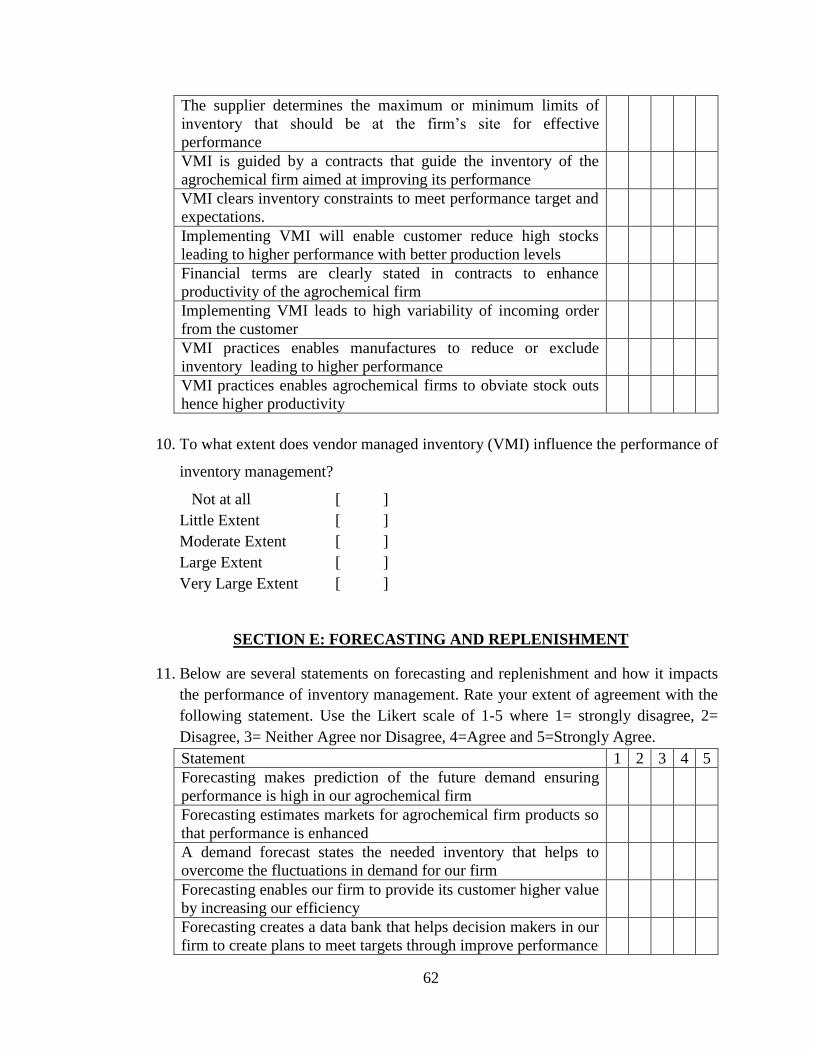
62
The supplier determines the maximum or minimum limits of
inventory that should be at the firm’s site for effective
performance
VMI is guided by a contracts that guide the inventory of the
agrochemical firm aimed at improving its performance
VMI clears inventory constraints to meet performance target and
expectations.
Implementing VMI will enable customer reduce high stocks
leading to higher performance with better production levels
Financial terms are clearly stated in contracts to enhance
productivity of the agrochemical firm
Implementing VMI leads to high variability of incoming order
from the customer
VMI practices enables manufactures to reduce or exclude
inventory leading to higher performance
VMI practices enables agrochemical firms to obviate stock outs
hence higher productivity
10. To what extent does vendor managed inventory (VMI) influence the performance of
inventory management?
Not at all [ ]
Little Extent [ ]
Moderate Extent [ ]
Large Extent [ ]
Very Large Extent [ ]
SECTION E: FORECASTING AND REPLENISHMENT
11. Below are several statements on forecasting and replenishment and how it impacts
the performance of inventory management. Rate your extent of agreement with the
following statement. Use the Likert scale of 1-5 where 1= strongly disagree, 2=
Disagree, 3= Neither Agree nor Disagree, 4=Agree and 5=Strongly Agree.
Statement 1 2 3 4 5
Forecasting makes prediction of the future demand ensuring
performance is high in our agrochemical firm
Forecasting estimates markets for agrochemical firm products so
that performance is enhanced
A demand forecast states the needed inventory that helps to
overcome the fluctuations in demand for our firm
Forecasting enables our firm to provide its customer higher value
by increasing our efficiency
Forecasting creates a data bank that helps decision makers in our
firm to create plans to meet targets through improve performance
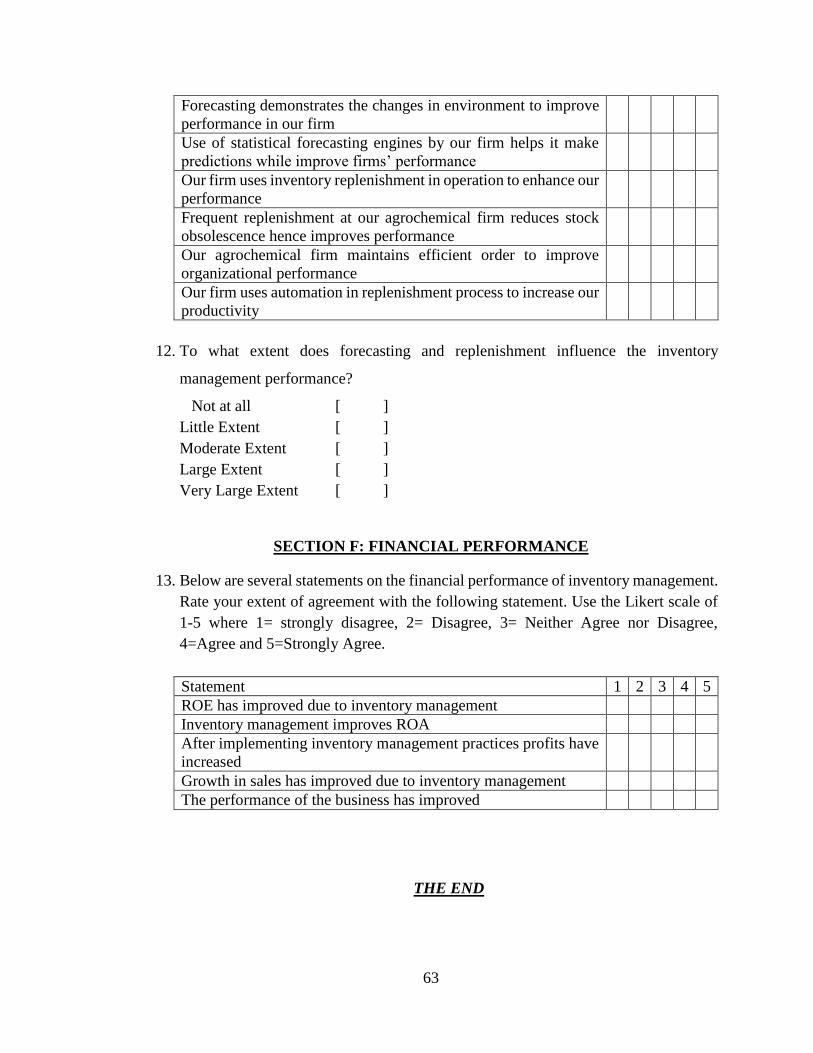
63
Forecasting demonstrates the changes in environment to improve
performance in our firm
Use of statistical forecasting engines by our firm helps it make
predictions while improve firms’ performance
Our firm uses inventory replenishment in operation to enhance our
performance
Frequent replenishment at our agrochemical firm reduces stock
obsolescence hence improves performance
Our agrochemical firm maintains efficient order to improve
organizational performance
Our firm uses automation in replenishment process to increase our
productivity
12. To what extent does forecasting and replenishment influence the inventory
management performance?
Not at all [ ]
Little Extent [ ]
Moderate Extent [ ]
Large Extent [ ]
Very Large Extent [ ]
SECTION F: FINANCIAL PERFORMANCE
13. Below are several statements on the financial performance of inventory management.
Rate your extent of agreement with the following statement. Use the Likert scale of
1-5 where 1= strongly disagree, 2= Disagree, 3= Neither Agree nor Disagree,
4=Agree and 5=Strongly Agree.
Statement 1 2 3 4 5
ROE has improved due to inventory management
Inventory management improves ROA
After implementing inventory management practices profits have
increased
Growth in sales has improved due to inventory management
The performance of the business has improved
THE END

64
Appendix II: Budget
BUDGET ITEM AMOUNT
Data collection from field
Research assistants wages
Transportation
Lunch
Airtime
TOTAL
4500
7000
1200
400
13,100
Data analysis and presentation
Internet costs and cyber use
Printing and Photocopying
Binding costs
TOTAL
5500
4000
1500
11,000
Contingency 3,000
TOTAL 24,100

65
Appendix III: Work Plan
Activity Start Time End Time Amount
of Time
Proposal development and approval Start -May
2016
End -June 2016 2 Months
Proposal Defense July 2016 Mid-July 2016 2 weeks
Data collection Mid July
2016
End-August 2016 1½
Months
Data analysis and Report Writing Start of Sept
2016
Mid-Oct 2016 1½
Months
Project report submission Mid-Oct
2016
End –Oct 2016 1 Month
Final Defense of project report Start Nov
2016
End Nov 2016 1 Month