The Randolph Glacier Inventory: a globally complete inventory of glaciers
Upload
khangminh22Category
view
1download
0
Nova Southeastern UniversityNSUWorks
Fischler College of Education: Theses andDissertations Abraham S. Fischler College of Education
1-1-2019
Implementation of the Instructional PracticesInventory – Technology Process with Fidelity: TheImpact on Technology Use and Student CognitiveEngagementMekca Rae Wallace-SpurginNova Southeastern University, [email protected]
This document is a product of extensive research conducted at the Nova Southeastern University Abraham S.Fischler College of Education. For more information on research and degree programs at the NSU AbrahamS. Fischler College of Education, please click here.
Follow this and additional works at: https://nsuworks.nova.edu/fse_etd
Part of the Educational Assessment, Evaluation, and Research Commons, EducationalTechnology Commons, and the Teacher Education and Professional Development Commons
Share Feedback About This Item
This Dissertation is brought to you by the Abraham S. Fischler College of Education at NSUWorks. It has been accepted for inclusion in FischlerCollege of Education: Theses and Dissertations by an authorized administrator of NSUWorks. For more information, please [email protected].
NSUWorks CitationMekca Rae Wallace-Spurgin. 2019. Implementation of the Instructional Practices Inventory – Technology Process with Fidelity: The Impacton Technology Use and Student Cognitive Engagement. Doctoral dissertation. Nova Southeastern University. Retrieved from NSUWorks,Abraham S. Fischler College of Education. (208)https://nsuworks.nova.edu/fse_etd/208.

Implementation of the Instructional Practices Inventory – Technology Process with
Fidelity: The Impact on Technology Use and Student Cognitive Engagement
by
Mekca Wallace-Spurgin
An Applied Dissertation Submitted to the
Abraham S. Fischler College of Education
in Partial Fulfillment of the Requirements
for the Degree of Doctor of Education
Nova Southeastern University
2019

ii
Approval Page
This applied dissertation was submitted by Mekca Wallace-Spurgin under the direction of
the persons listed below. It was submitted to the Abraham S. Fischler College of
Education and approved in partial fulfillment of the requirements for the degree of
Doctor of Education at Nova Southeastern University.
Susanne Flannelly, EdD
Committee Chair
Judith Converso, PhD
Committee Member
Kimberly Durham, PsyD
Dean

iii
Statement of Original Work
I declare the following:
I have read the Code of Student Conduct and Academic Responsibility as described in the
Student Handbook of Nova Southeastern University. This applied dissertation represents
my original work, except where I have acknowledged the ideas, words, or material of
other authors.
Where another author’s ideas have been presented in this applied dissertation, I have
acknowledged the author’s ideas by citing them in the required style.
Where another author’s words have been presented in this applied dissertation, I have
acknowledged the author’s words by using appropriate quotation devices and citations in
the required style.
I have obtained permission from the author or publisher—in accordance with the required
guidelines—to include any copyrighted material (e.g., tables, figures, survey instruments,
large portions of text) in this applied dissertation manuscript.
Mekca Wallace-Spurgin
Name
April 15, 2019
Date

iv
Abstract
Implementation of the Instructional Practices Inventory – Technology Process with
Fidelity: The Impact on Technology Use and Student Cognitive Engagement. Mekca
Wallace-Spurgin, 2019: Applied Dissertation, Nova Southeastern University, Abraham S.
Fischler College of Education. Keywords: educational technology, student cognitive
engagement, Instructional Practices Inventory – Technology, technology integration
This applied dissertation was designed to determine if students were using the recently
purchased Chromebooks as well as if they were cognitively engaged when using the
technology. Data collected using the IPI-T process suggested teachers were typically the
users of the technology, students were often disengaged, and teachers were asking
students to participate in lower-order surface activities. Missing from the process was the
implementation of the faculty collaborative sessions.
The writer scheduled dates to collect data three times during the 2018-19 school year. In
addition, faculty collaborative sessions were planned and facilitated within one week of
collection data. Participating in each faculty collaborative session, teachers (a) became
familiar with the IPI-T Rubric and Protocols, (b) analyzed and discussed the data, (c)
identified high-quality examples of student learning that foster student engagement with
technology, (d) designed high-quality lessons that foster student engagement with
technology, (e) compared longitudinal data and set goals for future data collection using
the IPI-T tool.
An analysis of the data revealed when implementing the IPI-T process with fidelity
teacher and student technology use increased as did student cognitive engagement when
using technology. In addition, it was found that students use technology for information
searches the majority of the time rather than media development or to collaborate among
peers for example, which are associated with higher-levels of cognitive engagement.

v
Table of Contents
Page
Chapter 1: Introduction ........................................................................................................1
Statement of the Problem .........................................................................................1
Setting of the Study ..................................................................................................8
Researcher’s Role ....................................................................................................8
Purpose of the Study ................................................................................................9
Definition of Terms................................................................................................10
Summary ................................................................................................................12
Chapter 2: Literature Review .............................................................................................14
Students’ Technology Experiences ........................................................................16
Teachers’ Technology Experiences .......................................................................18
Student Cognitive Engagement..............................................................................22
Theoretical Perspectives ........................................................................................27
Description of Instructional Practice Inventory .....................................................33
Description of Instructional Practice Inventory Level 1 Basic Workshop ............36
Description of Instructional Practice Inventory – Technology ..............................37
Description of Instructional Practice Inventory – Technology Workshop ............41
Description of Faculty Collaborative Sessions ......................................................42
Summary ................................................................................................................45
Research Questions ................................................................................................45
Chapter 3: Methodology ....................................................................................................48
Overview ................................................................................................................48
Participants .............................................................................................................49
Instruments .............................................................................................................51
Procedures ..............................................................................................................53
Limitations .............................................................................................................64
Chapter 4: Results ..............................................................................................................68
Research Question 1 ..............................................................................................71
Research Question 2 ..............................................................................................74
Research Question 3 ..............................................................................................78
Research Question 4 ..............................................................................................80
Research Question 5 ..............................................................................................82
Theme 1: Technology Integration ..........................................................................82
Theme 2: Implementing New Technology ............................................................83
Research Question 6 ..............................................................................................84
Theme 1: Awareness ..............................................................................................84
Theme 2: More Time .............................................................................................85
Summary ................................................................................................................86
vi
Chapter 5: Discussion ........................................................................................................88
Summary of Findings .............................................................................................88
Interpretation of Results .........................................................................................89
Implications of Findings ......................................................................................104
Limitations of the Study.......................................................................................106
Recommendations for Future Research ...............................................................107
Summary and Conclusions ..................................................................................108
References ........................................................................................................................110
Appendices
A Instructional Practices Inventory Categories ................................................118
B IPI-T Tech-Use Category Definitions and Examples ..................................120
C IPI/IPI-T Data Recording Forms (4-28-14) .................................................123
D Faculty Collaborative Session 1 ...................................................................125
E Faculty Collaborative Session 2 ..................................................................127
F Faculty Collaborative Session 3 ...................................................................129
G Faculty Collaborative Session 4 ..................................................................131
Tables
1 Research Questions and Corresponding Statistical Analysis Methods ..........58
2 Contingency Table for Question 1 ..................................................................59
3 Contingency Table for Question 2 ..................................................................60
4 Contingency Table for Question 3 ..................................................................61
5 Contingency Table for Question 4 ..................................................................62
6 Qualitative Questions on Web-Based Questionnaire .....................................63
7 Demographics of Faculty Participants ............................................................70
8 Demographics of Faculty Participants Taking the Questionnaire ..................70
9 Multiple Comparisons IPI-T Teacher Technology Use ..................................73
10 Teacher Technology Use ................................................................................74
11 ANOVA Effects of FCS* on Teacher Use of Technology.............................74
12 Multiple Comparisons IPI-T Student Engagement Codes ..............................76
13 Student Cognitive Engagement Codes ..........................................................77
14 Student Technology Use .................................................................................77
15 ANOVA Effects of FCS* on Student Cognitive Engagement When Using
Technology .....................................................................................................77
16 Frequencies of Categories of Technology Use Observed Using the IPI-T ....79
17 Tech Use Categories: Frequency of Student Cognitive Engagement Codes ..81
18 Qualitative Question 3 on Web-Based Questionnaire ....................................84
19 Qualitative Question 5 on Web-Based Questionnaire ....................................86
Figures
1 Measuring Student Engagement .....................................................................24
2 Bloom’s Taxonomy and Bloom’s Revised Taxonomy ..................................30
3 Mind Map of Bloom’s Revised Digital Taxonomy ........................................32

vii
4 Observations: Teacher is the Tech User .........................................................72
5 Frequencies of Categories of Technology Use ...............................................78

1
Chapter 1: Introduction
Statement of the Problem
A survey conducted in 2013 by The Harris Poll, revealed 92% of teachers believe
technology should be used in the classroom but only 14% are actually integrating
technology in their curriculum (Culala, 2016). In a report issued by the U.S. Department
of Education (U.S. DOE) (2016) the DOE stated, “School districts have an obligation to
provide equitable access to technology in order to close the digital divide and reduce
barriers for students while also preparing them for the digital complexities of the future”
(p. 22). In addition to access, the U.S. DOE issued the Common Core State Standards
(CCSS), a document that stated states are to be held accountable and include over 100
references to technology expectations in today’s learning environments.
Demographers and social scientists studying populations and the human society
have coined the most recent generation of children entering preschool and kindergarten as
Generation Alpha (Culala, 2016). These children are following Generation Z and while
Generation Z make up about 30% of the global population, Generation Alpha children
making their entrance into the world in 2010, are increasing nearly 2.5 million every
week (Culala, 2016 & McCrindle 2018). As the most technologically literate group of
children enter the classroom, it is necessary to look at current educational practices and
consider “the skills, competencies, values needed on the future global age, and how
generation alpha should be prepared, scholastically” (Culala, 2016). Speaker, author, and
educator, Marc Prensky (2001a) stated, “Today’s students are no longer the people our
educational system was designed to teach” (p. 1).
In an effort to provide access to technology and prepare students for the “digital

2
complexities of the future”, school board members in a small, rural community in
Southern Iowa recently spent $225,000 to purchase Chromebook and iPads. In addition,
administration sent the researcher and a team of teachers to a workshop to be trained in
the Instructional Practices Inventory – Technology (IPI-T) process. The IPI-T process
was piloted during the 2017-18 school year after purchasing $100,000 in Chromebooks.
The educational landscape is changing. The learning needs of our Digital Native
(Prensky, 2001b) students warrant the integration of technology, however, when teachers
do use technology for instruction, they may not be using it to its fullest potential to
promote high levels of student cognitive engagement (Cuban, Kirkpatrick, & Peck, 2001;
Prensky, 2015; Russell, Bebell, O’Dwyer, & O’Connor, 2003; Schrum & Levin 2012;
Zhao, Pugh, Sheldon, & Byers, 2002). It is important to provide in-service teachers the
opportunities to learn how to integrate technology into their teaching practices (Cuban et
al., 2001; Russell et al., 2003; Zhao et al., 2002). In line with recent studies (Cuban et al.,
2001; Russell et al., 2003) despite large expenditures of Chromebooks, baseline data
collected at the targeted high school indicates teachers are the users of technology, rather
than students. In addition, 70.4% of the time when technology was being used within the
learning activity, students were participating in lower-order, surface thinking.
The topic. The target school board and administration in this proposed study was
interested in determining if students were using the devices as well as if they were
cognitively engaged when using technology. Data collected using the IPI-T process
suggested teachers were typically the users of the technology, students were often
disengaged, and teachers were asking students to participate in lower-order, surface
activities. The researcher noticed that the IPI-T data collecting process was not

3
implemented with fidelity. Missing from the process was the implementation of the
faculty collaborative sessions.
The research problem. The researcher and team of teachers at the target school
were trained in the IPI-T data collection process; however, the process was not completed
with fidelity because only data collection occurred and faculty did not participate in
collaborative sessions. A key piece of the process is the implementation of faculty
collaborative sessions to follow each of the four data collecting dates. It is recognized
that teachers living in rural, high poverty areas don’t always have the same access to
digital resources, technology, and professional development opportunities to gain the
knowledge and skills to integrate technology in a way that encourages student cognitive
engagement as larger, neighboring districts (Howley, Wood, & Hough, 2011; Sundeen &
Sundeen, 2013). In order to create change in technology use and increase higher-order,
deeper thinking, implementation of the IPI-T process in its entirety was necessary
(Valentine, 2012b; Valentine, n. d.). That is teacher leaders collecting the data should
engage faculty in studying the data to identify patterns, trends, and changes in each data
profile as well as establish and deliver purposeful professional development and
continuous conversations (Valentine, 2012b; Valentine, n. d.).
Background and justification. Research for this study was conducted in a public
high school (grades 9-12) located in a small, rural district in Southeast Iowa. The
researcher has offered graduate courses, as well as short-term and infrequent mini
sessions, to support faculty and the integration of technology. Attendance was on a
volunteer basis resulting in zero faculty members participating in the mini sessions and
six faculty members out of twenty-seven took advantage of the graduate course work that

4
focused on the integration of technology in ways that increase higher-order, deeper
thinking among students.
At the start of the 2017-18 school year there were approximately 120 technology
devices that included, one cart of 30 Lenovo ThinkPad Laptops in the science wing and a
cart of 30 Lenovo ThinkPad Laptops in the English/Language Arts wing, as well as, four
computer labs, which housed a total of 60 desktops. In November 2017, the school board
approved $100,000 for the purchase of 320 Chromebooks and 10 computer carts. At the
beginning of the second semester, 270 new Chromebooks were rolled out among 9 carts.
Each core subject area now had access to 60 new Chromebooks and the non-core subject
areas still having access to the 60 Desktops plus 30 new Chromebooks as well as the
“old” Lenovo ThinkPad Laptops. To date the building has a nearly 2:1computer to
student ratio and an additional $125,000 was spent in 2018 to increase Chromebooks and
iPads across the district.
The IPI-T data collection team coded 217 observations from January 2018
through April 2018 after increasing technology devices nearly one per student at the high
school. Analysis of the data showed only 95 observations were coded in which students
were the users of technology. Based on this data, the researcher wondered why faculty
was not taking advantage of the newly purchased devices and integrating technology into
classroom instruction. She wondered if implementing the IPI-T process in its entirety
would make a difference in technology use among teachers and students and if teachers
would change their practice and offer learning activities that promoted higher-order,
deeper thinking.

5
Jerry Valentine, Professor at the University of Missouri, and graduate assistant
Bryan Painter, created the Instructional Practices Inventory (IPI) in 1996. The IPI
measures student cognitive engagement. In 2001, Valentine began to recognize the need
to add a technology component to the measuring tool as schools were moving 1:1 with
technology devices, resulting in the creation of the Instructional Practices Inventory –
Technology (IPI-T). As defined within Valentine’s Instructional Practices Inventory -
Technology (IPI-T), each category coded describes the level of student engagement and
are referred to as:
6. Student Active Engaged Learning
5. Student Verbal Learning Conversations
4. Teacher-led Instruction
3. Student Work with Teacher Engaged
2. Student Work with Teacher Not Engaged
1. Student Disengagement
It is important to note that the categories are not a hierarchy but rather “six distinct ways
to categorize student engagement” (Valentine, 2017, p. 2). According to Valentine
(2012c), Categories 5 and 6 are coded when students are observed participating in higher-
order, deeper thinking activities such as decision making from analysis, collaboration
among peers, and creative and innovative thinking. Categories 2, 3, and 4 include lower-
order, surface activities such as basic fact finding, recall and memorization, and simple
understanding (Workshop handouts, p. 2).
The researcher of this study is a member of the Instructional Practices Inventory-
Technology data collection team in rural, Southern Iowa school district. The first set of

6
codes was collected within the high school as a pilot of the measurement tool January
2018, shortly after the purchase of Chromebooks. After 217 observations of 27 high
school classrooms, 95 observations were coded as students using technology and 59
observations were coded as teachers using technology. When observed using technology,
students were engaged in lower-order, surface thinking activities 70.4% of the time.
Coding took place four times during the school year 2017-18. The researcher noticed
technology use by the teacher decreased slightly, increasing student use of technology,
but disengagement increased dramatically as did the integration of activities that fall
within Categories 4, 3, and 2 on the IPI-T. This is not surprising as the researcher and the
IPI-T data collection team did not implement the IPI-T process with fidelity. Valentine
(2012b) stated, “The greater the implementation integrity to these strategies, the greater
the likelihood the school will see positive academic results from their use of the IPI” (p.
1). Missing from the process during the 2017-18 pilot of the IPI-T was the
implementation of faculty collaboration sessions. The sessions provide faculty with time
to study the data after each data collection, engage faculty in reflecting about the data,
create collaborative learning experiences to build new knowledge, and allows faculty
voice in establishing annual cognitive engagement goals.
Deficiencies in the evidence. Barriers that prevent the integration of technology
by classroom teachers have identified and thoroughly documented in the existing
literature, (Ertmer, 1999; Hew & Brush, 2007; Kopcha, 2012). According to the Barrier
to Technology Model, external and internal barriers influence the integration of
technology in teacher’s classrooms (Ertmer, 1999; Ertmer and Ottenbreit-Leftwich, 2010;
Ertmer, Ottenbreit-Leftwich, Sadik, Sendurur, & Sendurur, 2012). First-order barriers are

7
known as resource barriers (e.g., access to technology devices, availability of technical
support, and sufficient time allowance to prepare for technology-integrated instruction)
and institutional barriers (e.g., administrator’s priority and school-wide plan for
technology integration) (Hew & Brush, 2007; Kopcha, 2012; Vongkulluksn, Xie, &
Bowman, 2018). Recognized as the “most proximal determinant of technology
integration” (Vongkulluksn, et al., 2018) is among the second-order barriers, teachers’
value beliefs regarding the importance of technology for learning (Ertmer, 1999; Ertmer
and Ottenbreit-Leftwich, 2010; Ertmer et al., 2012). According to Vongkulluksn et al.
(2018), “Teachers’ value beliefs about technology refer to the extent to which teachers
believe that technology can help fulfill instructional goals they identified as most
important for their students” (p. 71).
Organizations such as the U.S. Department of Education, International Society for
Technology Education (ISTE), and the Partnership for 21st Century Learning (P21)
provide regulations, standards, or a framework that simply states that there is a need for
ongoing professional development for faculty. Vongkulluksn, et al. (2018), suggested that
“teachers’ value beliefs towards technology to be highly predictive of the quantity and
quality of technology integration” (p. 71). There are few studies, if any, available that
suggests a particular strategy or plan that indeed targets teachers’ value beliefs and
provides teachers with the skills necessary to increase student cognitive engagement
when technology is integrated into their learning environment.
Audience. Initially faculty within the target school district will benefit from this
study. It is hypothesized faculty will see an increase in student cognitive engagement. as
well as higher-order deeper thinking with a reduction in disengagement, positively

8
influencing student academic achievement. In addition, students will demonstrate having
the necessary skills for success in the twenty-first century. The goal is to present
research-based data for school board members to have a better understanding of
technology use and how the recent expenditure of technology has impacted classroom
practices and student engagement.
Setting of the Study
This study takes place in a rural, high-poverty school district in Southern Iowa.
Total student population in the district is 1,426. The district is home to five school
buildings: a preschool, one building for all students in grades kindergarten through first,
one building for all students in second through fifth grade, a junior high made up of
grades six through eight, and the high school where students in grades nine through
twelve attend. Students and faculty from the high school, grades 9-12 are the focus of this
research.
Enrollment at the target high school is just over 400 students in grades 9-12 and
close to 30 certified faculty members. A typical school day begins at 8:10 a.m. and ends
at 3:20 p.m. and is made up of eight periods in a day. Core courses include a variety of
offerings in the following subjects: Math, Science, Social Studies, and English Language
Arts (ELA). The majority of the non-core courses is part of the Career Technical
Education (CTE) program and includes metals, welding, art, agriculture courses, and
business education.
Researcher’s Role
The researcher is an employee of Iowa Public Television (IPTV) with the title of
Teacher Ambassador (TA). The role of the TA is to support educators through

9
community building and professional development opportunities. As a former classroom
teacher, my position as a TA was brought onto the IPTV staff with the goal to improve
learning outcomes for all children – especially those who need the most help. In order to
help students, it’s critical that we support educators, who play a critical role in their
learning. To best serve educators the Teacher Ambassador was embedded full-time in
targeted school district. Teachers in this rural community report feeling isolated and have
limited access to digital resources, technology, and professional development
opportunities to gain the knowledge and skills to integrate technology in a way that
encourages student use of technology and increases student cognitive engagement.
Purpose of the Study
The purpose of this explanatory-sequential mixed method study was to assess the
impact of the IPI-T process on technology use and student cognitive engagement. The
goal was to implement all strategies, including faculty collaborative sessions four times
per year to support teacher implementation of new technology to increase higher-order,
deeper thinking by students and increase student use of technology. The impact was
measured by comparing quantitative IPI-T data codes of those faculty that participated in
the intervention group with baseline data prior to the implementation of the faculty
collaborative study sessions. Data collected during the quantitative phase was the
emphasis of this study. Qualitative data was gathered from one participant from each core
and non-core area, a total of eight participants. Each were asked to answer questions on a
web-based questionnaire during the final faculty collaborative session. After identifying
themes, the qualitative data was analyzed for themes and then because the data was
collected in sequence, findings were associated with the quantitative results of the IPI-T

10
to determine how and why the data converged. In addition, the researcher used the
qualitative data to explore key results found when collecting quantitative data that lead to
the acceptance or rejection of the null hypothesis.
Definition of Terms
Educational technology. Educational technology is defined as, “The study and
ethical practice of facilitating learning and improving performance by creating, using,
and managing appropriate technological processes and resources” (Januszewski &
Molenda, 2013, p. 1). This research study focused on the types of technology often used
in today’s educational or classroom setting such as interactive whiteboards, iPads,
Chromebooks, cellular devices, digital cameras, and the Internet to name a few.
Generation Z. Generation Z, also referred to as digital natives, include persons
born after 1995 and are known as the first generation to be born into a “globally (Internet)
connected world and therefore ‘live and breathe’ technology”. (Cilliers, 2017; Grail
Research, 2011; Rothman, 2016). Students observed within the targeted high school are
considered to be a part of Generation Z.
Generation Alpha. Generation Alpha are children born after 2010, entering
preschools and kindergarten. These children are following Generation Z and make up
about 30% of the global population, increasing nearly 2.5 million every week.
Furthermore, children belonging to Generation Alpha are considered the most
technologically literate group to enter the classroom yet (Culala, 2016 & McCrindle
2018). It is imperative teachers gain the skills necessary to meet the needs of our children
entering classrooms today.
Student cognitive engagement. According to Fred Newmann, (as cited by Voke,

11
2002) author of the 1992 book Student Engagement and Achievement in American
Secondary Schools, engaged students make a “psychological investment in learning.
They try hard to learn what school offers. They take pride not simply in earning the
formal indicators of success (grades), but in understanding the material and incorporating
or internalizing it in their lives” (pp. 2–3). The IPI-T process measures student cognitive
engagement when using technology and is the focus of the data presented to faculty
during the collaborative sessions (Valentine, 2012c, p. 2).
Higher-order thinking. Higher-order thinking activities are said to “challenge
the student to interpret, analyze, or manipulate information” (Lewis & Smith, 1993).
Lower-order thinking. Lower-order thinking activities “demand only routine or
mechanical application of previously acquired information such as listing information
previously memorized and inserting numbers into previously learned formulas” (Lewis &
Smith, 1993). A balance of higher-order/deeper thinking and lower-order surface thinking
is necessary to promote an increase in student achievement (Valentine, 2012c, p. 2).
Instructional Practices Inventory Categories. Instructional Practices Inventory
Categories are represented numerically (see Appendix A). Each category describes the
level of student engagement and are referred to as:
6. Student Active Engaged Learning
5. Student Verbal Learning Conversations
4. Teacher-led Instruction
3. Student Work with Teacher Engaged
2. Student Work with Teacher Not Engaged
1. Student Disengagement

12
The IPI and the IPI-T both utilize each of the six categories. It is important to note that
the categories are not considered a hierarchy but rather “six distinct ways to categorize
student engagement” (Valentine, 2017). Categories 6 and 5 include learning activities
that fall within the higher-order, deeper thinking spectrum of Bloom’s Taxonomy and
Bloom’s Digital Taxonomy such as analysis and creating while Categories 4, 3, and 2
include lower-order, surface thinking activities such as recalling simple facts and
googling for answers.
Categories of technology use. Categories of technology use include the
following eight categories: (a) Word Processing; (b) Math Computations; (c) Media
Development; (d) Information Search; (e) Collaboration Among Individuals; (f)
Experience-Based Immersion Learning; (g) Interactive/Presentation Technology; (h)
Other (Valentine, 2012c). These eight categories are used to document or code how
technology is being used for learning and is similar to the coding process for collecting
IPI data. However, during the IPI-T process, the individual collecting the data
“documents the total number of students and the numbers using and not using technology
and makes two IPI engagement codes, one for all students and one for ‘only the tech
students’” (Valentine, 2015).
Summary
Chapter one included a statement of the problem along with a description of the
setting in which this study took place. The purpose of this embedded quasi-experimental
mixed method study was to assess the impact of the IPI-T process on technology use and
student cognitive engagement. The goal was to implement all strategies, including faculty
collaborative sessions four times per year to support teacher implementation of new

13
technology to increase higher-order, deeper thinking by students and increase student use
of technology.

14
Chapter 2: Literature Review
A thorough review of the literature is included in chapter two, beginning with a
look at the current realities for many districts after purchasing technology and then trying
to align current teaching practices with the integration of technology. Such alignment
efforts must consider the characteristics of current students as digital natives, Generation
Alpha and Generation Z, as well as the characteristics of digital immigrants and the
connection to current classroom practices when integrating technology. Student cognitive
engagement and the integration of technology is at the heart of this study, specifically
higher-order thinking and lower-order thinking skills and activities outlined in Bloom’s
Original Taxonomy and the revised Bloom’s Digital Taxonomy. Chapter 2 continues
with a detailed look at the IPI and IPI-T data collection protocol to measure student
cognitive engagement and technology use, including how the implementation of the
Faculty Collaborative Sessions have been used to breakdown the barrier to technology
use and increase student cognitive engagement and higher-order thinking. In addition, a
historical look at the IPI and IPI-T process, a review of the research conducted using the
data collecting process, and the reliability of the IPI and IPI-T as a tool for collecting data
to measure student cognitive engagement is included within the literature review.
Many schools and districts have spent a significant amount of money in an effort
to become 1:1 with their devices or at the very least considered high-tech schools (Cuban
et al., 2001; Russell et al., 2003; Zhao et al., 2002). McClure, Jukes, and MacLean (2011)
maintained, rather than racing to purchase ‘stuff’, there is a need to shift teacher practice,
and collaboratively work to change pedagogy, teaching, learning, and assessment to
impact student success. Ultimately district leaders and faculty find themselves in a
15
position of wondering how they might utilize the newly purchased devices to increase
student cognitive engagement as well as achievement in an effort to justify their recent
technology expenditures (Cuban et al., 2001; Russell et al., 2003; Zhao et al., 2002).
Adding to this challenge, teachers living in rural, high poverty areas don’t have the same
access to digital resources, technology, and professional development opportunities to
gain the knowledge and skills to integrate technology in a way that encourages student
cognitive engagement as larger, neighboring districts (Howley, Wood, & Hough, 2001).
McClure et al. (2011) argued that faculty must participate in an ongoing,
multistep method to align the implementation of technology with their learning goals. In
addition, McClure et al. (2011) explained the first step of alignment involves gathering
data to determine the exact practices of teachers regarding technology use. The data
should then guide the creation of action plans to set the goal of technology alignment.
Once a plan is in place it is important to participate in ongoing assessment of the plan to
determine the effectiveness.
The Instructional Practice Inventory – Technology (IPI-T) was created by Dr.
Jerry Valentine in an effort to address the growing use of technology in the classroom.
The IPI-T can be used to help faculty in the alignment process. It is a walkthrough
observation process designed to collect data concerning how often and in what ways
teachers are integrating technology as well as how often students are cognitively engaged
in higher-order, deeper (HO/D) thinking as well as lower-order surface (LO/S) thinking.
The implementation of the IPI-T process includes engaging faculty in collaborative
sessions within one week after each data collection. Faculty collaborative sessions allow
all faculty to reflect about the data and establish cognitive engagement goals.

16
Implementing the entire IPI-T with fidelity increases the likelihood that the targeted
schools will see a positive influence on student achievement as they move toward a 1:1
environment.
Valentine (2013) stated, “Cognitive psychologists studying engagement for many
years noted that as students get older and progress through the K-12 learning experience,
the pattern of focus during learning time declines” (p. 1). Furthermore, Valentine (2013)
reported that students are typically engaged in HO/D thinking activities only 60-70
minutes per day. “Increasing the HO/D time by 15 minutes means an HO/D increase of
about 20-25%...translates into an increase of 2-3% high stakes pass rates over two years;
an increase of 8-10 full school days of more HO/D thinking per year and a conservative
estimate of 100-125 school days of more HO/D thinking during a thirteen year schooling
experience (Valentine, 2013, p. 1). Valentine (2012c) has collected tens of thousands of
codes, educating more than 23,000 educators in the IPI-T data collection process.
Valentine (2012c) explained, “Findings from our quantitative studies of the relationships
between IPI-T cognitive engagement data and achievement parallel findings from other
studies of the past two to three decades, i.e. increasing engagement and higher-order
deeper thinking during learning time and conversely reducing disengagement during
learning time positively influence student academic success” (p. 1).
Students’ Technology Experiences
Today technology is woven into our student’s lives. According to Prensky (2001),
students today are, “native speakers of the digital language of computers, video games,
and the Internet” (p. 1). Prensky called these native speakers Digital Natives.
Demographers and social scientists studying populations and the human society have

17
coined the most recent generation of children entering preschool and kindergarten as
Generation Alpha (Culala, 2016). These children are following Generation Z and while
Generation Z make up about 30% of the global population, Generation Alpha children
making their entrance into the world in 2010, are increasing nearly 2.5 million every
week (Culala, 2016 & McCrindle 2018). Others prefer to not assign labels to learners
today as they state, “these terms and their meanings do not accurately represent every
individual that might fall into such categories” (Milman, 2009, p. 59). Empirical evidence
has shown the use of digital technology is growing and there is a need to focus on digital
learners, not digital natives (Autry & Berge, 2011; Bullen, Morgan, Qayyum & Qayyum
2011; Milman, 2009).
Digital tools available today for learning, teaching, and communicating are
different (Milman, 2009). The Harris Poll conducted a survey in 2013 and found 92% of
the teachers polled said “they think EdTech tools should be used in the classrooms but
only 14% of them are actually integrating technologies into their curriculum” (as cited by
Culala, 2016). Alphas are predicted to be highly immersed with technologies (Culala,
2016; McCrindle, 2018). According to Culala (2016) students are not simple users but
“they are born with a ‘tech thumb’”. Living in a highly mobile and technologically
advanced society today’s students prefer to communicate using social media, they were
born into a world where Internet has always been available, and are the first fully global
generation, who prefer Google and YouTube over lectures and PowerPoint presentations
(Billings, Kowalski, & Shatto, 2016; Culala, 2016; Rothman, 2014; Shatto &Erwin,
2017). Prensky (2001a), maintained that students today think and process information
differently than others before them. Supported by social psychologists is the theory of

18
neuroplasticity; this theory is based on the premise that individuals thought process
pattern changes with their experiences (Autry & Berge, 2011). As cited by Prensky
(2001b), Dr. Bruce D. Perry of Baylor College of Medicine has found “different kinds of
experiences lead to different brain structures” (p. 1). Technology’s influence on brain
development of today’s students implies the need to make thoughtful and informed
decisions about the engagement of learners and changing instruction to meet the needs of
today’s learners (Autry & Berge, 2011; Milman, 2009; Prensky, 2001, Tapscott, 2009).
As the most technologically literate group of children enter the classroom, it is
necessary to look at current educational practices and consider “the skills, competencies,
values needed on the future global age, and how generation alpha should be prepared,
scholastically” (Culala, 2016). However, changing current educational practices
regarding the use and integration of technology can be complex and messy (Zhao, Pugh,
Sheldon, & Byers, 2002).
Teachers’ Technology Experiences
Barriers that prevent the integration of technology by classroom teachers are
identified and thoroughly documented in the existing literature (Ertmer, 1999; Hew &
Brush, 2007; Kopcha, 2012). The Barrier to Technology model, suggests there are two
sets of barriers, external and internal, that influence the integration of technology in
teachers’ classrooms (Ertmer, 1999; Ertmer and Ottenbreit-Leftwich, 2010; Ertmer,
Ottenbreit-Leftwich, Sadik, Sendurur, & Sendurur, 2012). First order-external barriers are
also known as resource barriers. Sufficient time allowance to prepare for technology-
integrated instruction is an example of a resource barrier (Hew & Brush, 2007; Kopcha,
2012; Vongkulluksn, Xie, & Bowman, 2018). In addition, Vongkulluksnet al. (2018)

19
considered the second order-internal barriers, teachers’ value beliefs as the “most
proximal determinant of technology integration” regarding them most important to using
technology for learning (Ertmer, 1999; Ertmer and Ottenbreit-Leftwich, 2010; Ertmer et
al., 2012).
Over the past 30 years, hundreds of studies have been conducted to determine
how a particular type of technology impacts student learning, which technological
innovation is “more of less effective than traditional instruction”, however, little research
has been conducted to determine how and why American teachers use technology (Zhao
et al., 2002, p. 483). Access to technology in most cases is no longer the major issue
(Schrum & Levin, 2015; Zhao et al., 2002); however, computer usage in the classroom
among students remains low (Cuban, 1999; Wang, Hsu, Campbell, Coster, Longhurst,
2014; Zhao et al., 2002). Removing barriers to technology use such as sufficient time
allowance to prepare for technology-integrated instruction (Hew & Brush, 2007; Kopcha,
2012; Vongkulluksn, Xie, & Bowman, 2018) and increasing teacher’s ability beliefs
increases the likelihood teachers will use technology to fulfill instructional goals that are
student-centered and lead to student achievement (Kopcha, 2012; Vongkulluksn, Xie, &
Bowman, 2018).
Personal pedagogical beliefs. According to Denessen (2000), pedagogical beliefs
refer to the understandings about teaching and learning that teachers hold to be true (as
cited in Tondeur et al., 2016). Described by Pajares (1992), a teacher’s belief system
includes beliefs about their roles and responsibilities, the subject matter taught, as well as
beliefs about their students (as cited in Tondeur et al., 2016). Complex and multifaceted
pedagogical beliefs include core beliefs, those that are most stable and the most difficult

20
to change as they have connections to other beliefs versus beliefs that are peripheral and
formed recently are more open to change (Tondeur et al., 2016).
Although evidence does indicate that the integration of technology in the learning
process is steadily increasing, “achieving technology integration is still a complex
process of educational change” (Tondeur, van Braak, Ertmer, & Ottenbreit-Leftwich,
2016). Deng, Chai, Tsai, and Lee, (2014) along with Inan and Lowther, (2010)
maintained that personal pedagogical beliefs of teachers “play a key role in their
pedagogical decisions” to integrate technology within their classroom practices (as cited
in Tondeur et al., 2016). Within the field of education technology teachers’ beliefs have
been classified into one of two categories: teacher-centered and student centered beliefs.
Teacher-centered beliefs, associated with behaviorism, tend to emphasize subject matter
and discipline while the teacher acts as the authority and serves as the expert in a highly
structured learning environment that is typically associated with activities that a teacher
uses to promote learning (Deng et al, 2014; Kim, Kim, Lee, Spector, & DeMeester, 2013;
Tondeur et al., 2016). In contrast, Kerlinger and Kaya (1959) and Mayer (2003)
maintained student-centered beliefs are typically associated with constructivism,
emphasizing individual student needs and interests and revolving around students
engaged in and actively participating in authentic and relevant learning opportunities
(Ertmer and Glazewski, 2015; Kim et al., 2013; as cited in Tondeur et al., 2016).
Educational technology best practices are those that promote student-centered learning
(Ottenbriet-Leftwich, Glazewski, Newby, and Ertmer, 2010; Tondeur et al, 2016).
Jonassen (1996) noted meaningful use of technology occurs when students use a
computer as a mindtool to achieve higher levels of thinking and reduce cognitive load (as
21
cited in Ottenbriet-Leftwich et al., 2013). Student-centered learning is said to increase
academic performance and help students develop lifelong skills such as problem solving
and self-regulation (Ottenbriet-Leftwich et al., 2013; Tondeur et al., 2016).
Collaborative learning. Removing barriers to technology use such as sufficient
time allowance to prepare for technology-integrated instruction (Hew & Brush, 2007;
Kopcha, 2012; Vongkulluksn, Xie, & Bowman, 2018) and increasing teacher’s ability
beliefs increases the likelihood teachers will use technology to fulfill instructional goals
that are student-centered and lead to student achievement (Kopcha, 2012; Vongkulluksn,
Xie, & Bowman, 2018). The significance of collaborative learning among teachers has
been documented in the literature (Faculty Collaborative Study, n.d.; Hattie, 2012).
Valentine (n.d.) maintained, that periodic collaborative learning among teachers to set
common goals, “to build knowledge and professional skills, and to discuss professional
values and beliefs together” is the key ingredient in quality professional development that
drives learning and academic success of students (Faculty Collaborative Study).
Hattie (2012), pointed out, “teachers’ beliefs and commitments are the greatest
influence on student achievement over which we can have some control” (p. 25).
Engaging faculty in a series of collaborative study sessions of the IPI-T data has been
shown to have the capacity to remove barriers to technology use by teachers to fulfill
instructional goals, increase teachers’ ability beliefs, increase student usage of
technology, and positively impact student cognitive engagement and academic success
(Jensen, 2016; Valentine 2012a; Valentine, 2013).

22
Student Cognitive Engagement
Historically student engagement has focused on three areas: increasing
achievement, positive behaviors, and a sense of belonging as an effort to retain students
(Parsons & Taylor, 2011; Dunleavy, Milton, & Willms, 2012). Recently student
engagement has become a strategic process, one in which is built around the goal of
“enhancing all students’ abilities to learn how to learn or to become lifelong learners in a
knowledge-based society (Parsons & Taylor, 2011). Fredricks, Blumenfeld, and Paris
(2004) maintained student engagement is a complex process that can be divided into
three basic categories—behavioral, emotional and cognitive:
1. Behavioral engagement draws on the idea of participation; it includes
involvement in academic and social or extracurricular activities and is considered
crucial for achieving positive academic outcomes and preventing dropping out.
2. Emotional engagement encompasses positive and negative reactions to
teachers, classmates, academics, and school and is presumed to create ties to an
institution and influence willingness to do the work.
3. Cognitive engagement draws on the idea of investment; it incorporates
thoughtfulness and willingness to exert the effort necessary to comprehend
complex ideas and master difficult skills.
For the purpose of this study, the focus will be on the latter, student cognitive
engagement. While definitions vary, cognitive engagement is defined by Fredericks,
Blumenfeld, and Paris (2004) as “a psychological investment in learning, a desire to go
beyond the requirements of school, and a preference for challenge” (p. 7). Adapted from
Fredericks et al. (2004), student cognitive engagement is “The expenditure of thoughtful

23
energy needed to comprehend complex ideas in order to go beyond the minimal
requirements” (as cited by Finn and Zimmer, 2012, p. 102). According to Finn and
Zimmer (2012), “High levels of cognitive engagement facilitate students’ learning of
complex material” (p. 102-103). Finn and Zimmer found behaviors that are suggestive of
cognitive engagement include “asking questions for the clarification of concepts,
persisting with difficult tasks, reading more than the material assigned, reviewing
material previously, studying sources of information beyond those required, and using
self-regulation and other cognitive strategies to guide learning” (p. 102-103).
Measuring student engagement. There has been an increased interest in
understanding and collecting data on student engagement. Various reasons have been
cited and include: a growing awareness of the relationship between student
disengagement and failure to complete school, the inclusion of student engagement as a
goal of school improvement, and use of student engagement as a program or intervention
outcome (Dunleavy, Milton, P, & Willms, 2012; Fredricks, McColskey, Meli, Mordica,
Montrosse, & Mooney, 2011). Fredricks et al. (2011), reviewed 21 instruments used to
measure dimensions of engagement in a tabular format (see Figure 1). Fourteen of the 21
instruments reviewed were student self-report instruments, three teacher reports on
students, and four observational measures. Instruments varied and could have been used
for measuring student engagement in upper elementary through high school.

24
Figure 1. Measuring student engagement. A visual representation showing the dimensions of engagement
(behavioral, emotional, and cognitive) assessed by various instruments. Retrieved from
http://ies.ed.gov/ncee/edlabs. Reprinted with permission from Kathleen Mooney.
Among the 21 instruments reviewed was the IPI. Other observational measures
included in the review were the Behavioral Observation of Students in Schools (BOSS),
the Classroom AIMS, and the Code for Instructional Structure and Student Academic
Response (MS-CISSAR). In comparison, the BOSS, is used with prekindergarten through
grade 12 students to measure individual student’ on-task and off-task behavior or

25
academic engagement time to record two categories of engagement and three categories
of non-engagement. Developed for use by school psychologists, the instrument is used to
screen students at risk of academic failure and for school psychologists, researchers, and
evaluators to track the effectiveness of interventions over time. Interobserver reliability of
the BOSS after training is reported to be 90-100 percent (Fredricks et al., 2011).
The Classroom AIMs is used with elementary school teachers (K-2) to evaluate
multiple domains associated with effective teaching practices: atmosphere,
instruction/content, management, and student engagement. Engagement is further
measured with four items: students on task and highly engaged in class activities; self-
regulated behaviors; participating in class; and expressing excitement. Classroom AIMS
is typically used with elementary school teachers, however, the instrument was used in
one study with secondary teachers (Fredricks et al., 2011). Stanulis and Floden (2009)
reported that within the study, the interrater reliability for individual items was 65 percent
and it was unclear which statistics corresponded to the student engagement scale or if the
engagement items could be used independently of the whole set of AIMS items (as cited
by Fredricks et al., 2011).
In 1981, development of the MS-CISSAR helped to gain a better understanding of
how student academic responding, interacts with teacher behavior and classroom settings.
Used in elementary, middle, and high schools, trained observers collect data on specific
students so practitioners can improve instruction and results for students. MS-CISSAR
consists of a 105 event taxonomy organized by student behavior, teacher behavior, and
ecological setting. Training to use the measurement is provided through drill and practice

26
tutorials. Wallace, Anderson, Bartholomay, and Hupp (2002) reported interobserver
reliability as 85-92 percent (as cited in Fredricks et al., 2011).
When comparing observational measures to assess student engagement, Fredricks
et al., (2011) reported the IPI as the only observational measure used to collect data on
student cognitive engagement. The IPI and IPI-T was chosen in the targeted school
district to determine if students were using the newly purchased Chromebooks as well as
if they were cognitively engaged when using technology. In addition to collecting data,
the IPI and IPI-T process is used for faculty reflection, instructional change, and school
improvement (as cited in Fredricks et al., 2011; Valentine, 2013; Valentine, 2017).
Rationale for studying student engagement. For many years, cognitive
psychologists studying cognitive engagement have noted “that as students get older and
progress through the K-12 learning experience, the pattern of focus during learning time
declines (as cited by Valentine, 2013, p. 2). Valentine (2013) reported, “In our IPI data,
this is evidenced by the lower average percentages of disengagement during elementary
school (2-3%) followed by higher percentages in middle schools (3-4%) and the highest
percentages in comprehensive high schools (6-8%)” (p. 2). Not surprising when
considering today’s students are different from generations before them (McCrindle,
2014; Prensky, 2005; Schrum & Levin, 2015; Tapscott, 2009). Technology’s influence
on brain development of today’s students implies the need to make thoughtful and
informed decisions about the engagement of learners and changing instruction to meet the
needs of today’s learners (Autry & Berge, 2011; Milman, 2009; Prensky, 2001a,
Tapscott, 2009). Many of today’s students, particularly as they progress to high school,
appear to be disengaged, unmotivated, and uninterested in learning (Prensky, 2001a;

27
Prensky, 2005; Schrum & Levin, 2015). Shernoff, Csikszentmihalyi, Schneider, and
Shernoff (2003) reported over a quarter of the day, secondary students are in a
disconnected state, such as boredom (as cited by Jensen, 2016). Hattie (2012) reported
that expert teachers with the ability to assist students in the development of deep and
conceptual understandings have an effect size of 1.0 (p. 32-33). Hattie (2012) referred to
the “hinge-point” for identifying what is and what is not effective as d=0.40 or an effect
size of 0.40 (p.3). In a blog post titled, “Principal of Change: Stories of Learning and
Leading”, Couros (2013) described what today’s students need to reach their full
potential growing up as 21st century learners (as cited by Schrum & Levin, 2015). Couros
admitted, although technology is not the focus, it does give us many opportunities to
magnify the opportunities such as supporting student voice and student choice, providing
time for reflection and opportunities for innovations, foster critical thinking and problem-
based learning that supports problem solving among students, opportunities for self-
assessment, and connected learning through collaboration not just locally but globally (as
cited by Schrum & Levin, 2015). In an effort to align current teaching practices with the
integration of technology and reach today’s students, the IPI and IPI-T process assists in
the collection of data to get an insight into how students are engaging in the learning
during the instructional activity.
Theoretical Perspectives
Empirical evidence shows the use of digital technology is growing, digital tools
available today for learning, teaching, and communicating are different (Milman, 2009),
and a need to focus on digital learners (Autry & Berge, 2011; Bullen & Morgan, 2011;
Milman, 2009). Technology experiences are much different for students today than

28
generations before them. The engagement of faculty in a series of collaborative study
sessions of the IPI-T data does not teach faculty how to use educational technology but
rather how students are engaging in the learning during the instructional activity.
Engagement of faculty in Faculty Collaborative Study Sessions have been shown to have
the capacity to remove barriers to technology use by teachers to fulfill instructional goals,
increase teachers’ ability beliefs, increase student usage of technology, and positively
impact student cognitive engagement and academic success. The IPI and IPI-T
encourages faculty members to work towards a balance of higher and lower levels of
student cognitive engagement through incremental changes in instructional practice
(Dennis, 2013). The theoretic underpinnings of the IPI and IPI-T process points to a firm
grounding in Bloom’s Taxonomy, Bloom’s Revised Taxonomy, and the most recent
Bloom’s Digital Taxonomy.
Bloom’s taxonomy. Benjamin S. Bloom published a handbook in 1956 titled,
Taxonomy of Educational Objectives: The Classification of Educational Goals.
Handbook 1: Cognitive Domain (Anderson & Krathwohl, 2001; Bloom, 1956; Forehand,
2011). Bloom was considered one of the most influential theorists to promote mastery
learning and higher level thinking (Forehand, 2011). Bloom created a taxonomy or
classification system that organized educational objectives according to their cognitive
complexity (Churches, 2008; Forehand, 2011; Anderson & Krathwohl, 2001). Referred to
as a framework, the taxonomy of educational objectives is made up of six major
categories of the cognitive domain (Anderson & Krathwohl, 2001; Bloom, 1956;
Krathwohl, 2002). Forehand (2011) stated, “Bloom’s Taxonomy is a multi-tiered model
of classifying thinking according to six cognitive levels of complexity” (p. 2). Depicted

29
as a stairway, many teachers have encouraged their students to ‘climb to a higher (level
of) thought’ (Forehand, 2011, p. 2). The lowest three levels are: knowledge,
comprehension, and applications. The highest three levels are: analysis, synthesis, and
evaluation. The taxonomy is hierarchical; each level leads up to the higher levels. It is
this arrangement or hierarchy that has led to the ‘natural divisions of lower and higher
level thinking’ (Forehand, 2011).
The original taxonomy or framework created by Bloom was a way to classify
(Anderson & Krathwohl, 2001; Bloom, 1956; Forehand, 2011; Krathwohl, 2002) what
“we expect or intend students to learn as a result of instruction” (Krathwohl, 2002, p.
212). Bloom saw the original Taxonomy as more than a measurement tool and believed it
could serve as a common language about learning goals to facilitate communication
across persons, subject matter, and grade levels” (Krathwohl, 2002). According to
Krathwohl (2002), Bloom believed the original taxonomy could serve as a:
1. Common language about learning goals to facilitate communication across
persons, subject matter, and grade levels.
2. Basis for determining particular course or curriculum the specific meaning of
broad educational goals, such as those found in the currently prevalent national, state, and
local standards.
3. Means for determining the congruence of educational objectives, activities, and
assessment in a unit, course, or curriculum.
4. Panorama of the range of educational possibilities against which the limited
breadth and depth of any particular educational course or curriculum could be considered
(p. 212).

30
Bloom’s revised taxonomy. A former student of Bloom’s, Lorin Anderson along
with David Krathwohl, led a group in an effort to update the original Bloom’s Taxonomy
to add relevance for students and teachers in the 21st century (Churches, 2008; Forehand,
2011; Anderson & Krathwohl, 2001). Major changes include the use of verbs rather than
nouns for each category as well as the arrangement of the sequence within the taxonomy
and the omission of synthesis and addition of creating (Churches, 2008 & Anderson &
Krathwohl, 2001).
Figure 2. Bloom’s Taxonomy and Bloom’s Revised Taxonomy. A visual representation showing the
revisions made to the original Bloom’s Taxonomy resulting in the omission of synthesis and the addition of
creating. Retrieved from http://burtonslifelearning.pbworks.com/f/BloomDigitalTaxonomy2001.pdf.
Reprinted with permission from Andrew Churches.
Both versions of Bloom’s represent the process of learning. The arrangement of
the six categories may lead others to believe one must first remember to understand and
apply, and so on, that is not the case (Churches, 2008; Krathwohl, 2002). But rather a
hierarchy exists within the six categories and are believed to differ in their complexity
(Krathwohl, 2002). For example, the act of understanding is said to be more complex
than remembering but less complex than applying (Krathwohl, 2002).
31
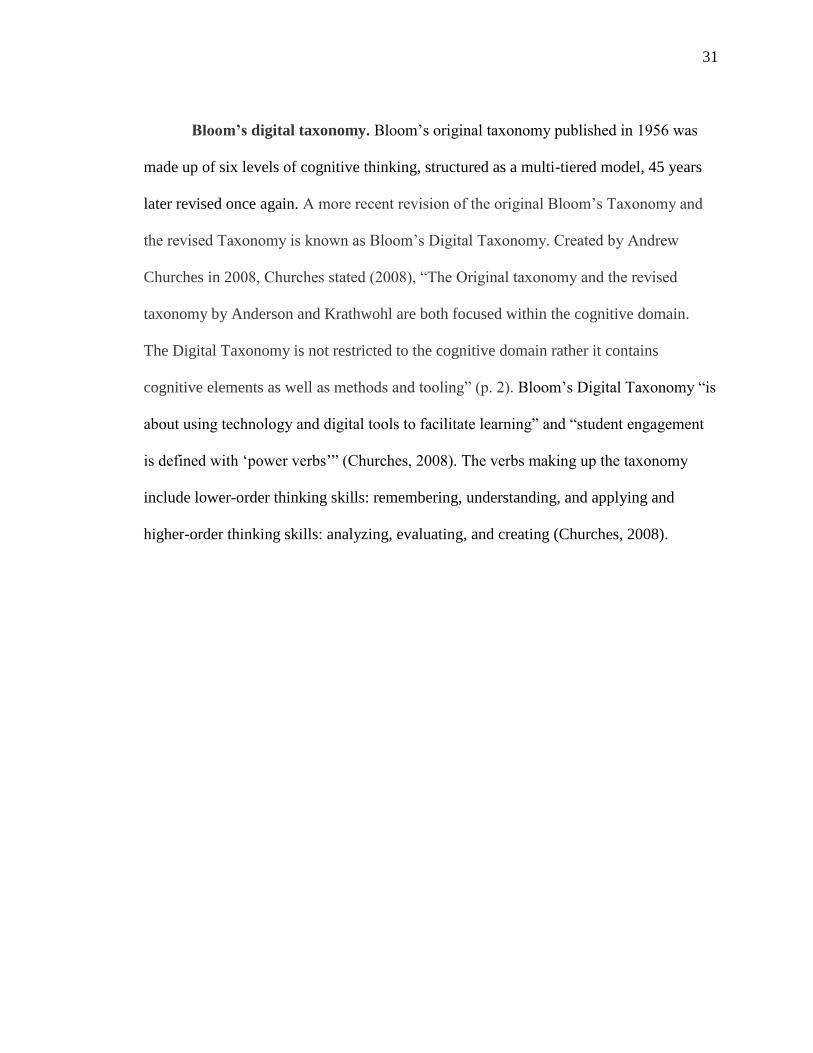
Bloom’s digital taxonomy. Bloom’s original taxonomy published in 1956 was
made up of six levels of cognitive thinking, structured as a multi-tiered model, 45 years
later revised once again. A more recent revision of the original Bloom’s Taxonomy and
the revised Taxonomy is known as Bloom’s Digital Taxonomy. Created by Andrew
Churches in 2008, Churches stated (2008), “The Original taxonomy and the revised
taxonomy by Anderson and Krathwohl are both focused within the cognitive domain.
The Digital Taxonomy is not restricted to the cognitive domain rather it contains
cognitive elements as well as methods and tooling” (p. 2). Bloom’s Digital Taxonomy “is
about using technology and digital tools to facilitate learning” and “student engagement
is defined with ‘power verbs’” (Churches, 2008). The verbs making up the taxonomy
include lower-order thinking skills: remembering, understanding, and applying and
higher-order thinking skills: analyzing, evaluating, and creating (Churches, 2008).

32
Figure 3. Mind Map of Bloom’s Revised Digital Taxonomy. A mindmap of elements and digital verbs
within Bloom’s Revised Digital Taxonomy. Retrieved from http://burtonslifelearning.pbworks.com/f/
BloomDigitalTaxonomy2001.pdf. Reprinted with permission from Andrew Churches.
In an effort to align current teaching practices with the integration of technology and
reach today’s students, the IPI and IPI-T process assists in the collection of data to get an
insight into how students are cognitively engaged in the learning during the instructional
activity. The IPI and IPI-T encourages faculty members to study the data and think
collaboratively about ways to work towards a balance of higher and lower levels of
student cognitive engagement through incremental changes in instructional practice
(Dennis, 2013). Categories 6 and 5 include learning activities that fall within the higher-
order, deeper thinking spectrum of Bloom’s Taxonomy and Bloom’s Digital Taxonomy

33
such as analysis and creating while Categories 4, 3, and 2 include lower-order, surface
thinking activities such as recalling simple facts and googling for answers.
Description of the Instructional Practice Inventory
In 1995 a professor at the University of Missouri, named Jerry Valentine along
with a graduate research assistant, Brian Painter developed the Instructional Practice
Inventory (IPI) process. They set out to create a tool that would document “the degree of
change in engagement and instruction” during a two-year school improvement project.
The project included 10 elementary, 10 middle, and 10 high schools across Missouri. An
interesting fact surfaced after using the IPI process from 1996-98 with the targeted
schools, when faculty participated collaboratively and studied the data to problem solve
the meaning of the data, they were said to have made greater gains instructionally than
the faculty that did not collaboratively study their data. The IPI evolved from being a tool
to collect data to understand and study the degree of student engagement into a “process
of data collection and collaborative study”. In 1998-2002 the IPI was used to support
school improvement in other Missouri school as well as nationally recognized middle
schools. In 2002 a set of protocols and standards were developed to support professional
development and the implementation of the IPI process in additional schools. Since its
development, more than 22,000 educators have participated in and completed the IPI
Level 1 Workshop. Upon completion, educators are certified as IPI data collectors as well
as facilitators, enabling them to lead collaborative study sessions (Valentine, “User
Requirements,” n.d.).
Instructional practice inventory process. The IPI process is led by teacher-
leaders and carried out school-wide to collect data about student engagement. Shortly

34
after the collection of data the teacher-leaders facilitate faculty collaborative sessions in
an effort to disseminate the data and participate in collaborative conversations. The
process includes informing faculty of the six categories associated with student cognitive
engagement so faculty who study the profiles will view the data as a fair and accurate
representation of engagement within classrooms. All faculty have the opportunity to
reflect upon the data and deepen their understanding of how to most effectively engage
students in their respective classrooms (Valentine, 2012c). It is important to note the IPI
process is not used for evaluative purposes or by district administrators. In addition,
during the data collection process individual teachers are not noted but rather the
observation number, class period, subject, and whether the class is part of the core
courses or non-core courses.
Instructional practices inventory categories. The IPI Categories are represented
numerically (see Appendix A). Each category describes the level of student engagement
and are referred to as:
1. Student Active Engaged Learning (Category 6): Students are engaged in
higher-order thinking and developing deeper understanding through analysis, problem
solving, critical thinking, creativity, and/or synthesis. Engagement in learning is not
driven by verbal interaction with peers, even in a group setting. Examples of classroom
practices commonly associated with higher-order/deeper Active Engaged Learning
include: inquiry-based approaches such as project-based and problem-based learning;
research and discovery/exploratory learning; authentic demonstrations; independent
metacognition, reflective journaling, and self-assessment; and, higher-order responses to
higher-order questions.

35
2. Student Verbal Learning Conversations (Category 5): Students are engaged in
higher-order thinking and developing deeper understanding through analysis, problem
solving, critical thinking, creativity, and/or synthesis. The higher-order/deeper thinking is
driven by peer verbal interaction. Examples of classroom practices commonly associated
with higher-order/deeper Verbal Learning Conversations include: collaborative or
cooperative learning; peer tutoring, debate, and questioning; partner research and
discovery/exploratory learning; Socratic learning; and, small group or whole class
analysis and problem solving, metacognition, reflective journaling, and self-assessment.
Conversations may be teacher stimulated but are not teacher dominated.
3. Teacher-led Instruction (Category 4): Students are attentive to teacher-led
instruction as the teacher leads the learning experience by disseminating the appropriate
content knowledge and/or directions for learning. The teacher provides basic content
explanations, tells or explains new information or skills, and verbally directs the learning.
Examples of classroom practices commonly associated with Teacher-Led Instruction
include: teacher dominated question/answer; teacher lecture or verbal explanations;
teacher direction giving; and, teacher demonstrations. Discussions may occur, but
instruction and ideas come primarily from the teacher. Student higher order/deeper
learning is not evident.
4. Student Work with Teacher Engaged (Category 3): Students are engaged in
independent or group work designed to build basic understanding, new knowledge,
and/or pertinent skills. Examples of classroom practices commonly associated with
Student Work with Teacher Engaged include: basic fact finding; building skill or
understanding through practice, ‘seatwork’, worksheets, chapter review questions; and

36
multi-media with teacher viewing media with students. The teacher is attentive to,
engaged with, or supportive of the students. Student higher-order/deeper learning is not
evident.
5. Student Work with Teacher Not Engaged (Category 2): This category is the
same as Category 3 except the teacher is not attentive to, engaged with, or supportive of
the students. The teacher may be out of the room, working at the computer, grading
papers, or in some form engaged in work not directly associated with the students’
learning. Student higher-order/deeper thinking is not evident.
6. Student Disengagement (Category 1): Students are not engaged in learning
directly related to the curriculum.
The categories are not a hierarchy but rather “six distinct ways to categorize student
engagement” (Valentine, 2017). Categories 6 and 5 include learning activities that fall
within the higher-order/deeper thinking spectrum of Bloom’s Taxonomy such as analysis
and critical thinking while categories 4, 3, and 2 include lower-order surface thinking
activities such as recalling simple facts.
Description of the Instructional Practice Inventory Level I Basic Workshop
The goal is for participants in the IPI Level I Basic Workshop to gain the skills to
“document student engagement using a six-category observation system”: (a) two
categories document the frequency with which students are engaged in higher-
order/deeper thinking during learning time; (b) another category assesses the degree of
student attentiveness during teacher-led instruction; (c) two categories assess the degree
to which students are engaged during seatwork, practice, skill development and other
forms of surface learning; (d) and, one category documents the degree to which students

37
are disengaged during learning time (Valentine, 2012c). All data collectors and
facilitators of the faculty collaborative study of the data are required to have successfully
completed an IPI Level 1 Workshop. The workshop is eight hours and designed to
prepare teacher-leaders to collect IPI data within their own schools with “validity,
reliability, and inter-rater reliability as well as develop strategies for leading the faculty in
the collaborative study of the data” (Valentine, 2012c).
Description of the Instructional Practice Inventory – Technology
Early discussions in 2010-2011 among Valentine, technology specialists,
teachers, and school leaders, already using the IPI data collection process, led to the
piloting and field testing in 2011-12 of the IPI-T data collection process. The IPI-T is an
‘add-on’ component designed for schools that have experience with the IPI process and
are currently 1:1 (one technology device per student) or planning to soon become 1:1 or
high-tech schools. The IPI-T process builds upon the work of the basic IPI process and
provides additional data that allow the faculty to understand student cognitive
engagement when technology is being used to support the learning experience as
compared to classes when technology is not associated with the learning experience.
Additional components are documented as well: (a) how technology is being used to
support learning; (b) the type of technology used to support the learning experience; (c)
the designer of the technology; (d) the primary user of the technology, the teacher or
student. Data can be disaggregated by faculty multiple ways to match their goals for
student cognitive engagement (Valentine, 2015a; Valentine, 2015b).
Instructional practices inventory- technology process. The IPI-T process has
been designed to be led by teachers and carried out school-wide to collect data about

38
student cognitive engagement, how students are thinking when using technology. Shortly
after the collection of data the teacher-leaders facilitate faculty collaborative sessions in
an effort to disaggregate the data and participate in collaborative conversations. In
comparison to the IPI process the IPI data collection protocols for collecting basic IPI
data are followed when the IPI-Technology Component is added. The observation/data
collection process, however, is more complex. In the IPI-T process, the data collector
documents the total number of students and the numbers using and not using technology
and makes two IPI engagement codes, one for all students and one for ‘only the tech
students’. The data collector also documents how technology is being used for learning
(see Appendix B). Once again it is important to note neither the IPI or IPI-T process
should not be used for evaluative purposes or by district administrators. In addition,
during the data collection process individual teachers are not noted but rather the
observation number, class period, subject, and whether the class is part of the core
courses or non-core courses. All persons being observed remain anonymous (Valentine,
2015a).
Instructional practices inventory- technology categories. There are six IPI-T
categories. Each category describes the level of student cognitive engagement and are
referred to as (1) Student Disengagement; (2) Student Work with Teacher Not Engaged;
(3) Student Work with Teacher Engaged; (4) Teacher-led Instruction; (5) Student Verbal
Learning Conversations; (6) Student Active Engaged Learning. The IPI and the IPI-T
both utilize each of the six categories. It is important to note that the categories are not
considered a hierarchy but rather “six distinct ways to categorize student engagement”
(Valentine, 2017). Categories 6 and 5 include learning activities that fall within the

39
higher-order, deeper thinking spectrum of Bloom’s Taxonomy and Bloom’s Digital
Taxonomy such as analysis and creating while Categories 4, 3, and 2 include lower-order,
surface thinking activities such as recalling simple facts and googling for answers.
Tech-use categories and definitions. Following is a brief explanation of the
Tech-Use Categories and definitions (see Appendix C). The categories provide faculty
with details about how students are cognitively engaged for each form of tech use.
1. Word Processing. The students are using technology to produce written
documents. This category includes note taking, composing papers, editing, formatting,
and printing the written material.
2. Math Computations. The students are using technology to perform
mathematical computations. This category includes calculating, charting, and plotting
with hand-held calculators, spreadsheets, and statistical formulae.
3. Media Development. The students are using technology to collect, manipulate,
and/or create media. This category includes the use of technology to collect, edit, and/or
design photo, video, and/or audio data and presentations, as well as programming, writing
code, and web development.
4. Information Search. The students are using technology to search and/or gather
information for their learning task. This category includes the use of the Web and/or
other media to access facts, information, and/or insights available through the use of
technology.
5. Collaboration Among Individuals. The students are using technology to
interact with and/or collaborate with others to accomplish their learning task. This
category includes the use technology for all forms of synchronous (same time, usually

40
verbal), communication and many forms of near-synchronous (intermittent or streamed,
usually text chat) communication.
6. Experience-Based Immersion Learning. The students are using technology to
engage in a tech-driven, immersion learning experience. This category
includes the use of technology to engage students in game-based software,
intense interactive simulations, and virtual reality associated with classroom
learning goals.
7. Interactive/Presentation Technology. The students and/or teacher are using an
interactive or presentation tech tool to support the learning task. This category includes us
of software that supports the transfer of information among students and between
students and teachers.
8. Other. Occasionally the data collector may determine that none of the seven
options adequately describe how students are using technology. This “other” option
should be marked if that is the case. However, selection of this “other” option is
extremely unusual.
The first set of codes was collected within the targeted high school as a pilot of
the measurement tool in the fall of 2017, shortly after the purchase of Chromebooks. The
researcher noticed after 217 observations of 27 high school classrooms, 95 observations
were coded as students using technology and 59 observations were coded as teachers
using technology. When observed using technology, students were engaged in lower-
order, surface thinking activities 58.9% of the time. Coding took place four times during
the 2017-18 school year, collecting 217 codes. Overtime, the researcher noticed
technology use by the teacher decreased slightly, increasing student use of technology,

41
but disengagement increased dramatically as did the integration of activities that fall
within Categories 4, 3, and 2 on the IPI-T. This is not surprising as the researcher did not
implement the IPI-T process with fidelity. Valentine (2012b) stated, “The greater the
implementation integrity to these strategies, the greater the likelihood the school will see
positive academic results from their use of the IPI” (p. 1). Missing from the process
during the 2017-18 pilot of the IPI-T was the implementation of faculty collaboration
sessions. The sessions provide faculty with time to study the data after each data
collection, engage faculty in reflecting about the data, create collaborative learning
experiences to build new knowledge, and allows faculty voice in establishing annual
cognitive engagement goals.
Description of the Instructional Practices Inventory - Technology Workshop
The IPI Level I Basic Workshop and the IPI-T Component Workshop are both
full-day workshops. In the IPI Level I Workshop participants gain the skills to “document
student engagement using a six-category observation system” (Valentine, 2012a). The
IPI-T Component Workshop does not teach participants how to code the six IPI
categories due to time constraints and the necessary time needed to teach the IPI process
as well as the IPI-T process. Therefore, all participants in the IPI-T Component
Workshop must have successfully completed the IPI Level I Workshop with an accuracy
score of .80 or higher (Valentine, 2015a).
During the IPI-T Component Workshop, technology is used to view practice
examples and to understand the data coding, data entry, and data reporting spreadsheets
that accompany the IPI-T process. Coding skills are developed via practice examples and
guided practice in classrooms in which technology is being used to support learning. Data

42
collection reliability is the data collector’s accuracy across multiple similar observations.
This means when a data collector sees student engagement of a particular type (both in
the IPI and IPI-T coding process) at two different times (8:00 a.m. and again at 2:00 p.m.)
the observer is making the same (correct) code for the two scenarios. During the IPI
Level I Workshop and the IPI-T Component Workshop participants complete 40 to 50
practices codes. Each coding scenarios can be very different in nature to highly similar.
Scenarios provided cover different classroom learning contexts as well as a variety of
grade levels in an effort to establish coder’s consistent competence (“Users
Requirements” n.d.).
The process for developing the data collector’s validity, reliability, and inter-rater
reliability during is the central focus during both IPI Level I Basic Workshop and the
IPI-T Component Workshop. Participants are given multiple scenarios to code
independently and then share out with the entire workshop participants in to allow each
participant to recognize their growth in coding throughout the day but also to realize they
are growing together and building inter-rater reliability as they work together. This
transformation is crucial in the IPI and IPI-T learning process because data collectors
must have confidence that their colleagues who are collecting data are coding just as
accurately as they are throughout the school day (“Users Requirements” n.d.).
Description of Faculty Collaborative Study Sessions
According to Valentine (2017), “When IPI/IPI-T data are collected for the
purposes of school improvement, all teachers should have the opportunity to study the
data and reflect upon their perceptions of effective learning/instructions” (p. 3). Faculty
should converse about best practices and the value of the six categories. Once a baseline

43
is established, discussions about how to change the engagement profiles over time should
occur to ensure instructional design and teaching practices evolve.
Profiles of many schools have been collected by Valentine. His findings indicate
that conversations about the IPI/IPI-T data should take place in a setting of “trust and
inquiry, where teachers can be open, not defensive, about profile data” (Valentine, 2017).
Valentine, (2017) suggested when studying the data faculty should be reminded the data
represent a ‘snapshot in time’ of the entire school’s learning experiences, secondly the six
categories are ‘discreet’ not ‘continuous’, categories three through six are of value of
different times throughout the lesson, next the six categories are not a hierarchy, and
finally the six categories are distinct ways to categorize student cognitive engagement.
Strategies prescribed by Dr. Jerry Valentine (2012b) include:
1. Create a school IPI-T team
2. Educate the faculty about the process
3. Support the IPI-T team and the process
4. Collect data multiple times per school year
5. Inform the faculty of upcoming data collections
6. Collect systematic, proportionate samples
7. Meet as a faculty to study the data after each data collection
8. Engage the faculty in reflecting about the data collection day
9. Engage the faculty in comparisons of the data
10. Create collaborative learning experiences to build new knowledge
11. Disaggregate data per faculty requests
12. Establish annual cognitive engagement goals which support higher-order

44
deeper thinking skills
13. Arrange the setting for collaborative faculty learning
14. Understand faculty perspectives and progress accordingly
The first data collection profile should serve as baseline data and future data
collections provide longitudinal perspectives of engaged learning for the school.
Valentine (2017) recommends each school collect data four times each school year to
achieve optimum impact. Teacher leaders collecting the data should engage faculty in
studying the data to identify patterns, trends, and changes in each data profile as well as
establish and deliver purposeful professional development and continuous conversations.
Valentine (2017) stated, “To make a difference in student cognitive engagement, the
faculty IPI/IPI-T collaborative conversations must progress from merely studying profile
percentages to learning discussions that deepen knowledge, build a commitment to
refinement of instructional practices, particularly increasing higher-order/deeper thinking
time and reducing disengagement during class time” (p. 3).
Valentine (2012c) has collected tens of thousands of codes, educating more than
23,000 educators in the IPI-T data collection process. Valentine (2012c) explained,
“Findings from our quantitative studies of the relationships between IPI-T cognitive
engagement data and achievement parallel findings from other studies of the past two to
three decades, i.e. increasing engagement and higher-order deeper thinking during
learning time and conversely reducing disengagement during learning time positively
influence student academic success” (p. 1).
The IPI-T was created through the collaborative discussions among Dr. Jerry
Valentine, technology specialists, teachers, and school leaders in an effort to address the

45
growing use of technology in the classroom. The IPI-T was built upon the work of the
basic IPI process to provide faculty with additional data to understand student cognitive
engagement when technology is being used in the classroom. It is a walkthrough
observation process designed to collect data concerning how often and in what ways
teachers are integrating technology as well as how often students are cognitively engaged
in higher-order, deeper (HO/D) thinking as well as lower-order, surface (LO/S) thinking.
The implementation of the IPI-T process includes engaging faculty in collaborative
sessions within one week after each data collection. Faculty collaborative sessions allow
all faculty to reflect about the data and establish cognitive engagement goals.
Implementing the entire IPI-T with fidelity increases the likelihood that the targeted
schools will see a positive influence on student achievement as they move toward a 1:1
environment.
Summary
Chapter 2 is an exhaustive review of the literature looking at today’s students,
Generation Z and Alpha. Also, a historical and thorough description of the IPI and IPI-T
process and categories is provided. Next is a look at the transformation of Bloom’s
Taxonomy to what we know now as Bloom’s Digital Taxonomy, as well as an
examination of experiences with technology among students and teachers. Finally, an
explanation of how the IPI and IPI-T process, including the implementation of the
Faculty Collaborative Sessions, have been used to breakdown the barrier to technology
use and increase student cognitive engagement and higher-order thinking.
Research Questions
The guiding questions for this research study are as follows. Research Questions

46
1-4 are quantitative. Research Questions 5-6 are qualitative. Research Question 7 is
mixed method.
1. To what extent does participation in faculty collaborative study sessions affect
faculty’s technology use as measured by codes on the Instructional Practices Inventory-
Technology (IPI-T)?
Ho: Participating in faculty collaborative study sessions has no affect on faculty’s
technology use as measured by codes on the Instructional Practices Inventory –
Technology (IPI-T)
Ha: Participating in faculty collaborative study sessions does affect faculty’s technology
use as measured by codes on the Instructional Practices Inventory – Technology (IPI-T)
2. To what extent does participation in faculty collaborative study sessions affect
student’s technology use as measured by codes on the Instructional Practices Inventory-
Technology (IPI-T)?
Ho: Participating in faculty collaborative study sessions has no affect on students’
technology use as measured by codes on the Instructional Practices Inventory –
Technology (IPI-T)
Ha: Participating in faculty collaborative study sessions does affect students’ technology
use as measured by codes on the Instructional Practices Inventory – Technology (IPI-T)
3. What categories of technology use, as defined by the IPI-T, are most frequently
used in 9-12 classrooms within the targeted district?
4. What categories of technology use, as defined by the IPI-T, are most frequently
coded when student cognitive engagement codes 5 and 6 are recorded?
5. How do faculty view their participation in faculty collaborative study sessions?

47
Specifically, did participating affect the teacher’s use of technology use in the classroom?
6. How do faculty view their participation in faculty collaborative study sessions?
Specifically, did participating affect students’ use of technology use in the classroom?
7. How does the qualitative follow-up data help us to better understand the
quantitative first-phase results?

48
Chapter 3: Methodology
Overview
The purpose of this explanatory-sequential mixed methods study was to assess the
impact of the IPI-T process on technology use and student cognitive engagement. The
goal was to implement all strategies, including faculty collaborative study sessions four
times per year to support teacher implementation of new technology to increase higher-
order, deeper thinking by students and increase student use of technology. The impact
was measured by comparing IPI-T data codes of those faculty that participate in the
faculty collaborative study sessions with baseline data prior to the implementation of the
faculty collaborative study sessions as well as participant responses from a web-based
questionnaire created by the researcher.
The design employed was an explanatory-sequential mixed methods approach.
The explanatory-sequential approach allowed the researcher to look at key results in more
detail, assuming either surprising or unexpected results may occur in the quantitative
phase of the study. The additional collection of qualitative data helped to further
understand the results (Creswell, 2015). Qualitative data collection followed the
quantitative phase with priority or emphasis placed on the quantitative results.
The quantitative portion of this study used the IPI-T instrument, a pre-determined
and numerically coded instrument, to collect data concerning the frequency and scale of
student cognitive engagement as technology is integrated into the classroom (Larinee,
2003; Valentine 2015c). Observational data collected using the IPI-T was recorded
numerically for analysis and interpretation through descriptive and inferential statistics
(Valentine 2015c).

49
Data collected from the qualitative strand was analyzed for themes and then because the
data was collected in sequence, findings were associated with the quantitative results of
the IPI-T to determine how and why the data converged.
A web-based questionnaire, created by the researcher, was used to collect
qualitative data. The questionnaire consisted of both closed-ended and open-ended
questions. According to Creswell (2015), there is an advantage to creating a questionnaire
with both closed and open-ended questions. The closed-ended questions are
predetermined and can “net useful information to support theories and concepts in the
literature” (Creswell, 2015, p. 219). Those participating in the qualitative phase and
responding to the questionnaire included eight faculty members, four representing core
courses, and four representing non-core courses. Prior to sharing the questionnaire with
participants two committees participated in the creation and validation of the questions. A
formative committee made up of three members from the IPI-T data collection team
assisted in the formation and revision of the questions. In addition, three experts from the
field served as the summative committed to validate the survey. The experts included the
creators of the IPI-T instrument, as well as a Research Associate from Rockman et al.
Finally, prior to surveying participants, two classroom teachers and one instructional
coach trained in the collection of IPI-T data piloted the survey.
Participants
The research participants are employed within a school district located in
southern, rural Iowa. The district includes five buildings: (a) preschool; (b)
kindergarten and first grade; (c) second through fifth grade; (d) the middle school
which houses students in grades six through eight; (e) the high school, grades nine

50
through twelve. This research study involved only the high school, grades 9-12
because technology is nearly one device per two students.
Quantitative. A nonprobability sampling approach was utilized. Popular
approaches in nonprobability sampling are convenience and snowballing sampling
approaches (Creswell, 2015). A convenience sampling strategy was employed for the
quantitative strand of the study because participants must be willing and available to
participate (Creswell, 2015; Edmonds & Kennedy, 2017). Participants included 27
faculty members, 11 males and 16 females. Each participated in faculty collaborative
study sessions within one week from the collection of data using the IPI-T Recorder
App. A Google Form was distributed to collect demographic information such as age,
ethnicity, educational level, and number of years of teaching experience. By
submitting the online survey, participants consented to volunteer to participate in the
study.
Qualitative. The sampling strategy for the qualitative strand was a purposeful
sample, utilizing a confirming and disconfirming sampling procedure during the study to
follow up on and explore specific findings (Creswell, 2015). A single person from each
content area, listed on the IPI/IPI-T Data Recording Form, was identified and invited to
volunteer to participate in an open-ended, web-based questionnaire. Content areas
included core classes: math, science, social studies, and English and language arts, as
well as non-core classes: fine and performing arts, physical education and health,
vocational technology, and special education. There was a possibility of eight
participants, four representing core courses, and four representing non-core courses.
According to Creswell, (2015) purposeful sampling allows the researcher to select

51
individuals or sites that are “information rich” and may provide useful information about
the central phenomenon (p. 205). In addition, purposeful sampling gives freedom to the
researcher to choose individuals that may otherwise be silenced but rather give them a
voice (Creswell, 2015).
Instruments
Instructional practice inventory – technology. The Instructional Practice
Inventory – Technology (IPI-T) is a walkthrough observation tool designed to collect
data concerning how often and in what ways teachers are integrating technology as well
as how often students are cognitively engaged in higher order, deeper thinking and can be
used to help faculty align technology standards both at grade level and content areas.
Instructional practices inventory- technology process. Led by teacher-leaders,
the IPI-T process is implemented school-wide, collecting data about student cognitive
engagement to show how students are thinking when using technology. Within a week
after the collection of data, the teacher-leaders facilitate faculty collaborative sessions in
an effort to disaggregate the data and participate in collaborative conversations. In
comparison to the IPI process, the IPI data collection protocols for collecting basic IPI
data will follow when the IPI-Technology Component is added. The observation/data
collection process, however, is more complex. In the IPI-T process, the data collector
documents the total number of students and the numbers using and not using technology
and makes two IPI engagement codes, one for all students and one for ‘only the tech
students’. The data collector documents how technology is being used for learning
(Valentine, 2015a).
Instructional practices inventory-technology categories. There are six IPI-T

52
categories. Each of the categories are represented numerically (see Appendix A). The six
categories describe the level of student cognitive engagement and are referred to as (a)
Student Disengagement; (b) Student Work with Teacher Not Engaged; (c) Student Work
with Teacher Engaged; (d) Teacher-led Instruction; (e) Student Verbal Learning
Conversations; (f) Student Active Engaged Learning. The IPI and the IPI-T both utilize
each of these categories. It is important to note that the categories are not considered a
hierarchy but rather “six distinct ways to categorize student engagement” (Valentine,
2017). Categories 6 and 5 include learning activities that fall within the higher-order,
deeper thinking spectrum of Bloom’s Taxonomy and Bloom’s Digital Taxonomy such as
analysis and creating while Categories 4, 3, and 2 include lower-order, surface thinking
activities such as recalling simple facts and googling for answers. Category 6 is coded
when students are engaged in higher-order thinking and developing deeper understanding
through analysis, problem solving, critical thinking and creativity. Likewise, Category 5
only differs from Category 6 because the higher-order, deeper thinking is driven by peer
verbal interaction. Teacher-led instruction is coded as a Category 4. Category 3 students
are engaged in independent or group work designed to build basic understanding, new
knowledge, and/or pertinent skills. This category is the same as Category 3 except the
teacher is not attentive to, engaged with, or supportive of the students. Category 1 is
associated with students not engaged in learning directly related to the curriculum.
Tech-use categories. According to Valentine (2015d) categories provide faculty
with details about how students are cognitively engaged for each form of tech use.
Following is a list of the Tech-Use Categories (see Appendix C) (1) Word Processing; (2)
Math Computations; (3) Media Development; (4) Information Search; (5) Collaboration

53
Among Individuals; (6) Experience-Based Immersion Learning; (7) Interactive
Presentation Technology; and (8) Other (Valentine, 2015d).
Procedures
Research design. The design employed was an explanatory-sequential mixed
methods approach. The explanatory-sequential approach allowed the researcher to look at
key results in more detail and assuming either surprising or unexpected results may occur
in the quantitative phase of the study, additional collection of qualitative helped to further
understand the results (Creswell, 2015). Qualitative data collection followed the
quantitative phase with priority or emphasis placed on the quantitative results.
The quantitative portion of this study used data from the IPI-T instrument, a pre-
determined and numerically coded instrument, to collect data concerning the frequency
and scale of student cognitive engagement when technology was integrated into the
classroom (Larinee, 2003; Valentine 2015c). Observational data collected using the IPI-T
was recorded numerically for analysis and interpretation through descriptive and
inferential statistics (Valentine 2015c).
Data collected from the qualitative strand was analyzed for themes and then
because the data was collected in sequence, findings were associated with the quantitative
results of the IPI-T to determine how and why the data converged.
Quantitative data collection. Participation in this study was not a requirement.
However, if a faculty member chose to participate, after receiving an overview of this
research study, they were asked to sign a research consent form. Each participant was
given a signed copy of this form to keep. In addition to the general consent form, consent
was sought at the district level, requiring approval from the district’s superintendent.

54
IPI-T data collection process required 3-5 minutes in the classroom for the IPI
data collection process and these additional steps:
Before entering the learning setting the researcher:
1. Recorded the Page Number at the top right portion of the Data Recording Form.
2. Recorded the Observation Number on the upcoming observation.
Upon entry into the learning setting the researcher:
3. Made a whole-class mental snapshot of student engagement, same as when
collecting basic IPI data.
During the time in the learning setting the researcher:
4. Took an entry snapshot, worked the learning setting, moved among the students
and talked with the students and teacher, if necessary, to obtain the specific details of the
big picture snapshot taken upon entry. Next, a determination was made of the IPI
Category that most appropriately defined student cognitive engagement for that learning
setting. The IPI data collection protocols explained in the basic IPI Workshop govern
both the IPI and IPI-T category codes. The researcher left the learning setting before
recording the student engagement codes for both the IPI and IPI-T student engagement
category codes.
5. Counted and recorded the total number of students in the learning setting during
or immediately after leaving the learning setting.
6. Counted and recorded the number of students (if any) who were disengaged in the
learning task(s) during or immediately after leaving the learning setting.
7. Counted and recorded the number of students (if any) who were using technology

55
(and those who are supposed to be using technology) as part of their learning experience.
Verified the total number of tech users and supposed-to-be users during or immediately
after leaving the learning setting.
8. Counted and recorded the number of students who were supposed to be using
technology but were disengaged from the learning task(s) during or immediately after
leaving the learning setting.
Determined the IPI-T tech use category:
9. During the time spent in the learning setting (classroom) it was
necessary to determine student head counts and IPI/IPI-T Codes. In addition, the
researcher determined how technology was being used by the students or by the teacher if
only the tech user was the teacher.
10. The IPI-T Tech-Use Categories provided the faculty with details about how
students were cognitively engaged for each form of Tech Use. Therefore, the data
collector identified the Tech-Use Category that represented how the greatest number
(most) of the “technology engaged” students were using technology (or, how the teacher
was using technology if the teacher was the only user of the technology and no students
were actively engaged in the use of technology). Recorded the Tech Use Category
number on the Data Recording Form. When students were using technology in multiple
ways, the data collector counted the varied uses and then selected the Tech Use Category
most frequently used. Data collectors were encouraged to record information and make
margin notes if needed. If no students were using, or supposed to be using technology,
“0” was recorded in the appropriate locations on the Data Recording Form.
After leaving the learning setting the researcher:
56
11. Determined the primary user of the technology. Student use carries
precedent in the coding process over teacher use for identifying the Tech-Use Category
(i.e. if students and the teacher were using technology, student use, not teacher use, was
recorded). For student use, the technology must be fostering active/direct student
engagement, not passive engagement. For example, if the teacher was writing
information from the students on a SMART Board, the teacher was the primary user of
the technology, not the students. If the students were using their technology to engage
with the learning task, then the students were the primary user of technology. If the
teacher was the tech user (and no students are using tech) an IPI-T Category code was not
given. Only student use generated a cognitive IPI-T engagement code.
12. Determined the producer/developer of the technology. Coded “1” if the tech being
used was developed commercially specifically for education; “2” if the teacher developed
the technology or modified existing technology to personalize the learning experience for
the students; “3” if a student(s) developed the technology being used to support learning;
or, “4” if the technology was developed commercially and not specifically for education.
If the teacher influenced the learning experience (left a thumbprint) then the teacher was
given credit as a producer/developer. Thus, teachers can understand student cognitive
engagement when they have/have not personalized the technology for their students.
Finally, the researcher will double checked each row to be sure to have either marked a
code for all cells or placed a “line” through items on the row that did not need a code.
Qualitative data collection. Upon institutional review board approval, eight
participants, four representing core courses, and four representing non-core courses were
informed about the study face-to-face. They learned about the purpose of the study as

57
well as what to expect if they chose to participate. Once participants agreed they were
asked to complete an informed consent form prior to participating. After the consent
forms were complete, the eight participants responded to an open-ended, web-based
questionnaire created using Google Forms. The questionnaire was distributed during the
final faculty collaborative session to only those that agreed to participate.
Quantitative data analysis. An explanatory-sequential mixed method design was
employed. The quantitative method was a quasi-experimental within-subjects approach
utilizing a pretest and posttest design. Inferential statistics were used to analyze the
nominal data collected from the IPI-T to test the null hypothesis using the parametric
statistic of analysis of variance (ANOVA). According to Creswell, (2015) descriptive
statistics describe general tendencies in the data such as mean, median, and mode and are
used to summarize, organize and simplify the nominal data. In addition to inferential
statistics, descriptive statistics will be used to organize the nominal data in a frequency
distribution table to answer descriptive research questions three and four.
The ANOVA is the inferential statistics technique chosen for this quantitative
study because the test analyzes main effects of the independent variable on the outcome
or dependent variable as well as interactive effects. (Creswell, 2015; Reeves, n.d.). The
ANOVA is a parametric test and will be used to analyze main effects of participation in
faculty collaborative sessions and the effect on IPI-T student cognitive engagement
codes.
Table 1 shows each research question and the corresponding statistical analysis
that will be used for the study. Research questions 3 and 4 will employ descriptive
statistics to report the frequency for each IPI-T category of technology use and student
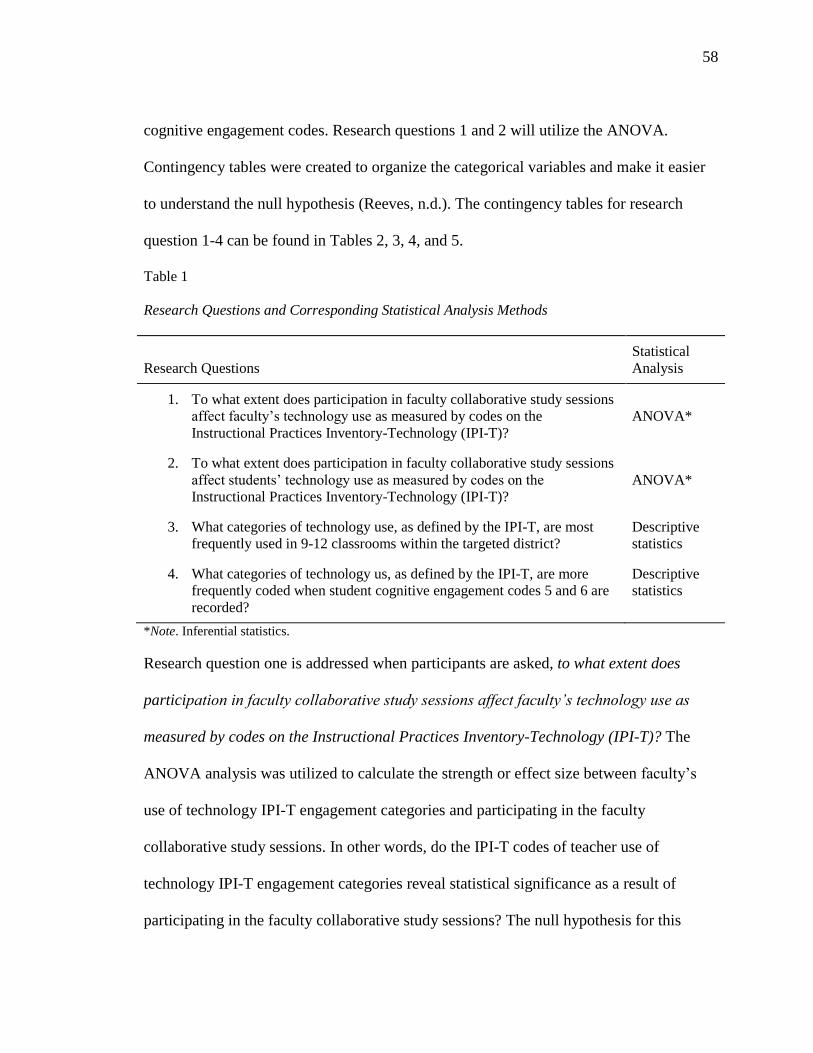
58
cognitive engagement codes. Research questions 1 and 2 will utilize the ANOVA.
Contingency tables were created to organize the categorical variables and make it easier
to understand the null hypothesis (Reeves, n.d.). The contingency tables for research
question 1-4 can be found in Tables 2, 3, 4, and 5.
Table 1
Research Questions and Corresponding Statistical Analysis Methods
Research Questions
Statistical
Analysis
1. To what extent does participation in faculty collaborative study sessions
affect faculty’s technology use as measured by codes on the
Instructional Practices Inventory-Technology (IPI-T)?
ANOVA*
2. To what extent does participation in faculty collaborative study sessions
affect students’ technology use as measured by codes on the
Instructional Practices Inventory-Technology (IPI-T)?
ANOVA*
3. What categories of technology use, as defined by the IPI-T, are most
frequently used in 9-12 classrooms within the targeted district?
Descriptive
statistics
4. What categories of technology us, as defined by the IPI-T, are more
frequently coded when student cognitive engagement codes 5 and 6 are
recorded?
Descriptive
statistics
*Note. Inferential statistics.
Research question one is addressed when participants are asked, to what extent does
participation in faculty collaborative study sessions affect faculty’s technology use as
measured by codes on the Instructional Practices Inventory-Technology (IPI-T)? The
ANOVA analysis was utilized to calculate the strength or effect size between faculty’s
use of technology IPI-T engagement categories and participating in the faculty
collaborative study sessions. In other words, do the IPI-T codes of teacher use of
technology IPI-T engagement categories reveal statistical significance as a result of
participating in the faculty collaborative study sessions? The null hypothesis for this
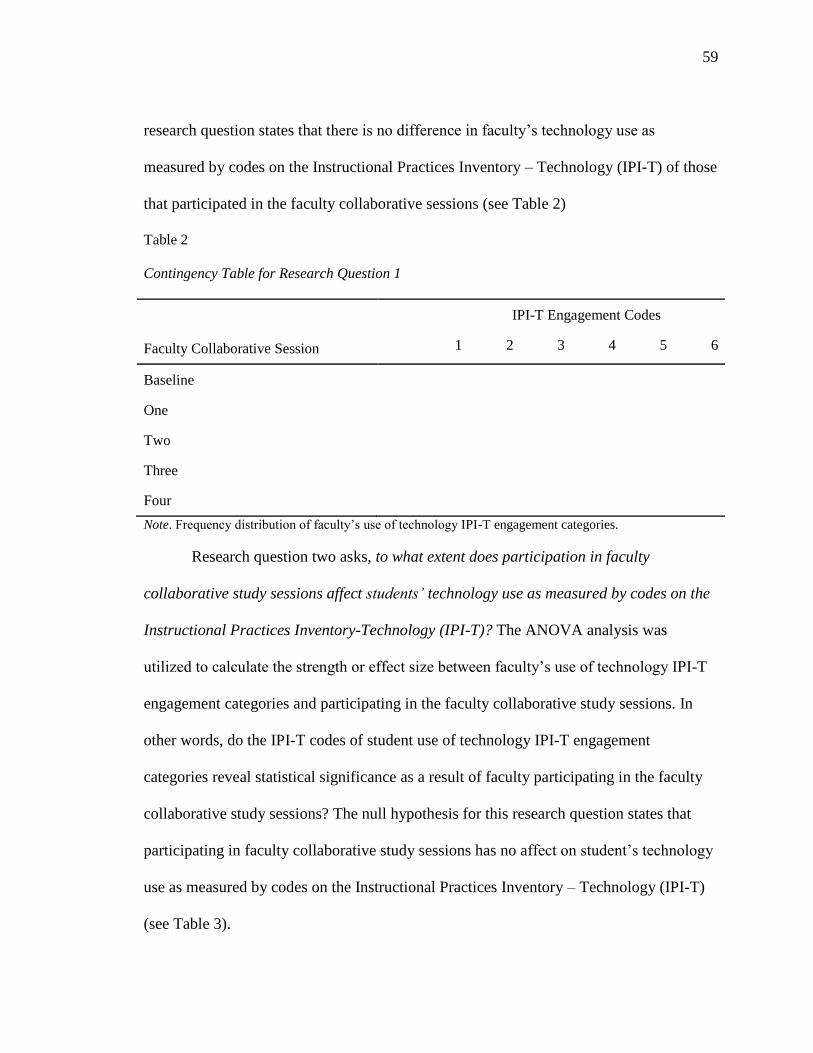
59
research question states that there is no difference in faculty’s technology use as
measured by codes on the Instructional Practices Inventory – Technology (IPI-T) of those
that participated in the faculty collaborative sessions (see Table 2)
Table 2
Contingency Table for Research Question 1
Faculty Collaborative Session
IPI-T Engagement Codes
1 2 3 4 5 6
Baseline
One
Two
Three
Four
Note. Frequency distribution of faculty’s use of technology IPI-T engagement categories.
Research question two asks, to what extent does participation in faculty
collaborative study sessions affect students’ technology use as measured by codes on the
Instructional Practices Inventory-Technology (IPI-T)? The ANOVA analysis was
utilized to calculate the strength or effect size between faculty’s use of technology IPI-T
engagement categories and participating in the faculty collaborative study sessions. In
other words, do the IPI-T codes of student use of technology IPI-T engagement
categories reveal statistical significance as a result of faculty participating in the faculty
collaborative study sessions? The null hypothesis for this research question states that
participating in faculty collaborative study sessions has no affect on student’s technology
use as measured by codes on the Instructional Practices Inventory – Technology (IPI-T)
(see Table 3).

60
Table 3
Contingency Table for Research Question 2
Faculty Collaborative Session
IPI-T Engagement Codes
1 2 3 4 5 6
Baseline
One
Two
Three
Four
Note. Frequency distribution of students’ use of technology IPI-T engagement categories.
Research question three asks, what categories of technology use, as defined by the
IPI-T, are most frequently used in 9-12 classrooms within the targeted district? (see
Table 4). Descriptive statistics will be used to organize the nominal data in a frequency
distribution table to answer descriptive research question three.

61
Table 4
Contingency Table for Research Question 3
Category of Technology Use
IPI-T Engagement Categories
1 2 3 4 5 6
Word Processing
Math Computations
Media Development
Information Search
Collaboration Among Individuals
Experience-Based Technology
Interactive/Presentation Technology
Other
Note. IPI-T engagement categories associated with categories of tech use.
Research question four asks, what category of technology use, as defined by the
IPI-T, are most frequently coded when student engagement codes 5 and 6 are recorded?
(see Table 5). Descriptive statistics will be used to organize the nominal data in a
frequency distribution table to answer descriptive research question four.

62
Table 5
Contingency Table for Research Question 4
Category of Technology Use
IPI-T Engagement Categories
1 2 3 4 5 6
Word Processing
Math Computations
Media Development
Information Search
Collaboration Among Individuals
Experience-Based Technology
Interactive/Presentation Technology
Other
Note. IPI-T engagement categories associated with categories of tech use.
Qualitative data analysis. Table 6 shows each qualitative research question,
possible responses, and the type of question: closed-ended or open-ended. Using Google
Forms, a web-based questionnaire was created. According to Creswell (2015), there is an
advantage to creating a questionnaire with both closed and open-ended questions. The
closed-ended questions are predetermined and can “net useful information to support
theories and concepts in the literature” (Creswell, 2015, p. 219). Sub-questions a, c, and e
were followed by an open-ended question to explore reasons behind the participant’s
responses (see Table 5).

63
Table 6
Qualitative Questions on Web-Based Questionnaire
Qualitative Questions Type
1. Did you participate in all faculty collaborative study sessions? Closed-ended
2. “Participating in faculty collaborative study sessions
affected my use of technology in my classroom.”
___________ Do you strongly agree?
___________ Do you agree?
___________ Are you undecided?
___________ Do you disagree?
___________ Do you strongly disagree?
Closed-ended
3. Please explain your response in more detail. Open-ended
4. “Participating in faculty collaborative study sessions
affected my students’ use of technology in my classroom.”
___________ Do you strongly agree?
___________ Do you agree?
___________ Are you undecided?
___________ Do you disagree?
___________ Do you strongly disagree?
Closed-ended
5. Please explain your response in more detail. Open-ended
Note. Distributed face-to-face during final faculty collaborative session.
This study is based on an explanatory-sequential approach. Using the participant-
selection design, quantitative data was collected, analyzed, and the results were
interpreted. Next the participants were selected for the qualitative phase using a means of
purposeful sampling. Following selection of participants, qualitative data was collected,
analyzed, and the results were interpreted (Edmonds & Kennedy, 2017). Looking for
overlapping themes within the open-ended questions, the researcher counted and
recorded themes or the number of times that the participants mention particular themes.
This self-designed protocol assisted in the organization of information reported by each

64
participant to each question (Creswell, 2015). Finally, both quantitative and qualitative
data were interpreted to determine how and why the data converged (Edmonds &
Kennedy, 2017).
Data integration. Data collected during the quantitative phase was the emphasis
of this study. After identifying themes, the qualitative strand was analyzed and then
because the data was collected in sequence, findings were associated with the quantitative
results of the IPI-T to determine how and why the data converged. In addition, the
researcher used the qualitative data to explore any key results found when collecting
quantitative data that lead to the acceptance or rejection of the null hypothesis.
Trustworthiness of the qualitative data was achieved through triangulation of the data.
The nature of this explanatory sequential mixed method design included the best of both
quantitative and qualitative data to inform or cast light on the topic of study and to valid
claims that arose from the study (Creswell, 2015; Olsen, 2004).
Limitations
When conducting this explanatory sequential mixed method design the
quantitative phase of the study was conducted first and followed up with the qualitative
phase (Creswell, 2015; Edmonds & Kennedy, 2017). A difficulty using this design was
that the researcher needed to decide which aspect of the quantitative results to follow-up
on using qualitative data (Creswell, 2015). In addition, participants were chosen during
the second, qualitative phase. The questions created for the second phase needed to build-
on the quantitative phase in an effort to further understand the results (Creswell, 2015).
This design was labor intensive because the researcher collected and analyzed two types
of data, quantitative and qualitative.

65
According to Edmonds and Kennedy, (2017) “Major challenges when conducting
research are often related to access to participants and an inability to randomly assign the
participants to conditions” (p. 57). For this reason, the researcher chose to employ a
quasi-experimental within-subjects approach utilizing a pretest and posttest design. The
major difference between experimental and quasi-experimental is the “level of control
and assignment to conditions” (Edmonds & Kennedy, 2017, p. 33). One group
participated in this study. A convenience sampling strategy was employed for the
quantitative strand of the study because participants were willing and available to
participate (Creswell, 2015; Edmonds & Kennedy, 2017). The sample of teachers chosen
from the population of teachers in the district was relatively small. The targeted district
employs 100 teachers, 27 are employees within the high school chosen for the study. The
sampling strategy for the qualitative strand was a purposeful sample, utilizing a
confirming and disconfirming sampling procedure during the study to follow up on and
explore specific findings (Creswell, 2015). A subgroup of eight teachers from the sample
was asked to participate in the qualitative phase. Participants from the small subgroup
had the potential to provide useful information for answering questions and hypotheses,
however, it is difficult for the researcher to say with confidence that the individuals
represented the entire teacher population (Creswell, 2015; Edmonds & Kennedy, 2017).
Additional disadvantages to this approach were threats to internal validity which include
maturation and history because the study took place over the course of several months
(Edmonds & Kennedy, 2017). Edmonds and Kennedy (2017) stated, “Maturation is the
natural process of changing, growing, and learning over time” and “History is any event
that occurs during the time of the treatment and the posttest that could affect the outcome

66
(e.g., natural life events such as a death in the family, change in job, or moving)” (p. 7).
Further, an assumption is observations represented typical school days, and that teachers
did not alter instruction when the IPI-T data collection team was present.
While the possibility of observer bias exists, training was provided to all teacher
leaders who collected codes in an effort to standardize data collection. It is important to
know that the process for developing the data collector’s validity, reliability, and inter-
rater reliability during was the central focus during both IPI Level I Basic Workshop and
the IPI-T Component Workshop. Participants were given multiple scenarios to code
independently and then share out with the entire workshop participants in order to allow
each participant to recognize their growth in coding throughout the day but also to realize
they were growing together and building inter-rater reliability as they worked together.
This transformation was crucial in the IPI and IPI-T learning process because data
collectors must have confidence that their colleagues who are collecting data are coding
just as accurately as they were throughout the school day (“Users Requirements” n.d.).
Upon the conclusion of each IPI-T workshop participants were required to
complete a Reliability Assessment. The assessment results were sent directly to the
participant and were not shared with others. Reliability ratings were used to gauge how
each individual was able to participate in the IPI-T process (“Users Requirements” n.d.):
1. A reliability score of .90 or higher was necessary for permission to use the IPI-T
Process for research purposes.
2. A reliability score of .80 or higher was necessary for permission to use the IPI-
Process for internal use within a school or district to collect data for faculty study for
school improvement.

67
3. A reliability score .70-.79 indicated the IPI-T Process may be used for personal or
informal use only – not for research or to use in school improvement.
4. A reliability score below .70 indicated the IPI-T Process should not be used for
data collection.
The researcher earned a reliability score of .95 on the IPI assessment and .98 on the IPI-T
assessment. Each member on the data collecting team completed the IPI Level I Basic
Workshop and IPI-T Component Workshop and earned a reliability score higher than .90
on both the IPI and IPI-T assessment (J. Valentine, personal communication, October 4,
2017).

68
Chapter 4: Results
In Chapter 3, the data collection and analysis procedures and research design were
presented. The quantitative phase of the study used the IPI-T data collection tool and the
qualitative phase utilized a questionnaire. Representing both core and non-core courses,
eight participants completed the web-based questionnaire during the final faculty
collaborative session.
Data collected during the quantitative phase was the emphasis of this study and
were used to answer Research Questions 1-4. Research Questions 5-6 were answered
during the qualitative phase of the study. After identifying themes, the findings were
analyzed and associated with the quantitative results of the IPI-T to determine how and
why the data converged to answer Research Question 7. In addition, the qualitative data
was used to explore key results found when collecting quantitative data. Following are
the research questions:
1. To what extent does participation in faculty collaborative study sessions affect
faculty’s technology use as measured by codes on the Instructional Practices Inventory-
Technology (IPI-T)?
2. To what extent does participation in faculty collaborative study sessions affect
student’s technology use as measured by codes on the Instructional Practices Inventory-
Technology (IPI-T)?
3. What categories of technology use, as defined by the IPI-T, are most frequently
used in 9-12 classrooms within the targeted district?
4. What categories of technology use, as defined by the IPI-T, are most frequently
coded when student cognitive engagement codes 5 and 6 are recorded?

69
5. How do faculty view their participation in faculty collaborative study sessions?
Specifically, did participating affect the teacher’s use of technology use in the classroom?
6. How do faculty view their participation in faculty collaborative study sessions?
Specifically, did participating affect students’ use of technology use in the classroom?
7. How does the qualitative follow-up data help us to better understand the
quantitative first-phase results?
Participants were faculty members employed within a school district located in
southern, rural Iowa. Although the district included five buildings: (a) preschool; (b)
kindergarten and first grade; (c) second through fifth grade; (d) the middle school
which houses students in grades six through eight; (e) the high school, grades nine
through twelve, this research study involved only the high school, grades 9-12,
because technology was nearly one device per two students. Due to the nature of this
mixed method study, two different sampling strategies were used for the quantitative
and the qualitative strands. Participants for the quantitative phase included the entire
faculty, equaling 27 participants. Of the 27 participants, 16 were females and 11 were
males. The qualitative phase included eight from the 27 participants, representing four
faculty members from core courses and four from non-core courses. Each subject area
was represented to include: English/language arts, social studies, science, and math as
well as special education, fine arts, career/technical education, and physical education.
Additionally, the eight participants were made up of four females and four males.
Demographic information is shown in Table 7 and 8.

70
Table 7
Demographics of Faculty Participants
Demographics* n % % %
Gender
Female
Male
16 59.2
11 40.8
Core Courses
English/Language Arts
Social Studies
Math
Science
4 14.8
4 14.8
3 11.1
3 11.1
Non-Core Courses
Special Education
Fine Arts
Career/Technical Education
Physical Education
4 14.8
3 11.1
4 14.8
2 7.5
*Note. High school faculty only (n=27)
Table 8
Demographics of Faculty Participants Taking the Questionnaire
Demographics* n % % %
Gender
Female
Male
4 50
4 50
Core Courses
English/Language Arts
Social Studies
Math
Science
1 12.5
1 12.5
1 12.5
1 12.5
Non-Core Courses
Special Education
Fine Arts
Career/Technical Education
Physical Education
1 12.5
1 12.5
1 12.5
1 12.5
*Note. High school faculty only identified from original sample (n=8)

71
Research Question 1
Research question 1 asks: To what extent does participation in faculty
collaborative study sessions affect faculty’s technology use as measured by codes on the
Instructional Practices Inventory-Technology (IPI-T)? To answer this question IPI-T data
were collected. The data was analyzed using the software program the Statistical Package
for Social Science (SPSS). A One-way ANOVA was performed to analyze any
differences that might have exist between the variables. Results can be found in Figure 4
and Tables 9, 10, and 11.
The null hypothesis stated that faculty collaborative sessions have no affect on
faculty’s technology use as measured by codes on the Instructional Practices Inventory –
Technology (IPI-T). A One-way ANOVA revealed a significant difference among the
baseline, first, second, third, and fourth faculty collaborative sessions, F (1, 1206) = 8.7,
p = .003. Baseline codes for teacher use (M = .45, SD = .498) were significantly higher
than the First (M = .39, SD = .489), and Second (M = .40, SD = .490) whereas Third (M =
.51, SD = .501), and Fourth (M = .52, SD = .500) were significantly higher than the
Baseline and Second. There was no significant difference in teacher technology use
between the Baseline data and the data collected prior to the Fourth faculty collaborative
session (p = .09). Consequently, the null hypothesis was rejected.

72
Figure 4. Observations: Teacher is the Tech User. Teacher is the technology user when IPI-T observations
were conducted.

73
Table 9
Multiple Comparisons IPI-T Teacher Technology Use
95% Confidence Interval
(J) FCS
Mean
Difference (I-
J) Std. Error Sig. Lower Bound Upper Bound
Baseline First .058 .047 .220 -.03 .15
Second .050 .048 .297 -.04 .15
Third -.068 .045 .132 -.16 .02
Fourth -.077 .045 .088 -.17 .01
First Baseline -.058 .047 .220 -.15 .03
Second -.007 .048 .875 -.10 .09
Third -.126* .044 .005 -.21 -.04
Fourth -.135* .044 .002 -.22 -.05
Second Baseline -.050 .048 .297 -.15 .04
First .007 .048 .875 -.09 .10
Third -.118* .045 .009 -.21 -.03
Fourth -.127* .046 .005 -.22 -.04
Third Baseline .068 .045 .132 -.02 .16
First .126* .044 .005 .04 .21
Second .118* .045 .009 .03 .21
Fourth -.009 .042 .827 -.09 .07
Fourth Baseline .077 .045 .088 -.01 .17
First .135* .044 .002 .05 .22
Second .127* .046 .005 .04 .22
Third .009 .042 .827 -.07 .09 *Note. The mean difference is significant at the 0.05 level.

74
Table 10
Teacher Technology Use
95% Confidence
Interval for Mean
FCS N Mean Std.
Deviation
Std.
Error
Lower
Bound
Higher
Bound
Minimum Maximum
Baseline 215 .45 .498 .034 .38 .51 0 1
First 229 .39 .489 .032 .33 .45 0 1
Second 207 .40 .490 .034 .33 .46 0 1
Third 280 .51 .501 .030 .46 .57 0 1
Fourth 277 .52 .500 .030 .46 .58 0 1
Total 1208 .46 .499 .014 .43 .49 0 1 Note. Teachers (n=27). FCS=Faculty Collaborative Sessions.
Table 11
ANOVA Effects of FCS* on Teacher Use of Technology
Sum of
Squares df Mean Square F Sig.
Between Groups 17.493 1 17.493 8.667 .003
Within Groups 2434.155 1206 2.018
Total 2451.648 1207
Note. p < .05
Research Question 2
Research question 2 asks: To what extent does participation in faculty
collaborative study sessions affect students’ technology use as measured by codes on the
Instructional Practices Inventory-Technology (IPI-T)? To answer these questions IPI-T
data were collected. The data was analyzed using the software program the Statistical
Package for Social Science (SPSS). A One-way ANOVA was performed to analyze any
differences that may exist between the variables Results can be found in Table 12, 13, 14,
and 15.
The null hypothesis stated that faculty collaborative sessions have no affect on
students’ technology use as measured by codes on the Instructional Practices Inventory –

75
Technology (IPI-T). A One-way ANOVA revealed a significant difference among the
baseline, first, second, third, and fourth faculty collaborative sessions, F (4, 1203) = 3.4,
p = .02. Baseline codes for student use (M = 1.67, SD = 2.17) were significantly higher
than the First (M = 1.40, SD = 2.05), and Second (M = 1.51, SD = 2.21) whereas the
Third (M = 1.81, SD = 2.14), and Fourth (M = 2.01, SD = 2.35) were significantly higher
than the Baseline and Second. There was no significant difference in students’
technology use between the Baseline data and the data collected prior to the fourth
faculty collaborative session (p = .08). Consequently, the null hypothesis was rejected.

76
Table 12
Multiple Comparisons IPI-T Student Engagement Codes
95% Confidence Interval
(I) FCS (J) FCS
Mean
Difference (I-
J) Std. Error Sig.
Lower Bound Upper Bound
Baseline First .268 .208 .199 -.14 .68
Second .158 .214 .461 -.26 .58
Third -.141 .199 .479 -.53 .25
Fourth -.345 .199 .084 -.74 .05
First Baseline -.268 .208 .199 -.68 .14
Second -.110 .210 .600 -.52 .30
Third -.409* .195 .037 -.79 -.03
Fourth -.613* .196 .002 -1.00 -.23
Second Baseline -.158 .214 .461 -.58 .26
First .110 .210 .600 -.30 .52
Third -.299 .201 .138 -.69 .10
Fourth -.502* .202 .013 -.90 -.11
Third Baseline .141 .199 .479 -.25 .53
First .409* .195 .037 .03 .79
Second .299 .201 .138 -.10 .69
Fourth -.204 .186 .273 -.57 .16
Fourth Baseline .345 .199 .084 -.05 .74
First .613* .196 .002 .23 1.00
Second .502* .202 .013 .11 .90
Third .204 .186 .273 -.16 .57 *Note. The mean difference is significant at the 0.05 level.

77
Table 13
Student Cognitive Engagement Codes
IPI-T Engagement Codes for Students
FCS
No
Tech
Used
Disengaged
L/O
Teacher
Not
Engaged
L/O
Teacher
Engaged
Teacher
Led
H/O
Students
Verbal
H/O
Students
Non-
Verbal
Total
Baseline 120 4 22 26 8 9 26 215
First 140 6 25 21 5 10 22 229
Second 125 6 22 18 1 5 30 207
Third 143 6 25 45 19 12 30 280
Fourth 135 17 12 47 4 12 50 277
Total 663 39 106 157 37 48 158 1208 Note. A code is only recorded when the student is the user of technology. Students are observed multiple
times during data collection. FCS=Faculty Collaborative Sessions.
Table 14
Students’ Technology Use
95% Confidence
Interval for Mean
N Mean Std.
Deviation
Std.
Error
Lower
Bound
Higher
Bound
Minimum Maximum
Baseline 215 1.67 2.178 .149 1.38 1.96 0 6
First 229 1.40 2.059 .136 1.13 1.67 0 6
Second 207 1.51 2.207 .153 1.21 1.81 0 6
Third 280 1.81 2.139 .128 1.56 2.06 0 6
Fourth 277 2.01 2.353 .141 1.74 2.29 0 6
Total 1208 1.70 2.202 .063 1.58 1.83 0 6
Table 15
ANOVA Effects of FCS* on Student Cognitive Engagement When Using Technology
Sum of Squares
df
Mean Square
F
Sig.
Between Groups 58.681 4 14.670 3.407 .016*
Within Groups 5791.223 1203 4.814
Total 5849.904 1207 *Note. FCS=Faculty Collaborative Sessions. p < .05.

78
Research Question 3
What categories of technology use, as defined by the IPI-T, are most frequently
used in 9-12 classrooms within the targeted district? To answer this question IPI-T data
were collected and descriptive statistics were used to organize the nominal data in a
frequency distribution table as well as a bar chart. Results are show in Figure 5 and Table
16.
Figure 5. Frequencies of Categories of Technology Use. Categories of technology most frequently used in
the classrooms observed, grades 9-12.

79
Table 16
Frequency of Categories of Technology Use Observed Using the IPI-T
Categories of Tech Use Frequency* % Valid % Cumulative %
Word Processing 34 9.1 9.1 9.1
Math Computations 22 5.9 5.9 5.9
Media Development 21 5.6 5.6 5.6
Information Search 145 39.0 39.0 39.0
Collaboration Among
Individuals
13 3.5 3.5 3.5
Experience-Based
Technology
64 17.2 17.2 17.2
Interactive/Presentation
Technology
73 19.6 19.6 19.6
Total 372 100.0 100.0 100.0 *Note. Technology use by students
Data was collected using the IPI-T observational tool four times, including the
collection of baseline data. A total of 372 observations were made in which students were
using technology. Of the 372 observations, 145 times (39%) students were observed
searching for information. According to Valentine (2015), when students are involved in
information searches they are using technology to search and/or gather information for
their learning task. This category includes the use of the Web and/or other media to
access facts, information, and/or insights available through the use of technology.
Additionally, 73 (19.6%) of the observations included observing students using an

80
interactive or presentation tech tool to support the learning task. This category includes
use of software that supports the transfer of information among students and between
students and teachers. Students participating in experience-based learning, or using
technology to engage in a tech-driven, immersion learning experience. was observed 64
(17.2%) times. This category includes the use of technology to engage students in game-
based software, intense interactive simulations, and virtual reality associated with
classroom learning goals. Only 13 (3.5%) observations were made when students used
technology to collaborate among others or to interact with and/or collaborate with others
to accomplish their learning task. This category includes the use technology for all forms
of synchronous (same time, usually verbal), communication and many forms of near-
synchronous (intermittent or streamed, usually text chat) communication.
Research Question 4
What categories of technology use, as defined by the IPI-T, are most frequently
coded when student cognitive engagement codes 5 and 6 are recorded? To answer this
question descriptive statistics were used to organize the nominal data in a frequency
distribution table. Results are shown in Table 17.

81
Table 17
Tech Use Categories: Frequency of Student Cognitive Engagement Codes
IPI-T Engagement Categories
Tech Use
Categories
Dis-
engaged
L/O
Teacher
Not
Engaged
L/O
Teacher
Engaged
Teacher-
Led
H/O
Students
Verbal
H/O
Students
Not
Verbal
Total
Word
Processing
4
14
12
0
1
3
34
Math
Computations
0
5
7
4
1
5
22
Media
Development
0
1
2
0
6
12
21
Information
Search
12
46
55
9
11
12
145
Collaboration
Among
Individuals
0
0
2
0
5
6
13
Experience-
Based
Technology
0
3
8
5
8
40
64
Interactive/
Presentation
Technology
2
24
18
4
3
22
73
Total 18 93 104 22 35 100 372
Note. H/O Students Verbal = 5. H/O Students Not Verbal = 6.
According to Valentine (2012) IPI-T category 1 is associated with disengagement,
categories 2, 3, and 4 are associated with lower-order, surface thinking and categories 5
and 6 are associated with higher-order, deeper thinking. Results show that 114
observations out of 372 higher-order, deeper thinking was recorded. The team observed
and recorded codes at a higher level, a 5 or a 6, 18 out of 21 times when students were
observed developing media, 11 out of 13 times collaborating among others, and 48 out of
64 times when they participated in experience-based technology. In contrast, 110 out of

82
372 observations were made of students using technology to search for information at a
low level (2, 3, or 4).
Research Question 5
How do faculty view their participation in faculty collaborative study sessions?
Specifically, did participating affect the teacher’s use of technology use in the classroom?
To answer this qualitative question, participants responded to both closed and open-ended
questions on a web-based questionnaire created using Google Forms. The closed-ended
question was followed by an open-ended question. Question 1 was a closed-ended
question and asked, did you participate in all faculty collaborative study sessions? Each
of the eight participants (100%) responded “yes”. Question 2 was also a closed-ended
question and asked participants to rate the impact of faculty collaborative sessions on
their own use of technology in their classroom. On a scale of strongly agree to strongly
disagree, two participants chose “strongly agree” and six participants chose “agree”.
Two key themes emerged from participant responses (see Table 18) as a result of
following up Question 2 with the open-ended Question 3, please explain your response in
more detail.
Theme 1: Technology Integration
The Instructional Practice Inventory – Technology (IPI-T) is a walkthrough
observation tool designed to collect data concerning how often and in what ways teachers
are integrating technology as well as how often students are cognitively engaged in
higher order, deeper thinking and can be used to help faculty align technology standards
both at grade level and content areas. Faculty discussed the new ways in which they

83
integrated technology as a result of participating in the Faculty Collaborative Study
Sessions.
1. “During discussions there were some new ideas shared about Google Classroom
that I have tried.”
2. "Working together is essential for implementing higher-order thinking and
engagement in the classroom."
3. “After the initial faculty session, I was much more aware of how I was utilizing
technology and I was much more aware of the cognitive level I was asking students to
work at.”
4. “These sessions have helped me learn ways I can have my students use
technology that I did not know before.”
Theme 2: Implementing New Technology
Faculty shared experience associated with implementing new technology as a
result of participating in Faculty Collaborative Study Sessions. These experiences
included:
1. “I feel like I became more aware of available technology resources that I could
use in my classroom”.
2. “I am implementing more as time allows.”
3. “Made you more aware of using technology instead of paper/pencil”
4. “When talking with coworkers, I was able to learn new apps to use in my
classroom. I was able to ask specific questions and receive immediate response.”

84
Table 18
Qualitative Question 3 on Web-Based Questionnaire
Q3. Please explain your response in more detail.
Theme Description
Technology Integration Faculty shared experiences of integrating new
technology.
Implementing New Technology Faculty shared their experiences of
implementing new technology such as Google
Classroom and Desmos Calculators. In
addition, faculty shared a new awareness of
technologies available. Note. Participants (n=8)
Research Question 6
How do faculty view their participation in faculty collaborative study sessions?
Specifically, did participating affect students’ use of technology use in the classroom? To
answer this qualitative question, participants responded to both closed and open-ended
questions on a web-based questionnaire created using Google Forms. Each closed-ended
question was followed by an open-ended question. Question 4 was a closed-ended
question and asked participants to rate the impact of faculty collaborative sessions on
students’ use of technology in their classroom. On a scale of strongly agree to strongly
disagree, four participants chose “strongly agree” and four participants chose “agree”.
Two key themes emerged from participant responses (see Table 19) as a result of
following up Question 4 with the open-ended Question 5, please explain your response in
more detail.
Theme 1: Awareness
The IPI-T is designed to quantify how often students are cognitively engaged in
higher order, deeper thinking. A total of twenty-seven faculty members participated in

85
four Faculty Collaborative Study Sessions. One theme that arose from the eight
participants that completed the questionnaire was a raised awareness of the necessity to
increase student cognitive engagement and the need to integrate technology in a way that
promoted higher order, deeper thinking. Participants shared:
1. “I was more aware of how I was asking them to use their technology and what
processing skills they were using.”
2. "I strive to self-monitor and reflect on my teaching to help my students reach
the 5 and 6 higher-order thinking and engagement with the use of technology; therefore, I
incorporated using Padlet as a way for students to reach the higher levels of engagement.
I truly do take the time to self-reflect on how I can enhance the learning environment at a
higher level."
3. “Being involved is a good thing, makes you take ownership of something and
you are all on the same page.”
4. “Made me aware of the student engagement going on throughout building.”
Theme 2: More Time
The second theme that arose was the need for more time. More time to not only
collect data but to continue to participate in faculty collaborative study sessions. Faculty
expressed the need to continue the build longitudinal data in an effort track trends and
patterns. In addition, responses indicated the need for time to be allotted so that faculty
can participate in purposeful professional development opportunities that are designed to
integration educational technology in and in a higher-order manner.

86
Table 19
Qualitative Question 5 on Web-Based Questionnaire
Q5. Please explain your response in more detail.
Theme Description
Awareness of Tech Usage Faculty shared a deeper awareness of the
importance of integrating technology as a result
of the Faculty Collaborative Study Sessions.
More Time Faculty members admitted increasing student
cognitive engagement was going to take time as
well as continued participation in Faculty
Collaborative Study Sessions. Note. Participants (n=8)
Summary
The impact of implementing the Instructional Practices Inventory – Technology (IPI-
T) process with fidelity was investigated in this mixed methods study. Data were collected
through the IPI-T data collection tool for the quantitative portion, and of the 27 participants
who participated in the faculty collaborative study sessions, eight participants responded to a
web-based questionnaire for the qualitative portion.
Analysis using a One-way ANOVA revealed that implementation of faculty
collaborative sessions within one week of data collection had a significant impact on
students’ technology use and engagement. Descriptive statistics were used to create
frequency tables in an effort to organize the data which revealed that students participate in
information searches more frequently than other categories of technology and particular
technology categories such as media development, collaboration among individuals, and
experience-based learning using technology support higher-order, deeper thinking.
Responses from the questionnaire were thematically analyzed and interpreted in an
effort to further explain the quantitative findings. Key themes emerged from the thematic

87
analysis: (a) technology integration, (b) implementing new technology, (c) awareness of tech
use, and (d) more time. Results are further discussed in Chapter 5, Discussion.

88
Chapter 5: Discussion
The IPI-T data collection team coded 217 observations from January 2018
through April 2018 after increasing technology devices nearly one per student at the high
school. Analysis of the data showed only 95 observations were coded in which students
were the users of technology. The results of faculty participating in faculty collaborative
study sessions within one week of data collection was the focus of this mixed methods
study. Data were collected through the IPI-T data collection process for the quantitative
portion, and a small group completed a web-based questionnaire for the qualitative
portion. The purpose of this explanatory-sequential mixed method study was to assess the
impact of the IPI-T process on technology use and student cognitive engagement. The
impact was measured by comparing quantitative IPI-T data codes of those faculty that
participated in faculty collaborative study sessions with baseline data prior to the
implementation of the faculty collaborative study sessions. Data collected using the IPI-T
process were examined, analyzed, and presented in Chapter 4. In Chapter 5, a summary
of the findings, interpretations of the findings, implications for practice and theory,
limitations, recommendations for future research, and a conclusion are provided.
Summary of Findings
An examination of the data revealed that participation in faculty collaborative
study sessions had a statistically significant impact on student technology use as well as
student cognitive engagement when using technology. While teacher technology use did
increase, the expected impact of participating in faculty collaborative study sessions was
that teachers’ technology use would actually decrease. Descriptive statistics revealed
more often students participate in information searches and word processing when they

89
are the users of technology which are associated with lower-order/surface thinking.
Furthermore, results showed that 31% of the codes collected, higher-order/deeper
thinking was observed when students were the user of technology. Technology use
categories observed at a higher level included media development, collaboration among
individuals, and experience-based technology.
For the qualitative portion, data were thematically analyzed and interpreted
looking for overlapping themes within the open-ended questions, with the goal of
providing a greater understanding of the quantitative results and the impact the faculty
collaborative study sessions had on technology use and student cognitive engagement.
Four key themes emerged: (a) technology integration, (b) implementing new technology,
(c) awareness of tech usage, and (d) more time.
Of the four themes that emerged from the questionnaire responses, the greatest
overlap was regarding awareness. In line with the first order-external barriers discussed
within the literature review, all eight of the participants mentioned that more time is
necessary. Specifically, participants stated that they need more time to study and analyze
the IPI-T data as well as to participate in purposeful professional development.
Interpretation of Results
This section summarizes and interprets the results of the quantitative portion of
the study which utilized the IPI-T data collection tool as well as the qualitative portion, a
web-based questionnaire.
Research Question 1. To what extent does participation in faculty collaborative
study sessions affect faculty’s technology use as measured by codes on the Instructional
Practices Inventory-Technology (IPI-T)? This research question attempted to determine if

90
participating in faculty collaborative sessions had an impact on teacher technology use,
specifically if teacher use of technology would decrease.
Research shows when teachers do use technology for instruction, they may not be
using it to its fullest potential to promote high levels of student cognitive engagement
(Cuban, Kirkpatrick, & Peck, 2001; Prensky, 2015; Russell, Bebell, O’Dwyer, &
O’Connor, 2003; Schrum & Levin 2012; Zhao, Pugh, Sheldon, & Byers, 2002). In line
with recent studies (Cuban et al., 2001; Russell et al., 2003) despite large expenditures of
Chromebooks, baseline data collected at the targeted high school indicated teachers were
the users of technology, rather than students. According to baseline data collected using
the IPI-T data collection tool, after 215 observations of 27 high school classrooms, 63
observations were made in which no technology was observed, 59 observations were
coded as teachers using technology, and 95 observations were made in which students
were the user of technology (Table 10).
Missing from the process during the 2017-18 pilot of the IPI-T was the
implementation of faculty collaboration sessions. Valentine (2012b) stated, “The greater
the implementation integrity to these strategies, the greater the likelihood the school will
see positive academic results from their use of the IPI” (p. 1). The sessions provided
faculty with time to study the data after each data collection, engaged faculty in a
reflection of the data, created collaborative learning experiences that built new
knowledge, and allowed faculty voice in the establishment of annual cognitive
engagement goals.
The results of the quantitative data revealed, despite implementation of faculty
collaborative study sessions, teacher technology use increased (Figure 4). While an

91
increase of technology use seems in line with the found alternative hypothesis which
stated: participating in faculty collaborative study sessions does affect faculty’s
technology use as measured by codes on the Instructional Practices Inventory –
Technology (IPI-T), results show teachers typically used technology in a lower-
order/surface manner to assist in the delivery of instruction. Much of the time teachers
were observed using their Interactive Whiteboards to project directions or notes as
instruction was delivered in a lecture format. According to Valentine (2012), examples of
teacher-led instruction includes classroom practices commonly associated with teacher
dominated questions and answers, teacher lecture or verbal explanations, teacher
direction giving, and teacher demonstrations. Discussions may occur, but instruction and
ideas come primarily from the teacher. Student higher-order, deeper learning is not
evident.
Research Question 2. To what extent does participation in faculty collaborative
study sessions affect student’s technology use as measured by codes on the Instructional
Practices Inventory-Technology (IPI-T)? This research question attempted to determine if
participating in faculty collaborative sessions had an impact on students’ technology use.
Specifically, if student use of technology would increase as well as student cognitive
engagement when using technology.
Coding using the IPI-T data collection tool took place four times during the
school year 2017-18 in an effort to gather baseline data. When observed using
technology, students were engaged in lower-order surface thinking activities 70.4% of the
time. Throughout the initial collection of baseline data, the researcher noticed technology
use by the teacher decreased slightly, increasing student use of technology, but

92
disengagement increased dramatically as did the integration of activities that fall within
categories 4, 3, and 2 on the IPI-T (Table 13). Again this is not surprising as the
researcher and the IPI-T data collection team did not implement the IPI-T process in its
entirety, leaving out the faculty collaborative study sessions in the first year. Time was
not provided to analyze the data or participate in purposeful professional development
that prepared faculty to integrate technology.
The Barrier to Technology model, suggests there are two sets of barriers, external
and internal, that influence the integration of technology in teachers’ classrooms (Ertmer,
1999; Ertmer and Ottenbreit-Leftwich, 2010; Ertmer, Ottenbreit-Leftwich, Sadik,
Sendurur, & Sendurur, 2012). First order-external barriers are also known as resource
barriers. Sufficient time allowance to prepare for technology-integrated instruction is an
example of a resource barrier (Hew & Brush, 2007; Kopcha, 2012; Vongkulluksn, Xie, &
Bowman, 2018).
According to Valentine (2017), “When IPI/IPI-T data are collected for the
purposes of school improvement, all teachers should have the opportunity to study the
data and reflect upon their perceptions of effective learning/instructions” (p. 3). Faculty
should converse about best practices and the value of the six categories. Once a baseline
is established, discussions about how to change the engagement profiles over time should
occur to ensure instructional design and teaching practices evolve. Upon collecting data
using the IPI-T, a faculty collaborative study session occurred. Faculty was arranged in
small table groups to encourage collaborative learning in an effort to build new
knowledge. Participants were engaged in both a reflection about the data collection day
and a comparison of the data. In addition, examples of higher-order and lower-order

93
activities were presented and faculty had the opportunity to work collaboratively to
design the ideal lesson that integrated both technology and higher-order, deeper thinking.
Lastly, during the last study session, faculty worked together and established cognitive
engagement goals for the upcoming 2019-2020 school year which support higher-order,
deeper thinking skills among students. Throughout the process the researcher made a
conscious effort to continuously understand faculty perspectives and progress
accordingly (see Appendices D, E, F, and G).
The first data collection profile served as baseline data and subsequent data
collections provided longitudinal perspectives of engaged learning for the school.
Teacher leaders collected the data. The researcher engaged faculty in studying the data to
identify patterns, trends, and changes in each data profile. In addition, she established and
delivered purposeful professional development and continuous conversations. Valentine
(2017) stated, “To make a difference in student cognitive engagement, the faculty IPI/IPI-
T collaborative conversations must progress from merely studying profile percentages to
learning discussions that deepen knowledge, build a commitment to refinement of
instructional practices, particularly increasing higher-order/deeper thinking time and
reducing disengagement during class time” (p. 3).
The results of quantitative data analysis of this study, indicated that participation
in faculty collaborative study sessions had an affect on students’ technology use as
measured by codes on the Instructional Practices Inventory – Technology (IPI-T). A One-
way ANOVA revealed a significant difference among the baseline, first, second, third,
and fourth faculty collaborative sessions, p = .02 (Table 15). In addition, when observed
using technology, higher-order, deeper cognitive engagement among students increased,

94
lower-order, surface cognitive engagement decreased, and student disengagement
decreased (Table 13).
Research Question 3. What categories of technology use, as defined by the IPI-
T, are most frequently used in 9-12 classrooms within the targeted district? This research
question attempted to identify the categories of technology use most frequently used in
the 9-12 classrooms that were observed.
Data was collected using the IPI-T observational tool four times, including the
collection of baseline data. Results of the quantitative analysis of data revealed a total of
372 observations were made in which students were using technology (Table 16). Of the
372 observations, students were observed searching for information more frequently than
other categories of technology use. According to Valentine (2015), when students are
involved in information searches they are using technology to search and/or gather
information for their learning task. This category includes the use of the Web and/or
other media to access facts, information, and/or insights available through the use of
technology. The second most frequently observed category of technology use was
students using an interactive or presentation tech tool to support the learning task. This
category includes use of software that supports the transfer of information among
students and between students and teachers. The third most frequently observed category
of technology use was experience-based immersion learning, or using technology to
engage in a tech-driven, immersion learning experience. This category includes the use of
technology to engage students in game-based software, intense interactive simulations,
and virtual reality associated with classroom learning goals. Very few observations were
made when students used technology to collaborate among others or to interact with

95
and/or collaborate with others to accomplish their learning task. This category includes
the use technology for all forms of synchronous (same time, usually verbal),
communication and many forms of near-synchronous (intermittent or streamed, usually
text chat) communication (Figure 5).
Valentine (2012c) has collected tens of thousands of codes, educating more than
23,000 educators in the IPI-T data collection process. Results of this study align with
Valentine’s findings. According to Valentine (2018), experience-based immersion
learning and collaboration among individuals are two categories of technology use that
are least frequently observed but are most commonly associated with higher-order,
deeper thinking. Likewise, information searches are observed most frequently and
associated with lower-order, surface thinking.
Research Question 4. What categories of technology use, as defined by the IPI-
T, are most frequently coded when student cognitive engagement codes 5 and 6 are
recorded? This research question attempted to identify the categories of technology use
when Student Cognitive Engagement Codes 5 and 6 were recorded.
The IPI-T data collection process was piloted and field tested in 2011-12. The IPI-
T is an ‘add-on’ component designed for schools that have experience with the IPI
process and are currently 1:1 (one technology device per student) or planning to soon
become 1:1 or high-tech schools. There are six categories associated with student
cognitive engagement and eight tech-use categories measured by the IPI-T.
According to Valentine (2012) IPI-T Student Cognitive Engagement Category 1
is associated with disengagement, Categories 2, 3, and 4 are associated with lower-order,

96
surface thinking and Categories 5 and 6 are associated with higher-order, deeper thinking.
Tech-use categories include:
1. Word Processing. The students are using technology to produce written
documents. This category includes note taking, composing papers, editing, formatting,
and printing the written material.
2. Math Computations. The students are using technology to perform
mathematical computations. This category includes calculating, charting, and plotting
with hand-held calculators, spreadsheets, and statistical formulae.
3. Media Development. The students are using technology to collect, manipulate,
and/or create media. This category includes the use of technology to collect, edit, and/or
design photo, video, and/or audio data and presentations, as well as programming, writing
code, and web development.
4. Information Search. The students are using technology to search and/or gather
information for their learning task. This category includes the use of the Web and/or
other media to access facts, information, and/or insights available through the use of
technology.
5. Collaboration Among Individuals. The students are using technology to
interact with and/or collaborate with others to accomplish their learning task. This
category includes the use technology for all forms of synchronous (same time, usually
verbal), communication and many forms of near-synchronous (intermittent or streamed,
usually text chat) communication.
6. Experience-Based Immersion Learning. The students are using technology to

97
engage in a tech-driven, immersion learning experience. This category includes the use of
technology to engage students in game-based software, intense interactive simulations,
and virtual reality associated with classroom learning goals.
7. Interactive/Presentation Technology. The students and/or teacher are using an
interactive or presentation tech tool to support the learning task. This category includes us
of software that supports the transfer of information among students and between
students and teachers.
8. Other. Occasionally the data collector may determine that none of the seven
options adequately describe how students are using technology. This “other” option
should be marked if that is the case. However, selection of this “other” option is
extremely unusual.
According to Valentine media development is the most likely tech-use category to
produce higher-order, deeper thinking at the high school level. Experience-based
immersive learning is also highly likely to produce higher-order, deeper thinking at the
high school level. Math computations is most commonly used for student skill and drill
practice and in high schools, the most common form of collaboration via technology is
misuse of the technology for email, blogs, and social media, coded a “1” for
disengagement. Information search in high schools is primarily fact finding without
higher-order analysis. Valentine (2018) stated with caution, “the volume of data at this
time is large enough to provide interesting insights and probable trends, but too small to
make firm conclusions about the relationships” (slide 82).
98
Results of this study show that less than half of the total observations, in which
students were the users of technology, higher-order, deeper thinking was recorded (Table
17). However, tech use categories recorded at a higher level, a 5 or a 6, include: Media
Development, Experience-Based Immersion Learning, and Collaboration Among
Individuals. In contrast, the tech use category most often observed was Information
Search. When students used technology to search for information an engagement code
was recorded at a low level (2, 3, or 4).
Research Question 5. How do faculty view their participation in faculty
collaborative study sessions? Specifically, did participating affect the teacher’s use of
technology use in the classroom? This research question attempted to determine if faculty
viewed their participation in faculty collaborative study sessions as having an impact on
their technology use in the classroom.
The Instructional Practice Inventory – Technology (IPI-T) is a walkthrough
observation tool designed to collect data concerning how often and in what ways teachers
are integrating technology as well as how often students are cognitively engaged in
higher-order, deeper thinking and can be used to help faculty align technology standards
both at grade level and content areas. The baseline data collected during the 2017-18
school year indicated teachers were the user of the technology most of the time, in line
with claims that indicate while access to technology in most cases is no longer the major
issue (Schrum & Levin, 2015; Zhao et al., 2002); computer usage in the classroom
among students remains low (Cuban, 1999; Wang, Hsu, Campbell, Coster, Longhurst,
2014; Zhao et al., 2002). While it was the intend of the faculty collaborative sessions to

99
in fact decrease the use of teacher technology and increase student use, teacher
technology use increased.
At the end of the final faculty collaborative study session eight participants were
asked to complete a web-based questionnaire. The questionnaire was comprised of
closed-ended questions, followed by an open-ended question. Even though teacher
technology use increased and much of the time was used to support teacher-led
instruction, themes emerged from each open-ended response that support the integration
and implementation of educational technology (Table 18).
Theme 1: Technology Integration. It is evident from responses that participants
recognize and believe that participation in the faculty collaborative study sessions
affected or impacted technology integration in their classroom. For example, faculty
discussed the new ways in which they integrated technology as a result of participating in
the Faculty Collaborative Study Sessions. Participants shared the following, “Working
together is essential for implementing higher-order thinking and engagement in the
classroom.” Also, “After the initial faculty session, I was much more aware of how I was
utilizing technology and I was much more aware of the cognitive level I was asking
students to work at.”
Theme 2: Implementing New Technology. In addition, as a result of
participating, faculty shared experiences associated with implementing new technology.
Faculty members stated, “I feel like I became more aware of available technology
resources that I could use in my classroom.” Faculty felt supported by each other and
stated, “When talking with coworkers, I was able to learn new apps to use in my
classroom. I was able to ask specific questions and receive immediate response”.

100
It seems the eight participants that completed the questionnaire may have not truly
understood the question or may have not interpreted the question correctly. The question
read, “How do faculty view their participation in faculty collaborative study sessions?
Specifically, did participating affect the teacher’s use of technology use in the
classroom?” When given the opportunity to explain their response one participant stated,
“These sessions have helped me learn ways I can have my students use technology that I
did not know before.” An explanation could be that faculty spent the majority of time
analyzing student cognitive engagement when working collaboratively during each
session, rather than focusing the deliberate attempt to decrease their own technology use.
Research Question 6. How do faculty view their participation in faculty
collaborative study sessions? Specifically, did participating affect students’ use of
technology use in the classroom? This research question attempted to determine if faculty
viewed their participation in faculty collaborative study sessions as having an impact on
their students’ technology use in the classroom.
The small group of participants that responded to the questionnaire share the
belief that participation in faculty collaborative student sessions impacted or affected
their students’ technology use in the classroom. The IPI-T is designed to quantify how
often students are cognitively engaged in higher order, deeper thinking while the
qualitative portion of this study attempted to seek feedback from the faculty to gain an
understanding of their viewpoint. Their responses support the quantitative portion of this
study. Two themes arose from their responses to the questionnaire.
Theme 1: Awareness. The first theme was a raised awareness of the necessity to
increase student cognitive engagement and the need to integrate technology in a way that
101
promoted higher order, deeper thinking. One participant stated, “I strive to self-monitor
and reflect on my teaching to help my students reach the 5 and 6 higher-order thinking
and engagement with the use of technology; therefore, I incorporated using Padlet as a
way for students to reach the higher levels of engagement. I truly do take the time to self-
reflect on how I can enhance the learning environment at a higher level.”
Theme 2: More Time. The second theme was the necessity to dedicate more time
to study data and participate in purposeful professional development. Valentine (2017)
recommends each school collect data four times each school year to achieve optimum
impact. Teacher leaders collecting the data should engage faculty in studying the data to
identify patterns, trends, and changes in each data profile as well as establish and deliver
purposeful professional development and continuous conversations. Valentine (2017)
stated, “To make a difference in student cognitive engagement, the faculty IPI/IPI-T
collaborative conversations must progress from merely studying profile percentages to
learning discussions that deepen knowledge, build a commitment to refinement of
instructional practices, particularly increasing higher-order/deeper thinking time and
reducing disengagement during class time” (p. 3). After studying baseline data and three
other data profiles twenty-seven faculty studied trends and changes. In addition, they
participated in continuous conversations about technology and integration to promote an
increase in higher order, deeper thinking among students. The eight participants each
shared that more time to study data and participate in purposeful professional
development was necessary. This is an indication that they would be in support of
continuing data collection using the IPI-T as well as participating in collaborative
sessions. In addition, it is the role of the researcher to provide meaningful professional

102
development opportunities that support the inclusion of educational technology. Based on
responses faculty are more willing to participate than in the past.
Research Question 7. How does the qualitative follow-up data help us to better
understand the quantitative first-phase results? Research Questions 1and 2 are
quantitative and ask:
1. To what extent does participation in faculty collaborative study sessions affect
faculty’s technology use as measured by codes on the Instructional Practices Inventory-
Technology (IPI-T)? The null hypothesis stated that participating in faculty collaborative
study sessions has no affect on faculty’s technology use as measured by codes on the
Instructional Practices Inventory – Technology (IPI-T).
2. To what extent does participation in faculty collaborative study sessions affect
student’s technology use as measured by codes on the Instructional Practices Inventory-
Technology (IPI-T)? The null hypothesis stated that participating in faculty collaborative
study sessions has no affect on students’ technology use as measured by codes on the
Instructional Practices Inventory – Technology (IPI-T).
The null hypothesis for Research Question 1 was rejected. Faculty were led in a
collaborative discussion about the difference between Cognitive Engagement Codes 6, 5,
4, 3, 2, and 1. Each session a minimum of five minutes was spent reviewing what each
category meant, along with classroom examples such as student participating in simple
recall or listening to a teacher stand at the front of the row and lead instruction (see
Appendices D-G). To understand the results, the researcher included the following
qualitative question in the questionnaire: “How do faculty view their participation in
faculty collaborative study sessions? Specifically, did participating affect the teacher’s

103
use of technology use in the classroom? Despite the collaborative discussions, teacher use
of technology increased. It could be said that participation in faculty collaborative study
sessions affected teacher use of technology, just not in terms of frequency, but rather how
technology was used. Unfortunately, an IPI-T Category of Tech Use is only recorded
when students are using technology so the researcher was not able to record if teachers
changed the way they were using technology themselves. Participant responses indicated
they may have misinterpreted the question and focused on student use rather than their
own use of technology.
Similarly, the null hypothesis for Research Question 2 was rejected. The
qualitative phase of this mixed method study not only supported the findings of the
quantitative phase but gave way to an understanding of how faculty value their efforts to
engage in an analysis of the IPI-T data as well as the trends and patterns they have
identified when meeting in small groups during collaborative sessions (see Appendices
D-G). Key themes that emerged from the qualitative questions include and awareness of
the need to integrate technology but also an awareness of the need to implement
technology that encourages higher-order, deeper thinking among students. Additionally,
faculty seem to be “breaking down” some of the barriers that have existed when
considering the implementation of technology. For example, while time is a factor, there
has been an acceptance that time is necessary for growth in the area of technology
integration. Faculty believe they should continue to gather IPI-T data into the next school
year and study it collaboratively with the intent to continue to establish goals of
technology integration. In addition, faculty have gained a willingness to spend time
104
participating in purposeful professional development that supports a change in the way
students use technology.
Implications of Findings
This mixed method study provides empirical evidence that implementing the IPI-
T data collection process in its entirety impacts technology use among faculty and
students. Student technology use increased, as did cognitive engagement. However,
evidence indicates that most of the time students are asked to search for information, a
low-level skill. Less often students were observed creating media, collaborating using
technology, or participating in experience-based learning, all associated with higher-
order, deeper thinking.
As the most technologically literate group of children enter the classroom, it is
necessary to participate in continuous collaborative conversations and to look at current
educational practices. Educators should consider “the skills, competencies, values needed
on the future global age, and how generation alpha should be prepared, scholastically”
(Culala, 2016). Zhao et al. (2002) claimed that changing current educational practices
regarding the use and integration of technology is complex and messy. This study
supports that claim. While complex, over time the 27 participants that participated in
collaborative conversations progressed from merely studying profile percentages to
learning discussions that deepened their knowledge. They came to value the integration
of technology and built a commitment to the refinement of instructional practices that
increased higher-order, deeper thinking time and reduced disengagement among students
when using technology.
105
The Barrier to Technology model, suggests there are two sets of barriers, external
and internal, that influence the integration of technology in teachers’ classrooms (Ertmer,
1999; Ertmer and Ottenbreit-Leftwich, 2010; Ertmer, Ottenbreit-Leftwich, Sadik,
Sendurur, & Sendurur, 2012). First order-external barriers are also known as resource
barriers. Sufficient time allowance to prepare for technology-integrated instruction is an
example of a resource barrier (Hew & Brush, 2007; Kopcha, 2012; Vongkulluksn, Xie, &
Bowman, 2018). In addition, Vongkulluksnet al. (2018) considered the second order-
internal barriers, teachers’ value beliefs as the “most proximal determinant of technology
integration” regarding them most important to using technology for learning (Ertmer,
1999; Ertmer and Ottenbreit-Leftwich, 2010; Ertmer et al., 2012).This study indicates
that engaging faculty in a series of collaborative study sessions of the IPI-T data has been
shown to have the capacity to remove barriers to technology use by teachers to fulfill
instructional goals, increase teachers’ ability beliefs, increase student usage of
technology, and positively impact student cognitive engagement and academic success.
There is no prescribed training or professional development to date that
guarantees an increase in technology use as well as an increase in higher-order, deeper
thinking among students. According to Denessen (2000), pedagogical beliefs refer to the
understandings about teaching and learning that teachers hold to be true (as cited in
Tondeur et al., 2016). Described by Pajares (1992), a teacher’s belief system includes
beliefs about their roles and responsibilities, the subject matter taught, as well as beliefs
about their students (as cited in Tondeur et al., 2016). Complex and multifaceted
pedagogical beliefs include core beliefs, those that are most stable and the most difficult
to change as they have connections to other beliefs versus beliefs that are peripheral and

106
formed recently are more open to change (Tondeur et al., 2016). Deng, Chai, Tsai, and
Lee, (2014) along with Inan and Lowther, (2010) maintained that personal pedagogical
beliefs of teachers “play a key role in their pedagogical decisions” to integrate technology
within their classroom practices (as cited in Tondeur et al., 2016). Within the field of
education technology teachers’ beliefs have been classified into one of two categories:
teacher-centered and student centered beliefs. Educational technology best practices are
those that promote student-centered learning (Ottenbriet-Leftwich, Glazewski, Newby,
and Ertmer, 2010; Tondeur et al, 2016). A clear implication of this study is the need for
professional development for both practicing and preservice teachers. The goal should be
to create a series of trainings or professional development opportunities that are student-
centered and promote the integration of technology as well as a strong knowledge of
curriculum activities. The activities should emphasis or promote higher-order, deeper
thinking, such as those activities found in Bloom’s Digital Taxonomy.
Limitations of the Study
The researcher chose to employ a quasi-experimental within-subjects approach
utilizing a pretest and posttest design. One group participated in this study. A
convenience sampling strategy was employed for the quantitative strand of the study
because participants were willing and available to participate. The sample of teachers
chosen from the population of teachers in the district was relatively small. Participants
from the small subgroup had the potential to provide useful information for answering
questions and hypotheses, however, it is difficult for the researcher to say with
confidence that the individuals represented the entire teacher population. Additional
disadvantages to this approach were threats to internal validity which include maturation

107
and history because the study took place over the course of several months. Further, an
assumption is observations represented typical school days, and that teachers did not alter
instruction when the IPI-T data collection team was present.
While the possibility of observer bias exists, training was provided to all teacher
leaders who collected codes in an effort to standardize data collection. It is important to
know that the process for developing the data collector’s validity, reliability, and inter-
rater reliability during was the central focus during both IPI Level I Basic Workshop and
the IPI-T Component Workshop. Upon the conclusion of each IPI-T workshop
participants were required to complete a Reliability Assessment and a reliability score of
.90 or higher was necessary for permission to use the IPI-T Process for research purposes.
The researcher earned a reliability score of .95 on the IPI assessment and .98 on the IPI-T
assessment.
Recommendations for Future Research
This mixed methods study contributes to the overall understanding of the capacity
of removing barriers to technology use when faculty engage collaboratively in the
analysis of data and instructional practices on a regular basis to fulfill instructional goals,
increase student usage of technology, and positively impact student cognitive
engagement and academic success. Future research should extend these findings by
replicating this study with faculty from the same school district in different grade levels
or with the same faculty, grades 9-12, to gather longitudinal data. Findings from future
research, examining the impact of participating in faculty collaborative study sessions at
multiple grade levels, could be used to inform district initiatives, school improvement,
and the development of professional development to integrate technology. The IPI and

108
IPI-T encourages faculty members to work towards a balance of higher and lower levels
of student cognitive engagement through incremental changes in instructional practice
(Dennis, 2013). Gathering longitudinal data could be used to inform change in
instructional practices over time. Additionally, future studies should include an
examination of the change in technology instructional practices when faculty participate
in faculty collaborative study sessions over a period of time.
In an effort to increase student use of technology and align current teaching
practices with the integration of technology, the IPI-T process assisted in the collection of
data to get an insight into how students were cognitively engaged in the learning during
the instructional activity. Implementing the IPI-T process in its entirety encouraged
faculty members to study the data and think collaboratively about ways to work towards a
balance of higher and lower levels of student cognitive engagement through incremental
changes in instructional practice (Dennis, 2013). Categories 6 and 5 include learning
activities that fall within the higher-order/deeper thinking spectrum of Bloom’s
Taxonomy and Bloom’s Digital Taxonomy such as media development, collaboration
among others, and experience or problem based learning. This study identified a
relationship between specific technology-use categories and specific IPI-T student
cognitive engagement codes. Studies should be done to identify engaging activities
designed for specific technology-use categories that promote higher-order thinking.
Summary and Conclusions
The purpose of this explanatory-sequential mixed method study was to assess the
impact of the IPI-T process on technology use and student cognitive engagement. The
goal was to implement all strategies, including faculty collaborative sessions four times

109
per year to support teacher implementation of new technology to increase higher-order,
deeper thinking by students and increase student use of technology. The impact was
measured by comparing quantitative IPI-T data codes of those faculty that participated in
the intervention group with baseline data prior to the implementation of the faculty
collaborative study sessions. Data collected during the quantitative phase was the
emphasis of this study. Qualitative data was gathered from one participant from each core
and non-core area, a total of eight participants. Each were asked to answer questions on a
web-based questionnaire during the final faculty collaborative session. Four key themes
emerged and each were associated with the quantitative portion of the study.
Findings from this mixed methods study confirm that implementing the IPI-T
process in its entirety increases both technology use and student cognitive engagement.
The IPI-T process was created in 2012 by Valentine and a team of specialists. The IPI-T
is an ‘add-on’ component designed for schools that have experience with the IPI process
and are currently 1:1 (one technology device per student) or planning to soon become 1:1
or high-tech schools. Implementing the entire IPI-T process with fidelity has been shown
to have a positive influence on student technology use and student cognitive engagement.
School board members in the targeted district have already purchased $250,000 worth of
Chromebooks and have committed to additional purchases in the upcoming school year.
As they move toward a 1:1 environment, longitudinal data can be studied and the IPI-T
process can drive collaborative discussions among teachers and leaders to ensure a
successful adoption of technology.

110
References
Anderson, L. W., & Krathwohl, D. R. (2001). A Taxonomy for Learning, Teaching and
Assessing: A Revision of Bloom’s Taxonomy of Educational Objectives:
Complete Edition. New York: Longman.
Autry, Alex J., Jr, & Berge, Z. (2011). Digital natives and digital immigrants: Getting to
know each other. Industrial and Commercial Training, 43(7), 460-466.
doi:10.1108/00197851111171890
Billings, D. M., Kowalski, K. & Shatto, B. (2016). Moving on from millennials:
Preparing for Generation Z. The Journal of Continuing Education in Nursing,
47(6), 253-254.
Bloom, B. S. (1956). Taxonomy of educational objectives: Handbook 1: Cognitive
domain. White Plains, NY: Longman.
Bullen, M., Morgan, T., Qayyum, A. & Qayyum, A. (2011). Digital Learners in Higher
Education: Generation is Not the Issue. Canadian Journal of Learning and
Technology / La revue canadienne de l’apprentissage et de la technologie, 37(1),.
Canadian Network for Innovation in Education. Retrieved
from https://www.learntechlib.org/p/42755/
Churches, A. (2008). Bloom’s digital taxonomy. Retrieved from http://www.ccconline.
org/wp-content/uploads/2013/11/Churches_2008_DigitalBloomsTaxonomy
Guide.pdf
Cilliers, E. J. (2017). The challenge of teaching Generation Z. PEOPLE: International
Journal of Social Sciences 3(1), 188-198. doi:2017.31.188198
Creswell, J. W. (2015). Educational research: Planning, conducting, and evaluating

111
quantitative and qualitative research (5th ed.). Lincoln, NE: Pearson.
Cuban, L., Kirkpatrick, H., & Peck, P. (2001). High access and low use of technologies in
high school classrooms: Explaining an apparent paradox. American Educational
Research Journal, 38(4), 813-834.
Culala, H. J. D. (2016). Educating generation alpha: What are the demands of the 21st
century workforce? Retrieved from https://www.academia.edu/24526330/
Educating_generation_alpha_What_are_the_demands_of_the_21st_century_work
force
Dennis, L. B. (2013). How Are Teachers Integrating Technology in K-5 Classrooms?
Studying Student Cognitive Engagement Using the Instructional Practices
Inventory-Technology (IPI-T) Instrument. New Mexico State University, Las
Cruces, New Mexico.
Dunleavy, J., Milton, P., & Willms, J. D. (2012). What did you do in school today?
Trends in intellectual engagement. Research Series Report Number Three
Toronto: Canadian Education Association.
Edmonds, A. W. & Kennedy, T. D. (2017). An applied guide to research designs:
Quantitative, qualitative, and mixed methods. Thousand Oaks, CA: Sage
Publications, Inc.
Ertmer, P. A. (1999). Addressing first-and second-order barriers to change: Strategies for
technology integration. Educational Technology Research and Development,
47(4), 47-61, doi:10.1007/BF02299597
Ertmer, P. A. & Ottenbreit-Leftwich, A. T. (2010). Teacher technology change: How

112
knowledge, confidence, beliefs, and culture intersect. JRTE, 42(3), 255-284. doi:
10.1080/15391523.2010.10782551
Ertmer, P. A., Ottenbreit-Leftwich, A. T., Sadik, O., Sendurur, E., & Sendurur, P. (2012).
Teacher beliefs and technology integration practices: A critical relationship.
Computer & Education 59, 423-435, doi:10.1016/j.compedu.2012.02.001
Fernández-Cruz, F., & Fernández-Díaz, M. (2016). Generation Z's teachers and their
digital skills. Comunicar, 24(46), 97-105. doi:10.3916/C46-2016-10
Finn, J. D. & Zimmer, K. S. (2012). Student engagement: What is it? Why does it
matter? Handbook of Research on Student Engagement,7(5), 97-131.
Forehand, M. (2011). Bloom’s taxonomy. Retrieved from https://www.d41.org/cms/lib/
IL01904672/Centricity/Domain/422/BloomsTaxonomy.pdf
Fredericks, J. A., Blumenfeld, P. C., & Paris, A. H. (2004). School engagement: Potential
of the concept, state of the evidence. Review of Educational Research, 74, 59-109.
doi:10.3102/00346543074001059
Fredricks, J., McColskey, W., Meli, J., Mordica, J., Montrosse, B., and Mooney, K.
(2011). Measuring student engagement in upper elementary through high school:
A description of 21 instruments. Issues & Answers Report, REL 2011–No. 098.
Washington, DC: U.S. Department of Education, Institute of Education Sciences,
National Center for Education Evaluation and Regional Assistance, Regional
Educational Laboratory Southeast. Retrieved from http://ies.ed.gov/ncee/edlabs
Grail Research. (2011). Consumers of tomorrow insights and observations
about Generation Z. Retrieved from http://goo.gl/7qYuWt
Hattie, J. (2012). Visible learning for teachers: Maximizing impact on learning. New

113
York: Routledge.
Hew, K. F. & Brush, T. (2007). Integrating technology into K-12 teaching and learning:
Current knowledge gaps. Education Tech Research and Development, 55(3),
223-252, doi:10.1007/s11423-006-9022-5
Howley, A., Wood, L., & Hough, B. (2011). Rural elementary school teachers’
technology integration. Journal of Research in Rural Education, 26(9), 1-13.
ISTE standards for students. (2016). USA: International Society for Technology in
Education.
Januszewski, A. & Molenda, M. (2013). Educational technology: A definition of
commentary. New York, NY: Routledge, Taylor & Francis Group.
Jensen, E. (2016). Poor students, rich teaching: Mindsets for change. Indiana: Solution
Tree Press.
Kim, C., Kim, M. K., Lee, C., Spector, J. M., & DeMeester, K. (2013). Teacher beliefs
and technology integration. Teaching and Teacher Education, 29, 76-85,
doi:10.1016/j.tate.2012.08.005
Kopcha, T. J. (2012). Teachers’ perceptions of the barriers to technology integration and
practices with technology under situated professional development. Computers
and Education, 59(4), 1109-1121, doi:10.1016/j.compedu.2012.05.014
Krathwohl, D. (2002). A revision of Bloom’s taxonomy: An overview. Theory into
practice: Revising Bloom’s taxonomy 41(4), 212-218, doi:
10.1207/s15430421tip4104_2
Larinee, D. B. (2013). How are teachers integrating technology in K-5 classrooms:
114
Studying student cognitive engagement using the Instructional Practices
Inventory-Technology (IPI-T) instrument. (Unpublished doctoral dissertation).
New Mexico University, New Mexico.
Lewis, A., & Smith, D. (1993). Defining higher order thinking. Theory into practice:
Teaching for higher order thinking 32(3), 131-137, doi:101.203.168.101
McClure, M., Jukes, I., & MacLean, R. (2011). Getting it right: Aligning technology
initiatives for measurable student results. Vancouver, Canada: 21st Century
Fluency Project.
McCrindle, M. (2014). The ABC of XYZ: Understanding the global generations.
Australia: A McCrindle Publication.
McCrindle, M. (2018). What comes after Generation Z? Introducing Generation Alpha
[web log comment]. Retrieved from https://mccrindle.com.au/insights/
blogarchive/what-comes-after-generation-z-introducing-generation-alpha/
Milman, N. B. (2009). Are students today really different? Distance Learning, 6(2), 59-
61. Retrieved from http://search.proquest.com.ezproxylocal.library.nova.edu/
docview/230703086?accountid=6579
Olsen, W. (2004). Triangulation in social research: Qualitative and quantitative methods
can really be mixed. Development in Sociology. M. Holborn, Ormskirk:
Causeway Press.
Prensky, M. (2001a). Digital Natives, Digital Immigrants, part I. On the Horizon, 9(5),
1-6. Retrieved from http://old.ektf.hu/~kbert/2014_15_01/erasmus/
DigitalNativesPartIII.pdf
Prensky, M. (2001b). Digital Natives, Digital Immigrants, part II: Do they really think

115
differently? On the Horizon, 9(6), 1-10. Retrieved from http://www.taylorprograms.com/
images/Marc_Prensky_Digital_natives_2.pdf
Prensky, M. (2005). Teaching digital natives: Partnering for real learning. Retrieved
from http://marcprensky.com/wp-content/uploads/2013/04/Prensky-TEACHING_
DIGITAL_NATIVES-Introduction1.pdf
Prensky, M. (2015). Teaching Digital Natives: Partnering for real learning. California:
Corwin.
Rothman, D. (2014). A Tsunami of learners called Generation Z. Retrieved from
http://mdle.net/Journal/A_Tsunami_of_Learners_Called_Generation_Z.pdf
Russell, M., Bebell, D., O’Dwyer, L., & O’Connor, K. (2003). Examining teacher
technology use implications for preservice and inservice teacher preparation.
Journal of Teacher Education, 54(4), 297-310.
Schrum, L. & Levin, B. (2012). Leading 21st century schools. California: Corwin.
Schrum, L. & Levin, B. (2015). Evidence-based strategies for leading 21st century
schools. California: Corwin.
Shatto, B. & Erwin, K. (2017). Teaching millennials and Generation Z: Bridging the
generational divide. Creative Nursing, 23(1), 24-28.
Sundeen, T. H. & Sundeen, D. M. (2013). Instructional technology for rural schools:
StratAccess and Acquisition. Rural Special Education Quarterly, 32(2), 8-14.
Tapscott, D. (2009). Growing up digital: How the Net Generation is changing our world.
New York: McGraw Hill.
Tondeur, Jo & van Braak, Johan & Siddiq, Fazilat & Scherer, Ronny. (2016). Time for a

116
new approach to prepare future teachers for educational technology use: Its
meaning and measurement. Computers & Education.
doi;10.1016/j.compedu.2015.11.009
U.S. Dept. of Education Office of Educational Technology. (2016). Future ready
learning: Reimagining the role of technology in education. Washington, DC.
Retrieved from http://tech.ed.gov/files/2015/12/NETP16.pdf
Valentine, J. User requirements. IPI website for the study of student engagement.
Retrieved from https://ipistudentengagement.com/ipi-process-in-depth/data-
collection-requirements
Valentine, J. (2012a). IPI component basic workshop description. Unpublished
manuscript.
Valentine, J. (2012b). Strategies for IPI implementation. Unpublished manuscript.
Valentine, J. (2012c). Workshop handouts. Unpublished manuscript.
Valentine, J. (2013). Frequently requested facts and figures about student engagement.
Unpublished manuscript.
Valentine, J. (2015a). IPI-T Component Workshop Description. Unpublished manuscript.
Valentine, J. (2015b). IPI frequently asked questions. Unpublished manuscript.
Valentine, J. (2015c). The Instructional Practices Inventory- Technology (IPI-T): IPI-
Technology Component Workshop description. Unpublished manuscript.
Valentine, J. (2017). The IPI Process-Basic perspectives. Unpublished manuscript.
Valentine, J. (n.d.). Faculty collaborative study. Retrieved from:
https://ipistudentengagement.com/ipi-process-in-depth/faculty-collaborative-study
Valentine, J. (2018). The Instructional Practices Inventory: A school-wide process for

117
faculty collaborative study of student cognitive engagement [PowerPoint slides].
Voke, H. (2002). Motivating students to learn. ASCD Infobrief 2(28). Retrieved from
http://www.ascd.org/publications/newsletters/policy-
priorities/feb02/num28/toc.aspx
Vongkulluksn, V. W., Xie, K., & Bowman, M. (2018). The role of value on teachers’
internalization of external barriers and externalization of personal beliefs for
classroom technology integration. Computers and Education, 118, 70-81, doi:
10.1016/j.compedu.2017.11.009
Wang, S., Hsu, H., Campbell, T., Coster, D. C., & Longhurst, M. (2014). An
investigation of middle school science teachers and students use of technology
inside and outside of classrooms: Considering whether digital natives are more
technology savvy than their teachers. Educational Technology, Research and
Development, 62(6), 637-662. doi:10.1007/s11423-014-9355-4
Zhao, Y., Pugh, K., Sheldon, S., & Byers, J. L. (2002). Conditions for classroom
technology innovations. Teachers College Record, 104(3), 482-515.

118
Appendix A
Instructional Practices Inventory Categories
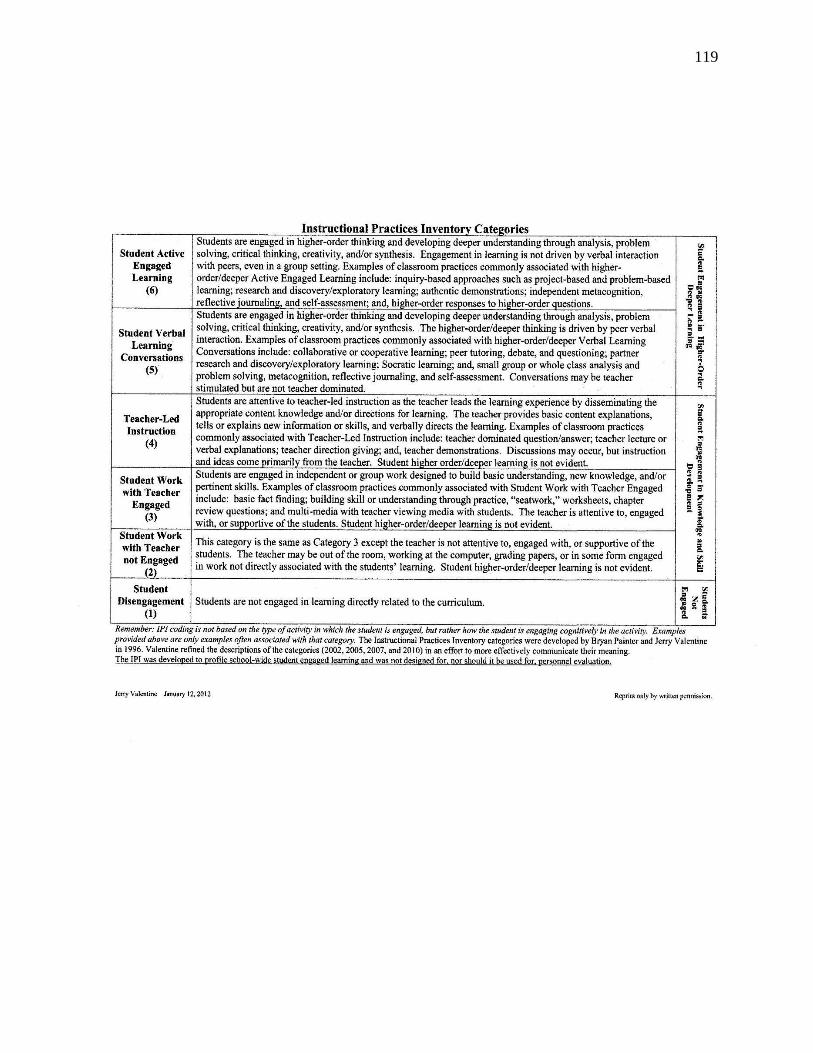
119

120
Appendix B
IPI-T Tech-Use Category Definitions and Examples

121

122

123
Appendix C
IPI/IPI-T Data Recording Form (4-28-14)

124

125
Appendix D
Faculty Collaborative Session 1

126

127
Appendix E
Faculty Collaborative Session 2

128

129
Appendix F
Faculty Collaborative Session 3

130
131
Appendix G
Faculty Collaborative Session 4

132
Copyright © 2022 FDOKUMEN