
Characteristics of Socio-Technical Systems 1 Introduction to the Concept of Socio-Technical Systems
Upload
independentCategory
view
5download
0
1
CHAPTER-1
INTRODUCTION
1.1 INTRODUCTION TO THE CONCEPT OF STUDY
Inventory management is the process of efficiently
overseeing the constant flow of units into and out of an
existing inventory. This process usually involves controlling
the transfer in of units in order to prevent the inventory
from becoming too high, or dwindling to levels that could put
the operation of the company into jeopardy. Competent
inventory management also seeks to control the costs
associated with the inventory, both from the perspective of
the total value of the goods included and the tax burden
generated by the cumulative value of the inventory.
Balancing the various tasks of inventory management means
paying attention to three key aspects of any inventory. The
first aspect has to do with time. In terms of materials
acquired for inclusion in the total inventory, this means
understanding how long it takes for a supplier to process an
order and execute a delivery. Inventory management also
demands that a solid understanding of how long it will take
for those materials to transfer out of the inventory be
established. Knowing these two important lead times makes it
possible to know when to place an order and how many units
must be ordered to keep production running smoothly.

2
Calculating what is known as buffer stock is also key to
effective inventory management. Essentially, buffer stock is
additional units above and beyond the minimum number required
to maintain production levels. For example, the manager may
determine that it would be a good idea to keep one or two
extra units of a given machine part on hand, just in case an
emergency situation arises or one of the units proves to be
defective once installed. Creating this cushion or buffer
helps to minimize the chance for production to be interrupted
due to a lack of essential parts in the operation supply
inventory.
Inventory management is not limited to documenting the
delivery of raw materials and the movement of those materials
into operational process. The movement of those materials as
they go through the various stages of the operation is also
important. Typically known as a goods or work in progress
inventory, tracking materials as they are used to create
finished goods also helps to identify the need to adjust
ordering amounts before the raw materials inventory gets
dangerously low or is inflated to an unfavourable level.
Finally, inventory management has to do with keeping
accurate records of finished goods that are ready for
shipment. This often means posting the production of newly
completed goods to the inventory totals as well as subtracting
the most recent shipments of finished goods to buyers. When
the company has a return policy in place, there is usually a
sub-category contained in the finished goods inventory to

3
account for any returned goods that are reclassified as
refurbished or second grade quality. Accurately maintaining
figures on the finished goods inventory makes it possible to
quickly convey information to sales personnel as to what is
available and ready for shipment at any given time.
In addition to maintaining control of the volume and
movement of various inventories, inventory management also
makes it possible to prepare accurate records that are used
for accessing any taxes due on each inventory type. Without
precise data regarding unit volumes within each phase of the
overall operation, the company cannot accurately calculate the
tax amounts. This could lead to underpaying the taxes due and
possibly incurring stiff penalties in the event of an
independent audit.
1.2 THEORETICAL BACKGROUND
A manufacturing inventory consists of three different parts:
raw materials, work in process and finished goods. Using a
leather crafting business as my sample craft company, here are
definitions and examples of the three:
RAW MATERIALS
This type of inventory includes any goods used in the
manufacturing process, such as components used to assemble a
finished product. Raw materials may also include partially
finished goods or materials. For example, for an orange juice
company, oranges, sugar and preservatives are raw materials;

4
while for a computer manufacturer, chips, circuit boards and
diodes are raw materials. Inventory items may be classified as
raw materials if the organization has purchased them from an
outside company, or if they are used to make components.
WORK-IN-PROCESS
Work-in-process inventory items are those materials and parts
that are waiting to be made into something else. These may
include partially assembled items that are waiting to be
completed. Work-in-process inventory items may include
finished goods that have not yet been packaged and inspected,
as well as raw materials that have moved from storage to a
preassembly area. For example, in an orange juice company, the
oranges may come in to a storage area, where they are raw
goods, but once they have been moved out of the storage area
and onto the assembly line for juicing, they become work-in-
process inventory. In a small company, work-in-process goods
may be stored in the same area as raw materials and finished
goods.
FINISHED GOODS
Finished goods are any products that are ready to be shipped
out or sold directly to customers, including to wholesalers
and retailers. Finished goods may be waiting in a storage area
or on a shop floor. If the amount of inventory of finished
goods increases faster that the amount of raw goods and work-
in-process goods, then production may need to slow down until
more finished goods are sold. In some businesses, goods are

5
not included in the finished goods inventory until they are
sold. For example, in companies where goods are made to order.
1. To meet anticipated demand.
2. To smooth production requirements.
3. To decouple operations.
4. To protect against stock-outs.
5. To take advantage of quantity discounts.
6. To permit operations.
7. To help hedge against price increases.
8. To take advantage of order cycles.
VARIOUS COSTS ON INVENTORY
Inventory procurement, storage and management is
associated with huge costs associated with each these
functions.
INVENTORY COSTS ARE BASICALLY CATEGORIZED INTO THREE
HEADINGS:
1. Ordering Cost
2. Carrying Cost
3. Shortage or stock out Cost & Cost of Replenishment
a. Cost of Loss, pilferage, shrinkage and

6
obsolescence etc.
b. Cost of Logistics
c. Sales Discounts, Volume discounts and other
related costs.
ORDERING COST
Cost of procurement and inbound logistics costs form a part of
Ordering Cost. Ordering Cost is dependant and varies based on
two factors - The cost of ordering excess and the Cost of
ordering too less.
Both these factors move in opposite directions to each other.
Ordering excess quantity will result in carrying cost of
inventory. Whereas ordering less will result in increase of
replenishment cost and ordering costs.
These two above costs together are called Total Stocking Cost.
If you plot the order quantity vs. the TSC, you will see the
graph declining gradually until a certain point after which
with every increase in quantity the TSC will proportionately
show an increase.
This functional analysis and cost implications form the basis
of determining the Inventory Procurement decision by answering
the two basic fundamental questions - How Much to Order and
When to Order. How much to order is determined by arriving at
the Economic Order Quantity or EOQ.
7
CARRYING COST
Inventory storage and maintenance involves various types
of costs namely:
Inventory Storage Cost
Cost of Capital
Inventory carrying involves Inventory storage and management
either using in house facilities or external warehouses owned
and managed by third party vendors. In both cases, inventory
management and process involves extensive use of Building,
Material Handling Equipments, IT Software applications and
Hardware Equipments coupled managed by Operations and
Management Staff resources.
INVENTORY STORAGE COST
Inventory storage costs typically include Cost of Building
Rental and facility maintenance and related costs. Cost of
Material Handling Equipments, IT Hardware and applications,
including cost of purchase, depreciation or rental or lease as
the case may be. Further costs include operational costs,
consumables, communication costs and utilities, besides the
cost of human resources employed in operations as well as
management.
COST OF CAPITAL
Includes the costs of investments, interest on working
capital, taxes on inventory paid, insurance costs and other
costs associate with legal liabilities.

8
The inventory storage costs as well as cost of capital are
dependent upon and vary with the decision of the management to
manage inventory in house or through outsourced vendors and
third party service providers.
Current times, the trend is increasingly in favor of
outsourcing the inventory management to third party service
provides. For one thing the organizations find that managing
inventory operations requires certain core competencies, which
may not be in line with their business competencies.
Secondly in case of large-scale warehouse operations, the
scale of investments may be too huge in terms of cost of
building and material handling equipments etc. Besides the
project may span over a longer period of several years, thus
blocking capital of the company, which can be utilized into
more important areas such as R & D, Expansion etc. than by
staying invested into the project.
1.3 REVIEW OF LITERATURE
Praveen, Singh (2008)1 on his paper “Inventory and working
capital management: an empirical analysis” tries to evaluate
the effect of the size of inventory and the impact on working
capital through inventory ratios, working capital ratios,
trend analyses. Finally, the study found that the size of
inventory directly affects working capital and its management.
F.Samiloglu and K.Demirgunes, (2008)2 on his paper “The effect
of working capital management on firm profitability: Evidence
from Turkey” aim of the study is to analyze the effects of
9
working capital management on firm profitability. Empirical
findings of the study show that accounts receivables period,
inventory period and leverage effect firm profitability
negatively; while growth (in sales) affects the firm
profitability. Results suggest that firm profitability can be
increased by shortening accounts receivables and inventory
periods.
AcaDemon Kanyanyuz(2005)3 in his paper “Fixed Asset Inventory
System” with the objective to design and develop a database
that will maintain the asset registers. The project emphasis
was mainly put on tracking the assets of the organisation
hence development of a register that will be used by the
auditors who come to audit the organization. The main the
objective was tracking assets of the organisation whereas this
project is looking at the managing of stocks meant to be sold.
______________________________________________________________
_____________
1.Praveen Singh, “Inventory and working capital management: an
empirical analysis”, the ICFAI Journal of accounting research,
apparel 2008, vol.7, No.2.pp.53-73.
2.Samiloglu and K.Demirgues, “The effect of working capital
management on firm profitability: Evidence from Turkey”, the
international journal of applied economics and France, 2008,
vol.no.2 (1), pp.44-50.

10
3.AcaDemon,(2005) Inventory Control Systems-Inventory control
systems as related to overall Production for a company.
[Online] http://www.academon.com/lib/paper/57872.html 15th
September 2005
B.J. Grablowsky, (2005)4 on his paper “Financial management of
inventory” surveyed small business inventory management
practices and compared with techniques commonly employed by
large corporations. It appears that smaller firms rely on
simple controls. Of those small firms which did not use
quantitative methods for determining inventory order and stock
levels, the most common qualitative methods were "past
experience" and "executive judgment".
Bwire (2004)5 on his paper “Stores Management Information
System” determines the stock levels by computing the received
and distributed commodities. The aim of the study was to
provide an Automated Computerised System for securing, quick
evaluation and manipulation of records of goods received and
distributed at the store. The paper mainly deals with stores
looking at the aspect of goods whereby the control of services
is not tackled. Ronald .H.Ballou, (2000)6 on his paper “Evaluating inventory
management performance using a turnover curve” examines the
inventory turnover ratio. Turnover curve is used to estimate
the impact of changing the inventory control procedures or to
set new targets of inventory levels. It is simple yet powerful

11
tool for evaluating inventory managerial performance can be
developed from readily available company data.
4.B.J. Grablowsky, 2005 “Financial Management of Inventory”
International Journal of Production Economics, Volumes 93-94,
Pages 239-25.
5.Bwire (2004), Project report entitled Stores Management
Information System.
6.Ronald H. Ballot.”Evaluating inventory management
performance using a turnover curve” international journal of
physical distribution & logistics management, 2000, vol. 30.
Kibera (1996)7 in his paper “Introduction to Business” examines
Inventory in most organisations is the largest single
investment. Its therefore sensible that the management
understands what it is and also effectively controls it.
Automation of inventory will effectively maintain a sufficient
buffer stock for the smooth running of the organization.
LalithGoonatilake (1990)8 On his paper “Inventory management
in the manufacturing sector in developing countries” examines
that the industrialization policies adopted by developing

12
countries and assesses its impact on inventory management
factors influencing inventory demand are identifies and the
interaction between production planning and inventory control
is considered as a key parameter. A reversal of inventory
management objectives in the developing country environment is
brought to light where the efficiency objective is given more
significance then the cost objective.
______________________________________________________________
_____________
7.Kibera.N. (1996), “Introduction to Business”, a Kenya
Perspective. Kenya Literature Bureau.

13
8.Lalithgoonatilale. (1990). “Inventory management in the
manufacturing sector in developing countries” Engineering
costs and production economics, 19(1-3), pp19 -24
1.4 STATEMENT OF THE PROBLEM
Control of inventory, which typically represents 45% to
90% of all expenses for business, is needed to ensure that the
business has the right goods on hand to avoid stock-outs, to
prevent shrinkage (spoilage/theft), and to provide proper
accounting. Many businesses have too much of their limited
resource, capital, tied up in their major asset, inventory.
Inventory Management ties up capital, requires handling, uses
storage space, deteriorates, sometimes becomes obsolete,
requires insurance, incurs taxes, can be stolen or gets lost.
Inventory must be considered at each of the planning levels
with production planning concerned with overall inventory,
master planning with end items and materials requirements
planning with components parts and raw material. The primary
function of inventory is buffering and decoupling. It serves
as a shock absorber between customer demand and the
manufacturer’s production capability, between input materials
required for an operation and the output of the preceding
operation, between the manufacturing process and the supplier
of raw materials.
1.5 OBJECTIVE

14
To categorise the inventory and highlight the most valued
items for manufacturing process.
The determine the effectiveness of existing inventory
management system.
1.6 SCOPE OF THE STUDY
The scope of the study is to analyse the inventory model
for Pricol Limited with the past 3 year’s reports (2010-2012).
Effectiveness of the present inventory system is also studied
with the help of information collected by questionnaire from
the employees who are in charge on each module in the
organisation.
1.7 METHODOLOGY
1.7.1 TYPE OF STUDY
The study carried out is descriptive research study. To
find the effectiveness of the existing inventory system and to
suggest the techniques which are helpful for further effective
control.
1.7.2 TOOLS FOR DATA COLLECTION

15
Secondary method of data collection is done through
websites, books, journals and annual records of the
organisation.
Primary data using questionnaire.
1.7.3 TOOLS OF ANALYSIS
Ratio Analysis
Percentage analysis
1.8 LIMITATIONS
The study depends more on the secondary data.
There might be personal bias.
1.9 CHAPTER SCHEME
INTRODUCTION

16
The chapter provides an introduction to the concept of
study, explains the theoretical background of the study, the
various review of literature, statement of problem, list of
objectives of study, explain various sources of research and
sample design, statistical and financial tools used in study,
scope of study and limitations.
ORGANISATIONAL PROFILE
This chapter provides details about the organisation
which includes history, management details, organisational
structure and board of directors, product profile and market
potential, information about competitive strength of company,
future plans and overall description of various functional
areas.
MICRO MACRO ECONOMIC ANALYSIS
This chapter briefly discuss about the prevailing
economic scenario with respect to the organisation
ANALYSIS AND INTERPRETATION
This chapter shows the implementation of various
statistical and financial tools for analysis of inventory and
financial performance and interpretation of results.
CONCLUSION
This chapter organises the various results and analysis
discussions and provide recommendations suggested to the users
of research findings.

17
CHAPTER-2
ORGANIZATION PROFILE
2.1 HISTORY OF THE ORGANISATION
Premier Instruments & Controls Limited is primarily an
Automobile Ancillary Unit with diversification in the recent
years into Electronic Control Instruments, Precision Machine
Tools, Panel and Sensor Instruments for Defence and Industrial
Gauges. Its main line of business is manufacture of auto
instruments and allied accessories.
The Company was established in 1972 and commenced
commercial production in the year 1975 with an initial
capacity of 4 lakh Nos. of Dashboard Instruments per annum at
its factory at Coimbatore.
The Company registered consistent growth in the turnover
over the years due to its dedicated personnel and commitment
to quality and service. Continuous Research & Development work
and multi disciplinary Engineering Base has strengthened its
capacity to cater to the changing needs of the end users
within a reasonable time. The Company has set up an assembling

18
unit at Gorgon, Haryana, with an annual installed capacity of
5 laky Nos. of dashboard instruments at better service to OME
customers. The production at assembling units.
The Company increased its installed capacity from 4
lakhs Nos.34.50 lakhs Nos. of Dashboard Instruments per annum
over the period and has emerged as the market leader having a
market share of more than 50% of OEM's requirements in the
domestic market, catering to the needs of almost all the
vehicle manufacturers in the country, besides meeting more
than 40% of the replacement market demand through the
countrywide dealers network.
The turnover of the company increased from RS.10lakh
during the year 1975 the year of commencement of commercial
production to RS.5419 in the previous year ending March 2013.
The Company has made a small beginning in Export of its
products with a turnover of Rs. 2.88 lakhs in 1985. The Export
turnover achieved during the last financial year ending 31st
March 2013- Rs.1752 lakhs. The Company is the first among the
few and only one in the automotive instrumentation field to
obtain the coveted ISO 9001 Certificate in this country.
During the year 1985, the Company has entered into
technical collaboration with M/s. NS International Ltd., U.SA.
(A subsidiary of M/s. Nippon Seiko Co. Ltd., Japan) for
upgradation of existing technology in the manufacture of
Dashboard Instruments for two wheelers.

19
During the year 1991-92, the Company has entered into
technical collaboration with M/s. Nippondenso Co. Ltd. Japan
for upgradation of technology in the manufacture of four
wheeler Instruments thereby improving upon its quality levels
and manufacturing methods to keep pace with the international
technological government in the instrumentation field.
The products manufactured by the company caters to the
needs of the established vehicle manufacturers like Maruti,
TELCO, Eicher, DCM, Kinetic Honda, Hero Honda, Escorts, TVS
Suzuki, Ashok Leyland, Mahindra and Mahindra, Bajaj Auto,
Bajaj Tempo, Tafe, Premier Automobiles, Hindustan Motors, etc.
Some milestones are,
1974- Established as premier instrument CBE limited (Plant 1)
1981- Renamed as premier instrument & control united.
1988- Established plant 2 at Gurgoan New Delhi.
1989- Started to manufacture defence products.
1997- Collaborated with Denso Corporation, Japan, to chalk out
the future growth plans of the company. Denso is the World’s
second largest auto ancillary company and has acquired 12.5%
of the equity capital of Pricol.
2004- Renamed as Pricol limited to leverage the brand name
“Pricol”. In the same year, the company established plant 5 in
Pune and PT Pricol surya in Indonesia to fulfil the
requirement of our OME customers in western India and
Indonesia respectively.
20
2007- Set up plant 6 in Bajaj Auto’s manufacturing park at
Pant Nagar, Uttarakhand.
2008- Commenced plant 7 in Tata motor’s Manufacturing Park at
pant Nagar, Uttarakhand; also established a new plant at
Malumichampatti, near Coimbatore in the same year.
2.1.1 CORPORATE VISION
Strive to attain leadership in all the products and
services that we provide, through socially and environmentally
acceptable means.
2.1.2 CORPORATE MISSION
Achieve leadership through constant innovation and continuous
improvement in every sphere of our activity. Enhance value to
our customers, employees, suppliers, shareholders and also
care for the society and environment around us.
2.1.3 CORPORATE CORE VALUES
Passion- Whatever we do, we do it from the
bottom of our heart
Respect- We respect those who add value to
our livesIntegri
ty- We never compromise on our values.
Collabo
rate
- We believe in working towards a
unified goalOwnersh
ip
- We are responsible for all our
actions
21
Listen- We listen to both the spoken and
unspoken before we act
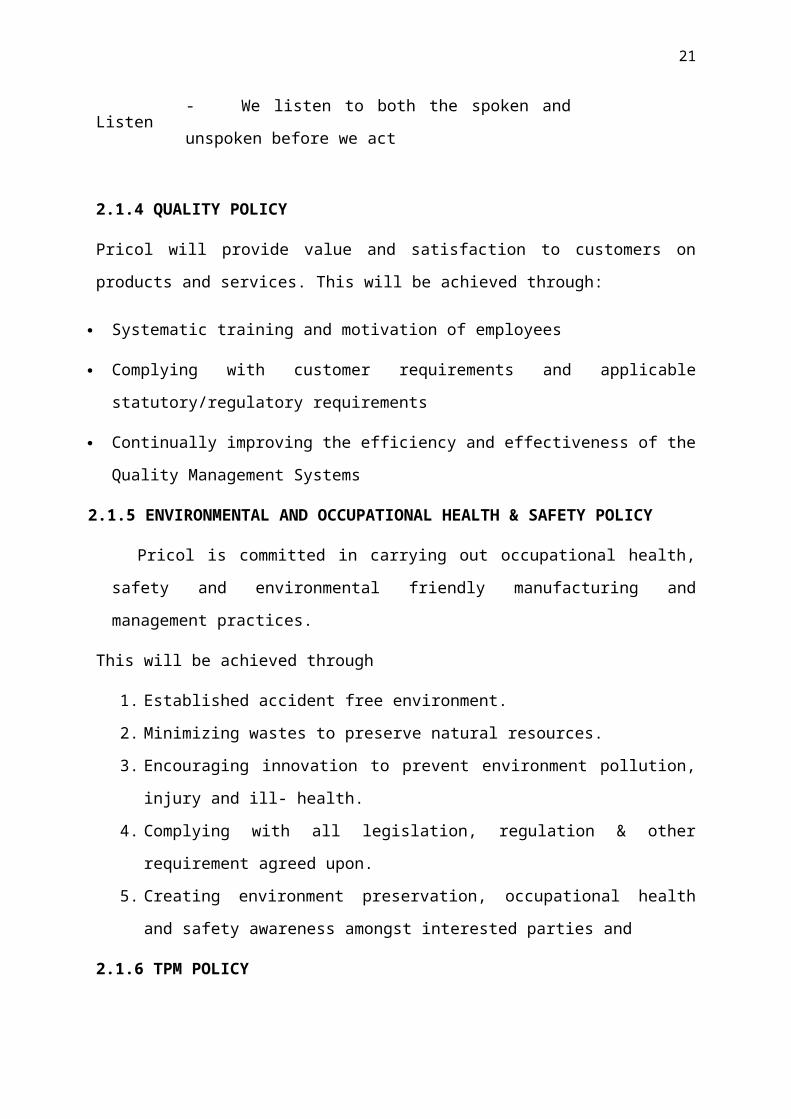
2.1.4 QUALITY POLICY
Pricol will provide value and satisfaction to customers on
products and services. This will be achieved through:
Systematic training and motivation of employees
Complying with customer requirements and applicable
statutory/regulatory requirements
Continually improving the efficiency and effectiveness of the
Quality Management Systems
2.1.5 ENVIRONMENTAL AND OCCUPATIONAL HEALTH & SAFETY POLICY
Pricol is committed in carrying out occupational health,
safety and environmental friendly manufacturing and
management practices.
This will be achieved through
1. Established accident free environment.
2. Minimizing wastes to preserve natural resources.
3. Encouraging innovation to prevent environment pollution,
injury and ill- health.
4. Complying with all legislation, regulation & other
requirement agreed upon.
5. Creating environment preservation, occupational health
and safety awareness amongst interested parties and
2.1.6 TPM POLICY

22
Establish an excellent Total Productive Manufacturing system
with total involvement of all employees to achieve utilization
of all resources.
2.1.7 MANUFACTURING LOCATION AND THE ACTIVITIES UNDERTAKEN:
Plant 1- periyanaikan palayam, Coimbatore
Plant 1 is the mother plant of pricol and it located at
periyanaickan palayam 22kms from Coimbatore, Tamilnadu, India,
manufactures and services automotive instrument & accessories,
Marine instruments and electronic products.
Plant 2 – Gurgaon, Haryana – manufacturing of all products in
Pricol range for OEM customers in North India, namely, Hero
Honda, Maruthi Suzuki and Yamaha.
Plant 3- Chinnamathampalayam, Coimbatore.
Manufacture of pumps group products (mechanical parts ),namely
,oil pumps for two wheelers and stationary engines, Speedo
drive components for two wheelers, auto fuel cocks,valves,
gears and chain tensioners.
Plant 4-karanadai, Coimbatore.
This plant focuses on the electronic group products namely
fleet management solution (FMS), vehicle security systems and
counters& controls for textile machinery. Plant 4 also
manufactures PCBs(Printed Circuit Boards) to support
instruments product group.
Plant 5- Pune, Maharashtra
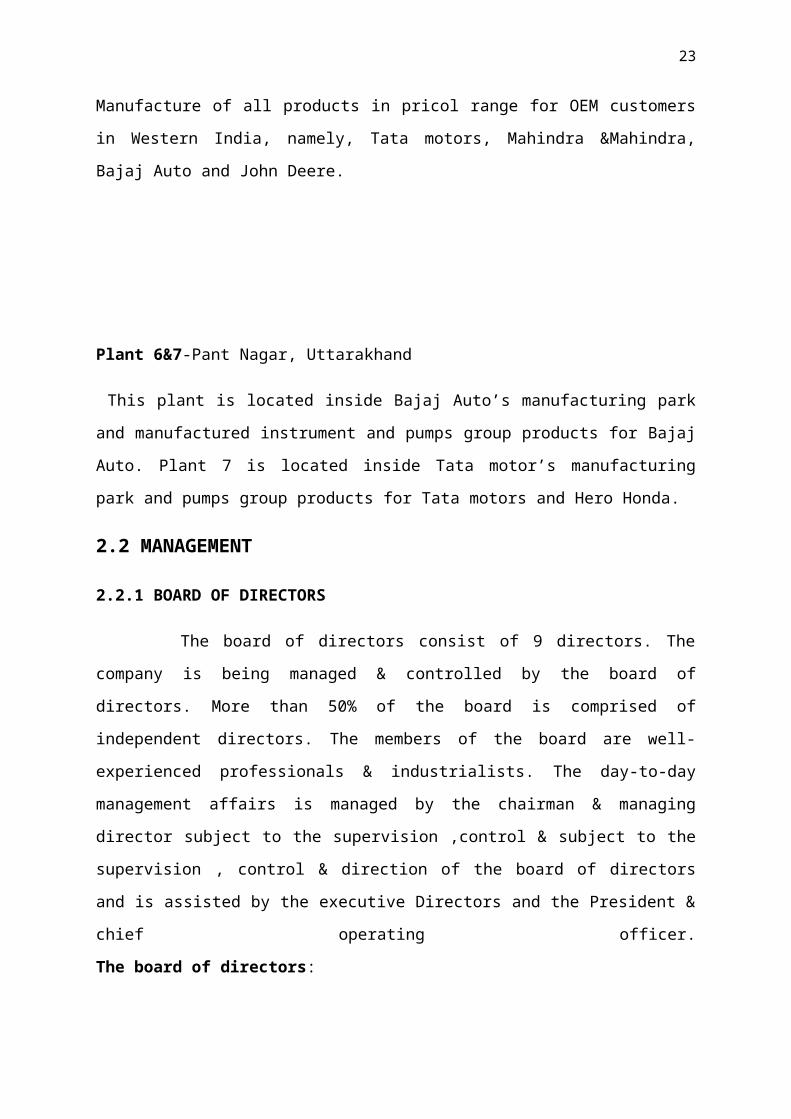
23
Manufacture of all products in pricol range for OEM customers
in Western India, namely, Tata motors, Mahindra &Mahindra,
Bajaj Auto and John Deere.
Plant 6&7-Pant Nagar, Uttarakhand
This plant is located inside Bajaj Auto’s manufacturing park
and manufactured instrument and pumps group products for Bajaj
Auto. Plant 7 is located inside Tata motor’s manufacturing
park and pumps group products for Tata motors and Hero Honda.
2.2 MANAGEMENT
2.2.1 BOARD OF DIRECTORS
The board of directors consist of 9 directors. The
company is being managed & controlled by the board of
directors. More than 50% of the board is comprised of
independent directors. The members of the board are well-
experienced professionals & industrialists. The day-to-day
management affairs is managed by the chairman & managing
director subject to the supervision ,control & subject to the
supervision , control & direction of the board of directors
and is assisted by the executive Directors and the President &
chief operating officer.
The board of directors:
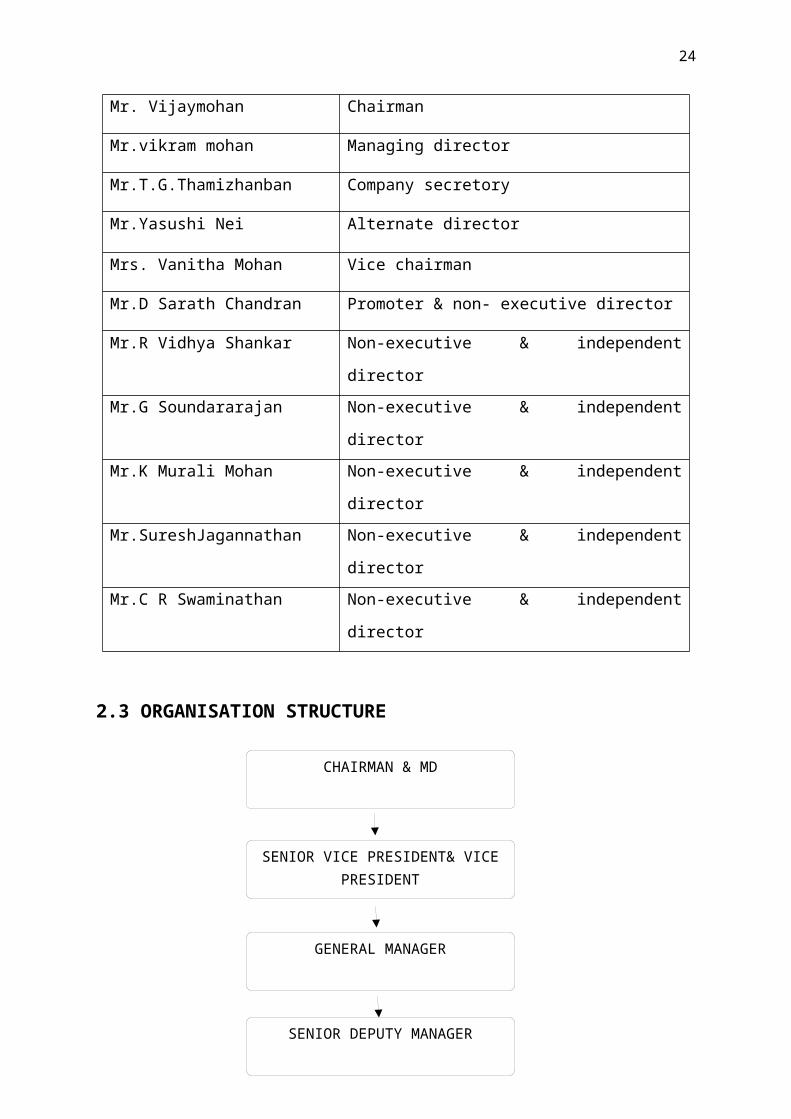
24
Mr. Vijaymohan Chairman
Mr.vikram mohan Managing director
Mr.T.G.Thamizhanban Company secretory
Mr.Yasushi Nei Alternate director
Mrs. Vanitha Mohan Vice chairman
Mr.D Sarath Chandran Promoter & non- executive director
Mr.R Vidhya Shankar Non-executive & independent
directorMr.G Soundararajan Non-executive & independent
directorMr.K Murali Mohan Non-executive & independent
directorMr.SureshJagannathan Non-executive & independent
directorMr.C R Swaminathan Non-executive & independent
director
2.3 ORGANISATION STRUCTURE
SENIOR VICE PRESIDENT& VICEPRESIDENT
GENERAL MANAGER
SENIOR DEPUTY MANAGER
CHAIRMAN & MD

25
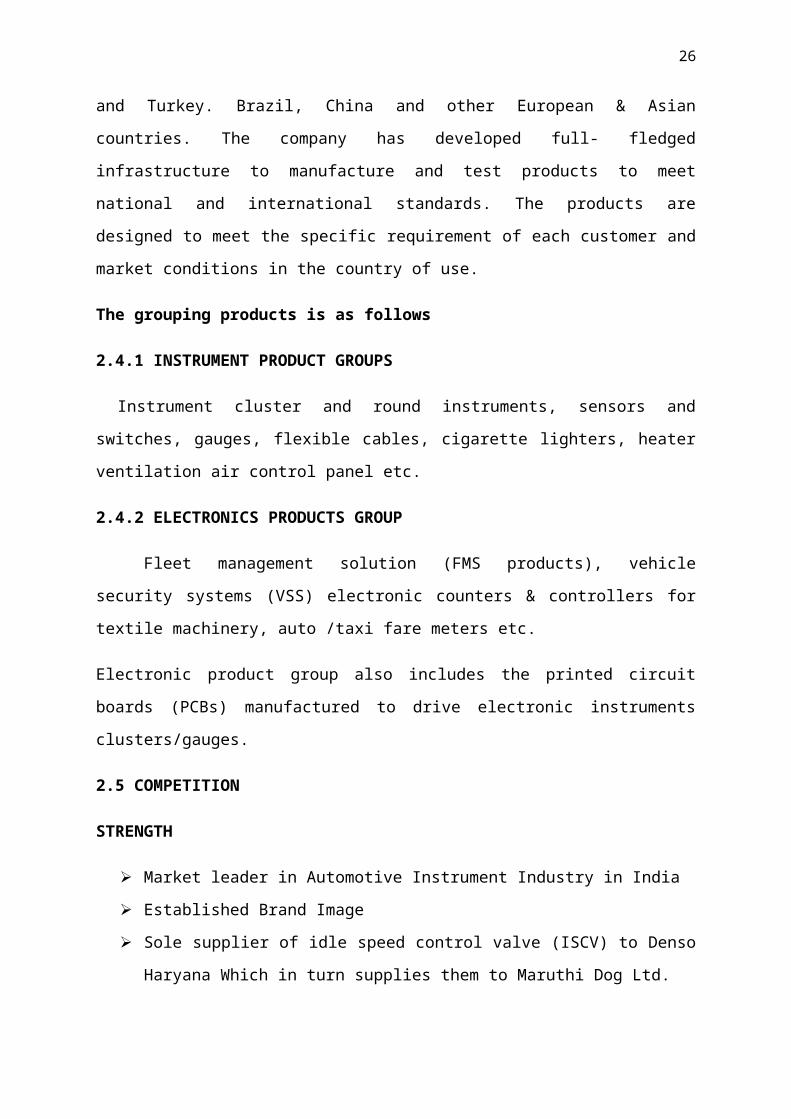
2.4 PRODUCT PROFILE & MARKET POTENTIAL
Pricol products are approved and used by most of the
original equipment manufacturers (OMEs) in the Indian
automobile industry. Pricol products are also exported to OEMs
and after – market customers in North America, UK, Australia,
DEPUTY MANAGER
ASSISTANT MANAGER
SENIOR ENGINEER/OFFICER
JUNIOR ENGINEER/OFFICER
ASSISTANT/TECHNICAL ASSISTANT
26
and Turkey. Brazil, China and other European & Asian
countries. The company has developed full- fledged
infrastructure to manufacture and test products to meet
national and international standards. The products are
designed to meet the specific requirement of each customer and
market conditions in the country of use.
The grouping products is as follows
2.4.1 INSTRUMENT PRODUCT GROUPS
Instrument cluster and round instruments, sensors and
switches, gauges, flexible cables, cigarette lighters, heater
ventilation air control panel etc.
2.4.2 ELECTRONICS PRODUCTS GROUP
Fleet management solution (FMS products), vehicle
security systems (VSS) electronic counters & controllers for
textile machinery, auto /taxi fare meters etc.
Electronic product group also includes the printed circuit
boards (PCBs) manufactured to drive electronic instruments
clusters/gauges.
2.5 COMPETITION
STRENGTH
Market leader in Automotive Instrument Industry in India
Established Brand Image
Sole supplier of idle speed control valve (ISCV) to Denso
Haryana Which in turn supplies them to Maruthi Dog Ltd.

27
Pricol Ltd gets technical support from Denso Corporation,
Japan, Which Is one of the largest automotive component
manufacturers.
Strong research and development.
Low cost, Skilled Workforce.
Learning from exports.
2.6 FUTURE PLAN
The vision of Pricol emerged in the form of “VISION 2020
– To achieve sales of Rs.10 billion by 2020 with 50%
contribution from International Business”.
To gain more Market Share & Profit in Exports.
Principle Strategic Challenges of the future
Think long term – but deliver today
Achieve global scale – But be responsive locally
Collaborate – simultaneously compete
Innovative – efficient
Team work – yet have individual accountability
Become flexible – yet standardise
Physical environment depleted – re-create by conservation
& tapping it exercise this year with the help of
Consultants. CIT also coordinates the activities of the
current BPR consultants.
ARCHITECTURE OF THE FUTURE
Strategy – aligned as per aspiration & choice of people &
team.

28
Organisation – Have only permeable boundaries
Processes - Have only minimal critical rules
Resources - Flexible
The future is only based on two factors – People and the
Brand.
2.7 DESCRIPTION OF VARIOUS FUNCTIONAL AREAS
2.7.1 BUSINESS DEVELOPMENT
Business Development (BD) is the front end department
of Pricol that interacts with customers.
Pricol’s businesses can be classified into 3 categories namely
Products for Original Equipment Manufacturers (OEMs)
Fleet Management Solutions (FMS) and
Products for Replacement Markets (Direct market products)
The OEM business contributes to the major portion of Pricol’s
total revenues and hence forms the largest team in BD.
BACKGROUND TO THE FORMATION OF CIT
Quality movement in Pricol commenced with the
implementation of TPM (Total Productive Manufacturing) systems
and practices way back. TPM was launched in several phases
since 1999 and by 2003 we successfully completed over 500
projects.
Pricol also initiated several advanced continuous
improvement approaches in the later years. Six Sigma, a

29
systematic methodology for achieving defect free production
system was launched in 2004 with the guidance of Satyam
Consultants and recently we established the Balanced Score
Card approach to monitor and control our business process.
Besides continuous improvement activities. Pricol
also underwent a Business Process Reengineering (BPR) exercise
way back in 1999 with the support of Renoir Consultants
Limited (UK) and is now undertaken a second BPR.
2.7.2 HUMAN RESOURCE DEPARTMENT
The HR department is primarily divided in to personnel
function, human resource development function
PERSONNEL FUNCTION
Time office, industrial Relations, Employee
welfare, discharging government apprenticeship (ITI) scheme,
HR activities at special vendor units & operationalising
Corporate Social Responsibility through Pricol Rural
Development Project (PRDP), cultural activities through
Kalakshetra & event management are the main key performance
areas of the function.
HUMAN RESOURCE FUNCTION
Competency mapping, assessment &
development, recruitment & new employee orientation, training
& development performance management, career development,
staff salary revision, leadership development, employee
satisfaction survey & aligning HR system with business

30
management system of Pricol are some of the initiatives of
this function.
DEVELOPMENT FUNCTION
Recruitment, training, performance
management, remuneration, performance appraisal, career &
succession planning & integrated human resource management
system.
2.7.3 FINANCE
Finance department is the management of sources &
applications of funds. It is important part of the company &
its function is accounting and reporting.
2.7.4 MACHINE SHOP (I)
The Machine Shop is the one of the main component
manufacturing units of Pricol. It is one of the oldest
departments in Pricol and manufactures back.
2.7.5 MATERIALS DEPARTMENT
Formerly known as Strategic Sourcing (SMS)
division, the Materials Department is bifurcated into
different terms based on the following core activities
Suppliers Quality Assurance (SQA) and Suppliers
Development (SD)
New Product Development (NPD)
Supplier Performance Management (SPM)
Procurement

31
2.7.6 MANUFACTURING ENGINEERING (ME)
The Manufacturing Engineering Department (ME) is the
facility creator for all the production modules of Pricol.
Since most of the products of Pricol are Original Equipment
(OE) products, which require exclusive assembly lines
involving Special Purpose Machines (SPMs), The Need an
engineering department that can develop these facilities in
inevitable.
2.7.7 PRODUCT DEVELOPMENT ENGINEERING-ELECTRONICS
PDEE is the counterpart of PDEI which focuses on the
design and development of electronic parts, mainly PCBs
(Printed Circuit Boards) for the new projects undertaken by
Pricol.
The PCB design and development processes include hardware
design, PCB design, software design, assembling, design
verification and validation etc. The PCB developed by PDEE is
supplied to the S&PM lab during sample assembly stage. Based
on Customers Evaluation of the sample, necessary modifications
are incorporated to the PCB, before freezing the design for
mass production.
2.7.8 PRODUCT DEVELOPMENT ENGINEERING-INSTRUMENTS
Product Development Engineering is the R&D
backbone of Pricol. PDEI (instruments) is one of the biggest
departments in Pricol. It undertakes the R&D activities for
the products belonging to the instruments group (i.e.,
Instrument clusters, round instruments & gauges, switches &
32
sensors etc). The major business divisions in PDEI are 2W
clusters, 4W clusters, off road vehicle clusters, accessories
& exports. Commercial vehicles are clubbed under 4W.
Accessories include switches, sensors, RSL, valves etc.
2.7.9 PLANT MAINTENANCE DEPARTMENT
PMD is the department responsible for carrying out
all the maintenance activities in Pricol. PMD Performs
Preventive and Breakdown Maintenance of all machineries and
utilities installed in Pricol and also undertake minor civil
works relating to renovation of existing facilities, shifting
of machineries, minor construction works etc. The Health,
Safety & Environment (HSE) cell is also attached to PMD.
2.7.10 PRINTING
The Printing department manufactures the dials for
instrument clusters as well as round instruments. The dials
manufactured in Pricol are printed on either Poly Carbonate
sheet or aluminium sheets.
2.7.11 INFORMATION SYSTEMS
To add value to the business process and render
faster and efficient service to the customers, Pricol has
installed IT systems like SAP R3 – ERP (Enterprise Resource
Planning) and Wind-chill (Collaborative Product Commerce)
Pricol Employs IBM Lotus Notes for Intra organization
communication and recently introduced the Sting Software for
facilitating Balanced Scorecard approach.

33
2.7.12 QUALITY ENGINEERING (QE)
Quality engineering is the department responsible for
ensuring quality at all stages of Pricol’s business process.
That is, from procurement stage to production and from
production to delivery of finished goods to customer, QE has
developed systems for quality check in order to ensure that
the final product supplied to customers is free of any defect.
2.7.13 STORES
The stores department in Pricol receives , inspects,
preserves and issues materials to all the internal buyers
(user departments). It handles nearly 60000inventory items.
The department has a centralized management structure but
decentralized operating units. It operates from several
locations near the buyer. However the activities and
procedures practices in all the store locations are the same.

34
CHAPTER -3
MICRO MACRO ECONOMIC ANALYSIS
3.1 MICRO MACRO ECONOMIC FACTOR
The global auto component industry experienced moderate
growth over the last five years and is expected to continue
its growth momentum reaching approximately $730.8 billion in
2017 with a CAGR of 3.2% over next five years (2012-2017).
APAC is anticipated to emerge as the leading growth market
over the forecast period due to high demand and low-cost
manufacturing practices in the region. Lucintel, a leading
global management consulting and market research firm, has
analyzed the global auto component industry and presents its
findings in “Global Auto Component Industry 2012-2017 Trend,
Profit, and Forecast Analysis.” The global auto component
industry is a highly diversified sector that involves engine
35
and auto component manufacturers, including aftermarket parts
manufacturers, suppliers, dealers, and retailers. The
manufacturing of auto components is gradually shifting toward
Asian countries such as China, India, and others because of
higher market potential and the low-cost manufacturing options
available. In China and India, OEMs are focused on helping the
suppliers improve and grow their businesses. Strong growth in
the industry has attracted a pool of companies, including
major foreign companies, to operate in China’s auto component
market. The growing importance of electronics and functional
integration of green components and sustainable products will
drive growth in the industry. Lucintel’s research indicates
that the industry witnessed strong growth during 2010-2011, as
there was an increase in automobile sales and production
coupled with demand for hybrid vehicles. Industry players
rapidly added capacity to meet growing demand from automobile
manufacturers. The industry is transforming and the boost in
demand is expected to give rise to several new players in the
industry. As per the study, searching qualified employees,
managing rising costs while staying competitive on price, and
expanding product portfolios are the biggest challenges for
the industry. Substantial investment in capacity expansion,
increasing after-market demand, and sales and revival in
global auto production with strong recovery in vehicle sales
are anticipated to expand the industry’s footprint. The report
tracks one market segment for four regions; thus, it tracks
four segments of the global auto component industry. This
comprehensive guide from Lucintel provides readers with

36
valuable information and the tools needed to successfully
drive critical business decisions with a thorough
understanding of the market’s potential. This report will save
Lucintel clients hundreds of hours in personal research time
on a global market and it offers significant benefits in
expanding business opportunities throughout the global auto
component industry. In a fast-paced ever-changing world,
business leaders need every advantage available to them in a
timely manner to drive change in the market and to stay ahead
of their competition. This report provides business leaders
with a keen advantage in this regard by making them aware of
emerging trends and demand requirements on an annual basis.
FIGURRE 3.1.1 ANNUAL PRODUCTION OF VEHICLES
The Indian auto component industry has been navigating
through a period of rapid changes with great élan. Driven by
global competition and the recent shift in focus of global
automobile manufacturers, business rules are changing and
37
liberalisation has had sweeping ramifications for the
industry. The global auto components industry is estimated at
US$1.2 trillion. The Indian auto component sector has been
growing at 20% per annum since 2000 and is projected to
maintain the high-growth phase of 15-20% till 2015.
The Indian auto component industry is one of the few
sectors in the economy that has a distinct global competitive
advantage in terms of cost and quality. The value in sourcing
auto components from India includes low labour cost, raw
material availability, technically skilled manpower and
quality assurance. An average cost reduction of nearly 25-30%
has attracted several global automobile manufacturers to set
base since 1991. India’s process-engineering skills, applied
to re-designing of production processes, have enabled
reduction in manufacturing costs of components. Today, India
has become the outsourcing hub for several global automobile
manufacturers.
Innovation and cost pruning hold the key to meeting the global
challenge of rising demand from developed countries and
competition from other emerging economies. Several large
Indian auto component manufacturers are already gearing to
this new reality and are in the process of substantially
investing in capacity expansion, establishing partnerships in
India and abroad, acquiring companies overseas and setting up
greenfield ventures, R&D facilities and design capabilities.
Some leading manufacturers of auto components in India include
Motor Industries Company of India, Bharat Forge, Sundaram

38
Fasteners, Wheels India, Amtek Auto, Motherson Sumi, Rico Auto
and Subros. The India’s Top 500 Companies, published by Dun &
Bradstreet in 2006, listed 22 auto component manufacturers as
top companies in India with a total turnover of US$ 3 bn.
These companies are in the process of making a mark on the
global arena, and some have already acquired assets abroad.
3.2 INDUSTRY STRUCTURE
The total turnover of the Indian auto component industry is
estimated at US$9 bn in 2006. The industry has the resources
to manufacture the entire range of auto products required for
vehicle manufacturing, approximately 20,000 components. The
entry of global manufacturers into India during the 1990s
enabled induction of new technologies, new products, improved
quality and better efficiencies in operations. This in turn
effectively acted as a catalyst to the local development of
the component industry.
The Indian auto component industry is extensive and highly
fragmented. Estimates by the Department of Heavy Industries,
Government of India, indicate there are over 400 large firms
who are part of the organised sector and cater largely to the
Original Equipment Manufacturers (OEMs). Another 10,000 firms
exist in the unorganised sector that operates in a tier-
format. The firms in this segment operate in low technology
products and cater to Tier I and Tier II suppliers and also
serve the replacement market
Around 4% of the companies operating in the auto component

39
segment cater to 80% of the demand emanating from OEMs. Within
the unorganised segment, apart from supplying in the
aftermarket, a number of players are also involved in job work
and contract manufacturing.
FIGURE 3.2.2 CHART OF AUTO COMPONENTS PRODUCT
The range of products manufactured, with each broad product
segment having a different market structure and technology,
has negated any possible concentration of the market in a few
hands. The market is so large and diverse that a large number
of players can be absorbed to accommodate buyer needs.
However, there are a select few large companies that have
integrated their operations across the value chain. The key to
competing in this industry is through specialisation by
product-type, and integrating operations across the related
area of specialisation.

40
An interesting insight provided by a study conducted by the
National Council of Applied Economic Research revealed that
the market segments for auto components included OEMs
constituting 33%, local components having 25% with the balance
42% comprising of spurious market including re-conditioned
parts. A large part of the spurious or grey market companies
are in the unorganised sector.
The regional base of auto component manufacturers is mostly
concentrated in the West, North and South of India. This
regional concentration of auto component manufacturers has
been dictated by the emergence of automobile manufacturers in
these regions. The set up of Tata Motors, Bajaj, Mahindra &
Mahindra and TVS in the 1950s and 1960s laid the foundation
for auto component manufacturers in the West and South, whilst
the entry of Maruti during the 1980s created the base in the
North.
3.3 INDUSTRY GROWTH
Production of auto ancillaries was estimated at US$10 bn in
2005-06 and has been growing at a robust 20% per annum since
2000. Exports of auto components have been strong growing at
24% per annum since 2000. This growth in exports if sustained
for another five years will see India’s auto components
exports will touch US$ 5 bn by 2011 from the US$ 2 bn at
present.
Till the 1990s, the auto component industry was solely
dependent on the domestic automobile industry to drive the

41
demand for ancillary products. This composition of the market
however is undergoing radical changes with global outsourcing
gaining momentum. In recent times, exports has emerged as a
significant driver of growth, and the demand emanating from
global OEMs and Tier I manufacturers has opened new
opportunities for the auto component industry in India. At the
same time, a bright outlook for the domestic automobile
industry also offers significant growth potential, given the
fast rising income levels with a rapidly growing middle and
high income consumers.
Share of exports in total production has risen from 10% in
1997 to 18% in 2006. The composition of exports in terms of
the proportion of OEM and aftermarket has also undergone a
sweeping change since the past decade. The ratio of OEM to
aftermarket has changed from 35:65 in the 1990s to 75:25 in
2006. While exports have been booming, there has been a sharp
rise in imports of auto components as well, especially in the
last three years. From an import of US$ 250 mn in FY03, they
have gone up to US$750 mn in FY06. This is a healthy trend,
indicative of rising domestic demand.

42
3.4 INVESTMENTS
Since 2000, the auto component industry has recorded an
investment level of Rs 18 bn and has attracted US$ 530 mn in
terms of foreign direct investment. Investments in the sector
have been growing at 14% per year. In 2005-06, investments
touched US$ 4.4 bn, and are expected to grow significantly in
future.
The Investment Commission has set a target of attracting
foreign investment worth US$ 5 bn for the next five years to
increase India’s share in the global auto components market
from the present 0.4% to 3-4%. This is a sizeable target
considering the meagre amount of FDI currently coming into the
industry. The changing perception of global auto makers is
however fast altering this scenario.
With less than 1% share in the global market, India has
tremendous potential to emerge as a supply base. Several
global giants like Ford and Toyota have already set up base in
India to source auto components. Outsourcing is fast catching
up with domestic OEMs as well, with most Indian OEMs today
sourcing nearly 70-80% of their component requirements from
vendors.
This changing business scenario is leading to an inevitable
outcome of consolidation within the industry. The takeover of
Kar Mobiles by Rane Engine and of Gero Auto by Uma Precision
is few instances. However, such mergers and takeovers will be
few and far in between in the auto component industry, unlike

43
the churn out anticipated in other emerging industries – the
principal factor being the vastness of the market and the
range of products that need to be delivered.
Rather than domestic consolidation, the general trend at
present is for the large auto component manufacturers to
establish a global presence. Top auto component manufacturers
have already set up base in the global markets, especially in
Europe. Overall, there have already been 16 acquisitions, with
six made in 2005. The industry is the third highest among the
Indian industries after IT and Pharma, in acquiring overseas
assets. These acquisitions have largely been in Europe and the
USA. This trend has been possible as the auto ancillary
industry in these countries have been collapsing, thus making
it affordable to acquire these companies. Nevertheless, this
will provide a base for Indian companies to access the
European and American markets.
Indian auto component companies are also setting up bases in
other emerging economies, who are potential competitors, for
instance, Sundaram Fasteners’ greenfield facility in Zhejiang
and Bharat Forge’s joint venture with the Chinese automotive
major FAW Corporation. Another auto component manufacturer
with plans to enter China is PMP Components, which intends to
set up a sourcing base to establish itself as a low cost
supplier.
These trends are indicative of the changing business
environment in the country. Top auto component manufacturers
are gearing to take big risks. Their cross-border vision has

44
established them as global companies. Though the going-global
phenomenon is limited to a handful of companies, the smaller
companies are also indirectly gearing to this trend by
entering into formal manufacturing contracts and
specialisation.
Prospects
Looking forward, the industry displays tremendous potential in
generating employment and boosting entrepreneurship in the
country. The spate of new investment plans announced by global
and domestic automobile manufacturers promises the emergence
of India as a global hub for auto components.
The industry is transforming, and the boost in demand will see
the emergence of several new players in the industry. The vast
market for auto components, and the diverse products and
technology involved ensures a place and role for many. At the
same time, the entry of several global automobile
manufacturers will bring in more regulation into the industry
and see a pruning of the spurious market. Among the smaller
players in the unorganised segment, this implies moving away
from being standalone companies, to entering into either
contract manufacturing or being ancillary units. The newly
defined rules are specialisation, development and delivery
that hold the key to success in the auto component industry.

45
CHAPTER -4
DATA ANALYSIS AND INTERPRETATION
This chapter deals with analysis and data interpretation
of data collected through secondary analysis and
questionnaire.
INVENTORY MANAGEMENT TECHNIQUES
4.1 ABC ANALYSIS
In supply chain, ABC analysis is an inventory
categorization method which consists in dividing items into
three categories, A, B and C: A being the most valuable items,
C being the least valuable ones. This method aims to draw
managers’ attention on the critical few (A-items) and not on
the trivial many (C-items).
Prioritization of the management attention
Inventory optimization is critical in order to keep
costs under control within the supply chain. Yet, in order to
get the most from management efforts, it is efficient to focus
on items that cost most to the business. The Pareto principle
states that 80% of the overall consumption value is based on
only 20% of total items. In other words, demand is not evenly
distributed between items: top sellers vastly outperform the
rest.

46
The ABC approach states that, when reviewing inventory, a
company should rate items from A to C, basing its ratings on
the following rules:
A-items are goods which annual consumption value is the
highest. The top 70-80% of the annual consumption value of the
company typically accounts for only 10-20% of total inventory
items.
C-items are, on the contrary, items with the lowest
consumption value. The lower 5% of the annual consumption
value typically accounts for 50% of total inventory items.
B-items are the interclass items, with a medium consumption
value. Those 15-25% of annual consumption value typically
accounts for 30% of total inventory items.
TABLE 4.1.1 ABC ANALYSIS
Category Percentage Value
A 69.95
26,73,
7,1670.4B 20.03 7,65,65,922.8
C 10.01
3,82,72,306.0
9
Total 100.00
38,22,09,899.
3
FIGURE 4.1.1 ABC ANALYSIS

47
A B C0.0010.0020.0030.0040.0050.0060.0070.00
ABC analysis
Percentage
4.2 FSN ANALYSIS
By doing FSN analysis materials can be classified based
on their movement from inventory for a specified period. Items
are classified based on consumption and average stay in the
inventory. Higher the stay of item in the inventory, the
slower would be the movement of the material
F – Fast Moving
S- Slow Moving
N- Non moving
This type of classification helps to establish and organize
proper warehouse layout by locating all the fast moving items
near the dispensing window to reduce the handling efforts.
Also, attention of the management is focused on the Non-Moving
items to enable decision as to whether they are in needs in
the future or they can be salvaged or disposed. This will help
to improve organization’s capital utilization and cash flow.

48
TABLE 4.2.1 FSN ANALYSIS
Category Percentage ValueMoving 69.07 18,46,63,901NM-3M 11.35 3,03,49,589.29SM-3M 19.58 5,23,58,180.09Total 100.00 267371670.4
FIGURE 4.2.1 FSN ANALYSIS
Moving NM-3M SM-3M
69.07
11.3519.58
FSN ANALYSISPercentage
4.3 PERCENTAGE OF INVENTORY ON WORKING CAPITAL
TABLE 4.3.1 PERCENTAGE OF INVENTORY ON WORKING CAPITAL
YEAR 2013 2012 2010

49
CURRENT ASSETS 346.93 455.14 409.85CURRENT LIABILITIES 262.27 354.72 218.25WORKING CAPITAL 84.66 100.42 191.6INVENTORIES 67.77 91.23 185.01% OF INVENTORIES IN WORKING
CAPITAL 80.05 90.85 96.56
FIGURE .4.3.1 PERCENTAGE OF INVENTORY ON WORKING CAPITAL
80.0590.85 96.56
INVENTORY ON WORKING CAPITAL
PERCENTAGE
The chart shows the percentage of inventory on working
capital. It keeps increasing year after year i.e. from 2010
(80%) to 2012 (96.56%).
4.4 TREND ANALYSIS
TABLE 4.4.1 TREND ANALYSIS
Month May’
13
Jun’
13
July
’13
Aug’
13
Sep’
13
Oct’
13
Nov’
13
Dec’
13
Jan’
13Invent 408 426 429 439 439 439 439 439 439

50
ory
FIGURE 4.4.1 TREND ANALYSIS
may'13
jun'13
jul'13
aug'13
sep'13
sep'13
oct'13
nov'13
dec'13
jan'14
390400410420430440450
Inventory Trend
inventory
The increasing trend shows the production for thecoming months is been predicted high from 408 units in may
2013 to 439 units in july 2013.
EFFECTIVENESS OF THE PRESENT INVENTORY SYSTEM IS ALSO STUDIED
WITH THE HELP OF INFORMATION COLLECTED BY QUESTIONNAIRE
4.5 AGE OF THE RESPONDENTS
TABLE 4.5.1 AGE OF THE RESPONDENTS
AGE(IN YRS) No. OF. RESPONDENT PERCENTAGE
BELOW 25 5 2025-35 9 5535-45 5 20ABOVE 45 1 5TOTAL 20 100
51
Among the respondents (55%) are between the age of 25-35yrs
and (20%) are below 25yrs and another (20%) from the age of
35-45yrs.
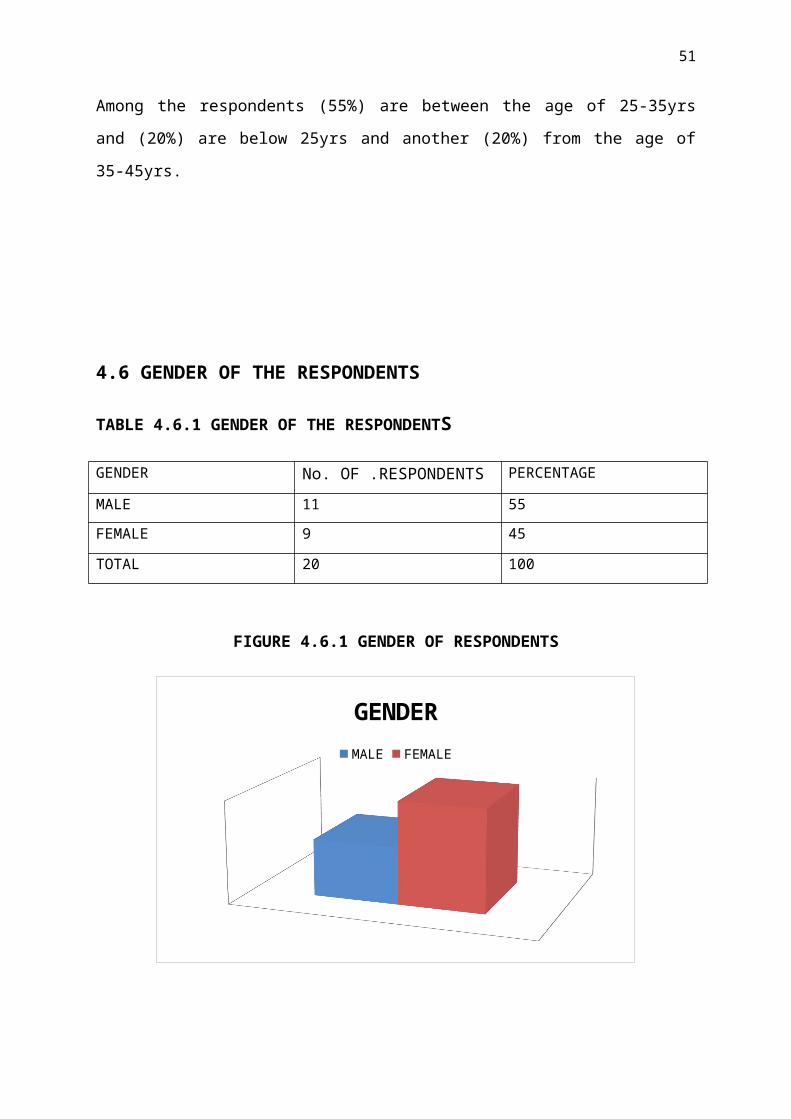
4.6 GENDER OF THE RESPONDENTS
TABLE 4.6.1 GENDER OF THE RESPONDENTS
GENDER No. OF .RESPONDENTS PERCENTAGE
MALE 11 55FEMALE 9 45
TOTAL 20 100
FIGURE 4.6.1 GENDER OF RESPONDENTS
GENDERMALE FEMALE

52
Among the respondents (55%) are male and remaining (45%) are
female employees.
4.7 EDUCATIONAL QUALIFICATION OF THE RESPONDENTS
TABLE 4.7.1 EDUCATIONAL QUALIFICATION OF THE
RESPONDENTS
EDUCATIONAL QUALIFICATION No.
OF .RESPONDENTS
PERCENTAGE
HIGHER SECONDARY 4 20UG 9 50PG 7 30OTHERS - -TOTAL 20 100
Among the respondents (50%) are under graduates and (30%) are
post graduates and remaining (20%) are higher secondary.
4.8 FREQUENCY OF RECEIVING MATERIAL
TABLE 4.8.1 FREQUENCY OF RECEIVING MATERIAL

53
FREQUENCY No.OF RESPONDENTS PERCENTAGEONCE IN 3 Hrs 3 15ONCE IN A DAY 10 55ONCE IN 3 DAYS 5 20ONCE IN A WEEK 2 10TOTAL 20 100
Among the respondents (55%) gets material once in a day and
(20%) gets once in 3 days.
4.9 NUMBER OF INVENTORY
TABLE 4.9.1 NUMBER OF ITEMS IN THE MODULE
NO OF ITEMS No.OF .RESPONDENTS PERCENTAGE
10-20 Nos 2 1020-30 Nos 6 3030-40 Nos 10 5040-50 Nos 2 10TOTAL 20 100
Among the modules (50%) of modules consists of 30-40
inventory items and (30%) with 20-30 inventory items.

54
4.10 TYPE OF COMPONENT PRODUCED
TABLE 4.10.1 TYPE OF COMPONENT PRODUCED
COMPONENT TYPE No.OF .RESPONDENTS PERCENTAGE2 WHEELER METERS 2 104 WHEELER METER 7 35TRUCKS AND LORRY
METERS
4 20
OTHERS 7 35TOTAL 20 100
Among the modules (35%) are producing 4 wheeler meters and
(35%) other type of products.
4.11SYSTEMATIC OPERATING PROCESS FOR INVENTORY
MANAGEMENT SYSTEM
TABLE4.11.1 SYSTEMATIC OPERATING PROCESS FOR INVENTORY
MANAGEMENT SYSTEM
FACTOR No. OF RESPONDENTS PERCENTAGEYES 20 100NO - -

55
TOTAL 20 100
All the respondents feel that their module is operating with
the systematic operating process of inventory management
system.
4.12 COMMUNICATIONS TO THE RESPONSIBLE STAFFS
TABLE 4.12.1 COMMUNICATIONS TO THE RESPONSIBLE STAFFS
FACTOR No. OF RESPONDENTS PERCENTAGEYES 18 90NO 2 10TOTAL 20 100
Among the respondents (90%) expressed that they receive
communication from the management regarding their modules and
only (10%) expressed that they do not receive get proper
communication.
TABLE 4.13 VARIETIES OF INVENTORY IN MODULE
TABLE 4.13.1 VARIETIES OF INVENTORY INMODULE
FACTOR No. OF RESPONDENTS PERCENTAGEYES 14 70NO 6 30TOTAL 20 100
56
Among the respondents (70%) expressed that their module has
variety of inventory and only (30%) expressed that there is no
variety of inventory in their modules.
4.14 MANAGEMENT REVIEWS OF REPORTS
TABLE 4.14.1 REVIEWS OF REPORTS BY MANAGEMENT
FACTOR No. OF RESPONDENTS PERCENTAGEYES 20 100NO - -TOTAL 20 100
All the respondents expressed that the management review the
reports regularly about the inventory of each module.
4.15 LAYOUT OF STORAGE FACILITY
TABLE 4.15.1 LAYOUT OF STORAGE FACILITY
FACTOR No. OF RESPONDENTS PERCENTAGEYES 16 80NO 4 20TOATAL 20 100
Among the respondents (80%) expressed that there is proper
store layout in the modules and only (20%) expressed that
there is no proper layout.
4.16 AREAS FOR RECEIVING AND DISTRIBUTING INVENTORY
TABLE 4.16.1 AREAS FOR RECEIVING AND DISTRIBUTING INVENTORY
57
FACTOR No. OF RESPONDENTS PERCENTAGEYES 12 60NO 8 40TOATAL 20 100
Among the respondents (60%) expressed that there is separate
area for receiving and distributing the inventory and other
(20%) expressed there in so such area for receiving and
distributing inventory.
4.17 TAGS INDICATING SHIPMENT
TABLE 4.17.1 TAGS INDICATING SHIPMENT
FACTOR No. OF RESPONDENTS PERCENTAGEYES 11 55NO 9 45TOATAL 20 100
Among the respondents (55%) expressed that tags are put up
properly indicating the shipment and (45%) expressed there is
no proper tags put up.
4.18 PROCESS AND DOCUMENTS INVOLVED IN DISTRIBUTION
OF GOODS
TABLE 4.18.1 PROCESS AND DOCUMENTS INVOLVED IN DISTRIBUTION OF
GOODS
FACTOR No. OF RESPONDENTS PERCENTAGEYES 10 50

58
NO 10 50TOATAL 20 100
Regarding the process and documents involved in distribution
of goods (50%) expressed that there is proper procedure and
remaining (50%) expressed that there is no such procedure.
4.19 CONTROL WITH REGARD TO INVOICE
TABLE 4.19.1 CONTROL WITH REGARD TO INVOICE
FACTOR No. OF RESPONDENTS PERCENTAGEYES 8 40NO 12 60TOATAL 20 100
FIGURE 4.19.1 CONTROL WITH REGARD TO INVOICE
5
9
CONTROL ON INVOICEYES NO

59
Among the respondents (55%) were given the control of invoice
preparation and remaining (45%) were not given such control
and that is been done centrally.
4.20 DOCUMENTED PROCEDURE FOR STOCK TAKING
TABLE 4.20.1DOCUMENTED PROCEDURE FOR STOCK TAKING
FACTOR No. OF RESPONDENTS PERCENTAGEYES 11 55NO 9 45TOATAL 20 100
Among the respondents (55%) expressed that there is proper
documented procedure for stock taking and (45%) says that
there is no such procedure in taking stock from the store.
4.21MANAGEMENT CONTROL ON FREQUENCY OF STOCK TAKING
TABLE 4.21.1 MANAGEMENT CONTROL ON FREQUENCY OF STOCK TAKING
FACTOR No. OF RESPONDENTS PERCENTAGEYES 10 50NO 10 50TOATAL 20 100

60
Among the (50%) feels that the frequency of taking stock is
been suggested by the management and other (50%) expressed
that it is not been controlled by the management.
4.22 POSSIBILITY OF ADJUSTMENT AFTER COUNTING PROCESS
TABLE .4.22.1 POSSIBILITY OF ADJUSTMENT AFTER COUNTING PROCESS
FACTOR No. OF RESPONDENTS PERCENTAGEYES - -NO 20 100TOATAL 20 100
FIGURE 4.22.1 ADJUSTMENT AFTER COUNTING PROCESS

61
5
9
ADJUSTMENT AFTER COUNTING PROCESS
YES NO
All the respondents (100%) express that there is no
possibility of adjusting the inventory once the initial
counting gets over.
4.23 INVENTORY LOCATION CUSTOMIZABLE
TABLE 4.23.1 INVENTORY LOCATION CUSTOMIZABLE
FACTOR No. OF RESPONDENTS PERCENTAGEYES 3 15NO 17 85TOATAL 20 100
62
FIGURE 4.23.1 LOCATION CUSTOMIZATION
15
85
LOCATION CUSTOMIZATIONYES NO
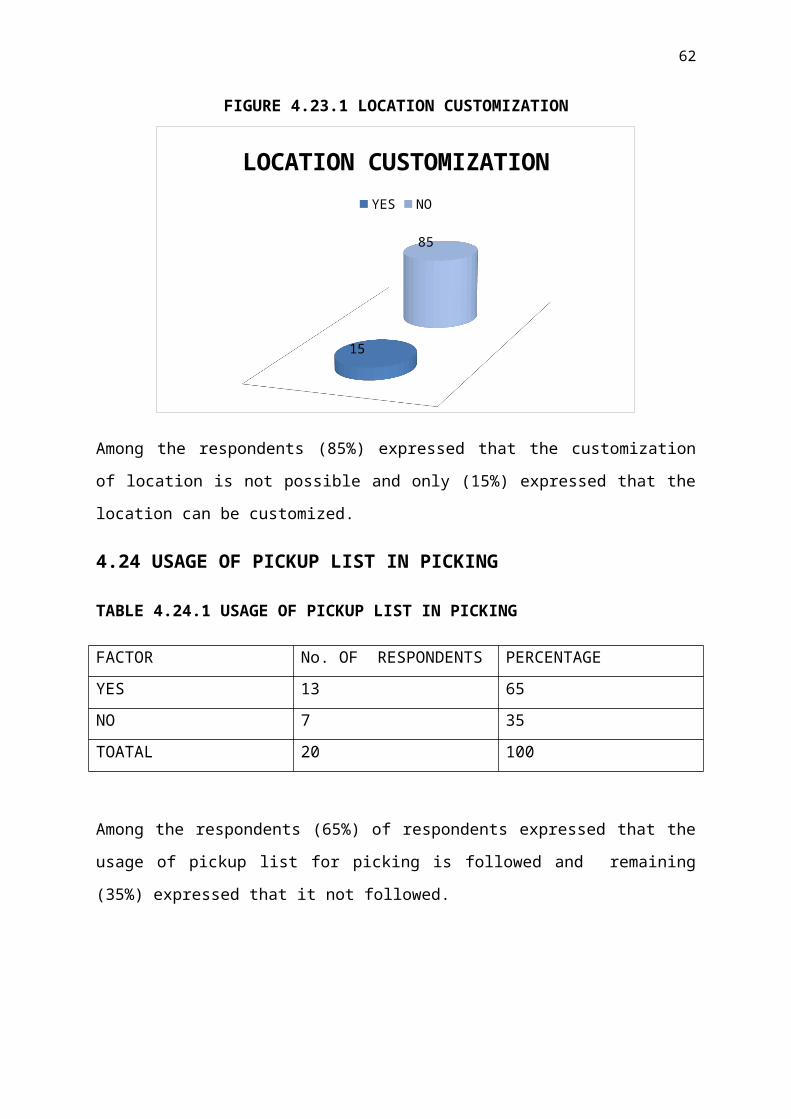
Among the respondents (85%) expressed that the customization
of location is not possible and only (15%) expressed that the
location can be customized.
4.24 USAGE OF PICKUP LIST IN PICKING
TABLE 4.24.1 USAGE OF PICKUP LIST IN PICKING
FACTOR No. OF RESPONDENTS PERCENTAGEYES 13 65NO 7 35TOATAL 20 100
Among the respondents (65%) of respondents expressed that the
usage of pickup list for picking is followed and remaining
(35%) expressed that it not followed.

63
4.25 PROVISION FOR OBSOLENCE AND INACTIVE ITEM
TABLE 4.25.1.PROVISION FOR OBSOLENCE AND INACTIVE ITEM
FACTOR No. OF RESPONDENTS PERCENTAGEYES 11 55NO 9 45TOATAL 20 100
Among the respondents (55%) expressed that there is provision
for obsolesce and inactive items and remaining (45%) expressed
that there is no such provision.
4.26 UPDATING OF PERPECTUAL INVENTORY
TABLE.4.26.1 UPDATING OF PERPECTUAL INVENTORY
FACTOR No. OF RESPONDENTS PERCENTAGEYES 17 85NO 3 15TOATAL 20 100
Among the respondents (85%) expressed that modules are
updating the perceptual inventory promptly and remaining
(15%) expressed that it is not promptly updated.

64
4.27 DISCREPANCIES BETWEEN PHYSISCAL AND ACTUAL
INVENTORY RECORDED
TABLE.4.27.1DISCREPANCIES BETWEEN PHYSISCAL AND ACTUAL
INVENTORY RECORDED
FACTOR No. OF RESPONDENTS PERCENTAGEYES 14 70NO 6 30TOATAL 20 100
Among the respondents (70%) expressed that the discrepancies
between perpetual and physical inventory are resolved properly
and remaining (30%) expressed that it is not been resolved.
4.28 INTERNAL CONTROL OF MANAGEMENT IN INVENTORY
TABLE.4.28.1INTERNAL CONTROL OF MANAGEMENT IN INVENTORY
FACTOR No. OF RESPONDENTS PERCENTAGEYES 14 70

65
NO 6 30TOATAL 20 100
Among the respondents (70%) expressed that the of modules
that there is internal control of management in inventory
control and remaining (30%) expressed that there is no such
internal control.
4.29 TRAINING FOR INVENTORY MANAGEMENT PERSONNAL
4.29.1 TRAINING FOR INVENTORY MANAGEMENT PERSONNAL
FACTOR No. OF RESPONDENTS PERCENTAGEYES 15 75NO 5 25TOATAL 20 100
Among the respondents (75%) expressed that there is proper
training given to employees who are dealing with inventory
and another (25%) expressed that proper training is not
given.
4.30 INVENTORY TURNOVER RATIO
66
The inventory turnover ratio is a common measure of the firm’s
operational efficiency in the management of its assets. As
noted earlier, minimizing inventory holdings reduces overhead
costs and, hence, improves the profitability performance of
the enterprise. Ideally the inventory turnover ratio would be
calculated as units sold divided by units on hand.
FORMULA 4.30 1
Inventory turnover ratio = Net sales
Average Inventory
TABLE 4.30.1 INVENTORY TURNOVER RATIO
Year 2010 2011 2012Net sales 964.94 842.93 779.37Inventory 133.79 132.55 125.02Ratio 6.23 6.35 7.2
FIGURE 4.30.1 INVENTORY TURNOVER RATIO

67
6.23 6.35
7.2
INVENTORY TURNOVER RATIOratio
The inventory is increasing every year from (6.23%)
2010 to (7.2%) 2012 which is reducing inventory stocked idle
before production.
68
CHAPTER -5
CONCLUSION
This chapter deals with the discussions on the
findings and the suggested recommendations based on the
findings.
5.1 RESULT AND DISCUSSIONS
The chart shows the percentage of inventory on working
capital. It keeps increasing year after year i.e. from
2010 (80%) to 2012 (96.56%).
The increasing trend shows the production for the coming
months is been predicted high from 408 units in may 2013
to 439 units in july 2013.
Among the respondents (55%) are between the age of 25-
35yrs and (20%) are below 25yrs and another (20%) from
the age of 35-45yrs.
Among the respondents (55%) are male and remaining (45%)
are female employees.
Among the respondents (50%) are under graduates and (30%)
are post graduates and remaining (20%) are higher
secondary.
Among the respondents (55%) gets material once in a day
and (20%) gets once in 3 days.
Among the modules (50%) of modules consists of 30-40
inventory items and (30%) with 20-30 inventory items.

69
Among the modules (35%) are producing 4 wheeler meters
and (35%) other type of products.
All the respondents feel that their module is operating
with the systematic operating process of inventory
management system.
Among the respondents (90%) expressed that they receive
communication from the management regarding their modules
and only (10%) expressed that they do not receive get
proper communication.
Among the respondents (70%) expressed that their module
has variety of inventory and only (30%) expressed that
there is no variety of inventory in their modules.
All the respondents expressed that the management review
the reports regularly about the inventory of each module.
Among the respondents (80%) expressed that there is
proper store layout in the modules and only (20%)
expressed that there is no proper layout.
Among the respondents (60%) expressed that there is
separate area for receiving and distributing the
inventory and other (20%) expressed there in so such area
for receiving and distributing inventory.
Among the respondents (55%) expressed that tags are put
up properly indicating the shipment and (45%) expressed
there is no proper tags put up.
Regarding the process and documents involved in
distribution of goods (50%) expressed that there is
proper procedure and remaining (50%) expressed that there
is no such procedure.

70
Among the respondents (55%) were given the control of
invoice preparation and remaining (45%) were not given
such control and that is been done centrally.
Among the respondents (55%) expressed that there is
proper documented procedure for stock taking and (45%)
says that there is no such procedure in taking stock from
the store.
Among the (50%) feels that the frequency of taking stock
is been suggested by the management and other (50%)
expressed that it is not been controlled by the
management.
All the respondents (100%) express that there is no
possibility of adjusting the inventory once the initial
counting gets over.
Among the respondents (85%) expressed that the
customization of location is not possible and only (15%)
expressed that the location can be customized.
Among the respondents (65%) of respondents expressed that
the usage of pickup list for picking is followed and
remaining (35%) expressed that it not followed.
Among the respondents (55%) expressed that there is
provision for obsolesce and inactive items and remaining
(45%) expressed that there is no such provision.
Among the respondents (85%) expressed that modules are
updating the perceptual inventory promptly and
remaining (15%) expressed that it is not promptly
updated.

71
Among the respondents (70%) expressed that the
discrepancies between perpetual and physical inventory
are resolved properly and remaining (30%) expressed that
it is not been resolved.
Among the respondents (70%) expressed that the of modules
that there is internal control of management in inventory
control and remaining (30%) expressed that there is no
such internal control.
Among the respondents (75%) expressed that there is
proper training given to employees who are dealing with
inventory and another (25%) expressed that proper
training is not given.
The inventory is increasing every year from (6.23%) 2010
to (7.2%) 2012 which is reducing inventory stocked idle
before production.
5.2 RECCOMENDATION
Since many of the respondents feels that there is no
customization of inventory location the researcher
suggests that the inventory location can be made
customized for the effective usage by the store keepers.
There is no possibility of making adjustment in the
system after counting gets over. Thus the systematic
method of modifying the inventory when the store -keeper
found its been left out while counting can be brought.
There is no proper documentation in distribution of goods
to the modules from the inventory. Thus the process of

72
documentation procedure should be brought in all the
modules.
Copyright © 2022 FDOKUMEN