Chapter1. Review literature Presentation of cattle production in Rwanda General Livestock production...
38
Chapter1. Review literature 1.1. Presentation of cattle production in Rwanda General Livestock production in Rwanda Livestock production systems are predominantly traditional, although a small number of modern livestock enterprises exist. The breeding contribution to the national economy is still weak in spite of efforts undertaken for the reconstitution of the livestock decimated by the war and the genocide of 1994. The main species raised include cattle (1 466 573 heads, of which 7% improved), goats (961 812 heads), sheep (380 557 heads), pigs (214 701 heads), poultry (2 519 568 units) and rabbit (506 927 units). Livestock has been on the increase for the last few years and cattle have virtuary passed 1990 levels (813415 head of cattle) with an increase of 244% from 2001 to 2004. In the other hand, livestock contributes marginally to the GDP (3.7%). Sub-sector exports (unprocessed skins) accounts for 2-4% of the country's total exports. Rwanda's annual consumption stands at 12 liters of milk and 4.8 kg of meat per capita, compared to 220 liters and 10 kg per capita per annum recommended by the FAO. The major constraints in animal production and development consist of food, medical, genetic, valorization and of exploitation. This sector faces several constraints, notably inadequate feeding both in terms of quantity and quality due to the limited and poor pasturage, lack of watering resources in 1
-
Upload
independent -
Category
Documents
-
view
4 -
download
0
Transcript of Chapter1. Review literature Presentation of cattle production in Rwanda General Livestock production...

Chapter1. Review literature 1.1. Presentation of cattle production in Rwanda
General Livestock production in Rwanda
Livestock production systems are predominantly traditional,
although a small number of modern livestock enterprises exist.
The breeding contribution to the national economy is still weak
in spite of efforts undertaken for the reconstitution of the
livestock decimated by the war and the genocide of 1994.
The main species raised include cattle (1 466 573 heads, of which
7% improved), goats (961 812 heads), sheep (380 557 heads), pigs
(214 701 heads), poultry (2 519 568 units) and rabbit (506 927
units). Livestock has been on the increase for the last few years
and cattle have virtuary passed 1990 levels (813415 head of
cattle) with an increase of 244% from 2001 to 2004.
In the other hand, livestock contributes marginally to the GDP
(3.7%). Sub-sector exports (unprocessed skins) accounts for 2-4%
of the country's total exports. Rwanda's annual consumption
stands at 12 liters of milk and 4.8 kg of meat per capita,
compared to 220 liters and 10 kg per capita per annum recommended
by the FAO.
The major constraints in animal production and development
consist of food, medical, genetic, valorization and of
exploitation. This sector faces several constraints, notably
inadequate feeding both in terms of quantity and quality due to
the limited and poor pasturage, lack of watering resources in 1

some farming zones and limited use of agricultural by-products.
Moreover, epidemics which regularly strike the herd and poor
performance of the local breed limit livestock productivity.
Lacking human and material resources, the veterinary services are
unable to meet the demands of livestock farmers. Dr Baligira Robert,
(2008).Efficient Water Use for Agriculture Production Project, Rwanda
Table 3 Number of Cattle per province
Province Number of cattle
MVK 32,630
North 171,718
East 455,311
South 333,316
West 167,366
TOTAL 1,160.090
Source: MINAGRI, 2008
1.1.1. Rwanda’s cattle population and the number of families
2

The cattle population in Rwanda is over one million headcomprising 86% local,13% cross and 1% exotic breeds.
Number of in-calf exotic heifers imported into the country.
Year 1997 1998 1999 2000 2001 2002 2004 2005NUMBER 70 70 360 85 450 381 243 985
Source: MINAGRI and RARDA Reports 2005
1.1.2. Livestock and food security
Food security exists when all people, at all times, have physical and economic
access to sufficient, safe and nutritious food for a healthy and active life (World
Food Summit Plan of Action Part 1, 1996). Food security embraces food
production, stability of supply and access to food. The three
most important dimensions of food security are; ensuring a safe
and nutritionally adequate food supply at the household and
national level, a reasonable degree of stability in the supply of
food from year to year and ensuring that each household has
physical, social and economic access to enough food to meet its
needs. Livestock play an important role in all the three
dimensions of food security. They make a contribution to food
production through the provision of high value protein rich
animal products. They indirectly support crop production through
draught power and provision of manure.
They stabilize food supply as they supply food all the year round
in addition to being the most significant source of income and
3

store of wealth for small holders thereby providing access to
food all the time.
The presence of domestic animals and availability of animal
products therefore contributes to food security to the
population. This is crucial for Rwanda because the country
usually experiences food insecurity periods.
Breeds of cattle kept in Rwanda
Identification of the types and breeds of cattle kept by farmers is a key element in attaining the objectives of this assignment. The type of breed kept has a direct relationship to the livestockproduction system described below.
Available data show that smallholder milk producers’ mainly keeping traditional and crossbred cattle (Plate 2 and 3) collectively own 99% of the cattle in Rwanda.
The rest comprise exotic breeds of cattle mostly Friesians, a fewJerseys and Browns Swiss (Plates 4, 5 and 6 respectively).
There is also an allay of non-descript crosses between the exoticbreeds themselves and with the local Ankole and scrub breeds, allkept on commercial dairy farms in and around Kigali City, Kicukiro, Gasabo, Ngoma, Rubavu, Gakenke and Gicumbi districts. Most traditional cattle (Ankole) are found in Nyagatare district while Ruhango district has the highest concentration of crossbredcattle. (MINAGRI and RARDA Reports 2005)
There is an increasing demand for all the dairy breeds shown above and this demand will be there for a number of years to come. The one cow per family program needs heifers in thousands and the supply is limited. Investment in Artificial Insemination and other related services will have positive returns. Companies
4

and individual investing in AI are likely to receive subsidy support due to high demand from government development partners.
1. Friesians
• The Holstein cow originated in Europe• The major historical development of this breed occurred in
what is now the Netherlands• Winthrop Chenery brought the first Holstein over so the
sailors could have milk He noticed her high production and started to bring over
more Holsteins are large, stylish animals with color patterns of
black and white or red and white Average production for all Holsteins enrolled in official
U.S. production-testing programs in 1987 was 17,408 pounds of milk, 632 pounds of butterfat and 550 pounds of protein per year
2. Ankole
5
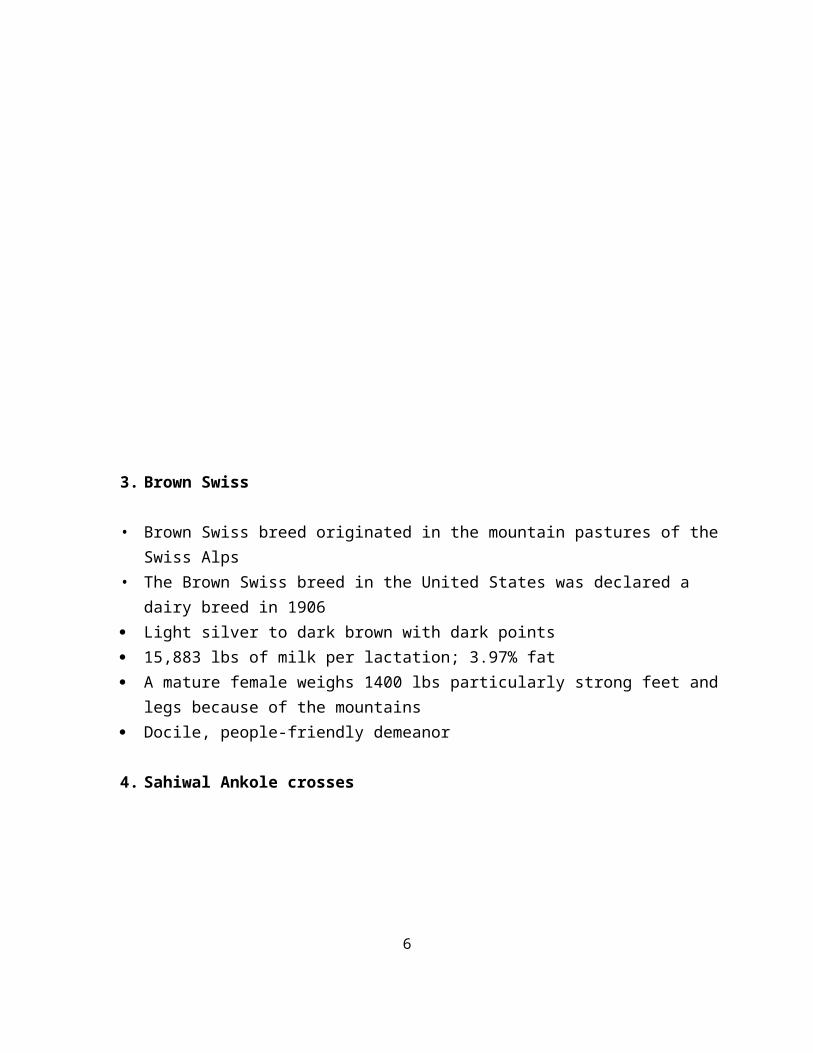
3. Brown Swiss
• Brown Swiss breed originated in the mountain pastures of theSwiss Alps
• The Brown Swiss breed in the United States was declared a dairy breed in 1906
Light silver to dark brown with dark points 15,883 lbs of milk per lactation; 3.97% fat A mature female weighs 1400 lbs particularly strong feet and
legs because of the mountains Docile, people-friendly demeanor
4. Sahiwal Ankole crosses
6

5. Jersey
• The Jersey breed originated on the Island of Jersey, a smallBritish island in the English Channel
• The island of Jersey was very protective of this breed. Because of this the breed stayed distinctive for many years
• Jerseys are adapted to a wide range of climatic and geographical conditions
• Jerseys vary greatly in color, but the characteristic color is golden fawn, with or without white markings
• Smallest of the dairy breeds• Long life (61.1 months vs 56.2 months) • Its nutritive content is 28.46% greater than ordinary milk
1.2. General introduction to milk production
The breed average on the large-scale farms were 6231 kg/lactation
for the Friesian/Holstein, 4397 kg/ lactation for the Jersey and
6000 kg/lactation for the Red Dane cows (Mostageer et al 1987).
7
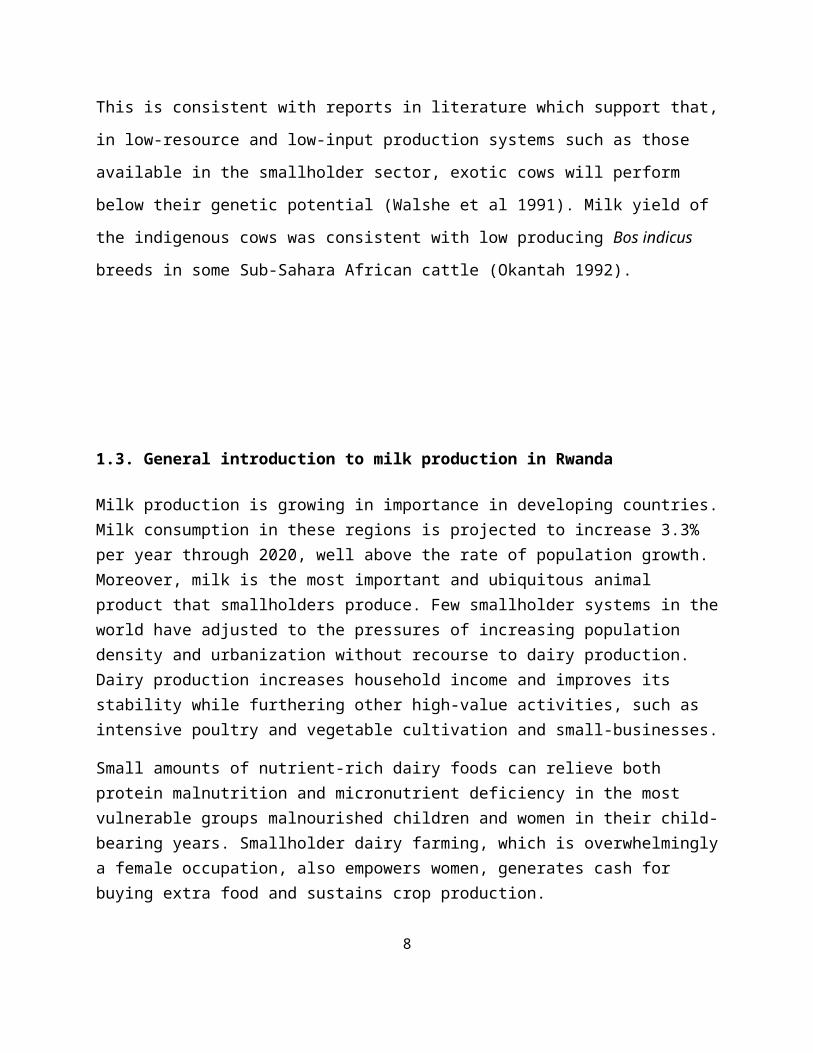
This is consistent with reports in literature which support that,
in low-resource and low-input production systems such as those
available in the smallholder sector, exotic cows will perform
below their genetic potential (Walshe et al 1991). Milk yield of
the indigenous cows was consistent with low producing Bos indicus
breeds in some Sub-Sahara African cattle (Okantah 1992).
1.3. General introduction to milk production in Rwanda
Milk production is growing in importance in developing countries.Milk consumption in these regions is projected to increase 3.3% per year through 2020, well above the rate of population growth. Moreover, milk is the most important and ubiquitous animal product that smallholders produce. Few smallholder systems in theworld have adjusted to the pressures of increasing population density and urbanization without recourse to dairy production. Dairy production increases household income and improves its stability while furthering other high-value activities, such as intensive poultry and vegetable cultivation and small-businesses.
Small amounts of nutrient-rich dairy foods can relieve both protein malnutrition and micronutrient deficiency in the most vulnerable groups malnourished children and women in their child-bearing years. Smallholder dairy farming, which is overwhelminglya female occupation, also empowers women, generates cash for buying extra food and sustains crop production.
8

The coincidence of these factors presents an opportunity in smallholder dairy that can be seized upon to lay the foundation for equitable broad-based growth in developing areas.
Since the smallholder farmers have labour and access to land regardless of size, they are the most likely source of future increases in milk supplies in Rwanda if deliberate efforts are made to help them acquire one to two quality cattle managed underthe zero grazing system.
The dairy industry in Rwanda is however, highly constrained by tremendous pressures created by both the availability of land percapita and the ingrained cultural habit of Rwandans to maintain large numbers of cattle. There are also the endemic problems of lack of availability of production inputs like feeds and lack of good quality cattle.
1.3.1. Milk availability in Rwanda
Rwanda has a human population of over 8.7 million people but only
produces
133,000 tons of milk. In real terms the consumption levels of
milk are 13 liters per person per year which translates to 1
liter of milk per person per month or one glass of milk per
person per week compared to 52 liters per person per year
recommended by FAO. The major challenge for Rwanda is to ensure
availability of protein sources where 10% of the requirements
must be of animal origin as these cannot be substituted.
Fat deficits are also of major importance and because of these
shortages; the country has to rely on milk imports which drains
9

foreign exchange reserves. The imported milk and milk products
into the country between 1990 and 2003 are given below.
Milk products (tons) imported into the country between 1990 and
2004
YEAR UHTMILK POWDERMILK MILKPRODUCTS LIQUIDMILK
TOTAL
1990 1150 10 11601991 2910 20 29301992 760 50 8101993 2910 20 29301994 890 10 9001995 2910 20 29301996 1360 60 800 22201997 2910 20 29301998 1600 8 19 16271999 2910 20 29302000 1200 18 62 12802001 703 651 20 13782002 1112 544 22 16782003 563 128 9 720
Source: BNR 200510

1.4. Socio-economic of smallholder dairy farming in Rwanda
1.4.1. Socio-economic context
Rwanda is a small landlocked country with a population of about
9.3 million people Annual (Economic Report, Published by
MINECOFIN, March 2006). With a per capita income of approximately
$292 and Rwanda is among the least developed countries. 56.9% of
households live below the poverty line.
The population density of about 350 per km2 is among the ten
highest in the world and agriculture is the primary activity for
the 90% of the population living in rural areas.
Over the last 12 years, Rwanda has made remarkable progress from
a destructive genocide to peace, reconstruction and development.
Key elements of macroeconomic stabilization have been achieved
with most sectors of the economy having recovered. Growth rates
during this recovery period have been much above Rwanda's
historical growth rates.
It has experienced rapid economic growth due mainly to large aid
inflows, coupled with a recovery in agriculture yields and large
investment in construction, tourism, banking and
telecommunication.
Between 1995 and 2004, the average growth rate was about 8%.
Annual average inflation came down from 64% in 1994 to less than
4% during 1999-2002. This growth slowed during 2003 due to mainly
11

a slowdown in agricultural growth caused by the drought. This
limited GDP growth to only 0.9% in 2003 and about 4% in 2004, but
growth rebounded to 6.5% in 2005.
Current estimates indicate that Rwanda’s GDP grew by almost 7%.
This represents a substantial increase over the 2004 figure of 4%
- and over the 0.9% rate of growth seen in 2003.
Considering a range of indicators, growth in the services sector
is estimated to have been around 6% (Annual economic report,
MINECOFIN March 2006). Services account for 38% of GDP,
consisting of wholesale and retail trade, transport, finance,
insurance, and other core services (public administration,
telecommunications and utilities). Industry accounts for 18% of
GDP, with roughly half of its share attributed to manufacturing
and the other half to construction. The majority of manufacturing
firms are small.
The larger establishments are primarily engaged in production
and/or processing of beer, soft drinks, tobacco, cement,
textiles, tea and coffee. Thus, the economy is heavily dependent
on the primary sector, with industry strongly tied to processing
of primary products, whose inputs come from the agriculture
sector.
Employment is heavily concentrated in Agriculture. Close to 86%
of the working age population works in this sector. Public
administration and social services employ another 10% of the
population, with commerce, hotels and restaurants representing
12

around 3%. Manufacturing, in contrast, employs less than 1% of
the working-age population.
The government, as part of its long-term strategy, has set the
targets of reaching the status of a middle income country by
envisaging income gains to $900 per person by 2020, based on a
rapid transition from subsistence farming to higher value added
agriculture and non-farm activities. This ambitious agenda will
rely heavily on private sector development and the transformation
of Rwanda from a mainly agricultural society to a knowledge based
economy where majority of employment is in industrial or service
sectors. This will also include addressing constraints on trade
competitiveness.
1.4.2. Poverty in the rural areas
The poverty profile of the population shows that 67% of poor
people are in the rural areas. On the other hand, poverty and
living standards depend on land and livestock holdings. In
Rwanda, the combination of cattle and land holdings has led to
six categories of poverty indicators.
1. Destitutes with no land, do not keep animals and must beg
for food
(Umutindi nyakujya)
2. Very poor, may have little land but can work but do not keep
animals (Umutindi)
3. Poor, has land to produce food but no savings (Umukene)13

4. Poor, has a bit more land keeps some animals, besides
subsistence has more income to satisfy other needs (Umukene
wifashije)
5. Rich in terms of food security has land, keeps animals and
may access paid employment (Umukungu)
6. Rich, has land, animals paid employment to maintain a good
living standard (Umukire)
What is very clear from the classification is that lack of
livestock is associated with a higher level of the poverty
profile and an individual who owns livestock moves a step upwards
away from poverty.
The entry point of this initiative will therefore be to assist
the people who own land and can have enough feed for their
animals so that they move away from the poverty line. In Rwanda,
agriculture will be the major household income earner but
livestock will be an integral part of the bio-physical and
economic importance of cropping providing inputs in terms of
manure and consuming outputs mainly milk.
1.4.3. Land size for agriculture in Rwanda
The republic of Rwanda covers a total surface of 26,338 km2 and
with a human population of 8,776,324 Rwanda is one of the densely
populated countries in Africa with about 300 inhabitants per km2.
Annex 1 show the distribution of land among families in Rwanda as
was recorded by a census done by MINECOFIN 2002 and MINAGRI 2005.
According to this information, the number of families can be
divided into the following broad categories.14

Number of families according to the Land size for agriculture inRwanda
Land size
(Hectares)
Number of
families
Proportion of
total (%)Less than 0.25 264,835 15Between 0.25 and
0.50
4630,235 25
Between 0.50 and
0.75
282,059 16
Between 0.75 and
1.00
204,446 12
Between 1.00 and
2.00
320,619 18
Between 2.00 and
3.00
78,555 4
Above 3.00 47,462 3
1.5. General Dairy production systems
Ruminant livestock are a major component of agricultural systems
in tropical countries. In smallholder systems, which dominate
tropical agriculture, ruminants are important because they
produce much more than food: they provide direct cash income;
they are capital assets; they produce manure for use as
fertilizer and fuel; and they may be a source of power for
transport and cultivation. Nevertheless one function, the
15

production of milk for human food, is often the primary reason
for keeping livestock, whether by pastoralists to meet their
subsistence needs in arid and semi-arid regions, or by peri-urban
smallholder farmers as a source of income from milk sales.
Dairy production is a biologically efficient system that converts
large quantities of roughage, the most abundant feed in the
tropics, to milk, the most nutritious food known to man. As
(Walshe et al, 1991) pointed out, where there is access to a
market, dairying is preferred to meat production since it makes
more efficient use of feed resources and provides a regular
income to the producer.
In general, therefore, dairy production systems in the tropics
are concentrated near consumption centres.
It is no coincidence that cattle and rural human population
densities are highly correlated (Kruska et al, 1997), with
specialized smallholder (and large scale) dairy farms generally
located close to (peri-urban) or within (intra-urban) major
markets, or more distant when there is an efficient market
infrastructure. On the other hand, the systems of production and
their productivity are influenced by agro-ecological factors and
traditional consumption habits16
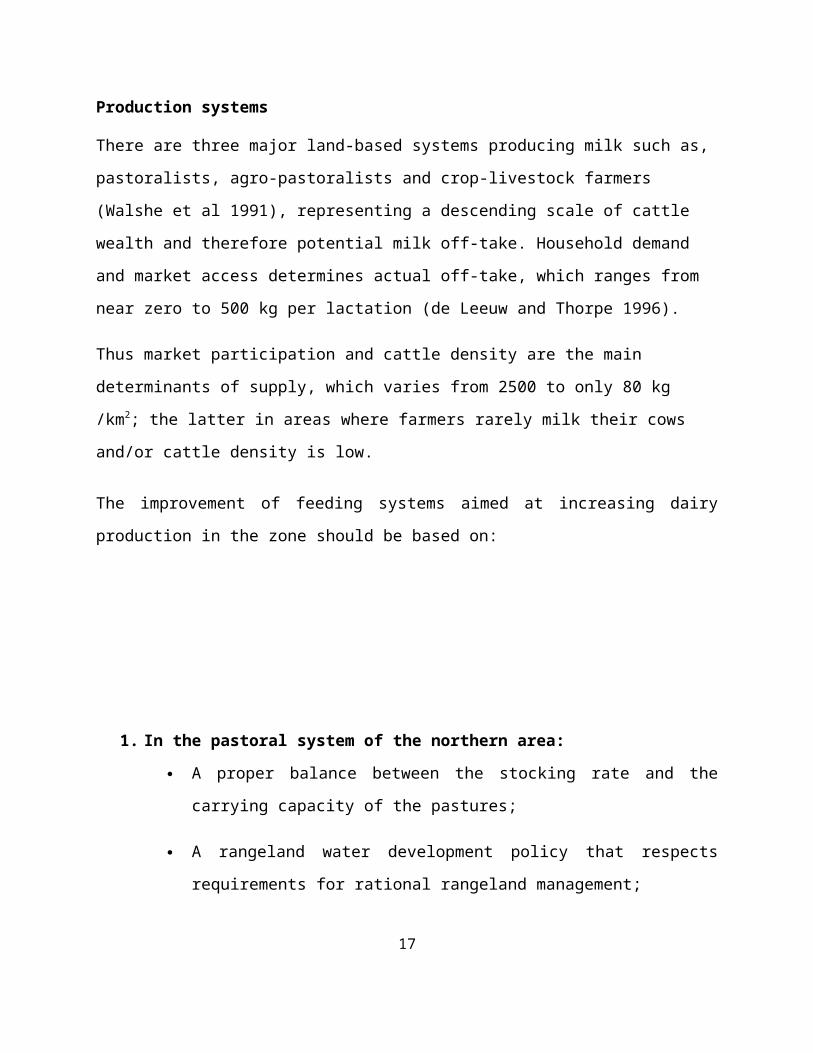
Production systems
There are three major land-based systems producing milk such as,
pastoralists, agro-pastoralists and crop-livestock farmers
(Walshe et al 1991), representing a descending scale of cattle
wealth and therefore potential milk off-take. Household demand
and market access determines actual off-take, which ranges from
near zero to 500 kg per lactation (de Leeuw and Thorpe 1996).
Thus market participation and cattle density are the main
determinants of supply, which varies from 2500 to only 80 kg
/km2; the latter in areas where farmers rarely milk their cows
and/or cattle density is low.
The improvement of feeding systems aimed at increasing dairy
production in the zone should be based on:
1. In the pastoral system of the northern area:
A proper balance between the stocking rate and the
carrying capacity of the pastures;
A rangeland water development policy that respects
requirements for rational rangeland management;
17

Improving impoverished rangelands by restoring
vegetation where it has died out and by enriching cover
with, for instance, legume crops;
Controlling major epidemic diseases to overcome the
herders' obsession with disaster and pave the way for
new attitudes in favour of smaller, more productive
The productivity of livestock in the pastoral system is low ,
varying from one region to the other and between years. Camels
and small ruminants are 1.5–2 times more productive than the
cattle; but, on average, the annual productivity of the area
varies from 26.2–31.4 kg/ha for milk and 2.6–3.1 kg/ha for meat
(Jahnke, 1984).
2. In agro pastoral systems and peri-urban dairying:
The preparation of pastoral codes that describe grazing
rights in order to curtail agricultural encroachment
and allow for better resource management;
Closer integration of agriculture and livestock
production through the introduction of fodder crops,
such as cowpea, or the application of more fertilizer
(including manure) to increase crop yields and,
consequently, crop residues that can be fed to animals;
Better use of locally available agro-industrial by-
products (bran, polishings, molasses as urea-molasses
18

blocks, etc.) Through the preparation of supplements
formulated to meet the needs of the animals and adapted
to rangeland conditions;
Gradual intensification in peri-urban livestock
development projects to meet market needs. More
importance should be given to experiments and the
development of fodder crops as such, wherever
conditions allow. (Jahnke, H.E. 1984).
Any improvement aimed at increasing dairy production should
consider the sociological aspect, which is closely related to
livestock in this region. Some solutions have been proposed here
to increase the milk production in the different production
systems.
Crossbreeding in dairy cattle
Benefits of crossbreeding have been known within many of the
commercial livestock productions for many years (Hansen, 2006;
Sorensen et al., 2008). In contrast, dairy production systems in
most developed countries have almost exclusively consisted of
pure breeding with a single breed, Holstein (Hansen, 2006). This
domination was caused by its high production and good
conformation traits (McA llister, 2002; Hansen, 2006).
Today the interest in crossbreeding increases (Heins, 2007;
Cassell & McAllister, 2009) due to changes in the dairy market
towards broader breeding goals including functional traits and
19

milk components, along with an increased level of inbreeding
among purebred Holstein (Hansen, 2006). Other aspects such as
increased consumer’s demands and higher awareness of welfare and
sustainability may also effect the dairy production (Hallén
Sandgren & Lindberg, 2007Sørensen et al., 2008).
The reason for crossbreeding is to increase the dairy cattle
productions through new combinations of genes in different
breeds, and one of the main benefits are caused by heterosis, or
hybrid vigour (Simm 2000). Some dairy producers are trying to
improve functional traits and production traits through
crossbreeding between Holstein, with high milk production, and
breeds with good fertility and health such as Scandinavian Red,
Normande or Montbeliarde, and thereby increase the profitability
of the dairy production (Hansen, 2006). Several crossbreeding
studies have been made and are under evaluation in several
different countries (Heins, 2007; Cassell & McAllister, 2009) but
this short literature review will only include breeds and crosses
used in commercial milk production in industrial countries.
Breeding for dairy through crossbreeding
Development of any genetic Improvement strategy requires
description of production environment, identifying the
availability of infrastructure, setting appropriate breeding
objective, selecting traits to be improved based on their
influence on returns and costs to the producer and consideration
of stockholders (Zewdu, 2004).
20

Crossbreeding
Crossbreeding is used for several different reasons. One is to
increase the overall efficiency of a production system through
crossing breeds which have their genetic merits in different
traits. Another is to produce individual dairy cattle with
intermediate performance between that of two more extreme parent
breeds (Simm, 2000).
This seems similar to the first reason but instead of matching
different breeds with different roles in the breeding system it
creates new individuals with intermediate performance.
Crossbreeding can also be used for upgrading to a new breed or be
used as an intermediate step when creating a new synthetic breed.
It can be used to introduce new variation to numerically small
breeds, or to introduce a favorable characteristic of a single
gene to an existing breed. Finally, one of the most important
reasons is to obtain benefits of heterosis (Simm, 2000).
Heterosis
Heterosis is an essential factor in crossbreeding strategies
(Simm, 2000). It is defined as the improvement in genetic level
and the advantage expressed for traits in a hybrid offspring
above the average of the parent breeds. Heterosis is a result of
the non-additive gene effect, dominance and epitasis along with
differences in the frequencies of the different alleles at each
locus. The total genetic makeup of crossbreds can include
additive effects, dominance, maternal effects, maternal heterosis
21

and recombination effects. Which effect that may be present is
dependent of the particular kinds of crosses involved
(McAllister, 2002).
The expected level of heterosis is difficult to predict and it
differs depending on the type and number of breeds in the
crossbreeding system (Sørensen et al., 2008). Usually it is
larger for crosses between genetically diverse breeds, because
the more distantly related the two breeds are, the greater the
proportion of loci at which different alleles are fixed in the
two parent breeds and hence the higher number of heterozygote
loci in the offspring (Simm, 2000).
The highest level of heterosis is most commonly seen in
functional traits affecting reproduction, survival and overall
fitness (Simm, 2000; Hansen, 2006). These traits often show at
least 10% heterosis and low heritability (Hansen, 2006).
Production traits affecting milk yield and growth show about 5%
heterosis (Hansen, 2006; Heins, 2007; Heins et al., 2007) and a
moderately high heritability (Hansen, 2006)
Table 1. Heterosis by generation for crossbreeding systems using2, 3 and 4 unrelated breeds
Generat
ion
2
breeds
3
breeds
4 breeds
1 100 100 1002 50 100 1003 75 75 100
22

4 63 88 885 69 88 946 66 84 947 67 86 948 67 86 939 67 86 93(Heins et al., 2007)
Inbreeding
Through continuous use of highly effective selection and breeding
programs without almost no concern of the risk of inbreeding, the
genetic relationship within breeds has accumulated (Hansen,
2006). Inbreeding refers to mating of individuals with one or
several ancestors in common (Falconer & Mackay, 1996; Simm, 2000)
and the closer relationship, the larger the quantity of identical
genes and the higher the risk of inbreeding.
Inbreeding can lead to a decline in performance of dairy cattle
and it is known as inbreeding depression (Simm, 2000; Adamec et
al., 2006). It is the opposite of heterosis (Falconer & Mackay,
1996; Simm, 2000) and is caused by a too high rate of
homozygosity in loci (Falconer & Mackay, 1996) with genes which
have a negative effect on traits connected with survival and
overall fitness, e.g. reproductive rate, health and disease
resistance. Hence, it increases the risk of recessive lethal
diseases and defects, reduces the performance of the dairy cattle
23

and also reduces the adaptability to future production
environments (Simm, 2000).
With continuous use of genetic evaluation programs based on
animal models, the genetic relationship within most dairy cattle
breeds has increased. In particular, purebred Holstein has had a
relatively constant increase of inbreeding with only a few sires
dominating the pedigree of AI bulls. Purebred Jersey has also
become more inbreed over time and because of a genetic
improvement of those two breeds, they have largely replaced other
breeds of dairy cattle in several countries. In contrast,
European breeds such as Montbeliarde, Normande and the
Scandinavian Red breeds have had a greater restraint in
permitting accumulation of genetic relationships (Hansen, 2006).
1.6. Description of principal breeds of cattle kept in Rwanda
and breeding systems
24

1.7. Factors limiting cattle production in Rwanda
25

1.8. Feeding and nutrition for dairy cows
FEEDING THE DAIRY COW DURING LACTATION
There are main stages in the lactation cycle of the dairy cow:
1- Early lactation (14-100 days)
2- Mid lactation (100 to 200 days)
3- Late lactation (200-305 days)
26

1. Early lactation
Nutrient Requirements of Dairy Cows in Early-lactation
Early lactation usually refers to the first 100 days of
lactation. At the beginning of this phase, cows will achieve peak
milk production (during the second month of lactation for
Holstein cows), feed intake is lagging and cows are usually
losing weight. At the end of early lactation, peak dry matter
will be achieve and no weight losses occurring.
Rations for lactating dairy cows are usually formulated based on
protein (e.g. CP) and energy (e.g. net energy for lactation)
requirements. However, to achieve maximum production, dairy
rations should be balanced for effective fiber, non-structural
carbohydrates, ruminal undegraded protein, soluble protein. Dairy rations
are usually formulated to maximize microbial yield and for
requirements for ruminal undegraded amino acids.
Dairy cows should be divided into three groups according to stage
of lactation (i.e. level of production). This implies that three
different TMR should be fed to the herd (at least two TMR, one
for the high producing group and one for the low producing
group).
National Research Council, (1989-2001)
Body Weight Loss during Early Lactation
27

During this period milk yield increases more rapidly than dry
matter intake (peak production). The demand for energy is
therefore higher than the amount of energy consumed. Thus the cow
mobilizes body reserves and losses weight (negative energy
balance).
The genetic potential is usually expressed during this period and
the cow will be under pressure to produce a large amount of milk.
However, the cow at this stage has a limited capacity to ingest
the required amount of feed.
Thus it is normal for the cow to mobilize body fat during early
lactation. The ability of the dairy cow to mobilize body fats
contributed to its genetic potential (i.e. cows with higher
genetic potential will mobilize body fats for a longer period of
time than cows with a lower genetic potential). During this
period, the cow could lose as much as 0.7 kg/day.
Figure 1. Showing the phase of lactation cycle
28

Source: (National Research Council, 1989-2001)
Monitoring Dry Matter Intake during Early Lactation
Feed intake is the key factor in maintaining high milk
production. Cows should be encouraged to maximize their intake
during early lactation. Each additional kg of dry mater consumed
can support 2-2.4 kg more milk. Feed intake by the dairy cow is
influenced by many factors including level of production, forage
quantity and quality, feed digestibility, feed processing,
feeding frequency, consistency of ration ingredients etc.
Table 1. Guidelines for dry matter intake (kg) for lactating dairy cows
Time 1st lactation 2nd lactation
29
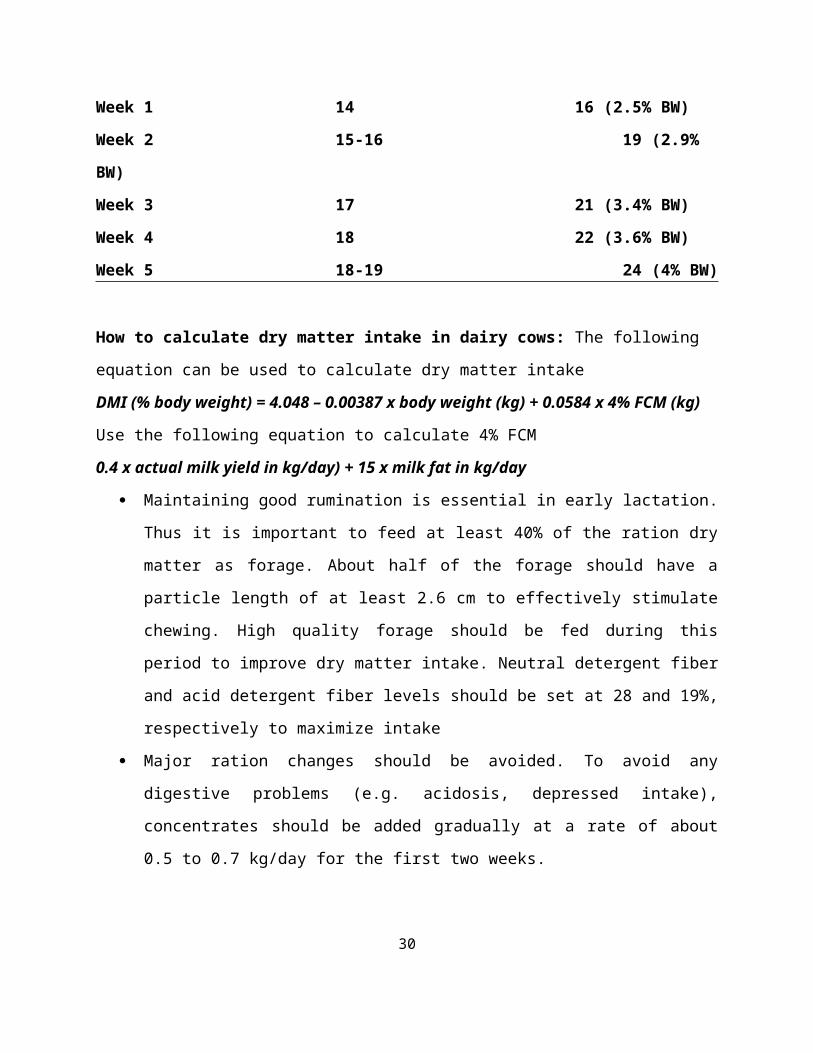
Week 1 14 16 (2.5% BW)
Week 2 15-16 19 (2.9%
BW)
Week 3 17 21 (3.4% BW)
Week 4 18 22 (3.6% BW)
Week 5 18-19 24 (4% BW)
How to calculate dry matter intake in dairy cows: The following
equation can be used to calculate dry matter intake
DMI (% body weight) = 4.048 – 0.00387 x body weight (kg) + 0.0584 x 4% FCM (kg)
Use the following equation to calculate 4% FCM
0.4 x actual milk yield in kg/day) + 15 x milk fat in kg/day
Maintaining good rumination is essential in early lactation.
Thus it is important to feed at least 40% of the ration dry
matter as forage. About half of the forage should have a
particle length of at least 2.6 cm to effectively stimulate
chewing. High quality forage should be fed during this
period to improve dry matter intake. Neutral detergent fiber
and acid detergent fiber levels should be set at 28 and 19%,
respectively to maximize intake
Major ration changes should be avoided. To avoid any
digestive problems (e.g. acidosis, depressed intake),
concentrates should be added gradually at a rate of about
0.5 to 0.7 kg/day for the first two weeks.
30

Protein is very critical during early lactation as the
amount of body protein that can be mobilized is very limited
compared with body fat. Thus in early lactation, a dietary protein
content of 17-19% is recommended. About 35-30% of dietary
protein should be ruminally undegraded protein while 30%
should be soluble protein. A guideline is to feed 0.5 kg of
a 34 to 50% protein concentrates for every 5 kg of milk
produced above 20 kg of milk.
2. Mid-lactation
Mid-lactation period is the period from day 100 to day 200 after
calving. By the beginning of this phase, cows will have achieved
peak production (8-10 weeks after calving). Peak dry matter
intake has also occurred with no more weight losses (see
figure1). Cows should reach maximum dry matter intake no later
than 10 weeks after calving.
At this point, cows should be eating at least 4% of their body
weight. The cow should be fed a ration that will maintain peak
production as long as possible. For every 2 kg of expected milk
production, large-breed cows should eat at least one kg of dry
matter.
The main target during this period is to maintain peak milk
productions as long as possible.
31

For each extra kg of milk at peak production, the average cow
will produce 200-225 kg more milk for the entire lactation.
Thus the key strategy during mid lactation is to maximize dry
matter intake. During this period the cow should be fed high
quality forage (minimum 40 to 45% of the ration dry matter) and
the level of effective fiber should be maintained at a level
similar to that of early lactation.
Concentrates should not exceed 2.3% of body weight and sources of
non-forage fibers such as beet pulp, distillers grains and cereal
bran can replace part of the starch in the ration to maintain a
healthy rumen environment.
Protein requirements during mid lactation are lower than in early
lactation. Therefore rations for dairy cows in mid-lactation
should contain 15-17% crude protein (Table 1).
During this period the cow should be bred to initiate a new
pregnancy (60-70 days after calving).
Source: (National Research Council, 1989-2001)
3. Late-lactation
This phase may begin 200 days after calving and end when the cow
dries off. During this period, milk yield continues to decline
and so does feed intake. However, the intake easily matches milk
yield. The cow also gains weight during this period to replenish
the adipose tissue lost during early lactation (see figure
above). However, as lactation approaches an end, more of the
increase in body weight is due to the increased size of the
growing fetus.32

Sources of protein and energy are not very critical during this
period. Cheap rations can be formulated with non-protein nitrogen
and a source of readily fermentable carbohydrates such as
molasses. Source: (National Research Council, 1989-2001)
Table 2 . Nutrient guidelines for lactating dairy cows.
Stage of lactation
Early Mid Late
Average milk yield (kg/d) 40 30 20
Dry matter intake (kg/d) 24-26 21-23 11-12
Crude protein (% DM) 17-19 15-16 13-15
Ruminal undegraded protein (% CP) 35-40 30-35 25Soluble protein (% CP) 25-33 25-36
25-40Neutral detergent fiber (% DM) 30-34 30-38 33-43Acid detergent fiber (% DM) 19-21 19-23 22-26Effective fiber (% NDF) 25 25 25Net energy for lactation (Mcal/kg) 1.64 1.57
1.5Non-fiber carbohydrates (% DM) 30-42 30-44 30-45Total digestible nutrients (% DM) 72-74 69-71 66-68Fat (maximum in DM) 5-6 4-6 3-5Calcium (% DM) 0.8-1.1 0.8-1.0 0.7-0.9
33

Phosphorous (% DM) 0.5-0.9 0.4-0.8 0.4-0.7Potassium (% DM) 0.9-1.4 0.9-1.3
0.9-1.3Sodium (% DM) 0.2-0.45 0.2-0.45 0.18-0.45Chlorine (% DM) 0.25-0.30 0.25-0.30
0.25-30Sulfur (% DM) 0.22-0.24 0.20-0.24 0.20-0.22Cobalt (mg/kg DM) 0.2-0.3 0.2-0.3
0.2-0.3Copper (mg/kg DM) 15-30 15-30
12-30Manganese (mg/kg DM) 60 60 50Zinc (mg/kg DM) 80 80 70Iodine (mg/kg DM) 0.8-1.4 0.6-1.4
0.6-1.2Iron (mg/kg DM) 100 75-100 50-100Selenium (mg/kg DM) 0.3 0.3 0.3Vitamin A (1000 IU/day) 100-200 100-200 100-200Vitamin D (1000 IU/day) 20-30 20-30
20-30Vitamin E (IU/day) 600-800 400-600 400-
600
Source: (National Research Council, 1989-2001)
1.9. Cattle management practices
34

35

References
1. Adamec, V., Cassell, B.G., Smith, E.P., Pearson, R.E. 2006.
Effects of inbreeding in the dams on dystocia and stillbirths in US Holsteins.
J. Dairy Sci. 89, 307-314
2. Ahlborn-Breier, G., Hohenboken, W.D.1991. Additive and no
additive genetic effects on milk production in dairy cattle: Evidence for
major individual heterosis. J. Dairy Sci. 74, 592-602
3. Cassell, B., McAllister, J. 2009. Dairy crossbreeding research:
Results from current projects. Virginia Cooperative
Extension. 404-094
4. http://www.creativegeneticsofca.com/procross.htm
5. Falconer, D.S., Mackay, T.F.C. 1996. Introduction to Quantitative
Genetics Fourth edition, 57-58, 253-254. Longman Group Ltd,
Edinburgh Gate, Harlow, Essex, England.
6. Hallén Sandgren, C., Lindberg, A. 2007. Financial return and
animal welfare-breed Effects.
7. Zewdu, W. (2004). Indigenous cattle genetic resources, theirhusbandry practices, and breeding objectives in northwesternEthiopia. M.Sc. thesis. Alemaya University, Alemaya,Ethiopia. p.143.
8. Hansen, L.B. 2006. Monitoring the worldwide genetic supply
for dairy cattle with emphasis on managing crossbreeding and
inbreeding. 8thWorld Congress on genetics applied to36

livestock production, August 13-18, Belo Horizonte, MG,
Brazil
9. Simm, G. 2000. Genetic Improvement of Cattle and Sheep, 64-65,
70, 74-79, 83-95, 134-135, 201, 244-247, 354355. Farming
press. CABI International, Wallingford, Oxon, UK.
10.Sørensen, M. K., Norberg, E., Pedersen, J., Christensen,
L.G. 2008. Invited review: Crossbreeding in dairy cattle: A Danish
perspective. J. Dairy Sci. 91, 4116-412
11.Kruska R.L., Reid R.S., Thornton P.K. and Perry B.D. 1997.
Spatial Data Characterization of Livestock Production
Systems in Africa. In: Proceedings of the Africa GIS 1997 Meeting,
Spatial Information Systems in Support of Sustainable Development in Africa,
Gaborone, Botswana, June
12.Walshe M.J., Grindle J., Nell A. and Bachmann M. 1991. Dairy
Development in Sub-Saharan Africa: A Study of Issues and Options. World
Bank Technical Paper 135. World Bank, Washington, DC, USA.
94 pp. 23-27, 1997.
13.De Leeuw P.N. and Thorpe W. 1996. Low input cattle
production systems in tropical Africa: An analysis of actual
and potential cow-calf productivity. In: All African Conference on
Animal Agriculture, Pretoria, South Africa, 1-4 April 1996. Conference
Handbook and Volume of Abstracts. South African Society of
Animal Science, Irene, South Africa. pp. 3.2.4
14.Jahnke, H.E. (1984). Systèmes de Production animale et
Développement de l'Elevage en Afrique tropicale. Kieler
Wissenschafts-verlag. Vauk.37

15.National Research Council, (1989-2001), Dairy Cattle Production,
Nutrient Requirements of Dairy Cows, Department of Animal
Science, Macdonald Campus of McGill University
38