
ACTIVITIES REPORT - National Bank of Rwanda
188
NATIONAL BANK OF RWANDA ACTIVITIES REPORT January - June 2012 OCTOBER 2012
-
Upload
khangminh22 -
Category
Documents
-
view
1 -
download
0
Transcript of ACTIVITIES REPORT - National Bank of Rwanda

NATIONAL BANK OF RWANDA
ACTIVITIES REPORT January - June 2012
OCTOBER 2012


NATIONAL BANK OF RWANDA

4
Activities report January - June 2012
BNR
TABLE OF CONTENTSFOREWORD 12EXECUTIVE SUMMARY 13INTRODUCTION 16CHAPTER I: BNR CORPORATE GOVERNANCE 17 I.1 Board Affairs 18 I.2. Management Committee (MC) 20 I.3. Monetary Policy Committee (MPC) 20 I.4. Monetary Policy Implementation Committee (MPIC) 21 I.5. Financial Stability Committee (FSC) 21 I.6. Audit and Risk Committee 21 I.7. Reserve Management Committee 22 I.8. IT Committee 22CHAPTER II: GLOBAL ECONOMIC DEVELOPMENTS 23 II.1 Economic growth and outlook 24 II.2 Inflation 25 II.3 World trade 25 II.4 Financial Markets 27 II.5 EAC member countries 28CHAPTER III: NATIONAL ECONOMIC PERFORMANCE 29 III.1 Economic growth 30 III.2 Prices 31 III.3 External sector 33 III.4 Public finance and domestic debt 45CHAPTER IV: MONETARY SECTOR DEVELOPMENTS 49 IV.1. Monetary and Exchange Rate Policy 50 IV.2. Money Supply and Demand 50 IV.3. Banking System Liquidity Conditions 51 IV.4. Interest Rate Developments 52 IV.5. Exchange Rate Developments 53 IV.6. Activities related to Reserves Management 54 IV.7 Communication strategy 54 IV.8. Research to Support Monetary Policy Management 55CHAPTER V: FINANCIAL SECTOR STABILITY 69 V.1. Banking Sector Performance 70 V.2. Microfinance Sector Performance 71 V.3. Non-Bank Financial Institutions Performance 61 V.4. Regulatory framework and supervision 63 V.5. Access to Finance 64 V.6. Credit Information system 66CHAPTER VI: MAINTAINING THE INTEGRITY AND SUPPLY OF CURRENCY 57 VI. 1 Currency management 58 VI. 2. Banking operations 59 VI. 3. BNR Branches operations 72

5
Activities report January - June 2012
BNR
CHAPTER VII: PAYMENT SYSTEMS MODERNISATION 73 VII.1. Rwanda Integrated Payments Processing System (RIPPS) 74 VII.2. Retail payments developments 75 VII.3. Payment infrastructure 76 VII.4. E-commerce 76 VII.5. Payment services providers 76 VII.6. Payment systems legal framework and new projects 77CHAPTER VIII: SUPPORT ACTIVITIES 79 VIII.1. ICT Systems Modernisation 80 VIII.2. Infrastructure Modernization 80 VIII.3. Human Resources Management and Development 81 VIII.4 Corporate Social Responsibility 81CHAPTER IX: FINANCIAL STATEMENTS 85 IX.1. Financial Statements Summary 86 IX.2. Report And Financial Statements 93CONCLUSION 145APPENDICES 147

6
Activities report January - June 2012
BNR
LIST OF TABLES
Table 1: World Economic Growth Developments 24Table 2: Annual Inflation Developments 25Table 3: World trade developments 26Table 4: Annual Inflation in EAC Countries 28Table 5: Real GDP Growth 31Table 6: Annual Headline Inflation 32Table 7: Overall and underlying price developments 33Table 8: Balance of Payments summary 33Table 9: Major Balance of Payment Components Developments 34Table 10: Export developments 34Table 11: Major exports Developments 35Table 12: Evolution of some non-traditional exports 36Table 13: Rwanda informal Cross border trade 37Table 14: Evolution of Imports CIF adjusted 39Table 15: Evolution of Services and Incomes 41Table 16: Net current transfers 41Table 17: Evolution of Capital and Financial Account 42Table 18: Stock of External public debt 43Table 19: Structure of External Public Debt by currency of borrowings 43Table 20: Development of disbursements 44Table 21: Development of External debt service 44Table 22: Government Financial Operations 45Table 23: Monetary Aggregates development 50Table 24: Change in deposits by institutional sectors 51Table 25: Interest Rates 52Table 26: Performance achievement 58Table 27: Key soundness indicators 59Table 28: MFIs Consolidated financial performance indicators, UMURENGE SACCO included 59Table 29: Consolidated financial performance indicators of MFIs UMURENGE SACCO excluded 60Table 30: Consolidated financial performance indicators of UMURENGE SACCOs 60Table 31: Financial Soundness indicators for the insurance sector 61Table 32: Financing of SMEs by Banks and MFIs 63Table 33: Distribution of loans by Gender 64Table 34: Number of accounts, deposits and loans classified by Gender in MFIs and SACCOs 64Table 35: Banking Sector financing to SMEs by province 65Table 36: Banknotes issued 70Table 37: Coins issued 70Table 38: Counterfeit FRW banknotes 70Table 39: Banking operations 71

7
Activities report January - June 2012
BNR
Table 40: Deposits and withdrawals for each branch 72Table 41: Transanctions settled through ATS 74Table 42: Transanctions settled through CSD 75Table 43: Statistical data on electronic means of payments 75Table 44: Evolution of payment infrastructure 76Table 45: Number of payment services providers 77Table 46: Summary of 2011/2012 financial result performance 86Table 47: Cash flow revenue income collection 87Table 48: Operating Income earned 87Table 49: Statement of comprehensive income 88Table 50: Statement of Financial position as at 30 June 2012 89Table 51: Statements of changes in Equity for the twelve month period ended 30 June 2012 90Table 52: Summary of 2012/2013 Budget 92

8
Activities report January - June 2012
BNR
LIST OF APPENDICES
Appendice 1: Major indicators of National Economy 148Appendice 2: Gross Domestic Product by Branche of Activity (Nominal) 149Appendice 3: Gross Domestic Product by Branch of Activity (Real) 150Appendice 4: Uses and Resources of GDP (Nominal) 151Appendice 5: Monthly Evolution of Consumer Price Index 152Appendice 6: Consolidated Financial Operations of the Central Government 154Appendice 7: BNR’s Balance Sheet 155Appendice 8: Balance Sheet of Other Depository Corporations 159Appendice 9: Monetary Survey 163Appendice 10: Consolidated Balance Sheet of Other Financial Intermediaries 167Appendice 11: Banking Survey 168Appendice 12: Outstanding Credit by Sectors of Activity 170Appendice 13: New Credits by Sector of Activity 171Appendice 14: Interest Rates Structure 172Appendice 15: Average Exchange Rates of the Major Currencies 173Appendice 16: Development of Guaranteed Debt Outstanding 174Appendice 17: Development of Disbursements 175Appendice 18: Development of External Debt Service Due 176Appendice 19: Balance Of Payment 177Appendice 20: Rwanda’s Exports 179Appendice 21: Rwanda’s Imports 181Appendice 22: Services and Income 183Appendice 23: Transfers 184Appendice 24: Capital and Financial Account 185Appendice 25: Available Financing 186

9
Activities report January - June 2012
BNR
ABREVIATIONS
ACH: Automated Clearing HouseAGF: Agricultural Guarantee Facility ATM: Automated Teller MachineBNR: Banque Nationale du Rwanda/National Bank of RwandaBOP: Balance of PaymentsBDF: Business Development FundBPM: Business Process ManagementCAMELS: Capital adequacy, Asset quality, Management, Earnings, Liquidity, Sensitivity to market riskCAN: Controller Area Network (in Automation)CISA: Certified Information Systems AuditorCMAC: Capital Market Advisory CouncilCOBIT: Control Objectives for Information and Related TechnologyCOGEAR: Compagnie Générale d’Assurances et Réassurances au RwandaCORAR : Compagnie de Réassurance et d’Assurance du RwandaCPI: Consumption Price IndexCPSS: Committee on Payments and Settlement Systems CRB: Credit Reference BureauCSD: Central Securities DepositoryEAC: East African CommunityEAPS: East African Payment SystemEDPRS: Economic Development and Poverty Reduction Strategy ERP: Enterprise Resource Planning FAQs: Frenquently Asked QuestionsFDI: Foreign Direct InvestmentFMDP: Financial Market Development action PlanFOB: Free On BoardFSC: Financial Stabilty CommitteeG&NFS: Good and Non Factor ServicesGDP: Gross Domestic Product.IAS: International Accounting StandardsICT: Information and Communication Technology IFRS: International Financial Reporting StandardsIGC: International Growth CenterIIP: Index of Industrial ProductionIMF: International Monetary FundIOSCO: International Organization of Securities CommissionsKRR: Key Repo RateMFIs: Micro Finance InstitutionsMIGEPROF: Ministry of Gender and Family Promotion MINAGRI: Ministry of AgricultureMINECOFIN: Ministry of Finance and Economic PlanningMPC: Monetary Policy Committee

10
Activities report January - June 2012
BNR
NCSD: National Central Securities DepositoryNDA: Net Domestic AssetsNFA: Net Foreign Assets NISR: National Institute of Statistics, RwandaNNSS: National Net Settlement SystemNPLs: Non Performing LoansNPS: National Payment SystemNPISH: Non-Profit Institutions Saving Households ODCs: Other Depository corporationsOMO: Open Market OperationsPAT: Portfolio Analytics ToolPFI: Participating Financial Institutions POS: Point of salePPI: Producer Price IndicesPR: Public RelationPRGF: Poverty Reduction and Growth FacilityPSI: Policy Support Instrument REPO: Repurchase Agreement Operations REPPS: Regional Payment Processing and Settlement SystemRIF: Rural Investment FacilityRIPPS: Rwanda Integrated Payment Processing SystemRMP: Risk Management ProgramRoA: Return on AssetsRoE: Return on Equity RRA: Rwanda Revenue Authority RSP: Remittance Services ProvidersRTGS: Real Time Gross Settlement SystemSMTEL: Société Monétique et de Télé-compensation au RwandaSOPYRWA: Société du Pyrethre au RwandaSR: Standard ReportSTA: Statistics Department of IMFTA: Technical AssistanceTMU: Technical Memorandum of UnderstandingTOR: Terms of ReferenceUSA: United States of AmericaUSAID: United States Agency for International DevelopmentVAT: Value Addition Tax

11
Activities report January - June 2012
BNR

12
Activities report January - June 2012
BNR
The first half of 2012 has been very challenging for decision makers in monetary, financial and economic fields. Financial tensions continued in Europe which, coupled with weak labour and housing markets in developed countries, resulted in higher uncertainties worldwide. Low, declining and in some cases negative growth prospects in the developed world have started to have a negative impact on exports from emerging and developing economies although the growth prospects in these countries remain strong. While there is hope that issues in the Euro zone will be solved in one way or another, uncertainties remain as to how fast this can be done.
This is therefore the time for governments, central banks and companies to learn fast, work hard and collaborate more in a bid to mitigate the negative impact of the crisis. Such deliberate effort has worked for us in East African Community. It made the turn round in inflation possible since the December 2011 climax.
In Rwanda, better coordination of monetary and fiscal policies supplemented monetary tightening to yield even higher performance as Rwanda’s inflation declined from 8.3% in December 2011 to 5.9% in June 2012 keeping the growth of the economy on course at a real GDP growth rate of 9.9% in the Second Quarter of 2012.
This is also the time for prudent management of macro and micro economic policies that are capable of building investors confidence and guide better their decisions of allocating the resources. Central Banks have an enormous role to play to ensure compliance to prudential norms and regulators of today are called to look domestic and cross-border at the same time. That is why National Bank of Rwanda has put a lot of efforts in making sure our financial institutions are profitable, liquid, well capitalized and ethical in their deal-ings. Customer care service guidelines were issued for those institutions to offer total value to their clients. Responsible lending and the use of credit reference bureau contributed to the decline in non performing loans in banks from 8% in December 2011 to 5.8% in June 2012. Banks, together with Savings and Credit Cooperatives (mainly Umurenge SACCOs), have contributed a lot to doubling formal financial inclusion in five years from 21% in 2008 to 42% in mid 2012 thus cutting exclusion from 52% to 28% over the same period. The modernisation of payment systems embarked on since 2011 has the potential to be the next driver of financial inclusion.
I believe Rwanda is on the right track to reaching its vision 2020. However, challenges still remain. Ac-commodating the high speed in growth which comes in the form of high growth in imports is one example in point. This implies increasing our exports if we are to prevent trade balance deterioration. It also means implementing flexible and timely policies to smoothen volatility in market-driven foreign exchange rates.
This report is for six months period (January-June 2012) as a transition from calendar year to financial year arrangement. Thus, to harmonize with the EAC Countries, the next annual report will cover the period of July 2012-June 2013 instead of January-December 2012.
I wish you an enjoyable reading.
Amb. GATETE ClaverGovernor
FOREWORD

13
Activities report January - June 2012
BNR
EXECUTIVE SUMMARY
In the first semester 2012, Rwanda’s economy evolved in a challenging international economic en-vironment. The world economy was marked by serious financial tensions surged in Europe while some other developed countries continue to face weak labor and housing markets. According to IMF forecasts, world economic growth is projected at 3.5% in 2012 from 3.9% in 2011. However, economic activity continues to be strong in emerging and developing countries.
Inflationary pressures remained stable in developed countries while relatively high in emerging and developing countries. With regard to EAC countries, high inflationary pressures have been progressively easing in general since November 2011 on account of better agricultural sector per-formance and tight monetary and fiscal policies.
The national economic performance was marked by a moderate food crop production due to unfavourable weather conditions (heavy rains and floods). However, other productive activities continued to record good performance in line with the real GDP growth projection of 7.7%. The composite index of non-agricultural economic activity (CIEA) increased by 11.1% in June 2012 on annual basis, total turnovers in Manufacturing industries and services increased by 23.6% and exports sector also continued to record good performance.
Sustained by traditional and nontraditional products, exports value increased by 25.1% during the first half of 2012 on annual basis, against 22.1% for imports. The imports cover improved to 18.7% in the first half of 2012 from 18.2% in the corresponding period of the last year. Although exports sector performed well, Rwanda recorded a negative Balance of Payments estimated at USD 195.50 million in the first half of 2012 draw principally by an important current account deficit and a decline in capital and financial account.
In EAC region, the country continued to record a significant expansion with an increase of 13.1% in total trade volume compared to the corresponding period in 2011. Good performance in real sector has been achieved with moderate inflation. Indeed, the inflation has been maintained at moderate level in the first half of 2012. The annual headline inflation decelerated from 8.3% in December 2011 to 5.9% in June 2012. However, during the most part of the period under review, the inflation has been higher than in June 2012, fluctuating around 8% on annual basis, mainly driven by food and energy prices.
As response to persistent uncertainties in international environment, the National Bank of Rwanda has been implementing a prudent monetary policy, while continuing to support the financing of the economy. In this regard, the Central Bank policy rate was increased in May 2012 from 7.0% to 7.5%.
Higher than expected, imports of capital goods, intermediary goods and energy reflecting in-creased investments in the country attracted high demand for foreign exchange leading to a mod-erate depreciation of Rwandan franc by 1.37% against USD at the end of June 2012. With regard to exchange rate policy, the BNR continued to maintain a flexible exchange rate regime interven-ing to smooth exchange volatility.

14
Activities report January - June 2012
BNR
The financial sector as a whole was sound and stable. The banking sub-sector continues to be profit-able, liquid and well capitalized to sustain growth but also resilient to external shocks as a result of strengthened legal, regulatory and supervisory framework. The capitalization levels (measured by total capital to risk weighted assets) stood at 25.1% against 25.0% in December 2011, well above the regulatory capital of 15%. The Non-performing loans (NPL) to total gross loans reduced to 5.8% in June 2012 from 8% in December 2011. The return on assets and return on equity (profitability) stood at 2.3% and 10.9% respectively in June 2012 compared to 2.9% and 15.2% in June 2011 while the sector’s liquidity position stood at 48.3% in June 2012 against 45.3% in December 2011.
The microfinance sub-sector (combining SACCOs and MFIs) also continued the expanding of its balance sheet, realizing 22.2% asset growth and NPLs ratio of 8.3% in June 2012 against 12% in December 2011. Taken alone, the SACCOs continued to play a significant role in expanding financial inclusion with very low NPL (2.6% in June 2012 from 5.6% in December 2011). The in-surance sub-sector performance improved progressively reflecting the impact of the supervisory reforms undertaken in the insurance industry. Insurance penetration reached 7% in 2012 from 3% in 2008. Furthermore, the pension sector continued to grow with a positive assets trend reaching FRW 251 billion in June 2012 from FRW 231 billion in June 2011. Better positive prospects are expected after the enactment of the new pension law that will give rise to the establishment of private pension schemes.
Regarding the access to finance, findings of FinScope Rwanda 2012 show that the percentage of adult population having access to formal financial services increased from 21.1% in 2008 to 42% in the mid of 2012 while financial exclusion declined by 46% from 52% in 2008 to 28% in 2012. On average, SMEs constitute 17% of the overall lending portfolio which compares to 16% on average in developing countries.
With regard to the payment systems modernization, a lot of progress has been made in all forms of retail electronic payment systems, both card based and mobile financial services.
Among other achievements, the Visa National Net Settlement System (NNSS) has been opera-tional since the 1st of March 2012. The retail Payments infrastructure has also improved consider-ably. The Number of ATMs has increased to 232 as compared to 167 by end 2011. Points of Sale (POS) have also increased to 385 from 227 at the end 2011.
To fast track the cheque payment process with more security, the Bank together with the Rwanda Bankers Association, is embarked on the cheque trunction Project. At regional level, the Rwanda Integrated Payments Processing System (RIPPS) has been upgraded to enable linkage to Re-gional Payment Systems notably; the East Africa Payment system (EAPS) and the COMESA Regional Payments and settlement system (REPSS) to facilitate the cross border payments in the East African community and COMESA region.
The above achievements resulted also from various facilities related principally to modernization of information technology systems and physical infrastructure as well as human resources manage-ment and development.

15
Activities report January - June 2012
BNR
Taking into account the information technology modernization, several projects related notably to inauguration of new data center and initiating Core Banking and ERP systems that have been given priority by the Bank management aiming essentially to improve the quality of customer services.
Concerning the modernization of the Bank’s physical infrastructure, a new car park with 180 Vehicle capacity is under construction expected to be completed very soon taking care of the customer and Bank staff parking needs and allowing for the target of keeping BNR green. In addition, construction of four (4) BNR Branch Office buildings based in the four provinces of Rwanda is in process.
Regarding human resources management and development, the Bank invested especially in the development of strategies to enhance the Human Resources Management and Organisational Effectiveness reform agenda. In terms of capacity building and talents management, a new ca-reer development system is being implemented through a Career Progression Policy published in June 2012. In the framework of the Bank’s three year rolling capacity building plan, trainings and industrial attachments have been continuous and by June 2012, 36 staff of BNR were registered in different professional courses while others are pursuing master’s degrees and PhDs in areas of monetary policy and economic development.
In the framework of corporate social responsibility, the Bank initiated a project to support families of its former staff who perished in the 1994 Genocide against Tutsi and officially inaugurated a Memorial at the BNR Headquarter. In addition, the Bank completed and handed over the poultry project designed for the Musambira orhphans and widows of the 1994 Genocide against Tutsi and continued sponsor-ship of students from the area pursuing technical and vocation training courses in various institutions.
The National Bank of Rwanda’s financial results for the financial year 2011/2012 has been a net profit of 6,903 million of FRW against 4,604 million for the previous period of 2010/2011.

16
Activities report January - June 2012
BNR
INTRODUCTION
This report presents the main activities of the National Bank of Rwanda over a period of six months from January to June 2012. It also describes the environment in which the Bank performed its work and the outlook in the near months ahead. The present edition is one of our annual reports series; however, it only covered the six months as a transition from a fiscal year that used to start in January ending in December to an East African Community one running from July to June of the following year.
The main activities undertaken by the Bank over the reporting period covered its core missions of ensuring and maintaining price stability on the one hand, and enhancing and maintaining a stable and competitive financial system on the other. The Bank also accomplished a lot in line with its other mission of supporting Government’s general economic policies.
The Bank further intensified communication to the market players and the general public as a de-liberate strategy intended to guide the formation of expectations and to prevent speculative moves that can be disruptive in the market.
This report is organized under nine (9) chapters. The first one presents the Bank’s governance framework. The second and the third highlight the context of global and national economic envi-ronment in which the Bank delivered its mandate during the period under review. The main objec-tives achieved by the Bank are presented from chapter four to eight while the last chapter shows the financial performance during the year 2011/2012. Statistical information related to the four macroeconomic sectors are enclosed to the report as appendices.

17
Activities report January - June 2012
BNR
BNR CORPORATE GOVERNANCE
CHAPTER I

18
Activities report January - June 2012
BNR
The National Bank of Rwanda’s vision is to become a leader Central Bank by implementing ef-ficient monetary policy, granting price & financial stability and ensuring efficient payment systems for sustainable economic growth.
According to article 5 of the law governing BNR, its main mission is to: Ensure and Maintain Price Stability; Enhance and Maintain a Stable and Competitive Financial System without any exclu-sion; and support Government’s General Economic Policies without damaging the two above-mentioned missions.
To achieve the mission described above, the Bank has the following functions:
• To define and implements the monetary policy;• To organize, supervise and regulate the foreign exchange market;• To supervise and regulate the activities of financial institutions;• To supervise and regulate payment systems;• To mint and manage money;• To hold and manage official foreign exchange reserves;• To act as State Cashier;• To carry out any other task that this law or another law may assign to the Bank
The Bank’s core values are Integrity, Accountability, Efficiency and Effectiveness.
I.1 Board Affairs
The Bank carries out its functions independently and it is accountable for its conduct of monetary policy and the use of its resources. It is managed by the Board of Directors and chaired by the Governor of the Bank.
In accordance with the law governing the National Bank of Rwanda (Law no.55/2007 of 30/11/2007), The Board of Directors of National Bank of Rwanda is composed of; the Governor who is the Chairman of the Board, the Vice Governor who is the Vice Chairperson of the Board and other four officials external members (to the Bank) as follows.

19
Activities report January - June 2012
BNR
Amb. GATETE Claver Board Chairman
Dr. NDAGIJIMANA UzzielBoard Member
Ms. KYATENGWA Lillian Board Member
Mr. RUGWABIZA MINEGA LeonardBoard Member
Ms. UWAMARIYA Odette Board Member
Ms. NSANZABAGANWA Monique Board Vice Chairperson
BOARD OF DIRECTORS

20
Activities report January - June 2012
BNR
In the current composition of the Board, women represent 50%, high than the minimum of 30% set by the Law.
Within the framework of defining policies and supervising the activities of the Bank, the Board of Directors held two ordinary meetings in the first semester of 2012. During this period, the Board of Directors resolved to restructure BNR ICT function into a Directorate with two Departments of IT Infrastructure Management and Management information Systems. The Board also approved the 2011 Annual Report and Financial Statements among other decisions.
I.2. Management Committee (MC)
The Bank Management Committee is composed of the Governor, Vice Governor, all Directors General and Directors. This is a coordinating organ of the Bank charged with the day to day man-agement of the Bank. Through out its daily activities, the Management Committee ensures good functioning of the various organs of the Bank and the implementation of the resolutions of the Board of Directors. In the first semester of 2012, the Management Committee of the Bank continued to put emphasis on a number of issues related to the management of the Bank especially on Monetary Policy, Financial Markets, Banking System Oversight, Insurance Industry Reform, Payment System Mod-ernization, Microfinance Supervision among others.
The Bank Management also continued to implement the recommendations from the visit of His Excellency President of the Republic to the National Bank of Rwanda in 2009. The management also registered high performance in implementing audit recommendations.
It is also important to mention that the Management Committee of the Bank conducted a Retreat in May 2012 which mainly focused on; Research Based Monetary Policies, Financial Inclusion, National and Regional Payment Systems, Bank’s 3 Year Strategic Plan, Modern IT and its associ-ated risks, Equipping BNR branches and necessary Reforms to fast-track best service delivery in the Bank.
I.3. Monetary Policy Committee (MPC)
In line with its mandate of formulating monetary and exchange rate policies, the MPC met twice in first half of 2012 to monitor challenges in the international, regional and domestic economic envi-ronment. With developments in inflation drivers and banking system liquidity in the first quarter of 2012, the Committee decided to maintain the Central Bank policy rate, the Key Repo Rate (KRR) at 7.0% on 16th March. On 4th May, an MPC extraordinary meeting raised the KRR to 7.5% to pursue monetary policy tightening to prevent effect of persistent inflationary pressure at global and regional levels. The Committee also committed to ensure that exchange rate is market driven and the BNR intervening only to smoothen the exchange rate volatility.

21
Activities report January - June 2012
BNR
I.4. Monetary Policy Implementation Committee (MPIC)
Through its weekly meetings, the Monetary Policy Implementation Committee has been on right track to complete its mandate of implementing decisions made by MPC. It has been focusing on reserve money developments to achieve quantitative assessment targets as defined in the mon-etary program under the Policy Support Instrument (PSI). For the first half of 2012, all targets on Reserve Money and Net Foreign Assets were successfully met.
However, the MPIC faced some challenges, among them, high demand on foreign market en-hanced by the reduction of external inflows and increase in money market interest rates. De-spite those challenges, the MPIC continued to cope with developments in domestic, regional and international economic environment to advice on policy actions to curb inflationary pressure. Moreover, MPIC has continued implementing a flexible exchange rate regime, keeping the overall stability of the exchange rate.
I.5. Financial Stability Committee (FSC)
The BNR Financial Stability Committee (FSC) was established in May 2012 following the BNR Board of Directors decision with a mission to promote the stability of the Rwandan financial system by analysing the system in its environment on a permanent basis, and by identifying, monitoring and publishing associated risks.
I.6. Audit and Risk Committee
The National Bank of Rwanda Audit committee which is a sub-committee of the Board of Directors works its regular activities with close collaboration of the Internal Audit and Risks Management Departments.
The risk management in BNR is essentially oriented in mitigating the risks and their impacts. The achievement of objectives is generally compromised by unexpected events. It is in this regard, that as usual even during the first half of year 2012, BNR enhanced its commitment to strengthen efficient internal controls system in all operations as principal means by which the risks were man-aged. In this regard, the senior managers have been requested to periodically conduct a review of the effectiveness of the system of internal controls in the Bank. Among other internal controls, the Bank has consistently insisted on compliance to the adopted policies, regulations, processes and procedures, strategic planning, capacity building plan, standards of various businesses, etc. The internal controls implemented in BNR have significantly reduced the potential risks at tolerable level and the process of their implementation is continuous. This is possible through application of risk based audit approach by the Internal Audit Department (IAD) evaluating the design and implementation of internal controls within the Bank.

22
Activities report January - June 2012
BNR
I.7. Reserve Management Committee
The Law n° 55/2007 of 30/11/2007 governing the Central Bank of Rwanda, in its Chapter II Article 42, entitles the Bank (BNR) to manage official foreign exchange reserves of the country. The Board of Directors approves the Foreign Exchange Reserves Management Policy and delegates to the Reserves Management Committee the power to approve and to enforce the compliance to the In-vestment Guidelines as well as different investment decisions proposed by the Financial Markets Department which is in charge of the day to day management of the foreign exchange reserves. For the first semester of 2012, the Reserves Management Committee reviewed through its regular meetings, the observance of risk parameters and different limits fixed by the Guidelines. The Com-mittee activities were conducted under a challenging and unprecedented environment marked with low returns and increasing credit risk on authorized asset classes, consecutive to the sovereign debt crisis in the Euro zone countries. The Committee proposed to the Board the review of the Reserves Management Policy for a better and flexible management of the credit risk. On another note, the Committee reviewed the performance of the internal portfolios and that of funds outsources.
I.8. IT Committee
The BNR in the first semester of 2012 reviewed the mandate of IT Committee. During the period of this report the Committee managed to lay out strategies on how to fast-track the implementation of the IT projects that have been identified as the best tools to modernise the IT systems in the Bank.

23
Activities report January - June 2012
BNR
GLOBAL ECONOMIC DEVELOPMENTS
CHAPTER II

24
Activities report January - June 2012
BNR
II.1 Economic growth and outlook
According to IMF estimates in July 2012, the world economic activity rose by 3.6% in the first quarter 2012 helped by easing financial conditions, rebound in industrial production and interna-tional trade together with improving business confidence after the European long-term refinancing operations. The value of world trade of goods was 5% higher in the first quarter of 2012 compared to the same period of 2011 and the industrial production rose by 5.5% in the three months up to April 2012. However, due to escalating financial woes in the Euro area and their spillover effects in other regions and following slower-than- expected economic growth in emerging and develop-ing economies, global economic activity decelerated to 1.7% in the second quarter 2012, and it is projected to increase by 3.5% for the whole year 2012 after 3.9% in 2011. In advanced countries, economic growth remained subdued as a result of structural impediments and concerns about global economy. In emerging and developing countries, despite some mod-eration following weak external demand and policy tightening, economic growth remained sus-tained. The IMF projects real GDP growth in 2012 at 1.4% in developed economies and 5.6% for emerging & developing economies against 1.6% and 6.2% respectively in 2011.
Table 1: World Economic growth developments (annual real growth rate)2007 2008 2009 2010 2011 2012 Proj.
World 5.4 2.8 -0.7 5.2 3.9 3.5Advanced Economies 2.8 0.1 -3.7 3.2 1.6 1.4 - United-States 1.9 -0.3 -3.5 3.0 1.7 2.0 - Japan 2.4 -1.2 -6.3 4.4 -0.7 2.4 - Euro Zone 3.0 0.4 -4.3 1.9 1.5 -0.3 - Newly Industrialized Asian Economies 5.9 1.8 -0.7 8.4 4.0 2.7Other Emerging and Developing Countries 8.9 6.0 2.8 7.3 6.2 5.6 - Sub-Saharan Africa 7.1 5.6 2.8 5.3 5.2 5.4 - Asia 11.5 7.7 7.2 9.5 7.8 7.1 - Western Hemisphere 6.7 4.6 2.6 4.3 3.1 -
Source: IMF, World Economic Outlook, January 2012
In the United States, real GDP rose by 1.5% in the second quarter of 2012 after 2.0% in the previ-ous quarter led by accelerating consumer spending and exports while non-residential and inven-tory investment growth remained weak. Recent survey data pointed to a slight improvement in GDP growth to 2.0% by end 2012 compared to 1.7% in 2011.
In the Euro area, economic activity declined by 0.4% in the second quarter 2012 after stagnating in the previous quarter 2012 due to weak manufacturing production especially in April as a result of poor performance of peripheral economies. By the end of 2012, the economic activity is expected to slow down by 0.3% after 1.5% increase in 2011.
In Japan, economic growth decelerated from 5.5% in the first quarter of 2012 to 1.4% in the sec-ond quarter 2012, with slowing production as evidenced by slowing manufacturing production and slowing growth of exports, particularly to Asia.

25
Activities report January - June 2012
BNR
In United Kingdom, real GDP declined by 0.5% year on year in the second quarter of 2012 weighed down by investment and household consumption which contributed negatively to GDP after -0.2% and 0.6% respectively in the first quarter 2012 and the last quarter 2011. For 2012, average eco-nomic growth will recover, according to IMF estimates in July 2012 at 0.2% after 0.7% in 2011.
In the Middle East and North Africa, economic activity is expected to strength to 5.5% in 2012 boosted by oil production and domestic demand against 3.5% in 2011. Economic growth is also projected to remain robust to 5.4% in Sub-Saharan Africa from 5.2% in 2011, thanks to its relative insulation with regard to external financial shocks and consolidation of macroeconomic stability.
II.2 Inflation
Inflationary pressures are gradually easing, thanks to declining energy prices and following weak-ening global demand. The world annual inflation stood at 2.6% in the second quarter 2012 after 3.1% in the first quarter 2012. In advanced economies, inflation is projected at 2.0% in 2012 against 2.7% in 2011 while for emerging and developing countries it is expected to decelerate to 6.3% from 7.2% in 2011.
Table 2: Annual inflation developments (in % )2010 2011 2011 2012 2012
projDec. Dec. Mar. Jun. Sept. Jan. Mar. Apr. May Jun.United States 1.3 3.0 2.7 3.6 3.9 3.0 2.7 2.3 1.7 1.7 2.1Euro Zone 2.0 2.7 2.6 2.7 3.0 2.7 2.7 2.6 2.4 2.4 1.8United Kingdom 3.7 4.5 4.1 4.2 5.2 4.2 3.5 3.0 2.8 2.4 2.4Japan 0.1 -0.2 0.0 0.2 0.1 0.2 0.7 0.5 0.1 -0.3 -0.2
Source: ECB, Monthly Bulletin, August 2012.www.cbrates.com
In June 2012, headline inflation remained flat at 1.7% in the USA and in Euro Area to 2.4% after 2.3% and 2.6% respectively in April 2012. In the UK, inflation was down to 2.4% in June from 2.8% and 3.0% respectively in May and April 2012. In Japan, inflation was for the sixth straight month positive at 0.2% in June after 0.1% in May and 0.5% in April 2012.
II.3 World trade
World trade volume decelerated to 5.9% in 2011 after a strong recovery in 2010 (12.8%) from the collapse in 2009. The global trade growth is expected to continue slowing down in 2012. For first quarter 2012, the value of world trade of goods was 5% higher than the trade in the same period of 2011. The world trade volume in 2012 is expected to curb to 3.8% due to conflicting economic developments in USA and in Europe which made the economy very fragile and therefore leading to weak trade, according to IMF forecasts in July 2012. The price deflator in USD is also expected to fall by 0.2% on average for 2012 from 10.8% rebound in 2011.

26
Activities report January - June 2012
BNR
Table 3: World trade developments (annual percent change)2007 2008 2009 2010 2011 2012
Trade in goods and services - Volume 7.7 3.0 -10.7 12.8 5.9 3.8-PricedeflatorinUSdollars 7.8 10.9 -10.2 5.5 10.9 -0.2Trade in volume - Exports Advanced Economies 6.8 2.1 -11.9 12.2 5.4 2.3 Emerging markets and developing countries 10.2 4.7 -7.7 14.4 6.6 5.7 - Imports Advanced Economies 5.2 0.6 -12.4 11.5 4.4 1.9 Emerging markets and developing countries 13.8 9.1 -8.0 15.3 8.8 7.8 - Terms of trade Advanced Economies 0.4 -1.9 2.3 -1.0 -1.7 -0.9 Emerging markets and developing countries 0.2 3.3 -4.3 2.0 3.2 0.6Trade in goods - volume 7.5 2.8 -11.7 14.3 6.3 3.7-PricedeflatorsinUSdollars 7.6 11.4 -11.8 6.6 12.1 0.1World price in dollars - Manufactured products 6.0 6.7 -6.6 2.4 7.2 0.2 - Oil 10.7 36.4 -36.3 27.9 31.6 -2.1 - Non-petroleum products 14.1 7.5 -15.7 26.3 17.8 -12.0
• Food 15.2 23.4 -14.7 11.5 19.7 -7.5• Beverages 13.8 23.3 1.6 14.1 16.6 -22.2• Agricultural raw materials 5.0 -0.8 -17.0 33.2 22.7 -13.2• Metals 17.4 -7.8 -19.2 48.2 13.5 -10.5
Source: IMF, World Economic Outlook, April 2012 and World Economic Outlook July 2012
Exports as well as imports of goods and services are expected to slow down in both developed and developing economies following weak global demand. Exports growth is projected to retreat to 2.3% and to 5.7% respectively in developed and in emerging & developing countries after 5.4% and 6.6%. Similarly, imports growth is estimated to slide to 1.9% and 7.8% in developed econo-mies and emerging and developing countries. Terms of trade will deteriorate for the third straight years in developed countries while in emerging and developing economies, remained positive but still very low.
With regard to prices developments, manufacture prices are estimated to remain almost un-changed on average in 2012 while prices are expected to decline for all commodities, oil (-2.1%) and non-oil commodities (-12.0%) in response to deteriorating European debt concerns.
In second quarter of 2012, most commodity prices declined, energy prices declined by 8.57% after an increase of 7.55% in the previous quarter 2012 on rising supply, high stocks in United States and on easing tensions with Iran. Similarily, non-energy prices dropped by 1.82% led by de-clines in main groups of products: metals and minerals prices fell by 5.56% in the second quarter 2012 on concerns about global demand, agriculture prices slowed by 0.48% drawn by most com-modities including beverages (-5.19%), raw materials (-3.90%) while prices increased for grains (0.14%) and for food (1.57%).
According to IMF estimates in July 2012, oil prices will decline on average by 2.1% 2012 after an increase of 31.6% in 2011 on easing supply conditions coupled with weak demand and high US stocks.

27
Activities report January - June 2012
BNR
Fig. 1: Brent crude price developments (USD/ barrel)
Source: IMF
II.4 Financial Markets
For the first half of 2012, money market interest rates kept on declining reflecting significant ex-cess liquidity in the money market. Long term maturity interest rates remained volatile. Central Bank rates remained unchanged in all leading economies as inflationary pressures have been dampened further. Policy rate remained in the range between 0% and 0.25% in USA, at 0.5% at Bank of England, Japanese Central Bank kept it at 0.1% and Euro Area at 1%. 3-month interest rates reduced to 0.53% in June after 0.59% in May 2012 in Euro area, to 0.87% after 1% in the UK. In the USA, 3-month rate was a little down to 0.47% in June 2012 after 0.48% in the previous month whereas it was constant at 0.17% in Japan.
10-year government bond rate was almost unchanged in USA standing at 1.64% in June 2012 on account of mixed economic data and due to subdued labor market data while housing market was relatively stable. In the Euro area, 10-year interest rate was up to 1.58% in June 2012 from 1.20% in May 2012 on return of risk appetite and reduced flight-to-safety flows ahead of June European Council meeting that was expected to initiate some political measures to strengthen financial sta-bility. Japanese and British 10-year Government rate stood at 0.84% and 1.73%, respectively in June from 0.86% and 1.57% in May 2012.
On the foreign exchange market since March 2012, US dollar remained strong against the Euro and the GBP (since April) mainly due to changes in perception of sustainability of the debt in the European countries and on yield differentials between USA and Euro Area. However, in June, the dollar depreciated by 2.4% versus the Euro and 1.9% versus the GBP while appreciating by 1.8% versus the Japanese Yen.

28
Activities report January - June 2012
BNR
II.5 EAC member countries
With regard to EAC countries, high inflationary pressures have been progressively easing since November last year on account of better agriculture sector performance and tight monetary and fiscal policies. In June 2012, Kenya’s and Uganda’s year-on-year inflation rate slowed down to 10.1% and 18.0% from 18.9% and 27.0% in December 2011 and from 14.5% and 15.8% respec-tively in June 2011. Similarly, headline inflation has dropped slightly to 17.4% in June in Tanzania from 19.8% in December 2011 while it was at 10.9% in June 2011.
Table 4: Annual inflation in EAC countries in % 2010 2011 2012Dec. Mar. Jun. Sept. Dec. Jan. Feb. Mar. Apr. May Jun.
Uganda 3.1 11.1 15.8 28.3 27.0 25.7 25.4 21.2 20.3 18.6 18.0Kenya 4.5 9.2 14.5 17.3 18.9 18.3 16.7 15.6 13.1 12.2 10.1
Tanzania 5.6 8.0 10.9 16.8 19.8 19.7 19.4 19.0 18.7 18.2 17.4Burundi 4.9 5.7 8.6 11.7 14.9 21.6 22.0 24.5 25.2 22.5 17.3Rwanda 0.2 4.1 5.8 6.6 8.3 7.8 7.9 8.2 7.00 8.3 5.9
Source: EAC Central Banks. www.bou.or.ug; www.centralbank.go.ke; www.bot-tz.org; www.brb.bi; www.bnr.rw
In Burundi, the annual inflation increased from 14.9% in December 2011 to 25.2% in April 2012, before easing to 17.3% in June 2012.
Box 1
• World Economic growth (2012): 3.5% (projection )• World Annual inflation ( Q2,2012) : 2.6%• World Trade volume growth (2012): 3.8% (projection)

29
Activities report January - June 2012
BNR
NATIONAL ECONOMIC PERFORMANCE
CHAPTER III

30
Activities report January - June 2012
BNR
III.1 ECONOMIC GROWTH
The Rwandan economy maintained its good performance in the first half of 2012 with annual real GDP growth projected at 7.7% in 2012 from 8.6% in 2011. In the second quarter 2012, real GDP increased by 9.9 percent boosted by high increase in services (14.4 percent) and Industry (9.2 percent) sectors despite moderate performance in agriculture sector (3.8 percent).
Value added for the agriculture sector increased by 3.8 percent as compared to 0.4 percent in the second quarter 2011. Food crops improved by 4.1 percent compared to 0.4 percent attained in second quarter 2011. However, the value added for export crops decreased by 17.3 percent while livestock, forestry and fisheries improved by 7.0 percent, 5.1 percent and 2.7 percent respectively.
With regard the industry sector, the value added at constant prices of 2006 grew by 9.2 percent in the second quarter 2012 compared to 14.3 percent in the second quarter of the previous year. This per-formance was mainly driven by improvement in construction sector (16.8 percent) as well as electric-ity and water (16.1 percent), despite a decrease of 0.4 percent in mining and quarrying sector.
The performance observed last year in services sector was maintained in second quarter 2012 with an increase of 14.4 percent compared to 9.8 percent in the second quarter 2011. This in-crease was mainly attributed to the high increase in public administration, transport, storage and communication services, finance and insurance, education and hotels and restaurants, which respectively grew by 22.0 percent, 20.5 percent, 16.4 percent, 14.4 percent and 13.3 percent.
In addition, the composite index of economic activities (CIEA) in nominal terms, increased by 11.1% end June 2012 compared to the same period of 2011 and by 8% compared to December 2011. Total turno-vers registered by industry and services sectors show good performance of the economy during the first half of 2012 rising by 23.6%. Industry sector grew by 21.7% and services by 24.4%. This performance re-sulted mainly from developments in manufacturing industries (+35.3%), energy sector (+30.7), construc-tion sector (+11.8%) for industry sector, and trade services (+25.1%), banks and insurance companies (27.1%), transport and storage (+50.4%), petroleum companies (+21.4%), garage services (+33.4%) and posts and telecommunication (+15.4%) for the service sector.
The industry companies represent about 30.2% while service sector accounts for 69.8% of the total turnovers.

31
Activities report January - June 2012
BNR
Table 5: Real GDP Growth (in %)
2008 2009 2010 2011 2012
Q1 Q2 Annual proj.GDP 11.2 6.2 7.2 8.6 7.7 9.9 7.7Agriculture 6.5 7.7 5.0 4.7 3.4 3.8 6.1 Food Crops 6.2 9.4 4.9 5.0 4.1 4.1 6.0 Export crops 28.9 15.1 14.2 2.7 -24.1 -17.3 22.5 Livestock 2.8 3.1 4.8 2.8 4.7 7.0 3.0 Forestry 3.7 2.3 3.2 2.7 3.2 5.1 2.7 Fisheries 1.6 3.2 3.1 3.0 2.9 2.7 2.7Industry 15.1 1.3 8.4 17.6 1.1 9.2 11.2 Mining and Quarrying 15.4 18.2 10.2 49.5 0.0 -0.4 10.8 Manufacturing 5.6 2.9 9.3 8.0 3.5 0.0 8.6 Electricity and Water 20.0 14.3 14.6 16.4 21.3 16.1 11.0 Construction 28.1 1.4 8.8 23.6 -0.7 16.8 13.2Services 13.8 6.2 9.0 8.9 14.2 14.4 8.7 Wholesale and Retail 19.4 4.0 8.4 10.2 14.6 11.1 8.8 Hotels and Restaurants 5.5 5.7 8.0 3.8 13.3 13.3 2.9 Transport & Communication 23.8 9.2 8.7 5.3 19.2 20.5 6.0 Finance and Insurance 1.6 4.1 23.6 20.4 9.5 16.4 12.4 Real estate & business services 15.5 8.2 1.0 0.2 12.9 10.2 3.0 Public Administration 4.9 7.3 14.5 14.9 15.1 22.0 6.6 Education 6.9 15.5 8.6 17.9 14.4 14.4 20.3 Health 11.9 15.1 15.8 2.3 10.8 6.0 17.9 Other personal services 1.9 5.2 7.1 0.7 -2.0 2.7 4.0Adjustments 11.5 9.6 4.8 7.9 -1.0 10.0 0.6
Source: Ministry of Finance and EconomicPlanning (MINECOFIN) and National Institute of Statistics, Rwanda (NISR)
III.2 PRICES
A. Overall inflation
Despite high regional inflationary pressures, inflation in Rwanda has been kept at moderate levels in 2012 as a result of efficient management of the monetary and exchange rate policies and con-tinuing overall improvement in the supply side, despite some sporadic shocks, especially on food and energy products. In June 2012, headline inflation on annual basis decelerated to 5.9%, from 8.3% in December 2011 as a result of a decline in prices of food.

32
Activities report January - June 2012
BNR
Monetary Policy and Financial Stability Statement
The main driver for domestic inflation has been food prices which increased on annual basis by 11.3% in June 2012 after 11.2% in December 2011. Higher food prices are mainly due to lower harvests compared to the previous periods caused by heavy rains which destroyed some crops, especially vegetables. Increase in vegetables’ prices has been much higher in 2012 reaching 21.3% in June 2012 from 8.7% in December 2011.
Table 6: Annual Headline Inflation (percent change in CPI, base Feb. 2009:100)
Weighted average
2007 2008 2009 2010 2011June 2012
Headline Inflation 10 000 6.6 22.3 5.7 0.2 8.3 5.91. Food and non-alcoholic beverages 3 538 1.0 30.9 9.0 -2.7 11.2 11.3 - Bread and cereals 733 1.1 43.7 2.8 -10.6 20.5 6.1 - Meat 274 3.7 51.9 -3.1 5.0 10.3 13.0 - Fish 83 6.7 36.3 3.4 9.4 22.5 9.8 - Vegetables 1 200 -3.0 17.8 20.7 -5.2 8.7 21.3 - Non-alcoholic beverages 160 6.6 20.4 -1.4 -0.3 4.6 9.32. Alcoholic beverages and tobacco 240 8.9 35.5 8.6 4.1 3.0 10.33. Clothing and footwear 377 2.7 4.9 1.9 1.6 8.7 4.64. Housing, water, electricity, gas and other fuels 2 204 19.2 21.4 0.9 1.6 6.8 5.55. Furnishing, household equipment and routine household maintenance 457 3.4 24.4 -0.4 -2.4 4.9 4.3
6. Health 163 13.0 12.3 -0.8 -1.1 1.9 1.47. Transport 1 189 7.2 12.2 11.8 4.1 9.1 0.48. Communication 288 3.2 -14.3 -3.6 -0.4 -6.3 -7.79. Recreation and culture 256 -4.3 2.5 1.8 1.4 5.2 -1.510. Education 331 10.0 14.2 17.4 6.5 20.7 1.011. Restaurants and hotels 558 10.8 25.1 2.0 -0.4 4.5 2.012. Miscellaneous goods and services 400 0.7 2.4 7.9 2.4 5.6 2.4
Source: BNR

33
Activities report January - June 2012
BNR
Domestic inflation stood at 6.8% after 8.3% in December 2011 while imported inflation decelerated to 2.7% in June 2012 from 8.6% in December 2011.
B. Underlying Inflation
Core inflation which excludes fresh foods and energy from the overall CPI has been decelerating significantly and stood at 3.7% in June 2012 from 8.3% in December 2011 thanks to the effective-ness of the monetary and exchange rate policies implemented by the National Bank of Rwanda.
Table 7: Overall and Underlying price developments (percent change in CPI, base Feb. 2009 = 100)
WeightsAnnual Headline Inflation Monthly Inflation
2011 2012 2012Dec. Jan. Mar. May Jun. Jan. Mar. May Jun.
Overall inflation 10 000 8.34 7.81 8.18 8.32 5.92 -0.35 2.21 1.41 -0.71 Local Goods 7947 8.26 7.78 9.01 9.65 6.75 -0.37 2.46 1.60 -1.12Imported Goods 2053 8.63 7.93 4.89 3.13 2.65 -0.24 1.20 0.60 0.99Fresh Food Products 1403 8.26 11.39 22.35 21.39 16.89 -0.25 9.53 -0.35 -2.81Energy 767 9.30 8.41 8.27 10.84 6.64 -1.34 4.56 6.05 -2.88Underlying inflation 7829 8.25 7.06 5.27 5.43 3.65 -0.26 0.38 1.33 0.02
Source: BNR
On annual average, underlying inflation increased to 6.8% in June 2012 from 5.7% in December 2011.
III.3 EXTERNAL SECTOR
III.3.1 BALANCE OF PAYMENTS
During the first half of the year 2012, Rwanda external sector continued to perform better. Exports and imports have increased significantly reflecting the level of economic activity although the imports value has been larger than export value. The trade deficit stood at USD 605.45 million, almost a half of the deficit projected for the whole year 2012. Net income and services were also negative and counted around 38% (USD 124.41 million) of the projected amount end 2012. After 8 consecutive years of surplus, the overall balance was negative to USD 195.50 for the first half of the year drawn by low capital and financial account balance which offset only 69% of the current account deficit (USD 466.39 million).
Table 8: Balance of Payments Summary 2011: (in USD million)2007 2008 2009 2010 2011 End Jun-2012 2012Proj.
Trade balance -404.39 -613.05 -762.06 -786.70 -1101.17 -605.45 -1313.10Services & income (net) -140.38 -135.67 -214.49 -292.06 -242.54 -124.41 -329.92Current account balance -83.45 -230.15 -372.54 -421.40 -463.14 -466.39 -703.67Capital and Financial account 196.70 316.12 433.55 499.36 682.51 321.99 692.31Errors et Omissions -2.66 -27.97 -3.96 -5.89 16.17 -51.10 1.65Overall balance 110.60 58.01 57.05 72.07 235.54 -195.50 -9.71
Source: BNR

34
Activities report January - June 2012
BNR
1. MAJOR BALANCE OF PAYMENTS COMPONENTS DEVELOPMENTS
A. TRADE BALANCE
For the first half of the year 2012, the trade balance stood at USD 605.45 million, the exports value amounted to USD 247.59 million and the imports to USD 887.57 million. Compared to the same period of 2011, exports increased in both volume and value respectively by 61.9% and 25.1% while imports rose respectively by 23.9% and 22.1%. Despite these trends, trade deficit deteriorated by 21.4% compared to the first half of 2011. However, imports cover has slightly improved to 18.7% from 18.2% for the first half of 2011 and to 23.3% after 21.4% when including cross-border trade.
Table 9: Major Balance of Payment components Developments (in USD million)2007 2008 2009 2010 2011 End Jun.12 2012 proj.
A. Trade balance -404.39 -613.05 -762.06 -786.70 -1101.17 -639.97 -1313.10Exports of which 176.77 267.67 234.94 297.28 464.24 247.60 466.93 coffee 35.67 47.05 37.29 56.08 74.60 12.14 76.63 tea 31.52 44.95 48.24 55.71 63.90 33.53 65.17Imports FOB -581.16 -880.72 -997.00 -1083.97 -1565.40 -887.56 -1780.02B. Services (net) -123.16 -100.60 -177.70 -246.22 -187.85 -106.36 -256.09C. Income (net) -17.22 -35.06 -36.79 -45.85 -54.69 -40.97 -73.83Trade, services and income balance -544.76 -748.71 -976.56 -1078.76 -1343.71 -787.30 -1643.01D. Current transfers net 461.32 518.57 604.02 657.36 880.57 287.00 939.34 Private 98.82 72.61 79.71 90.68 133.31 77.74 134.89 Public 362.50 445.96 524.31 566.68 747.25 209.26 804.45E. Current account -83.45 -230.15 -372.54 -421.40 -463.14 -500.30 -703.67F. Capital and Financial account balance 196.70 316.12 433.55 499.36 682.51 272.44 692.31Errors and Omissions -2.66 -27.97 -3.96 -5.89 13.58 16.17 32.37G. Overall balance 110.60 58.01 57.05 72.07 235.54 -195.50 -9.71
Source: BNR
A.1 Exports
During the first half of 2012, total receipts from exports were evaluated to USD 247.60 million mostly dominated by traditional products which represented 57% of the total exports receipts while other ex-ports together with re-exports represented 43% of the total export earnings for the first half of 2012. Other export products comprise a set of products, foodstuffs and other minerals, live animals among others while re-exports were mostly composed by petroleum products, vehicles and minerals.
Table 10: Export developments (Value in millions of USD, Volume in Tons)2010 2011 End June 2012 2012 proj.
Volume (tons)
Value (mios $)
Volume (tons)
Value (mios$)
Volume (tons)
Value (mios$)
Value (mios$)
Coffee 18235.85 56.08 15596.62 74.60 3436.45 12.14 76.63
Tea 21528.48 55.71 23732.19 63.90 11904.74 33.53 65.17
Minerals 5466.35 67.85 8848.38 151.43 3690.38 64.64 141.99
Other 117.64 174.31 137.29 183.14
Total exports 297.28 464.24 247.60 466.93
Source: BNR

35
Activities report January - June 2012
BNR
Tea and coffee
Tea exports performed poorly during the first half of 2012 in both value and volume, declining by 7.7% in value and 10.7% in volume, despite an increase of 3.3% in unit price from USD 2.73/Kg in the first half of 2011 to USD 2.82/Kg for the first half of 2012 following a decline of 7.3% in produc-tion due to adverse weather conditions.
Table 11: Major exports Developments (Value in USD million and volume in tons) 2007 2008 2009 2010 2011 End Jun-12 2012 proj.
Coffeevalue 35.67 47.05 37.29 56.08 74.60 12.14 76.63volume 13,673.86 18,191.29 14,992.36 18,235.85 15,596.62 3,436.45 22,000.00
Teavalue 31.52 44.95 48.24 55.71 63.90 33.53 65.17volume 18,375.62 19,828.02 18,689.30 21,528.48 23,732.19 11,904.74 26,000.00
Cassiterittevalue 31.97 41.25 28.58 42.21 96.82 27.20 99.15volume 4,565.91 4,193.29 4,269.17 3,874.20 6,952.07 2,320.40 8,000.00
Coltanvalue 19.23 36.03 20.24 18.48 38.58 23.73 27.16volume 968.96 1,190.33 949.92 748.72 890.08 544.82 700.00
Wolframvalue 19.42 13.41 5.76 7.10 16.03 13.71 15.68volume 2,686.11 1,708.04 874.45 843.42 1,006.24 825.17 1,100.00
Hides and skins
value 3.56 2.85 1.96 3.74 7.62 4.95 7.00volume 1,805.60 2,043.60 1,791.68 3,730.87 6,220.43 3,670.59 6425.71
Pyrethrumvalue 3.00 0.38 0.64 1.41 4.51 4.53 5.73volume 38.27 3.30 3.18 6.33 18.78 17.48 27.47
Other prod-ucts
value 32.32 85.80 49.26 69.66 85.61 75.45 88.44Total value 176.77 267.67 234.94 297.28 464.24 247.59 466.93
Source: BNR
With regard to coffee exports, they recorded good performance with an increase of 51.8% in vol-ume from 2,264 tons in the first half of 2011 to 3,436 tons in the first half of 2012.
This increase in volume has offset a decline of 2.4% in unit price from an average of USD 3.62/Kg in the first half of 2011 to an average of USD 3.53/Kg in first half of 2012, as the value increased by 48.0%.
Coffee exports remained dominated by ordinary coffee which volume dropped by 6.5% to 2,126 tons in the first half of 2012 from 1,997 tons in the first half of 2011, while the volume of fully washed coffee sharply increased by 60.0% from 461 tons in the first half of 2011 to 738 tons in the first half 2012. Despite gradual increase in the fully washed coffee production, its volume remained low with regard to the objective of transforming 85 percent of the total production into fully washed in 2012.
Minerals
Good performance observed since 2010 in mining sector has changed the trend in the first half of 2012. During the period under review, Rwanda’s mining exports declined by 0.6% in volume and by 4.5% in value declining from USD 67.7 million in the first half of 2011 to USD 64.6 million in the first half of 2012. This poor performance of the mining sector was mainly due to a fall in tin’s unit price which decreased by 25.9% from an average of USD 15.82/Kg to USD 11.72/Kg in the first half of 2012, while the unit price of coltan increased by 16.9% from an average of USD 37.27/Kg to USD 43.55/Kg in the first half of 2012 and wolfram rose by 27.0% from an average of USD 13.08/Kg to USD 16.61/Kg in the first half of 2012.

36
Activities report January - June 2012
BNR
In terms of volume, mineral exports remained dominated by tin which represented 62.9% of the total exports of minerals while wolfram and coltan came for 22.4% and 14.8% respectively. In terms of val-ues, tin export earnings declined by 41.8% to USD 27.2 million from USD 46.7 million, while coltan rose by 39.4% to USD 23.7 million from USD 17.0 million and wolfram by 245.3% to USD 13.7 million from USD 4.0 million in the first half of 2011.
Hides and Skins
Compared to the first half of 2011, hides and skins exports in 2012 recorded good performance with an increase of 54.9% in value driven by 36.7 percent increase in volume and 13.3% increase in unit prices. In total, 3,670.59 tons of skins and hides were exported at US 1.35/Kg comparing to 2,684.59 tons exported at USD 1.19/Kg in the first half of 2011.
Pyrethrum
During the first half of 2012, pyrethrum exports recorded a good performance with an increase of 38.0% in value from USD 3.28 million in the first half of 2011 to USD 4.53 million in the first half of 2012 following the high unit prices (+11.2%) rising from USD 233.1/Kg to USD 259.1/Kg. The volume of pyrethrum exports also rose by 24.1% from 14.08 tons to 17.48 tons in the first half of 2012, more than half of 20 tones which is the production projected by end 2012 due to strong emphasis on land consolidation, organized farmer cooperatives, prompt payment campaigns to farmers and quality improvement to maintain prices high through research and planting of selected seed varieties.
Non-traditional exports
Non-traditional exports, such as others exports recorded an increase of 64.6% in value and 63.4% in volume. Among non-traditional exports, cement exports value rose by 130.4% followed by livestock and mineral water and beer which increased by 84.8% and 55.1% respectively. Regarding the re-export products including cassiterite, coltan, wolfram, other minerals, petroleum products, machines and engines, vehicles mainly exported to the neighbouring countries incredibly performed better in both value and volume by 155.6% and 249.9%, respectively.
Table 12: Evolution of some non-traditional exports (in USD) 2010 2011 Jan.-Jun. 2011 Jan.-Jun. 2012 % ChangeLivestock 4,027,833 5,598,137 2,199,863 3,625,525 64.81Mineral water and Beer 3,459,978 6,030,028 2,512,694 3,898,021 55.13Footwear 1,654,939 1,611,652 755,611 675,283 -10.63Skin care products 1,484,112 1,483,744 791,165 929,394 17.47Edible vegetables, roots and tubers 1,615,309 2,756,318 1,775,023 1,787,842 0.72Cement 1,210,918 1,062,814 564,517 1,300,617 130.39Hand crafts 625,653 456,815 238,264 168,916 -29.11
Source: BNR

37
Activities report January - June 2012
BNR
Visit of the Governor at Inyange factory.
The external sector was also boosted by informal cross border trade which amounted to USD 51.04 millions of exports from USD 30.52 million in the first half of 2011 representing around 26.1% of formal exports. During the same period, the informal imports declined by 18.1% from USD 12.89 in the first half of 2011 to USD 10.48 million in the first half of 2012, leading to im-provement in Rwanda’s positive trade balance with neighboring countries (+USD 40.56 million). This informal cross border trade is dominated by crop products and live animals. The main trade partners are DRC and Uganda.
Table 13: Rwanda informal cross border trade (in USD millions)
2010 2011 2011 2012 2012Total Total Jan. Mar. Jun. Jan.- Jun Jan. Feb. Mar. Apr. May Jun. Jan.-Jun.
Exports 48.85 71.51 4.45 4.36 6.70 30.52 8.08 7.86 9.94 7.72 8.72 8.72 51.04Imports 35.17 23.51 1.62 1.60 4.62 12.89 1.33 1.40 1.97 1.68 2.03 2.07 10.48Trade balance 13.68 48.00 2.83 2.76 2.07 17.63 6.75 6.46 7.97 6.04 6.69 6.65 40.56
Source: BNR
A.2 Imports
For the first half of 2012, imports value CIF increased by 22.1% to USD 1,046.49 million after USD 857.09 million in the first half of 2011 and have been mostly dominated by intermediary goods which totalled 28.6% of the total imports value, followed by capital goods with 28.1%, consumer goods with 26.6%, while energy products represented 16.7% of the total imports value. With regard to unit value, all categories of imports recorded price increase, 42.3% for capital goods, 24.4% for inter-mediary goods, 6.1% for consumer goods and 18.5% for energy products. In terms of volume, total imports increased by 23.9% during the period under review pushed up by increase of 23.0%, 35.8% and 27.4% of consumer goods, capital goods and intermediary goods respectively.

38
Activities report January - June 2012
BNR
Fig 3: Structure of imports developments (value in US million)
Source: BNR
Capital goods
Capital goods imports were rising in both value and volume in line with dynamic activities which occasioned higher demand for capital goods. In the first half of 2012, capital goods rose by 42.3% in value to USD 293.76 million from USD 206.40 million in the first half of 2011. In volume, they increased by 35.8% while their unit price went up by 4.8%.
Capital goods imports were mainly dominated by machines, devices and tools whose share was around 28.1% of the total value of imports and 4.2% of the total volume of imports, increased highly in both value and volume, respectively by 42.3% and 35.8%. Imports of transport materials increased by 58.1% in value mainly triggered by buses (+486.2%), vans (+110.1%), while ma-chines, devices and tools also recorded a high increase of 66.3%.
Intermediary goods
Driven by higher domestic demand of their main components such as construction materials and indus-trial products; the imports of intermediary goods in the first half of 2012 represented 28.6% of the total value imports and increased by 27.4% in volume and by 24.4% in value to USD 299.11 million after USD 240.48 million in the corresponding period of 2011. Construction materials which accounted for 36.3% of total value imports of intermediary goods increased by 29.9% in value and by 26.7% in volume of which a big part is attributed to metallic construction materials, cement and other similar products which increased by 32.3% and 25.2% respectively. Industrial products which represented 45.4% of total value imports of intermediary goods increased by 17.9% in value and by 36.7% in volume, largely attributed to metallic industries (+78.7%, chemicals industries (+43.3%) and foods products (+36.6%). However, import of fertilizers declined in both value and volume by 9.7% and 17.7% respectively.

39
Activities report January - June 2012
BNR
Final consumer goods
Imports value of final consumer goods which account for 26.6% of the total value imports increased in both volume and value, respectively by 23.0% from 201,573.45 tonnes to 247,891.73 tonnes in the first half of 2012, and by 6.1% from USD 262.63 million in the first half of 2011 to USD 278.72 million in the first half of 2012; drawn by the increase in value of beverages and tobacco (75.5%), article of clothings (+56.4%) and food products (20.2%), despite the decline in health and care (-21.0%), domestic use (-1.9%) and papers and cartons (-40.0%).
Food products occupied a lion’s share with 40.2% of the total value of consumer goods and they increased in value and volume, respectively by 20.2% and 22.8%. Those developments were attrib-uted to sugar and sweets (+48.0%), various food preparations (+31.3%), salt (+26.3%), meat & fish (+23.0%) and cereal, fats & oil (+7.8%).
Health and care which account for 19.6% share of total value of consumer goods increased by 10.7% in volume, while declined by 21.0% in value as a result of pharmaceutical products which de-clined by 33.6% in value and 38.7% in volume. Imports of goods for domestic use rose by 15.9% in volume, and declined by 1.9% in value, due mainly due to lower imports of beddings which declined by 38.1% in value and by 1.7% in volume.
Energy and lubricants
The imports of energy and lubricants (of which 95% are petroleum products) increased by 18.5% in value to USD 174.90 million and by 13.8% in volume due to the higher oil prices and increasing domestic demand.
Table 14: Evolution of imports CIF adjusted (value in USD million)
Import category 2007 2008 2009 2010 2011End Jun-
20122012 Proj.
Capital goods 202.53 367.29 372.40 357.56 465.35 293.76 765.62Intermediates goods 189.91 323.87 332.46 381.97 526.55 299.11 567.7Energy 115.65 161.49 177.97 210.84 345.57 174.90 406.38Consumer goods 229.1 284.08 363.99 439.01 553.11 278.72 543.37Other 33.46 37.24 61.64 41.66 -325.18 -158.92 -503.05Total 770.65 1,173.98 1,308.46 1,431.04 1,565.40 887.57 1,780.02
Source: BNR
A.3. Trade with EAC countries
Rwanda’s total trade with EAC partner states recorded a significant expansion in both imports and exports. The total trade volume with EAC recorded an increase of 13.1% in the first half of 2012 totaling USD 454.60 million from USD 402.01 million in the first half of 2011, driven mainly by im-ports, indicating that Rwanda is a net importer in the EAC region.

40
Activities report January - June 2012
BNR
Rwanda’s main exports to EAC countries in the first half of 2012 were flavored or non-flavored tea, raw hides of bovine, roasted or non-roasted coffee, bars and rods of iron or non-alloy steel, vegetables and beer. On the other hand, major imports from EAC countries are cement, fertilizers, clothing, fats & oils and sugar, among others.
Fig 4: Evolution of Rwanda’s trade with EAC (in USD million)
Source: BNR
B. BALANCE OF SERVICES AND INCOME
Coming to the balance of services and income, both income and services accounts continued to re-cord deficit totalling USD 146.06 million for the first half of the year 2012 while the deficit was USD 242.54 million by end December 2011 and against USD 329.92 projected for the whole year 2012. This deficit was mainly attributed to the services account which came negative to USD 106.18 million while the income deficit stood at USD 39.88 million representing respectively 73% and 27% the overall income and services account (net).
With regard to the services account, inflows came mostly from tourism receipts (USD 128.30 million) and other services income (USD 46.13 million) including operating costs of embassies, posts and tel-ecommunication and ICT receipts. On the debit side, freight & insurance and other transportation cost amounted to USD 247.57 million while travel and other services came for only USD 66.18 million ( 79% and 21% respectively of the total service outflows).

41
Activities report January - June 2012
BNR
Table 15: Evolution of Services and Incomes (in USD million)2007 2008 2009 2010 2011 End June
2012 2012 Proj.Services (net) -123.16 -100.60 -181.62 -246.22 -187.85 -106.18 -256.09
Credit/Inflows 240.63 419.86 341.05 310.36 430.55 207.58 429.87Freight and insurance 5.23 5.15 4.61 4.77 3.38 1.71 3.70Other transportation 24.58 37.74 49.04 21.68 45.64 31.44 47.15Travel 151.63 186.00 174.46 201.65 251.80 128.30 276.00Others services 59.19 190.97 112.94 82.26 129.73 46.13 103.02
Debit/Outflows -363.79 -520.46 -522.66 -556.57 -618.41 -313.76 -685.96Freight and insurance -134.53 -208.21 -246.05 -293.68 -352.25 -209.61 -396.74Other transportation -50.50 -75.75 -76.03 -43.19 -52.96 -37.96 -57.04Travel -46.66 -69.99 -71.83 -77.01 -89.19 -29.54 -96.06Others services -30.55 -41.91 -34.35 -28.36 -35.62 -36.64 -38.37
Income (net) -17.22 -35.06 -36.79 -45.85 -54.69 -39.88 -73.83Credit/Receipts 25.44 28.27 14.91 12.81 17.17 2.67 10.07
Investment income 21.35 23.72 10.42 7.86 12.01 0.00 4.74Labour services income 4.09 4.49 4.49 4.94 5.14 2.65 5.31Property income 0.00 0.05 0.00 0.01 0.02 0.02 0.02
Debit/Payments -42.66 -63.33 -51.71 -58.65 -71.86 -42.56 -83.90Income on direct investments -9.29 -16.42 -4.66 -3.74 -12.10 -0.38 -6.68Income on others investments -7.33 -7.74 -9.41 -11.97 -13.07 -8.34 -26.93Labour services Income -25.50 -37.95 -36.40 -42.92 -46.69 -32.98 -50.29Property income -0.54 -1.23 -1.23 -0.02 0.00 -0.85 0.00Services and Revenues (nets) -140.38 -135.67 -218.41 -292.06 -242.54 -146.06 -329.92
Source: BNR
Back to income balance, for the first half of 2012, the deficit stood at USD 39.88 million reflecting mostly payment of labour services (USD 32.98 million) and on investments other than the direct investments totalling USD 8.34 million of which USD 3.85 million of interest payments on external public debt. With regard to income inflows, USD 2.65 million was recorded as remuneration of national labour force.
C. CURRENT TRANSFERS
With regard to current transfers, available data showed that net current transfers inflows amounted to USD 287.09 million for the first six months of the year 2012, amount too far away from net cur-rent transfers by December 2011 (33% share) and from projections of 2012 (31% share). Current transfers were dominated by official transfers around 73% of the total by end June 2012 while private transfers came for 27%. Around 64% of the private transfers were made of remittances from dias-pora i.e USD 50.15 million over USD 77.83 million of total private transfers against USD 27.69 million that were received from churches and other associations.
Table 16: Net Current Transfers (in USD million) 2007 2008 2009 2010 2011 End Jun-12 2012 Proj.
Current transfers (net) 461.32 518.57 604.02 657.36 880.57 287.09 939.34
Current private transfers (net) 98.82 72.61 79.71 90.68 133.31 77.83 134.89
Remittances from Diaspora (net) 69.48 31.07 53.09 65.07 110.17 50.15 111.35
Churches and associations 29.34 41.54 26.62 25.61 23.14 27.69 23.55
Current officials transfers (net) 362.50 445.96 524.31 566.68 747.25 209.25 804.45
Current support net 259.27 339.76 415.84 479.52 628.39 167.11 705.05
Humanitarian aid 107.11 110.32 115.84 100.52 107.03 50.12 110.56
Source: BNR

42
Activities report January - June 2012
BNR
Official current transfers which remained predominant in net current transfers amounted to USD 209.25 million of which USD 167.11 million were for the budget support the remaining USD 50.12 million were for humanitarian aid.
D. CAPITAL AND FINANCIAL OPERATIONS ACCOUNT
By end June, the total capital and financial account totalled USD 272.43 million against USD 692.31 million projected for the whole year 2012. This amount was not enough to cover the deficit in current account which stood at USD 498.95 million. Therefore the overall balance of payments stood negative to USD 195.50 million after a surplus of USD 235.54 million in 2011. Coming to capital transfers, they amounted to USD 94.94 million representing 46% of the projections for the whole year 2012 and 48% of the amount recorded in 2011. They were mostly allocated to projects support (USD 93.58 million) against USD 177.65 million received the previous year.
For the first half of the year, financial inflows were at USD 177.49 million i.e around 37% of the total amount of 2011 and 37% of projections in 2012. Estimates showed that long term capital stood at USD 107.32 million while short term counted only USD 70.18 million. For the first half of the year 2012, pri-vate capital (net) took a lion’s share of net long term capital coming to USD 70.18 million while the long term public capital stood at USD 35.59 million. The foreign direct investment which is a part of private long term capital came for USD 24.53 million representing only around 18% of the total received in 2011 and about 14% of the projections for 2012.
Table 17: Evolution of capital and financial account (in USD million)
2007 2008 2009 2010 2011 End June-12 2012 Proj.
Capital and Financial account balance 196.70 316.12 426.80 499.36 682.51 272.43 692.31
Capital Account 92.04 210.06 200.00 285.64 196.66 94.94 206.33Capital transfers 92.04 210.06 200.00 285.64 196.66 94.94 206.33Financial transactions account 104.67 106.06 226.80 213.72 485.85 177.49 485.98Long Term capital 161.80 194.69 235.29 232.35 438.34 107.32 492.74Public sector capital (LT) (net) 80.36 104.75 81.35 51.90 207.22 35.59 169.67Disbursement 88.66 112.20 88.80 61.71 222.21 42.34 192.16Amortization -8.30 -7.45 -7.45 -9.81 -14.99 -6.75 -22.49Private (net) 81.43 89.94 153.94 180.45 231.12 71.73 323.07Disbursement 3.4 9.5 42.72 129.02 148.78 73.93 216.980Amortization -4.2 -4.1 -7.450 -12.289 -55.157 -26.738 -75.283Investments 82.28 84.56 118.67 63.71 137.50 24.53 181.370Other capital -57.13 -88.63 -8.49 -18.63 47.51 70.18 -6.76
Source: BNR
Short term capital were fully constituted by decline in net foreign assets of commercial banks and were estimated at USD 70.18 million largely higher than the gain of USD 2.49 million recorded by end 2011.

43
Activities report January - June 2012
BNR
III.3.2 External Debt
1. Public External Debt
The public external debt situation of Rwanda in the first half of 2012 was mostly composed of loans from Multilateral Institutions, such as World Bank, African Development Bank and IMF, and represented 83.8% of total public external debt. The remaining 16.2% were from bilateral partners.
Table 18: Stock of External Public debt (in USD million) CREDITOR 2007 2008 2009 2010 2011 Jan. - June 20121. MULTILATERAL 485.66 580.53 628.26 651.14 832.99 841.66ADB-ADF 102.16 135.49 157.88 172.59 210.62 213.33BADEA 25.44 25.77 26.49 29.33 34.03 33.56EIB 14.48 11.39 8.9 6.39 5.03 3.66EU 20.67 18.78 17.82 15.25 13.89 12.9IFAD 85.96 92.61 99.74 103.05 107.07 107.58IMF 8.1 11.47 15.19 14.82 14.13 13.59IDA 205.3 240.38 253.3 258.25 391.55 401.11NDF 2.08 12.71 16.54 16.4 16.08 15.33OPEC 21.47 31.92 32.4 35.08 40.57 40.382. BILATERAL 84.19 85.2 108.34 115.45 151.66 163.02AFD 4.92 4.74 4.79 3.66 2.12 1.36CHINA 0,00 0,00 0,00 0,00 0 0EXIMCHINA 0 0 6.17 10.36 28.6 30.7EXIMINDIA 0 0 16,00 18.5 28.65 39.55Abu Dhabi 1.85 1.85 1.85 1.85 2.99 2.99Kuwait Fund 34.49 34.22 34.63 35.52 44.68 44.48Saudi Fund 42.58 44.04 44.54 45.22 44.28 44.59LIBYA 0.36 0.35 0.36 0.35 0.35 0.34TOTAL 569.85 665.73 736.6 766.59 984.65 1004.68% of GDP 15.2 14.4 14.2 14 15.57
Source: BNR
A. PUBLIC EXTERNAL DEBT STOCK
Regarding the borrowing currencies, Rwanda’s total external debt is dominated by SDR with a share of 52.0% at end of the first half of 2012 against 52.1% at end of December 2011, followed by the US dollar with 18.1%, and Euro with the share of 11.4% at end of the first half of 2012 against 12.0% at end of December 2011.
Table 19: Structure of external public debt by currency of borrowings (in USD million) 2007 2008 2009 2010 2011 Jan.-June 2012
Currency Amount % total Amount %
total Amount % total Amount %
total Amount % total Amount %
totalSDR 299.4 52.5 344.5 52.5 354.6 48.1 376.1 49.1 512.7 52.1 522.3 52.0EUR 106.1 18.6 124.5 18.6 126.1 17.1 113.8 14.8 118.3 12.0 114.3 11.4USD 66.6 39.9 83.6 39.9 107.6 14.6 125.0 16.3 171.1 17.4 181.5 18.1Others 97.8 17.2 113.1 17.0 148.3 20.1 151.7 19.8 182.6 18.5 186.6 18.6Total 569.8 100.0 665.7 100.0 736.6 100.0 766.6 100.0 984.7 100.0 1,004.7 100.0
Source: BNR

44
Activities report January - June 2012
BNR
B. EXTERNAL PUBLIC DEBT DISBURSEMENTS
The total disbursements stood at USD 42.3 million at end of the first half of 2012 against USD 222.2 million at end of December 2011. The share of disbursements on multilateral creditors was the most important representing 69% of the total disbursements observed in the first half of 2012, mainly from IDA and FAD-FSN with respective shares of 67.6% and 26.6% of multilateral disbursements. While in the same period, the share of bilateral creditors was around 31% of the total disbursements.
Table 20: Development of disbursements (in USD million)2007 2008 2009 2010 2011 Jan - June 2012
MULTILATERAL CREDITORS 79.4 110.6 51.2 43.34 197.5 29.28Of which : IDA 27.6 40.5 10.49 10.1 138.2 19.8FAD-FSN 26.2 32.08 22.6 16.03 39 7.79BILATERAL CREDITORS 9.1 1.7 24.7 7.3 24.8 13.28TOTAL 88.5 112.3 75.9 50.7 222.2 42.38Of Which :Drawings for projects 84.1 106.5 71.8 50.7 186.7 42.38Drawings for budget support 1.0 2.07 0.5 0 35.5 0Drawings for BOP support (IMF) 3.4 3.72 3.6 0 0 0
Source: BNR
C. PUBLIC EXTERNAL DEBT SERVICING
External debt services are dominated by multilateral debt and represented 80.3% at end of the first half of 2012 against 81.4% at end of December 2011. The bilateral debt service represented 19.7% of the total external debt services at the end of the first half of 2012.
Table 21: Developments of external debt service (in USD million)2005 2006 2007 2008 2009 2010 2011 Jan.-June 2012
MULTILATERAL DONORS 40.6 31.4 11.3 12.9 12.7 14.9 19.3 10.6Principal 30.1 21.2 6.2 7.2 7.3 8.8 13.3 7.5Of which : IDA 15.2 9.3 0.0 0.0 0.0 0.5 2.4 1.4FAD-FSN 7.2 5.6 0.8 0.7 1.1 1.2 1.7 0.9BADEA 3.5 0.0 0.0 0.0 0.0 0.0 1.0 0.5Interests 10.5 10.2 5.0 5.7 5.4 6.2 4.4 3.1Of which : IDA 8.0 5.0 1.5 1.7 1.6 1.9 2.3 1.2FAD-FSN 0.8 3.1 1.3 1.6 1.5 1.6 1.6 0.9BADEA 0.6 1.0 0.9 0.9 0.4 0.9 0.0 0.0BILATERAL DONORS 9.1 2.7 1.3 1.4 1.8 2.9 4.4 2.6Principal 6.2 1.7 0.3 0.3 0.3 1.2 2.3 1.3Interests 2.9 1.0 1.1 1.2 1.6 1.7 2.2 1.3SUPPLIERS’CREDITS 0.7 0.0 0.0 0.0 0.0 0.0 0.0 0.0Principal 0.0 0.0 0.0 0.0 0.0 0.0 0.0 0.0Interests 0.7 0.0 0.0 0.0 0.0 0.0 0.0 0.0TOTAL 50.5 34.1 12.6 14.3 14.5 17.8 23.7 13.2Principal 36.3 22.9 6.5 7.5 7.5 10.0 15.6 8.9Interests 14.2 11.2 6.1 6.9 7.0 7.9 8.1 4.3
Source: BNR

45
Activities report January - June 2012
BNR
2. PRIVATE EXTERNAL DEBT
The Private external debt is a debt contracted with non-resident private sector by private resident of Rwanda with or without Government guarantees. Compared to public external debt, the private debt remains low. Nevertheless, it begins to grow with the privatization of public enterprises and the liberalization of capital account allowing private sector to borrow from foreign creditors. These last years, private external debt is dominated by long term borrowing.
At the end the first half of 2012, the total stock of the private external debt reached an amount of USD 58.0 million which concern only non-guaranteed external private debt.
III.4 PUBLIC FINANCE AND DOMESTIC DEBT
III.4.1 Public Finance Developments
The Government finances were marked by an increase in total revenues and grants (+14.9 per-cent) accounting for 21.8 percent of GDP in the first half of 2012 compared to 22.2 percent of GDP in the corresponding period of 2011. The overall fiscal deficit including grants worsened to 7.7 percent of GDP from 6.3 percent of GDP on account of high government spending.
Table 22: Government Financial Operations (in Percentage of GDP)
2009 2010 20112011 2012
Q1 Q2 Q1 + Q2 Q1 Q2 Q1 + Q2
Revenues and grants 24.3 25.2 26.3 18.1 26.0 22.2 19.3 24.3 21.8
Domestic revenues 12.7 13.1 14.5 14.4 14.5 14.4 14.7 14.9 14.8
Tax revenues 12.2 12.6 13.5 14.0 13.7 13.8 14.3 14.4 14.3
Non tax revenues 0.6 0.6 1.0 0.5 0.8 0.6 0.3 0.6 0.4
Grants 11.6 12.1 11.8 3.6 11.5 7.7 4.6 9.4 7.0
Total Expenditure and net lending 24.0 26.8 26.4 28.1 28.8 28.4 27.4 31.6 29.5
Total Expenditure 24.0 25.9 27.0 29.1 28.5 28.8 26.5 30.8 28.7
Current expenditure 14.2 15.3 15.2 14.1 16.2 15.2 15.0 15.5 15.2
Capital expenditure 9.9 10.7 11.8 15.0 12.3 13.6 11.6 15.4 13.5
Currentdeficit -1.5 -2.1 -0.7 0.3 -1.7 -0.8 -0.3 -0.5 -0.4
Overalldeficit,includinggrants -0.8 -1.6 -0.1 -10.0 -2.8 -6.3 -8.1 -7.3 -7.7
Overalldeficit,excludinggrants -12.4 -13.7 -11.9 -13.6 -14.3 -14.0 -12.7 -16.7 -14.7
Overalldeficit(cashbasis)Overalldeficit,excludinggrants -2.0 -7.1 -6.0 -6.5 -9.7 -6.4 -8.0
Nominal GDP 2 985.0 3 279.8 3 828.3 863.1 919.9 1 783.0 1 009.9 1 068.1 2 078.0
Source: MINECOFIN

46
Activities report January - June 2012
BNR
III.4.1.1 Government Revenues
Government revenues realized represent 14.7 percent of GDP in the first half of 2012, which rose by 19.5 percent against the same period of 2011. The increase in total domestic revenues largely emanated from tax revenue sources which held a share of 59.1 percent to the overall domestic revenues.
Tax revenues account for 14.3 percent of GDP in the first half of 2012 and their collection per-formed well in line with the consecutive upward trend in growth of GDP. The increase was marked by improvements in their major components, of which direct taxes (30.2 percent), taxes on interna-tional trade (26.6 percent), and taxes on goods and services (13.3 percent). The improvement was enabled by the increase in volume of imported goods, upgrade in sensitization campaigns and cooperation with the private sector actors to track down non-compliant tax payers, implementation of e-system as well as Rwanda e-regulations among others.
Non tax revenues which represent only 0.4 percent of GDP stood at Rwf 9.2 billion in the first half of 2012 compared to 0.6 percent of GDP in the corresponding period of 2011.
The total grants which account for 7.0 percent of GDP were above the corresponding period in 2011, and these were made up of budgetary grants and capital grants.
III. 4.1.2 Public expenditure
During the first half of 2012, the total expenditure and net lending account for 29.5 percent of GDP compared to 28.8 percent of GDP in the first half of 2011. The share of total expenditure to nominal GPD was 28.7 percent compared to 28.5 percent in the corresponding period of the previous year.
Current expenditure which represents 15.2 percent of GDP rose by 16.4 percent as compared with the first half of 2011, of which exceptional expenditure (35.2 percent), wages and salaries (23.2 percent), purchase of goods and services (20.8 percent), interest payments (9.4 percent), and transfers and subsides (5.0 percent). The ratio of total capital expenditure to nominal GDP was 13.5 percent, and RWF 127.1 billion represented domestically financed payments while RWF 154.0 billion was in respect of foreign financed.
The ratio of the overall deficit including grants to nominal GDP was 7.7 percent, while that of the overall deficit excluding grants was 14.7 percent. On cash basis, the overall deficit accounting for 8.0 perecent of GDP compared to 6.5 percent in the first half of 2011. This deficit was financed mainly by foreign borrowing in-form of project loans.
III.4.2 Domestic Debt Developments
The stock of domestic debt at the end of the first half of 2012 increased by compare to end December 2011.

47
Activities report January - June 2012
BNR
The central bank’s holdings continued to yield the lion’s share as the leading creditor of the Government fiscal deficit financing.
Box 2
• Rwanda Real GDP growth 2012 projected at 7.7% (projection)• Rwanda Exports value increase (end June): 25.1%• Rwanda Imports value increase (end June): 22.1% • Rwand Imports cover (end June):18.7%• Rwanda BOP deficit(end June): USD 195.50 million

48
Activities report January - June 2012
BNR

49
Activities report January - June 2012
BNR
MONETARY SECTOR DEVELOPMENTS
CHAPTER IV

50
Activities report January - June 2012
BNR
IV.1. Monetary and Exchange Rate Policy
During the first half of 2012, the National Bank of Rwanda has been implementing a tight monetary policy to avoid risks of exacerbation of inflationary pressures while continuing to support the fi-nancing of the economy. In response to rising inflation and persistent uncertainties in international and regional environment, the BNR Monetary Policy Committee raised the Central Bank policy rate from 7.0% in November 2011 to 7.5% in May 2012.
With regard to exchange rate policy, the BNR continued to maintain a flexible exchange rate re-gime, regularly intervening on the domestic foreign exchange market by selling foreign exchange to banks to smoothen the FRW exchange rate volatility. During the first half of 2012, the Rwanda franc remained quite stable; depreciating by 1.37% against the US dollar, the most used foreign currency in transactions with trading partners.
IV.2. Money Supply and Demand
From December 2011 to June 2012, broad money M3 increased by 12.5% against 16.9% in the same period of 2011 and 17% projected for the whole year 2012. This increase was driven by a signifi-cant growth in net domestic assets (230.9%) resulting from an increase in net credit to government (+76.7%) and credit to the private sector (+18.1%) whereas Net foreign assets declined by 23% due to a high increase of 70% in BNR sales of foreign exchange to commercial banks and moderate increase of 1.4% of government spending in foreign currency.
Table 23: Monetary aggregates development (in FRW billion, at end of period)2011 2012 Change (%)
Mar. Jun. Sept. Dec. Mar. Jun. Dec-10/Jun-11
Dec-11/Jun-12
Net foreign assets 464.4 485.3 520.0 671.2 579.7 516.5 -6.5 -23.0Net domestic assets 162.0 227.3 201.8 109.4 235.4 362.1 134.4 230.9 Domestic credit 323.4 400.9 379.3 288.0 417.7 550.6 49.5 91.2Central government (net) -98.6 -48.2 -114.6 -223.6 -138.5 -52.0 63.3 76.7 Public enterprises 1.1 2.6 4.4 2.8 2.1 2.6 -17.7 -8.0 Private sector 421.4 447.0 490.3 509.8 555.6 602.2 12.6 18.1Other items net (Assets: +) -161.4 -173.5 -177.5 -178.5 -182.3 -188.5 -1.4 -5.6Broad money M3 626.5 720.2 721.8 780.7 815.1 878.6 16.9 12.5 Currency in circulation 83.9 101.5 93.4 102.8 99.3 111.6 12.2 8.6 Deposits 542.5 618.6 628.4 678.0 715.9 769.8 17.7 13.6
Source: BNR
In the first half of 2012, the credit to the private sector increased by 18.1% and new authorized loans stood at FRW 237.3 billion against FRW 140.7 billion in the first half of 2011, which is an increase of 68.6%.
Considering distribution of credit to private sector by economic activities, loans extended by the banking sector largely benefited the mortgage industries (26.8%), commerce and hotel (31.5%) and non-classified activities (15.4%) which comprise mainly loans to consumption (salary advances, overdraft to individuals, etc.). The share of loans to primary agriculture, manufacturing, transport and warehousing were relatively low, representing 5.5%, 6.3% and 8.8% respectively. Regarding the agriculture and related activities, the share of loans represented 9.3% in the first half of 2012.

51
Activities report January - June 2012
BNR
Regarding money demand, from December 2011 to June 2012, both currency in circulation and deposits in banking system kept on trending upward as was observed in the same period of 2011 even if the increase in first semester of 2012 was relatively lower. Currency in circulation grew by 8.6% in first half of 2012 compared to 12.2% in the same period of 2011 due to less demand for cash to finance coffee season as the prices to farmers have significantly declined from FRW 350 per kg in 2011 to FRW 220 in 2012. In 2012, about FRW 15.7 billion has been injected to finance coffee season against RWF 18.1 billion in 2011.
In addition, as the use of mobile payment system and the development of POS in Rwanda and re-lated distribution channels underwent important changes since 2005, the ongoing modernization of payment systems reduces progressively the currency in circulation.
Furthermore, deposits with the banking system also recorded an increase of 13.6% against 17.7% in 2011 as demand deposits gained more increasing by 19.1% and time deposits by 15.0% while foreign currency deposits declined by 0.7%. As shown in the table below, households and non-profit institutions saving households (NPISH) have the largest share in total deposits, while it de-clined from 57.3% in the first half of 2011 to 52.8% in the period under review.
Table 24: Change in deposits by institutional sectors (in million RWF unless otherwise indicated)
Jan.- Jun. 2011 Jan.- Jun. 2012% changes
Amount Shares in % Amount Shares in %Otherfinancialinstitutions 143354.1 5.2 327386.1 9.2 128.4Social Security Funds 250770.7 9.2 385034.6 10.8 53.5Public enterprises 111656.1 4.1 125700.4 3.5 12.6Othernon-financialcorporations 661997 24.2 841017.5 23.6 27.0Households and NPISH 1568239.5 57.3 1880745.8 52.8 19.9Total 2736017.4 100.0 3559884.4 100.0 30.1
Source: BNR
IV.3. Banking System Liquidity Conditions
The banking system liquidity continued to improve during the first half of 2012 and BNR has inter-vened frequently to manage liquidity through REPO operations and issuance of treasury bills to meet the reserve money targets.
By end of June 2012, total outstanding liquidity resulting from mopping up operations amounted to FRW 215 billion compared to FRW 160.8 billion by end December 2011, treasury bills accounting for 53.3% against 46.6% for Repos. Besides, outstanding Government long term deposit facility reached FRW 22.3 billion by end June 2012 against FRW 20.6 billion by end December 2011 and was used to finance especially mortgages and equipment with 52% and 36% respectively.
Within the framework of developing the capital market, BNR issued Government Treasury Bonds and by end June 2012, the total Bonds listed on Rwanda Stock Exchange amounted to FRW 12.50 billion.

52
Activities report January - June 2012
BNR
Fig. 5: Outstanding amount of BNR and Government securities (RWF billion)
23.25
91.37
12.5
100.4
22.4
Monetary T-Bills
Fiscal T-bills
T-Bonds
Repos
Gvt Facility
Source: BNR
Regarding the interbank market development in the first semester 2012, a significant decrease of 95% has been recorded in the total volume transacted. It stood at 14.38 billion RWF end June 2012 from 294.88 billion in end June 2011. This trend was driven by comfortable liquidity conditions in al-most banking system leading to more investment in money market instruments as mentioned above.
IV.4. Interest Rate Developments
Over the course of the first half of 2012, short-term interest rates increased slightly and adjusted to the change in Policy Rate in May 2012 from 7 to 7.5%. Repo, T-bills and interbank weighted average interest rates moved to 7.4%; 9.3% and 9.0% respectively from 6.4%; 7.6% and 7.3% in January 2012. That transmission facilitated the Central Bank to more efficiently manage the liquid-ity in the banking system.
Table 25: Interest rates (in percentage)
2011 2012
Mar. Jun. Sept. Dec. Jan. Feb. Mar. Apr. May Jun.BNR Policy RatesKey Repo Rate 6.0 6.0 6.0 7.0 7.0 7.0 7.0 7.0 7.5 7.5Discount Rate 10.0 10.0 10.0 11.0 11.0 11.0 11.0 11.0 11.5 11.5Money Market RatesRepo rate 6.0 6.0 6.0 6.5 6.4 6.0 6.9 6.9 7.4 7.4RefinancingFacilityRate 7.5 9.0 9.5 8.5 8.5 9.5 9.5 10.0 9.5 10.1Treasury Bills Rate 7.2 6.8 6.7 7.6 7.6 7.6 7.7 7.9 8.3 9.3Commercial Banks RatesInterbank Rate 6.7 7.0 6.9 8.1 7.3 6.9 7.7 8.0 8.6 9.0Deposit Rate 7.5 8.0 6.5 8.0 7.4 8.3 8.2 8.1 9.9 7.9Lending Rate 16.6 17.0 17.0 16.7 16.9 16.7 16.3 16.9 16.7 16.8
Source: BNR
Over the period under review, the commercial banks average lending rates have stabilized between 16.7% and 16.9% while deposits rate have been fluctuating between 7.4% in January and 7.9% in June 2012, but with a clear upward trend observed since September 2011. This trend is an indication of improving competition in the banking system, especially with the licensing of two regional banks as well as two big microfinance institutions which have been upgraded to microfinance banks).

53
Activities report January - June 2012
BNR
IV.5. Exchange Rate Developments
Regarding the exchange rate policy, BNR kept the RWF exchange rate fundamentally market driv-en. It continued to intervene on the domestic foreign exchange market by selling foreign exchange to banks to smoothen the RWF exchange rate volatility depending on the volume of foreign exchange reserves available.
As a result, the Rwandan franc depicted a relatively stable performance against the major inter-national currencies during the six months of 2012. It moderately depreciated against the USD by 1.4% trading between RWF 604.14 end-December 2011 and 612.43 end-June 2012 per dollar. However, this moderate depreciation recorded against USD in the first half of 2012 is relatively high compared with total depreciation of 1.6% over the whole of last year. It was due to the higher-than expected increase in forex demand to finance important imports of goods especially in the second quarter of 2012.
In the first half of 2012, RWF also edged down by 2.5% against the GBP while it appreciated by 2.1% versus the EURO. In the East African region, RWF depreciated against Uganda, Kenya and Tanzania shillings by 1.61%, 2.46% and 1.96% respectively following rapid appreciation of these currencies against USD to offset a strong depreciation recorded last year. On the other hand, RWF appreciated by 5.32% against Burundian franc.
Facing higher demand for forex in the first half of 2012, the Bank managed to keep the external stability of local currency through interventions on forex exchange market. Thus, the sales to commercial banks increased by 71% and reach USD 228.5 million in the first half of 2012 versus USD 134.1 million during the same period in 2011.
Overall, the real effective exchange rate appreciated by 1.6% between February and June 2012, resulting mainly from narrowing inflation differential vis-à-vis major sub-regional trade partners.
Fig. 6: Real effective exchange rate with ten major trading partner countries, June 2012
Source: BNR

54
Activities report January - June 2012
BNR
IV.6. Reserves Management
At the end of June 2012, the level of reserves was at 5 months of import cover. Most of the Bank’s reserves are externally managed, but the Bank initiated an internally managed portfolio since August 2011. The capacity building for the personnel involved in reserves management has been provided by the external Fund Managers including the RAMP, a reserves advisory and management pro-gramme of the World Bank, through mentoring and workshops. Areas covered include investment, risk management and settlement of foreign exchange operations. Currently the internally managed portfolio is done through indexation whereby a portfolio is rebalanced every month in order to match the return and risk characteristics of the chosen index. BNR will soon switch from pure indexation to enhanced indexation and after acquiring appropriate skills and techniques active management will be the next milestone.
The overall performance of the reserves for the first semester of the year 2012 was 0.39% com-pared to 0.40% and 0.36% for the first and second semesters of 2011 respectively. This perfor-mance was mostly driven by our investment portfolio invested in US Treasury bonds as the later were considered to be safer in the context of the Eurozone sovereign crisis.
For the period from January to June 2012, interest rates on money market were kept low by mon-etary authorities in emerging and advanced economies for the purpose of encouraging borrowing and spending. Federal Reserve Bank and Bank of England kept their interest rates at 0.25% and 0.50% respectively. Similarly, the European Central Bank was expected to cut the key rate by 25 basis points to 0.75%. Also, other monetary tools like quantitative easing and longer term refinanc-ing operations continued to be created to improve investor sentiments.
Following the global economic crisis and Euro zone sovereign debt crisis, most of the banks have been downgraded including many of our counterparts. Given the existing market environment and the importance of maintaining certain relationships, investment guidelines were reviewed to accom-modate counterparts with minimum credit rating of A- (the minimum used to be AA-) provided that the combined holdings are AAA rated.
IV.7 Communication Strategy
To further build and shape market expectations, the BNR continued to enhance its communication strategy by exchanging information with all stakeholders, with a particular focus on financial institu-tions and the business community. In addition to the biannual Monetary Policy and Financial Stabil-ity Statement, the communication strategy has been enhanced by a financial services awareness program for investors and consumers.

55
Activities report January - June 2012
BNR
Press conference at BNR headquarter.
Specifically, it has been highlighted different modes of access to finance as well as different non-cash financial instruments notably the mobile banking, the Automated Teller Machines (ATMs), the Point of Sale (POS), the telephone banking and the internet banking.
In providing the public with the skills, knowledge and information, this program contributes to im-proving the monetary policy transmission mechanism.
IV.8. Research to Support Monetary Policy Management
The year 2012 began with economic uncertainties mainly originating from hovering debt crisis in European countries and USA and surging oil prices in international markets. The Bank embarked on close monitoring and research on global and regional economic development to make appro-priate monetary policy decisions.
Down ward and upward risks were considered in short-term and medium term inflation forecast, this gave a clear guidance to monetary policy orientation.
The Bank has been relying on short-term univariate models to forecast inflation and other mon-etary aggregates. To extend the forecast horizons of its key monetary policy variables, jointly with International Growth Center (IGC), the Bank has embarked on building a small-macro model, which will be used in medium and long-term inflation forecasting as well as conducting policy simulations for monetary policy considerations. In this regard, a number of research papers were conducted as an in-put to the macro-model, these include; Inflation dynamics, Money demand and the transmission channels of monetary policy in Rwanda.

56
Activities report January - June 2012
BNR
Box 3
• Rwanda Inflation rate (June):5.92% • BNR Central Bank Policy rate (as of May): 7.5%;• Rwanda Increase of Broad Money (June) :12.5%;• Rwanda Increase of Credit to private sector (June):18.1%• FRW depreciation vs USD (June): 1.4%

57
Activities report January - June 2012
BNR
FINANCIAL SECTOR STABILITY
CHAPTER V

58
Activities report January - June 2012
BNR
In the period under review, the Bank continued to employ important reforms to ensure that the financial system mainly composed of the banking system, microfinance and non-banking financial institutions is robust and continue to show good financial health. These reforms included the es-tablishment of appropriate market infrastructure notably efficient legal and regulatory framework, supervisory tools and modern payment systems. In addition, the BNR established the Financial Stability Committee (FSC) in May 2012 with the mission to promote the stability of the Rwandan financial system by analysing the system in its environment on a permanent basis, and by identify-ing, monitoring and publishing associated risks.
The outcome of the 2011 financial stability reports and first meeting of FSC substantiate that Rwanda’s financial system is sound and stable and able to mitigate systemic risks.
V.1. Banking Sector Performance
The Rwandan banking system is comprised of nine commercial banks and five specialized insti-tutions (including 3 microfinance banks, 1 development bank and 1 cooperative bank) and held around 70 percent of the total assets of the Rwandan financial sector.
During the first half of year 2012, the sector has demonstrated good performance as a result of strengthened both legal and supervisory reforms as well as good macroeconomic environment. The balance sheet outlook was remarkable with a total asset growth of 11.4 percent from RWF 1,084.2 billion in December 2011 to RWF 1,207.8 billion in June 2012. Loans increased by 22 percent from RWF 631.2 billion in December 2011 to RWF 757,2 billion in June 2012, while deposits have grown by 12.8 percent reaching RWF 808.4 billion from RWF 716.5 billion end year 2011. The Non-performing loans stood at RWF 45.3 billion in June 2012 against RWF 50.5 billion in December 2011; that is an improvement of 10.3 percent. The banking sector profitability remained good despite a decrease of 0.4 percent, from RWF 13.5 billion in June 2011 to RWF 13.4 billion in June 2012.
Table 26: Performance achievement (in FRW 000)Dec. 11 Jun.12
Total Assets 1,084,192,044 1,207,844,775Total Deposits 716,466,968 808,370,208Total Loans 631,267,680 757,018,376NPL 50,504,712 45,254,736ProfitAfterTax 13,495,292 13,439,891
Source: BNR
In regard with the soundness indicators, the sector remained well capitalized with sufficient income to cope with market demands and generate enough equity buffers. The capitalization levels (meas-ured by total capital to risk weighted assets) stood at 25.1 percent against 25.0 percent in December 2011, well above the regulatory capital of 15 percent. The Non-performing loans (NPL) to total gross loans reduced to 5.8 percent in June 2012 from 8 percent in December 2011. The return on assets and return on equity (profitability) stood at 2.3 percent and 10.9 percent respectively in June 2012 compared to 2.9 percent and 15.2 percent in June 2011 while the sector’s liquidity position stood at 48.3 percent in June 2012 against 45.3 percent in December 2011.

59
Activities report January - June 2012
BNR
Table 27: Key soundness indicators (in percent)Indicators 2011 2012
June September December March JuneSolvency ratio (total capital) 24.4 25.7 25.0 26.6 25.1NPLs / Gross Loans 9.2 9.3 8.0 6.5 5.8NPLS net/Gross loans 7.5 7.3 6.2 5.1 4.3Provisions / NPLs 49.5 49.4 50.8 52.8 51.1EarningAssets / Total Assets 80.5 71.2 77.2 79.9 81.4Large Exposures / Gross Loans 10.2 10.1 9.8 7.7 9.5Return on AverageAssets 2.9 2.3 2.2 2.5 2.3Return on AverageEquity 15.2 11.9 10.5 11.6 10.9Cost of deposits 2.4 2.4 2.4 2.9 2.9Liquidassets/total deposits 55.9 49.3 45.3 49.4 48.3Forex exposure/core capital 4.8 3.0 6.6 5.6 -1.5
Source: BNR
Box 4Financial soundness indicators (Banking system):
• Solvancy (June): 25.4% • NPL(June): 5.8% • Profitability(June): 2.3% • Liquidity(June): 48.3 %
V.2. Microfinance Sector Performance
The microfinance sector is comprised of 11 limited companies microfinance institutions and 486 SACCOs. The sector continued to demonstrate good performance during the period under review mainly driven by the growth of UMURENGE SACCOs. The total assets (UMURENGE SACCOs included) increased by 22.2 percent from December, 2011 to June, 2012, from RWF 77.4 billion to RWF 94.6 billion. Gross loans and deposits increased by 25.7 percent and 23.3 percent, from RWF 40.7 billion to RWF 51.7 billion and from RWF 45.8 billion to RWF 56.5 billion, respectively.
Table 28: MFIs Consolidated financial performance indicators, UMURENGE SACCOs included (in RWF billion)31-Dec-11 30-June-12 Change in %
Total Assets 77.4 94.6 22.2Liquidity 33.0 38.2 15.7Gross Loans (Before Provisions) 40.7 51.2 25.7Non PerformingLoans 4.8 4.2 -12.5Provisions 2.1 2.3 9.5Loans (Net of Provisions) 38.6 48.9 26.6Deposits 45.8 56.5 23.3Equity 20.2 24.5 21.2Non- Performing Loans rate (in percent) 12.0 8.3 -30.8Liquidity ratio (in percent) 85.6 67.6 -21.0Capital adequacy ratio (in percent) 26.1 25.9 -0.7
Source: BNR

60
Activities report January - June 2012
BNR
Table 29: Consolidated financial performance indicators of MFIs - UMURENGE SACCOs excluded (in RWF billion)
31-Dec-11 30-Jun-12 Change in %Total Assets 48.3 53.8 11.1Liquidity 8.2 10.1 23.1Gross Loans 35.9 41.3 14.7Non-Performing Loans 4.6 4 -15.2Provisions 2 2.2 10Loan Portfolio (Net of Provisions) 33.9 39 15Total Deposits 23.4 26.2 11.9Equity 15.4 16.3 5.8Non- Performing Loans Ratio (in percent) 12.9 9.7 -24.8Liquidity Ratio (in percent) 54.7 60.4 10.6Capital adequacy Ratio (in percent) 32 30.3 -5.3
Source: BNR
For UMURENGE SACCOs only, deposits and gross loans increased respectively by 34.2% and 112.7% from end December 2011 to end June 2012, from RWF 22.5 billion and 4.7 billion RWF to RWF 30.2 billion and RWF 10.0 billion. Total assets increased by 40.6 percent, from RWF 29 billion to RWF 40.8 billion.
Table 30: Consolidated financial performance indicators of UMURENGE SACCOs (in RWF billion) Dec-11 June -12 Change in %
Total Assets 29.0 40.8 40.6Liquidity 23.2 28.0 20.6Gross loans 4.7 10.0 112.7Provisions 0.1 0.1 -Net Loans 4.6 9.9 115.2NPLs 0.2 0.2 -Total Deposits 22.5 30.2 34.2Total Equity 4.7 8.1 72.3NPL Ratio (in percent) 5.6 2.6 53.5Liquidity ratio (in percent) 103.2 92.8 -10.0Capital Adequacy Ratio (in percent) 16.1 20.0 24.2
Source: BNR
Concerning the financial soundness indicators, the sector shows an improvement measured in terms of NPLs ratio with a downward trend from 12 percent to 8.3 percent, improvement driven mainly by UMURENGE SACCOs with NPL rate of 2.6% against 9.7 % for other MFIs. A slight decrease is observed in capital adequacy ratio since the increase in assets of UMURENGE SAC-COs is not backed by the same increase in share capital.
The liquidity ratio registered a decrease of 10% as UMURENGE SACCOs fully licensed have to maintain a liquidity ratio of 60% instead of 80 % for those which are not yet fully licensed. However, compared to the minimum prudential norms of 15 % for capital adequacy ratio and 30 % for the liquidity ratio, UMURENGE SACCOs are complying with the minimum regulatory requirements.

61
Activities report January - June 2012
BNR
V.3. Non-Bank Financial Institutions Performance
The non-bank financial institutions are composed of insurance and pension sectors. The National Bank of Rwanda is mandated to regulate and supervise these institutions to protect interests of policy holders and pensioners by ensuring that these institutions are financially sound and stable.
Training on corporate governance with Board of Directors and Managing Directors of Insurance companies
1. Insurance sector
The insurance sector is composed of 9 insurers of which seven are private and two are public, 5 insurance brokers, 120 insurance agents and 8 loss adjusters. The insurance sector in Rwanda is developing as depicted by insurance penetration which is about 7% though still less than the 10% for middle income economies.
During the period under review, the insurance sector performance improved progressively. The total assets as at 30th June 2012 reached RWF 180.6 billion compared to RWF 147.5 billion as at 30th June 2011.
The Gross premiums increased, however the net profit decreased slightly. The liquidity position of the insurers is strong. The return on assets and return on equity improved as most of the insurers continue to invest prudently.
Table 31: Financial soundness indicators for the insurance sector (in RFW billion)
Indicators2010 2011 2012Dec June Dec Mar June
Total assets 128.211 147.513 157.528 169.242 180.632Total capital 85.028 100.862 104.381 112.044 115.184Total gross premiums 49.738 42.826 46.288 32.634 46.354Underwritingprofit 7.063 12.875 6.756 11.381 16.843Totalnetprofit 15.687 20.076 12.564 14.632 19.820Claims ratio in percent 44 17 41 45 43Combined ratio in percent 81 65 79 61 63Current ratio (percent) 178 180 190 218 298Return on equity ratio(ROE) percent 17 20 13 13 17Return on assets ratio(ROA) percent 11 14 9 9 11
Source: BNR

62
Activities report January - June 2012
BNR
2. Pension sector
The Pension Sector is comprised of the Rwanda Social Security Board (pension branch) or Na-tional Social Security Fund and about 40 private occupational pension schemes administered by insurance companies.
The National Social Security Fund covers largely salaried workers representing 8% of the working population in Rwanda. The pension coverage is still low compared to middle income economies’ coverage of at least 25%.
During the period under review, the pension sector assets, contributions and benefits (excluding private pension schemes) continued to grow with a positive trend. The contributions as major source of revenue increased by 26% while assets increased by 9%.
V.4. Regulatory Framework and Supervision
In the first half of 2012, the Bank continued to strengthen its supervisory roles by conducting off site surveillance and onsite inspection. During the period under review, four onsite inspections were conducted against ten targeted the whole year. In addition, the Bank continued to imple-ment the banking law by putting in place new regulations; two directives were approved and is-sued to banks. Also, two regulations were published in the Official Gazette in the first half of 2012.
In regard with microfinance, off-site and on-site inspections were performed on regular basis. The microfinance supervision activity was mainly concentrated on the licensing and onsite inspections of SACCOs established in line with UMURENGE SACCO Program where 362 SACCOs out of 416 were fully licensed against 139 end December 2011.
Concerning the Non-Bank Financial institutions, a number of activities relating to strengthening the legal framework and conducting inspections have been accomplished. Activities accomplished in-clude reviewing the Insurance contracts law and finalization of insurance regulation on dissolution and winding up of insurance companies that will soon be published in the official Gazette. In addition, the Bank has been closely following up legislative procedures aiming at the pension law enactment.
In addition, the Bank closely monitored the actuarial valuation for life insurance companies to facilitate the separation of life and non-life insurance businesses. A number of prudential meet-ings were conducted to ensure that the non-bank financial institutions meet minimum capital and solvency requirements and observe corporate governance best practices. Furthermore, the Bank started the initiatives aiming at establishing appropriate supervisory framework for Special Guar-antee Fund and Mutuelle de Santé. The Bank also participated in the peer review meeting of all EAC insurance regulators to review the compliance with insurance core principles.
Regarding forex bureaus, four new entrants were licensed in the first half of 2012 against five closed due to failure to meet the requirement, hence, recording a total of 130 forex bureaus. Furthermore, the Bank issued a new regulation on the operation of forex bureaus (to best practices in the sector

63
Activities report January - June 2012
BNR
to be enforceable in January 2013) with the aim of streamlining the business and to ensure adher-ence to best practices in the sector.
V.5. Access to Finance
In line with measuring access to finance, a second FinScope survey has been undertaken. Preliminary findings summarized in the following financial inclusion strand show that the percentage of total adult population having access to formal financial services increased from 21.1% in 2008 to 42% in 2012; while adult population formal and informal financially included increased from 47.5% in 2008 to 71.8% in 2012. Adult population total financially excluded decreased from 52.4% to 28 .1% from 2008 to 2012.
Fig 7: FINSCOPE SURVEY 2012
Source: BNR
The Bank has been actively advocated for financial inclusiveness and equality through the finan-cial awareness campaigns being undertaken.
SMEs financing
According to the country’s policy of empowering of SMEs, which is observed as the key catalyst for GDP growth and employment creation, the Bank has taken proactive steps in this regard. In March to May 2012, the Bank in partnership with World Bank conducted a supply SME financing survey to assess the obstacles of financing to SME’s in Rwanda and thereafter propose appropriate policies.
The preliminary findings indicate positive outlook. On average, SMEs constitute 17% of the overall lending portfolio in Rwanda, which compares to 16% across developing economies. In addition, the Bank has undertaken appropriate measures to break the traditional norms of over-reliance on real estate and land as prime collateral by introducing the enforcement of movable collateral and supplemented by better credit information provided through the new private credit bureau.
Table 32: Financing of SMEs by banks and MFIs (in 000 Rwf)Sector 2006 2007 2008 2009 2010 2011 Jun-12Banks 45,234,156 67,620,359 77,200,670 108,733,789 108,015,099 118,421,717 139,999,822MFIs 624,962 830,897 815,038 2,732,746 3,470,400 6,523,902 7,687,818Total 45,859,118 68,451,256 78,015,708 111,466,535 111,485,499 124, 945,619 147, 687,640
Source: BNR

64
Activities report January - June 2012
BNR
Gender access to finance
Access to finance by gender indicate that generally, women’s appetite and courage to take loans is improving which is a positive indicator to empower women out of poverty. As shown in the table below, in 2006 only 16% of loans by banking sector were granted to women against 22% in 2011.
Furthermore, monthly comparison indicates that about 75% (Rwf 16.6 billion) and 25.0% (Rwf5.5 billion) of loans issued by banks were disbursed to men and women respectively in June 2012 compared to the 80.5% and 19.5% recorded in June 2011.
Table 33: Distribution of loans by Gender (in FRW 000) Women % Men %
Annual comparison2006 8,077,683 16.2 41,741,921 83.82007 11,754,102 17.2 56,574,791 82.82008 18,563,152 18.8 80,429,946 81.22009 19,549,504 19.8 79,070,496 80.22010 27,773,725 21.0 104,689,811 79.02011 41,224,762 22.0 145,836,108 78.0
Monthly comparisonJune 2011 3,030,304 19.5 12,543,186.0 80.5June 2012 5,546,956 25.1 16,596,579 75.0
Source: BNR
As indicated in the table above, the trend of access to loans by both women and men is increasing. Based on the percentage share of new loans disbursed, the portion for women has recorded an upward trend over the years and on monthly basis, unlike for men.
Table 34: Number of accounts, deposits and loans classified by gender in MFIs and SACCOs DENOMINATION Dec. 2011 30-June, 2012 % per gender 30-June 2012A.UMURENGE SACCOsAccounts 955,065 1, 211,726 100%
Men 522,955 655,466 54%Women 373,552 474,187 40%Groups 58,558 82,073 6%
Deposits (in thousands) 12, 730,598.4 30,267,739.8 100%Men 8, 190,963.4 12, 872,760.0 43%Women 4, 539,635 7, 570,128.0 25%Groups 9,653,587.7 9,824,851.8 32%
Loans in (in thousands ) 4, 266,134.2 10,007.890.5 100% Men 3, 210,498.5 6, 907,691.8 69%Women 1,055,635.6 2, 244,409.8 22%Groups 482,750.1 855,788.9 9%
B.OtherMFIs/SACCOs Accounts 562,876 568,920 100%
Men 332,314 329,954 58%Women 230,562 238,966 42%
Deposits (in thousands ) 23, 428,974.2 26, 290,691.4 100% Men 14, 966,258.7 15, 312,535.3 58%Women 8, 462,715.5 10, 978,156.1 42%
Loans in (in thousands ) 33, 958,127.1 41, 399,063.1 100% Men 19, 427,559.2 23, 684,543.9 57%Women 14, 530,567.8 17, 714,519.2 43%
Source: BNR

65
Activities report January - June 2012
BNR
For UMURENGE SACCOs, women held 40% of accounts with 25% of deposits and 22% of loans as at end June 2012. For other MFIs and SACCOs, women held 42% of accounts with 42% of deposits and 43% of loans.
However, considering accounts held by individuals (excluding accounts held by groups and other entities whose members should be women or men), 42% of account holders in microfinance sector (UMURENGE SACCOs included) are women with 40% of total deposits and 39% of outstanding loans as at end June 2012.
Geographical distribution of loans
Geographical distribution of loans according to provinces and districts indicates that there is imbal-ance in loan issuance. Province level
As indicated in the graph below, the Kigali City province takes the lion’s share of 73 percent for new loans disbursed in the month of June 2012.
Table 35: Banking sector financing to SMEs by Province (Amounts in FRW «000») Dec. 2011 June. 2012 Province Numbers of SMEs Amounts Numbers of SMEs Amounts % Share Kigali City 6,603 86,008,269 7,886 114,166,282 78.6%Western 1,054 8,556,379 862 9,658,701 6.6%Southern 1,008 9,778,619 793 7,988,669 5.5%Eastern 1,348 7,608,409 1,512 6,860,741 4.7%Nothern 792 6,470,041 736 6,652,802 4.6%TOTAL 10,805 118,421,717 11,788 145,327,194
Source: BNR
Fig 8: Distribution of new loans by Province (June 2012)
Source: BNR

66
Activities report January - June 2012
BNR
District level
In the period under review (June 2012), the three districts in Kigali City, i.e., Nyarugenge, Kicukiro and Gasabo had the largest share of new loans issued by banks taking 35.8% (Rwf 12.5 billion), 19.6 (Rwf 6.9 billion) and 18.0% (Rwf 6.3 billion) respectively.
The top five other districts (up-country) include Rubavu (3.9%: Rwf 1.4 billion), Huye (3.0%: Rwf 1.1 billion), Muhanga (2.2%: 0.8 billion), Musanze (2.0%: Rwf 0.7 billion) and Nyagatare (1.9%: Rwf 0.7 billion).
The top last five districts include; Nyaruguru (0.2%), Burera (0.3%), Gisagara (0.3%), Kamonyi (0.3%) and Ngororero (0.3%).
V.6. Credit Information system
The private credit reference bureau (CRB Africa) came to supplement the public credit reference bureau managed within the National Bank of Rwanda in order to gather quality credit information for the purposes of minimizing credit moral hazards and adverse selections has started to pay off.
All financial institutions have signed memorandum of understanding with CRB Africa and have started to provide data to CRB Africa. Similarly, banks have begun to use CRB Africa data in client credit analysis.During the first half of year 2012, all mandatory participants provided data to CRB Africa and used credit reports issued by the bureau.
According to CRB Africa report, from June 2011 to June 2012, the usage of credit report by the manda-tory participants increased by 385 %, from 2,467usage in June 2011 to 11,959 usage in June 2012.
As of 30th June 2012, all commercial banks and microfinance banks as well as 32 MFIs and SAC-COs were CRB participants. The insurance companies started sharing information with CRB Africa in October 2011 and the num-ber of policy accounts submitted increased significantly by 425% from 6,003 in December 2011 to 31,507 in June 2012.
In addition to mandatory participants (financial institutions), voluntary participants such as the utility com-panies (telecoms & EWSA) have registered to share credit information and information on client accounts submitted to the bureau increased by 352% from 1,562 in December 2011 to 7,055 in June 2012.
Going forward, the National Bank of Rwanda will continue to ensure improved quality and coverage of credit information sharing with voluntary participants to include retail traders (supermarkets) as well as other credit granting institutions. Furthermore, the Bank will continue to monitor the assignment that already started in June 2012, of conducting a mass public awareness campaign to sensitize consum-ers, participants and policy makers on the role of credit information sharing and consumer rights.

67
Activities report January - June 2012
BNR
Box 5Access to finance:• Formal financial services access: 42% from 21.1% in 2008• Formal and informal financial services access:71.8% from 47.5%
in 2008

68
Activities report January - June 2012
BNR

69
Activities report January - June 2012
BNR
MAINTAINING THE INTEGRITY AND SUPPLY OF CURRENCY
CHAPTER VI

70
Activities report January - June 2012
BNR
VI. 1 Currency management
VI.1.1 Currency issuance
For the first semester 2012, the National Bank of Rwanda has put in circulation new notes and coins amounting to FRW 41,443.91 million of which 41,210 million of banknotes and 233.91 mil-lion of coins, against FRW 34,828.24 million for the same period of 2011.
Table 36: Banknotes issued (FRW million) Year
Denomination
January-June 2009 January-June 2010 January-June 2011 January-June 2012
500 1,430 2 ,200 2 ,620 1,7101,000 2,600 3,380 5,720 5,2202,000 960 9,800 12,600 17,8805,000 3,200 10,520 13,700 16,400Total 8,190 25,900 34,640 41,210
Source: BNR
The issuance of banknotes and coins increased respectively by 19% and 24% compared to the corresponding period of 2011. The increase of new coins put in circulation was driven by a high demand in FRW 100 and FRW 50 coins.
Table 37: Coins issued (FRW thousands)Year
Denomination
January-June 2009 January-June 2010 January-June 2011 January-June 2012
1 60 140 60 105 3,870 3,360 2,560 600
10 3,400 13,300 16,410 3,30020 11,472 17616 22,160 9,92050 22,500 5,100 1,750 38,400
100 607,000 275,600 145,300 181,680Total 648 302 315 116 188 240 233 910
Source: BNR
VI.1.2. Counterfeit banknotes
In the 1st semester 2012, the National Bank of Rwanda recorded 380 counterfeit FRW banknotes, including 89 of FRW 5 000, 114 of FRW 2 000 and 177 fake notes of FRW 1 000 FRW, against 121 fake notes for the whole last previous year.
Table 38: Counterfeit FRW banknotesDenominat.Origin
5 000 2 000 1 000 500 Total2010 2011 2012 2010 2011 2012 2010 2011 2012 2010 2011 2012 2010 2011 2012
BNR counters 104 2 8 4 1 1 21 0 1 0 0 0 129 3 10Banks counters 33 5 12 179 12 37 205 18 1 6 13 0 423 48 50National Police 31 35 69 128 35 76 781 0 175 0 0 0 940 70 320TOTAL 168 42 89 311 48 114 1,007 18 177 6 13 0 1,492 121 380
Source: BNR

71
Activities report January - June 2012
BNR
Regarding foreign currency, the Bank recorded 337 fake notes of which 12 of the USD 100, 199 of the USD 10, 24 of the EUR 100 and 102 of EUR 20.
Machine detecting fake note.
To mitigate currency counterfeiting practice, the Bank has put in place a clean currency policy with efficient measures against counterfeiters including a Regulation approved by the Board of Direc-tors to be published shortly. The regulation establish rules and procedures under which financial institutions shall carry out activities of handling cash, including counting and sorting activities and detection of counterfeit currency collected from clients. In addition, a sensitization campaign of the public on the use of currency and fight against counterfeit is planned in November 2012.
VI. 2. Banking operations
The services offered by the banking operations include cheques and transfer orders processing, cash deposits and withdrawals, cheques certifications and cash deposits and withdrawals as well as opening and closing of accounts. During the first half of the year 2012, the cash operations decreased in volume by 8.5% and increased by 26.7% in value as compared to the same period in 2011.
Table 39: Banking Operations (Amount in FRW million)January-June 2011 January-June 2012 Variation (%)
Operations Volume Amount Volume Amount Volume AmountCash Operations 91,754 5,288,420 83,924 6,699,316 -8.5% 26.7% Cash withdrawals 32,724 4,037,354 29,990 5,246,014 -8.4% 29.9% Cash deposits 59,030 1,251,066 53,934 1,453,302 -8.6% 16.2%Funds transfers processing 147,527 186,686,616 104,797 422,823,068 -29.0% 126.5%Cheques processing 41,940 4,617,562 70,060 21,425,416 67.0% 364.0%Chequescertification 2,968 95,463 2,415 71,775.8 -18.6% -24.8%Opening of accounts 216 - 110 - -49.1% - Closing of accounts 76 - 132 - 73.7% -
Source:BNR
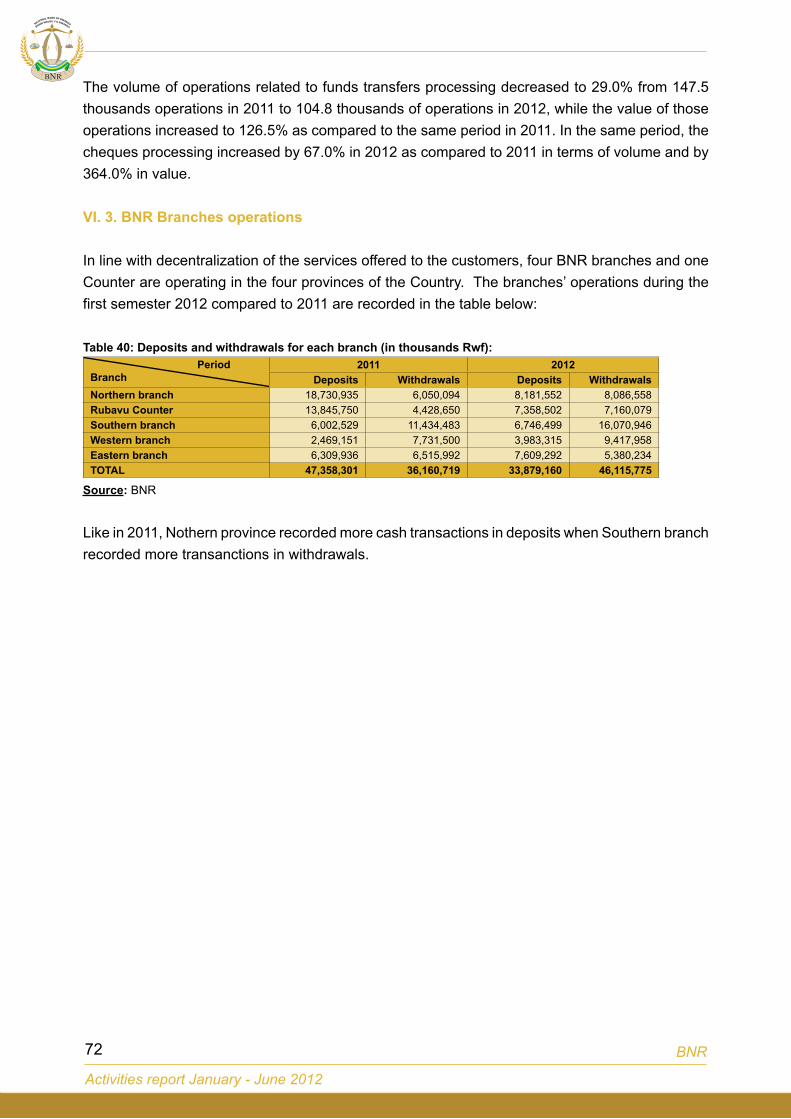
72
Activities report January - June 2012
BNR
The volume of operations related to funds transfers processing decreased to 29.0% from 147.5 thousands operations in 2011 to 104.8 thousands of operations in 2012, while the value of those operations increased to 126.5% as compared to the same period in 2011. In the same period, the cheques processing increased by 67.0% in 2012 as compared to 2011 in terms of volume and by 364.0% in value.
VI. 3. BNR Branches operations
In line with decentralization of the services offered to the customers, four BNR branches and one Counter are operating in the four provinces of the Country. The branches’ operations during the first semester 2012 compared to 2011 are recorded in the table below:
Table 40: Deposits and withdrawals for each branch (in thousands Rwf): PeriodBranch
2011 2012 Deposits Withdrawals Deposits Withdrawals
Northern branch 18,730,935 6,050,094 8,181,552 8,086,558Rubavu Counter 13,845,750 4,428,650 7,358,502 7,160,079Southern branch 6,002,529 11,434,483 6,746,499 16,070,946Western branch 2,469,151 7,731,500 3,983,315 9,417,958Eastern branch 6,309,936 6,515,992 7,609,292 5,380,234TOTAL 47,358,301 36,160,719 33,879,160 46,115,775
Source: BNR
Like in 2011, Nothern province recorded more cash transactions in deposits when Southern branch recorded more transanctions in withdrawals.

73
Activities report January - June 2012
BNR
PAYMENT SYSTEMS MODERNISATION
CHAPTER VII

74
Activities report January - June 2012
BNR
Safe, effective and efficient payment systems are vital for the economic development of any coun-try since they facilitate the smooth movement of money in the economy and enable the financial transactions to be completed safely and timely.
Payment systems help to promote the development of commerce, enhance economic policy over-sight, control the risk inherent in moving large values, and reduce the financial, capital and human resources devoted to the transfer of payments. Payment systems also contribute to an effective transmission of monetary policy. After the implementation of the Rwanda Integrated Payment Processing System (RIPPS) in 2011, the period under review had been concentrated to stabilise the RIPPS and to introduce new and strengthen existing retail payment systems. All changes were spearheaded by concerted effort of the central Bank/Government and financial institutions especially commercial banks.
The principle objective of most of these changes has been to
i. reduce the usage of currency and other paper based payment instruments and ii. facilitate safer and faster movement of funds in the economy.
VII.1. Rwanda Integrated Payments Processing System (RIPPS)
During the first six months of 2012, the RIPPS was stabilized and banks had put much effort to integrate core banking applications within the system. As of 30th June 2012, 73.33% of banks had developed the interface between RIPPS and their core banking. The availability rate of the system had been 99.44% from January to end June 2012.
Table 41: Transactions settled through ATS (January - June 2012).
Type of transactions
RTGS ACHTotalCustomers
transactionsInterbank
transactions Cards Cheques Credit transfers (batches)
Total Messages 65,950 3,590 428 28,174 120,587 221,823
Volume of instructions 65,950 3,590 428 181,430 856,665 1,111,157
Values (FRW millions ) 464,943 484,162 3,016 463,279 588,726 2,326,931
Source: BNR
On the Central Securities Depository (CSD) side, around 2,000 transactions equivalents to 3,036 billion were settled through the Central Securities Depository system. Those transactions com-prise both equities and Debt instruments (REPO’s, Treasury bills and Treasury Bonds). All equities transactions are the secondary operations which take place on Rwanda Stock Exchange while on debt securities side more than 99% are new issuance by the Central Bank.

75
Activities report January - June 2012
BNR
Table 42: Transactions through CSD ( January-June 2012)
Equities
Period Number of trades/transactions Number of shares traded Turnover (FRW millions)Jan-12 259 3,986,300 619Feb-12 208 1,311,200 270Mar-12 181 3,036,600 511Apr-12 272 4,831,200 734May-12 559 13,903,300 1,897Jun-12 309 18,905,500 3,144
Debt securities
Jan-12 26 - 417,050Feb-12 24 - 406,594Mar-12 27 - 489,850Apr-12 24 - 473,744May-12 26 - 677,800Jun-12 25 - 564,459
TOTAL 1,940 3,036,670
Source: BNR
VII.2. Retail payments developments
To achieve the vision of changing the Rwandan society from cash-based oriented to electronic channels, the Bank and its stakeholders continued to work hand in hand to encourage the elec-tronic means towards less movement of cash.
2.1. Card based payment system and mobile money schemes
To further support the vision of payment system modernisation in Rwanda, an important partnership between Visa inc. and the Government of Rwanda was signed in November 2011 aiming at devel-oping localized payment solutions to extend access to financial services to local and international consumers throughout the country. In that regard, all commercial banks have different membership with Visa namely 3 banks which are principal members, 3 banks which are associate members and 4 banks with cash disbursement membership.
Moreover, the Visa National Net Settlement System (NNSS) is operational since the 1st March 2012. The Visa National Net Settlement System facilitates domestic transactions to be settled in local currency and the Central Bank is the settlement agent. By end June 2012, six banks were already participating in NNSS.
Table 43: Statistical data on electronic means of payments (in FRW Million) Number of Subscribers Number of Transactions Value (FRW) 2011 Mar-12 Jun-12 2011 Mar-12 Jun-12 2011 Mar-12 Jun-12POS - - - 38,440 9,957 12,341 73 2,424 2,058ATMs - - - 1,976,376 1,082,223 1,420,583 122,536 35,846 43,763Mobile Banking 155,986 198,590 248,689 527,300 33,655 253,392 5,215 179 411Internet Banking - 5,841 6,237 1,493 35,513 36,828 708 4,188.50 4,568Mobile payments 639,673 765,416 968,315 4,323,490 2,767,884 4,301,744 51,024 26,476 33,737
Source: BNR

76
Activities report January - June 2012
BNR
VII.3. Payment infrastructure
The retail Payments infrastructure has also improved considerably. By end June 2012, the Num-ber of ATMs had increased to 232 as compared to 167 by end 2011. Points of Sale (POS) had also increased to 385 from 227 at end 2011.
Modern Payment infrastructure
More importantly, the number of cards issued superseded what the Banks had projected; a total of 320,565 cards was issued as at end June 2012 as compared to 250,534 in March 2012, repre-senting an increase of 28% in three months.
Table 44: Evolution of payment infrastructureItem End 2011 Mar-12 Jun-12Number of Debit Cards 208,767 250,534 320,565Number of credit Cards 526 645 542Number of ATMs 167 201 232Number of POSs 227 317 385
Source: BNR
VII.4. E-commerce
Regarding the E-commerce in Rwanda, Rwandair has been operating e-commerce through a foreign Bank since November 2011.
One local bank had got the e-commerce license from Visa and had already identified the payment gateway and they are on the test phase.
VII.5. Payment services providers
All financial institutions are allowed to offer payment services. In addition to financial institutions, the non-financial institutions were licensed to provide those services in order to facilitate Rwandan people to have the access to formal financial services. They offer domestic and international pay-ment services.

77
Activities report January - June 2012
BNR
Table 45: Number of payment services providersYear 2008 2009 2010 2011 Jun-12Mobile banking - - - 5 6Internet banking - - 3 4 6Mobile payments providers - - 1 2 2Remittanceserviceproviders(Non-financialinstitutions) 1 2 7 10 12
Source: BNR
VII.6. Payment systems legal framework and new projects
On the legal and regulatory side, the regulation governing payment services providers was amend-ed to include the interoperability between payment infrastructures.
To further enhance the developments in payment systems, the BNR together with the Rwanda Bankers Association, have embarked on the Cheque Truncation Project. The cheque truncation consists of cheque clearing system based on cheques image where the cheque is scanned and transmitted through the entire clearing cycle using the image instead of the physical cheque.
In this regard, new standards for the cheques were issued in November 2011 and new printers willing to provide services to banks in Rwanda are being accredited by the BNR following the ac-creditation guidelines that were published in May 2012. This project shall help to fast track the cheque payment process with a more secure and trusted method of processing as more security features have been added to the new cheque. Besides, the cheques will be cleared efficiently because all account structures will be harmonized facilitating the integration between RIPPS and banks’ core banking applications.
In addition, the RIPPS system is being upgraded to enable linkage to Regional Payment Systems; the East Africa Payment systems (EAPS) and the COMESA Regional Payment and settlement system (REPSS) so as to facilitate the cross border payments in the East African Community and COMESA region.

78
Activities report January - June 2012
BNR

79
Activities report January - June 2012
BNR
SUPPORT ACTIVITIESCHAPTER VIII

80
Activities report January - June 2012
BNR
VIII.1. ICT SYSTEMS MODERNISATION
During the period of first Semester of 2012, the Bank mainly endeavored to fast-track the imple-mentation of modern technology and applications to support the core functions of the Bank. Rwanda being a front-runner on the ICT development, the Bank ensured prerequisites to embark on utilizing available ICT capacity as an option of facilitating execution of central banking functions with modern IT systems put in place. Specifically, the Bank has initiated an ICT Modernization Project (Core banking and Enterprise Resource Planning (ERP) whose primary objective entails to install modern IT infrastructure and software applications to support Bank operations in a more coordinated manner.
For the first semester of 2012, the Bank has managed to hire a specialized and competent soft-ware vendor known as TEMENOS that will supply and implement the Core Banking and ERP Systems. During this period of reporting, along side this Project (Core banking & ERP), the Bank managed also to upgrade other IT systems including successful launch of a modern data center, strengthening existing IT security mechanisms and installation of VISA-RIPPS interface and Re-gional Payment systems.
All these efforts have been employed to fast-track the implementation of the recommendations made by His Excellency Paul KAGAME during his visit to BNR in 2009 among which he recom-mends the modernization of the Bank’s IT systems with modern automation functions.
VIII.2. Infrastructure Modernization
2.1 Construction and Rehabilitation projects
Since 2009, following the visit by H. E the President of the Republic of Rwanda, the National Bank of Rwanda embarked on a modernization journey towards the creation of the 21st century Cen-tral Bank by all accounts. The physical reorganization involved rehabilitation of the current Bank buildings and construction of new ones to this effect.
In the financial period under review, a new car park with 180 Vehicle capacity is under construc-tion expected to be completed in October 2012 taking care of the customer and Bank staff parking needs and allowing for the target of keeping BNR green.
Another major project in progress is construction of four (4) BNR Branch Office buildings based in the four provinces of Rwanda. These branches currently operate in rented offices usually very costly for the Bank, with insufficient space and would not enable the Bank to establish permanent infrastructure essential in the context of its mission. Target completion date is the course of 2013.
In the coming years starting preparation in 2012/13, the Bank has planned to put forth a New BNR Headquarter Building that shall last the century standards and more with modern infrastructure capacity and compliance to international environmental settings.

81
Activities report January - June 2012
BNR
VIII.3. Human Resources Management and Development
The Human Resources Management and Development function is strategically positioned to en-sure that the National Bank of Rwanda realises its strategic objectives through attraction, develop-ing, maintaining and proper utilization of relevant workforce.
The Bank’s Human Resources function has for last six months invested in development of strate-gies to enhance the Human Resources Management and Organisational Effectiveness reform agenda. The strategies include, creation of high corporate performance culture in BNR, putting in place talents management strategies and leadership development plan. In addition, the Bank has embarked on review of its performance management system which shall adopt the balanced Score card to modernise the performance management approach.
In terms of capacity building and talents management, a new career development system is being implemented through a Career progression policy approved and published in June 2012. The policy on career progression has dual career progression framework which provides ample career growth opportunity for the Bank staff, thus enhancing professionalism as well as retention strategy. By June 2012, the Bank size had grown to 513 staff having 17 new staff with diverse experi-ence and skills, 4 of whom hold managerial positions.
Since 2011, the Bank started a three year rolling capacity building plan, targeting investment in pro-fessionalism and leadership development. Trainings and industrial attachments have been continu-ous and by June 2012, 36 staff of BNR were registered in different professional courses while others are pursuing master’s degrees and PhDs in areas of monetary policy and economic development.
In the coming financial year, the Bank will continue the human resources management and de-velopment initiatives and has planned to invest in enhancement of the staff welfare schemes and modernisation of its management system.
VIII.4 CORPORATE SOCIAL RESPONSIBILITY
At the beginning of 2012, the Bank completed and handed over the poultry project designed for the orhphans and widows of the 1994 Genocide against Tutsi. The project was officially handed over to the beneficiaries in the presence of local and district authorities of Kamonyi district. The project cost the Bank to the tune of FRW 20,457,000.

82
Activities report January - June 2012
BNR
Governorofficiallylaunchingthepoultryproject.MayorofKamonyiandViceGovernorwatchon.
However, sponsorship continued to be extended to students pursuing technical and vocation training courses in various institutions.
On 12th April 2012, the Bank embarked and initiated a project to support families of its twenty eight (28) former staff who perished in the 1994 Genocide against Tutsi funding some income generating activities. Initial consultations for appropriate projects have been established with the concerned families and projects are yet to be rolled out.
Governor with the representatives of BNR former staff killed during the 1994 genocide againt tutsis.
In addition, the Bank, in memory of its former staff that perished during the 1994 Genocide against Tutsi, in April 2012 officially inaugurated a Memorial at the BNR Headquarter.

83
Activities report January - June 2012
BNR
Inauguration of the memorial of 1994 genocide against tutsi at BNR headquarters by the Minister of Sport and Culture.
Furthermore, the Bank donated additional FRW 7,396,000 to various requests from individuals, institutions and associations. A special donation budget has also been specially designated for BNR branches to respond to various requests from their locality. Branches have been mandated with the powers to assess and appreciate requests and recommend appropriate support.

84
Activities report January - June 2012
BNR

85
Activities report January - June 2012
BNR
FINANCIAL STATEMENTS
CHAPTER IX

86
Activities report January - June 2012
BNR
IX. 1 FINANCIAL STATEMENTS SUMMARY
IX.1.1 FINANCIAL PERFORMANCE FOR THE PERIOD ENDED 30 JUNE 2012
1.1. Financial Results
1.1.1. Summary 2011/2012 Financial Results
During the year under review, the bank expected to achieve Rwf 20.6 billion of revenues against Rwf 18.04 billion of operating expenses, which makes a net operating income of Rwf 1.58 billion. Capital expenditure was estimated to Rwf 13.56 billion including Rwf 9.26 billion of capital expen-ditures and Rwf 4.29 billion of notes and coins printing costs deferred to fiscal years.
Compared to the expectation, the actual result was quit significant good as depicted by the table below:
Table 46: Summary of 2011/2012 financial result performance.Actual Results
30 June 12 Rwf “000”
Actual Results 30 June 11 Rwf “000”
BudgetJuly June 11/12
Rwf “000”
Amount % % of Budget
1 Revenues 21,727,877 196 105 11,090,902 20,621,0472 Operating Expenses 14,824,130 229 78 6,486,108 19,047,0853 Net Income (1-2) 6,903,747 150 439 4,604,794 1,573,9624 Capital Expenditure 3,249,929 35 9,263,3245 Deferred Expenses 1,652,487 38 4,297,1876 Total Capital Budget (4+5) 4,902,416 36 13,560,511
Source: BNR
1.2. Financial Performance
1.2.1. Revenue Collection
During the year under review, revenue collection has been has been increased by 105% above the actual performance on 30 June 2011. The total revenue was received from interest income (Rwf 5.4 billion), commission and fees income (Rwf 0.3 billion), foreign exchange gain on foreign currency deals (Rwf 15.1 billion) and other income (Rwf 0.9 billion) respectively. The big part of this revenue was derived from gain on sale of the foreign currencies to Banks, realized gains on foreign financial instrument managed by our external fund managers and both local and foreign interest income investments.
Both local and foreign income has produced good results, above 140% and 79% respectively compared to the budget. Foreign interest income was increased due to increase on external man-aged funds basket and the actual interest rate on USD investments for call money and fixed de-posits which improved from 0.045 to 0.16% and 0.17% to 0.25% respectively.

87
Activities report January - June 2012
BNR
The local source of income is from interest on loans to Government and interest on IFC swap op-erations, while that of foreign income the big part is from foreign investments managed by external fund managers.
The fiscal year ended 30 June 2012 was characterized by the high demand of foreign currency by the commercial bank requested for their customers’ investments and import activities. BNR earns revenue of Rwf 7.7 billion this fiscal year (2011/12) compared to Rwf 0.05 billion year 2010/11.
Table 47: Cash flow revenue income collection30 June 2012
Rwf “000”30 June 2011
Rwf “000”Local interest income 2,119,877 1,440,010Foreign interest income 3,317,231 1,660,103Commission and fees income 296,384 212,448ForeignexchangedealingprofitonBanks 7,718,974 48,355Realisedgainsonforeignfinancialinstruments 2,687,470 437,120Total 16,139,936 3,798,036
Source: BNR
1.2.2. Cash Flow Revenue Collection
Revenue income is recorded in the books of accounts using accounting convention and based on international financial reporting stands (IFRS). The total cash flow revenue recorded was Rwf 15 billion. The non-cash flow income recorded for the period was 6.4 billion, included foreign exchange revaluation gain (Rwf 4.7 billion) and fair value on available for sale financial assets (Rwf 1.7 billion).
1.2.3. Operating expenses
Recurring expenses (including depreciation and amortisation) were budgeted for Rwf 19.05 billion. The actual operating expense stands at Rwf 21.21 billion (111%). The increase is mainly described by the interest paid on borrowing from money market, interest on T-bills and currency acquisition costs.
1.2.4. Operating income
Operating income for the year of Rwf 6.9 billion compared to Rwf 1.6 billion budgeted has been recorded. Operating cash flow income for the year was Rwf 2.2 billion while revaluation gain was Rwf 4.7 billion.
Table 48: Operating income earned 30 June 2012
Rwf “000”30 June 2011
Rwf “000”Cashflowoperatingincome 2,215,632 640,099Foreign assets (exchange) revaluation gain 4,688,116 3,964,695Total operating income 6,903,748 4,604,794
Source: BNR, 2012 Financial Statements

88
Activities report January - June 2012
BNR
Cash flow operating income has performed significantly due to foreign exchange dealing profit from Banks and realized gains from foreign financial instruments managed by the external fund managers.
As indicated above, BNR is complying with International Financial Reporting Standards (IFRS), the total comprehensive income recorded was Rwf 1.67 billion for fair value on available for sale financial assets compared to Rwf 0.03 billion end June 2011. The table below give a snap picture of financial performance.
Table 49: Statement of Comprehensive Income for the twelve month period ended 30 June 2012Details Note Twelve months ended
June 30 2012Six months ended 30 June 2011
Twelve months ended December 31 2010
Interest Income 3 5,437,107 3,100,113 5,061,718
Interest expense 4 (310,907) (159,123) (208,216)
Net interest income 5,126,200 2,940,990 4,853,502
Net fees and commission income 5 (193,948) 17,749 17,623
Foreign exchange gain 6 13,866,875 6,657,767 16,439,321
Other operating income 7 899,826 536,859 1,151,106
Operating income 19,698,954 10,153,365 22,461,552
Operating expense 8 (12,795,206) (5,548,571) (9,063,108)
Profit for the year 6,903,748 4,604,794 13,398,444
Other comprehensive income - - -
Net changes in fair value on available for sale financialassets
1,669,932 29,486 (77,231)
Total comprehensive income for the year 8,573,680 4,634,280 13,321,213
Source: BNR, 2012 Financial Statements
1.3. Dividends
Considering the Net Profit of the period under review (Rwf 6,903,748,000), the proposed dividend for the year ended 30 June 2012 is amounted to Rwf 1,506,630,000.
1.4. Financial position
During the period under review, compared to the six month period ended 30 June 2011, the as-sets of the Bank increased by Rwf 29.464 billion (5%). This was mainly due to the increase in foreign assets (17%). This increase is mainly explained by the cash flow received from the budget support partners; these were WB, (AfDB), DFID, EU and others. Actually the foreign assets cur-rent account was increased significantly.
The other factor that added to the growth in assets is the proceed from IFC swap operations that increased from Rwf 1.479 billion to Rwf 5.953 billion, loans and advance to staff that increased from Rwf 4.235 billion to Rwf 5.007 billion and increase of 39% in property and equipment result-ing from acquisition of land (Rwf 0.025 billion), building (Rwf 1.186 billion), office furniture (Rwf 0.655), computer equipment (Rwf 0.350 billion) and vehicle (Rwf 0.065 billion).

89
Activities report January - June 2012
BNR
Table 50: Statement of Financial Position as at 30 June 2012Details 30-Jun-12 30-Jun-11 31-Dec -10
Note Rwf ‘000’ Rwf ‘000’ Rwf ‘000’ASSETSCash and cash equivalents 5,955,905 6,128,520 1,530,077
Foreign assets 9 519,179,264 442,967,641 481,329,713
International Monetary Fund Quota 10 74,251,386 76,965,858 73,003,334
Due from Government of Rwanda 11 38,597,550 72,166,089 57,850,366
Loan and advance to banks 12 1,918,484 8,313,257 10,899,747
Duefromforeignfinancialinstitutions 13 5,953,536 1,479,511 1,479’511
Loan and advance to staff 14 5,007,285 4,235,648 4,098,586
Other investment 15 6,164 6,164 219,374
Investment property 16 73,109 87,942 87,942
Property and equipment 17 6,379,003 4,586,327 7,718,231
Intangible assets 18 560 3,122 3,330
Other assets 19 18,673,814 29,591,693 1,269,511
TOTAL ASSETS 675,996,060 646,531,772 636,505,400
LIABILITIESCurrency in circulation 20 129,876,564 115,051,253 104,140,320
Government deposits 21 156,513,929 175,547,413 236,722,357
Duetolocalfinancialinstitutions 22 169,016,173 124,906,462 94,374,197
Due to International Monetary Fund 23 153,801,483 160,133,067 151,884,907
Foreign liabilities 24 7,528,397 2,333,896 2,086,447
Other liabilities 25 10,437,869 24,536,584 5,849,788
TOTAL LIABILITIES 627,174,415 602,508,675 595,058,016
EQUITY AND RESERVESShare capital 26 7,000,000 7,000,000 7,000,000
General Reserve Fund 27 8,505,380 8,933,479 10,436,274
Other Reserves 28 26,412,517 28,089,618 24,011,110
Profitfortheyear 6,903,748
TOTAL EQUITY AND RESERVES 48,821,645 44,023,097 41,447,384TOTAL LIABILITIES AND EQUITY 675,996,060 646,531,772 636,505,400
Source: BNR, 2012 Financial Statements
Total liability and equity has increased by Rwf 29.464 billion (5%). This is explained by the in-crease in currency in circulation (13%), liability to local financial institutions (35%), foreign liabilities (223%). The recorded net surplus for the period of Rwf 6.903 billion also significantly contributed to the growth in liability and equity. However, during the period, Government deposits and other liabilities were decreased by 11% and 57% respectively.
1.5. Changes in Equity
1.5.1. Share Capital
As per the article 2 of Law n° 55/2007 of 30 November 2007 governing the National Bank of Rwanda, these financial statements maintained the authorized and fully paid share capital of the bank at 7 billion of Rwandan Francs. The share capital is entirely subscribed by the Government of Rwanda and the shares do not have a par value.

90
Activities report January - June 2012
BNR
1.5.2. Reserves
During the year, the Bank generated operating income of Rwf 6.9 billion. At 30 June 2012, our reserves were Rwf 49 billion (30 June 2011: Rwf 44 billion).
Table 51: Statement of Changes in Equity for the Twelve Month Period Ended 30 June 2012
Share capital General reserve fund
Other reserves Total
Frw ‘000’ Frw ‘000’ Frw ‘000’ Frw ‘000’
At 31 Dec 2010 7,000,000 10,436,274 24,011,110 41,447,384
Comprehensive income for the period - 4,604,794 - 4,604,794
Other comprehensive income for the period
Fair value movement on available for sale financialassets - - 29,486 29,486
Dividend paid for 2010 - (2,058,567) - (2,058,567)
Transfer to other reserves - (4,049,022) 4,049,022 -
As at 30 June 2011 7,000,000 8,933,479 28,089,618 44,023,097
Comprehensive income for the period - 6,903,748 - 6,903,748
Other comprehensive income for the period
Fair value movement on available for sale financialassets - - (1,669,932) (1,669,932)
Dividend paid for June 2011 - (416,220) - (416,220)
Transfer to other reserves
Foreign assets (exchange) revaluation gain - (4,688,116) 4,688,116 -
Staff Welfare Fund - (265,876) 265,876 -
As at 30 June 2012 7,000,000 10,467,015 31,373,677 48,840 ,692
Source: BNR, 2012 Financial Statements
The general reserve fund is a fund into which 20% of the net annual profits of the Bank is trans-ferred at the end of each financial year. This is after allowing for expenses for operation and after deducting all charges, including depreciation and estimated liabilities. General Reserves Fund has increase by 17%.
Other reserve constitutes staff welfare, land revaluation reserves, fair value reserve and transla-tion reserve. These were increased by 112% compared to position at 30 June 2011.
1.6. Key Activities Related Performance.
During the period under review, the Bank pursued development and recurrent activities at a good performance level. For development activities, the Bank pursued four big projects and seven capital replacement and other new facilities. The five big projects includes, IT-infrastructure project which includes, Core banking & ERP project, data centre creation, interface RIPPS/IBIS, Constructing Branch Offices, Commemoration monuments and Constructing New Parking. For capital replace-ment and other new facilities, activities performed ranges from building remodelling works, replacing old equipment and customer care facilities for improving image and reputation of the Bank.

91
Activities report January - June 2012
BNR
The major part of recurrent activities performance is relating to staff recruitment and capacity building. Others are monetary policy liquidity management and goods and services. Below are the summarized targets and achievements:
1.6.1. Development Activities Performance.
A. Big projects
Nr Description Target end June 2012 Achievement end June 20121. IT- Infrastructure Project
• Core Banking & ERP Project
Preliminary study • Strategy roadmap• Technicalspecifications• Tendering process and contract negotiation
Done
• Data centre Creation Full completion Done
• Interface RIPPS/IBIS Full completion 90%completed,onlyfineturningisremaining
2. Branch Building Construction • Huye • One year contract Completion, January 2013• Musanze • One year contract Completion, January 2013• Rusizi • One year contract Completion, January 2013• Rwamagana • One year contract Completion, January 2013
3. Commemoration monument Full completion CompletedandofficiallylaunchedinApril 2012
4. New Parking Construction Full completion OfficialreceptiononJuly15,2012
B. Capital replacement and other new facilities
Nr Description Target end June 2012 Achievement end June 2012
1. Building Remodelling works Done
2. IT – Equipment 54 new computers, 46 laptops, 3 servers Done
3. Security Equipment CCT System, access control system, fire detec-tion and automatic fire suppression systems
Delivery done, only clearing exercise is in process
4. Currency Processing System
• Counting and Sorting Machines:
Remodelled notes destructing room,Notes counting machine and note binding ma-chine acquired
Done
• Air conditioning Remodelled air ventilation in sorting and count-ing room Done
5. Other facilities
• Equipment and tools Office equipment and materials for HQ and Branches acquired Done
6. Currency Acquisition Bank notes and coins (for a three year period) delivered Done
7. Customer care facilities: image and reputation
• TV screens Acquisition and installation Done
• Website development Full completion Done

92
Activities report January - June 2012
BNR
1.6.2. Recurrent Activities Performance.
Description Target end June 2012 Achievement end June 2012
1. Capacity building
• 3 Years capacity Building Plan Implementation
Increased manpower capacity and ability through short courses, professional courses, masters and PhD programs.
• Sponsored 400 staff members who attended short courses and attachments to other banks
• Sponsored15 staff members enrolled in professional courses (ACCA, CFA,)
• Sponsored 4 staff in Masters and 1 in PhD.
2. Staff recruitment
Capable and skilled staff in various positions as per the new organisational structure: 2 DG, 2 Directors, 5 Managers, 11 Inspectors, 2 Internal Auditors, 2 Economists, 9 IT Officers, 2 Financial Analysts and 3 Research staff, 2 legal officers, 3 tellers.
Recruited: 1 DG, 2 Directors, 5 Managers, 11 Inspectors, 2 Internal Auditors, 4 Economists, 9 IT Officers, 2 Finan-cial Analysts and 3 Research staff .
3. Monetary policy management
• Liquidity management 7% as average interest on REPOS operations. Thus, interest paid on REPOS operations: Rwf 4.2 billion
Interest paid on REPOS operations: Rwf 5.06 billion, that is 129%.
Annual interest rate on T-Bills: 8%. Thus, interest paid on T-Bills: Rwf 0.277 billion
Interest paid on T-Bills: Rwf 0.715 billion, that is 258%
4. Good and Services
• Officesupplies Rwf 0.075 billion spending Rwf 0.047 billion spending, end users satisfied
• Travel (missions) costs Rwf 0.150 billion spending Rwf 0.129 billion spending , end us-ers satisfied
• Consultancies Rwf 0.831 billion spending Rwf 0.437 billion spending, end users satisfied
• Printing and publication costs Rwf 0.117 billion spending Rwf 0.21 billion spending , end users satisfied
• Repairs and maintenance Rwf 0.367billion spending Rwf 0.202 billion spending , end us-ers satisfied
IX.1.2 PLANS FOR 2012/2013
The Bank has planned to increase its revenue collection by 34%, increase its operating costs by 27% and increase its capital expenditure by 65%. Operating income is expected to increase by 200%. A summarized snap picture below indicates the increasing variation.
Table 52: Summary of 2012/2013 Budget.2011/12 Budget
Rwf “000” 2012/13 Budget
Rwf “000”% increaseRwf “000”
1 Revenues 20,626,047 27,637,539 342 Operating Expenses 18,047,085 22,880,434 273 Net Income (1-2) 1,578,962 4,757,105 2014 Capital Expenditure 9,263,324 17,167,057 855 Deferred Expenses 4,297,187 5,232,783 226 Total Capital Budget (4+5) 13,560,511 22,399,840 65
Source: BNR, 2012 Financial Statements

93
Activities report January - June 2012
BNR
The above expectation is built on the following assumptions.
• The average level of reserves: 900 million USD.
• Interest rates estimated at:
CurrencyJuly 2012-July 2013
Interest rates on Call money Interest rates on Deposits
USD 0.05% 0.25%
EUR 0.25% 1.00%
GBP 0.15% 0.50%
SDR 0.20% -
• Exchange rates estimated at:
Currency July 2012-July 2013
USD 616
EUR 801
GBP 967
SDR 955
IX.1.3 WAY FORWARD TOWARD STANDARD FINANCIAL REPORTING
3.1 Professionalism in accounting and reporting
The Bank shall ensure that basic information is available to guide good financial management in a sense of reducing risks of business failure. In this framework, modern performance-oriented financial management tools such as Balance Score Card shall be introduced to all staff and imple-mented throughout all Departments. Furthermore, performance planning and budgeting as well as timely recording of budget commitments shall be observed by Departments to ensure complete and accurate financial information in the framework of the accrual principle of accounting.
3.2 Capacity Building for financial reporting staff
We need to align BNR accounting and reporting systems with those of other central banks. Ef-forts will be put in building the capacity of staff in charge of recording, reconciliation and reporting through in-house trainings, professional exposure and enrolment in professional courses. Efforts will also be put in computerising BNR accounting processes and financial reporting systems.
IX.2 REPORT AND FINANCIAL STATEMENTS

94
Financial statements
BNR
FINANCIAL STATEMENTSFOR THE YEAR ENDED 30 JUNE 2012
TABLE OF CONTENTS PAGE
Directors,officersandadministration 95
Directors’ Report 96
Statement of Directors’ Responsibilities 97
Report of the Independent Auditors 98
Statement of Comprehensive income 99
Statementoffinancialposition 100
Statement of Changes in Equity 101
StatementofCashflows 102
Notes to the Financial Statements 103 - 144

95
Financial statements
BNR
DIRECTORS, OFFICERS AND ADMINISTRATIONFOR THE YEAR ENDED 30 JUNE 2012
DIRECTORS
Claver GATETE Governor and Chairman (Appointed on 6 May 2011)François KANIMBA Governor and Chairman (Retired on 6 May 2011)Monique NSANZABAGANWA Vice-Governor and Member (Appointed on 6 May 2011)Uzziel NDAGIJIMANA MemberOdette UWAMARIYA MemberLilian KYATENGWA MemberRUGWABIZA MINEGA Leonard Member (Appointed on 4 November 2011)
SENIOR MANAGEMENT
Claver GATETE GovernorMonique NSANZABAGANWA Vice-GovernorRUSUHUZWA KIGABO Thomas Director General- Monetary Policy and ResearchNTARE Joy Director General- Financial StabilitySEBABI John Bosco Director General- OperationsIHOGOZA Frances Director General- Finance and AdministrationMURASIRA Appolinaire Director - Human Resources and DevelopmentNZABONIKUZA Joseph Director - Monetary Policy and Economic AnalysisMWITIREHE Viviane Director - StatisticsKAGOYIRE Françoise Director - Banks SupervisionKAVUGIZOSHYAMBAKevin Director-MicrofinanceSupervisionSANGANO Bonaventure Director - Non Bank Financial SupervisionGATERA SEBAGABO Jonathan Director - Financial MarketsSEKAGIRIMANA Celestin Director - Currency and Banking OperationsBAGIRISHYA KARAMUKA John Director - Payment SystemsBIGIRUMWAMI Emmanuel Director - Finance MUHIRE Modeste Director - Planning and Corporate AffairsMURAGIRA Uwimana Enid Director - Internal Audit RUTAYISIRE MUNYURA Bosco Director - Information and Communication TechnologyRUTABINGWA Jean Paul Director - Legal ServicesNTAGANDA Cyril Director - Risk ManagementMUJAWIMANA Alphonsine Director - General ServicesINGABIREJosiane Director-Governor’sOffice
REGISTERED OFFICENational Bank of RwandaAvenue Paul VIPO Box 531Kigali, Rwanda
BRANCHES
Southern BranchPO Box 622Huye, Rwanda
Eastern Branch PO Box 14 Rwamagana, Rwanda
Northern Branch PO Box 127Musanze, Rwanda
Western Branch PO Box 462Rusizi, Rwanda
AUDITORSKPMG Rwanda LimitedOmega BuildingBoulevard de I’OUAPO Box 6755Kigali, Rwanda
MAIN LAWYERSJean Paul RutabingwaAvenue Paul VIPO Box 531Kigali, Rwanda

96
Financial statements
BNR
DIRECTORS’ REPORT FOR THE YEAR ENDED 30 JUNE 2012
Thedirectorssubmittheirreporttogetherwiththeauditedfinancialstatementsfortheyearended 30 June 2012, which shows the state of affairs of the Bank.
1. Incorporation The Bank is incorporated under the Law No 55/2007 of 30/11/2007.
2. Principal activitiesThe Bank is established and administered under the law with the principal object of formulating and implementing monetary policy directed to achieving and maintaining stability in the general level of prices. It is also the responsibility of the Bank to foster liquidity, solvency and proper functioning of a stable and competitive market-based financialsystem.
ThedirectorsresolvedtochangethefinancialreportingdateoftheBankfrom31st Decemberto30June.The2012setoffinancialstatementshasbeenpreparedfor12monthsperiodended30June2012while2011financialstatementswerepreparedfora6 month period ended 30 June 2011.
3. ResultsThe results for the period are set out on page 101.
4. DividendThe board of directors recommends the payment of a dividend of Frw 1,506,630,000 (2011: Frw 416 220 016)
5. DirectorsThe directors who served during the period and up to the date of this report are listed on page 95.
6. AuditorsKPMG Rwanda Limited was appointed auditors in 2011 and has indicated their willingnesstocontinueinoffice.
BY ORDER OF THE BOARD
BOARD CHAIRMANDate:

97
Financial statements
BNR
STATEMENT OF DIRECTORS’ RESPONSIBILITIES
TheDirectorsareresponsibleforthepreparationandpresentationofthefinancialstatementsofNationalBankofRwandasetoutonpages101to145whichcomprisethestatementoffinancialposition as at 30 June 2012, and the statement of comprehensive income, statement of changes inequityandstatementofcashflowsfortheyearthenended,andasummaryofsignificantaccounting policies and other explanatory notes.
The Directors responsibility includes: determining that the basis of accounting described in Note 2 isanacceptablebasisforpreparingandpresentingthefinancialstatementsinthecircumstances;preparationandpresentationofthefinancialstatementsinaccordancewithInternationalFinancialReporting Standards and Law No 55/2007 of 30 November 2007 relating to statutes of National Bank of Rwanda and for such international control as the directors determine is necessary to enablethepreparationofthefinancialstatementsthatarefreefrommaterialmisstatementswhether due to fraud or error.
TheDirectorsacceptresponsibilityforthefinancialstatements,whichhavebeenpreparedusingappropriate accounting policies supported by reasonable and prudent judgments and estimates, in conformity with International Financial Reporting Standards and in the manner required by the Law No. 55/2007 of 30 November 2007 relating to statutes of the National Bank of Rwanda. The DirectorsareoftheopinionthatthefinancialstatementsgiveatrueandfairviewofthestateofthefinancialaffairsoftheBankandofitsoperatingresults.
The Directors further accept responsibility for the maintenance of accounting records which may berelieduponinthepreparationoffinancialstatements,aswellasadequatesystemsofinternalfinancialcontrol.
The Directors have made an assessment of the Bank’s ability to continue as a going concern and have no reason to believe the Bank will not be a going concern for at least the next twelve months from the date of this statement.
Approval of the financial statements
Thefinancialstatements,asindicatedabove,wereapprovedbytheBoardofDirectorson__________________and were signed on its behalf by:
__________________________ __________________________
Governor Director
Date: Date:

98
Financial statements
BNR
REPORT OF THE INDEPENDENT AUDITORS TO THE MEMBERS OFNATIONAL BANK OF RWANDA
WehaveauditedthefinancialstatementsofNationalBankofRwandasetoutonpages101to145whichcomprisethestatementoffinancialpositionoftheBankat30June2012,andthestatementofcomprehensiveincome,statementofchangesinequityandstatementofcashflowsforyearthenended,andasummaryofsignificantaccountingpoliciesandotherexplanatorynotes.
Directors’ responsibility for the financial statements
As stated on page 97, the directors are responsible for the preparation and fair presentation of thesefinancialstatementsinaccordancewithInternationalFinancialReportingStandards,andtherequirements of Law No. 55/2007 of 30 November 2007 relating to statutes of the National Bank of Rwanda, and for such internal control as the directors determine is necessary to enable the preparation offinancialstatementsthatarefreefrommaterialmisstatement,whetherduetofraudorerror.
Auditor’s responsibility
Ourresponsibilityistoexpressanopiniononthesefinancialstatementsbasedonouraudit.Weconducted our audit in accordance with International Standards on Auditing. Those standards require that we comply with relevant ethical requirements and plan and perform the audit to obtain reasonableassurancewhetherthefinancialstatementsarefreefrommaterialmisstatement.
An audit involves performing procedures to obtain audit evidence about the amounts and disclosures in the financial statements. The procedures selected depend on our judgment,includingtheassessmentoftherisksofmaterialmisstatementofthefinancialstatements,whetherdue to fraud or error. In making those risk assessments, we consider internal controls relevant to theentity’spreparationandfairpresentationofthefinancialstatementsinordertodesignauditprocedures that are appropriate in the circumstances, but not for the purpose of expressing an opinion on the effectiveness of the entity’s internal controls. An audit also includes evaluating the appropriateness of accounting policies used and the reasonableness of accounting estimates madebymanagement,aswellasevaluatingtheoverallpresentationofthefinancialstatements.
Webelievethat theauditevidencewehaveobtainedissufficientandappropriatetoprovideabasis for our opinion.
Opinion
Inouropinion, thefinancialstatementsgiveatrueandfairviewof thefinancialpositionof theBankasat30June2012,andtheBank’sfinancialperformanceandcashflowsfortheyearthenended in accordance with International Financial Reporting Standards and Law No. 55/2007 of 30 November 2007 relating to statutes of the National Bank of Rwanda.
John NdunyuKPMG Rwanda LimitedCertifiedPublicAccountantsP. O. Box 6755KigaliRwanda
Date:

99
Financial statements
BNR
STATEMENT OF COMPREHENSIVE INCOME FOR THE YEAR ENDED 30 JUNE 2012
NoteYear
ended 30 June 2012
Six months ended
30 June 2011
Frw‘000 Frw‘000Interest Income 3 5,437,107 3,100,113
Interest expense 4 (310,907) (159,123)
Net interest income 5,126,200 2,940,990 Net fees and commission (expense) / income 5 (193,948) 17,749
Foreign exchange gain 6 13,866,875 6,657,767
Other operating income 7 899,826 536,859
Operating income 19,698,953 10,153,365 Operating expense 8 (12,795,206) (5,548,571)
Profit for the year 6,903,747 4,604,794 Other comprehensive income - -
Netchangesinfairvalueonavailableforsalefinancialassets 1,669,932 29,486
Total comprehensive income for the year 8,573,679 4,634,280
Thenotessetoutonpages103to145formanintegralpartofthesefinancialstatements.

100
Financial statements
BNR
STATEMENT OF FINANCIAL POSITION AS AT 30 JUNE 2012
30-Jun-12 30-Jun-11ASSETS Note Frw ‘000 Frw‘000
Cash and cash equivalents 5,955,905 6,128,520 Foreign assets 9 519,179,264 442,967,641 International Monetary Fund Quota 10 74,251,386 76,965,858 Due from Government of Rwanda 11 38,597,550 72,166,089 Loan and advance to banks 12 1,918,484 8,313,257 Duefromforeignfinancialinstitutions 13 5,953,536 1,479,511 Loan and advances to staff 14 5,007,285 4,235,648 Other investment 15 6,164 6,164 Investment property 16 73,109 87,942 Property and equipment 17 6,379,003 4,586,327 Intangible assets 18 560 3,122 Other assets 19 18,673,814 29,591,693
TOTAL ASSETS 675,996,060 646,531,772
LIABILITIES
Currency in circulation 20 129,876,564 115,051,253 Government deposits 21 156,513,929 175,547,413 Duetolocalfinancialinstitutions 22 169,016,173 124,906,462 Due to International Monetary Fund 23 153,801,483 160,133,067 Foreign liabilities 24 7,528,397 2,333,896 Other liabilities 25 10,437,869 24,536,584
TOTAL LIABILITIES 627,174,415 602,508,675
EQUITY AND RESERVES
Share capital 26 7,000,000 7,000,000 General Reserve Fund 27 8,505,380 8,933,479 Other Reserves 28 26,412,518 28,089,618 Profitfortheyear 6,903,747 -
TOTAL EQUITY AND RESERVES 48,821,645 44,023,097
TOTAL LIABILITIES AND EQUITY 675,996,060 646,531,772
ThefinancialstatementswereapprovedbytheBoardofDirectorsforissueonandsignedonitsbehalf by:
_____________________________ ______________________________Governor DirectorDate: Date:
Thenotessetoutonpages103to145formanintegralpartofthesefinancialstatements.

101
Financial statements
BNR
STATEMENT OF CHANGES IN EQUITY FOR THE YEAR ENDED 30 JUNE 2012
Share capitalGeneral reserve
fundOther
reserves TotalFrw ‘000’ Frw ‘000’ Frw ‘000’ Frw ‘000’
At 31 Dec 2010
7,000,000
10,436,274 24,011,110
41,447,384
Comprehensive income for the period
- 4,604,794 - 4,604,794
Other comprehensive income for the periodFair value movement on available forsalefinancialassets
- - 29,486 29,486
Dividend paid for 2010 - (2,058,567) - (2,058,567)Transfer to other reserves - (4,049,022) 4,049,022 -
As at 30 June 2011 7,000,000 8,933,479 28,089,618 44,023,097
Comprehensive income for the period
- 6,903,747 - 6,903,747
Other comprehensive income for the periodFair value movement on available forsalefinancialassets
- - (1,669,932) (1,669,932)
Dividend paid for June 2011 - (416,220) - (416,220)Transfer to other reserves - Foreign assets (exchange) revaluation gain
- (4,688,116) 4,688,116 -
Staff Welfare Fund - (265,876) 265,876 -
As at 30 June 2012 7,000,000 10,467,015 31,993,859 48,840,692
Thenotessetoutonpages103to145formanintegralpartofthesefinancialstatements.

102
Financial statements
BNR
STATEMENT OF CASH FLOWS FOR THE YEAR ENDED 30 JUNE 2012
NoteYear ended
30 June 2012
Six months ended 30
June 2011
Net cash flows from operating activities 30 64,075,835 (42,478,987)
Investing activitiesPurchase of property, plant and equipment 17 (2,457,052) (137,702)Purchase of intangible assets - (1,608)Proceeds from sale of equipment 11,134 2,302
Net cash outflow from investing activities (2,445,918) (137,008)
Financing activitiesCurrency in circulation 20 14,825,311 10,910,933Dividends paid (416,220) (2,058,567)Net cash inflow/(outflow) from financing activities 14,409,091 8,852,366
Net increase/(decrease) in cash and cash equivalents 76,039,008 (33,763,269)
Cash and cash equivalents at the beginning of the year 449,096,161 482,859,790
Cash at end of the period 31 525,135,169 449,096,161

103
Financial statements
BNR
1. REPORTING ENTITY
The National Bank of Rwanda (the “Bank”) is wholly owned by the Government of Rwanda. The Bank is established by and derives its authority and accountability from Law No. 55/2007 of 30 November 2007 relating to statutes of the National Bank of Rwanda and isdomiciledinRwanda.TheBankalsoactsasbanker,advisorandfiscalagentoftheGovernment of Rwanda.
Article6ofthatLawspecifiesthattheBankshallperformthefollowingduties:
• To formulate and implement the monetary policy; • To organize, supervise and regulate the local foreign exchange market; • Tosuperviseandregulatetheactivitiesofthelocalfinancialinstitutionsnotably
banks,microfinanceinstitutions;insurancecompanies,socialinstitutions,collectiveplacement companies and pension fund institutions;
• To supervise and regulate the payment systems;• To print, mint and manage money;• Toholdandmanageofficialforeignexchangereserves;• To act as State Cashier,• To carry out any other task that this Law or any another law may assign to it.
Article2ofthesameLaw,fixestheBank’ssharecapitaltoseven(7)billionRwandaFrancs (Frw). In order to comply with it, during its meeting of 28 June 2008, the Board of Directors decided to increase the share capital from 2 billion Frw to 7 billion Frw by incorporating an amount of Frw 5 billion from the general reserve fund account.
In accordance with article 66 of the Law No 55/2007 of 30 November 2007, the Bank’s netprofitisappropriatedasfollows:
• Apartof20%ofthenetprofitisincorporatedintheGeneralReserveAccount.• After all other appropriations to reserves deemed necessary by the Board of
Directors, the remaining balance is paid to the Public Treasury.

104
Financial statements
BNR
2. SIGNIFICANT ACCOUNTING POLICIES
(a) Basis of preparation
(i) Statement of compliance
Thefinancialstatementshavebeenpreparedinaccordance,andcomplywithInternational Financial Reporting Standards (IFRS) and Law No 55/2007 relating to the statutes of the National Bank of Rwanda.
(ii) Basis of measurement
Thefinancialstatementsarepreparedunderthehistoricalcostbasisexceptforthe following:
• financialinstrumentsatfairvaluethroughprofitorlossaremeasuredatfairvalue;• available-for-salefinancialassetsaremeasuredatfairvalue;• buildings measured at revalued amounts
(iii) Use of estimates and judgments
ThepreparationoffinancialstatementsinconformitywithIFRSrequirestheuseof estimates and assumptions that affect the reported amounts of assets and liabilities and disclosure of contingent assets and liabilities at the date of the financialstatementsandthereportedamountsofrevenuesandexpensesduringthe reporting period. Although these estimates are based on the directors’ best knowledge of current events and actions, actual results ultimately may differ from those estimates.
The estimates and underlying assumptions are reviewed on an ongoing basis. Revisions to accounting estimates are recognised in the period in which the estimate is revised if the revision affects only that period or in the period of the revision and future periods if the revision affects both current and future periods.
Themostsignificantuseofjudgmentsandestimatesaremadeforthefollowingitems:
Impairment of loans and advances
The Bank reviews its loans and advances at each reporting date to assess whetheranallowanceforimpairmentshouldberecognisedinprofitorloss.Inparticular, judgment by the directors is required in the estimation of the amount andtimingoffuturecashflowswhendeterminingthelevelofallowancerequired.Such estimates are based on the assumptions about a number of factors and actual results may differ, resulting in future changes in the allowance.
Inadditiontospecificallowancesagainstindividualsignificantloansandadvances, the Bank makes a collective impairment allowance against exposures which,althoughnotspecificallyidentifiedasrequiringaspecificallowance,havea greater risk of default than when originally granted. This takes into consideration such factors as any deterioration in industry, technological obsolescence, as well asidentifiedstructuralweaknessesordeteriorationincashflows.

105
Financial statements
BNR
Impairment of equity investment
TheBank’sinvestmentinequityisreviewedeverytimethereisasignificantand prolonged decline in its fair value compared to its cost or where objective evidence of impairment exists.
Property, equipment and intangible assets
Critical estimates are made by management in determining depreciation and amortisation rates for property, equipment, and intangible assets. The rates used are set out in the accounting policies (d) and (e) below.
(iv) Functional and presentation currency
ThesefinancialstatementsarepresentedinRwandaFrancs(Frw)whichistheBank’s functional currency.
Exceptasotherwiseindicated,financialinformationpresentedinRwandaFrancshas been rounded to the nearest thousands.
(b) Revenue recognition
RevenueisrecognisedwhenitisprobablethattheeconomicbenefitswillflowtotheBankandtherevenuecanbereliablymeasured.Thefollowingspecificrecognition criteria must also be met before revenue is recognised:
(i) Interest income and expenses
Interestincomeandexpensearerecognisedintheprofitorlossforallinterestbearing instruments on an accrual basis using the effective interest method based on the actual purchase price.
The effective interest rate is the rate that exactly discounts the estimated futurecashpaymentsandreceiptsthroughtheexpectedlifeofthefinancialasset or liability (or, where appropriate, a shorter period) to the carrying amountofthefinancialassetorliability.
When calculating the effective interest rate, the Group estimates future cash flowsconsideringallcontractualtermsofthefinancialinstrument,butnotfuture credit losses.
The calculation of the effective interest rate includes all transaction costs and fees and points paid or received that are an integral part of the effective interest rate. Transaction costs include incremental costs that are directly attributabletotheacquisitionorissueofafinancialassetorliability.

106
Financial statements
BNR
2. SIGNIFICANT ACCOUNTING POLICIES (Continued)
Interestincomeincludescouponsearnedonfixedincomeinvestmentandtrading securities and accrued discount and premium on treasury bills and other discounted instruments.
(ii) Fees and commission income
Feesandcommissionincome,whicharisefromfinancialservicesprovidedbythe Bank, are recognised when the corresponding services are provided.
(iii) Other income and expenses
The non interest income and expenses are recognised in the period in which they are earned or incurred. They are not accrued if their recoverability is considered doubtful.
(c) Translation of foreign currencies
Transactions in foreign currencies are converted into Rwanda Francs at rates ruling at the transaction dates. Assets and liabilities at the reporting date which are expressed in foreign currencies are translated to Rwanda Francs at the spot exchange rate ruling at that date. The resulting differences from conversion and translationarerecognisedinprofitorloss.
Non-monetary items that are measured in terms of historical cost in a foreign currency are translated using the exchange rates as at the dates of the initial transactions.
Non-monetary items measured at fair value in a foreign currency are translated using the spot exchange rates at the date when the fair value was determined.
(d) Property and equipment
Property and equipment are measured at cost/revaluation less accumulated depreciation and accumulated impairment losses. Changes in expected useful life are accounted for by changing the depreciation period or method. Depreciation is calculated using the straight-line method to write down the cost of property and equipment to their residual values over their estimated useful lives. Land is not depreciated.

107
Financial statements
BNR
The annual depreciation rates in use for the current and comparative periods for each category are:
Buildings 4-20%Lift for the headquarter 10%Computer equipment 33%Currency processing machines 20%Motor vehicles 25%
Furniture, fittings and office equipment10-20%
Security equipment 15%
Property that is being constructed or developed for future use to support operationsisclassifiedascapitalWork–in–Progress(WIP)andstatedatcostuntilconstructionordevelopmentiscomplete,atwhichtimeitisreclassifiedaspropertyand equipment in use.
Subsequent expenditure is capitalised only when it increases future economic benefitsandmeetstherecognitioncriteria.Expenditureincurredtoreplaceamajorcomponent of an item of property and equipment is accounted for separately and capitalised while the replaced component is derecognised.
All other expenditure items which do not meet the recognition criteria are recognisedinprofitorlossastheyareincurred.
An item of property and equipment is derecognised upon disposal or when no futureeconomicbenefitsareexpectedfromitsuseordisposal.Anygainorloss arising on de-recognition of the asset (calculated between the net disposal proceedsandthecarryingamountoftheasset)isrecognisedinprofitorlossasother income or other expense in the year the asset is derecognised.
The assets residual values, useful lives and methods of depreciation are reviewed andadjustedifappropriateateachfinancialyearend.Anasset’scarryingamountis written down immediately to its recoverable amount if the carrying amount is greater than its estimated recoverable amount. The recoverable amount is the higher of the asset’s fair value (less costs to sell) and value in use.
(e) Intangible asset
Intangible assets acquired separately are measured on initial recognition at cost. Following initial recognition, intangible assets are carried at cost less any accumulated amortisation and accumulated impairment losses.

108
Financial statements
BNR
2. SIGNIFICANT ACCOUNTING POLICIES (Continued)
Intangible assets that are being developed for future use to support operations are classifiedasWork–in–Progress(WIP)andstatedatcostuntildevelopmentiscomplete,atwhichtimetheyarereclassifiedasIntangibleassets.
Theusefullivesofintangibleassetsareassessedtobefiniteandareamortisedover the useful economic life. The amortisation expense on intangible assets with finitelivesisrecognisedintheStatementofComprehensiveIncome.
Amortisation is calculated using the straight line method to write down the cost of intangible assets to the residual values over the estimated useful life as follows:
Computer software - Four years
Amortisation methods, useful lives and residual values are reviewed at each financialyearendandadjustedwhendeemedappropriate.
(e) Intangible asset
Subsequent expenditure on software assets is capitalised only when it increases thefutureeconomicbenefitsembodiedinthespecificassettowhichitrelates.Allother expenditure is expensed as incurred.
The useful lives of intangible assets are assessed to be finite and these assets areamortisedovertheirusefuleconomiclife.Theamortisationperiodofassetswithafiniteusefullifearereviewedatleastateachfinancialyearendandadjustedifappropriate.Theamortisationexpenseonintangibleassetswithfinitelivesisrecognisedinprofitorloss.
Amortisation is calculated using the straight-line method to write down the cost of intangible assets to their residual values over their estimated useful lives as follows:
Computer software 33.3 % (annual amortisation rate)
The gain or loss arising from the derecognition of an intangible asset shall be determined as the difference between proceeds, if any, and the carrying amount of theasset.Itshallberecognisedinprofitorlosswhentheassetisderecognized.
(f) Stocks of consumables
Stocks of consumables are valued at the lower of cost and net realizable value. Cost is estimated using the weighted average method. Provisions are made for all anticipated stock losses, impairment and obsolescence.

109
Financial statements
BNR
(g) Currency printing and minting costs
Banknotes printing expenses for each denomination which include ordering, printing, freight, insurance and handling costs are initially deferred. Based on the currency issued into circulation, the respective proportional actual costs incurred are released totheprofitorlossfromthedeferredcostsaccountovertheusefulperiod(lifespan)of each banknotes denomination. The deferred amount is recognised as prepayment and represents unissued banknotes (currency) stock. Cost of coins minted is expensed in full on delivery in the year of purchase/acquisition. The life span of each bank note denomination is as described in note 3(c).
(h) Financial instruments
Afinancialinstrumentisanycontractthatgivesrisetobothafinancialassetofoneentityandafinancialliabilityorequityinstrumentofanotherentity.
(i) Date of recognition
Purchasesorsalesoffinancialassetsthatrequiredeliveryofassetswithinthe time frame generally established by regulation or convention in the marketplace are recognised on the trade date, which is the date that the Bank commits to purchase or sell the asset.
(ii) Recognition and initial measurement
Theclassificationoffinancialinstrumentsatinitialrecognitiondependsonthepurposeforwhichthefinancialinstrumentswereacquiredandtheircharacteristics.Allfinancialinstrumentsaremeasuredinitiallyattheirfairvalueplus,inthecaseoffinancialassetsandfinancialliabilitiesnotatfairvaluethroughprofitorloss,anydirectlyattributablecostsofacquisitionorissueofthefinancialassetorliability.
(h) Financial Instruments (continued)
(iii) Classification and measurement
TheBankdeterminestheclassificationofitsinvestmentsatinitialrecognition.The main categories include:

110
Financial statements
BNR
2. SIGNIFICANT ACCOUNTING POLICIES (Continued)
Loans and receivables
Loans and receivables are advances made by the bank including loans and advances to staff. They are initially measured at the fair value and subsequently at the amortized cost using effective interest rate. Amortized cost represents the amounts at which the financialinstrumentsweremeasuredatinitialrecognitionminusprincipalrepayments,plus or minus the cumulative amortization using the effective interest rate of any difference between the initial amount and the maturity amount and minus any write down for impairment or un-collectability.
In its capacity as cashier and banker of the Government, the Bank may make direct advancestotheGovernmentforthepurposeofoffsettingfluctuationsbetweenGovernment receipts and expenditure. In accordance with article No 49 of the Law No 55/2007, the total amount of the advances to Government shall not exceed eleven per cent of the gross ordinary revenue of the Government collected during theprecedingfiscalyear.Interestischargedattheaveragedailyinter-bankmoneymarket rate and is paid quarterly by the Government.
In accordance with the agreement No 5/96 between BNR and the Government of Rwanda dated 6 February 1996, all the other unpaid loans granted to the Government before 31 December 1994, in addition to the balance of the revaluation account as at 6 March 1995 were consolidated and are charged at an interest rate of 2 % per year. From January 2002, the recovery of the principal of that consolidated debt is made through a reduction of 30 % of the annual dividend payable to the Government.
Asthelenderoflastresort,theBankmaygrantloansoradvancesforfixedperiod not exceeding seven days to commercial banks that pledge securities specifiedbytheBank.Interestrateschargedtothesebanksaredeterminedbythe Bank based on the inter-bank money market rates.
The Bank manages certain lines of credit granted to the Government of Rwanda createdinordertofacilitatespecificeconomicactivities,anditcanalsocreateitsown funds with the aim of encouraging that sector.
Specificprovisionsforloanimpairmentaremadeeachtimetheyareconsideredas irrecoverable in accordance with instruction No 03/2000 of March 2000 relating toclassificationofassetsandmonitoringofliabilitiesofbanksandotherfinancialinstitutions. When a loan is deemed uncollectable, it is written off against the relatedprovisionforimpairment.Subsequentrecoveriesarecreditedtoprofitorloss, if previously written off.

111
Financial statements
BNR
Held to maturity
Investmentsclassifiedasheldtomaturityarenon-derivativefinancialassetswithfixedordeterminablepaymentsandfixedmaturitiesthattheBankhastheintention and ability to hold to maturity. After initial measurement, held-to-maturity financialinvestmentsaresubsequentlymeasuredatamortisedcostusingtheeffective interest method, less allowance for impairment. Amortised cost is calculated by taking into account any discount or premium on acquisition and fees that are an integral part of the effective interest rate. The amortisation is includedin‘Interestincome’inprofitorloss. The losses arising from impairment of such investments are recognised in the profitorlossline‘Impairmentlossesonfinancialinvestments’.WeretheBanktosellotherthananinsignificantamountofsuchassets,theentirecategorywouldbereclassifiedasavailableforsale.TheBankcurrentlyclassifiestermdeposits,Government securities, repurchase and reverse purchase instruments as held to maturity.The losses arising from impairment of such investments are recognised in the profitorlossline‘Impairmentlossesonfinancialinvestments’.WeretheBanktosellotherthananinsignificantamountofsuchassets,theentirecategorywouldbereclassifiedasavailableforsale.TheBankcurrentlyclassifiestermdeposits,Government securities, repurchase, and reverse purchase instruments as held to maturity.
Available-for-sale financial assets
Available-for-sale investments are non-derivative investments that are designated asavailable-for-saleorarenotclassifiedasanothercategoryoffinancialassets.Unquoted equity securities whose fair value cannot reliably be measured are carried at cost. All other available-for-sale investments are carried at fair value.
Interestincomeisrecognisedinprofitorlossusingtheeffectiveinterestmethod.Foreign exchange gains or losses on available-for-sale debt security investments arerecognisedinprofitorloss.Otherfairvaluechangesarerecognisedinothercomprehensive income until the investment is sold or impaired, whereupon the cumulative gains and losses previously recognised in other comprehensive incomeisreclassifiedtoprofitorlossasareclassificationadjustment.
Anon-derivativefinancialassetisreclassifiedfromtheavailable-for-salecategorytotheloansandreceivablescategoryifitotherwisewouldhavemetthedefinitionof loans and receivables and if the Bank has the intention and ability to hold that financialassetfortheforeseeablefutureoruntilmaturity.

112
Financial statements
BNR
2. SIGNIFICANT ACCOUNTING POLICIES (Continued)
Cash and cash equivalents
Cash and cash equivalents comprises of cash balances, bank deposits, current accounts, gold holding, government securities with maturity of up to 3 months from the date of issue. Cash and cash equivalents are carried at amortised cost in the statementoffinancialposition.
Financial liabilities
Financial liabilities are measured at amortised cost except for financial liabilitiesdesignatedatfairvaluethroughprofitandloss.Financialliabilitiesareinitiallyrecognisedat fair value less, in the case of liabilities carried at amortised cost (including due to banks, due to International Monetary Fund other deposits and other funds borrowed), transaction costs incurred and any difference between the proceeds net of transaction costsandtheredemptionamountisrecognisedintheprofitorlossasinterestexpenseover the period to maturity using the effective interest rate method. Financial liabilities which are repayable on demand are recorded at nominal value. Deposits represent reserve deposits of depository institutions’ participants and current accounts of the Bank.
TheBankhasclassifiedthefollowingfinancialinstrumentsasfinancialliabilities:
• Currency in circulation
Currency issued by the Bank represents a claim on the Bank in favour of the holder. The liability for currency in circulation is recorded at face value in these financialstatements.Currencyincirculationrepresentsthefacevalueofnotesand coins in circulation. Notes and coins held by the Bank as cash in main vault,intermediaryvault,andcashierattheendofthefinancialyeararenettedoff against the liability for notes and coins in circulation because they do not represent currency in circulation.
• Deposits
Depositsarenon-derivativefinancialliabilitieswithfixedordeterminablereceiptsthat are not quoted in an active market. They arise when the Bank receives money or services directly from counterparty with no intention of trading the payable. Deposits held are carried at cost with interest income accruing on an effective interest rate basis.
Cash Ratio Deposits are taken from commercial banks for liquidity management (monetary policy purposes) of the Bank in accordance with the Banking Act and are interest free. Cash Ratio Reserves is a monetary policy instrument used to manage liquidity.

113
Financial statements
BNR
(h) Financial Instruments (continued)
The deposits earn no interest to commercial banks and the Bank does not trade on these deposits in any way. The deposits are currently computed at 4.5% of each commercial bank’s deposits taken from the public. Each commercial bank is required to deposit the applicable amount at the Bank and the computation is done on a monthly basis.
• Other liabilities
Other liabilities are stated at their nominal value/cost, which approximates fair value due to the short term nature thereof.
Financial assets at fair value through profit or loss: Held for Trading Afinancialassetisclassifiedinthiscategoryifitisacquiredprincipallyforthe purpose of selling in the short term or if so designated by management. Derivativesareclassifiedasheldatfairvaluethroughprofitorloss.
TheBankhasclassifiedtheReserveAssetManagementProgramme(RAMP)financialinstrumentsasheldfortrading.
(i) Derecognition
Financialassetsarede-recognisedwhentherightstoreceivecashflowsfromthefinancialassetshaveexpiredorwheretheBankhastransferredsubstantiallyallof the risks and rewards of ownership.
Afinancialliabilityisde-recognisedwhentheobligationundertheliabilityisdischargedorcancelledorexpires.Whenanexistingfinancial liability isreplacedbyanotherfrom the same lender on substantially different terms, or the terms of an existing liabilityaresubstantiallymodified,suchanexchangeormodification is treatedasa derecognition of the original liability and the recognition of a new liability, and the differenceintherespectivecarryingamountsisrecognisedintheprofitorloss.
The gains and losses on investments held to maturity and loans and receivables arerecognisedinprofitorlosswhentheinvestmentsarederecognised.
(i) Gains and losses on subsequent measurement
Gainsandlossesonamortisationofpremiumsordiscountsoffinancialinstrumentscarriedatamortisedcostarerecognisedinprofitorlossoftheperiodin which they arise. Gains and losses due to impairment are recognised as stated in the paragraph dealing with impairment.

114
Financial statements
BNR
2. SIGNIFICANT ACCOUNTING POLICIES (Continued)
(ii) Offsetting
Financialassetsandfinancialliabilitiesareoffsetandthenetamountreportedon the reporting date only where there is a legally enforceable right to set off the recognised amount and there is an intention to settle on a net basis or to realise the asset and settle the liability simultaneously.
(iii) Impairment of financial assets
At each reporting date, the Bank assesses whether there is objective evidence thatafinancialassetnotcarriedatfairvaluethroughprofitorlossisimpaired.Financial assets are impaired when objective evidence demonstrates that a loss event has occurred after the initial recognition of the assets, and that the loss eventhasanimpactonthefuturecashflowsontheassetsthatcanbeestimatedreliably.
TheBankconsidersevidenceofimpairmentatbothaspecificassetandcollectivelevel.Allindividuallysignificantfinancialassetsareassessedforspecificimpairment.Allsignificantassetsfoundnottobespecificallyimpairedarethen collectively assessed for any impairment that has been incurred but not yet identified.Assetsthatarenotindividuallysignificantarecollectivelyassessedforimpairmentbygroupingtogetherfinancialassets(carriedatamortisedcost)withsimilar risk characteristics.
Objectiveevidencethatfinancialassets(includingequitysecurities)areimpaired can include default or delinquency by a borrower, restructuring of a loan or advance by the Bank on terms that the Bank would otherwise consider, indications that a borrower or issuer will enter bankruptcy, the disappearance of an active market for a security, or other observable data relating to a group of assets such as adverse changes in the payment status of borrowers or issuers in the group, or economic conditions that correlate with defaults in the group. In addition,foraninvestmentinanequitysecurity,asignificantorprolongeddeclinein its fair value below its cost is objective evidence of impairment.
In assessing collective impairment, the Bank uses statistical modelling of historical trends of the probability of default, timing of recoveries and the amount of loss incurred, adjusted for management’s judgment as to whether current economic and credit conditions are such that the actual losses are likely to be greater or less than suggested by historical modelling. Default rates, loss rates and the expected timing of future recoveries are regularly benchmarked against actual outcomes to ensure that they remain appropriate.

115
Financial statements
BNR
Impairment losses on assets carried at amortised cost are measured as the differencebetweenthecarryingamountofthefinancialassetsandthepresentvalueofestimatedcashflowsdiscountedattheassets’originaleffectiveinterestrate.Lossesarerecognisedinprofitorlossandreflectedinanallowanceaccountagainst loans and advances. Interest on the impaired asset continues to be recognised through the unwinding of the discount.
When a subsequent event causes the amount of impairment loss to decrease, the impairmentlossisreversedthroughprofitorloss.Impairmentlossesonavailable-for-sale investment securities are recognised by transferring the difference between the amortised acquisition cost and current fair value out of other comprehensive income toprofitorlossasareclassificationadjustment.Whenasubsequenteventcausesthe amount of impairment loss on an available-for-sale debt security to decrease, the impairmentlossisreversedthroughprofitorloss.
However, any subsequent recovery in the fair value of an impaired available-for-sale equity security is recognised directly in other comprehensive income. Changes inimpairmentprovisionsattributabletotimevaluearereflectedasacomponentofinterest income.
ThecarryingamountsoftheBank’snon-financialassetsotherthanstockofconsumables are reviewed at each reporting date to determine whether there is any indication of impairment. If any such indication exists then the asset’s recoverable amount is estimated.
(i) Impairment of non-financial assets
The recoverable amount of an asset or cash-generating unit is the greater of its value in use and its fair value less costs to sell. In assessing value in use, the estimatedfuturecashflowsarediscountedtotheirpresentvalueusingapre-taxdiscountratethatreflectscurrentmarketassessmentsofthetimevalueofmoneyandtherisksspecifictotheasset.
An impairment loss is recognised if the carrying amount of an asset or its cash-generating unit exceeds its recoverable amount. A cash-generating unit is the smallestidentifiableassetgroupthatgeneratescashflowsthatarelargelyindependent from other assets or group of assets. Impairment losses are recognisedinprofitorloss.Impairmentlossesrecognisedinrespectofcash-generatingunitsareallocatedfirsttoreducethecarryingamountofanygoodwillallocated to the units and then to reduce the carrying amount of the other assets in the unit (group of units) on a pro-rata basis.

116
Financial statements
BNR
2. SIGNIFICANT ACCOUNTING POLICIES (Continued)
Impairment losses recognised in prior periods are assessed at each reporting date for any indications that the loss has decreased or no longer exists. An impairment loss is reversed if there has been a change in the estimate used to determine the recoverable amount. An impairment loss is reversed only to the extent that the asset’s carrying amount does not exceed the carrying amount that would have been determined net of depreciation or amortization in no impairment was derecognized.
(j) Investment property
The Bank holds certain properties as investments to earn rental income or capital appreciation or any currently undetermined future use. Investment properties are carried at cost less accumulated depreciation and accumulated impairment. Depreciation is calculated at a rate of 10 % using the straight-line method.
Gains or losses arising from the retirement/ disposal of investment property shall be determined as the difference between the net disposal proceeds and the carryingamountoftheassetandshallberecognisedinprofitorloss.
(k) Provisions
Provisions are recognised when the bank has a present obligation (legal or constructive)asaresultofpastevent,anditisprobablethatanoutflowofresourceembodyingeconomicbenefitswillberequiredtosettletheobligationand a reliable estimate of the amount of the obligation can be made.
(l) Cash and cash equivalents
Cash comprises of foreign currency held in the Bank and demand deposits held with foreign banks. Cash equivalents comprise of short term highly liquid investments and term deposits that are readily convertible into known amounts of cashandwhicharesubjecttoaninsignificantriskchangesinvalue.Theshort-term highly liquid investments include balances with maturities of three months or less from the date of acquisition.
(m) Employee benefits
In accordance with the existing law relating to social security, the Bank makes contributions to Rwanda Social Security Board on behalf of its employees. The Bank’scontributionischargedtoprofitorlossintheyeartowhichitrelates.
Thebankalsohasanin-housemanageddefinedcontributionplan.Adefinedcontributionplanisapost-employmentbenefitunderwhichanentitypaysevencontributions and has no legal/constructive obligation to pay future amounts. Obligationsforcontributionstothedefinedcontributionplanarerecognizedasanexpenseinprofitorlossintheperiodinwhichtheserviceisrenderedbytheemployee.

117
Financial statements
BNR
The employees’ contribution amounts to a third of the total monthly salary and the remainingtwothirdsiscontributedbytheBank,andischargedtoprofitorlossinthe year to which it relates.
The estimated monetary liability for employees leave entitlement at the reporting dateisrecognisedasanaccrualexpense.Thisamountiswrittenbacktoprofitor loss when employees utilize their leave days in subsequent periods. The Bank also provides medical facilities for the employees and their families. Related costs arechargedtoprofitorloss.
(n) Commitments on behalf of the Government of Rwanda
Commitments on behalf of Government of Rwanda arising from the issue of TreasurybillsandTreasurybondsarenotincludedinthesefinancialstatementsas the Bank is involved in such transactions only as an agent.
(o) Comparatives
Wherenecessary,comparativefigureshavebeenadjustedorexcludedtoconform to changes in presentation in the current year.
(p) Taxation
Accordingly to Article No 74 of the Law No 55/2007 of 30 November 2007, the Bank is considered as the State with regard to the rules of tax liability and taxpaymentpertainingtoalltaxesleviedforthebenefitoftheStateanditsadministrative entities. The Bank is therefore exempt from taxes.
(q) Dividends payable
Dividends are accounted for when payment is made. Dividends declared after thereportingdate,butbeforefinancialstatementsareauthorisedforissue,aredisclosedinthenotestothefinancialstatements.
(r) Government grant and government assistance
TheBank,beingawhollyownedgovernmentalfinancialinstitution,mayreceivegrants in both monetary and non-monetary basis. Government grants are recognised as income over the period necessary to match them with the related costs which they are intended to compensate, on a systematic basis. Government grants related to assets, including non-monetary grant at fair value, are presented inthestatementoffinancialpositionbysettingupthegrantasdeferredincome.In addition, the Bank may receive certain forms of government assistance which cannot reasonably have a value placed upon them, and transactions with Government which cannot be distinguished from the normal trading transactions of the entity. The Bank’s policy on government assistance that cannot be reliably measured is to disclose the nature, extent and duration of the assistance in order thatthefinancialstatementsarenotmisleading.

118
Financial statements
BNR
2. SIGNIFICANT ACCOUNTING POLICIES (Continued)
(s) New standards and interpretations not yet adopted
A number of new standards, amendments to standards and interpretations are not yet effective for the six month period ended 30 June 2011, and have not been appliedinpreparingthesefinancialstatementsasfollows:
Standard/Interpretation Effective date
IAS 12 amendment Deferred tax: Recovery of Underlying Assets
Annual periods beginning on or after 1 January 2012
IAS 1 amendmentPresentation of Financial Statements: Presentation of Items of Other Comprehensive Income
Annual periods beginning on or after 1 July 2012
IFRS 10 Consolidated Financial Statements Annual periods beginning on or after 1 January 2013
IFRS 11 Joint Arrangements Annual periods beginning on or after 1 January 2013
IFRS 12 Disclosure of Interests in Other Entities
Annual periods beginning on or after 1 January 2013
IFRS 13 Fair Value Measurement Annual periods beginning on or after 1 January 2013
IAS 19 amended 2011 Employee Benefits Annual periods beginning on or
after 1 January 2013
IAS 27 Separate Financial Statements (2011) Annual periods beginning on or after 1 January 2013
IAS 28 Investments in Associates and Joint Ventures (2011)
Annual periods beginning on or after 1 January 2013
IFRIC 20 Stripping Costs in the Production Phase of a Surface Mine
Annual periods beginning on or after 1 January 2013
IFRS 1 amendment Government Loan Annual periods beginning on or after 1 January 2013
IFRS 7 amendment Disclosures: Offsetting Financial Assets and Financial Liabilities
Annual periods beginning on or after 1 January 2013
IAS 32 amendment Offsetting Financial Assets and Financial Liabilities
Annual periods beginning on or after 1 January 2014
IFRS 9 Financial Instruments Annual periods beginning on or after 1 January 2015

119
Financial statements
BNR
The Bank will adopt the above standards, interpretations and amendments on their effective dates.
The Bank does not intend early adopting any of the above amendments, standards and interpretations.
Amendment to IAS 1 Presentation of Financial Statements
TheamendmenttoIAS1willbeadoptedbytheNationalBankofRwandaforthefirsttimeforitsfinancialreportingperiodending30June2013.The Bank will present those items of other comprehensive income that may be reclassifiedtoprofitorlossinthefutureseparatelyfromthosethatwouldneverbereclassifiedtoprofitorloss.Therelatedtaxeffectsforthetwosub-categorieswillbeshown separately.
(t) New standards and interpretations not yet adopted
This is a change in presentation and will have no impact on the recognition or measurementofitemsinthefinancialstatements.
This amendment will be applied retrospectively and the comparative information will be restated.
IFRS 13 Fair Value Measurement
IFRS13willbeadoptedbytheNationalBankofRwandaforthefirsttimeforitsfinancialreportingperiodending30June2014.Thestandardwillbeappliedprospectively and comparatives will not be restated.IFRS 13 introduces a single source of guidance on fair value measurement for both financialandnon-financialassetsandliabilitiesbydefiningfairvalue,establishingaframework for measuring fair value and setting out disclosures requirements for fair value measurements. The key principles in IFRS 13 are as follows:
• Fair value is an exit price• Measurement considers characteristics of the asset or liability and not entity-
specificcharacteristics• Measurement assumes a transaction in the entity’s principle (or most
advantageous) market between market participants• Price is not adjusted for transaction costs• Measurement maximises the use of relevant observable inputs and minimises
the use of unobservable inputs • The three-level fair value hierarchy is extended to all fair value measurements

120
Financial statements
BNR
2. SIGNIFICANT ACCOUNTING POLICIES (Continued)
Theimpactonthefinancialstatementsfor30June2014cannotbereasonablyestimated as at 30 June 2012.
Amendment to IAS 19 Employee Benefits: Defined benefit plans
The amendments to IAS 19 will be adopted by the National Bank of Rwanda for thefirsttimeforitsfinancialreportingperiodending30June2014.Intermsoftheamendments, the following key change will have an impact on the Bank:
• Thedefinitionsofshort-termandotherlong-termemployeebenefitshavebeenamended and the distinction between the two depends on when the entity expectsthebenefittobesettled;
• All actuarial gains and losses must be recognised immediately in other comprehensive income;
• Thecalculationsoffinancecostshasbeenrevised;• Additionaldisclosuresrequiredfordefinedbenefitplans;and• Possiblechangestothetimingoftherecognitionofterminationbenefits.
ThisamendmentwillmostsignificantlyimpacttheBanksrecognitionofactuarialgains and losses.
IFRS 7 amendment
ThisamendmentwillbeadoptedbytheNationalBankofRwandaforthefirsttimeforitsfinancialreportingperiodending30June2014.
(q) New standards and interpretations not yet adopted (continued)
This amendment sets out the additional disclosure requirements resulting from the IAS32offsettingamendment.Theimpactonthefinancialstatementsfor30June2014 cannot be reasonably estimated as at 30 June 2012.
IAS 32 amendment
ThisamendmentwillbeadoptedbytheNationalBankofRwandaforthefirsttimeforitsfinancialreportingperiodending30June2015.
This amendment provides clarity on the application of the offsetting criteria listed in the current standard.

121
Financial statements
BNR
Theimpactonthefinancialstatementsfor30June2015cannotbereasonablyestimated as at 30 June 2012.
IFRS 9 (2010) Financial Instruments
IFRS9(2010)willbeadoptedbytheNationalBankofRwandaforthefirsttimeforitsfinancialreportingperiodending30June2016.Thestandardwillbeappliedretrospectively, subject to transitional provisions.
IFRS9(2010)addressesthemeasurementandclassificationoffinancialliabilitiesand will replace the relevant sections of IAS 39.
UnderIFRS9(2010),theclassificationandmeasurementrequirementsoffinancialliabilities are the same as per IAS 39, except for the following two aspects:
• Fairvaluechangesforfinancialliabilities(otherthanfinancialguaranteesandloancommitments)designatedatfairvaluethroughprofitorloss,thatareattributable to the changes in the credit risk of the liability will be presented in other comprehensive income (OCI). The remaining amount of the fair value changeisrecognisedinprofitorloss.However,ifthisrequirementcreatesorenlargesanaccountingmismatchinprofitorloss,thenthewholefairvaluechangeispresentedinprofitorloss.Thedeterminationastowhethersuchpresentation would create or enlarge an accounting mismatch is made on initial recognition and is not subsequently reassessed.
• Under IFRS 9 (2010) derivative liabilities that are linked to and must be settled by delivery of an unquoted equity instrument whose fair value cannot be reliably measured, are measured at fair value.
IFRS 9 (2010) incorporates, the guidance in IAS 39 dealing with fair value measurement and accounting for derivatives embedded in a host contract that isnotafinancialasset,aswellastherequirementsofIFRIC9ReassessmentofEmbedded Derivatives.
Theimpactonthefinancialstatementsfor30June2016cannotbereasonablyestimated as at 30 June 2012.

122
Financial statements
BNR
2. SIGNIFICANT ACCOUNTING POLICIES (Continued)
Estimates and judgements are continually evaluated and are based on historical experience and other factors, including experience of future events that are believed to be reasonableunderthecircumstances.Themostsignificantuseofjudgementandestimatesare as follows:
(a) Impairment losses on loans ,advances and receivables
The Bank reviews its loans, advances and receivables at each reporting date to assesswhetheranallowanceforimpairmentshouldberecognisedintheprofitorloss. In particular, judgement by the directors is required in the estimation of the amountandtimingoffuturecashflowswhendeterminingthelevelofallowancerequired. Such estimates are based on the assumptions about a number of factors and actual results may differ, resulting in future changes in the allowance.
Inadditiontospecificallowancesagainstindividualsignificantloansandadvances,the Bank makes a collective impairment allowance against exposures which, althoughnotspecificallyidentifiedasrequiringaspecificallowance,haveagreaterrisk of default than when originally granted. This takes into consideration such factors asanydeteriorationinindustry,technologicalobsolescence,aswellasidentifiedstructuralweaknessesordeteriorationincashflows.
(b) Property, equipment and intangible assets
Critical estimates are made by the management in determining depreciation and amortisation rates for property, equipment and intangible assets. The rates used are set out in the Note 2 (d).
(c) Useful life of currency
Banknotes printing expenses for each denomination which include ordering, printing, freight, insurance and handling costs are initially deferred. Based on the currency issued into circulation, the respective proportional actual costs incurred are released to the income statement from the deferred costs account over the useful period (life span) of each banknotes denomination. The deferred amount is recognised as prepayment and represents unissued banknotes (currency) stock. Previously the costs were expensed upon delivery of currency stock. Cost of coins minted is expensed in full on delivery in the year of purchase/acquisition.
Useful lives of the various banknotes denominations are currently estimated as follows:
FRW 5,000 2 yearsFRW 2,000 2yearsFRW 1000 1 year and 6 monthsFRW 500 1 year
The useful life for all other denominations (coins) is estimated at 10 years.

123
Financial statements
BNR
(d) Fair value of financial instruments
Fair value is the amount for which an asset could be exchanged, or a liability settled, between knowledgeable, willing parties in an arm’s length transaction.
Allfinancialinstrumentsareinitiallyrecognisedatfairvalue,whichisnormallythetransaction price. In certain circumstances, the initial fair value may be based on avaluationtechniquewhichmayleadtotherecognitionofprofitsorlossesatthetimeofinitialrecognition.However,theseprofitsorlossescanonlyberecognisedwhen the valuation technique used is based solely on observable market inputs.
Subsequenttoinitialrecognition,someofthebank’sfinancialinstrumentsarecarriedatfairvalue,withchangesinfairvalueeitherreportedwithinprofitorlossor within other comprehensive income until the instrument is sold or becomes impaired.
Thefairvaluesofquotedfinancialinstrumentsinactivemarketsarebasedoncurrentprices.Ifthemarketforafinancialinstrumentisnotactiveincludingforunlisted securities, the Group establishes fair value by using valuation techniques. Theseincludetheuseofrecentarm’slengthtransactions,discountedcashflowanalysis, option pricing models and other valuation techniques commonly used by market participants.
Where representative prices are unreliable because of illiquid markets, the determination of fair value may require estimation of certain parameters, which are calibrated against industry standards and observable market data, or the use of valuation models that are based on observable market data.
ThefairvalueforthemajorityoftheBank’sfinancialinstrumentsisbasedonobservable market prices or derived from observable market parameters.
3. INTEREST INCOME
30-Jun-12Frw‘000
30-Jun-11 Frw‘000
Interest Income on Frw operations 2,119,876 1,440,010
Interest Income on Foreign currency transactions 3,317,231 1,660,103
5,437,107 3,100,113
4. INTEREST EXPENSE
Interest on IMF fund 185,991 156,304
Other interest and similar expenses 124,916 2,819
310,907 159,123
5. NET FEES AND COMMISSION INCOME
Commision and fees income 296,384 212,448
Commision and fees paid (490,332) (194,699)
(193,948) 17,749

124
Financial statements
BNR
6. FOREIGN EXCHANGE GAIN
Net gain on foreign currency market intervention 643,389 58,755
Foreign exchange dealing profit on commercial banks 209,033 48,355
Foreign assets (exchange) revaluation gain 4,688,116 3,964,695
Transaction with foreign correspondent banks 3,006,653 1,205,382
Transaction with local clients 3,862,650 1,525,175
Realised gain on foreign financial instruments 2,687,470 439,120
Realised loss on foreign financial instruments (1,083,052) (583,715)
Unrealized loss on foreign financial instruments (111,441) -
13,866,875 6,657,767
7. OTHER OPERATING INCOME
Fines, penalties and other administrative income 208,543 162,085
Written back accruals and provisions 130,579 188,584
Gain on sales of properties and equipment 11,134 2,302
Subvention from the Government of Rwanda 327,535 -
Interest refund from the Government of Rwanda 6,385,208 1,839,847
Interest paid on monetary policy issues (6,385,241) (1,832,487)
Other income 222,068 176,528
899,826 536,859
8. OPERATING EXPENSES
Bank notes printing and coins minting 1,652,584 64,653
Staff costs (8 (a)) 7,688,542 3,712,342
Auditor’s remuneration 40,110 20,110
Consultancy fees 448,652 189,067
Other expenses 1,944,428 870,461
Depreciation of property and equipment 662,700 264,505
Amortisation of intangible assets 2,562 1,514
Depreciation of investment property 14,833 15,674
Provisions 340,795 412,246
12,795,206
5,548,571
(a). Staff costs
Salaries and other related allowances 6,170,479 3,017,191
Pensions 524,904 212,700
Medical expenses 583,327 275,232
Training and development 383,002 176,317
Other expenses 26,830 30,902
7,688,542 3,712,342

125
Financial statements
BNR
9. FOREIGN ASSETS
Current accounts 89,788,857 41,638,866
Fixed term placements with foreign correspondents 94,155,934 125,362,371
Foreign investments 220,754,426 184,090,974
Special Drawing Rights 76,770,653 80,217,170
Other foreign assets 37,682,9034 11,562,746
Interest receivable 26,490 95,514
519,179,264 442,967,641
10. INTERNATIONAL MONETARY FUND
The International Monetary Fund Quota refers to the Rwanda Government’s total subscription to the International Monetary Fund (IMF). It is equal to Special Drawing Rights SDR 80,100,000 and was converted to Rwanda Francs based on the exchange rate of the Special Drawing Rights (SDR) applicable at the reporting date.
Frw‘000 Frw‘000 Balance at the beginning of the year 76,965,858 73,003,334
Foreign currency adjustment (2,714,472) 3,962,524
Balance at end of year 74,251,386 76,965,858
11. DUE FROM GOVERNMENT OF RWANDA
Consolidated debt at the beginning of the year 72,166,089 39,345,701
Recovery in the year (130,581) (617,570)
Recovery on government overdraft (33,437,958) -
Consolidated debt at the end of the year 38,597,550 38,728,131
Government overdraft outstanding - 33,437,958
Balance at the end of the year 38,597,550 72,166,089
The Bank signed an agreement with the Government on 7 February 1996 to consolidate the entire Government debts amounting to Frw 34 457 billion at a rate of 2 % per annum. The amount increased to Frw 43 469 billion effective 1 August 1997 subsequent to the passing of Law No 11/97 regarding the statutes of the Bank which stipulated under its article 79, that the balance of the revaluation account as at 6 March 1995 would be consolidated with the amount of that initial debt. The recovery of the amount is done through a reduction of 30 % of the annual dividend payable to the Government commencing 2002 and interest on the debt is charged at 2% per annum on the outstanding balance.
12. LOANS AND ADVANCES TO BANKS
Current accounts with commercials banks 301,778 1,018,299
Loans to the agricultural and agro business sectors 1,616,707 2,172,948
Other short loans to local financial institutions - 5,100,000
Accrued interest on loans to banks - 22,010
1,918,484 8,313,257

126
Financial statements
BNR
13. DUE FROM FOREIGN FINANCIAL INSTITUTION
Balance as at 30 June 5,953,536 1,479,511
On 9 November 2010, the Bank entered into a currency swap transaction with International Finance Corporation. The notional amount rendered by the bank was Frw 1.479 billion in exchange of USD 2.5 million.
14. LOAN AND ADVANCES TO STAFF
Loans to staff 5,059,780 4,288,289
Provision for impairment (52,495) (52641 )
5,007,285 4,235,648
15. OTHER INVESTMENTS
Cost 450,000 450,000
Provision for impairment (443,836) (443,836)
Carrying amount 6,164 6,164
The investment relates to capital subscribed in Société Interbancaire de Monétique etTelecompensation au Rwanda S.A (SIMTEL) which amounts to a shareholding of 7.98%. The shares in SIMTEL are not listed and are not available for sale.
SIMTELisregisteredanddomiciled inRwandaanditoffersaninter-banknetworkforfinancialcommunication that supports card based payment systems, electronic funds transfers, simple bills paymentsystemandcapitalmarketoperationstobanksandotherfinancialinstitutionsinRwanda.
At the end of 2006, owing to accumulated losses, National Bank of Rwanda decided to provide the total cost of its investment in SIMTEL as impairment. In 2008, SIMTEL was restructured and National Bank of Rwanda share capital was revised to Frw 450 million.
16. INVESTMENT PROPERTY
CostBalance at 1 July 313,490 313,490
Depreciation -
Balance at 1 July 225,548 209,874
Depreciation charge for the year 14,833 15,674
240,381 225,548
Carrying value 73,109 87,942
Investment property is stated at depreciated cost. The property rental income earned by the Bank from this property is nominal on account of a preferential lease rental charged to its related company- SIMTEL. The direct operating expenses including repairs and maintenance areminimalandtherearenosignificantcontractualobligationstoincurcostsonrepairs,maintenance or improvement thereto. The property is situated on plot number 1200 (R.C J number: 2141 KIG) and the directors are of the opinion that the carrying value is a fair presentation of its market value

127
Financial statements
BNR
17. PROPERTY AND EQUIPMENT
As at 30 June 2012
Land Frw ‘000
Capital work in
progress Frw ‘000
Buildings Frw ‘000
Motor Vehicles Frw ‘000
Furniture and
Equipment Frw ‘000
Total Frw ‘000
CostAt 01 July 2011 1,553,817 - 3,269,186 96,124 5,277,250 10,196,378 Additions 25,849 1,036,140 150,295 65,900 1,178,868 2,457,052 Disposals - - - - (92,039) (92,039)
At 30 June 2012 1,579,667 1,036,140 3,419,481 162,024 6,364,079 12,561,391
Depreciation
At 01 July 2011 - - 1,904,060 66,397 3,639,594 5,610,051 Charge for the year - - 83,317 21,743 559,316 664,376 Disposals - - - - (92,039) (92,039)
At 30 June 2012 - - 1,987,377 88,140 4,106,871 6,182,388
NBV as at 30 June 2012 1,579,667 1,036,140 1,432,104 73,884 2,257,208 6,379,003
As at 30 June 2011
Cost Land
Frw ‘000 Buildings
Frw ‘000
Motor Vehicles Frw ‘000
Furniture and
Equipment Frw ‘000
Total Frw ‘000
At 01 January 2011 1,553,817 3,201,371 96,124 5,259,557 10,110,869 Additions - 67,815 - 69,887 137,702 Disposals - - - (52,311) (52,311)
At 30 June 2011 1,553,817 3,269,186 96,124 5,277,133 10,196,260
Depreciation
At 01 July 2011 - 1,862,290 50,206 3,480,142 5,392,638
Charge for the year - 41,770
16,191 211,645
269,606
Disposals - - - (52,311) (52,311)
At 30 June 2011 - 1,904,060 66,397 3,639,476 5,609,933
NBV as at 30 June 2011 1,553,817 1,365,126 29,727 1,637,657 4,586,327

128
Financial statements
BNR
18. INTANGIBLE ASSETS
30-Jun-12 30-Jun-11Cost Balance at 1 July 687,984 686,376 Additions - 1,608 687,984 687,984
DepreciationBalance at 1 July 684,862 683,046 Depreciation charge for the year 2,562 1,816 At period end 687,424 684,862
Carrying value 560 3,122
19. OTHER ASSETS
Deferred currency expenses 2,551,979 1,194,863 Stock of consumable 214,180 218,155 Other debtors 15,907,655 28,364,482 18,673,814 29,777,500 Impairment losses - (185,807) 18,673,814 29,591,683
20. CURRENCY IN CIRCULATION
Currency printed and minted 283,452,060 208,833,061 Money in reserve (108,004,120) (20,968,460) 175,447,940 187,864,601 Cash held at the bank (45,571,377) (72,813,348) 129,876,563 115,051,253
Money in reserve represents currency printed but not issued into circulation. Cash held at the Bank represents notes and coins held by the Bank’s principal cashier. These two elements have been netted off against the liability for notes and coins in circulation because they do not represent currency in circulation. The cash shown at the reporting date relates only to foreign currency cash balances held by the Bank at the end of the year.
30 June 2012
30 June 2011
Opening balance of notes and coins in existence 388,603,655 381,103,655
(+) New banknotes and coins printed and received in the year 156,090,000 7,500,000
(-) Banknotes destroyed during the year (261,241,595) (179,770,595)
(-) Uncirculated Banknotes and coins (108,004,120) (20,968,460)Closing balance of banknotes in existence 175,447,940 187,864,600 (-) Banknotes on hand (45,571,377) (72,813,347)Banknotes in circulation liability 129,876,563 115,051,253

129
Financial statements
BNR
19. CURRENCY IN CIRCULATION (Continued) Currency in circulation represents the face value of notes and coins in circulation. Notes and coins held by the Bank as cash in main vault, intermediary vault, and cashier/ teller at the end offinancialyearhavebeenexcludedfromtheliabilityofnotesandcoinsincirculationbecausethey do not represent currency in circulation. Currency notes and coins are issued in the following denominations:
Notes: 5,000/=, 2,000/=, 1,000/=, 1,000 and 500/=.
Coins: 100/=, 50/=,20/=,10/=,5/=,2/=,1/=.
21. GOVERNMENT DEPOSITS
Government special deposits 6,621,348 5,536,525 Deposits for letters of credit and other commitments 704,914 1,093,974 Projects and ministry accounts 79,329,983 69,729,498 Local Governments 19,399,921 24,939,442 Public institutions 3,900,280 5,692,443 Public service enterprises 5,687,887 4,146,110 Foreign currency accounts 40,869,596 64,409,421 156,513,929 175,547,413
22. DUE TO LOCAL FINANCIAL INSTITUTIONS
Local currency deposits 43,882,791 21,479,038 Foreign currency deposits 2,166,504 14,603,999 Money market interventions 122,409,817 88,730,178 Interests payable 557,060 93,247 169,016,173 124,906,462
TheBank, in fulfilling its principal objectives, engages in issuingandbuyingTreasurybills formonetary policy purposes. The amount owed to third parties in relation to mop up operations (issue of Treasury bills) is disclosed as money market interventions.
23. DUE TO THE INTERNATIONAL MONETARY FUND
International Monetary Fund Deposits 74,263,594 76,978,512 IMF Poverty Reduction and Growth Facility Loan 8,325,332 9,287,694 Special Drawing Rights Allocation 71,212,557 73,815,935 Interest Payable - 50,926 153,801,483 160,133,067
IMF balances are maintained in special drawing rights (SDR) which are revalued daily with other foreign currency accounts. At the close of the year, they are shown in Rwandan Francs based on the average SDR rate applicable at the reporting date.

130
Financial statements
BNR
24. FOREIGN LIABILITIES
Deposits in local currency 196,583 137,704 Deposits in foreign currency 7,331,814 690,149 Loan from International Financial Corporation - 1,506,043 7,528,397 2,333,896
25. OTHER LIABILITIES
Staff deposits 90,906 728,828 Non statutory accounts in Rwandan Francs 1,426,998 1,524,213 Non statutory accounts in foreign currencies 741,548 704,890 Other payables 7,264,845 21,336,298 Provision for contingencies 107,486 125,986 Provision in lieu of outstanding staff leave 425,141 102,764 Deferred income 380,945 13,605 10,437,869 24,536,584
26. SHARE CAPITAL
Authorised and fully paid share capital 7,000,000 7,000,000
Article 2 of Law N° 55/2007 of 30 November 2007 governing the National Bank of Rwanda fixedthesharecapitalofthebankat7billionofRwandanFrancs.Thatsharecapitalisentirelysubscribed by the Government of Rwanda and the shares do not have a par value.
27. GENERAL RESERVE FUND
The general reserve fund is a fund intowhich at least 20% of the net annual profits of theBankaretransferredat theendofeachfinancialyear.This isafterallowingforexpensesforoperation and after allowance has been made for bad and doubtful debts, depreciation of assets, contributiontostaffbenefitfund,andsuchothercontingenciesandprovisionsastheBankdeemsappropriate. The Bank utilises funds accumulated in this account to pay dividends once declared by the Board of Directors, increase paid up capital when necessary and to absorb any negative external shocks.
28. OTHER RESERVES
30-Jun-12 30-Jun-11Revaluation reserves 1,412,420 1,412,420 Staff welfare fund 3,626,326 3,626,326 Fair value reserve 3,846 640,176
Translation reserve 21,369,925 21,369,925
26,412,517 27,048,847

131
Financial statements
BNR
29. DIVIDEND
30-June-2012Frw ‘000
30-June-2012Frw ‘000
Ordinary dividend 1,506,630 416,220
The dividend was proposed by the directors after the respective reporting dates. The dividends have not been provided for and there are no income tax consequences.
30. CASH FLOW FROM OPERATING ACTIVITIES
30-Jun-12 30-Jun-11Profit for the year 6,903,748 4,604,794 Adjustments: Depreciation of property and equipment 662,700 269,606 Amortisation of software 2,562 1,816 Depreciation of investment property 14,833 15,675 Gain on sale of property and equipment (12,810) (2,302)Revaluation loss of IMF quota 2,714,472 (3,962,524)Unrealised gain on foreign assets (1,685,628)
Impairment loss on other investment - 213,210 Cash flows before changes in working capital 8,599,877 1,140,275
Increase / (Decrease) in amount due from Government of Rwanda 33,568,539 (14,315,723)Increase in amounts due from banks and other financialinstitution decreased 6,392,791 2,586,490 Decreaseinamountsduefromforeignfinancial institutionsincreased (4,474,025) - Decrease in loans and advances to staff (771,637) (137,059)Increase / (Decrease) in other assets 11,051,517 (28,322,182)Decrease in the Government deposits (19,030,348) (61,174,944)Increaseinamountduetolocalfinancialinstitutions 44,109,711 30,532,265 (Decrease) / increase in amount due to International Monetary Fund (6,331,584) 8,248,160 Increase in Foreign liabilities 5,194,501 247,449 (Decrease) / increase in Other liabilities (14,354,235) 18,686,796
Net cash flows from operating activities 64,075,835 (42,508,473)
31. CASH AND CASH EQUIVALENTS
30-Jun-12 30-Jun-11Cash balance 5,955,905 6,128,520 Foreign assets 519,179,264 442,967,641
525,135,169 449,096,161

132
Financial statements
BNR
32. RELATED PARTY TRANSACTIONS
In the course of its operations, the Bank enters into transactions with related parties. Those include the Government of Rwanda as its sole shareholder. Unless otherwise stated, all transactions between these entities take place at arm’s length and with reference to market rates.
a) Transactions with the Government of Rwanda
Transactions entered into with the Government include:• Banking services;• Management of issues and redemption of securities;• Settlements and remittances in foreign currencies by order and/or in favor of the Government
of Rwanda.
The Bank charges a fee of Frw 1,000 for maintaining the Government accounts. Further, Government accounts do not generate interest income. However, the Bank earns commissions on all foreign currency transactions carried out on behalf of the Government.At the reporting date, the following balances which are included in various statements of financialpositioncategories,wereoutstanding:
Transaction with the Government of Rwanda 30-Jun-12 30-Jun-11Due from Government of Rwanda (Note 11) 38,597,550 72,166,089 Government of Rwanda deposits (Note 21) 156,513,929 175,547,413
b) Staff loans
The Banks extends loans facilities to members of staff including the senior management. As at the reporting date, loans and advances to employees amounted to Rwf 5,007,285 (‘000) ( June 2012: Rwf 4,235,648(‘000)). The advances are at a preferential interest rate determined by the Bank.
c) Loans to Directors 30-Jun-12 30-Jun-11At 1 July 2011 98,210 -New loans during the period 23,783 22,073
Loans repayments (21,570) (10,839)
100,423 134,982
d) Director’s emolumentsFees to non-executive directors 4,821 6,439
Other remuneration to executive directors 132,775 31,969 e) Other related party transaction
Rental income from SIMTEL 11,755 5,422

133
Financial statements
BNR
33. RISK MANAGEMENT POLICIES
The Bank’s risk management policies and practices have been developed and cover all its business activities. They are supported by a very strict management culture and a strong commitment to active risk management by senior management and the departmental directors.
TheBankholdsforeignexchangereservesforthepurposesofservicingofficialforeigndebt, paying non- government debt and National Bank of Rwanda expenditures abroad, and occasional intervention in the foreign exchange market to smoothen exchange rate movements.
The Bank can only intervene in the foreign exchange market when there are sharp exchange ratemovementswhicharelikelytodestabilizethefinancialmarket.In view of the Bank’s reserve management policy of safe investment, liquidity, and return, respectively, the Bank, with a prudent approach, subjects its foreign exchange reserves to investments in international markets.
Inthisframework,almostallthefinancialriskstowhichtheBankisexposedarisewhilefulfillingits duties of managing foreign exchange reserves and rendering certain banking services to the banking sector and the Government of Rwanda
The Bank is exposed to credit, market, and liquidity risks due to the aforementioned operations. The financialrisksthatariseduringthemanagementofforeignexchangereservesaretheoutcomeofan investment choice. Nevertheless, the Bank endeavours to minimise such risks by managing them with a conservative approach.
The bank risk management policies and practices are driven by the following principles which are applied to the following.
• Board oversight: The investment and operational policies and guide lines have to be approved by the Board of Directors and are subject to review from time to time.
• Review by senior management: All activities, including those involving any risk and management of investment of external reserves, are subject to review and approval by the senior management.
• Diversification:Investmentpoliciesandlimitsaresetwithaviewtoensuringthatrisksarewelldiversified.
• Assessment: Policies and processes have been established to ensure that risks are properly assessed.
• Reviewandreporting:Riskprofilesofcounterpartsandportfoliosaresubjecttoongoingreviewand reporting to the senior management and to the Board of Director.
Individual risks, portfolio and operational risks are subject to comprehensive Internal Audit Department review, with independent reporting to senior management.
The following are the main types of risks that the Bank is exposed to in the course of executing its operations:
• Credit risk• Liquidity risk• Market risk:
- Interest risk- Foreign currency exchange risk
• Operational risk

134
Financial statements
BNR
33. RISK MANAGEMENT POLICIES (Continued)
Credit risk
Duringitsfinancialoperations,theBankisexposedtocreditrisk,definedastheprobabilityofacompleteorpartialfailureofcounterpartytofulfillitsobligationsarisingfromafinancialtransaction.The credit risk basically originates from the investments made of deposit placements, if on their maturity the depository bank is unable to pay.
The management of the credit risk that the Bank is exposed to during the foreign exchange reserve management is based on the principle of minimising default probabilities of the counterparties and thefinanciallossincaseofdefault.
TheBanklendsonlytotheRwandanGovernment,thelocalbanksandfinancialinstitutions.Creditstobanksandotherfinancialinstitutionsareforaveryshorttermandarecoveredbyguaranties.The Bank requires deposits totalling 100 % of the total amounts of letters of credit opened and/or confirmed.Itrequiresguarantiesincaseofissuingoffbalancesheetliabilities.
30-Jun-12 30-Jun-11a Credit risk
Cash and cash equivalents 5,955,905 6,128,520 Foreign assets 519,179,264 442,967,641 International Monetary Fund Quota 74,251,386 76,965,858 Due from Government of Rwanda 38,597,550 72,166,089 Loan and advance to banks 1,918,484 8,313,257 Duefromforeignfinancialinstitutions 5,953,536 1,479,511 Loan and advance to staff 5,007,285 4,235,648
650,863,411 612,256,524
Analysis of staff loans and advances, and Government overdraft
Individually impaired:
At 30 June
2012
At 31June
2011Staff loans 77,110 - Allowance for impairment (52,482 ) -
24,628 - Loans past due but not impairedPast due up to 30 days 1,786 - Pastdue31–60days 2,265 - Pastdue61–90days 975 -
5,026 -
Loans neither past due nor impairedStaff loans and advances 4,563,639 Government overdraft - 33,437,958
4,563,639 33,437,958

135
Financial statements
BNR
Liquidity risk
Liquidityriskisdefinedashavingdifficultyinfindingsufficientcashtomeetthecommitments that are due or being compelled to convert assets into cash at a price lower than their fair value. The choice of the types of instruments to invest the reserves in is part of liquidity risk management.
In order to manage liquidity risk, the Bank invests its surplus reserves in time deposits with maturities concentrated in short-term maturity span of one to three months. The portfolio is structured in such a manner that a mix of deposits matures every week to ensure availability of funds to meet scheduled government and the Bank’s obligations.
The table below analyses liabilities into relevant maturity groupings based on the remaining period to the contractual maturity date
As at 30 June 2012 On demandDue within3
months
Due between
4-12 months
Due between 1-5 years
Due after 5 years Total
Currency in circulation 129,876,564 0 0 0 0 129,876,564
Government deposits 155,809,016 704,914 0 0 0 156,513,929
Due to local financial institutions 46,049,295 122,409,817 557,060 0 0 169,016,173
Due to International Monetary Fund 0 0 0 8,325,332 145,476,151 153,801,483
Foreign liabilities 7,528,397 0 0 0 0 7,528,397
Other liabilities 7,355,751 2,701,174 0 380,945 0 10,437,869
346,619,023 125,815,904 557,060 8,706,277 145,476,151 627,174,415
As at 30 June 2011
Currency in circulation 115,051,253 0 0 0 0 115,051,253
Government deposits 170,813,162 4,734,251 0 0 0 175,547,413
Due to local financial institutions 36,082,776 87,193,502 1,630,184 0 0 124,906,462
Due to International Monetary Fund 0 50,925 922,438 6,264,886 152,894,818 160,133,067
Foreign liabilities 828,018 0 136,913 1,300,673 68,292 2,333,896
Other liabilities 21,607,870 2,928,714 0 0 0 24,536,584
344,383,079 94,907,392 2,689,535 7,565,559 152,963,110 602,508,675

136
Financial statements
BNR
33. RISK MANAGEMENT POLICIES (Continued)
Foreign currency exchange rate risk
Foreigncurrencyexchangeraterisksignifiestheprobabilityofincurringalossstemmingfrom adverse market movements, usually in interest rates, currency exchange rates, and asset prices
The Bank has put in place a foreign reserve management committee. Generally, the Bank manages risks through prudent management of its assets and liabilities by ensuring long foreign exchange position especially for the United States of America dollars (US$) for which the exchange rate is relatively stable in comparison to other foreign currencies and hence limiting exchange positions for other currencies.
The Bank’s assets are maintained in US$ given that most transactions with correspondent banks are carried out in this currency. The Bank manages country exchange reserves and places deposits in AAA sovereign assets and supranational organizations.
Structurally, the Bank’s exchange positions by currency are long except for transferable positions in Special Drawing Right and in Rwandan Francs that are short. Thus, when exchange rates vary upward, the Bank makes a gain. On the other hand, if there is variation of exchange rates downward, the Bank makes a loss.

137
Financial statements
BNR
Foreign currency exchange rate risk
Foreign currencies to which the Bank was exposed at 30 June 2012 are summarized below all expressed in thousand Francs.
USD EURO GBP SDR Others Total
Foreign assets 422,002,922 8,074,685 278,136 76,770,653 12,052,868 519,179,264
International Monetary Fund Quota
0 0 0 74,251,386 0 74,251,386
Cash balance 5,613,462 205,824 123,524 0 13,095 5,955,905
Total assets 427,616,384 8,280,509 401,661 151,022,039 12,065,962 599,386,555
Liabilities
Government deposits 29,628,120 11,214,554 7,128 0 115,664,128 156,513,929
Due to International Monetary Fund
0 0 0 153,801,483 0 153,801,483
Due to local financial institutions
2,123,988 42,516 0 0 166,849,669 169,016,173
Foreign liabilities 6,360,656 971,051 0 106 196,583 7,528,397
Total liabilities 38,112,764 12,228,121 7,128 153,801,589 282,710,380 486,859,982
Net exposure 389,503,620 (3,947,612) 394,532 (2,779,550) (270,644,418) 112,526,573
Total assets at 30 June 2011 372,592,797 30,298,606 3,265,955 149,127,622 578,144 555,863,124
Total liabilities at 30 June 2011
100,618,464 24,768,593 1,927,693 151,885,012 178,017 279,377,779
Net exposure at 30 June 2011
271,974,333 5,530,013 1,338,262 (2,757,390) 400,127 276,485,345
Sensitivity analysis on currency risk
Currency risk is the risk of loss resulting from changes in exchange rates. The Bank has assetsandliabilitiesinvariouscurrencies;however,themostsignificantexposurearisesfrom assets denominated in the US dollar, GBP and Euro currencies. The following table demonstrates the sensitivity to reasonably possible change in the Frw/ US dollar exchange rate,withallothervariablesheldconstant,oftheBank’sprofitearned.

138
Financial statements
BNR
33. RISK MANAGEMENT POLICIES (Continued)
Thefollowingsignificantexchangeratesappliedduringtheyear:
Currency Closing rate Average rate Average rateAt 29 June
2012At 30 June
2011Six months ended
30 June 201231 December
2011USD 612.43 602.42EURO 761.06 869.23GBP 951.89 964.95SDR 926.98 960.87
A 5% percent strengthening of the Rwanda Francs against the following currencies wouldhaveincreased/(decreased)equityandprofitorlossbyamountsshownbelow.This analysis assumes that all other variables, in particular interest rates, remain constant. The analysis is performed on the same basis for 2010:
At 30 June 2011 At 31 December 2010Frw’ 000 Frw’ 000
USD (14 403 310) (13 598 717)EURO 80 868 (276 501)GBP 9 934 (66 913)SDR 143 195 137 870
Interest risk
Interest rates risk on currencies lies in the fact that, on one hand interest rates on short-term placements (generally for 1 to 3 months) can diminish and create a loss and on the other hand, interest on liabilities can increase.
The existing legal provisions cover the Bank against all risks relating to interest rates. Article 50 of the Bank’s charter provides that “credit balances in the accounts opened at the National Bank do not generate interest”. However, Article 49 of the Bank’s charter provides that the Bank shall levy on debit balances interest computed at the daily average of inter-bank interest rate.
When commercial banks have excess liquidity, the Bank continues its market intervention policy of short term interest earning deposits (mop up deposits) to encourage the commercial banks to invest/deposit the excess funds at the Bank. This is aimed at bringing monetary stability in the economy.

139
Financial statements
BNR
This table shows the extent to which the Bank’s interest rate exposures on assets and liabilities are matched. Items are allocated to time bands by reference to the earlier of the next contractual interest rate reprising date and maturity date.
Interest rate risk
As at 30 June 2012
3 months or less
3-12 months Over one year
Non interest bearing
Total
Cash and cash equivalents
0 0 0 5,955,905 5,955,905
Foreign assets 419,670,874 0 76,770,653 22,737,736 519,179,264
International Monetary Fund Quota
0 0 0 74,251,386 74,251,386
Due from Government of Rwanda
0 0 38,597,550 0 38,597,550
Loan and advance to banks
0 0 0 0 1,918,484
Due from foreign financial institutions
0 0 5,953,536 0 5,953,536
Loan and advance to staff
0 0 0 0 5,007,285
Other assets 18,673,814 0 0 0 18,673,814
Total assets 438,344,688 0 121,321,740 102,945,028 669,537,225
Currency in circulation
0 0 0 129,876,564 129,876,564
Government deposits
0 0 0 156,513,929 156,513,929
Due to local financial institutions
0 0 0 0 169,016,173
Due to International Monetary Fund
0 0 79,537,889 74,263,594 153,801,483
Foreign liabilities 0 0 0 0 7,528,397
Other liabilities 10,437,869 0 0 0 10,437,869
Total liabilities 10,437,869 0 79,537,889 360,654,087 627,174,415
Interest sensitivity gap at 30 June 2012
427,906,819 0 41,783,851 (257,709,059) 42,362,810

140
Financial statements
BNR
33. RISK MANAGEMENT POLICIES (Continued)
Interest risk – continued
Cash and cash equivalents
0 0 0 6,128,520 6,128,520
Foreign assets 258,699,847 184,090,974 0 176,820 442,967,641
International Monetary Fund Quota
0 0 0 76,965,858 76,965,858
Due from Government of Rwanda
33,437,957 143,362 38,584,770 0 72,166,089
Loan and advance to banks
4,643,454 1,017,243 1,634,261 1,018,299 8,313,257
Due from foreign financial institutions
0 134,501 1,345,010 0 1,479,511
Loan and advance to staff
94,621 342,272 3,585,847 212,908 4,235,648
Other assets 29,591,693 0 0 0 29,591,693
Total assets 326,467,572 185,728,352 45,149,888 84,502,405 641,848,217
Currency in circulation
0 0 0 115,051,253 115,051,253
Government deposits
0 0 0 175,547,412 175,547,412
Due to local financial institutions
87,193,502 1,630,184 0 36,082,776 124,906,462
Due to International Monetary Fund
50,926 922,437 82,181,192 76,978,512 160,133,067
Foreign liabilities 0 136,913 1,368,965 828,018 2,333,896
Other liabilities 24,536,584 0 0 0 24,536,584
Total liabilities 111,781,012 2,689,534 83,550,157 404,487,971 602,508,674
Interest sensitivity gap at 30 June 2011
214,686,560 183,038,818 (38,400,269) (319,985,566) 39,339,543
Sensitivity analysis on interest rate risk
Interest rate risk is the risk of loss resulting from changes in interest rates, including changes in the shape of yield curves. The Bank bases its analysis on the interest sensitivity gap above. The sensitivitycomputationsassumethatfinancialassetsmaintainaconstantrateofreturnfromoneyeartothenext.Theeffectonprofitduetoreasonablepossiblechangesininterestrates,withallother variables held constant, is as follows:

141
Financial statements
BNR
Operational risk
Operational risk is the risk of loss due to human or system errors, incompatibility or failure of internal business processes, or external events. The Bank seeks to minimise losses from operational risk by establishing effective internal control systems which prevent or detect all errors and situations which might cause loss through failure of people or processes in such a way that losses are avoided or reduced to the minimum possible extent. The Bank has assigned the responsibility for managing operational risks to the management of the departments. Human Resource risk
The particular nature of the activities of the Bank necessitates specialized knowledge in many areas. The Bank ensures that there is an adequate knowledge base for all specialized job requirementsbyinvestingsignificantlyinhumanresourcedevelopmentintermsofcapacitybuilding and practical exposure. The Bank also organises workshops, seminars, conferences and job attachments to its staff as an effort to improve its human resource requirements.
Legal risk
Legal risks arise from any uncertainty of enforceability, whether through legal or judicial processes, of the obligations of the Bank’s clients and counter parties. These are the risks that the Bank may not be complying fully with the relevant laws and legislations. The Bank aims at minimising such uncertainties through continuous consultations with all relevant parties. In mitigating these types of the risks, the Bank ensures that all business agreements are sub-jected to extensive legal reviews before contracting.
Reputation risk
TheconcernaboutreputationflowsfromthefactthattheBankisapublicinstitutionwithimportantresponsibilitiesforstabilityinthevalueofmoney,thesoundnessandefficiencyofthefinancialsystemandtheissueofcurrency(notesandcoins).Allofthesemattershavedirectimpact on all citizens and the credibility and the reputation of the Bank is an important factor in thesuccessfulfulfillmentoftheseresponsibilities.
In managing this risk, the Bank adheres to the best practices and applies principles of sound corporate governance. It also ensures that all key staff has a clear understanding of the appropriate processes in respect of the best practice and principles of good corporate governance.
The Bank therefore, sets out policies and guidelines that govern sound functional operations within the Bank. The performance of these policies and guidelines are periodically reported to different levels of the Bank’s Management for Control and Compliance Monitoring.
FAIR VALUE
Intheopinionofthedirectors,thefairvaluesoftheBank’sfinancialassetsandliabilitiesapproximatetheirrespectivecarryingamounts.Fairvaluesarebasedondiscountedcashflowsusing a discount rate based on the borrowing rate that directors expect would be available to the Bank at the reporting date.

142
Financial statements
BNR
33. RISK MANAGEMENT POLICIES (Continued)
Thetablebelowsetsoutthecarryingamountsofeachclassoffinancialassetsandliabilities,and their fair values:
As at 30 June 2011 Loans and receivables
Available-for-sale
Other amortised cost
Total carrying amount
Fair value
ASSETSCash balance 6 128 520 - - 6 128 520 6 128 520Foreign assets - 442 967 641 - 442 967 641 442 967 641International Monetary Fund quota 76 965 858 - - 76 965 858 76 965 858
Due from Government of Rwanda 72 166 089 - - 72 166 089 72 166 089
Advances to banks 8 313 257 - - 8 313 257 8 313 257Duefromforeignfinancialinstitutions 1 479 511 - - 1 479 511 1 479 511
Loans and advances to staff 4 235 648 - - 4 235 648 4 235 648Other assets 29 591 693 - - 29 591 693 29 591 693Total assets 198 880 576 442 967 641 - 641 848 217 641 848 217
LIABILITIESCurrency in circulation - - 115 051 253 115 051 253 115 051 253Government deposits - - 175 547 413 175 547 413 175 547 413Duetolocalfinancialinstitutions - - 124 906 462 124 906 462 124 906 462Due to International Monetary Fund - - 160 133 067 160 133 067 160 133 067Foreign liabilities - - 2 333 896 2 333 896 2 333 896Other liabilities - - 24 536 584 24 536 584 24 536 584Total liabilities - - 602 508 674 602 508 674 602 508 675

143
Financial statements
BNR
As at 31 December 2010 Loans and receivables
Available-for-sale
Other amortised cost
Total carrying amount
Fair value
ASSETSCash balance 1 530 077 - - 1 530 077 1 530 077Foreign assets 481 329 713 - 481 329 713 481 329 713International Monetary Fund quota 73 003 334 - - 73 003 334 73 003 334Due from Government of Rwanda 57 850 366 - - 57 850 366 57 850 366Advances to banks 10 899 747 - - 10 899 747 10 899 747Duefromforeignfinancialinstitutions 1 479 511 - - 1 479 511 1 479 511Loans and advances to staff 4 098 589 - - 4 098 589 4 098 589Other assets 1 269 511 - - 1 269 511 1 269 511Total assets 150 131 135 481 329 713 - 631 460 848 631 460 848
LIABILITIESCurrency in circulation - - 104 140 320 104 140 320 104 140 320 Government deposits - - 236 722 357 236 722 357 236 722 357 Duetolocalfinancialinstitutions - - 94 374 197 94 374 197 94 374 197 Due to International Monetary Fund - - 151 884 907 151 884 907 151 884 907 Foreign liabilities - - 2 086 447 2 086 447 2 086 447 Other liabilities - - 5 849 788 5 849 788 5 849 788 Total liabilities - - 595 058 016 595 058 016 595 058 016

144
Financial statements
BNR
33. RISK MANAGEMENT POLICIES (Continued)
COMMITMENTS AND CONTINGENT LIABILITIESAt 30 June 2011 At 31 December 2010
Frw’ 000 Frw’ 000
Claims - -
The Bank is a party to legal proceedings with former employees. Having regard to the legal advice received, and in all circumstances, the management is of the opinion that these legal proceedings will not give rise to liabilities, which in aggregate, would otherwise have material effect on these financialstatements.
At 30 June 2011 At 31 December 2010Commitments Frw’ 000 Frw’ 000
Contracted for - 27 355 748
Authorised and not contracted for - 152 197
Others:
Rwanda Government debt 127 509 200 126 954 285 Letters of credits opened 17 684 652 23 295 614 Other off balance sheet accounts 512 977 652 180

145
Financial statements
BNR
CONCLUSION
In this report, it was shown that the National Bank of Rwanda has achieved its objectives of ensur-ing the stability of prices and the well-functioning of the financial sector despite the challenging global, regional and domestic economic environment.
The global economic environnent was marked by serious uncertainties on financial market, the de-cline of inflation following weak demand and the decline of growth compared to the previous year.
The regional economic environment witnessed turn round in inflation rates, which contributed to mitigating the imported inflation to Rwanda. Movements in exchange rates had an opposite effect. As currencies of our major trading partners in the EAC regained vis-à-vis the dollar, the RWF de-preciated against the currencies in those countries. Rwanda remained the net importer in the EAC.
Despite the global slowdown, the national economic performance remained on track. Produc-tive activities continued to record good performance in line with the real GDP growth projection and exports and imports grew beyond expectations which resulted in higher demand in foreign exchange which could have pushed the depreciating trend of the RWF even further hadn’t the National Bank increased its sales to the market.
The National Bank of Rwanda managed to keep Broad Money supply and demand in line with the dynamism in economic activities. The inflation has been limited at low and stable levels, sustaining improvement in banking system liquidity conditions and ensuring smooth fluctuation of exchange rate.
The financial sector continued to be profitable, liquid and well capitalized to sustain growth and resilience to external shocks. Access to finance has been improved in terms notably of number of accounts, licensing of agency banking, new technologies and modernization efforts.
In line with the Government program, the Bank continued to improve domestic and international payment systems. Thus, after the implementation of the Rwanda Integrated Payment Processing System (RIPPS), the first semester of 2012 has been focused to stabilise the RIPPS and to intro-duce new and strengthen existing retail payment systems. In particular, the RIPPS system has been upgraded to enable linkage to the COMESA Regional Payment and Settlement System (REPSS).
The National Bank of Rwanda wishes to thank all its partners and stakeholders for the good col-laboration that has enabled the rich achievements to be made. The Bank remains committed to ensuring macroeconomic stability in the periods to come. Although uncertainties persist, the ou-took is generally positive and everyone should work hard to realize the good things the future is holding for the human kind.

146
Financial statements
BNR

APPENDICES

148
APPENDICES
BNR
MA
JOR
IND
ICAT
OR
S O
F N
ATIO
NA
L EC
ON
OM
Y
App
endi
ce 1
Des
crip
tion
2005
2006
2007
2008
2009
2010
2011
Jan.
- Ju
n 20
12C
urre
nt G
DP
( in
FRW
bill
ion)
1439
.917
16.5
2044
.625
76.6
2985
.032
79.8
3828
.32,
078.
0
o
f whi
ch :
Prim
ary
sect
or, i
n %
of G
DP
38.4
38.4
35.7
32.4
33.9
32.2
31.9
31.7
Sec
onda
ry s
ecto
r, in
% o
f GD
P14
.113
.813
.914
.814
.415
.016
.315
.2
T
ertia
ry s
ecto
r, in
% o
f GD
P 41
.442
.044
.646
.445
.546
.745
.647
.0C
onst
ant G
DP
(in F
RW
bill
ion
,200
6)1,
571.
41,
716.
41,
847.
42,
053.
62,
181.
92,
339.
42,
540.
11,
310.
1G
row
th ra
te (
in %
)9.
49.
27.
711
.66.
27.
28.
68.
7
o
f whi
ch :
Prim
ary
sect
or6.
52.
82.
66.
57.
75.
04.
73.
6
S
econ
dary
sec
tor
9.3
11.7
9.1
15.1
1.4
8.4
17.6
5.0
Ter
tiary
sec
tor
11.9
13.3
12.2
13.8
6.2
9.0
8.9
14.1
Infla
tion
rate
9.
18.
99.
115
.410
.32.
35.
77.
5C
urre
nt G
DP
per c
apita
(In
USD
) 2
88.7
33
2.6
391
.1
479.
2 51
9.2
540.
1 59
4.8
-G
row
th ra
te (
in %
)19
.215
.217
.622
.58.
34.
010
.1-
USE
S O
F G
DP(
cons
tant
), in
%
100.
010
0.0
100.
010
0.0
100.
010
0.0
100.
010
0.0
Priv
ate
Con
sum
ptio
n76
.380
.180
.476
.181
.582
.281
.483
.2
P
ublic
Con
sum
ptio
n18
.118
.117
.115
.716
.517
.016
.615
.9
G
ross
Dom
estic
Inve
stm
ent
14.8
16.0
18.6
22.1
21.4
21.4
22.1
21.9
Res
ourc
e B
alan
ce
-9.9
-14.
2-1
6.1
-14.
0-1
9.6
-20.
6-2
0.1
-21.
0
Bal
ance
of c
urre
nt p
aym
ents
(+ne
t tra
nsfe
rs),
in %
of G
DP
-2.2
-4.3
-2.2
-5.2
-8.2
-7.0
-7.0
-0.1
Gro
ss re
serv
es, i
n nu
mbe
r of m
onth
s of
impo
rts
of g
oods
an
d no
n fa
ctor
ser
vice
s(G
NFS
)7.
66.
87.
05.
16.
2 6.
0 5.
8 5.
1
Tax
reve
nues
, in
% o
f GD
P11
11 1
2.0
1312
1313
.214
.8
Bud
get d
efic
it (c
ash
basi
s ),
in %
of G
DP
-0.5
-1.0
-1.3
0.1
-1.3
-2.0
-0.5
-0.1
Exte
rnal
deb
t sto
ck (U
SD m
illio
n )
1,49
6.0
481.
756
6.7
665.
5573
6.6
766.
5998
4.7
1,00
4.7
Exte
rnal
deb
t Ser
vice
in %
of e
xpor
t ear
ning
s 40
.423
.97.
15.
67.
56.
05.
16.
8
Sour
ce: B
NR

149
APPENDICES
BNR
GR
OSS
DO
MES
TIC
PR
OD
UC
T B
Y B
RA
NC
H O
F A
CTI
VITY
(Nom
inal
) A
ppen
dice
2(In
FR
W b
illio
n, a
t cur
rent
pric
es)
DES
CR
IPTI
ON
2004
2005
2006
2007
2008
2009
2010
2011
Jan.
- Ju
n 20
12 A
gric
ultu
re
465
553
660
729
834
1,01
21,
058
1,22
365
9
Foo
d cr
op
396
467
546
619
692
858
891
1,04
1
Exp
ort c
rops
13
1825
1824
2328
29 L
ives
tock
26
2731
3342
4950
56 F
ores
try
2635
5253
6872
7784
Fis
herie
s 5
56
79
1011
13 In
dust
ry
167
202
236
285
382
430
491
625
316
Min
ing
and
Qua
rryi
ng
810
1121
2516
2248
Man
ufac
ture
d go
ods
8410
111
712
515
919
021
825
2
of w
hich
: Foo
dstu
ffs,b
ever
ages
and
toba
cco
53
6777
8010
613
615
217
3
O
ther
s 30
3540
4453
5465
79
E
lect
ricity
, Gas
, and
Wat
er
13
38
56
78
Con
stru
ctio
n 74
8810
513
219
421
924
431
7 S
ervi
ces
497
596
720
912
1,19
81,
365
1,53
01,
725
976
Who
lesa
le a
nd re
tail
trade
,Res
taur
ants
and
hot
els
147
187
233
289
415
449
500
564
T
rans
port,
sto
rage
and
com
mun
icat
ion
7490
117
145
197
223
257
288
Fina
nce,
Insu
ranc
e,R
eal E
stat
e,B
usin
ess
serv
ices
13
114
616
223
130
135
137
341
5
P
ublic
Adm
inis
tratio
n 68
7587
9711
212
815
118
1
E
duca
tion
4359
7695
108
140
167
210
heal
th
2121
2330
3644
5153
O
ther
s se
rvic
es
1318
2327
3030
3334
Les
s: B
ank
serv
ice
char
ges
-17
-19
-24
-31
-40
-41
-50
-70
-42
Plu
s: V
AT a
nd O
ther
taxe
s on
pro
duct
s 94
108
124
151
204
226
249
306
169
GR
OSS
DO
MES
TIC
PR
OD
UC
T 1,
206
1,44
01,
716
2,04
62,
579
2,99
23,
280
3,82
82,
078
Sour
ce:
Nat
iona
l Ins
titut
e of
Sta
tistic
s of
Rw
anda
(IN
SR)

150
APPENDICES
BNR
GROSS DOMESTIC PRODUCT BY BRANCH OF ACTIVITY (Real) Appendice 3(In FRW billion , at 2006 constant prices)
DESCRIPTION 2004 2005 2006 2007 2008 2009 2010 2011Jan. - Jun 2012
Agriculture 603 642 660 677 721 776 815 853 413 Food crop 499 538 546 567 603 659 692 727 Export crops 25 19 25 18 23 20 22 23 Livestock 28 30 31 32 33 34 35 36 Forestry 44 48 52 53 55 56 59 60 Fisheries 6 6 6 6 6 7 7 7 Industry 193 211 236 258 297 301 326 383 189 Mining and Quarrying 10 13 11 16 13 11 10 15 Manufactured goods 95 103 117 118 124 128 140 151 of which: Foodstuffs,beverages and tobacco 61 68 77 75 79 83 89 93
Others 33 34 40 43 45 45 51 57 Electricity, Gas, and Water 4 4 3 4 4 4 6 6 Construction 85 93 105 121 155 157 171 211 Services 568 636 720 809 929 982 1,065 1,160 639 Wholesale and Retail trade,Restaurants and Hotels 168 196 233 262 309 316 342 374
Transport, Storage and Communication 81 95 117 134 166 181 197 208 Finance, Insurance,Real estate and Business services 145 153 162 181 202 212 224 237
Public Administration 77 79 87 92 96 103 118 136 Education 60 71 76 87 99 110 117 138 health 22 21 23 26 29 34 39 40 Others services 14 19 23 26 27 25 27 27 Less: Bank Service Charges -20 -21 -24 -29 -31 -30 -35 -46 -26 Plus: VAT and Other taxes on products 107 114 124 133 149 158 169 191 95 GROSS DOMESTIC PRODUCT 1,437 1,571 1,716 1,849 2,064 2,187 2,339 2,540 1,310
Source: National Institute of Statistics of Rwanda (INSR)

151
APPENDICES
BNR
USES AND RESOURCES OF GDP (nominal) Appendice 4 (In FRW billion)
2004 2005 2006 2007 2008 2009 2010 2011 Jan.- June 2012
Gross Domestic Product 1,206 1,440 1,716 2,046 2,579 2,992 3,280 3,828 2,078Final Consumption Expenditure 1,190 1,411 1,686 1,975 2,400 2,867 3,266 3,740 2,060 Public Administration 221 262 312 338 378 434 524 580 Private (including change of stocks)
968 1,149 1,374 1,637 2,022 2,433 2,742 3,160
Gross Domestic Investment 181 227 275 369 585 645 688 818 456 Gross Fixed capital formation 181 227 275 369 585 645 688 818 Construction 135 166 204 257 382 432 484 631 Equipment ( durable goods) 46 61 71 112 203 213 204 187Resource Balance -165 -199 -244 -298 -406 -520 -674 -730 -437 Exports (gnfs) 134 165 190 224 372 347 330 514 Goods (fob) 55 67 79 93 142 109 149 255 Non factor Services 79 97 111 132 230 237 181 259 Imports (gnfs) 299 363 434 523 778 866 1,003 1,244 goods (fob) 162 205 250 324 493 572 679 872 Non factor Services 137 158 184 199 285 294 325 371
USES AND RESOURCES OF GDP (real) Appendice 4 (Cont’d)(In billions of Rwf constant prices, 2006)
2004 2005 2006 2007 2008 2009 2010 2011Jan. - Jun 2012
Gross Domestic Product 1,441 1,575 1,716 1,849 2,064 2,187 2,339 2,540 1,310Final Consumption Expenditure 1,365 1,487 1,686 1,819 1,928 2,113 2,321 2,489 1,262 Public Administration 260 285 312 333 365 399 397 422 Private (including change of stocks)
1,104 1,201 1,374 1,486 1,562 1,714 1,924 2,068
Gross Domestic Investment 203 234 275 344 455 467 501 561 300 Gross Fixed capital formation 203 234 275 344 455 467 501 561 Construction 155 175 204 236 306 310 338 420 Equipment ( durable goods) 47 59 71 108 149 157 163 141Resource Balance -136 -156 -244 -314 -318 -392 -482 -510 -253 Exports (gnfs) 166 184 190 194 267 240 235 347 Goods (fob) 72 79 79 74 83 69 108 175 Non factor Services 94 106 111 121 183 170 127 172 Imports (gnfs) 296 334 434 509 585 634 717 857 goods (fob) 160 189 250 313 369 418 485 600 Non factor Services 136 146 184 195 215 215 231 256
Source : National Institute of Statistics of Rwanda

152
APPENDICES
BNR
MO
NTH
LY E
VOLU
TIO
N O
F C
ON
SUM
ER P
RIC
E IN
DEX
A
ppen
dice
5
(For
the
gene
ral i
ndex
and
the
divi
sion
s in
dex)
Jan
. 201
1 - J
un. 2
012
2011
2012
Div
isio
nsW
eigh
tsJa
nFe
bM
arA
prM
ayJu
nJu
lA
ugS
epO
ctN
ovD
ecJa
nFe
bM
arA
prM
ayJu
n
01. F
ood
and
non-
alco
holic
bev
er-
ages
3,53
810
1.8
103.
010
7.5
110.
510
9.4
112.
111
3.4
113.
311
2.8
114.
411
5.5
114.
911
4.8
118.
912
4.1
124.
612
6.0
124.
8
- Bre
ad a
nd c
erea
ls73
390
.391
.496
.110
0.2
103.
911
0.2
108.
610
8.2
108.
010
7.7
108.
110
8.7
110.
310
9.2
111.
011
3.2
115.
911
6.9
- Mea
t27
410
0.6
101.
010
0.9
102.
310
1.5
101.
910
2.3
105.
110
6.7
108.
511
0.2
110.
511
2.4
112.
311
3.1
114.
211
5.0
115.
1
- Fis
h83
113.
111
8.3
118.
712
0.6
127.
112
9.7
126.
212
8.6
132.
913
4.4
139.
413
9.7
135.
513
8.2
136.
613
8.6
141.
314
2.4
- Veg
etab
les
1,20
010
1.5
103.
111
3.2
116.
911
0.3
112.
311
4.4
113.
511
3.2
117.
512
1.0
117.
211
6.2
129.
714
3.3
141.
714
2.1
136.
2
-
Non
-alc
ohol
ic b
ever
ages
160
99.6
99.1
98.9
98.8
99.3
101.
210
3.7
104.
110
4.4
103.
510
0.1
102.
010
2.2
112.
611
1.3
111.
111
0.6
110.
5
02. A
lcoh
olic
bev
erag
es a
nd to
bacc
o24
011
1.2
113.
011
1.5
111.
811
2.2
112.
811
3.4
117.
111
5.5
115.
111
5.1
116.
011
6.5
115.
411
1.1
114.
711
8.9
124.
4
03. C
loth
ing
and
foot
wea
r37
710
4.1
105.
410
5.2
105.
510
7.3
107.
410
8.2
110.
211
0.7
110.
611
1.7
111.
611
2.1
110.
411
1.8
110.
811
1.6
112.
4
04. H
ousi
ng, w
ater
, ele
ctric
ity, g
as
and
othe
r fue
ls2,
204
101.
910
2.3
102.
710
3.3
104.
010
5.0
104.
410
5.2
108.
110
8.8
109.
210
8.8
107.
410
6.8
109.
610
9.8
113.
711
0.8
05. F
urni
shin
g, h
ouse
hold
equ
ipm
ent
and
ro
utin
e ho
useh
old
mai
nten
ance
457
98.0
97.8
98.4
99.0
99.2
99.2
99.6
101.
210
1.6
102.
210
1.9
101.
410
2.0
102.
910
2.6
102.
610
3.4
103.
4
06. H
ealth
163
101.
410
1.0
101.
610
1.2
101.
210
2.1
102.
910
3.0
103.
110
2.6
101.
910
1.9
102.
410
2.6
103.
410
3.3
102.
810
3.6
07. T
rans
port
1,18
911
5.9
116.
511
7.9
120.
712
1.8
125.
512
6.2
127.
212
7.3
126.
812
6.5
126.
612
4.9
123.
712
4.1
124.
712
5.5
126.
0
08. C
omm
unic
atio
n28
897
.710
0.8
101.
410
0.0
101.
310
0.8
100.
899
.493
.793
.391
.591
.692
.291
.693
.593
.393
.093
.0
09. R
ecre
atio
n an
d cu
lture
256
101.
810
3.1
105.
410
5.7
106.
110
5.7
104.
410
5.9
106.
810
6.5
106.
010
6.1
104.
110
4.2
104.
310
4.0
104.
010
4.2
10. E
duca
tion
331
119.
212
6.9
127.
612
7.6
127.
612
8.6
128.
612
8.6
128.
612
8.6
128.
612
8.6
129.
912
9.9
129.
912
9.9
129.
912
9.9
11. R
esta
uran
ts a
nd h
otel
s55
810
2.3
102.
110
2.3
102.
010
3.3
103.
310
3.3
103.
010
4.6
104.
210
4.4
105.
210
5.5
105.
310
5.3
104.
910
5.0
105.
4
12. M
isce
llane
ous
good
s an
d se
rvic
es40
099
.910
0.3
102.
210
1.7
101.
410
3.3
103.
210
3.3
104.
110
4.8
103.
710
4.2
104.
310
5.6
106.
110
5.3
105.
810
5.8
GE
NE
RA
L IN
DE
X10
,000
.010
4.0
105.
110
7.1
108.
610
8.7
110.
411
0.8
111.
311
1.8
112.
411
2.8
112.
611
2.2
113.
311
5.8
116.
111
7.8
116.
9
Mon
thly
cha
nges
0.1
1.0
1.9
1.4
0.1
1.5
0.4
0.4
0.4
0.6
0.3
-0.2
-0.3
1.0
2.2
0.2
1.4
-0.7
Cha
nges
ove
r 12
mon
ths
1.1
2.6
4.1
5.0
4.5
5.8
7.1
7.5
6.6
7.8
7.4
8.3
7.8
7.9
8.2
6.9
8.3
5.9
Sou
rce
: BN
R

153
APPENDICES
BNR
Mon
thly
Evo
lutio
n of
Pro
duce
r Pric
e In
dex
App
endi
ce 5
(con
t’d)
Four
th q
uart
er 2
003
= 10
0
ISIC
. Rev
.3G
roup
of A
ctiv
ityW
eigh
tsY
EA
R 2
011
YE
AR
201
2
Jan.
Feb.
Mar
.A
pr.
May
Jun.
Jul.
Aug
.S
ept.
Oct
.N
ov.
Dec
.Ja
n.Fe
b.M
ar.
Apr
.M
ayJu
n.
1511
-160
0Fo
od P
rodu
cts,
Bev
erag
es a
nd T
obac
co45
616
1.8
161.
716
1.8
163.
216
3.4
165.
717
8.9
178.
817
7.7
178.
917
8.9
178.
917
8.9
185.
418
5.4
178.
218
4.7
184.
7
1511
-154
2Fo
od P
rodu
cts
129
175.
617
5.4
175.
818
0.6
181.
418
9.4
190.
519
0.4
186.
419
0.5
190.
519
0.5
190.
475
190.
475
190.
475
190.
483
190.
483
190.
483
1511
Pro
duct
ion,
pro
cess
ing
and
pres
ervi
ng o
f mea
t an
d m
eat p
rodu
cts
322
0.9
220.
922
0.9
220.
922
0.9
220.
922
0.9
220.
922
0.9
220.
922
0.9
220.
922
1.2
221.
222
1.2
221.
222
1.2
221.
2
1513
Pro
cess
ing
and
pres
ervi
ng o
f fru
its a
nd
vege
tabl
es8
168.
516
8.5
168.
517
5.2
175.
217
5.2
175.
217
5.2
175.
219
4.0
206.
922
6.4
226.
422
6.4
226.
417
5.2
175.
221
0.4
1520
Man
ufac
ture
of d
airy
pro
duct
s32
211.
421
1.4
211.
421
7.5
217.
521
7.5
217.
521
7.5
201.
321
2.0
212.
021
2.0
201.
820
1.8
204.
923
9.1
239.
123
9.1
1531
-153
3M
anuf
actu
re o
f gra
in m
ill a
nd a
nim
al fe
eds
prod
ucts
2714
5.4
144.
914
6.7
147.
014
8.7
182.
218
2.6
182.
118
2.1
180.
518
0.7
180.
817
9.2
177.
917
9.0
179.
317
8.6
178.
4
1541
Man
ufac
ture
of b
aker
y pr
oduc
ts, p
astry
, bi
scui
ts
1317
2.9
172.
917
2.9
191.
819
1.8
191.
819
1.8
191.
819
1.8
191.
819
1.8
191.
819
1.8
191.
819
1.8
191.
819
1.8
191.
8
1542
Man
ufac
ture
of
suga
r45
167.
516
7.0
167.
216
9.7
170.
817
3.6
176.
517
6.5
176.
518
7.9
187.
922
2.1
196.
518
7.9
165.
119
6.5
187.
916
5.1
1552
-160
0B
ever
ages
and
Tob
acco
327
156.
315
6.3
156.
315
6.3
156.
315
6.3
174.
217
4.2
174.
217
4.2
174.
217
4.2
174.
218
3.4
183.
417
3.3
182.
418
2.4
1552
-160
0M
anuf
actu
re o
f bee
r, so
ft dr
inks
and
toba
cco
327
156.
315
6.3
156.
315
6.3
156.
315
6.3
174.
217
4.2
174.
217
4.2
174.
217
4.2
174.
218
3.4
183.
417
3.3
182.
418
2.4
1711
-361
0O
ther
s th
an F
ood,
Bev
erag
es a
nd T
obac
co54
416
6.2
169.
016
9.0
170.
917
0.9
171.
016
6.8
166.
817
0.7
170.
717
0.7
170.
716
9.9
170.
017
0.0
170.
017
0.0
172.
6
1711
-192
0M
anuf
actu
re o
f tex
tiles
, wea
ring
appa
rel,
tan-
ning
and
dre
ssin
g of
leat
her
4717
5.1
174.
417
4.9
185.
118
5.0
185.
618
5.8
185.
818
5.8
185.
818
5.8
185.
818
2.6
182.
618
2.6
182.
618
2.6
182.
6
2029
-222
1M
anuf
actu
re o
f pap
er a
nd p
aper
pro
duct
s,
publ
ishi
ng o
f boo
ks, n
ewsp
aper
s40
145.
014
7.3
147.
314
7.3
147.
314
7.3
147.
314
7.3
147.
314
7.1
147.
114
7.1
147.
114
7.1
147.
114
7.1
147.
114
7.1
2422
-242
9M
anuf
actu
re o
f che
mic
al p
rodu
cts
172
149.
115
7.3
157.
316
4.7
164.
716
4.7
152.
315
2.3
164.
716
4.7
164.
716
4.7
164.
316
4.3
164.
316
4.3
164.
316
4.3
2511
-252
0M
anuf
actu
re o
f pla
stic
pro
duct
s,
tube
s,re
tread
ing
and
rebu
ildin
g of
rubb
er ty
res
4515
1.3
151.
315
1.3
135.
713
5.7
135.
713
5.7
135.
713
5.7
135.
713
5.7
135.
713
5.7
135.
713
5.7
135.
713
5.7
135.
7
2693
-269
5M
anuf
actu
re o
f cer
amic
pro
duct
s, c
emen
t, lim
e an
d ar
tiles
of c
oncr
ete
126
196.
119
6.1
196.
119
6.1
196.
119
6.1
196.
719
6.7
196.
719
6.8
196.
819
6.8
196.
819
6.8
196.
819
6.8
196.
820
8.0
2811
-289
9M
anuf
actu
re o
f fab
ricat
ed m
etal
pro
duct
s70
177.
317
7.3
177.
317
7.3
176.
917
7.5
174.
117
4.1
174.
117
3.8
173.
717
3.7
173.
217
3.4
173.
417
3.4
173.
417
3.4
3610
Man
ufac
ture
of f
urni
ture
4315
6.0
156.
015
6.0
156.
115
6.1
156.
115
6.1
156.
115
6.1
156.
115
6.1
156.
115
2.7
152.
715
2.7
152.
715
2.7
152.
7
1511
- 36
10P
PI f
or M
ainl
y Lo
cal S
old
prod
ucts
1000
164.
216
5.6
165.
716
7.4
167.
516
8.6
172.
317
2.3
173.
917
4.4
174.
417
4.4
174.
017
7.0
177.
017
3.7
176.
717
8.1
Mon
thly
Cha
nge
-0.1
%0.
9%0.
1%1.
0%0.
0%0.
7%2.
2%-0
.0%
1.0%
0.3%
-0.0
%-0
.0%
-0.0
0.0
0.0
-0.0
0.0
0.0
Cha
nge
over
12
Mon
ths
6.7
7.8
6.7
2.5
2.6
3.3
5.6
5.8
6.7
6.8
6.5
6.1
6.0
6.8
6.8
3.8
5.5
5.6
1549
Man
ufac
ture
of o
ther
food
pro
duct
s n.
c.e
978
244.
325
0.9
252.
327
0.5
269.
527
7.0
277.
027
5.8
264.
831
9.0
311.
229
7.2
306.
930
7.5
307.
731
8.2
301.
132
1.0
1549
Pro
duct
ion
of te
a58
517
7.7
181.
817
7.7
168.
917
1.1
176.
317
9.3
186.
716
7.5
167.
816
4.5
163.
717
0.6
171.
417
1.9
189.
419
1.6
194.
0
1549
Pro
duct
ion
of c
offe
e39
234
3.6
354.
136
3.6
422.
141
6.2
427.
142
2.6
408.
640
9.9
544.
552
9.9
496.
451
0.4
510.
451
0.4
510.
446
4.4
510.
4
2421
Man
ufac
ture
of p
estic
ides
and
oth
er a
gro-
chem
ical
pro
duct
s22
415.
241
5.2
415.
249
9.3
499.
349
9.3
499.
249
9.2
499.
250
1.0
501.
050
1.0
503.
750
3.7
503.
750
5.0
506.
350
7.4
2421
Pro
duct
ion
of p
yret
hrum
2241
5.2
415.
241
5.2
499.
349
9.3
499.
349
9.2
499.
249
9.2
501.
050
1.0
501.
050
3.7
503.
750
3.7
505.
050
6.3
507.
4
1549
- 24
21P
PI
for M
ainl
y E
xpor
t Pro
duct
s10
0024
8.1
254.
625
5.9
275.
627
4.6
281.
928
1.9
280.
727
0.0
323.
031
5.4
301.
831
1.3
311.
831
2.1
322.
430
5.7
325.
1
Mon
thly
Cha
nge
8.7%
2.6%
0.5%
7.7%
-0.4
%2.
7%-0
.0%
-0.4
%-3
.8%
19.6
%-2
.4%
-4.3
%0.
00.
00.
00.
0-0
.10.
1
Cha
nge
over
12
Mon
ths
27.2
823
.91
27.3
841
.07
43.5
147
.12
46.4
537
.93
36.8
652
.79
46.3
532
.23
25.5
022
.48
21.9
416
.96
11.3
115
.33
Sou
rce
: BN
R

154
APPENDICES
BNR
CONSOLIDATED FINANCIAL OPERATIONS OF THE CENTRAL GOVERNMENT Appendice 6(In billions of FRW)
Description 2005 2006 2007 2008 2009 2010 2011Jan - June 2012*
TOTAL REVENUES AND GRANTS 344.8 374.7 472.5 660.8 726.8 828.3 982.5 453.8
Total Revenue 180.3 205.6 252.1 381.0 379.4 430.9 541.7 307.6
Current Revenue 180.3 205.6 252.1 381.0 379.4 430.9 541.7 307.6
Tax Revenue 162.6 191.1 237.8 328.7 362.8 412.8 505.0 298.4
Direct Taxes 50.8 65.2 85.8 123.1 136.5 162.0 198.6 128.8
Income Tax 50.1 64.5 85.8 123.1 136.5 162.0 198.6 128.8
Property Tax 0.7 0.7 0.0 0.0 0 0.0 0.0 0.0
Indirect Taxes 111.8 125.8 152.0 205.6 226.4 250.8 306.4 169.6
Taxes on Goods and Services 82.8 95.5 121.0 161.7 183.7 216.8 265.7 144.5
Taxes on international trade 29.0 30.3 31.0 43.9 42.7 34.0 40.7 25.2
Non tax revenues 17.7 14.6 14.3 52.3 16.5 18.1 36.7 9.2
Capital revenues
Grants 164.5 169.1 220.4 279.8 347.4 397.4 440.8 146.2
Current Grants 110.9 73.2 132.4 185.7 233.6 275.9 298.7 54.7
Capital Grants 53.6 95.9 88.0 94.1 113.8 121.5 142.1 91.5
TOTAL EXPENDITURE 340.7 383.7 491.4 649.7 751.0 879.4 987.2 613.7
Current expenditure 214.9 255.4 313.2 368.5 424.4 501.0 569.4 316.2
Wages and Salaries 51.2 62.2 73.8 84.2 97.4 116.4 130.4 76.0
Civilians 34.7 41.2 52.5 61.0 69.9 85.4 98.9 58.4
Military 16.5 21.0 21.3 23.2 27.5 30.9 31.5 17.6
Purchase of goods and services 64.4 80.7 78.0 80.3 104.8 118.7 137.8 82.8
Civilians 55.8 71.6 67.5 66.9 86.5 105.7 121.3 75.6
Military 8.6 9.1 10.5 13.4 18.3 13.0 16.5 7.2
Interests payment on public debt 10.3 7.1 10.9 12.6 11.4 14.7 17.4 8.6
On domestic debt 4.2 4.2 8.7 8.9 7.3 10.1 12.5 6.0
On external debt 6.1 2.9 2.2 3.8 4.1 4.6 4.9 2.6
Transfers & Grants 53.6 71.9 103.6 130.4 162.4 189.5 220.3 106.9
Exceptional expenditure 35.4 33.5 46.9 60.9 48.4 61.7 63.6 42.0
Capital Expenditure 121.4 118.7 186.3 267.8 291.9 350.1 441.0 281.1
Financed by domestic resources 34.7 35.7 63.8 119.2 139.4 192.4 214.6 127.1
Financed by foreign resources 86.7 83.0 122.5 148.5 152.5 157.7 226.3 154.0
Net Lending 4.4 9.6 -8.1 13.5 34.7 28.3 -23.2 16.4
CurrentDeficit(paymentorderbasis) -34.6 -49.8 -61.1 12.5 -45.0 -70.1 -27.7 -8.6
OVERALL DEFICIT (payment order basis)
Excluding Grants -160.4 -178.1 -239.3 -268.8 -371.6 -448.5 -445.5 -306.1
Including Grants 4.0 -9.0 -18.9 11.0 -24.2 -51.1 -4.7 -159.9
Change in arrears -10.7 -7.5 -8.2 -8.0 -10.6 -13.3 -12.6 -5.8
Domestic arrears -7.0 -7.5 -8.2 -8.0 -10.6 -13.3 -12.6 -5.8
Foreign arrears -3.7 0.0 0.0 0.0 0.0 0.0 0.0 0.0
DEFICIT/SURPLUS (Cash basis) -6.7 -16.6 -27.1 3.0 -34.8 -64.4 -17.3 -165.7
FINANCING 1.8 23.7 14.4 -3.0 34.8 64.4 17.3 165.7
External Financing 34.3 34.9 32.1 56.4 34.4 29.1 124.8 20.4
Net loans 34.3 34.9 32.1 56.4 34.4 29.1 124.8 20.4
Domestic Financing (excluding Adjustments) -32.5 -11.2 -17.7 -59.4 0.4 35.3 -107.5 145.3
Banks -32.5 -11.2 -5.4 -43.7 5.1 10.0 -92.1 171.6
Non banks 0.0 0.0 -12.3 -15.7 -4.7 -14.0 -19.4 -18.5
Adjustment-Deposit buildup 6.5
Error and omission 7.7 39.3 4.0 -7.9
* : ProvisionalSource: MINECOFIN

155
APPENDICES
BNR
BN
R’s
BA
LAN
CE
SHEE
T
App
endi
ce 7
(In F
RW
mill
ion)
AS
SE
TS
TOTA
L A
SS
ETS
DE
SC
RIP
TIO
NFO
RE
IGN
AS
SE
TS
TOTA
L FO
RE
IGN
A
SS
ETS
CLA
IMS
ON
DO
ME
STI
C S
EC
TOR
S
AS
SE
TS N
ON
C
LAS
SIF
IED
ELS
EW
HE
RE
CO
RR
ES
-P
ON
DE
NTS
BA
NK
SFO
RE
IGN
BA
NK
NO
TES
SD
Rs
HO
LDIN
GS
RE
SE
RV
E
PO
SIT
ION
WIT
H T
HE
FU
ND
INV
ES
T-M
EN
TSC
OV
ER
IT
EM
SR
EC
EIV
AB
LE
FO
RE
IGN
B
AN
KS
OV
ER
DR
AFT
CLA
IMS
ON
G
OV
ER
NM
EN
T
CLA
IMS
O
N
PU
BLI
C
EN
TER
P-
RIS
ES
CLA
IMS
ON
P
RIV
ATE
S
EC
TOR
CLA
IMS
ON
BA
NK
SC
LAIM
S
ON
OTH
ER
FI
NA
NC
. IN
STI
T.M
ON
EY
M
AR
KE
TO
THE
R
2005
101,
822.
5972
0.5
14,3
45.6
0.0
108,
178.
020.
343
9.8
225,
506.
746
,374
.761
.22,
943.
60.
01,
379.
842
4.0
75,4
95.2
352,
185.
1
2006
74,0
41.5
21,
381.
212
,525
.90.
015
3,21
6.89
49.3
0.0
241,
214.
741
,792
.924
.43,
231.
90.
01,
189.
327
8.0
79,9
88.8
367,
720.
0
2007
26,3
25.2
153
3.6
13,0
81.5
0.0
260,
884.
880.
40.
030
0,82
5.5
41,1
96.8
13.2
3,66
5.4
0.0
1,29
8.9
1,16
7.4
83,7
68.5
431,
935.
6
2008
77,8
75.4
464
4.7
17,6
50.9
0.0
238,
050.
00.
220.
033
4,22
1.2
39,7
37.4
1.15
4,31
2.3
0.0
1,49
5.6
1,46
0.7
83,5
45.8
464,
774.
27
2009
47,0
53.5
81,
121.
8974
,514
.92
0.00
301,
452.
570.
234.
4642
4,14
7.65
50,1
59.8
90.
005,
372.
298,
678.
1588
1.68
2,47
1.03
82,6
72.2
857
4,38
2.97
2010
51,4
88.5
11,
530.
0876
,075
.98
0.00
354,
355.
160.
024.
2548
3,45
4.00
57,8
50.3
70.
004,
752.
918,
000.
0074
5.61
1,71
2.82
87,4
60.9
264
3,97
6.63
2011
79,4
15.3
85,
839.
2677
,054
.47
0.00
472,
040.
880.
020.
0063
4,35
0.01
38,7
28.3
70.
005,
590.
3360
0.00
597.
211,
839.
0814
0,10
9.70
821,
814.
70
2012
98,7
19.7
45,
955.
9176
,770
.65
0.00
344,
881.
840.
020.
0052
6,32
8.16
38,5
97.5
50.
005,
489.
650.
0045
0.05
1,67
1.14
145,
292.
8871
7,82
9.43
2009
Janu
ary
50,8
62.9
1,42
4.21
17,3
91.8
60.
025
3,51
9.37
0.21
0.00
323,
198.
5739
,738
.59
0.15
4,30
6.15
3,00
0.0
1,50
4.2
1,46
0.7
83,8
55.8
145
7,06
4.22
Febr
uary
72,2
13.0
1,01
1.84
17,0
76.2
10.
021
5,31
9.07
0.20
0.00
305,
620.
3039
,737
.44
0.15
4,32
7.50
0.00
1,03
7.2
1,44
8.5
82,9
69.9
243
5,14
1.01
Mar
ch64
,440
.352
2.45
17,3
11.4
40.
019
9,14
2.79
0.21
0.00
281,
417.
1945
,238
.83
0.00
4,61
6.61
0.00
891.
661,
424.
0281
,061
.82
414,
650.
13
Apr
il82
,411
.31,
190.
7017
,375
.23
0.0
216,
575.
460.
210.
0031
7,55
2.86
39,7
39.7
70.
004,
937.
462,
000.
001,
114.
092,
599.
2982
,141
.23
450,
084.
70
May
32,6
45.7
561.
6617
,778
.35
0.0
249,
759.
540.
224.
6230
0,75
0.10
39,3
63.0
10.
005,
015.
922,
000.
001,
187.
892,
599.
2983
,942
.64
434,
858.
85
June
46,2
73.1
1,15
3.81
18,0
02.8
20.
025
9,23
9.56
0.22
4.69
324,
674.
2339
,363
.02
0.00
5,00
1.89
2,08
7.00
953.
252,
570.
7985
,715
.69
460,
365.
87
July
38,6
66.5
1,31
5.39
18,0
06.2
30.
027
5,92
2.12
0.22
4.36
333,
914.
8539
,363
.02
0.00
5,04
2.49
2,57
4.77
878.
322,
558.
3186
,498
.93
470,
830.
69
Aug
ust
44,0
49.2
886
6.13
70,8
87.3
70.
0026
4,72
7.36
0.22
4.44
380,
534.
8056
,028
.23
0.00
5,05
4.50
4,67
4.77
888.
282,
545.
7887
,770
.36
537,
496.
72
Sep
tem
ber
58,9
65.1
71,
050.
0574
,936
.49
0.00
277,
934.
910.
234.
5141
2,89
1.36
40,8
99.3
90.
005,
179.
445,
003.
7787
1.08
2,53
3.20
90,2
19.9
455
7,59
8.18
Oct
ober
47,7
84.9
450
4.95
75,3
92.4
70.
0031
5,74
9.11
517.
914.
5543
9,95
3.93
39,3
66.4
80.
005,
236.
045,
702.
5782
7.21
2,53
3.20
95,2
01.0
058
8,82
0.43
Nov
embe
r35
,543
.86
1,61
4.70
76,4
97.0
10.
0032
1,94
3.05
526.
864.
6343
6,13
0.11
39,3
66.4
80.
005,
269.
367,
751.
3767
6.27
2,49
6.03
94,5
16.8
758
6,20
6.49
Dec
embe
r47
,053
.58
1,12
1.89
74,5
14.9
20.
0030
1,45
2.57
0.23
4.46
424,
147.
6550
,159
.89
0.00
5,37
2.29
8,67
8.15
881.
682,
471.
0382
,672
.28
574,
382.
97
2010
Janu
ary
59,8
87.9
376
1.28
74,4
83.1
00.
0028
4,61
8.58
0.23
4.37
419,
755.
4939
,362
.90
0.00
5,34
0.99
8,18
9.16
916.
262,
021.
0383
,753
.94
559,
339.
77
Febr
uary
50,6
82.1
345
1.75
73,1
09.3
90.
0027
5,15
5.57
1,37
6.74
4.21
400,
779.
7948
,792
.22
0.00
5,33
7.16
8,18
7.92
1,01
9.04
1,99
5.92
82,8
79.7
254
8,99
1.77
Mar
ch50
,996
.09
833.
2372
,789
.11
0.00
262,
252.
620.
024.
2138
6,87
5.28
60,8
76.2
70.
005,
294.
7011
,186
.68
841.
381,
945.
3883
,706
.74
550,
726.
43
Apr
il36
,854
.29
1,19
2.85
72,6
07.5
30.
0028
1,45
0.67
0.02
4.16
392,
109.
5261
,707
.09
0.00
5,41
1.67
11,6
85.4
299
6.92
1,91
9.97
84,0
15.3
955
7,84
5.98
May
52,7
74.6
532
8.87
71,5
12.8
60.
0026
5,33
5.69
0.02
3.92
389,
956.
0168
,408
.94
0.00
5,42
4.67
8,68
4.16
2,90
1.84
1,89
4.45
84,9
31.2
456
2,20
1.31
June
101,
708.
171,
073.
6172
,513
.93
0.00
285,
527.
780.
023.
9146
0,82
7.42
39,3
45.7
00.
005,
454.
1010
,682
.89
2,94
8.90
1,86
8.82
86,5
49.4
760
7,67
7.30
July
87,0
79.8
652
2.37
74,8
32.4
90.
0026
8,22
6.84
0.02
4.20
430,
665.
7844
,384
.02
0.00
5,49
8.87
12,6
82.8
91,
020.
621,
868.
8290
,018
.31
586,
139.
31
Aug
ust
70,7
89.4
81,
266.
0074
,013
.47
0.00
252,
059.
410.
024.
0639
8,13
2.44
67,7
18.8
20.
005,
623.
0411
,682
.89
770.
841,
817.
2590
,281
.14
576,
026.
42

156
APPENDICES
BNR
BN
R’s
BA
LAN
CE
SHEE
T
App
endi
ce 7
(Con
t’d)
(In F
RW
mill
ion)
AS
SE
TS
TOTA
L A
SS
ETS
DE
SC
RIP
TIO
NFO
RE
IGN
AS
SE
TS
TOTA
L FO
RE
IGN
A
SS
ETS
CLA
IMS
ON
DO
ME
STI
C S
EC
TOR
S
AS
SE
TS N
ON
C
LAS
SIF
IED
ELS
EW
HE
RE
CO
RR
ES
-P
ON
DE
NTS
BA
NK
SFO
RE
IGN
BA
NK
NO
TES
SD
Rs
HO
LDIN
GS
RE
SE
RV
E
PO
SIT
ION
WIT
H T
HE
FU
ND
INV
ES
T-M
EN
TSC
OV
ER
IT
EM
SR
EC
EIV
AB
LE
FO
RE
IGN
B
AN
KS
OV
ER
DR
AFT
CLA
IMS
ON
G
OV
ER
NM
EN
T
CLA
IMS
O
N
PU
BLI
C
EN
TER
P-
RIS
ES
CLA
IMS
ON
P
RIV
ATE
S
EC
TOR
CLA
IMS
ON
BA
NK
SC
LAIM
S
ON
OTH
ER
FI
NA
NC
. IN
STI
T.M
ON
EY
M
AR
KE
TO
THE
R
Sep
tem
ber
94,4
95.5
167
9.78
76,4
87.5
30.
0028
6,67
9.12
0.02
4.37
458,
346.
3339
,347
.02
0.00
5,70
8.01
11,7
53.8
983
5.15
1,79
1.30
94,1
62.9
061
1,94
4.60
Oct
ober
29,3
84.6
31,
548.
9877
,517
.73
0.00
348,
118.
710.
024.
4645
6,57
4.53
39,3
47.3
20.
005,
711.
378,
003.
891,
128.
671,
791.
3095
,752
.66
608,
309.
74
Nov
embe
r21
,174
.74
1,87
5.75
75,8
02.4
70.
0033
0,26
9.91
0.02
4.25
429,
127.
1461
,757
.46
0.00
5,75
4.56
8,00
0.87
817.
361,
739.
0910
1,20
1.65
608,
398.
13
Dec
embe
r51
,488
.51
1,53
0.08
76,0
75.9
80.
0035
4,35
5.16
0.02
4.25
483,
454.
0057
,850
.37
0.00
4,75
2.91
8,00
0.00
745.
611,
712.
8287
,460
.92
643,
976.
63
2011
Janu
ary
20,0
18.7
195
0.73
78,1
54.6
50.
0035
6,99
5.84
0.02
0.00
456,
119.
9544
,807
.27
0.00
5,11
6.44
8,00
0.00
680.
171,
686.
4589
,632
.06
606,
042.
34
Febr
uary
25,5
01.8
15,
347.
4178
,303
.17
0.00
338,
092.
120.
020.
0044
7,24
4.53
64,2
87.0
70.
005,
105.
615,
000.
0074
0.87
1,65
9.97
123,
198.
4664
7,23
6.51
Mar
ch35
,764
.38
10,2
24.9
379
,002
.51
0.00
299,
543.
480.
020.
0042
4,53
5.32
71,9
07.0
90.
005,
184.
535,
600.
0065
2.15
1,63
3.37
482,
392.
9299
1,90
5.38
Apr
il43
,300
.58
14,6
55.2
481
,126
.96
0.00
354,
769.
680.
020.
0049
3,85
2.48
39,3
46.4
60.
005,
176.
935,
100.
0077
3.01
1,63
3.37
752,
401.
631,
298,
283.
88
May
46,6
09.8
715
,046
.91
79,4
29.2
20.
0032
2,77
9.76
0.02
0.00
463,
865.
7855
,110
.54
0.00
5,23
2.10
5,10
0.00
983.
871,
579.
8680
2,22
6.65
1,33
4,09
8.80
June
55,0
25.9
36,
128.
5280
,217
.17
0.00
309,
548.
850.
020.
0045
0,92
0.49
72,3
73.4
00.
005,
310.
215,
100.
001,
276.
282,
002.
9411
8,74
9.28
655,
732.
60
July
106,
072.
235,
767.
2280
,151
.14
0.00
259,
831.
870.
020.
0045
1,82
2.48
38,7
31.2
70.
005,
285.
353,
500.
001,
046.
842,
002.
9413
2,28
5.26
634,
674.
14
Aug
ust
42,9
42.0
97,
071.
4080
,656
.41
0.00
348,
925.
180.
020.
0047
9,59
5.10
38,7
31.2
70.
005,
383.
982,
400.
0065
1.51
1,97
7.00
127,
768.
2765
6,50
7.13
Sep
tem
ber
47,4
69.6
110
,956
.93
78,5
52.2
20.
0035
8,76
1.95
0.02
0.00
495,
740.
7345
,546
.97
0.00
5,59
4.05
600.
0080
2.36
1,92
1.52
145,
891.
1969
6,09
6.82
Oct
ober
48,3
91.5
712
,349
.61
80,1
26.2
40.
0040
8,90
8.99
0.02
0.00
549,
776.
4338
,778
.18
0.00
5,61
2.53
600.
0077
6.15
1,89
4.15
176,
743.
8677
4,18
1.30
Nov
embe
r40
,481
.16
9,83
9.05
78,1
72.9
80.
0039
3,52
7.57
0.02
0.00
522,
020.
7854
,736
.74
0.00
5,57
3.88
600.
0064
3.25
1,86
6.67
191,
083.
3777
6,52
4.69
Dec
embe
r79
,415
.38
5,83
9.26
77,0
54.4
70.
0047
2,04
0.88
0.02
0.00
634,
350.
0138
,728
.37
0.00
5,59
0.33
600.
0059
7.21
1,83
9.08
140,
109.
7082
1,81
4.70
2012
Janu
ary
56,8
46.4
65,
316.
7677
,997
.81
0.00
456,
547.
040.
020.
0059
6,70
8.09
38,7
28.3
70.
005,
579.
5560
0.00
388.
861,
811.
3814
6,67
2.67
790,
488.
92
Febr
uary
52,1
23.4
44,
104.
7878
,265
.49
0.00
447,
009.
140.
020.
0058
1,50
2.87
38,7
28.4
60.
005,
562.
4960
0.00
575.
291,
783.
5615
1,24
7.62
780,
000.
29
Mar
ch25
,518
.97
4,75
2.96
77,7
89.8
30.
0043
7,56
2.48
0.02
0.00
545,
624.
2638
,728
.21
0.00
5,53
9.56
0.00
495.
471,
755.
6315
2,99
2.30
745,
135.
43
Apr
il33
,139
.32
3,70
7.91
78,1
59.9
10.
0039
9,09
9.18
0.02
0.00
514,
106.
3463
,317
.01
0.00
5,56
6.66
0.00
391.
111,
727.
5816
0,07
0.11
745,
178.
81
May
35,0
16.6
95,
381.
8576
,599
.21
0.00
347,
423.
050.
020.
0046
4,42
0.82
89,6
60.6
10.
005,
511.
800.
0061
6.10
1,69
9.42
162,
458.
6372
4,36
7.38
June
98,7
19.7
45,
955.
9176
,770
.65
0.00
344,
881.
840.
020.
0052
6,32
8.16
38,5
97.5
50.
005,
489.
650.
0045
0.05
1,67
1.14
145,
292.
8871
7,82
9.43
Sour
ce: B
NR

157
APPENDICES
BNR
BN
R’s
BA
LAN
CE
SHEE
T
App
endi
ce 7
(con
t’d)
(In F
RW
mill
ion)
LIA
BIL
ITIE
S
TOTA
L LI
AB
ILIT
IES
DES
CR
IPTI
ON
RES
ERVE
MO
NEY
OTH
ER D
OM
ESTI
C L
IAB
ILIT
IES
FOR
EIG
N
LIA
BIL
ITIE
S
SHA
RES
A
ND
OTH
ER
EQU
ITY
LIA
BIL
ITIE
S N
ON
C
LASS
IFIE
D
ELSE
WH
ERE
CU
RR
ENC
YB
AN
KS’
D
EPO
SITS
PRIV
ATE
SEC
TOR
D
EPO
SITS
PUB
LIC
EN
TER
PRIS
ES
DEP
OSI
TS
OTH
ER F
IN.
INST
ITU
TIO
NS’
D
EPO
SITS
MO
NET
ARY
B
ASE
MO
NEY
M
AR
KET
B
OR
RO
WIN
G
OTH
ER
AM
OU
NTS
D
UE
GO
VER
NM
ENT
DEP
OSI
TSC
urre
ncy
in
circ
ulat
ion
Cur
renc
y he
ld in
ban
ksC
urre
ncy
out o
f BN
R
2005
46,2
10.1
14,
078.
4650
,288
.611
,062
.266
.024
6.6
27.9
61,6
91.4
40,2
73.0
1,54
0.1
104,
508.
643
,364
.427
,756
.373
,051
.435
2,18
5.1
2006
52,7
30.8
65,
694.
2258
,425
.111
,322
.90
36.9
218
0.81
310.
4070
,276
.150
,538
.23
1,59
4.37
116,
151.
7016
,258
.29
30,3
85.1
882
,516
.11
367,
720.
0
2007
63,2
23.9
89,
512.
8872
,736
.918
,581
.93
73.7
935
6.38
675.
6892
,424
.658
,611
.49
1,45
4.78
142,
168.
6418
,770
.09
35,5
06.4
782
,999
.67
431,
935.
8
2008
80,8
92.3
47,
605.
7388
,498
.125
,141
.45
69.3
531
9.26
418.
0111
4,44
6.1
16,6
00.0
01,
523.
2119
8,70
4.30
7,77
0.86
35,7
45.2
389
,984
.77
464,
774.
5
2009
76,9
92.3
79,
133.
5286
,125
.924
,130
.56
129.
271,
508.
0354
8.22
112,
442.
073
,537
.80
3,93
5.73
195,
613.
5165
,977
.33
38,1
67.0
784
,709
.55
574,
383.
0
2010
90,4
78.2
113
,662
.11
104,
140.
324
,681
.09
108.
7748
5.78
619.
9413
0,03
5.9
69,3
30.5
83,
074.
7223
4,52
6.68
68,5
32.5
851
,793
.57
86,6
82.5
864
3,97
6.6
2011
102,
754.
7215
,169
.44
117,
924.
241
,923
.04
247.
8514
6.10
1181
.79
157,
802.
696
,114
.93
2,40
1.06
301,
393.
9070
,480
.06
54,6
77.1
613
5,21
4.77
821,
814.
7
2012
111,
570.
9818
,305
.58
129,
876.
645
,571
.38
133.
9717
5.22
566.
2517
6,72
4.3
122,
409.
822,
403.
3115
6,08
4.02
74,4
55.8
461
,947
.43
123,
804.
7271
7,82
9.5
2009
Janu
ary
71,9
57.6
39,
083.
1481
,040
.836
,850
.46
55.8
62,
589.
9037
6.55
120,
913.
56,
000.
002,
612.
2019
3,34
3.51
8,60
9.34
35,1
99.4
290
,386
.18
457,
064.
2
Febr
uary
69,0
29.5
58,
419.
2177
,448
.827
,862
.88
64.4
22,
581.
0440
4.89
108,
362.
00.
002,
659.
9119
0,97
6.86
7,95
1.03
34,9
67.2
790
,223
.93
435,
141.
0
Mar
ch66
,251
.89
10,5
65.4
176
,817
.333
,034
.99
179.
0939
7.40
949.
0911
1,37
7.9
0.00
3,42
3.18
168,
265.
218,
503.
5635
,145
.97
87,9
34.3
341
4,65
0.1
Apr
il68
,058
.86
9,52
6.57
77,5
85.4
29,3
10.6
012
5.95
687.
9761
6.64
108,
326.
68,
961.
683,
509.
3519
2,59
5.40
10,9
50.0
035
,136
.03
90,6
07.8
545
0,08
6.9
May
67,6
44.9
79,
327.
7376
,972
.725
,108
.55
100.
7639
0.25
445.
1810
3,01
7.4
16,8
85.5
83,
537.
1717
2,57
2.03
11,1
71.9
534
,165
.47
93,5
08.9
943
4,85
8.6
June
72,0
81.8
99,
582.
7781
,664
.724
,309
.06
77.7
669
9.25
680.
3710
7,43
1.1
33,4
89.0
93,
550.
2717
0,97
1.39
11,2
77.5
834
,323
.27
99,3
23.1
746
0,36
5.9
July
73,1
73.1
79,
532.
6382
,705
.825
,748
.12
89.2
086
9.70
497.
9210
9,91
0.7
32,7
18.7
13,
808.
3918
3,38
9.80
10,4
94.8
834
,338
.66
96,1
69.5
447
0,83
0.7
Aug
ust
70,3
92.9
110
,860
.28
81,2
53.2
29,4
61.9
078
.96
1,19
3.17
492.
2211
2,47
9.4
48,4
74.0
23,
542.
8817
6,94
0.01
63,8
90.9
834
,421
.86
97,7
47.5
353
7,49
6.7
Sep
tem
ber
69,4
33.4
910
,675
.94
80,1
09.4
30,2
00.8
793
.53
1,04
5.02
1121
.53
112,
570.
453
,917
.74
3,60
5.73
188,
244.
7467
,575
.46
34,5
44.6
197
,139
.30
557,
598.
0
Oct
ober
70,4
56.0
89,
910.
3580
,366
.430
,059
.07
81.8
41,
189.
8656
6.71
112,
263.
958
,330
.97
3,90
4.65
210,
989.
0967
,841
.65
34,6
22.8
310
0,86
7.07
588,
820.
2
Nov
embe
r70
,707
.69
10,7
98.9
281
,506
.628
,600
.57
65.4
41,
515.
0139
9.76
112,
087.
462
,454
.59
3,91
2.61
201,
950.
5468
,641
.07
34,8
11.3
310
2,34
8.92
586,
206.
5
Dec
embe
r76
,992
.37
9,13
3.52
86,1
25.9
24,1
30.5
612
9.27
1,50
8.03
548.
2211
2,44
2.0
73,5
37.8
03,
935.
7319
5,61
3.51
65,9
77.3
338
,167
.07
84,7
09.5
557
4,38
3.0
2010
Janu
ary
72,8
95.2
411
,395
.27
84,2
90.5
28,9
88.1
788
.69
1,14
3.49
408.
8311
4,91
9.7
54,7
44.6
63,
931.
4819
4,97
3.03
65,8
99.8
838
,161
.59
86,7
09.4
355
9,33
9.8
Febr
uary
68,5
26.3
413
,143
.84
81,6
70.2
31,6
52.3
978
.04
834.
7055
5.23
114,
790.
553
,626
.46
2,83
1.75
183,
595.
0864
,620
.41
37,9
24.4
291
,603
.11
548,
991.
8
Mar
ch68
,389
.82
12,8
14.6
281
,204
.432
,761
.21
62.3
962
7.38
627.
4911
5,28
2.9
64,8
82.0
22,
847.
3917
3,06
8.96
64,2
03.0
537
,869
.34
92,5
72.7
655
0,72
6.4
Apr
il72
,471
.68
10,8
87.7
783
,359
.534
,553
.63
70.4
639
9.18
431.
111
8,81
3.8
57,1
86.8
43,
220.
4218
6,71
7.28
64,0
23.6
437
,858
.16
90,0
25.8
655
7,84
6.0
May
75,0
01.2
612
,880
.49
87,8
81.8
30,9
08.2
861
.46
569.
7741
9.5
119,
840.
853
,201
.15
2,89
4.31
192,
612.
5263
,369
.33
37,6
12.2
592
,671
.05
562,
201.
4
June
83,4
66.2
710
,569
.59
94,0
35.9
24,2
25.1
664
.26
865.
3544
4.59
119,
635.
285
,314
.18
2,46
4.13
186,
572.
3664
,377
.28
37,7
83.9
711
1,53
0.16
607,
677.
3
July
84,2
57.6
413
,484
.55
97,7
42.2
30,5
19.2
156
.51
1,18
2.55
468.
0012
9,96
8.5
59,8
98.0
02,
485.
3518
5,38
5.55
66,0
77.9
238
,179
.01
104,
145.
0658
6,13
9.4
Aug
ust
81,1
01.2
114
,485
.46
95,5
86.7
31,4
27.0
551
.39
1,72
4.36
431.
5212
9,22
1.0
62,7
42.7
12,
960.
7217
1,93
7.29
68,7
19.9
538
,037
.51
102,
407.
2657
6,02
6.4
Sep
tem
ber
81,7
72.8
912
,284
.16
94,0
57.1
29,2
81.8
951
.49
1,74
4.58
438.
4612
5,57
3.5
69,4
46.0
22,
542.
2120
0,98
6.94
67,8
12.5
438
,462
.67
107,
120.
7961
1,94
4.6

158
APPENDICES
BNR
BN
R’s
BA
LAN
CE
SHEE
T
App
endi
ce 7
(con
t’d)
(In F
RW
mill
ion)
LIA
BIL
ITIE
S
TOTA
L LI
AB
ILIT
IES
DES
CR
IPTI
ON
RES
ERVE
MO
NEY
OTH
ER D
OM
ESTI
C L
IAB
ILIT
IES
FOR
EIG
N
LIA
BIL
ITIE
S
SHA
RES
A
ND
OTH
ER
EQU
ITY
LIA
BIL
ITIE
S N
ON
C
LASS
IFIE
D
ELSE
WH
ERE
CU
RR
ENC
YB
AN
KS’
D
EPO
SITS
PRIV
ATE
SEC
TOR
D
EPO
SITS
PUB
LIC
EN
TER
PRIS
ES
DEP
OSI
TS
OTH
ER F
IN.
INST
ITU
TIO
NS’
D
EPO
SITS
MO
NET
ARY
B
ASE
MO
NEY
M
AR
KET
B
OR
RO
WIN
G
OTH
ER
AM
OU
NTS
D
UE
GO
VER
NM
ENT
DEP
OSI
TSC
urre
ncy
in
circ
ulat
ion
Cur
renc
y he
ld in
ban
ksC
urre
ncy
out o
f BN
R
Oct
ober
81,4
89.3
813
,391
.52
94,8
80.9
29,6
88.8
054
.22
1,95
9.99
428.
0112
7,01
1.9
73,8
62.8
72,
578.
9418
6,70
1.84
68,4
25.9
938
,639
.63
111,
088.
6060
8,30
9.8
Nov
embe
r80
,877
.99
16,2
79.9
497
,157
.932
,159
.95
66.9
719
7.51
489.
3513
0,07
1.7
70,1
69.3
62,
584.
5618
6,43
6.50
68,4
56.2
838
,351
.82
112,
327.
9260
8,39
8.2
Dec
embe
r90
,478
.21
13,6
62.1
110
4,14
0.3
24,6
81.0
910
8.77
485.
7861
9.94
130,
035.
969
,330
.58
3,07
4.72
234,
526.
6868
,532
.58
51,7
93.5
786
,682
.58
643,
976.
6
2011
Janu
ary
83,7
19.1
517
,076
.20
100,
795.
429
,299
.17
152.
7411
.21
468.
7413
0,72
7.2
39,1
86.1
22,
131.
0121
5,98
9.62
70,5
08.7
152
,151
.07
95,3
48.6
360
6,04
2.4
Febr
uary
82,6
76.7
916
,120
.56
98,7
97.4
30,6
29.5
410
3.59
14.0
351
7.64
130,
062.
242
,748
.02,
111.
5623
0,24
4.85
70,4
24.0
752
,175
.64
119,
470.
2064
7,23
6.5
Mar
ch83
,946
.22
14,1
28.0
098
,074
.231
,583
.14
110.
8816
.33
511.
9113
0,29
6.5
48,0
59.1
2,09
8.02
205,
091.
0970
,979
.48
52,2
95.9
148
3,08
5.32
991,
905.
4
Apr
il89
,607
.17
15,1
64.8
410
4,77
2.0
29,8
92.5
794
.00
38.8
356
4.55
135,
362.
060
,589
.82,
127.
8623
0,23
0.98
72,8
87.2
752
,661
.25
744,
424.
761,
298,
283.
9
May
89,7
15.8
318
,101
.15
107,
817.
016
,187
.56
79.0
013
4.51
1059
.05
125,
277.
192
,330
.22,
122.
1318
5,46
0.54
71,8
44.1
452
,368
.26
804,
696.
481,
334,
098.
8
June
101,
533.
5113
,517
.74
115,
051.
328
,600
.78
185.
0033
.80
486.
9714
4,38
0.4
88,7
30.2
2,31
6.35
175,
518.
1773
,388
.84
55,1
71.7
011
6,22
6.99
655,
732.
6
July
100,
857.
3815
,561
.56
116,
418.
937
,925
.28
78.6
41.3
960
2.31
155,
066.
563
,780
.22,
379.
4016
2,37
1.75
72,0
96.0
955
,160
.33
123,
819.
9063
4,67
4.2
Aug
ust
95,2
84.0
818
,651
.42
113,
935.
534
,543
.93
77.5
90.8
161
0.72
149,
258.
581
,230
.22,
427.
9017
3,72
8.86
72,9
56.5
855
,245
.71
121,
659.
4465
6,50
7.1
Sep
tem
ber
93,4
29.1
616
,803
.31
110,
232.
538
,743
.27
198.
6620
2.56
843.
415
0,22
0.4
81,6
43.1
2,48
4.66
194,
605.
4971
,625
.81
54,9
11.6
914
0,60
5.66
696,
096.
8
Oct
ober
92,8
29.3
517
,113
.21
109,
942.
635
,692
.89
218.
8712
9.37
821.
2514
7,26
9.7
74,2
84.2
2,34
0.28
258,
132.
4572
,846
.92
55,1
92.3
516
4,11
5.37
774,
181.
3
Nov
embe
r91
,337
.66
17,6
83.2
410
9,02
0.9
40,5
41.1
917
8.5
239.
8211
22.7
215
1,36
7.1
83,7
28.9
2,34
9.31
238,
457.
2070
,911
.71
54,8
42.6
417
4,86
7.75
776,
524.
6
Dec
embe
r10
2,75
4.72
15,1
69.4
411
7,92
4.2
41,9
23.0
424
7.85
146.
1011
81.7
915
7,80
2.6
96,1
14.9
2,40
1.06
301,
393.
9070
,480
.06
54,6
77.1
613
5,21
4.77
821,
814.
7
2012
Janu
ary
96,3
03.4
816
,580
.56
112,
884.
048
,303
.08
156.
3214
5.01
666.
3616
2,39
9.1
8884
9.33
2,40
8.19
277,
740.
8471
,384
.94
54,8
40.1
413
2,86
6.40
790,
489.
0
Febr
uary
96,6
35.6
318
,134
.57
114,
770.
245
,712
.16
189.
9514
6.50
737.
3316
2,03
2.1
1202
66.5
12,
411.
6322
7,79
9.33
74,6
90.9
554
,879
.47
137,
920.
3078
0,00
0.3
Mar
ch99
,252
.81
16,3
10.8
211
5,56
3.6
28,2
78.7
414
4.45
141.
1575
7.07
144,
905.
013
8894
.46
2,41
3.15
191,
168.
3575
,665
.44
54,8
06.5
413
7,28
2.42
745,
135.
4
Apr
il10
5,13
3.57
19,2
99.2
112
4,43
2.8
44,8
25.2
214
3.53
119.
0015
33.3
217
1,63
2.0
1109
20.2
72,
397.
7118
7,17
0.78
75,6
30.1
354
,881
.31
142,
546.
6674
5,17
8.9
May
103,
355.
3020
,102
.67
123,
458.
043
,213
.23
162.
3319
3.45
534.
7216
7,88
6.8
1206
08.7
22,
384.
3416
2,51
1.73
74,2
21.3
454
,609
.61
142,
144.
8172
4,36
7.3
June
111,
570.
9818
,305
.58
129,
876.
645
,571
.38
133.
9717
5.22
566.
2517
6,72
4.3
1224
09.8
22,
403.
3115
6,08
4.02
74,4
55.8
461
,947
.43
123,
804.
7271
7,82
9.5
Sour
ce: B
NR

159
APPENDICES
BNR
BA
LAN
CE
SHEE
T O
F O
THER
DEP
OSI
TORY
CO
RPO
RAT
ION
S (B
K, B
CR
, FIN
A B
AN
K, E
CO
BA
NK
, AC
CES
S B
AN
K, C
OG
EBA
NQ
UE,
UO
B, B
PR S
A, K
CB
RW
AN
DA
, CC
P, U
NG
UK
A,A
GA
SEK
E, C
SS &
EQ
UIT
Y B
AN
K* )
A
ppen
dice
8(In
FR
W m
illio
n)
ASS
ETS
DES
CR
IPTI
ON
CLA
IMS
ON
BN
RFO
REI
GN
CR
EDIT
TO
EC
ON
OM
YA
SSET
S N
ON
C
LASS
IFIE
D
ELSE
WH
ERE
TOTA
L A
SSET
SR
ESER
VES
OTH
ER C
LAIM
S A
SSET
SC
LAIM
S O
N
GO
VER
NM
ENT
CLA
IMS
ON
PU
BL.
EN
TER
PRIS
ESC
LAIM
S O
N
PRIV
ATE
SEC
TOR
CLA
IMS
ON
OTH
ER
FIN
C. I
NST
UT.
TOTA
L C
LAIM
S O
N
THE
ECO
NO
MY
2008
30,6
51.0
13,3
68.3
96,7
51.9
29,5
41.2
1,63
6.9
335,
470.
62,
338.
6733
7,10
7.6
62,0
15.4
569,
435.
4
2009
34,4
43.4
473
,220
.90
107,
466.
220
,070
.62,
949.
631
7,85
7.1
7,26
0.81
328,
067.
687
,179
.965
0,44
8.6
2010
38,2
22.7
268
,786
.80
146,
776.
884
,804
.03,
213.
639
0,57
7.6
13,0
32.0
049
1,62
7.2
114,
532.
785
9,94
6.2
2011
58,4
72.4
96,8
20.7
514
8,19
0.7
85,6
33.0
2,80
0.1
501,
404.
41,
040.
1359
0,87
7.6
158,
040.
81,
052,
402.
2
2009
Janu
ary
44,0
08.7
6,27
0.9
86,5
37.8
20,4
04.2
3,02
2.0
326,
817.
82,
908.
3333
2,74
8.1
82,4
84.3
572,
453.
9
Febr
uary
36,1
21.4
249.
993
,544
.420
,016
.92,
953.
432
9,84
6.2
1,76
3.23
334,
562.
983
,321
.556
7,81
6.8
Mar
ch45
,357
.71,
169.
997
,207
.917
,496
.23,
231.
632
6,66
5.2
4,94
7.45
334,
844.
384
,563
.158
0,63
9.2
Apr
il42
,338
.68,
850.
796
,412
.719
,710
.82,
964.
632
7,15
4.6
4,22
2.55
334,
341.
784
,503
.658
6,15
8.3
May
35,8
31.4
15,5
37.4
99,8
24.0
19,7
21.0
2,74
4.4
325,
386.
15,
375.
7733
3,50
6.2
89,4
83.7
593,
903.
8
June
34,7
65.7
38,7
09.3
99,6
89.7
19,4
61.6
1,87
2.7
318,
587.
42,
414.
4932
2,87
4.6
87,0
67.2
602,
568.
1
July
37,0
51.3
32,9
45.9
117,
718.
420
,313
.02,
088.
031
9,98
1.4
1,73
3.32
323,
802.
783
,672
.361
5,50
3.7
Aug
ust
46,8
85.1
46,3
21.4
107,
590.
020
,475
.51,
730.
131
7,15
5.9
2,03
0.63
320,
916.
682
,641
.162
4,82
9.8
Sep
tem
ber
43,6
92.1
47,1
22.8
101,
280.
522
,809
.81,
939.
830
9,83
4.2
6,89
4.04
318,
668.
186
,575
.062
0,14
8.2
Oct
ober
41,1
65.8
56,0
81.9
102,
793.
622
,470
.01,
815.
731
0,22
8.9
4,75
4.46
316,
799.
084
,942
.762
4,25
3.0
Nov
embe
r40
,863
.48
59,2
46.9
210
6,47
0.6
22,3
78.2
2,73
0.2
320,
169.
25,
884.
6632
8,78
4.0
80,6
42.4
638,
385.
6
Dec
embe
r34
,443
.44
73,2
20.9
010
7,46
6.2
20,0
70.6
2,94
9.6
317,
857.
17,
260.
8132
8,06
7.6
87,1
79.9
650,
448.
6
2010
Janu
ary
41,0
31.8
54,0
68.1
105,
375.
831
,569
.82,
791.
235
7,51
5.5
6,98
6.00
398,
862.
587
,961
.168
7,29
9.2
Febr
uary
44,9
64.1
50,8
56.9
112,
201.
432
,545
.92,
791.
235
2,13
1.1
8,04
9.70
395,
517.
992
,386
.569
5,92
6.8
Mar
ch45
,171
.062
,856
.910
7,77
7.8
31,1
98.3
2,78
5.8
358,
227.
19,
147.
3040
1,35
8.5
94,2
51.2
711,
415.
5
Apr
il46
,244
.255
,664
.599
,363
.941
,041
.22,
902.
936
1,37
9.8
9,14
7.30
414,
471.
292
,403
.670
8,14
7.3
May
41,1
59.5
57,2
17.7
94,9
73.4
55,0
84.8
2,81
3.8
361,
171.
49,
147.
0042
8,21
7.0
91,8
33.6
713,
401.
2
June
33,6
36.6
85,9
87.3
98,9
37.0
56,4
95.2
2,91
2.2
363,
887.
110
,512
.40
433,
806.
910
2,00
7.7
754,
375.
5
July
44,4
31.7
61,5
69.7
118,
004.
053
,632
.13,
083.
736
9,12
3.2
11,6
44.0
043
7,48
3.0
98,2
60.4
759,
748.
8
Aug
ust
50,4
02.1
65,2
12.8
117,
072.
253
,751
.02,
999.
137
1,10
9.6
11,9
75.0
043
9,83
4.7
90,1
93.5
762,
715.
4
Sep
tem
ber
41,3
96.8
77,5
46.5
114,
132.
554
,437
.82,
807.
737
0,45
1.5
12,2
00.0
043
9,89
7.0
100,
200.
477
3,17
3.2
Oct
ober
41,6
70.5
82,7
95.3
118,
844.
445
,635
.32,
934.
237
5,91
5.2
12,3
55.1
043
6,83
9.8
99,0
72.4
779,
222.
4
Nov
embe
r50
,511
.73
65,8
94.2
711
5,43
1.7
66,2
49.2
2,02
5.0
385,
211.
113
,032
.00
466,
517.
310
0,57
2.5
798,
927.
4
Dec
embe
r38
,222
.72
68,7
86.8
014
6,77
6.8
84,8
04.0
3,21
3.6
390,
577.
613
,032
.00
491,
627.
211
4,53
2.7
859,
946.
2

160
APPENDICES
BNR
BA
LAN
CE
SHEE
T O
F O
THER
DEP
OSI
TORY
CO
RPO
RAT
ION
S (B
K, B
CR
, FIN
A B
AN
K, E
CO
BA
NK
, AC
CES
S B
AN
K, C
OG
EBA
NQ
UE,
UO
B, B
PR S
A, K
CB
RW
AN
DA
, CC
P, U
NG
UK
A,A
GA
SEK
E, C
SS &
EQ
UIT
Y B
AN
K* )
A
ppen
dice
8 (C
ontt’
d)(In
FR
W m
illio
n)
ASS
ETS
DES
CR
IPTI
ON
CLA
IMS
ON
BN
RFO
REI
GN
CR
EDIT
TO
EC
ON
OM
YA
SSET
S N
ON
C
LASS
IFIE
D
ELSE
WH
ERE
TOTA
L A
SSET
SR
ESER
VES
OTH
ER C
LAIM
S A
SSET
SC
LAIM
S O
N
GO
VER
NM
ENT
CLA
IMS
ON
PU
BL.
EN
TER
PRIS
ESC
LAIM
S O
N
PRIV
ATE
SEC
TOR
CLA
IMS
ON
OTH
ER
FIN
C. I
NST
UT.
TOTA
L C
LAIM
S O
N
THE
ECO
NO
MY
2011
Janu
ary
42,3
60.8
39,3
33.8
142,
114.
982
,633
.63,
409.
939
6,55
7.5
1,94
9.48
484,
550.
513
0,73
9.5
839,
099.
5
Febr
uary
48,7
14.7
42,7
03.1
148,
925.
284
,019
.02,
500.
540
8,14
5.7
964.
0449
5,62
9.3
146,
150.
488
2,12
2.6
Mar
ch44
,956
.653
,907
.813
1,66
1.9
84,9
26.0
1,14
5.7
413,
809.
31,
274.
1250
1,15
5.1
153,
359.
988
5,04
1.4
Apr
il46
,535
.856
,417
.413
1,34
1.9
86,5
94.1
956.
542
7,97
9.0
1,26
9.98
516,
799.
614
2,82
3.0
893,
917.
7
May
38,0
34.8
89,0
83.1
134,
127.
389
,039
.81,
492.
143
4,06
9.5
1,40
7.16
526,
008.
614
1,65
2.4
928,
906.
2
June
45,4
30.4
88,7
69.7
134,
141.
210
2,88
5.4
2,64
2.9
437,
714.
82,
811.
3954
6,05
4.5
150,
276.
696
4,67
2.5
July
55,3
91.2
63,6
62.6
117,
647.
899
,193
.24,
092.
046
3,30
4.4
1,64
6.51
568,
236.
116
3,45
9.9
968,
397.
5
Aug
ust
47,0
28.4
82,5
33.1
122,
139.
794
,043
.43,
537.
847
5,42
0.8
1,31
3.88
574,
316.
016
0,74
4.6
986,
761.
7
Sep
tem
ber
47,4
89.1
77,8
77.1
128,
287.
183
,034
.44,
433.
748
1,77
6.2
1,75
6.40
571,
000.
815
1,55
9.4
976,
213.
5
Oct
ober
47,3
88.5
71,8
61.7
120,
986.
887
,271
.54,
615.
649
3,84
0.5
2,11
7.55
587,
845.
216
0,24
2.8
988,
325.
0
Nov
embe
r52
,770
.781
,723
.513
6,63
6.0
87,4
04.8
3,07
4.6
497,
751.
61,
479.
2458
9,71
0.3
151,
199.
51,
012,
039.
9
Dec
embe
r58
,472
.496
,820
.814
8,19
0.7
85,6
33.0
2,80
0.1
501,
404.
41,
040.
1359
0,87
7.6
158,
040.
81,
052,
402.
2
2012
Janu
ary
64,2
40.6
88,8
49.3
145,
056.
777
,814
.62,
861.
550
7,43
1.5
1,81
1.38
589,
919.
015
0,67
9.4
1,03
8,74
5.0
Febr
uary
63,8
46.7
120,
266.
514
5,44
8.2
69,1
23.3
2,08
3.6
525,
478.
71,
785.
6059
8,47
1.2
160,
606.
61,
088,
639.
2
Mar
ch44
,589
.613
8,89
4.5
152,
906.
956
,589
.02,
107.
954
4,39
9.9
1,75
5.63
604,
852.
414
7,87
4.5
1,08
9,11
7.8
Apr
il64
,124
.411
0,92
0.3
148,
844.
055
,650
.72,
201.
556
1,53
1.8
1,72
7.58
621,
111.
615
9,84
8.7
1,10
4,84
9.0
May
63,3
15.9
120,
608.
714
5,84
2.7
68,9
66.3
3,24
6.4
576,
514.
01,
699.
4265
0,42
6.2
165,
555.
21,
145,
748.
7
June
64,0
34.7
122,
409.
810
9,48
8.1
103,
927.
72,
576.
459
0,74
5.9
1,67
1.14
698,
921.
117
0,61
3.4
1,16
5,46
7.2
Sour
ce: B
NR
* EQ
UIT
Y B
AN
K is
incl
uded
sin
ce D
ecem
ber 2
011

161
APPENDICES
BNR
BA
LAN
CE
SHEE
T O
F O
THER
DEP
OSI
TORY
CO
RPO
RAT
ION
S (B
K, B
CR
, FIN
A B
AN
K, E
CO
BA
NK
, AC
CES
S B
AN
K, C
OG
EBA
NQ
UE,
UO
B, B
PR S
A, K
CB
RW
AN
DA
, CC
P, U
NG
UK
A SA
,AG
ASE
KE
BA
NK
LTD
, C
SS &
EQ
UIT
Y B
AN
K* )
A
ppen
dice
8 (C
ont’d
)(In
FR
W m
illio
n)
LIA
BIL
ITIE
S
DES
CR
IPTI
ON
DEP
OSI
TS IN
CLU
DED
IN B
RO
AD
MO
NEY
GVT
DEP
OSI
TS
FOR
EIG
NLI
AB
ILIT
IES
BN
R C
RED
ITS
SHA
RES
AN
D
OTH
ER E
QU
ITY
LIA
BIL
ITY
NO
NC
LASS
IFIE
DEL
SEW
HER
ETO
TAL
LIA
BIL
ITIE
STR
AN
SFER
AB
LED
EPO
SITS
N
ON
TRA
NSF
ERA
BLE
DEP
OSI
TS
FOR
EIG
N
CU
RR
ENC
Y D
EPO
SITS
SUB
-TO
TAL
2005
84,6
21.3
70
,754
.2
43,6
72.7
19
9,04
8.2
24,2
69.0
11
,403
.5
1,37
9.8
20,1
25.6
48
,623
.3
304,
849.
3
2006
97,7
70.5
108,
988.
6 59
,178
.4
265,
937.
523
,520
.8
10,7
94.7
1,
189.
3 27
,515
.6
56,4
00.6
38
5,35
8.4
2007
154,
690.
313
8,66
3.2
68,6
34.0
36
1,98
7.5
22,6
95.5
17
,171
.7
1,29
8.9
43,9
50.3
56
,081
.3
503,
185.
3
2008
133,
485.
215
8,40
7.9
82,3
38.2
37
4,23
1.3
17,8
51.3
18
,564
.2
1,40
4.5
76,1
76.4
81
,207
.6
569,
435.
4
2009
190,
105.
316
2,43
7.7
97,0
36.9
35
2,54
3.1
27,7
20.8
22
,830
.4
7,99
3.4
88,3
75.2
94
,900
.2
650,
448.
5
2010
240,
090.
618
6,13
7.5
99,2
29.6
426,
228.
124
,930
.242
,741
.77,
561.
3512
5,58
4.9
232,
900.
085
9,94
6.2
2011
279,
108.
626
3,30
9.3
135,
569.
554
2,41
7.9
38,7
89.3
40,9
36.3
1,43
1.85
168,
064.
514
4,00
5.6
1,05
2,40
2.2
2012
332,
029.
430
2,93
7.5
132,
254.
563
4,96
6.9
40,9
84.2
47,1
56.2
450.
0518
0,63
6.3
261,
273.
61,
165,
467.
2
2009
Janu
ary
157,
418.
212
1,01
0.9
77,2
64.1
278,
429.
117
,467
.818
,862
.53,
805.
4783
,837
.692
,786
.357
2,45
2.8
Febr
uary
144,
564.
312
1,06
3.0
79,7
79.9
265,
627.
317
,983
.918
,956
.669
9.21
84,0
03.2
100,
764.
456
7,81
4.5
Mar
ch14
3,25
4.7
125,
831.
381
,952
.326
9,08
6.0
23,6
11.2
20,9
82.9
711.
1282
,544
.910
1,74
9.9
580,
638.
2
Apr
il15
4,02
2.4
123,
903.
483
,262
.127
7,92
5.8
19,9
71.8
19,2
94.4
2,67
4.69
83,1
13.4
99,9
15.3
586,
157.
4
May
148,
819.
012
1,97
3.5
85,4
60.6
270,
792.
520
,218
.724
,162
.22,
666.
7983
,970
.710
6,63
5.3
593,
907.
0
June
156,
222.
911
9,45
9.1
85,5
19.7
275,
681.
924
,884
.922
,844
.22,
660.
5384
,164
.110
6,81
6.4
602,
571.
7
July
165,
756.
612
0,55
2.9
101,
696.
228
6,30
9.5
17,1
87.6
20,8
08.2
2,28
7.44
84,9
58.5
102,
255.
461
5,50
2.9
Aug
ust
176,
397.
811
6,70
3.7
92,1
38.1
293,
101.
620
,020
.823
,283
.02,
269.
2684
,296
.410
9,71
9.1
624,
828.
3
Sept
embe
r17
2,69
0.6
120,
830.
090
,370
.929
3,52
0.7
24,2
16.9
21,7
92.9
4,40
1.17
87,1
21.4
98,7
24.2
620,
148.
2
Oct
ober
172,
172.
412
7,40
5.4
91,5
30.1
299,
577.
919
,930
.821
,518
.34,
370.
9587
,510
.399
,802
.362
4,24
0.6
Nov
embe
r17
0,07
9.2
136,
153.
696
,853
.930
6,23
2.8
21,2
22.2
21,4
95.0
7,52
5.33
88,2
10.2
96,8
45.0
638,
384.
4
Dec
embe
r19
0,10
5.3
162,
437.
797
,036
.935
2,54
3.1
27,7
20.8
22,8
30.4
7,99
3.38
88,3
75.2
94,9
00.2
650,
448.
5
2010
Janu
ary
177,
712.
316
5,88
8.3
94,8
14.7
343,
600.
621
,787
.524
,149
.77,
806.
8899
,100
.419
0,85
4.1
687,
299.
2
Febr
uary
180,
104.
316
1,54
6.7
100,
173.
534
1,65
1.0
22,4
47.4
21,7
48.4
7,84
7.77
100,
601.
620
1,63
0.6
695,
926.
8
Mar
ch17
9,40
6.0
160,
175.
394
,799
.133
9,58
1.2
26,3
22.7
22,6
95.2
8,69
7.17
98,2
52.3
215,
867.
071
1,41
5.5
Apr
il19
7,12
4.4
158,
662.
391
,796
.335
5,78
6.7
23,4
17.6
20,9
76.4
12,4
11.8
510
0,46
1.8
195,
092.
970
8,14
7.3
May
195,
629.
016
6,40
5.2
92,8
81.6
362,
034.
224
,016
.119
,919
.09,
434.
3910
2,40
4.1
195,
593.
471
3,40
1.2
June
207,
146.
117
1,44
2.2
101,
763.
937
8,58
8.3
27,5
75.5
20,8
71.1
11,3
70.1
010
2,56
1.4
213,
409.
175
4,37
5.5

162
APPENDICES
BNR
BA
LAN
CE
SHEE
T O
F O
THER
DEP
OSI
TORY
CO
RPO
RAT
ION
S (B
K, B
CR
, FIN
A B
AN
K, E
CO
BA
NK
, AC
CES
S B
AN
K, C
OG
EBA
NQ
UE,
UO
B, B
PR S
A, K
CB
RW
AN
DA
, CC
P, U
NG
UK
A SA
,AG
ASE
KE
BA
NK
LTD
, C
SS &
EQ
UIT
Y B
AN
K* )
A
ppen
dice
8 (C
ont’d
)(In
FR
W m
illio
n)
LIA
BIL
ITIE
S
DES
CR
IPTI
ON
DEP
OSI
TS IN
CLU
DED
IN B
RO
AD
MO
NEY
GVT
DEP
OSI
TS
FOR
EIG
NLI
AB
ILIT
IES
BN
R C
RED
ITS
SHA
RES
AN
D
OTH
ER E
QU
ITY
LIA
BIL
ITY
NO
NC
LASS
IFIE
DEL
SEW
HER
ETO
TAL
LIA
BIL
ITIE
STR
AN
SFER
AB
LED
EPO
SITS
N
ON
TRA
NSF
ERA
BLE
DEP
OSI
TS
FOR
EIG
N
CU
RR
ENC
Y D
EPO
SITS
SUB
-TO
TAL
July
208,
765.
717
4,17
3.1
105,
955.
738
2,93
8.8
26,8
83.7
19,9
44.5
12,0
08.5
610
3,56
0.0
214,
413.
275
9,74
8.8
Aug
ust
207,
080.
717
7,98
3.4
105,
955.
738
5,06
4.0
26,8
60.3
18,6
60.7
11,8
32.0
910
5,15
6.6
215,
141.
676
2,71
5.4
Sept
embe
r21
2,00
6.5
173,
026.
210
4,25
8.9
385,
032.
830
,819
.619
,781
.511
,472
.79
110,
704.
821
5,36
1.6
773,
173.
2
Oct
ober
228,
417.
617
0,78
3.3
104,
299.
339
9,20
0.8
27,5
94.8
21,7
56.9
8,14
9.41
114,
386.
220
8,13
4.2
779,
222.
4
Nov
embe
r21
7,27
9.4
183,
223.
610
3,82
0.2
400,
502.
926
,391
.925
,748
.07,
185.
6611
5,50
8.9
223,
590.
179
8,92
7.4
Dec
embe
r24
0,09
0.6
186,
137.
599
,229
.642
6,22
8.1
24,9
30.2
42,7
41.7
7,56
1.35
125,
584.
923
2,90
0.0
859,
946.
2
2011
Janu
ary
234,
202.
318
3,92
6.4
108,
437.
541
8,12
8.6
27,1
12.8
29,6
18.1
7,72
7.01
127,
706.
122
8,80
6.9
839,
099.
5
Febr
uary
229,
068.
518
9,04
3.7
118,
836.
941
8,11
2.2
28,1
22.2
32,4
95.2
7,04
4.69
129,
980.
726
6,36
7.5
882,
122.
6
Mar
ch23
9,14
0.2
187,
587.
811
5,82
1.0
426,
728.
031
,249
.721
,757
.96,
677.
9613
3,03
3.2
265,
594.
888
5,04
1.4
Apr
il25
5,43
7.6
192,
094.
911
0,77
8.1
447,
532.
429
,820
.124
,050
.06,
391.
3213
4,46
4.2
251,
659.
789
3,91
7.7
May
264,
576.
420
4,28
0.6
111,
543.
146
8,85
7.0
33,9
69.0
26,8
01.7
2,86
4.68
137,
523.
725
8,89
0.1
928,
906.
2
June
272,
679.
423
3,68
5.1
112,
296.
150
6,36
4.6
35,4
77.6
26,8
20.7
2,56
0.83
138,
455.
625
4,99
3.2
964,
672.
5
July
260,
733.
124
3,33
2.4
108,
780.
450
4,06
5.4
34,5
49.8
38,3
16.4
2,45
4.57
140,
471.
724
8,53
9.6
968,
397.
5
Aug
ust
266,
457.
425
7,13
6.6
116,
602.
452
3,59
4.0
39,8
01.9
28,2
52.8
1,33
5.55
141,
808.
525
1,96
9.0
986,
761.
7
Sept
embe
r26
2,84
4.8
242,
398.
412
3,12
9.1
505,
243.
243
,092
.032
,452
.71,
544.
6615
8,28
8.8
235,
592.
097
6,21
3.5
Oct
ober
264,
716.
724
3,04
8.0
123,
045.
250
7,76
4.8
42,0
02.3
26,5
50.1
1,52
5.35
158,
746.
625
1,73
5.9
988,
325.
0
Nov
embe
r27
8,80
2.3
255,
319.
612
0,05
8.9
534,
121.
937
,122
.433
,868
.01,
513.
7116
0,79
8.0
244,
615.
91,
012,
039.
9
Dec
embe
r27
9,10
8.6
263,
309.
313
5,56
9.5
542,
417.
938
,789
.340
,936
.31,
431.
8516
8,06
4.5
260,
762.
31,
052,
402.
2
2012
Janu
ary
276,
790.
726
2,04
9.3
125,
212.
453
8,84
0.0
36,9
85.0
46,8
32.8
988.
8616
9,23
8.8
245,
859.
71,
038,
745.
0
Febr
uary
296,
783.
527
7,85
6.9
125,
595.
857
4,64
0.4
37,6
76.0
46,8
36.5
1,17
5.29
173,
844.
025
4,46
7.0
1,08
8,63
9.2
Mar
ch31
0,21
2.2
279,
317.
312
5,37
2.2
589,
529.
544
,235
.243
,655
.349
5.47
174,
120.
723
7,08
1.7
1,08
9,11
7.8
Apr
il32
0,48
4.5
282,
378.
512
2,00
6.5
602,
863.
139
,626
.543
,584
.139
1.11
176,
700.
424
1,68
3.8
1,10
4,84
9.0
May
312,
645.
930
5,10
3.6
142,
839.
661
7,74
9.6
42,8
78.9
46,2
93.9
616.
1017
5,40
8.1
262,
802.
31,
145,
748.
7
June
332,
029.
430
2,93
7.5
132,
254.
563
4,96
6.9
40,9
84.2
47,1
56.2
450.
0518
0,63
6.3
261,
273.
61,
165,
467.
2
Sour
ce: B
NR
* EQ
UIT
Y B
AN
K is
incl
uded
sin
ce D
ecem
ber 2
011

163
APPENDICES
BNR
MO
NET
ARY
SU
RVE
Y
App
endi
ce. 9
(In F
RW
mill
ion)
ASS
ETS
PER
IOD
MO
NEY
(M1)
BR
OA
D M
ON
EY (M
2)TO
TAL
LIA
BIL
ITIE
S B
RO
AD
MO
NEY
(M3)
C
UR
REN
CY
IN
CIR
CU
LATI
ON
OU
T O
F B
AN
KS
TRA
NSF
ERA
BLE
DEP
OSI
TSTO
TAL
MO
NEY
(M1)
NO
N T
RA
NSF
ERA
BLE
DEP
OSI
TS
BR
OA
D M
ON
EY (M
2)FO
REI
GN
CU
RR
ENC
Y D
EPO
SITS
M3
2005
47,0
28.1
84,7
71.5
131,
799.
670
,754
.220
2,55
3.8
43,6
72.7
246,
226.
5
2006
52,7
30.9
103,
274.
615
6,00
5.5
105,
788.
626
1,79
4.1
59,1
78.4
320,
972.
5
2007
63,2
24.0
154,
690.
321
7,91
4.3
138,
663.
235
6,57
7.5
68,6
34.0
425,
211.
5
2008
80,9
13.4
144,
486.
922
5,40
0.3
158,
407.
938
3,80
8.1
82,3
38.2
466,
146.
4
2009
76,9
92.4
183,
999.
326
0,99
1.7
143,
373.
740
4,36
5.4
97,0
37.0
501,
402.
4
2010
90,4
78.2
118
7,93
4.51
278,
412.
7223
8,25
5.87
516,
668.
699
,229
.55
615,
898.
14
2011
102,
754.
7227
9,13
0.96
381,
885.
6926
3,30
9.29
645,
195.
013
5,56
9.46
780,
764.
4
2012
111,
570.
9833
2,02
9.38
443,
600.
3630
2,93
7.48
746,
537.
813
2,25
4.46
878,
792.
3
2009
Janu
ary
71,9
57.6
162,
827.
523
4,78
5.2
126,
673.
536
1,45
8.6
77,2
64.1
438,
722.
8
Febr
uary
69,0
29.6
150,
719.
821
9,74
9.3
128,
386.
434
8,13
5.8
79,7
79.9
427,
915.
7
Mar
ch66
,251
.914
9,69
5.1
215,
947.
013
4,95
8.6
350,
905.
681
,952
.343
2,85
8.0
Apr
il68
,058
.915
9,94
1.3
228,
000.
113
1,43
9.3
359,
439.
483
,262
.144
2,70
1.6
May
67,6
77.6
151,
652.
621
9,33
0.2
131,
081.
235
0,41
1.3
95,4
60.6
445,
872.
0
June
72,0
81.2
150,
466.
122
2,54
7.3
128,
745.
035
1,29
2.4
85,5
19.7
436,
812.
1
July
73,1
73.2
163,
020.
223
6,19
3.4
128,
098.
336
4,29
1.7
101,
696.
246
5,98
7.9
Aug
ust
70,3
92.9
181,
289.
925
1,68
2.8
124,
059.
437
5,74
2.2
92,1
38.1
467,
880.
4
Sep
tem
ber
69,4
33.5
171,
654.
924
1,08
8.4
128,
854.
836
9,94
3.1
90,3
70.9
460,
314.
0
Oct
ober
70,4
56.1
171,
059.
624
1,51
5.7
135,
696.
337
7,21
1.9
91,5
30.1
468,
742.
0
Nov
embe
r70
,701
.08
175,
075.
024
5,77
6.1
144,
165.
038
9,94
1.1
96,8
53.9
486,
795.
0
Dec
embe
r76
,992
.37
183,
999.
326
0,99
1.7
143,
373.
740
4,36
5.4
97,0
37.0
501,
402.
4
2010
Janu
ary
72,8
95.2
417
7,71
2.21
250,
607.
4516
5,88
8.33
416,
495.
894
,814
.67
511,
310.
5
Febr
uary
68,5
26.3
418
0,10
4.29
248,
630.
6316
1,54
6.71
410,
177.
310
0,17
3.50
510,
350.
8
Mar
ch68
,389
.82
179,
405.
9724
7,79
5.79
160,
175.
2740
7,97
1.1
94,7
99.0
950
2,77
0.2
Apr
il72
,456
.70
197,
124.
4326
9,58
1.13
158,
662.
3142
8,24
3.4
91,7
96.3
352
0,03
9.8
May
75,0
01.2
619
5,62
9.02
270,
630.
2816
6,40
5.22
437,
035.
591
,348
.23
528,
383.
7
June
83,4
65.4
120
7,14
6.08
290,
611.
4917
1,44
2.22
462,
053.
792
,881
.64
554,
935.
4
July
84,2
15.4
520
8,76
5.72
292,
981.
1717
4,17
3.06
467,
154.
210
1,76
3.90
568,
918.
1

164
APPENDICES
BNR
MO
NET
ARY
SU
RVE
Y
App
endi
ce. 9
(Con
t’d)
(In F
RW
mill
ion)
ASS
ETS
PER
IOD
MO
NEY
(M1)
BR
OA
D M
ON
EY (M
2)TO
TAL
LIA
BIL
ITIE
S B
RO
AD
MO
NEY
(M3)
C
UR
REN
CY
IN
CIR
CU
LATI
ON
OU
T O
F B
AN
KS
TRA
NSF
ERA
BLE
DEP
OSI
TSTO
TAL
MO
NEY
(M1)
NO
N T
RA
NSF
ERA
BLE
DEP
OSI
TS
BR
OA
D M
ON
EY (M
2)FO
REI
GN
CU
RR
ENC
Y D
EPO
SITS
M3
Aug
ust
81,2
14.5
420
7,08
0.65
288,
295.
1917
7,98
3.39
466,
278.
610
5,95
5.65
572,
234.
2
Sep
tem
ber
81,7
72.8
921
1,96
8.84
293,
741.
7317
3,02
6.24
466,
768.
010
4,25
8.88
571,
026.
9
Oct
ober
81,4
89.3
822
8,37
9.88
309,
869.
2617
0,78
3.27
480,
652.
510
4,29
9.25
584,
951.
8
Nov
embe
r80
,920
.06
190,
457.
2627
1,37
7.32
210,
007.
9948
1,38
5.3
103,
820.
1758
5,20
5.5
Dec
embe
r90
,478
.21
187,
934.
5127
8,41
2.72
238,
255.
8751
6,66
8.6
99,2
29.5
561
5,89
8.1
2011
Janu
ary
83,7
19.1
523
4,20
2.25
317,
921.
4018
3,92
6.39
501,
847.
8010
8,43
7.46
610,
285.
26
Febr
uary
82,6
76.7
922
9,00
6.85
311,
683.
6418
9,04
3.74
500,
727.
3811
8,83
6.87
619,
564.
25
Mar
ch83
,946
.22
239,
140.
2032
3,08
6.42
187,
587.
7651
0,67
4.18
115,
820.
9862
6,49
5.16
Apr
il89
,607
.17
255,
437.
5634
5,04
4.73
192,
094.
8753
7,13
9.59
110,
778.
1364
7,91
7.72
May
89,7
15.8
326
4,57
6.40
354,
292.
2320
4,28
0.61
558,
572.
8411
1,54
3.13
670,
115.
97
June
101,
533.
5127
2,67
9.42
374,
212.
9322
6,17
2.05
600,
384.
9811
2,26
6.28
712,
651.
26
July
100,
857.
3826
0,73
3.08
361,
590.
4624
3,33
2.36
604,
922.
8210
8,77
5.02
713,
697.
84
Aug
ust
95,2
84.0
826
6,45
7.43
361,
741.
5025
7,13
6.57
618,
878.
0711
6,59
3.48
735,
471.
55
Sep
tem
ber
93,4
29.1
626
2,84
4.82
356,
273.
9824
2,39
8.40
598,
672.
3812
3,12
0.64
721,
793.
02
Oct
ober
92,8
29.3
526
4,71
6.72
357,
546.
0724
3,04
8.04
600,
594.
1112
3,03
6.93
723,
631.
04
Nov
embe
r91
,337
.66
278,
555.
1437
0,13
9.94
255,
319.
6162
5,45
9.55
120,
058.
9174
5,51
8.45
Dec
embe
r10
2,75
4.72
279,
130.
9638
1,86
3.35
263,
309.
2964
5,17
2.64
135,
569.
4678
0,74
2.10
2012
Janu
ary
96,3
03.4
827
6,79
0.69
373,
094.
1726
2,04
9.26
635,
143.
4312
5,21
2.35
760,
355.
78
Febr
uary
96,6
35.6
329
6,78
3.47
393,
419.
1027
7,85
6.93
671,
276.
0312
5,59
5.76
796,
871.
79
Mar
ch99
,252
.81
310,
212.
2040
9,46
5.01
279,
317.
3068
8,78
2.31
125,
372.
1781
4,15
4.48
Apr
il10
5,13
3.57
320,
484.
5242
5,61
8.09
282,
378.
5470
7,99
6.63
122,
006.
5383
0,00
3.16
May
103,
355.
3031
2,64
5.94
416,
001.
2430
5,10
3.61
721,
104.
8514
2,83
9.59
863,
944.
44
June
111,
570.
9833
2,02
9.38
443,
600.
3630
2,93
7.48
746,
537.
8413
2,25
4.46
878,
792.
30
Sour
ce: B
NR

165
APPENDICES
BNR
DES
CR
IPTI
ON
NET
FO
REI
GN
ASS
ETS
DO
MES
TIC
CR
EDIT
TOTA
L A
SSET
SN
ETS
CLA
IMS
ON
GO
VER
NM
ENT
CR
EDIT
TO
EC
ON
OM
YTO
TAL
DO
MES
TIC
C
RED
IT
OTH
ER IT
EMS
NET
SG
RO
SS
ASS
ETS
GR
OSS
LI
AB
ILIT
IES
NET
FO
REI
GN
A
SSET
SC
LAIM
SD
EPO
SITS
NET
CLA
IMS
CLA
IMS
ON
PU
BLI
C
ENTE
RPR
ISES
CLA
IMS
ON
PR
IVAT
E SE
CTO
R
2005
277,
290.
654
,767
.922
2,52
2.7
67,1
47.8
127,
753.
3-6
0,60
5.5
2,18
0.1
165,
734.
810
7,30
9.5
-83,
605.
024
6,22
7.2
2006
312,
194.
027
,053
.028
5,14
1.0
68,1
60.8
139,
652.
4-7
1,49
1.6
2,40
6.0
211,
307.
314
2,22
1.7
-106
,390
.232
0,97
2.5
2007
387,
495.
635
,941
.835
1,55
3.7
88,1
73.9
164,
806.
6-7
6,63
2.7
1,76
2.5
257,
475.
018
2,60
4.8
-108
,949
.042
5,20
9.6
2008
430,
104.
226
,335
.140
3,76
9.2
69,0
49.0
211,
749.
2-1
42,7
00.2
1,63
8.1
340,
365.
319
9,30
3.2
-136
,926
.046
6,14
6.4
2009
531,
454.
889
,831
.844
1,62
3.0
76,2
90.9
223,
389.
4-1
47,0
98.5
3,02
1.4
331,
830.
818
7,75
3.7
-127
,974
.350
1,40
2.4
2010
630,
230.
811
1,27
3.5
518,
957.
314
3,90
2.0
275,
226.
9-1
31,3
24.9
3,21
3.6
390,
577.
626
8,20
0.9
-171
,222
.761
5,89
8.14
2011
782,
540.
711
1,37
8.7
671,
162.
012
4,45
0.8
348,
051.
4-2
23,6
00.7
2,80
0.1
509,
784.
528
7,95
0.7
-178
,519
.578
0,74
2.1
2012
635,
816.
212
1,64
9.7
514,
166.
614
2,57
8.2
194,
924.
2-5
2,34
6.0
2,57
6.4
602,
154.
255
0,18
4.5
-185
,634
.13
878,
716.
9
2009
Janu
ary
408,
985.
627
,471
.838
1,51
3.77
65,5
53.9
209,
755.
8-1
44,2
01.9
1,89
6.9
335,
437.
319
3,13
2.4
-135
923.
443
8,72
2.7
Febr
uary
398,
500.
826
,926
.837
1,57
3.91
65,2
39.5
207,
381.
8-1
42,1
42.3
1,77
6.0
338,
386.
719
8,02
0.4
-141
678.
6342
7,91
5.7
Mar
ch37
7,89
9.8
29,2
19.9
348,
679.
8768
,617
.718
8,08
7.2
-119
,469
.52,
261.
333
8,41
9.5
221,
211.
3-1
3703
3.14
432,
858.
0
Apr
il41
3,25
0.2
30,2
45.4
383,
004.
8165
,329
.820
9,73
0.5
-144
,400
.72,
012.
033
8,46
6.0
196,
077.
3-1
3638
0.59
442,
701.
5
May
399,
596.
535
,334
.236
4,26
2.36
65,1
32.2
192,
322.
2-1
27,1
90.0
2,81
6.2
339,
224.
621
4,85
0.7
-133
241.
0644
5,87
2.0
June
423,
589.
734
,121
.738
9,46
7.93
63,1
27.1
202,
382.
1-1
39,2
55.0
1,94
4.4
327,
146.
118
9,83
5.5
-142
491.
3943
6,81
2.1
July
450,
835.
331
,302
.241
9,53
3.13
63,8
36.7
206,
233.
1-1
42,3
96.4
1,94
7.1
327,
915.
618
7,46
6.3
-141
011.
4846
5,98
8.0
Aug
ust
487,
318.
786
,983
.040
0,33
5.74
80,6
78.0
193,
774.
9-1
13,0
96.9
1,80
1.8
325,
364.
221
4,06
9.1
-146
524.
5346
7,88
0.4
Sep
tem
ber
513,
426.
789
,392
.942
4,03
3.78
68,8
92.2
216,
871.
7-1
47,9
79.6
2,01
1.6
323,
266.
117
7,29
8.1
-141
017.
8846
0,31
4.0
Oct
ober
542,
092.
889
,360
.045
2,73
2.85
67,0
12.0
234,
905.
2-1
67,8
93.2
1,88
7.5
321,
367.
315
5,36
1.5
-139
352.
3546
8,74
2.0
Nov
embe
r54
1,99
0.19
90,1
73.0
045
1,81
7.19
6708
2.14
220,
768.
4-1
53,6
86.2
2,80
1.9
332,
598.
818
1,71
4.5
-146
736.
7248
6,79
5.0
Dec
embe
r53
1,45
4.84
89,8
31.8
444
1,62
3.00
7629
0.92
223,
389.
4-1
47,0
98.5
3,02
1.4
331,
830.
818
7,75
3.7
-127
974.
3150
1,40
2.4
2010
Janu
ary
525,
130.
890
,102
.243
5,02
8.6
71,1
48.6
220,
545.
5-1
49,3
96.9
2,79
1.2
357,
515.
521
6,82
1.9
-140
,582
.751
1,31
0.5
Febr
uary
512,
981.
286
,368
.842
6,61
2.4
81,8
55.8
209,
305.
5-1
27,4
49.6
2,79
1.2
352,
131.
123
3,35
8.7
-149
,617
.951
0,35
0.8
Mar
ch49
4,65
3.1
86,8
98.2
407,
754.
992
,481
.821
2,41
8.3
-119
,936
.52,
785.
835
8,22
7.1
246,
820.
3-1
51,8
05.8
502,
770.
2
Apr
il49
0,89
5.7
85,0
00.0
405,
895.
710
2,07
8.0
215,
056.
4-1
12,9
78.5
2,90
2.9
361,
379.
825
7,13
3.5
-142
,953
.652
0,03
9.8
May
484,
929.
483
,288
.340
1,64
1.1
125,
999.
122
2,73
4.2
-96,
735.
12,
813.
836
1,17
1.4
272,
669.
2-1
45,9
27.1
528,
383.
7
June
559,
737.
085
,271
.147
4,46
5.9
97,8
11.3
223,
594.
3-1
25,7
83.0
2,91
2.2
363,
887.
124
4,01
6.3
-163
,504
.055
4,93
5.4
MO
NET
ARY
SU
RVE
Y
App
endi
ce. 9
(Con
t’d)
(In F
RW
mill
ion)

166
APPENDICES
BNR
DES
CR
IPTI
ON
NET
FO
REI
GN
ASS
ETS
DO
MES
TIC
CR
EDIT
TOTA
L A
SSET
SN
ETS
CLA
IMS
ON
GO
VER
NM
ENT
CR
EDIT
TO
EC
ON
OM
YTO
TAL
DO
MES
TIC
C
RED
IT
OTH
ER IT
EMS
NET
SG
RO
SS
ASS
ETS
GR
OSS
LI
AB
ILIT
IES
NET
FO
REI
GN
A
SSET
SC
LAIM
SD
EPO
SITS
NET
CLA
IMS
CLA
IMS
ON
PU
BLI
C
ENTE
RPR
ISES
CLA
IMS
ON
PR
IVAT
E SE
CTO
R
July
548,
650.
086
,044
.546
2,60
5.4
100,
609.
821
1,93
4.6
-111
,324
.83,
083.
736
9,12
3.2
263,
948.
8-1
57,5
92.7
568,
918.
1
Aug
ust
515,
172.
287
,360
.742
7,81
1.5
122,
510.
219
9,86
0.3
-77,
350.
12,
999.
137
1,10
9.6
299,
898.
8-1
55,5
94.5
572,
234.
2
Sep
tem
ber
572,
432.
587
,581
.548
4,85
1.0
100,
871.
923
3,34
8.6
-132
,476
.72,
807.
737
0,45
1.5
243,
981.
5-1
57,8
95.9
571,
026.
9
Oct
ober
575,
444.
490
,156
.948
5,28
7.4
92,6
95.4
216,
559.
4-1
23,8
64.0
2,93
4.2
375,
915.
226
1,91
3.4
-162
,190
.658
4,95
1.8
Nov
embe
r54
4,55
8.6
94,2
48.0
450,
310.
512
8,26
4.3
217,
377.
4-8
9,11
3.1
2,92
5.0
385,
211.
130
5,94
1.5
-171
,012
.858
5,20
5.5
Dec
embe
r63
0,23
0.8
111,
273.
551
8,95
7.3
143,
902.
027
5,22
6.9
-131
,324
.93,
213.
639
0,57
7.6
268,
200.
9-1
71,2
22.7
615,
898.
1
2011
Janu
ary
598,
235.
810
0,21
6.0
498,
019.
913
0,71
6.7
253,
230.
1-1
22,5
13.4
3,40
9.9
405,
928.
028
6,22
1.6
-174
,045
.14
610,
285.
3
Febr
uary
596,
183.
410
3,00
7.5
493,
175.
814
8,62
0.2
271,
582.
2-1
22,9
62.0
2,50
0.5
415,
674.
229
4,63
9.9
-168
,326
.84
619,
564.
2
Mar
ch55
6,21
1.2
91,8
14.3
464,
396.
915
6,97
4.2
255,
551.
3-9
8,57
7.1
1,14
5.6
421,
391.
732
3,39
6.0
-161
,373
.09
626,
495.
2
Apr
il62
5,20
9.2
96,9
26.6
528,
282.
612
6,08
5.0
272,
938.
2-1
46,8
53.2
956.
543
5,89
7.8
289,
466.
5-1
69,9
33.7
764
7,91
7.7
May
598,
007.
298
,190
.349
9,81
6.8
144,
439.
623
4,89
5.6
-90,
456.
01,
492.
144
1,98
2.0
352,
436.
7-1
82,1
44.2
667
0,11
6.0
June
585,
048.
199
,761
.048
5,28
7.1
175,
315.
322
3,49
1.9
-48,
176.
62,
645.
944
6,99
6.7
400,
880.
2-1
73,5
45.9
771
2,65
1.3
July
569,
470.
211
0,38
8.7
459,
081.
613
8,46
8.6
203,
797.
2-6
5,32
8.6
4,09
2.0
471,
227.
140
9,16
6.0
-154
,449
.62
713,
797.
9
Aug
ust
601,
734.
810
1,17
1.7
500,
563.
113
2,99
4.1
221,
858.
6-8
8,86
4.5
3,53
7.8
483,
788.
839
7,65
6.4
-161
,184
.07
737,
035.
4
Sep
tem
ber
624,
027.
810
4,04
0.9
519,
986.
912
9,25
1.4
243,
825.
7-1
14,5
74.3
4,43
3.7
490,
255.
637
9,31
5.9
-177
,472
.15
721,
793.
0
Oct
ober
670,
763.
299
,359
.357
1,40
3.9
127,
088.
930
8,04
9.9
-180
,961
.04,
615.
650
2,30
2.6
325,
085.
0-1
72,8
17.1
772
3,63
1.0
Nov
embe
r65
8,65
6.8
104,
742.
055
3,91
4.8
142,
199.
128
8,25
7.3
-146
,058
.23,
074.
650
6,61
3.9
362,
640.
6-1
70,9
96.2
674
5,51
8.5
Dec
embe
r78
2,54
0.7
111,
378.
767
1,16
2.0
124,
450.
834
8,05
1.4
-223
,600
.72,
800.
150
9,78
4.5
287,
950.
7-1
78,5
19.5
078
0,74
2.1
2012
Janu
ary
741,
764.
811
8,25
5.4
623,
509.
411
6,54
2.9
313,
497.
2-1
96,9
54.2
2,86
1.5
519,
495.
432
4,17
4.0
-187
,363
.93
760,
319.
5
Febr
uary
726,
951.
112
1,56
5.1
605,
386.
010
7,85
1.7
263,
911.
2-1
56,0
59.5
2,08
3.6
536,
696.
038
1,15
6.1
-189
,668
.20
796,
873.
8
Mar
ch69
8,53
4.4
119,
361.
857
9,17
2.6
95,3
17.5
233,
825.
4-1
38,5
07.9
2,10
7.9
555,
558.
641
7,58
0.4
-182
,598
.30
814,
154.
7
Apr
il66
2,95
0.3
119,
253.
454
3,69
7.0
118,
967.
722
5,21
9.2
-106
,251
.52,
201.
557
2,75
5.1
467,
127.
1-1
80,8
58.5
782
9,96
5.4
May
610,
263.
512
0,55
3.0
489,
710.
515
8,62
6.9
203,
172.
4-4
4,54
5.4
3,24
6.4
588,
671.
154
5,15
3.9
-170
,995
.33
863,
869.
1
June
635,
816.
212
1,64
9.7
514,
166.
614
2,57
8.2
194,
924.
2-5
2,34
6.0
2,57
6.4
602,
154.
255
0,18
4.5
-185
,634
.13
878,
716.
9
Sour
ce: B
NR
MO
NET
ARY
SU
RVE
Y
App
endi
ce. 9
(Con
t’d)
(In F
RW
mill
ion)

167
APPENDICES
BNR
CONSOLIDATED BALANCE SHEET OF OTHER FINANCIAL INTERMEDIARIES* Appendice .10(In FRW million)
DESCRIPTION 2005 2006 2007 2008 2009 2010 2011 2012
ASSETS 21,640.79 26,858.88 31,741.65 44,111.72 52,374.27 63,080.73 97,614.87 109,552.76Reserves 24.20 17.45 44.40 63.38 415.04 181.61 743.39 199.76Foreign Assets 0.00 0.00 0.00 0.00 0.00 1,595.35 1,523.02 356.21Claims on Government 5,064.91 157.89 0.13 0.13 0.13 0.00 45.36 23.50Claims on the economy 10,079.25 18,319.69 25,744.25 31,340.00 42,571.41 52,945.26 74,180.69 74,180.69 Claims on publ enterprises 0.00 0.00 0.00 0.00 215.70 280.98 0.00 0.00 Claims on private sector 10,079.25 18,319.69 25,744.25 31,340.00 42,355.72 52,664.28 74,180.69 82,568.61Claims on banks 4,063.03 5,925.68 3,835.27 10,227.10 6,537.80 4,348.08 9,145.60 13,457.06Other Assets 2,409.40 2,438.17 2,117.60 2,481.11 2,849.89 4,010.43 11,976.81 12,889.57
LIABILITIES 21,640.83 26,858.84 31,741.65 44,111.71 52,374.27 63,080.85 97,614.85 109,552.76Government liabilities 0.00 0.00 5,472.40 5,545.21 9,627.91 10,738.34 16,132.78 13,309.87BNR credits 1,431.82 1,171.45 1,541.54 1,407.73 2,726.10 4,599.50 1,826.62 1,417.34Long term loans 4,906.25 3,187.82 2,162.47 2,125.70 5,050.17 6,255.17 21,761.83 22,085.59Savings Deposits 0.00 0.00 0.00 0.00 0.00 0.00 0.00 0.00Equity capital 4,744.34 5,070.44 5,618.26 13,097.35 14,100.07 16,823.85 20,185.81 28,456.00Other amounts due 4,541.61 7,732.33 3,287.07 8,465.51 4,112.78 4,520.57 4,521.57 7,467.05Other liabilities 6,016.81 9,696.80 13,659.91 13,470.21 16,757.24 20,143.42 33,186.24 36,816.91
Source : BNR
* At the reporting time this statement includes only BRD

168
APPENDICES
BNR
BANKING SURVEY* Appendice. 11(BNR, BK, BCR, FINA BANK, ECOBANK, ACCESS BANK, COGEBANQUE, UOB, BPR SA, KCB RWANDA, CSS , UNGUKA SA, AGASEKE BANK LTD, EQUITY BANK and BRD)(In FRW million)
DESCRIPTION 2005 2006 2007 2008 2009 2010 2011 2012 (June)
I. NET FOREIGN ASSETS 222,522.7 285,141.0 351,553.7 403,731.5 442,806.1 518,956.5 671,124.3 514,166.6 Assets: BNR 224,673.0 241,195.9 300,601.9 333,352.3 424,147.7 483,454.0 634,350.0 526,328.1
BANKS 52,617.6 70,998.1 86,893.7 96,751.9 107,466.2 146,776.8 148,190.7 109,488.1
Less liabilities: BNR 43,364.4 16,258.3 18,770.1 7,808.5 65,977.3 68,532.6 70,480.1 74,493.5
BANKS 11,403.5 10,794.7 17,171.7 18,564.2 22,830.4 42,741.7 40,936.3 47,156.2
II. NET DOMESTIC CREDIT 122,471.3 162,667.3 209,616.9 231,344.1 215,646.8 252,277.2 365,020.0 637,413.4 Net Claims on Government -56,059.8 -69,365.6 -75,365.0 -141,998.2 -153,103.7 -116,802.5 -218,955.6 -52,346.0 Claims: BNR 42,125.7 41,792.9 41,196.8 39,737.4 50,159.9 57,850.4 38,728.4 38,650.4
BANKS 24,760.0 26,367.9 46,977.2 29,570.2 20,070.6 84,804.0 85,633.0 103,927.7
OFIs 5,064.9 157.9 0.1 0.1 0.13 0.00 0.00 0.00
Less deposits: BNR 103,741.4 114,163.6 140,843.5 198,251.1 195,613.5 234,526.7 301,393.9 153,940.0
BANKS 24,269.0 23,520.8 22,695.5 13,054.9 27,720.8 24,930.2 41,923.0 40,984.2
O.F.I 0.0 0.0 0.0 0.0 0.0 0.0 0.0 0.0
Claims on public enterprises 2,180.2 2,406.0 1,762.5 1,636.9 3,165.3 3,494.6 2,800.1 2,576.4 BNR 61.2 24.4 13.2 0.0 0.0 0.0 0.0 0.0
BANKS 2,119.0 2,381.6 1,749.4 1,636.9 2,949.6 3,213.6 2,800.1 2,576.4
O.F.I 0.0 0.0 0.0 0.0 215.7 281.0 0.0 0.0
Claims on private sector 176,350.8 229,627.0 283,219.3 371,705.3 365,585.1 365,585.1 581,175.4 687,183.1 BNR 3,367.6 3,509.9 4,833.2 5,353.0 5,372.3 5,372.3 5,590.3 5,489.7
BANKS 162,367.2 207,797.4 252,641.9 335,012.3 317,857.1 390,577.6 501,404.4 594,993.4
O.F.I 10,616.0 18,319.7 25,744.3 31,340.0 42,355.7 52,664.3 74,180.7 86,700.0
ASSETS = LIABILITIES 344,994.0 447,808.4 561,170.6 635,075.6 658,452.9 771,233.8 1,036,144.3 1,151,580.0MONEY SUPPLY 247,865.0 316,246.4 424,478.3 466,104.8 491,194.0 617,705.6 780,742.2 851,371.5I. MONEY 133,438.1 152,313.4 217,181.1 225,358.7 258,050.7 280,220.2 381,863.4 416,179.6 Currency in circulation 47,028.1 52,730.9 63,224.0 80,892.3 76,992.4 104,140.3 79,415.4 111,571.0
Transferable deposits with BNR 1,788.7 1,812.1 1,885.0 1,911.8 5,573.0 594.6 394.0 1,671.1 Publ Enterprises 246.6 180.8 356.4 319.3 1,508.0 108.8 146.1 0.0
Private Sector 1,542.0 1,631.3 1,528.6 1,592.6 4,065.0 485.8 247.9 1,671.1
Nontranferable deposits with ODCs 84,621.3 97,770.5 152,072.1 142,554.5 175,485.3 175,485.3 302,054.1 302,937.5
II. QUASI MONEY 114,426.9 163,933.0 207,297.2 240,746.1 233,143.3 337,485.4 398,878.8 435,191.9
Non transferable deposits 70,754.2 104,754.6 138,663.2 158,407.9 136,106.3 238,255.9 263,309.3 302,937.5 BNR 0.0 0.0 0.0 0.0 0.0 0.0 0.0 0.0
BANKS 70,754.2 104,754.6 138,663.2 158,407.9 136,106.3 238,255.9 263,309.3 302,937.5
Foreign currency deposits 43,672.7 59,178.4 68,634.0 82,338.2 97,036.9 99,229.6 135,569.5 132,254.5

169
APPENDICES
BNR
DESCRIPTION 2005 2006 2007 2008 2009 2010 2011 2012 (June)
OTHER ITEMS NET 97,128.9 131,561.9 165,315.2 139,566.7 197,936.6 220,882.7 332,673.8 375,070.7I. BNR 68,416.5 99,110.8 119,654.2 88,124.1 135,552.2 148,850.8 197,405.2 222,803.1 Cash in Banks 2,832.1 5,694.2 9,512.9 7,605.7 9,161.9 13,662.1 15,169.4 15,169.4
Cash in OFIs 6.0 2.3 0.9 0.3 0.2 0.3 0.3 0.3
Deposits in Banks 10,895.8 11,322.9 18,581.9 25,141.5 24,130.6 24,681.1 38,192.8 45,729.1
Deposits in OFIs 213.1 173.6 675.7 418.0 548.2 619.9 1,181.8 1,156.3
Money market borrowings 40,273.0 50,538.2 58,611.5 16,600.0 73,537.8 69,330.6 96,114.9 122,409.8
Shares and other equity 23,526.4 30,262.9 35,506.5 35,745.2 38,167.1 51,793.6 54,677.2 61,947.4
Unclassified liabilities 73,049.4 82,518.6 82,999.7 89,984.8 84,709.6 86,682.6 135,214.8 123,804.7
Loans money market 0.0 0.0 0.0 0.0 -8,678.2 -8,000.0 -600.0 0.0
Claims on banks -1,379.8 -1,189.3 -1,298.9 -1,495.6 -881.7 -745.6 -597.2 -450.1
Claims on OFIs. -424.0 -278.0 -1,167.4 -1,010.7 -2,471.0 -1,712.8 -1,839.1 -1,671.1
Unclassified Assets -80,575.4 -79,934.6 -83,768.5 -84,865.0 -82,672.3 -87,460.9 -140,109.7 -145,292.9
II. BANKS 25,946.5 32,574.2 52,285.9 56,091.3 61,368.2 67,902.8 122,580.4 137,892.8 BNR loan 1,379.8 1,189.3 1,298.9 1,495.6 9,559.88 9,559.88 9,560.88 9,646.88
Shares and other equity 20,125.6 27,533.6 55,050.7 76,176.4 88,375.2 125,584.9 168,064.5 180,636.3
Banks Deposits 0.0 0.0 0.0 0.0 0.0 0.0 0.0 0.0
Reserves -15,136.5 -17,017.1 -18,956.9 -25,141.5 -34,443.4 -38,222.7 -58,472.4 -64,034.7
Claims on Banks -1,379.8 -1,189.3 -1,298.9 -11,487.4 -9,843.8 -9,843.8 -9,843.8 -9,843.8
Claims on OFIs 0.0 0.0 0.0 0.0 0.0 0.0 0.0 0.0
Other item net 20,957.4 22,057.7 16,192.1 15,048.2 7,720.3 -19,175.5 13,271.2 21,488.2
III. OFIs 2,766.0 -123.0 -6,624.9 -4,648.8 1,016.1 4,129.2 12,688.3 14,374.8 Reserves -24.2 -17.5 -39.7 -63.4 -415.0 -181.6 -743.4 -199.8
Claims on banks -4,063.0 -5,925.7 -3,835.3 -10,227.1 -6,537.8 -4,348.1 -9,145.6 -13,457.1
Claims on OFIs 0.0 0.0 0.0 0.0 0.0 0.0 0.0 0.0
Long term loan 4,906.3 7,732.3 2,162.5 2,125.7 5,050.2 6,255.2 21,761.8 22,085.6
Other amounts due 0.0 0.0 0.0 0.0 0.0 0.0 0.0 0.0
BNR Credit 1,431.8 1,171.5 1,011.6 1,407.7 2,726.1 1,712.8 1,839.1 1,417.3
Shares and other equity 4,744.3 5,070.4 5,618.3 13,097.4 14,100.1 16,823.9 20,185.8 28,456.0
Other items net -4,229.2 -8,154.1 -11,542.3 -10,989.1 -13,907.4 -16,133.0 -21,209.4 -23,927.3
*This statement consolidates the balance sheets of BNR, ODCs and other financial intermediaries.Source: BNR, Statistics Department
BANKING SURVEY* Appendice. 11 (Cont’d)(BNR, BK, BCR, FINA BANK, ECOBANK, ACCESS BANK, COGEBANQUE, UOB, BPR SA, KCB RWANDA, CSS , UNGUKA SA, AGASEKE BANK LTD, EQUITY BANK and BRD)(In FRW million)

170
APPENDICES
BNR
Outstanding Loans by activities sector and by term June 2012 Appendice. 12In thousands of Rwanda Franc. Data submitted by BCR, BK, ECOBANK RWANDA, FINA BANK, ACCESS BANK, COGEBANQUE, KCB, BPR and BRDCash credits private and public sectorClass 1 to 5Individual and legal entities
Activities sector30 June 2012
Total
Long-termMedium-
term Short-term0001 : Non_classified activities 664,827 66,132,581 6,945,657 73,743,065 1000 : Agricultural, fisheries& livestock 4,996,751 9,660,460 2,513,898 17,171,109 2000 : Mining activities 3,220 3,220 3000 : Manufacturing activities 11,440,911 8,695,942 6,004,945 26,141,798 4000 : Water & energy activities 289,539 1,292,327 1,910,987 3,492,853 5000 : Mortgage industries 86,764,784 45,718,326 19,813,841 152,296,951 6000 : Commercial & hotel 32,901,514 44,631,787 85,984,447 163,517,748 7000 : Transport & warehousing 2,368,883 25,714,959 8,386,858 36,470,700 8000 : OFI &Insurance 1,848,544 1,785,820 1,424,358 5,058,722 9000 : Service sector 12,763,336 3,792,354 1,437,683 17,993,373 Grand Total 154,042,309 207,424,556 134,422,674 495,889,539
Source : BNR

171
APPENDICES
BNR
NEW AUTHORIZED LOANS BY SECTOR OF ACTIVITY (JANUARY- JUNE 2012) Appendice. 13(BCR, BK, ECOBANK RWANDA, FINA BANK, ACCESS BANK , COGEBANQUE, BPR, BRD, KCB, EQUITY, AGASEKE, UNGUKA AND URWEGO OPPORTUNITY)(In thousand FRW)
Activities sectorJanuary-June 2012
TotalLong-term Medium-term Short-term
0001 : Non_classified activities 656,733 38,015,464 4,647,639 43,319,836 1000 : Agricultural, fisheries& livestock 454,700 2,647,915 1,908,521 5,011,136 3000 : Manufacturing activities 5,009,274 4,002,248 2,973,692 11,985,214 4000 : Water & energy activities 166,977 4,620 171,597 5000 : Mortgage industries 29,815,288 15,835,387 14,480,478 60,131,153 6000 : Commercial & hotel 8,436,939 21,765,559 77,236,078 107,438,576 7000 : Transport & warehousing 4,643 9,104,817 3,931,195 13,040,655 8000 : OFI &Insurance 183,410 376,546 842,371 1,402,327 9000 : Service sector 1,395,333 1,816,835 2,376,676 5,588,844 Total 45,956,320 93,731,748 108,401,270 248,089,338
Source: BNRNote: The statement above includes cash credit to firms and individuals, from both private and public sectors

172
APPENDICES
BNR
Inte
rest
rate
s St
ruct
ure
(in %
) A
ppen
dice
. 14
DES
CR
IPTI
ON
2011
2012
Janu
ary
Febr
uary
Mar
chA
pril
May
June
July
Aug
.Se
pt.
Oct
.N
ov.
Dec
.Ja
nuar
yFe
brua
ryM
arch
Apr
ilM
ayJu
ne
Dep
osit
rate
7.51
7.50
7.49
8.65
7.93
8.03
6.83
6.59
6.49
7.04
7.97
7.96
7.40
8.25
8.20
8.09
9.92
7.91
Lend
ing
rate
15.6
316
.91
16.5
916
.21
16.8
916
.97
16.5
816
.98
17.0
117
.04
16.4
816
.73
16.9
516
.27
16.3
016
.87
16.7
216
.82
Mon
ey m
arke
t ra
te
* -M
op-u
p -
--
--
--
--
--
--
--
--
-
-In
ject
ion
--
--
--
--
--
--
--
--
-
Rep
o R
ate
5.95
6.00
6.00
6.00
6.00
6.00
6.00
6.00
6.00
6.37
6.62
6.53
6.44
6.01
6.90
6.91
6.37
7.43
Dis
coun
t rat
e10
.00
10.0
010
.00
10.0
010
.00
10.0
010
.00
10.0
010
.00
10.5
011
.00
11.0
011
.00
11.0
011
.00
1111
.511
.5
Inte
rban
k ra
te
6.71
6.74
6.74
6.86
6.92
7.00
6.93
6.87
6.93
7.36
7.48
8.08
7.45
6.86
7.65
88.
608.
95
Wei
ght a
vera
ge
rate
on
T-bi
ll m
arke
t :7.
197.
027.
227.
117.
046.
786.
806.
746.
717.
217.
827.
627.
607.
617.
737.
858.
349.
31
28 d
ays
6.13
6.23
6.40
6.35
6.21
6.11
6.15
6.10
6.27
6.77
6.83
6.98
7.14
7.15
7.42
7.48
7.91
8.81
91 d
ays
6.38
6.44
6.90
6.84
6.69
6.47
6.35
6.21
6.48
7.01
7.24
7.28
7.26
7.62
7.62
7.62
8.13
9.63
182
days
7.20
7.14
7.39
7.24
7.18
6.92
7.21
7.16
6.85
7.24
7.69
7.61
7.66
7.45
7.93
7.92
8.34
9.41
364
days
7.70
7.34
7.58
7.38
7.33
7.21
7.06
7.05
6.98
7.50
8.62
8.18
8.38
8.02
7.78
8.45
8.86
9.13
T-B
onds
mar
ket
Tbon
d 2
yrs
--
--
--
--
--
--
--
--
--
Tbon
d 3
yrs
-10
.43
--
--
--
--
--
--
--
-
Tbon
d 5
yrs
--
--
--
--
-11
.12
--
--
--
--
3 to
12
mon
ths
BN
R li
quid
ity
faci
lity
--
--
--
--
--
--
--
--
--
Key
Rep
o R
ate
6.00
6.00
6.00
6.00
6.00
6.00
6.00
6.00
6.00
6.50
7.00
7.00
7.00
7.00
7.00
7.00
7.5
7.5
Rev
erse
Rep
o-
--
--
--
--
--
--
--
--
-
Sour
ce :
BN
R
* The
Mop
-up
oper
atio
ns w
ere
repl
aced
by
thos
e of
Rep
o si
nce
sept
embe
r 200
8

173
APPENDICES
BNR
Des
crip
tion
1USD
1£st
g1Y
EN1D
TS1E
UR
O
2005
557.
8110
16.3
05.
0982
5.11
695.
52
2006
548.
0010
15.9
74.
7481
1.64
692.
40
2007
547.
0110
93.0
94.
6583
6.71
748.
93
2008
546.
8510
13.8
35.
3086
4.46
804.
23
2009
568.
2788
7.92
6.09
872.
5079
1.79
2010
583.
1390
1.56
6.65
889.
7277
4.01
2011
600.
2996
2.83
7.54
947.
6283
5.67
2012
606.
9795
6.76
7.62
930.
5778
7.37
2009
Janu
ary
564.
1981
8.69
6.24
811.
2575
1.34
Febr
uary
566.
8081
9.40
6.16
843.
4072
6.52
Mar
ch56
8.53
806.
325.
8284
2.58
739.
97
Apr
il56
8.50
833.
805.
7684
7.85
749.
48
May
567.
2187
2.06
5.86
861.
3077
1.60
June
567.
9791
1.11
5.88
877.
3779
6.07
July
569.
2893
0.39
6.03
883.
5080
1.88
Aug
ust
568.
0494
0.25
5.98
885.
9980
9.75
Sep
tem
ber
568.
8092
9.48
6.21
896.
7082
6.78
Oct
ober
569.
4492
0.91
6.32
905.
0984
3.29
Nov
embe
r56
9.87
945.
366.
3891
1.17
849.
38
Dec
embe
r57
0.59
927.
336.
3890
3.76
835.
43
Ann
ual a
vera
ge
568.
2788
7.92
6.09
872.
5079
1.79
2010
Janu
ary
572.
1492
5.31
6.26
895.
7481
8.10
Febr
uary
572.
7889
4.64
6.35
880.
6478
3.17
Mar
ch57
2.62
861.
876.
3387
4.94
777.
53
Apr
il57
4.00
879.
636.
1387
0.93
770.
38
May
578.
6385
0.49
6.27
857.
1572
9.81
June
584.
3886
1.02
6.42
857.
8071
3.67
July
589.
3990
0.23
6.73
886.
1275
2.66
Aug
ust
588.
9792
0.83
6.88
893.
1375
9.07
Sep
tem
ber
588.
3591
5.29
6.97
897.
4976
7.91
Oct
ober
590.
1793
5.82
7.20
925.
9181
9.28
Nov
embe
r59
2.37
947.
547.
2092
5.46
812.
37
Dec
embe
r59
3.78
926.
057.
1291
1.33
784.
12
Ann
ual a
vera
ge
583.
1390
1.56
6.65
889.
7277
4.01
Des
crip
tion
1USD
1£st
g1Y
EN1D
TS1E
UR
O
2011
Janu
ary
596.
7593
9.46
7.23
921.
6279
6.76
Febr
uary
600.
2496
7.47
7.27
936.
0781
8.70
Mar
ch59
9.53
969.
667.
3494
5.49
838.
94
Apr
il60
1.27
982.
157.
2295
7.07
867.
09
May
599.
2897
9.81
7.39
956.
1486
0.98
June
600.
0097
4.24
7.45
958.
2386
3.18
July
600.
3596
9.56
7.57
957.
7585
7.12
Aug
ust
599.
7598
1.83
7.78
963.
5786
0.21
Sep
tem
ber
599.
8494
9.47
7.81
948.
3082
8.69
Oct
ober
601.
2994
5.55
7.85
947.
0882
2.51
Nov
embe
r60
1.77
952.
407.
7794
4.63
817.
69
Dec
embe
r60
3.45
942.
337.
7593
5.53
796.
17
Ann
ual a
vera
ge
600.
2996
2.83
7.54
947.
6283
5.67
2012
Janu
ary
604.
3793
6.44
7.85
930.
4377
9.26
Febr
uary
605.
1595
5.36
7.73
938.
6679
9.47
Mar
ch60
6.80
959.
527.
3793
4.15
801.
24
Apr
il60
7.01
970.
757.
4693
6.26
799.
26
May
608.
5697
0.58
7.63
932.
8478
1.01
June
609.
9494
7.89
7.70
911.
0676
4.00
Ann
ual a
vera
ge
606.
9795
6.76
7.62
930.
5778
7.37
Sour
ce :
BN
R
AVER
AG
E EX
CH
AN
GE
RAT
ES O
F TH
E M
AJO
R C
UR
REN
CIE
S
App
endi
ce 1
5

174
APPENDICES
BNR
Stock of External Public Debt Appendice 16(In USD million by donor, end period)
DESCRIPTION 2005 2006 2007 2008 2009 2010 2011End June
2012MULTILATERAL DEBT 1,402.82 390.02 485.66 580.53 628.26 651.14 832.99 841.66ADB-ADF 294.60 69.33 102.16 135.49 157.88 172.59 210.62 213.33
BADEA 18.46 21.47 25.44 25.77 26.49 29.33 34.03 33.56
EIB 16.56 15.30 14.48 11.39 8.90 6.39 5.03 3.66EU 18.54 19.54 20.67 18.78 17.82 15.25 13.89 12.90IFAD 58.86 73.61 85.96 92.61 99.74 103.05 107.07 107.58IMF 4.90 4.29 8.10 11.47 15.19 14.82 14.13 13.59IDA 975.53 168.43 205.30 240.38 253.30 258.25 391.55 401.11
NDF 0.00 0.56 2.08 12.71 16.54 16.40 16.08 15.33
OPEC 16.50 17.49 21.47 12.71 32.40 35.08 40.57 40.38
BILATERAL DEBT 83.99 89.52 84.19 85.20 108.34 115.45 151.66 163.02AFD-FRANCE 3.96 4.40 4.92 4.74 4.79 3.66 2.12 1.36
CHINA 16.01 16.54 0.00 0.00 0.00 0.00 0.00 0.00
EXIM-CHINA 0.00 0.00 0.00 0.00 6.17 10.36 28.60 30.70
EXIM-INDIA 0.00 0.00 0.00 0.00 16.00 18.50 28.65 39.55Abu Dhabi 1.84 1.85 1.85 1.85 1.85 1.85 2.99 2.99KUWAIT 32.21 32.66 34.49 34.22 34.63 35.52 44.68 44.48
SAUDI FUND 29.63 33.74 42.58 44.04 44.54 45.22 44.28 44.59
LYBIA 0.33 0.34 0.36 0.35 0.36 0.35 0.35 0.34
TOTAL 1486.81 479.54 569.85 665.73 736.60 766.59 984.65 1004.68
N.B. : Government guaranteed debt not included
Source: BNR

175
APPENDICES
BNR
Development of disbursements (in USD million) Appendice 17
DESCRIPTION 2005 2006 2007 2008 2009 2010 20112012/
Jan-JuneMULTILATERAL CREDITORS 101.5 105.2 79.4 110.6 51.2 43.3 197.5 29.3 Of which : IDA 46.3 36.7 27.6 40.5 10.5 10.1 138.2 19.8 FAD-FSN 36.9 27.6 26.2 32.08 22.6 16.0 39.0 7.8 BILATERAL CREDITORS 0.0 4.4 9.1 1.7 24.7 7.3 24.8 13.3 TOTAL 101.5 109.5 88.5 112.3 75.9 50.7 222.2 42.4 Of Which :Drawings for projects 93.3 100.1 84.1 106.5 71.8 50.7 186.7 42.4 Drawings for budget support 8.2 6.9 1.0 2.07 0.5 0.0 35.5 0.0 Drawings for BOP support (IMF) 0.0 2.5 3.4 3.72 3.6 0.0 0.0 0.0
Source: BNR

176
APPENDICES
BNR
Development of External Debt Service (in USD million) Appendice 18
DESCRIPTION 2005 2006 2007 2010 20112012/
Jan-JuneMULTILATERAL DONORS 40.6 31.4 11.3 14.9 19.3 10.6 Principal 30.1 21.2 6.2 8.8 13.3 7.5 Of which : IDA 15.2 9.3 0.0 0.5 2.4 1.4 FAD-FSN 7.2 5.6 0.8 1.2 1.7 0.9 BADEA 3.5 0.0 0.0 0.0 1.0 0.5 Interests 10.5 10.2 5.0 6.2 4.4 3.1 Of which : IDA 8.0 5.0 1.5 1.9 2.3 1.2 FAD-FSN 0.8 3.1 1.3 1.6 1.6 0.9 BADEA 0.6 1.0 0.9 0.9 0.0 0.0 BILATERAL DONORS 9.1 2.7 1.3 2.9 4.4 2.6 Principal 6.2 1.7 0.3 1.2 2.3 1.3 Interests 2.9 1.0 1.1 1.7 2.2 1.3 SUPPLIERS’CREDITS 0.7 0.0 0.0 0.0 0.0 0.0 Principal 0.0 0.0 0.0 0.0 0.0 0.0 Interests 0.7 0.0 0.0 0.0 0.0 0.0 TOTAL 50.5 34.1 12.6 17.8 23.7 13.2 Principal 36.3 22.9 6.5 10.0 15.6 8.9 Interests 14.2 11.2 6.1 7.9 8.1 4.3
Source: BNR

177
APPENDICES
BNR
2010 2011 Prov. End June 2012
Trade Balance -786.70 -1101.17 -605.45 Exports, f.o.b. 297.28 464.24 247.59 Of which: coffee 56.08 74.60 12.14 tea 55.71 63.90 33.53 Imports, f.o.b. -1083.97 -1565.40 -853.04 Services and income (net) -292.06 -242.54 -124.41 Services (net) -246.22 -187.85 -87.35 Income (net) -45.85 -54.69 -37.06 Trade and Services and income balance -1078.76 -1343.71 -729.85Current transfers (net) 657.36 880.57 263.46 Private 90.68 133.31 61.92 Public 566.68 747.25 201.54 Current account balance (including official transfers) -421.40 -463.14 -466.39Capital and Financial account balance 499.36 682.51 321.99 Capital Account 285.64 196.66 94.48 Capital transfers 285.64 196.66 94.48 Debt Forgiveness 0.00 0.00 0.00 Migrants transferss 0.00 0.00 0.00 Other capital transfers 285.64 196.66 94.48 Financial transactions account 213.72 485.85 227.51 Public sector capital (LT) (net) 51.90 207.22 33.46 Private sector capital (LT) (net) 180.45 231.12 123.88 Lt. Debt 129.02 148.78 73.93 Amortization -12.29 -55.16 -26.74 Direct investment 63.71 137.50 76.68 Other Capital -18.63 47.51 70.18 Short term capital -18.63 47.51 70.18 Errors & Omissions -5.88 16.17 -51.10Overall balance 72.07 235.54 -195.50Financing (- increase) -72.07 -235.54 195.50Change in net foreign assets of NBR (increase -) -72.07 -235.54 195.50 a. Net use of IMF credit (increase +) 0.00 0.00 0.00 b. Change in gross reserves (increase -) -69.08 -236.72 190.58 c.Change in other foreign liabilities (increase +) -2.99 1.18 4.91Change in arrears (decrease -) 0.00 0.00 0.00Exceptional financing 0.00 0.00 0.00 Rescheduling 0.0 0.00 0.0 Cancellation 0.0 0.0 0.0 GAP (+ financing needed) 0.00 For the recordGross official reserves (Mios USD) 813.4 1050 859.21Foreign liabilities(Mios USD) 115.40 116.6 121.57Gross reserves in month of imports G&S 6 5.8 4.5 Gross reserves in months of CAF imports of goods 7 7.7 5.14Gross reserves in months of FOB imports of goods 9 8.0 6.04Trade balance (in percent of GDP) -14% -18% -18%
BALANCE OF PAYMENTS Appendice 19 (In USD million)

178
APPENDICES
BNR
2010 2011 Prov. End June 2012
Current account balance in percent of GDP (including official transfers) -7% -7% -14%Current account balance in percent of GDP (excluding official transfers) -18% -19.4%Overall balance (in percent of GDP) 1.3% 4% -6%GDP (millions $US, Current) 5,628.34 6,231.95 3,406.89GDP (billions de RFW, current) 3,282 3,741.00 2,078.00Exchange rate of 1 USD (RFW/1 USD), end period 594.45 604.14 612.43Imports of goods and services -1640.55 -2183.82 -1147.97Exchange rate average ( RFW/1 USD) 583.12 600.29 609.94
Source : BNR
BALANCE OF PAYMENTS Appendice 19(Cont’d) (In USD million)

179
APPENDICES
BNR
RWANDA’s EXPORTS Appendice 20(FOB value in USD million)
2005 2006 2007 2008 2009 2010 2011 Prov. End June 2012
I. CoffeeValue 38.3 54.04 35.67 47.05 37.29 56.08 74.60 12.14in % of Total exports, f.o.b. 30.6 36.7 20.18 18.28 19.75 19% 16%
% change of value 18.7 41.2 -33.99 31.51 -20.51 50% 33%
Volume (1,000 tons) 18,398.6 26,534.1 13,673.86 18,191.29 14,992.36 18,235.85 15,596.62 3,436 % change of volume -32.1 44.2 -48.47 33.04 -0.18 22% -14%
Unit value (US$/kg) 2.08 2.04 2.61 2.58 2.49 3.08 4.78 3.53 % change of unit value 74.8 -2.08 28.08 -1.15 -0.04 23.7% 55.5%
II. TeaValue 24.38 31.86 31.52 44.95 48.24 55.71 63.90 33.53in % of Total exports, f.o.b. 19.51 21.62 17.83 15.61 25.80 19% 14%
% change of value 13.13 30.68 -1.09 27.08 21.63 15% 15%
Volume (1,000 tons) 15,481 16,523.7 18,375.62 19,828.02 18,689.30 21,528.48 23,732.19 11,904.74 % change of volume 18.5 6.7 11.21 3.93 -0.01 15.2% 10.2%Unit value (US$/kg) 1.57 1.93 1.72 2.10 2.58 2.59 2.69 2.82 % change of unit value -4.8 22.44 -11.06 22.28 0.23 0.2% 4.0%
III. MineralsValue 37.30 36.57 70.62 91.69 55.43 67.85 151.43 64.64in % of Total exports, f.o.b. 29.85 24.81 39.95 35.57 28.90 23% 33%
% change of value 27.4 -1.9 93.09 29.23 -40.20 22% 123%
Volume (1,000 tons) 6,150.49 5,995.15 8,220.98 7,009.98 6,093.54 5,466.35 8,848.38 3,690.38 % change of volume 34.5 -2.5 37.13 -14.73 -0.13 -10% 62%Cassiterite Value 17.86 15.87 31.97 41.25 28.58 42.21 96.82 27.20 in % of Total exports, f.o.b. 14.29 10.76 18.09 16.04 15.14 14% 21%
% change of value 12.46 -11.14 101.52 28.70 -30.55 48% 129%
Volume (1,000 tons) 4,531.8 3,835.3 4,565.91 4,193.29 4,269.17 3,874.20 6,952.07 2,320.40 % change of volume 27.54 -15.37 19.05 -9.85 0.04 -0.09 79%Unit value (US$/kg) 3.94 4.14 7.00 10.00 6.69 10.89 13.93 11.72 % change of unit value -11.85 4.99 69.28 42.76 -33.04 0.63 28%ColtanValue 16.87 11.17 19.23 36.03 20.24 1848% 38.58 23.73 in % of Total exports, f.o.b. 13.50 7.58 10.88 14.50 10.72 0.06 8%
% change of value 29.84 -33.76 72.10 93.51 -45.62 -9% 109%
Volume (1,000 tons) 1,061.64 724.25 968.96 1,190.33 949.92 748.72 890.08 544.82 % change of volume 23.30 -31.78 33.79 26.16 -22.29 -0.21 19%Unit value (US$/kg) 15.89 15.43 19.85 30.44 21.30 2469% 43.35 43.55 % change of unit value 5.30 -2.90 28.63 53.38 -30.02 16% 76%WolframValue 2.58 9.53 19.42 13.41 5.76 710% 16.03 13.71 in % of Total exports, f.o.b. 2.06 6.47 10.98 5.03 3.05 0.02 3%
% change of value 536.01 270.11 103.67 -33.58 -55.34 23% 126%
Volume (1,000 tons) 557.02 1,435.57 2,686.11 1,708.04 874.45 843.42 1,006.24 825.17 % change of volume 253.63 157.72 87.11 -37.78 -0.48 -0.04 19%Unit value (US$/kg) 4.62 6.64 7.23 7.72 6.59 842% 15.93 16.61 % change of unit value 79.93 43.61 8.85 6.76 -14.64 28% 89%

180
APPENDICES
BNR
2005 2006 2007 2008 2009 2010 2011 Prov. End June 2012
OrValeur 1.01 0.86 6%in % of Total exports, f.o.b. 0.00var en % de la valeur -93%Volume exporté(Tonnes) 0.04 0.03 0.00var en % du volume
Prix Unit(USD/kg) 20,810.52
% change of unit value
IV . Hides and skinsValue 4.73 1.99 3.56 2.85 1.96 3.74 7.62 4.95 in % of Total exports, f.o.b. 3.79 1.35 2.02 1.11 1.04 0.01 2%
% change of value 39.82 -58.00 79.31 -20.06 -31.16 0.91 103%
Volume (1,000 tons) 3,183 1,160 1,805.60 2,043.60 1,791.68 3,730.87 6,220.43 3,670.59 % change of volume 48.01 -63.57 55.67 13.18 -0.12 1.08 67%Unit value (US$/kg) 1.49 1.71 1.97 1.39 1.09 100% 1.22 1.35 % change of unit value -5.30 15.29 15.18 -29.37 -21.48 -8% 22%V. PyrethrumValue 1.92 3.00 0.38 0.64 141% 4.51 4.53 in % of Total exports, f.o.b. 0.00 1.31 1.70 0.15 0.34 0.00 1.0%
% change of value -100.00 56.05 -87.25 68.08 119% 221%
Volume (1,000 tons) 44.64 38.27 3.30 3.18 6.33 18.78 17.48 % change of volume -100.00 -14.25 -91.39 -0.04 0.99 197%Unit value (US$/kg) 43.10 78.44 116.16 202.61 22227.4% 240.37 259.14 % change of unit value -100.00 81.98 48.09 74.43 10% 8%VI. Other products Value 20.22 20.91 32.32 85.80 49.26 6966% 85.61 75.45 in % of Total exports, f.o.b. 16.18 14.19 18.28 31.25 26.54 -0.77 -82%
% change of value 87.25 3.45 54.55 148.03 -37.48 41% 23%
Other ordinary products 3.19 4.41 14.37 33.00 26.88 33.76 48.35 35.96 Reexports 17.03 16.50 17.95 52.81 22.38 35.90 37.26 39.49 Sub- Total 124.90 147.30 176.69 272.73 192.82 25446% 387.67 195.23 VII. Adjustments 0.08 0.08 0.08 -5.06 -0.16 4282% 76.57 52.36Electricity 0.08 0.08 0.08 0.09 0.12 0.11 0.21 0.06
Postal colis
Carnets 126
Goods purchased in the ports or airports 0.56 9.21 2.97
Reexports of minerals 11.12 25.17Ajustment in transport and insurance
Ajustments on exports/ surveys 4.33 46.91 71.40 51.04
Ajustment on transport &Tea assurance -5.15 -4.61 -4.77 -4.26 -1.71
Total fob 124.98 147.38 176.77 267.67 192.67 297.28 464.24 247.59 % change 27.46 17.93 19.94 45.14 -28.02% 26.53% 56.16% -46.67%Source : BNR
RWANDA’s EXPORTS Appendice 20 (Cont’d)(FOB value in USD million)

181
APPENDICES
BNR
RWANDA’S IMPORTS Appendice 21(Value in USD million)
2005 2006 2007 2008 2009 2010 2011 Prov end June 2012
I. Capital goodsValue 109.9 126.8 202.5 367.29 372.40 357.56 465.35 281.93 in % of Total M CIF 23.31 21.44 26.28 31.29 28.67 0.25 0.24 0.27 % change of value 37.39 15.40 59.72 81.35 -1.25 -0.04 0.27 Volume (tons) 17,506 20,803 31,551 39,860 53,136 43,076 50,523.71 32,172.92 % change of volume 40.13 18.83 51.67 26.33 0.33 -0.19 26.75%Unit value (US$/kg) 6.28 6.10 6.42 9.21 7.01 8.30 9.21 8.76 % change of unit value -1.96 -2.89 5.31 43.55 -5.89 0.18 -0%II. Intermediate goodsValue 111.16 146.15 189.91 323.87 332.46 381.97 526.55 285.64 in % of Total M CIF 23.58 24.71 24.64 27.59 24.75 0.27 27% 27% % change of value 40.35 31.48 29.94 70.54 -3.31 0.15 63%
Volume (tons) 154,363 206,831 274,574 367,938 408,677 481,644 609,175.67 363,369.37
% change of volume 43.31 33.99 32.75 34.00 124.87 0.18 66%Unit value (US$/kg) 0.72 0.71 0.69 0.88 0.81 0.79 0.86 0.79 % change of unit value -2.06 -1.88 -2.12 27.26 -16.66 -0.03 -1.80%III . Energy productsValue 78.16 108.56 115.65 161.49 177.97 210.84 345.57 167.96 in % of Total M CIF 16.58 18.36 15.01 13.76 16.50 0.15 18% 16% % change of value 13.88 38.90 6.53 39.63 29.28 0.18 114%
Volume (tons) 128,819 172,818 183,252 186,722 189,347 195,785 220,493.31 121,687.58
% change of volume 4.49 34.16 6.04 1.89 0.01 0.03 18%Unit value (US$/kg) 0.61 0.63 0.63 0.86 0.94 1.08 1.57 1.38 % change of unit value 8.99 3.53 0.46 37.04 68.67 0.15 81%IV. Consumer goodsValue 131.17 166.54 229.10 284.08 363.99 439.01 553.11 267.79 in % of Total M CIF 27.83 28.16 29.73 24.20 27.06 0.32 28% 25% % change of value 28.02 26.97 37.56 24.00 20.52 0.21 95%
Volume (tons) 120,855 173,743 285,259 253,662 359,314 468,472 453,195.56 247,905.55
% change of volume 10.66 43.76 64.18 -11.08 117.46 0.30 79%Unit value (US$/kg) 1.09 0.96 0.80 1.12 1.01 0.94 1.22 1.08 % change of unit value 15.68 -11.68 -16.22 39.45 -10.42 -0.07 9%1. FoodValue 35.26 47.93 71.76 87.07 122.72 154.18 207.63 107.75 in % of Total M CIF 7.48 8.10 9.31 7.42 9.16 0.11 11% 10% % change of value 6.33 35.91 49.74 21.33 33.07 0.26 138%
Volume (tons) 79,854 122,832 223,979 172,073 265,599 372,488 343,935.87 186,016.50
% change of volume 5.43 53.82 82.35 -23.17 111.84 0.40 100%Unit value (US$/kg) 0.44 0.39 0.32 0.51 0.46 0.41 0.60 0.58 % change of unit value 0.86 -11.65 -17.88 57.93 -9.53 -0.10 19%

182
APPENDICES
BNR
RWANDA’S IMPORTS Appendice 21 (Cont’d)(Value in USD million)
2005 2006 2007 2008 2009 2010 2011 Prov end June 2012
2.Others consummer goodsValue 95.91 118.62 157.34 197.01 241.27 284.83 345.48 160.03 in % of Total M CIF 20.34 20.06 20.42 16.78 17.90 0.21 18% 15% % change of value 38.40 23.68 32.64 25.22 14.98 0.18 75%
Volume (tons) 41,001 50,911 61,280 81,589 93,715 95,985 109,259.69 61,889.05
% change of volume 22.52 24.17 20.37 33.14 134.97 0.02 34%Unit value (US$/kg) 2.34 2.33 2.57 2.41 2.57 2.97 3.16 2.59 % change of unit value 12.96 -0.39 10.20 -5.95 0.07 0.15 31%S/TOTAL 430.37 548.06 737.19 1136.73 1246.81 1389.38 1,890.58 1,003.31 Var en % 30.31 27.35 34.51 54.20 10% 11% 66%V. Ajustment Valeur 41.03 43.32 33.46 37.24 61.64 41.66 60.98 50.69 in % of Total M CIF 8.70 7.32 4.34 3.17 0.05 0.03 3% 5%electricity 5.57 11.00 12.10 2.29 2.28 2.85 0.19 0.04 En % de val cif totale 1.18 1.86 1.57 0.19 0.00 0.00 0.0% 0.0%Parcel post 1.36 1.36 1.36 0.06Autres (dont) 34.1 31.0 20.0 34.89 59.35 38.81 60.79 50.65 126 BIS 34.1 22.4 11.0 11.49 13.50 in % of Total M CIF 7.23 3.79 2.58 3.18 Oil purchased in the aeport 3.62 3.50 0.94 2.22 3.72 12.89 9.76 Reexport non included -- 12.7 11.00 43.82 27.10 35.90 46.29 39.49 Embassies’ imports -7.75 -5.50 -21.36 -18.97 -22.04 -21.90 -9.08 ICBT 23.52 21.23 23.51 10.48 Imports of TIGO 55 14.20 - in % of Total M CIFVI. Import cif 471.40 591.38 770.65 1173.98 1308.45 1431.04 1,951.56 1,054.00 % change 28.17 25.45 30.31 52.34 0.11VII. Freight and insurance 117.76 144.98 189.49 293.26 311.45 347.07 472.67 200.96 In % du CIf 24.98 24.98 24.98 24.98 24.98 24.98 20.03% change of ratio 0.00 0.00 0.00 0.00 0VIII.Total fob 353.64 446.40 581.16 880.72 997.00 1083.97 1,478.89 853.04 % change 28.17 26.23 30.19 51.54 13% 9% 36%
Source : BNR

183
APPENDICES
BNR
SERVICES AND INCOME Appendice 22(In USD million)
SERVICES 2007 2008 2009 2010 2011Prov June 2012
Services and income (net) -140.38 -135.67 -218.41 -292.06 -315.61 -124.41Services (net) -123.16 -100.60 -181.62 -246.22 -263.45 -87.35 Credit 240.63 419.86 341.05 310.36 354.97 207.58 Freight and insurance 5.23 5.15 4.61 4.77 3.38 1.71 Other transportation 24.58 37.74 49.04 21.68 18.51 31.44 Travel 151.63 186.00 174.46 201.65 251.80 128.30 Others services 59.19 190.97 112.94 82.26 81.28 46.13 - Operating cost of embassies 39.99 81.87 92.14 65.97 31.25 28.46 - privates (incl: post, communicat, ICT…) 19.19 109.10 20.81 16.30 50.03 17.66 Debit -363.79 -520.46 -522.66 -556.57 -618.41 -294.93 Freight and insurance -134.53 -208.21 -246.05 -293.68 -352.25 -142.68 Other transportation -50.50 -75.75 -76.03 -43.19 -52.96 -37.96 Travel -46.66 -69.99 -71.83 -77.01 -39.00 -48.03 Operating cost of embassies -29.59 -17.90 -15.45 -17.80 -17.80 -9.97 Technical assistance -71.95 -106.69 -78.96 -96.54 -56.02 -37.10 technical assistance (PIP) -45.17 -79.12 -50.00 -71.41 -10.27 -23.28 technical assistance (humanitarian aids) -26.78 -27.58 -28.96 -25.13 -45.75 -13.82 Other private services (incl: post, ICT, Communicat.) -30.55 -41.91 -34.35 -28.36 -100.38 -19.18Income (net) -17.22 -35.06 -36.79 -45.85 -52.16 -37.06 Credit 25.44 28.27 14.91 12.81 34.20 5.50Investment income 21.35 23.72 10.42 7.86 12.01 2.82 - Official investment(BNR) 19.90 20.00 8.45 6.12 9.02 2.82 - Banks investment 1.46 1.78 1.89 1.73 0.69 - Dividends 0.00 1.94 0.08 0.01 2.30Labor services income 4.09 4.49 4.49 4.94 22.17 2.65Property income 0.00 0.05 0.00 0.01 0.02 0.02 Debit -42.66 -63.33 -51.71 -58.65 -86.36 -42.56 Income paid on directs investments -9.29 -16.42 -4.66 -3.74 -12.10 -0.38 1. Dividendes -9.29 -15.36 -4.66 -3.74 -12.10 -0.38 2. Interest paid or reinvested on private invstments 0.00 -1.06 0.00 0.00 0.00 Income paid on others investments -7.33 -7.74 -9.41 -11.97 -13.07 -8.34 Public sectorl -6.18 -6.93 -7.27 -7.83 -8.11 -3.85 - Interest due on public external debt -6.15 -6.88 -7.06 -7.83 -8.11 -3.85 - Interest due on resccheduling. (consolidated amount: 7/98-5/2001) 0.00 0.00 0.00 0 - Interest due on new public external debt 0.00 0.00 0.00 0 - Interest on IMF debt by BNR -0.03 -0.05 0.00 0.00 0.00 0 - Interest on others debt (BNB) 0.00 0.00 -0.21 0.00 0.00 0 Private sector -1.15 -0.81 -2.15 -4.14 -4.95 -4.49 Labor services Income -25.50 -37.95 -36.40 -42.92 -61.19 -32.98 Property income -0.54 -1.23 -1.23 -0.02 -0.00 -0.85
Source : BNR

184
APPENDICES
BNR
Transfers Appendice 23(In USD million)
2007 2008 2009 2010 2011Prov.June
2012
Current transfers (net) 461.32 518.57 604.02 657.36 886.26 263.46
Current private transfers(net) 98.82 72.61 79.71 90.68 139.01 61.92 Credit 131.17 108.51 122.93 133.80 197.45 96.80 Debit 32.35 35.90 43.22 43.12 58.44 34.88 Remittances from Diaspora 69.48 31.07 53.09 65.07 135.34 50.15 Credit 98.50 63.31 88.13 98.21 166.18 80.65 Debit 29.02 32.24 35.04 33.14 30.84 30.50 Private transfers for churchs and associations 29.34 41.54 26.62 25.61 3.67 11.77 Credit 32.67 45.20 34.80 35.59 31.27 16.15 Debit 3.33 3.67 8.18 9.98 27.60 4.38Current officials transfers (net) 362.50 445.96 524.31 566.68 747.25 201.54 Credit 366.38 450.08 531.67 580.04 757.62 209.52 1. current support net 259.27 339.76 415.84 479.52 628.39 159.40
of which HIPC Initiative 4.50 5.60 5.21 4.53 4.56 2.41 2.Social security benefits 22.19 3. humanitarian aid 107.11 110.32 115.84 100.52 107.03 50.12 a. technical assistance 26.78 27.58 27.62 25.13 26.76 0.00 b. other humanitarian aid 80.33 82.74 82.85 75.39 80.27 50.12Debit (of which contribution to internat. Organ.) -3.88 -4.12 -7.36 -13.36 -10.36 -7.97
Source : BNR

185
APPENDICES
BNR
Capital and Financial account Appendice 24(In USD million)
2007 2008 2009 2010 2011Prov.June 2012
Capital and Financial account balance 196.70 316.12 433.55 499.36 649.71 321.99 Capital Account 92.04 210.06 200.00 285.64 196.66 94.48 Capital transfers 92.04 210.06 200.00 285.64 196.66 94.48 Debt Forgiveness 0.00 0.00 0.00 0.00 0.00 0.00
a. Arrears (principal+interest) 0.00
b. Current service (principal + interest) 0.00 0.00 0.00 0.00 0.00 0.00
c. Principal not yet due forgiven (principal) 0.00
Capital transfers in kind 19.02 0.00
Other capital transfers (dons d’appui au PIP) 92.04 210.06 200.00 285.64 177.65 94.48
a. Capital (projects) 69.03 157.55 150.00 214.23 133.24 71.20
b. technical Assistance 23.01 52.52 50.00 71.41 44.41 23.28
Acquisitions et assignments of non financial assets Financial transactions account 104.67 106.06 226.80 213.72 453.04 227.51 Long Term capital 161.80 194.69 235.29 232.35 438.35 157.34 I. Public sector capital (LT) (net) 80.36 104.75 81.35 51.90 207.23 33.46 Credit 88.66 112.20 88.80 61.71 222.20 42.16 Current 0.00 5.80 0.00 0.00 117.84 0.00
Projects (PIP) 88.66 106.40 88.80 61.71 98.14 42.16
- capital 66.50 79.80 66.60 46.29 73.61 42.16
- technical assistance 22.17 26.60 22.20 15.43 24.54
Drawings on new loans 0.00 0.00 0.00 0.00 0.00 0.00
a. Rescheduling of existing debt 0.00 0.00 0.00 0.00 0.00 0.00
b. Rescheduling of arrears
c. Rescheduling of non due debt
Debit -8.30 -7.45 -7.45 -9.81 -14.97 -8.70 Scheduled amortization -8.30 -7.45 -7.45 -9.81 -14.97 -8.70
Dont a. Principal due cancelled 0.00
b. Principal due rescheduled 0.00
Pcpl non due rescheduled 0.00
Pcpl non due cancelled 0.00
Souscript. au cap. des org.inter. non monétaires 0.00 0.00 0.00 0.00 0.00 0.00
MDRI relief from IDA and AfDF
II. Private (net) 81.43 89.94 153.94 180.45 231.12 123.88 Lt. Debt 3.4 9.5 42.72 129.02 148.78 73.93
Amortization -4.2 -4.1 -7.45 -12.29 (55.16) -26.74
Investments 82.28 84.56 118.67 63.71 137.50 76.68
a. direct investment 82.28 103.35 118.67 42.33 106.21 76.68
b. portofolio investment 0.00 -18.79 0 21.38 31.29 0.00
III. Other capital -57.13 -88.63 -8.49 -18.63 14.69 70.18 Short term capiatl -57.13 -88.63 -8.49 -18.63 14.69 70.18
a. Commercial Credits 37.5 -0.6 1.02 9.86 0.00 0.00
b. Commercial banks (Change in NFA of comm banks)(-aug) -9.43 -15.62 -9.51 -28.49 -35.31 70.18
c. Other capitl -85.20 -72.41 0.00 0.00 50.00 0.00
Source : BNR

186
APPENDICES
BNR
AVAILABLE FINANCING Appendice 25(In USD million)
2008 2009 2010 2011Prov.June 2012
Financing (- increase) -54.3 -57.0 -72.1 -234.5 195.5
Change in net foreign assets of NBR (increase -) -54.3 -57.0 -72.1 -234.5 195.5 a.Net use of IMF credit (increase +) 3.7 3.56 0.00 -0.2 0.0 1. disbursements/purchases 3.7 3.56 0.00 0.37 0.0 2. repayments/repurchases 0.0 0.0 0.0 -0.6 0.0 b.Change in gross reserves (increase -) -58.7 -159.5 -69.1 -251.8 190.6 c.Change in other foreign liabilities (increase +) 0.67 102.47 -2.99 17.5 4.9Change in arrears (decrease -) 0.0 0.0 0.0 0.00 0.0 Accumulation 0.0 0.0 0.0 0.0 0.0 Cancellation ( Kow Funds) 0.0 0.0 0.0 0.0 0.0 : other bilateral 0.0 0.0 0.0 0.0 0.0Exceptional financing 0.0 0.0 0.0 0.00 0.00 Rescheduling 0.0 0.0 0.0 0.00 0.00 Stock of Arrears (Fonds Kow) 0.0 0 0 0.0 0.0 Current debt service (bilatéraux:Paris club et Fonds Kow): 0.0 0.0 0.0 0.0 0.0 Current debt service (OPEC) 0.0 0.0 0.0 0.0 0.0 Cancellation 0.0 0.0 0.0 0.0 0.0 Stock of Arrears 0.0 0.0 0.0 0.0 0.0 Current Debt service 0.0 0.0 0.0 0.0 0.0
Source : BNR


188
Activities report January - June 2012
BNR
Paul VI Avenue, P.O Box 531 Kigali, RwandaTel.: +250 (0) 252574282, Fax: +250 (0) 252577391
E-mail: [email protected]: BNRWRWRW