No. Farm Registration Number Name of Farm Location ... - BFAR
Upload
khangminh22Category
view
2download
0
Improving firm–farm relationship in wheat production in Rwanda: Case of
wheat farmers cooperatives of Nyaruguru District and UNICOOPAGI
A Research project Submitted to Larenstein University of Applied Sciences in
Partial Fulfilment of the Requirements for the Degree of Master of Development,
specialization Rural Development and Food Security
By
Nelson Muhayimana
September 2012
Wageningen, the Netherlands
© Copyright Nelson Muhayimana, 2012 All rights reserved

i
ACKNOWLEDGEMENTS
First of all, I would like to thank God for allowing me this opportunity to carry out this study.
Likewise, I give thanks to Nuffic, which made my study possible through the provision of funds.
I wish to convey my gratitude to all the lecturers of Van Hall Larenstein and fellow students
particularly my colleagues from Rwanda for the assistance and encouragement during my
studies.
I would also like to express my sincere thanks to my course coordinator Mr Hesselink Eddy and
all Management of Development (MOD) staff for the role they undertook in the whole course.
I’m very grateful to my Supervisor Mr Marco Verschuur for his commitment in guiding during the
writing of this report. Without him this thesis would have not been produced up to this standard.
My thanks go to the district of Nyaruguru; my working organisation for supporting me technically
and financially during my data collection period. My thanks go also to CID and Agriprofocus
specifically Agriprofocus Rwanda for their financial and technical assistances in my field work. I
finally convey my thanks to wheat farmers of KIAKI and staff of UNICOOPAGI, for providing
valuable information that constitute the backbone of this research.
It also gives me a lot of pleasure to thank my entire family for their enormous close support
during the whole study period. Thanks so much may God bless all of you abundantly.
ii
DEDICATION
To my Wife
To my Kids
I dedicate my thesis
iii
TABLE OF CONTENTS
ACKNOWLEDGEMENTS ............................................................................................................ i
DEDICATION .............................................................................................................................. ii
TABLE OF CONTENTS ............................................................................................................. iii
LIST OF TABLES ....................................................................................................................... vi
LIST OF FIGURES ................................................................................................................... vii
LIST OF MAPS ......................................................................................................................... vii
LIST OF PHOTOS .................................................................................................................... vii
ABBREVIATIONS .................................................................................................................... viii
ABSTRACT ................................................................................................................................. x
1. INTRODUCTION ................................................................................................................... 1
1.1. Background ..................................................................................................................... 1
1.2. Problem statement .......................................................................................................... 3
1.3. Justification of study ........................................................................................................ 4
1.4. Research Objective ......................................................................................................... 5
1.5. Research question ........................................................................................................... 5
1.6. Limitation of the study ...................................................................................................... 6
1.7. Conceptual framework ..................................................................................................... 6
1.8. Concepts definition .......................................................................................................... 7
2. LITERATURE REVIEW .......................................................................................................... 8
2.1. Firm-farm contract and production ................................................................................... 8
2.2. Firm-farm and food security ............................................................................................. 9
2.3. Different types of contracts .............................................................................................. 9
2.4. Contract challenges ........................................................................................................10
2.5. Firm -farm contract in Rwanda ........................................................................................13
2.6. Wheat sector in Rwanda .................................................................................................14
iv
2.6.1. General overview of Agriculture in Rwanda ..............................................................14
2.6.2. Wheat production in Rwanda ...................................................................................15
2.6.3. Wheat competitiveness with other crops and its price ..............................................16
2.6.4. Wheat Stakeholders in Rwanda ...............................................................................17
2.5.5. Constraints and opportunities in wheat production in Rwanda ..................................20
3. METHODOLOGY ..................................................................................................................22
3.1 .Study area ......................................................................................................................22
3.2. Description of the research area .....................................................................................22
3.3. Research strategy ..........................................................................................................23
3.4. Methodology to collect data ............................................................................................23
3.4. 1. Methodology to collect secondary data .......................................................................23
3.4.2. Methodology to collect primary data ............................................................................23
4. UNICOOPAGI AND KIAKI COOPERATIVE ..........................................................................26
4. 1. Business case description .............................................................................................27
4.1.1. Access to inputs .......................................................................................................27
4.1.2. Production and yield .................................................................................................27
4.1.3. Functioning of cooperative (KIAKI) ...........................................................................28
4.1.4. Functioning of UNICOOPAGI ...................................................................................29
4.1.5. Contract between UNICOOPAGI and KIAKI .............................................................30
4.1.6. Post- harvest facilities and quality management .......................................................31
4.1.7. Commercial relations ...............................................................................................32
4.1.8. Stakeholder network and collaboration .....................................................................34
4.1.9. Perspectives and SWOT analysis between UNICOOPAGI and KIAKI ......................36
4. 2. Survey results ................................................................................................................38
4.2.1. Access to inputs .......................................................................................................38
4.2.2. Production and yield .................................................................................................40
v
4.2.3. Functioning of KIAKI (cooperative) ...........................................................................42
4.2.4. Functioning of UNICOOPAGI .................................................................................43
4.2.5. Contract between UNICOOPAGI and KIAKI .............................................................45
4.2.6. Post-harvest facilities and quality management ........................................................47
4.2.7. Commercial relations ...............................................................................................50
4.2.8. Stakeholder network and collaboration .....................................................................52
4.2.9. Perspectives ............................................................................................................54
4.3. Debriefing results ............................................................................................................56
5. DISCUSSION AND INTERPRETATION OF RESULTS ........................................................62
5.1. Access to inputs .............................................................................................................62
5.2. Production and yields .....................................................................................................63
5.3. Functioning of KIAKI cooperative ....................................................................................64
5.4. Functioning of UNICOOPAGI .........................................................................................65
5.5. Contract between UNICOOPAGI and KIAKI ...................................................................66
5.6. Post- harvest facilities and quality management .............................................................67
5.7. Commercial relations ......................................................................................................68
5.8. Stakeholder network and collaborations .........................................................................69
5.9. Perspectives ...................................................................................................................70
5.10. Firm–farm relationships and food security ....................................................................71
5.11. Main indicators of the strong relationships between UNICOOPAGI and KIAKI .............71
5.12: Remarks on 2-2 tango tool ...........................................................................................72
6. CONCLUSION AND RECOMMENDATION .........................................................................73
6.1. Conclusion ......................................................................................................................73
6.2. Recommendations ..........................................................................................................75
References ...............................................................................................................................78
Annex 1: Business Case Features; interview with farmer organization .....................................81
vi
Annex2: questionnaire ..............................................................................................................88
LIST OF TABLES
Table 2.1: Rights and obligations of farmers and firms in smallholder contracts ........................ 11
Table 2.2: Different productions of crops in tons from 2005-2011in Rwanda ........................... 155
Table 3.4.1:Number respondent by activity in field work ............................................................ 24
Table 4 4.1:Value share of wheat chain ..................................... Error! Bookmark not defined.3
Table 4.1.2: SWOT analysis of the business case between UNICOOPAGI and KIAKI ............ 377
Table 4.2.1: Statements in accessibility to inputs ......................................................................38
Table 4.2.2: Statements in production and yield ........................................................................40
Table 4.2.3: Statements in functioning of KIAKI ........................................................................42
Table 4.2.4: Statements in the functioning of UNICOOPAGI .....................................................44
Table 4.2.5: Statements in contract between UNICOOPAGI and KIAKI ....................................46
Table 4.2.6: Statements in post-harvest activities and quality management ..............................48
Table 4.2.7: Statements in commercial relations .......................................................................50
Table 4.2.8: Statements in stakeholders’ network and collaboration .........................................52
Table 4.2.9: Statements in perspectives....................................................................................54
Table 4.3.1: Action for improving firm farm relationships between KIAKI and UNICOOPAGI ....56
Table 5.1 Main indicators of strong relationships between UNICOOPAGI and KIAKI ............. 723
vii
LIST OF FIGURES
Figure 1.1: Causal diagram firm farm relationships in wheat production .................................... 4
Figure 1. 2: Operationalization of the concepts .......................................................................... 6
Figure 2.1: Areas covered by different crops in Rwanda from 2000-2010 ............................... 166
Figure 2.2: Wheat value chain map in RWANDA .................................................................... 199
Figure 3.3.1: Research framework .......................................................................................... 266
Figure 4.1.1: Wheat value chain UNICOOPAGI and KIAKI ..................................................... 366
Figure 4.2.1: Average score per statement on accessibility to inputs ........................................39
Figure 4.2.2: Level of agreement on accessibility to inputs .......................................................39
Figure 4.2.3: Average score by statements on production and yield ..........................................41
Figure 4.2.4: Level of agreement on production and yields .......................................................41
Figure 4.2.5: Average score per statement on functioning of KIAKI cooperative ....................... 43
Figure 4.2.6: Level of agreement on the functioning KIAKI ........................................................43
Figure 4.2.7: Average score per statement on functioning of UNICOOAGAI. ............................44
Figure 4.2.8: Level of agreement on the functioning of UNICOOAGAI. .....................................45
Figure 4.2.9: Average score per statement contact between KIAKI and UNICOOPAGI ............46
Figure 4.2.10: Level of agreement on contract between KIAKI and UNICOOPAGI ...................47
Figure 4.2.11: Average score per statement on post harvest activities and quality management
.................................................................................................................................................48
Figure 4.2.12: Level of agreement per statement on past harvest facilities and quality
management .............................................................................................................................49
Figure 4.2.13. Average score per statement on commercial relations .......................................51
Figure 4.2.14: Level of agreement in commercial relations .......................................................51
Figure 4.2.15: Average score per statement in stakeholders’ network and collaboration ...........53
Figure 4.2.16: Level of agreement in stakeholder network and collaboration ............................53
Figure 4.2.17: Average score per statement on perspectives ....................................................55
Figure 4.2.18: Level of agreement on perspectives ...................................................................55
LIST OF MAPS
Map 3.1: Nyaruguru District Map ........................................................................................................... 22
LIST OF PHOTOS
Photo 4.1.1: Traditional post-harvest facilities and modern thresher and winnower ..................... 32
Photos 4.1 2: Adequate storage and testing the quality by eyes at wheat selling point ............... 32
viii
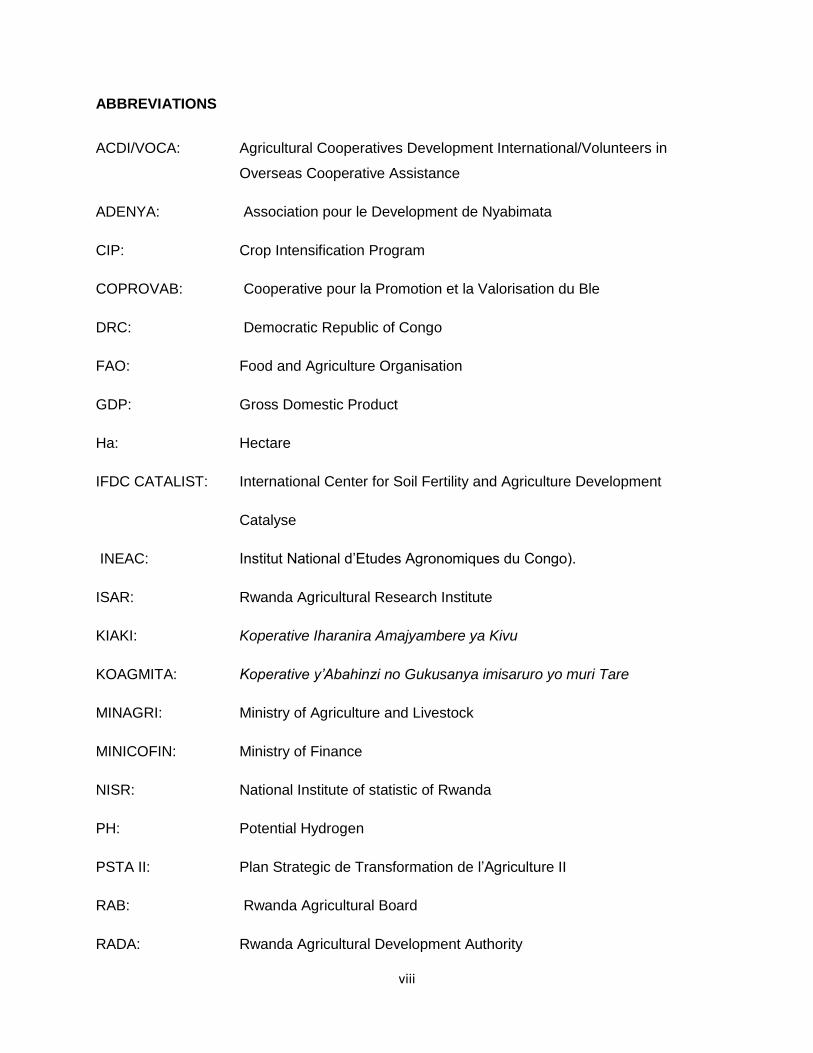
ABBREVIATIONS
ACDI/VOCA: Agricultural Cooperatives Development International/Volunteers in
Overseas Cooperative Assistance
ADENYA: Association pour le Development de Nyabimata
CIP: Crop Intensification Program
COPROVAB: Cooperative pour la Promotion et la Valorisation du Ble
DRC: Democratic Republic of Congo
FAO: Food and Agriculture Organisation
GDP: Gross Domestic Product
Ha: Hectare
IFDC CATALIST: International Center for Soil Fertility and Agriculture Development
Catalyse
INEAC: Institut National d’Etudes Agronomiques du Congo).
ISAR: Rwanda Agricultural Research Institute
KIAKI: Koperative Iharanira Amajyambere ya Kivu
KOAGMITA: Koperative y’Abahinzi no Gukusanya imisaruro yo muri Tare
MINAGRI: Ministry of Agriculture and Livestock
MINICOFIN: Ministry of Finance
NISR: National Institute of statistic of Rwanda
PH: Potential Hydrogen
PSTA II: Plan Strategic de Transformation de l’Agriculture II
RAB: Rwanda Agricultural Board
RADA: Rwanda Agricultural Development Authority
ix
RIM: Reseau Indocesain de Microfinance
RIU: Research into Use
ROPORWA: Reseaux des Organisation Paysans
RSSP: Rural Sector Support Project
SACCO: Saving Credit Cooperatives
SOPAV: Societé de Production d’Aliments de Vegetaux
UNICOOBLE: Union Cooperatives de Ble
UNICOOPAGI: Union des cooperatives Agricoles Integrées
USAID: United States Agency for International Development
USD: United States Dollars

x
ABSTRACT
Wheat is one of main source of energy in Nyaruguru district where it is daily consumed in
different ways by households. It is actually promoted in ten districts where it constitutes a major
staple food. Individual and organized farmers in cooperatives and union are involved in wheat
production, processing and selling. Despite subsidy provided by Government, the supply is still
low and cannot meet the demand.
The objective of this study was to contribute to an improvement of cooperation between wheat
farmers’ cooperatives and UNICOOPAGI through investigation of their current relationships in
order to increase the quality and quantity of wheat produced. The research question was “How
can the relationship between wheat cooperative farmers and UNICOOPAGI be improved for
more wheat production and sales in Nyaruguru district?” Eight sub-questions were formulated in
line with the main question. To answer this question, 2-2 tango tool was used to collect and
analyse data. This tool involved three steps: business case description, survey and debriefing
meeting. Eight respondents were interviewed from KIAKI and UNICOOPAGI in developing a
business case, 31 from both sides were respondents in survey and 16 were participants in
debriefing meeting.
The results indicate poor relationships between KIAKI and UNICOOPAGI in accessibility to
inputs and post-harvest facilities. Lime, fertilizers, improved seeds are not available in the area
and its prices are not affordable to farmers. Farmers are still practicing traditional ways in post-
harvest activities and quality management which lead to low quality of wheat. Wheat production
was low and few stakeholders involved in wheat production have moderate relationships
between UNICOOPAGI and wheat farmers. KIAKI cooperative and UNICOOPAGI are well-
functioning and respect their contracts of buying farmers’ produce at negotiated price. Wheat
revenues are invested income generating activities which contribute to a sustainable food
security in households.
KIAKI’s members and UNICOOPAGI plans to improve their relationships by putting in place a
shop for input agricultural especially lime and also renovate their stock shed. Farmers are willing
to apply the recommended agricultural practices in order to multiply and conserve improved
seeds. KIAKI and UNICOOPAGI together want to improve their relationships in post-harvest
facilities by using modern thresher and winnowers and installation of small milling factory in the
area.
1
1. INTRODUCTION
1.1. Background
Rwanda is situated in East Africa, surrounded by Tanzania to the east, Democratic Republic of
Congo (DRC) to the west, Burundi to the south, and Uganda to the north. It is 26,336 square
kilometres, its population is estimated at 11 million people, and the density is about 395 persons
per square kilometre (MINALOC, 2011). Growth rate is 2.8% per annual and the population is
expected to increase to about 12 million by 2015(NISR, 2011). Rwanda ranks among the
poorest countries worldwide with 34% undernourished, and over 65% of the population living
from less than one USD per day, (FAO, 2010). The Rwandan economy is strongly based on
agriculture which provides 87% of jobs and 80 % of all exports (MINIGRI, 2009). The available
arable land for agriculture is 2,294,380 hectares but around 1,750,000 hectares are actually
exploited (NISR, 2011).
According to the Ministry of Agriculture (2010), agriculture is indeed considered as the
backbone of the Rwandan economy and contributes 41% of GDP, while employing over 75% of
the population engaged in mainly subsistence agriculture. Before 2007, crops were produced
especially for home consumption; less quantity reached the market due to lack of improved
seed and fertilisers, insufficient technical assistance in cropping system, soil highly degraded by
erosion and lack of adequate policies in Agriculture. To overcome the above problems the
government of Rwanda has developed different national policy:
The prospective long term vision 2020 for Rwanda
The national Poverty Reduction Strategy and its successors , the Economic
Development and Poverty Strategy both adopted by all development partners
The National Investment Strategy.
Sector policies and strategies covering different priority areas(MINAGRI,2009)
In Agriculture, different policies and strategies were developed such as policies on fertilizers
distributions, on seeds improvement such distribution of new varieties, on erosion control such
bench terraces, on post-harvest and on agribusiness. The development and implementation of
these policies are done through different programs such as Crop Intensification Program (CIP).
The latter is an agricultural development project launched by MINAGRI in 2007, as a pilot
program with the main goals of increasing agricultural productivity in high-potential food crops
and ensuring food security for all and self-sufficiency (MINAGRI, 2007). Wheat one of the focus
of CIP, had its production multiplied by 3.7 from 2007 to 2011 and at the same time wheat
2
plantation area also multiplied by 3. However the productivity was still low (1.1t/ha) compare to
3,5t/ha expected (NISR, 2011). Despite the efforts done of the Rwandan government in
increasing wheat production, it is still low and cannot satisfy the demand of the market. The
import of wheat is still high for instance: 10,288 tons of wheat was imported in 2011and a large
quantity of wheat estimated at 71,396 tons was reported by MINAGRI (2011) as deficit to meet
the market demand. As the growth rate of the population is 2.8 % by annual, the need of wheat
will continuously increase in the future.
Wheat is produced generally by individuals farmers or by groups, associations and cooperatives
of famers and about 25000 farmers are organised in wheat cooperatives. These farmers
actually cultivate 10% of arable land favourable to wheat in Rwanda estimated at 501200
hectares (MINAGRI, 2011). Some wheat farmers have contracts with Rwanda Agriculture Board
Authority (RAB) in wheat seed production, while others produce for processors and traders most
of the time with informal contract. One of the companies involved in wheat production and
working closely with CIP program is UNICOOPAGI (Union des Cooperatives Agricoles
Intregrees).
The latter had got contract with RADA for providing technical support, distributing fertilizer,
seeds and at the same time buying wheat produced by 15000 farmers organized in different
cooperatives located in Nyaruguru and Nyamagabe district (Mutijima, 2007). The UNICOOPAGI
provides credits to wheat farmers via its microfinance called Twizigamire and buy wheat
farmers’ produces. In 2011 the UNICOOPAGI reported that less than 150 tons of wheat has
been bought on 300 tons of wheat planned to be bought (Nyaruguru, 2011).
On the other hand the government through the Ministry of Trade and Industry promote the
agribusiness in Rwanda by introducing facilities to new investors in different sectors especially
in Agriculture. Small and large firm processors have emerged recently in wheat processing and
trading such as PEMBE, BATHRESA with milling of capacity 400 and 200 tons a day
respectively. These firms started their activities in Gicumbi district and in Kigali town but still
work below their capacity (MINICOM, 2011).
Most of wheat grain used by these enterprises is imported from outside the country because of
the low volume and low quality of wheat produced in Rwanda. Processors and traders almost
use only imported grain or wheat flour at high price which lead them to work below their capacity
estimated at 30% and cannot satisfy the market demand (MINAGRI, 2011). Different
organizations such as Agriprofucus Rwanda among others had started to diagnose the
3
feasibility of entrepreneurship for both farmers and different companies involved in cultivation,
processing and selling for different crops in Rwanda with the objective of linking farmers with
firms and taking them to improved market of their produce.
1.2. Problem statement
The agreement between farmers and firms is most of time based on quantity, standard quality
and the price. The price is often fixed before production of the crops and meeting these
requirements has been always a challenge to farmers. Wheat cooperative farmers of Nyaruguru
district are facing a big challenge of low quanltity and quality of wheat produced and do not
meet the requirement of the UNICOOPAGI due to inadequate use of input, inadequate
conducive climate and high loss in post-harvest activities. About 14, 5% of production is lost in
threshing, winnowing and drying because they still practice the traditional facilities (Terpend,
Kayumba and Ntaganda, 2007).
The unfavourable relationship between wheat cooperative farmers of Nyaruguru district and
UNICOOPAGI especially in price making is also a challenge (USAID, 2010). Because of this,
wheat farmers are unmotivated by the low price offered by UNICOOPAGI and some of them
decide to sell their products to local market with a high transaction cost. At the same time
UNICOOPAGI complains that wheat cooperative farmers mix varieties and low volume of wheat
delivered by farmers contains a high level of impurities and is insufficient dried with a high
moisture contents of 17-18 % (MINAGRI, 2011).
The strong cooperation between wheat cooperative farmers of Nyaruguru district and
UNICOOPAGI can be one of the solutions which can contribute to an increase of quantity and
quality of wheat in Rwanda. There are only few studies being done regarding firm- farm
relationships in wheat production in Rwanda, hence there is low volume and quality of wheat
production among other cereals in Rwanda. Therefore there is a need for Agriprofocus Rwanda
to conduct an investigation of firm-farm relationship in wheat production in order to come up
with mitigating recommendations to reverse the trends.
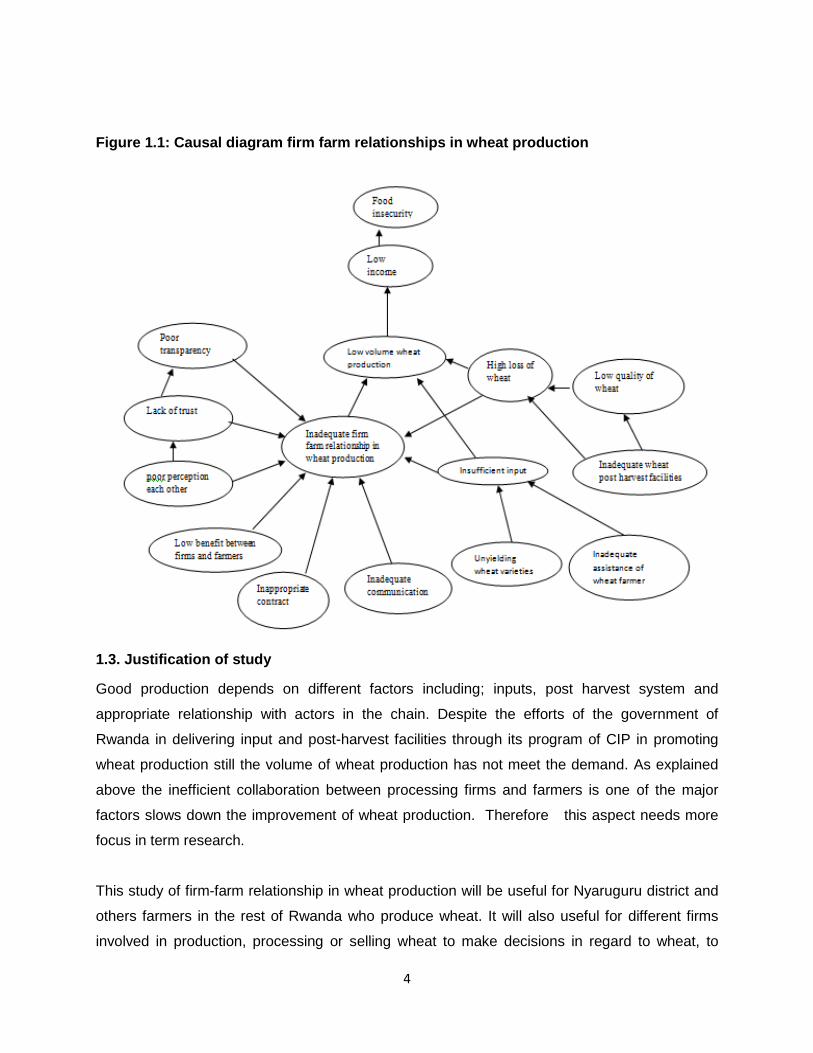
4
Figure 1.1: Causal diagram firm farm relationships in wheat production
1.3. Justification of study
Good production depends on different factors including; inputs, post harvest system and
appropriate relationship with actors in the chain. Despite the efforts of the government of
Rwanda in delivering input and post-harvest facilities through its program of CIP in promoting
wheat production still the volume of wheat production has not meet the demand. As explained
above the inefficient collaboration between processing firms and farmers is one of the major
factors slows down the improvement of wheat production. Therefore this aspect needs more
focus in term research.
This study of firm-farm relationship in wheat production will be useful for Nyaruguru district and
others farmers in the rest of Rwanda who produce wheat. It will also useful for different firms
involved in production, processing or selling wheat to make decisions in regard to wheat, to

5
creating conducive environment between firms and farmers in formulating appropriate strategies
for wheat production sector. This study helps also the development of 2-2 tango tool which is
used in collecting, processing and analysing data. Besides, it will be a beneficial reference for
researchers and other people interested in the same area of study.
1.4. Research Objective
The overall objective of this research is to contribute to an improvement of cooperation between
wheat farmers cooperatives and UNICOOPAGI through investigation of their current
relationships in order to increase the quality and quantity of wheat produced.
1.5. Research question
How can the relationship between wheat cooperative farmers and UNICOOPAGI be improved
for more wheat production and sales in Nyaruguru district?
Sub-questions
1. What are the roles played by wheat cooperatives and UNICOOPAGI in wheat production
in Nyaruguru District?
2. Do farmers understand the functioning of their wheat cooperatives in Nyaruguru District?
3. Do farmers and staff of UNICOOPAGI understand the functioning of the union?
4. Do UNICOOPAGI and wheat cooperatives farmers have a common understanding in
implementation of their contract on wheat production?
5. What are the commercial relations of wheat between UNICOOPAGI and wheat
cooperative farmers?
6. What are the facilitations given to wheat farmers by UNICOOPAGI in post-harvest of
wheat in Nyaruguru district?
7. Do wheat farmers’ cooperatives and UNICOOPAGI collaborate with others stakeholders
involved in wheat production in Nyaruguru District?
8. What are the perspectives for UNICOOPAGI and wheat farmers cooperatives for
improving their relationship
6
1.6. Limitation of the study
Even if the government of Rwanda is putting emphasis on wheat production, this crop was
abandoned and reappeared recently in production. Wheat is also limited to few districts because
of its requirement for specific in climatic conditions for growth. This has led to limited number of
research studies done on this crop hence few information available on it in Rwanda, especially
in the subject of firm-farm relationship. Moreover two large factories involved in wheat
processing Nyungwe mill and SOTIRU have recently closed leading to more loss of information.
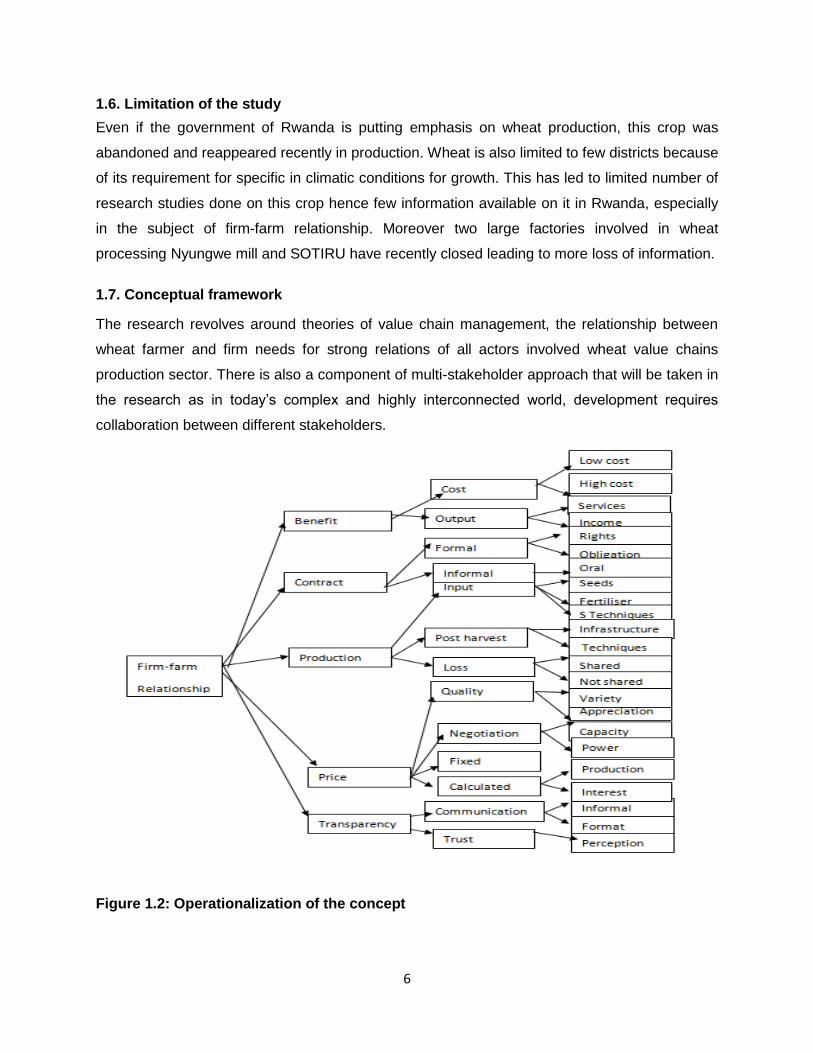
1.7. Conceptual framework
The research revolves around theories of value chain management, the relationship between
wheat farmer and firm needs for strong relations of all actors involved wheat value chains
production sector. There is also a component of multi-stakeholder approach that will be taken in
the research as in today’s complex and highly interconnected world, development requires
collaboration between different stakeholders.
Figure 1.2: Operationalization of the concept
7
1.8. Concepts definition
Firm: For the purpose of this study a firm is a private company or government organization
(cooperatives, processors, sellers) who that buys farmers’ wheat.
Farm: The farm will be used as an area of land that is used for growing wheat in order to sell it
to the firm.
Farmer: In this study wheat farmer is a producer of wheat, member of wheat cooperative who
sells his product to firm with a formal contract or informal contract
Relationships: For the purpose of this study, relationships means the way in which firms and
farmers get connected, feel and behave towards each other in relation with their business.
Contract: “A contractual arrangement between farmers and other firms, whether oral or written,
specifying one or more conditions of production, and one or more conditions of marketing, for an
agricultural product, which is non-transferable” (Prowse, 2012).
Perception: Opinion of wheat farmers or firms toward each other about their relationships in
wheat production and selling.
Transparency: In this study it refers to how wheat farmers and firms share financial activities,
openness without secrets in income repartition in wheat production and the trust and honest
between each other.
Informal contract: It refers to an oral arrangement which wheat farmers sell their product to
firm and the purchase also is done by trust between each other.
Production: The production is the process of either of growing or processing wheat in small
scale and large quantities.
Market: It refers to the total quantity of wheat that a farmer delivers to sell to the company
Price: For the purpose of this paper is the amount of money that the farmer receives for one kg
of grain wheat at home gate or at firm gate.
Quality standards: This is a level of good characteristics of wheat that are agreed on and
acceptable between farmer and the firm.
Benefits: it means the advantages for farmers or firm that are drawn from wheat produced and
sold.
8
2. LITERATURE REVIEW
2.1. Firm-farm contract and production
Different literature understood the firm-farm relationships by contract farming between farm and
firm. Some authors trace the principles of contract farming back to the 19th century, when the
mechanism was used in the United States for processing crops such as sugar beets and
peaches, and in Taiwan, for sugar production under the Japanese colonial rule (Runsten and
Key, 1996; Rehber, 1998; Warning and Hoo, 2000). Contract farming is more common in
developed countries and The United States Department of Agriculture revealed in a recent
report that contracts now govern 36% of the value of US agriculture production, and tends to be
established in developing countries (Da Silva, 2005).
Prowse (2012) mentions that there are significant reasons of instauration of contract farming in
developing countries; greater urbanization, higher incomes and changing food preferences
(towards higher protein and more expensive products) have all played a role in changing
demand for agricultural products, continuous increase of populations. On the supply side, there
are changes in transport and logistics, biotechnology, liberalisation of national and international
markets, improvements in information and communication technology, greater concentration
within agricultural supply chains, the increasing importance of standards and the traceability of
products, have all contributed to the greater prevalence of contracts.
Vellema (2002) argues that contract farming in tropical regions like sub Sahara in Africa can be
seen as an institutionally innovative arrangement; wherein growers’ competence to deal with
new financial, organisational and technological conditions importantly affects whether a scheme
is going to yield improved income and productivity or not. (Ashok, Kavery and Maurice , 2008)
emphasize the above argument by saying that contract farming has offered higher profits and
lower costs to the contract farmers compared with non-contract farmers. In addition to the
assured markets and stable prices afforded farmers, the backward linkages help control
transaction and marketing costs, yielding higher returns to contract farmers. Furthermore, the
proposed firm-farm contract approach involves an examination of co-ordination of productive
practices, conditions for profit sharing, concurrent management styles, division of tasks,
handling of risks and uncertainties in production, and efficacy of prescribed technologies and
available expertise.
9
2.2. Firm-farm and food security
Well-managed contract farming is an effective way to coordinate and promote production and
marketing in agriculture. Contract farming approach had increased the benefit for both farm and
farm in different countries. A study of the project of tomatoes in India done by Eaton and
Shepherd (2001) confirmed that production yields and farmers’ incomes increased as a result of
the use of hybrid seeds and the availability of an assured market. An analysis of the yields and
incomes of the contracted farmers compared with farmers who grew tomatoes for the open
market showed that yields of the farmers under contract were 64 percent higher than those
outside the project.
Prowse (2012) highlights the improvement of production in developing countries; especially in
Southern-Africa, Uganda, Kenya, Tanzania and Zambia where contract farming occupied 21%
of agriculture and increased the availability, accessibility and sustainability of staple food like
maize in Zambia and income from cash crops like coffee and tea in Uganda and Kenya. This
had contributed to food security of rural household. As proposed by Vellema ( 2002) an
adequate contract farming, is a key important in food security and the profitability refers to types
of contact and the capacity of each contractors in price negotiation and also the power for
contractors.
2.3. Different types of contracts
Different types of contracts were defined by many authors and can differ by size of company,
the types of crops, types of organization (government or private), numbers of stakeholders
involved in contract, direct contract and indirect contract and the quantity and quality to produce
in contract. Da silva (2001) and Prowse (2012) outline five different “types” or models of
contract farming and classify them as follow:
Centralized model, where a firm (often a large processor) contracts a large number of farmers,
with strict quality requirements and quantity targets, normally applied for large farm and large
firm.
Nucleus-estate model, where the firm (again, often a processor) enters the production node
through an estate or plantation but also contracts with independent producers (for greater
volumes, or for seed), this model is preferable for perennial crops.
Tripartite model, where a joint venture (between a public entity and a private firm) enters into a
contract with farmers.
10
Informal model, where smaller firms or traders enter into annual agreements, often on a verbal
basis, with a limited number of farmers, frequently for fruit and vegetables that require minimal
processing.
Intermediary model, where the firm sub-contracts interaction with the farmers to an
intermediary, such as a farming committee or a trader. This type of contract is popular and
Hongdong, Robert and Jianhua. (2005) raise it as the most accepted by farmers and show that
“Firm+Cooperative+Farm” appears to be the most desirable way to maintain contracts even
though middlemen and direct “Firm+Farm” contracting are the most common types at present.
Marketing contracts are more common than production contracts for both firms and growers.
Oral contracts are most commonly used by middlemen because of strong social capital and
networks in rural areas.
2.4. Contract challenges
As reported by FAO (2001) the advantages, disadvantages and problems arising from contract
farming will vary according to the physical, social and market environments. More specifically,
the distribution of risks will depend on such factors as the nature of the markets for both the raw
material and the processed product, the availability of alternative earning opportunities for
farmers, and the extent to which relevant technical information is provided to the contracted
farmers. Contracts should in theory specify in detail the rights and obligations between the out
growers and the contracts, including the penalties for breach of contract by either side.
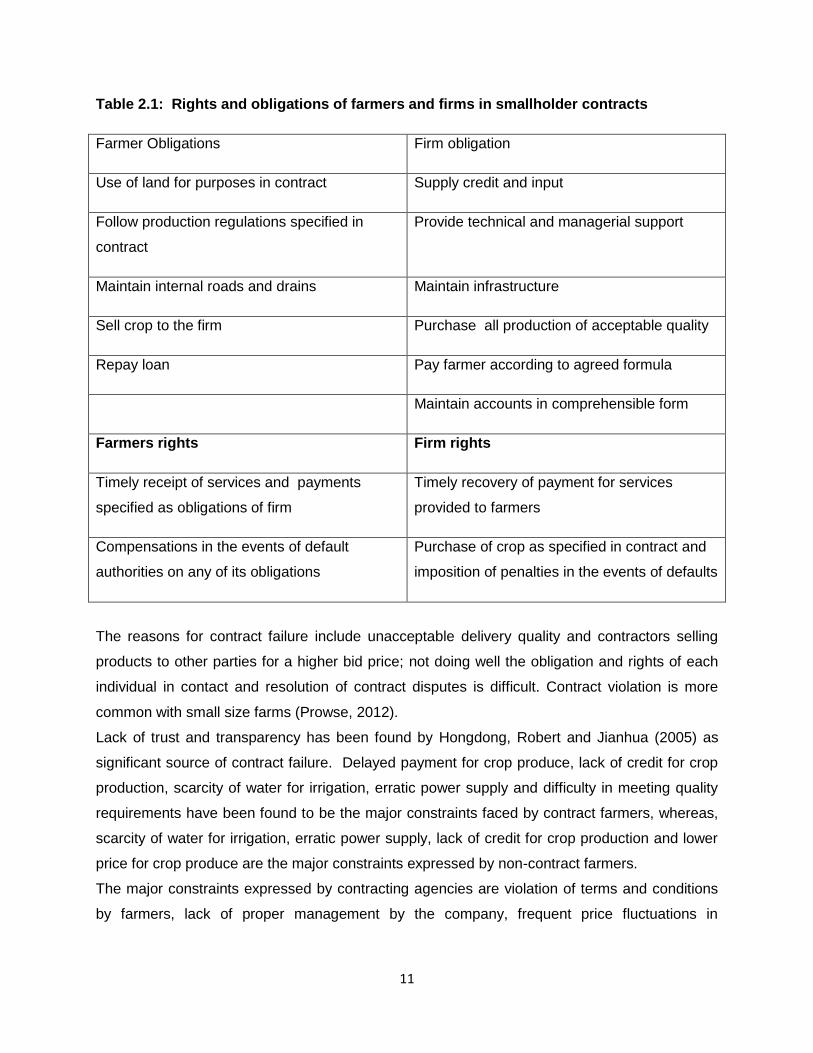
Baumann (2000) outlines in the following table typical rights and obligations in smallholder
contact.
11
Table 2.1: Rights and obligations of farmers and firms in smallholder contracts
Farmer Obligations Firm obligation
Use of land for purposes in contract Supply credit and input
Follow production regulations specified in
contract
Provide technical and managerial support
Maintain internal roads and drains Maintain infrastructure
Sell crop to the firm Purchase all production of acceptable quality
Repay loan Pay farmer according to agreed formula
Maintain accounts in comprehensible form
Farmers rights Firm rights
Timely receipt of services and payments
specified as obligations of firm
Timely recovery of payment for services
provided to farmers
Compensations in the events of default
authorities on any of its obligations
Purchase of crop as specified in contract and
imposition of penalties in the events of defaults
The reasons for contract failure include unacceptable delivery quality and contractors selling
products to other parties for a higher bid price; not doing well the obligation and rights of each
individual in contact and resolution of contract disputes is difficult. Contract violation is more
common with small size farms (Prowse, 2012).
Lack of trust and transparency has been found by Hongdong, Robert and Jianhua (2005) as
significant source of contract failure. Delayed payment for crop produce, lack of credit for crop
production, scarcity of water for irrigation, erratic power supply and difficulty in meeting quality
requirements have been found to be the major constraints faced by contract farmers, whereas,
scarcity of water for irrigation, erratic power supply, lack of credit for crop production and lower
price for crop produce are the major constraints expressed by non-contract farmers.
The major constraints expressed by contracting agencies are violation of terms and conditions
by farmers, lack of proper management by the company, frequent price fluctuations in
12
international markets and scarcity of transport vehicles during peak periods in the way of
expansion of contract farming (Jagdish and Prakash, 2008).
FAO (2001) groups different challenges faced by farmers in contract farming in six categories;
increased risk, Unsuitable technology and crop incompatibility; manipulation of quotas and
quality specifications, corruptions, domination by monopolies and indebtedness and
overreliance on advance. The problems faced by firm or companies have been classified also in
land availability constraints, social and cultural constraints farmers discontent; an extra-
contractual market and input diversion.
Increased risks: Farmers entering new contract farming ventures should be prepared to
balance the prospect of higher returns with the possibility of greater risk. Such risk is more likely
when the agribusiness venture is introducing a new crop to the area. There may be production
risks, particularly where prior field tests are inadequate, resulting in lower-than-expected yields
for the farmers. Market risks may occur when the company's forecasts of market size or price
levels are not accurate. Considerable problems can result if farmers perceive that the company
is unwilling to share any of the risk, even if partly responsible for the losses (Maxwell and
Devereux, 2001; FOA, 2001)
Unsuitable technology and crop incompatibility: The introduction of a new crop to be grown
under conditions rigorously controlled by the companies or firms can cause disruption to the
existing farming system. Innovation should consider the social life of the community and the
practicality or adaptation of farmers. For example a sophisticated machine may affect local
employment in developing countries and overcapitalisation of the contracted farmers. In Europe
the introduction of potato became successful when wheat production became insufficient to feed
a rising population in the pre-industrial period (Den Hartog, Van Staveren and Brouwer, 2006).
Manipulation of quotas and quality specifications: Lack of proper management by the
company may lead to production exceeding original targets. Companies may have unrealistic
expectations of the market for their product or the market may collapse unexpectedly owing to
transport problems, civil unrest, change in government policy or the arrival of a competitor. Such
occurrences can lead managers to reduce farmers' quotas.
In some situations management may be tempted to manipulate quality standards in order to
reduce purchases while appearing to honour the contract (FAO, 2001; Jagdish and Prakash,
2008).
13
Domination by Monopolies: Prowse (2012) argues that a monopoly of a single crop by a
sponsor can have a negative effect. Allowing only one purchaser encourages monopolistic
tendencies, particularly where farmers are locked into a fairly sizeable investment, such as with
tree crops, and cannot easily change to other crops. The greatest abuses do tend to occur when
there are public monopolies, where buying prices are set by the government, or where farmers
have made long-term investments in perennial crops.
In 1999 the Kenya Tea Development Authority experienced serious unrest amongst its growers,
reportedly because of the Authority's inefficient extension services and alleged "manipulation" of
farmers. There was also discontent in Kenya among sugar farmers because the price set by
the government did not change between 1997 and 1999(FAO, 2001).
Indebtedness and overreliance on advances
Most of the time farmers are attracted by the availability of credit provided either directly by the
company or through other partners. But farmers can face considerable indebtedness if they are
confronted with production problems, if the company provides poor technical advice, if there are
significant changes in the market conditions or if the company fails to honour the contract. In
one venture "compassionate" advances for school fees, weddings and even alimony resulted in
many farmers receiving no payments at the end of the season. Dropout rates for farmers in that
particular project were high, as they thought contract farming did not pay (Prowse, 2012).
2.5. Firm -farm contract in Rwanda
FAO (2001) mentioned that contract farming started in Rwanda in cash crops especially tea,
coffee, pyrethrum and sugar cane and mostly between farmers and government organization
and international agencies. Farmers accepted the contract as it was and had no capacity to
bargain the price. The fact that all those cash crops were for export in which government gained
devises; farmers were pushed to cultivate them without any information about the market.
USAID (2010) reports two types of contract farming in Rwanda: informal model, where smaller
firms or traders enter into annual agreements, often on a verbal basis, with a limited number of
farmers, frequently for fruit and vegetables that require minimal processing. The second is an
intermediary model is agreement, where firm sub-contacts interaction with farmers to an
intermediary, such as farming committee, cooperatives of farmers or a trader.
14
The first model is more popular for farmers surrounding the urban cities, mostly done between
fruit and vegetables farmers and middlemen. The second model is likely observed in seed
production for example maize, wheat and cash crops like tea and coffee (RADA, 2011).
2.6. Wheat sector in Rwanda
2.6.1. General overview of Agriculture in Rwanda
Agriculture is a pillar of livelihood of most households in Rwanda. Different crops such cash
crops such as coffee and tea are more grown among others and food crops like cassava,
wheat, beans, maize, Irish potatoes, and rice also cultivated in three crop seasons A, B and C
by year (GoR, 2011). Agriculture faces many challenges; Smallness of farms due to high
population pressure and more than 60% farmers cultivate less than 0.7 ha, 50 % cultivate less
than 0.5 ha and more 25% cultivate less than 0.25 ha (MINIGRI, 2009); low productivity of lands
resulting from excessive use of land and low application of inputs including fertilizers, improved
seeds and pesticides; low level of commercial exchanges in agriculture; absence of well-defined
extension system with clear orientations and suitable for the Country; lack of awareness about
market dynamics by the farmer; difficulties to get access to agricultural credit because of lack
collateral in agriculture; too little academic research whose findings are not extended to the
population(MINAGRI, 2004). Farmers are still using traditional methods and materials in
exploitation of their land which is continuously degraded by erosion from high rainfall observed
especially in high mountainous and hilly area characterising the country.
Different programs were implemented in line of the vision 2020; which is a government strategic
program of 20 years started in 2000 with aim to raise Rwanda among others countries of
average income by 2020. Agriculture has a fundamental place in that vision. In implementation
of that vision 2020 the country to develop some specific program in agriculture sector such as
land use consolidation in reducing the individual plots in exploitation, land conservation for
mitigating high erosion and crops intensification in promoting the selected crops adapted in
specific regions (U.S Government, 2011). As reported by MINAGRI( 2011) the implementation
of these programs had improved the agriculture sector from years 2000-2011 in using fertilizer
from 0.5 kg to 30 kg/ha/annum, practicing modern agriculture from 3% up to 20 % and soil
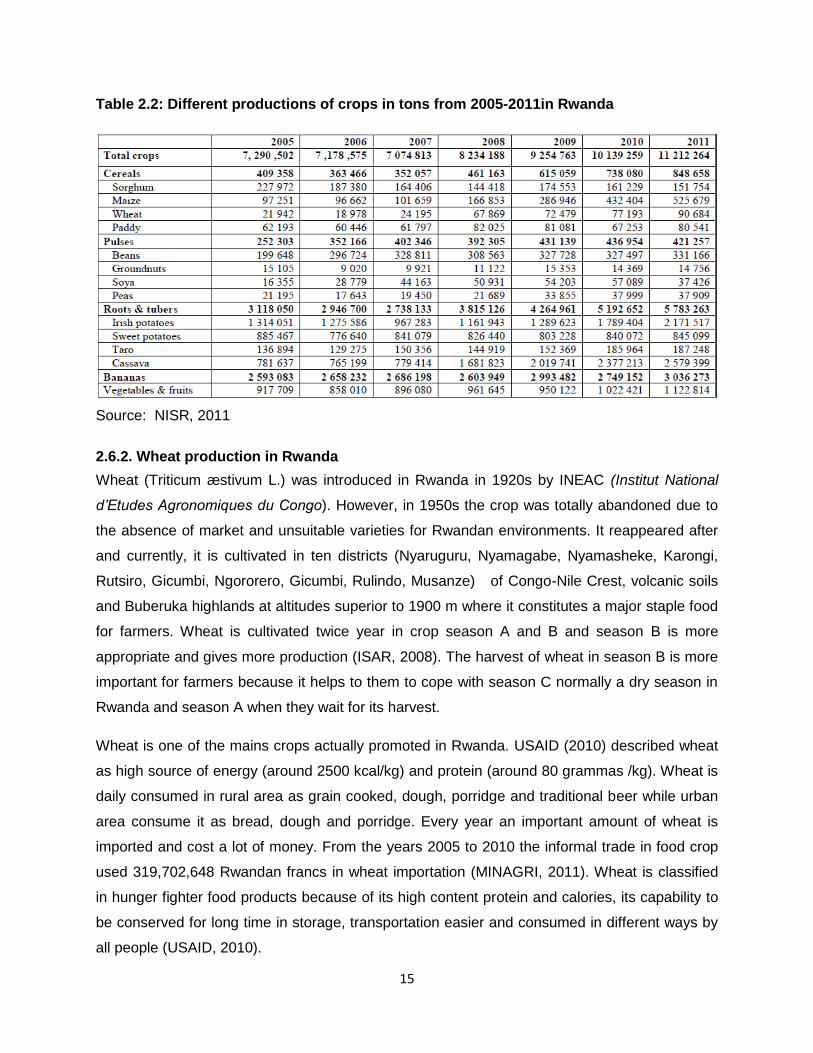
erosion protection from 20% to 87.3%. These programs had increased the production of
different crops as presented in table 2.2
15
Table 2.2: Different productions of crops in tons from 2005-2011in Rwanda
Source: NISR, 2011
2.6.2. Wheat production in Rwanda
Wheat (Triticum æstivum L.) was introduced in Rwanda in 1920s by INEAC (Institut National
d’Etudes Agronomiques du Congo). However, in 1950s the crop was totally abandoned due to
the absence of market and unsuitable varieties for Rwandan environments. It reappeared after
and currently, it is cultivated in ten districts (Nyaruguru, Nyamagabe, Nyamasheke, Karongi,
Rutsiro, Gicumbi, Ngororero, Gicumbi, Rulindo, Musanze) of Congo-Nile Crest, volcanic soils
and Buberuka highlands at altitudes superior to 1900 m where it constitutes a major staple food
for farmers. Wheat is cultivated twice year in crop season A and B and season B is more
appropriate and gives more production (ISAR, 2008). The harvest of wheat in season B is more
important for farmers because it helps to them to cope with season C normally a dry season in
Rwanda and season A when they wait for its harvest.
Wheat is one of the mains crops actually promoted in Rwanda. USAID (2010) described wheat
as high source of energy (around 2500 kcal/kg) and protein (around 80 grammas /kg). Wheat is
daily consumed in rural area as grain cooked, dough, porridge and traditional beer while urban
area consume it as bread, dough and porridge. Every year an important amount of wheat is
imported and cost a lot of money. From the years 2005 to 2010 the informal trade in food crop
used 319,702,648 Rwandan francs in wheat importation (MINAGRI, 2011). Wheat is classified
in hunger fighter food products because of its high content protein and calories, its capability to
be conserved for long time in storage, transportation easier and consumed in different ways by
all people (USAID, 2010).
16
2.6.3. Wheat competitiveness with other crops and its price
Wheat is a crop for rotation in Rwanda especially in Nyaruguru district. It is normally in
cultivated in season B in rotation with Irish potatoes and maize. Wheat is in competition with
maize as reported by Terpend, Kayumba and Ntaganda (2007) and can take more than 70 % of
the area cultivated in season B and 25 % in season A. Even though wheat gives low production
farmers like it because of its capacity of resistance on acid soil and also its capacity to be stored
long time than Irish potatoes in household.
Before 2000 the price of wheat was less than 120 Rwandan francs and after it promotion in
2007 the price fluctuated in range of 280-320 Rwandan francs because of its importance in
home consumption. At harvest the price most of the time is low and is determined by the market
in north part of the country. However in southern ex-province Gikongoro (Nyamagabe and
Nyaruguru district) the price is made in consultation with local government, traders, and
cooperative representatives wheat cooperatives farmers and Union of cooperatives such as
UNICOOPAGI, UNICOOBLE. Most of the time, the price is high after three months because of
its high demand in market (Mutijimana, 2004).
Rwanda imports grain wheat and flour done by wheat processor and traders at cheap price. The
alternative use of wheat in preparation of wheat beer from Rwandan wheat also makes it very
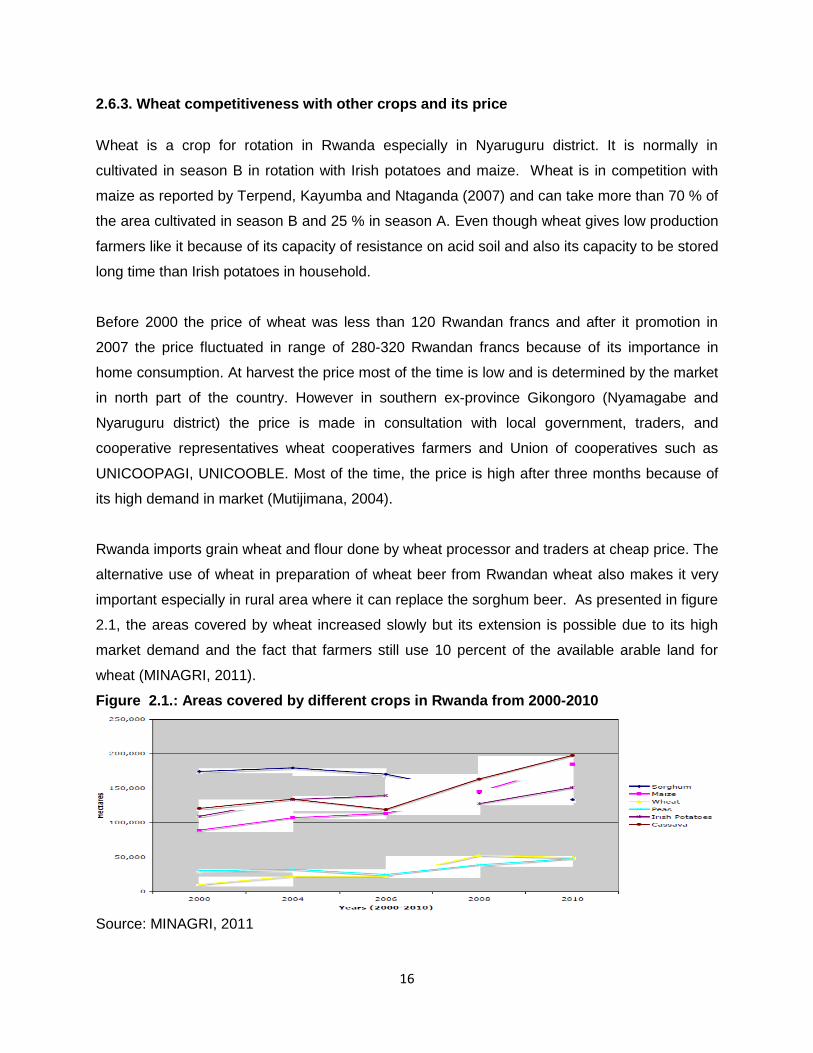
important especially in rural area where it can replace the sorghum beer. As presented in figure
2.1, the areas covered by wheat increased slowly but its extension is possible due to its high
market demand and the fact that farmers still use 10 percent of the available arable land for
wheat (MINAGRI, 2011).
Figure 2.1.: Areas covered by different crops in Rwanda from 2000-2010
Source: MINAGRI, 2011
17
2.6.4. Wheat Stakeholders in Rwanda
As observed by USAID (2010) three groups of stakeholders are involved in wheat value chain
in Rwanda: actors, supporters and influencers. The actors are those who actively involved in
wheat value chain, the supporters are those who provide different supports like loan technical
support among others to the chain actors and the influencers create enabling environment to
all stakeholders of wheat value chain by providing all regulations in wheat production,
infrastructure, market, price and monitoring .
Actors
Suppliers of input: Rwanda Agricultural Board (RAB) supplies and distributes improved seed
to famers at the same time this organization coordinates the distribution of fertilizers through
SOPAV (Société de Production d’Aliments de Végétaux) Company. The later gets a contract
with RAB to sell and to distribute subsidized fertilizers to farmers who are able to grow wheat on
at least ½ hectares.
Producers: Large, small, individual and cooperatives of farmers are observed in wheat
production in Rwanda. As reported by Mutijima (2004) more than 60% of wheat producers are
individual farmers and cultivate on small plots less than 0.5 ha using their own seeds. Terpend,
Kayumba and Ntaganda (2007) found that more 25000 farmers are grouped in cooperatives
and had stated the consolidation of their land in wheat production and use improved seeds.
Collectors, dryers and traders: Different cooperatives (COPROVAB, UNICOOPAGI,
UNICOBLE, and KOAGMITA) facilitate the collection wheat. These cooperatives have been
united in unions like UNICOOPAGI (Union des Cooperatives Agricoles de Gikongoro ) which
actually buys, collects wheat farmers’ production, dry it at 14% of moisture content, package
and store the production in its appropriate stores(RAB,2011).
Middle men: Many buyers informally buy at low price from farmer gates especially from male
farmers; even before the harvest of wheat and sell it to other actors in chain at a good price.
Processors: BATHRESA and PEMBE are the large millers with capacity respectively of 200
and 400 tons a day working in Rwanda. Small scale processors produce wheat floor by
electrical machines without any transformation, most women are involved in wheat small scale
18
processing and sell the product in local market. Recently two wheat millers closed the
processing activities because of various problems in their management (MINICOM, 2011).
Retailers: Many buyers and sellers are involved in wheat value chain. They buy grain wheat
and wheat flour from wheat miller, from wholesalers, wheat cooperative or individual farmers.
Most wheat millers have contract with supermarket and different shops in different cities of
Rwanda. Retailers sell their product at different price depending on the selling point and the
consumers (CIMMYT, 2000).
Consumers: Three types of consumers are observed. High income consumers in urban area
who buy the first quality of wheat floor in supermarkets at high price. Low income consumers
who buy low quality of wheat flour, or wheat grain at cheap price in shops or local markets.
Some small processors had signed contracts with secondary schools to supply wheat floor for
students’ consumption (NISR, 2011).
Supporters
Research: The Institut des Sciences Agronomiques du Rwanda (ISAR) does different
researches: testing adaptability of new varieties, pest and diseases control in wheat value chain
Rwanda.
Services providers: Some unions of wheat cooperatives such as UNICOOPAGI, UNICOBLE,
and COPROVAB operate in wheat value chain as actors and supporters. They provide
extension services to wheat farmers and do also advocacy of farmers (U.S. Government, 2011).
BANKS: RIU (Research Into Use), RIM (Reaseau Indiocesain de Microfinance), Microfinance,
SACCO (Saving credit Cooperatives), Banque Populaire du Rwanda provide loans to wheat
farmers to buy inputs (fertilisers and seeds) or to wheat cooperatives and small scale
processors to buy production of farmers at harvest or to process grain wheat in wheat flour at
low price affordable by low income consumers.
Government Projects: Rural Sectors Support Project (RSSP) and ACDI VOCA provide funds
to qualified projects in wheat value chain and SAN project (Projet de Securite Alimentaire de
Nyaruguru) provide extension services through Integrated Pest Management.
19
Influencers
Government: The MINAGRI establishes regulations in wheat value chain especially policies
(laws in fertilizer, varieties needed). Actually there is a policy on intensive agriculture
implemented through a program of Crop Intensification.
Local government: The ten above cited districts through its agriculture departments coordinate
the distribution of seed, and fertilizers, monitor and evaluate all stakeholders in wheat value
chain. They also determine the price of wheat grain in collaboration with all stakeholders and
produce a report on wheat value chain. Different stakeholders in wheat production and their
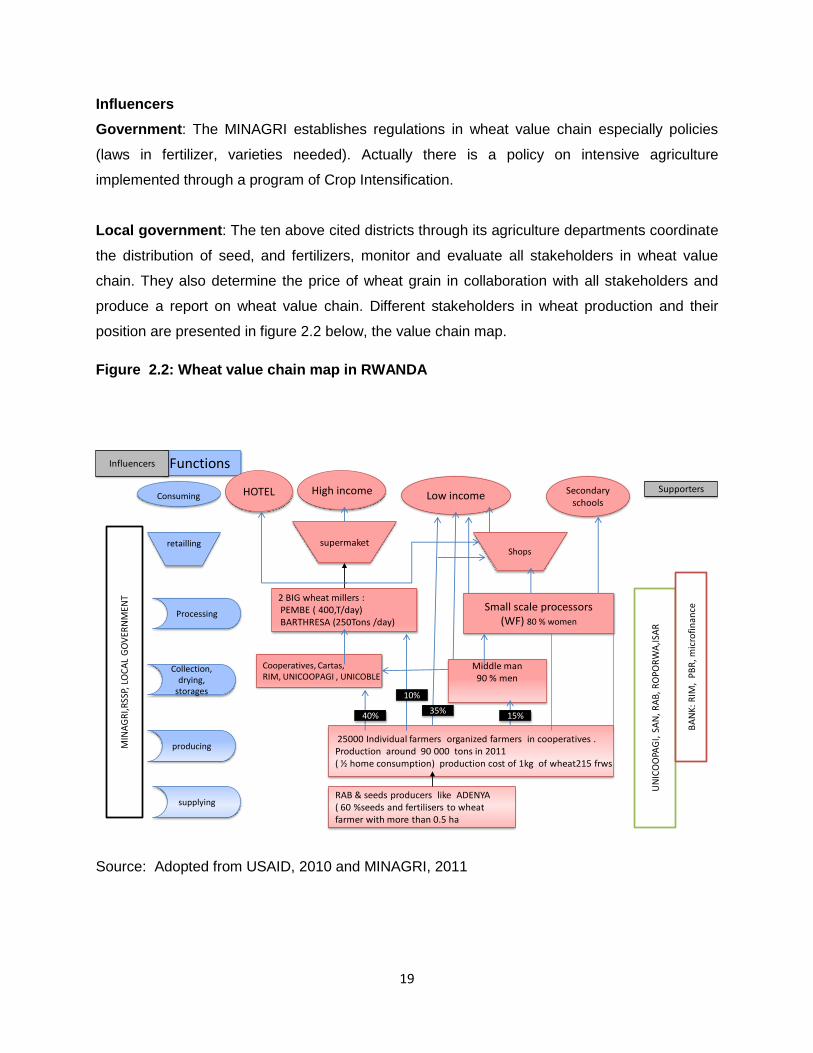
position are presented in figure 2.2 below, the value chain map.
Figure 2.2: Wheat value chain map in RWANDA
25000 Individual farmers organized farmers in cooperatives . Production around 90 000 tons in 2011 ( ½ home consumption) production cost of 1kg of wheat215 frws
Cooperatives, Cartas,RIM, UNICOOPAGI , UNICOBLE
Shops
Low income
2 BIG wheat millers : PEMBE ( 400,T/day)BARTHRESA (250Tons /day)
RAB & seeds producers like ADENYA( 60 %seeds and fertilisers to wheat farmer with more than 0.5 ha
supermaket
High income
Middle man90 % men
Functions
Secondary schools
UN
ICO
OPA
GI,
SA
N, R
AB
, RO
POR
WA
,ISA
R
SupportersHOTEL
BA
NK
: R
IM,
PB
R, m
icro
fin
ance
MIN
AG
RI,R
SSP,
LO
CA
L G
OV
ERN
MEN
T
Small scale processors (WF) 80 % women
Influencers
15%35%
40%
10%
Processing
supplying
producing
Collection, drying,
storages
retailling
Consuming
Source: Adopted from USAID, 2010 and MINAGRI, 2011
20
2.5.5. Constraints and opportunities in wheat production in Rwanda
Opportunities:
As reported by USAID (2010) wheat production in Rwanda has strengths and opportunities; this
crop is highly appreciated by consumers at different levels because of its diversification in
preparation in consumption and its demand in Rwanda far exceeds supply. Strong cooperatives
are organized around wheat production sales and some cooperatives have appropriate storages
facilities and high capacity of storage. Small and large processors are operating in the country.
Others such as BARTHRESA stimulated by good policies in agriculture that facilitate the new
investors have started milling activities in Rwanda.
Through different trainings provided by some projects like Integrated Pest Management project
some wheat producers were trained in integrated pest management of wheat rust and could
reduce losses in production. The appropriate technology in threshing and winnowing had been
identified by Terpend, Kayumba and Ntaganda (2007) in improving the quality of wheat. Wheat
has also an opportunity to be used in other forms of consumption such as porridge and this
alternative could mitigate the problem of high moisture rendering the Rwandan wheat unsuitable
to flour. The climate in Rwanda is favourable for farmers to produce wheat in two seasons by
year (A and B) (RAB, 2011).
Constraints:
The production of wheat in Rwanda has a lot of weaknesses and threats; a very low volume of
Rwandan wheat is produced with very low quality compromised by high contents of impurities
incurred during the threshing, winnowing and drying because of use of traditional facilities. The
inability of most farmers to dry down to required moisture level (14%) in most production
locations especially in the area of high altitude (Cantore, 2012).
Variety grown by farmers is inappropriate for wheat millers. Most cooperatives lack adequate
drying and storage facilities and as a results great losses are incurred in post-harvest. The
price fluctuates during the year and the MINAGRI (2011) reported that the price offered by
wheat millers is most of the time lower than what is paid at local market and this reduces
collaboration with famers. Another issue observed is poor management of wheat millers which
led to the closure of some milling factories such as SOTIRU and Nyungwe Mill.
21
Most of wheat millers use imported wheat with better quality and available in quality required by
flour mills. This competes with the Rwandan wheat production and as a result poor relationships
are observed between producers and wheat millers and these discourage wheat producers.
Many cooperatives were strongly assisted by projects such as ACDI VOCA and SAN among
others in providing technical and financial support and actually as these projects ended their
supports, they suffer in management term. Even if the climate in Rwanda is favourable for
wheat production, it is also favourable to different pests and diseases, which affect wheat
production and storage. Wheat rust is common disease and birds destroy the crop causing
losses in wheat production. The special characteristics of slope and high rainfall of Rwanda
facilitates, the flooding in the area of production of wheat and the occasional rapid change to
drought affects the production of wheat (CIP, 2011).
22
3. METHODOLOGY
3.1 .Study area
The district of Nyaruguru is one of 10 districts in which wheat is grown in Rwanda and situated
in Southern part of the country. It is divided in 14 sectors made of 72 cells 332 villages. This
district has been chosen as the study area. This is because wheat constitutes a major crop of
this population and consumed at 8kg/year /persons (Mutijima, 2004). About 30% of wheat
farmers of the country are organised in cooperatives and individual farmers involved in wheat
seeds production and wheat production are located in that district and collaborate with different
stakeholders (Terpend, Kayumba and Ntaganda, 2007). For this reason data collected in this
area can be used to represent a generalised case to the whole country. UNICOOPAGI and
KIAKI cooperative have been proposed by Agriprofocus to be a research company (firm) and
wheat farmers cooperative and operate in Nyaruguru district. This district was also the working
organisation of the researcher so it was easy to reach the area as well as respondents as long
as the researcher was familiar with local situation.
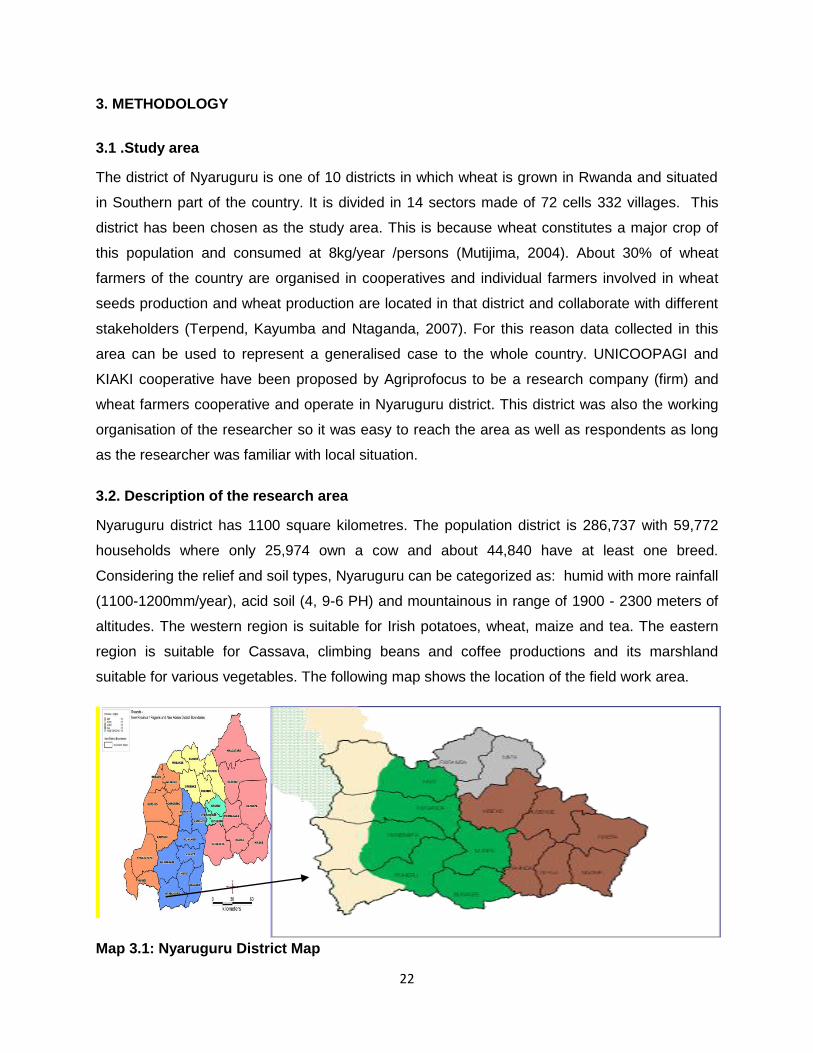
3.2. Description of the research area
Nyaruguru district has 1100 square kilometres. The population district is 286,737 with 59,772
households where only 25,974 own a cow and about 44,840 have at least one breed.
Considering the relief and soil types, Nyaruguru can be categorized as: humid with more rainfall
(1100-1200mm/year), acid soil (4, 9-6 PH) and mountainous in range of 1900 - 2300 meters of
altitudes. The western region is suitable for Irish potatoes, wheat, maize and tea. The eastern
region is suitable for Cassava, climbing beans and coffee productions and its marshland
suitable for various vegetables. The following map shows the location of the field work area.
Map 3.1: Nyaruguru District Map
23
3.3. Research strategy
To achieve the objective of this research two, steps were involved; collection of primary data
and collection of secondary data. The collection of primary data was done in three steps:
1) Developing a business case description between UNICOOPAGI and KIAKI cooperative
with semi–structured interview (checklist and open questions).
2) Survey used pre-structured questions (statement were formulated and scored by both
farmers’ cooperative and staff of UNICOOPAGI).
3) Debriefing meeting with farmers and staff of KIAKI.
Collection of secondary data used desk study: internet, book, journals, and official rapport for
the government. The processing of data used an excel sheet and data was analysed through a
value chain analysis with food security lens.
3.4. Methodology to collect data
This research has used a desk study to collect secondary data, field work to collect primary data
and observation to concretise the field work.
3.4. 1. Methodology to collect secondary data
Desk study: The first step of this study involved a reading and gathering different information
about the research objective especially on wheat production and firm-farm relationship. This
information summarised have been used in data analysis and interpretation of findings. Reading
was more focus on different research publications, articles, reports from government or
government institutions or international organisations and PhD thesis. Information based on
desk study was collected through electronic search using library books of digital library of
Wageningen, as well as reliable Internet source related to the research topic.
3.4.2. Methodology to collect primary data
Business case selection respondents
In selecting respondents more focus was on farmers and staff of UNICOOPAGI mostly involved
in wheat production.
Farmers: The selection has been done from wheat farmers of KIAKI who sold their production
to UNICOOPAGI through their cooperatives and who took that product as an important business
for household. All selected respondents were literates.
24
Firm Staff: Staff respondents were selected according the interaction they have with wheat
production and the following list was interviewed: agronomist, market officer, quality controller
and the coordinator of UNICOOPAGI.
Survey selection respondents
Farmers capable of writing and reading were selected from members of KIAKI cooperative.
Respondent were producers of wheat and who sold wheat to UNICOOPAGI. Some of them
have been interviewed in development of business case. Depending on their function in wheat
production, the following staff scored the questionnaire; President of UNICOOPAGI, Coordinator
of UNICOOPAGI, cooperatives officer, market officer, quality controller and agronomist.
Debriefing selection respondents: Two debriefing meetings have been done: with wheat
farmers of KIAKI cooperative and with staff of UNICOOPAGI. The debriefing meeting with
farmers was attended by 10 participants who were respondent survey. The debriefing meeting
with UNICOOPAGI was attended by the same staffs that were respondent to the survey.
Depending on the importance of women in wheat production in Rwanda, they were represented
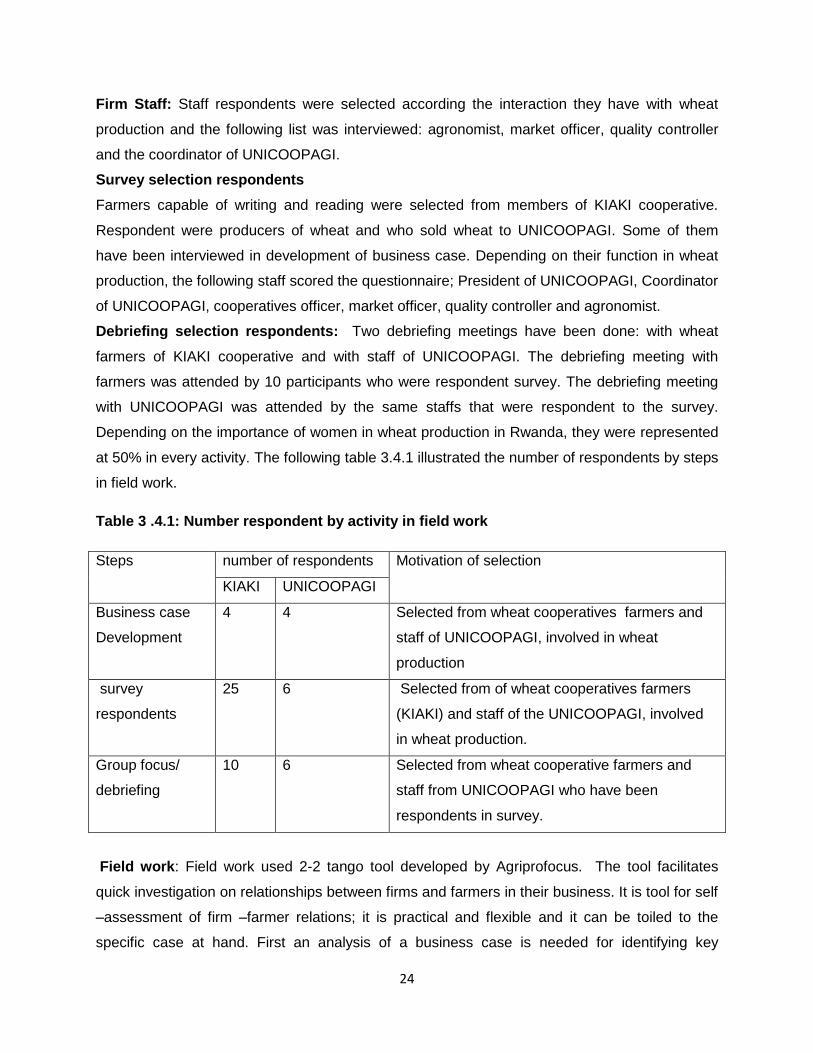
at 50% in every activity. The following table 3.4.1 illustrated the number of respondents by steps
in field work.
Table 3 .4.1: Number respondent by activity in field work
Steps number of respondents Motivation of selection
KIAKI UNICOOPAGI
Business case
Development
4 4 Selected from wheat cooperatives farmers and
staff of UNICOOPAGI, involved in wheat
production
survey
respondents
25 6 Selected from of wheat cooperatives farmers
(KIAKI) and staff of the UNICOOPAGI, involved
in wheat production.
Group focus/
debriefing
10 6 Selected from wheat cooperative farmers and
staff from UNICOOPAGI who have been
respondents in survey.
Field work: Field work used 2-2 tango tool developed by Agriprofocus. The tool facilitates
quick investigation on relationships between firms and farmers in their business. It is tool for self
–assessment of firm –farmer relations; it is practical and flexible and it can be toiled to the
specific case at hand. First an analysis of a business case is needed for identifying key
25
challenges and indicators and preparing statements. The tool allows having quick results, which
can be visualised by easy to understand graphs. The self-assessment results facilitate
communication between farmers and firm. The tool is of potential interest of external facilitators,
which seek (or are asked to facilitate the firm- farmers’ relations. The tool is transferrable to
farmer’ organisation, firms and facilitators and can be applied by private organization staff,
company staff and young professional (Agriprofocus, 2012).
Using this tool the followings steps were taken to collect primary data:
1) Business case description between KIAKI cooperative and UNICOOPAGI: In this step
wheat farmers and UNICOOPAGI’ staff have been interviewed with a checklist (cfr annex 1);
qualitative data was extracted and analysed to get clear problems insight UNICOOPAGI and
KIAKI cooperative and its interactions in wheat production. A business case was elaborated to
present different challenges areas and all partners of UNICOOPAGI and KIAKI involved in
wheat production.
2) Identifying indicators and formulating statements: depending on the business case, clear
indicators or challenge areas were selected in regard to firm-farmer relation. Based on this,
clear and applicable to both wheat farmers and staff firm, questionnaires or statements have
been formulated (cfr annex 2).
3) Firm and farmers scoring the statements: Quantitative data was collected in field using
questionnaire from respondents. Researcher collected quantitative data from respondents
who scored a statement by marking in box a X where it was written strongly disagree, disagree,
agree and strongly agree. Women and men were targeted in order to collect different point of
view in firm -farm relationships in wheat production by sex.
4) Data entry and processing and preparation of graphs (Excel): using Excel sheet,
quantitative data collected from field was entered and processed in excel workbook. From this
the researcher produced different graphs which illustrated a picture of tendency by statement of
staff for UNICOOPAGI and wheat farmers for KIAKI
5) Preparing a debriefing report and meeting(s): depending on indicators and how
respondents scored different statements, a report analysis was prepared and shared in a
debriefing KIAKI’ members and staff for UNICOOPAGI
6) Sharing and discussing self-assessment results: The group focus helped to collect more
information from different points of view of participants and sometimes a consensus on same
conclusion. The discussion has been focused on issues raised in report and actions to take for
improving their relationships.
26
Observation will ensure the availability and accessibility of the production, infrastructure
facilities, contact, record keeping and interpretation of body language of interviewee.
3.5. Data processing and analysis
Data collected have been entered in excel sheet developed by CID which automatically gave
two graph on average score and level of agreement by challenge area. The analysis of data
used the value chain analysis and food security dimensions. Data was discussed by a
triangulation and confrontation of the three source of information; primary data, secondary data
and observation.
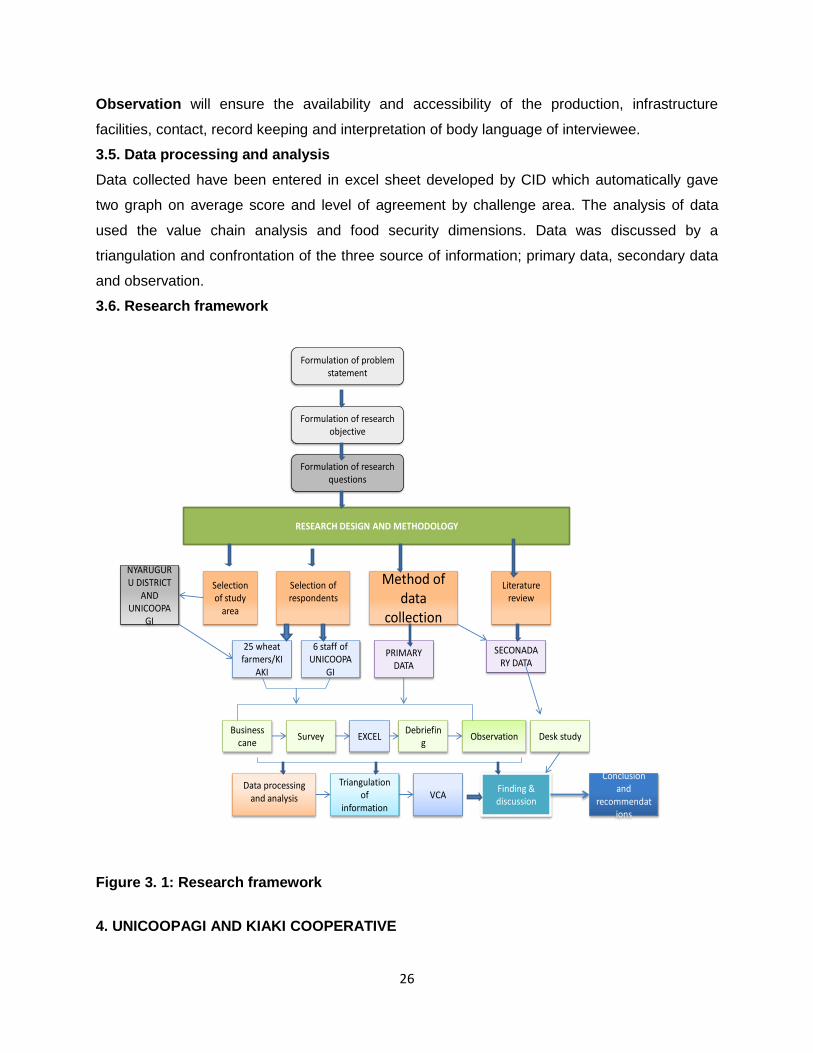
3.6. Research framework
Formulation of problem statement
Formulation of research objective
Formulation of research questions
RESEARCH DESIGN AND METHODOLOGY
NYARUGURU DISTRICT
AND UNICOOPA
GI
Selection of respondents
Selection of study
area
Method of data
collection
Literature review
Data processing and analysis
25 wheat farmers/KI
AKI
6 staff of UNICOOPA
GI
PRIMARY DATA
SECONADARY DATA
Survey Debriefin
g Observation Desk study
Triangulation of
information
Finding & discussion
EXCEL
Conclusion and
recommendations
Business cane
VCA
Figure 3. 1: Research framework
4. UNICOOPAGI AND KIAKI COOPERATIVE
27
In this chapter results are presented in three parts: Business case description, results from
survey and debriefing results between UNICOOPAGI and KIAKI cooperative
4. 1. Business case description
This business case is described with input from interview with members of KIAKI cooperative
and staff of UNICOOPAGI.
4.1.1. Access to inputs
Different improved seeds varieties of wheat and fertilizers are provided by the government
through its agency RAB. Fertilisers of wheat are subsidised at 50% and wheat seeds distributed
to farmers at loan which have to be repaid at harvest. These inputs have benefitted wheat
farmers or to the group of wheat farmers who cultivate wheat at 0.5 hectare. Pesticides are also
provided by RAB and distributed by local government in collaboration with UNICOOPAGI who
concluded a contract with RAB for playing a role of providing extension services to farmers.
UNICOOPAGI provides extension services, facilitates the accessibility of farmer to input
especially cereals fertilizers. KIAKI’s famers said “we know UNICOOPAGI in distributing
wheat inputs but most of the time the delay in distribution affects our production”. Lime
is hardly available to farmers. It is supplied from northern part of the country by private
companies and the later don’t have a selling point of lime in the area.
The accessibility to credit stressed famers and said “it is not easy to access the credit in
agriculture because of lack of collateral, lack of capacity in credits managing and lack of
banks in the area”
4.1.2. Production and yield
Depending on different varieties of wheat, different yield levels are observed. In season B for
every year, wheat is cultivated at around 70% of total cultivated area and constitutes the major
source of income for households. Musama is the variety with low yields ranging between 1 and
2 tons per hectare. Comparatively to other varieties, it is more tolerant to various factors (soil
acidity, drought, poor fertility of soil) but easily affected by winds and not appreciated by
processors. Two other varieties, Ks-Mwamba and 161 varieties provide high yields 2.5 to 5 tons
per hectare, highly appreciated by processor but too exigent in production. Wheat farmers in
KIAKI cooperative are responsible to all activities necessary in wheat production, including land
preparation, sowing, weeding, transporting and applying the organic manure. The KIAKI
production committee mobilizes members for the wheat production on the cooperative’s own
plantation and on individual plots. An interviewed wheat farmer revealed some challenges in
28
applying fertilisers according to agronomists’ recommendations: misuse or application of small
quantity fertiliser as required, the challenge in measuring their farms and harvested quantities
as well as an unwillingness of some farmers in applying good agricultural practices.
The production of this cooperative (farmers’ individual plots included) is around 90 tons by
season and the production by household is around 500kg. The estimation of total production of
wheat in the operation area of UNICOOPAGI is around 16,000 tons per year. Subsidies of
fertilizers and seeds had facilitated an improvement observed in wheat production. Some
farmers attest the insufficiency of improved seeds and lime and said “if improved seeds and
lime could be available and affordable they can obtain far higher yields of wheat in their
area”.
Wheat is affected by different factors. “The fluctuation of climate conditions as high rainfall
and resulting erosion sweeps away rich soil, resulting in production losses that can
reach as high as 40 % of total expected production” said the agronomist of UNICOOAPAGI.
Pests (black aphids) and diseases (rust) are also observed with less impact on production but
when there is a delay in application of pesticides and chemicals, losses can be massive. The
soil is highly acidic and needs much lime for acidity correction which involves high costs
because of its limited availability in the area and high transport costs. All these costs are
supported by farmers and the union is not sharing any of risks with farmers even when it
delayed the supply of inputs. The only thing done by UNICOOPAGI is the reporting to RAB on
the gravity of diseases and pests attack.
4.1.3. Functioning of cooperative (KIAKI)
KIAKI is member of the UNICOOPAGI; it is engaged in wheat production in two sectors (Kivu
and Muganza) of Nyaruguru district. It has 85 women members and 54 men involved in wheat,
maize and Irish potatoes production
KIAKI cooperative has an executive committee, a general assembly, an internal audit
committee and a production committee. Every committee has responsibility to enhance the
production and selling of wheat produced by farmers. The internal auditing committee of KIAKI
cooperative facilitates the control in management of the cooperative the only challenge
mentioned by farmers is the capacity for this committee to fully understand accounting formats
and adapt them to monitoring activities of the executive committee. There is moderate
transparency between UNICOOPAGI and KIAKI in sharing capacity and information regarding
the monitoring of activities.
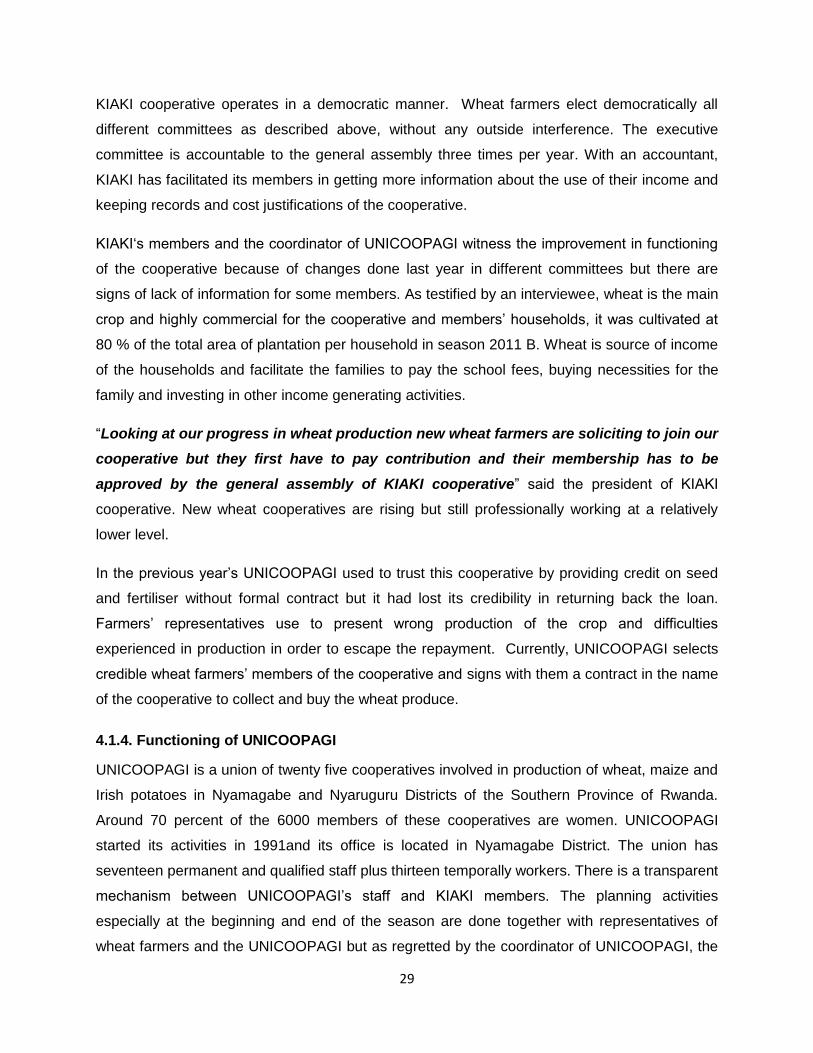
29
KIAKI cooperative operates in a democratic manner. Wheat farmers elect democratically all
different committees as described above, without any outside interference. The executive
committee is accountable to the general assembly three times per year. With an accountant,
KIAKI has facilitated its members in getting more information about the use of their income and
keeping records and cost justifications of the cooperative.
KIAKI‘s members and the coordinator of UNICOOPAGI witness the improvement in functioning
of the cooperative because of changes done last year in different committees but there are
signs of lack of information for some members. As testified by an interviewee, wheat is the main
crop and highly commercial for the cooperative and members’ households, it was cultivated at
80 % of the total area of plantation per household in season 2011 B. Wheat is source of income
of the households and facilitate the families to pay the school fees, buying necessities for the
family and investing in other income generating activities.
“Looking at our progress in wheat production new wheat farmers are soliciting to join our
cooperative but they first have to pay contribution and their membership has to be
approved by the general assembly of KIAKI cooperative” said the president of KIAKI
cooperative. New wheat cooperatives are rising but still professionally working at a relatively
lower level.
In the previous year’s UNICOOPAGI used to trust this cooperative by providing credit on seed
and fertiliser without formal contract but it had lost its credibility in returning back the loan.
Farmers’ representatives use to present wrong production of the crop and difficulties
experienced in production in order to escape the repayment. Currently, UNICOOPAGI selects
credible wheat farmers’ members of the cooperative and signs with them a contract in the name
of the cooperative to collect and buy the wheat produce.
4.1.4. Functioning of UNICOOPAGI
UNICOOPAGI is a union of twenty five cooperatives involved in production of wheat, maize and
Irish potatoes in Nyamagabe and Nyaruguru Districts of the Southern Province of Rwanda.
Around 70 percent of the 6000 members of these cooperatives are women. UNICOOPAGI
started its activities in 1991and its office is located in Nyamagabe District. The union has
seventeen permanent and qualified staff plus thirteen temporally workers. There is a transparent
mechanism between UNICOOPAGI’s staff and KIAKI members. The planning activities
especially at the beginning and end of the season are done together with representatives of
wheat farmers and the UNICOOPAGI but as regretted by the coordinator of UNICOOPAGI, the
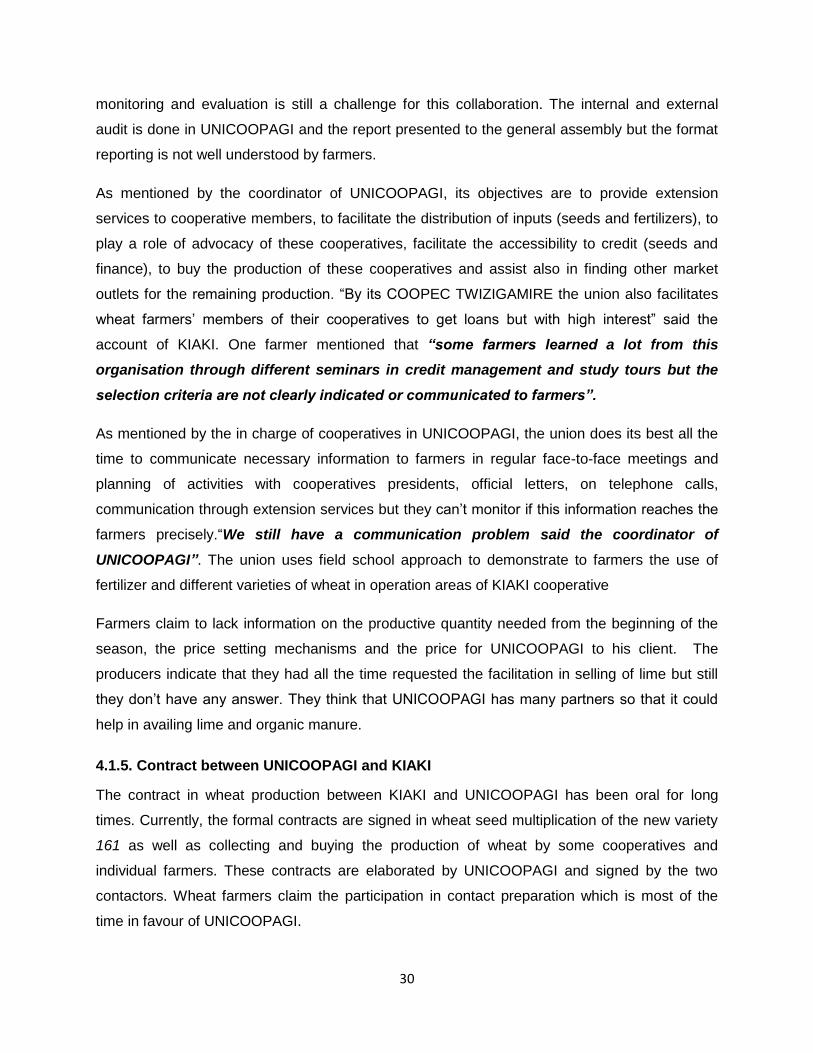
30
monitoring and evaluation is still a challenge for this collaboration. The internal and external
audit is done in UNICOOPAGI and the report presented to the general assembly but the format
reporting is not well understood by farmers.
As mentioned by the coordinator of UNICOOPAGI, its objectives are to provide extension
services to cooperative members, to facilitate the distribution of inputs (seeds and fertilizers), to
play a role of advocacy of these cooperatives, facilitate the accessibility to credit (seeds and
finance), to buy the production of these cooperatives and assist also in finding other market
outlets for the remaining production. “By its COOPEC TWIZIGAMIRE the union also facilitates
wheat farmers’ members of their cooperatives to get loans but with high interest” said the
account of KIAKI. One farmer mentioned that “some farmers learned a lot from this
organisation through different seminars in credit management and study tours but the
selection criteria are not clearly indicated or communicated to farmers”.
As mentioned by the in charge of cooperatives in UNICOOPAGI, the union does its best all the
time to communicate necessary information to farmers in regular face-to-face meetings and
planning of activities with cooperatives presidents, official letters, on telephone calls,
communication through extension services but they can’t monitor if this information reaches the
farmers precisely.“We still have a communication problem said the coordinator of
UNICOOPAGI”. The union uses field school approach to demonstrate to farmers the use of
fertilizer and different varieties of wheat in operation areas of KIAKI cooperative
Farmers claim to lack information on the productive quantity needed from the beginning of the
season, the price setting mechanisms and the price for UNICOOPAGI to his client. The
producers indicate that they had all the time requested the facilitation in selling of lime but still
they don’t have any answer. They think that UNICOOPAGI has many partners so that it could
help in availing lime and organic manure.
4.1.5. Contract between UNICOOPAGI and KIAKI
The contract in wheat production between KIAKI and UNICOOPAGI has been oral for long
times. Currently, the formal contracts are signed in wheat seed multiplication of the new variety
161 as well as collecting and buying the production of wheat by some cooperatives and
individual farmers. These contracts are elaborated by UNICOOPAGI and signed by the two
contactors. Wheat farmers claim the participation in contact preparation which is most of the
time in favour of UNICOOPAGI.
31
These contracts elaborated in local language lack explanation to farmers and mostly signed by
the executive committee of the cooperative. “We do not know the content of our contract
said the interviewee but I’m sure our executive committee knows it.” The contract in
collecting and buying wheat produce is not properly observed by UNICOOPAGI because it buys
less quantity than collected by farmers. “Many times our contracts are kept by UNICOOPAGI
in their office and we don’t have any copy” said a farmer. Most of the times UNICOOPAGI
does not respect the contract signed with farmers in buying their produce not because of low
quality but because of the financial capacity as mentioned by the marketing manager of
UNICOOPAGI.
The price of wheat is set in collaboration with local government from sector level to district level,
the representatives of wheat producing cooperatives, the representatives of progressive
farmers, the UNICOOPAGI and CARITAS as buyers. Together they calculate the production
cost of one kilogramme of wheat and then apply 20% on it as benefit. The high estimation of
farmers in input investment creates all the time the misunderstanding in price negotiation and
farmers complain that the UNICOOPAGI as the biggest market outlet for their produce uses this
negotiation power to impose the price even if some of them know how the price is set. Price
making is still a challenge for both wheat farmers and UNICOOPAGI.
4.1.6. Post- harvest facilities and quality management
The harvesting is done normally from mid-July to August. This period corresponds with the dry
season and facilitates the drying of wheat. The lack of adequate post harvest facilities
decreases the production because currently the losses during the threshing, winnowing, drying
and storage stages are high. The marketing manager of UNICOOPAGI attests that around 14%
of the wheat production is lost in different activities of traditional harvest and post harvesting
compared with modern threshers and winnowers. UNICOOPAGI has two threshers and two
winnowers which are yet to be operational. They are expected to be used during this 2012B
season.
32
Photo 4.1.1: Traditional post-harvest facilities and modern thresher and winnower
The transport of input and production is a challenge in the area. UNICOOPAGI sometimes
facilitates the transport of fertilizers to KIAKI’s office. Transportation by head is a challenge and
discourages famers. The roads serving the area are not well maintained and the transport cost
by trucks is too high. The KIAKI cooperative has a small warehouse with a capacity of 30 tons
and not appropriate to store wheat, while UNICOOPAGI has benefited from adequate storage
facility of a 60 tons capacity plus a truck through a donor (TROCAIRE Rwanda).
Photos 4.1 2: Adequate storage and testing the quality by eyes at wheat selling point
4.1.7. Commercial relations
The only big market of wheat in Nyaruguru and Nyamagabe districts is the UNICOOPAGI but it
buys around 20% of the total production and it works as monopoly in these districts. The
remaining production is sold to different buyers such as at local market, middlemen and Caritas.
Adequate stock Selling Point
Traditional port harvest facilities Modern thresher and winnower
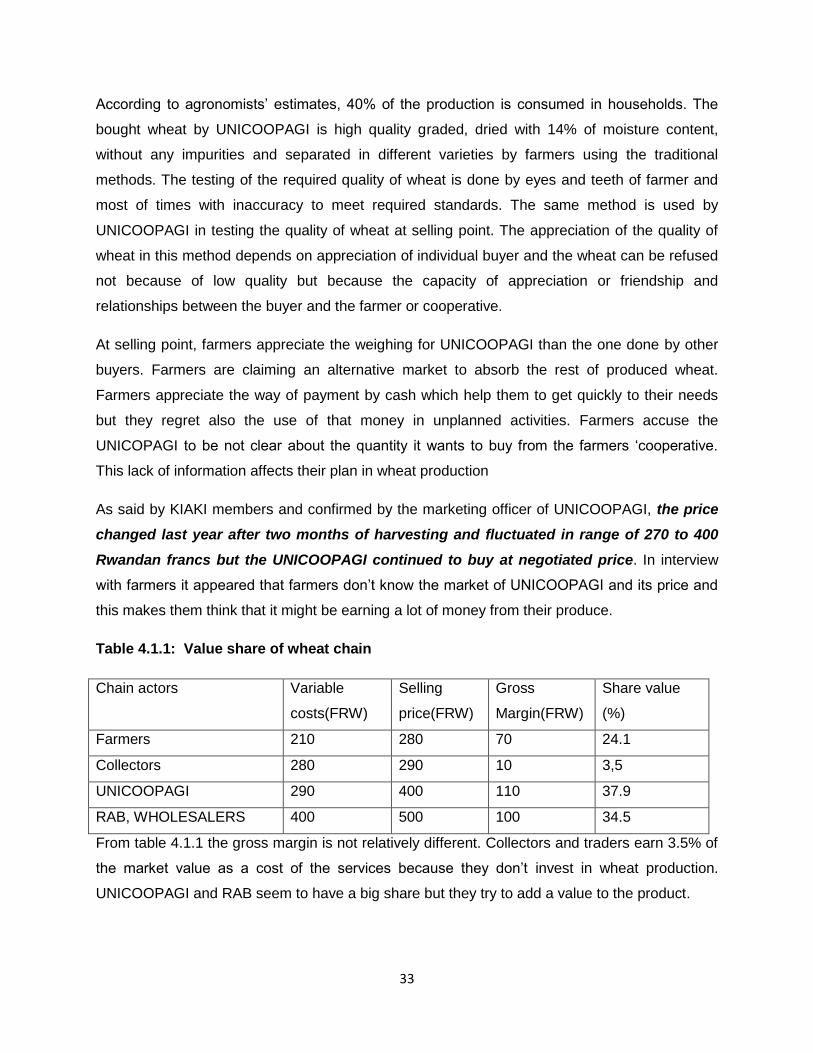
33
According to agronomists’ estimates, 40% of the production is consumed in households. The
bought wheat by UNICOOPAGI is high quality graded, dried with 14% of moisture content,
without any impurities and separated in different varieties by farmers using the traditional
methods. The testing of the required quality of wheat is done by eyes and teeth of farmer and
most of times with inaccuracy to meet required standards. The same method is used by
UNICOOPAGI in testing the quality of wheat at selling point. The appreciation of the quality of
wheat in this method depends on appreciation of individual buyer and the wheat can be refused
not because of low quality but because the capacity of appreciation or friendship and
relationships between the buyer and the farmer or cooperative.
At selling point, farmers appreciate the weighing for UNICOOPAGI than the one done by other
buyers. Farmers are claiming an alternative market to absorb the rest of produced wheat.
Farmers appreciate the way of payment by cash which help them to get quickly to their needs
but they regret also the use of that money in unplanned activities. Farmers accuse the
UNICOPAGI to be not clear about the quantity it wants to buy from the farmers ‘cooperative.
This lack of information affects their plan in wheat production
As said by KIAKI members and confirmed by the marketing officer of UNICOOPAGI, the price
changed last year after two months of harvesting and fluctuated in range of 270 to 400
Rwandan francs but the UNICOOPAGI continued to buy at negotiated price. In interview
with farmers it appeared that farmers don’t know the market of UNICOOPAGI and its price and
this makes them think that it might be earning a lot of money from their produce.
Table 4.1.1: Value share of wheat chain
Chain actors Variable
costs(FRW)
Selling
price(FRW)
Gross
Margin(FRW)
Share value
(%)
Farmers 210 280 70 24.1
Collectors 280 290 10 3,5
UNICOOPAGI 290 400 110 37.9
RAB, WHOLESALERS 400 500 100 34.5
From table 4.1.1 the gross margin is not relatively different. Collectors and traders earn 3.5% of
the market value as a cost of the services because they don’t invest in wheat production.
UNICOOPAGI and RAB seem to have a big share but they try to add a value to the product.
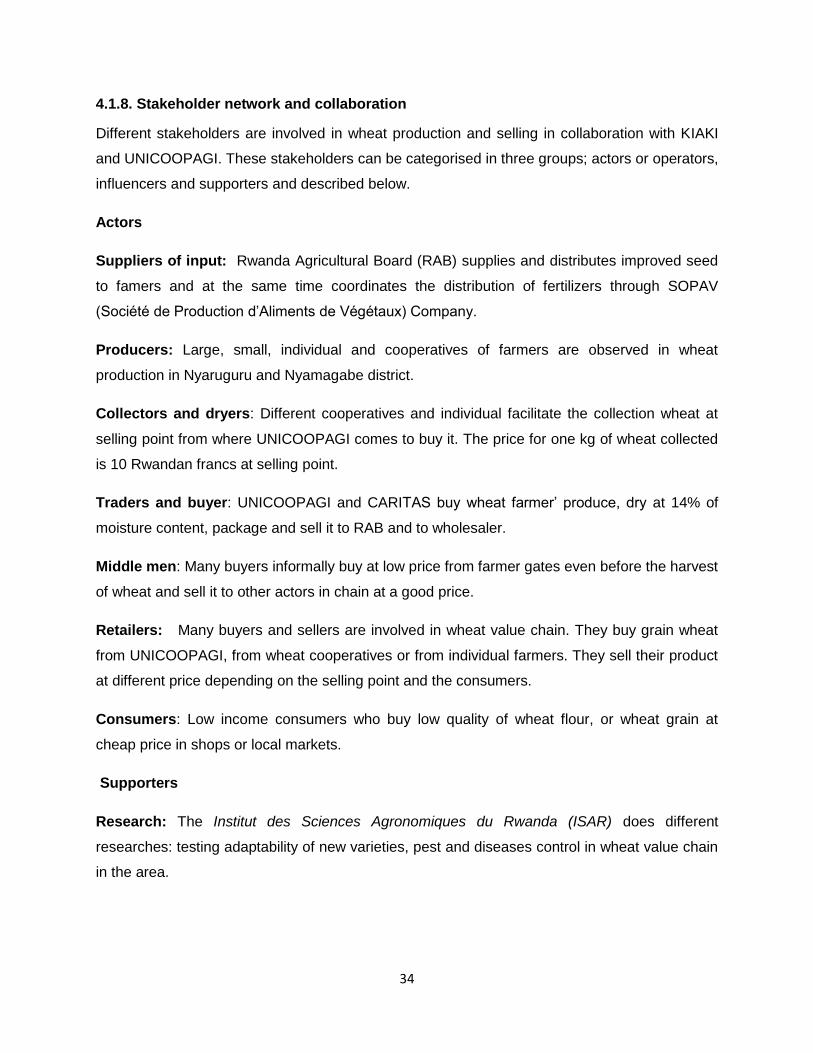
34
4.1.8. Stakeholder network and collaboration
Different stakeholders are involved in wheat production and selling in collaboration with KIAKI
and UNICOOPAGI. These stakeholders can be categorised in three groups; actors or operators,
influencers and supporters and described below.
Actors
Suppliers of input: Rwanda Agricultural Board (RAB) supplies and distributes improved seed
to famers and at the same time coordinates the distribution of fertilizers through SOPAV
(Société de Production d’Aliments de Végétaux) Company.
Producers: Large, small, individual and cooperatives of farmers are observed in wheat
production in Nyaruguru and Nyamagabe district.
Collectors and dryers: Different cooperatives and individual facilitate the collection wheat at
selling point from where UNICOOPAGI comes to buy it. The price for one kg of wheat collected
is 10 Rwandan francs at selling point.
Traders and buyer: UNICOOPAGI and CARITAS buy wheat farmer’ produce, dry at 14% of
moisture content, package and sell it to RAB and to wholesaler.
Middle men: Many buyers informally buy at low price from farmer gates even before the harvest
of wheat and sell it to other actors in chain at a good price.
Retailers: Many buyers and sellers are involved in wheat value chain. They buy grain wheat
from UNICOOPAGI, from wheat cooperatives or from individual farmers. They sell their product
at different price depending on the selling point and the consumers.
Consumers: Low income consumers who buy low quality of wheat flour, or wheat grain at
cheap price in shops or local markets.
Supporters
Research: The Institut des Sciences Agronomiques du Rwanda (ISAR) does different
researches: testing adaptability of new varieties, pest and diseases control in wheat value chain
in the area.
35
Services providers: The unions of cooperatives such as UNICOOPAGI and UNICOBLE
operate in wheat production as actors and supporters. They provide extension services to
wheat farmers buy wheat product and do also advocacy for farmers.
BANKS:), RIM (Reaseau Indiocesain de Microfinance), CAPEC for UNICOOPAGI
(TWIZIGAMIRE), SACCO (Saving credit Cooperatives), Banque Populaire du Rwanda provides
loans to wheat farmers to buy input (fertilisers and seeds) or to wheat cooperatives and small
scale processors to buy production of farmers at harvest or to process grain wheat in wheat
flour at low price affordable by low income consumers.
Government Projects: Rural Sectors Support Project (RSSP) provides funds to qualified
projects in wheat seed multiplication and production and SAN project (Projet de Securite
Alimentaire de Nyaruguru) provides also extension services through Integrated Pest
Management. KIAKI had benefited funds from RSSP in wheat production and capacity building
for his members.
Non-Government Organisation: RIU (Research Into Use), TROCAIRE and IFDC Catalyst
provide extension services support and test in use of fertiliser.
Influencers
Government: The MINAGRI establishes regulations in wheat value chain especially policies
(laws in fertilizer, varieties needed). Actually there is a policy on intensive agriculture
implemented through a program of Crop Intensification. These policies facilitate farmers to
access to fertilizers and improved seeds
Local government: The two districts Nyamagabe and Nyaruguru through its agriculture
departments and field workers coordinate the distribution of seed, and fertilizers, monitors and
evaluate all stakeholders in wheat value chain and sometime participate in price setting of
wheat grain in collaboration with all stakeholders and produce a report on wheat value chain. In
addition to this, KIAKI cooperative has the roles in mobilising its members in wheat production in
collaboration with agronomists from local government and extension officers from
UNICOOPAGI.
36
Individual farmers and about 6000 organized farmers in 25 cooperatives Production around 16000 tons in 2011 ( 40 % home consumption) production cost of 1kg of wheat225fr
Wheat Cooperatives ( KIAKI, KAIMU,...)Individual farmes
Shops
Low income
UNICOOPAGI, CARITAS
RAB & seeds producers like ADENYA( 60 %seeds and fertilisers to wheat farmer with more than 0.5 ha
RAB
farmers
Middle man90 % men
Functions
OPEN MARKET
UNIC
OOPA
GI, S
AN, R
AB, R
OPOR
WA,
ISAR
Supporters
BANK
: RIM
, PBR
, micr
ofina
nce c
apec
TWIZI
GAM
IRE
MIN
AGRI
,RSS
P, LO
CAL G
OVER
NMEN
T
Small scale processors 80
% women
Influencers
15%35%
40%
10%
Traders
supplying
producing
Collection, drying,
storages
retailling
Consuming
Figure 4. 1.1: Wheat value chain UNICOOPAGI and KIAKI
4.1.9. Perspectives and SWOT analysis between UNICOOPAGI and KIAKI
Perspectives
Regarding the possibility of maximisation of production of wheat in Nyaruguru district the KIAKI
cooperative has new orientation in facilitating the production organic manure by providing small
livestock to every member. The purpose of KIAKI is to increase the productivity of wheat by
encouraging its members to use recommended fertilisers and technical practices. The use of
modern threshers and winnowers for reducing loss in post harvest and increase the quality of
wheat is major concern for KIAKI cooperative as said the vice president of the cooperative. As
proposed the president of KIAKI the plan of commercialisation of lime is also the priority of the
cooperative.
The UNICOOPAGI has started the feasibility study of installation of small factory of wheat which
can help in processing and also facilitate in maximisation in buying of all produce of farmers. In
collaboration with its partners the union plans to renovate different storage facilities of its
cooperatives in order to delay the time of selling wheat so they can increase farmer’s income
from wheat.The formal contract with UNICOOPAGI is planned to be collateral for KIAKI in bank
for accessing to loans and this facilitate the payment of wheat farmers through bank transfers.
The major concern for both UNICOOPAGI and KIAKI is to reduce the production cost of one kg
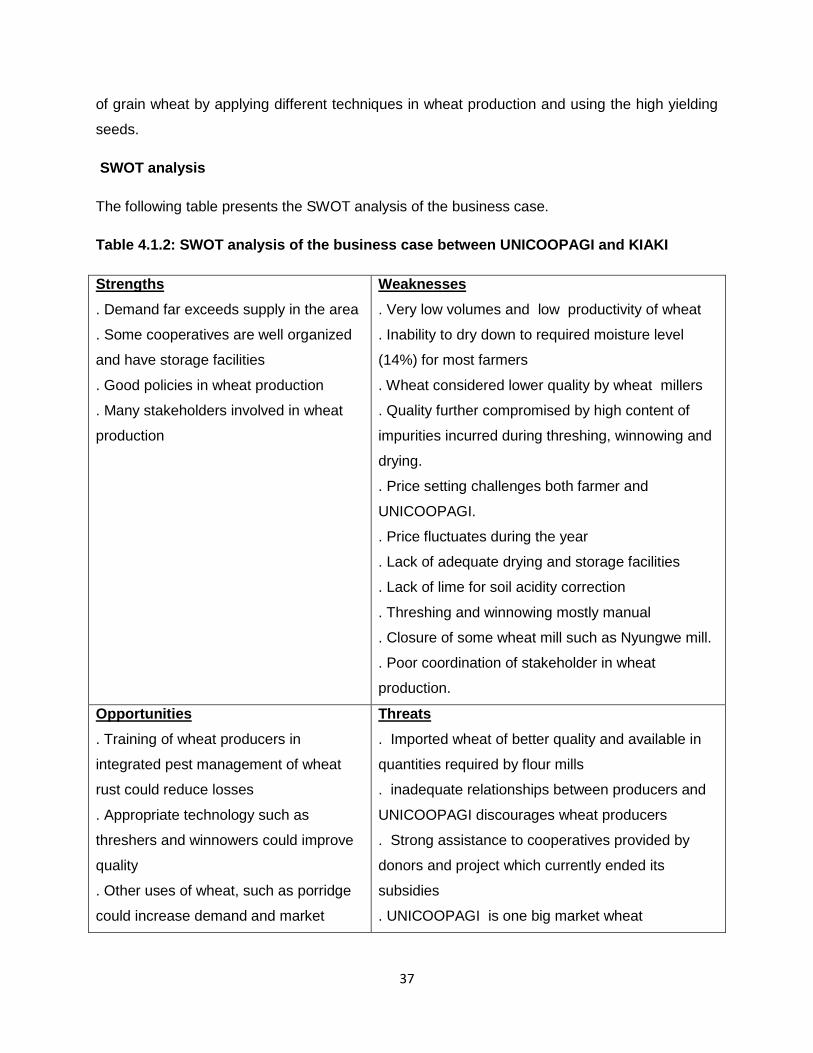
37
of grain wheat by applying different techniques in wheat production and using the high yielding
seeds.
SWOT analysis
The following table presents the SWOT analysis of the business case.
Table 4.1.2: SWOT analysis of the business case between UNICOOPAGI and KIAKI
Strengths
. Demand far exceeds supply in the area
. Some cooperatives are well organized
and have storage facilities
. Good policies in wheat production
. Many stakeholders involved in wheat
production
Weaknesses
. Very low volumes and low productivity of wheat
. Inability to dry down to required moisture level
(14%) for most farmers
. Wheat considered lower quality by wheat millers
. Quality further compromised by high content of
impurities incurred during threshing, winnowing and
drying.
. Price setting challenges both farmer and
UNICOOPAGI.
. Price fluctuates during the year
. Lack of adequate drying and storage facilities
. Lack of lime for soil acidity correction
. Threshing and winnowing mostly manual
. Closure of some wheat mill such as Nyungwe mill.
. Poor coordination of stakeholder in wheat
production.
Opportunities
. Training of wheat producers in
integrated pest management of wheat
rust could reduce losses
. Appropriate technology such as
threshers and winnowers could improve
quality
. Other uses of wheat, such as porridge
could increase demand and market
Threats
. Imported wheat of better quality and available in
quantities required by flour mills
. inadequate relationships between producers and
UNICOOPAGI discourages wheat producers
. Strong assistance to cooperatives provided by
donors and project which currently ended its
subsidies
. UNICOOPAGI is one big market wheat
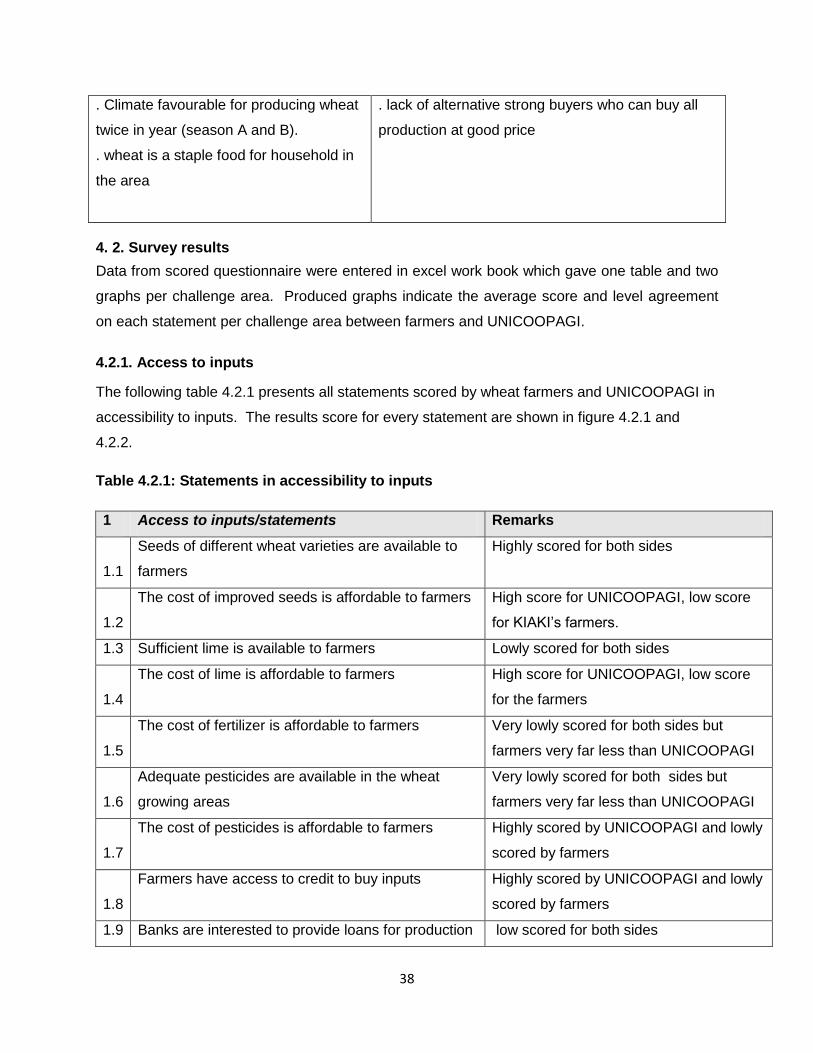
38
. Climate favourable for producing wheat
twice in year (season A and B).
. wheat is a staple food for household in
the area
. lack of alternative strong buyers who can buy all
production at good price
4. 2. Survey results
Data from scored questionnaire were entered in excel work book which gave one table and two
graphs per challenge area. Produced graphs indicate the average score and level agreement
on each statement per challenge area between farmers and UNICOOPAGI.
4.2.1. Access to inputs
The following table 4.2.1 presents all statements scored by wheat farmers and UNICOOPAGI in
accessibility to inputs. The results score for every statement are shown in figure 4.2.1 and
4.2.2.
Table 4.2.1: Statements in accessibility to inputs
1 Access to inputs/statements Remarks
1.1
Seeds of different wheat varieties are available to
farmers
Highly scored for both sides
1.2
The cost of improved seeds is affordable to farmers High score for UNICOOPAGI, low score
for KIAKI’s farmers.
1.3 Sufficient lime is available to farmers Lowly scored for both sides
1.4
The cost of lime is affordable to farmers High score for UNICOOPAGI, low score
for the farmers
1.5
The cost of fertilizer is affordable to farmers Very lowly scored for both sides but
farmers very far less than UNICOOPAGI
1.6
Adequate pesticides are available in the wheat
growing areas
Very lowly scored for both sides but
farmers very far less than UNICOOPAGI
1.7
The cost of pesticides is affordable to farmers Highly scored by UNICOOPAGI and lowly
scored by farmers
1.8
Farmers have access to credit to buy inputs Highly scored by UNICOOPAGI and lowly
scored by farmers
1.9 Banks are interested to provide loans for production low scored for both sides
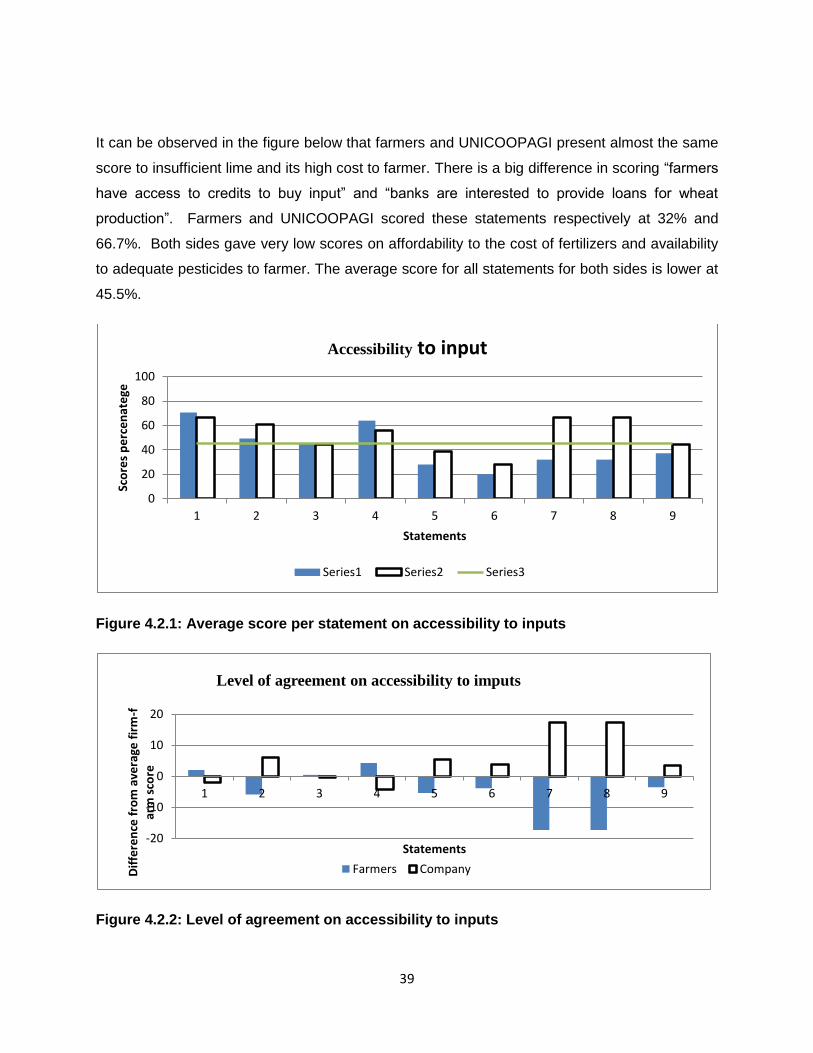
39
It can be observed in the figure below that farmers and UNICOOPAGI present almost the same
score to insufficient lime and its high cost to farmer. There is a big difference in scoring “farmers
have access to credits to buy input” and “banks are interested to provide loans for wheat
production”. Farmers and UNICOOPAGI scored these statements respectively at 32% and
66.7%. Both sides gave very low scores on affordability to the cost of fertilizers and availability
to adequate pesticides to farmer. The average score for all statements for both sides is lower at
45.5%.
Figure 4.2.1: Average score per statement on accessibility to inputs
Figure 4.2.2: Level of agreement on accessibility to inputs
0
20
40
60
80
100
1 2 3 4 5 6 7 8 9
Sco
res
pe
rce
nat
ege
Statements
Accessibility to input
Series1 Series2 Series3
-20
-10
0
10
20
1 2 3 4 5 6 7 8 9
Dif
fere
nce
fro
m a
vera
ge f
irm
-f
arm
sco
re
Statements
Level of agreement on accessibility to imputs
Farmers Company
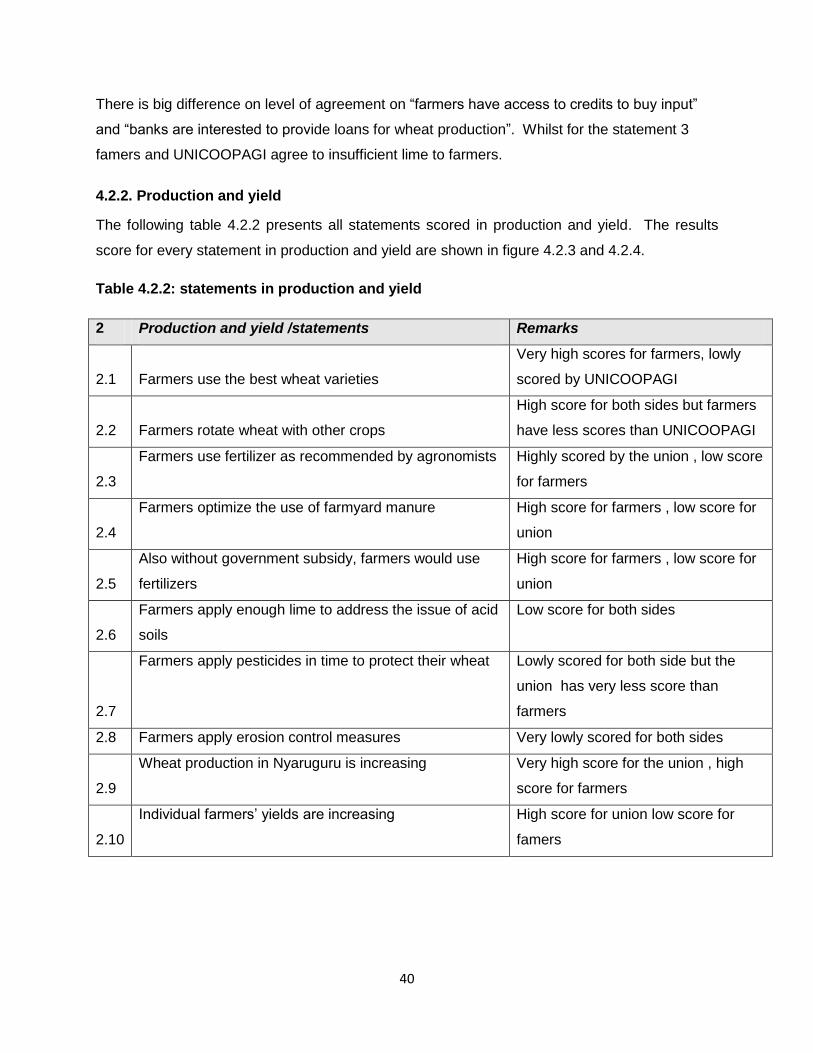
40
There is big difference on level of agreement on “farmers have access to credits to buy input”
and “banks are interested to provide loans for wheat production”. Whilst for the statement 3
famers and UNICOOPAGI agree to insufficient lime to farmers.
4.2.2. Production and yield
The following table 4.2.2 presents all statements scored in production and yield. The results
score for every statement in production and yield are shown in figure 4.2.3 and 4.2.4.
Table 4.2.2: statements in production and yield
2 Production and yield /statements Remarks
2.1 Farmers use the best wheat varieties
Very high scores for farmers, lowly
scored by UNICOOPAGI
2.2 Farmers rotate wheat with other crops
High score for both sides but farmers
have less scores than UNICOOPAGI
2.3
Farmers use fertilizer as recommended by agronomists Highly scored by the union , low score
for farmers
2.4
Farmers optimize the use of farmyard manure High score for farmers , low score for
union
2.5
Also without government subsidy, farmers would use
fertilizers
High score for farmers , low score for
union
2.6
Farmers apply enough lime to address the issue of acid
soils
Low score for both sides
2.7
Farmers apply pesticides in time to protect their wheat Lowly scored for both side but the
union has very less score than
farmers
2.8 Farmers apply erosion control measures Very lowly scored for both sides
2.9
Wheat production in Nyaruguru is increasing Very high score for the union , high
score for farmers
2.10
Individual farmers’ yields are increasing High score for union low score for
famers
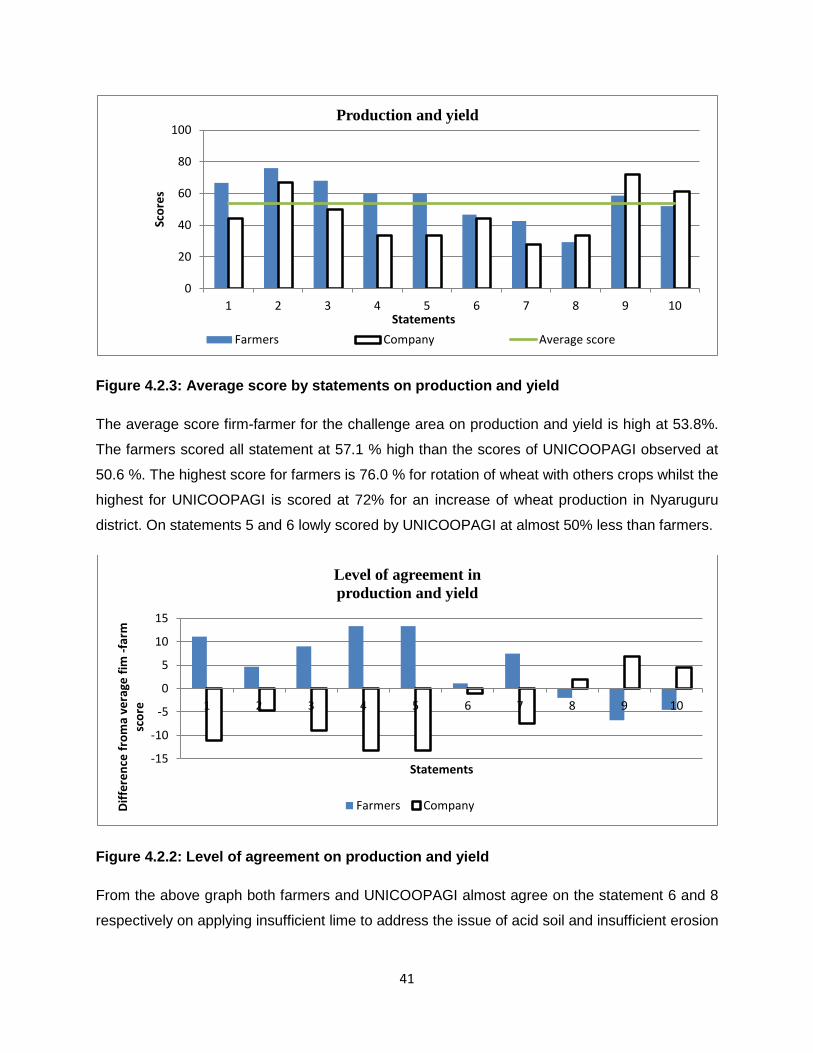
41
Figure 4.2.3: Average score by statements on production and yield
The average score firm-farmer for the challenge area on production and yield is high at 53.8%.
The farmers scored all statement at 57.1 % high than the scores of UNICOOPAGI observed at
50.6 %. The highest score for farmers is 76.0 % for rotation of wheat with others crops whilst the
highest for UNICOOPAGI is scored at 72% for an increase of wheat production in Nyaruguru
district. On statements 5 and 6 lowly scored by UNICOOPAGI at almost 50% less than farmers.
Figure 4.2.2: Level of agreement on production and yield
From the above graph both farmers and UNICOOPAGI almost agree on the statement 6 and 8
respectively on applying insufficient lime to address the issue of acid soil and insufficient erosion
0
20
40
60
80
100
1 2 3 4 5 6 7 8 9 10
Sco
res
Statements
Production and yield
Farmers Company Average score
-15
-10
-5
0
5
10
15
1 2 3 4 5 6 7 8 9 10
Dif
fere
nce
fro
ma
vera
ge f
im -
farm
sc
ore
Statements
Level of agreement in
production and yield
Farmers Company
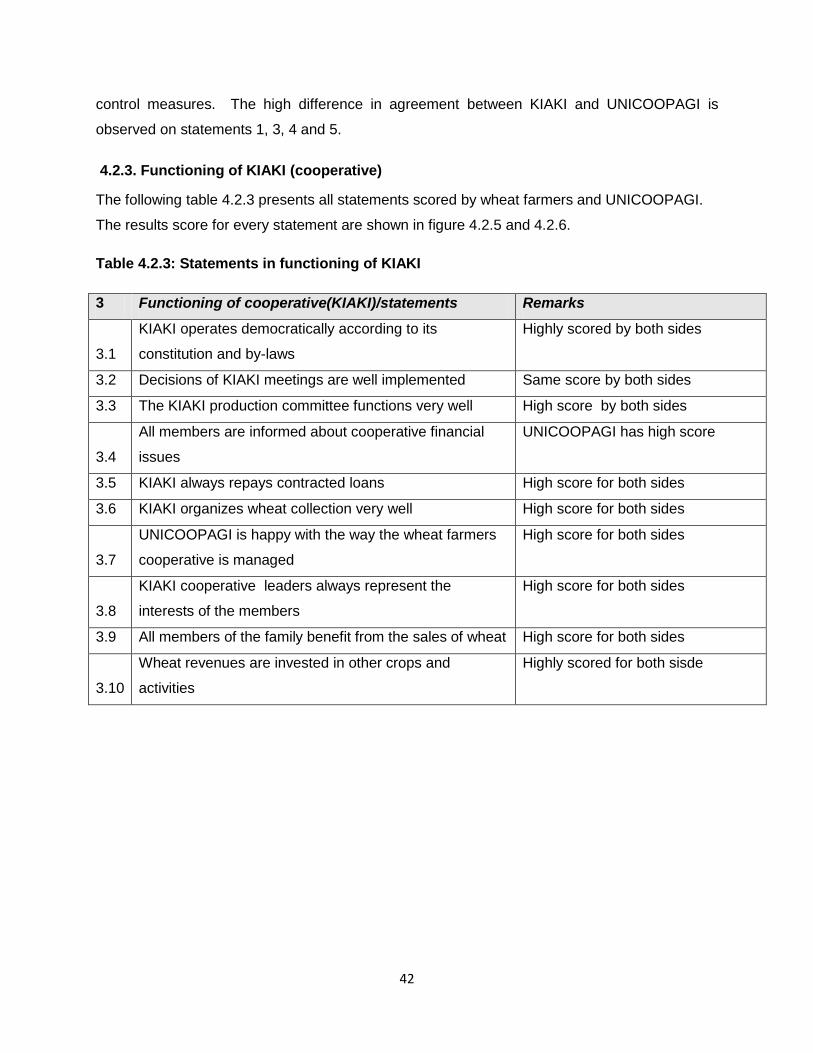
42
control measures. The high difference in agreement between KIAKI and UNICOOPAGI is
observed on statements 1, 3, 4 and 5.
4.2.3. Functioning of KIAKI (cooperative)
The following table 4.2.3 presents all statements scored by wheat farmers and UNICOOPAGI.
The results score for every statement are shown in figure 4.2.5 and 4.2.6.
Table 4.2.3: Statements in functioning of KIAKI
3 Functioning of cooperative(KIAKI)/statements Remarks
3.1
KIAKI operates democratically according to its
constitution and by-laws
Highly scored by both sides
3.2 Decisions of KIAKI meetings are well implemented Same score by both sides
3.3 The KIAKI production committee functions very well High score by both sides
3.4
All members are informed about cooperative financial
issues
UNICOOPAGI has high score
3.5 KIAKI always repays contracted loans High score for both sides
3.6 KIAKI organizes wheat collection very well High score for both sides
3.7
UNICOOPAGI is happy with the way the wheat farmers
cooperative is managed
High score for both sides
3.8
KIAKI cooperative leaders always represent the
interests of the members
High score for both sides
3.9 All members of the family benefit from the sales of wheat High score for both sides
3.10
Wheat revenues are invested in other crops and
activities
Highly scored for both sisde
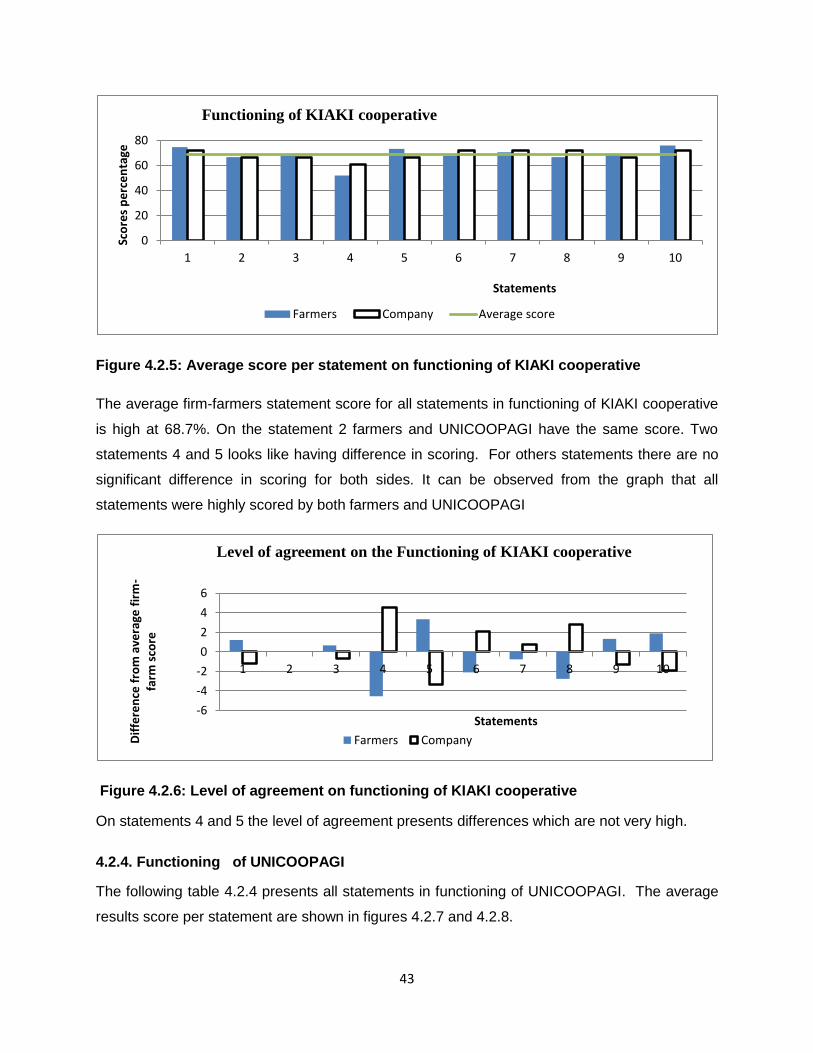
43
Figure 4.2.5: Average score per statement on functioning of KIAKI cooperative
The average firm-farmers statement score for all statements in functioning of KIAKI cooperative
is high at 68.7%. On the statement 2 farmers and UNICOOPAGI have the same score. Two
statements 4 and 5 looks like having difference in scoring. For others statements there are no
significant difference in scoring for both sides. It can be observed from the graph that all
statements were highly scored by both farmers and UNICOOPAGI
Figure 4.2.6: Level of agreement on functioning of KIAKI cooperative
On statements 4 and 5 the level of agreement presents differences which are not very high.
4.2.4. Functioning of UNICOOPAGI
The following table 4.2.4 presents all statements in functioning of UNICOOPAGI. The average
results score per statement are shown in figures 4.2.7 and 4.2.8.
0
20
40
60
80
1 2 3 4 5 6 7 8 9 10
Sco
res
pe
rce
nta
ge
Statements
Functioning of KIAKI cooperative
Farmers Company Average score
-6
-4
-2
0
2
4
6
1 2 3 4 5 6 7 8 9 10
Dif
fere
nce
fro
m a
vera
ge f
irm
-fa
rm s
core
Statements
Level of agreement on the Functioning of KIAKI cooperative
Farmers Company
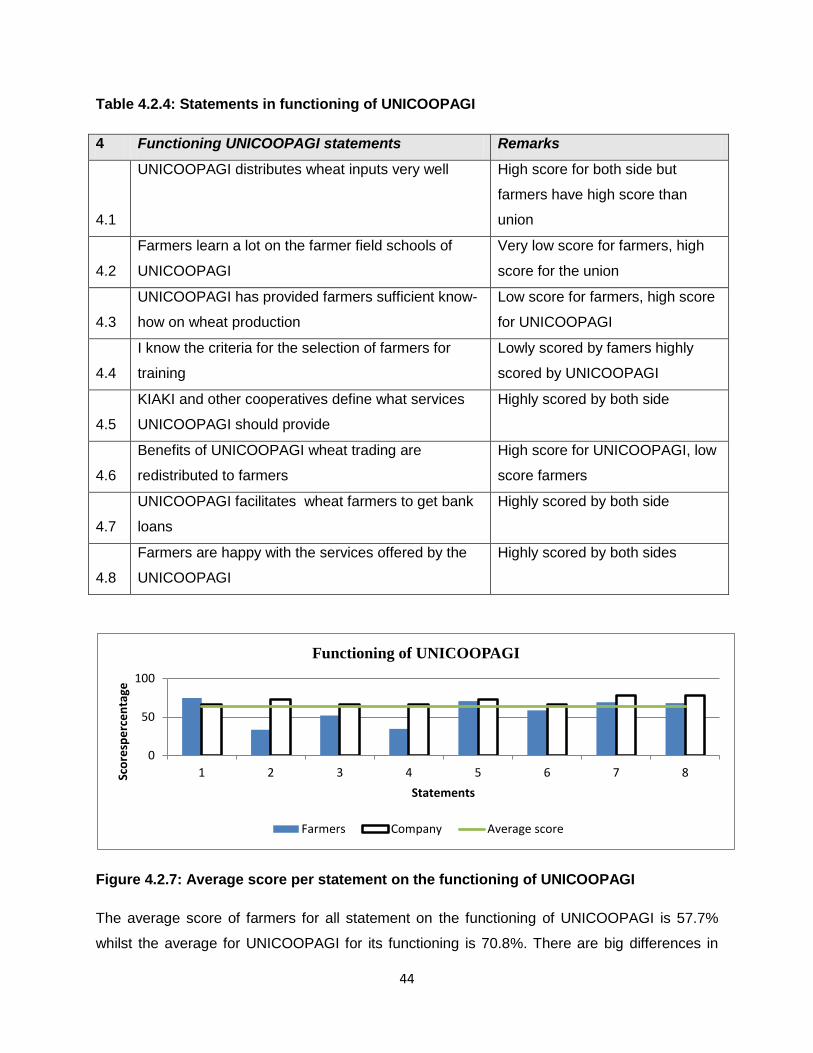
44
Table 4.2.4: Statements in functioning of UNICOOPAGI
4 Functioning UNICOOPAGI statements Remarks
4.1
UNICOOPAGI distributes wheat inputs very well High score for both side but
farmers have high score than
union
4.2
Farmers learn a lot on the farmer field schools of
UNICOOPAGI
Very low score for farmers, high
score for the union
4.3
UNICOOPAGI has provided farmers sufficient know-
how on wheat production
Low score for farmers, high score
for UNICOOPAGI
4.4
I know the criteria for the selection of farmers for
training
Lowly scored by famers highly
scored by UNICOOPAGI
4.5
KIAKI and other cooperatives define what services
UNICOOPAGI should provide
Highly scored by both side
4.6
Benefits of UNICOOPAGI wheat trading are
redistributed to farmers
High score for UNICOOPAGI, low
score farmers
4.7
UNICOOPAGI facilitates wheat farmers to get bank
loans
Highly scored by both side
4.8
Farmers are happy with the services offered by the
UNICOOPAGI
Highly scored by both sides
Figure 4.2.7: Average score per statement on the functioning of UNICOOPAGI
The average score of farmers for all statement on the functioning of UNICOOPAGI is 57.7%
whilst the average for UNICOOPAGI for its functioning is 70.8%. There are big differences in
0
50
100
1 2 3 4 5 6 7 8Sco
resp
erc
en
tage
Statements
Functioning of UNICOOPAGI
Farmers Company Average score

45
scoring for the statement 2 and 4 where farmers’ scores are very low than UNICOOPAGI’
scores. The highest score for farmers is done on distribution of input by UNICOOPAGI at
74.7%. For UNICOOPAGI two statements (7 and 8) were given a same highest score at 77.8%.
The average firm-farmer statement score is high at 64.2%%.
Figure 4.2.8: Level of agreement on the functioning of UNICOOPAGI.
From the above graph it can be observed big difference on level agreement in scoring 2, 3, and
4 statements. For other statement there are no significant differences in level of agreement or
scoring.
4.2.5. Contract between UNICOOPAGI and KIAKI
The following table presents all statements scored by both Farmers and UNICO0PAGI. The
percentage of average score and level of agreement in contract between KIAKI and
UNICOOPAGI are illustrated respectively in figure 4.5.9 and 4.5.10.
-30
-20
-10
0
10
20
30
1 2 3 4 5 6 7 8
Dif
fere
nce
fro
m a
vera
ge f
irm
-f
arm
sco
re
Statements
Level of agreement on the functioning of UNICOOPAGI
Farmers Company
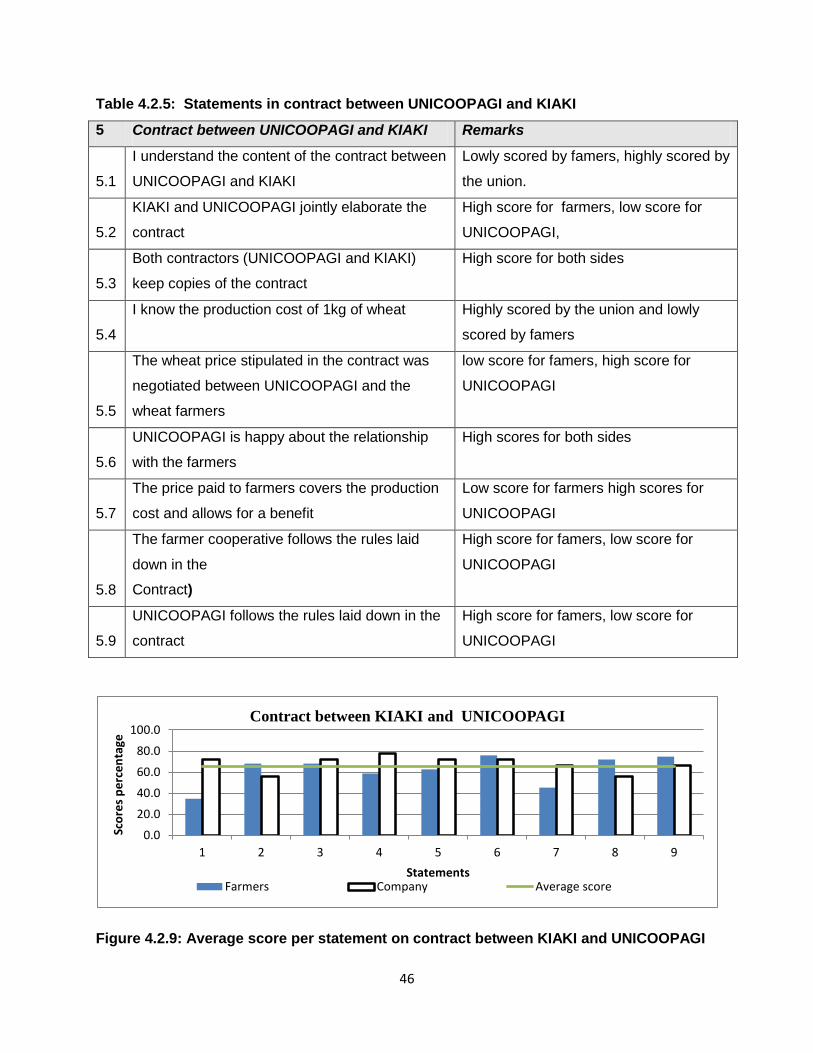
46
Table 4.2.5: Statements in contract between UNICOOPAGI and KIAKI
5 Contract between UNICOOPAGI and KIAKI Remarks
5.1
I understand the content of the contract between
UNICOOPAGI and KIAKI
Lowly scored by famers, highly scored by
the union.
5.2
KIAKI and UNICOOPAGI jointly elaborate the
contract
High score for farmers, low score for
UNICOOPAGI,
5.3
Both contractors (UNICOOPAGI and KIAKI)
keep copies of the contract
High score for both sides
5.4
I know the production cost of 1kg of wheat Highly scored by the union and lowly
scored by famers
5.5
The wheat price stipulated in the contract was
negotiated between UNICOOPAGI and the
wheat farmers
low score for famers, high score for
UNICOOPAGI
5.6
UNICOOPAGI is happy about the relationship
with the farmers
High scores for both sides
5.7
The price paid to farmers covers the production
cost and allows for a benefit
Low score for farmers high scores for
UNICOOPAGI
5.8
The farmer cooperative follows the rules laid
down in the
Contract)
High score for famers, low score for
UNICOOPAGI
5.9
UNICOOPAGI follows the rules laid down in the
contract
High score for famers, low score for
UNICOOPAGI
Figure 4.2.9: Average score per statement on contract between KIAKI and UNICOOPAGI
0.0
20.0
40.0
60.0
80.0
100.0
1 2 3 4 5 6 7 8 9
Sco
res
pe
rce
nta
ge
Statements
Contract between KIAKI and UNICOOPAGI
Farmers Company Average score
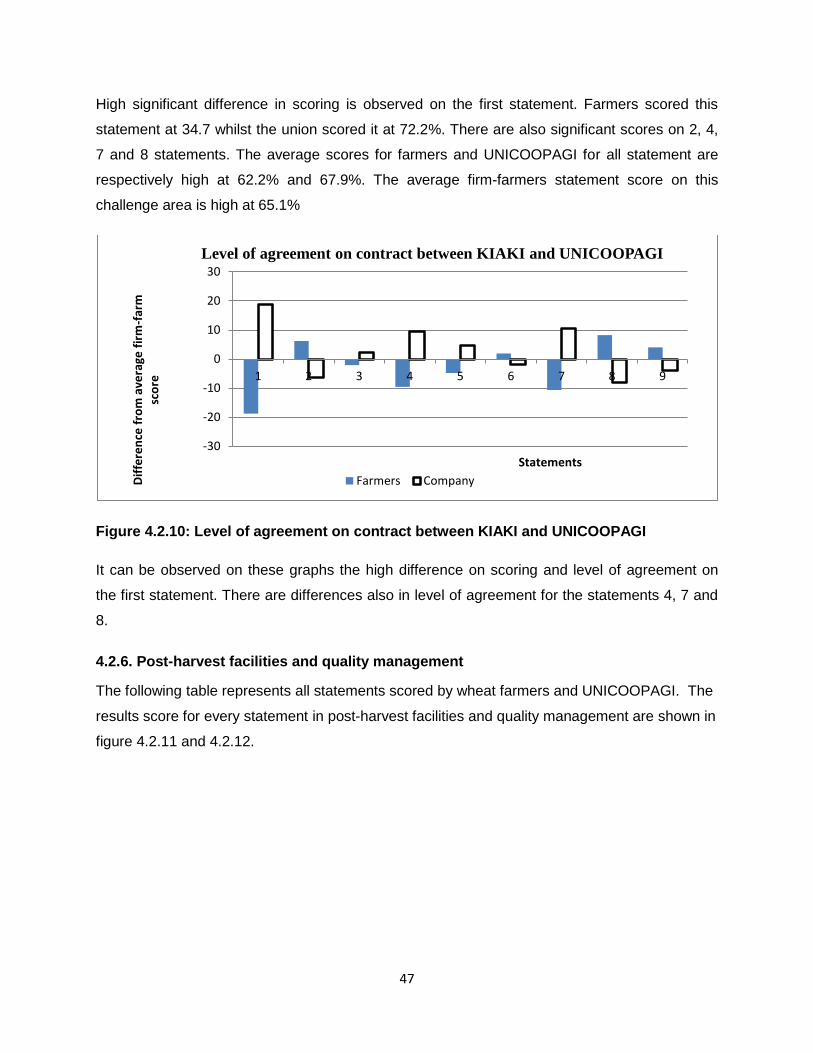
47
High significant difference in scoring is observed on the first statement. Farmers scored this
statement at 34.7 whilst the union scored it at 72.2%. There are also significant scores on 2, 4,
7 and 8 statements. The average scores for farmers and UNICOOPAGI for all statement are
respectively high at 62.2% and 67.9%. The average firm-farmers statement score on this
challenge area is high at 65.1%
Figure 4.2.10: Level of agreement on contract between KIAKI and UNICOOPAGI
It can be observed on these graphs the high difference on scoring and level of agreement on
the first statement. There are differences also in level of agreement for the statements 4, 7 and
8.
4.2.6. Post-harvest facilities and quality management
The following table represents all statements scored by wheat farmers and UNICOOPAGI. The
results score for every statement in post-harvest facilities and quality management are shown in
figure 4.2.11 and 4.2.12.
-30
-20
-10
0
10
20
30
1 2 3 4 5 6 7 8 9
Dif
fere
nce
fro
m a
vera
ge f
irm
-far
m
sco
re
Statements
Level of agreement on contract between KIAKI and UNICOOPAGI
Farmers Company
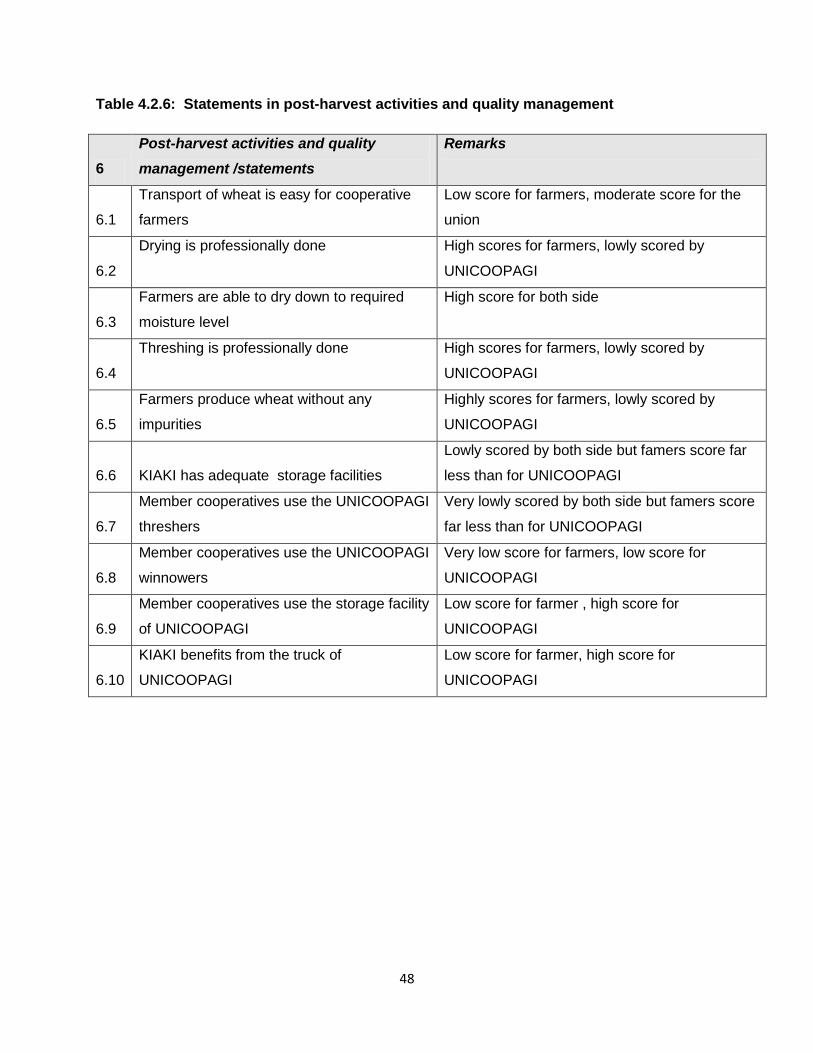
48
Table 4.2.6: Statements in post-harvest activities and quality management
6
Post-harvest activities and quality
management /statements
Remarks
6.1
Transport of wheat is easy for cooperative
farmers
Low score for farmers, moderate score for the
union
6.2
Drying is professionally done High scores for farmers, lowly scored by
UNICOOPAGI
6.3
Farmers are able to dry down to required
moisture level
High score for both side
6.4
Threshing is professionally done High scores for farmers, lowly scored by
UNICOOPAGI
6.5
Farmers produce wheat without any
impurities
Highly scores for farmers, lowly scored by
UNICOOPAGI
6.6 KIAKI has adequate storage facilities
Lowly scored by both side but famers score far
less than for UNICOOPAGI
6.7
Member cooperatives use the UNICOOPAGI
threshers
Very lowly scored by both side but famers score
far less than for UNICOOPAGI
6.8
Member cooperatives use the UNICOOPAGI
winnowers
Very low score for farmers, low score for
UNICOOPAGI
6.9
Member cooperatives use the storage facility
of UNICOOPAGI
Low score for farmer , high score for
UNICOOPAGI
6.10
KIAKI benefits from the truck of
UNICOOPAGI
Low score for farmer, high score for
UNICOOPAGI
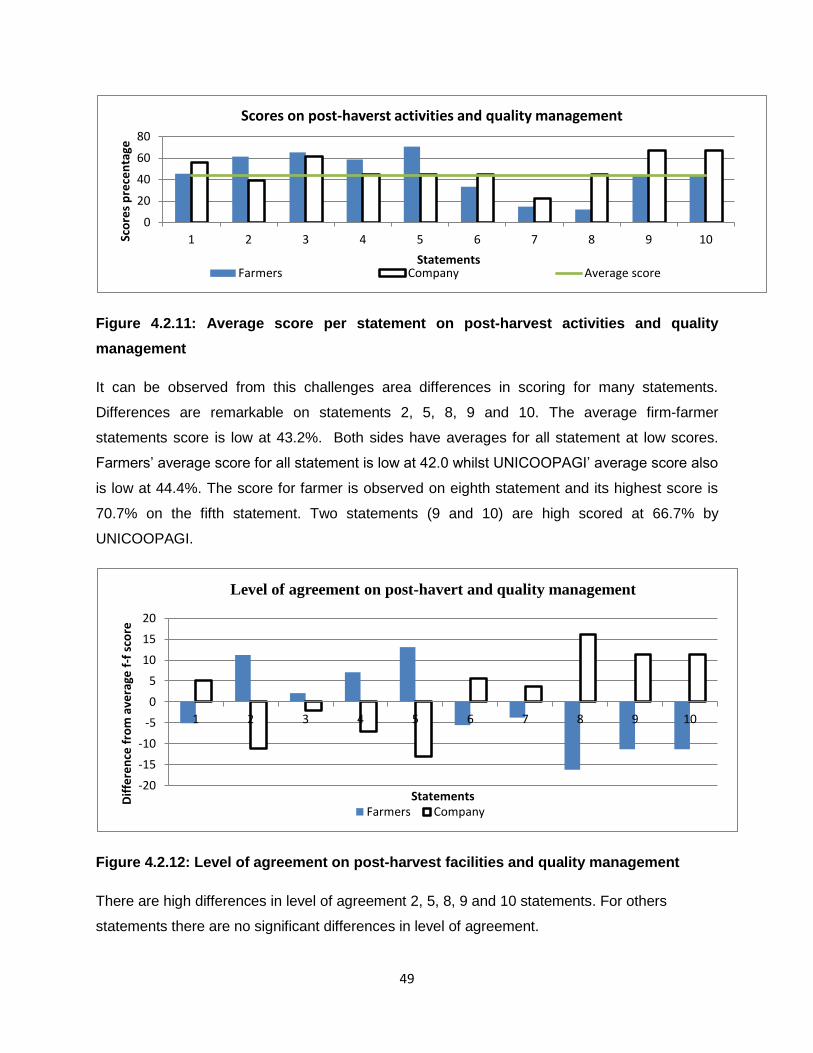
49
Figure 4.2.11: Average score per statement on post-harvest activities and quality
management
It can be observed from this challenges area differences in scoring for many statements.
Differences are remarkable on statements 2, 5, 8, 9 and 10. The average firm-farmer
statements score is low at 43.2%. Both sides have averages for all statement at low scores.
Farmers’ average score for all statement is low at 42.0 whilst UNICOOPAGI’ average score also
is low at 44.4%. The score for farmer is observed on eighth statement and its highest score is
70.7% on the fifth statement. Two statements (9 and 10) are high scored at 66.7% by
UNICOOPAGI.
Figure 4.2.12: Level of agreement on post-harvest facilities and quality management
There are high differences in level of agreement 2, 5, 8, 9 and 10 statements. For others
statements there are no significant differences in level of agreement.
0
20
40
60
80
1 2 3 4 5 6 7 8 9 10Sco
res
pre
cen
tage
Statements
Scores on post-haverst activities and quality management
Farmers Company Average score
-20
-15
-10
-5
0
5
10
15
20
1 2 3 4 5 6 7 8 9 10
Dif
fere
nce
fro
m a
vera
ge f
-f s
core
Statements
Level of agreement on post-havert and quality management
Farmers Company

50
4.2.7. Commercial relations
The following table presents all statements scored by farmers and UNICOOPAGI in commercial
relations. The percentages of average score per statement by UNICOOPAGI and KIAKI
‘farmers are illustrated in figure 4.2.13 and the level of agreement presented also in figure
4.2.14.
Table 4.2.7: Statements in commercial relations
7
Commercial relations
Remarks
7.1
UNICOOPAGI is clear about the quantity of wheat
it wants to buy from the farmers’ cooperative
High score for both side
7.2
UNICOOPAGI clearly informs wheat farmers about quality
requirements
Highly score by both side
7.3
UNICOOPAGI pays farmers a fair price Low score for farmers, high
score for UNICOOPAGI
7.4
Wheat farmers know the price at which UNICOOPAGI sells
the wheat to its clients
Lowly score for farmers, low
score for UNICOOPAGI
7.5 UNICOOPAGI pays wheat farmers at the agreed time High score for both side
7.6 The appreciation of wheat quality is done professionally Moderate score for both side
7.7
The reasons for the rejection of farmers’ wheat quality are
clear
Low score for farmers, high
score for UNICOOPAGI
7.8
The farmer cooperative keep records of the wheat
delivered to UNICOOPAGI
Low score for farmers, high
score for UNICOOPAGI
7.9
I trust weighing scale used by UNICOOPAGI at the local
selling point
Same score for both side
7.10
Wheat farmers are happy to sell their produce to
UNICOOPAGI
Same score for both side
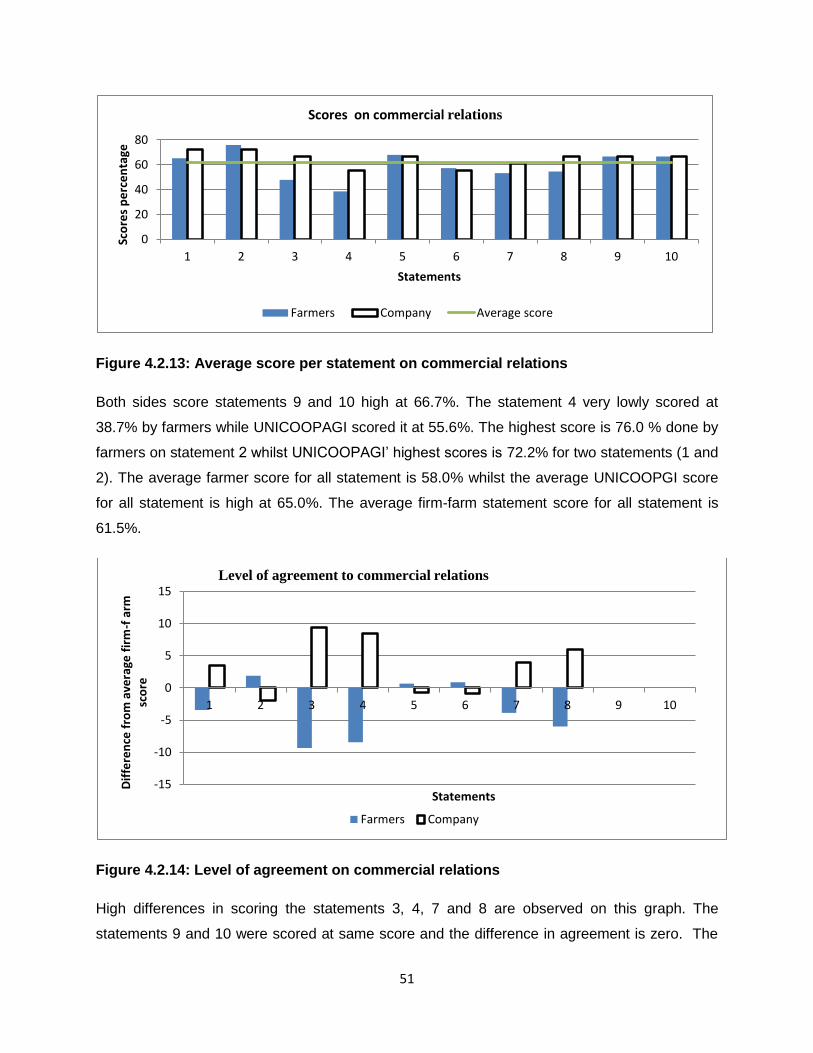
51
Figure 4.2.13: Average score per statement on commercial relations
Both sides score statements 9 and 10 high at 66.7%. The statement 4 very lowly scored at
38.7% by farmers while UNICOOPAGI scored it at 55.6%. The highest score is 76.0 % done by
farmers on statement 2 whilst UNICOOPAGI’ highest scores is 72.2% for two statements (1 and
2). The average farmer score for all statement is 58.0% whilst the average UNICOOPGI score
for all statement is high at 65.0%. The average firm-farm statement score for all statement is
61.5%.
Figure 4.2.14: Level of agreement on commercial relations
High differences in scoring the statements 3, 4, 7 and 8 are observed on this graph. The
statements 9 and 10 were scored at same score and the difference in agreement is zero. The
0
20
40
60
80
1 2 3 4 5 6 7 8 9 10
Sco
res
pe
rce
nta
ge
Statements
Scores on commercial relations
Farmers Company Average score
-15
-10
-5
0
5
10
15
1 2 3 4 5 6 7 8 9 10
Dif
fere
nce
fro
m a
vera
ge f
irm
-f a
rm
sco
re
Statements
Level of agreement to commercial relations
Farmers Company
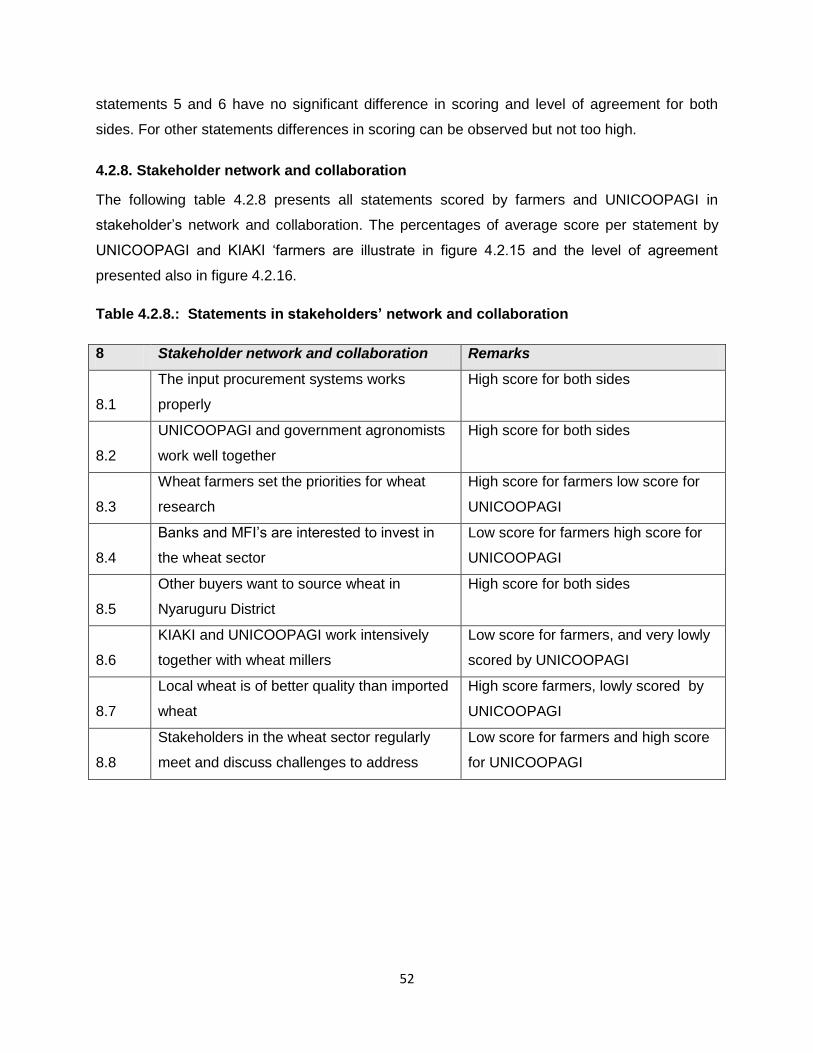
52
statements 5 and 6 have no significant difference in scoring and level of agreement for both
sides. For other statements differences in scoring can be observed but not too high.
4.2.8. Stakeholder network and collaboration
The following table 4.2.8 presents all statements scored by farmers and UNICOOPAGI in
stakeholder’s network and collaboration. The percentages of average score per statement by
UNICOOPAGI and KIAKI ‘farmers are illustrate in figure 4.2.15 and the level of agreement
presented also in figure 4.2.16.
Table 4.2.8.: Statements in stakeholders’ network and collaboration
8 Stakeholder network and collaboration Remarks
8.1
The input procurement systems works
properly
High score for both sides
8.2
UNICOOPAGI and government agronomists
work well together
High score for both sides
8.3
Wheat farmers set the priorities for wheat
research
High score for farmers low score for
UNICOOPAGI
8.4
Banks and MFI’s are interested to invest in
the wheat sector
Low score for farmers high score for
UNICOOPAGI
8.5
Other buyers want to source wheat in
Nyaruguru District
High score for both sides
8.6
KIAKI and UNICOOPAGI work intensively
together with wheat millers
Low score for farmers, and very lowly
scored by UNICOOPAGI
8.7
Local wheat is of better quality than imported
wheat
High score farmers, lowly scored by
UNICOOPAGI
8.8
Stakeholders in the wheat sector regularly
meet and discuss challenges to address
Low score for farmers and high score
for UNICOOPAGI
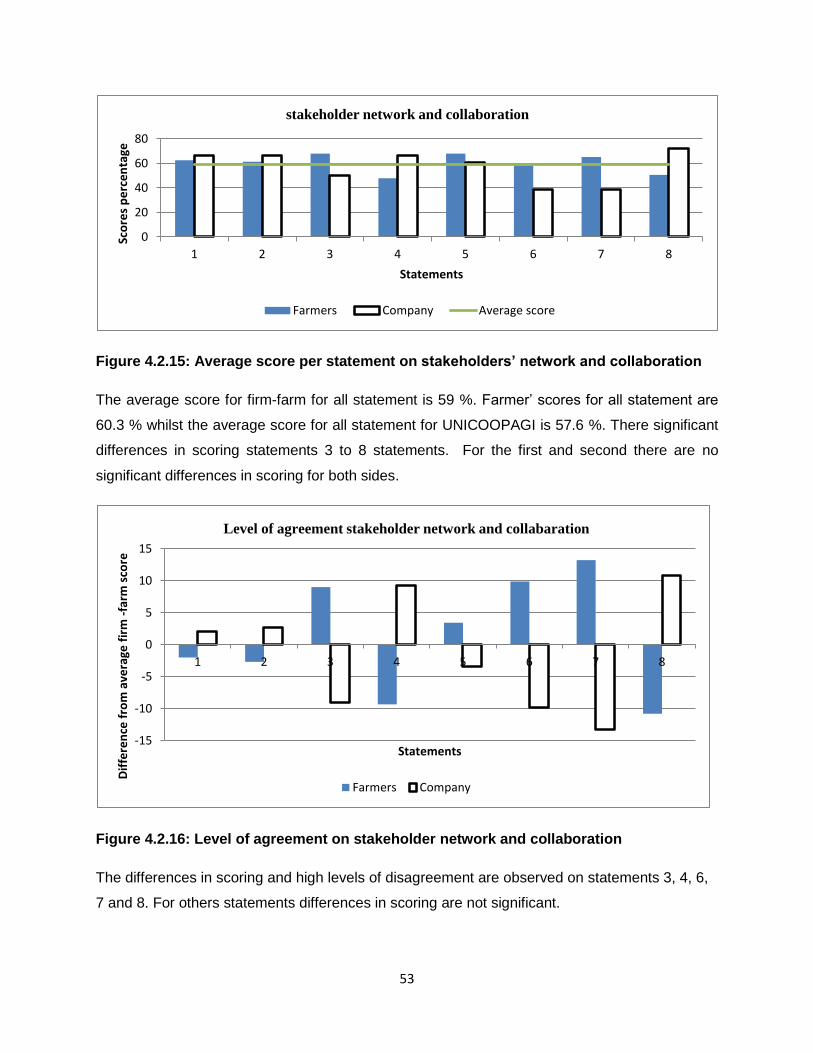
53
Figure 4.2.15: Average score per statement on stakeholders’ network and collaboration
The average score for firm-farm for all statement is 59 %. Farmer’ scores for all statement are
60.3 % whilst the average score for all statement for UNICOOPAGI is 57.6 %. There significant
differences in scoring statements 3 to 8 statements. For the first and second there are no
significant differences in scoring for both sides.
Figure 4.2.16: Level of agreement on stakeholder network and collaboration
The differences in scoring and high levels of disagreement are observed on statements 3, 4, 6,
7 and 8. For others statements differences in scoring are not significant.
0
20
40
60
80
1 2 3 4 5 6 7 8
Sco
res
pe
rce
nta
ge
Statements
stakeholder network and collaboration
Farmers Company Average score
-15
-10
-5
0
5
10
15
1 2 3 4 5 6 7 8
Dif
fere
nce
fro
m a
vera
ge f
irm
-fa
rm s
core
Statements
Level of agreement stakeholder network and collabaration
Farmers Company
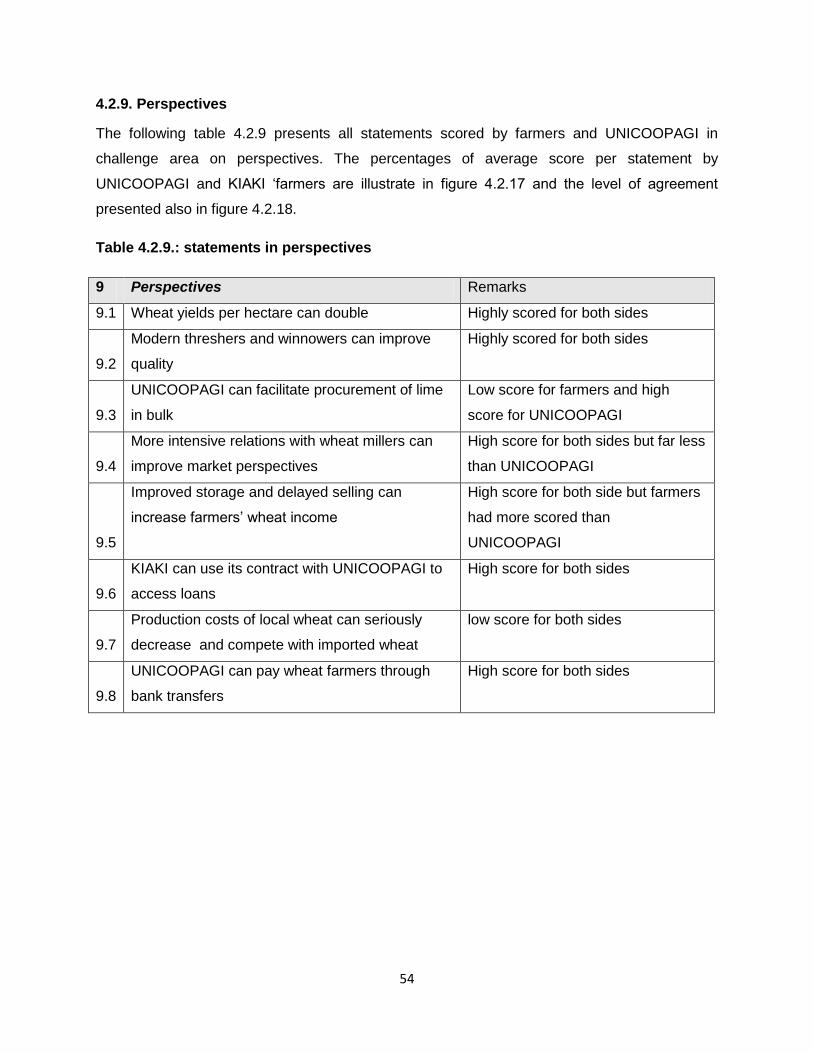
54
4.2.9. Perspectives
The following table 4.2.9 presents all statements scored by farmers and UNICOOPAGI in
challenge area on perspectives. The percentages of average score per statement by
UNICOOPAGI and KIAKI ‘farmers are illustrate in figure 4.2.17 and the level of agreement
presented also in figure 4.2.18.
Table 4.2.9.: statements in perspectives
9 Perspectives Remarks
9.1 Wheat yields per hectare can double Highly scored for both sides
9.2
Modern threshers and winnowers can improve
quality
Highly scored for both sides
9.3
UNICOOPAGI can facilitate procurement of lime
in bulk
Low score for farmers and high
score for UNICOOPAGI
9.4
More intensive relations with wheat millers can
improve market perspectives
High score for both sides but far less
than UNICOOPAGI
9.5
Improved storage and delayed selling can
increase farmers’ wheat income
High score for both side but farmers
had more scored than
UNICOOPAGI
9.6
KIAKI can use its contract with UNICOOPAGI to
access loans
High score for both sides
9.7
Production costs of local wheat can seriously
decrease and compete with imported wheat
low score for both sides
9.8
UNICOOPAGI can pay wheat farmers through
bank transfers
High score for both sides
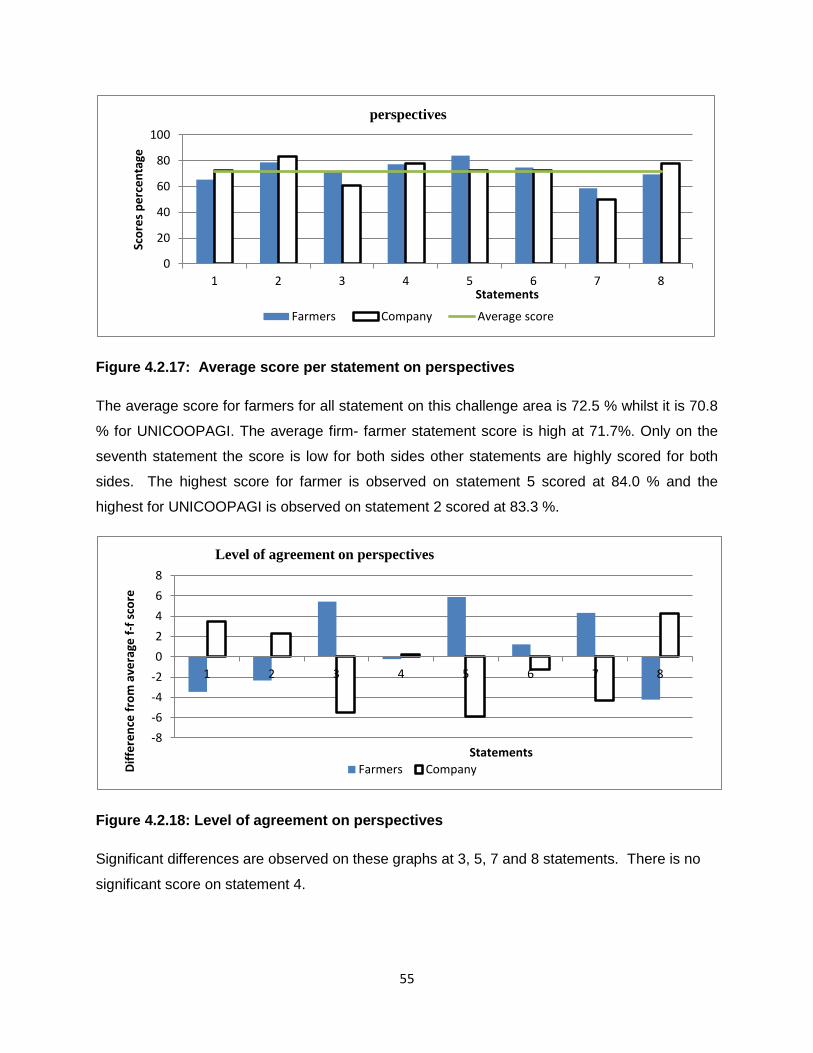
55
Figure 4.2.17: Average score per statement on perspectives
The average score for farmers for all statement on this challenge area is 72.5 % whilst it is 70.8
% for UNICOOPAGI. The average firm- farmer statement score is high at 71.7%. Only on the
seventh statement the score is low for both sides other statements are highly scored for both
sides. The highest score for farmer is observed on statement 5 scored at 84.0 % and the
highest for UNICOOPAGI is observed on statement 2 scored at 83.3 %.
Figure 4.2.18: Level of agreement on perspectives
Significant differences are observed on these graphs at 3, 5, 7 and 8 statements. There is no
significant score on statement 4.
0
20
40
60
80
100
1 2 3 4 5 6 7 8
Sco
res
pe
rce
nta
ge
Statements
perspectives
Farmers Company Average score
-8
-6
-4
-2
0
2
4
6
8
1 2 3 4 5 6 7 8
Dif
fere
nce
fro
m a
vera
ge f
-f s
core
Statements
Level of agreement on perspectives
Farmers Company
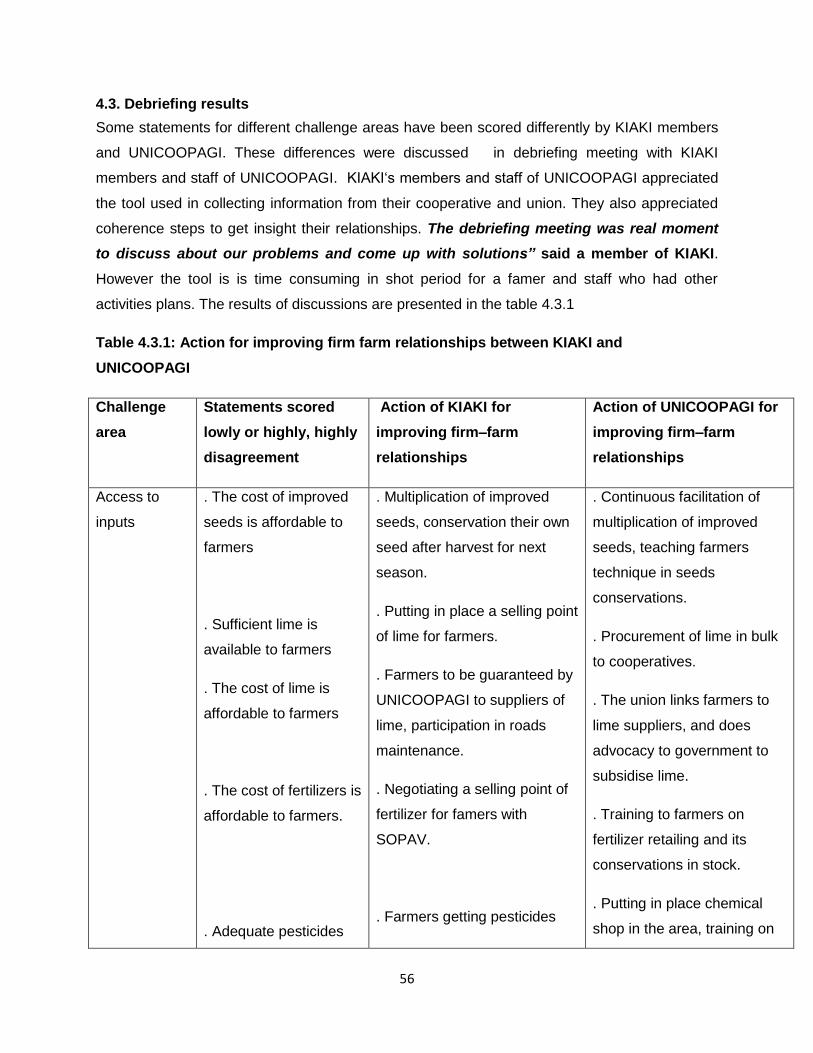
56
4.3. Debriefing results
Some statements for different challenge areas have been scored differently by KIAKI members
and UNICOOPAGI. These differences were discussed in debriefing meeting with KIAKI
members and staff of UNICOOPAGI. KIAKI‘s members and staff of UNICOOPAGI appreciated
the tool used in collecting information from their cooperative and union. They also appreciated
coherence steps to get insight their relationships. The debriefing meeting was real moment
to discuss about our problems and come up with solutions” said a member of KIAKI.
However the tool is is time consuming in shot period for a famer and staff who had other
activities plans. The results of discussions are presented in the table 4.3.1
Table 4.3.1: Action for improving firm farm relationships between KIAKI and
UNICOOPAGI
Challenge
area
Statements scored
lowly or highly, highly
disagreement
Action of KIAKI for
improving firm–farm
relationships
Action of UNICOOPAGI for
improving firm–farm
relationships
Access to
inputs
. The cost of improved
seeds is affordable to
farmers
. Sufficient lime is
available to farmers
. The cost of lime is
affordable to farmers
. The cost of fertilizers is
affordable to farmers.
. Adequate pesticides
. Multiplication of improved
seeds, conservation their own
seed after harvest for next
season.
. Putting in place a selling point
of lime for farmers.
. Farmers to be guaranteed by
UNICOOPAGI to suppliers of
lime, participation in roads
maintenance.
. Negotiating a selling point of
fertilizer for famers with
SOPAV.
. Farmers getting pesticides
. Continuous facilitation of
multiplication of improved
seeds, teaching farmers
technique in seeds
conservations.
. Procurement of lime in bulk
to cooperatives.
. The union links farmers to
lime suppliers, and does
advocacy to government to
subsidise lime.
. Training to farmers on
fertilizer retailing and its
conservations in stock.
. Putting in place chemical
shop in the area, training on
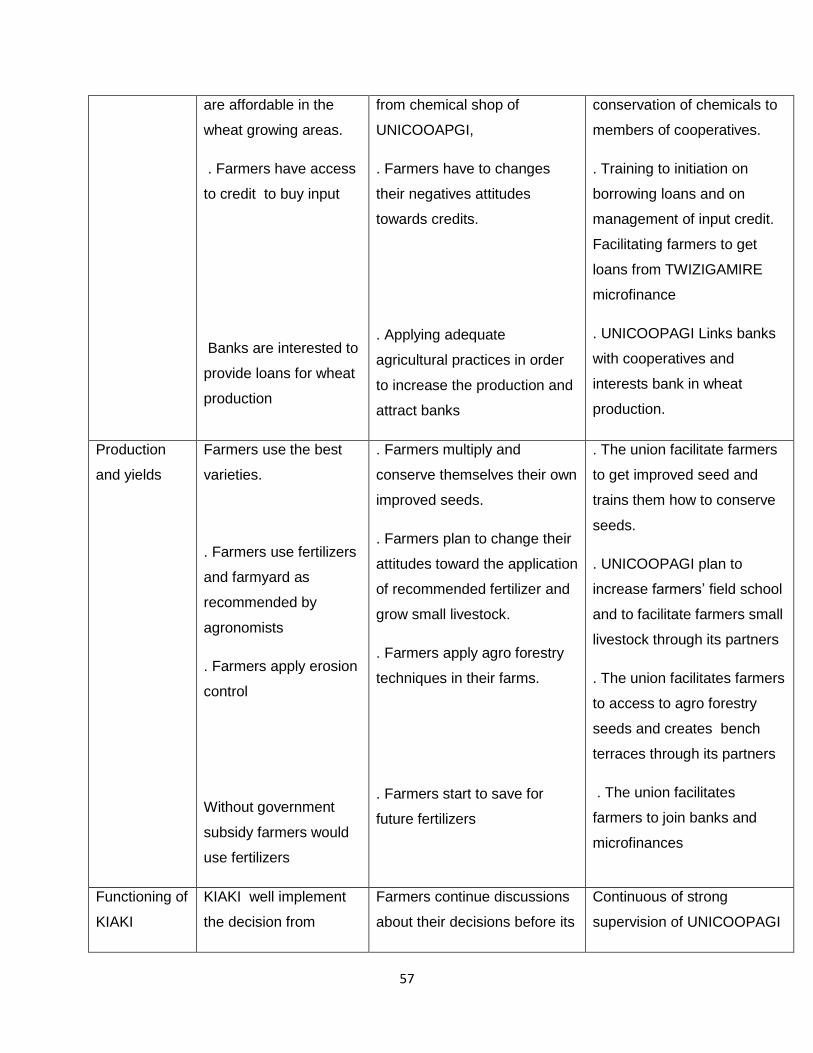
57
are affordable in the
wheat growing areas.
. Farmers have access
to credit to buy input
Banks are interested to
provide loans for wheat
production
from chemical shop of
UNICOOAPGI,
. Farmers have to changes
their negatives attitudes
towards credits.
. Applying adequate
agricultural practices in order
to increase the production and
attract banks
conservation of chemicals to
members of cooperatives.
. Training to initiation on
borrowing loans and on
management of input credit.
Facilitating farmers to get
loans from TWIZIGAMIRE
microfinance
. UNICOOPAGI Links banks
with cooperatives and
interests bank in wheat
production.
Production
and yields
Farmers use the best
varieties.
. Farmers use fertilizers
and farmyard as
recommended by
agronomists
. Farmers apply erosion
control
Without government
subsidy farmers would
use fertilizers
. Farmers multiply and
conserve themselves their own
improved seeds.
. Farmers plan to change their
attitudes toward the application
of recommended fertilizer and
grow small livestock.
. Farmers apply agro forestry
techniques in their farms.
. Farmers start to save for
future fertilizers
. The union facilitate farmers
to get improved seed and
trains them how to conserve
seeds.
. UNICOOPAGI plan to
increase farmers’ field school
and to facilitate farmers small
livestock through its partners
. The union facilitates farmers
to access to agro forestry
seeds and creates bench
terraces through its partners
. The union facilitates
farmers to join banks and
microfinances
Functioning of
KIAKI
KIAKI well implement
the decision from
Farmers continue discussions
about their decisions before its
Continuous of strong
supervision of UNICOOPAGI
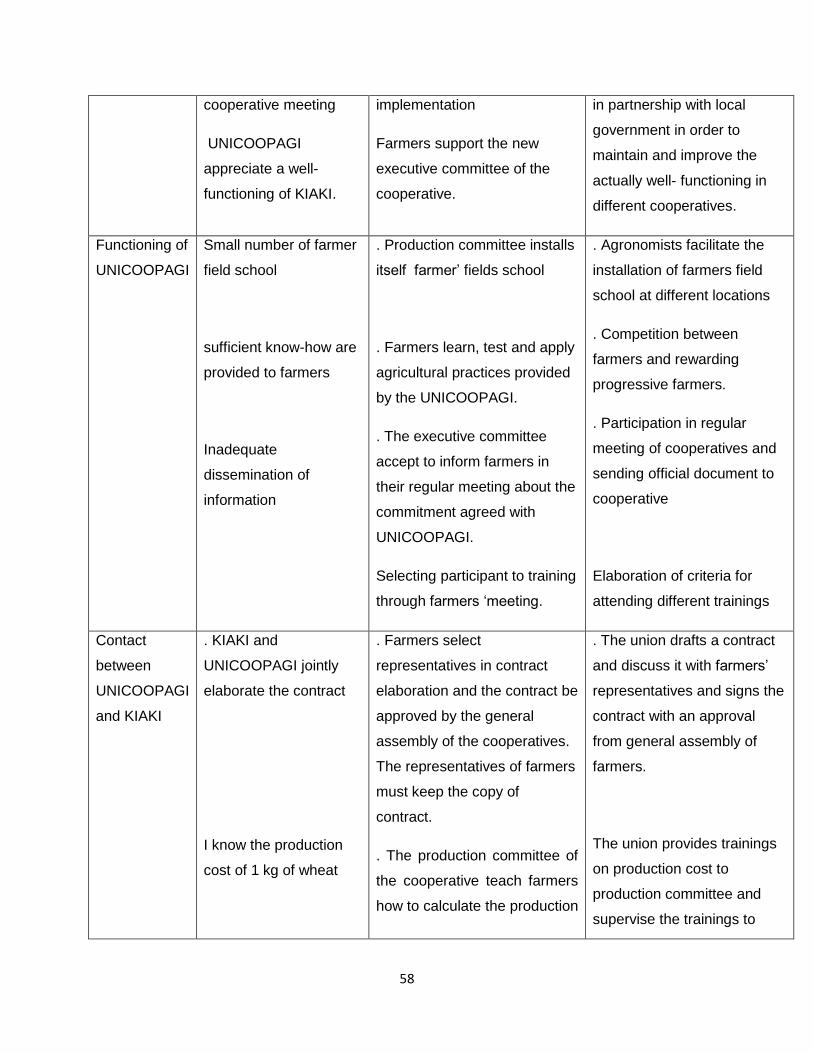
58
cooperative meeting
UNICOOPAGI
appreciate a well-
functioning of KIAKI.
implementation
Farmers support the new
executive committee of the
cooperative.
in partnership with local
government in order to
maintain and improve the
actually well- functioning in
different cooperatives.
Functioning of
UNICOOPAGI
Small number of farmer
field school
sufficient know-how are
provided to farmers
Inadequate
dissemination of
information
. Production committee installs
itself farmer’ fields school
. Farmers learn, test and apply
agricultural practices provided
by the UNICOOPAGI.
. The executive committee
accept to inform farmers in
their regular meeting about the
commitment agreed with
UNICOOPAGI.
Selecting participant to training
through farmers ‘meeting.
. Agronomists facilitate the
installation of farmers field
school at different locations
. Competition between
farmers and rewarding
progressive farmers.
. Participation in regular
meeting of cooperatives and
sending official document to
cooperative
Elaboration of criteria for
attending different trainings
Contact
between
UNICOOPAGI
and KIAKI
. KIAKI and
UNICOOPAGI jointly
elaborate the contract
I know the production
cost of 1 kg of wheat
. Farmers select
representatives in contract
elaboration and the contract be
approved by the general
assembly of the cooperatives.
The representatives of farmers
must keep the copy of
contract.
. The production committee of
the cooperative teach farmers
how to calculate the production
. The union drafts a contract
and discuss it with farmers’
representatives and signs the
contract with an approval
from general assembly of
farmers.
The union provides trainings
on production cost to
production committee and
supervise the trainings to
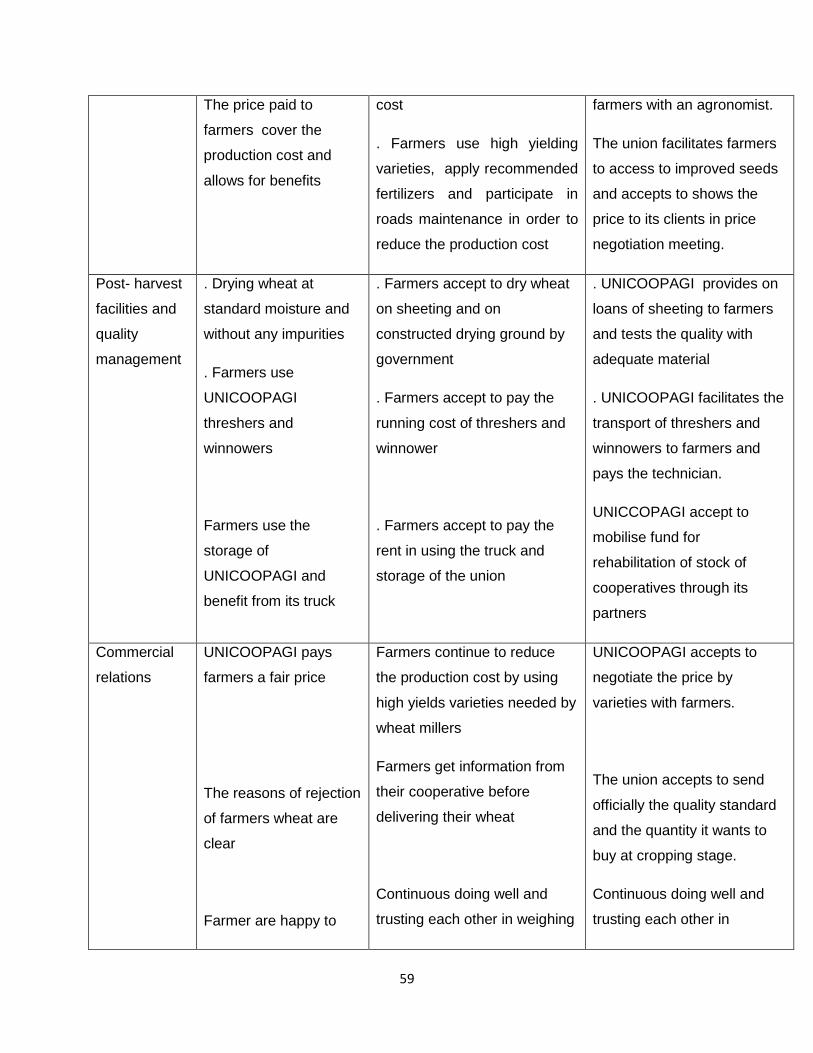
59
The price paid to
farmers cover the
production cost and
allows for benefits
cost
. Farmers use high yielding
varieties, apply recommended
fertilizers and participate in
roads maintenance in order to
reduce the production cost
farmers with an agronomist.
The union facilitates farmers
to access to improved seeds
and accepts to shows the
price to its clients in price
negotiation meeting.
Post- harvest
facilities and
quality
management
. Drying wheat at
standard moisture and
without any impurities
. Farmers use
UNICOOPAGI
threshers and
winnowers
Farmers use the
storage of
UNICOOPAGI and
benefit from its truck
. Farmers accept to dry wheat
on sheeting and on
constructed drying ground by
government
. Farmers accept to pay the
running cost of threshers and
winnower
. Farmers accept to pay the
rent in using the truck and
storage of the union
. UNICOOPAGI provides on
loans of sheeting to farmers
and tests the quality with
adequate material
. UNICOOPAGI facilitates the
transport of threshers and
winnowers to farmers and
pays the technician.
UNICCOPAGI accept to
mobilise fund for
rehabilitation of stock of
cooperatives through its
partners
Commercial
relations
UNICOOPAGI pays
farmers a fair price
The reasons of rejection
of farmers wheat are
clear
Farmer are happy to
Farmers continue to reduce
the production cost by using
high yields varieties needed by
wheat millers
Farmers get information from
their cooperative before
delivering their wheat
Continuous doing well and
trusting each other in weighing
UNICOOPAGI accepts to
negotiate the price by
varieties with farmers.
The union accepts to send
officially the quality standard
and the quantity it wants to
buy at cropping stage.
Continuous doing well and
trusting each other in
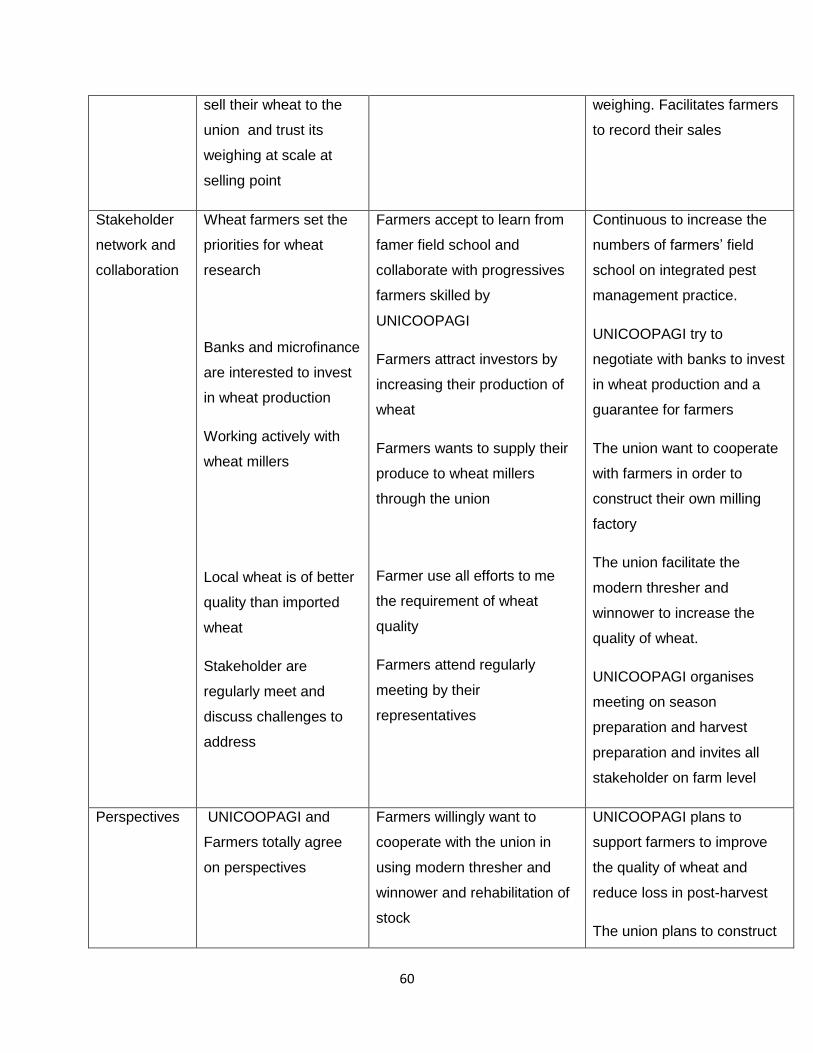
60
sell their wheat to the
union and trust its
weighing at scale at
selling point
weighing. Facilitates farmers
to record their sales
Stakeholder
network and
collaboration
Wheat farmers set the
priorities for wheat
research
Banks and microfinance
are interested to invest
in wheat production
Working actively with
wheat millers
Local wheat is of better
quality than imported
wheat
Stakeholder are
regularly meet and
discuss challenges to
address
Farmers accept to learn from
famer field school and
collaborate with progressives
farmers skilled by
UNICOOPAGI
Farmers attract investors by
increasing their production of
wheat
Farmers wants to supply their
produce to wheat millers
through the union
Farmer use all efforts to me
the requirement of wheat
quality
Farmers attend regularly
meeting by their
representatives
Continuous to increase the
numbers of farmers’ field
school on integrated pest
management practice.
UNICOOPAGI try to
negotiate with banks to invest
in wheat production and a
guarantee for farmers
The union want to cooperate
with farmers in order to
construct their own milling
factory
The union facilitate the
modern thresher and
winnower to increase the
quality of wheat.
UNICOOPAGI organises
meeting on season
preparation and harvest
preparation and invites all
stakeholder on farm level
Perspectives UNICOOPAGI and
Farmers totally agree
on perspectives
Farmers willingly want to
cooperate with the union in
using modern thresher and
winnower and rehabilitation of
stock
UNICOOPAGI plans to
support farmers to improve
the quality of wheat and
reduce loss in post-harvest
The union plans to construct
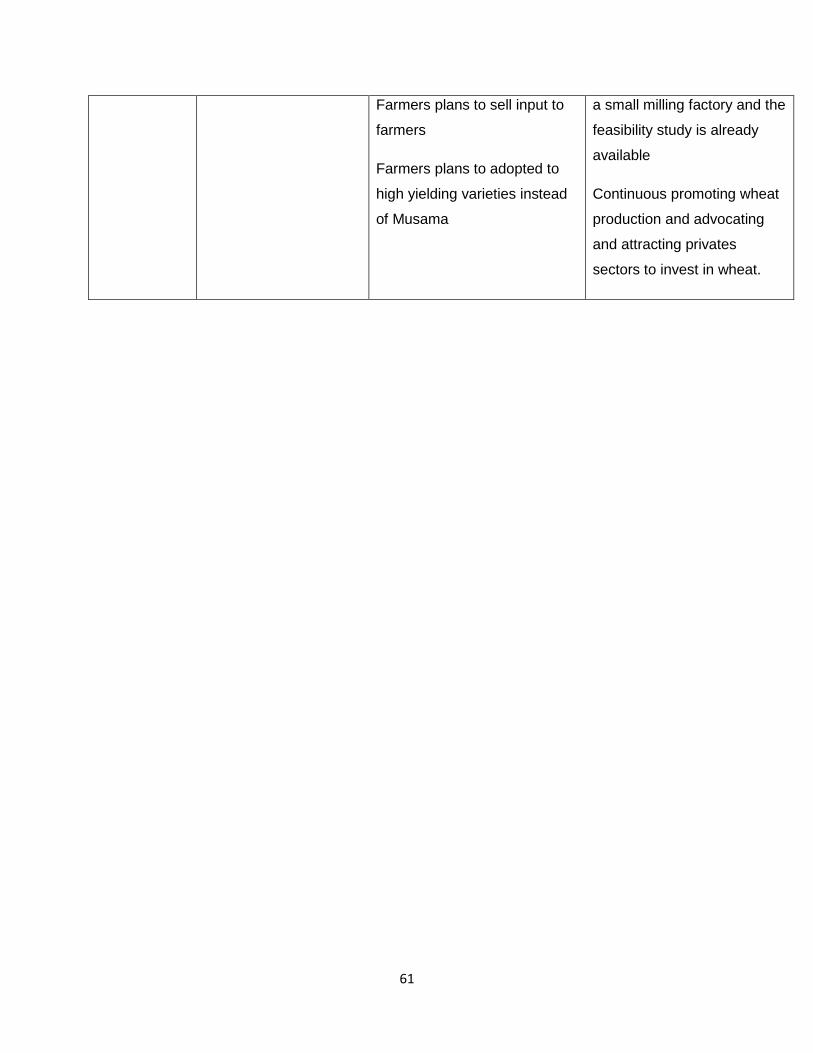
61
Farmers plans to sell input to
farmers
Farmers plans to adopted to
high yielding varieties instead
of Musama
a small milling factory and the
feasibility study is already
available
Continuous promoting wheat
production and advocating
and attracting privates
sectors to invest in wheat.
62
5. DISCUSSION AND INTERPRETATION OF RESULTS
In this chapter data are discussed using a value chain analysis and food security dimensions:
Availability, Accessibility, Utilisation and Sustainability and also according to challenge areas
The sources of information in the discussion are data processed and presented in the above
chapter, the literature review and the observation done during field work. The overall score
firm-farmers relationship for all challenge areas is presented at 59.9%. This shows a moderate
relationship between UNICOOPAGI and KIAKI. For some specific challenge areas low scores
were attributed by wheat farmers as presented in previous chapter and need a high attention by
UNICOOPAGI.
5.1. Access to inputs
KIAKI’ farmers and UNICOOPAGI agree on the availability of different varieties of wheat to
farmers because it is distributed by the Government through its policies of promotion of six
major crops in which wheat is included. The accessibility to some varieties such as KS Mwamba
and 161 is still a challenge for famers because they are still in multiplication. “To obtain these
varieties in its distribution by government, farmers are required to have 0.5 ha of plot,
fertilizer (DAP and Urea) sufficient organic manure which are not easier to many farmers”
said the president of KIAK.
The availability of lime to address soil acidity stressed farmers in wheat production. As observed
in the area, and witnessed by farmers and UNICOOPAGI, there is no shop for lime in Nyaruguru
district. The unavailability and inaccessibility of lime has presented a high cost to farmers and
most of the time farmers resort to cultivating without it or to apply a small quantity of lime and as
result very low production has been observed. Farmers and UNICOOPAGI scored at very low
score the availability and affordability of pesticides in wheat growing, because there are no
selling points of them in the area and their prices are very high. Even if pesticides are distributed
by the government, most of the time they is a delay in the distribution by the government and
the gravity of pest or disease is irreversible when the eventually arrive. The bureaucracy in local
government in distribution of pesticides was revealed by farmers and this affected its
accessibility to wheat farmers which leads to low crop production. Both farmers and
UNICOOPAGI suggests that the pesticides be distributed at the same time with improved seeds
and fertilizers so they can apply it at the right time.
63
Fertilizers of wheat are subsidised at 50% of the price and the farmers have to pay the
remaining price before getting these fertilisers (MINAGRI, 2007). Both sides scored lowly the
affordability of fertilizer because even if these fertilizers are subsided some poor farmers are
incapable to pay their part. As revealed by the coordinator of UNICOOPAGI farmers had for a
long time benefited from free fertilisers from donors and they refuse to pay for them. The
accessibility to credit to buy inputs and loans for wheat production is a challenge and was lowly
scored by farmers. “Banks are not interested in providing loans in wheat production
because of instability of climate and the low production of wheat” said the coordinator of
UNICOOPAGI. Only TWIZIGAMIRE microfinance can help farmers but with a high interest rate
on the loans said a farmer.
The average score for statement on accessibility was low at 45.4% and this emphasises the
gravity of the matter in accessibility to inputs to wheat farmers in Nyaruguru district. This score
concretises also the unavailability and inaccessibility of inputs described in sub chapter 4.1.1 of
the business case. Both sides scored this challenge area below 50%. The later indicates poor
relationship between UNICOOPAGI and wheat farmers of Nyaruguru district in distribution of
inputs.
The accessibility to inputs and credit is the major concern of farmers in firm-farmer relationship
as stipulated by Bauman (2000) as obligation for the firm. As recorded by William (2006), in
southern Uganda, the use of improved seeds in firm-farm relationships increased the production
of wheat at 96% while the use of fertiliser increased the production by 50%. A high improvement
in food security by favourable firm-farm relationship was observed in India where income of
farmers under contract increased at 64% by using improved seeds of tomatoes and an assured
market (Eaton and Shepherd, 2001). The same record can be observed in southern Rwanda
with a strong improvement in distribution and accessibility to inputs and also with adequate
relationships between farmers and companies.
5.2. Production and yields
MINAGRI (2011) mentioned the increase of wheat production among others crops promoted in
CIP. Farmers scored moderately the increase of production because they still have problems
on accessibility of improved varieties needed by wheat millers. They grow Musama variety
which is tolerant to soil acidity but with low production, low content of flour and protein (ISAR,
2008). UNICOOPAGI as services provider highly scored the increase in wheat production. It
finds out a good improvement in wheat production as also recorded by NISR (2011) a great
64
improvement in production of promoted crops comparing to the previous years. However the
yield was not increased, because farmers were pushed to extend their plantation of wheat
motivated by the free distribution of inputs but not focusing on wheat productivity. In debriefing
meeting famers accepted the insufficient application of organic manure because of lack of
sufficient cattle. As revealed by the agronomist of UNICOOPAGI, around 30% of wheat farmers
can buy subsidised fertilizers in his work area while others use small quantity or nothing. He
thinks that without government subsidy farmers will have difficulty in using fertilizers. Farmers
themselves in the debriefing meeting accepted their incapacity to afford non subsidised
fertilizers. Both sides recognised the use of insufficient lime to address the issue of soil acidity
because of its inaccessibility and unavailability in the area which leads to low wheat production.
Looking to the topography of the area farmers can hardly apply different erosion control
measures. High rainfall and mountainous slope create the difficulties to framers to control
erosion. The continuous degradation of soil increases the soil acidity and decrease the soil
productivity. The overall score to this challenge area is moderate. For both sides the scores
area is around 50% which shows the low level of production of wheat in Nyaruguru district. The
relationship in wheat production between UNICOOPAGI and wheat farmers can be mostly seen
in extension services because the provision of other inputs is done by the government and
private companies.
The same observation of low production and yield has been found by Vellema (2002) in tropical
regions like sub Sahara in Africa where firm-farm relationship in crop production was seen as an
institutionally innovative arrangement; wherein growers’ competence to deal with new financial,
organisational and technological conditions importantly affected whether yield improved income
and productivity or not.
5.3. Functioning of KIAKI cooperative
“After electing a new committee last year, things are going well in our cooperative” said a
member of KIAKI cooperative. This improvement is resulting from the government policy on
regular monitoring on management of cooperatives by local government. Both sides KIAKI’
members and UNICOOPAGI highly appreciated the way KIAKI’ leaders work and implement
democratically the decisions from their meetings. Farmers appreciate the functioning of the
production committee by its new vision in use of new improved seeds, organisation of their
activities and the way it collaborates with farmers and partners. The contracted loans repayment
is highly appreciated by UNICOOPAGI comparing to previous years because good
65
management of the cooperative is also well appreciated. Farmers and UNICOOPAGI highly
scored the benefit sharing of the sales of wheat by all members of the household. This was
confirmed by ISAR (2008) and USAID (2010) which recognised wheat as a staple food in which
all members of the household are involved in Nyaruguru district. Revenues from wheat which
are normally obtained in season B are mostly invested in Irish potatoes production in rotation
with wheat. Information on financial issues should be explained and shared very well with
farmer because it scored relatively low at 52%. The high score at 68.7% of average firm-farmer
for all statements on the functioning of KIAKI shows the good relationship between
UNICOOPAGI and different cooperatives in helping its capacity building and its management.
5.4. Functioning of UNICOOPAGI
Farmers appreciated the monitoring done by UNICOOPAGI in distribution of inputs during the
cropping season because UNICOOPAGI as a union of cooperatives played a role of services
provider and advocacy for it. Both sides accepted the well distribution of inputs and highly
scored around 70%. Extension services provided including the farmer field school and the skills
needed in wheat production are still insufficient. Few farmers’ field schools have been installed
by UNICCOPAGI and all farmers cannot easily learn from them and this is possibly why they
scored this statement at very low score. The same low score was attributed to criteria in
selection of farmers for training which is done mostly by partners of UNICOOPAGI. “When the
president of our cooperative is asked to select participants for training, he chooses
anyone but mostly same persons in cooperatives either from executive committee or
from his relatives” said a farmer. This shows how fair selection criteria should been adopted
and UNICOOPAGI needs to pay attention in order to facilitate the participation in capacity
building for all members of cooperative.
The planning of activities is jointly done by UNICOOPAGI and cooperative representatives. In
this planning cooperatives define what they need from UNICOOPAGI and both sides
appreciated the collaboration in this activity by attributing a score higher than 70%. The benefits
of UNICOOPAGI from the trading of wheat are redistributed to farmers through different
activities such as planning of activities, extension services and regular workshop. But farmers
are not happy with this redistribution and had lowly scored this statement at 58.7% because
they don’t know exactly the benefit of UNICOOPAGI and also the union don’t share information
to all members of the cooperatives but only to their representatives.
66
Both sides UNICOOPAGI and KIAKI’ members appreciated the facilitations to wheat farmers to
get loan by creating microfinance TWIZIGAMIRE for them. “Farmers accessed easily to loans
from this microfinance but with high interest rate which limited some of them” said the
president of KIAKI. In the debriefing meeting farmers showed the happiness of the services
offered by UNICCOPAGI to them but as said by a farmer “it can improve to some activities
such increasing the numbers of farmers’ field school”. KIAKI’s farmers appreciated all
statements in the functioning of UNICOOPAGIA at 57.7% which shows the low dissemination of
information on the functioning of the union to farmers. The coordinator of UNICOOPAGI
recognised this weakness by saying in debriefing meeting that “our union is still having a
communication problem to farmers and can affect negatively our relationships with
KIAKI”.
Lack of proper management in communication or others aspect and inadequate observation of
its obligation in contract by the company may lead to losing its trust from farmers. Companies
may have unrealistic expectations of the market for their product or the market may collapse
unexpectedly owing to transport problems, civil unrest, change in government policy or the
arrival of a competitor. Such occurrences can lead managers to reduce farmers' quotas (FAO,
2001).
5.5. Contract between UNICOOPAGI and KIAKI
Two types of contract are observed between UNICOOPAGI and KIAKI; informal and formal
contracts. These contracts as explained by Prowse (2012) and Da Silva (2001) are respectively
oral based on trustiness between farmers and companies and written contract signed between
two contractors. The informal contract is observed in wheat production and the formal contract
in multiplication of improved seed and in wheat collecting and buying. Individual farmers and
cooperatives benefited from the formal contract. As scored lowly the content of the contract is
not understood by farmers because they did not participate jointly with UNICOOPAGI in its
elaboration. “Most of the time, a contract is elaborated by the union and signed by
cooperative representatives without a consultation of general assembly of farmers” said
a farmer as result the implementation is difficult to them. The union qualifies them incapable to
support contract elaboration because most of them are illiterate. As long as farmers did not
keep a copy of their contract they can’t also follow the rules laid down in it. The poor farmers’
participation in contract elaboration is confirmed by a low score of 55.6 % given by
UNICOOPAGI and this indicates a poor transparency in collaboration.
67
Almost around 58% of KIAKI ‘members knew how to calculate the production cost of one Kg of
wheat. This comes from a strong assistance of NGO and government projects as mentioned by
USAID (2010). With this capacity, farmers through their representatives participate in
negotiations meeting with UNICOOPAGI and others buyers in collaboration also with local
government. “It has been found that in price negotiations, famers exaggerated the
production cost of 1 kg as a result the price was to some extent fixed by the local
government and all participants in meeting accepted the proposition” said the president of
KIAKI. Even if farmers are represented in price setting they claim that the price given to their
produce did not cover all the production cost whilst the union pretends giving to farmers a fair
price. The price given is for all varieties of wheat which demotivates farmers who have different
production cost for different varieties. Farmers indicate the fluctuation of the price during year
the because of high demand of the product as also confirmed by Mutijima (2004) and MINAGRI
(2011) but UNICOOPAGI did not change the negotiated price. The average firm-farmer
statement score for all statements is high at 65.1% and this shows the willingness in
establishing smart contract between UNICOOPAGI and KIAKI. Farmers scored all statement
below that of UNICOOPAGI and this shows also a need in improvement in relationship by both
sides especially to the union in contract elaboration and implementation.
5.6. Post- harvest facilities and quality management
Farmers are still using the traditional material in harvesting, drying, threshing, and winnowing
which affect the quality and lead to and high loss in post-harvest. FAO (2010) indicated
estimation at 14.5 % of the total production is lost in post-harvest activities in Rwanda. “There
is no choice, we lost a lot of produce in winnowing, threshing and drying of wheat and
also our energy and time” said a farmer. UNICOOPAGI (2012) has also the same average
when it compared the traditional post-harvest and the modern threshers and winnower but the
later are not accessible and affordable to farmers. The score on the use of these threshers and
winnowers was low at 12%. The drying is done ground or on sheeting and threshing and
winnowing done manually as result high impurities and low quality of wheat. Wheat among
others crops was classified by CIP (2011) in crops which need a good processing and post-
harvest facilities in order to compete the imported wheat and had started to construct different
drying grounds in local areas but are still few in number.
68
After buying wheat from farmers, the union has to eliminate all impurities and tests content of
moisture with modern instruments before its packaging. KIAKI has small storehouse in critical
situation and need to be renovated whilst UNICOOPAGI has benefited from TRACAIRE, an
adequate store with 60 tons capacity but not shared with farmers. Immediately at peak harvest,
farmers are obliged to sell their produce because they could not store it in their houses or in
cooperative’ stock. The only alternative they have is to sell it to UNICOOPAGI which has limited
financial capacity to buy all the produce. The union had also a small stock all because of small
capacity.
Roads are not maintained destroyed by high erosion on high rainfall and transport cost of input
and production is very high. Farmers could benefit from the union’ truck but since the cost is
high they preferred to transport by head from farm gate to the selling point or from the suppliers
to their farms. “All these activities, efforts used, time spent increased the production cost
and the price given cannot cover all of them” said a farmer. The average score at 43.2%
given by the union and farmers to all statements of this challenge area emphasises the different
problems in post-harvest facilities in wheat production. These challenges were also identified by
Terpend, Kayumba and Ntaganda(2007) to be improved in order to meet the quality standard
required by wheat miller in Rwanda. An amelioration of relationship in post- harvest facilities and
quality management of UNICOOPAGI in partnership with other stakeholders will increase the
quality and the production of wheat in Rwanda. Farmers and UNICOOPAGI willingly want to
cooperate and to improve their relationships in post-harvest facilities by sharing bags for
packaging and sheeting for drying on.
5.7. Commercial relations
The commercial relation is generally based on oral contract. Farmers knew through meeting and
field workers that the union will buy their produce of wheat but they were not informed about the
quantity it wanted to buy. The lack of this information affected their plans in wheat production
and an improvement for this crop. It allowed them to produce for subsistence not for a strong
market. Farmers knew the quality requirement for wheat to deliver to UNICOOPAGI but this
information was not officially disseminated. “We knew exactly the quality standard when our
productions were refused at the selling point” said farmers. The test of the quality at selling
point is done by appreciation with eyes and also by crashing grain wheat with teeth of the
collectors. This test of the quality is not appreciated by farmers because most of the time their
production are refused not because of the low quality but because of inadequate friendships
with some collectors.
69
At local selling point farmers trust the weighing scale of UNICOOPAGI and most of the time they
sell to this union not because they are paying a fair price but because of good weighing done
compared to others buyers. The fact that there is no alternative strong buyer like UNICOOPAGI
pushed farmers to sell their produce to the union. For wheat farmer the price paid by
UNICOOPAGI is unfair comparing to the production cost and the time spent for getting 1 kg of
wheat. The table below illustrates the benefit value share of the wheat chain
Farmers are not informed about the price at which UNICOOAPAGI sells their wheat to its client
not because the information is a secret but because the quality requirement is too high to meet.
The average scored for all statement for both sides is 61.5%. This score shows a good relation
in benefit in value share. Even the benefit sharing is relatively different but which need an
improvement in price making. This improvement should focus on setting different prices to
different varieties.
5.8. Stakeholder network and collaborations
Many cooperatives were strongly assisted by projects such as ACDI VOCA and SAN among
others in providing technical and financial support and actually as these projects ended their
supports, they suffer in management terms (CIP, 2011). Actually UNICOOPAGI and other
unions and strong cooperatives are mostly the ones involved in wheat production in
collaboration with local government. Wheat millers don’t collaborate with wheat farmers
because they are more interested to buy wheat from outside country at cheap prices
(MINICOM, 2011). Farmers and UNICOOPAGI agree on inadequate relationship with wheat
millers and scored this relation at 38.9%. The closing activity of Nyungwe milling factory which
was installed in the working area of UNICOOPAGI is sign of poor relationships of wheat millere
and farmers in wheat production. Network and collaboration with stakeholders are not well
established with farmers and UNICOOPAGI. As a result the input procurement system doesn’t
work properly because it involves few partners (local government and UNICOOPAGI) and when
they don’t meet the target it directly affects all famers.
“Regular meetings are organised by either by local government or UNICOOPAGI but they
are not attended by the privates sector as result the low investors in wheat production
said the coordinator of UNICOOPAGI”. In these meeting problems or challenges are not
solved because of incapacity of UNICOOPAGI or local government. “It can be found a good
production of wheat if investors are attracted to operate in Nyaruguru because wheat is
70
well adapted in the area and farmers are involved in it and want to cooperate with them”
said a farmer”.
Banks and microfinance’s are not interested to invest in wheat production because they not sure
of the repayment of the loans because of fluctuation of the climate which affect the production
and also farmers don’t have guarantee fund for their production. Farmers lowly scored this
statement at 48% because they have problem to access the loans but UNICOOPAGI which has
microfinance highly scored this statement at 66.7%. The issue on accessibility to loans from
UNICOOPAGI’ microfinance is the high interest rate. The average score for this challenge area
for both sides is 59% which shows a poor network and collaboration in wheat production in
Rwanda. The sustainability and a good improvement of wheat production need a strong
partnership and monitoring of all stakeholders in wheat value chain.
5.9. Perspectives
Both UNICOOPAGI and wheat farmers are willing to improve their relationships in wheat
production. All statements for both sides were scored in average of 71.7 % which is a promising
score of an improvement their relationships. The union had started some steps for improving the
relationships with wheat farmers by doing a feasibility study of installation of small milling factory
of wheat which could help the processing of all produce from farmers. It also introduced the use
of modern threshers and winnowers for improving the quality, reducing losses in post- harvest
facilities and as a result reducing the production cost of one kg of wheat.
UNICOOPAGI highly appreciated the idea of facilitating the procurement of lime in bulk to
farmers which can double the yield by hectare because already farmers who use recommended
fertiliser and sufficient lime and organic manure got a high yield by hectare. Both sides
UNICOOPAGI and farmers agree on the renovation of different storages of cooperatives which
can help in storing their produce and waiting to sell them when the price is good during the year.
The price fluctuates during the year is mentioned by Mutijima (2004) and most of the time
doubles two months after the pick harvest.
The union willingly wants to introduce a formal contract in contract farming which can be
presented to different banks as collateral and helps farmers to access to loans as a result
farmers will be paid through bank transfers. The only statement was scored lowly in this
challenge is the competitiveness of production cost of local wheat with imported wheat. The
explanation of this low score comes from the lack of information about the production cost of
imported wheat. The only thing they knew that, the price of imported wheat is cheap. If the
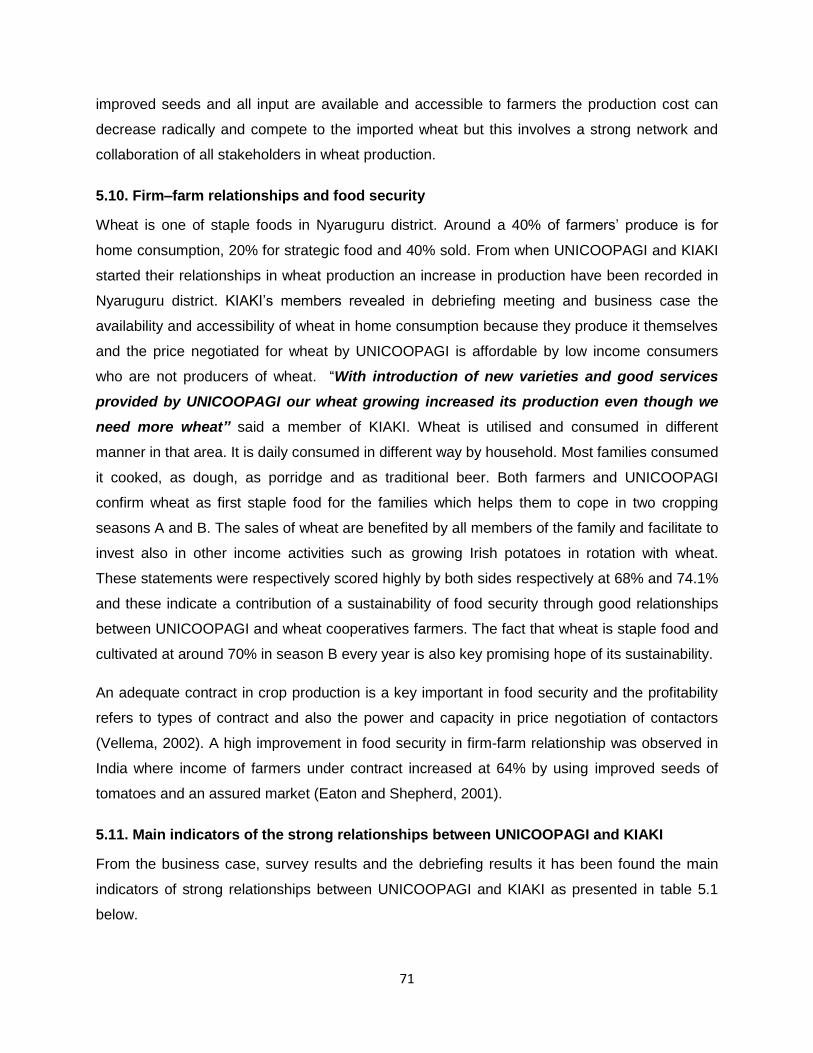
71
improved seeds and all input are available and accessible to farmers the production cost can
decrease radically and compete to the imported wheat but this involves a strong network and
collaboration of all stakeholders in wheat production.
5.10. Firm–farm relationships and food security
Wheat is one of staple foods in Nyaruguru district. Around a 40% of farmers’ produce is for
home consumption, 20% for strategic food and 40% sold. From when UNICOOPAGI and KIAKI
started their relationships in wheat production an increase in production have been recorded in
Nyaruguru district. KIAKI’s members revealed in debriefing meeting and business case the
availability and accessibility of wheat in home consumption because they produce it themselves
and the price negotiated for wheat by UNICOOPAGI is affordable by low income consumers
who are not producers of wheat. “With introduction of new varieties and good services
provided by UNICOOPAGI our wheat growing increased its production even though we
need more wheat” said a member of KIAKI. Wheat is utilised and consumed in different
manner in that area. It is daily consumed in different way by household. Most families consumed
it cooked, as dough, as porridge and as traditional beer. Both farmers and UNICOOPAGI
confirm wheat as first staple food for the families which helps them to cope in two cropping
seasons A and B. The sales of wheat are benefited by all members of the family and facilitate to
invest also in other income activities such as growing Irish potatoes in rotation with wheat.
These statements were respectively scored highly by both sides respectively at 68% and 74.1%
and these indicate a contribution of a sustainability of food security through good relationships
between UNICOOPAGI and wheat cooperatives farmers. The fact that wheat is staple food and
cultivated at around 70% in season B every year is also key promising hope of its sustainability.
An adequate contract in crop production is a key important in food security and the profitability
refers to types of contract and also the power and capacity in price negotiation of contactors
(Vellema, 2002). A high improvement in food security in firm-farm relationship was observed in
India where income of farmers under contract increased at 64% by using improved seeds of
tomatoes and an assured market (Eaton and Shepherd, 2001).
5.11. Main indicators of the strong relationships between UNICOOPAGI and KIAKI
From the business case, survey results and the debriefing results it has been found the main
indicators of strong relationships between UNICOOPAGI and KIAKI as presented in table 5.1
below.
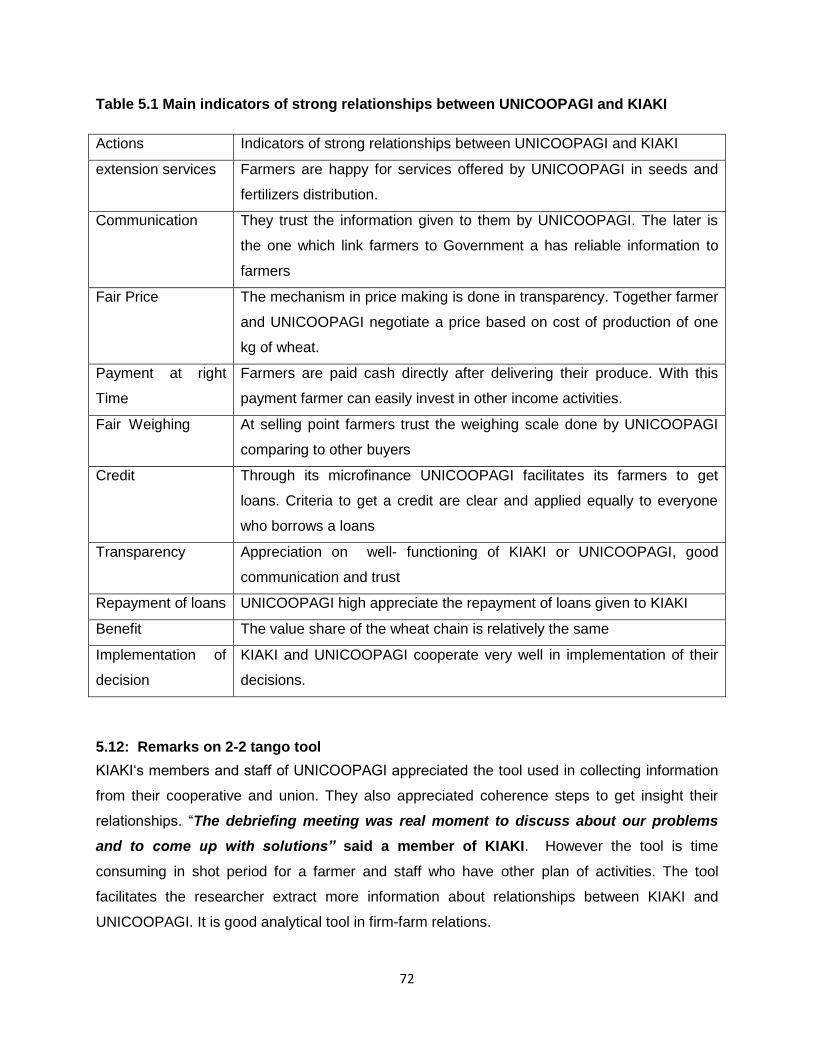
72
Table 5.1 Main indicators of strong relationships between UNICOOPAGI and KIAKI
Actions Indicators of strong relationships between UNICOOPAGI and KIAKI
extension services Farmers are happy for services offered by UNICOOPAGI in seeds and
fertilizers distribution.
Communication They trust the information given to them by UNICOOPAGI. The later is
the one which link farmers to Government a has reliable information to
farmers
Fair Price The mechanism in price making is done in transparency. Together farmer
and UNICOOPAGI negotiate a price based on cost of production of one
kg of wheat.
Payment at right
Time
Farmers are paid cash directly after delivering their produce. With this
payment farmer can easily invest in other income activities.
Fair Weighing At selling point farmers trust the weighing scale done by UNICOOPAGI
comparing to other buyers
Credit Through its microfinance UNICOOPAGI facilitates its farmers to get
loans. Criteria to get a credit are clear and applied equally to everyone
who borrows a loans
Transparency Appreciation on well- functioning of KIAKI or UNICOOPAGI, good
communication and trust
Repayment of loans UNICOOPAGI high appreciate the repayment of loans given to KIAKI
Benefit The value share of the wheat chain is relatively the same
Implementation of
decision
KIAKI and UNICOOPAGI cooperate very well in implementation of their
decisions.
5.12: Remarks on 2-2 tango tool
KIAKI‘s members and staff of UNICOOPAGI appreciated the tool used in collecting information
from their cooperative and union. They also appreciated coherence steps to get insight their
relationships. “The debriefing meeting was real moment to discuss about our problems
and to come up with solutions” said a member of KIAKI. However the tool is time
consuming in shot period for a farmer and staff who have other plan of activities. The tool
facilitates the researcher extract more information about relationships between KIAKI and
UNICOOPAGI. It is good analytical tool in firm-farm relations.
73
6. CONCLUSION AND RECOMMENDATION
6.1. Conclusion
After presentation and discussion of results it can be conclude as follow:
The accessibility to input is a high challenge for wheat producers in Nyaruguru district. The price
of fertilizers, pesticides and lime is not affordable to farmers. Subsidised fertilizers reached few
farmers and most of the time distribution is delayed. Insufficient lime with high cost is a
challenge to farmers. Poor relationship is observed between UNICOOPAGI and wheat farmers
of Nyaruguru district in input distribution but both sides realise the problem and want to improve
it.
Low volume and low yield of wheat are recorded in Nyaruguru district but comparing to the
previous year’s production there is a little improvement. Some farmers apply small quantity of
lime and fertilizer and others use nothing in wheat production. High yielding varieties of wheat
are not available and farmyard manure is insufficient to farmers. Farmers have difficulties to
apply erosion control measures because of the mountainous and hilly area. Both farmers and
UNICOOPAGI accept their moderate relationships in wheat production and yields but willingly
seek its improvement.
With a strong supervision UNICOOPAGI and local government KIAKI is actually well-
functioning. Decisions are made democratically and well implemented by farmers with good
leaderships of their executive committee. UNICOOPAGI appreciates the repayment of
contracted loans and transparency in sharing information on financial issues to farmers.
Farmers invest the revenues from wheat to others income generating activities and all member
of the household benefit from wheat income. KIAKA’s members want to strength their well-
functioning by regular meeting and official dissemination of information to farmers.
Staffs of UNICOOPAGI and KIAKI’s members appreciate the well-functioning of UNICOOPAGI.
The latter with cooperatives jointly define what services to provide to farmers in planning
activities. Farmers appreciate the supports in getting loans, from UNICOOPAGI’s microfinance
Twizigamire and the transparency in delivering services. However farmers are claiming there
are few numbers of farmer field schools and how the selection process of participants in
trainings is done.
74
Informal contract is dominating in relationships between UNICOOPAGI and KIAKI cooperative.
Formal contract is found in multiplication of wheat seeds and collection of wheat produced.
UNICOOPAGI does not specifying the quantity and quality it wants to buy from farmers at
cropping stage. The contracts are not jointly prepared with farmers and most of them are not
clear to them. Wheat price is negotiated with farmers and cash paid to farmers could not cover
the production cost.
Farmers are still using traditional facilities in threshing; drying and winnowing which bring a lot of
impurities and high loss is inevitable in this process. Damaged roads increase the transport cost
of truck and transport by head is common in the area. Storages facilities are poorly maintained
and this increases the loss in storage. All these difficulties contribute to high production cost /kg
of wheat. Both farmers and UNICOOPAGI regret having poor relationship in post-harvest and
quality management and proposed some actions to improve it as presented in table 4.3.1.
Price setting is a challenge in commercial relations between UNICOOPAGI and wheat farmers.
Farmers are not happy with same price given to all varieties of wheat produced even if they their
representatives participate in this negotiation. Quantity and quality to buy from farmers’
cooperative are not specific at planting stage and an eyes testing of quality of wheat are not
appreciated by farmers. However farmers appreciate the weighing of their produce and the
cash payment on time.
The few stakeholders do not collaborate very well in wheat production. Private’ investors and
banks are not interested to invest in wheat production because low production and fluctuation of
climate which affect the production.
Although there are many challenges in relationships between UNICOOPAGI and wheat farmers,
both sides are willing want to collaborate each other in order to improve their relationship in
wheat production and marketing. UNICOOPAGI had already started to address some issue in
relationship with farmers such a feasibility study of installation of small wheat milling factory
and initiation in using modern thresher and winnowers in post-harvest activities.
The collaboration UNICOOPAGI and KIAKI cooperative has contributed to availability and
accessibility to food for the households in the Nyaruguru. Wheat can be prepared in different
ways for home consumption and all members of the family benefit from wheat income. The
latter is invested in income generating activities for the households.

75
Correct weighing, negotiation of price based on production cost, reliable information given to
farmer by UNICOOPAGI, cash payment at right time, trust and transparency in functioning of
union and cooperative, farmers access to credit trough microfinance Twizigamire have been
found as main indicators of strong relationships between UNICOOPAGI and KIAKI.
In addition of this, 2-2 tango tool was appreciated by KIAKI’s members and staff of
UNICOOPAGI.
6.2. Recommendations
In order to improve the relationships between wheat cooperatives farmers and UNICOOPAGI
the following recommendations can be proposed to different level:
To farmers
Farmers participate actively in maintenance of roads so that transport cost can be
reduced and make their working area accessible to trucks and apply agro forestry
techniques in soil erosion control measures with appropriate varieties.
In order to access to loans farmers are recommended to accept the payment through
bank account for insuring banks on the repayment of loans.
Farmers apply agricultural practices, fertility dose recommended by agronomist in
wheat production and participate in putting in place their own farmers field school.
Farmers produce and multiply their own seeds and also conserve it for a next cropping
season in order to escape the delay in supplying seed by government.
In order to access to inputs farmers are suggested to participate actively in renovation
of their storages also invest in installation of shared shop of agricultural inputs with
UNICOOPAGI.
Suggestions of actions for improvement of firm-farmer relation to framers in debriefing
meeting are supported to be implemented.
To Cooperative
Cooperatives prepare its business plan and elaborate projects which can be submitted
to different sponsors or donors in order to support farmer in supply of input.
Executive committee of KIAKI organise and facilitate in putting in place shop of different
inputs and also negotiate a bank loans for modern threshers and winnowers.
76
Production committee of KIAKI is recommended to assist its members to approach and
collaborate with banks and other stakeholders in order can have access to loans and
others services.
UNICOOPAGI
UNICOOPAGI accepts to facilitate its cooperatives in developing project, business plan
in order to get funds of the planning activities
UNICOOPAGI facilitates its cooperatives in procurement of lime to their shop by its truck
and develops a strong network with suppliers of lime from northern country.
UNICOOPAGI facilitates the renovation of storages and also facilitate the accessibility to
modern cheap threshers and winnowers to farmers so they can reduce losses in post-
harvest and increase the quality which leads to a decrease of the production cost.
UNICOOPAGI states precisely the volume and quality of wheat it wants to buy before its
growing and the price of wheat depending on the variety so it can stimulate farmers to
maximize their production.
To the Government
Government facilitates farmers to access to subsidised lime in wheat production
especially in Southern province where the acidity of soil is very high.
Government accepts to distribute all inputs through the UNICOOPAGI in order to escape
the bureaucracy observed in local government which delays the plantation of wheat and
affects the production of crops.
Government through its institution RAB prepares study on productivity and
commercialisation of wheat in Rwanda in order to attract privates’ investors in wheat
production.
To Agriprofocus Rwanda
The Agriprofocus Rwanda starts the facilitation in linking farmer’s cooperative and
wheat millers in order to find an alternative market for their produce
The Agriprofocus Rwanda applies the 2-2 tango tool to others crops especially those in
competitions with wheat in order to select which crop can be proposed to famers which
presents good relationships between farmers and companies.
77
The Agriprofocus facilitates farmers’ cooperative and UNICOOPAGI in developing
strategies implementation of their perspectives and actions for improving their
relationships proposed in debriefing results
The Agriprofocus continues advocacy for creating a guarantee fund for farmers in wheat
production in order to attract the investment of different stakeholders (new investors,
banks, microfinance, wheat millers) in wheat production and selling.
The Agriprofocus continues research in focusing on feasibility study of market, quality
and safety for wheat produced in Rwanda comparing to imported wheat.
The Agriprofocus Rwanda applies the 2-2 tango tool in firm-farm relationships between
wheat processors in different location in order to develop a good strategy of improving
the relationship in wheat processing in Rwanda.
78
References
Agriprofocus, 2012; Organized Farmers as Partners in Agribusiness; Firm–Farmer
partnership and contracting: taking linkages to the next level.
Ashok,G., Kavery G. and Maurice R. Landes., 2008. Toward Contract Farming in a
Changing Agri-food System
Baumann, P., 2000; Equity and Efficiency in Contract Farming Schemes: The
Experience of Agricultural Tree Crops. Working Paper 139, Overseas Development
Institute, October 2000
CIMMYT (International Maize and Wheat Improvement Centre) 2004: Global trends
influencing CIMMYT’s future. Prepared by the Global Trends Task Force in support of
strategic planning at CIMMYT Mexico, D.F.: CIMMYT
CIP, 2011: Crop Intensification Program, report on six major crops promoted in Rwanda,
MINAGRI, Kigali.
Contore Nicola, 2012: The Crop Intensification Program: a Sustainable analysis,
Overseas development Institute, 111 Westminster Bridge Road, London, SE1 7JD.
Da Silva Carlos Arthur B., 2005: The growing role of contract farming in agri-food
systems development: Drivers, Theory and Practices. Agricultural Management,
Marketing and Finance Service FAO, Rome
Den Hartog Adel P., Van Staveren Wija A. and Brouwer Inge D., 2006: Food habits and
Consumption in developing countries. Manual for field studies, Wagenningen Academic
Publichers: The Netherlands.
Devereux S. and Maxwell S., 2005: Food security in Sub Saharan Africa. University of
Natal Press, Pieter maritzburg, Southern Africa
FAO, 2010 the state of food Insecurity in the world available at
Http://www.fao.org/docrep/013/i1683e/i1683e.pdf accessed on 22 may 2012
Government report of Rwanda , 2011: Government annual report, July 2010-june 2011,
Hongdong Guo, Robert W. Jolly, Jianhua Zhu, 2005: Contract Farming in China: Supply
Chain or Ball and Chain?
79
ISAR, 2008: Rwanda Agriculture Research Institute: Report on Wheat Program,
Musanze, Rwanda
Jagdish Kumar and Prakash Kumar K., 2008: Contract Farming: Problems, Prospects
and its Effect on Income and Employment; Department of Agricultural Economics, G. B.
Pant University of Agriculture & Technology; Pantnagar - 263 145, Uttarakhand.
MINAGRI, 2004: Ministry of Agriculture and livestock: Agriculture Policies in Rwanda,
Kigali
MINAGRI, 2009: Ministry of Agriculture and Animal Resources: Strategic Plan for the
Transformation of Agriculture in Rwanda –Phase II, Final rapport
MINAGRI, 2011: Ministry of Agriculture and Animal Resources; National Post Harvest
Strategy, kigali
MINALOC, 2011: Ministry of Local Government, Annual report 2011, Kigali
Mutijima, 2004: Plan strategic de la transformation de l’Agriculture au Rwanda. Analyse
thematique productions. MINAGRI, Kigali.
NISR, 2011: National Institute of Statistic of Rwanda; Rwanda Statistical YearBook
2011,
Prowse M., 2012: Contract farming in developing countries- Institute of Development
Policy and Management, University of Antwerp
RAB, 2011: Rwanda Agricultural Board, Annual report 2011, Kigali
RADA, 2011: Rwanda Agriculture Development Authority, Annual report 2011, Kigali.
Rehber, E. 2000; Vertical Coordination in the Agro-Food Industry and Contract Farming:
A Comparative Study of Turkey and the USA. Food Marketing Policy Center University
of Connecticut; Research Report No. 52, February 2000.
Runsten, D. and Key, N. 1996; Contract Farming in Developing Countries: Theoretical
Aspects and Analysis of Some Mexican Cases, U.N. Economic Commission for Latin
America and the Caribbean, Santiago
80
Terpend, Kayumba and Ntaganda, 2007: Diagnostic et elaboration du plan de
development national de la filiere Ble au Rwanda
US Government, 2011: Rwanda feed the future 2012-2015 multi years strategy
available at
http://www.feedthefuture.gov/sites/default/files/country/strategies/files/RwandaFeedtheF
utureMulti-YearStrategy.pdf accessed on 14 may 2012
Vellema Sietze, 2002: Making contract farming work? Society and technology in
Philippine transnational agribusiness; Maastricht: Shaper publishing available on
http://www.tad.wur.nl/NR/rdonlyres/0E68D3D2-B68A-41B1-95C9-
928391AAAA53/47555/Vellema_webadvertisement.pdf accessed on 15 may 2012
Warning, M. and Hoo, W. 2000; The Impact of Contract Farming on Income Distribution:
Theory and Evidence. Paper Prepared for Presentation at the Western Economics
Association International Annual Meetings, June 2000
William Wamala Wagoire, 2006: Quantification of the value of improved wheat
production. Options in South-western Uganda, Kachwekano, Agricultural Research and
Development Centre, P.O. Box 421, Kabale – Uganda
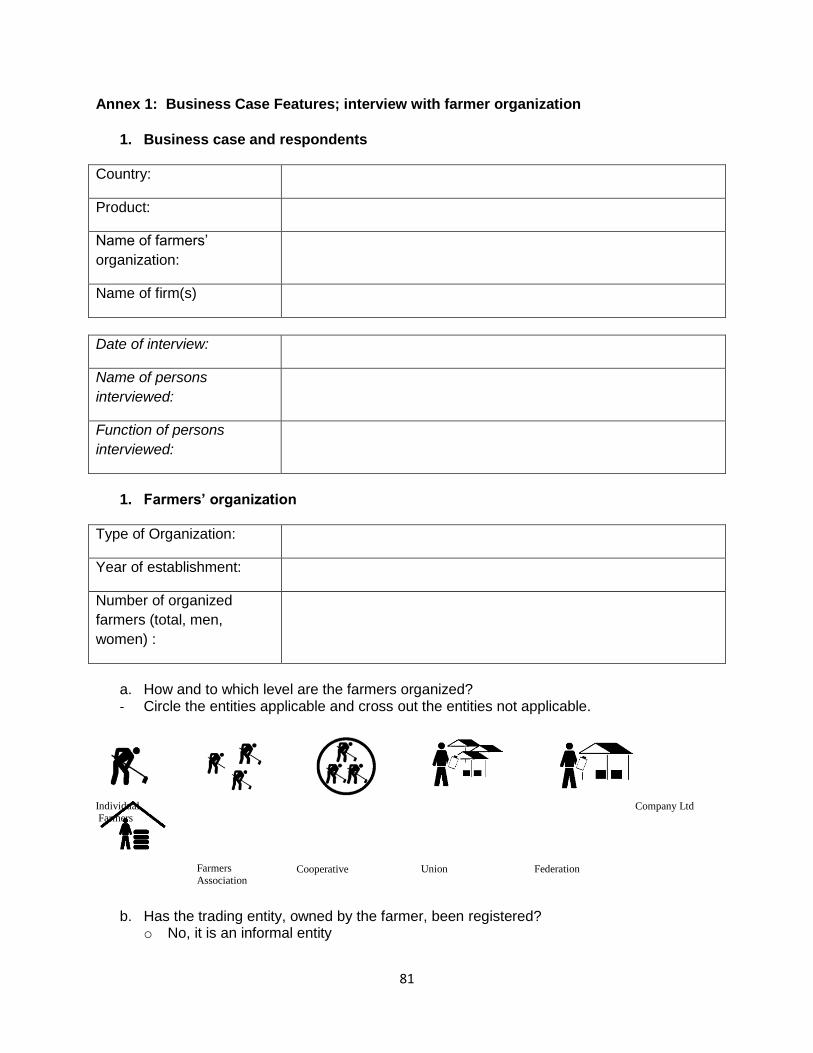
81
Annex 1: Business Case Features; interview with farmer organization
1. Business case and respondents
Country:
Product:
Name of farmers’
organization:
Name of firm(s)
Date of interview:
Name of persons
interviewed:
Function of persons
interviewed:
1. Farmers’ organization
Type of Organization:
Year of establishment:
Number of organized
farmers (total, men,
women) :
a. How and to which level are the farmers organized? - Circle the entities applicable and cross out the entities not applicable.
b. Has the trading entity, owned by the farmer, been registered? o No, it is an informal entity
Individual Farmers
Farmers
Association Cooperative Union Federation
Company Ltd
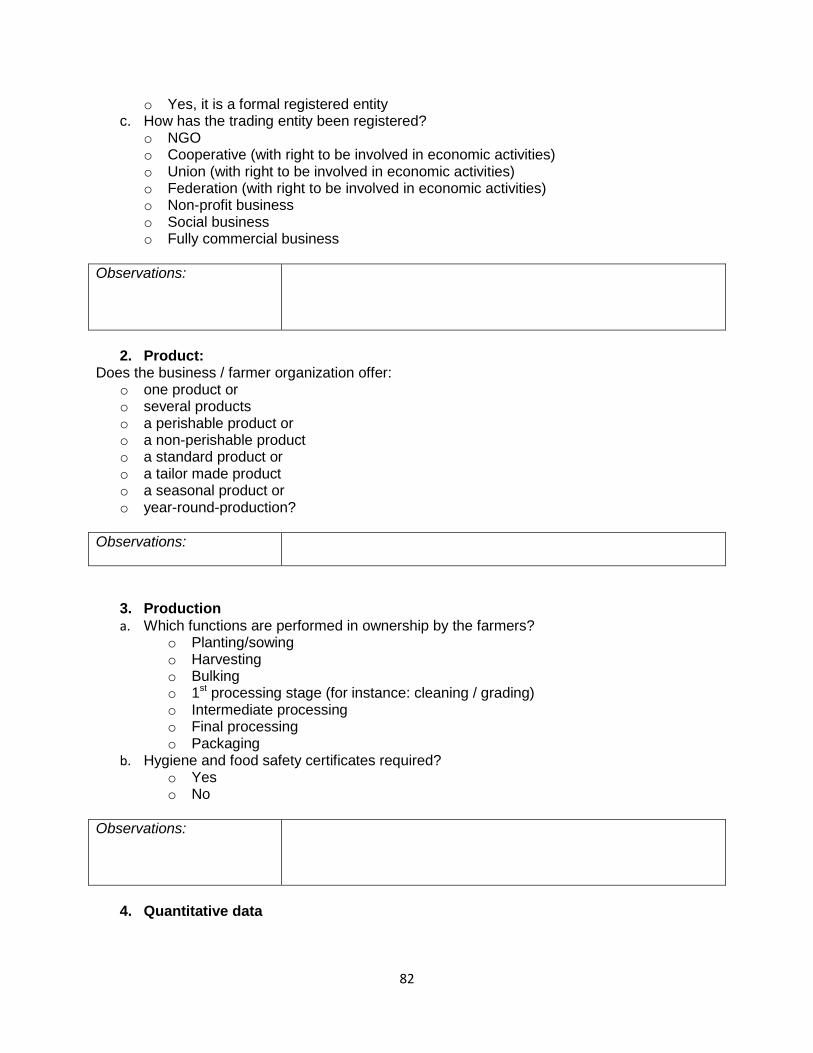
82
o Yes, it is a formal registered entity c. How has the trading entity been registered?
o NGO o Cooperative (with right to be involved in economic activities) o Union (with right to be involved in economic activities) o Federation (with right to be involved in economic activities) o Non-profit business o Social business o Fully commercial business
Observations:
2. Product:
Does the business / farmer organization offer: o one product or o several products o a perishable product or o a non-perishable product o a standard product or o a tailor made product o a seasonal product or o year-round-production?
Observations:
3. Production
a. Which functions are performed in ownership by the farmers? o Planting/sowing o Harvesting o Bulking o 1st processing stage (for instance: cleaning / grading) o Intermediate processing o Final processing o Packaging
b. Hygiene and food safety certificates required? o Yes o No
Observations:
4. Quantitative data
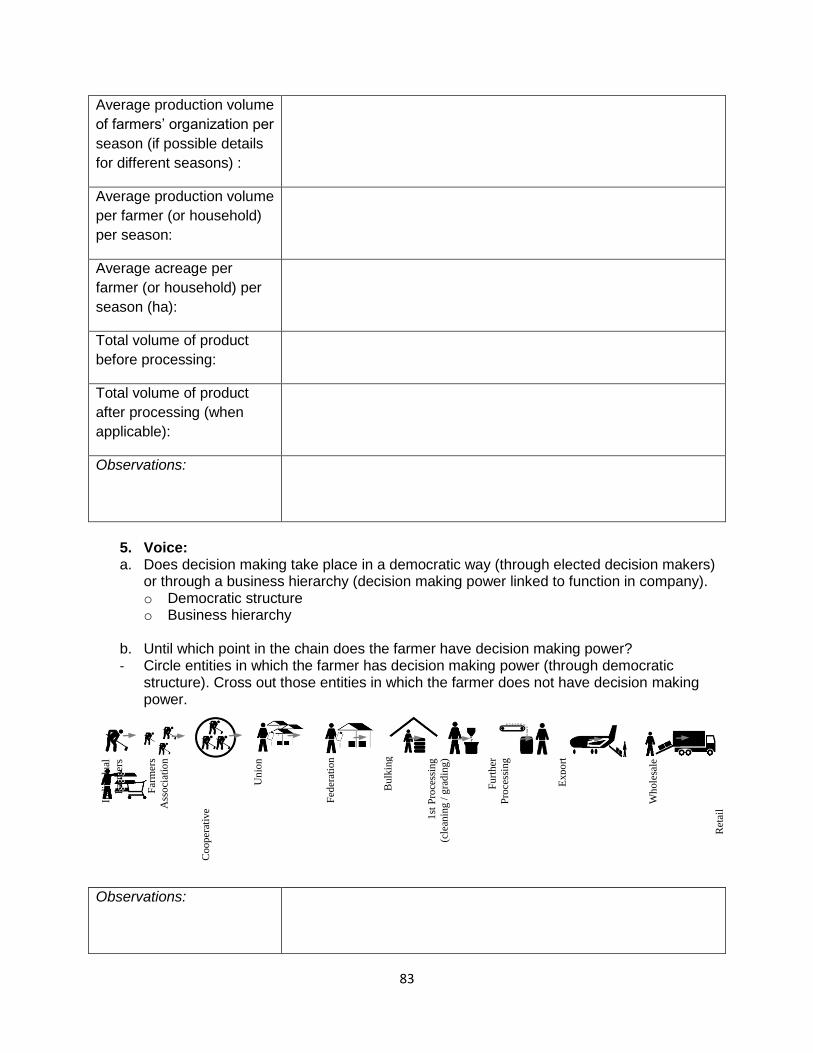
83
Average production volume
of farmers’ organization per
season (if possible details
for different seasons) :
Average production volume
per farmer (or household)
per season:
Average acreage per
farmer (or household) per
season (ha):
Total volume of product
before processing:
Total volume of product
after processing (when
applicable):
Observations:
5. Voice: a. Does decision making take place in a democratic way (through elected decision makers)
or through a business hierarchy (decision making power linked to function in company). o Democratic structure o Business hierarchy
b. Until which point in the chain does the farmer have decision making power? - Circle entities in which the farmer has decision making power (through democratic
structure). Cross out those entities in which the farmer does not have decision making power.
Observations:
Indiv
idu
al
Far
mer
s
Far
mer
s
Ass
oci
atio
n
Coop
erat
ive
Un
ion
Fed
erat
ion
1st
Pro
cess
ing
(cle
anin
g /
gra
din
g)
Fu
rth
er
Pro
cess
ing (
Bulk
ing
Exp
ort
(
Wh
ole
sale
(
Ret
ail (
84
6. Product branding a. Is the product specifically branded?
o Organic Certified o Conventional, generic (no specific brand) o Socially certified (Fair Trade, UTZ, etc)
b. Is the product sold to the customer under the specific brand name of the business/producer organization?
o Yes o No
Observations:
7. Customer / Market:
a. How many customers does the business/farmer organization serve? o one o several
b. Categorize the direct customer(s) o trader, o exporter, o processor, o wholesale, o retail, o end-user
c. Which market does the business/farmer organization serve? o the mass market (bulk market) o a niche market
d. Is the direct customer a local or an international customer? o Local o International
e. Is the end-market (end-consumer) a local or international market?
o Local end-market o International end-market
Observations:
8. Revenue model: Does the business / producer organization earn its income through:
o the sale of a physical product, o the sale of a service o lending/renting/leasing the use of a physical product
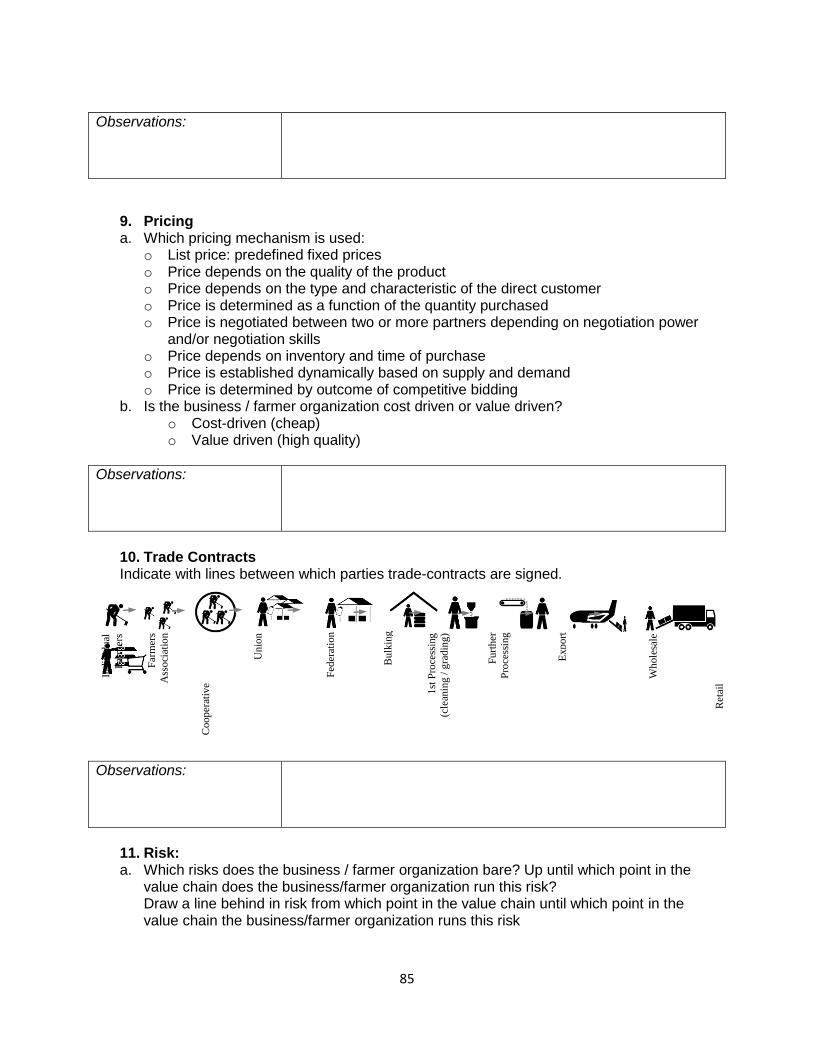
85
Observations:
9. Pricing a. Which pricing mechanism is used:
o List price: predefined fixed prices o Price depends on the quality of the product o Price depends on the type and characteristic of the direct customer o Price is determined as a function of the quantity purchased o Price is negotiated between two or more partners depending on negotiation power
and/or negotiation skills o Price depends on inventory and time of purchase o Price is established dynamically based on supply and demand o Price is determined by outcome of competitive bidding
b. Is the business / farmer organization cost driven or value driven? o Cost-driven (cheap) o Value driven (high quality)
Observations:
10. Trade Contracts Indicate with lines between which parties trade-contracts are signed.
Observations:
11. Risk: a. Which risks does the business / farmer organization bare? Up until which point in the
value chain does the business/farmer organization run this risk? Draw a line behind in risk from which point in the value chain until which point in the value chain the business/farmer organization runs this risk
Indiv
idu
al
Far
mer
s
Far
mer
s
Ass
oci
atio
n
Coop
erat
ive
Un
ion
Fed
erat
ion
1st
Pro
cess
ing
(cle
anin
g /
gra
din
g)
Fu
rth
er
Pro
cess
ing (
Bulk
ing
Exp
ort
(
Wh
ole
sale
(
Ret
ail (
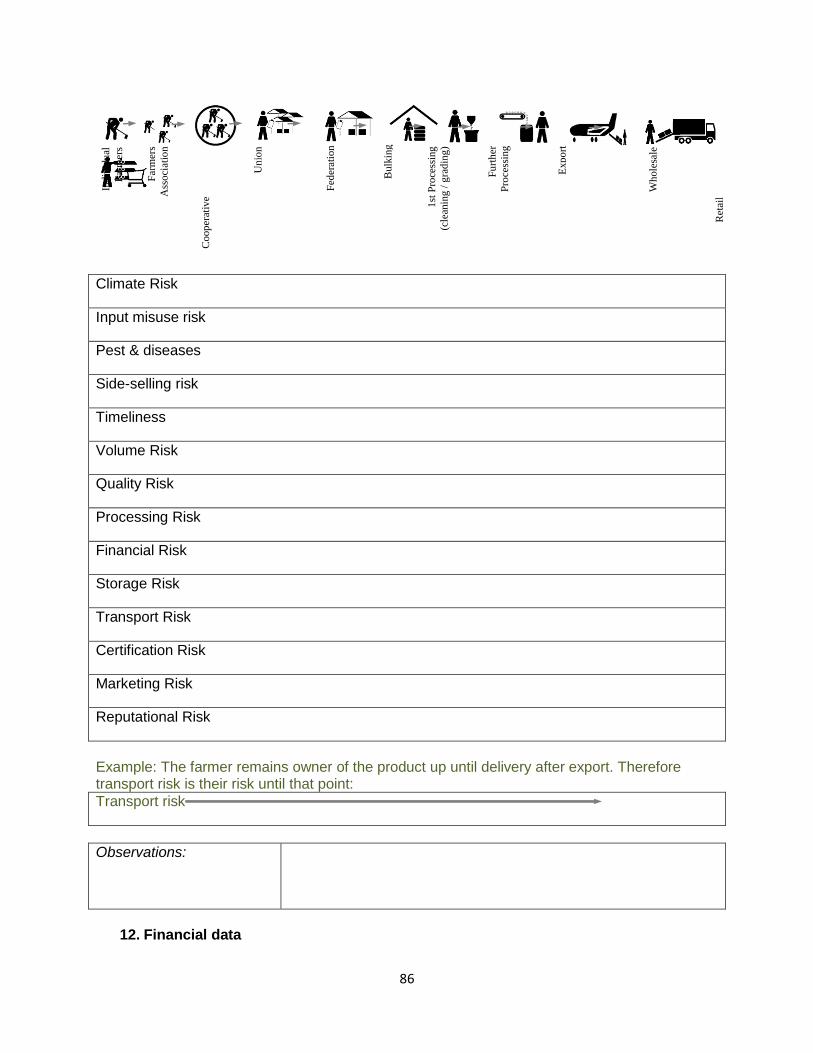
86
Climate Risk
Input misuse risk
Pest & diseases
Side-selling risk
Timeliness
Volume Risk
Quality Risk
Processing Risk
Financial Risk
Storage Risk
Transport Risk
Certification Risk
Marketing Risk
Reputational Risk
Example: The farmer remains owner of the product up until delivery after export. Therefore transport risk is their risk until that point:
Transport risk
Observations:
12. Financial data
Indiv
idu
al
Far
mer
s
Far
mer
s
Ass
oci
atio
n
Coop
erat
ive
Un
ion
Fed
erat
ion
1st
Pro
cess
ing
(cle
anin
g /
gra
din
g)
Fu
rth
er
Pro
cess
ing (
Bulk
ing
Exp
ort
(
Wh
ole
sale
(
Ret
ail (
87
2009 2010 2011
Turn-over
Cost of Production
Operational Costs
Overhead Costs
Profit / Loss
Break Even Point
(expected to be) reached
in year:
Observations:
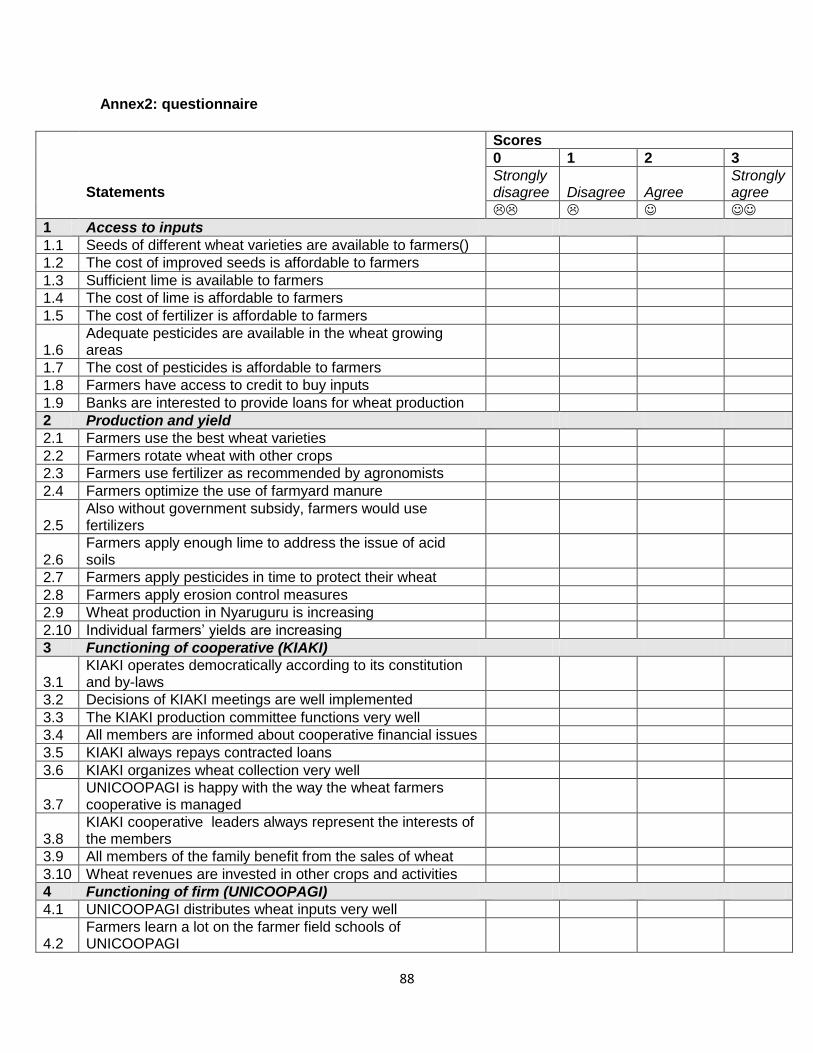
88
Annex2: questionnaire
Scores
0 1 2 3
Statements Strongly disagree Disagree Agree
Strongly agree
1 Access to inputs
1.1 Seeds of different wheat varieties are available to farmers()
1.2 The cost of improved seeds is affordable to farmers
1.3 Sufficient lime is available to farmers
1.4 The cost of lime is affordable to farmers
1.5 The cost of fertilizer is affordable to farmers
1.6 Adequate pesticides are available in the wheat growing areas
1.7 The cost of pesticides is affordable to farmers
1.8 Farmers have access to credit to buy inputs
1.9 Banks are interested to provide loans for wheat production
2 Production and yield
2.1 Farmers use the best wheat varieties
2.2 Farmers rotate wheat with other crops
2.3 Farmers use fertilizer as recommended by agronomists
2.4 Farmers optimize the use of farmyard manure
2.5 Also without government subsidy, farmers would use fertilizers
2.6 Farmers apply enough lime to address the issue of acid soils
2.7 Farmers apply pesticides in time to protect their wheat
2.8 Farmers apply erosion control measures
2.9 Wheat production in Nyaruguru is increasing
2.10 Individual farmers’ yields are increasing
3 Functioning of cooperative (KIAKI)
3.1 KIAKI operates democratically according to its constitution and by-laws
3.2 Decisions of KIAKI meetings are well implemented
3.3 The KIAKI production committee functions very well
3.4 All members are informed about cooperative financial issues
3.5 KIAKI always repays contracted loans
3.6 KIAKI organizes wheat collection very well
3.7 UNICOOPAGI is happy with the way the wheat farmers cooperative is managed
3.8 KIAKI cooperative leaders always represent the interests of the members
3.9 All members of the family benefit from the sales of wheat
3.10 Wheat revenues are invested in other crops and activities
4 Functioning of firm (UNICOOPAGI)
4.1 UNICOOPAGI distributes wheat inputs very well
4.2 Farmers learn a lot on the farmer field schools of UNICOOPAGI
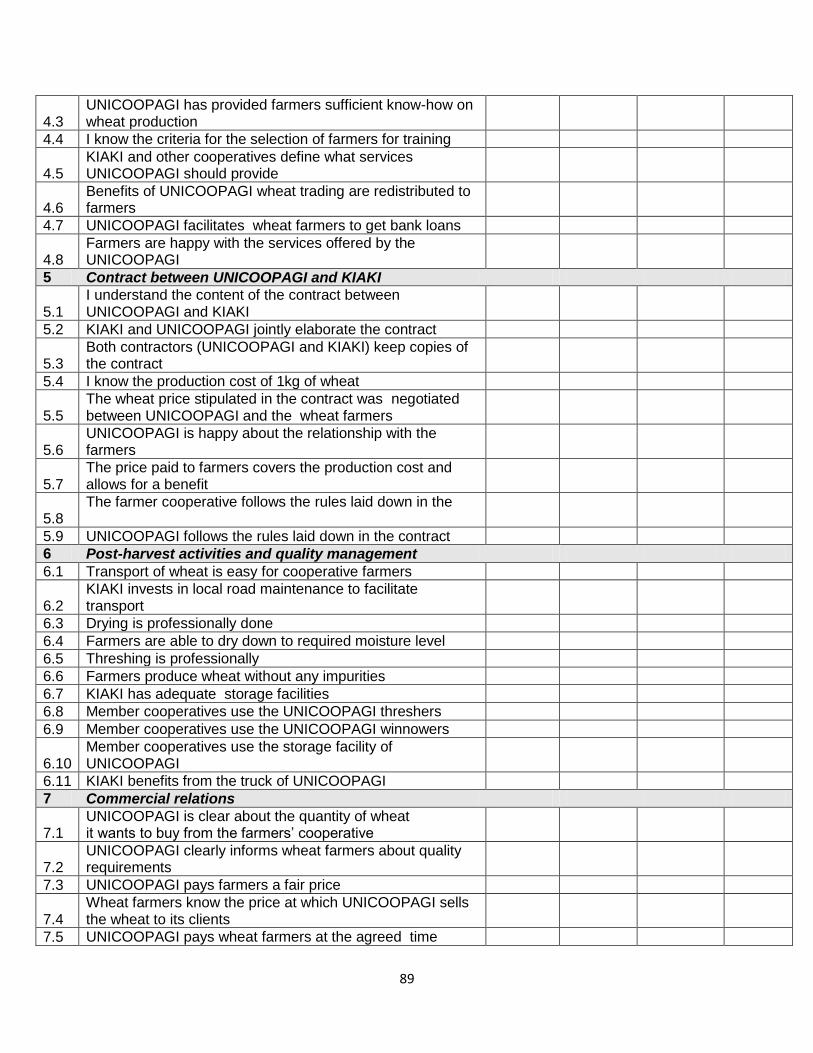
89
4.3 UNICOOPAGI has provided farmers sufficient know-how on wheat production
4.4 I know the criteria for the selection of farmers for training
4.5 KIAKI and other cooperatives define what services UNICOOPAGI should provide
4.6 Benefits of UNICOOPAGI wheat trading are redistributed to farmers
4.7 UNICOOPAGI facilitates wheat farmers to get bank loans
4.8 Farmers are happy with the services offered by the UNICOOPAGI
5 Contract between UNICOOPAGI and KIAKI
5.1 I understand the content of the contract between UNICOOPAGI and KIAKI
5.2 KIAKI and UNICOOPAGI jointly elaborate the contract
5.3 Both contractors (UNICOOPAGI and KIAKI) keep copies of the contract
5.4 I know the production cost of 1kg of wheat
5.5 The wheat price stipulated in the contract was negotiated between UNICOOPAGI and the wheat farmers
5.6 UNICOOPAGI is happy about the relationship with the farmers
5.7 The price paid to farmers covers the production cost and allows for a benefit
5.8 The farmer cooperative follows the rules laid down in the
5.9 UNICOOPAGI follows the rules laid down in the contract
6 Post-harvest activities and quality management
6.1 Transport of wheat is easy for cooperative farmers
6.2 KIAKI invests in local road maintenance to facilitate transport
6.3 Drying is professionally done
6.4 Farmers are able to dry down to required moisture level
6.5 Threshing is professionally
6.6 Farmers produce wheat without any impurities
6.7 KIAKI has adequate storage facilities
6.8 Member cooperatives use the UNICOOPAGI threshers
6.9 Member cooperatives use the UNICOOPAGI winnowers
6.10 Member cooperatives use the storage facility of UNICOOPAGI
6.11 KIAKI benefits from the truck of UNICOOPAGI
7 Commercial relations
7.1 UNICOOPAGI is clear about the quantity of wheat it wants to buy from the farmers’ cooperative
7.2 UNICOOPAGI clearly informs wheat farmers about quality requirements
7.3 UNICOOPAGI pays farmers a fair price
7.4 Wheat farmers know the price at which UNICOOPAGI sells the wheat to its clients
7.5 UNICOOPAGI pays wheat farmers at the agreed time
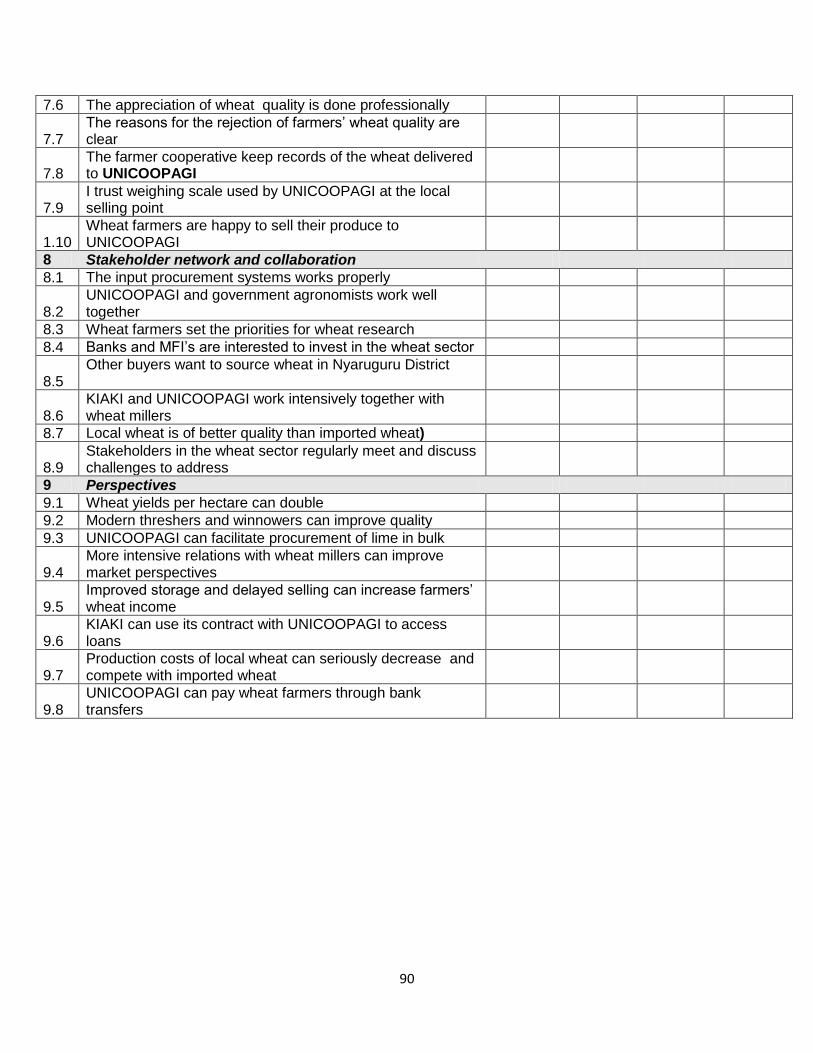
90
7.6 The appreciation of wheat quality is done professionally
7.7 The reasons for the rejection of farmers’ wheat quality are clear
7.8 The farmer cooperative keep records of the wheat delivered to UNICOOPAGI
7.9 I trust weighing scale used by UNICOOPAGI at the local selling point
1.10 Wheat farmers are happy to sell their produce to UNICOOPAGI
8 Stakeholder network and collaboration
8.1 The input procurement systems works properly
8.2 UNICOOPAGI and government agronomists work well together
8.3 Wheat farmers set the priorities for wheat research
8.4 Banks and MFI’s are interested to invest in the wheat sector
8.5 Other buyers want to source wheat in Nyaruguru District
8.6 KIAKI and UNICOOPAGI work intensively together with wheat millers
8.7 Local wheat is of better quality than imported wheat)
8.9 Stakeholders in the wheat sector regularly meet and discuss challenges to address
9 Perspectives
9.1 Wheat yields per hectare can double
9.2 Modern threshers and winnowers can improve quality
9.3 UNICOOPAGI can facilitate procurement of lime in bulk
9.4 More intensive relations with wheat millers can improve market perspectives
9.5 Improved storage and delayed selling can increase farmers’ wheat income
9.6 KIAKI can use its contract with UNICOOPAGI to access loans
9.7 Production costs of local wheat can seriously decrease and compete with imported wheat
9.8 UNICOOPAGI can pay wheat farmers through bank transfers
Copyright © 2022 FDOKUMEN