
Mathematica code for image analysis, semi-automatic parameter extraction and strain analysis
Upload
khangminh22Category
view
0download
0
University of Huddersfield Repository
Wright, Daniel
Introduction of a Semi Automatic Quality Control Process into an SME
Original Citation
Wright, Daniel (2011) Introduction of a Semi Automatic Quality Control Process into an SME. Masters thesis, University of Huddersfield.
This version is available at http://eprints.hud.ac.uk/id/eprint/17554/
The University Repository is a digital collection of the research output of theUniversity, available on Open Access. Copyright and Moral Rights for the itemson this site are retained by the individual author and/or other copyright owners.Users may access full items free of charge; copies of full text items generallycan be reproduced, displayed or performed and given to third parties in anyformat or medium for personal research or study, educational or not-for-profitpurposes without prior permission or charge, provided:
• The authors, title and full bibliographic details is credited in any copy;• A hyperlink and/or URL is included for the original metadata page; and• The content is not changed in any way.
For more information, including our policy and submission procedure, pleasecontact the Repository Team at: [email protected].
http://eprints.hud.ac.uk/
INTRODUCTION OF A SEMI AUTOMATIC QUALITY CONTROL PROCESS INTO AN SME
DANIEL WRIGHT
A Thesis submitted to the University of Huddersfield in partial
fulfillment of the requirements for the degree of Master of
Research
Knowledge Transfer Partnership between the University of
Huddersfield and Craftsman Tool Ltd.
November 2011

2
I Abstract
The purpose of this thesis is to show considerations made when designing and
implementing a semi automatic quality control process into an SME; Craftsman Tools
Ltd. Small batches are produced at any one time, usually of quantities of around 5 to
10 parts. The drive for change arises because the tolerances required becoming ever
tighter.
Investigation has been made in to other systems and processes in operation for
comparisons. Most systems, however, are aimed at large batch, mass manufacture,
and not at an SME producing small quantities, which this research will address.
Machine Analysis has been conducted to evaluate and monitor the condition of the
machine during the project and beyond. This information will be used to create a
solid benchmark for machine performance.
A system was selected, implemented and tested on the machine tool for automating
part manufacture and inspection providing closed loop feedback information for
“right first time” part manufacture.
Results are discussed and conclusions made for the feasibility of the systems and the
machine analysis.

3
II Acknowledgements
I would like to thank all those involved throughout the project and for their belief and
support for making the project possible.
The academic team for their contribution and support, Professor Alan Myers, Dr
Andrew Longstaff and Dr Simon Fletcher.
The company, Craftsman Tools, for the investment made in the project, Mr. Robert
Johnson – Managing Director, Mr. Stephen Murgatroyd – Company Supervisor and
Wilfred Morrow – Staff Technician.
I would also like to thank my family for their support during the project period.
This Partnership received financial support from the Knowledge Transfer Partnerships
programme (KTP). KTP aims to help businesses to improve their competitiveness
and productivity through the better use of knowledge, technology and skills that
reside within the UK knowledge base. KTP is funded by the Technology Strategy
Board along with other government funding organisations.

4
III Contents
I Abstract ........................................................................................................................ 2 III Contents .................................................................................................................... 4 IV Table of Figures ........................................................................................................ 7 V Table of tables ............................................................................................................ 8
Chapter 1 – Introduction ................................................................................................ 9 1.1 Aims ................................................................................................................... 10 1.2 Objectives .......................................................................................................... 11
1.3 Chapter Outline .................................................................................................. 11 1.4 Summary ............................................................................................................ 12
Chapter 2 – Literature Review ..................................................................................... 13 2.1 Introduction ........................................................................................................ 13
2.2 Machine Tool Errors .......................................................................................... 13 2.3 Machine Tool Maintenance ............................................................................... 16 2.4 SPC and Quality Control ................................................................................... 17 2.5 Probing Systems................................................................................................. 18
2.6 Systems in use .................................................................................................... 20 2.7 Software Systems ............................................................................................... 21 2.8 BallBar ............................................................................................................... 22
2.9 Summary ............................................................................................................ 23
Chapter 3 – Initial Processes and Systems ................................................................... 24 3.1 Introduction ........................................................................................................ 24 3.2 Initial Processes and Systems ............................................................................ 24
3.3 Summary ............................................................................................................ 33 Chapter 4 – Proposed Processes and Systems ............................................................. 34
4.1 Introduction ........................................................................................................ 34 4.2 Description of Processes and Systems ............................................................... 34 4.3 System Time Comparison .................................................................................. 39
4.4 Machine Analysis and condition ........................................................................ 41 4.5 Summary ............................................................................................................ 43
Chapter 5 – System Selection ...................................................................................... 44
5.1 Introduction ........................................................................................................ 44
5.2 System Selection ................................................................................................ 44 5.2.1 Justification for Purchase ................................................................................ 44 5.2.2 Selection of Equipment ................................................................................... 46 5.2.3 Purchase of Equipment ................................................................................... 48 5.3 Companies Investigated for Probes and software .............................................. 48
5.3.1 Probes .............................................................................................................. 48 5.3.2 Software .......................................................................................................... 49 5.3.3 System Selection Scoring Matrix.................................................................... 51 5.4 Costing Analysis ................................................................................................ 52 5.4.1 System Costs ................................................................................................... 53
5.5 Hardware and Software Selection ...................................................................... 56
5.6 Hardware and Software Functionality ............................................................... 57 5.7 Machine Maintenance ........................................................................................ 57 5.7.1 Benefits ........................................................................................................... 58 5.7.2 Drawbacks....................................................................................................... 59

5
5.7.3 Costs ................................................................................................................ 60 5.7.4 Training ........................................................................................................... 61 5.8 Summary ............................................................................................................ 61
Chapter 6 – Implementation......................................................................................... 63 6.1 Introduction ........................................................................................................ 63
6.2 Implementation .................................................................................................. 63 Identification of Key Processes ............................................................................... 63 6.2.1 Priority Cell ..................................................................................................... 63 6.2.2 Priority Machine ............................................................................................. 63 6.2.3 Probe ............................................................................................................... 64
6.2.4 Software .......................................................................................................... 64 6.3 Processes ............................................................................................................ 70
6.3.1 Processes for Implementation ......................................................................... 70
6.3.2 Testing............................................................................................................. 70 6.3.3 Investment Requirements................................................................................ 71 6.3.4 Implementation Plan ....................................................................................... 72 6.3.5 Process Pyramid Stages .................................................................................. 78 6.3.5.1 Preventative.................................................................................................. 78
6.3.5.2 Design for manufacture ................................................................................ 78
6.3.5.3 Feed rates and spindle speeds ...................................................................... 78 6.3.5.4 Machine capability ....................................................................................... 79 6.3.5.5 Probe qualification ....................................................................................... 79
6.3.5.6 Predictive ..................................................................................................... 80
6.3.5.7 Machine check ............................................................................................. 80 6.3.5.8 Tooling suite check ...................................................................................... 80 6.3.5.9 Component in fixture check ......................................................................... 80
6.3.5.10 Correct part check ...................................................................................... 80 6.3.5.11 WPC set ..................................................................................................... 81
6.3.5.12 Tool set....................................................................................................... 81 6.3.5.13 Active ......................................................................................................... 82 6.3.5.14 Thermal track ............................................................................................. 82
6.3.5.15 Tool offsets ................................................................................................ 82 6.3.5.16 Broken tool check ...................................................................................... 82
6.3.5.17 Informative ................................................................................................. 83 6.3.5.18 Updates ...................................................................................................... 83
6.3.5.19 Finished and roughing sizes ....................................................................... 83 6.4 BallBar ............................................................................................................... 85
6.4.1 Hardware ......................................................................................................... 85 6.4.2 Software .......................................................................................................... 85 6.4.3 Process – Test Method .................................................................................... 85 6.5 Summary ............................................................................................................ 92
Chapter 7 – Testing and Results .................................................................................. 93
7.1 Introduction ........................................................................................................ 93 7.2 Testing and Results ............................................................................................ 93 7.2.1 Development of Systems – M&H Systems .................................................... 93 7.2.2 Development of Systems – Renishaw........................................................... 114
7.2.3 Gauge R&R Data .......................................................................................... 115 7.3 Probing of the Part – Test Results.................................................................... 118 7.4 Batch Inspection Results .................................................................................. 123
7.5 Inspection Reports ........................................................................................... 125

6
7.6 Production Data ............................................................................................... 126 7.7 BallBar testing and results ............................................................................... 128 7.8 Summary .......................................................................................................... 133
Chapter 8 – Conclusions and Further Work .............................................................. 134 8.1 Introduction ...................................................................................................... 134
8.2 Conclusions ...................................................................................................... 134 8.3 Cost savings brought about from the system ................................................... 136 8.3.1 Direct Savings ............................................................................................... 136 8.3.2 Indirect savings ............................................................................................. 136 8.3.3 Maintenance costs ......................................................................................... 137
8.4 Further Work .................................................................................................... 137 Chapter 9 – References .............................................................................................. 138
Chapter 10 – Appendices ........................................................................................... 141
10.1 ISO Programs ................................................................................................. 141 10.2 BS EN ISO Standards .................................................................................... 150 10.3 BallBar Method .............................................................................................. 152 10.4 BallBar Test Part Programs ........................................................................... 154 10.5 Inspection Reports ......................................................................................... 157

7
IV Table of Figures Figure 1: Process flow from customer input through to shipment of part to customer25 Figure 2: Current processes for manufacture on the factory shop floor ...................... 29 Figure 3: Benchmark flow chart .................................................................................. 38 Figure 4: Parts made comparison ................................................................................. 40 Figure 5: Example BallBar trend graph ....................................................................... 43
Figure 6: Test part model in the Renishaw AE PRO Software.................................... 66 Figure 7: A feature being created on the model for inspection. ................................... 66 Figure 8: The tool, which will be updated from the feature. ....................................... 67
Figure 9: Logic statement being built within the software to control a specific update.
.............................................................................................................................. 67 Figure 10: Customised error messages can be displayed for the operator ................... 68 Figure 11: Another feature measurement being created. ............................................. 68
Figure 12: Writing the measured value in to a variable number on the machine tool
controller. ............................................................................................................. 69 Figure 13: Manual G-code inserted ............................................................................. 69 Figure 14: General implementation flow chart ............................................................ 72
Figure 15: Calibration procedures ............................................................................... 73 Figure 16: Process flow chart ...................................................................................... 76 Figure 17: Process Pyramid ......................................................................................... 77
Figure 18: Tooling file ................................................................................................. 84
Figure 19: Renishaw BallBar 20 software Advanced mode home screen ................... 86 Figure 20: BallBar test setup screen - machine creation or selection .......................... 86 Figure 21: BallBar test setup screen - plane selection ................................................. 87
Figure 22: BallBar test results selection screen ........................................................... 87 Figure 23: BallBar test setup - machine addition screen ............................................. 88
Figure 24: BallBar test setup - parameter screen ......................................................... 88 Figure 25: BallBar test setup - direction and limits screen .......................................... 89 Figure 26: BallBar test setup - part program creation .................................................. 89
Figure 27: BallBar test running on probing implementation machine ........................ 91 Figure 28: BallBar test running on probing implementation machine ........................ 91
Figure 29: Flow chart ................................................................................................... 96
Figure 30: Flow chart ................................................................................................... 99
Figure 31: Flow chart ................................................................................................. 102 Figure 32: Flow chart ................................................................................................. 106 Figure 33: Flow chart ................................................................................................. 109 Figure 34: Mazatrol program screen capture ............................................................. 113 Figure 35: Measurement comparisons graph ............................................................. 119
Figure 36: CMM Report ............................................................................................ 120 Figure 37: CMM Report ............................................................................................ 121 Figure 38: CMM Report ............................................................................................ 122 Figure 39: Component inspection report ................................................................... 123 Figure 40: Component inspection report ................................................................... 123
Figure 41: Component inspection report ................................................................... 124
Figure 42: Component inspection report ................................................................... 124 Figure 43: SPC Graph ................................................................................................ 125 Figure 44: Production data comparison graph ........................................................... 128 Figure 45: Smashed Probe following an accident on machine .................................. 129

8
Figure 46: Smashed Probe following an accident on machine .................................. 129 Figure 47: Ballbar test results .................................................................................... 130 Figure 48: Ballbar test results .................................................................................... 130 Figure 49: Ballbar test results .................................................................................... 131 Figure 50: Ballbar test results .................................................................................... 131
Figure 51: Ballbar test results .................................................................................... 132 Figure 52: Ballbar test results .................................................................................... 132
V Table of tables Table 1: Probing hardware scoring matrix ................................................................... 51 Table 2: Probing software scoring matrix .................................................................... 52 Table 3: 2009 Cash flow .............................................................................................. 54 Table 4: 2008 Cash flow .............................................................................................. 55
Table 5: Process responsibilities .................................................................................. 75 Table 6: Initial Mazatrol trials ..................................................................................... 95 Table 7: Revised Maztrol trial ..................................................................................... 98 Table 8: ISO only programming ................................................................................ 101
Table 9: Mazatrol - ISO - Mazatrol ........................................................................... 105 Table 10: ISO - Mazatrol - ISO ................................................................................. 108 Table 11 - Gauge R&R test results ............................................................................ 116
Table 12: 63.5mm bore comparison .......................................................................... 118
Table 13: 63.75mm bore comparisons ....................................................................... 118 Table 14: 63.75mm bore comparisons ....................................................................... 118 Table 15: 63.75mm bore comparisons ....................................................................... 118
Table 16: Production data .......................................................................................... 127

9
Chapter 1 – Introduction
Quality control is an area of engineering that is becoming ever more critical.
Demands on suppliers are stretching the capacity of companies and are requiring
more stringent testing of every part produced. The traceability of each part has
become a given rather than an ideal and creates more paperwork for each part.
The extra work created, however, must not impact upon the production lead times and
therefore systems and processes must meet these capabilities, whilst trying to reduce
costs and improve overall quality.
Craftsman Tools Ltd is a family owned SME based in Otley, Leeds employing around
55 people and has been operating for almost 60 years. The company operates in a
worldwide market with the specialist products being in-house designed work holding
equipment and tool holders for most major machine tool builders worldwide. The
company also produces parts for many large companies in the oil and gas industry as
sub-contractors where the global market is highly competitive for both cost and
quality of the finished parts in a time conscious manner. Most items produced are
"one offs" or small batches.
The content of the following thesis is the result of research and work undertaken as a
Knowledge Transfer Partnership (KTP) programme 007057 between Craftsman Tools
Ltd and the University of Huddersfield. The project provided a significant strategic
impact for the company, helping to provide reductions in manufacturing costs and
improved quality, which greatly enhance the company‟s reputation for high quality,
precision manufactured parts.
The aim of the collaborative program was to address specific issues around process
quality, such as machining accuracy, whilst also aiming to reduce significant
manufacturing costs through automation of product testing, validation and
certification. The lack of confidence within the company for the processes accuracy
and reliability forced the undertaking of manual inspection, measurement and testing
of components, which has major implications for cost of quality and overall
manufacturing costs.
The company has previously attempted to automate the machining and validation of
parts on a number of occasions, which all proved troublesome and ineffective, and
were therefore never implemented. The scepticism provided by the past failed
attempts failing added an extra barrier to be overcome as part of the project, therefore

10
requiring good change management as well as providing a technologically suitable
solution.
The manufacture of the parts is currently a complex process involving many people
and pieces of machinery and equipment. Simplifying the processes and amount of
equipment required will help to reduce the amount of human intervention for
manufacture of parts and also for dimensional measurement.
The current manufacture of a designed part has the following procedures:
Block of material placed in vice
Program written in Mazatrol according to drawing sizes
Work Piece Co-ordinate (WPC) set
Program run to rough first off
Part removed from machine and taken to manual inspection
Work co-ordinates manually updated to suit
Part re-machined to finish size
Final manual inspection to check against tolerance and dimensioning
Next parts run on full cycle if inspection passed
Base is now completed
Part moved to indexer for Capto bore cycle
Hole rough bored
Part taken to manual inspection for first off check
Final boring of hole
Part taken for final inspection and dimensions manually recorded
This process requires around four visits to the quality control department, which
ultimately leads to delays in production. It is not always possible to get
measurements immediately and queuing can occur lengthening the process further.
A test case system has been identified using the Severn Cell within the company.
There are a number of machines present including milling and turning. The testing
will begin on one of four Mazak Nexus 510CII machines. The system will be rolled
out factory wide when successful.
1.1 Aims
Aim 1 – To implement a semi automatic quality control process in an SME

11
Aim 2 – Evaluate against accuracy and cost benefits
1.2 Objectives
Objective 1 – Validation of the machines capability and continued monitoring
Objective 2 – Reduction of manufacturing costs within the company
Objective 3 – Automated measurement and reporting of parts
Objective 4 – Evaluation of the monitoring of the machines, accuracy and capability
Objective 5 – Evaluation of the cost savings made with the introduction of a semi
automated system
Objective 6 – Evaluation of the benefits brought by the research
1.3 Chapter Outline
Chapter 2 – Literature review
Looking at past work and reviewing current systems or those that are being
developed.
Chapter 3 – Initial processes and systems
Review of the company‟s current processes and systems, with identification of areas
for development.
Chapter 4 – Proposed processes and systems
Proposal of processes and / or systems that will improve the company‟s working
practices. This will have been compared to a benchmark set out in chapter 3.
Chapter 5 – System selection
A system will be selected using the proposals of chapter 4. Different solutions will be
presented and trials for suitability where possible.
Chapter 6 – Implementation
The systems and processes outlined in chapter 4, and the equipment selected in
chapter 5 will be implemented, with a full description of the activities taking place.
Chapter 7 – Testing and results

12
Following on from the implementation in chapter 6, the results of the implementation
will be discussed.
Chapter 8 – Conclusion and further work
After implementation and testing, a review of the achievements will be made against
the original aims and objectives and stating any further work that could be
undertaken.
1.4 Summary
The aim of the research is to implement a semi automatic quality control process and
systems into an SME whilst also evaluate against the accuracies and cost benefits.
In the following chapter a literature review is presented and shows what has been
done previously that could impact upon the project and the likely implications as a
result of the implementation of any systems.

13
Chapter 2 – Literature Review
2.1 Introduction The aims and objectives of the research are to implement a semi automatic quality
control process in to an SME and to evaluate against accuracy and cost benefits. To
achieve this it is necessary to review literature regarding present systems and any
reported future developments that are planned. The areas for research will be
machine tool errors, probing systems, software systems, machine tool maintenance
and present systems in use.
2.2 Machine Tool Errors Machine tool accuracy is affected by the following types of errors [1]:
Geometric errors
Non-rigid errors
Thermal errors
Wear
Geometric errors are inherent within the machine tool as it is made up of many
mechanical assemblies, each of which having inaccuracies due to design and
manufacture constraints.
The geometric errors of a machine tool are made up of the following errors and
amounts, giving a total of 21 per machine for a 3-axis machine [1][2]:
Positioning – 3 per machine
Straightness – 6 per machine
Angular – 9 per machine
Squareness – 3 per machine
Error compensation is an effective way of reducing the nature of errors present in the
machine. This is done through measurement of the 21 standard geometric errors
during a "downtime" period on the machine. A system interprets the results and then
corrects the errors in real time. Re-verification of the machine is then made. A
reduction of 97% in the rigid errors is quoted by Poxton et al. [3].

14
Okafor and Ertekin [4] also provide vast amounts of information on the geometric
errors within a three-axis machine tool. The errors are mathematically calculated to
form an error model, which is volumetric. From the matrices formed in these
equations for the model, error compensation components were derived and used to
create a new model.
As with many other papers in the field of machine tool errors, Ramesh et al. [5] and
Barman and Sen [6] describe error sources and methods for error elimination through
many different methods including use of measurement tools, such as laser
interferometers.
Thermal errors appear within the machines structure during the heating and cooling
whilst in operation. The heat can come from both internal and external sources.
Internal sources will include:
Heat from the cutting operation
Motors for spindles and axes
Motors for swarf conveyors
Pumps for coolant feed
Friction within moving mechanical mechanisms
External sources will include:
Draughts from doors, roller shutters and loading bays
Heating equipment
Sunlight (warm and hot days)
Thermal errors provide complex issues within the machine tool and give rise to
change in geometric errors as previously described.
Most machine tool manufacturers will provide a specific warm up and cool down
procedure to ensure that an optimum temperature is reached before cutting takes place
to reduce the errors that could be transposed to the work piece. As materials vary,
coefficients of expansion this can prove difficult to compensate for.
There has been a great level of research undertaken in the field of thermal errors
within machine tools, and for compensation. The causes of thermal errors and
methods for reduction within the machine tool structure are described by
Postlethwaite et al. [7]. The paper concludes that even though there has been a large
amount of time spent in researching this area, there still remains a significant problem
with work piece errors caused through thermal distortions. The errors caused due to

15
thermal distortion would require its own project within the company and will be noted
when implementation of systems takes place for future work.
Non-rigid errors occur from loads placed on the machines structure such as the weight
of the work piece and any fixturing, loads transferred whilst cutting the metal and
weights of tools in the spindle. In many tool data files on the machine tool controller
there is designation for heavy tools, which can be assigned.
Discussion is made by Wang [8] for the use of volumetric analysis of the machine
tool becoming more common and to give a better understanding of the machines
accuracies, as previous linear measurements do not provide enough information. The
measurement of all 21 errors are required to understand the machines capabilities as
machine tool manufacturers improve quality of machines through time. The
Renishaw QC20-W BallBar system allows for some volumetric analysis [2]. The
extent to which this is capable is determined by the volume that can be covered by the
BallBar for length and restriction to three planes. The measured and monitored
volume should match that of the active area used within the machine for most jobs.
There are a large number of ISO standards, which relate to the calibration of machine
tools and CMM‟s. These are listed in the appendix.
Although all of these standards play an important part in the machine tools, there are a
few which stand out as necessary for review during the project including BS ISO 230
– 4 : 2005 - Test code for machine tools - circular tests for numerically controlled
machine tools [46], which will be linked to the BallBar tests. The ISO standard sets
out the principals for measurement of contouring circles to be measured on the
machine tool being tested. It is very similar to the way the BallBar software guides
you through set up of tests, which is very useful as it makes auditing far more simple
under the maintenance programs. A useful guide similar to the help file of the
BallBar 20 software can be found as the annex to the standard showing the likely
errors to be found and where they are likely to originate. The software can provide
the results to this particular standard for easy reference. The BS ISO 230 – 10 : Draft
- Test code for machine tools - determination of measuring performance of probing
systems of numerically controlled machine tools [52] is also quite important as it
could play a future part in any probing systems that are employed on the machine
tool.
Wang [8] discusses calibration in the 3D volume of the machine tool and highlights
the way in to which this fits in with the BS ISO 230 standards. Definitions are

16
provided for positioning errors and 3D volumetric errors. The 3D volumetric
positioning error is defined as the RMS (Root Mean Square) of the maximum errors
of each axis. This is now considered inadequate due to the largest errors being
straightness, squareness and angular errors in modern machines. The volumetric error
is defined as the maximum of the RMS of the total errors in each axis direction. The
volumetric error for angular errors is defined as the maximum of the RMS of the
deviations in three angular directions.
2.3 Machine Tool Maintenance Machine tools are a complex structure of many mechanical assemblies, which
degrade over time and require maintenance to ensure that accuracies and capability
are maintained over its lifetime. Willoughby et al. [9] discusses how in many cases
machines will be calibrated to an ISO standard and be certified but produce parts that
are incorrect due to a lack of proper maintenance. Machines are then used with
updated offsets to ensure production continues without addressing the specific
breakdown.
Munzinger et al. [10] looks at the maintenance activities that take place and how
machine availability can be improved through use of use of algorithms for parts and
assemblies within the machine tool that are maintenance friendly and also the
associated parts of that failure model. Taking a machine tool apart to its bare
structure would not be maintenance friendly for an operator. It is categorised for
levels of knowledge and training, difficulty, maintenance, costs and other activities.
All of which are formulated and work out which are the most and least friendly
maintenance activities, and which will require follow up work. This can be a useful
approach if there are enough skilled staff within the production team capable of the
tasks presented, however, in most circumstances it is more feasible to call in a service
engineer due to their knowledge and level of training. The downtime for both
methods could be monitored.
Within an American Machinist article [11] a small amount of text focuses upon the
need for maintenance of machines if they are being used for inspection as well as
measurement. A discussion is made for the regular calibration of the machines in a
similar way to the CMM, and that a BallBar test would be ideally run around every
three to six months. The accuracy of the information that tests of quarterly or half

17
yearly testing could be questioned. As it is a simple test, it should be run frequently
and also as a reactive measure when something happens to cause change.
Planned maintenance scheduling and calibration methods are discussed by Wang and
Thomas [12]. The authors describe the way in which the planned maintenance can be
scheduled through knowledge gained from regular a benchmark for when the machine
tool should be calibrated and serviced. With this knowledge the maintenance can be
scheduled to cause least disruption to production. Many methods for calibration are
mentioned within the article for both linear and rotary axes including grid plate
encoders and laser interferometers with their method for use described.
For multi axis and mill turn machines there are systems available for calibration of the
rotary axis by companies such as Renishaw. The system offered is called Axiset [13]
and gives users the ability to check the pivot point of a rotary axis against its centre.
In a similar way to the BallBar system, a history file can be created for the machine to
monitor any changes over time. This is not a current issue within Craftsman as the
priority implementation machines are 3 axis. It is useful for future equipment
requirements to know systems are available to maintain the calibration of the
machine. Companies such as Heidenhain and Fidia amongst other produce versions
of this test equipment.
Also for multi axis machines is a volumetric distortion assessment method for five
axis machines using un-calibrated master ball artefacts. Erkan et al. [14] uses
measured values for the probing of the artefacts against an expected position to work
out the overall volumetric distortion within the machine tool. The work however
proved to show large variations between machine tool and CMM results, meaning the
author required further work to determine the errors present within the machine tool
to explain the large unexplained errors.
2.4 SPC and Quality Control Quality control is becoming an issue for many companies with demands on suppliers
for finer tolerances to be achieved. This extra strain is passed through the entirety of
manufacture and inspection. It is therefore starting to become critical to know
accurate levels of scrap and use root cause analysis to find the reason for scrapping
the part in the first instance. The white paper by Renishaw IM110 [15] details the
need to address the root causes of process failures and eliminate as many of the

18
manual processes as possible. These generally go hand in hand with each other. The
use of a pyramid based system, such as the Productive Process Pyramid provides a
structured, systematic approach to ensuring machining consistency. The paper
discusses the need for multiple machines and work of the same type for in-process
inspection to be a viable option; otherwise there will be a vast level of time
consumption. The paper suggests that the machine should not become a replacement
for a CMM however as each machine has its specific purpose with the effects of
thermal error being noted.
Saunders [16] also discusses the Productive Process Pyramid, which was the prior
design to the one shown in the IM110 white paper [15]. Over time it has become
more refined and user friendly, however still benchmarks against previous processes
to continually improve.
Wu and Jiao [17] look at the use of charts in SPC and how they can implement a
system that looks at interval between suspect samples and uses control limits for
determination of non conformance. A study is made into the length of time taken to
calculate the values for the chart with a simple inspection of an attribute and ring
gauge. If more complicated measurement systems are used the time vastly increases.
For the measurements of critical features of the companies manufactured components,
a simple system would be ideal for taking the measured values and calculating its
deviation.
2.5 Probing Systems
Probing systems are becoming more common on machine tools, and can be used for a
variety of purposes such as part location and dimensional metrology. The systems are
more common within large organisations than an SME however where large batches
are produced and output is critical. The method by which the probe functions has
been described by Weckenmann et al. [18].
Use of machine tools as measurement instruments has been long debated, and the
validity of the dimensional measurement on the same machine the part is cut on
questioned due to the same errors being subjected to measurement as those during
cutting. The use of the in-process inspection can however detect errors that were not
picked up during standard maintenance and servicing. The use of compensation
systems and techniques such as the Laser Interferometer and gold standard parts allow

19
for rectification of manufacturing errors and means that the use of in-process
inspection is becoming more acceptable according to Davis et al [19]. The author
also describes the lack of systems for manufacture of parts that use in-process
inspection to create a closed loop system for cutting and measurement. All such
processes and systems can be related back to the idea of the Productivity Pyramid and
how all levels are used as informative data, which can be used to continually improve
from the foundations up.
Arguments for and against the use of the machine tools is made by Bates [11] as
cutting time is taken away from the machine to measure parts. It is argued, however,
that if parts are left at CMM with faults, there will be longer periods of downtime.
Suggestion is made that a sample inspection of a batch could be made instead of
inspecting every part on the machine. The company previously sub-contracted the
parts requiring CMM checks. This adds extra cost and lead-time to any job that is
going through manufacture.
Kim and Chung [20] show how errors generated due to discrepancies between the
machine tool and contact positions are affected by the geometric errors within the
machine tool, probing error or measurement and also any error within the mechanical
assembly probe unit itself. This leads to error compensation systems being developed
and implemented into a system for measuring parts at an effective feed rate so as to
not affect the rate of production of parts on the machine tool. This however is present
in most software provided with touch trigger probes by the manufacturer in the form
of ISO G-code programs in the current market, and proves how quickly developments
are being made on a technological basis.
Choi et al [21] discuss how conventional measurement on a CMM can lead to
bottlenecks of production and providing need for measurement on the machine tool.
Error models are created for the machine tool to compare against the CMM with an
artefact plate comprising of multiple cubes. The models are used to generate
algorithms for error compensation, and fed into a closed loop system for probing and
cutting with reduced machining errors.
Modern Machine Shop [22] discusses how many manufacturers do not release the full
potential of on machine probing. They have stated that if machines are maintained
correctly and tools such as the BallBar and calibrated artefacts are used that offline
inspection could be done away with. The prevalence of thermal errors is brought to

20
attention and how it can be accommodated for using the artefact methods in a similar
way that Renishaw manufacture their own parts [23].
A case study company in Quality magazine [24] display benefits gained from the
incorporation of probing systems within the company including the time saved
through probing, additional capacity created and the levels of scrap parts. The levels
of scrap in the case study fell from up to 50% to virtually zero with the use of probing
systems. A third unmanned shift can run due to the probing system, which increases
productivity. Offset errors caused 20% of parts to be scrapped, which has been
corrected automatically with software for offset updates. Within the project there will
be a similar benchmarking made for these timesavings to determine the overall
benefits brought about from the new technologies.
Tseng et al. [25] discuss the relationship between in process inspection and inspection
on the CMM following machining. Suggestion is made for capability studies to be
carried out on the machine tool due to the inherent machine tool structure errors
influencing the manufacture of the parts.
Choi et al. [26] discuss the use of Probing systems as a method of error detection
within the machine tool. This method uses an artefact cube based system for
measurement of results found from created models. It uses a compensation system
based on measured cutting values to update a positional value. This method is in
practice within software systems commercially available, such as the Renishaw AE
Pro software.
2.6 Systems in use
Koc and Bozdag [27] investigate the use of advanced manufacturing techniques
within a sample of SMEs. The SMEs were asked about current systems in place such
as CAD and CAM and any automated inspection. Results of their survey show that
just 43% of the companies used some form of automated inspection.
Renishaw‟s RAMTIC (Renishaw‟s Automated Milling, Turning and Inspection
Centre) system [28] uses carousels to automate processes. The carousels contain
tools, work pieces and calibrated artefacts for measurement comparison. Such
systems are well suited for use in mass production environments where time and
money can be invested heavily, however, do not suit smaller SME‟s. The principals

21
used for manufacture, such as their pyramid processes can however be adopted and
developed to suit different applications.
Mazak offer full factory systems called FMS (Flexible Manufacturing Systems),
which are linked in to the Mazatrol CNC controllers [29]. It is essentially a palletised
system (Palletech) that can be placed factory wide. The work pieces are called to the
machines through CNC commands made at the machine as part of automated systems.
This method again is suited to larger organisations and is generally used with larger
parts. The system can be seen in use within their own factory for manufacture of their
machines.
Xu and Newman [30] discuss the advances being made in CNC programming through
use of STEP-NC. The aim of the new programming is to make use of new intelligent
workstations and incorporates CAD and CAM to create programs for the machine
tool controller. With this simple architecture, there could be possibility for linking in
of many systems, which could include in-process inspection.
2.7 Software Systems
Bates [11] shows use of software developed for machine tool use in inspection. The
design is based around a CMM style design and communicates through a PC-Dmis
NC system. In the example shown, Lockheed Martin in Orlando, America, uses the
measurement software. The on machine inspection systems are used to skip or
eliminate previously required quality steps and eliminates bottlenecks at the CMM.
Part programs and probing programs are stored on a standalone server and called
when required directly to the controller. The inspection of parts is now limited to a
first off to check for processes being within specification, and then taking samples
from a batch instead of measurement of all parts.
The uncertainty within software changes dependent upon the algorithms used for
calculation. Raffaldi and Shakarji [31] suggests how efforts are being made to
standardise the testing frameworks for machines. The uncertainties are presented in a
chart for all typical contributors to uncertainty. Similar tests could be used or
implemented on the machine tool if used as a measuring machine.

22
2.8 BallBar Renishaw‟s BallBar system is commonly known throughout industry and is accepted
as a quick health check of a machine. There are systems available from other
manufacturers such as Heidenhain and API, but are not so commonly used in the UK.
The QC20-W BallBar system literature [2] for the product states that it can be used as
a quick 10-minute check of a machine tool. The BallBar software, BallBar 20, offers
flexibility for result output and can be displayed in many standard formats to associate
with ISO, JIS and ASME. Renishaw also offer their own output format, which breaks
down the results to show 15 contributory errors within the machine tool. The
positioning accuracy is recorded in the software to provide information on circularity
and deviation.
The software is also used to build up profiles of the machine tools it is used to test and
graphically records all of the changes over time. There is an ability to generate part
programs within the software, which are post processed to suit the many different
types of machine tool controller allowing full factory flexibility.
For different levels of use within the factory, different modes are selectable within the
software front end [32].
A system using 3 BallBars has been developed by Jywe et al. [33] for 3 dimensional
calibration of machine tools. The solution is offered as a quicker and cheaper
replacement for laser calibration by using triangulation methods. This would
however require a substantial amount of time and knowledge to apply in a factory
environment. The use of laser interferometers would provide greater practicality and
are known for the highest levels of accuracy available.
Kwon and Burdekin [34] demonstrate the errors that are shown through use of a
BallBar system such as backlash, stick slip, servo mismatch and positioning errors.
These are also described within the help files of the Renishaw BallBar 20 software
[32]. The research presented was for the development of a different link system for
the BallBar, which essentially changed the balls and cups around with different
amounts of kinematic motion translation points and was tested against a standard
BallBar system.

23
2.9 Summary Following the review of literature, decisions can be made to the extent in which
previous research can be applied to the project. Much of the past work has been
suited to large companies producing batches of parts at a time with no variation in
type.

24
Chapter 3 – Initial Processes and Systems
3.1 Introduction This chapter will describe the current processes and systems in place within the
company. A flow chart will be created and used as a benchmark on which to build
the new systems.
3.2 Initial Processes and Systems
To understand the current processes, a benchmark flow chart was created and used as
a basis for the additional processes.
As an appendix to this thesis, the processes as set out to satisfy the ISO 9001:2008
Quality manual are included. This discusses the flow of jobs through the Severn Cell
within the company. The Severn Cell is the tool holding area of the company, which
primarily manufactures Capto tool holders and also standard Mazak tool holders.
New developments are currently being investigated and manufactured as part of
research and development in the cell also. If there are drastic changes through the
addition of extra systems and processes, this document will require rectification to
suit and pass any future audits.
Benchmarking of any future processes and systems must start with how the current
system works. This will be further discussed during chapter three.

25
Figure 1: Process flow from customer input through to shipment of part to customer

26
The flow charts show a basic routing from input through to output. The stages are
described below:
Customers can be the end user or a distributor. Whichever category they fall in to,
they will require a solution to a current problem. The company has key customers
and as such are provided with preferential rates and lead times. The goal for
achieving these lead times can easily be delayed if parts are scrapped or there is
machine downtime.
A query or quote comes from the customer to enquire about a solution for their
problem. A price and lead-time will be provided for their consideration. This will
reflect the current production capabilities; material costs and exchange rates for
export items.
Customers place an order for the goods or service that were previously quoted and a
contract is entered in to for this to be fulfilled. If the original date is unachievable, a
new date will be negotiated and agreed upon. This happens in instances where a
quote will have been sent off and the customer comes back a few weeks later.
At some point in the products life cycle, it will have had to be designed. This is a
time consuming exercise and can involve extensive research in to the machine tool it
will fit.
If the product is being specially designed, drawings will need to be sent out to the
customer for manufacturing drawing approval before a final general assembly and
detailed manufacturing drawings can be produced.
Conversion of 3D model to relevant format to use in alternative software is completed
where required. The 3D CAD models may require converting to formats other than
the AutoDesk Inventor .IPT format that they are created in.
Every job requires some planning. The companies system provides a job traveler
document, which details all processes required for manufacture with barcodes for
operators to clock on and off jobs allowing costing to be made. If the part has been
manufactured previously, the information can be copied across for the routing of the
material from saw to inspection and packing. Where a product is manufactured for
the first time, all information has to be entered for how the part is to be manufactured
and the stages required to do so. The traveler sheets have each operation bar-coded
for tracking of jobs in the computer system.
All parts are manufactured in house, which includes the following:

27
The machine operators are encouraged to write their own Mazatrol machining
programs for the parts. The staff inspector can check these where necessary, for
operators such as apprentices and trainees. The Mazatrol conversational
programming format is used on the Mazak Nexus Machines for simplified
programming of part programs with graphics to illustrate the part that is being
created.
The parts are firstly rough finished and then taken to inspection for checks to be
made for position of bores and slots or tenons. These are all manufactured so that
adjustments can be made, such as a bore would be started with a test hole.
After parts have been produced at the roughing stage, machine datum‟s are updated to
allow the final cuts to take place and be in the correct position and to size. The first
finished machined part will be checked at inspection prior to all other parts being
finish machined.
Program files can be transferred between machines. Currently this is done with
Floppy disks and USB sticks, dependent upon the controller.
Most parts are inspected manually with use of Trimos height gauge or other manual
measuring equipment such as bore micrometers.
The CMM is generally used for measurement of other parts produced in the factory.
It is kept for measuring of complex parts or measurement that is not easily made. The
CMM was purchased following completion of the project meaning that any CMM
required for parts prior to this were sub contracted out, again creating additional cost.
Most inspection is made manually, and will use a Trimos height gauge with test bars
and specially made fixture cubes.
The Capto unit is fitted following manufacture and tested using a Capto test bar for
its alignment and run-out. All values are recorded and assigned against an individual
serial number. All information is kept in a database in case of query.
Parts are packed according to customer and include labeling for particular customers
or Craftsman branding where appropriate.
Parts are despatched following adequate packing and invoices are generated.
Customers receive the parts at the end of the long process flow and pay invoices. If
there are any issues then the customer makes the cell manager aware for rectification.
Customers will also place new orders where the whole process will begin again.

28
From the above flow chart of processes, the aims and objectives will use the
following areas; manufacture through to Capto fitting, with the rest being outside the
scope of the project currently.
To effectively improve the current processes and systems it is necessary to review
current practices and investigate means for improvement.

29
Figure 2: Current processes for manufacture on the factory shop floor

30
The shop floor receives drawings from the office as part of job bag, with traveler
documentation detailing the machining operations to take place in the manufacture of
the part.
The staff inspector decides what size material is required for the part and sends the
order to saw for the bar to be cut. In some cases castings are used where available,
and dramatically help to cut down on the time used for material removal compared
with solid bar. Some instances require large flame cut pieces of material, which are
ordered to suit.
The machine operators receive manufacturing drawings from the job traveler packets,
which are stored with the relevant material, and begin to create the part programs
within the Mazatrol conversational programming language on the machine tool
controller.
Where necessary the operators will get the staff inspector to check through the part
program to ensure that it is correct, and simple errors have not been made, such as a
decimal point in the wrong place.
For manufacture the material will initially be loaded into a vice on the machine table
where it will have the top face machined as well as creating a profile whilst traveling
in the Z Axis.
Once the part program reaches the cutting depth that it has been programmed for
(usually clearance of vice and cutter length when using large face mills) it is turned
over and machined in a similar manner to give a profiled part.
Features are added to the block as the next operations and some extra stock removal
for profiles where required.
Holes will be drilled to allow for the part to be attached to its fixture, which resembles
the machine the part is being manufactured to suit. Where required, tenons and slots
or diamond locators are added also.
The fixturing is usually mounted to an indexer, which enables the part to be cut from
5 of the 6 faces.
The first operation in the indexing fixture would be to add pilot holes. It is when
these pilot holes are in place that the part can be removed from the machine for first
off inspection. The centre lines are checked to ensure the position of the main bores
is within tolerance for position. Any adjustments necessary are made at this stage of

31
the machining program for offsets that may be required to bring the part within
specification.
The part will be cut just smaller than its dimensioned size with the updated offsets and
then removed as part of the first off checking again and monitored to make sure the
position has not drastically changed, and that it now falls within its drawn values.
Where the part is found to be ok, and no further adjustment required, the part will be
finish cut and then once more inspected as a fool proof.
For all remaining parts of the batch, the program will be run with updated offsets on
the trust of operator knowledge of how much wear takes places against time for
cutting tool wear.
Once manufactured, all parts will go to assembly and be set, with the measured values
recorded in an inspection record sheet against a serial number.
The whole process will vary for time taken per part due to sizes and features. The
average for time taken can be spread over a period however and used to evaluate the
amount of parts produced.
Time taken for measurement of the parts however is more of a constant and can be
evaluated against any other systems that are implemented. An average time for
inspection of a part would be around ten minutes.
Where manual inspection is required the following processes would occur:
The part is mounted to a ground flat fixture, which has been manufactured to replicate
the machine tool the part has been manufactured to fit.
Measurement is required for the centre height of the main bore and also against the
centre line of the part. In most instances, parts will have some kind of tenon or slot,
which dictates where the centre line of the part should be.
The parts are manually measured with use of a Trimos height gauge. This is
calibrated for its touching values against its calibration block.
Each part is measured individually and against the drawn dimensions and tolerances.
Most parts require a tolerance of no more the 20 microns.
The Capto unit itself is measured for its accuracy and run out values using a Capto
ended test bar. Measurements are taken at the base, middle and end of the bar and all
recorded. The Capto unit must be able to provide the end user with the repeatability
and accuracy the Capto sells itself upon.

32
All recorded values are stored in a database so that parts can be checked against in the
event of any issues following despatch to customers.
Maintenance of the Trimos is carried out at the intervals of calibration described in
the Quality Manual. The inspection table is also calibrated at regular intervals to
maintain the level of accuracy required.
To zero the Trimos, a calibration block is used which come with the equipment. It
uses ground flat faces for the probe to touch on to in the Z Axis in both directions.
There are currently no preventative measures or processes in place for Ballbar testing
within the company. The company relies upon the operators changing values within
programs to adjust datum‟s and offsets, which mean that the true accuracy of the
machine is unknown and errors are only accounted for during the machining
operations. The machines are serviced yearly with a full service and set up and also
half yearly with an interim service.
With operators changing offsets and datum‟s in the programs to suit each time the
machine maintenance was reduced during difficult economic periods as it was not
seen as added value, and less parts were being produced by each machine. This
however should not be an excuse for no maintenance at all, and plans could be made
for more general maintenance to be brought within the company and a Planned
Preventative Maintenance (PPM) schedule created for each machine.
For the machine tool to accurately produce and measure parts it will require the
understanding and knowledge of the errors that are present within a machine tool and
the effects they can have, and their implications.
The maintenance, whether predictive, planned or reactive will reduce costs from re-
work or scrapping of parts. This is generally due to out of tolerance rather than mad
incorrectly. With proper maintenance in place, tolerances can be monitored and the
overall accuracy should improve over time.
This will ultimately mean that the scrap and re-work is almost eliminated in a
controlled environment and fit within the target tolerance bands of the parts produced.
Most of the standard Mazak tool holders and Capto tool holders are produced to a
tolerance of 20 microns.
If the machine is accurate and monitored then the parts produced on it can be roughed
and finished as well as measured in the knowledge it will be correct.
It is impossible to ever eradicate all errors within a machine tool, as it is a mechanical
structure. Compensation can be made for these and regular calibration will allow for

33
a known value of error. A full calibration can however mean the machine is taken out
of production for a long period of time. A simple check on the machines current state
at often intervals can be used to indicate when a full calibration or service is required
for the machine.
The quick checks can be used as part of a preventative maintenance plan and will
monitor any deterioration in the accuracy of the machine, and also for any sudden
changes that may occur. These could come from machine crashes, including tools or
probes hitting the work piece, a fault inside the machine; such as bearing failure or an
external factor such as material being moved to the machine on a crane swinging
round too quickly and hitting the machines structure.
3.3 Summary
The chapter has shown the initial practices within the company for manufacture of
parts and how machines are currently maintained. A great deal of trust is placed upon
the skills and knowledge of operators for programming and running the machines for
the batches of components with the "right first time" approach in mind.
Time spent on manual inspection will be discussed in the following chapters and how
much time the stage takes in a best-case scenario for no queuing time, and removal
and replacement in the machine without delays.
The lack of predictive maintenance will cause problems for tight lead times of
components.
In chapters four and five there will be discussion of new systems and their associated
costs and the benefits they will bring to the company both financially and through
functionality.
34
Chapter 4 – Proposed Processes and Systems
4.1 Introduction This chapter will introduce systems and processes that can be incorporated in to the
company's present procedures.
Following on from the benchmarking exercise in the previous chapter, the highlighted
area for improvement will be discussed and presented as a flow chart of the additional
processes required.
The chapter will also discuss the current costs for machining parts, and how this
would be affected if there was a system in place already, as a parts made comparison.
Two very different years are portrayed to give a good example of a very good year's
production and one that shows the effects of the global economic difficulties.
Discussion is made for the machine condition monitoring systems and their costs.
4.2 Description of Processes and Systems In the new proposed system the following processes will happen:
The parts will be machined and measured during the same process meaning the parts
will no longer require removal from the machine for manual inspection, which as a
by-product also removes any further induced errors that could occur re-attaching the
part to a fixture to machine a second or third time. It is almost impossible to get the
part to be positioned in exactly the same place more than once.
Tool wear will be accounted for during the machining cycles and therefore eliminates
operator intervention.
The process is aimed at being semi automated with operator‟s only loading parts into
the machine for manufacture where a program has already been created for
manufacture of that particular part. A program will be written where necessary,
which will be suitable for the new process. The operator will "press the green button"
to start the cycle and remove completed parts. The only time there would be any
other operator intervention during the cycle is if there was an issue.
It is proposed that the manufacture of further parts could be undertaken during the
night as a third unmanned shift. For this to happen raw material would need to be
placed into the machine and the cycle started before the operators finish their shift on

35
the night. The morning shift would then remove the completed parts on the start of
their shift.
For full automation, robotic loading would be required to place raw material into the
machine and remove completed components. This is outside the scope of this work.
A revised flow chart of processes is listed below. This incorporates the extra systems
required from the original benchmark and are highlighted in the italic writing:
Customer
Query / Quote
Order
Design (If necessary)
o Manufacturing drawing approval
o Conversion of 3D model to relevant format to use in alternative
software
Job planning (Traveler)
Manufacture
o Create Mazatrol programs
Roughing
Finishing
o Align axes for machine datum – software packages for probing and
measurement all use different relative datum‟s. These are commonly
taken from the CAD model and will not match where the datum is within
the machine tool. This therefore means manipulation of the model is
required in the software for it to match the machine.
o Create measurement program – software for creating a measurement
program is required. Many operate in a similar manner to that of CMM
software. The machine datum and software CAD datum require
alignment, as previously mentioned. This allows for the ISO program that
is generated to work correctly from the machine‟s Work Piece Co-ordinate
system, for measurement of the part.
File transfer – mentioned in benchmarking but now includes transfer of ISO
measurement programs.

36
BallBar test (if required) – Could be linked to the SPC data for running a test
where rogue results become present in the graphical data
Machining – the machining processes are now made up of additional
processes to include on machine measurement of parts during the cutting of
the metal.
Probing checks – probing of the parts will happen during the machining cycle
and finally once the part has been finished. Probing will provide closed loop
feedback to the machine tool controller for part and feature size and position.
This is likely to happen between different processes such as roughing, semi
finishing and finishing.
o Inspection report – the probes measurement of the part will produce an
inspection report, which can be passed on to the customer with the part
and also within the inspection department.
o Scrap – the probing will also be able to give indication of a part that is
potentially scrapped. A message telling the user to manually check for
issues will be displayed. An example of this could be a tool breakage.
o Re-work – The probe will determine the size of the feature it is
measuring compared to a nominal value with tolerances. Logical
decisions can be used to determine whether updates can be made for
size and / or position within the machine tool controller. Tool offsets
or WPC‟s could be updated to allow for correct sizes to be cut.
Continue – once the part has reached the probed features nominal size and
tolerance band, the next machining operations can then be completed.
Sample inspection from batch – Once the processes are fully proven and
trusted, it will be feasible to trust the results produced on the machine.
Random samples will be selected from each batch however for a check by the
Inspector for quality assurance against the measured results.
o CMM
o Manual
Report comparison – the inspection reports from both the probing and CMM
or manual inspection can be compared to ensure there are no significant errors
or differences between the two methods.

37
Add data to SPC – the statistical analysis of the results from measurement can
be used to monitor the processes and how they vary over time. It will also
provide information for parts that could potentially require a manual check for
verification.
o Out of limit – parts out of limit can be easily identified. The type of
error will also be shown, and may provide evidence of a particular
fault.
o Check tooling – tool wear can be monitored for the amount that it is
updated by after each component is produced. This will be important
if running overnight, as sister tooling will not be available due to
magazine capacity in the tool changer.
o Review processes – the data provided can help with reviewing the
processes and implementing new ideas. For example, this could be the
way holes or bores are machined, such as using circular interpolation
or a boring bar.
o Within limits – parts produced within limits will show that all
processes have been controlled and monitored effectively. This can
provide a figure for number of parts produced wrong against the
number of parts produced overall.
o Continue manufacture – if processes are proving successful and parts
are being manufactured successfully then manufacture can be
continued and monitored until a change occurs. This then must be
investigated.
Capto fitting
Packing
Despatch
Customer
To follow the above description, the additional components have been created in a
flow chart and would fit directly in to the benchmark flow chart:

38
Figure 3: Benchmark flow chart

39
4.3 System Time Comparison
Using probing cycles created by M&H or Renishaw software takes one minute.
Manual inspection of components takes up to ten minutes, which involves
transporting the work piece from machine, measurement of the work piece, recording
the dimensions and then return to machine to be re-attached to the fixture.
This would save nine minutes per work piece.
On a batch of ten parts, five may be manually inspected so the total time saved would
be eighty minutes. This involves two measurements on each part, the base and the
Capto. This process could be much longer if the quality control department is
unavailable or busy. This is therefore a best-case scenario.
An assumption for the time saved is used below in the examples, which show the
machine being fully utilised except for idle periods where components are at
inspection or being loaded. Parts other than Capto tool holders are also produced
within the cell. In the assumptions, the money saved is calculated from machine
hourly costs, worked out from the hours that could have been saved with systems in
place.
Using 2008 figures taken from JobBoss system for all Capto units produced in
Severn Cell within the year:
Actual:
3,932 hours were spent on machining Capto units.
805 units were made over the above hours.
5 hours per part as an average of parts produced in the time spent machining.
Assumed:
Therefore using the above assumption for timesavings, if new systems were already in
place, then the savings on what was produced are shown below:
242 hours could have been saved over the production time.
£10,264 represents money saved from this probing in production.
49 extra parts could therefore have been made in the time saved.

40
Using 2009 figures in the same way as above (Jan to Nov figures used):
Actual:
2,188 hours were spent on machining Capto units.
434 units were made over the above hours.
5 hours per part as an average of parts produced in the time spent machining.
Assumed:
Therefore using the above assumption for timesavings, if new systems were already in
place, then the savings on what was produced are shown below:
130 hours could have been saved over the production time.
£5,536 represents money saved from this probing in production.
26 extra parts could therefore have been made in the time saved.
Figure 4: Parts made comparison
The graph shows the number of parts produced in the corresponding years and next to
it the number of parts that could have been produced in the same amount of time if the
system was in place.
Per Part Assumption:
The saving per part is shown as a rough guide below:

41
Average time machining per part is roughly 5hours.
0.3 hours saved on machining time producing each part with on machine inspection.
£13 represents the money saved per part on machining.
Full Utilisation Assumption:
If parts were machined based on 16 hours per day machining over 5 days constantly
then the assumption would be that:
14,400 hours could be utilised.
2,880 Capto units could be made at an average of 5 hours each.
864 hours could be saved with probing systems employed on the above figure.
£36,720 represents the money that would be saved as a result of this.
173 extra parts produced capability from the time saved using the probing system.
The full utilisation assumption is based on the cell producing only Capto tool holders
and that the demand for products would be able to match the available capacity.
4.4 Machine Analysis and condition As there was no previous system for machine condition monitoring at the company
there is a vast scope for opportunity.
There are many different machine tool health checks that can be made. These
include:
BallBar – a simple and quick test to run. It uses a Linear Variable Displacement
Transducer (LVDT) to measure deviations in a programmed circular (or part) path.
These measurements are recorded in diagnostic software from the BallBar
manufacturer.
Gold standard component – uses an artefact that has been created on the machine tool
and verified for size on a CMM. It can be probed on the machine tool to check for
sizes. Any inaccuracies would give rise for a calibration requirement. Parts produced
can be compared to the artefact using logic statements.
Laser Interferometer – highly accurate for measurement, however takes a
considerable amount of time to carry out tests with. It uses light of known
wavelengths for comparison, which measures displacement, straightness or angle.

42
The BallBar system provides coherent readings and can be linked into the probing
results of parts. This is very important and is discussed further in chapter 5.
The BallBar should be introduced on a regular scheduled basis factory wide. Where
applicable, the simple test can also be run if an accident has happened on a machine
or if there are erroneous results being produced in the manufactured parts.
A Planned Preventative Maintenance schedule would be useful across the factory and
would sit between the full yearly service and half yearly services of the machines.
The condition monitoring of the machines is essential as a foundation of all processes.
If the machine is not capable of producing parts accurately in the first instance, the
machine will only be able measure to that capacity also. This could be very
detrimental to the parts produced as probing would say they are correct even though
they are in error.
The BallBar test takes around 30 minutes to complete from setting up, to running the
tests and evaluating the results in all three planes.
With no current diagnostic or health check system in place it is very difficult to put a
definitive monetary value against the costs of the downtime of machines. However, if
it was put in to context that every hour the machine is down, the company is not
producing, which equates to between £40 - £50 per hour. On top of this there is the
lost revenue from finished parts and productivity overall suffers and leads to extended
or late lead times of parts.
Machine inaccuracies also account for a proportion of the levels of scrap produced.
The machines are potentially running with inaccuracies, which could ultimately lead
to machine failure. If this is monitored correctly, the prevention of failure will be
more cost effective than reactive maintenance and give shorter planned downtime
periods.
An example graph of the output of a machines history is shown below and illustrates
how the machine deviates over time and also how it requires attention when it gets to
a critical point.

43
Figure 5: Example BallBar trend graph
4.5 Summary
The benchmark of chapter three's current processes has been used to create a new
flow chart of the processes and systems required to achieve the aims and objectives.
The costs of having a system in place have been highlighted and will be discussed
further in chapter five when a system selection is made.

44
Chapter 5 – System Selection
5.1 Introduction This chapter will focus on the solutions available on the market currently and draw
upon cost benefit analysis for the systems.
The work undertaken in previous chapters will be influential on the choices made for
the systems and the functionality they will provide.
The systems for investigation are of probing, software and machine condition
monitoring.
5.2 System Selection A number of considerations must be made when looking at the systems required for
implementation of new processes and systems. This can be thought of in terms of
what is required, why it is required and how will it be funded. This is outlined below:
5.2.1 Justification for Purchase
The justification for the purchase can be defined in areas such as:
The equipment costs:
- Costs of probe and software. This should consider costs for implementing on
a single machine as well as a full machining cell or factory overall.
- Costs of training. Training costs can extend much further than just sending
people away for courses. Everyone learns at different abilities and it therefore
may be necessary to utilise extra resource to support this. The level of training
required for the use of the equipment will very much depend on the member
of staff using the equipment.
- Costs of support. Problems can and will occur with anything technologically
innovative. The level of support provided by the manufacturer should be
considered, as this will ultimately affect the manufacture of parts.
Existing equipment:
- Could equipment be utilised in any way if it exists?
- What equipment is currently available to use and test?

45
Value to be gained:
- Extra productivity from machines both during the standard shifts and as a third
overnight unmanned shift.
- Extra sales and revenue from improved sense of quality and delivery time.
Current situation:
- Equipment already in place and being used during manufacture. This can
include automatic measurement and also manual measurement.
- Levels of scrap parts being produced with the current equipment and
processes.
- Cost of machining currently, which is based on the two shifts with an
assumption of spindles turning constantly.
Associated costs:
- Spares and accessories must be easily accessible and relatively inexpensive.
The styli for probes are easily damaged in machine tools due to the delicate
nature their use is designed for. The styli are manufactured to deform before
damage occurs to the main probe body, which would result in an expensive
and costly crash.
- After sales services are important as software is regularly updated and
removes bugs found in programs. The service provided as part of after sales
can sometimes include the upgrades as part of a package. It is particularly
useful to be able to contact someone where technical difficulties are faced.
Where this happens it is more appropriate to speak to an engineer rather than a
call centre reading from a script, and has no idea of what you are asking or
require.
- Warranties of software and hardware purchased must extend beyond taking
them out of the box to use. It is expensive equipment and should be covered
for the use it is specified for.
- Repairs and damaged items. It is inevitable that time to time, mistakes happen
and there will be accidents. If and when this happens it is important that when
equipment is damaged, the machine will have a limited down time while
repairs take place.
- Machine downtimes for implementation will affect the production schedules,
and as such need to be kept to a minimum to avoid disruption. This will not

46
only impact upon the set up of equipment initially but for the testing and
proving.
- Extra and new fixtures will be required to utilise the new processes and
equipment to its full potential. The manufacture or modification of these
items will also have an impact on the production of parts initially. Where
possible this can be completed by an apprentice on a simple milling machine
to minimise the disruption.
Availability could have detrimental effect on length of project both for
standard equipment and spares and accessories. Service engineers will be
required for implementation and could be limited to diarised slots.
Fitness for purpose of the equipment will allow determination of whether it
does everything required or integrates into part of a complete system such as
hardware and software and the process involved.
Effects on costing can be worked out for how extra time the machines are
working affects the cost of parts and overheads.
Machining costs are worked out using the following:
- Direct costs that include machine costs, labour costs and the consumables
used.
- Indirect costs, which include lighting and heating
5.2.2 Selection of Equipment
The requirements of the equipment for its selection are outlined below. The
capabilities must be fulfilled for purchase of the equipment:
Ability to probe parts. Most probes will do this but to what degree and
accuracy is dependent upon brand and money spent. Those with more
complex internals will generally be of better quality and accuracy however
will be offset by the extra cost.
Must meet accuracies required, which in most instances is around 10 microns.
Software MUST produce reports at the end of process. This is stipulated as
one of the most important parts of the selection criterion. The Inspection
reports require the ability to be edited and formatted to suit the manufactured
parts and customers. The reports should be produced in a suitable software
package such as Microsoft office or in PDF format.

47
Ability to re-machine work during the machining process. CAD models in
with relevant tolerances could be used to measure against whilst machining to
produce accurate, in tolerance parts in one process.
Time required for setup:
- The time taken for initial setup of equipment for use during the machining
process, including programming.
- How simple is the equipment and processes to use?
- What is required for the use of the equipment and processes?
- Who is required for the use of the hardware and processes?
Time required for installation:
- How long is the machine out of action for whilst equipment and software is
being installed?
- Who needs to be involved with the installation and setup?
- What is involved during the installation and setup?
Calibration processes:
- How often is calibration performed?
- What equipment is required for calibration?
Costs, which should include all associated costs mentioned above.
Service levels:
- Level of and quality of service provided by manufacturer.
- What is included as standard?
Upgrades:
- If software changes, what costs are involved including training and software
cost?
- Adding extra user licences for software if and when necessary.
Availability of spares such as styli for probes, and assurance they can be
obtained quickly.
Amount of users of software and equipment:
- Limited to one person?
- Multiple users at the same time?
- Multiple users at different times?
- Who is responsible?
- What can be used?

48
- When can it be used?
5.2.3 Purchase of Equipment
When the purchase of the equipment has been agreed upon, the following should be
considered:
What will be included in the deal? Can any extras such as spare styli and
extra warranty be thrown in?
Operator training:
- Before, during or after the installation of the processes and equipment?
- Who needs to be trained and at what level?
- Who will provide training?
What will be required at the installation in terms of people, time, machines,
tools and equipment
Terms of payment and conditions
To investigate the possibilities available to use, contact was made with various sales
reps and demonstrations made where possible at machine tool exhibitions or local
venues, such as the University of Huddersfield.
The details of the companies investigated for hardware and software are recorded
below:
5.3 Companies Investigated for Probes and software
5.3.1 Probes Many different companies were investigated during the period of the project
including, but not limited to Marposs, Renishaw, M & H, Blum Novotest, Heidenhain
and Delcam. Some of the positives and negatives of the systems are detailed below:
Company A investigated whilst at the EMO Milano Exhibition in September 2009
raised doubt for the ability to receive good customer service. The staff on the stand
did not speak much English, and therefore the lack of communication made it difficult
to get answers to any questions, and were presented with a generic general

49
information brochure. With such a technical project it was felt that the correct level
of support would be required, and whilst there would be sales advisors in the UK,
anything further would have to go through head office with the possibility of the
problem mentioned.
Company B investigated is a very large company, and have been involved with
probes for a long period of time, and are generally accepted as one of the market
leaders. Whilst investigating however, there seemed a lack of interest from the sales
reps and follow up in the beginning of the project. This was possibly due to the
economic climate that prevailed, and staff being over-stretched to cover all markets
whilst redundancies were made. The probes are generally good quality and reliable.
Company C is part of a large metrology group, and therefore has a very large backing
behind them. The quality of the probes and usability is very good. The probes are
cheaper in comparison to most of the competition and appeared to have a better level
of service than many of the others. The UK sales representative provided a probe for
trial use.
Company D were found to be very expensive for probes and through negative
previous experiences and dealings meant they were not a priority for choice.
One particular manufacturer could not offer a solution for use with the Mazak
Mazatrol controllers when investigated. They could however be considered for other
applications.
Using the above, there would be two options for the probe itself; the company could
retain its original probes, which are Renishaw, and are a mixture of old and new
model probes. The machines for the projects implementation were originally sold
with a Renishaw touch trigger probe for part setting. Using the current equipment
would not cost anything, but could affect the choice of software available and its
functionality.
If the M&H probes were utilised then there would be initial purchase costs. The
probes can be configured so that they work with the Renishaw receivers, which are
already installed in the machine tools. This helps to keep the initial costs lower.
5.3.2 Software As mentioned above for the probing, the staff of company A did not speak much
English and could not understand what was specified when asked. The same

50
concerns were raised, as software can be difficult to use and require time with
applications support staff.
Software from company B had been used previously within the company. This
performed some of the required functions, but not all. The software had a major
drawback in that it cannot be manipulated to produce inspection reports in the format
required. After a visit to the manufacturer's stand at the EMO exhibition show it was
made clear that additional new software is available, which is based around the
reporting from inspection. However this cannot perform functions of the software
used previously within the company, so two software packages would be required.
As the software was very new, it appeared complicated and difficult to use in the first
instance, and even the sales representatives were struggling to find options. This was
likely due to the launch of the software at the exhibition and lack of familiarity.
Another manufacturer produces the new reporting software that was demonstrated.
Company C provided a full demonstration of their software at the EMO exhibition.
The first demonstration was shown by someone unfamiliar with the operation of the
software, which proved its ease of use. The software can be used to perform both
probing and also reporting as one package. The software generates G-code for
calibration of the probe as part of the probing cycle allowing for greater accuracy.
Company E is well known and deal with metrology reporting and CADCAM based
applications mainly. The software on display was similar if not identical to that on
another manufacturers stand, but with their own branding.
Similarly to the probes, there are two viable options for the software that could be
used. This would be Renishaw software or software by M & H. The software is
where the company will have to invest heavily to make the project successful and
work in the manner required.
The service provided by the companies will also influence decisions in the purchase.
Overall both systems have the functionality to work to the set specifications.
The other implications would be that of a financial nature. The need for a business
case was presented as a financial justification in a cost versus benefit analysis. This
can be found below, and utilises figures from chapter four.

51
5.3.3 System Selection Scoring Matrix A costing analysis has already been included in the chapter as 5.4. To add further
emphasis to this, a scoring matrix is presented below to show the technical and
commercial characteristics of each system. Each characteristic is graded between 0
and 3 with a system total at the bottom, with 0 being least and 3 being the highest
rating.
Probing hardware:
Justification Weighting
Multiplier
System A System B System C System D
Equipment
Already
Owned
N/A 2 0 0
Meet
Required
Accuracy
10 N/A 30 30 0
Availability
of Spares
8 N/A 24 24 0
Standard of
Service
10 N/A 30 30 10
Future
Upgrading
N/A 2 2 1
Installation
Ease
5 N/A 10 10 0
Training 8 N/A 24 16 0
Equipment
Cost
5 N/A 15 5 0
Calibration
of Equipment
10 N/A 30 20 0
Probe
Functionality
– Including
Adaptive
Machining
Support
10 N/A 30 20 0
Total N/A 197 157 11
Table 1: Probing hardware scoring matrix

52
Probing software:
Justification Weighting
Multiplier
System A System B System C System E
Software
Already
Owned
N/A 2 0 0
Future
Upgrading
N/A 2 2 1
Standard of
Service
10 N/A 30 30 20
Installation
Ease
5 N/A 10 10 5
Training 8 N/A 24 16 16
Equipment
Cost
5 N/A 15 5 5
Software
Functionality
– Including
Adaptive
Machining
Support
10 N/A 30 20 10
Report
Creation
8 N/A 16 24 16
Macro
Creation
10 N/A 30 20 0
License
Limits
N/A 2 2 1
Total N/A 161 129 74
Table 2: Probing software scoring matrix
5.4 Costing Analysis
Equipment was sourced and tested to check for suitability from M & H.
The benefits of the system could be seen straight away using the equipment for time
that could be saved. This was used in the cost benefit analysis with figures from the
computer system used for working out the costs.
These costs are shown below which include the Capto units made in 2008 and
January to November 2009. Times and costs were taken from the JobBoss system
and then put into a table where calculations could take place to work out what savings
could have been made over this period.

53
5.4.1 System Costs The system costs for both the M & H systems and Renishaw systems are fairly
similar. Equipment already installed on the machines was ignored for the purpose of
providing a reasonable costing exercise and decision of the two systems would then
come down to functionality.
The total price will include software cost, Inventor filter cost and probe cost.
Total system price is approximately £9,000.
Payback period:
The payback period for the equipment can therefore be calculated as such below using
the figures from the 2008 and 2009 parts manufactured:
If we took option of all three for purchase at £9,000 plus three further probes at full
price £2,140 (discount would have to be negotiated) which would equip all four
Nexus Machines then:
Using 2008 figures (good year):
£10,263.75 (money that would have been saved if probing in place) / 12months =
£855 per month
This gives a time for payback on equipment of 18 months
Using 2009 figures (bad year):
£5,533.5 (money that would have been saved if probing in place) / 12months = £461
per month
This gives a time for payback on equipment of 33 months
The cost savings would be based on the machining time saved. With operations
moving forward there would be the opportunity for increased levels of fixtures, which
would raise the amount of capacity for the machines production. The parts produced
on the machine and verified on machine would save labour costs of inspection. With
production costs reduced the units will become more profitable to make and sell,
which will also add benefit to the costs saved and the period of time for payback on
the equipment.

54
Discounted Cash Flow:
Using the figures a discounted cash flow can be created. The calculation shown
below is for the 2009 figures:
Discount Rate 8.00%
0 1 2 3 4 5
Year 0 Yr1 Yr2 Yr3 Yr4 Yr5
Outflows
Equipment
Purchase
-15140
Inflows
Monthl
y
461 Machine Costs
recovered
5532 5532 5532 5532 5532 5532
Maintenance -1514 -1514 -1514 -1514 -1514
Cash Flow -9608 4018 4018 4018 4018 4018
Discounted
Cash Flow
-9608 3720 3445 3190 2953 2735
Cum NPV 6435
Table 3: 2009 Cash flow
Similarly the values for the 2008 figures:
Discount Rate 8.00%
0 1 2 3 4 5

55
Year 0 Yr1 Yr2 Yr3 Yr4 Yr5
Outflows
Equipment
Purchase
-15140
Inflows
Monthl
y
855 Machine Costs
recovered
10260 10260 10260 10260 10260 10260
Maintenance -1514 -1514 -1514 -1514 -1514
Cash Flow -4880 8746 8746 8746 8746 8746
Discounted
Cash Flow
-4880 8098 7498 6943 6429 5952
Cum NPV 30040
Table 4: 2008 Cash flow
The discount rate was set at eight percent and also a cost for maintenance added
which could include software upgrades and other spares, which may be required.
This is set as 10% of the value of the equipment purchased.
The figures show the value of the equipment when purchased and then its value over
the five-year period with depreciation.
As previously mentioned, the University hosted testing being undertaken by
Renishaw. This was to investigate radio wave probes on the 5 axis Geiss machine,
and also testing of their newest version of Productivity Plus AE pro.

56
This version is specifically aimed at the lights out manufacturing market. The contact
was a senior applications expert.
The new version of the AE Pro software is designed for creating probing cycles for
lights out style machining. The program can be used as process control of features
rather than for reporting. This would therefore mean this software could be used in
conjunction with the M&H software, which will provide the inspection report at the
end of the manufacture.
The program provides the ability to be able to chose a particular probe, or create one
in the custom mode. This would be for stylus length and also diameter of the ball.
Measure features are created in the program in a similar way to the 3Dimensional
Form Inspect (3DFI) software. This is pretty standard amongst most packages these
days.
Macros can be inserted into the program as well as logic statements, which allow for
the machine to re work a part according to updates of tools and work piece offsets.
The program can be added to Gibbs CAM software as an add-in, which allows the
probing to become part of the generated cutting program. This could be something
additional to investigate for the future.
5.5 Hardware and Software Selection Following on from trials run on the machines within the Severn Cell the following
equipment was decided upon:
Hardware – Renishaw Touch Trigger Probe. In the first machine, this was an OMP
60 model. As this was already installed in the machine there was no cost implication.
The probe was only previously used for part datum setting through the Mazatrol
Conversational Programming language.
A Renishaw TS27R Tool setting Probe was purchased to accompany the Part Probe
for further automation of the processes. The tool probe measures both length and
diameter of tools present in the spindle when commanded to do so. Values are
transferred into the machine tool controller‟s tool data file.
Software – Renishaws Active Editor (AE) Pro was purchased by the company many
years ago but was not implemented. The software in the current state was unsuitable
for the purpose required of it. Many meetings were held with Renishaw during the

57
period of the project and agreement made to upgrade the software free of charge for
the company‟s help in testing of new developments within the application.
When the software was originally purchased this was around £6000.
To work alongside the AE Pro software there is also report creation software, which is
called CNC Reporter. This has the functionality to create inspection reports for each
part produced. As an additional function, data from these reports can be used to
create Statistical Process Control (SPC) graphs, which monitor how well the process
is performing.
Costs for the other software and hardware are shown above and are quite comparable.
5.6 Hardware and Software Functionality Essentially the touch trigger probes are the same, and both function using infrared
signals from the probe to a receiver eye in the machine tool. The M&H probe can be
programmed to send signals to match the Renishaw receiver, or any other brand,
which makes it ideal for a replacement probe if an incident, occurs within the factory
allowing the Probe to be used on most machines.
The tool-setting probe is a replacement for the standard Mazak equipment, which is
only capable of length measurement of the tools. The Renishaw TS27R has
functionality for measurement of diameter also.
It is the software where the main differences can be experienced. The M&H software
is very similar to a package that would be found on a CMM. Feature points are easily
selected and then a report generated post measurement to show the values measured.
The software however has no functionality to apply automatic offset updates within
the part program. The Renishaw software packages also behave in a similar manner
to those of a CMM and allow for part programs to be created with automation
included. This allows for work piece co-ordinate updates and tool dimension updates
to create a manufactured in one process component. The downside to the program
however is a lack of flexibility in reporting and complexity of the program.
5.7 Machine Maintenance
There are a number of ways in which the condition of the machines can be monitored.
There are sophisticated tools available from manufacturers such as Renishaw, Agilent

58
and Heidenhain, however simple ideas can also be effective, such as using a
calibrated gold standard part.
The Heidenhain grid plate is an expensive kit to purchase and would not really be
suited to „everyday‟ shop floor usage. There is a great chance that it would be
damaged accidentally.
Renishaw offer a Laser Interferometer kit as well as the BallBar kit. The Laser is
used where full calibration is required and requires the machine to be out of use for
around two days on average meaning it would only be used on a half yearly or yearly
basis.
For general use, the BallBar kit provides the best overall solution. It is simple and
quick to run, with shop floor staff having the ability to use the equipment if they
suspect something is not right.
Highlighted below are the benefits and costs that would be implicated with such a
system:
5.7.1 Benefits
The machines are monitored on a regular basis and allows for servicing to be
implemented around this.
Graphical history charts for each machine can be created within the software, and
could be used for monitoring of degradation or any results that do not fit the trend.
The BallBar kit can be used on all machines with correct adaptor kit, which allows for
factory wide usage.
Tests can be cut down in length of time taken when the operator is used to the use of
equipment and generally tests take around 20 minutes per machine to complete.
The equipment is kept in a hard case so can be stored easily and the risk for damage is
kept minimal. It can be stored with other measurement and calibration equipment at
one of the inspection stations, which allows access when required.
The kit can help to diagnose faults for maintenance of machines and provide a quick
answer to the user, such as following an accident on machine to assess what damage
has occurred, if any.
The kit provides ease of use as the computer can be placed anywhere with Bluetooth
connection range and therefore there are no wires to get tangled or caught whilst
operating.

59
5.7.2 Drawbacks Whilst a test is being run the machines are out of operation. This may only be for 20
– 30 minutes at a time but is still lost productivity and money.
The results can be difficult to interpret for what is good and what is bad. It requires
someone who can interpret the charts correctly to see where errors lie in the machine.
The initial costs of equipment for purchase can be quite high and also depend upon
the amount of equipment and adaptors required.
Calibration of the equipment needs to be kept up to date and will require
responsibility for ownership of this.
The BallBar is an expensive piece of equipment if it is accidentally broken when
running the program. This would most likely happen if changes were made to a
proven test program. Running without the BallBar itself installed is always a good
precaution when proving the program. This correct set up for operation will provide
the most accurate results from the test.
The software has different modes from the front end, which include operator mode
and advanced mode. This allows for setup and determination of tests, whereas an
operator can only run the test.
Bluetooth connection has a limited range of 10m, which means a laptop is preferable
for use, rather than desktop computer and sometimes is unreliable and does not hold
connection compared with its wired alternative older model.
The software would ideally need to be kept to one computer so that the results and
history files are kept up to date and in one central position.
Issues over responsibility of equipment and testing of the machines could be
presented, such as use is only permitted by staff inspectors or certain operators and
not everyone.
There is the possibility of chasing microns constantly and therefore increasing costs
through service and maintenance of machines that is un-necessary for the type of
machine.
Procedures would be required for „standardising‟ the test as much as possible, such as
on the Mazak milling machines, the heights in Z axis and also table position would
need to be kept constant and within the usual working areas.
Not all accidents on the machines are reported so errors may only be picked up when
testing routinely. This would raise questions for the frequency that testing of the
machines would take place.

60
5.7.3 Costs Kits are around £10k, which includes all available adaptors, full user training and
certificates for calibration.
The BallBar is now wireless and therefore is very versatile for use, with no cabling
dragging or tugging between the machine tool and computer.
Machine downtime for each test that is run takes around half an hour, so would be
feasible to estimate that this would equate to roughly £20 – £25.
Human effort is required for each test that is run, and again this is approximately half
an hour per machine. Responsibility for the testing would need to be assigned to
someone as it would not be feasible training everyone in its use to begin with. A slow
rollout program would be more effective.
A lack of maintenance costs money, as well as keeping the machines up and running.
As parts wear, the errors created in the machines are ever increasing and therefore
more likely to fail, which would cause greater expense of repairs.
Machine downtime can last for long periods, depending on the issue and therefore be
better managed through preventative rather than reactive maintenance to reduce
important lead times.
Costs provided by Renishaw
BallBar and calibrator Kit
Bluetooth dongle
Two days training for up to four people
360 degree Lathe adaptor kit
VTL adaptor
Total price £8850
For implementation of the BallBar system within the Severn Cell the following could
be assumed:
Cost of the BallBar kit to suit milling applications £7850
Four priority machines would be tested on a rolling basis with each machine tested
fortnightly.
To reduce the impacts on production, this could be done on a Saturday morning or
Friday afternoon when there are generally no shifts.

61
The cost of each machines downtime would be around £20 – £25 for each half an
hour it is being tested. This would mean that over a year it would cost between £520
– £650 per machine.
For the four machines this would work out to £2080 – 2600 per year.
If each machine had downtime of approximately two weeks per year through
servicing and breakdowns this would cost the company between £5760 – £7200 Per
machine. For all four machines, the total cost would be £23,040 – £28,800
Therefore based upon this assumption, if breakdowns and maintenance was reduced
by fifty percent the cost of the BallBar equipment would have been paid for in 7 – 9
months roughly.
5.7.4 Training
The training provided is for two days and can include up to four colleagues.
The training would be provided to suitable members of staff, such as the staff
technicians, works manager and a member of management.
One day is spent learning the milling tests and the other is spent learning the lathe.
Both days are mainly practical and include time for learning how to interpret and
analyse the results provided by the equipment.
The course can be held at the company's premises or alternatively at Renishaw
premises. The latter of the two could be useful in the sense it does not mean long
periods of machine down time over those days, however, utilising the equipment on
our own machines allows for greater knowledge to be gained and set ups stored
within the machine. In effect analysis of the companies own machines under expert
supervision would happen.
Further study, or pre training use would be useful for familiarity with the equipment
and gaining more from the courses.
5.8 Summary
The chapter has drawn conclusions on the systems and processes that will be required
within the company. Cost versus benefit analysis was performed and shown in
graphical format as well as monetary values.
The systems chosen were the Renishaw BallBar for machine condition monitoring
and after testing, the Renishaw probe and Active Editor Pro Software.

62
Details of testing of the M & H system will also be presented in chapter six as there
was substantial work completed with this system initially.
Details of the system implementations, testing and results will be detailed in the
following chapters.

63
Chapter 6 – Implementation
6.1 Introduction Chapter six describes the implementation of the hardware, systems and processes
within the company.
A priority cell and machines are outlined for use and what will be required for
successful implementation.
6.2 Implementation
Identification of Key Processes
6.2.1 Priority Cell
The cell chosen for initial implementation and testing will be Severn Cell, which is
primarily made up of milling machines. This was chosen for the knowledge of the
parts produced due to them being designed and produced in house. The levels of
scrap and re-work account for approximately a quarter of the total for the factory
overall. This was considered beneficial for process study.
The majority of work carried out in the Severn Cell will be small batches of around
five to ten parts, but this can vary with large batches and one off specials also.
In all instances there will be a massive time saving from inspection on machine for
the first off part as discussed in chapter 5. This time is made up of removing the
component from the fixture in the machine, taking the part to be inspected, re setting
the component in the machine fixture and updating the program.
6.2.2 Priority Machine
For initial implementation, trials and testing will be carried out on one of the four
Mazak Nexus 510 C II machines in the Severn Cell, which are vertical milling
machines.

64
Two of the machines have Fusion 640M controllers, and two have Mazatrol Matrix
controllers. The Matrix is the newest version of the two Controllers and is more
refined than the 640M. It has subtle differences that could make a huge difference
when programming and therefore it was decided that it would be most sensible to use
the eldest of the four machines so that the likelihood of it functioning across all the
machines is greater. If the newest controller had been selected first, there could be
potential issues with backwards compatibility for programs on the controllers.
Following on from the four VCN‟s the processes will be implemented onto the
horizontal Mazak FH6000 machine. This has a Fusion 640M controller similar to the
vertical machines.
6.2.3 Probe The probes are already installed in the machine tools, and came as an additional
purchase option at the time the machines were selected and purchased. The probes are
a mixture of MP10 and OMP60. Both probes are infrared signal based, as there is no
requirement for radio transmission due to the machines only being 3 Axis. The Strain
Gauge probes were considered as an upgrade when investigating hardware and
software, however, it was deemed that the equipment was sufficient for current
purpose.
An M&H probe was also purchased during the duration of the project due to its
flexibility and capability for use if accidents occurred with other probes, and at the
time was deemed to be a better option as it worked with the M&H software
calibrations and accuracies.
6.2.4 Software
The software package in use is Renishaw‟s Active Editor PRO. The company had a
previous version of this installed on a standalone PC on the factory floor. Issues with
this caused it to be discounted in the early stages of the project and did not have the
relevant functions required.
A copy of M&H software 3D Form Inspect was purchased as this fulfilled most of the
project requirements at the time. This was used and tested extensively until a new
version of the Renishaw software was released, which had full functionality that was
required for the project to come to fruition.

65
The software was released on a free upgrade due to the collaboration between the
company and Renishaw in testing of Post Processors and for the Productivity Process
Pyramid in its current state.
As an attachment to the Renishaw software, an add-on called CNC Reporter is used
for inspection report generation and process monitoring through SPC functionality.
Figures 6 - 13 show screen shots taken from the Renishaw AE Pro software where a
part as been imported for a program to be created for measurement. The program was
transferred to the machine tool controller and subsequently used. Figure 6 shows the
extensive 'tree' of commands and logic on the left hand side of the screen with the part
shown on the right with the Work Co-ordinate System (WCS). Figure 7 illustrates a
feature being created on the model for inspection. In this instance it is for a plane and
is then used to update the length of a tool. Figure 8 shows the tool that will be
updated as a result of the feature measurement and the parameters that can be
addressed for the tool. Figure 9 shows a logic statement being built within the
software to control a specific update. In the figure shown here, it is for an angular
check of the rotary axis using a measured plane. The logic statement provides an
update for the rotary axis to ensure that the part is cut square. Figure 10 shows how a
customised message can be displayed to the operator if the update exceeds the limits
of the logic that has been created. Figure 11 demonstrates another measurement
feature being created. This is for measurement of a bore and will be used for creation
of updates such as the tool diameter. Figure 12 shows another feature available in the
software, which will write the measured value in to a variable number on the machine
tool controller. This is particularly useful when monitoring the process happening.
Figure 13 shows the use of manual G-code entries being inserted in to the program to
call a program to re-machine following a logic statement finding the part has been cut
too small. The logic statement is also used to provide feedback for the operators as
error messages. If the part is manufactured to tolerance it will continue to the next
part program.

66
Figure 6: Test part model in the Renishaw AE PRO Software
Figure 7: A feature being created on the model for inspection.

67
Figure 8: The tool, which will be updated from the feature.
Figure 9: Logic statement being built within the software to control a specific
update.

68
Figure 10: Customised error messages can be displayed for the operator
Figure 11: Another feature measurement being created.

69
Figure 12: Writing the measured value in to a variable number on the machine
tool controller.
Figure 13: Manual G-code inserted

70
6.3 Processes
6.3.1 Processes for Implementation Before any new systems can be placed on the machine, it is essential that the
foundations are looked at in detail. The steps taken to ensure control of processes are
very important and will determine how capable the machines are of repeating and
being accurate.
The level of process control in place was measured in collaboration during a visit to a
Renishaw facility, and a process pyramid created to follow a similar procedure to
theirs.
One of the processes is a Ballbar test. This would be carried out at set intervals and
give and provide a record of the machines capability.
6.3.2 Testing
Testing will begin with assessment of the machines and use the process pyramid to
ensure there is a stable manufacturing capability to work from. One of the key
processes to study is to ensure the machines are accurate and repeatable, so will
require tests using the BallBar to assess the current situation.
Testing will include methods for programming of the machines and how the probing
routines will work.
The testing procedure for the machine can now be simplified and broken down to the
following steps for the next chosen machines:
Check probe installed on machine
Create calibration routine in software
Run calibration of probe
Create probing program in software
Create programs in Mazatrol to cut part
Run cutting program with probing
Check inspection report against manual inspection

71
6.3.3 Investment Requirements Below is a listing of what will be required to equip all four Mazak Nexus 510 C II
machines to be able to run on a „lights out‟ manufacturing basis:
Spindle probe – already present on machines so no cost applicable.
Software – previously purchased for FH 6000 machine with post processor
specific to this. Upgrade of software negotiated for test purposes, and help to
correct the post processor to work on the four Nexus machines. This will
allow use of AE Pro on all machines.
One package is required which will create probing routines and logic to be
used in manufacture, and then a second add in for reporting of dimensions and
SPC.
Hardware – wiring required to connect the machines to the computer for real
time data collection if necessary and possible. Transfer of data and programs
can be done using floppy disk or other media currently. This is not essential
equipment but would be preferential to have for the future.
Tool setting device – not yet purchased but this includes all hardware and
software required and any installation and training necessary for its use. It is
not essential but will help to improve accuracy and will aid productivity.
To maintain the machines and ensure their health a BallBar kit will also need
to be purchased. The kit including training and adaptors is around £7850.
The training includes necessary theoretical and practical teaching in both
milling and turning operations. The health checks of the machines can be
related to the periods of time between services and through monitoring of SPC
data. If there are deviations to the defined standard baseline, a simple BallBar
test could help to track a problem.
With software upgrades everything required for the purposes of the project is
available. The addition of a tool setter will ensure greater accuracy and process
stability. It will allow for full measurement of tools and could help provide more
information on the usage of tooling and inserts with wear. The information can be fed
back into the tooling file for more accurate information and performance from the
machines.

72
6.3.4 Implementation Plan
Figure 14: General implementation flow chart

73
Figure 15: Calibration procedures
Above are two flow charts created to show the implementation processes for running
the machine „lights out‟. One is the general overview, whilst the other describes the
calibration process for the installation of the probing on to the machine.
Steps to implement:
Install probe into machines. Check stylus run-out whilst in spindle using clock. This
should be as small as possible to ensure a higher accuracy when probing. Any
incidents such as crashes or bangs should call for the probe to be re calibrated in this
manner.
Calibrate probe in both Mazatrol and ISO. This is done by setting a ring gauge on the
machine table. The spindle should be loaded with a clock and adjustment made in the
axes to find the true centre position. The Z-axis value can be set using the MMS

74
touch feature within the controller. This can be set at micron resolution and is
accurate enough for pre calibration. The centre point values and Z height value
should be recorded and also preferably stored within one of the G54 etc.
The Mazak calibration is most easily done first and just requires the centre co-
ordinates and a Z measure height to be entered. The Z height is measured first and
touches on to the top of the ring gauge. The calibration function is next and measures
four points within the gauge to give calibration values. Once the Mazak calibration is
complete the Renishaw software can be used to create a calibration routine for the
ISO side. The program generated uses twelve measure points on the inside of the ring
gauge as well as the Z height measurement. This provides a vector measurement to
give greater accuracy. The downside to this however is that more variable numbers
are used both for calculation and also storing of calibration values.
It is important that the probes are recalibrated on a regular basis to ensure that
accuracy is maintained and that measurement is consistent. If there is an accident on
the machine then the probe should be calibrated again.
The probes should be used when possible and appropriate on jobs that pass through
the machines. This may be more difficult in a situation where the part is a one off and
no CAD model is present. Creating such a part could be more timely and ineffective
for cost than standard measurement using height gauge or CMM if present at the time.
If CAD models are required for tool holders then these can be designed from the
drawings and then stored on the server as normal. The models could then also be
used on the website.
The CAD model is imported into the relevant software, the M&H or Renishaw
software. Once in the software, the model can be manipulated to suit the application
it is to be used for, and allows for the part to match the datum set within the machine
tool cutting program. This is usually set to the highest point in the Z-axis. If there is
rotation in the indexer, the Z height datum needs to be adjusted accordingly. This can
also be changed to suit within the measurement programs.
The programs then need to be created with measure points. When using the Renishaw
software, machine updates can also be included and then when ready a machine
program can be created. The program and its sub programs can then be transferred to
the NC controller for running.

75
The programs created should have the ability to output the files the print folder on the
machine controller. This information can automatically be passed across to the CNC
reporter software and generated. This is all still to be queried however
Below is a chart of all the processes and the responsibilities for each that happen from
input (customer) through to the output (customer):
Process Sub Process Responsibility
Customer Cell Manager
Query / Quote Cell Manager
Order Cell Manager
Design IF Necessary Designer
Manufacture Approval Customer / Designer
Convert 3D Model to IGES Format Designer
Job Planning (Traveler) Cell Manager
Manufacture Cell Manager
Create Mazatrol Programs Operator / Staff Technician
Roughing Operator / Staff Technician
Finishing Operator / Staff Technician
Align Axes for Machine Datum Staff Technician / Operator
Create AE PRO Program Staff Technician / Operator
File Transfer Operator / Staff Technician
Machining Operator / Staff Technician
Probing Checks Operator / Staff Technician
Inspection Report Inspector / Staff Technician
Scrap Inspector / Staff Technician
Re-Machine Inspector / Staff Technician
Continue Inspector / Staff Technician
Sample Inspection from Batch Inspector / Staff Technician
CMM Inspector / Staff Technician
Manual Inspector / Staff Technician
Report Comparison Inspector / Staff Technician
Add Data to SPC Inspector / Staff Technician
Out of Limit Inspector / Staff Technician
Check Tooling Operator / Staff Technician
Ball Bar Test Staff Technician / Operator
Review Pyramid Processes Staff Technician / Operator
Within Limit Inspector / Staff Technician
Continue Manufacture Operator / Staff Technician
Capto Fitting Fitter
Packing Fitter
Despatch Fitter
Customer Cell Manager
Table 5: Process responsibilities

76
Figure 16: Process flow chart

77
Informative
Active
Predictive
Preventative
PA
RT
Information to help
develop new processes
Protect from
Manual Errors
Indication of
Process
Critical features
ONLY
PROCESS SPECIFIC
Design For Manufacture
Feed and Speed Rates
Machine Capability – BallBar
Testing
Probe Qualification
Regular
Maintenance
Machine Check
Tooling Suite Check
Component in Fixture check
Correct part check
WCS Set
Tool Set
Thermal Track
Tool offsets
Broken Tool
Check
Updates
Finished AND roughing sizes
Figure 17: Process Pyramid

78
6.3.5 Process Pyramid Stages
6.3.5.1 Preventative
Regular Maintenance
The preventative stage of the pyramid is probably the most fundamental and helps the
understanding of the machine and processes that occur on it. Being preventative will
ensure that the likelihood for error occurring is considerably reduced. Where things
do go wrong, this is likely to be due to unforeseen circumstances.
Regular maintenance of the machine is the key to achieving successful manufacture of
the components. Without systems and processes in place to control what is happening
during the machining processes, there could be endless occurrences of errors and
scrap parts. This aids production not only with probing in place but also on a day-to-
day standard basis.
6.3.5.2 Design for manufacture
When parts are designed they will be checked for suitability for manufacture, and the
processes and machines that will be required. All drawings are passed for approval
after detail drawings are complete. Each set up will have a specific fixture already to
aid this production, or where required, a new fixture manufactured.
A design based KTP project will also influence a great deal of this work, which is
running concurrently and will introduce a standardising system to allow all
components to work from a standard features database.
6.3.5.3 Feed rates and spindle speeds Feed and speed rates are being monitored currently and are populated within an excel
spreadsheet, which details everything the operators need to know. It is anticipated
that this can be further enhanced with the use of SPC, as the wear rates can be
monitored with tool updates compared to sizes of features. The length of time for the
cutting processes can be measured and will provide us with solid information.
The tools available are all listed within one sheet of the file, and then the commonly
used ones are separated and put into permanent pockets in the tool carousel. Doing so
leaves spare pockets for which job specific tools can be entered. There is a vast

79
amount of knowledge amongst the shop floor technicians for the tooling used, what
works best and keeping tool life optimal. When required the reps from tooling
companies such as Sandvik and Guhring are very useful and will provide help and
information on cutting, and optimisation.
6.3.5.4 Machine capability
Machine capability has been monitored where possible using ball bar testing
equipment. A graphical history is built up within the software for this and allows for
limits to be set before requirement for an engineer is called to service the machine.
The capability can also be monitored through use of SPC when the probing is fully
running and any features that are abnormal and out of limits should provide reasoning
for investigation.
It is also important to know what the machine is capable of according to the
manufacturers specifications. There would be little or no point trying to chase
microns on a machine that could not get anywhere near this for example.
6.3.5.5 Probe qualification
To qualify the probe it must be calibrated on the machine against a ring gauge of
known size. For the test purposes this was a 70mm ring, which, when calibrated
measures 69.999mm.
A program can be created using Renishaw AE Pro software, which gives a calibration
routine and will check for probe length and also work out offsets in the ruby ball and
where the central position is. It calibrates by using vectors to get a best fit for the
position and size. These calibration values are stored in the machine variables and
can be viewed if necessary to ensure they have not been altered.
It is wise to calibrate the probe twice to ensure that the greatest accuracy is achieved
and is recommended by the applications engineers who designed the software and
work with it daily.
The probe is qualified in both Mazatrol and in ISO – this ensures that the probe is
measuring the same within both variables in the controller.

80
6.3.5.6 Predictive Protect from manual errors
The predictive step of the pyramid is the knowledge of the processes and where things
could go wrong. By ensuring these are checked each time the machine is run, there
should be very little chance of a manual error occurring.
6.3.5.7 Machine check Checking that the machine is correctly functioning before any operation is carried out
is essential.
The machines should be checked daily to ensure that there are no outstanding issues
that require resolution before operation occurs. This would include checking levels
of coolant and oil etc.
The machine job boards are noted with information of servicing dates. If these are
incorrect or missing, they should be checked against the schedule.
6.3.5.8 Tooling suite check
The tooling required for each job should be checked before it is started. If it is a
special or non-standard part, extra or new tooling may be required. This stage can be
done when planning a job or during design, as well as double-checks being made
before production.
All tooling should be listed in the tooling file and states everything the operators
would need to know as shown in Figure 18. This can be used for cross-referencing
against the tool data file on the machine controller.
6.3.5.9 Component in fixture check Simple manual error such as not putting a component in the fixture – either the vice or
indexer could cause the machine to crash if the green button was pressed. This also
links to the correct part check as described next.
6.3.5.10 Correct part check
Ensuring that the correct part is placed into the fixture – many parts can be laid out on
the floor next to the machine ready to be started. It could be the case that an incorrect

81
piece of material is picked accidentally, and then machined. This will also include
checking that the programs within the machine are correct for the part to be produced
and that it matches the drawing for the part to be machined.
Within the Renishaw AE Pro Software a simple program can be created to check that
a part or piece of material is in its correct position and to the sizes it should be. If
there is an incorrect sized piece of material, the machine can be forced to display an
error, informing the operator to check the material. Critical features of a semi
finished part could be used for location identification and setting of work piece co-
ordinates.
If any of these states were incorrect it is possible to make the machine alarm and alert
the operator to the error that has occurred.
6.3.5.11 WPC set The Work Piece Co-ordinate (WPC) is set from the centre of the indexer and
incorporates a set height fixture of a known length. This is the same for any part that
is produced in this particular way. This ensures that there is consistency between all
the components that are produced and all operators are taught to work out datum‟s for
the jobs in this manner.
The choice to make next is whether or not to continue with the existing Mazatrol
WPC or whether to change to G59 for example to ensure updates are happening each
and every time. The Mazatrol system now has the capability for updates; however it
is essential that these work EVERY time.
As mentioned above for correct part check, programs can be written which will locate
the part and create the datum to be associated with this.
6.3.5.12 Tool set
Currently only tool length is set within the machine tool controller using the Mazak
plunger system. The addition of a Renishaw tool setting device will ensure that the
correct length and diameter of tools is set before use on a job.
The speeds and feed rates of the tools involved will also form part of this process
level, ensuring that the base level has been properly adhered to.

82
6.3.5.13 Active Indication of Process
The active level of the pyramid gives an indication of the processes occurring whilst
machining the components. It links very closely to the top level which is informative.
6.3.5.14 Thermal track
The thermal track of the machine is controlled to an extent by the machine tool
controller, which monitors temperature and compensates for fluctuation and deviation
in the expansion of the machine tool. If there is too much variation or the machine
cannot compensate it will alarm out and stop use. If this happens 10 times then the
machine will lock out and need to be re-set by an engineer.
One machine suffered from this issue where it was alarming due to temperature
differences occurring. One end of the machine is close to the fire door and the other
is close to the overhead heater. The machine was therefore getting mixed signals due
to considerable difference in temperature compensation being required for two
different ends of the machine table.
6.3.5.15 Tool offsets
The tool offsets will be calculated within the cutting program itself through intelligent
machining. After a part is cut, probing will take place and measure against a nominal
value. This will go through logic statements and update the tool by the percentage of
feedback required to achieve the correct sized cut.
The tools can be measured before cutting for size and also during cutting for extra
checks if required. With accurate information before cutting takes place there will be
fewer requirements for the cutting tool to be updated for re-cuts to take place during
the machining process.
6.3.5.16 Broken tool check
Tools can be checked for breakage when measured, and also in cycle if there is a
discrepancy showing in size. If there were enough pockets within the tool carousel,
sister tooling could be used and called out.
The tools can be checked for breakage with the tool-setting device, as it should
operate within a set of parameters for sizes of the tool it is measuring.

83
Results of probing data could also provide indication of broken tooling and cause the
machine to stop and be checked.
6.3.5.17 Informative
Critical features only – Process Specific
The informative or top level of the pyramid is used to help feed back information into
the other layers of the pyramid from the base upwards. The top level relies on the
critical features being used to identify the processes requiring specific data.
6.3.5.18 Updates
The updates are feature based and come from within the probing program and are
therefore only used for critical features.
The measurements of the dimensions against nominal sizes are passed through a
series of logic statements, and output an update value. This can be either a tool
dimension update or one for the work co-ordinate system to adjust an offset or even
both if required.
Updates will only happen correctly if the processes before this occurs have been
followed. If the machine tool is not able to repeat, the processes will not be able to
compensate for this.
6.3.5.19 Finished and roughing sizes
This is the amount of material left on the component at each stage of manufacture and
will be decided upon through trialling the programs on the machine and gaining
confidence in its capabilities.
The Renishaw program has the capability to account for stock left on the part to adjust
datum‟s, for positioning and work piece shifts.
The quality of the finish achieved and the sizes to tolerance will be determined
through the amount of stock left before a final cut. The less material to be removed
the better, as there is less force involved and ultimately meaning the cut takes place
where it should.

84
Figure 18: Tooling file

85
6.4 BallBar
6.4.1 Hardware
The hardware required for running the test is listed as below:
Renishaw QC10 or QC20-W BallBar
Zerodur calibrator
Computer (with Bluetooth dongle if using wireless BallBar)
Various adaptors to suit machines being tested
6.4.2 Software The software used for testing the machines is Renishaw BallBar 20.
Advanced mode allows for set-up of machines and tests, viewing of machine results
and the machine history.
Operator mode allows for running of tests, viewing of machine results and the
machine history.
Quick check mode allows for running of tests and viewing of machine results.
6.4.3 Process – Test Method The test would be carried out weekly in an ideal situation, moving to a fortnightly
check to perform a reasonable analysis of the machines condition during the initial
phases of the project. The analysis records need to be printed, and stored for
continual monitoring and as part of process analysis. The records are stored within
the software and can show any degradation over a period of time. This error can be
picked up and used for maintenance purposes, either corrective or preventative.
The following is required to set up a test to run:

86
Figure 19: Renishaw BallBar 20 software Advanced mode home screen
Figure 20: BallBar test setup screen - machine creation or selection

87
Figure 21: BallBar test setup screen - plane selection
Figure 22: BallBar test results selection screen

88
Figure 23: BallBar test setup - machine addition screen
Figure 24: BallBar test setup - parameter screen

89
Figure 25: BallBar test setup - direction and limits screen
Figure 26: BallBar test setup - part program creation
Advanced mode must be selected from the software to allow set up of tests Figure 19.
A machine needs to be created if not already present Figure 20. This will build a file
that can store the history of all tests on the machine and keep records of the machines

90
condition. Where a number of machines are similar, the machines can be cloned and
re-named.
After a machine has been selected a test will need to be set up if there are none
available already Figure 21.
The type of machine is selected from a graphical list, such as horizontal or vertical
milling machine Figure 23. The test plane is next selected and will require repetition
of this process for all three planes if required. A feed rate for the test can be entered,
and again, a number of different feed rates may wish to be selected for representation
of the differing machining processes Figure 24. The BallBar length is selected next
from a drop down list. It is recommended for a length to be selected that best suits the
working volume of the machine being tested. Other details can also be entered for a
test position and program numbers used.
The following screen in the program is for determination of the run Figure 25. The
direction of the axes can be set and determination of the direction of travel of the
BallBar made. The amount of travel the BallBar makes can be decided with options
for full circular travel and the amount of overshoot to get an effective reading.
If a part program is required, this can be generated within the software. A controller
type must be selected and program number entered so that a program can be
processed in to G-code format Figure 26.
To run the test, the equipment must be set up in the machine ready with the BallBar
placed on the calibrator switched on. The machine for testing and test plane is
selected and the screen is displayed for beginning a test on the machine showing
communication between BallBar and computer.
The results and machine history can be selected from the front end of the software. In
a similar manner to the test set-up, the history files for the machine are laid out in the
same manner Figure 22.
The method for which the BallBar is installed in the machine is described in the
appendix for both wired and wireless BallBar systems. The part programs for the
measurement will also be included as part of the appendix.

91
Figure 27: BallBar test running on probing implementation machine
Figure 28: BallBar test running on probing implementation machine

92
6.5 Summary
The implementation of hardware, software and processes is described within the
chapter and includes illustration where possible. In the next chapter, the results of the
implementation and testing will be discussed.

93
Chapter 7 – Testing and Results
7.1 Introduction This chapter follows on from the implementation of the processes and systems to test
against the original aims and objectives of the project.
7.2 Testing and Results
7.2.1 Development of Systems – M&H Systems
Testing initially began on the machines using the M&H software and probe. The
installation of the probe within the machine tool is a straightforward approach and is
calibrated using a clocked ring gauge. ISO programs are loaded in to the machine
tool for the various functions required for the probe to function, such as inch or metric
checks, bore checks and line or plane checks.
These were installed in the machine tool as programs 9100 to 9128. The 3DFI
software also required programs to reside within the controller, which were 5002,
9850 and 9851. A program 5000 was created through the 3DFI software, which is
specific to the part requiring measurement.
The results of the implementation are presented below in tabular form. Explanations
of the issues are described and used to move forward with new approaches. At each
stage significant amounts of time were spent at the machine writing and modifying
programs to run and test.
The program flow between Mazatrol and ISO proved very difficult to understand and
issues with nesting of programs meant that different approaches had to be made at
each stage.
In the fifth table below, the program flow is finally reached for successful
achievement of a program, run from start to finish. Although success was achieved,
the practicalities and difficulties associated would be quite counter productive. The
ISO programs are attached to the thesis as an appendix and have been simplified as
much as possible.

94
At this point of testing, the Renishaw system became available for use and the results
of such will follow after the description of the M&H equipment.

95
Operation System Hardware / software
Working Issue
Set up Mazatrol routines + M&H Probe + Mazatrol Program
Yes with no problems Only for datum setting
Machine Mazatrol Program Yes Programs currently created in Mazatrol Conversational language for ease of use
Check Mazatrol Program + M&H Probe + 3DFI Software + M&H Probing Macros
No Final inspection program was being used – Issue came when trying to get updates from this for Mazatrol. Need to find how / where dimensions recorded are stored – how to extrapolate to go back and re-machine using these
Re-Machine Mazatrol Program No – Due to component not being checked
Programs currently created in Mazatrol Conversational language for ease of use – would be same as initial machining but against updated offsets.
Final Inspection M&H Probe + 3DFI Software + M&H Probing Macros
Yes (as separate entity) Prints out reports with no issues – Not capable of use for going back to re-machine. Called at end of program as G65 P5002 in Mazatrol.
Table 6: Initial Mazatrol trials

96
Figure 29: Flow chart
Setup
MAZATROL
PROGRAM
Machine
MAZATROL
PROGRAM
Probing Checks
MAZATROL
PROGRAM
Machine
MAZATROL
PROGRAM
Final Inspection
ISO PROGRAM / 3DFI
Logic Checks
YES / NO / MAYBE
Final inspection program
used – Cannot use this for
logic and updates of offsets.
Program stops

97
The flow chart above is representative of the table above. Further explanation of
such is listed below in its sequential order:
Mazatrol Program
This program is used as the base for all programming and cutting of the material. It is
used to call both Mazatrol and ISO Sub Programs. The setup of the program datum‟s
is done from within the Mazatrol cutting program using the Mazatrol routines for step
measurement and part height using the M&H Probe, which are basic and only used
for finding a Z surface height and X and Y step values. This gives the height of the
part in its fixture, and the dimensions of the material in the XY plane.
Mazatrol Cutting Program
A Mazatrol cutting program was used in this trial that was already saved within the
controller. It was copied and renamed so that any changes made would not be left in
for an operator to make an error with upon next use. All cutting programs are made
through the Mazatrol conversational programming language, so would therefore be
beneficial for us to use as re writing everything could take time.
Mazatrol Program
The Mazatrol program calls the final inspection program as a sub program to go in
and measure the part. This is done successfully however there is no way of
extrapolating the measured results for use to update the Mazatrol program. Without
the ability to use these measured values, no logic can be performed to update the
WPC.
Mazatrol Cutting Program
The re-cutting of material cannot take place as updates have not been made within the
Mazatrol program for any offsets.

98
Operation System Hardware / software
Working Issue
Set up Mazatrol routines + M&H Probe + Mazatrol Program + Master ISO Program
Yes with no problems Master ISO Program created – calls sub program from Mazatrol to set datum’s and then transfers to G59 (or whichever other is available)
Machine Mazatrol Program Yes Programs created in Mazatrol Conversational language for ease of use – Called into Master ISO to do cutting – G65 command
Check Master ISO Program + M&H Probe + M&H Probing Macros
Partly Master ISO Program calls M&H Probing cycles (feature used was across a tenon) M&H probe cycle no P9110 – Uses offsets from Mazatrol initially which are fed into G59. Tool radius offset activated for use to re-cut with this program call. Program cycle stopped at 45 mm above job – just before probing across width was about to occur – needs de bugging to check?
Re-Machine Mazatrol Program + ISO Program
No – Due to component not being checked
Logic held within ISO program to check against tolerance and then re-call the Mazatrol cutting program within ISO – uses tool radius offset compensation to cut to correct size.
Final Inspection M&H Probe + 3DFI Software + M&H Probing Macros
Yes (as separate entity) Prints out reports with no issues – Not capable of use for going back to re-machine. Not tried at this stage as it has previously worked and can be relied upon. Will just be called at end of program as G65 P5002 in Mazatrol.
Table 7: Revised Maztrol trial

99
Figure 30: Flow chart
Setup
MAZATROL
PROGRAM
Machine
MAZATROL
PROGRAM
Probing Checks
ISO PROGRAM
Machine
MAZATROL
PROGRAM
Final Inspection
ISO PROGRAM / 3DFI
Logic Checks
YES / NO / MAYBE
ISO Program used to call
probing routines to measure.
Program crashes out above
job.

100
The flow chart above is representative of the table above. Further explanation of such
is listed below in its sequential order:
Mazatrol and ISO Program
The Mazatrol program is used as the base for all programming and cutting of the
material. It is used to call both Mazatrol and ISO Sub Programs. The setup of the
program datum‟s is done from within the Mazatrol cutting program using the
Mazatrol routines for step measurement and part height using the M&H Probe, which
are basic and only used for finding a Z surface height and X and Y step values. This
gives the height of the part in its fixture, and the dimensions of the material in the XY
plane. Once the datum is established within Mazatrol, a sub routine is called within
Mazatrol for an ISO program, which then shifts the Datum to G59 or whichever other
is available for use.
Mazatrol and ISO Cutting Program
For this example, a cutting program was created within the ISO program to cut the
material with a simple feature. In this case the raw material was rough-cut to create a
square block, which could be then measured for width.
ISO Program
Following the cutting program, there is a program call for measurement of the part
using program P9110. The program is referenced for the part using the datum that
was transferred into G59. The program call was successful and started to move the
probe. On each try however, the probe would stop at 45mm above the job and just
stop. The controller would not show up any alarm to give an indication of a problem.
The probing cycle parameters were set so that the radius of the tool would be changed
to re cut the material if necessary with an updated value.
Mazatrol Cutting Program
The re-cutting of material cannot take place, as updates have not been made within
the Mazatrol or ISO program for any offsets as the probing did not occur and function
correctly.

101
Operation System Hardware / software
Working Issue
Set up Master ISO Program Yes Master ISO Program created – sets datum’s within G59 (or whichever other is available)
Machine Master ISO Program Yes Programs created in ISO language – Just cutting a rectangle in our example for speed of testing – Would be long winded to write programs in ISO for all parts
Check Master ISO Program + M&H Probe + M&H Probing Macros
Yes Master ISO Program calls M&H Probing cycles (feature used was across a tenon) M&H probe cycle no P9110 – Uses offsets from G59. Tool radius offset activated for use to re-cut with this program call. Program cycle ran through and measured width – tool radius offset updated.
Re-Machine ISO Program Yes Logic held within ISO program to check against tolerance and then re-call the cutting program within ISO – uses tool radius offset compensation to cut to correct size. (Can be seen on machine position page that it is updated to remove more material
Final Inspection M&H Probe + 3DFI Software + M&H Probing Macros
Yes (as separate entity) Prints out reports with no issues – Not capable of use for going back to re-machine. Not tried at this stage as it has previously worked and can be relied upon. Will just be called at end of program as G65 P5002 in same way as in Mazatrol.
Table 8: ISO only programming

102
Figure 31: Flow chart
Setup
ISO PROGRAM
Machine
ISO PROGRAM
Probing Checks
ISO PROGRAM
Machine
ISO PROGRAM
Final Inspection
ISO PROGRAM / 3DFI
Logic Checks
YES / NO / MAYBE
Move on Go Back
Finished part
Start next
part
Scrap
Re-make
part

103
The flow chart above is representative of the table above. Further explanation of such
is listed below in its sequential order:
ISO Program
The ISO program is used as the base for all programming and cutting of the material.
The setup of the program datum‟s is done from within the ISO program using a centre
drill to estimate the parts central location before inserting the values into G59 or
whichever other WPC is available.
ISO Cutting Program
For this example, a cutting program was created within the ISO program to cut the
material with a simple feature. In this case the raw material was rough-cut to create a
square block, which could be then measured for width. This would be representative
of us creating a tenon feature on a tool holder. It was cut simply with an end mill.
ISO Program
Following the cutting program, there is a program call for measurement of the part
using program P9110. The program is referenced for the part using the datum in G59.
The program call was successful and probed the feature as it was wished for. The
program next uses some simple logic statements to check the dimensions of the
measured feature. The probing cycle parameters were set so that the radius of the tool
would be changed to re cut the material if necessary with an updated value.
Logic Statements
The logic statements are used to decide the „fate‟ of the part through simple equation.
There are three possible outcomes that can occur through the logic which are; that the
part is in size and tolerance and that the part can therefore continue on the next part of
the program, the part is undersized (in this instance as it was a bore measurement) and
can therefore be re-machined to correct the size, or finally, it is too large and therefore
the part is scrap.
Part ok – continue program
The part has been measured and is within size and tolerance. The program is
therefore told to move to the next operation through the logic statements. There is not
a specific logic for this, as the values will fit in between the two logic statements. If
this happens then the program will carry on to the next stage of the program.
Part repairable – go back and re cut
The part has been measured and is (in this case) undersized. The program is informed
that it should go back to the original cutting program and update to cut the feature to

104
the correct size. The probe will then be called again following this for a re check.
The logic for this states that if the stored measure value is less than the nominal size
minus the tolerance then go back to the start of the cutting program for this feature.
Part not good – scrap
If the part is measured and it is above the size and tolerance values then the program
will display and alarm, which will tell the operator the issue, such as, bore too large or
part too small. The part is then deemed as scrap and will need to be restarted with
operator checking for possible causes or issues, such as incorrect tool used and cut too
large. The logic for this states that if the stored measure value is greater than the
nominal size plus the tolerance then go to the alarm screen to advise the operator that
the part is outside the limits and is therefore scrap.
ISO Cutting Program
The re-cutting of material is dependent upon the outcome of the data flowing through
the logic statements. If it is decided that the part can be salvaged then the program
will go back and re-cut the material. If the part is within tolerance then the program
will continue with the next cutting operation.
Final Inspection
Once the part has been finish machined, the final sub program call is used to select the
final inspection of the part to produce the inspection report.
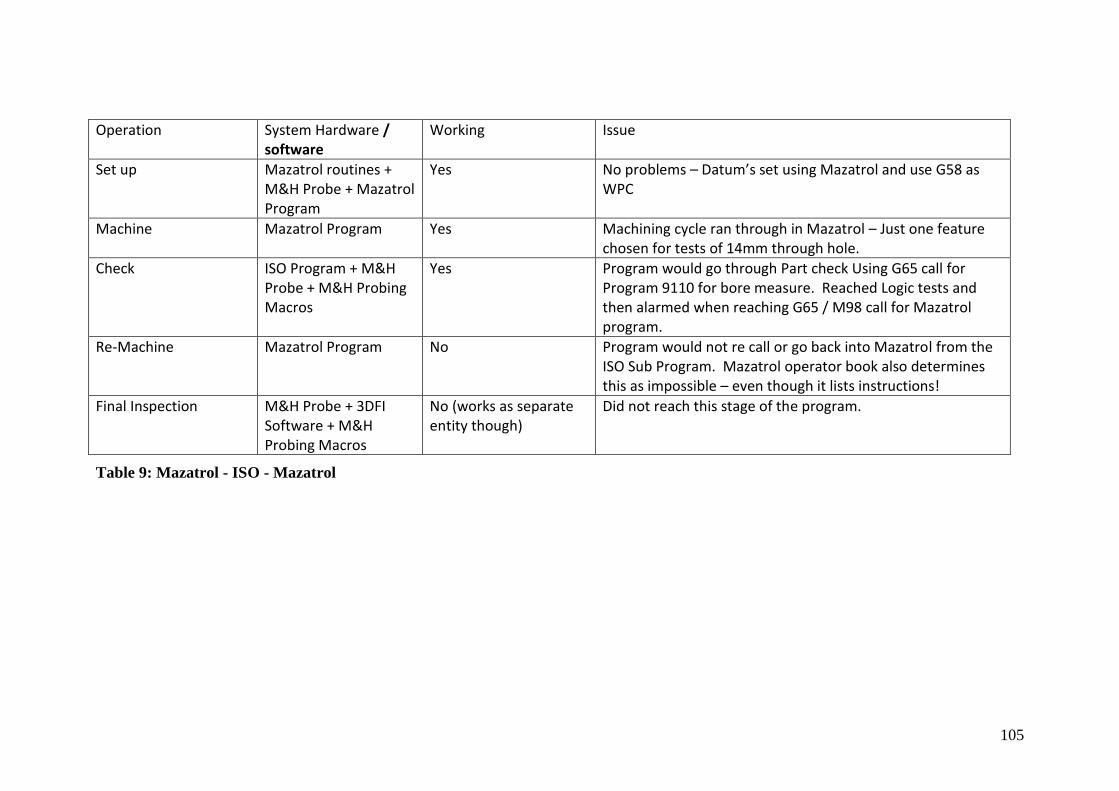
105
Operation System Hardware / software
Working Issue
Set up Mazatrol routines + M&H Probe + Mazatrol Program
Yes No problems – Datum’s set using Mazatrol and use G58 as WPC
Machine Mazatrol Program Yes Machining cycle ran through in Mazatrol – Just one feature chosen for tests of 14mm through hole.
Check ISO Program + M&H Probe + M&H Probing Macros
Yes Program would go through Part check Using G65 call for Program 9110 for bore measure. Reached Logic tests and then alarmed when reaching G65 / M98 call for Mazatrol program.
Re-Machine Mazatrol Program No Program would not re call or go back into Mazatrol from the ISO Sub Program. Mazatrol operator book also determines this as impossible – even though it lists instructions!
Final Inspection M&H Probe + 3DFI Software + M&H Probing Macros
No (works as separate entity though)
Did not reach this stage of the program.
Table 9: Mazatrol - ISO - Mazatrol

106
Figure 32: Flow chart
Setup
MAZATROL
PROGRAM
Machine
MAZATROL
PROGRAM
Probing Checks
ISO PROGRAM
Machine
MAZATROL
PROGRAM
Final Inspection
ISO PROGRAM / 3DFI
Logic Checks
YES / NO / MAYBE
Would not go back
after logic test
Would not move on
after logic test

107
The flow chart above is representative of the table above. Further explanation of such
is listed below in its sequential order:
Mazatrol Program
The Mazatrol program is used as the base for all programming and cutting of the
material. The setup of the program datum‟s is done from within the Mazatrol
program using the Mazatrol datum setting routines and is then stored into G58 or
whichever other WPC is available.
Mazatrol Cutting Program
For this example, a cutting program for a particular part was used, which was already
created in Mazatrol. The program was copied and re-numbered to avoid confusion.
The program was edited so that it took just one part of the program, which was to drill
a 14mm hole. The part was drilled as it should have been and then moved to the next
stage of the process.
ISO Program
Following the cutting program, there is a program call for measurement of the part
using program P9110 from the Mazatrol program. The program is referenced for the
part using the datum in G58 in Mazatrol. The program call was successful and probed
the feature as it was wished for. The program next uses some simple logic statements
to check the dimensions of the measured feature. The probing cycle parameters were
set so that the radius of the tool would be changed to re cut the material if necessary
with an updated value. At the end of the ISO program a G65 and M98 call were used
to try and get back to the correct Mazatrol program and line number. Each time this
occurred it alarmed out and would not go back through to the Mazatrol program.
Upon later checks and research using the Mazak operator manuals, the process of
calling programs in this way is described fully, but finally describes the process as
„impossible‟ even though the steps are laid out in detail.

108
Operation System Hardware / software
Working Issue
Set up Master ISO Program + M&H Probe + M&H Probing Macros
Yes Datum set within G58. Program 9110 can be used for updating of centreline of part.
Machine Mazatrol Program Yes Machining cycle ran through in Mazatrol – Just one feature chosen for tests of 14mm through hole.
Check Master ISO Program + M&H Probe + M&H Probing Macros
Yes Reversed logic statements to ensure it did not re cut part when tool radius was updated as all holes were only in roughing stage. Logic arguments successful and went back to re machining Mazatrol program.
Re-Machine Mazatrol Program Yes Machining cycle ran through again in Mazatrol – Just one feature chosen for tests of 14mm through hole. Program then went back into ISO to recheck bore now correct size. #
Final Inspection Master ISO Program M&H Probe + 3DFI Software + M&H Probing Macros
Yes Part was not fully completed but program call worked, so cycle was stopped.
Table 10: ISO - Mazatrol - ISO
# For program to function correctly, parts would need to be broken into smaller chunks of Mazatrol and called from the Master ISO with its own
ISO Probing checks for logic. This could be done in a fairly simple manner using program or unit copy in Mazatrol.

109
Figure 33: Flow chart
Setup
ISO MASTER
PROGRAM
Machine
MAZATROL
PROGRAM
Logic Checks
YES / NO / MAYBE
Probing Checks
ISO PROGRAM
Machine
MAZATROL
PROGRAM
Final Inspection
ISO PROGRAM / 3DFI
Go Back Move on
Scrap
Finished part
Re-make
part
Start next
part

110
The flow chart above is representative of the table prior to this. Further explanation
of such is listed below in its sequential order:
ISO Master Program
This program is used as the base for all programming and cutting of the material. It is
used to call both Mazatrol and ISO Sub Programs. In this instance the first call is
made for program number 96920. Assigned next to this is detail of the tool that
would be updated for radius given that re machining is required following
measurement. The setup of the program datum‟s is done from within the Mazatrol
cutting program.
Mazatrol Cutting Program
The Mazatrol cutting program 96920 was a full program inserted into this for
demonstration. There was an end block inserted after the first operation of a drilled
hole. Due to the way the program would work, the Mazatrol programs would need to
be broken down for this to work and allow updates. Where non-critical features are
being machined, these can all be grouped together in one single program; such as
milling the raw material to give a square and flat finish. The end of the program in
Mazatrol must contain a 1to show that the program must continue. This allows for the
program to then revert back into the Master ISO Program. The datum‟s used within
the program are set from the very outset of program creation. The datum estimate is
taken from use of a centre drill to take the rough centre point of the work piece. The
Mazak Mazatrol routines can be used following this for datum setting and teaching
into the machine. This will then be used for following operations with the line of
code for transfer of work piece offsets. The initial datum setting is done with the
M&H Probe and Mazatrol probing routines, which are basic and only used for finding
a Z surface height and X and Y step values. This gives the height of the part in its
fixture, and the dimensions of the material in the XY plane.
ISO Master Program
The next lines of command in the ISO Program call for a sub program, which is also
written in ISO code. This takes the stored datum from the Mazatrol program and
saves it into which ever WPC is chosen. In this instance it was moved to G54.
The WPC is called up in the next line of the program, and then is followed by the tool
change to bring the probe to the spindle ready for measurement.
Once the tool is loaded and ready the program moves in rapid to X0 and Y0, and then
to a Z position above the work piece whilst employing tool length compensation.

111
The probing call is made next as an ISO sub program 9110. This line also gives the
command for the action of that probing to occur such as the expected centre point of
the feature, its size, what kind of feature, how it is to be measured and what to do with
the information once it is recorded. The probing then is undertaken and once finished,
the probe will return to the home position and then the controller will compute the
logic statements.
Logic Statements
The logic statements are used to decide the „fate‟ of the part through simple equation.
There are three possible outcomes that can occur through the logic which are; that the
part is in size and tolerance and that the part can therefore continue on the next part of
the program, the part is undersized (in this instance as it was a bore measurement) and
can therefore be re-machined to correct the size, or finally, it is too large and therefore
the part is scrap.
Part ok – continue program
The part has been measured and is within size and tolerance. The program is
therefore told to move to the next operation through the logic statements. There is not
a specific logic for this, as the values will fit in between the two logic statements. If
this happens then the program will carry on to the next stage of the program.
Part repairable – go back and re cut
The part has been measured and is (in this case) undersized. The program is informed
that it should go back to the original cutting program and update to cut the feature to
the correct size. The probe will then be called again following this for a re check.
The logic for this states that if the stored measure value is less than the nominal size
minus the tolerance then go back to the start of the cutting program for this feature.
Part not good – scrap
If the part is measured and it is above the size and tolerance values then the program
will display and alarm, which will tell the operator the issue, such as, bore too large or
part too small. The part is then deemed as scrap and will need to be restarted with
operator checking for possible causes or issues, such as incorrect tool used and cut too
large. The logic for this states that if the stored measure value is greater than the
nominal size plus the tolerance then go to the alarm screen to advise the operator that
the part is outside the limits and is therefore scrap.
Mazatrol Cutting Program

112
This is used as the next stage for the cutting program and is the next operation of the
machining process of that particular component. If this is also dimensionally critical,
it will also be followed by a probing operation to measure. This program will be
similar to the previous
ISO Program
The program length will be dependent upon how many operations are necessary to
produce the final part overall. It will include many calls for Mazatrol programs and
also for ISO sub routines such as the probing. In between the programs there will be
use of logic to allow the operations to seamlessly run together.
The final operation is to call the program end
Program End
If the program has successfully run all the way through, the part should come off the
machine fully finished and inspected in a correct manor. The next raw material can
be loaded into the machine and the program run again.
Program details for test:
O00000029(DANS DO NOT MOVE OR DELETE)
N10 G65 P96920 H9. D9. (Line ten. Program call for Mazatrol cutting program
96920. Tool updates to take place for tool 9)
N20 G65 P4999 (Line twenty. Program call for ISO program 4999. Shifts WPC co-
ordinates from Mazatrol to G54)
N30 G54 (Line thirty. Calls WPC G54)
T30 M6 (Tool change for tool 30 - Probe)
G0 G90 X0. Y0. (Absolute programming. Rapid Move to X0 Y0)
G43 Z50. H30 (Activate Tool Length Compensation tool 30. Z height 50mm)
G65 P9110 A0. D14. F800. X27. Y-44. Z-15. R10. S11. T09 (Call ISO program 9110.
Start probing at angle 0. Diameter of 14mm. Function 800 - Update tool radius. Goto
X27 Y-44 Z-15. Safety distance of 10mm from job. Bore measure function selected.
Tool to update.)
G91 G28 Z0. (Return to home position)
N100 (Line 100)
IF[#529LT[14.-.013]]GOTO10 (Logic statement - Measured value less than nominal -
tolerance go back to cut program)

113
IF[#529GT[14.+.500]]GOTO40 (Logic statement - Measured value greater than
nominal + tolerance go to alarm)
GOTO50 (Goto Line 50)
N40 #3000=100 (CHECK WIDTH)
N50 M30 (Line fifty - Stop Program)
The program above can be modified further so that it calls particular sub programs,
possibly that of checks in Capto bores for example. The sizes could easily be selected
from a list such that line 500 is C3, line 600 is C4, line 700 C5, line 800 C6 and line
900 C8. Also included in the list could be the important features such as tenons and
slots.
M640M WNo.15 ( DANS DO NOT DELETE MAIN PROGRAM )
UNo. MAT. INITIAL-Z ATC MODE MULTI MODE MULTI FLAG PITCH-X
PITCH-Y
0 CST IRN 50. 0 OFF @ @
@
UNo. UNIT ADD. WPC X Y th Z
C A
1 WPC- 0 -807.228 -265.922 0. -495.832
0.
UNo. UNIT WORK No. $ REPEAT
2 SUB PRO 4999 @
UNo. UNIT ADD. WPC X Y th Z
C A
3 WPC-56 G56
UNo. UNIT TOOL NOM-Ø No.
4 MANU PRO T.SENS. 6. A
SNo.G1 G2 DATA 1 DATA 2 DATA 3 DATA 4 DATA 5 DATA 6
S M/B
1 0 X 0. Y 0.
2 0 Z 0.
UNo. UNIT WORK No. $ REPEAT
5 SUB PRO 5002 @
UNo. UNIT CONTI.NUMBER ATC X Y Z C
A
6 END 0 0 0 -1050. 0. 0.
106.411
Figure 34: Mazatrol program screen capture

114
7.2.2 Development of Systems – Renishaw The Renishaw probe is set up as in the implementation guide for calibration using a
ring gauge. The Renishaw AE PRO software is used to create the ISO programs for
the calibration of the probe. In a slightly different way to the M&H probe, the
Renishaw ISO programs do not have to reside on the controller permanently. Each
time a measurement program is created in AE PRO, the relevant G-code can be
output. Similarly to the M&H having a program 5000, the Renishaw uses program
2000.
A test part was set up and created within AutoDesk Inventor software to match. The
model is converted for import in to the Renishaw software and a program made.
The program was run several times with parameters changed in the software on a
number of occasions so that a bore could be opened up gradually to its required size.
Each step still however had to conform within tolerance for cut and re-cut.
Some of the results are presented below in a table for size measured using the probe,
CMM and manually and are compared for differences in error. The first table is with
the bore of the part cut to 63.5mm. The part was measured both manually and with
the probe following cutting. The difference in size for the bore between
measurements is 4 microns and the measurement for position in X and Y is different
by 3 microns and 9 microns respectively. All measurements are within the tolerances
permitted.
Following on from this check the part was then re-cut to a new size of 63.75mm. In a
similar manner, the measurements were taken and recorded with comparison this time
made between the three different methods. All results again fall within the tolerances
and differ slightly between the three different methods. The results of the test are
shown in Table 12 - 15 and Figures 35 - 38.
The effects of temperature could have a large impact upon the measurements taken
and may reduce or increase the differences dependent upon location. This however is
beyond the extent for the project.
The measurement results were also added to the SPC software to monitor and track
the process for all remaining components of the batch.
Additional benefits were gained through the use of the probing system, which were
not accounted for during the initial plans. The software allowed for a rotary axis to be
updated for angular error, and as such, a program written to reside in each machine
tool controller for set up of jobs. The previous method for setting involved using a

115
dial gauge and operator skills and knowledge. The method using the probing system
takes a matter of seconds to complete, whereas the manual method would take up to
ten minutes. The financial benefits of this alone are substantial.
Through experimentation it was decided that a tool probe would make for a valuable
investment as only tool length was measured previously on a Mazak plunger. The
Renishaw tool-setting probe also provides measurement information and can be
linked directly with measurement programs created in AE PRO. With accurate tool
data, less iteration are required for re-cutting of material. G-code can be placed
within the program to ensure that only a certain number of re-cuts are made to stop
the probing being stuck in a continuous closed loop. The levels of percentage
feedback can be adjusted within the software, and are useful for learning and
understanding until confidence is gained. These feedback levels changed
significantly over the period of time testing so that there would be more trust placed
in the system to go back and re-cut accurately first time.
During the set-up and training period, discovery was made of a conflict in variable
numbers used by the probe and an ISO program used for engraving parts on the
machine. Both were sharing the numbers 500 to 503 and losing calibration values.
This issue flagged a question of whether or not the previous test work conducted with
the M&H probe would have been affected significantly or not.
With this corrected there is assurance that the probe will hold its calibrated value.
A decision was made that, in the same way as running BallBar tests, the frequency of
the probe calibration should be increased to ensure that parts are produced to the best
possible accuracies.
7.2.3 Gauge R&R Data Assessment of the Gauge R&R of the measurement system on the machine tool is a
probing system implemented on a machine tool with a numerical controller. The
effect of the operator using the system is negligible as they are essentially pressing the
green button to start a cycle.
The stated repeatability of the probe unit from the supplier is 1 µm. However, the
influence of the non-repeatability of the machine must also be evaluated since this
forms an integral part of the measurement system.

116
The ring gauge used for this study has a certified, calibrated dimension of 69.995 mm
with ±1 µm accuracy.
The company gains confidence in the use of the system through regular testing and
calibration such as that demonstrated in the table below:
Test Number Dimension Difference
1 69.997 +0.002
2 69.995 0.000
3 69.995 0.000
4 69.996 +0.001
5 69.995 0.000
6 69.994 -0.001
7 69.995 0.000
8 69.997 +0.002
9 69.995 0.000
10 69.994 -0.001
11 69.993 -0.002
12 69.995 0.000
13 69.997 +0.002
14 69.998 +0.003
15 69.996 +0.001
Table 11 - Gauge R&R test results
The resolution of reporting of the probing results is 1 µm.
It can be seen in the table that the probe is repeating with ±3 µm. Further analysis
shows that the mean deviation is 0.4 µm and two standard deviations equates to 3 µm.
This is sufficient for the capabilities of the machine and what would be expected for
the general working volume. Tolerances of parts produced are generally around the
20 Micron level, however some are tighter still and can be around 10 Microns.
The level off accuracy will become more prominent in years to come as the size of
cutting tools increases. The test bars used when measuring a part for its centre height
will be much longer and therefore any error gets amplified further.
A calibrated, certified ring gauge was used for the testing of the probe. A standard
cycle can be created within the Renishaw AE Pro Software for calibration of the
probe. This takes 12 measurements within the internal bore diameter to work out the
true size. This is compared to the size of the ring gauge that is already known.

117
A measurement can be taken also using the Mazatrol software which calibrates for X
and Y axis and gives a size of the bore. As this is only 4 points however, it is
nowhere near as accurate as the measurement taken using the 12 point test due to it
being a best fit macro.
The size of the ring gauge used is very similar to that of the measurements shown in
the tables representing tests made to compare the difference between the on-machine
probe, manual inspection and CMM inspection. With this in mind it is useful to know
that the working volumes of the machine tool are taken in to account for calibration,
and coincide with that of the BallBar tests.

118
7.3 Probing of the Part – Test Results
Bore Size
Diameter Difference In Tolerance?
X Centre
In Tolerance?
Y Centre
In Tolerance?
Probe 63.5 63.506 0.006 Yes -0.001 Yes -0.007 Yes
Manual 63.5 63.509 0.009 Yes -0.004 Yes -0.016 Yes
Difference N/A 0.003 0.003 -0.003 -0.009
CMM N/A N/A N/A N/A N/A
Table 12: 63.5mm bore comparison
Bore Size
Diameter Difference In Tolerance?
X Centre
In Tolerance?
Y Centre
In Tolerance?
Probe 63.75 63.764 0.014 Yes -0.006 Yes 0.001 Yes
Manual 63.75 63.753 0.003 Yes -0.005 Yes -0.004 Yes
Difference N/A 0.011 0.011 -0.001 -0.005
Table 13: 63.75mm bore comparisons
Bore Size
Diameter Difference In Tolerance?
X Centre
In Tolerance?
Y Centre
In Tolerance?
Probe 63.75 63.764 0.014 Yes -0.006 Yes 0.001 Yes
CMM 63.75 63.758 0.008 Yes -0.014 Yes -0.002 Yes
Difference N/A 0.006 0.006 -0.008 -0.003
Table 14: 63.75mm bore comparisons
Bore Size
Diameter Difference In Tolerance?
X Centre
In Tolerance?
Y Centre
In Tolerance?
Manual 63.75 63.753 0.003 Yes -0.005 Yes -0.004 Yes
CMM 63.75 63.758 0.005 Yes -0.014 Yes -0.002 Yes
Difference N/A 0.005 0.005 -0.009 -0.002
Table 15: 63.75mm bore comparisons

119
Figure 35: Measurement comparisons graph

120
Figure 36: CMM Report

121
Figure 37: CMM Report

122
Figure 38: CMM Report
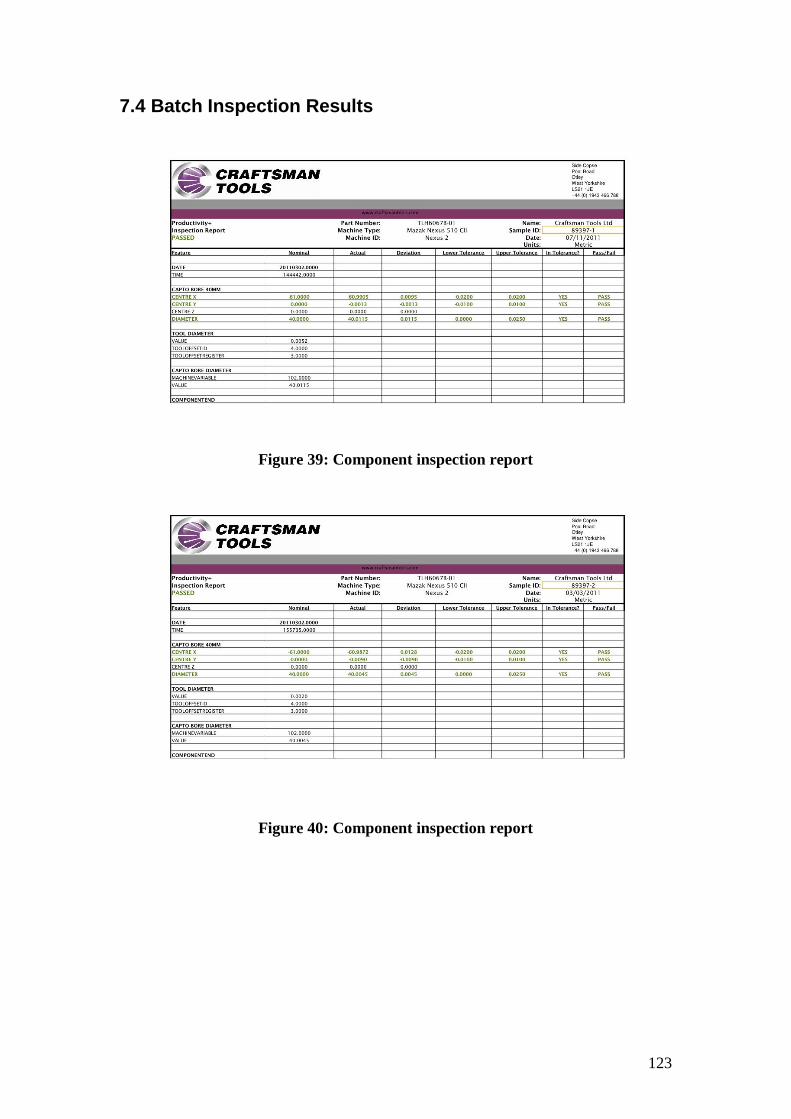
123
7.4 Batch Inspection Results
Figure 39: Component inspection report
Figure 40: Component inspection report

124
Figure 41: Component inspection report
Figure 42: Component inspection report

125
Figure 43: SPC Graph
The above Inspection reports and SPC graph Figures 39 - 43 are representative of a
batch of parts going through the factory during testing. It can be seen within the SPC
graph that all parts were manufactured within the tolerance band for the size of Capto
bore. As this is only represent a batch of four parts, the change in the graph looks
dramatic for the difference in sizes produced. Similarly, graphs can be produced for
the centre line values and the centre height values for the bore. Using the graph
shown above, sampling for manual inspection can be picked out at random, or those
parts that do not meet the requirements or suffer considerable deviation from the
mean.
7.5 Inspection Reports
A great deal of work went in to getting an inspection report template that would be
suitable for use. It was decided that there could be two versions produced; one for the
customer and one for the inspections department. The decision for this was due to the
fact customers only needed to know a part was good, and would not be interested in
the full dimensional report. This information however is important for the inspection
department.
As the project progressed, the requirement for an inspection report became less of a
priority.

126
A number of templates were produced in both the Renishaw and M&H software, with
the latter being preferred due to its colourful graphical nature and ease of
manipulation of design. The Renishaw report template is very rigid with a limited
amount of design change available. This was a factor that became apparent when
studying the reports to see where improvements could be made, and suggestion of
separate reports made due to information being included that was irrelevant, but could
not be removed, and would leave a customer confused and thinking they have
received a part that is no good.
Examples of the reports are included in the appendix.
7.6 Production Data The cycle times have been cut down considerably due to the use of probing when
setting up a job. The indexing facility can be set so that it is square. This has also
been checked in a similar way to the Gauge R&R.
The use of this function takes away the manual intervention of an operator using dial
gauges. The time saving brought about however is very impressive. A study of the
operators concluded that the manual set-up could take anywhere between five and ten
minutes, mainly due to the skill levels. Using the probing cycle took just 5 seconds
for measurement and correction.
Cutting times of parts were also reduced using standardisation of the tooling as
addressed by the productivity pyramid. All operators were using the machines at the
correct speeds and feed rates for the materials and cutting tools being used. This is
also shown within the results.
Probing of the parts for measurement of sizes would on average take around one to
two minutes. Parts removed from the machines for manual inspection could take
around ten to fifteen minutes if the inspector is available straight away. To this you
are also inherently adding a level of uncertainty due to removal and re-installation of
the part in to the machine.
Using both methods allows for modification of the part following measurement. For a
first off part this process could be completed manually two to three times to ensure
the program is corrected correctly. This program modification is done manually.
For a first off part the assumption could be made that both systems require two checks
of the part to update the program sufficiently for the next part to be cut correctly.

127
Following parts would be sample checked from the batch to ensure they are correct.
This again would be around ten to fifteen minutes for the check dependant upon
availability of the inspector. All parts could be inspected on machine using the
probing system with the cycle time being around one minute for this.
The gains in cycle time are vast using the on machine measuring systems.
Confidence in the systems improves the more it is used, as the operators begin to
understand what is happening during the process and why the process is actually
happening.
A table is presented below for part A, B, C etc. Each first off part of specific batches
are measured and recorded below:
Part Number Manual Variance Probing Variance
Part A 15 minutes 1-2 hours 2 minutes 2-3 minutes
Part B 30-60 minutes 2-3 hours 2-3 minutes 4-5 minutes
Part C 14 minutes 1-2 hours 2 minutes 2-3 minutes
Part D 11 minutes 1-2 hours 1.5 minutes 2 minutes
Part E 10 minutes 1-2 hours 1 minute 1-2 minutes
Part F 13 minutes 1-2 hours 2 minutes 2-3 minutes
Part G 11 minutes 1-2 hours 1.5 minutes 2 minutes
Part H 10 minutes 1-2 hours 1 minute 1-2 minutes
Part I 14 minutes 1-2 hours 2 minutes 2-3 minutes
Part J 12 minutes 1-2 hours 1.5 minutes 2 minutes
Part K 30-60 minutes 2-3 hours 3-4 minutes 5 minutes
Table 16: Production data
It can be seen from the table that certain parts can be difficult to measure manually.
This could be due to sizes and weights or complexities of geometry. In such
instances, these parts would likely be taken to a CMM for measurement. This
invariably led to the length of time seen for measurement and the variances involved
with queuing.
Graph showing production data results from the table for cycle times of manual and
on-machine measurement:

128
Figure 44: Production data comparison graph
7.7 BallBar testing and results
During the early stages of the probing tests, large errors were being reported in the Y-
axis direction of the parts, however when a manual inspection was completed, the
parts would be to size and tolerance. This instigated a requirement for the need to run
a BallBar test on the machine. The errors being reported were not accounted for
during manual offset updates within the program for cutting the parts, allowing the
error to be seen and acted upon. A service engineer was scheduled to re-align the
machine following the test.
The history results of one of the machines are shown below. The machine was
subjected to a large crash, which saw a probe moved at rapid feed rate in to the work
piece as if it were a cutting tool. The whole probe was obliterated and the large piece
of material moved in the vice Figures 45 & 46.
Measurement Times of Parts using On-Machine Probing and Manual Measurement
0
20
40
60
80
100
120
140
160
180
200
220
240
Part A
Man
ual
Part A
Pro
be
Part B
Man
ual
Part B
Pro
be
Part C
Man
ual
Part C
Pro
be
Part D
Man
ual
Part D
Pro
be
Part E M
anua
l
Part E Pro
be
Part F M
anua
l
Part F Pro
be
Part G
Man
ual
Part G
Pro
be
Part H
Man
ual
Part H
Pro
be
Part I M
anua
l
Part I Pro
be
Part J M
anua
l
Part J Pro
be
Part K
Man
ual
Part K
Pro
be
Part Number
Tim
e (
Min
ute
s)
Variance
Measurement Time

129
Figure 45: Smashed Probe following an accident on machine
Figure 46: Smashed Probe following an accident on machine
An initial Ball Bar test was used to check for any damage to the machine, and the
subsequently, a machine re-alignment was scheduled and can be seen in the history
graphs for improvement Figures 47 - 49. The images below show the machine history
for a period between July 2010 and February 2011 in the XY plane Figures 50 - 52.

130
It can be seen that following the initial BallBar test, an error was found and acted
upon. The machine was re-tested following the re-alignment and can be seen through
a great improvement in the circularity. As expected, the machine deteriorates over
time with the test in February showing a slight deterioration in the circularity.
Figure 47: Ballbar test results
Figure 48: Ballbar test results

131
Figure 49: Ballbar test results
Figure 50: Ballbar test results

132
Figure 51: Ballbar test results
Figure 52: Ballbar test results

133
7.8 Summary Testing of the probing systems gave rise to many issues with compatibility of
programming languages. The company uses the Mazatrol conversational
programming language, which is installed on the machine tool controllers allowing all
operators to create programs with ease of use. The ISO programming language and
Mazatrol, however, are not fully coherent with each other and will cause conflict if
not used in a certain way. The user manuals for the machines give detailed
descriptions of how to perform this kind of function, only to be followed by a
statement saying that these operations cannot actually be performed, which questions
why it is included.
Through implementation of processes and systems, the company has a system in
which parts can be manufactured and inspected on the same machine with the
confidence that the quality of the part will be correct, and produced in a more cost
effective manner. The technology has provided some unexpected benefits such as
drastic reduction in set-up time of parts in an indexer fixture. The time saved using
this method alone will provide a significant cost saving to the company.
A plan for the use of a BallBar within the company has been suggested and is being
considered for purchase. The use of the BallBar through the university proved very
beneficial and helped strengthen the case for the requirement of equipment.
The process pyramid is used and updated on a daily basis and must be thought of as a
continual development. Each input will affect another outcome and must be directly
put back in to refine processes further.

134
Chapter 8 – Conclusions and Further Work
8.1 Introduction The previous chapters have shown the research undertaken to achieve the aims and
objectives of the project, which were to implement a semi automatic quality control
system and evaluate the costs and benefits of doing so. In this chapter, a brief
summary of the achievements is made and the savings brought about through the
work and realised in the company.
8.2 Conclusions
At the start of the project, a manufacturing cell and range of parts were chosen to use
as a case study for manufacturing processes. The weaknesses were identified
following process audits. Lead times for delivery of parts required reduction,
predominantly caused by idle spindles and machine downtime. The latter adversely
affects the quality of the parts produced.
A great deal of responsibility and trust was placed with the operators for getting the
parts "right first time" and required a solid knowledge of the machining processes to
manually adjust offsets and make corrections in the part programs to ensure each
component is manufactured correctly.
The inspection of parts at any stage of manufacture added a significant risk of errors
occurring, due to parts being removed from the machine and then re-set. This stage
also adds time to the process and can be slowed further if there is no availability or
queuing at the quality control department.
A process pyramid approach was adopted to better understand the requirements for
consistent manufacture of parts.
A regular BallBar system is used for measurement of the machines fitness for
purpose, and is run independently or reactively.
The probing systems on the machines are run both in-cycle and also for final
inspection of parts and are validated against manual and CMM inspection.
A great amount of cost saving has been made through use of technology, systems and
processes even within an SME producing small batches of components, which are
usually between 1 off and 10 off.

135
Indirect savings, as well as direct, have been made through extra use of the
equipment, which was not in the first instance considered.
From the work undertaken it was apparent that the use of technology-based systems in
a small batch environment producing a wide variety of different parts could be very
difficult to achieve results.
The results however show that successes can be made with technical complex
projects.
The change management process is most difficult in a company that has many
operators set in their ways after doing the job for so long. Once the benefits are
shown and explained, the new systems are warmly received and utilised. The amount
of parts produced affects the level of bonus the operators receive, so it was pitched to
them in such a manner that it would help them to achieve more production, and
ultimately earn them more money.
The machine tool is a complex structure with many forms of error that can be induced
amongst the many mechanical components and systems. The capability of these is
important, and when benchmarked can be monitored and evaluated sufficiently to
ensure the machine is capable of producing parts accurately and repeatedly.
There are many tools available for monitoring the health of machines and alerting a
user to a potential requirement for further investigation or servicing. This equipment
is relatively cheap when compared with the overall downtime of machines and falls
within a planned preventative maintenance system instead of the usual reactive
maintenance that many are used to.
Study of fundamental elements of the whole machining process allow for
determination of every step, with each as important as the last, and fitting into a
pyramid of process stages allows for investigation into potential causes of future
errors, or alternatively where error has occurred, can be traced back through a root
cause analysis.
With the stability of the machine determined and understood, it can be used for the
measurement of parts as well as cutting them, safe in the knowledge that they will not
be cutting inaccurately and measuring in the same way.
It is only when the machines are producing parts in a semi autonomous way that the
realisation of the benefits can be seen against the initial set up costs. Savings can be
made not only through part measurement but also for the set up of the machines in the
first instance.

136
The in process inspection provides the operator with less work at the machine and
allows for other tasks to be completed during the cycle time. This ultimately
improves production outside of the machine also.
Whilst being machined the part is now inspected for size and tolerance and re
machined where necessary. The parts come away for the machine right first time and
avoid the need for removal and manual inspection, which can bring further error.
With the machining cycle completed, parts are removed and a print out of the
inspection report can be made. The data is also added to the SPC software for process
monitoring.
The accuracy of the probe against measurements made manually and with a CMM are
proven to be within +/- 10 microns of each other. A small level of deviation is to be
expected due to temperature changes and fixturing. The confidence in parts being
produced correctly within tolerance is increasing as the system is used more
frequently.
8.3 Cost savings brought about from the system
8.3.1 Direct Savings
A yearly figure of around £27k will be realised through time saved from automation.
It will allow for extra machining capacity across the machines with savings being
made from the removal of intermediate inspection processes, which are undertaken
away from the machine. During the „lights out‟ overnight period the expected
additional capacity will return an extra £25k. Initially this will be restricted until
fixturing can be reviewed to provide extra capacity for manufacture of the
components.
Turnover within the cell will increase by 20% for a value of 250k per year and is
attributable to the overall perception of improved quality, and most importantly,
reduced lead times as customers do not want to wait or be delayed.
8.3.2 Indirect savings
The system also proved useful for set ups of jobs, such that an indexing fixture could
be set in around 10 seconds compared to the average 5 – 10 minutes it took operators

137
to do manually with a dial gauge. The time it took the operator would depend on their
experience and level of skill.
From the improved set up the savings to be made are approx 20k per year.
8.3.3 Maintenance costs
Introduction of a BallBar system in the company for just the four Nexus milling
machines will save the company between £11.5k – £14.5k per year in machine
downtime, and excludes any production that would have taken place during this time.
If the equipment is utilized across all machines, this saving will be significantly
higher. With use on 20 machines, the figure could easily be at around the £60k mark
per year plus lost production.
8.4 Further Work
An understanding of the machine tool was made for its errors and how they affect the
production of the finished parts. A system has been implemented for monitoring the
health and condition of the machines, however, further future work could be
undertaken to study the effects more closely on areas such as the thermal influences
within the factory.
With the research proving successful in the first cell of the factory, there are plans for
further implementation factory wide. This will also include new machinery being
purchased for the initial cell to help cope with increased demand and capacity issues.
Due to the Productivity Pyramid, there will always be change, which will affect the
practices of the operators in the strife for continual improvement.

138
Chapter 9 – References
[1] Goodfellow, S., 1999, Introduction of a universal maintenance strategy into Micro
Metalsmiths LTD (machine shop), MSc in Engineering and Metrology
[2] Renishaw QC20W BallBar brochure
[3] Poxton, A., Longstaff, A. P., Barrans, S., Myers, A., Fletcher, S., Pislaru, C., 2008,
Simulation of the Structural Elements of a Three Axis VMC for Machine Tool Error
Compensation, Proceedings of Computing and Engineering Annual Researchers
Conference 2008: CEARC‟08. University of Huddersfield, p. 23-27
[4] Okafor, A. C., Ertekin, Y. M., 2000, Derivation of machine tool error models and
error compensation procedure for three axes vertical machining centre using rigid
body kinematics, International journal of machine tools & manufacture 40 (8), p.
1199-1213
[5] Ramesh, R., Mannan, M. A., Poo, A. N., 2000, Error compensation in machine
tools - a review Part I: geometric, cutting-force induced and fixture-dependent errors,
International journal of machine tools & manufacture 40 (9), p. 1235-1256
[6] Barman, S., Sen, R., 2010, Enhancement of accuracy of multi-axis machine tools
through error measurement and compensation of errors using laser interferometry
technique, MAPAN: journal of Metrology Society of India 25 (2), p. 79-87
[7] Postlethwaite, S. R., Allen, J. P., Ford, D. G., 1999, Machine Tool Thermal Error
Reduction – an appraisal, Proceedings of the Institution of Mechanical Engineers. Part
B, Journal of engineering manufacture 213 (1), p. 1-9
[8] Wang, C., 2008, Machine Tool Calibration: Standards and Methods, American
Machinist, p. 56-58
[9] Willoughby, P., Verma, M., Longstaff, A. P., Fletcher, S., 2010, A Holistic
Approach to Quantifying and Controlling the Accuracy, Performance and Availability
of Machine Tools, Proceedings of the 36th
International MATADOR Conference, p.
313-316
[10] Munzinger, C., Fleischer, J., Broos, A., Hennrich, H., Wieser, J., Ochs, A.,
Schopp, M., 2009, Development and implementation of smart maintenance activities
for machine tools, CIRP journal of manufacturing science and technology 1 (4), p.
237-246

139
[11] Bates, C., 2007, the software side of probing, American Machinist 151 (4), p. 34-
38
[12] Wang, C., Thomas, B., 1997, Predictive maintenance and machine tool
calibration techniques, Modern Machine Shop 69 (11), p. 102-107
[13] Renishaw Axiset literature
[14]Erkan, T., Rene Mayer, J.R., Dupont, Y., 2011, Volumetric distortion assessment
of a five-axis machine by probing a 3D reconfigurable uncalibrated master ball
artefact, Precision engineering 35 (1), p. 116-125
[15] Renishaw white paper IM 110, Survival of the fittest – the process control
imperative
[16] Saunders, M., 2006, Process Development: Building the Pyramid, Metalworking
Production, p. 34-35
[17] Wu, Z., Jiao, J., 2008, A control chart for monitoring process mean based on
attribute inspection, International journal of production research 46 (15), p. 4331-
4347
[18] Weckenmann, A., Estler, T., Peggs, G., McMurty, D., 2004, Probing Systems in
Dimensional Metrology, CIRP Annals 53 (2), p. 657-684
[19] Davis, T. A., Carlson, S., Red, W. E., Jenson, C. G., Sipfle, K., 2005, Flexible in-
process inspection through direct control, measurement: journal of the International
Measurement Confederation 39 (1), p. 57-72
[20] Kim, K. D., Chung, S. C., 2001, Synthesis of the measurement system on the
machine tool, International journal of production research 39 (11), p. 2475-2497
[21] Choi, J. P., Min, B. K., Lee, S. J., 2004, Reduction of machining errors of a
three-axis machine tool by on-machine measurement and error compensation system,
Journal of materials processing technology 155-156, p. 2056-2064
[22] Annonymous, May 2005, Release the potential of your machine tool, Modern
Machine Shop 77 (12), p. 5-8
[23] Arrigo, L., 2005, Q&A: Probing for Machine Accuracy, Product design &
development 60 (4), p. 18
[24] Annonymous, 2006, Machine Tool Probing Provides Prescription for Scrap
Rates, Quality 45 (1), p. 70-76
[25] Tseng, T., Kwon, Y., Ertekin, Y., Chung, W., Jiang, F., 2005, Modeling and
Analysis between In-Process CNC Touch Probe Gauging and Post-Process CMM
Inspection, IIE Annual Conference Proceedings, p. 1-6.

140
[26] Choi, J. P., Min, B. K., Lee, S. J., 2004, Reduction of machining errors of a
three-axis machine tool by on-machine measurement and error compensation system,
Journal of materials processing technology 155-156, p. 2056-2064
[27] Koc, T., Bozdag, E., 2009, The impact of AMT practices on firm performance in
manufacturing SMEs, Robotics and computer-integrated manufacturing 25 (2), p.
303-313
[28] Albert, M., Oct 2007, RAMTIC system still ticking, Modern Machine Shop 80
(5), p. 84-89
[29] Mazak UK Website (2011) FMS Systems
http://www.mazak.eu/jkcm/default.aspx?pg=84 Last accessed Oct. 2011
[30]Xu, X. W., Newman, S. T., 2005, Making CNC machine tools more open,
interoperable and intelligent-a review of the technologies, Computers in industry 57
(2), p. 141-152
[31] Raffaldi, J., Shakarji, C. M., 2004, Managing CMM Software Uncertainties,
Quality 43 (3), p. 48-51
[32] Renishaw Website - Various Pages Last accessed Oct. 2011
[33] Jywe, W., Liu, C. H., Lin, B. J., Hsu, T. H., 2006, The development of a triple
ball bar system for calibration of CNC machine tools, Proceedings of the Institution of
Mechanical Engineers. Part B, Journal of engineering manufacture 220 (b5), p. 759-
766
[34] Kwon, H. D., Burdekin, M., 1998, Measurement and diagnostics of machine tool
errors during circular contouring motions, Proceedings of the Institution of
Mechanical Engineers. Part B, Journal of engineering manufacture 212 (5), p. 343-
356
[35 - 52] See Appendix

141
Chapter 10 – Appendices
10.1 ISO Programs
(ISO Master Program)
(Set G54 for base in vice)
N10 T30 M6 (Tool change for tool 30 – probe)
N20 G0 G90 X0 Y0 (Absolute programming. Rapid Move to X0 Y0)
N30 G43 Z50 H30 (Activate Tool Length Compensation tool 30. Z height 50mm)
N5 #114= ***.*** (ENTER BORE DIA/WEB/TENON/SLOT SIZE)
N25 #115= ***.*** (ENTER X DIMENSION)
N45 #116= ***.*** (ENTER Y DIMENSION)
N65 #117= ***.*** (ENTER Z DIMENSION)
N15 IF[#114NE#0]GOTO35 (Check a value has been entered for D)
#3000=200 (SIZE/DIA MISSING)
N35 IF[#115NE#0]GOTO55 (Check a value has been entered for X)
#3000=201 (X DIM MISSING)
N55 IF[#116NE#0]GOTO75 (Check a value has been entered for Y)
#3000=202 (Y DIM MISSING)
N75 IF[#117NE#0]GOTO95 (Check a value has been entered for Z)
#3000=203 (Z DIM MISSING)
N95
N40 G65 P9110 A0 D#114 F1 X#115 Y#116 Z#117R10 S3
(Call ISO program 9110. Start probing at angle 0. Diameter of ***.***mm.
Function 1 – Update G54. Goto X***.*** Y***.*** Z***.***. Safety distance of
10mm from job. Slot / web measure function selected).
N50 G65 P9110 A90 D#114 F1 X#115Y#116 Z#117R10 S3
(Call ISO program 9110. Start probing at angle 90. Diameter of ***.***mm.
Function 1 – Update G54. Goto X***.*** Y***.*** Z***.***. Safety distance of
10mm from job. Slot / web measure function selected).
N60 G65 P9112 F1 X#115 Y#116 Z#117 R10 S4
(Call ISO program 9112. Function 1 – Update G54. Goto X***.*** Y***.***
Z***.***. Safety distance of 10mm from job. Z height measure function selected).
N70 G91 G28 Z0 (Return to home position)
N80 G65 MAZATROL PROGRAM using G54 for WPC Base in Vice
(Set G54 for base in table fixture)
N100 T30 M6 (Tool change for tool 30 – probe)
N110 G0 G90 X0 Y0 (Absolute programming. Rapid Move to X0 Y0)
N120 G43 Z50 H30 (Activate Tool Length Compensation tool 30. Z height 50mm)

142
N5 #114= ***.*** (ENTER BORE DIA/WEB/TENON/SLOT SIZE)
N25 #115= ***.*** (ENTER X DIMENSION)
N45 #116= ***.*** (ENTER Y DIMENSION)
N65 #117= ***.*** (ENTER Z DIMENSION)
N15 IF[#114NE#0]GOTO35 (Check a value has been entered for D)
#3000=200 (SIZE/DIA MISSING)
N35 IF[#115NE#0]GOTO55 (Check a value has been entered for X)
#3000=201 (X DIM MISSING)
N55 IF[#116NE#0]GOTO75 (Check a value has been entered for Y)
#3000=202 (Y DIM MISSING)
N75 IF[#117NE#0]GOTO95 (Check a value has been entered for Z)
#3000=203 (Z DIM MISSING)
N95
N130 G65 P9110 A0 D#114 F1 X#115Y#116 Z#117 R10 S3
(Call ISO program 9110. Start probing at angle 0. Diameter of ***.***mm.
Function 1 – Update G54. Goto X***.*** Y***.*** Z***.***. Safety distance of
10mm from job. Slot / web measure function selected).
N140 G65 P9110 A90 D#114F1 X#115 Y#116 Z#117 R10 S3
(Call ISO program 9110. Start probing at angle 90. Diameter of ***.***mm.
Function 1 – Update G54. Goto X***.*** Y***.*** Z***.***. Safety distance of
10mm from job. Slot / web measure function selected).
N150 G65 P9112 F1 X#115 Y#116 Z#117R10 S4
(Call ISO program 9112. Function 1 – Update G54. Goto X***.*** Y***.***
Z***.***. Safety distance of 10mm from job. Z height measure function selected).
N160 G91 G28 Z0 (Return to home position)
N170 G65 MAZATROL PROGRAM using G54 for WPC Base in table fixture
(Set G54 for base in indexer)
N200 T30 M6 (Tool change for tool 30 – probe)
N210 G0 G90 X0 Y0 (Absolute programming. Rapid Move to X0 Y0)
N220 G43 Z50 H30 (Activate Tool Length Compensation tool 30. Z height 50mm)
N25 #115= ***.*** (ENTER X DIMENSION)
N45 #116= ***.*** (ENTER Y DIMENSION)
N65 #117= ***.*** (ENTER Z DIMENSION)
N35 IF[#115NE#0]GOTO55 (Check a value has been entered for X)
#3000=201 (X DIM MISSING)
N55 IF[#116NE#0]GOTO75 (Check a value has been entered for Y)
#3000=202 (Y DIM MISSING)
N75 IF[#117NE#0]GOTO95 (Check a value has been entered for Z)
#3000=203 (Z DIM MISSING)
N95
N230 G65 P9112 A0 D10. F1 X#115 Y#116 Z#117 R10 S1
(Call ISO program 9112. Function 1 – Update G54. Goto X***.*** Y***.***
Z***.***. Safety distance of 10mm from job. X position measure function selected).

143
N5 #114= ***.*** (ENTER BORE DIA/WEB/TENON/SLOT SIZE)
N25 #115= ***.*** (ENTER X DIMENSION)
N45 #116= ***.*** (ENTER Y DIMENSION)
N65 #117= ***.*** (ENTER Z DIMENSION)
N15 IF[#114NE#0]GOTO35 (Check a value has been entered for D)
#3000=200 (SIZE/DIA MISSING)
N35 IF[#115NE#0]GOTO55 (Check a value has been entered for X)
#3000=201 (X DIM MISSING)
N55 IF[#116NE#0]GOTO75 (Check a value has been entered for Y)
#3000=202 (Y DIM MISSING)
N75 IF[#117NE#0]GOTO95 (Check a value has been entered for Z)
#3000=203 (Z DIM MISSING)
N95
N240 G65 P9110 A90 D#114 F1 X#115 Y#116 Z#117 R10 S3
(Call ISO program 9110. Start probing at angle 90. Diameter of ***.***mm.
Function 1 – Update G54. Goto X***.*** Y***.*** Z***.***. Safety distance of
10mm from job. Slot / web measure function selected).
N25 #115= ***.*** (ENTER X DIMENSION)
N45 #116= ***.*** (ENTER Y DIMENSION)
N65 #117= ***.*** (ENTER Z DIMENSION)
N35 IF[#115NE#0]GOTO55 (Check a value has been entered for X)
#3000=201 (X DIM MISSING)
N55 IF[#116NE#0]GOTO75 (Check a value has been entered for Y)
#3000=202 (Y DIM MISSING)
N75 IF[#117NE#0]GOTO95 (Check a value has been entered for Z)
#3000=203 (Z DIM MISSING)
N95
N250 G65 P9112 F1 X#115 Y#116 Z#117 R10 S4
(Call ISO program 9112. Function 1 – Update G54. Goto X***.*** Y***.***
Z***.***. Safety distance of 10mm from job. Z height measure function selected).
N260 G91 G28 Z0 (Return to home position)
N270 G65 MAZATROL PROGRAM using G54 for WPC Base in Indexer
(Probing of bore)
N5 #114= ***.*** (ENTER BORE DIA/WEB/TENON/SLOT SIZE)
N25 #115= ***.*** (ENTER X DIMENSION)
N45 #116= ***.*** (ENTER Y DIMENSION)
N65 #117= ***.*** (ENTER Z DIMENSION)
N85 #118= ** (ENTER TOOL NUMBER FOR UPDATING)
N105 #119= ***.*** (ENTER LOWER TOLERANCE VALUE)
N125 #120= ***.*** (ENTER UPPER TOLERANCE VALUE)
N15 IF[#114NE#0]GOTO35 (Check a value has been entered for D)

144
#3000=200 (SIZE/DIA MISSING)
N35 IF[#115NE#0]GOTO55 (Check a value has been entered for X)
#3000=201 (X DIM MISSING)
N55 IF[#116NE#0]GOTO75 (Check a value has been entered for Y)
#3000=202 (Y DIM MISSING)
N75 IF[#117NE#0]GOTO95 (Check a value has been entered for Z)
#3000=203 (Z DIM MISSING)
N95 IF[#118NE#0]GOTO115 (Check a value has been entered for T)
#3000=204 (TOOL NUMBER MISSING)
N115 IF[#119NE#0]GOTO135 (Check a value has been entered for lower tolerance)
#3000=205 (LOWER TOLERANCE MISSING)
N135 IF[#120NE#0]GOTO145 (Check a value has been entered for upper tolerance)
#3000=206 (UPPER TOLERANCE MISSING)
N145
N1000 T30 M6 (Select tool 30 (Probe) / Change tool)
N1010 G0 G90 X0 Y0 (Rapid / Absolute Programming / Position)
N1020 G43 Z50. H30 (Activate Tool Length offset + direction / Z height of 50mm /
Tool number 30)
N1030 G65P9110 A0. D#114 F800. X#115 Y#116 Z#117 R10. S11. T#118
N1040 G91 G28 Z0 (Incremental Programming / Home position / Z at 0)
N1050 (Line Number for calling Logic sequence)
N1080 #105=1 (Logic sequence count initialise)
N1060 IF[#529GT[#114+2]]GOTO1160 (Check for unexpected error before allowing
logic)
N1070 IF[#529LT[#114-2]]GOTO1160 (Check for unexpected error before allowing
logic)
N1090 IF[#529LT[#114+#120]]GOTO260 (If found measure result is greater than
desired value + tolerance go back to start of program and re-machine)
N1100 IF[#529GT[#114-#119]]GOTO1140 (If found measure result is less than
desired value - tolerance call #3000 alarm for width too narrow)
N1110 IF[#105>3]GOTO1150 (Logic sequence count check for less than three
iterations)
N1120 #105=#105+1 (Logic sequence count addition)
N1130 GOTO1160
N1140 #3000=100 (CHECK WIDTH)
N1150 #3000=101 (LOOP EXCEEDED)
N1160 #3000=102 (CHECK MACHINE DIMENSIONS)
N1170 M30 (Stop program)

145
Nomenclature explanations:
A - Touching Angle 0 / 90 / 180 / 270 (0 is First touch on X+ of part)
C - Touch Counter - Default value used if no value set
D - Diameter of Object - Estimated diameter / length / width of feature being
measured. Must be exact if using F600, F700 or F800
E - Error amount part feature may be miss-located - Default value used if no value set
F - Touching Function - Set to 0 by default, full listing below:
F0 - Only measuring, works with cycles 9110, 9111 and 9114
F1 Through F6 - Work co-ordinate G54 to G59 will be updated, works with cycles
9110, 9111 and 9114
F7 - The actual work co-ordinate will be shifted by the difference between the input
values and the measuring results, works with cycles 9110, 9111 and 9114
F8 - The actual work co-ordinate will be updated by the measuring result, works with
cycles 9110, 9111 and 9114
F101 Through F400 - Work co-ordinate G54.1 P1 to G54.1 P300 will be updated,
works with cycles 9110, 9111 and 9114
F500 - Tolerance Check / Check position, works with cycles 9110, 9112 and 9114
F600 - Tolerance Check / Check size of diameter or distance, works with cycle 9110
F700 - Tolerance Check / Check position and size of diameter or distance, works with
cycle 9110
F800 - Update Tool with T value for tool number, works with cycles 9110 and 9112
F[Value] + 1000 - Printout of measuring results from serial port
H - Probe number - Set to 1 by default
R - Safety Distance in Z - If no R value set, Z is used + 0.01mm
S - Measuring Object Type, full listing below:
S1 - Pocket without obstruction
S2 - Pocket with obstruction
S3 - Web
S11 - Bore
S12 - Bore with obstruction
S13 - Boss
S21 - Bore 3 point
S22 - Bore 3 point with obstruction
S23 - Boss 3 point
T - Tool Number to be updated
U - X Position Tolerance
V - Y Position Tolerance
W - Diameter Tolerance
X - X Centre - Estimated centreline of feature being measured. Default actual X
Position. Exact position needed for F600 and F700
Y - Y Centre - Estimated centreline of feature being measured. Default actual X
Position. Exact position needed for F600 and F700
Z - Z Position - Position in Z-axis at which measuring will be made. Default actual Z
Position
Variable Numbers in controller:
#525 - Error Number
#526 - Measuring Result in X

146
#527 - Measuring Result in Y
#528 - Measuring Result in Z
#529 - Found Diameter or angle
Measuring a Tenon
G65P9110 Astart angle. Dsize. Ffunction number. Xcentre point value. Ycentre point
value. Zmeasuring depth. R10. S3. Twhich tool to update for recut
Measuring a Slot
G65P9110 Astart angle. Dsize. Ffunction number. Xcentre point value. Ycentre point
value. Zmeasuring depth. R10. S1./2. Twhich tool to update for recut
Measuring a Bore
G65P9110 A0. Dsize. Ffunction number. Xcentre point value. Ycentre point value.
Zmeasuring depth. R10. S11. Twhich tool to update for recut
Logic Sequences
N111 (Line Number for calling Logic sequence)
#125=Diameter part should be (Used just for logic test and user entered into this
variable number or straight into calculation below)
#529=Found measure result (Used just for logic test - automatically written to
variable)
IF[#529GT[#125+.1]]GOTO1 (If found measure result is greater than desired value +
tolerance go back to start of program and re machine)
IF[#529LT[#125-.1]]GOTO2 (If found measure result is less than desired value -
tolerance call #3000 alarm for width too narrow)
GOTO3
N2#3000=100 (CHECK WIDTH)
N3 M30 (Stop program)
Capto Bore check program C3
T30 M6 (Select tool 30 (Probe) / Change tool)
G0 G90 X0 Y0 (Rapid / Absolute Programming / Position)
G43 Z50. H30 (Activate Tool Length offset + direction / Z height of 50mm / Tool
number 30)
G65P9110 A0. D30. F. X. Y. Z. R10. S11. T.
G91 G28 Z0 (Incremental Programming / Home position / Z at 0)
N111 (Line Number for calling Logic sequence)

147
IF[#529LT[30.+.025]]GOTO1 (If found measure result is greater than desired value +
tolerance go back to start of program and re machine)
IF[#529GT[30.-.000]]GOTO2 (If found measure result is less than desired value -
tolerance call #3000 alarm for width too narrow)
GOTO3
N2#3000=100 (CHECK WIDTH)
N3 M30 (Stop program)
Capto Bore check program C4
T30 M6 (Select tool 30 (Probe) / Change tool)
G0 G90 X0 Y0 (Rapid / Absolute Programming / Position)
G43 Z50. H30 (Activate Tool Length offset + direction / Z height of 50mm / Tool
number 30)
G65P9110 A0. D40. F. X. Y. Z. R10. S11. T.
G91 G28 Z0 (Incremental Programming / Home position / Z at 0)
N111 (Line Number for calling Logic sequence)
IF[#529LT[40.+.025]]GOTO1 (If found measure result is greater than desired value +
tolerance go back to start of program and re machine)
IF[#529GT[40.-.000]]GOTO2 (If found measure result is less than desired value -
tolerance call #3000 alarm for width too narrow)
GOTO3
N2#3000=100 (CHECK WIDTH)
N3 M30 (Stop program)
Capto Bore check program C5
T30 M6 (Select tool 30 (Probe) / Change tool)
G0 G90 X0 Y0 (Rapid / Absolute Programming / Position)
G43 Z50. H30 (Activate Tool Length offset + direction / Z height of 50mm / Tool
number 30)
G65P9110 A0. D50. F. X. Y. Z. R10. S11. T.
G91 G28 Z0 (Incremental Programming / Home position / Z at 0)
N111 (Line Number for calling Logic sequence)
IF[#529LT[50.+.025]]GOTO1 (If found measure result is greater than desired value +
tolerance go back to start of program and re machine)
IF[#529GT[50.-.000]]GOTO2 (If found measure result is less than desired value -
tolerance call #3000 alarm for width too narrow)
GOTO3
N2#3000=100 (CHECK WIDTH)
N3 M30 (Stop program)
Capto Bore check program C6
T30 M6 (Select tool 30 (Probe) / Change tool)
G0 G90 X0 Y0 (Rapid / Absolute Programming / Position)
G43 Z50. H30 (Activate Tool Length offset + direction / Z height of 50mm / Tool
number 30)
G65P9110 A0. D60. F. X. Y. Z. R10. S11. T.
G91 G28 Z0 (Incremental Programming / Home position / Z at 0)
N111 (Line Number for calling Logic sequence)

148
IF[#529LT[63.+.025]]GOTO1 (If found measure result is greater than desired value +
tolerance go back to start of program and re machine)
IF[#529GT[63.-.000]]GOTO2 (If found measure result is less than desired value -
tolerance call #3000 alarm for width too narrow)
GOTO3
N2#3000=100 (CHECK WIDTH)
N3 M30 (Stop program)
Capto Bore check program C8
T30 M6 (Select tool 30 (Probe) / Change tool)
G0 G90 X0 Y0 (Rapid / Absolute Programming / Position)
G43 Z50. H30 (Activate Tool Length offset + direction / Z height of 50mm / Tool
number 30)
G65P9110 A0. D80. F. X. Y. Z. R10. S11. T.
G91 G28 Z0 (Incremental Programming / Home position / Z at 0)
N111 (Line Number for calling Logic sequence)
IF[#529LT[80.+.025]]GOTO1 (If found measure result is greater than desired value +
tolerance go back to start of program and re machine)
IF[#529GT[80.-.000]]GOTO2 (If found measure result is less than desired value -
tolerance call #3000 alarm for width too narrow)
GOTO3
N2#3000=100 (CHECK WIDTH)
N3 M30 (Stop program)
Tenon check program
T30 M6 (Select tool 30 (Probe) / Change tool)
G0 G90 X0 Y0 (Rapid / Absolute Programming / Position)
G43 Z50. H30 (Activate Tool Length offset + direction / Z height of 50mm / Tool
number 30)
G65P9110 A. D. F. X. Y. Z. R10. S3. T.
G91 G28 Z0 (Incremental Programming / Home position / Z at 0)
N111 (Line Number for calling Logic sequence)
IF[#529GT[#125+.1]]GOTO1 (If found measure result is greater than desired value +
tolerance go back to start of program and re machine)
IF[#529LT[#125-.1]]GOTO2 (If found measure result is less than desired value -
tolerance call #3000 alarm for width too narrow)
GOTO3
N2#3000=100 (CHECK WIDTH)
N3 M30 (Stop program)
Slot check Program
T30 M6 (Select tool 30 (Probe) / Change tool)
G0 G90 X0 Y0 (Rapid / Absolute Programming / Position)
G43 Z50. H30 (Activate Tool Length offset + direction / Z height of 50mm / Tool
number 30)
G65P9110 A. D. F. X. Y. Z. R10. S1. T.
G91 G28 Z0 (Incremental Programming / Home position / Z at 0)
N111 (Line Number for calling Logic sequence)
IF[#529LT[#125+.1]]GOTO1 (If found measure result is greater than desired value +
tolerance go back to start of program and re machine)

149
IF[#529GT[#125-.1]]GOTO2 (If found measure result is less than desired value -
tolerance call #3000 alarm for width too narrow)
GOTO3
N2#3000=100 (CHECK WIDTH)
N3 M30 (Stop program)
150
10.2 BS EN ISO Standards
BS3800 – 2 : 1991 – General tests for machine tools; statistical methods for
determination of accuracy and repeatability of machine tools [35].
BS EN ISO 10360 – 1 : 2001 – Geometrical Product Specifications (GPS) –
acceptance and reverification tests for Coordinate Measuring Machines (CMM) –
Vocabulary [36].
BS EN ISO 10360 – 2 : 2009 – Geometrical Product Specifications (GPS) –
acceptance and reverification tests for Coordinate Measuring Machines (CMM) –
CMM‟s used for measuring linear dimensions [37].
BS EN ISO 10360 – 3 : 2001 – Geometrical Product Specifications (GPS) –
acceptance and reverification tests for Coordinate Measuring Machines (CMM) –
CMM‟s with the axis of a rotary table as the fourth axis [38].
BS EN ISO 10360 – 4 : 2001 – Geometrical Product Specifications (GPS) –
acceptance and reverification tests for Coordinate Measuring Machines (CMM) –
CMM‟s used in scanning measuring mode [39].
BS EN ISO 10360 – 5 : 2001 – Geometrical Product Specifications (GPS) –
acceptance and reverification tests for Coordinate Measuring Machines (CMM) –
CMM‟s using multiple stylus probing systems [40].
BS EN ISO 10360 – 6 : 2001 – Geometrical Product Specifications (GPS) –
acceptance and reverification tests for Coordinate Measuring Machines (CMM) –
Estimation of errors in computing Gaussian associated features [41].
BS ISO 26303 – 1 : DRAFT – Machine tools – Reliability, availability and capability
– Capability evaluation of machining processes on metal cutting machine tools [42].
BS ISO 230 – 1 : 1996 – Test code for machine tools – Geometric accuracy of
machines operating under no load or finishing conditions [43].
BS ISO 230 – 2 : 2006 – Test code for machine tools – Determination of accuracy and
repeatability of positioning numerically controlled axes [44].
BS ISO 230 – 3 : 2007 – Test code for machine tools – Determination of thermal
effects [45].
BS ISO 230 – 4 : 2005 – Test code for machine tools – Circular tests for numerically
controlled machine tools [46].

151
BS ISO 230 – 5 : 2000 – Test code for machine tools – Determination of the noise
emission [47].
BS ISO 230 – 6 : 2002 – Test code for machine tools – Determination of positioning
accuracy on body and face diagonals (Diagonal displacement tests) [48].
BS ISO 230 – 7 : 2006 – Test code for machine tools – Geometric accuracy of axes of
rotation [49].
PD ISO TR 230 – 8 : 2010 – Test code for machine tools – Vibrations [50].
PD ISO TR 230 – 9 : 2005 – Test code for machine tools – Estimation of
measurement uncertainty for machine tool tests according to series ISO 230, basic
equations [51].
BS ISO 230 – 10 : DRAFT – Test code for machine tools – Determination of
measuring performance of probing systems of numerically controlled machine tools
[52].

152
10.3 BallBar Method
Wired:
Attach base to table
Insert magnet leaving free to move initially
Insert magnet in to spare chuck
Insert magnet in to machine tool spindle
Jog to central position of magnets
Tighten base magnet into holder
Set work-piece offsets in G54
Program controller to interpolate in circular motions in XY plane
Insert BallBar in to machine between magnets
Ensure cable is placed as to not get tangled
Use computer software to calibrate settings of BallBar
Start monitoring within the software
Press cycle start on machine tool controller
Wait for cycle to finish and ensure wire does not snag
Review results in software
Remove equipment from machine
Wireless:
Attach base to table
Insert magnet leaving free to move initially
Insert magnet in to spare chuck
Insert magnet in to machine tool spindle
Jog to central position of magnets
Use spare magnetic ball for centralising
Tighten base magnet into holder
Set work-piece offsets in G54
Program controller to interpolate in circular motions in XY plane
Program controller to perform partial arcs in XZ and YZ plane for 220 degrees
Switch on Wireless BallBar
Place BallBar between points on calibration equipment
Use computer software to calibrate settings of BallBar

153
Insert BallBar in to machine between magnets
Ensure door of machine is closed
Start monitoring within the software
Press cycle start on machine tool controller
Wait for cycle to finish
Review results in software
Remove equipment from machine
Turn off BallBar

154
10.4 BallBar Test Part Programs
%
O100
(WARNING!)
(Renishaw cannot guarantee that the part programs generated are)
(correct. Anyone using the part programs generated by this software)
(must ensure that the programs are suitable for the machine/controller)
(on which they are used. Part programs should only be run by personnel)
(who are fully familiar with the machine, the controller and the)
(operation of all guards, interlocks and emergency stop switches.)
(It is recommended that programs are initially tested at low speed using)
(the feedrate override control.)
N10 G21
N20 G54
N30 G90
N40 G17
N50 G64
N60 M05
N70 M19
N80 G98 F500.000
N90 G01 X-151.5000 Y0.0000 Z0.0000
N100 M00
N110 G01 X-150.0000 Y0.0000
N120 G03 X-150.0000 Y0.0000 I150.0000 J0.0000
N130 G03 X-150.0000 Y0.0000 I150.0000 J0.0000
N140 G01 X-151.5000 Y0.0000
N150 G04 X5.0
N160 G01 X-150.0000 Y0.0000
N170 G02 X-150.0000 Y0.0000 I150.0000 J0.0000
N180 G02 X-150.0000 Y0.0000 I150.0000 J0.0000
N190 G01 X-151.5000 Y0.0000
N200 M30
%

155
%
O104
(WARNING!)
(Renishaw cannot guarantee that the part programs generated are)
(correct. Anyone using the part programs generated by this software)
(must ensure that the programs are suitable for the machine/controller)
(on which they are used. Part programs should only be run by personnel)
(who are fully familiar with the machine, the controller and the)
(operation of all guards, interlocks and emergency stop switches.)
(It is recommended that programs are initially tested at low speed using)
(the feedrate override control.)
N10 G21
N20 G54
N30 G90
N40 G19
N50 G64
N60 M05
N70 M19
N80 G98 F500.000
N90 G01 X0.0000 Y140.4684 Z-56.7529
N100 M00
N110 G01 Y139.0776 Z-56.1910
N120 G03 Y-139.0776 Z-56.1910 J-139.0776 K56.1910
N130 G01 Y-140.4684 Z-56.7529
N140 G04 X5.0
N150 G01 Y-139.0776 Z-56.1910
N160 G02 Y139.0776 Z-56.1910 J139.0776 K56.1910
N170 G01 Y140.4684 Z-56.7529
N180 M30
%

156
%
O107
(WARNING!)
(Renishaw cannot guarantee that the part programs generated are)
(correct. Anyone using the part programs generated by this software)
(must ensure that the programs are suitable for the machine/controller)
(on which they are used. Part programs should only be run by personnel)
(who are fully familiar with the machine, the controller and the)
(operation of all guards, interlocks and emergency stop switches.)
(It is recommended that programs are initially tested at low speed using)
(the feedrate override control.)
N10 G21
N20 G54
N30 G90
N40 G18
N50 G64
N60 M05
N70 M19
N80 G98 F500.000
N90 G01 X140.4684 Y0.0000 Z-56.7529
N100 M00
N110 G01 X139.0776 Z-56.1910
N120 G02 X-139.0776 Z-56.1910 I-139.0776 K56.1910
N130 G01 X-140.4684 Z-56.7529
N140 G04 X5.0
N150 G01 X-139.0776 Z-56.1910
N160 G03 X139.0776 Z-56.1910 I139.0776 K56.1910
N170 G01 X140.4684 Z-56.7529
N180 M30
%

157
10.5 Inspection Reports

158

159
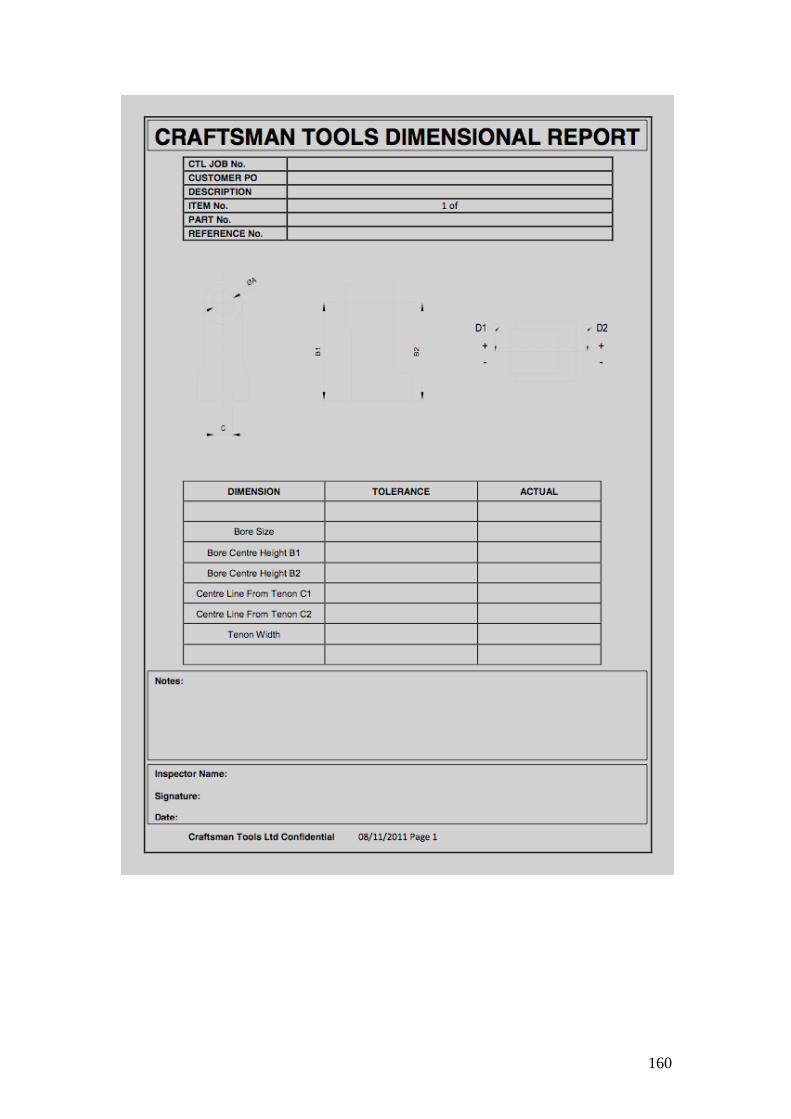
160

161

162

163

164

165
Copyright © 2022 FDOKUMEN