Intestinal expression of genes involved in iron absorption in humans
33
Intestinal expression of genes involved in iron absorption in humans Andreas Rolfs 1,2 , Herbert L. Bonkovsky 2,4 , James G. Kohlroser 2,3 , Kristina McNeal 2 , Ashish Sharma 2 , Urs, V. Berger 1 , Matthias A. Hediger 1,4 1 Membrane Biology Program and Renal Division, Brigham and Women’s Hospital, Harvard Medical School, Boston, MA 2 Department of Medicine, Medical School, University of Massachusetts, Worcester, MA 3 Current address: Division of Gastroenterology, Albany Medical College, Albany, NY Keywords: HFE, DCT1, DMT1, Nramp2, IREG1, MTP1, ferroportin1, Intestinal Iron Absorption, Human Biopsies Abbreviations: divalent cation transporter (DCT1), hereditary hemochromatosis (HHC), iron-responsive element (IRE), transferrin receptor (TfR), transferrin saturation (TfS) 4 Corresponding Author Address: M.A.Hediger H.L. Bonkovsky Membrane Biology Program The Liver-Biliary-Pancreatic Center Brigham & Women’s Hospital University of Massachusetts Medical School Harvard Medical School Rm S6-737 HIM bldg., rm. 570 55 Lake Ave., North Ave. Louis Pasteur 77 Worcester, MA 01651 Boston, MA 02115 Phone: (617) 525-5820 (508) 856 3068 Fax: (617) 525-5821 (508) 856 3981 email: [email protected] [email protected] Copyright 2001 by the American Physiological Society. AJP-GI Articles in PresS. Published on October 31, 2001 as DOI 10.1152/ajpgi.00371.2001
-
Upload
independent -
Category
Documents
-
view
4 -
download
0
Transcript of Intestinal expression of genes involved in iron absorption in humans

Intestinal expression of genes involved in iron absorption in humans
Andreas Rolfs1,2, Herbert L. Bonkovsky2,4, James G. Kohlroser2,3, Kristina McNeal2, Ashish
Sharma2, Urs, V. Berger1, Matthias A. Hediger1,4
1Membrane Biology Program and Renal Division, Brigham and Women’s Hospital, Harvard
Medical School, Boston, MA
2Department of Medicine, Medical School, University of Massachusetts, Worcester, MA
3Current address: Division of Gastroenterology, Albany Medical College, Albany, NY
Keywords:
HFE, DCT1, DMT1, Nramp2, IREG1, MTP1, ferroportin1, Intestinal Iron Absorption, Human
Biopsies
Abbreviations:
divalent cation transporter (DCT1), hereditary hemochromatosis (HHC), iron-responsive element
(IRE), transferrin receptor (TfR), transferrin saturation (TfS)
4 Corresponding Author Address:
M.A.Hediger H.L. Bonkovsky Membrane Biology Program The Liver-Biliary-Pancreatic Center Brigham & Women’s Hospital University of Massachusetts Medical School Harvard Medical School Rm S6-737 HIM bldg., rm. 570 55 Lake Ave., North Ave. Louis Pasteur 77 Worcester, MA 01651 Boston, MA 02115 Phone: (617) 525-5820 (508) 856 3068 Fax: (617) 525-5821 (508) 856 3981 email: [email protected] [email protected]
Copyright 2001 by the American Physiological Society.
AJP-GI Articles in PresS. Published on October 31, 2001 as DOI 10.1152/ajpgi.00371.2001
Rolfs et al 10/29/2001
1
ABSTRACT
Hereditary hemochromatosis (HHC) is one of the most frequent genetic disorders in
humans. It is caused by a missense mutation (C282Y) in the HFE gene which triggers excessive
intestinal iron absorption, followed by toxic accumulation of iron in the liver and other organs. In
healthy individuals, the absorption of iron in the intestine is tightly regulated by the cells with
highest iron demand, in particular erythroid precursors. The cloning of the intestinal iron
transporter proteins, DCT1 and IREG1/hephaestin, provided new insight into the mechanisms
and regulation of intestinal iron absorption. The aim of this study was to assess whether, in man,
the two transporters are regulated in an iron dependent manner, and whether this regulation is
disturbed in HHC. Using quantitative PCR, we measured the RNA expression of DCT1, IREG,
and hephaestin mRNA expression in duodenal biopsy samples of individuals with normal iron
levels, iron deficiency anemia, or iron overload due to liver disease or hereditary
hemochromatosis. In control subjects, we found inverse relationships between the DCT1 splice
form containing an iron-responsive element (IRE), and blood hemoglobin, serum transferrin
saturation, or ferritin. Subjects with iron-deficiency anemia show a significant increase in
expression of DCT1(IRE) mRNA when compared with controls. Similarly in subjects
homozygous for the C282Y HFE mutation, the DCT1(IRE) expression levels remained high,
despite high serum iron saturation. In HHC, we found a significantly increased IREG1
expression, compared with controls. Hephaestin did not exhibit a similar iron dependent
regulation. In conclusion, our data show that the expression of the human DCT1 mRNAs is
regulated in an iron-dependent manner, similar to other mammals, while the mRNA of
hephaestin is not affected. In HHC patients, the mRNA expression levels of DCT1 and IREG1
remain high despite elevated serum transferrin saturation and ferritin levels. The lack of

Rolfs et al 10/29/2001
2
appropriate down regulation of the apical and basolateral iron transporter in duodenum leads to
excessive iron absorption in persons with HHC.
Rolfs et al 10/29/2001
3
INTRODUCTION
Hereditary hemochromatosis (HHC) is one of the most prevalent inherited disorders in
man. It is caused by excessive intestinal iron absorption that may lead to damage of various
organs, especially liver, pancreas, heart, and pituitary gland. As reported by Feder et al. in 1996,
it is primarily caused by a missense mutation within the HFE gene (mostly cysteine 282 to
tyrosine) (12). In HFE, this mutation leads to iron accumulation in the body, and may cause liver
cirrhosis or heart disease, and eventually death, if not treated by phlebotomy (5,14). The HFE
protein neither binds nor transports iron, but, rather, physically interacts with the transferrin
receptor (TfR) (13,21,30,45). Some investigators propose that the HFE protein competes with
diferric transferrin for the transferrin receptor (22), and thereby reduces the overall uptake of iron
into cells, maintaining low, but sufficient intracellular levels of iron (35,38). However, it has also
been reported that HFE protein can facilitate the uptake of transferrin-bound iron into certain
cells (26).
In the mammalian body, iron absorption is tightly regulated by the demand of iron for
erythropoiesis, and occurs only in the small intestine, in particular in the duodenum (18). Iron
uptake is mediated in two steps, as revealed by studies of naturally occurring mutations in
animals (3), and the characterization of recently cloned transporter genes (19,24). At the apices
of intestinal villi, enterocytes express the transporter DCT1 (also known as DMT1 or Nramp2)
that is essential for cellular uptake of iron from the intestinal lumen (15,19). The transport from
enterocytes into the serum, at the basolateral side of enterocytes, is accomplished by the
coordinated action of the transporter IREG1 (also known as MTP1 or ferroportin1 (1,11,24)),
and the multi-copper ferrroxidase hephaestin (44). For both transporters, DCT1 and IREG1, the
mRNA’s contain sequences resembling iron-responsive elements (IRE’s) previously found in the
mRNA’s of ferritin and TfR, that presumably regulate their expression by intracellular iron in a

Rolfs et al 10/29/2001
4
cell specific manner (for review see refs. 34 and 41). DCT1 and IREG1 mRNA and protein have
been reported to be upregulated in response to chronic iron deficiency in the intestine
(1,19,24,43). Abboud and Haile isolated IREG1 (which they call MTP1) by the ability of its
RNA to bind the iron responsive element binding protein-1 (IRP1), immobilized on a column.
Likewise, binding of IRP1 to the mRNA of DCT1, has been reported recently (46).
Interestingly, intestinal absorption of iron, which is mediated by DCT1 and IREG1,
occurs in duodenal villi (1,8,24), whereas the “modulator of iron homeostasis”, HFE, is normally
expressed in crypt cells (7,31). How HFE, which is presumed to act as a modulator of the affinity
of TfR for transferrin, can regulate iron absorption in villus cells is still not completely
understood. Recently, it was shown that the lack of expression of hepcidin, a peptide synthesized
in liver, leads to iron overload in mice, similar to HFE or β2-microglobulin knock-out mice
(28,33). Whether this peptide acts as a regulator of genes involved in iron absorption, and how
this regulation occurs, remains to be determined.
A model proposed by Conrad et al. in 1964 (10) provides a possible mechanism for
regulation of iron absorption mediated by the amount of iron absorbed by crypt cells in the
intestine. This body iron “sensing mechanism” in crypt cells would be expected to be disturbed
in HHC, leading to imbalances in intestinal iron absorption in villus cells (37). The observed iron
dependent regulation of the two iron transporters, DCT1 and IREG/MTP1, raises the question of
a possible dysregulation of these transporters in HHC. In two previous studies, carefully selected
HHC patients homozygous for C282Y were compared with control subjects, subjects with
secondary iron overload, and iron deficient subjects for their expression level of total DCT1 and
IREG1. DCT1 and IREG1 were found to be increased in HHC. However, this study did not
differentiate between the two DCT1 splice forms (with and without an IRE) (47,48), and the
expression of hephaestin was not examined.

Rolfs et al 10/29/2001
5
Recently two rare forms of hereditary hemochromatosis not related to mutations in the
HFE gene have been described. One of them is caused by a missense mutation in the IREG1
gene (29) and the other one by a defect in the recently identified second transferrin receptor
isoform, called TfR2 (36). These findings highlight the importance of iron transport in
controlling body iron homeostasis.
In the present study we investigated the expression of the mRNA’s of both the apical and
basolateral iron transporters in human upper intestinal biopsies in subjects with iron-deficiency
anemia, normal iron, and iron-overload. We compared the data from patients with homozygous
hereditary hemochromatosis (HHC) subjects with and without the major (C282Y) and minor
(H63D) mutations of HFE associated with HHC at different levels of serum ferritin and
transferrin saturation (TfS). We found that, in HHC patients without liver disease, DCT1(IRE)
and IREG1 are significantly upregulated in comparison with control individuals, whereas no
changes were detected for hephaestin. We also assessed the portion of DCT1 upregulation that is
attributable to HHC, by studying the regulation of DCT1 in normal individuals as a function of
blood hemoglobin, serum iron, and ferritin levels. The “normal” regulation of DCT1 in human
intestine by differentiating the two splice forms has not been reported heretofore.
Rolfs et al 10/29/2001
6
MATERIALS and METHODS
Proximal duodenal biopsy samples (from the 2nd portion within 5cm of the duodenal
bulb) were obtained from 9 patients with classical hereditary hemochromatosis (C282Y +/+,
H63D -/-), and 27 patients with wild type genotype (C282Y -/-, H63D -/-). Patients were
recruited from the Clinic or the endoscopy suite of U Mass Memorial Healthcare. One patient
with phenotypic hemochromatosis volunteered to undergo endoscopy for study purposes. All
other patients volunteered for duodenal biopsies during medically indicated upper GI
endoscopies. In all cases, upper GI endoscopies were performed in subjects who were ingesting
diets that were not limited or supplemented with iron and after an overnight fast of at least 12
hours. The study protocol and consent form were approved by the Human Subjects’ Committee
of U Mass. All patients were older than 18 years and gave their written, informed consents.
At the time of endoscopy, blood was obtained for hematocrit, hemoglobin, serum ferritin,
serum iron binding capacity, transferrin, and HFE mutational analysis. The duodenal biopsies
were obtained with standard mucosal biopsy forceps inserted through standard gastrofiberscopes
(Olympus Corp. GIF140, Tokyo, Japan). They were immediately placed into 300 µl of Ultraspec
Total RNA Isolation Reagent (Biotecx, Houston, TX). Typically a total of six biopsies, each
about 5 mg wet weight, were placed into three 1.5 ml micro-centrifuge tubes, two specimens per
tube. A seventh biopsy was also collected, immediately placed into a cryovial, and snap frozen in
liquid N2 for histochemical studies. Tissue in Ultraspec was treated following the manufacturer’s
instructions, RNA’s were stored at -20oC under isopropanol, and prior to 1st strand synthesis
centrifuged, washed in ethanol and dissolved in 20 µl water.
Random primed 1st strand cDNA was synthesized from each biopsy sample with an
AMV-RT kit, following the manufacturer’s instructions (Roche, Indianapolis, IN), and using 1
µg total RNA as a template (OD260). Genomic sequences for IREG1 and hephaestin were

Rolfs et al 10/29/2001
7
obtained from the ‘htgs’ sequence library of GenBank (IREG1 acc. no AC012488; hephaestin
acc. no AC020739). For β-actin and DCT1, the earlier published genomic sequences (23,27)
were used to design oligonucleotide primers.
The PCR-primers synthesized were as follows: β-actin (GenBank M10277)
2282gggaaatcgtgcgtgacatt2301 and 2583cacgaaactaccttcaactcc2603, exons3 to 4; IREG1 (GenBank
AC012488) 224tgctatctccagttccttgc205 and 160203tgtcttctcctgcaacaaca160184, exons1 to 5; hephaestin
(GenBank AC020739) 79303tataccatccaccctcatgg79284 and 63319gcatcctattgctctcctga63338, exons2 to
4; DCT1(nonIRE) (GenBank AF064481 andAF064483) 1535cccatcctcacatttacgag1554,
953atcccagagtccaagacaca934, exons14 to17; DCT1(IRE) (GenBank AF064481 and AF064482)
1535cccatcctcacatttacgag1554, 921ccctaatccagttctaag904 exons14 to 16a (IRE 3' end), respectively.
Quantitative-PCR amplification was performed with the Lightcycler device/software and
the SYBRgreen DNA master kit following the manufacturer’s instructions (Roche, Indianapolis,
IN). After initial denaturation at 95oC for 30sec, each gene was independently amplified and
detected using the following cycles (usually 40 cycles): β-actin: 95oC 0sec, 62oC 4sec, 72oC
5sec, 82oC 2sec (fluorescent detection, gain: 20); IREG1: 95oC 0sec, 58oC 8sec, 72oC 18sec,
82oC 3sec (fluorescent detection, gain: 15); hephaestin: 95oC 0sec, 53oC 10sec, 72oC 15sec, 82oC
2sec (fluorescent detection, gain: 30); DCT1(IRE): 95oC 0sec, 57oC 5sec, 72oC 12sec, 82oC 1sec
(fluorescent detection, gain: 20); DCT1(nonIRE): 95oC 0sec, 53oC 10sec, 72oC 15sec, 82oC 2sec
(fluorescent detection, gain: 30). Each PCR amplification was followed by a melting curve
analysis (97oC 5sec, 65oC 15sec, followed by 0.1oC ramping by continuous fluorescent
measurement to 99oC) to control for specific amplification products. Each sample was analyzed
at least twice; in some cases additional analysis of a second set of specimens was performed to
examine intra-individual variations. Data obtained for DCT1, IREG1 and hephaestin were
Rolfs et al 10/29/2001
8
normalized by comparison with β-actin expression, therefore, the results might be called semi-
quantitative.
Non-radioactive in situ hybridization was performed as described previously (19), using a
digoxigenin (DIG)-labeled cRNA probe that contained 800 bases of DCT1(IRE) 3' untranslated
sequence (nucleotides 1719-2423, AB004857). Frozen sections (8µm) were cut from the
intestinal biopsies in a cryostat and captured onto Superfrost plus microscope slides (Fisher
Scientific, Pittsburgh, PA). The sections were fixed and acetylated, and then hybridized at 68°C
for 36 hours to the DCT1(IRE) probe (approximate concentration 100 ng/ml). Hybridized probe
was visualized using alkaline phosphatase-conjugated anti-DIG Fab fragments (Roche,
Indianapolis, IN) and 5-bromo-4-chloro-3-indolyl-phosphate/Nitro blue tetrazolium (BCIP/NBT)
substrate (Kierkegard and Perry Laboratories, Gaithersburg, MD). Sections were rinsed several
times in 100 mM Tris, 150 mM NaCl, 20 mM EDTA pH 9.5, and coverslipped with glycerol
gelatin (Sigma, St. Louis, MO). Control sections were incubated in an identical concentration of
the sense probe transcript.
Statistical and regression analyses were performed using the computer software Prism
(GraphPad Software, Inc., San Diego, CA). Linear regression was calculated by the least square
method, and “r2" and “p” values are shown in the graphs to indicate the significance of the linear
regression analyses. Significance was determined using the unpaired t-test method.
Rolfs et al 10/29/2001
9
RESULTS
We studied a total of 36 subjects (see Table 1 for details) of whom 27 were HFE normal,
(having neither the C282Y nor the H63D mutation; individuals with prefix WT [wild type], and
in the following called ‘controls’), and 9 of whom were homozygous for C282Y (i.e. have
classical HHC; individuals with prefix HHC). We divided the two groups further into 5 different
categories: Controls without liver disease (WT-LD), controls with iron deficiency anemia
without liver disease (WT-Fe), controls with liver disease (WT+LD) and HHC patients with or
without liver disease (HHC+/-LD). The reason for subdividing individuals with liver disease is
the observation that liver diseases can result in extensive iron accumulation. This division should
avoid mixing of two different effects influencing body iron homeostasis.
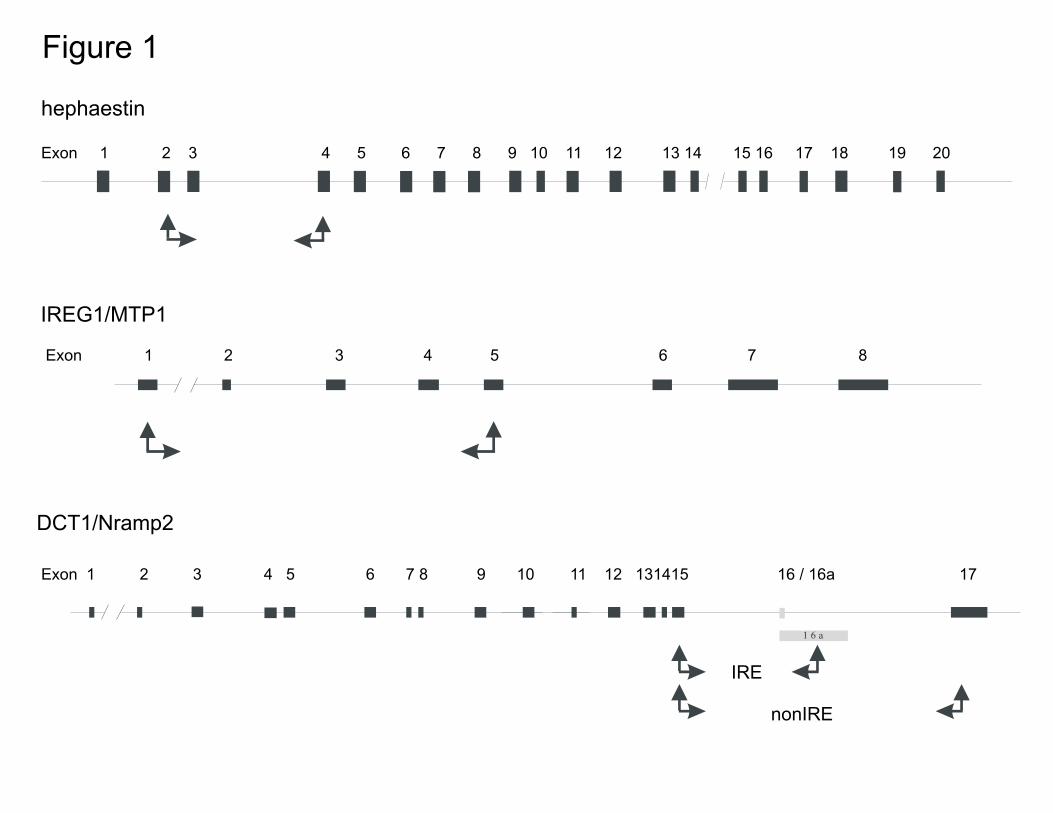
The genomic organizations of the human hephaestin and IREG1 genes were assembled
from sequences published by the human genome project. The primers for quantitative PCR of
DCT1, IREG1, and hephaestin were designed to amplify mRNA sequences spanning over at
least one intron, to rule out amplification of genomic DNA (Figure 1), which was excluded by
melting curve analysis using the Lightcycler software, and by agarose gel electrophoresis (not
shown).
As expected, subjects with iron deficiency anemia exhibited significantly lower mean
serum TfS values (p<0.0001) than controls (Figure 2a, WT-Fe). Furthermore, they had
significantly higher mean values for DCT1(IRE) mRNA expression (p=0.0078) than non-iron
deficient controls (WT-LD), with a mean value about 10 times higher for anemic subjects than
for subjects without anemia (Figure 2b). This increase was also detectable by in situ
hybridization analysis on sections of frozen intestinal biopsies (Figure 3). Between these two
groups no significant difference for DCT1(nonIRE) expression (Figure 2c) or hephaestin (not
shown) was observed. With respect to IREG1 mRNA expression, a modest, though statistically

Rolfs et al 10/29/2001
10
not significant, increase of expression in the group with anemia was observed in contrast to an
earlier publication (48). We failed to detect an effect of age or gender on DCT1 mRNA
expression in this study (data not shown). Control subjects with normal iron status exhibited a
scattering for both, DCT1(IRE) and DCT1(nonIRE) expression within roughly one order of
magnitude (after normalization to β-actin (Figure 2a), in agreement with an earlier publication
which measured the total DCT1 content (46). Normalized mean values for DCT1(IRE) were
about 10-fold higher than DCT1(nonIRE), a difference also observed for intestinal DCT1
expression in other mammals (Rolfs, Hediger, unpublished observations).
When we compared the control group (WT-LD) with the HHC-LD group (n=5, subjects
HHC35 to HHC39 in Table1), we not only observed significant differences in TfS (p=0.0001,
Figure 2a), with HHC-LD having about three times higher values, but we also saw a significantly
higher DCT1(IRE) expression in the HHC-LD group (p=0.013, Figure 2b). In addition,
expression of IREG1 in the HHC-LD group was increased compared with controls (p=0.04,
Figure 2d). No differences in DCT1(nonIRE) (Figure 2c) or hephaestin (not shown) mRNA
expression could be detected between these groups. The expression level of DCT1(IRE) (Figure
2b) in the HHC-LD group was the same as for the group with iron deficiency anemia (WT-Fe),
despite markedly different serum iron data (Table1, Figure 2a). This suggests that, in contrast to
iron deficiency anemia, in HFE C282Y+/+ homozygous patients, expression of IREG1 and
DCT1(IRE) are not correlated with or dependent upon serum iron values. This lack of correlation
may be due to the disturbance of iron homeostatic signaling in homozygous C282Y HFE
subjects, analogous to the recently described alterations of hepcidin in mice (28,33).
We failed to observe statistically significant differences for DCT1 (with or without IRE),
IREG1, or hephaestin mRNA expression between WT-LD and WT+LD. The number of liver
disease patients, or their diversity, might make it difficult to derive any conclusive data, since the
Rolfs et al 10/29/2001
11
etiology and stage of liver disease may influence expression of these genes. Indeed, in the
controls, expression levels of hephaestin mRNA were within one order of magnitude, regardless
of serum TfS or ferritin. In contrast, WT09, who has chronic hepatitis C (Table 1), had modestly
elevated hephaestin mRNA levels (not shown). The liver disease in this patient may have
influenced the expression of the hephaestin gene in an iron independent manner.
Among controls, we found inverse relationships of DCT1(IRE) mRNA expression and
serum TfS (Figure 4a; r2=0.49, p=0.016), serum ferritin (Figure 4b; r2=0.65, p=0.005), and blood
hemoglobin (Figure 4c; r2=0.46, p=0.015). Our data indicate that, in man, the IRE-containing
form of DCT1 mRNA is regulated in the same way in response to iron deprivation as in rat and
mouse (8, 19). We did not observe significant correlations among duodenal IREG1 (Figure 6a),
DCT1(nonIRE), or hephaestin mRNA expression and any of the blood data studied in the WT-
LD group.
With respect to patients with HHC without liver disease (HHC-LD) who, as already
described, exhibited high DCT1(IRE) mRNA expression despite elevated TfS values (Figure 2a
and b), no inverse relationship between DCT1(IRE) and serum ferritin or transferrin saturation
was detectable (Figure 5a, r2=0.26, p=0.4, and b, r2=0.67, p=0.08, respectively). For comparison,
linear regression lines of controls from Figure 4 are shown in Figure 5. When correlating with
blood hemoglobin we found an inverse linear relationship which did not differ significantly from
that of the WT-LD group (Figure 5c), presumably because hemoglobin synthesis is not affected
in HHC. In contrast to this, IREG1 mRNA expression and serum TfS exhibited a linear
relationship for the HHC-LD group (Figure 6b; r2=0.878, p=0.02, n=5), which was not paralleled
by a similar relationship in WT-LD subjects (Figure 6a). These findings demonstrate that the
correlation between serum iron levels and intestinal iron absorption is disturbed in HFE
C282Y+/+ homozygous patients.
Rolfs et al 10/29/2001
12
DISCUSSION
Numerous advances in iron metabolism have been made in the last 5 years, ushered in by
cloning and characterization of the HFE gene and its mutations in HHC. In addition, several
proteins responsible for the intestinal absorption of iron have been identified, including DCT1,
IREG1 and hephaestin. Relations among these transporters have not yet been the subject of in
depth analysis in humans. The data described here, revealing an inverse correlation between
DCT1(IRE) mRNA expression and serum transferrin saturation, serum ferritin, and blood
hemoglobin (Figures 4a to c), emphasize the relationship of iron absorption and body iron
homeostasis. The upregulation of DCT1 mRNA in iron deficiency is consistent with studies in
rats (19) and mice (16) kept on diets low in iron, although in our patients, blood loss rather than
iron-deficient diets, was the cause of iron deficiency. The increase in DCT1 mRNA levels is
most probably due to increased stability of the splice form of DCT1 which contains an IRE in its
3'UTR, since the other splice form without the IRE did not exhibit a similar regulation.
In contrast, in HFE C282Y+/+ homozygous patients an inverse relationship for
DCT1(IRE) and transferrin saturation was not observed, and, expression of DCT1(IRE) mRNA
was higher than anticipated by the serum transferrin saturation. HHC-LD patients, despite high
serum transferrin saturations, exhibit elevations of DCT1- IRE mRNA expression to the same
degree as controls with iron-deficient anemia. Moreover, duodenal DCT1(IRE) mRNA
expression in these individual seems less closely correlated to serum ferritin levels, since
untreated patients having similar serum ferritin levels (hh32 and hh33), had different serum
transferrin saturation (Table 1) and DCT1(IRE) expressions.
Our observations on HFE C282Y+/+ homozygous patients are in agreement with studies
of DCT1(IRE) regulation in homozygous mice with a gene disruption of HFE (16). More recent
studies (9,17, 40) suggest that HFE-regulated iron absorption involves additional, yet to be
Rolfs et al 10/29/2001
13
determined factors. In one study comparing normal and β2-microglobulin knock-out mice (9), no
significant difference in duodenal DCT1 protein amount was observed. In another recent report
of HFE knock-out mice (17) a strong influence of the genetic background on the level of iron
accumulation was observed in three different inbred mouse strains, suggesting that additional
heritable factors influence the phenotype, and might account for the differences in expression
and regulation of DCT1 reported from different laboratories (9,16, 40). It has also been reported
that, in the duodenums of HHC patients and in HFE knockout mice, IRP binding affinity is
increased, leading to increased TfR expression (2,32). These findings support the model of a
defect in iron sensing in crypt cells of the small intestine of HHC subjects, leading to
inappropriately high levels of expression of genes involved in iron metabolism and transport in
differentiating villus cells (37), as if these iron replete subjects had iron deficiency anemia.
However, how mutation or disruption of the HFE gene results in altered signaling that makes
maturing villus cells behave as if the body had iron-deficiency remains unknown. Recent results
in mice suggest that the oligopeptide hepcidin (also referred to as LEAP-1) may be a molecule
that reports the status of tissue (especially liver) iron stores to duodenal crypt cells (28,33). In
normal subjects, such signaling aids in appropriate regulation of mucosal uptake and transport of
iron by modulation of expression of DCT1(IRE) and IREG1. It is possible that patients with
HHC or mice with HFE gene disruption lack the ability to transduce the hepcidin signal to their
duodenal enterocytes. However, it is currently unknown whether the HFE/TfR complex interacts
with hepcidin, and whether such an interaction triggers a specific response in enterocytes and
macrophages.
With respect to the expression of IREG1 mRNA, our HHC-LD patients exhibited a
significant upregulation compared with controls, in agreement with recent findings (47,48).
IREG1 mRNA, which contains a 5'UTR IRE, may also be regulated at the transcriptional level
Rolfs et al 10/29/2001
14
(Figure 2d and 6a), as described for ferritin or the erythroid form of 5-aminolevulinate synthase
(20,25,34,39,41,42). It should be noted that the observed linear correlation for IREG1 with
serum transferrin saturation in HHC-LD occurs at a level of iron loading not normally seen in
healthy individuals. Further studies with a larger number of patients are required to investigate
the observed upregulation in hemochromatosis. In contrast, no iron-dependent regulation of the
hephaestin gene expression was observed.
It has been known for many years that iron overload occurs in liver cirrhosis, and recent
results indicate that the great majority of patients with end-stage chronic liver disease and iron
overload do not have HHC (i.e., are not C282Y +/+) (4,6). Although our data do not show
evidence for upregulation of intestinal iron transport in cirrhosis, this possibility cannot be ruled
out at this point, since none of our liver disease patients actually had iron overload, as shown by
liver biopsies (data not shown) and results in Table 1. Therefore, how and why patients with end-
stage liver disease develop iron overload remains to be elucidated. Additional studies in patients
with chronic liver diseases are currently in progress.
Rolfs et al 10/29/2001
15
ACKNOWLEDGMENTS
We thank the nursing and clinical staff of the University of Massachusetts Memorial
Gastrointestinal Endoscopy Unit for their help in performing duodenal mucosal biopsies and care
of patients studied.
Supported by grants RO1 DK 57782 to M.A.H., RO1 DK 38825 to H.L.B., and contract NO1
DK 92326 to H.L.B. from NIH, and by a grant from American College of Gastroenterology to
J.G.K & H.L.B.
Rolfs et al 10/29/2001
16
References
1. Abboud, S, and Haile, DJ. A novel mammalian iron-regulated protein involved in
intracellular iron metabolism. J Biol Chem 275: 19906-19912, 2000.
2. Bahram, S, Gilfillan, S, Kuhn, LC, Moret, R, Schulze, JB, Lebeau, A, and Schumann, K.
Experimental hemochromatosis due to MHC class I HFE deficiency: immune status and
iron metabolism. Proc Natl Acad Sci U S A 96: 13312-13317, 1999.
3. Bannerman, RM. Genetic defects of iron transport. Fed Proc 35: 2281-2285, 1976.
4. Bonkovsky HL, and Lambrecht, RW. Iron-induced liver injury. Clin Liver Dis 4: 409-429,
2000.
5. Bonkovsky, HL. Iron and the liver. Am J Med Sci 301: 32-43, 1991.
6. Bonkovsky, HL, and Obando, JV. Role of HFE gene mutations in liver diseases other than
hereditary hemochromatosis. Curr Gastroenterol Rep 1: 30-37, 1999.
7. Byrnes, V, Ryan, E, O'Keane, C, and Crowe, J. Immunohistochemistry of the Hfe protein
in patients with hereditary hemochromatosis, iron deficiency anemia, and normal controls.
Blood Cells Mol Dis 26: 2-8, 2000.
8. Canonne-Hergaux, F, Gruenheid, S, Ponka, P, and Gros, P. Cellular and subcellular
localization of the Nramp2 iron transporter in the intestinal brush border and regulation by
dietary iron. Blood 93: 4406-4417, 1999.
9. Canonne-Hergaux, F, Levy, JE, Fleming, MD, Montross, LK, Andrews, NC, and Gros, P.
Expression of the DMT1 (NRAMP2/DCT1) iron transporter in mice with genetic iron
overload disorders. Blood 97: 1138-1140, 2001.
10. Conrad, ME, Weintraub, LR, and Crosby, WH. The role of the intestine in iron kinetics. J
Clin Invest 43: 963-974, 1964.
Rolfs et al 10/29/2001
17
11. Donovan, A, Brownlie, A, Zhou, Y, Shepard, J, Pratt, SJ, Moynihan, J, Paw, BH, Drejer,
A, Barut, B, Zapata, A, Law, TC, Brugnara, C, Lux, SE, Pinkus, GS, Pinkus, JL, Kingsley,
PD, Palis, J, Fleming, MD, Andrews, NC, and Zon, LI. Positional cloning of zebrafish
ferroportin1 identifies a conserved vertebrate iron exporter. Nature 403: 776-781, 2000.
12. Feder, JN, Gnirke, A, Thomas, W, Tsuchihashi, Z, Ruddy, DA, Basava, A, Dormishian, F,
Domingo, R Jr., Ellis, MC, Fullan, A, Hinton, LM, Jones, NL, Kimmel, BE, Kronmal, GS,
Lauer, P, Lee, VK, Loeb, DB, Mapa, FA, McClelland, E, Meyer, NC, Mintier, GA,
Moeller, N, Moore, T, Morikang, E, Prass, E, Quintana, L, Starnes, S, Schatzman, R,
Brunke, K, Drayna, D, Risch, N, Bacon, B, and Wolff, RK. A novel MHC class I-like gene
is mutated in patients with hereditary haemochromatosis. Nat Genet 13: 399-408, 1996.
13. Feder, JN, Penny, DM, Irrinki, A, Lee, VK, Lebron, JA, Watson, N, Tsuchihashi, Z, Sigal,
E, Bjorkman, PJ, and Schatzman, RC. The hemochromatosis gene product complexes with
the transferrin receptor and lowers its affinity for ligand binding. Proc Natl Acad Sci U S A
95: 1472-1477, 1998.
14. Feder, JN. The hereditary hemochromatosis gene (HFE): a MHC class I-like gene that
functions in the regulation of iron homeostasis. Immunol Res 20: 175-185, 1999.
15. Fleming, MD, Trenor, CC, Su, MA, Foernzler, D, Beier, DR, Dietrich, WF, and Andrews,
NC. Microcytic anaemia mice have a mutation in Nramp2, a candidate iron transporter
gene. Nat Genet 16: 383-386, 1997.
16. Fleming, RE, Migas, MC, Zhou, X, Jiang, J, Britton, RS, Brunt, EM, Tomatsu, S, Waheed,
A, Bacon, BR, and Sly, WS. Mechanism of increased iron absorption in murine model of
hereditary hemochromatosis: Increased duodenal expression of the iron transporter DMT1.
Proc Natl Acad Sci U S A 96: 3143-3148, 1999.
Rolfs et al 10/29/2001
18
17. Fleming, RE, Holden, CC, Tomatsu, S, Waheed, A, Brunt, EM, Britton, RS, Bacon, BR,
Roopenian, DC, and Sly, WS. Mouse strain differences determine severity of iron
accumulation in Hfe knockout model of hereditary hemochromatosis. Proc Natl Acad Sci
U S A 98: 2707-2711, 2001.
18. Green, R, Charlton, R, Seftel, H, Bothwell, T, Mayet, F, Adams, B, Finch, C, and Layrisse,
M. Body iron excretion in man: a collaborative study. Am J Med 45: 336-353, 1968.
19. Gunshin, H, Mackenzie, B, Berger, UV, Gunshin, Y, Romero, MF, Boron, WF,
Nussberger, S, Gollan, JL, and Hediger, MA. Cloning and characterization of a mammalian
proton-coupled metal-ion transporter. Nature 388: 482-488, 1997.
20. Hentze, MW, and Kuhn, LC. Molecular control of vertebrate iron metabolism: mRNA-
based regulatory circuits operated by iron, nitric oxide, and oxidative stress. Proc Natl
Acad Sci U S A 93: 8175-8182, 1996.
21. Lebron, JA, Bennett, MJ, Vaughn, DE, Chirino, AJ, Snow, PM, Mintier, GA, Feder, JN,
and Bjorkman, PJ. Crystal structure of the hemochromatosis protein HFE and
characterization of its interaction with transferrin receptor. Cell 93: 111-123, 1998.
22. Lebron, JA, West, AP Jr., and Bjorkman, PJ. The hemochromatosis protein HFE competes
with transferrin for binding to the transferrin receptor. J Mol Biol 294: 239-245, 1999.
23. Lee, PL, Gelbart, T, West, C, Halloran, C, and Beutler, E. The human Nramp2 gene -
Characterization of the gene structure, alternative splicing, promoter region and
polymorphisms. Blood Cells Mol Dis 24: 199-215, 1998.
24. McKie, AT, Marciani, P, Rolfs, A, Brennan, K, Wehr, K, Barrow, D, Miret, S, Bomford,
A, Peters, TJ, Farzaneh, F, Hediger, MA, Hentze, MW, and Simpson, RJ. A novel
duodenal iron-regulated transporter, IREG1, implicated in the basolateral transfer of iron to
the circulation. Mol Cell 5: 299-309, 2000.

Rolfs et al 10/29/2001
19
25. Menotti, E, Henderson, BR, and Kuhn, LC. Translational regulation of mRNAs with
distinct IRE sequences by iron regulatory proteins 1 and 2. J Biol Chem 273: 1821-1824,
1998.
26. Montosi, G, Paglia, P, Garuti, C, Guzman, CA, Bastin, JM, Colombo, MP, and Pietrangelo,
A. Wild-type HFE protein normalizes transferrin iron accumulation in macrophages from
subjects with hereditary hemochromatosis. Blood 96: 1125-1129, 2000.
27. Nakajima-Iijima, S, Hamada, H, Reddy, P, and Kakunaga, T. Molecular structure of the
human cytoplasmic beta-actin gene: interspecies homology of sequences in the introns.
Proc Natl Acad Sci U S A 82: 6133-6137, 1985.
28. Nicolas, G, Bennoun, M, Devaux, I, Beaumont, C, Grandchamp, B, Kahn, A, and Vaulont,
S. Lack of hepcidin gene expression and severe tissue iron overload in upstream
stimulatory factor 2 (USF2) knockout mice. Proc Natl Acad Sci U S A 98: 8780-8785,
2001.
29. Njajou, OT, Vaessen, N, Joosse, M, Berghuis, B, van Dongen, JW, Breuning, MH,
Snijders, PJ, Rutten, WP, Sandkuijl, LA, Oostra, BA, van Duijn, CM, and Heutink, P. A
mutation in SLC11A3 is associated with autosomal dominant hemochromatosis. Nat Genet
28: 213-214, 2001.
30. Parkkila, S, Waheed, A, Britton, RS, Bacon, BR, Zhou, XY, Tomatsu, S, Fleming, RE, and
Sly, WS. Association of the transferrin receptor in human placenta with HFE, the protein
defective in hereditary hemochromatosis. Proc Natl Acad Sci U S A 94: 13198-13202,
1997.
31. Parkkila, S, Waheed, A, Britton, RS, Feder, JN, Tsuchihashi, Z, Schatzman, RC, Bacon,
BR, and Sly, WS. Immunohistochemistry of HLA-H, the protein defective in patients with

Rolfs et al 10/29/2001
20
hereditary hemochromatosis, reveals unique pattern of expression in gastrointestinal tract.
Proc Natl Acad Sci U S A 94: 2534-2539, 1997.
32. Pietrangelo, A, Casalgrandi, G, Quaglino, D, Gualdi, R, Conte, D, Milani, S, Montosi, G,
Cesarini, L, Ventura, E, and Cairo, G. Duodenal ferritin synthesis in genetic
hemochromatosis. Gastroenterology 108: 208-217, 1995.
33. Pigeon, C, Ilyin, G, Courselaud, B, Leroyer, P, Turlin, B, Brissot, P, and Loreal, O. A new
mouse liver-specific gene, encoding a protein homologous to human antimicrobial peptide
hepcidin, is overexpressed during iron overload. J Biol Chem 276: 7811-7819, 2001.
34. Richardson, DR, and Ponka, P. The molecular mechanisms of the metabolism and transport
of iron in normal and neoplastic cells. Biochim Biophys Acta 1331: 1-40, 1997.
35. Riedel, HD, Muckenthaler, MU, Gehrke, SG, Mohr, I, Brennan, K, Herrmann, T, Fitscher,
BA, Hentze, MW, and Stremmel, W. HFE downregulates iron uptake from transferrin and
induces iron- regulatory protein activity in stably transfected cells. Blood 94: 3915-3921,
1999.
36. Roetto, A, Totaro, A, Piperno, A, Piga, A, Longo, F, Garozzo, G, Cali, A, De Gobbi, M,
Gasparini, P, and Camaschella, C. New mutations inactivating transferrin receptor 2 in
hemochromatosis type 3. Blood 97: 2555-2560, 2001.
37. Rolfs, A, and Hediger, MA. Metal ion transporters in mammals: structure, function and
pathological implications. J Physiol 518: 1-12, 1999.
38. Roy, CN, Penny, DM, Feder, JN, and Enns, CA. The hereditary hemochromatosis protein,
HFE, specifically regulates transferrin-mediated iron uptake in HeLa cells. J Biol Chem
274: 9022-9028, 1999.
Rolfs et al 10/29/2001
21
39. Schumann, K, Moret, R, Kunzle, H, and Kuhn LC. Iron regulatory protein as an
endogenous sensor of iron in rat intestinal mucosa. Possible implications for the regulation
of iron absorption. Eur J Biochem 260: 362-372, 1999.
40. Sproule, TJ, Jazwinska, EC, Britton, RS, Bacon, BR, Fleming, RE, Sly, WS, and
Roopenian, DC. Naturally variant autosomal and sex-linked loci determine the severity of
iron overload in beta 2-microglobulin-deficient mice. Proc Natl Acad Sci U S A 98: 5170-
5174, 2001.
41. Theil, E. C., McKenzie, RA, and Sierzputowska-Gracz, H.. Structure and function of IREs,
the noncoding mRNA sequences regulating synthesis of ferritin, transferrin receptor and
(erythroid) 5-aminolevulinate synthase. Adv Exp Med Biol 356: 111-118, 1994.
42. Theil, EC. The iron responsive element (IRE) family of mRNA regulators. Regulation of
iron transport and uptake compared in animals, plants, and microorganisms. Met Ions Biol
Syst 35: 403-434, 1998.
43. Trinder, D, Oates, PS, Thomas, C, Sadleir, J, and Morgan, EH. Localisation of divalent
metal transporter 1 (DMT1) to the microvillus membrane of rat duodenal enterocytes in
iron deficiency, but to hepatocytes in iron overload. Gut 46: 270-276, 2000.
44. Vulpe, CD, Kuo, YM, Murphy, TL, Cowley, L, Askwith, C, Libina, N, Gitschier, J, and
Anderson, G J. Hephaestin, a ceruloplasmin homologue implicated in intestinal iron
transport, is defective in the sla mouse. Nat Genet 21: 195-199, 1999.
45. Waheed, A, Parkkila, S, Saarnio, J, Fleming, RE, Zhou, XY, Tomatsu, S, Britton, RS,
Bacon, BR, and Sly, WS. Association of HFE protein with transferrin receptor in crypt
enterocytes of human duodenum. Proc Natl Acad Sci U S A 96: 1579-1584, 1999.

Rolfs et al 10/29/2001
22
46. Wardrop, SL, and Richardson, DR. The effect of intracellular iron concentration and
nitrogen monoxide on Nramp2 expression and non-transferrin-bound iron uptake. Eur J
Biochem 263: 41-49, 1999.
47. Zoller, H, Pietrangelo, A, Vogel, W, and Weiss, G. Duodenal metal-transporter (DMT-1,
NRAMP-2) expression in patients with hereditary haemochromatosis. Lancet 353: 2120-
2123, 1999.
48. Zoller, H, Koch, RO, Theurl, I, Obrist, P, Pietrangelo, A, Montosi, G, Haile, DJ, Vogel, W,
and Weiss, G. Expression of the duodenal iron transporters divalent-metal transporter 1 and
ferroportin 1 in iron deficiency and iron overload. Gastroenterology 120: 1412-1419, 2001.
Rolfs et al 10/29/2001
23
Figure Legends
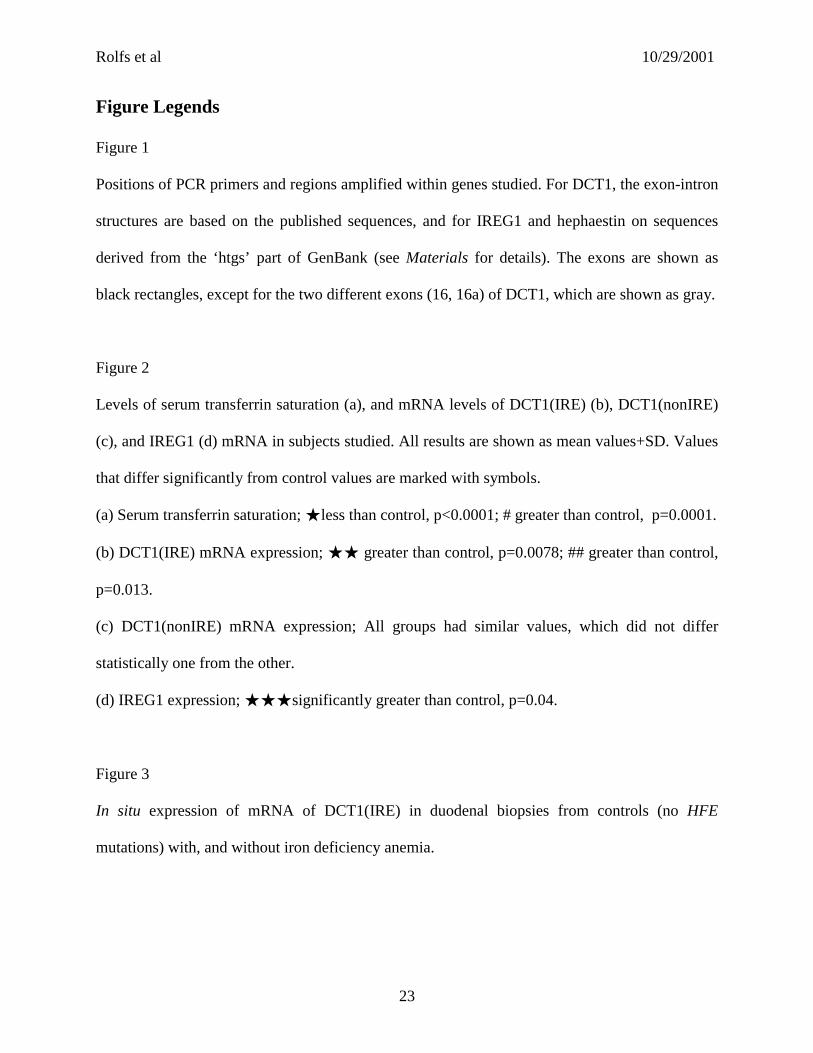
Figure 1
Positions of PCR primers and regions amplified within genes studied. For DCT1, the exon-intron
structures are based on the published sequences, and for IREG1 and hephaestin on sequences
derived from the ‘htgs’ part of GenBank (see Materials for details). The exons are shown as
black rectangles, except for the two different exons (16, 16a) of DCT1, which are shown as gray.
Figure 2
Levels of serum transferrin saturation (a), and mRNA levels of DCT1(IRE) (b), DCT1(nonIRE)
(c), and IREG1 (d) mRNA in subjects studied. All results are shown as mean values+SD. Values
that differ significantly from control values are marked with symbols.
(a) Serum transferrin saturation; øless than control, p<0.0001; # greater than control, p=0.0001.=
(b) DCT1(IRE) mRNA expression; øø greater than control, p=0.0078; ## greater than control,
p=0.013.
(c) DCT1(nonIRE) mRNA expression; All groups had similar values, which did not differ
statistically one from the other.
(d) IREG1 expression; øøøsignificantly greater than control, p=0.04.
Figure 3
In situ expression of mRNA of DCT1(IRE) in duodenal biopsies from controls (no HFE
mutations) with, and without iron deficiency anemia.
Rolfs et al 10/29/2001
24
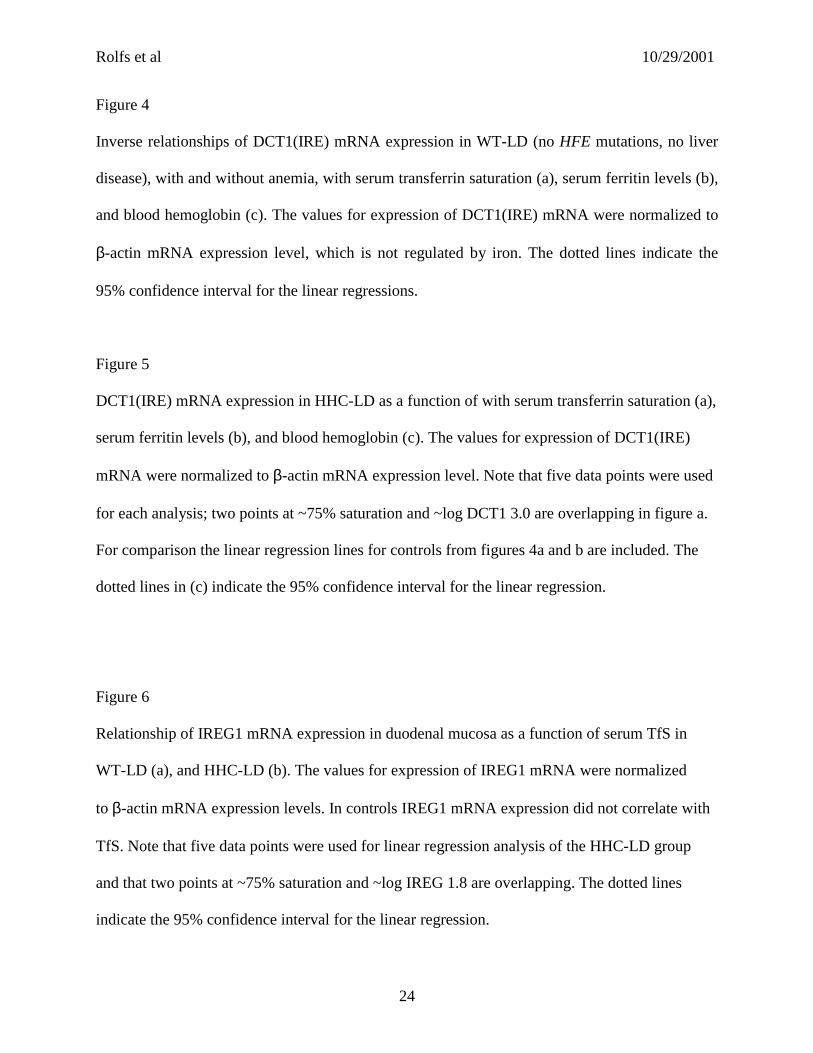
Figure 4
Inverse relationships of DCT1(IRE) mRNA expression in WT-LD (no HFE mutations, no liver
disease), with and without anemia, with serum transferrin saturation (a), serum ferritin levels (b),
and blood hemoglobin (c). The values for expression of DCT1(IRE) mRNA were normalized to
β-actin mRNA expression level, which is not regulated by iron. The dotted lines indicate the
95% confidence interval for the linear regressions.
Figure 5
DCT1(IRE) mRNA expression in HHC-LD as a function of with serum transferrin saturation (a),
serum ferritin levels (b), and blood hemoglobin (c). The values for expression of DCT1(IRE)
mRNA were normalized to β-actin mRNA expression level. Note that five data points were used
for each analysis; two points at ~75% saturation and ~log DCT1 3.0 are overlapping in figure a.
For comparison the linear regression lines for controls from figures 4a and b are included. The
dotted lines in (c) indicate the 95% confidence interval for the linear regression.
Figure 6
Relationship of IREG1 mRNA expression in duodenal mucosa as a function of serum TfS in
WT-LD (a), and HHC-LD (b). The values for expression of IREG1 mRNA were normalized
to=β-actin mRNA expression levels. In controls IREG1 mRNA expression did not correlate with
TfS. Note that five data points were used for linear regression analysis of the HHC-LD group
and that two points at ~75% saturation and ~log IREG 1.8 are overlapping. The dotted lines
indicate the 95% confidence interval for the linear regression.

Table 1: Selected demographic, laboratory, and clinical data on subjects studied
NAME AGE M/F Hgb MCV
TF
SAT’N Ferritin
HFE
genotype
Liver
Disease Major Diagnoses
(g/dl) (fl) (%) (ng/ml) C282Y H63D (Yes/No)
WT01 26 F 13.5 87 27 27 -/- -/- N GERD
WT02 49 M 13.2 83 23 865 -/- -/- N GERD, chronic anemia, chronic elevated ferritin
WT03 31 M 16 83 32 284 -/- -/- N Irritable bowel syndrome
WT04 47 M 11.6 93 28 286 -/- -/- Y CHC, cirrhosis, alcoholism, HCC
WT05 50 M 15 99 51 129 -/- -/- Y CHC, cirrhosis
WT06 50 F 9.9 67 6 4 -/- -/- N Iron deficiency anemia, ulcerative colitis
WT07 50 M 14.8 85 26 246 -/- -/- N GERD
WT08 61 M 9.1 78 12 11 -/- -/- Y Ulcerative colitis, colon cancer, iron deficiency anemia
WT09 51 M 12.6 80 12 9 -/- -/- N CHC, iron deficiency anemia
WT10 54 M 13.8 91 12 247 -/- -/- Y Lymphoma, anemia, cirrhosis
WT11 61 M 12.1 65 23 27 -/- -/- N CHC, thalassemia minor, iron-reduced
WT12 76 M 13.1 91 24 111 -/- -/- Y Alcoholic cirrhosis, diabetes, portal hypertension
WT13 81 F 9.1 83 5 8 -/- -/- Y Primary biliary cirrhosis, iron deficiency anemia
WT14 65 F 13.1 93 38 140 -/- -/- Y Cryptogenic cirrhosis, portal hypertension
WT15 63 F 12.4 91 22 N/A -/- -/- N GERD
WT16 42 F 11.4 84 19 58 -/- -/- Y sarcoidosis
WT17 49 M 14.7 92 49 123 -/- -/- Y CHC, cirrhosis,diabetes milletus
WT18 34 M 14.8 94 24 180 -/- -/- N GERD, esophagitis
WT19 80 F 11.1 88 N/A 336 -/- -/- N cholecystitis
WT20 46 M 14.3 89 35 120 -/- -/- Y CHC, cirrhosis
WT21 62 F 11.9 87 38 89 -/- -/- Y CHC, cirrhosis
WT22 59 F 13.4 89 23 33 -/- -/- Y severe NASH, CHC, cirrhosis
WT23 42 M 14.9 92 N/A N/A -/- -/- Y NASH, obesity, cirrhosis
WT24 46 M 15.8 91 N/A 342 -/- -/- Y CHC, obesity, cirrhosis

WT25 62 F 11.9 87 38 89 -/- -/- Y CHC, cirrhosis
WT26 49 F 13.3 94 21 81 -/- -/- Y alcoholic cirrhosis
WT27 50 F 12.1 95 31 133 -/- -/- N CHC
HHC31 29 M 11.4 78 10 21 +/+ -/- Y HHC*, cirrhosis, seizure disorder
HHC32 42 M 13.7 95 73 782 +/+ -/- Y HHC, CHC, alcoholism, drug abuse
HHC33 50 M 11.2 99 N/A 594 +/+ -/- Y HHC, CHC, cirrhosis, ulcerative colitis
HHC34 50 M 14.1 102 61 179 +/+ -/- Y HHC*, primary sclerosing cholangitis, cirrhosis
HHC35 27 F 13.2 97 43 24 +/+ -/- N HHC*, iron depleted not deficient, no liver disease
HHC36 51 M 15.1 97 79 75 +/+ -/- N HHC*, antral gastritis, undergoing phlebotomy
HHC37 52 M 12.3 97 80 789 +/+ -/- N HHC, GERD
HHC38 55 F 10.6 91 80 8 +/+ -/- N *HHC
HHC39 58 M 11.6 102 101 1692 +/+ -/- N HHC
Ref. Range - -
F:12-16
82-101 20-50
F:12-150 -/- -/- N
M:14-18 M:12-
250 * Fully treated by therapeutic phlebotomy; no iron overload present at the time of the study. Abbreviations used: CHC, chronic hepatitis C; ESLD, end stage liver disease; GERD, gastro-esophageal reflux disease; HCC, hepatocellular carcinoma; HHC, hereditary hemochromatosis N/A, not available
hephaestin
IREG1/MTP1
DCT1/Nramp2
Exon 1 2 3 4 5 6 7 8
Exon 1 2 3 4 5 6 7 8 9 10 11 12 131415 16 / 16a 17
Exon 1 2 3 4 5 6 7 8 9 10 11 12 13 14 15 16 17 18 19 20
1 6 a
IRE
nonIRE
Figure 1
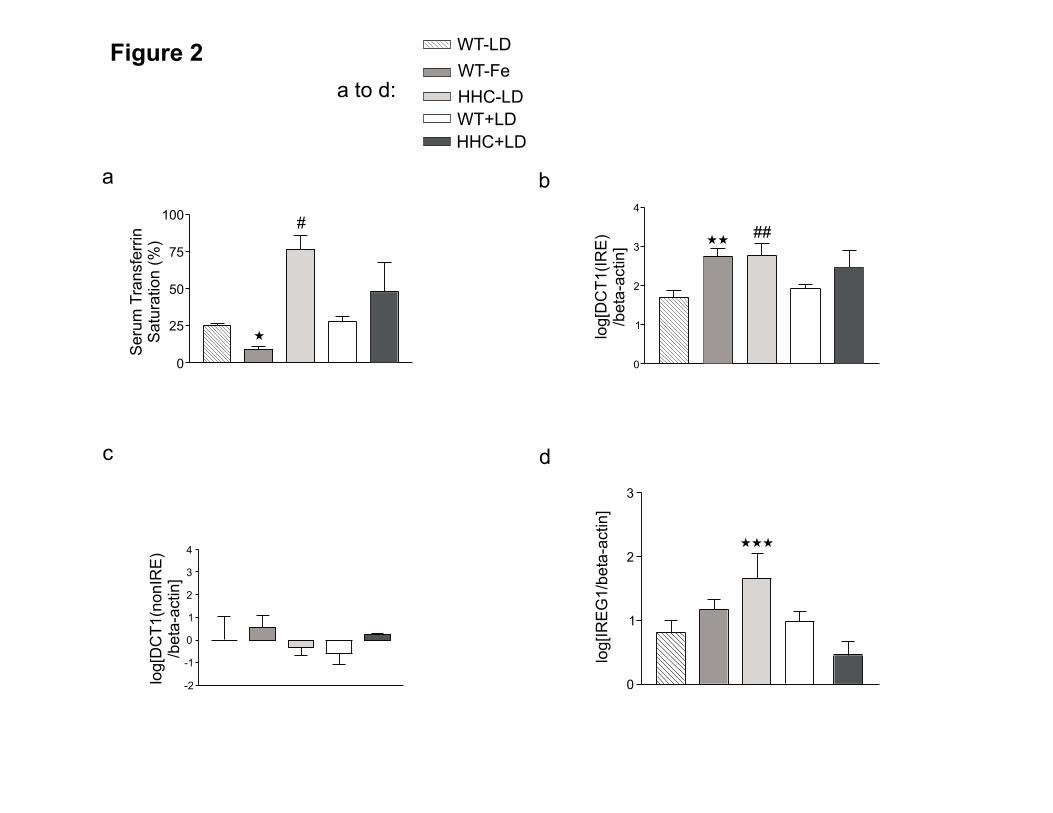
Figure 2 WT-LD
WT-Fe
HHC+LD
WT+LD
HHC-LDa to d:
a
Seru
mT
ransfe
rrin
Satu
ration
(%)
100
75
50
25
0
�
#
b
log[D
CT
1(I
RE
)/b
eta
-actin]
4
3
2
1
0
��##
log[D
CT
1(n
onIR
E)
/beta
-actin]
4
3
2
1
0
-1
-2
c d
log[IR
EG
1/b
eta
-actin]
3
2
1
0
���
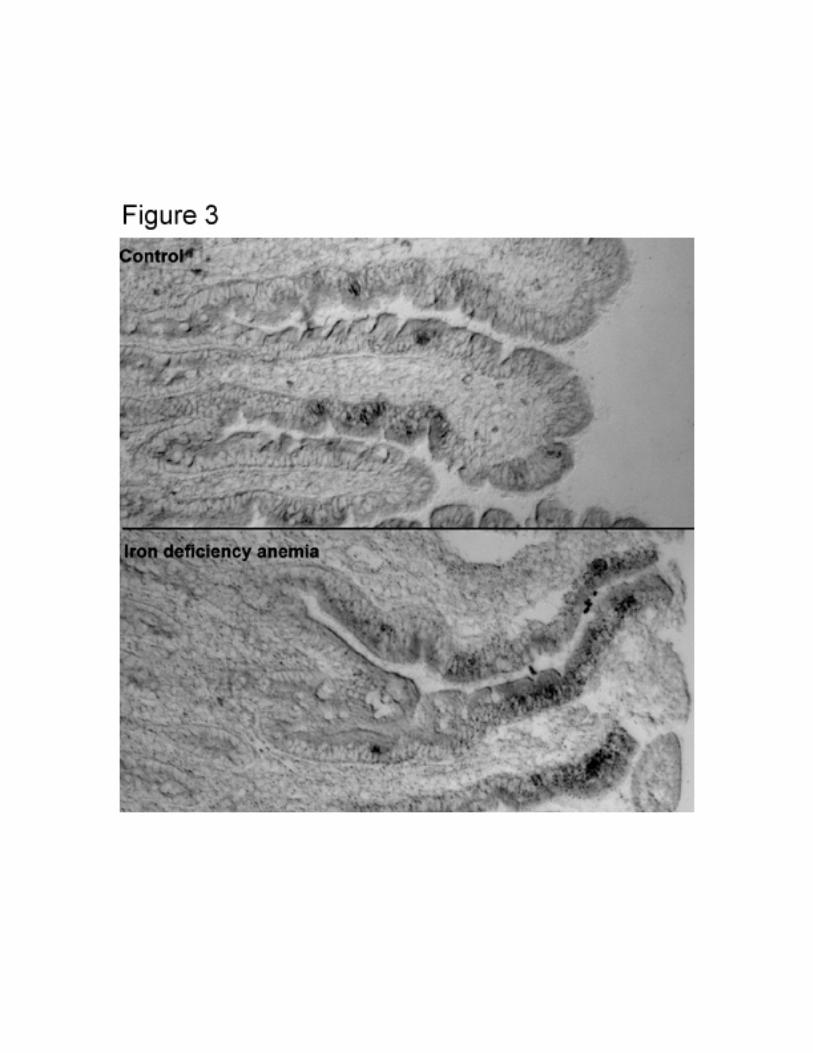
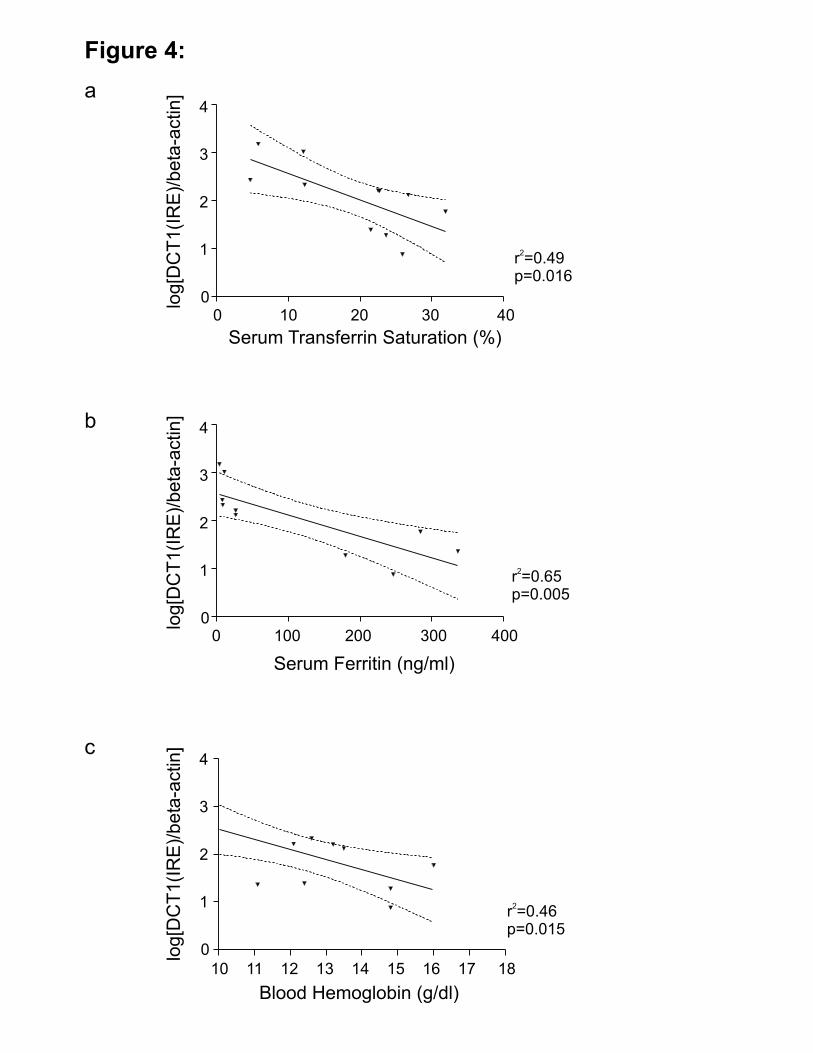
Figure 4:
b
log[D
CT
1(I
RE
)/beta
-actin]
4
3
2
1
0
r =0.65p=0.005
2
0 100 200 300 400
Serum Ferritin (ng/ml)
a
r =0.49p=0.016
2
Serum Transferrin Saturation (%)
0 10 20 30 40
log[D
CT
1(I
RE
)/beta
-actin]
4
3
2
1
0
c
log[D
CT
1(I
RE
)/beta
-actin]
4
3
2
1
0
r =0.46p=0.015
2
Blood Hemoglobin (g/dl)
10 11 12 13 14 15 16 17 18

Figure 5
a
Serum Transferrin Saturation (%)
0 25 50 75 100 125
log[D
C1(I
RE
)/beta
-actin] 5
4
3
2
1
0
c
Blood Hemoglobin (g/dl)
10 11 12 13 14 15 16 17
log[D
CT
1(I
RE
)/beta
-actin]
5
3
2
1
0
4
r =0.55p=0.15
2
5
4
3
2
1
0log[D
C1(I
RE
)/beta
-actin]
0 500 1000 1500 2000
Serum Ferritin (ng/ml)
b

Figure 6
Serum Transferrin Saturation (%)
0 25 50 75 100 125
log[IR
EG
1/b
eta
-actin] 4
3
2
1
0
-1
a
b
r =0.878p=0.019
2
Serum Transferrin Saturation (%)
0 25 50 75 100 125
log[IR
EG
1/b
eta
-actin] 4
3
2
1
0
-1