Intertidal community responses to field-based experimental warming
11
EV-1 Intertidal community responses to field-based experimental warming Rebecca L. Kordas, Steve Dudgeon, Stefan Storey and Christopher D. G. Harley R. L. Kordas ( orcid.org/0000-0002-9121-3452 )([email protected]), S. Storey and C. D.G. Harley, Univ. of British Columbia, 6270 University Blvd, Vancouver, BC, V6T1Z4, Canada. RLK also at: Imperial College London, Silwood Park Campus, Buckhurst Rd, Ascot, SL5 7PY, UK. – S. Dudgeon, California State Univ., 18111 Nordhoff Street, Northridge, CA 91330, USA. As the climate warms, there is little doubt that ecosystems of the future will look different from those we see today. However, community responses to warming in the field are poorly understood. We examined the effects of field-based warming on intertidal communities in the Salish Sea, which is a regional thermal ‘hot spot’ and therefore a model system for studying thermally stressed communities. We manipulated temperature at three tidal heights by deploying black- and white-bordered settlement plates. Black plates increased in situ substratum temperature by an average of 2.6 °C (maximum temperature, 40.9 °C). Barnacles fared poorly on black plates in all zones. When overall thermal stress was highest (summer in the high intertidal zone) herbivores were absent. In lower tidal zones, herbivores were abundant on white plates but were scarce on black plates. e total percent cover of algae was unaffected by the temperature treatment, despite the fact that macroalgae were expected to be the least thermally tolerant functional group. However, we did find that ephemeral green algae exhibited a delay in phenology on black plates. We also found that species richness declined and invertebrate assem- blage structure was altered due to warming. Results from this year long experiment suggest that communities in thermally stressful habitats respond to warming via the interplay between species-specific thermal responses and secondary adaptive strategies such as behavioral microhabitat selection. Declines in diversity and changes in the invertebrate assemblage were due to the decline of local thermally-stressed species and the lack of replacement by warm-adapted species. Given the low variation in the species pool along the northeast Pacific coastline, the arrival of warm-adapted species to the Salish Sea may not occur over relevant time scales, leaving local communities depauperate. e earth’s climate is changing, with models predicting an average 1.0–3.7 °C rise in global surface temperature by the end of the century (IPCC 2013). is warming will take the form of both increasing mean temperatures and increas- ing frequency and severity of thermal extremes (Trenberth 2012, IPCC 2013). Ongoing consequences of anthropo- genic warming have been ubiquitously observed in a variety of systems and taxa (Parmesan and Yohe 2003, Pinsky et al. 2013). emes are emerging at the species and population level, including poleward shifts in species distributions and changes in the seasonal timing of life history stages, and demographic shifts towards smaller sized individuals (Parmesan and Yohe 2003). However, much is still unknown about the responses of whole communities given the expected reshuffling of assemblages and changing interactions (Lurgi et al. 2012). Our ability to predict responses to altered climatic patterns relies on a coherent understanding of how warming affects all levels of organization; from individ- ual-to biome-level processes. Community level predictions are particularly challenging due to individualistic species responses to abiotic and biotic changes. In addition, species respond to temperature differ- ently when interacting with other species (Davis et al. 2002). For example, abiotic stress may remove otherwise domi- nant competitors, allowing subordinate species to persist (Poloczanska et al. 2008) or shift negative relationships to positive ones (Leonard 2000). Because the direct effects of climatic warming can vary in sign and magnitude among interacting taxa, indirect effects mediated by shifts in inter- specific relationships may be common. Resolving the ways in which the myriad of idiosyncratic species responses will drive these indirect effects and changes in community-level patterns remains one of the greatest challenges in climate change ecology. One approach is to quantify species responses to experi- mental warming within a community framework, in situ. Since direct and indirect species interactions can modify how taxa respond to warming (Davis et al. 2002), multi- species studies can provide a more accurate and holistic representation of community responses because they capture direct and indirect responses. Further, more accurate climate predictions can be made by relying on a combination of observational studies, lab and mesocosm experiments, and in situ field experiments (Wernberg et al. 2012a, Stewart et al. 2013). Field manipulations can mimic projected abiotic stress, have appropriate controls, and a realistic species pool (a combination of qualities not possible in other experimen- tal methods), providing a crucial experimental link between © 2014 e Authors. Oikos © 2014 Nordic Society Oikos Subject Editor: Peter Todd. Editor-in-Chief: Dries Bonte. Accepted 2 October 2014 Oikos 000: 001–011, 2014 doi: 10.1111/oik.00806
Transcript of Intertidal community responses to field-based experimental warming

EV-1
Intertidal community responses to fi eld-based experimental warming
Rebecca L. Kordas , Steve Dudgeon , Stefan Storey and Christopher D. G. Harley
R. L. Kordas ( � orcid.org/0000 - 0002-9121-3452 � )([email protected]), S. Storey and C. D.G. Harley, Univ. of British Columbia, 6270 University Blvd, Vancouver, BC, V6T1Z4, Canada. RLK also at: Imperial College London, Silwood Park Campus, Buckhurst Rd, Ascot, SL5 7PY, UK. – S. Dudgeon, California State Univ., 18111 Nordhoff Street, Northridge, CA 91330, USA.
As the climate warms, there is little doubt that ecosystems of the future will look diff erent from those we see today. However, community responses to warming in the fi eld are poorly understood. We examined the eff ects of fi eld-based warming on intertidal communities in the Salish Sea, which is a regional thermal ‘ hot spot ’ and therefore a model system for studying thermally stressed communities. We manipulated temperature at three tidal heights by deploying black- and white-bordered settlement plates. Black plates increased in situ substratum temperature by an average of 2.6 ° C (maximum temperature, 40.9 ° C). Barnacles fared poorly on black plates in all zones. When overall thermal stress was highest (summer in the high intertidal zone) herbivores were absent. In lower tidal zones, herbivores were abundant on white plates but were scarce on black plates. Th e total percent cover of algae was unaff ected by the temperature treatment, despite the fact that macroalgae were expected to be the least thermally tolerant functional group. However, we did fi nd that ephemeral green algae exhibited a delay in phenology on black plates. We also found that species richness declined and invertebrate assem-blage structure was altered due to warming. Results from this year long experiment suggest that communities in thermally stressful habitats respond to warming via the interplay between species-specifi c thermal responses and secondary adaptive strategies such as behavioral microhabitat selection. Declines in diversity and changes in the invertebrate assemblage were due to the decline of local thermally-stressed species and the lack of replacement by warm-adapted species. Given the low variation in the species pool along the northeast Pacifi c coastline, the arrival of warm-adapted species to the Salish Sea may not occur over relevant time scales, leaving local communities depauperate.
Th e earth ’ s climate is changing, with models predicting an average 1.0 – 3.7 ° C rise in global surface temperature by the end of the century (IPCC 2013). Th is warming will take the form of both increasing mean temperatures and increas-ing frequency and severity of thermal extremes (Trenberth 2012, IPCC 2013). Ongoing consequences of anthropo-genic warming have been ubiquitously observed in a variety of systems and taxa (Parmesan and Yohe 2003, Pinsky et al. 2013). Th emes are emerging at the species and population level, including poleward shifts in species distributions and changes in the seasonal timing of life history stages, and demographic shifts towards smaller sized individuals (Parmesan and Yohe 2003). However, much is still unknown about the responses of whole communities given the expected reshuffl ing of assemblages and changing interactions (Lurgi et al. 2012). Our ability to predict responses to altered climatic patterns relies on a coherent understanding of how warming aff ects all levels of organization; from individ-ual-to biome-level processes.
Community level predictions are particularly challenging due to individualistic species responses to abiotic and biotic changes. In addition, species respond to temperature diff er-ently when interacting with other species (Davis et al. 2002). For example, abiotic stress may remove otherwise domi-
nant competitors, allowing subordinate species to persist (Poloczanska et al. 2008) or shift negative relationships to positive ones (Leonard 2000). Because the direct eff ects of climatic warming can vary in sign and magnitude among interacting taxa, indirect eff ects mediated by shifts in inter-specifi c relationships may be common. Resolving the ways in which the myriad of idiosyncratic species responses will drive these indirect eff ects and changes in community-level patterns remains one of the greatest challenges in climate change ecology.
One approach is to quantify species responses to experi-mental warming within a community framework, in situ. Since direct and indirect species interactions can modify how taxa respond to warming (Davis et al. 2002), multi-species studies can provide a more accurate and holistic representation of community responses because they capture direct and indirect responses. Further, more accurate climate predictions can be made by relying on a combination of observational studies, lab and mesocosm experiments, and in situ fi eld experiments (Wernberg et al. 2012a, Stewart et al. 2013). Field manipulations can mimic projected abiotic stress, have appropriate controls, and a realistic species pool (a combination of qualities not possible in other experimen-tal methods), providing a crucial experimental link between
© 2014 Th e Authors. Oikos © 2014 Nordic Society Oikos Subject Editor: Peter Todd. Editor-in-Chief: Dries Bonte. Accepted 2 October 2014
Oikos 000: 001–011, 2014 doi: 10.1111/oik.00806

EV-2
observational and laboratory studies. Nonetheless, compared to other methods, fi eld experiments are lacking in climate change ecology.
Th e scarcity of fi eld experiments is particularly noticeable in marine environments, where documentation of climate change impacts lags behind that of terrestrial environments (Richardson and Poloczanska 2008). Th e ratio of experimen-tal to observational studies is quite low due to the logistical diffi culties inherent in manipulating temperature in marine systems (Wernberg et al. 2012a). Nevertheless, a limited number of opportunistic studies have shown that commu-nity composition changes with warming in the fi eld (Schiel et al. 2004, Wernberg et al. 2012b).
Intertidal systems have become a popular laboratory for climate change ecology, and represent a tractable system for in situ warming studies. Some key organisms in the inter-tidal already live at or near their thermal limits (Hofmann and Somero 1995, Davenport and Davenport 2005) and recent episodes of warming have resulted in stress, mortal-ity, and range shifts (Southward et al. 1995, Harley 2011). Th us, the intertidal may serve as ‘ an early warning system ’ for the impacts of climate warming (Helmuth et al. 2006). Although laboratory-based estimates of thermal tolerance are available for several intertidal taxa, allowing for some basic predictions to be made, the eff ect of intertidal warming at the community level is poorly understood.
In this study, we used passively warmed settlement plates in situ to test the eff ects of warming on intertidal com-munities. Intertidal seaweeds exhibit visible damage when exposed to unusually hot temperatures, such as when trans-planted higher on shore (Harley 2003) and during heat waves (Underwood 1980). Similarly, intertidal invertebrate populations experience mass mortality events when extreme environmental heat causes body temperatures to exceed ther-mal tolerances (Harley 2008). Th us, we expected that aerial warming during low tide would be detrimental to intertidal algae and invertebrates because some already reach stressful body temperatures when exposed (Hofmann and Somero 1995).
Interspecifi c diff erences provide one possible start-ing point for predicting temperature-driven changes in assemblage structure (Helmuth et al. 2005), and in our intertidal system we used existing information regard-ing variation in thermal limits among taxa to make several predictions. Upper thermal limits for Pacifi c barnacle spe-cies (44 – 46 ° C in air) exceed those of Pacifi c limpet species (34 – 39 ° C in water, 39 – 44 ° C in air; Supplementary material Appendix 1 Table A1). Th e upper thermal limits for species of prostrate (i.e. fl at) intertidal macroalgae in the northeast Pacifi c are considerably lower (23 – 33 ° C), though have only been measured in water (Supplementary material Appendix 1 Table A2). Little is known about the thermal tolerances of these species in air, however there is some evidence that algal thermal limits may be slightly higher in air than water (5 ° C higher for Mastocarpus papillatus ; Bell 1995). During emersion, we expected algae to be physiologically sensitive to localized warming, which would reduce abundance. In this case, mobile grazer density would also decrease because their food source would be limiting. However, if mobile grazers avoided warm treatments and released palatable algae from herbivory, algal abundance could increase. We also expected
that thermal stress would reduce barnacle populations, however, we expected the eff ect to be milder compared to other taxa because their thermal limits are higher. Overall, we predicted that warming would reduce species richness by eliminating thermally sensitive species and shift species composition away from food webs based on in situ benthic production (algae, limpets) and towards thermally tolerant species that do not rely on local benthic primary productiv-ity (e.g. barnacles).
Material and methods
Study system
Th is experiment was conducted on the southeast shore of Salt Spring Island, one of the southern Gulf Islands in British Columbia, Canada (48 ° 75 ′ 3 ′ ′ N, 123 ° 38 ′ 8 ′ ′ W). Tides around the Gulf Islands are mixed semidiurnal with a maximum tidal amplitude of 3.9 m during the experimental period. Daytime lower low tides occur only during summer months (March – August) and coincide with the hottest por-tion of the day (10 a.m. – 3 p.m.). In addition, the Gulf Islands are protected from both oceanic swell and wind waves by Vancouver Island (a large barrier island directly west of the island chain; Demes et al. 2012), and fall within the rain shadow of Vancouver Island mountains. Th e archi-pelago that includes the Gulf Islands (Canada) and San Juan Islands (USA) is considered a ‘ hot spot ’ for stressful inter-tidal temperatures relative to the outer west coast (Helmuth et al. 2002). Th ese conditions make Salt Spring Island an ideal location for the study of thermal stress on intertidal communities.
Experimental warming treatment
We used black and white bordered settlement plates that would passively heat the substratum without changing irradiance (e.g. by shading) to alter the temperature of a surface conductively connected to intertidal organisms (see Supplementary material Appendix 2 for further informa-tion regarding the rationale for substratum warming). Due to diff erences in absorption, the warmed (black) treatment attained higher temperatures during daytime low tides. We installed black and white settlement plates at each of three tidal heights (1.1 m, 1.6 m, 2.6 m above chart datum) in the rocky intertidal. Th e Canadian chart datum is calculated using the lowest astronomical (uninfl uenced by weather) tide approximated by the Canadian Hydrographic Service. Settlement plates (Fig. 1) were made of black or white high-density polyethylene (HDPE) ‘ puckboard ’ . Each HDPE plate was 15.25 � 15.25 cm with a centered 6.9 � 6.9 cm area of white textured epoxy (see Supplementary material Appendix 2 for further details of the design). Unlike previ-ous settlement plate designs, we used the same material on all plates for the central settlement area because diff erences in chemical composition and substratum color infl uence recruitment independent of thermal diff erences (Swain et al. 2006, Finlay et al. 2008).
Settlement surface temperature was estimated using iButton temperature loggers (resolution � 0.5 ° C), placed in

EV-3
Sea Goin’® Poxy Putty
iButton
HDPE plastic
1 cm
Figure 1. Passive solar heated plate design. Th e top plate was either black or white HDPE with a central area of textured Sea Goin ’ Poxy Putty where organisms settled. A hole in the underside of the top plate allowed for a recessed iButton to directly measure epoxy tem-perature. Th e bottom plate was bolted to the rocky bench. See Supplementary material Appendix 2 for details of plate construction.
a central recessed hole located under the epoxy surface, such that the sensor side of the logger was in direct contact with the epoxy. Loggers recorded the temperature once every 60 min. Th e temperature of the surrounding rocky bench was monitored using iButtons embedded in Z-Spar in each zone (n � 3), interspersed among plates. All plates were installed on a gently sloping (0 – 20 ° ) southeast facing bench, although the high zone plates were on average slightly more horizon-tal than the rest due to topographic constraints at the site (Supplementary material Appendix 3 Table A3).
Within each of three zones, seven plates of each color were affi xed to the rocky bench in an irregularly alternat-ing sequence, spaced 15 – 30 cm apart. Plates were installed between 12 and 30 April 2009 and monitored at two-week intervals during summer months (May – September) and approximately every three months during winter (September, November, March). At each census date, den-sities of invertebrates and percent cover of all algal species on the epoxy surfaces were estimated. Understory algal cover was estimated by moving the canopy layers aside, thus algal estimates sometimes exceeded 100% cover. Barnacles were subsampled (31% of epoxy area counted) on plates. A 3 mm area at the edge of the epoxy was excluded from counts to avoid edge eff ects, as some organisms were observed to prefer the topographic heterogeneity provided by the raised epoxy edge. Th e black and white puckboard plate borders were also scrubbed clean of any diatoms and macroalgae at every sampling date to maintain temperature treatments.
Statistical analyses
Average daily maximum temperature was calculated for each plate and used in analyses. Due to logger failure, few individual plates had complete temperature records for the duration of the experiment, which could bias thermal com-parisons among plates due to diff erences in the time periods over which temperatures were recorded. Th us, we calculated the residual for each plate on each sampling date from the
grand mean, across plates on the same sampling date. Th e average residual across dates for each plate was then calcu-lated, and used in an analysis of variance (ANOVA) with plate as the level of replication, to determine if temperature varied among plate colors or shore levels.
Alpha diversity and the abundances of barnacles, macroalgae and grazing gastropods in response to tidal eleva-tion and the temperature manipulation were analyzed as a repeated measures design using linear mixed eff ect models (SAS Inst.). Th e design consisted of a fi xed eff ects model of temperature crossed with tidal zone and each of those factors crossed with date, the repeated measure. We used the Akaike information criteria (AIC) to infer the best sup-ported model(s) of the various main eff ects and interactions. For most responses, we tested 18 diff erent models, although the analysis for total algae encompassed 36 diff erent models, because each of the 18 models were tested with and without the inclusion of grazer density as a covariate.
Model parameters were fi tted using restricted maximum likelihood (REML) estimation. Examination of the variance-covariance matrix among repeated observations indicated that modeling repeated observations using an unstructured covariance matrix was appropriate. We used the Box – Cox transformation procedure to identify the best transformation to improve normality. Th e data for some variables remained leptokurtotic after transformation because of many zeros in a data set. To normalize those data, we added random noise to the data set by adding a value to each observation drawn randomly from a normal distribution with a mean equal to 0.1% of the maximum value of the variable observed in the data and a correspondingly small standard deviation so that all values of variates remained greater than zero. Th is pro-cedure has no eff ect on the relative order of variates among groups, it only introduces normally distributed errors within groups to meet assumptions of the test and so is a conserva-tive approach (P. Petraitis pers. comm.).
To test our hypothesis that community structure would be aff ected by temperature treatment, we analyzed the assemblage structure of the community with multivariate statistics (Clarke and Warwick 2001). We used community data from the 15 August 2009 sampling date because it is the latest date before loss of replicates became prevalent. Percent cover of algae and invertebrate density were analyzed sepa-rately because diff erent types of data cannot be combined. We square root transformed invertebrate density prior to applying the Bray – Curtis similarity coeffi cient to construct the resemblance matrix, to down weight similarity between blank or sparsely settled plates. Total algae percent cover was fi rst log (x � 1) transformed to down weight contributions of quantitatively dominant species (Clarke and Warwick 2001), before constructing an MDS plot using Euclidean distance. Permutational multivariate analysis of variance (PERMANOVA) was used to examine variation in commu-nity assemblage between temperature treatments and zones. When signifi cant results were detected, a SIMPER analysis was conducted to determine the principal contributors to dissimilarity in community composition.
Finally, to determine if the community living on top of the plates was infl uenced by mobile consumers sheltering under the plates, we quantifi ed grazers and predators under plates during two census dates: July and September 2009

EV-4
(detailed methods in Supplementary material Appendix 4). Data are expressed in means � SE where applicable.
Results
Temperature
Temperature diff erences between treatments only existed during daytime low tides in the summer and not in win-ter when low tides were at night (Kordas 2014). Subsequent experiments using the same method at the same location confi rmed the similarity of treatment temperatures over winter months. Th us, summer temperatures drove the dif-ferences on plates. Th e temporal variation in average daily maximum (ADM) temperature tracked the fortnightly tidal cycle in the low and mid zones, where plates remained completely submerged or minimally exposed for consecu-tive days during neap tide series (Supplementary material Appendix 3 Fig. A2). Plates in the high zone were rarely submerged for more than several hours per day (except dur-ing extreme spring tides), hence had consistently high plate temperatures. Temperature was low (8 – 15 ° C) and similar across diff erent colored plates during high tides (Fig. 2a). During daytime low tides, plates and the rock warmed by more than 20 ° C and black and white plates diverged (Fig. 2a, Supplementary material Appendix 2 Fig. A2). Th e temperature of white plates very closely approximated that of the surrounding bedrock (Fig. 2). ADM temperatures
0
2
4
6
8
10
12
05
10152025303540
(a)
(b)
0:00
6:00
12:0
0
18:0
0
0:00
6:00
12:0
0
18:0
0
0:00
6:00
12:0
0
18:0
0
0:00
6:00
12:0
0
18:0
0
0:00
6:00
12:0
0
18:0
0
0:00
Aug 19 Aug 20 Aug 21 Aug 22 Aug 23
tideairrock
coolwarm
Tide height (m)
–8
–4
0
4
8 WarmCoolRock
c
a
b b
d d,e e,f f,g g
Res
idua
l mea
n da
ilym
ax te
mp
(°C
)
Tem
pera
ture
(°C
)
High Mid Low
Figure 2. Plate temperatures. (a) Association between plate temperature and environment over a 5-day low tide series in August 2009. Th e average temperature ( ° C) of cool (open circles) and warm (solid circles) plates and the nearby rocky bench (open squares) in the high inter-tidal are displayed on the left y-axis. Epoxy and rock temperatures were sampled every 60 min using iButton loggers. Air temperature data (dotted line) are from Environment Canada for nearby Victoria, BC. Th e right y-axis displays the tidal regime (solid line). Error bars are excluded for clarity here, but are included in time series data for the entire summer (Supplementary material Appendix 3 Fig. A2). (b) Mean residual daily maximum temperature from plates and bench for each zone. Letters that are diff erent than each other indicate signifi cant diff erences at α � 0.05. Error bars are � SE throughout.
were consistently higher on black plates and at higher shore levels during the summer months, with no signifi cant inter-action between treatment and zone (ANOVA: temperature treatment F 2,30 � 38.847, p � 0.001; zone F 2,30 � 435.169, p � 0.001; temp � zone F 4,30 � 1.423, p � 0.250). Th e aver-age ADM temperature diff erence between black (hereafter, warm) and white (hereafter, cool) plates in high, mid, and low zones was 2.9, 2.0, 1.5 ° C respectively (Table 1). Th e diff erence between the average highest recorded tempera-tures of warm and cool plates were 4.0, 6.0, 5.0 ° C for the high, mid, and low zones, respectively (Table 1).
Functional group responses
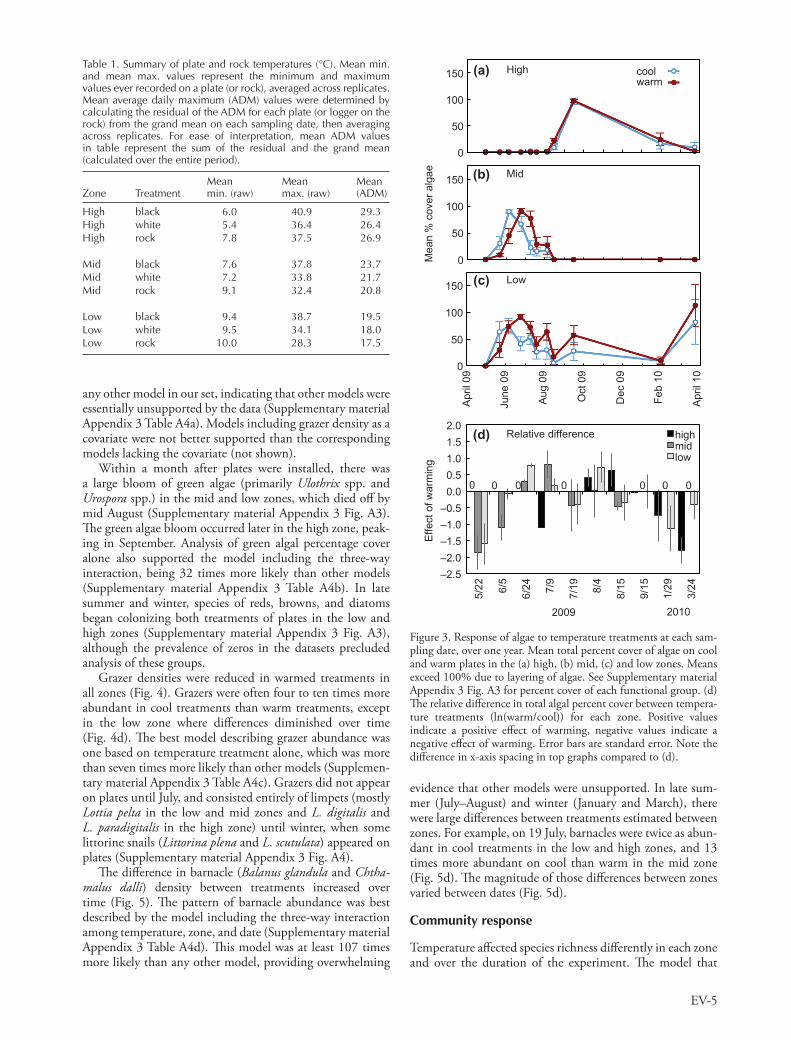
Th e majority of algal cover quantifi ed in this experiment was from prostrate species that laid in contact with the plate surface, so it is likely that thalli were warmed on black plates (species list in Supplementary material Appendix 1 Table A2). Diff erences among tidal zones in the temporal dynamics of algal abundance depended on temperature treat-ment (Fig. 3d). In the high intertidal, cool and warm treat-ments showed similar patterns of algal abundance, peaking at 100% cover in August, which thereafter declined through-out fall to a minimum the following winter and spring (Fig. 3a). In contrast, warm temperatures in the mid and low zones delayed the development of algal communities from late spring into summer and algae persisted at greater abun-dance thereafter in the low zone (Fig. 3b – c). Th e three-way interaction model was more than 50 times more likely than
EV-5
Table 1. Summary of plate and rock temperatures ( ° C). Mean min. and mean max. values represent the minimum and maximum values ever recorded on a plate (or rock), averaged across replicates. Mean average daily maximum (ADM) values were determined by calculating the residual of the ADM for each plate (or logger on the rock) from the grand mean on each sampling date, then averaging across replicates. For ease of interpretation, mean ADM values in table represent the sum of the residual and the grand mean (calculated over the entire period).
Zone TreatmentMean min. (raw)
Mean max. (raw)
Mean (ADM)
High black 6.0 40.9 29.3High white 5.4 36.4 26.4High rock 7.8 37.5 26.9
Mid black 7.6 37.8 23.7Mid white 7.2 33.8 21.7Mid rock 9.1 32.4 20.8
Low black 9.4 38.7 19.5Low white 9.5 34.1 18.0Low rock 10.0 28.3 17.5
–2.5–2.0–1.5–1.0–0.50.00.51.01.52.0
highmidlow
0
50
100
150 (a)
(b)
(c)
(d)
0
50
100
150
0
50
100
150
April
09
June
09
Oct
09
Dec
09
April
10
Aug
09
Feb
10
warmcoolHigh
Mid
Low
Mea
n %
cov
er a
lgae
5/22 6/
5
8/15
9/15
3/24
7/19
1/29
6/24 7/
9
8/4
2009 2010
Relative difference
0 0 0 0 0 0 0
Effe
ct o
f war
min
g
Figure 3. Response of algae to temperature treatments at each sam-pling date, over one year. Mean total percent cover of algae on cool and warm plates in the (a) high, (b) mid, (c) and low zones. Means exceed 100% due to layering of algae. See Supplementary material Appendix 3 Fig. A3 for percent cover of each functional group. (d) Th e relative diff erence in total algal percent cover between tempera-ture treatments (ln(warm/cool)) for each zone. Positive values indicate a positive eff ect of warming, negative values indicate a negative eff ect of warming. Error bars are standard error. Note the diff erence in x-axis spacing in top graphs compared to (d).
any other model in our set, indicating that other models were essentially unsupported by the data (Supplementary material Appendix 3 Table A4a). Models including grazer density as a covariate were not better supported than the corresponding models lacking the covariate (not shown).
Within a month after plates were installed, there was a large bloom of green algae (primarily Ulothrix spp. and Urospora spp.) in the mid and low zones, which died off by mid August (Supplementary material Appendix 3 Fig. A3). Th e green algae bloom occurred later in the high zone, peak-ing in September. Analysis of green algal percentage cover alone also supported the model including the three-way interaction, being 32 times more likely than other models (Supplementary material Appendix 3 Table A4b). In late summer and winter, species of reds, browns, and diatoms began colonizing both treatments of plates in the low and high zones (Supplementary material Appendix 3 Fig. A3), although the prevalence of zeros in the datasets precluded analysis of these groups.
Grazer densities were reduced in warmed treatments in all zones (Fig. 4). Grazers were often four to ten times more abundant in cool treatments than warm treatments, except in the low zone where diff erences diminished over time (Fig. 4d). Th e best model describing grazer abundance was one based on temperature treatment alone, which was more than seven times more likely than other models (Supplemen-tary material Appendix 3 Table A4c). Grazers did not appear on plates until July, and consisted entirely of limpets (mostly Lottia pelta in the low and mid zones and L. digitalis and L. paradigitalis in the high zone) until winter, when some littorine snails ( Littorina plena and L. scutulata ) appeared on plates (Supplementary material Appendix 3 Fig. A4).
Th e diff erence in barnacle ( Balanus glandula and Chtha-malus dalli ) density between treatments increased over time (Fig. 5). Th e pattern of barnacle abundance was best described by the model including the three-way interaction among temperature, zone, and date (Supplementary material Appendix 3 Table A4d). Th is model was at least 107 times more likely than any other model, providing overwhelming
evidence that other models were unsupported. In late sum-mer (July – August) and winter (January and March), there were large diff erences between treatments estimated between zones. For example, on 19 July, barnacles were twice as abun-dant in cool treatments in the low and high zones, and 13 times more abundant on cool than warm in the mid zone (Fig. 5d). Th e magnitude of those diff erences between zones varied between dates (Fig. 5d).
Community response
Temperature aff ected species richness diff erently in each zone and over the duration of the experiment. Th e model that

EV-6
–3.0
–2.5
–2.0
–1.5
–1.0
–0.5
0.0
0.5
highmidlow
Mea
n gr
azer
den
sity
0
5
10
15
20
25
0
5
10
15
20
25
0
5
10
15
20
25
(a) High
(b) Mid
(c) Low
warmcool
5/22 6/5
8/15
9/15
3/24
7/19
1/29
6/24 7/9
8/4
2009 2010
n/a
(d) Relative difference0 0 0 0 n/a n/a
April
09
June
09
Oct
09
Dec
09
April
10
Aug
09
Feb
10
Effe
ct o
f war
min
g
Figure 4. Response of grazers to temperature treatments at each sampling date, over one year. Mean density of total grazers on cool and warm plates in the (a) high, (b) mid, (c) and low zones. See Supplementary material Appendix 3 Fig. A4 for density of each functional group. (d) Th e relative diff erence in grazer density between temperature treatments (ln(warm/cool)) for each zone. Positive values indicate a positive eff ect of warming, negative values indicate a negative eff ect of warming. Note the diff erence in x-axis spacing in top graphs compared to (d).
–4.0
–3.0
–2.0
–1.0
0.0
1.0
highmidlow
0
200
400
600
0
200
400
600
0
200
400
600
Mea
n ba
rnac
le d
ensi
ty
warmcool (a) High
(b) Mid
(c) Low
5/22 6/5
8/15
9/15
3/24
7/19
1/29
6/24 7/9
8/4
2009 2010
(d) Relative difference
April
09
June
09
Oct
09
Dec
09
April
10
Aug
09
Feb
10
Effe
ct o
f war
min
g
Figure 5. Eff ect of temperature treatment on barnacle abundance in (a) high, (b) mid, and (c) low zones at each sampling date over one year. (d) Th e relative diff erence in barnacle density between tem-perature treatments (ln(warm/cool)) for each zone. Positive values indicate a positive eff ect of warming, negative values indicate a negative eff ect of warming. Note the diff erence in x-axis spacing in top graphs compared to (d).
best described the pattern is one that included the three-way interaction between temperature, zone, and date and was at least 43 times more likely than all other models (Supple-mentary material Appendix 3 Table A4e). Species richness was generally reduced in warm treatments (Fig. 6). In early summer and winter, the diff erence between temperature treatments was higher at higher shore levels (Fig. 6d). During mid-late summer, species richness was 1.5 – 2.5 times lower on warm plates in the mid and low zones, while the diff erence between treatments in the high zone was negli-gible. In the mid and high zones, limpets and littorine snails were rare or absent on warm plates (Supplementary material
Appendix 3 Fig. A4), accounting for much of the diff erence between treatments by the end of the experiment.
On plate settlement surfaces, MDS ordination indicated partitioning due to temperature in the structure of the inver-tebrate assemblage in August (Fig. 7a). We detected signifi -cant diff erences in multivariate assemblage structure between temperature treatments and zone for invertebrates (Table 2a). Barnacles and limpets were the largest contributors to the dis-similarity between temperature treatments, and all were less abundant on warm plates (Supplementary material Appen-dix 3 Table A5). Th e same taxa were also responsible for diff erences between zones; relative abundances contributed to 33 – 38% dissimilarity between pairs of zones (data not shown). MDS ordination indicated partitioning and PER-

EV-7
–1.2
–1.0
–0.8
–0.6
–0.4
–0.2
0.0
0.2
0.4
highmidlow
0
2
4
6
0
2
4
6
0
2
4
6
Spec
ies
richn
ess
(a) High
(b) Mid
(c) Low
warmcool
5/22 6/
5
8/15
9/15
3/24
7/19
1/29
6/24 7/9
8/4
2009 2010
(d) Relative difference
April
09
June
09
Oct
09
Dec
09
April
10
Aug
09
Feb
10
Effe
ct o
f war
min
g
Figure 6. Eff ect of temperature treatment on species richness in (a) high, (b) mid, and (c) low zones at each sampling date over one year. (d) Th e relative diff erence in species richness between tem-perature treatments (ln(warm/cool)) for each zone. Positive values indicate a positive eff ect of warming, negative values indicate a negative eff ect of warming. Note the diff erence in x-axis spacing in top graphs compared to (d).
Figure 7. MDS ordination plots of community composition for the (a) abundance of invertebrates (square root transformed with Bray – Curtis similarity), and (b) percent cover of algae (log(x � 1) trans-formed with Euclidean distance) on the 15 August 2009 sampling date (n � 40 plates). Filled symbols represent warm plates, open symbols represent cool plates in the high (triangles), mid (circles), and low (squares) zones. In the algae plot, many symbols are over-lapping (e.g. in the center of the plot, where there was 0% cover algae on plates).
Table 2. Permutational multivariate analysis of variance of the effects of temperature treatment and zone for (a) the density of inverte-brates (square root transformed, using Bray – Curtis similarity) and (b) percent cover of algae (log(x � 1) transformed, using Euclidean dis-tance) for the 15 August 2009 sampling date. Bold p-values indicate signifi cance at α � 0.05.
Source DF SS Pseudo-F p
(a) Invertebrate densitytemp (t) 1 11262 9.749 � 0.001 zone (z) 2 10737 4.647 � 0.001 t � z 2 1562 0.676 0.708residual 34 39279total 39 62890
(b) Algal percent covertemp 1 3.53 1.937 0.094zone 2 43.27 11.883 � 0.001 t � z 2 5.43 1.492 0.146residual 34 61.90total 39 114.78
MANOVA revealed signifi cant diff erences in algal assem-blage structure between zones but not between temperature treatments (Fig. 7b, Table 2b). Green fi lamentous algae, diatoms and Ulva spp. contributed to diff erences between zones (80 – 100% dissimilarity between pairs of zones). In September, the low zone was characterized by high diatom and Ulva spp. coverage, the mid zone was characterized by bare plates (0% cover), while the high zone was character-ized by high green fi lament cover and moderate diatom and Ulva spp. cover. Th e assemblage structure and abundance of consumers found under plates did not diff er between tem-perature treatments (Supplementary material Appendix 4 Fig. A5).
Discussion
Temperature is a fundamental determinant of survival and performance for all species. Because diff erent species have diff erent thermal tolerances and diff erent morphological

EV-8
of advance or delay in phenology depends on what warm temperatures enable (e.g. fl owering) or hinder (e.g. early succession).
Th e average maximum on black plates was approximately 4 ° C warmer than white plates. Even if thermal limits were not exceeded by these conditions, sub-lethal stress may have caused mobile grazers to simply avoid this microclimate during low tide. Limpets ( Lottia spp.) generally have high lethal thermal limits; 34 – 39 ° C in water and 39 – 44 ° C in air (Wolcott 1973). Although these temperatures encom-passed the warmest temperatures measured on the epoxy of our black plates, the black borders were likely a few degrees warmer, thus may have been too hot for limpets to cross during sunny low tides. Limpet adults and recruits were observed on black plate borders during low tide surveys, although results from subsequent experiments revealed that limpets were approximately half as numerous on black HDPE borders than white borders during summer (Kordas 2014). Nevertheless, limpets do not actively forage in hot conditions (e.g. daytime low tides; Branch 1981) and they had access to the ocean- or air-cooled epoxy surface dur-ing high tide and at night. Th us, hotter black borders may have restricted but not prevented limpet access to the epoxy surface. Regardless of the mechanism, warmer conditions reduced limpet abundance, which likely reduced grazing pressure to warmed intertidal communities.
Warming eff ects on algae and limpets appeared to be primarily direct, rather than mediated indirectly by top – down or bottom – up forcing. Th is was evidenced by two observations; 1) on cool plates in the low and mid zones, there was a gap between green (i.e. palatable) algae die-off in late summer and grazer appearance shortly thereafter and, 2) on warm plates in the mid zone, grazers were entirely absent, yet algae disappeared in late summer. Harley (2006) also observed a green algae die off in late summer in treatments where herbivores were removed. Th us it seems likely that algal abundance was not dependent on grazer abundance in this experiment. It is probable that green algae were an early successional functional group that allowed for grazers to either recruit to plates or facilitated a microbial food source that is preferable to grazers, since grazers appeared on plates following algae die-off . However, there were fewer grazers in warm treatments; this diff erence was particularly evident in the mid and low zones, where limpets were numerically abundant compared to the high zone. Th us, despite non-discriminatory ‘ preparation ’ by green algae (i.e. green algae was equally abundant in warm and cool treatments), mobile grazers were less abundant on warm plates. Th erefore, the diff erence in limpets on plates was likely due to abi-otic conditions rather than availability of food. Subsequent studies controlling for the eff ect of grazing will shed light on the eff ect of warming on these interactions (Kordas and Harley unpubl.).
In summary, we found that functional groups responded diff erently to experimental warming; barnacles and lim-pets were reduced, and green algal phenology was shifted. Although laboratory-based physiological thermal tolerances can provide useful mechanistic insight into species responses to climate warming (Helmuth et al. 2005), the current shortage of data hinders our ability to apply this framework at the community level. Since species thermal responses are
and behavioral coping strategies, species-specifi c responses to warming are inevitable. Although we expected all taxa to be negatively aff ected by warming, we also predicted that barnacles would fare well relative to limpets and algae because thermal limits for the former are higher than those for other taxa. Given that little is known about the thermal tolerances of northeast Pacifi c algal species in air, it was not possible to precisely predict how prostrate algae would fare compared to other functional groups. However, we proposed two possibilities; algae would be sensitive to warming (which would decrease abundance) or, if mobile grazers avoided hot microclimates, palatable macroalgae would be released from grazing (which would increase algal abundance). Further, we predicted that species richness would decline and species composition would shift towards dominance by thermally tolerant species such as barnacles.
We found that warming negatively aff ected the density of barnacles in all zones throughout the year, thus it is likely that temperatures in warm treatments exceeded physiologi-cal tolerances of barnacles. Th ough much is known about the eff ect of temperature on barnacles in general (Foster 1969), less is known about northeast Pacifi c intertidal species. Balanus glandula heat shock protein expression begins at 23 ° C and peaks at 33 ° C in air (Berger and Emlet 2007). Chthamalus dalli cirri (feeding apparatus) beating reaches maximum levels at 28 ° C and ceases at 35 ° C in water (South-ward and Southward 1967). In Australia, barnacle settle-ment and growth were inhibited when the substratum was warmed 2.2 ° C (Lathlean and Minchinton 2012), confi rm-ing that Australian barnacles are sensitive to slight increases in substratum temperature. Subsequent work in this system will elucidate the mechanisms controlling Pacifi c barnacle demographic responses to warming (Kordas and Harley unpubl.).
Contrary to our expectations, algal abundance and algal community structure were relatively unaff ected by tempera-ture treatments. Previous fi eld experiments mimicking aerial thermal stress on macroalgae have found that the responses are context specifi c (Allison 2004) and likely depend on complex interactions. In the high zone, algal colonization was delayed until mid August, which may have been due to higher thermal and desiccation stress or nutrient limitation from long emersion times during summer, or diff erences in algal reproductive phenologies. In lower zones, green fi la-mentous algae (the dominant algal group recruiting to our experimental plates) responded to warming via a delay in phenology. Interestingly, after an initial delay in establish-ment on warmed plates, green algae population dynamics followed the same pattern (Supplementary material Appen-dix 3 Fig. A3b – c). Studies from a variety of ecosystems have also found warming induced colonization or phenology shifts (Parmesan and Yohe 2003). However, most have found that these changes advance with warming, whereas here, we observed a delay in the warm treatment. In most cases, life history transitions are triggered by warming in the spring. For ephemeral intertidal algae, the bloom may be triggered by early successional amelioration of stress. For example, there may have been delayed establishment of an early suc-cessional biofi lm (Morelissen and Harley 2007) needed for green algae settlement, as has been suggested to be required for coral larvae (Webster et al. 2010). Th us, the prediction

EV-9
the slope of the relationship between maximum body and maximum air temperature is very close to one (Denny et al. 2006). Since the relationship between substratum, body, and air temperature is strong and approximately 1:1, the experi-mental warming of the substratum on black versus white plates (2 ° C average) should increase body temperatures by approximately the same amount as would the global average change in air temperature expected by 2100 (IPCC 2013).
Th e treatments used in this study were able to isolate the stressful eff ects of warming during aerial exposure (Hofmann and Somero 1995) from the generally non-stressful eff ects of changing seawater temperature (Menge et al. 2008). Temperature was the same across treatments during high tide, but these passively warmed plates diff ered by as much as 6 ° C between treatments during low tide, simulating an increase in stressful aerial conditions only. Th e disadvantage of this method is that the surrounding seawater could not also be warmed, which often has a benefi cial eff ect on marine organ-isms. Warmer water temperatures in the temperate zone have been associated with increased development rates (Nasrolahi et al. 2011), growth rates (Menge et al. 2008), and feed-ing rates (Southward and Southward 1967, Sanford 2002, O’Connor 2009). As the climate changes, air and water will continue to warm, although air will warm more quickly than water (Sutton et al. 2007). Th e relative rate at which each medium warms and the potential benefi ts or stressors that result from each will determine the net thermal eff ect on intertidal organisms. Despite the fact that passively heated plates are imperfect proxies for warmer future conditions, our results demonstrate that thermal stress has signifi cant impacts on intertidal communities. Field based experiments that increase thermal stress are still rare due to logistic diffi -culties, especially in marine systems (Wernberg et al. 2012a), but are more suitable for future warming studies than other fi eld-based temperature manipulations (e.g. shades).
Contemporary responses of whole ecosystems to global warming have been context dependent (reviewed by Doney et al. 2012) and depend on a myriad of factors: specifi cally, the interplay between individual thermal tolerances and adaptations, context-dependent species interactions, additional abiotic stressors, rates of immi-gration, and the scale of observation. Th e paleontological literature reports massive declines in biodiversity followed by a global reshuffl ing of species (reviewed by Barnosky et al. 2012). Decadal-scale observations have demonstrated increased diversity and changes in community composi-tion with warming (Stachowicz et al. 2002, Schiel et al. 2004, Perry et al. 2005), while shorter term experimental studies have demonstrated declines in diversity (e.g. this study; Gedan and Bertness 2009, Burgmer and Hillebrand 2010). Improving our understanding of the ultimate ecological responses to anthropogenic warming will involve linking mechanistic drivers to long-term, macro-scale pat-terns; conducting more fi eld-based warming experiments will be one key step towards this goal.
Acknowledgements – We thank Kyle Demes and Mary O ’ Connor for constructive comments on earlier drafts of this manuscript. We also thank Ladd Johnson and Catherine Miles for advice and help in the fi eld. Th is work was supported by a National Science and Engineering Research Council Discovery Grant to CDGH.
idiosyncratic, temperature performance data for a greater diversity of species (especially interacting pairs), physiologi-cal and behavioral responses, and habitat conditions (e.g. low tide and high tide), will provide climate change science with an essential database to build predictive models.
Th e overall outcome of the taxon-specifi c changes detailed above was a reduction in richness and a change in inverte-brate community structure with warming. Th is was due to the loss of mobile herbivores and reduction in barnacles in warm treatments, and by the failure of warm-adapted taxa to replace those losses. It is possible that our experiment overes-timated species loss and underestimated species replacement due to the spatial and temporal scale of our manipulations. Th e experiment did not aff ect enough individuals over a long enough period of time to promote local adaptation based on existing genetic variation; such adaptation could amelio-rate abundance declines and reduce species losses. Further-more, our manipulations did not aff ect water temperature, and non-resident warm-adapted taxa that require warmer water (e.g. for larval development) would not be expected to appear on our plates. Nonetheless, there is reason to believe, at least at a coarse level, that the decline in species richness we measured will refl ect actual future change in this system. Th e Salish Sea (inland waters of Washington and British Columbia) is a thermal hot spot within the northeast Pacifi c, with the nearest shores likely to harbor species adapted to warmer conditions being found over 1500 km distant in southern California. Th ere is very little variation in the spe-cies pool along the intervening coastline (Blanchette et al. 2008), so the availability of warm-adapted species to our system may be very limited. Barring local adaption (which may not keep pace with warming), the Salish Sea may rep-resent a system which is on the declining (stressed) portion of its thermal performance curve, with little prospect for the arrival of warm-adapted species in the foreseeable future.
Our fi eld-based warming experiment allowed us to gain insights that would not have been obtainable using other approaches. However, like other heated plate designs (Smale et al. 2011, Lathlean et al. 2013) and indeed all in situ warming methods, our technique had advantages and disad-vantages. One inevitable drawback is that not all species are aff ected equally. First, highly mobile organisms and disper-sive life history stages are not aff ected by the manipulations except during the time they occupy the treatments. Second, not all species are heated by conduction to the same extent. Heated plates can only modify the immediate environment, and thus do not aff ect processes that occur at larger scales (larval survivorship, species pool) that will be infl uenced by climate change (Smale et al. 2011). Th e heated substratum would probably have little eff ect on more erect species such as mussels and erect algae (uncommon in this experiment), which have body temperatures more strongly determined by insolation, convection, and evaporation than by conduc-tion (Bell 1995, Helmuth 1998). Nevertheless, the organ-isms found on these plates have body temperatures that are highly correlated to substratum temperatures (Denny and Harley 2006), and although experimentally warming the substrate is not the same thing as climatic warming of the air, the eff ects on body temperature are extremely similar. For example, although substratum and limpet body tem-peratures tend to exceed air temperature by several degrees,

EV-10
Helmuth, B. et al. 2005. Biophysics, physiological ecology, and climate change: does mechanism matter? – Annu. Rev. Physiol. 67: 177 – 201.
Helmuth, B. et al. 2006. Living on the edge of two changing worlds: forecasting the responses of rocky intertidal ecosystems to climate change. – Annu. Rev. Ecol. Evol. Syst. 37: 373 – 404.
Hofmann, G. E. and Somero, G. N. 1995. Evidence for protein damage at environmental temperatures: seasonal changes in levels of ubiquitin conjugates and hsp70 in the intertidal mussel Mytilus trossulus . – J. Exp. Biol. 198: 1509 – 1518.
IPCC 2013. Working group I contribution to the IPCC fi fth assessment report climate change 2013: the physical science basis. – � www.climatechange2013.org/ � .
Kordas, R. L. 2014. Community ecology in a warmer world: direct and indirect eff ects of temperature on community dynamics. – PhD thesis, Th e University of British Columbia.
Lathlean, J. A. and Minchinton, T. E. 2012. Manipulating thermal stress on rocky shores to predict patterns of recruitment of marine invertebrates under a changing climate. – Mar. Ecol. Progr. Ser. 467: 121 – 136.
Lathlean, J. A. et al. 2013. Temperature variability at the larval scale aff ects early survival and growth of an intertidal barnacle. – Mar. Ecol. Progr. Ser. 475: 155 – 166.
Leonard, G. H. 2000. Latitudinal variation in species interactions: a test in the New England rocky intertidal zone. – Ecology 81: 1015 – 1031.
Lurgi, M. et al. 2012. Novel communities from climate change. – Phil. Trans. R. Soc. B 367: 2913 – 2922.
Menge, B. et al. 2008. Response of a rocky intertidal ecosystem engineer and community dominant to climate change. – Ecol. Lett. 11: 151 – 162.
Morelissen, B. and Harley, C. D. G. 2007. Th e eff ects of tempera-ture on producers, consumers, and plant – herbivore interac-tions in an intertidal community. – J. Exp. Mar. Biol. Ecol. 348: 162 – 173.
Nasrolahi, A. et al. 2011. Being young in a changing world: how temperature and salinity changes interactively modify the performance of larval stages of the barnacle Amphibalanus improvisus . – Mar. Biol. 159: 331 – 340.
O’Connor, M. I. 2009. Warming strengthens an herbivore – plant interaction. – Ecology 90: 388 – 398.
Parmesan, C. and Yohe, G. 2003. A globally coherent fi ngerprint of climate change impacts across natural systems. – Nature 421: 37 – 42.
Perry, A. et al. 2005. Climate change and distribution shifts in marine fi shes. – Science 308: 1912 – 1915.
Pinsky, M. L. et al. 2013. Marine taxa track local climate velocities. – Science 341: 1239 – 1242.
Poloczanska, E. S. et al. 2008. Modeling the response of popula-tions of competing species to climate change. – Ecology 89: 3138 – 3149.
Richardson, A. J. and Poloczanska, E. S. 2008. Under-resourced, under threat. – Science 320: 1294 – 1295.
Sanford, E. 2002. Water temperature, predation, and the neglected role of physiological rate eff ects in rocky intertidal communi-ties. – Integr. Comp. Biol. 42: 881 – 891.
Schiel, D. R. et al. 2004. Ten years of induced ocean warming causes comprehensive changes in marine benthic communi-ties. – Ecology 85: 1833 – 1839.
Smale, D. A. et al. 2011. Turning on the heat: ecological response to simulated warming in the sea. – PLoS ONE 6: e16050.
Southward, A. J. and Southward, E. C. 1967. On the biology of an intertidal chthamalid (Crustacea, Cirripedia) from the Chukchi Sea. – Arctic 20: 8 – 20.
Southward, A. J. et al. 1995. Seventy years ’ observations of changes in distribution and abundance of zooplankton and intertidal organisms in the western English Channel in relation to rising sea temperature. – J. Th erm. Biol. 20: 127 – 155.
References
Allison, G. 2004. Th e infl uence of species diversity and stress inten-sity on community resistance and resilience. – Ecol. Monogr. 74: 117 – 134.
Barnosky, A. D. et al. 2012. Approaching a state shift in Earth’s biosphere. – Nature 486: 52 – 58.
Bell, E. C. 1995. Environmental and morphological infl uences on thallus temperature and desiccation of the intertidal alga Mastocarpus papillatus K ü tzing. – J. Exp. Mar. Biol. Ecol. 191: 29 – 55.
Berger, M. S. and Emlet, R. B. 2007. Heat-shock response of the upper intertidal barnacle Balanus glandula : thermal stress and acclimation. – Biol. Bull. 212: 232 – 241.
Blanchette, C. A. et al. 2008. Biogeographical patterns of rocky intertidal communities along the Pacifi c coast of North America. – J. Biogeogr. 35: 1593 – 1607.
Branch, G. M. 1981. Th e biology of limpets: physical factors, energy fl ow and ecological interactions. – Oceanogr. Mar. Biol. Annu. Rev. 19: 235 – 380.
Burgmer, T. and Hillebrand, H. 2010. Temperature mean and variance alter phytoplankton biomass and biodiversity in a long-term microcosm experiment. – Oikos 120: 922 – 933.
Clarke, K. R. and Warwick, R. M. 2001. Change in marine com-munities: an approach to statistical analysis and interpretation. – PRIMER-E. - UK.
Davenport, J. and Davenport, J. 2005. Eff ects of shore height, wave exposure and geographical distance on thermal niche width of intertidal fauna. – Mar. Ecol. Progr. Ser. 292: 41 – 50.
Davis, A. J. et al. 2002. Individualistic species responses invalidate simple physiological models of community dynamics under global environmental change. – J. Anim. Ecol. 67: 600 – 612.
Demes, K. W. et al. 2012. Ferry wakes increase seaweed richness and abundance in a sheltered rocky intertidal habitat. – Hyd-robiologia 693: 1 – 11.
Denny, M. W. and Harley, C. D. G. 2006. Hot limpets: predicting body temperature in a conductance-mediated thermal system. – J. Exp. Biol. 209: 2409 – 2419.
Denny, M. W. et al. 2006. Th ermal stress on intertidal limpets: long-term hindcasts and lethal limits. – J. Exp. Biol. 209: 2420 – 2431.
Doney, S. C. et al. 2012. Climate change impacts on marine ecosystems. – Annu. Rev. Mar. Sci. 4: 11 – 37.
Finlay, J. A. et al. 2008. Eff ect of background colour on growth and adhesion strength of Ulva sporelings. – Biofouling 24: 219 – 225.
Foster, B. A. 1969. Tolerance of high temperatures by some inter-tidal barnacles. – Mar. Biol. 4: 326 – 332.
Gedan, K. B. and Bertness, M. D. 2009. Experimental warming causes rapid loss of plant diversity in New England salt marshes. – Ecol. Lett. 12: 842 – 848.
Harley, C. D. G. 2003. Abiotic stress and herbivory interact to set range limits across a two-dimensional stress gradient. – Ecology 84: 1477 – 1488.
Harley, C. D. G. 2006. Eff ects of physical ecosystem engineering and herbivory on intertidal community structure. – Mar. Ecol. Progr. Ser. 317: 29 – 39.
Harley, C. D. G. 2008. Tidal dynamics, topographic orientation, and temperature-mediated mass mortalities on rocky shores. – Mar. Ecol. Progr. Ser. 371: 37 – 46.
Harley, C. D. G. 2011. Climate change, keystone predation and biodiversity loss. – Science 334: 1124 – 1127.
Helmuth, B. 1998. Intertidal mussel microclimates: predicting the body temperature of a sessile invertebrate. – Ecol. Monogr. 68: 51 – 74.
Helmuth, B. et al. 2002. Climate change and latitudinal patterns of intertidal thermal stress. – Science 298: 1015 – 1017.

EV-11
Underwood, A. J. 1980. Th e eff ects of grazing by gastropods and physical factors on the upper limits of distribution of intertidal macroalgae. – Oecologia 46: 201 – 213.
Webster, N. S. et al. 2010. Elevated seawater temperature causes a microbial shift on crustose coralline algae with implications for the recruitment of coral larvae. – ISME J. 5: 759 – 770.
Wernberg, T. et al. 2012a. A decade of climate change experiments on marine organisms: procedures, patterns and problems. – Global Change Biol. 18: 1491 – 1498.
Wernberg, T. et al. 2012b. An extreme climatic event alters marine ecosystem structure in a global biodiversity hotspot. – Nat. Climate Change 3: 78 – 82.
Wolcott, T. G. 1973. Physiological ecology and intertidal zonation in limpets ( Acmaea ): a critical look at ‘ limiting factors ’ . – Biol. Bull. 145: 389 – 422.
Stachowicz, J. et al. 2002. Linking climate change and biological invasions: ocean warming facilitates nonindige-nous species invasions. – Proc. Natl Acad. Sci. 99: 15497 – 15500.
Stewart, R. I. et al. 2013. Mesocosm experiments as a tool for ecological climate-change research. – Adv. Ecol. Res. 48: 71 – 181.
Sutton, R. T. et al. 2007. Land/sea warming ratio in response to climate change: IPCC AR4 model results and comparison with observations. – Geophys. Res. Lett. 34 , L02701, doi:10.1029/2006GL028164
Swain, G. et al. 2006. Short-term testing of antifouling surfaces: the importance of colour. – Biofouling 22: 425 – 429.
Trenberth, K. E. 2012. Framing the way to relate climate extremes to climate change. – Climatic Change 115: 283 – 290.
Supplementary material (available online as Appendix oik.00806 at � www.oikosjournal.org/readers/appendix � ). Appendix 1–4.