Interpretations on how the macroscopic mechanical behavior of sandstone affected by microscopic...
10
Interpretations on how the macroscopic mechanical behavior of sandstone affected by microscopic properties—Revealed by bonded-particle model Yo-Ming Hsieh a , Hung-Hui Li b , Tsan-Hwei Huang b , Fu-Shu Jeng b, ⁎ a Department of Construction Engineering, National Taiwan University of Science and Technology, Taipei, Taiwan b Department of Civil Engineering, National Taiwan University, Taipei, Taiwan article info abstract Article history: Received 30 August 2007 Received in revised form 8 January 2008 Accepted 23 January 2008 Available online 23 February 2008 Macroscopic mechanical properties of sandstones, such as uniaxial compressive strength and Young's modulus were found to be significantly affected by their petrographic properties, e.g. the porosity n and the grain area ration GAR. The intricate relationship between the macroscopic properties of sandstones and their petrographic or microscopic properties necessitates further study in exploring how the microscopic properties influence the macroscopic mechanical behavior. In this research, numerical analyses based on the bonded-particle model, the microscopic properties of which originated from the bonded strength and stiffness, were thus conducted as a systematic study aiming at unraveling these microscopic mechanisms. A series of tests was conducted, and the results were compared with the actual behavior of sandstone. A numerical model comprised of three types of particles, grain particles GP, matrix particles MP and porous matrix particles PP, was accordingly proposed to represent the sandstone. The results of analyses demonstrated how the petrographic parameter GAR and porosity n determined the proportions and the numbers of GP, MP and PP. The strength and stiffness of these bonds were estimated based on back analyses. Accordingly, the results of parametric study indicate that matrix particles tend to have stronger bonding strength yet softer stiffness, when compared to the grain particles. © 2008 Elsevier B.V. All rights reserved. Keywords: Sandstone Bonded-particle model Grain Matrix Particle contacts 1. Introduction Sandstone is a detrital sedimentary rock composed of rock fragments and mineral grains. The macroscopic mechanical behavior of sand- stones, the uniaxial compressive strength (UCS)(ISRM, 1981) for instance, is inherently affected by the microscopic properties of the sandstone, e.g. the mineral types, porosity, bonding strength, etc. of the constituting particles. How do these microscopic properties of sand- stones affect the macroscopic mechanical behavior of these rocks had been focus of interests in a number of recent researches. The influence of microscopic factors on the macroscopic strength of rock, were studied by various researchers with regard to the following aspects: a) Mineralogical composition—The quartz content may contribute positively to the uniaxial compressive strength of sandstones (Smart et al., 1982; Gunsallus and Kulhaway, 1984; Shakoor and Bonelli, 1991). Nevertheless, there are situations that the quartz content of sandstones has no effect on their strength (Bell, 1978; Barbour et al., 1979; Dobereiner and De Freitas, 1986). b) Cement and matrix—The strengths of sandstones are closely rela- ted to their cementation. Sandstones with higher cement content tend to have higher strength than those with lower cement con- tent (Clough et al.,1981; David et al., 1998). The type of cement also affects the sandstones' strength. For instance, sandstones with silica or calcareous cement have higher strength than the ones with clay mineral cement (Vutukuri et al., 1974). The term “matrix” is often referred to the fine particles between the grains. In sedi- mentology, these fine particles in fact include “matrix” deposited during sediment processes and “matrix” formed during diagenetic processes. In practice, especially when observing thin sections, it is difficult to distinguish the cement content within the fine particles. Hereinafter, the term “matrix” used in this work refers to the mixture of fine particles including both matrix and cement. As such, the matrix may exhibit bonding strength owing to the ce- ment content within it. c) Grain size—The effect of grain size on the strengths of sandstones may vary in accordance with the particular types of rocks studied. It has been found that increase in grain sizes results in decrease in uniaxial compressive strength for greywacke (Singh, 1988). While in other cases, there are no correlation between the grain size and the strength (Shakoor and Bonelli, 1991; Plachik, 1999). d) Grain particle packing—The compactness of grain particle packing can be described by parameters such as the packing density, the grain contact, and the grain area ratio (GAR), which is defined as the ratio between the grain area and the total area in the selected range of the specimen image (Ersoy and Waller, 1995). Dobereiner and De Freitas (1986) suggested the strength of sandstones has no obvious correlation with the packing density, but positively corre- lates to the grain contact. Bell (1978) and Bell and Culshaw (1993), Engineering Geology 99 (2008) 1–10 ⁎ Corresponding author. Tel.: +886 2 2363 0530; fax: +886 2 2364 5734. E-mail address: [email protected] (F.-S. Jeng). 0013-7952/$ – see front matter © 2008 Elsevier B.V. All rights reserved. doi:10.1016/j.enggeo.2008.01.017 Contents lists available at ScienceDirect Engineering Geology journal homepage: www.elsevier.com/locate/enggeo
Transcript of Interpretations on how the macroscopic mechanical behavior of sandstone affected by microscopic...

Engineering Geology 99 (2008) 1–10
Contents lists available at ScienceDirect
Engineering Geology
j ourna l homepage: www.e lsev ie r.com/ locate /enggeo
Interpretations on how the macroscopic mechanical behavior of sandstone affectedby microscopic properties—Revealed by bonded-particle model
Yo-Ming Hsieh a, Hung-Hui Li b, Tsan-Hwei Huang b, Fu-Shu Jeng b,⁎a Department of Construction Engineering, National Taiwan University of Science and Technology, Taipei, Taiwanb Department of Civil Engineering, National Taiwan University, Taipei, Taiwan
a r t i c l e i n f o
⁎ Corresponding author. Tel.: +886 2 2363 0530; fax:E-mail address: [email protected] (F.-S. Jeng).
0013-7952/$ – see front matter © 2008 Elsevier B.V. Aldoi:10.1016/j.enggeo.2008.01.017
a b s t r a c t
Article history:Received 30 August 2007Received in revised form 8 January 2008Accepted 23 January 2008Available online 23 February 2008
Macroscopic mechanical properties of sandstones, such as uniaxial compressive strength and Young'smodulus were found to be significantly affected by their petrographic properties, e.g. the porosity n and thegrain area ration GAR. The intricate relationship between the macroscopic properties of sandstones and theirpetrographic or microscopic properties necessitates further study in exploring how the microscopicproperties influence the macroscopic mechanical behavior.In this research, numerical analyses based on the bonded-particle model, the microscopic properties of whichoriginated from the bonded strength and stiffness, were thus conducted as a systematic study aiming atunraveling these microscopic mechanisms. A series of tests was conducted, and the results were comparedwith the actual behavior of sandstone. A numerical model comprised of three types of particles, grain particlesGP, matrix particlesMP and porous matrix particles PP, was accordingly proposed to represent the sandstone.The results of analyses demonstrated how the petrographic parameter GAR and porosity n determined theproportions and the numbers of GP, MP and PP. The strength and stiffness of these bonds were estimatedbased on back analyses. Accordingly, the results of parametric study indicate that matrix particles tend to havestronger bonding strength yet softer stiffness, when compared to the grain particles.
© 2008 Elsevier B.V. All rights reserved.
Keywords:SandstoneBonded-particle modelGrainMatrixParticle contacts
1. Introduction
Sandstone is a detrital sedimentary rock composed of rock fragmentsand mineral grains. The macroscopic mechanical behavior of sand-stones, the uniaxial compressive strength (UCS) (ISRM, 1981) forinstance, is inherently affected by the microscopic properties of thesandstone, e.g. the mineral types, porosity, bonding strength, etc. of theconstituting particles. How do these microscopic properties of sand-stones affect the macroscopic mechanical behavior of these rocks hadbeen focus of interests in a numberof recent researches. The influence ofmicroscopic factors on themacroscopic strengthof rock,were studiedbyvarious researchers with regard to the following aspects:
a) Mineralogical composition—The quartz content may contributepositively to the uniaxial compressive strength of sandstones(Smart et al., 1982; Gunsallus and Kulhaway, 1984; Shakoor andBonelli, 1991). Nevertheless, there are situations that the quartzcontent of sandstones has no effect on their strength (Bell, 1978;Barbour et al., 1979; Dobereiner and De Freitas, 1986).
b) Cement and matrix—The strengths of sandstones are closely rela-ted to their cementation. Sandstones with higher cement contenttend to have higher strength than those with lower cement con-tent (Clough et al., 1981; David et al., 1998). The type of cement also
+886 2 2364 5734.
l rights reserved.
affects the sandstones' strength. For instance, sandstones withsilica or calcareous cement have higher strength than the oneswith clay mineral cement (Vutukuri et al., 1974). The term “matrix”is often referred to the fine particles between the grains. In sedi-mentology, these fine particles in fact include “matrix” depositedduring sediment processes and “matrix” formed during diageneticprocesses. In practice, especially when observing thin sections, it isdifficult to distinguish the cement content within the fine particles.Hereinafter, the term “matrix” used in this work refers to themixture of fine particles including both matrix and cement. Assuch, the matrix may exhibit bonding strength owing to the ce-ment content within it.
c) Grain size—The effect of grain size on the strengths of sandstonesmay vary in accordance with the particular types of rocks studied.It has been found that increase in grain sizes results in decrease inuniaxial compressive strength for greywacke (Singh, 1988). Whilein other cases, there are no correlation between the grain size andthe strength (Shakoor and Bonelli, 1991; Plachik, 1999).
d) Grain particle packing—The compactness of grain particle packingcan be described by parameters such as the packing density, thegrain contact, and the grain area ratio (GAR), which is defined asthe ratio between the grain area and the total area in the selectedrange of the specimen image (Ersoy and Waller, 1995). Dobereinerand De Freitas (1986) suggested the strength of sandstones has noobvious correlation with the packing density, but positively corre-lates to the grain contact. Bell (1978) and Bell and Culshaw (1993),

Fig. 1. Schematic illustration of the framework of this research.
2 Y.-M. Hsieh et al. / Engineering Geology 99 (2008) 1–10
however, suggested higher packing density results in higher mate-rial strength.
Furthermore, other fundamental physical properties such as poro-sity, unit weight, and water content have been correlated to the uni-axial compressive strength of rocks (Dyke and Dobereiner, 1991;Hawkins and McConnell, 1992; Jeng et al., 1994; Hatzor and Plachik,1997, 1998; Plachik, 1999; Jeng et al., 2002, 2004; Lin et al., 2005;Weng et al., 2005, 2008; Tsai et al., 2008). It was showed the strengthdecreases with increasing porosity and water content, and increaseswith increasing unit weight.
Jeng et al. (2004) and Weng et al. (2005) performed mechanicalexperiments and petrographic analyses on 13 different sandstonelayers collected from the Western Foothill Range in Taiwan. The voidsbetween particles can be either empty or partly filled with matrixmaterials. It has been found that fracture surfaces tend to go throughparticle–particle contacts or in between matrix when the sandstone isdry or wet, respectively (Lin et al., 2005).
In addition, since grains, matrix and porosity constitute the wholesandstone; how these entities affect the macro behavior is of interest.Through petrographic analysis, the influences of microscopic para-meters (or petrographic parameters) on the macroscopic mechanicalbehaviors had been studied. Two parameters, the porosity n and thegrain area ratio GAR were found to be the key parameters (Jeng et al.,2004). As a result, the uniaxial compressive strength (UCS) can berelated to porosity n and GAR as shown in Eq. (1).
UCS ¼ 133:7d e�0:107n� �3:2� 0:026 GARð Þ ð1Þ
Unit: MPaFurthermore, the deformability (Young's modulus E) was found to
be related to porosity n and GAR as well (Jeng et al., 2004) and can beexpressed as:
E ¼ 36:3d e�0:106n� �0:354þ 0:017 GARð Þ ð2Þ
Unit: GPaFrom Eq. (2), it indicates that the Young's modulus of sandstones
decreases with increasing porosity n and with decreasing GAR. Itshould be noted that the porosity n typically ranges between 5% and25%, and GAR ranges between 20% and 75% for the studied sandstones.These two empirical equations, Eqs. (1) and (2), represent how themacroscopic strength and deformability of natural sandstones arerelated to porosity n and GAR. These empirical equations have beencompared to sandstone worldwide (Bell and Culshaw, 1993, 1998;Ulusay et al., 1994) and were found to be consistent with the behaviorof sandstones studied.
These two equations are adopted as the key relations to be metwhen validating and modifying numerical models and later analyses.
Some of the microscopic properties of rock can be directly mea-sured or observed. For instance, the type of mineral and packing ofgrains can be measured from observing the thin sections of rocksunder microscope. However, some other properties, e.g. the strengthof matrix or the bonding strength of the grains, are difficult tomeasuredirectly. Moreover, in studying the influence of a particular micro-scopic factor, it would be ideal if the factor of interest could be variedwhile the other factors remained unchanged. Unfortunately, whennatural rocks are used, frequently more than one factor will vary fromspecimen to specimen, rendering it difficult to evaluate, on identicalbases, the unbiased influence of a particular factor.
There is very little study on the effect of matrix strength andstiffness on the macroscopic strength of rock. Despite these diffi-culties, a numerical model that is capable of accounting for the dis-crete packing nature of grains and the bonding strength, can serve asconvenient means in studying the influence of microscopic propertieson the macroscopic behavior of rock. Among the existing discretenumerical models, bonded-particle model (BPM) possesses the
desirable requirements mentioned above, and this model was firstlytested and eventually adopted in this research. By using BPM, thebonding strength between the matrix and the grain can be system-atically varied and the corresponding variation of macroscopicmecha-nical behavior can be observed. As a result, clarification on the effectsof the matrix on mechanical behaviors of sandstones is accordinglyobtained.
2. Methodology—a modified bonded-particle model
The framework of this study is illustrated in Fig. 1. Before adoptingBPM for studying microscopic mechanisms, the numerical modelmust be tested and modified until it shows adequate macroscopicmechanical behavior. Therefore, as shown in Fig. 1, uniaxial compresstests were simulated and compared (Steps 1 and 2) and the resultswere verified (Verification I).
As such, the uniaxial compression was first modeled using BPM,and it was revised iteratively until it yields reasonable macroscopicuniaxial compression behavior (similar uniaxial compressive strengthand Young's modulus). This test also serves the purpose of determin-ing BPM's microscopic parameters. After the test, a 2-dimensionalnumerical model was found to be capable of yielding a reasonablemacroscopic mechanical response and was thus adopted as the toolfor further analyses.
2.1. Setup of the modified BPM
In this study, a bonded-particle model (Potyondy and Cundall,2004), which enables assembly and bonding of discrete circle par-ticles, is considered for simulating the aggregation and cementation ofthe sandstone. Intuitively, the bonded-particle model differs from thenatural sandstone in the following aspects: (1) the grains of nature

Fig. 2. Illustration of the three particles and the corresponding four contact types adopted in this research. Symbols: GP=grain particle,MP=matrix particle, PP=porous particle. Thethick lines depict the width of the parallel bond between the particles.
3Y.-M. Hsieh et al. / Engineering Geology 99 (2008) 1–10
sandstone are not necessarily spherical; (2) the contact of naturalgrains may often show “line-contact” as observed in thin sections;however, the contact of BPM is either “point contact” or a segment ofline-contact in between two particles, the so-called “parallel bond”, asshown in Figs. 2; and (3) the number of grains opted when conductingnumerical analysis can be much less than the actual number of grainsin the real rock. Therefore, it is necessary to test and perform nec-essary modifications on the BPM so that adequate mechanical be-haviors can be reproduced by the numerical model.
Since the natural sandstone is composed of grains, matrix, cementand void, particles representing grains and matrix were accordinglyintroduced into the BPM. One of the major difficulties simulatingnatural sandstones is to model sandstone with high porosity. Naturalsandstone typically shows porosity in the range of 10%–25%; however,the use of BPM to model sandstone with large porosity may oftenresult in “floating particles”, i.e. some particles are not supported or incontact with other grains owing to the limited number of particlesopted. If awider range of grain size distribution, like natural sandstonemay have, is used, it is expected that therewould bemuch less or nonefloating particles in the model.
To overcome the aforementioned issue of floating particles in BPM,an additional type of particle representing the “porous matrix” wasintroduced. Therefore, this work allows modeling of high-porosity
Fig. 3. Grain size distribution of the sandstone studied and the grain size distributionadopted.
sandstones without leading to unsupported, floating particles. As aresult, the proposed model contains three types of particles repre-senting grain, matrix and porous matrix. These particle types arerespectively denoted as GP, MP and PP. This modification enablescontrolled variation of the GAR and porosity n of the model whileobserving the macroscopic variation of UCS and Young's modulus E.
Once the numerical procedure with desired control on bothmicroscopic and index properties is validated, themechanisms behind“wet softening” can then be studied. Some of the weak sandstonespossess “wet softening” behavior, and were found to be related to GARand porosity n as well as wet weakening of the matrix (Jeng et al.,2004; Lin et al., 2005). The modified BPM predicts macroscopicstrength and deformability based on independent parameters includ-ing: (1) GAR and porosity; and (2) the strength and the deformabilityof the matrix particles and the porous matrix particles.
The three types of particles (GP,MP and PP) in the proposedmodelresulted in six different types of bonds between these three particletypes (Fig. 2). Since the porous matrix particle PP should be theweakest material among the three types of particles, the bondingstrength of PP with other types of particles should be dominated bythe weakest bonding strength of PP. Therefore, the P–G and P–Mbonds are replaced by P–P bonds. As a result, a total of four types ofbonds were used in the proposed model (Fig. 2).
2.2. Properties of natural sandstone simulated
The natural sandstone simulated is the one studied by Jeng et al.(2004), and its UCS and E of are summarized in Table 1. The grain sizedistribution of this natural sandstone was obtained by petrographicstudies, as shown in Fig. 3 (Jeng et al., 2004). Particle sizes of themodelwere determined based on the natural size distribution. As shown inFig. 3, the sizes of the particles in simulation are about 10 times greater
Table 1Macroscopic properties of the sandstone studied and the simulated results yielded bythe proposed numerical model
Items Value Unit
Natural sandstone studiedUniaxial compressive strength UCS 39.6 MPaYoung's modulus E 7.9 GPa
Prediction of the proposed modelUniaxial compressive strength UCS 41.6 MPaYoung's modulus E 8.4 GPa

4 Y.-M. Hsieh et al. / Engineering Geology 99 (2008) 1–10
than the actual grain size owing to the limitation of total number ofparticles limited by the available computing resource. The grain sizedistributions for various GAR are selected to be similar to the naturalone, as shown in Fig. 3. The size of particles ranges between 0.5 mmand 6 mm, and particles with diameter less than or equal to 2 mm areselected as matrix particle MP.
The material-genesis procedures is summarized and illustrated inFig. 4. Fig. 5a, b, and c shows the respective typical distributions of PP,MP and GP particles based on the above-mentioned concepts. The
Fig. 4. Illustration of the mat
particles were randomly distributed inside a specimen of 5.5 cm inwidth and 13 cm in height. Fig. 5d shows the complete modelspecimenwith GAR=55% and n=25%, and there are 8487 particles and17,123 contact points in this numerical model. The numbers of G–G,M–G, M–M and P–P contacts are 170, 1564, 1587 and 13,802, re-spectively. The number of particles and contact points varies with thevariation of petrographic parameters, e.g. GAR and n, and theseparameters also affects the relative ratio of the four different types ofcontacts, as will be discussed in Section 4.
erial-genesis procedures.
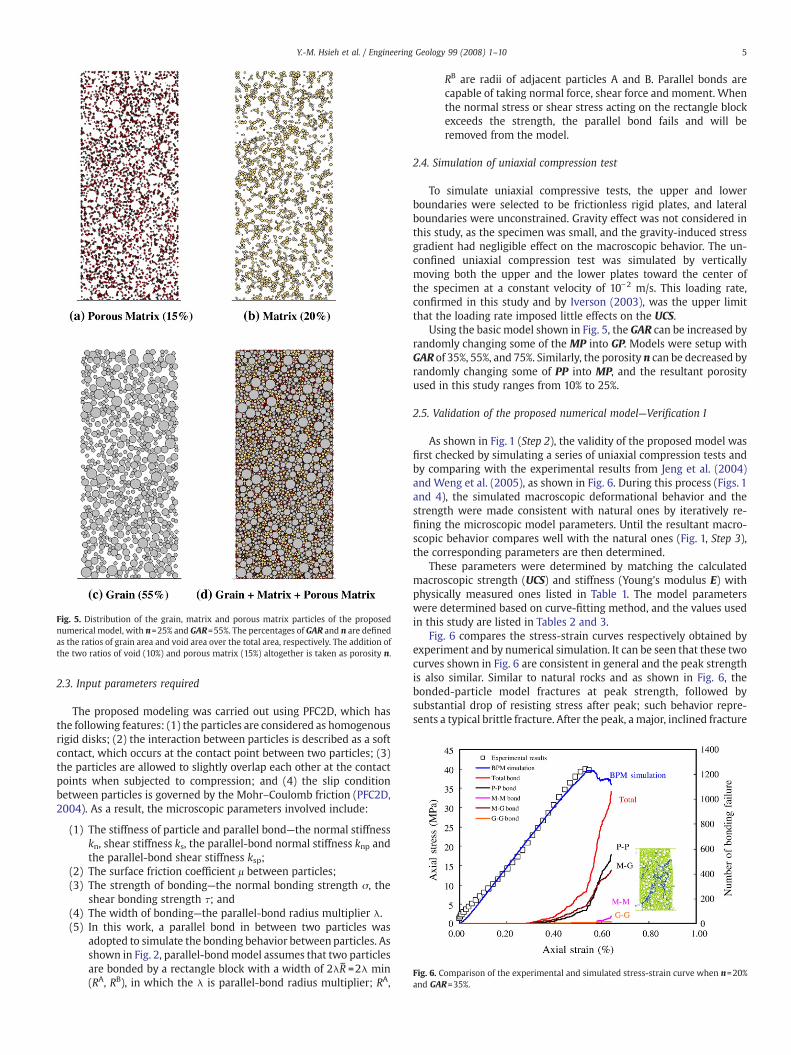
Fig. 5. Distribution of the grain, matrix and porous matrix particles of the proposednumerical model, with n=25% and GAR=55%. The percentages of GAR and n are definedas the ratios of grain area and void area over the total area, respectively. The addition ofthe two ratios of void (10%) and porous matrix (15%) altogether is taken as porosity n.
Fig. 6. Comparison of the experimental and simulated stress-strain curve when n=20%and GAR=35%.
5Y.-M. Hsieh et al. / Engineering Geology 99 (2008) 1–10
2.3. Input parameters required
The proposed modeling was carried out using PFC2D, which hasthe following features: (1) the particles are considered as homogenousrigid disks; (2) the interaction between particles is described as a softcontact, which occurs at the contact point between two particles; (3)the particles are allowed to slightly overlap each other at the contactpoints when subjected to compression; and (4) the slip conditionbetween particles is governed by the Mohr–Coulomb friction (PFC2D,2004). As a result, the microscopic parameters involved include:
(1) The stiffness of particle and parallel bond—the normal stiffnesskn, shear stiffness ks, the parallel-bond normal stiffness knp andthe parallel-bond shear stiffness ksp;
(2) The surface friction coefficient μ between particles;(3) The strength of bonding—the normal bonding strength σ, the
shear bonding strength τ; and(4) The width of bonding—the parallel-bond radius multiplier λ.(5) In this work, a parallel bond in between two particles was
adopted to simulate the bonding behavior between particles. Asshown in Fig. 2, parallel-bondmodel assumes that two particlesare bonded by a rectangle block with a width of 2λR− =2λ min(RA, RB), in which the λ is parallel-bond radius multiplier; RA,
RB are radii of adjacent particles A and B. Parallel bonds arecapable of taking normal force, shear force and moment. Whenthe normal stress or shear stress acting on the rectangle blockexceeds the strength, the parallel bond fails and will beremoved from the model.
2.4. Simulation of uniaxial compression test
To simulate uniaxial compressive tests, the upper and lowerboundaries were selected to be frictionless rigid plates, and lateralboundaries were unconstrained. Gravity effect was not considered inthis study, as the specimen was small, and the gravity-induced stressgradient had negligible effect on the macroscopic behavior. The un-confined uniaxial compression test was simulated by verticallymoving both the upper and the lower plates toward the center ofthe specimen at a constant velocity of 10−2 m/s. This loading rate,confirmed in this study and by Iverson (2003), was the upper limitthat the loading rate imposed little effects on the UCS.
Using the basic model shown in Fig. 5, the GAR can be increased byrandomly changing some of the MP into GP. Models were setup withGAR of 35%, 55%, and 75%. Similarly, the porosity n can be decreased byrandomly changing some of PP into MP, and the resultant porosityused in this study ranges from 10% to 25%.
2.5. Validation of the proposed numerical model—Verification I
As shown in Fig. 1 (Step 2), the validity of the proposed model wasfirst checked by simulating a series of uniaxial compression tests andby comparing with the experimental results from Jeng et al. (2004)and Weng et al. (2005), as shown in Fig. 6. During this process (Figs. 1and 4), the simulated macroscopic deformational behavior and thestrength were made consistent with natural ones by iteratively re-fining the microscopic model parameters. Until the resultant macro-scopic behavior compares well with the natural ones (Fig. 1, Step 3),the corresponding parameters are then determined.
These parameters were determined by matching the calculatedmacroscopic strength (UCS) and stiffness (Young's modulus E) withphysically measured ones listed in Table 1. The model parameterswere determined based on curve-fitting method, and the values usedin this study are listed in Tables 2 and 3.
Fig. 6 compares the stress-strain curves respectively obtained byexperiment and by numerical simulation. It can be seen that these twocurves shown in Fig. 6 are consistent in general and the peak strengthis also similar. Similar to natural rocks and as shown in Fig. 6, thebonded-particle model fractures at peak strength, followed bysubstantial drop of resisting stress after peak; such behavior repre-sents a typical brittle fracture. After the peak, a major, inclined fracture
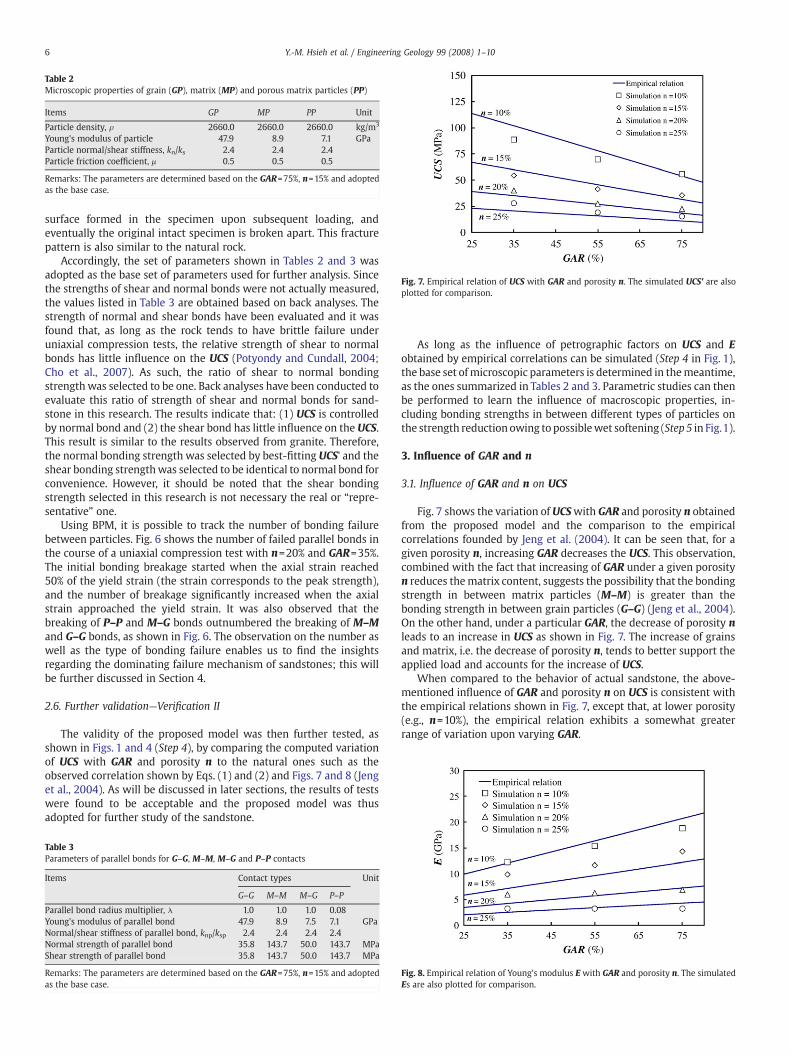
Table 2Microscopic properties of grain (GP), matrix (MP) and porous matrix particles (PP)
Items GP MP PP Unit
Particle density, ρ 2660.0 2660.0 2660.0 kg/m3
Young's modulus of particle 47.9 8.9 7.1 GPaParticle normal/shear stiffness, kn/ks 2.4 2.4 2.4Particle friction coefficient, μ 0.5 0.5 0.5
Remarks: The parameters are determined based on the GAR=75%, n=15% and adoptedas the base case.
Fig. 7. Empirical relation of UCS with GAR and porosity n. The simulated UCS' are alsoplotted for comparison.
6 Y.-M. Hsieh et al. / Engineering Geology 99 (2008) 1–10
surface formed in the specimen upon subsequent loading, andeventually the original intact specimen is broken apart. This fracturepattern is also similar to the natural rock.
Accordingly, the set of parameters shown in Tables 2 and 3 wasadopted as the base set of parameters used for further analysis. Sincethe strengths of shear and normal bonds were not actually measured,the values listed in Table 3 are obtained based on back analyses. Thestrength of normal and shear bonds have been evaluated and it wasfound that, as long as the rock tends to have brittle failure underuniaxial compression tests, the relative strength of shear to normalbonds has little influence on the UCS (Potyondy and Cundall, 2004;Cho et al., 2007). As such, the ratio of shear to normal bondingstrengthwas selected to be one. Back analyses have been conducted toevaluate this ratio of strength of shear and normal bonds for sand-stone in this research. The results indicate that: (1) UCS is controlledby normal bond and (2) the shear bond has little influence on the UCS.This result is similar to the results observed from granite. Therefore,the normal bonding strength was selected by best-fitting UCS' and theshear bonding strengthwas selected to be identical to normal bond forconvenience. However, it should be noted that the shear bondingstrength selected in this research is not necessary the real or “repre-sentative” one.
Using BPM, it is possible to track the number of bonding failurebetween particles. Fig. 6 shows the number of failed parallel bonds inthe course of a uniaxial compression test with n=20% and GAR=35%.The initial bonding breakage started when the axial strain reached50% of the yield strain (the strain corresponds to the peak strength),and the number of breakage significantly increased when the axialstrain approached the yield strain. It was also observed that thebreaking of P–P and M–G bonds outnumbered the breaking of M–Mand G–G bonds, as shown in Fig. 6. The observation on the number aswell as the type of bonding failure enables us to find the insightsregarding the dominating failure mechanism of sandstones; this willbe further discussed in Section 4.
2.6. Further validation—Verification II
The validity of the proposed model was then further tested, asshown in Figs. 1 and 4 (Step 4), by comparing the computed variationof UCS with GAR and porosity n to the natural ones such as theobserved correlation shown by Eqs. (1) and (2) and Figs. 7 and 8 (Jenget al., 2004). As will be discussed in later sections, the results of testswere found to be acceptable and the proposed model was thusadopted for further study of the sandstone.
Table 3Parameters of parallel bonds for G–G, M–M, M–G and P–P contacts
Items Contact types Unit
G–G M–M M–G P–P
Parallel bond radius multiplier, λ 1.0 1.0 1.0 0.08Young's modulus of parallel bond 47.9 8.9 7.5 7.1 GPaNormal/shear stiffness of parallel bond, knp/ksp 2.4 2.4 2.4 2.4Normal strength of parallel bond 35.8 143.7 50.0 143.7 MPaShear strength of parallel bond 35.8 143.7 50.0 143.7 MPa
Remarks: The parameters are determined based on the GAR=75%, n=15% and adoptedas the base case.
As long as the influence of petrographic factors on UCS and Eobtained by empirical correlations can be simulated (Step 4 in Fig. 1),the base set ofmicroscopic parameters is determined in themeantime,as the ones summarized in Tables 2 and 3. Parametric studies can thenbe performed to learn the influence of macroscopic properties, in-cluding bonding strengths in between different types of particles onthe strength reduction owing to possiblewet softening (Step 5 in Fig.1).
3. Influence of GAR and n
3.1. Influence of GAR and n on UCS
Fig. 7 shows the variation of UCSwith GAR and porosity n obtainedfrom the proposed model and the comparison to the empiricalcorrelations founded by Jeng et al. (2004). It can be seen that, for agiven porosity n, increasing GAR decreases the UCS. This observation,combined with the fact that increasing of GAR under a given porosityn reduces thematrix content, suggests the possibility that the bondingstrength in between matrix particles (M–M) is greater than thebonding strength in between grain particles (G–G) (Jeng et al., 2004).On the other hand, under a particular GAR, the decrease of porosity nleads to an increase in UCS as shown in Fig. 7. The increase of grainsand matrix, i.e. the decrease of porosity n, tends to better support theapplied load and accounts for the increase of UCS.
When compared to the behavior of actual sandstone, the above-mentioned influence of GAR and porosity n on UCS is consistent withthe empirical relations shown in Fig. 7, except that, at lower porosity(e.g., n=10%), the empirical relation exhibits a somewhat greaterrange of variation upon varying GAR.
Fig. 8. Empirical relation of Young's modulus E with GAR and porosity n. The simulatedEs are also plotted for comparison.

Table 4Summation of the particle numbers, contact numbers and the relative contents of theadopted particles for the cases analyzed
GAR (%) n (%) Particlenumber
Contactnumber
G–G(%)
M–M(%)
M–G(%)
P–P(%)
(a) 35 10 12,113 23,856 0 82 18 015 0 61 15 2420 0 43 12 4525 0 27 9 63
(b) 55 10 8487 17,123 1 66 33 015 1 42 25 3220 1 23 17 5925 1 9 9 81
(c) 75 10 7606 15,328 2 51 47 015 2 28 34 3620 2 12 21 6425 2 3 9 87
Remarks: The numbers of bond breakings are plotted and compared in Fig. 9.
Fig. 9. Variations of contents of four contact types with porosity n and GAR ranging from0%~25% and 35%~75%, respectively. The numbers of contacts and bond breakings forthree cases (GAR=35%, 55% and 75%) plotted in this figure are summarized in Table 4.
7Y.-M. Hsieh et al. / Engineering Geology 99 (2008) 1–10
3.2. Influence of GAR and n on Young's modulus E
The effect of GAR and porosity n on Young's modulus E is shown inFig. 8. It can be seen that, under a specific porosity n, increasing GARincreases E. Since the increase of GAR under a constant n, which wasmodeled by replacing some of matrix particles with grain particles,leads to a greater E, this observation suggests the stiffness in betweengrains is greater than that in between matrix particles.
On the other hand, under a constant GAR, a decrease in theporosity n increases the E as shown in Fig. 8. Decreasing porositymeansmorematrix particles and less porousmatrix particles and voidand leads to a more consolidated packing of the particles and thematrix. This densely packed structure tends to give larger stiffnessthan loosely packed structures. Consequently, increased number ofparticles accounts for the increase in E.
The simulation of the influence of GAR and porosity n on the UCSand E enables further validation on the selected parameters for theadopted model. The base set of parameters was selected from a set ofGAR and n, and simulations were conducted to yield variations of UCSand E. The simulated variations are then compared with those ofnatural sandstones under various GAR and n as shown in Figs. 7 and 8.Fairly good agreement of the predictions with the actual behaviorsshows that the proposed model is acceptable for use in furtheranalyses.
4. Contact type distribution
As described in Section 2, the proposed model comprises threetypes of particles: GP,MP, and PP; and involves four types of contacts:G–G, M–M, M–G, and P–P. In the proposed model, the variations ofporosity n and GAR change both the number of particles and therelative number of contacts amongst different contact types, as shownin Table 4 and Fig. 9.
Fig. 9a shows the proportions of four contact typesM–M,M–G,G–G,and P–P when GAR is 35%. It is seen in Fig. 9a that, with increase inporosity n from 10% to 25%, the proportion of P–P significantly in-creases and the proportions of M–M and M–G contacts correspond-ingly decrease. The proportion of G–G contact remains constant due toits tie to GAR. Similar changes to proportions of different contact typescan be seenwith variation inGAR in the range of 55% and 75% as shownin Fig. 9b and c. Nevertheless, due to the increase ofGAR, the number ofGP particles relatively increases, and the proportion of M–G and G–Gcontacts increases accordingly. It can also be seen in Fig. 9 that the G–Gcontact has a rather low percentage, not exceeding 2%, this rather lowpercentage of G–G is resulted from the relatively large diameter of thegrain particles (GP), when compared to other particle types in theadopted model.

Fig. 11. Variations of R corresponding to the GAR and n of Cases A, B and C.
Fig. 10. Variations of UCS and E corresponding to the GAR and n of Cases A, B and C.
8 Y.-M. Hsieh et al. / Engineering Geology 99 (2008) 1–10
The observation on the changes in the proportion of differentcontact types and the failure of bonding provides us a sound basis toexplore the micro-mechanism behind the macroscopic mechanical ofsandstones, concerning the dominant contact type affecting the UCSunder various combination of porosity n and GAR, especially.
Fig. 10a and b shows contours of UCS and E respectively undervarious combination of porosity n and GAR, which are based on theactual behavior of natural sandstone (Jeng et al., 2004). Three cases ofmacroscopic failure, referred to as Cases A, B, and C, are discussed inthe following. The corresponding bonding failure types whenapproaching particle failure for the three cases are summarized inTable 5.
In transitioning from Case A to Case B, in which GAR decreasesunder constant porosity, e.g. UCS increases and Young's modulus Edecreases, as shown in Fig. 10. Meanwhile, the major type of brokenbonding transit from M–G and G–G dominant to M–G and M–Mdominant, as shown in Table 5.
This phenomenon is readily interpreted by the fact that a decreaseof GAR reduces the number of GP and increases the number of MP. As
Table 5Summation of the number of cracks yielded by Cases A, B and C
Case A Case B Case C
Contact type n=10% n=10% n=10%
GAR=75% GAR=35% GAR=75%
P–P 0% 0% 55%M–M 0% 22% 1%M–G 76% 75% 41%G–G 24% 3% 3%Total number of cracks 225 673 272
the number of GP decreases, the number of M–G bonding decreases;as the number of MP increases, the number of M–M bondingincreases. For the M–M bonding, its strength is higher than M–Gbonds and its stiffness is lower thanM–G bonds, thus the macroscopicstrength UCS increases in Fig. 10a from Case A to Case B; macroscopicYoung's modulus E decreases from Case A to Case B in Fig. 10b.
When transitioning from Case B to Case C, with porosity increasingfrom 10% to 25% under a constant GAR of 35%, as shown in Fig. 10a andb, both macroscopic UCS and E decrease.
For Case C, due to the increase of porosity under a constant GAR,parts of MPs are replaced by PPs such that the number of P–Pincreases and the number of M–M bond decreases in the meanwhile.As a result, the most failed bonds are P–P and M–G bonds. The P–Pbond features relatively lower strength and stiffness, and therefore themore P–P bonds leads to reductions of the macroscopic UCS and E aswell.
5. Influence of bonding strength on the wet-softening behaviorof sandstone
Thewet-softening behavior of sandstones refers to the reduction ofshear strength when the material is wetted by water. This wet-softening behavior is owing to the fact that the bonding strength ofmatrix materials is reduced when the sandstone is wetted (Dober-einer and De Freitas, 1986; Lin et al., 2005). The degree of UCS reduc-tion can be expressed in R, a measure of the so-called strengthreduction ratio defined as the ratio of theUCS of dry rock by theUCS ofwet rock (Jeng et al., 2004; Weng et al., 2005). The relationship,proposed by Jeng et al. (2004), between R and porosity n and GAR isshown in Fig. 11. Under low porosity n and high GAR, there is littlematrix content, thus R is close to unity and indicates little reduction ofstrength when soaked; on the contrary, with high porosity n and lowGAR, the matrix content is high, R is close to 0 and represents sig-nificant wet-softening behavior.
Through mechanical regression analyses between laboratory ex-periments and thin-slice observations, the relationship between R andporosity n and GAR can be established. However, the influence ofbonding on macroscopic strength is difficult to study using the above-mentioned conventional methods. The proposed model offers a wayto explore the effect of particle bonding on macroscopic mechanicalbehaviors.
Fig. 12 shows the effect of bonding strength of each individualbonding type on the macroscopic UCS for Cases A, B, and C. In Fig. 12,all the bonding strengths are normalized with respect to the corre-sponding dry strengths of Cases A, B, and C respectively. For Case A,as shown in Fig. 12a, with 10% of porosity and 75% of GAR, thereduction of M–G bond most significantly decreases the macroscopicUCS. Whereas, reductions of M–M and G–G bonding strength result

Fig. 12. Variation of UCS upon varying bonding strengths of contacts.
9Y.-M. Hsieh et al. / Engineering Geology 99 (2008) 1–10
in a moderate UCS reduction and P–P bonding has little effect onUCS.
For a lower GAR under a constant porosity, such as Case Bwith 10%of porosity and 35% of GAR, reduction of M–G and M–M bondingstrength leads to significant reduction of UCS, and the strength re-duction of G–G and P–P bonding have an insignificant effect on UCS(Fig. 12b).
Fig. 12c depicts, Case C with 25% of porosity and 35% of GAR, P–Pbonding strength reduction renders significant reduction of UCS, M–
M, M–G, and G–G bonding strength reductions have lesser and lessereffect on UCS reduction.
On one hand, the global GAR or porosity n determines the numbersof each contact type. In turn, the specific distribution of the contacttypes, the three cases studied for instance, dominates not only UCSand E but also the degree of wet softening of sandstone R.
6. Conclusion
In this study, how the microscopic factors, e.g. particle types andthe corresponding bonding strength and stiffness, affect the macro-scopic UCS, E and R of sandstones was explored.
A model based on bonded-particle method was proposed to simu-late the macroscopic mechanical behaviors of sandstones. The pro-posed numerical model contained three types of particles: grainparticles (GP), matrix particles (MP), and porous matrix particles (PP).These two additional types of particles introduced in this study, MPand PP, greatly facilitated the study on the effects of petrographicparameters GAR and porosity n on the macroscopic mechanicalbehaviors. The model had been verified for modeling sandstones andshowed good capability in simulating/predicting the macroscopicmechanical behavior of sandstones. Meanwhile, the porosity wastaken into consideration, and porous matrix particles were intro-duced. These particles enabled simulations with a wide range ofporosity, from 10% to 25%, and facilitated the corresponding observa-tion on the variations of UCS and Young's modulus E with varyingporosity.
Overall, this study revealed reasonable explanations on why theUCS and R vary according to GAR and porosity n as follows:
(1) As long as theM–M bond is stronger than G–G bond, a decreasein GAR will lead to the increase of UCS in the macroscopicmanner under a constant porosity (Fig. 10a);
(2) On the other hand, provided thatM–M bond is softer than G–Gor M–G bonds and under a constant porosity, a decrease inGAR will lead to the decrease of E under a constant porosity(Fig. 10b).
(3) An increase in P–P bonds leads to reductions of UCS and E(Change from Case B to Case C, shown in Fig. 10); and
(4) When a sandstone possesses a greater number of P–P bonds orM–M bonds, this sandstone tends to have a greater wettingreduction of UCS, as shown in Figs. 11 and 12.
Given the methodology and the results presented in previoussections, this research has its limitations and further researches are ofinterest:
(1) The analysis in this study is 2-dimensional, and the truegeometrical condition of specimens in unconfined uniaxialcompression tests cannot be fully represented. Three-dimen-sional analyses are inherentlymore representative of the three-dimensional nature of rock and can be used to further check thevalidity of this work.
(2) The void ratio is 10%; however, other types of rocks may havemuch lower void ratio. Reduction of void ratio means moreparticles in the computer model are needed, which may not befeasible using standard single-processor computers.
(3) The types of grains considered are mainly based on sedimen-tary rocks. Such types of grains may not represent other rocktypes (including igneous rocks, metamorphic rocks and others).More studies should be carried out to find adequate models fordifferent rock types.
(4) The type of grain contacts considered is point contact. As such,the influence of grain-contact types on the macroscopic be-havior awaits to be further studied. More simulation techniquesshould be developed to represent other types of rocks.
(5) The used of porous particle facilitates simulation of naturalsandstone; however, it does pose limitations. The stiffness andbonding strength are determined based on back analyses,

10 Y.-M. Hsieh et al. / Engineering Geology 99 (2008) 1–10
which are not physical properties than can be obtained throughlaboratory experiments since the “porous matrix” is a con-ceptual model rather than an actual material.
Acknowledgments
The research is partly supported by the National Science Council ofTaiwan, grant numbers NSC-95-2221-E-002-261 and NSC-95-2221-E-002-263. Authors thank Mr. Christopher Fong for his help and advicesin improving the paper.
References
Barbour, T.G., Atkinson, R.H., Ko, H.Y., 1979. Relationship of Mechanical Index andMineralogic Properties of Coal Measure Rock: 20th Symposium of Rock Mechanics,Austin, Texas, pp. 189–198.
Bell, F.G., 1978. Physical and mechanical properties of the fell sandstones, Northumber-land, England. Engineering Geology 12 (1), 1–29.
Bell, F.G., Culshaw, M.G., 1993. A survey of the geotechnical properties of some relativelyweak Triassic sandstones. The Engineering Geology of Weak Rock: Proceedings ofthe 26th Annual Conference of the Engineering Group of the Geological Society,Leeds, United Kingdom. Balkema, Rotterdam, pp. 139–148.
Bell, F.G., Culshaw, M.G., 1998. Petrographic and engineering properties of sandstonesfrom the Sneinton Formation, Nottinghamshire, England. Quarterly Journal ofEngineering Geology 31, 5–19.
Clough, G.W., Sitar, N., Bachus, R.C., 1981. Cemented sands under static loading. Journalof Geotechanical Engineering Division 107 (6), 799–817.
Cho, N., Martin, C.D., Sego, D.C., 2007. A clumped particle model for rock. InternationalJournal of Rock Mechanics and Mining Sciences 44, 997–1010.
David, C., Menendez, B., Bernabe, Y., 1998. The mechanical behaviour of syntheticsandstones with varying brittle cement content. International Journal of RockMechanics and Mining Sciences 35 (6), 759–770.
Dobereiner, L., De Freitas, M.H., 1986. Geotechnical properties of weak sandstone.Geotechnique 36 (1), 79–94.
Dyke, C.G., Dobereiner, L., 1991. Evaluating the strength and deformability ofsandstones. Quarterly Journal of Engineering Geology 24, 123–134.
Ersoy, A., Waller, M.D., 1995. Textural characterisation pf rock. Engineering Geology 39,123–136.
Gunsallus, K.L., Kulhaway, F.H., 1984. Comparative evaluation of rock strengthmeasurements. International Journal Rock Mechanics and Mining Sciences &Geomechanics Abstracts 21 (5), 233–248.
Hatzor, Y.H., Plachik, V., 1997. The influence of grain size and porosity on crack initiationstress and critical flaw length in dolomites. International Journal of RockMechanicsand Mining Sciences 34 (4), 805–816.
Hatzor, Y.H., Plachik, V., 1998. A microstructure-based failure criterion for Aminadavdolomites. International Journal of Rock Mechanics and Mining Sciences 35 (6),797–805.
Hawkins, A.B., McConnell, B.J., 1992. Sensitivity of sandstone strength and deformabilityto changes in moisture content. Quarterly Journal of Engineering Geology 25,115–130.
ISRM, 1981. In: Brown, E.T. (Ed.), Rock Characterization, Testing and Monitoring—ISRMSuggested Methods. Pergamon, New York. 211 pp.
Iverson, S.R., 2003. Investigation of bulk solids engineering properties and applicationof PFC2D to ore pass flow problems. In: Konietzky, H. (Ed.), Numerical Modeling inMicromechanics via Particle Methods. Proceedings of the 1st International PFCSymposium, Gelsenkirchen, Germany. Balkema, Rotterdam, pp. 252–258.Netherlands.
Jeng, F.S., Ju, G.T., Huang, T.H., 1994. Properties of Some Weak Rock in Taiwan:Proceedings of The 1994 Taiwan Rock Engineering Symposium. National CentralUniversity, Chungli, Taiwan, pp. 259–267.
Jeng, F.S., Weng,W.C., Huang, T.H., Lin, M.L., 2002. Deformational characteristics of weaksandstone and impact to tunnel deformation. Tunnelling and Underground SpaceTechnology 17, 263–264.
Jeng, F.S., Weng, M.C., Lin, M.L., Huang, T.H., 2004. Influence of petrographic parameterson geotechnical properties of Tertiary sandstones from Taiwan. EngineeringGeology 73, 71–91.
Lin, M.L., Jeng, F.S., Tsai, L.S., Huang, T.H., 2005. Wetting weakening of tertiarysandstones—microscopic mechanism. Environmental Geology 48, 265–275.
Shakoor, A., Bonelli, R.E., 1991. Relationship between petrographic characteristics,engineering index properties, and mechanical properties of selected sandstone.Bulletin of the Association of Engineering Geologists 28, 55–71.
Singh, S.K., 1988. Relationship among fatigue strength, mean grain size and compressivestrength of a rock. Rock Mechanics and Rock Engineering 21, 271–276.
Smart, B.D., Rowlands, N., Isaac, A.K., 1982. Progress towards establishing relationshipsbetween the mineralogy and physical properties of coal measures rocks.International Journal of Rock Mechanics and Mining Sciences & GeomechanicsAbstracts 19, 81–89.
Tsai, L.S., Hsieh, Y.M., Weng, M.C., Huang, T.H., Jeng, F.S., 2008. Time-dependentDeformation Behaviors of Weak Sandstones. International Journal Rock Mechanicsand Mining Sciences 45, 144–154.
PFC2D (Particle Flow Code in 2 Dimension) Version 3.1, 2004. Itasca Cons Group,Minneapolis.
Plachik, V., 1999. Influence of porosity and elastic modulus on uniaxial compressivestrength in soft brittle porous sandstones. Rock Mechanics and Rock Engineering32, 303–309.
Potyondy, D.O., Cundall, P.A., 2004. A bonded-particle model for rock. InternationalJournal of Rock Mechanics and Mining Sciences 41, 1329–1364.
Ulusay, R., Tureli, K., Ider, M.H., 1994. Prediction of engineering properties of selectedlitharenite sandstone from its petrographic characteristics using correlation andmultivariate statistical techniques. Engineering Geology 37, 135–157.
Vutukuri, V.S., Lama, R.D., Saluja, S.S., 1974. Handbook on Mechanical Properties ofRocks.
Weng, M.C., Jeng, F.S., Huang, T.H., Lin, M.L., 2005. Characterizing the deformationbehavior of tertiary sandstones. International Journal of Rock Mechanics andMining Sciences 42, 388–401.
Weng, M.C., Jeng, F.S., Hsieh, T.M., Huang, T.H., 2008. A simple model for stress-inducedanisotropic softening of weak sandstones. International Journal of Rock Mechanicsand Mining Sciences 45, 155–166.