CHAPTER IV – RESULTS AND INTERPRETATIONS
149
CHAPTER IV – RESULTS AND INTERPRETATIONS – PERSPECTIVE OF TEACHERS 135
-
Upload
khangminh22 -
Category
Documents
-
view
0 -
download
0
Transcript of CHAPTER IV – RESULTS AND INTERPRETATIONS

CHAPTER IV –
RESULTS AND INTERPRETATIONS
– PERSPECTIVE OF TEACHERS
135

Chapter - IV
Results and Interpretations
Perspectives of Teachers
Teachers are largely the providers of services under various plans and programmes for
primary education that are implemented in the schools. The experiences of teachers
largely inform decision making (Berliner, 2004). This chapter includes the views of
the teachers regarding the implementation and impact of the primary education plans
and programmes being implemented in the schools. The teachers teaching at the
selected government schools were considered to be the sample and data was collected
through a structured interview schedule. It was of vital importance to include views of
the teachers as an important aspect of the study as their engagement can largely give a
picture of the effectiveness of the plans and programmes in the schools. The interview
schedule helped in exploring the following themes; understand the current status of
implementation of the primary education plans and programmes, highlight the
perception of the teachers regarding success of the plans and programmes, understand
the problems encountered by them while implementation of those plans and
programmes and subsequently provide suggestions to effective implementation. A
total of 112 teachers were interviewed from the selected Government Schools.
The following chapter is divided into four sections viz.
Section I: Background information of the Teacher Respondents and Implementation
of the Government Plans and Programmes in the School
Section II: Perceptions regarding success of Government Plans and Programmes in
ensuring hundred percent enrolment. This section also includes the analysis of results
using t-test, ANOVA and Post Hoc tests.
Section III: Problems faced in Implementation This also includes the results using t-
test analysis, ANOVA and Post Hoc tests to understand the magnitude of problem
faced in implementation of the plans and programmes.
Section IV: Suggestions from the Teachers regarding effective implementation of the
plans and programmes related to primary education at the school.
136

Section I
Background Information of Respondents and Implementation of Government
Plans and Programmes at Schools
Table 8: Background Information of the Teachers
(N=112)
Profile Categories Frequency Percentage
Gender
Male 51 45.5
Female 61 54.5 112 100
District
Banaskantha 30 26.8
Vadodara 29 25.9
Surat 23 20.5
The Dangs 30 26.8 112 100
Associated with the
school since
1-2 Years 17 15.2
3-4 Years 12 10.7
4-5 Years 14 12.5
More than 5 years 68 60.7
No Response 1 0.9 112 100
Whether undergone
Teacher Training
Yes 96 85.7
No 06 5.4
No Response 10 8.9 112 100
Out of the total respondents, 45.5% were males while 54.5% were females. As far as
District wise distribution of respondents is concerned, Banaskantha and The Dangs
had 26.8% of respondents (30 each) while Vadodara had 26.8% (29) respondents and
Surat had the least, 20.5% (23) respondents. The Right to Education Act (RTE)
mandates an optimal teacher student ratio of 1:30 for all Indian schools. This mandate
is to ensure that individualized attention is provided to each student. However, this
was not the scenario in the Kendra Shalas or Centre Schools in Banaskantha and Surat
where the number of children was quite high and as against that, the number of
teachers was lower. This only meant that were more students to be managed leaving
them with lesser individualized attention.
Teachers‘ association with the schools is quite essential to know how the school has
improved over the years and being closer to the community members, the strategies
137

Each year it’s the same…..
“Badhu same same dar vakhate hoy chhe. Kaik navu hotu nathi.” (Everything is same
each year and there is nothing new). – A female teacher from Surat
Training is like a waste of time…
“Ek jaat nu waste of time thaay chhe kem ke badhu ek jevuj hoy dar training ma.” (It‘s a
kind of waste of time as evrytime the content is the same in every training). – A female
teacher from Vadodara
Often teachers are busy and they don’t get to attend the training…..
“Je shikshak sarkar ni kaamgiri ma nathi hota athva senior hoy, ene training ma district
level par mokalva ma aave chhe. Ghani vakhate shikshako kaamgiri ma atvayela hoy
chhe ane training ma javanu nathi maltu.”(Teachers who are not occupied in
Government work or are senior in nature are sent for the training at the district level.
Many a time teachers are occupied with work and thus they don‘t get to attend the
training). – A female teacher from The Dangs
that the school needs to be adopted would be best decided. The data revealed that
60.7% (68) teachers were associated with the schools since more than 5 years. 12.5%
(14) teachers were associated with the school since 4-5 years. 10.7% (12) teachers
were associated with the school since 3-4 years and 15.2% (17) teachers were
associated with the school since 1-2 years.
Teaching is one of the most demanding vocations and in order to fulfill their roles,
regular training is quite necessary. The training needs of the teachers in the
Government schools are truly daunting. It was found that the pre-service training
curriculum followed is often outdated and does not develop teachers who can handle
the challenges of their roles innovatively. Given this scenario, the in-service teacher
education and professional development is one of the greatest challenges in ensuring
that RTE not only provides access to education but also ensures quality in education
too.
With regard to teachers having undergone training in the past year, it was found that
85.7% (96) teachers said that they had undergone pre-service and in-service training,
5.4% (6) said that they haven‘t attended any in the past year while 8.9% (10) chose
not to respond. Informal conversations with the teachers who had attended the
training revealed that there were many issues with the training specifically with the
content.
138

Table 9: Distribution of Teacher's responses regarding implementation of
Government Plans and Programmes for Primary Education in Schools
(N=112)
Programme Yes No No
Response Total
Right to Education Act 111 (99.1%) - 1 (0.9%) 112 (100%)
Mid Day Meal 111 (99.1%) - 1 (0.9%) 112 (100%)
Shala Praveshotsav 111 (99.1%) - 01 (0.9%) 112 (100%)
Gunotsav 111 (99.1%) - 01 (0.9%) 112 (100%)
Kanya Kelavani Yojna 104 (92.8%) 03 (2.6%) 05 (4.6%) 112 (100%)
99.1% (111) teachers said that their schools implemented the RTE Act, while 0.9%
(1) chose not to respond.
99.1% (111) teachers said that their schools implemented the Mid Day meal scheme,
while 0.9% (1) chose not to respond.
99.1% (111) teachers said that their schools implemented the Shala Praveshotsav,
while 0.9% (1) chose not to respond.
99.1% (111) teachers said that their schools implemented the Gunotsav Programme,
while 0.9% (1) chose not to respond.
92.8% (104) teachers said that their school implemented the Kanya Kelavani Yojna,
2.6% (03) teachers responded that their schools do not implement the Kanya Kelavani
Yojna while 4.6% (05) didn‘t respond to the question.
139

Efforts made by school to promote awaress regarding Government
Plans and Programmes N=112
Efforts made by the Schools to promote awaress regarding Plans and Programmes
96.4%
39.3% 41.1% 47.3%
Hold Annual Campaigns Distribute Posters and Hold Regular Meetings Take Help of Community
Booklets Leaders
Table 10: Distribution of teachers’ responses regarding efforts made by schools
to promote awareness regarding government programmes
(N=112)
Efforts Made Response Frequency Percentage
Hold Annual
Campaigns
Yes 44 39.3
No 68 60.7 112 100
Distribute Posters
and Booklets
Yes, distributed 46 41.1
No, not distributed 66 58.9 112 100
Hold Regular
Meetings
Yes, regular meetings held 108 96.4
No, not held 4 3.6 112 100
Take Help of
Community Leaders
Yes, help is taken 53 47.3
No, not taken 59 52.7
112 100
Figure 19: Teachers’ responses regarding efforts made by schools
to promote awareness regarding Government programmes
Majority of the teachers, 96.4% (108) said that their schools hold regular meetings
with the community members in order to spread awareness regarding the government
efforts towards primary education followed by 47.3% (53) teachers saying that their
schools take help of community leaders to spread awareness amongst the people.
These community members largely included School Management Committee (SMC)
Members, Anganwadi Workers and Village level workers who had a good rapport
140

Community members refer to the posters printed by the Government….
“Sarkar taraf thi drawing karela saara ma na posters aape chhe gujrati ma jema ghana
badha pictures hoy chhe. Aam to je manas vaanchi na shake, ene khabar to padij jaye ke
poster shu kehva maange chhe. Ame aava posters nu vitran gaam ma kariye athva shada
ma mukiye chhe jethi ae loko ne jyare faave ae aaine joine jay athva mahite le shikshako
paase thi. Aavi Shishyavrutti ni ghani mahiti aapi chhe school taraf thi valiyo ne.” (The
Government gives a lot of posters with infographics in gujarati. Even a person who
cannot read can see and understand. We have distributed such posters in the village and
kept them in school, whenever the people want they come and see the posters and seek
help from the teachers. This way we have given a lot of information regarding
scholarship to the parents from the school). – A female teacher from Dangs
with the community members at large. The least used method to spread awareness
was holding annual campaigns. Only 39.3% (44%) teachers said that their schools use
campaigns as a method of spreading awareness regarding the plans and programmes
related to education. Public campaigns prove to be an important determinant of
awareness generation regarding Government efforts towards primary education.
Communication, education and public awareness programs are critical to achieving
support for such initiatives. Creating awareness at the community level requires more
than simply transmitting and receiving information; it requires identifying the
emotional and practical approach towards dealing with people and thus designing
effective communication campaigns (Everett, 2003). Moreover, public awareness
campaigns help in increasing support and stimulate self-mobilization. Raising
awareness regarding the educational efforts of the government is quite essential to
mobilize local knowledge and resources.
41.1% (46) teachers said that they distribute posters and booklets to generate
awareness amongst the community members. Considering that the members of The
Dangs district were largely agricultural laborers, they didn‘t have much time to come
to the school and attend meetings. Another major reason being that such take away
material with infographics and pictures prove to be a great source of retention for the
community members as they often store such material and take help from local
leaders to seek information regarding the booklets and posters. Despite the fact that
the people in Dangs were not too literate, poster form of communication for spreading
awareness was more popular amongst the people.
141

Table 11: Distribution of teachers’ responses regarding year of implementation
of Right to Education Act (RTE) in the school
(N=112)
Year of Implementation Frequency Percentage
2010-12 104 92.9
2013-15 01 0.9
No Response 07 6.3
112 100
The RTE Act came into force on 1
st April 2010 and the mandate required all the
government run primary schools across the country to implement it from 2010
onwards. During the time only 19 Indian states had notified the RTE rules which
included Rajasthan, Tamil Nadu, Madhya Pradesh, Karnataka, Andhra Pradesh and
Maharashtra. The major obstacle stated by many states regarding implementation of
the Act included the paucity of funds (Ramakant Rai, National Coordinator, National
Coalition for education in New Delhi).
The data revealed that 92.9% (104) respondents claimed their schools implemented
RTE in 2010-11 itself, while 0.9% (1) of them claimed their schools implemented in
2013-15 whereas 6.3% (07) did not choose to respond at all.
Table 12: Distribution of teachers’ responses regarding facilities provided under
RTE
(N=112)
Facilities Provided Not Provided No Response Total
Free Admission 112
(100%) - -
112 (100%)
Free Books 112
(100%) - -
112 (100%)
Free Uniform 112
(100%) - -
112 (100%)
Mid Day Meal 112
(100%) - -
112 (100%)
Separate Toiltes for Boys and Girls
112 (100%)
- - 112
(100%)
Classroom 105
(93.8%) 7
(6.3%) -
112 (100%)
Library 98
(87.5%) 13
(11.6%) 1
(0.9%) 112
(100%)
Playground 89
(79.5%) 22
(19.6%) 1
(0.9%) 112
(100%)
Computer Lab 79
(70.5%) 32
(28.6%) 1
(0.9%) 112
(100%) Figures in parentheses indicate percentage
142

Free admission, free books and Uniform
All the schools provided free admission to the children in all the districts as per the
mandate. Free books and uniform were also provided as per the mandate.
Playground
The intent of inclusion of playground as an infrastructural requirement of a school
was to ensure that children have sufficient open space for sports and other physical
activities during school hours. However it was not mandatory for the school
management to provide this facility within the school premises, it can be provided in
adjoining playground/park etc for the children to play. This was added as a clause by
the Ministry after receiving a representation from State Governments stating paucity
of open space areas especially in metro cities and crowded localities dated 26the
October 2012.
The findings revealed that 79.5% (89) revealed that their schools had the playground
facilities or its equivalent while 19.6% (22) claimed that there were no such facilities
in the schools, whereas 0.9% (1) did not choose to respond.
Classrooms
As far as proper classrooms are concerned as per the mandate, the State Government
should upgrade existing schools with classes. Banaskantha had a shortfall of classes.
The RTE Act 2009 provided a time frame of three years from the commencement of
the Act for the completion of school infrastructure. 93.8% (105) respondents admitted
that their schools had proper classrooms while 6.3% (07) respondents revealed that
their schools lacked proper classroom facilities which were not adequate for the
teaching learning procedure.
Mid-Day Meal Scheme
All the schools had MDM facilities provided.
Computer Labs
RTE mandates provision of computer labs with the major aim to inculcate ICT in
education. The findings revealed 70.5% (79) of the teachers revealed that their
schools had provision of computer labs; other 28.6% (32) revealed that their schools
143

There are computers in school, but no teachers to teach them….
“Computer room to chhej pan koi shikshak nahi bhanavva valo.” (There is a computer
lab in the school but no teacher to teach) – A male teacher from Surat
did not have provisions of computer lab. It was also observed that the schools which
had computer labs had computers which were in a very outdated conditions, most of
which were not working and most of the schools did not have any teachers to teach
computers to the children.
Separate Toilets for Boys and Girls
All schools had separate toilets for girls and boys and in working conditions.
Library
The RTE mandate requires each school to establish a library in a room equipped with
furniture, almirah, racks, fixtures, fittings, circulation are etc. 87.5% (98) revealed that
their school had library whereas 11.6% (13) teachers revealed that their school did not
have any facility for the library. It was also found that most of the schools had books
which were donated by several NGO‘s or community members. However largely,
they were lying unused. Corresponding to this there was no reading period in most of
the schools which would let the children access the books and read.
Table 13: Distribution of teachers’ responses regarding ensuring
Community Participation for Implementation
(N=112)
Community Participation Ensured Frequency Percentage
Yes, it is ensured 100 89.3
No, it is not ensured 10 8.9
No Response 02 1.8
112 100
144

Parents don’t come only…..
“Valiyo to aavtaj nathi kemke ae kheti par jata reh ane saanje moda aave. Kai pan
program hoy, agau pan kahiye chhe to ae aavtaj nathi.” (Parents do not come as they
leave for agricultural work and come late in the evening. Whenever there is a program we
tell them in advance, yet they don‘t come). – A female teacher from Dangs
Figure 20: Teachers’ responses regarding ensuring
Community Participation for Implementation
Community participation is generally identified as the collective involvement of local
people in assessing their needs and organizing strategies to meet those needs‖ (Zakus
& Lysack, 1998). It is said to be the vital ingredient for community development.
Studies have linked community participation to greater program outcomes such as
greater access to social services (Bedelu, Ford, Hilderbrand, & Reuter, 2007).
Community participation is a central and important factor in planning,
implementation and monitoring interventions under the RTE Act 2009 to ensure
meaningful participation of key stakeholders and transparency in implementation.
89.3% (100) respondents said that community participation for the implementation of
the programs is sought whereas 8.9% (10) said that community participation is not
sought whatsoever.
145
Ensuring Community Participation
Yes No No Response
9% 2%
89%

Extra-curricular activities are as important as curricular activities…..
“Vidyarthi maate itar pravittiyo pan khoob agatya ni chhe jetli ke shaikshanik pravittiyo.
(Other activities are as important as educational activities for a child). – A male teacher
from Surat
We take the students out to play in our own vehicles…..
“Amari school ma aatlo protsahan aapvama aave chhe ke principal ane ame shikshako
pote amara kharche badako ne ramat gamat maate lai jaiye chhe.” (Our school
encourages to the point that the Principal and teachers sometimes take the children for play
and recreational activities at their own cost) – A male teacher from Surat
It is important to motivate the children…..
“Protsahan aapvo jaruri chhe, aana thij badako ne ras aavshe nishaade aavano.
(Encouragement is important; it is only because of which children will find it interesting
to come to school). – A male teacher from Banaskantha
Some students are interested, while some are not…..
“Badhaj ek sarkha na ahoy vidhyarthiyo. Amuk ne bhanvama ras hoy ane amuk ne
ramva ma. Banne category na vidhyarthiyo ne protsahan aapvama aave chhe.” (All
children are not the same. Some are interested in studying while some are interested in
playing. Both the categories of students are encouraged). – A female teacher from
Banaskantha
Table 14: Distribution of teachers’ responses regarding
encouragement of Children to participate in curricular and co-curricular activities
(N=112)
Participation of children in curricular and
co-curricular activities Frequency Percentage
Yes, children are encouraged 112 100
112 100
A school is a place that provides an environment for the all round development of the
child‘s personality which includes encouragement of children in the curricular, co-
curricular as well as the extra-curricular activities. It was found that the schools
provided opportunities to the children leading to their all round development. It was
observed that all the teachers were very positive when it came to encouraging the
children into inter-school competitions and Khel Mahakumbh etc.
146

Table 15: Distribution of teachers’ responses regarding whether the No-Detention
Policy is followed in the school
(N=112)
No Detention Policy Frequency Percentage
Yes, it is followed 103 92.0
No, it is not followed 07 6.3
No Response 02 1.8
112 100
According to the recent Gazette published by Ministry of Law and Justice on January
11, 2019, it is stated that there shall be regular examination in the fifth and the eighth
grade at the end of every academic year. Quoting the Gazette, if a child fails in the
examination referred to in sub section (1) he should be given additional instruction
and granted opportunity for re examination within a period of two months from the
date of declaration of the result. It is also stated that the appropriate Government may
allow schools to hold back the child in fifth or eighth grade if the child fails in the re-
examination as well. However no child shall be expelled from the school till the
completion of elementary education.
The findings related to the no-detention policy revealed that 92% (103) teachers said
that their schools follow the no detention policy while the other 6.3% (7) teachers said
that their schools don‘t follow the no detention policy owing to the new circular
received. Informal decision with the teachers revealed that the no detention policy is
doing more harm than good as the minimum levels of learning of the children are
seldom achieved.
147
The child will not learn anything if promoted just like that….
“Vidhyarthi jyare koi ek varg ma bhantar ma saaro na hoy ane ene promotion
aapvama aave, to ae to kashu shikhvanoj nathi kemke ena mind ma aa vaat tevai gayi
chhe k bhano k na bhano, pass to thavanaj chhe ne.” (If a student in any class is not
good at studying and he/she is promoted, he/she is not going to learn anything as it is
fitted in his mind that he/she will be promoted whether he/she studies or not) – A
female teacher from Surat
What will the future of the children be?
“Chhokrao nu bhavishya su thhay jyare emne pass kari devama aave, jyare ae loko
kashu shikhya na hoy.”(What will be the future of the children if they are promoted
when they haven‘t learnt anything) – A male teacher from Surat

Children are not included in meetings as their education would suffer…..
“Badako nu samavesh aam to karva ma aave chhe paripatra pramane, pan meetingo
ma aamno aam koi kaam hotu nathi, ae loko nu abhyas bagde.” (Students are as such
added in the Committee according to the circular but they don‘t have any work in the
meetings as such). – A female teacher from Vadodara
Children are included during the Mid Day Meal implementation…..
“Vidhyarthiyo nu samavesh Madhyan Bhojan ni kaamgiri jova ma leva ma aave chhe.”
(Children are involved in the overlooking of the Mid Day Meal activities). – A male
teacher from Dangs
Table 16: Distribution of teachers’ responses regarding formation of
School Management Committee in school
(N=112)
Formation of SMC Committee Frequency Percentage
Yes, SMC has been formed 112 100
112 100
100% (112) teachers said that their schools had SMC formed as per the RTE 2009
Gazette with inclusion of 75% of the parents and guardians of the students of the
school and 25% (1/3) would be among the elected representatives of the local
authority, 1/3 from among the teachers of the school and remaining one third from the
local educationists. The mandate also has provision of inclusion of the children of the
schools in the SMC Committee; however, it was found that none of the schools had
inclusion of children in the committee when it came to meetings, it was just for
namesake.
The School Management Committee has the responsibility of monitoring the working
of the school and its activities and often, the members also have a duty to overlook the
mid day meal activities. It was found through interaction with the community
members in Dangs and Banaskantha that the community members, apart from the
SMC members did overlook the cooking and serving of the mid day meals in schools
at some point of time.
148

29.5%
20.5%
6.3% 2.6%
Other Four times a year Twice a year Once in two
Months
Once a Month
41.1%
Frequency of SMC Meetings in School
Table 17: Distribution of teachers’ responses regarding frequency of
School Management Committee (SMC) Meetings in schools
(N=112)
Frequency of SMC Meetings Frequency Percentage
Once a Month 46 41.1
Once in two months 33 29.5
Four times a year 23 20.5
Twice in a year 07 6.3
Other 03 2.6
112 100
Figure 21: Frequency of School Management Committee Meetings in School
As per the RTE mandate, the School Management Committee (SMC) meetings have
to take place once a month month to oversee the working of the school, prepare
school development plan and monitor utilization of Government grant etc.
The findings regarding frequency of SMC meetings revealed that only 41.1% (46)
teachers said that the SMC in their schools meets once a month. 29.5% (33) said that
the SMC in their schools meets once in two months. There were also teachers who
said that the SMC in their schools meet twice a year, 6.3% (07) and 2.7% (03) said
that the SMC in their schools meets as and when the need arises.
A study conducted by Kumar, S. entitled ―Roles and Functions of the School
Management Committees (SMC‘s) Of Government Middle Schools In District Kullu
Of Himachal Pradesh: A Case Study‖ and published in the Scholarly Research Journal
for Humanity Science and English Language (2016) aimed to study the roles and
149

functions of the SMC in the management and improvement of the schools. The
findings revealed that SMC members are not aware about the purpose behind the
formation of School Management Committees as they largely did not meet often.
Teron (2012) undertook a study entitled Functioning of School Management
Committee in Golaghat District of Assam and found that the SMC‘s were formed as
per the RTE guidelines and meetings and trainings of the members took place
regularly.
It was found that despite 41.1% (46) teachers claiming the meetings take place once a
month, there was little or no clarity of work amongst the members. The findings of
the present study are matched with above mentioned Kumar‘s (2016) study stating
that the SMC members are not aware about their roles and responsibilities as such.
Considering the fact that Dangs, Banaskantha and Surat had a lot of seasonal laborer
population, according to the perception of the teachers in these Districts, it is very
difficult to call and assemble the parents for the meetings as they go away for work
and are seldom ready to come and attend the meetings held at the school.
Parents are called but they don’t come…..
“Valiyo ne bolava ma aave chhe, chhata aavta nathi.” (Parents are called but despite
that they don‘t come) – A male teacher from Dangs
We conduct meetings once a month with whoever comes…..
“Je SMC na vaali sabhyo hoy, ae kyaare aave kyaare nathi aavta, chhata meeting to
ame mahina ma ek vakhat kariye je aave eni saathe.” (The SMC parent members
sometimes come and sometimes don‘t, despite that, we conduct meetings once a month)
– A female teacher from Dangs
Meetings are held whenever the need is felt…..
“Meeting to jyare jarur pade, tyare rakhvama aave chhe. Aam to madhyan bhojan
darmyan athva tithi bhojan yojavva ma aave chhe to vaali SMC sabhya haajr hoye pan
meeting aam regular to nathi rakhvama aavti kemke amne pan kaamgiri etli ane saaheb
ne pan.” (Meetings are organized as and when required. Usually, parent SMC members
are present during Mid Day Meal and Tithi Bhojan when it is organized but meeting as
such are not held regularly because we are busy with work and so is (Principal) Sir.) – A
female teacher from Vadodara
150

100.0%
90.0%
80.0%
93.8%
N=112
76.8%
70.0%
60.0%
50.0%
40.0%
30.0%
20.0%
60.7%
43.8%
25% 27.7%
14.3% 21.4%
10.0%
0.0%
2.7% 3.5%
11.6%
8% 3.6% 7.1%
0
Quality of
Education
To a Great Extent
Infrastructural
Facilities
To Some Extent
Mid Day Meal
To the Least Extent
Admission related
Queries
Don't Know
Table 18: Distribution of teachers’ responses regarding
Points of Discussion in School Management Committee (SMC) Meetings
(N=112)
Agenda To a
Great
Extent
To Some
Extent
To the
Least
Extent
Don’t
Know Total
Quality of Education
105 (93.8%)
3 (2.7%)
4 (3.5%)
- 112 (100%)
Mid Day Meal 86
(76.8%) 13
(11.6%) 9
(8%) 4
(3.6%) 112 (100%)
Infrastructural Facilities
68 (60.7%)
28 (25%) - 16
(14.3%) 112 (100%)
Admission related queries and discussions
49
(43.8%)
24
(21.4%)
31
(27.7%)
8
(7.1%)
112 (100%)
Figures in parentheses indicate percentages
Figure 22: Points of discussion in School Management Committee (SMC) meetings
Quality of education is to a large extent one of the many topics of discussion in the
SMC meetings according to most of the teacher respondents, 93.8% (105). In terms of
quality of education, the committee discusses the teaching and learning
methodologies that need to be adopted in order to ensure that the children enjoy the
process of teaching and learning and at the same time, they achieve the basic
milestones aswell. 60.7% (68) of the teachers said that to a large extent, discussions
151

regarding infrastructural facilities takes place in their schools, 25% (28) teachers said
that the infrastructural facilities are discussed to some extent in their schools.
Discussion regarding infrastructural facilities in many schools mainly included the
decision regarding unitization of school development funds and meeting the
infrastructural needs of the school in terms of construction of classrooms and staff
rooms, ensuring that there is enough furniture for the children to study, maintenance
of available infrastructure and ensuring cleanliness of the school campus.
Since MDM is a successful initiative by the Government, 76.8% of the teachers
reported that discussions related to MDM, regarding the facilities provided under
MDM, the donations that come in the form of food for the children by various
companies and agencies etc are discussed to a large extent in the SMC meetings.
Admission related queries seldom come, regardless of that, ensuring that the
procedure of admissions each year is made easier and in such a manner that each
parent gets assistance regarding admitting their child to the nearest schools,
discussions in the SMC meetings take place to a large extent as per 43.8% (49)
teacher respondents.
The data clearly suggests that as per the teacher respondents, much of the discussions
in the SMC meetings take place around quality of education compared to other things
like MDM, infrastructural facilities and admission related queries.
Table 19: Distribution of teachers’ responses regarding
inception of Mid-Day Meal in school
(N=112)
Inception of MDM Frequency Percentage
5 Years Ago 29 25.9
Since Inception 83 74.1
112 100
The Mid Day Meal in Gujarat was started in the year 1984, second in the country to
implement the scheme. In 1995, launching of Mid Day Meal Scheme was the major
initiatives of Government of India. November 28, 2001, Supreme Court passed an
order to regularize the quality of cooked mid day meal in primary school within 6
months (Dave & Mandaviya, A Crtitical Review on MDM Scheme: A CaseStudy of
Gujarat, India, 2014). 25.9% (29) teachers said that the noon programme in their
152

school was started five years ago in the form of cooked meals and not dry snacks. The
remaining 74.1% (83) said that the scheme was started in their school since its
inception in the year 1984.
Akshaya Patra was providing meal facilities in some villages of Surat and Vadodara
but in most of the villages in Dangs and Banaskantha, the noon meal is cooked in the
schools itself with the help of local community members or with the help of workers
appointed under the MDM Programme.
Table 20: Distribution of teachers’ responses regarding
type of food served under Mid Day Meal in their School
(N=112)
Type of Food Served in MDM Frequency Percentage
Dry Snacks 02 1.8
Cooked Meal 72 64.3
Both 38 33.9
112 100
The MDM scheme began in 1995 with the introduction of dry meals like fruit, baked
porridge, raw wheat, rice, sweet/salted Mathis and uncooked food grains. From 3rd
June 2006 onwards, NGO Stri Shakti was introduced provide cooked meals to the
students as per the guidelines of the scheme. In the year 2007, The Akshaya Patra
Foundation (TAPF) was invited as another NGO to set up various centralized kitchens
in Gandhinagar. (Mid Day Meal Scheme Web Page, Government of Gujarat).
Ideally, under the Mid Day Meal scheme, the children are provided with a full
nutritious meal that includes fruits, vegetables, pulses, legumes and food grains in
addition to milk. State-wise the menu differs according to the locally available
material and requirement of the children.
1.8% (02) respondents said that their schools provide dry snacks to the children.
Under the dry snacks, Sukhadi, a protein and calorie rich recipe is provided to the
children or boiled chickpeas and boiled whole black grams. 64.3% (72) of the
teachers claimed that only cooked meals are provided in the schools which include
dal, rice, roti and vegetables. The findings revealed that 33.9% (38) of the teachers
reported having served both, dry and cooked meal to the children under the MDM
programme. At the onset of the school activities, children are provided with dry
153

snacks followed by the noon meal for morning schools and for the afternoon schools,
the meals are provided and dry snacks are provided later during the day. In Dangs, the
Dudh Sanjeevani Yojna is active where 200 ml of 154ad eke154ng154 milk is
provided for five days in a week to children of classes I to V. This programme in
Gujarat is implemented in 21 developing blocks of Gujarat. Apart from the meal that
is regularly provided the concept Tithi Bhojan is implemented in many schools across
the state where donations in the form of sweet, namkeen or sprouts are given by
various people to enhance the taste of the mid-day meal.
Certain types of snacks are given under Tithi Bhojan…..
“Tithi bhojan ni antargat, gaam na amuk loko badako ne kaik nasto aape chhe.
Donation ma Ghana vakhate loko nishaadej bhojan raandhe chhe.” (Under the Tithi
Bhojan, certain members of the village provide snacks to the children. As a donation,
many people get the meals cooked in the school only.) – A female teacher from
Dangs
The timings for dry snacks is fixed….
“Savaar ni pali na badako ne suko nasto aapvama aave prarthana sabha baad ane
madhyan bhojan 11:00 vaage aapvama aave chhe. Bapor ni pali na badako ne 12-
12:30 vaage madhyan bhojan aapvama aave and saanje 4:00 vaage suko naasto”
(Children of the morning school batch are given dry snacks after the morning
assembly and are given mid day meal at 11:00 am. Students of the afternoon batch
are given mid day meal at 12-12:30 pm and are given dry snacks at 4:00 pm.) – A
male teacher from Surat
Menu for meals is fixed…..
“Jamva ma to je school nu je menu hoy ae aapvama aave jemke daal dhokli, shaak
rotli, sambhar chaval. Ane suka nasta ma to sing chana, mamra, sukhadi, chikki
athva to bafela chana hoy.” (Lunch is according to the school menu like Daal
Dhokli, vegetable and rice, sambhar and rice. While in dry snacks ground nuts,
puffed rice, chikki or boiled horse gram dal is provided.) – A female teacher from
Vadodara
154

Table 21: Distribution of teachers’ responses regarding
whether Mid Day Meal cooked in school
(N=112)
Whether MDM cooked in
school Frequency Percentage
Yes, cooked in school 82 73.2
No, not cooked in school 30 26.8
112 100
Largely, Akshaya Patra Centralized Kitchens in 6 Districts of Gujarat viz.
Ahmedabad, Bhavnagar , Bhuj, Kalol, Surat and Vadodara and that too in limited
blocks (Mid Day Meal Scheme Web Page, Government of Gujarat). 73.2% (82)
respondents said that the food for MDM is cooked in the school whereas 26.8% (30)
said that the meal is provided by Akshaya Patra and hence not cooked in school.
Except the Vadodara block, meals were cooked in schools in Blocks of Banaskantha,
Surat and The Dangs in the school kitchens itself.
Table 22: Distribution of teachers’ responses regarding
facilities available in school if meal is cooked in school
(N= 82)
Facilities Yes No Total
Kitchen 81 (98.8%) 1 (1.2%) 82 (100%)
Place to Keep Food grains 81 (98.8%) 1 (1.2%) 82 (100%)
Cooking Gas 81 (98.8%) 1 (1.2%) 82 (100%)
Figures in parentheses indicate percentage
The schools where MDM is cooked within the school premises, 98.8% (81) of the
respondents said that their schools had all the facilities under MDM viz. Kitchen,
place to keep food grains and Gas to ensure that the meals are cooked properly.
One such school in The Dangs District did not have these facilities and so the food
was cooked in the open area on the logs and food grains were stored in the
Anganwadi centre which was in a very shabby condition.
155

Table 23: Distribution of teachers’ responses regarding
provision of dishes under Mid Day Meal Programme
(N=112)
Dishes provided by Frequency Percentage
School 82 73.2
Children get from home 21 18.8
Other 09 8
112 100
The Mid Day Meal scheme document mentions that the plates, glasses for food needs
to be provided by the school from the funds provided by the State. 73.2% (82)
respondents said that the dishes for MDM are provided through the school with the
help of the State funds. 18.8% (21) respondents said that the children get the dishes
from home while 5.3% (06) teachers stated that the dishes come in the form of
donations from Gram Panchayat or from donors from various companies and places.
Table 24: Distribution of teachers’ responses regarding
monitoring of MDM in school (Multiple Responses)
(N=112)
Monitoring of MDM undertaken by Frequency Percentage
Teachers 84 75.0
Parent Teacher Associations (PTA) 21 18.8
Parent Representatives 21 18.8
School Management 17 15.2
Gram Panchayat 04 3.6
*Multiple responses, hence total will not match upto hundred percent
Figure : Distribution of teachers’ responses regarding
monitoring of MDM in school
156
75%
18.8% 18.8% 15.2%
3.6%
Gram Panchayat PTA Parent
Representatives
Teachers School
Management
Monitoring of MDM undertaken by

CRC and BRC come once a month to inspect MDM work…..
“CRC saheb ane BRC saheb aave mahina ma ek vakhat Madhyan Bhojan ni kaamgiri jova
maate.” (CRC sir and BRC Sir come once in a month to overlook the work of the Mid Day
Meal in the school) – A female teacher from Dangs
Parents sometimes come to see whether children eat or not
“Valiyo amuk vakhate aave chhe jova ke badako khaay chhe ke nahi.” (Parents come
sometimes to see whether the children are eating or not) – A male teacher from Surat
Panchayat members come very less to check….
“Panchayat na sabhyo ghana ochha aavya chhe kaamgiri jova maate.” (Members of the
Panchayat have come the least to overlook the work) – A female teacher from Dangs
The Department of School Education and Literacy, Ministry of Human Resource
Development has given a comprehensive mechanism for undertaking the monitoring
and supervision of the MDM programme which includes arrangements for local level
monitoring including Gram Panchayat members, School Development Management
Committees, Parent Teacher Associations etc to overlook certain aspects of the
implementation of the MDM programme. Apart from that, there is also a Block level
Committee including Cluster Resource Coordinators and Block Resource
Coordinators who monitor the programme from time to time. There is also a District
Level Committee including Members of Parliament, State Legislatures and Zila
Parishad have to overlook the monitoring and supervision.
The MDM scheme document also highlights that effective arrangement for close
supervision and monitoring of MDM programme must be made. At the school level,
the SMC has to ensure community participation in the scheme.
Majority of the teacher respondents, 75% (84) claimed that the teachers monitor the
MDM in the schools in terms of the quantity served, seating arrangement of the
children at the time of eating the meal, ensuring no wastage of food and making sure
that children wash the dishes properly after eating.
15.2% (17) said that the school management committee ensures the monitoring of the
MDM scheme in school which is one crucial aspect of their roles and responsibilities.
157

Table 25: Distribution of teachers’ responses regarding
helpers recruited under Mid Day Meal Programme (Multiple responses)
(N=112)
Helpers Recruited Frequency Percentage
Manager 93 83.0
Cook 78 69.6
Helper 105 93.7
*Multiple responses, hence total will not match upto Hundred percent
The MDM scheme document puts forward that a cook-cum-helper upto 25 students
along with one additional cook-cum-helper for every addition upto 100 students must
be appointed, the expenditure of which must be charged between the Centre and the
States.
93.7% (105) teachers said that their schools have recruited helpers to help serve the
MDM to the children and clean up the area after the meal. 83% (93) teacher
respondents said that their schools recruited a manager to oversee the MDM
implementation while 69% (78) teachers said that they recruited a cook to cook the
meals in the schools under MDM. The managers were basically appointed to monitor
the activities of the cook and/ or helper. The schools where the food was cooked in
the premises only had a cook who prepared the meals and a helper who usually did
odd jobs of cutting the vegetables, washing the shed, utensils etc.
158
SMC members and students sometimes overlook the implementation….
“SMC na sabhyo hoy amuk vakhat ane vidhyarthi pratinidhiyo to kaamgiri jova maate
nishaadej hoy. Ae jove ke badha vidhyarthiyo khavanu bagad na kare, kaya vidhyarthiyo no
vaaro chhe jamvanu pirasvanu, badha pot-potana disho dhoye chhe ke nahi.” (Sometimes
members of School Management Committee and student representatives are present at
school to oversee the activities. They oversee that the students do not waste the food, which
students would have to serve the meals and whether the students wash their dishes or not)
– A male teacher from Banaskantha

Table 26: Distribution of teachers’ responses regarding
inception of Kanya Kelavani Yojna in schools
(N=112)
Inception of Kanya Kelavani Yojna in school Frequency Percentage
2 years ago 3 2.6
3-4 years ago 2 1.8
5 years ago 91 81.3
Don‘t Know 16 14.3
112 100
Women‘s education in Gujarat in the year 2001 was on the 20th
position with a mere
literacy of 48.1% amongst girls. The then Chief Minister, Shri Narendra Modi
collaborated with IAS, IPS for a massive Kanya Kelavani Rath, turning it into a
massive movement in the year 2009 (Government of Gujarat, 2019). 81.3% (91) of
the teachers said that their school started the implementation of Kanya Kelavani
Yojna more than five years ago around the same time when it was launched. 2.6% (3)
teachers said that their schools implemented Kanya Kelavani Yojna in the last 3-4
years. 14.3% (16) teachers did not know as they were fairly newly recruited to the
schools.
Table 27: Distribution of teachers’ responses regarding
provision of scholarship under Kanya Kelavani Yojna
(N=112)
Facilities Yes No No
Response Total
Scholarship 84 (75%) 7 (6.3%) 21 (18.7%) 112 (100%)
Figures in parentheses indicate percentage
Under the Kanya Kelavani Yojna, the girl child is provided with Rs.1000 every year
in the bank account till the completion of elementary education to support the
expenses of education. 75% (84) teachers responded that their schools have girl
children who avail the scholarship under KKY. 6.3% (07) responded that girls in their
schools have not availed the KKY due to several reasons like not having a bank
account, having a bank account but no money received yet etc. 18.7% (21) teachers
chose not to respond to the question as they were not aware regarding the facilities
being availed by the girl children in the schools or were not aware of the scheme
altogether as they were young and fresh new recruits. It was also found that new,
young teachers were recruited in schools but they had not attended any meetings or
159

No one from Jilla Panchaya ever came…..
“Aam to Shala Praveshotsav ma BRC ane CRC saheb aave chhe, koi Jilla Panchayat ma
thi aavya nathi kyarey.” (BRC and CRC sirs come during Shala Praveshotsav. No one
from the Legislative Assembly from the District came ever) – A male teacher from Dangs
“Na, jilla ma thi koi sabhyo aaj sudhi nishaad ni mulakat leva aavya nathi. CRC saheb
ane BRC saheb aave ane gaam na loko saathe vaat chit kare and rally jevi kaade.” (No,
no member from the District have come to visit the school. CRC and BRC sir come and
interact with the village members and conduct a sort of rally.) – A female teacher from
Dangs
trainings due to which their awareness regarding implementation of many schemes
and programmes was quite low.
Table 28: Distribution of teachers’ responses
regarding holding of Shala Praveshotsav in school last
(N=112)
Implementation of last Shala Praveshotsav in
school Frequency Percentage
2 years ago 99 88.4
3-4 years ago 4 3.6
5 years ago 6 5.4
No Response 3 2.6
112 100
The Shala Praveshotsav or the School Admission Festival was launched in the year
2003 by Gujarat Government under the Sarva Shiksha Abhiyan to ensure hundred
percent enrolment. Under this, the Hon‘ble Chief Minister, Ministers, Officials of
District and State level travel to various remote villages to encourage the parents to
enroll their children in schools. (Government of Gujarat). 88.4% (99) teachers said
that last Praveshotsav in their school was held a year ago and it‘s a regular feature to
ensure enrolment of children in the primary schools. 3.6% (04) teachers said that it
was held 3-4 years ago, 5.4% (06) said that it was held in their school 5 years ago
while 2.6% (03) chose not to respond to the question as they were really not aware
regarding the last Praveshotsav that was held at their school, them being newly
recruited. Informal conversations with the teachers revealed that Praveshotsav, though
demands that the State and the District officials participate in the event, none of them
participated in any of the events.
160

Table 29: Distribution of teachers’ responses regarding
participation of State Officials in Praveshotsav campaigns
(N=112)
Participation of State Officials Frequency Percentage
Yes, they participate 108 96.4
No, they don‘t participate 4 3.6
112 100
96.4% (108) teachers said the local officials from their districts participate during the
Praveshotsav campaign. 3.6% (04) teachers said that the officials do not participate in
the campaign. By State officials the teachers largely meant the Block Resource
Coordinators that would come during such programmes.
Table 30: Distribution of teachers’ responses regarding
efforts made by school to ensure that each child is enrolled
(N=112)
Efforts Yes No Total
Door to door campaigns 106 (94.6%) 6 (5.4%) 112 (100%)
Awareness Campaigns 95 (84.8%) 17 (15.2%) 112 (100%)
Assist parents in filling up
of forms 93 (83%) 19 (17%) 112 (100%)
Figures in parentheses indicate percentage
Figure 23: Distribution of teachers’ responses regarding
efforts made by school to ensure that each child is enrolled
161
94.6% 84.8% 83% N=112
15.2% 17%
5.4%
Door to Door Campaigns Awareness Campaigns Assist parents in filling up
forms
Yes No

Anganwadi workers go door to door to spread the message…..
“Anganwai ni behno jaaye door-to-door loko paase k anganwadi athva school ma
bharti karo chhokrao ne, kehva.” (Anganwadi workers go door-to-door to tell people to
enroll their children in Anganwadi and school) - A female teacher from Dangs
There is too much Government workload…..
“Sarkar ni kaamgirio aatli hoy ke aapde campaign ne badhu na kari shakay.”
(Government workload is so much that we cannot conduct campaign and all)
- A female teacher from Vadodara
We don’t go around the village as such
“Campaigning to jyare badha school ma 15mi August ka to 26th January na roj
vaaliyo aave, tyare vaat chit kari laiye, aam gaam ma nathi farta kemke aatlu time
pan na hoy.” (When the parents come during 15th August and 26
th January, we talk
to them. We don‘t go around in the village as we don‘t have so much time)
– A male teacher from Banaskantha
Door to door campaigns
94.6% (106) teachers claimed that their schools conduct door to door campaigns to
ensure that each child in the vicinity of the school is enrolled at the elementary level,
while 5.4% (06) teachers said that their schools do not conduct any such campaigns.
Awareness Campaigns
84.8% (95) teachers claimed that their schools conduct regular awareness campaigns
to ensure that the community members know about the Government facilities for
education and thus enroll their children in the schools. The remaining 15.2% (17)
teachers said that their schools do not carry out any such initiatives as they don‘t have
much time.
Assist parents in filling up the forms
83% (93) of the respondents said that their schools either designate certain teachers to
help the parents in filling up the admission forms or appoint Anganwadi workers to
162

Our teachers assist the parents when they don’t have certain documents…..
“Amuk valiyo paase amuk dastavej nathi hota jemke aadhar card, janm daakhlo, jena
aadhar par shishyavrutti madi shake chhe. Aadhar card to jaruri chhe Kanya Kelavani
hetad shishyavrutti medavva. Aava sanjogo ma amara shikshako valiyo ne madadrup
thay chhe.” (At times, parents do not have certain documents like Aadhar, birth
certificate based on which scholarship is received. Aadhar card is necessary for getting
scholarship under Kanya Kelavani. In such circumstances, our teachers are helpful to the
parents) - A male teacher from Banaskantha
assist the parents in sorting the documents and filling up the forms while 17% (19)
teacher respondents said they don‘t do any such thing.
Table 31: Distribution of teachers’ responses regarding
inception of Gunotsav in the school
(N=112)
Inception of Gunotsav Frequency Percentage
2 years ago 2 1.8
3-4 years ago 1 0.9
5 years ago 107 95.5
No Response 2 1.8
112 100
Gunotsav programme was started in the year 2009 with an aim to improve quality of
education in the schools along with academic achievements of children belonging to
classes 2 to 8th
. 95.5% (107) respondents said it has been 5 years since the inception
of Gunotsav in their schools. 1.8% (2) teachers said that it was started 2 years ago in
their schools while 1.8% (2) teachers were not aware about the inception as they were
new to the school.
―Gunotsav was not meant to be a permanent feature on the school calendar‖ according
to R.P. Gupta, the State‘s Principal Secretary of School Education in the year 2009,
however due to dwindling results of quality education, it was decided to continue the
same in the schools each year.
163

Table 32: Distribution of teachers’ responses regarding
involvement of community members in Praveshotsav
(N=112)
Involvement of Community Members Frequency Percentage
Yes, they are involved 112 100
No, they are not involved 0 0
112 100
According to (Carino & Valsino, 1994) there are a number of ways in which parents
and community members are to be brought closer to the schools like;
a) minimizing discontinuities between schools and communities, schools and families
b) minimizing conflicts between schools and communities
c) minimizing cultural shocks of new entrants to schooling
Keeping the above in mind, Praveshotsav ensires that the community members are
involved in the process of admission of the child in the schools during the
Praveshotsav campaigns. All the teachers said that the community members were
involved in the Praveshotsav campaigns. Participation in terms of inviting the parents
to the school and making them a part of the celebration where they interact with the
State and District officials regarding the importance of schooling for their children.
164
We have to assess the students as per the Government rules…..
“Dar shaniwaare pariksha leva ma aave chhe.Sarkar taraf thi paripatra aave chhe
jema time ane divas nakki hoy chhe ane ae pramane svamulyankan ke
baahyamulyankan yojaay te mujabni vyavastha jadavvani hoy chhe.” (Every
Saturday exam is being taken. A circular from the Government is received according
to which we have to undertake self-assessment or assessment of others and make
necessary arrangements for the same) - A female teacher from Banaskantha
Assessment is as per the classes….
“Gunotsav darmyan dhoran 1 thi 5 ma vaachan, lekhan ane ganannu mulyankan
karvama aave chhe. Jyare dhoran 6 thi 8 ma vachan, lekhan ane ganan ane saathe
saathe lekhit mulyankan karvama aave chhe.” (Assessment in Gunotsav is for
reading, writing and arithematic for standards 1 to 5. While for students in standards
6 to 8 assessment is for reading, writing, arithematic as well as subjective written
exams also) - A female teacher from Vadodara

Prayer and Yoga is held everyday…..
“Prarthana sabha ane yog to darroj savare hoy j chhe. Eni saathe aaj na samachar,
suvichar, general knowledge ane aaj na divas ma itihas ma shu thayu hatu ae pan
janavva ma aave chhe.” (Prayer and Yoga are held regularly. Along with that daily
news, quote of the day, general knowledge and the importance of the day in history are
also shared with the students.) - A female teacher from Vadodara
Committees of students to conduct the assembly have been made
“Vidyarthiyo ni committee banavi deva ma aayi chhe chhatta, saatma ane aathma
dhoran thi je savar ni prarthana yoje chhe. Aa rite badha vidhyarthiyo ne chance made
chhe.” (A students committee has been formed from the 6th, 7
th and 8
th standards who
conduct the morning assembly. This way each student gets a chance.) - A female
teacher from Vadodara
Table 33: Distribution of teachers’ responses regarding
types of co-curricular and extra curricular activities held at School
(N=112)
Co-Curricular Yes Sometimes Total
Prayer and Yoga 112 (100%) 0 112 (100%)
Cultural Events 112 (100%) 0 112 (100%)
Games 112 (100%) 0 112 (100%)
Exhibitions 107 (95.5%) 5 (4.5%) 112 (100%)
The Right To Education (RTE) mandate section 16 prohibits the school from
expulsion and holding back a child until he/she completes the primary education
incase of deviant and aberrant behavior of children and also mandates that the school
must address the child differently by provision of different curricular and co-
curricular ativities in order to develop self awareness, address deep rooted fears and
problems of the children. Each school has to make provisions regarding curricular and
co-curricular activities for the children in their schools and encourage the children to
participate in them.
a) Prayer and Yoga
The data revealed that prayer and yoga were a regular feature in the school assemblies
of all the schools.
165

Teachers take students to play in other schools in their own vehicles…..
“Khel kud ma badako ne khoob ras hoy ane biji shadao ma jaine spardha ma bhaag le
chhe. Amuk vakhate mare shikshako potani gaadi ma lai jaye chhe chhokraone ramva.”
(Students are more interested in sports and they go to other schools to take part in
competitions. Often our teachers take them in their own vehicles to play.) – A male
teacher from Surat
b) Cultural Events
All the schools hold annual events where cultural programs are held so that the
community members come together in the schools and get an idea of what is
happening in the schools.
c) Sports
Subsequently games also formulate an important aspect of the activities conducted in
the schools. However it was found that most of the schools did not have any adequate
equipment for the children to play. On the positive side, the encouragement of the
teachers and school authorities towards sending the children for inter school sports
competition and Khel Mahakumbh was high.
d) Exhibitions
According to 95.5% (107) of the teacher, science and creative exhibitions, where
working models and experiments made by the students under various subjects, were
held in schools. 45% (05) teacher respondents said that their schools hold exhibitions
sometimes only due to unavailability of space and/or parents not coming at all.
166
Annual day is a grand celebration in our school…..
“Amari school ma annual day bhavya tarike yojavva ma aave chhe. School no angan
khaso moto chhe ane ame to school development fund ma thi mota speakaro pan
lidha chhe jethi motu sambhdaay. Valiyo khoob moti sankhya ma aave chhe jo emne
agau kehva ma aave to.” (The annual day is celebrated in a grand manner in our
school. We have a huge area in our school and we have also purchased big speakers
from the school development fund which have a loud sound. Parents come in large
quantities if they are informed well in time.) – A male teacher from Banaskantha

Table 34: Distribution of teachers’ responses regarding
regularity of the school in informing parents about the child’s progress
(N=112)
Regularity in informing Frequency Percentage
Yes, school regularly informs the parents 112 100
112 100
Over the years, a lot of literature has been written regarding importance of parental
involvement in the child‘s school. Parent involvement is often considered a pathway
through which schools enhance the achievement of underperforming children (Berger,
1991). All teachers 100% (112) responded that their schools inform the parents
regularly about the child‘s progress, when they come to the school or the teacher
meets them personally to do so.
Table 35: Distribution of teachers’ responses regarding
last Parents Teachers Meeting held to discuss the child’s progress
(N=112)
Last PTA meeting held to discuss progress of child Frequency Percentage
1-2 years ago 24 21.4
3-4 years ago 52 46.4
More than 5 years ago 36 32.2
112 100
Figure 24: Distribution of teachers’ responses regarding
last Parents Teachers Meeting held to discuss the child’s progress
167
46.4% N=(112)
32.2%
21.4%
1-2 years ago 3-4 years ago More than 5 years ago
Last PTA Meeting held in School
Models are displayed for exhibition, but parents don’t come…..
“Aam to vidhyarthiyo ae banavela vigyan athva ganit na modelo nu pradarshan karva
ma aavhe chhe computer room kaan to saheb na room ma, pan valiyo ne koi samjan
padti nai to ae aavta nai.” (The science and maths models made by the students are
displayed in the computer room or the Principals room but the parents don‘t understand
anything so they don‘t come at all.) - A female teacher from Vadodara

Parents leave for the farms, hence can’t come…..
“Valiyo kheti kaam maate jaye chhe, savare 4 vaage nikdi jaaye chhe to saanje 6 vaage
aave.” (The parents go for agricultural labor work, they leave at 4 in the morning and come
back at 6 in the evening.) – A female teacher from Vadodara
Instead of parents, grandparents come if informed in advance…..
“Valiyo ne dar mahina bolavanu thodu aghru hoy kem ae aavta nathi. Valiyo na varti
chhokrao na dada hoy to ae amuk vaar aavi jay pan agau thi janavu pade.” (It is difficult
to call the parents every month because they don‘t come. Instead of the parents, the
grandparents come some times if they are informed in advance.) - A male teacher from
Dangs
It is required that PTA meetings are held at least once in a month to keep the parents
informed about what is happening at the child‘s school.
21.4% (24) teachers said that their schools held the parent teacher meeting 1-2 years
ago. 46.4% (52) teachers said that the meetings in their schools were held 3-4 years
ago, 32.2% (36) said that the meetings in their schools were held more than 5 years
ago. The data reveals that parent teacher meetings are still not made as a regular
monthly feature in most of the schools under the study. The reasons cited by the
teachers included the following:
Table 36: Distribution of teachers’ responses regarding
use of Teaching Aids to increase the interest of the children in studies at school
(N=112)
Teaching Aids
To a
Great
Extent
To Some
Extent
To the
Least
Extent
No
Response
Total
Blackboard 107
(95.5%) 3 (2.7%) 2 (1.8) -
112 (100%)
Chart Paper 85
(75.9%) 25
(22.3%) 2 (1.8%) -
112 (100%)
Games 84 (75%) 26
(23.2%) 2 (1.8) -
112 (100%)
Bulletin Boards 76
(67.9%) 20
(17.9%) 16
(14.2%) -
112 (100%)
Flash Cards 66
(58.9%) 35
(31.3%) 11 (9.8%) -
112 (100%)
Picture Books 31
(27.7%) 35
(31.3%) 24
(21.4%) 22 (19.6%)
112 (100%)
Figures in parentheses indicate percentage
168

Figure 25: Distribution of teachers’ responses regarding
use of Teaching Aids to increase the interest of the children in studies at school
Teaching aids ensure increased interest in the subject and at the same time increases
the retention level of the matter taught.
a) Chart Papers
75.9% (85) respondents said that they use chart papers to a great extent while teaching
as they increase the level of attention of the students in what is taught. 22.3% (25)
teachers said that they use chart papers to some extent and supplement the teaching
with other aids as well. Only 1.8% (02) teachers doesn‘t use chart paper during the
teaching-learning process as they are not a very clear medium of communication.
b) Picture Books
31.3% (35) of the teachers preferred using picture books to some extent as they feel
that only visuals can get ambiguous and can hamper the clarity of the content taught.
21.4% (24) teachers used picture books to the least extent as they felt only pictures
cannot suffice teaching and learning. 27.7% (31) teachers said that they use picture
books to a great extent. There were 19.6% (22) teachers who were not aware about
what picture books were and thus they chose not to respond to the question.
169
120
N= (112)
100 95.5
80 75.9 75 67.9
58.9 60
40
22.3 27.7
20
31.3
21.4 19.6
31.3
23.2 17.9
9.8 14.2
1.8
Chart Paper Picture books
2.7 1.8
Blackboard
1.8
0 Games Flash Cards Bulletin
Boards
To a Great Extent To Some Extent To the Least Extent No Response

Teachers use Youtube to teach the students…..
“Youtube par ganit ane vigyan na ghana badha gemo hoy chhe, ae ame class ma
vidhyarthiyo ne remade chhiye. Chhokrao ras le chhe ane yaad rakhe chhe” (There are
games related to science and maths on Youtube. We make the students play those in
class. Children take interest and remember them.) – A female teacher from Vadodara
Children enjoy studying through smart boards…..
“Pragna varg ma smart board aapel chhe, to ema thi banvama khoob anand aave chhe
chhokrao ne. blackboard karta smart board vadhare kaam laage.” (There is a smart board
available in the activity centre, the children enjoy studying from that. Smart boards are
more useful compared to black boards.) - A female teacher from Banaskantha
Children enjoy learning through different mediums…..
“Nava nava maadhyamo thi bhanva ma chhokrao ne maja aave chhe ae maate ghani
vakhate ame shikshako flash cards banaviye chhe.”(Students enjoy learning from different
mediums and for that we teachers make flash cards.) - A female teacher from Banaskantha
c) Blackboard
Blackboards are the most traditional and conventional mediums of teaching and
learning. Even today 95.5% (107) teachers claimed using blackboards to teach to a
great extent followed by 2.7% (03) teachers using it to some extent and 0.9% (01) to
the least extent.
d) Games
75% (84) teachers claimed using games as a medium of teaching to a great extent
while 23.2% (26) claimed using games to some extent only. 1.8% (2) teachers said
that they use games to the least extent.
e) Flash Cards
58.9% (66) teachers said that they use flashcards apart from the other teaching aids as
they prove really helpful. 31.3% (35) teachers claimed using flash cards to some
extent while 9.8% (11) teachers said they use flash cards to the least extent.
170
Students prepare drawings themselves…..
“Amari shada na badako pote chitro banave emni book ma joine, vignan na hoy athva
bhugol, ganit, pachhi pote ae loko vaanche joine ema thi.” (Students in our school
themselves make pictures from their books whether it is on science, geography or maths.
Then they themselves read from them.) – A female teacher from Dangs

f) Bulletin Boards
67.9% (76) said that they use bulletin boards to a great extent while 17.9% (20) said
they use it to some extent and 9.8% (11) said they use it to least extent.
Apart from the above mentioned materials, teachers also discussed using the BISAG
medium and the audio visual mediums made available in some of the schools under
the Mission Vidya Campaign of the Government of Gujarat. Teachers also claimed
using project based learning and a lot of computer aided materials to teach in order to
arouse the curiosity in the minds of the children.
Table 37: Distribution of teachers’ responses regarding
procurement of Teaching Learning Material
(N=112)
Place of Procurement Yes No Total
Teachers Make it themselves 94 (83.9%) 18 (16.1%) 112 (100%)
Get it ready from the market 35 (31.3%) 77 (68.7) 112 (100%)
Figures in parentheses indicate percentage
83.9% (94) of the teachers said that they prepare the teaching aids like charts
themselves in school with the help of the children. For aids like flash cards, flip books
and picture books the materials are procured from the market.
As other options teachers said that the Gyankunj unit has been set up in some schools
which is audio-visual enabled. The curriculum is available on the medium and the
children can learn through the interactive medium with the help of songs, games and
stories related to subject matter.
The teachers also said that sometimes the teaching-learning material is received from
the Government pretty late or not at all due to which teaching suffers. Hence, they
prefer making the teaching aids themselves only.
Table 38: Distribution of teachers’ responses regarding
remedial classes being conducted in school
(N= 112)
Remedial Classes Frequency Percentage
Yes, they are conducted 109 97.3
No, they are not conducted 3 2.7
112 100
171

Under the 8th
edition of Gunotsav, the Gujarat Government found that many students
were unable to read, write and solve Math problems. Mission Vidya was launched in
2018 and the implementation of which was entrusted to IAS, IPS and IFS officials.
The mission was launched in July 26th
to Aug 31st 2018 in 250 Talukas of the State
where academically weak students would be given training for two hours during
school time and an additional one hour after the school hours for the student of 6-8
grades. (Informartion Department, Gujarat, 2018)
The data revealed that as per 97.3% (109) teachers, remedial classes are conducted in
their schools under Gunotsav and Mission Vidya campaign. Only 2.7% (03) of the
total respondents said that their schools do not conduct remedial classes as the
necessary training of the students is ensured during the regular classes only.
Table 39: Distribution of teachers’ responses regarding
availability of necessary infrastructure for quality education
(N=112)
Availability of necessary infrastructure Frequency Percentage
Yes, it is available 91 81.3
No, it is not available 21 18.7
112 100
Figure 26: Distribution of teachers’ responses regarding
availability of necessary infrastructure for quality education
The quality of education depends on a number of factors, the primary one being
availability of school infrastructure. School infrastructure is broadly termed as school
buildings, playgrounds, libraries, civic amenities and other facilities like drinking
172
Availability of Necessary Infrastructure
No, not (N=112)
available
19%
Yes, available
81%

This building is the only facility we have…..
“Je sagvad chhe aa imarat nij chhe. Biji koi aam sagvad nathi jemke chopadiyo, library
jethi chhokrao ne bhanva ma ras aave.” (Whatever facility we have, it is the building
only. No other facility as such like books, library due to which the children can take
interest in learning.) - A female teacher from Surat
Sometimes books also come late…..
“Amuk vaar chopadiyo pan late aave chhe ane faati jaaye to aapdi paase biji to hoy
nahi je aapde vidyarthiyo ne aapiye.” (Sometimes books also come late and if they tear,
we don‘t have extra to provide to the students.) - A female teacher from Dangs
water, classrooms etc. all this contribute to the overall learning environment of the
school. ―Throughout the country, in most schools, the classrooms experience
deficiency in terms of ventilation, heating and cooling equipment in accordance to the
weather conditions and furniture. The students were supposed to sit on the floor and
as a consequence, were unable to concentrate on their studies.‖ (Bhunia, Shit, &
Duary, 2012)
According to the perceptions of 81.3% (91) teachers, their schools had all necessary
infrastructures that would make teaching and learning easy and would have a positive
effect on the quality of education delivered.
18.7% (21) teachers however said that the schools did not have the necessary
infrastructure which would make the process of teaching and learning easy.
173

81.3% (N=112)
13.4%
5.3%
1-2 years ago More than 5 years ago Never took place
Table 40: Frequency and percentage distribution of responses
regarding last assessment conducted by Government officials in School
(N=112)
Last assessment conducted Frequency Percentage
1-2 years ago 91 81.3
More than 5 years ago 15 13.4
Never Visited 6 5.3
112 100
Figure 27: Frequency and percentage distribution of responses
regarding last assessment conducted by Government officials in School
The Education system today has a major commitment to provide quality of education
and requires the State to ensure, check and regulate the provisions to make quality of
education a reality. In this, the Cluster Resource Coordinators (CRC) and the Block
Resource Coordinators (BRC) have an important role to support the resources
required for smooth functioning and actively promote school quality improvement.
This was set up during the District Primary Education Programme (DPEP) and later
carried forward through the Sarva Shiksha Abhiyan (SSA) (The Committee to
Suggest Indicative Operational Guidelines for Strengthening and Revitalisation of
Sub-District Level Resource Centers, 2011). The CRC and the BRC are seen as an
alternative to the monitoring system in the schools. The key work features of BRC‘s
and CRC‘s is to strengthen the conception and guidance of the school improvement,
impart academic support and training to the schools, build a repository of local
knowledge and resources and overall data management related to the schools. They
are supposed to visit the schools atleast once a month to take a stock of development.
174

All 5 programmes viz. RTE, MDM, KKY, Shala Praveshotsav and Gunotsav were
being implemented in the selected schools
Various efforts are being made by the school to ensure that community participates in the school programmes
but community participation remains an issue especially in Dangs
MDM monitoring and burden of work is on the
teachers majorly
There is lack of TLM’s and Infrastructure, thus
hampering quality teaching and learning
Only local officials like CRC and sometimes
BRC participate in the Praveshotsav campaigns
The school assessments by State officials is
sporadic
81.3% (91) teachers said that assessment by Government functionaries is regular in
their school and the last assessment conducted was 1-2 years ago. By this they meant
that it took place in the previous year. The BRC‘s visits once in a while the CRC‘s
visit during the scheduled day and date. 13.4% (15) respondents said that the
assessment by officials in their schools was conducted more than 5 years ago. They
said that it was very infrequent and sporadic. The BRC rarely came and while the
CRC came, they just did for the sake of it. 5.3% (06) respondents said that no officials
have ever visited their schools for assessment.
It was observed that the CRC‘s and the BRC‘s of certain blocks in Dangs and
Banaskantha were pretty active in conducting assessments and weekly stock taking of
activities of the schools under their purview.
Figure 28: Section I – Major findings regarding implementation of Government
Plans and Programmes at schools - At a glance
175

RTE has brought about lot of change…..
“RTE aava thi to ghano fark padyo chhe ane bharti thai chhe ghani badhi school ma,
pan bija program pan chhe jemke madhyan bhojan. Ena lidhe savthi vadhare aave
chhe chhokrao nishaade.” (There has been a lot of change after the inception of RTE
but there are other programs too like Mid Day Meal. It is because of MDM that most
children come to school) - A female teacher from Vadodara
Each child got an opportunity to schooling due to RTE…..
“RTE thi dakhla no pramaan khoobj vadhi gayo chhe school ma. Pehla aatla daakhla
nota ahiyan, pan RTE lagu thayu ena pachi gaam na darek badak ne school javani tak
madi.” (The admission rate has increased a lot through RTE. Earlier there were not
much admissions here but after RTE was implemented each child from the village got
an opportunity to go to school.) - A female teacher from Dangs
Section – II
Perceptions regarding success of Government Plans and Programmes in
ensuring hundred percent enrolment
Table 41: Distribution of teachers’ perceptions of success of
Right to Education (RTE) Act in ensuring hundred percent enrolment
(N=112)
Programme Success of the Programme Frequency Percentage
Right to Education
Act
To a Great Extent 99 88.3
To Some Extent 13 11.7
To the Least Extent 0 0 112 100
According to the perception of 88.4% (99) teacher respondents, Right to Education
has been successful to a great extent in ensuring hundred percent enrolment in the
schools. While there was a fraction of the teachers 11.7% (13) who said that RTE has
instrumental in ensuring hundred percent enrolment apart from RTE.
Table 42: t-test results of perceptions of Male and Female teachers regarding
success of Right to Education Act in ensuring hundred percent enrolment
(N=112) t-test for Equality of Means
n Mean Std. Deviation
t df Sig. (2 tailed)
Male 51 2.73 .666 -.2.491 110 .014 (Sig.)**
Female 61 2.95 .218
** Result Significant (Sig) as p<0.05
176

RTE has helped, but there are other programmes too…..
“Ae vata saachi chhe ke RTE thi daakhla no praman vadhyu chhe pan sarkar ni ghani
badhi biji pan schemo chhe jena lidhe praman vadhyu chhe jemke Kanya Kelavani jema
shishyavrutti made. Have je valiyo fakt kheti kaam kart ahoy, ema aavak khoob occhi
hoy, to shishyavrutti kaam laage chhe.” (It is true that RTE has helped in increasing the
enrolment of students but there are other schemes too by the Government like Kanya
Kelavani where scholarship is given. Now the parents who are agricultural laborers,
their income is very less, so to them the scholarship proves helpful). - A female teacher
from Vadodara
An independent samples t- test was conducted to compare the perceptions of male and
female teachers regarding success of Right to Education Act (RTE) in ensuring
hundred percent enrolment. There was a significant difference noted in the means
between male and female teachers which indicate that the female teachers‘ perception
regarding RTE being successful is more positive as compared to that of the male
teachers.
There were more female teachers who felt that RTE has indeed helped in increasing
the enrolment in schools compared to their male counterparts. The male teachers were
of the opinion that there are other programmes too which need to be given credit for
the increase in enrolment.
Table 43: Analysis of Variance (ANOVA) results of perceptions of teachers
regarding success of Right to Education Act in ensuring hundred percent
enrolment in relation with selected variables
(N=112)
Variables Source of Variance
Sum of Squares
df Mean
Square F Sig.
District
Between Groups
.756 3 .252
1.060
.369 (NS)*
Within Groups 25.664 108 .238
Years of
Association
with the school
Between Groups
.342 4 .085 .351
.843 (NS)*
Within Groups 26.078 107 .244
Whether
undergone
any Teacher Training
Between Groups
.253 2 .126 .527
.592 (NS)*
Within Groups 26.167 109 .240
*Result Not Significant (NS) as p>0.05
The above table shows a comparative picture of the perceptions of teachers regarding
success of Right to Education Act (RTE) in relation with selected variables. The
177

There has been an increase in attendance due to MDM…..
“Madhyan bhojan thi khoob vadharo thayo chhe daakhla ane haajri ma vadharo thayo
chhe.” (There has been an increase in the enrolment as well as the attendance rate in the
children due to Mid Day Meals in schools.) - A female teacher from Dangs
findings revealed that there is no significant difference in the perception of the
teachers with regard to District, the number of years of association with the school,
whether they had undergone any teacher training or not.
Table 44: Distribution of teachers’ perception regarding
success of Mid Day Meal Programme in ensuring hundred percent enrolment
(N=112)
Programme Success of the Programme Frequency Percentage
Mid Day Meal
To a Great Extent 106 94.6
To Some Extent 5 4.5
To the Least Extent 1 0.9
No Response 0 0 112 100
94.6% (106) teachers felt that Mid Day Meal is by far the most effective program,
which has helped a great deal in ensuring enrolment and at the same time helped in
retention of the students in the school. 4.5% (5) teachers felt that Mid Day Meal
programme was successful to some extent while only 0.9% (1) teacher felt that it was
successful to the least extent.
Table 45: t-test results of perceptions of Male and Female teachers regarding
success of Mid Day Meal Programme in ensuring hundred percent enrolment
(N=112) t-test for Equality of Means
n Mean Std. Deviation
t df Sig. (2 tailed)
Male 51 2.86 .491 -1.851 110 .067 (NS)*
Female 61 2.98 .128
*Result Not Significant (NS) as p>0.05
The t Test results showed no significant differences between the means of male and
female teacher respondents regarding perceptions of Mid Day Meal Programme in
ensuring hundred percent enrolment. The scores of both male and female teachers
showed that regardless of gender, they believed that MDM programme had been
successful to a great extent in ensuring hundred percent enrolment.
178

Table 46: Analysis of Variance (ANOVA) results of perceptions of teachers
regarding success of Mid Day Meal Programme in ensuring hundred
percent enrolment in relation with selected variables
(N=112)
Variables Source of
Variance
Sum of
Squares df
Mean
Square F Sig.
District
Between Groups
.172 3 .057
.468 .705
(NS)* Within Groups 13.256 108 .123
Years of
Association
with the school
Between Groups
.100 4 .025 .201
.937
(NS)* Within Groups 13.328 107 .125
Whether
undergone
any
Teacher
Training
Between Groups
.070 2 .035
.287
.751
(NS)*
Within Groups
13.358
109
.123
*Result Not Significant (NS) as p>0.05
Table describes the ANOVA results comparing perceptions of the teacher respondents
regarding success of Mid Day Meal in ensuring hundred percent enrolment in relation
with selected variables. The results suggested that there is no significant relationship
between the selected variables and MDM being instrumental in making hundred
percent enrolment successful.
Table 47: Distribution of teachers’ perceptions regarding
success of Kanya Kelavani Yojna in ensuring hundred percent enrolment
(N=112)
Programme Success of Kanya Kelavani
Yojna Frequency Percentage
Kanya Kelavani
Yojna
To a Great Extent 103 92.0
To Some Extent 6 5.4
To the Least Extent 2 1.7
No Response 1 0.9 112 100
According to the perception of 92% (103) teachers, Kanya Kelavani Yojna has been
instrumental in ensuring that the girls, who otherwise earlier were not sent to school
due to several reasons, economic reason being one of the major one, are being sent to
school. The major motivation under this scheme is the economic incentive that is
179

Scholarships have motivated many parents to send their girls to shool…..
“Shishyavrutti na lidhe ghana badha valiyo potana badako ne school ma bharti
karavva protsahit thaya chhe.” (Due to scholarships, many parents have been
motivated to admit their children in schools).
– A female teacher from Dangs
“Kanya Kelavani thi be agatya ni vastiyo ma fer aavyo chhe, ek ke chhokariyo ne
bhanvani tak madi chhe and biju shishyavrutti made chhe.” (There has been a change
in two important things due to Kanya Kelavani, one that the girls are getting an
opportunity to study and second that they receive a scholarship)
– A male teacher from Banaskantha
“Chhokariyo na bhantar na lidhe loko no mantavya badlayu chhe saara maate.” (The
perception of the people has changed regarding education of girls.) – A male teacher
from Vadodara
provided to the girl children due to which the parents don‘t find it difficult to bear the
economic burden that comes with educating the girl children.
Table 48: t-test results of Male and Female teachers’ perception of
success of Kanya Kelavani Yojna in ensuring hundred percent enrolment
(N=112) t-test for Equality of Means
n Mean Std. Deviation
t df Sig. (2 tailed)
Male 51 2.73 .635 -.622 110
.535 (NS)* Female 61 2.80 .679
*Result Not Significant (NS) as p>0.05
The t-test results showed no significant difference in the perceptions of the male and
female teachers regarding Kanya Kelavani Yojna ensuring hundred percent
enrolment. The mean scores of both the genders revealed that they both were of the
opinion that Kanya Kelavani Yojna had been successful to a great extent in ensuring
hundred percent enrolment.
180

Table 49: Analysis of Variance (ANOVA) results of perceptions of teachers
regarding success of Kanya Kelavani Yojna in ensuring hundred percent enrolment
in relation with selected variables
(N=112)
Variables Source of
Variance
Sum of
Squares df
Mean
Square F Sig.
District
Between Groups
5.641 3 1.880
4.798 .004
(Sig)** Within Groups 42.323 108 .392
Years of
Association
with the school
Between Groups
2.619 4 .655 1.545
.194
(NS)* Within Groups 45.345 107 .424
Whether
undergone
any Teacher Training
Between Groups
.125 2 .062 .142
.868
(NS)* Within Groups 47.840 109 .439
** Result Significant (Sig) as p<0.05, *Result Not Significant (NS) as p>0.05
The ANOVA results of teachers perceptions of success regarding success of Kanya
Kelavani Yojna in ensuring hundred percent enrolment indicated no significant
difference in the responses of the teachers with years of association of the teachres
with the school and whether the teachers had undergone any teacher training or not. A
significant difference was however recorded with regard to District as a variable. To
identify which groups differed significantly a post hoc analysis was carried out.
Table 50: Post Hoc Test result for perception of teachers regarding
success of Kanya Kelavani Yojna in ensuring hundred percent enrolment in
relation with selected variables
(N=112)
Variables (I)
Variable
(I)
Mean
(J)
Variable
(J)
Mean
Mean
Difference (I-J)
Std.
Error
Sig.
District
Dangs
2.97
Banaskantha 2.97 0 .033 1.000 (NS)*
Surat 2.65 0.23 .135 0.239 (NS)*
Vadodara 2.45 0.37 1.055 0.007
(Sig.)**
** Result Significant (Sig) as p<0.05, *Result Not Significant (NS) as p>0.05
The post hoc results of perceptions of teachers regarding success of Kanya Kelavani
Yojna in ensuring hundred percent enrolment in relation to District as a variable
indicated an equal mean score between respondents from Dangs and Banaskantha
Districts, having a higher mean score than respondents from Surat or Vadodara.
181

There was a significant difference in the perception of teachers from Vadodara as
compared to those of Dangs and Banskantha in terms of success of Kanya Kelavani
Yojna ensuring hundred percent enrolment. While the incentive based scheme had
been more successful in Dangs and Banaskantha, it wasn‘t that successful in
Vadodara according to the perception of the teachers. While Dangs and Banaskantha
has a sizeable population engaged as agricultural laborers, the scheme, specifically the
scholarship under the scheme has been really instrumental in ensuring that the parents
get their children enrolled in the schools.
Table 51: Distribution of teachers’ perception regarding
success of Gunotsav in ensuring hundred percent enrolment
(N=112)
Programme Success of Gunotsav Frequency Percentage
Gunotsav
To a Great Extent 87 77.7
To Some Extent 11 9.8
To the Least Extent 8 7.1
No Response 6 5.4 112 100
77.7% (87) teachers felt that Gunotsav was successful to a great extent in ensuring
hundred percent enrolment as quality of education being improved is the primary
concern for the parents and teachers alike. The fact that Government schools were
making efforts to make it possible for the child to achieve atleast the basic reading
and writing skills in the children motivated a lot many parents to make sure that their
child is enrolled in the nearby Government school as per the perceptions of the
teachers. 9.8% (11) teachers felt that Gunotsav has been successful to some extent
while 7.1% (8) teachers felt that it was successful to the least extent. 5.4% (6) teachers
chose not to respond to the question.
It depends on the assessment…..
“Kasu kehvay nai aana lidhe kemke kevi rite mulyankan thay ena upar aadahrit hoy.”
(Cant say anything about it as it depends on how the assessment is done) - A female
teacher from Vadodara
People’s perception regarding Government schools has changed after Gunotsav…..
“Sarkari shadao nu aavu chhaap chhe ke bhanavama aavtu nathi ane kai quality
education madtu nathi. Pan Gunotsav baad thodu to fer aavyu chhe loko na mantavya
ma.” (The impression of Government schools is such that no teaching happens here and
quality education is not received. But the perceptions of people have changed after
Gunotsav) - A male teacher from Banaskantha
182

Table 52: t-test results perception of Male and Female teachers regarding
success of Gunotsav in ensuring hundred percent enrolment
(N=112) t-test for Equality of Means
n Mean Std. Deviation
t df Sig. (2 tailed)
Male 51 2.61 .777 .299 110 .766 (NS)*
Female 61 2.56 .975
*Result Not Significant (NS) as p>0.05
The t-test results showed no significant difference in the perception of male and
female teachers regarding success of Gunotsav in ensuring hundred percent enrolment
indicating that that respondents regardless of their gender were of a higher opinion
regarding Gunotsav being successful to a great extent in ensuring hundred percent
enrolment.
Table 53: Analysis of Variance (ANOVA) results of perceptions of teachers
regarding success of Gunotsav in ensuring hundred percent enrolment in relation
with selected variables
(N=112)
Variables Source of
Variance
Sum of
Squares df
Mean
Square F Sig.
District
Between Groups
8.568 3 2.856
.011 .011
(Sig.)** Within Groups 78.708 108 .729
Years of
Association
with the school
Between Groups
1.984 4 .496 .622
.648
(NS)** Within Groups 85.293 107 .797
Whether
undergone
any
Teacher
Training
Between Groups
6.843 2 3.422
4.637
.012
(Sig.)**
Within Groups
80.433
109
.738
** Result Significant (Sig) as p<0.05, *Result Not Significant (NS) as p>0.05
The ANOVA results suggested no significant differences in perceptions of the
teachers regarding success of Gunotsav in ensuring hundred percent enrolment in
relation with the teachers ‗years of association with the school as a variable. A
significant difference in perceptions regarding the same was found in relation to
variable like whether the teachers had undergone teacher training and District as
183

variables. To identify which groups varied significantly, the results were put to post
hoc analysis.
Table 54: Post Hoc Test result for perception of teachers regarding
success of Gunotsav in ensuring hundred percent enrolment
(N=112)
Variables (I)
Variable
(I)
Mean
(J)
Variable
(J)
Mean
Mean
Difference (I-J)
Std.
Error
Sig.
Whether
undergone
any
Teacher
Training
Yes
2.67
No
2.50
0.17
0.339
0.617
(NS)*
No
Response
1.80
0.87
0.286 0.003
(Sig.)**
District
Dangs
2.90
Banaskantha 2.77 0.13 0.152 0.395 (NS)*
Vadodara 2.31 0.59 0.204 0.005
(Sig.)**
Surat 2.26 0.64 0.209 0.000
(Sig.)**
** Result Significant (Sig) as p<0.05, *Result Not Significant (NS) as p>0.05
The above table highlights the results of post-hoc analysis of perceptions of teachers
regarding success of Gunotsav in ensuring hundred percent enrolment with regard to
whether the teachers had undergone teacher training or not. The results reflect that
the mean score of teachers who had undergone training was higher than those who
have not undergone and the teachers who chose not to respond to the question.
With regard to District as a variable, the mean score of teachers in Dangs district were
significantly different than those in Vadodara and Surat. Besides, it was revealed that
the perception of teachers in Dangs regarding success of Gunotsav in ensuring
hundred percent enrolment does not differ significantly from the teachers in
Banaskantha District. Dangs and Banaskantha being districts having a sizeable tribal
population being agrarian in nature, government schools to them being the sole option
for education, Gunotsav was a big boon in terms of access to quality education,
specifically reading and writing. Teachers in Vadodara and Surat district however
differed in their perception saying that compared to non government schools, the
learning levels were not at par at all.
184

CRC and BRC come to talk and it makes a lot of difference…..
“Sarkar taraf thi, aiyan jo ke amara CRC, BRC saheb aave chhe, ae loko gaam na
loko saathe vaat chit kare to ghano farak pade chhe. Gaam na loko khoob mane chhe
sahebo ne.” (Our CRC and BRC come from the Governments side, they talk to the
people of the village and it makes a lot of difference. People of the village listen to
them) - A female teacher from Dangs
Table 55: Distribution of teachers’ perception regarding
success of Shala Praveshotsav in ensuring hundred percent enrolment
(N=112)
Programme Success of Shala Praveshtosav Frequency Percentage
Shala Praveshotsav
To a Great Extent 103 92.0
To Some Extent 6 5.4
To the Least Extent 2 1.7
No Response 1 0.9 112 100
92% (103) teachers perceived that Shala Praveshotsav has been instrumental in
ensuring hundred percent enrolment. The perception that the local officials participate
in the admission campaign ensures trust in the minds of the community members that
schooling is good for their children and the rapport that is created by the officials
helps motivate the parents to send their children to school.
Table 56: t-test results of Male and Female teachers regarding
success of Shala Praveshotsav in ensuring hundred percent enrolment
(N=112) t-test for Equality of Means
n Mean Std. Deviation
t df Sig. (2 tailed)
Male 51 2.80 .601 -1.777 110
.078 (NS)* Female 61 2.95 .218
*Result Not Significant (NS) as p>0.05
The t test results indicated no significant mean difference in the perceptions of male
and female respondents regarding success of Shala Praveshotsav in ensuring hundred
185
No guarantee that the child is learning…..
“Gunotsav ma mulyankan karva ma aave chhe, pan ae mulyankan thi koi guarantee
nathi k badak vaanchta lakhta shikhe.” (Assessment is being conducted under
Gunotsav but there is no guarantee of the child learning to read or write.) - A female
teacher from Surat

percent enrolment at the primary school level. Both male and female respondents
were of the opinion that Shala Pravesotsav was successful to a great extent in ensuring
hundred percent enrolment.
Table 57: Analysis of Variance (ANOVA) of perception of teachers regarding
success of Shala Praveshotsav in ensuring hundred percent enrolment in relation
with selected variables
(N=112)
Variables Source of
Variance
Sum of
Squares df
Mean
Square F Sig.
District
Between Groups
1.746 3 .582
3.183 .027
(Sig)** Within Groups 19.745 108 .183
Years of
Association
with the school
Between
Groups .590 4 .147
.755
.557
(NS)* Within Groups 20.901 107 .195
Whether
undergone
any Teacher Training
Between Groups
.401 2 .201 1.038
.358
(NS)* Within Groups 21.090 109 .193
** Result Significant (Sig) as p<0.05, *Result Not Significant (NS) as p>0.05
The above table showing ANOVA results show that no significant difference was
found amongst the perception of teachers regarding Shala Praveshotsav being
successful in ensuring hundred percent enrolment with variables like the teachers‘
years of association with the school and whether the teachers had undergone any
teacher training or not. A significant difference was however found with regard to
District as a variable. To find out which group of respondents were significantly
differing in their opinion, post-hoc analysis was conducted.
Table 58: Post Hoc Test result for perception of teachers regarding
success of Shala Praveshotsav in ensuring hundred percent enrolment
(N=112)
Variables (I)
Variable
(I)
Mean
(J)
Variable
(J)
Mean
Mean
Difference
(I-J)
Std.
Error
Sig.
District
Banaskantha
3.00
Dangs 3.00 0.00 .000 1.000 (NS)*
Surat 2.74 .619 .129 0.131 (NS)*
Vadodara 2.76 .636 .118 0.142 (NS)*
*Result Not Significant (NS) as p>0.05
186
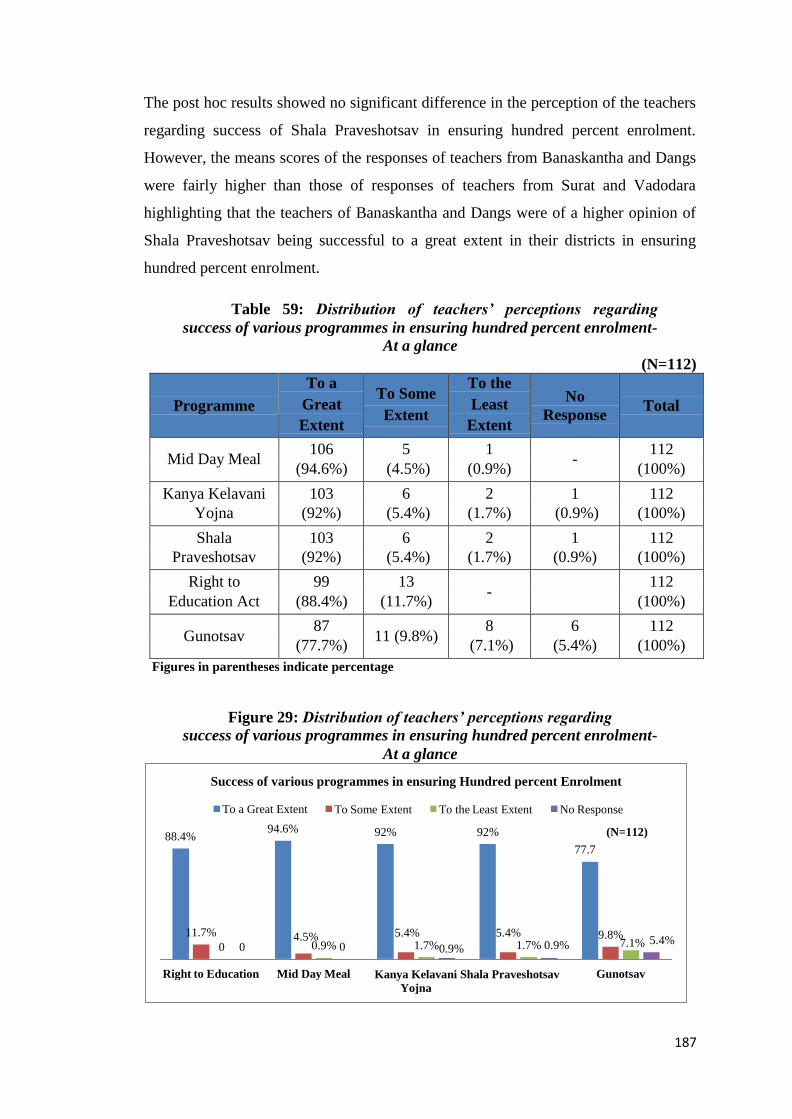
%
The post hoc results showed no significant difference in the perception of the teachers
regarding success of Shala Praveshotsav in ensuring hundred percent enrolment.
However, the means scores of the responses of teachers from Banaskantha and Dangs
were fairly higher than those of responses of teachers from Surat and Vadodara
highlighting that the teachers of Banaskantha and Dangs were of a higher opinion of
Shala Praveshotsav being successful to a great extent in their districts in ensuring
hundred percent enrolment.
Table 59: Distribution of teachers’ perceptions regarding
success of various programmes in ensuring hundred percent enrolment-
At a glance
(N=112)
Programme
To a
Great
Extent
To Some
Extent
To the
Least
Extent
No
Response
Total
Mid Day Meal 106 5 1
- 112
(94.6%) (4.5%) (0.9%) (100%)
Kanya Kelavani 103 6 2 1 112
Yojna (92%) (5.4%) (1.7%) (0.9%) (100%)
Shala 103 6 2 1 112
Praveshotsav (92%) (5.4%) (1.7%) (0.9%) (100%)
Right to 99 13 -
112
Education Act (88.4%) (11.7%) (100%)
Gunotsav 87
11 (9.8%) 8 6 112
(77.7%) (7.1%) (5.4%) (100%)
Figures in parentheses indicate percentage
Figure 29: Distribution of teachers’ perceptions regarding
success of various programmes in ensuring hundred percent enrolment-
At a glance
187
Success of various programmes in ensuring Hundred percent Enrolment
To a Great Extent
88.4% 94.6%
To Some Extent To the Least Extent No Response
92% 92% (N=112)
77.7
11.7%
0 0 4.5%
0.9% 0
5.4% 1.7%0.9%
5.4% 1.7% 0.9%
9.8% 7.1% 5.4%
Right to Education Mid Day Meal Kanya Kelavani Shala Praveshotsav
Yojna
Gunotsav

The above graph shows the picture of how the various Government Plans and
Programmes are perceived by the teachers regarding helping in achieving hundred
percent enrolment. The graph is indicative that each of the plan and programme has
been successful to a large extent mostly but Mid Day Meal Programme has been
successful the most (94.6%) as compared to all the other programmes. On the
contrary, Gunotsav programme is perceived to be contributing the least among all the
other programmes in terms of ensuring hundred percent enrolment as perceived by
77.7% teachers. On the other hand, Shala Praveshotsav being a largely community
engagement programme is perceived to be successful too (92%) along with Kanya
Kelavani Yojna, being an incentive based programme (92%) by the teachers of all the
Districts. Right to Education (RTE) Act on the other hand is perceived to fall a little
short behind the incentive based Kanya Kelavani Yojna as perceived by 988.4% of
the teachers.
Table 60: Distribution of teachers’ perception regarding
effect of No Detention Policy on quality of education
(N=112)
No Detention Policy affects the quality of education
Frequency Percentage
To a Great Extent 65 58.0
To Some Extent 33 29.5
To the Least Extent 14 12.5
112 100
The No Detention Policy of RTE Act, was introduced with the basic idea of not
detaining the children in classes so as to reduce the reasons that compel them to leave
school. With regard to perceptions regarding the No Detention Policy of RTE Act,
58% (65) teachers felt that the policy compromises the quality of education to a great
extent. Their arguments revealed that schools have only become a centre for Mid day
meals as learning is not happening only. 29.5% (33) teachers felt that No detention
policy has affected the quality of education to some extent, their arguments were that
the fact that RTE and no detention policy resulting in hundred percent enrolment
cannot be negated, but also, the fact that this has led to an increase in the drop out
ratio at the secondary level needs to be considered. 12.5% (14) teachers believed that
no detention policy has little or no effect on the quality of education.
188

There is more loss than profit due to No Detention Policy…..
“Na pass karvani paddhati thi faayda karta nuksan vadhare thaay chhe kemke
chhokrao prathmik shikshan puru karine madhyamik shikshan ma jaye jaaye to
emne kasu aavde to nathi.” (There is more loss than gain due to the No
Detention Policy as when the children progress from primary to secondary
education, they know nothing) – A male teacher from Surat
The child will not know anything in the future….
“Aam ne aam chhokrao ne pass kari deva ma aave to kasuj nai aavano ene
bhavishya ma.” (If the child is promoted like this only, he will not know
anything in the future) – A female teacher from Dangs
There is no improvement in learning…..
“Aam bhanva ma sudhaaro to aavto nathi na paas na kariy to pan, aapde aa
vaat nakari shakta nathi ke na pass karvani paddhati thi ghana badha
chhokrao school aava thi ghabrata nathi. Na pass thavana darr thi amuk
chhokrao school aavanu bandh kari de chhe. Have aa niyam aava thi koi drop
out nathi thatu.” (There is no improvement in learning even if we don‘t demote
the child but we cannot negate the fact that this policy of no detention has led to
children not fearing the schooling. The fear of failing compels many children to
stop coming to the school. now because of this policy, nobody drops out) – A
female teacher from Vadodara
Nothing related to promotion or demotion, desire to learn is intrinsic…..
“Bhanvani jigyasa andruni hoy, jyare manas ne bhanvu hoy to ae kevi pan rite
bhani leshe, aama pass na pass jevu kai nai hotu.” (The desire to learn is
intrinsic. If a child wants to learn, he will learn anyhow. There is nothing
related to promotion or demotion) – A male teacher from Vadodara
Table 61: t-test results of Male and Female teachers regarding
effect of No Detention Policy on Quality of Education
(N=112) t-test for Equality of Means
N Mean Std. Deviation
t df Sig. (2 tailed)
Male 51 2.25 .997 -1.700 110
.092 (NS)* Female 61 2.52 .673
*Result Not Significant (NS) as p>0.05
The t-test result suggested no significant difference in the means of the perception of
male and female teachers regarding the effect of no detention policy on quality of
education. Both the genders were of the opinion that the no detention policy is
compromising the quality of education to a large extent.
189

Table 62: Analysis of Variance (ANOVA) results of perceptions of teachers
regarding effect of No Detention Policy on Quality of Education in relation with
selected variables
(N=112)
Variables Source of
Variance
Sum of
Squares df
Mean
Square F Sig.
District Between Groups 20.382 3 6.794
12.534 .000
(Sig.)** Within Groups 58.538 108 .542
Years of
Association
with the school
Between Groups 1.079 4 .270 .371
.829
(NS)* Within Groups 77.840 107 .727
Whether
undergone
any
Teacher
Training
Between Groups .497 2 .248
.345
.709
(NS)*
Within Groups
78.423
109
.719
** Result Significant (Sig) as p<0.05, *Result Not Significant (NS) as p>0.05
The above table portrays a comparative picture of the perceptions of teacher
respondents regarding effect of no detention policy compromising quality of
education. No significant differences were found in the perceptions in relation to
variables like teachers‘ years of association with the school and whether the teachers
had undergone any teacher training. However, a significant difference in the
perception of the teachers regarding the effect of no detention policy on the quality of
education was found in relation with District as a variable. To know which groups
differ significantly, the results were put to post hoc analysis.
Table 63: Post Hoc Test result for perception of teachers regarding
effect of No Detention Policy on Quality of Education
(N=112)
Variables
(I)
Variable
(I)
Mean
(J)
Variable
(J)
Mean
Mean
Difference
(I-J)
Std.
Error
Sig.
District
Vadodara
2.72
Dangs 2.63 0.09 0.157 0.569 (NS)*
Surat 2.61 0.11 0.214 0.608 (NS)*
Banaskantha 1.70 1.02 0.195 0.000
(Sig.)**
** Result Significant (Sig) as p<0.05, *Result Not Significant (NS) as p>0.05
A significant relation was found to exist between the Districts and the perceptions
regarding the effect of the No Detention Policy under RTE. Majority of the teachers
190

Free education for a poor person is a big thing…..
“Garib manas mate mafat ma shikshan madtu hoy ae vaatj sauthi moti. Ek naam joiye
ke bhanelo chhe, biju kai nai. Ane napass karva thi loko nu manobal tooti jase.” (For a
poor person, getting free education is the biggest thing. They want education just for the
name and failing would only de-motivate them) – A male teacher from Dangs
in Vadodara and Surat Districts perceived that the No Detention Policy compromises
the quality of education to a great extent followed by the perceptions of the teachers
being the same from The Dangs district.
While Teachers in Banaskantha were of the opinion that it affects the quality of
education but to some extent. As quoted earlier, teachers from Banaskantha believed
that such a policy is important as it helps in the reduction of school drop-out rates.
Table 64: Distribution of teachers’ perception regarding
sufficiency of grants received under RTE to meet the infrastructural, teaching and
learning requirements at the school
(N=112)
Sufficiency of Grants under RTE Frequency Percentage
To a Great Extent 12 10.7
To Some Extent 49 43.8
To the Least Extent 29 25.9
No Response 22 19.6
112 100
The implementation of RTE requires an unprecedented sum of money. The funding
pattern is divided in 60:40 ratio where the central Government bears the major cost.
The grants under RTE are provided for infrastructural facilities, ensuring supplements
in teaching and overall development of the school. The perceptions of 43.8% (49)
teachers revealed that the funds received were sufficient to some extent, 25.9% (29)
of the teachers said that the funds received were sufficient to the least extent. The
reasons cited by them included the fact that the learning demands of the students are
increasing and now with the increase in use of technology in education, more
infrastructure needs to be made available in order to meet those learning needs of the
children. Apart from that, specific training in terms of integrating technology into
education is not being provided. Only 10.7% (12) of the teachers felt that the funds
were sufficient to a great extent.
191

19.6% (22) teachers chose not to respond to the question. The reason behind so many
teachers not responding to the question was that there was apprehension on the parts
of the teachers talking about unavailability of resources from the Governments end.
We talk of digitalization of education, but no resources or training…..
“Aaaje aapde vaat kariye digitalization of education ni, pan ae student sudhi
pochavva maate aapde saadhan to joiye ne. darek badak ne have mobile ne
computer ni khabar chhe, pan use karta aavu joiye ane use karva maate aapdi
paase vyavastha to hovij joiye.” (Today we talk of digitalization of education but
for that being available till the student, we need resources. Each child knows
about mobile and computer but they should know how to use it and for that we
must have arrangement) - A male teacher from Vadodara
“Gyan Kunj project ni andar smart board aapel chhe amuk shadao ne, pan ene
use karvani training aapvama aavi nathi. Jo aapdi paase raashi hoy school ma to
aapde koik private trainer paase thi pan training appi shake shikshako ne jethi
vastu vapray to khari.” (Smart boards have been made available under project
Gyaan Kunj to certain schools but no training regarding how to use it has been
provided yet. If we had money in the school we could arrange training for its
usage for the teachers through a private trainer so that atleast the facility can be
used) - A male teacher from Vadodara
”Aapdi sarkari shadao suvidha na lidhe maar khai jaaye chhe. Paisa hoy to
suvidha hoy, donation par aapde dar vakhte nirbhar na rehvi shakay.” (Our
Government schools lag behind due to lack of facilities. If we have money, we
have facilities, we cannot rely on donations all the time) – A male teacher from
Dangs
Table 65: t-test results of perception Male and Female teachers regarding
sufficiency of grants received under Right to Education Act (RTE)
(N=112) t-test for Equality of Means
N Mean Std. Deviation
t df Sig. (2 tailed)
Male 51 1.45 1.026 .730 110
.467
(NS)* Female 61 1.31 .992
*Result Not Significant (NS) as p>0.05
The t-test results showed no significant difference in the perception of male and
female teachers regarding sufficiency of grants received under RTE Act. This
indicated that respondents regardless of gender were of the opinion that the funds
under RTE were sufficient to some extent only.
192

Table 66: Analysis of Variance (ANOVA) results of perception of teachers
regarding sufficiency of grants received under Right to Education Act (RTE) in
relation with selected variables
(N=112)
Variables Source of
Variance
Sum of
Squares df
Mean
Square F Sig.
District
Between Groups
17.423 3 5.808
6.614 .000
(Sig.)** Within Groups 94.827 108 .878
Years of
Association
with the school
Between Groups
2.096 4 .524 .509
.729
(NS)* Within Groups 110.154 107 1.029
Whether
undergone
any
Teacher
Training
Between Groups
18.077 2 9.039
10.462
.000
(Sig.)**
Within Groups
94.173
109
.864
** Result Significant (Sig) as p<0.05, *Result Not Significant (NS) as p>0.05
The ANOVA results showed no significant difference in the perception of the
teachers regarding sufficiency of grants received under RTE with regard to number of
association with the schools of the teachers.
A significant difference was recorded amongst the perception of the teachers with
regard to variables like District and whether the teachers had undergone any training.
To know which groups differ significantly, the results were put to post hoc analysis.
Table 67: Post Hoc Test result for perception of teachers regarding
sufficiency of grants received under RTE
(N=112)
Variables (I)
Variable
(I)
Mean
(J)
Variable
(J)
Mean
Mean
Difference
(I-J)
Std.
Error
Sig.
District
Vadodara
2.72
Banaskantha 1.70 1.020 0.195 .000
(Sig.)**
Dangs 2.63 0.090 0.157 .569
(NS)*
Surat 2.61 1.890 0.277 .000
(Sig.)**
Whether
undergone
teacher
training
Yes
2.43
No 2.33 0.100 0.339 .768
(NS)*
No Response 2.20 0.230 0.286 .423
(NS)*
** Result Significant (Sig) as p<0.05, *Result Not Significant (NS) as p>0.05
193

The above table highlights the post hoc analysis of perception of teachers regarding
sufficiency of grants received under RTE with regard to District and whether the
teachers have undergone teacher training or not as a variable.
With regard to District wise data, the mean score of teachers in Vadodara was higher
as compared to teachers in Banaskantha and Surat, suggesting that teachers in
Vadodara felt that the funds received was sufficient and teachers in Banaskantha and
Surat felt that the funds were not sufficient. There was not much significant difference
in the mean scores of teachers from Vadodara and Dangs regarding sufficiency of
funds, suggesting that their perceptions were more or less similar.
With regard to teacher training as a variable, the mean scores of the teachers who had
undergone training were higher compared to the teachers who had not undergone
training. This signifies that the trained teachers felt that the grants received under RTE
were sufficient as compared to the other teachers.
Teachers’ Views on Benefits of Mid Day Meal Programme
The MDM Programme was started in the year 1995 with the basic aim of enhancing
enrolment, retention, increasing attendance levels in school and reducing drop outs in
the schools. It has been a great benefit to many parents in order to ensure that their
children are in school, learning well and at large, their nutritional requirements are
met.
Table 68: Distribution of teachers’ perception regarding
increased regularity of children due to Mid Day Meal Programme
(N=112)
Children are regular in attending school Frequency Percentage
To a Great Extent 95 84.8
To Some Extent 14 12.5
To the Least Extent 3 2.7
112 100
194

84.8% Increased Regularity due to MDM
(N=112)
12.5% 2.7%
To a Great Extent To Some Extent To the Least Extent
Figure 30: Distribution of teachers’ perception regarding
increased regularity of children due to Mid Day Meal Programme
With regard to increase in regularity of the children in attending schools due to MDM,
the perception of, 84.8% (95) teachers revealed that MDM has been successful to a
great extent in ensuring that the children attend schools regularly. 12.5% (14) teachers
said that it has been successful to some extent while 2.7% (3) teachers felt that it
helped in increasing regularity amongst the children to the least extent.
Table 69: t-test results of perceptions of Male and Female teachers regarding
increased regularity of children due to Mid Day Meal Programme
(N=112) t-test for Equality of Means
n Mean Std. Deviation
T df Sig. (2 tailed)
Male 51 2.76 .651 -.505 110
.615 (NS)* Female 61 2.82 .500
*Result Not Significant (NS) as p>0.05
The t-test results showed no significant difference in the means of male and female
teachers‘ perception regarding increased regularity of children due to Mid Day Meal
Programme. The teachers regardless of their gender were of a higher opinion that
MDM has helped in increasing the regularity of the students to a great extent.
195

Table 70: Analysis of Variance (ANOVA) results of perception of teachers
regarding increased regularity of children due to Mid Day Meal Programme in
relation with selected variables
(N=112)
Variables Source of
Variance
Sum of
Squares Df
Mean
Square F Sig.
District
Between Groups
.265 3 .088
.265 .851
(NS)* Within Groups 36.012 108 .333
Years of
Association
with the school
Between Groups
1.579 4 .395 1.217
.308
(NS)* Within Groups 34.698 107 .324
Whether
undergone
any
Teacher
Training
Between Groups
5.304 2 2.652
9.333
.000
(Sig.)**
Within Groups
30.973
109
.284
** Result Significant (Sig) as p<0.05, *Result Not Significant (NS) as p>0.05
The ANOVA results suggested no significant difference in the perception of teachers
regarding increased regularity of children due to Mid Day Meal Programme in
relation with variables like District and number of years of association of teachers
with the school. A significant difference was noted in the perception of the teachers
with regard to whether teachers have undergone any teacher training or not as a
variable. To identify which groups differed significantly, the results were put to post-
hoc analysis.
Table 71: Post Hoc Test result for perception of teachers
regarding increased regularity of children due to Mid Day Meal Programme
(N=112)
Variables
(I)
Variable
(I)
Mean
(J)
Variable
(J)
Mean
Mean
Difference
(I-J)
Std.
Error
Sig.
Whether
undergone
any
Teacher Training
Yes
2.86
No
2.83
.030
0.179
0.867
(NS)*
** Result Significant (Sig) as p<0.05, *Result Not Significant (NS) as p>0.05
196

The above table highlights the post hoc analysis of perception of teachers regarding
increased regularity of children due to Mid Day Meal Prograame with regard to
whether the teachers have undergone any teacher training as a variable. The results
showed that the teachers who had undergone training had a higher mean score than
those who had not attended training suggesting that they were of a higher opinion
regarding increased regularity of children in schools due to MDM programme. The
teachers who had undergone training were subjected to the data prior to starting the
mid day meal scheme and had an idea as to how much difference the meal schemes
made to the enrolement and attendance of the children in the schools. There was
however, no significant difference in the perceptions of the teachers who had
undergone training and those who had not.
Table 72: Distribution of teachers’ perception regarding
increase in the enrolment of children due to Mid Day Meal Programme
(N=112)
More children are getting enrolled Frequency Percentage
To a Great Extent 86 76.7
To Some Extent 21 18.8
To the Least Extent 2 1.8
Can‘t Say 3 2.7
112 100
Figure 31: Distribution of teachers’ perception regarding
increase in the enrolment of children due to Mid Day Meal Programme
76.7%
Increase in Enrol ment due to MDM
(N=112)
18.8%
1.8%
2.7%
To a Great Extent To Some Extent To the Least Extent Can't Say
A study conducted on impact of Mid Day Meal Programme on Enrolment and
Retention of Primary School Children was conducted in Bengal and it was found that
after the introduction of MDM in schools in West Bengal there was a 30.44% increase
in enrolment in class I, 23.26% increase in enrolment in class II, 33.79% increase in
enrolment in class III and 32.44% increase in enrolment in class IV. He also found
197

MDM is not the only reason for increase in enrolment…
“Aa to kehvaya nathi k ekla madhyan bhojan maate chhokrao no praman vadhyu chhe,
mafat shikshan thi pan ghana badah ne protsahan madyo chhe.” (It cannot be said that
the enrolment of children has increased due to Mid Day Meal, free education also has
motivated many people) – A male teacher from Banaskantha
that the parents were more eager to send their children to schools due to MDM being
served in schools (Mondal B. , 2017).
Similar findings were recorded with regard to the question of whether more children
are getting enrolled in schools due to MDM, 76.7% (86) teachers felt that enrolment
has increased to a great extent due to MDM. 18.8% (21) teachers felt that to some
extent, MDM has been successful in increasing the enrolment at the primary level but
it‘s not the only programme that has led to the increase. 1.8% (2) teachers felt that it
has increased to the least extent while 2.7% (3) teachers couldn‘t say about it.
Table 73: t-test results of perceptions of Male and Female teachers regarding
increase in enrolment of children due to Mid Day Meal Programme
(N=112) t-test for Equality of Means
n Mean Std. Deviation
t df Sig. (2 tailed)
Male 51 2.59 .853 -1.252 110
.213 (NS)* Female 61 2.75 .537
*Result Not Significant (NS) as p>0.05
The t-test results showed no significant difference in the means of male and female
teachers with regard to increase in enrolment of children due to Mid Day Meal
Programme. Regardless of gender, the respondents believed that MDM has helped a
great deal in increasing the enrolment rate in their schools to a great extent.
198

Table 74: Analysis of Variance (ANOVA) results of perceptions of teachers
regarding increase in enrolment of children due to Mid Day Meal Programme in
relation with selected variables
(N=112)
Variables Source of
Variance
Sum of
Squares df
Mean
Square F Sig.
District
Between Groups
1.085 3 .362
.733 .535
(NS)* Within Groups 53.343 108 .494
Years of
Association
with the school
Between Groups
1.209 4 .302 .608
.658
(NS)* Within Groups 53.219 107 .497
Whether
undergone
any
Teacher
Training
Between Groups
5.095 2 2.548
5.629
.005
(Sig.)**
Within Groups
49.333
109
.453
** Result Significant (Sig) as p<0.05, *Result Not Significant (NS) as p>0.05
The ANOVA results suggested no difference in perceptions of teachers regarding
increase in enrolment of children due to Mid Day Meal Programme in relation with
District and years of association of the t4eachers with the school. However, a
significant difference was found amongst the teachers‘ perception with regard to
whether the teachers had undergone teacher training or not. To identify which groups
differed significantly, the results were put to post-hoc analysis.
Table 75: Post Hoc Test result for perception of teachers regarding
increase in enrolment of children due to Mid Day Meal Programme
(N=112)
Variables (I)
Variable
(I)
Mean
(J)
Variable
(J)
Mean
Mean
Difference
(I-J)
Std.
Error
Sig.
Whether
undergone
any
Teacher
Training
Yes
2.75
No
2.67
0.80
0.257
0.756
(NS)*
No
Response
2.00
0.750
0.226 0.001
(Sig.)**
** Result Significant (Sig) as p<0.05, *Result Not Significant (NS) as p>0.05
The post hoc results indicated that the teachers who had undergone training had a
higher mean score as compared to the teachers who had not attended any training.
However, there was no significant difference amongst the two. The teachers who did
199

Improvement in Nutrition due to MDM
79.5% (N=112)
16.1% 4.4%
To a Great Extent To Some Extent To the Least Extent
not respond to the question of whetherthey had undergone training or not had a
significantly different perception which said that enrolment had increased to some
extent only.
Table 76: Distribution of teachers’ perceptions regarding
improvement in nutrition of children due to Mid Day Meal Programme
(N=112)
Nutrition of children has improved Frequency Percentage
To a Great Extent 89 79.5
To Some Extent 18 16.1
To the Least Extent 5 4.4
112 100
Figure 32: Distribution of teachers’ perceptions regarding
improvement in nutrition of children due to Mid Day Meal Programme
An impact study for Akshay Patra Foundation conducted by Sigma Research and
Consulting Pvt Ltd. in the year 2014 in various states including Gujarat (Vadodara,
Gandhinagar and Surat) and found that the recommended nutritional requirements
were largely fulfilled due to MDM and the food was hygienic and healthy. (Sigma
Research and Consulting Pvt. Ltd., 2014)
MDM has been instrumental in increasing the nutritional levels of the children at a
manifold level. The data reveals that teachers, 79.5% (89) believe that MDM has been
beneficial to a great extent in improving the nutritional status of the children. There
were also teachers, 16.1% (18) who believed that MDM has been successful to some
extent in improvising the nutritional level of the children as the meal is not a square
one and that cannot be sufficient alone in increasing the nutritional status of the
200

Children get variety in MDM….
“Amuk chhokrao ne barabar jamvanu madtu nathi, ahiya to rotlo khaaye ane adad ni
dal jema eklo mithu hoy, chokrao khaay, nai khaay ane ema poshan adhuru rhai jaye.
Madhyan bhojan antargat variety made chhe jethi chhokrao ne maja pan aave khavama
ane poshan pan made.” (Certain children don‘t get to eat properly. Here people eat Rotlo
(flat bread) and lentils which includes only salt, children eat, don‘t eat and thus the
nutrition is not fulfilled. In the mid day meal, they get a variety of meals which children
love to eat also and they get nutrition also) – A female teacher from Vadodara
At times children waste food, thus losing out on nutrition…
“Amuk vakhate, jamvanu ekdum marchu mithu vager hoy chhe jethi chhokrao bagad
kare chhe khavanu ane khata nathi, ema poshan to adhuruj rhai jaaye.” (Sometimes
there is less spice and salt in the food due to which the children waste the food and thus
the nutrition remains unfulfilled) – A female teacher from Banaskantha
children. 4.4% (5) teachers believed that it has been instrumental to the least extent as
sometimes children do not eat well due to the taste being bland.
Table 77: t-test results of perceptions of Male and Female teachers regarding
improvement in nutrition of children due to Mid Day Meal Programme
(N=112) t-test for Equality of Means
n Mean Std. Deviation
t df Sig. (2 tailed)
Male 51 2.67 .739 -1.056 110
.293
(NS)* Female 61 2.79 .451
*Result Not Significant (NS) as p>0.05
The t-test results showed no significant difference in the perception of male and
female teachers regarding improvement in nutrition of children due to Mid Day Meal
programme. Regardless of gender, the respondents believed that MDM has been
successful to a great extent in improving the nutritional levels of the children.
201
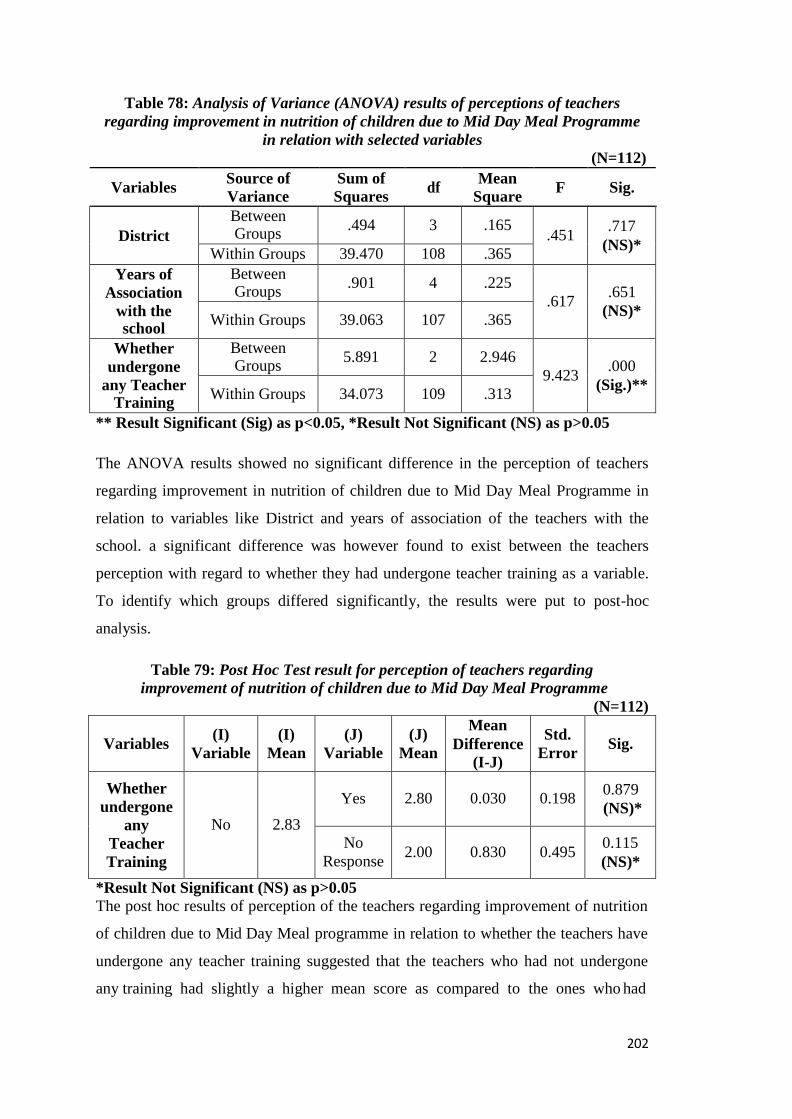
Table 78: Analysis of Variance (ANOVA) results of perceptions of teachers
regarding improvement in nutrition of children due to Mid Day Meal Programme
in relation with selected variables
(N=112)
Variables Source of
Variance
Sum of
Squares df
Mean
Square F Sig.
District
Between Groups
.494 3 .165
.451 .717
(NS)* Within Groups 39.470 108 .365
Years of
Association
with the school
Between Groups
.901 4 .225 .617
.651
(NS)* Within Groups 39.063 107 .365
Whether
undergone
any Teacher Training
Between Groups
5.891 2 2.946 9.423
.000
(Sig.)** Within Groups 34.073 109 .313
** Result Significant (Sig) as p<0.05, *Result Not Significant (NS) as p>0.05
The ANOVA results showed no significant difference in the perception of teachers
regarding improvement in nutrition of children due to Mid Day Meal Programme in
relation to variables like District and years of association of the teachers with the
school. a significant difference was however found to exist between the teachers
perception with regard to whether they had undergone teacher training as a variable.
To identify which groups differed significantly, the results were put to post-hoc
analysis.
Table 79: Post Hoc Test result for perception of teachers regarding
improvement of nutrition of children due to Mid Day Meal Programme
(N=112)
Variables (I)
Variable
(I)
Mean
(J)
Variable
(J)
Mean
Mean
Difference
(I-J)
Std.
Error
Sig.
Whether
undergone
any
Teacher
Training
No
2.83
Yes
2.80
0.030
0.198 0.879
(NS)*
No
Response
2.00
0.830
0.495 0.115
(NS)*
*Result Not Significant (NS) as p>0.05
The post hoc results of perception of the teachers regarding improvement of nutrition
of children due to Mid Day Meal programme in relation to whether the teachers have
undergone any teacher training suggested that the teachers who had not undergone
any training had slightly a higher mean score as compared to the ones who had
202

Improvement in Concentration due to MDM (N=112)
61.6%
25%
8.9% 4.5%
To a Great Extent To Some Extent To the Least Extent Can't Say
undergone training. There was no significant difference in the perception of the
responses of the teachers belonging to the different categories.
Table 80: Distribution of teachers’ perception regarding
improvement in concentration of children due to Mid Day Meal Programme
(N=112)
Concentration of children has improved Frequency Percentage
To a Great Extent 69 61.6
To Some Extent 28 25.0
To the Least Extent 10 8.9
Can‘t Say 5 4.5
112 100
Figure 33: Distribution of teachers’ perception regarding
improvement in concentration of children due to Mid Day Meal Programme
Absence of adequate breakfast for a period of time can affect behavior and nutritional
status and low concentration span which affects the active learning capacity of the
children. (Department of School Education and Literacy, Ministry of Human
Resource Development, Government of India, 2018)
MDM as a programme aimed to tackle the problem of low levels of concentration
amongst the primary school children. As per the data, 61.6% (69) teachers perceived
that MDM has been instrumental in improving the concentration of the children to a
great extent as the children are well fed in school and their minds are diverted from
being hungry towards taking interest in what is being done in the classroom and the
school. 25% (28) teachers felt that concentration of the children has improved to some
extent due to MDM, while 8.9% (10) teachers felt that the MDM scheme has been
instrumental in increasing the concentration level of the students to the least extent.
4.5% (5) teachers said they couldn‘t really comment on it.
203

Table 81: t-test results of perceptions of Male and Female teachers regarding
improvement in concentration of children due to Mid Day Meal Programme
(N=112) t-test for Equality of Means
N Mean Std. Deviation
t df Sig. (2 tailed)
Male 51 2.43 .878 .222 110
.825 (NS)* Female 61 2.39 .918
*Result Not Significant (NS) as p>0.05
The t-test results signified no difference in perception of male and female teachers
with regard to improvement in concentration of children due to Mid Day Meal
programme. Regardless of gender, the respondents believed that MDM has been
successful to a great extent in improving the concentration of children.
Table 82: Analysis of Variance (ANOVA) results of perceptions of teachers
regarding improvement in concentration of children due to Mid Day Meal
Programme in relation with selected variables
(N=112)
Variables Source of
Variance
Sum of
Squares df
Mean
Square F Sig.
District
Between
Groups 2.522 3 .841
1.049
.374
(NS)* Within Groups 86.585 108 .802
Years of
Association
with the school
Between Groups
1.300 4 .325 .396
.811
(NS)* Within Groups 87.807 107 .821
Whether
undergone
any Teacher Training
Between Groups
1.868 2 .934 1.167
.315
(NS)* Within Groups 87.240 109 .800
*Result Not Significant (NS) as p>0.05
204
There is no relation between hunger and concentration….
“Bhook ane ekagrata vishe aam kasu kehvay nathi. Badak bhukyo na hoy to pan aema
ekgrata occhi hoy evu bani shake chhe.” (Nothing can be said related to hunger and
concentration. A child who is not hungry can also have low concentration)
– A male teacher from Vadodara
A person who has the will to study, will study even when hungry…
“Jema bhanvani jigyasa hoy, ae bhukyo hoy to pan bhani shake chhe.” (Who ever has
will to study can study even when hungry)
– A male teacher from Surat

Inculcation of Habit of Sharing due to MDM
97.3% (N=112)
1.8% 0.9%
To a Great Extent To Some Extent
To the Least Extent
The ANOVA results suggested no significant difference in the perceptions of teachers
regarding improvement in concentration of children due to Mid Day Meal Programme
in relation with selected variables.
Table 83: Distribution of teachers’ perception regarding
inculcation of the habit of sharing meals amongst children due to Mid Day Meal
Programme
(N=112)
Children learn to share a meal with other children Frequency Percentage
To a Great Extent 109 97.3
To Some Extent 2 1.8
To the Least Extent 1 0.9
112 100
Figure 34: Distribution of teachers’ perception regarding
inculcation of the habit of sharing meals amongst children due to Mid Day Meal
Programme
One of the basic objectives of MDM Programme is to promote friendship and feelings
of common brotherhood among the children belonging to different caste, colour and
creed by providing them meals together. It was found that this objective is being
largely achieved as 97.3% (109) teachers perceived that MDM does inculcate the
habit of sharing the meals amongst the children. Only 1.8% (2) teachers felt that it is
successful in achieving this objective to some extent while 0.9% (1) said that it was
instrumental to the least extent.
205

Children wait for their friends to come and then eat together….
“Haan sharing ni tev vadhi chhe. Jyaare shukhdi k kaik nasto hoy Tithi Bhojan
antargat, to amuk chhokrao potana friends mate wait kare chhe, k friends aave to
badaha besine ek bija saathe khaye. Doodh Sanjeevani ma je flavoured doodh aave ae
badako ne game ane ame joyu chhe k amuk badak ne vadhare game, amuk ne occhu, to
badako ritsar potanu share bija ne aape chhe.” (Yes, the habit of sharing has
increased. When there is Sukhadi or any other snack under Tithi Bhojan, some children
wait for their friends that when the friends come, they will sit and eat together. Under
Doodh Sanjeevani the children love the flavoured milk that they get and we have seen
that some kids love it more than the others and children share their portion with others
readily) - A female teacher from Dangs
Table 84: t-test results of perceptions of Male and Female teachers regarding
inculcation of the habit of sharing meals amongst children due to Mid Day Meal
Programme
(N=112) t-test for Equality of Means
n Mean Std. Deviation
t df Sig. (2 tailed)
Male 51 2.94 .420 -.439 110
.662 (NS)* Female 61 2.97 .180
*Result Not Significant (NS) as p>0.05
The t-test results signified no significant difference in the perception of male and
female teachers regarding MDM inculcating the habit if sharing meals amongst the
children. Regardless of gender, the respondents were of the opinion that MDM helped
a great deal in inculcation of the habit of sharing meals amongst the children.
206
Sometimes children don’t sit without each other to eat….
“Haan, madhyan bhojan thi ghano fer aavyo chhe badako na vartan ma. Pehla to amuk
chhokrao ek bija saathe bese nai, pan have ae occhu thayu chhe. Amuk vaar to ek bija
vager bese nai ane khaye pan nahi.” (Yes, there has been a lot of difference in the habit
of the children due to Mid Day Meal. Earlier certain children did not sit with one another
but this has reduced now. Sometimes they don‘t even sit without each other and eat also)
– A female teacher from Dangs

Table 85: Analysis of Variance (ANOVA) results of perceptions of teachers
regarding inculcation of the habit of sharing meals amongst children due to Mid
Day Meal Programme in relation with selected variables
(N=112)
Variables Source of
Variance
Sum of
Squares df
Mean
Square F Sig.
District
Between Groups
.220 3 .073
.752 .524
(NS)* Within Groups 10.556 108 .098
Years of
Association
with the school
Between Groups
.640 4 .160 1.688
.158
(NS)* Within Groups 10.137 107 .095
Whether
undergone
any Teacher Training
Between Groups
.718 2 .359 .388
0.23
(Sig)** Within Groups 10.058 109 .092
** Result Significant (Sig) as p<0.05, *Result Not Significant (NS) as p>0.05
The ANOVA results suggested a significant difference in the perception of the
teachers regarding MDM inculcating the habit of sharing amongst the children with
regard to whether the teachers had undergone teacher training. To identify which
group differs significantly, the result was put to post hoc analysis. The ANOVA
results suggested no significant difference in the perception of teachers with regard to
MDM inculcating the habit of sharing meals amongst the children in relation with
variables like District and teachers‘ number of years of association with the school.
Table 86: Post Hoc Test result for perception of teachers regarding
inculcation of the habit of sharing meals amongst children due to Mid Day Meal
Programme in relation with selected variables
(N=112)
Variables (I)
Variable
(I)
Mean
(J)
Variable
(J)
Mean
Mean
Difference (I-J)
Std.
Error
Sig.
Whether
undergone
any
Teacher
Training
No
3.00
Yes
2.98
0.02
.044
0.98
(NS)*
No
Response
2.70
0.30
.949 0.14
(Sig.)**
** Result Significant (Sig) as p<0.05, *Result Not Significant (NS) as p>0.05
The post hoc analysis of teachers‘ perception regarding inculcation of the habit of
sharing meals amongst the children due to MDM Programme in relation to whether
the teachers had undergone teacher training indicated no significant difference in the
207

To a Great Extent To Some Extent To the Least Extent Can't Say (N=112)
97.3%
84.8% 76.7% 79.5%
61.6%
12.5% 2.7%
18.8% 16.1% 25%
0 1.8% 2.7% 4.4% 0
8.9% 4.5%
1.8% 0.9%
Increased
Regularity
Increased
Enrolment
Improvement in Improved Increase in Habit of
Nutrition Concentration Sharing
perception of the teachers. However, the mean scores of the teachers who had not
undergone any training were higher as compared to the ones who had attended
training indicating that they were of a higher opinion that the MDM Programme had
helped in inculcating the habit of sharing meals amongst the children.
Table 87: Distribution of teachers’ perceptions regarding
benefits of Mid Day Meal Programme – At a glance
(N=112)
Benefits
To a
Great
Extent
To Some
Extent
To the
Least
Extent
Can’t
Say
Total
Increase in habit of sharing meals
109
(97.3%)
2
(1.8%)
1
(0.9%) -
112
(100%)
Increased
Regularity
95
(84.8%)
14
(12.5%)
3
(2.7%) -
112
(100%)
Improvement in
Nutrition 89
(79.5%)
18
(16.1%)
5
(4.4%) -
112
(100%)
Increased
Enrolment
86
(76.7%)
21
(18.8%)
2
(1.8%)
3
(2.7%)
112
(100%)
Improved
Concentration 69
(61.6%)
28
(25%)
10
(8.9%)
5
(4.5%)
112
(100%)
Figures in parentheses indicate percentage
Figure 35: Distribution of teachers’ perceptions regarding
benefits of Mid Day Meal Programme
The above graph shows the perception of teachers regarding benefits of MDM
Programme. Among all the benefits, the teachers feel that the programme has helped
208

Food is a source of motivation for many children….
“Ghana badha chhokrao nishade khava maate aave chhe, ae loko maate aa motivation
jevu thaay chhe jethi bhane pan chhe ane bhar pet jamva pan male chhe.” (Many children
come to the school to eat, for them this is like a motivation due to which they study also
and they get to a satiated meal as well) - A female teacher from Dangs
There is existence of caste discrimination in the cillage, but not amongst the children…
“Gaamo ma jaativaad nu prabhav vadhara ma vadhare pan badako ma aavu kai nathi,
chhokrao madhyan bhojan na lidhe saathe bese pan and khaye pan.” (There is a lot of
existence of caste discrimination in villages but there is nothing amongst the children, they
sit together and eat due to mid day meals) – A male teacher from Banaskantha
There is no relation between hunger and concentration….
“Bhook ane ekagrata vishe aam kasu kehvay nathi. Badak bhukyo na hoy to pan aema
ekgrata occhi hoy evu bani shake chhe.” (Nothing can be said related to hunger and
concentration. A child who is not hungry can also have low concentration)
– A male teacher from Vadodara
in increasing the habit of sharing meals amongst the children which was not the case
before.
The second most successful benefit according to 84.8% (95) teachers was an increase
in regularity of the children as many children came from poor families who couldn‘t
afford nutritive meals everyday and thus, MDM serves as a major motivation for
many children to come to schools regularly.
Comparatively, the least benefit according to 61.6% (69) teachers was MDM
programme increasing the concentration in the children.
209

The scholarship is a source of motivation for many parents….
“Kanya Kelavani hetad shishyavrutti made chhe je ghana badha valiyo maate protsahan
no saadhan chhe kemke aa loko paase biju koi sadhan nathi to paisa ni laalachma to
laalach me, valiyo chhokariyo ne nishaade to mokle.” (The scholarship under Kanya
Kelavani is a motivating factor for many parents because these people don‘t have any
other resources, so for greed of money, they send girls to the schools atleast) – A female
teacher from Dangs
Table 88: Distribution of teachers’ perception regarding
role of Kanya Kelavani Rath in increasing the gender enrolment ratio
(N=112)
Role of Kanya Kelavani Rath in increasing GER Frequency Percentage
To a Great Extent 72 64.3
To Some Extent 27 24.1
To the Least Extent 10 8.9
Can‘t Say 3 2.7
112 100
Figure 36: Distribution of teachers’ perception regarding
role of Kanya Kelavani Rath in increasing the gender enrolment ratio
The Kanya Kelavani Yatra (Girl Child Education Campaign) aims at increasing the
enrolment of girls at the primary school level and reducing drop out of girls. 64.3%
(72) felt that Kanya Kelavani Rath has been instrumental to a great extent in
increasing the gender enrolment ratio in the schools. The reason cited for this was that
this programme has motivated the parents a great deal in ensuring that they send their
girl children to schools as they not only had incentive based motivation but also
ensures that there is equality of opportunity.
24.1% (27) teachers felt that Kanya Kelavani Rath has been instrumental to some
extent while 8.9% (10) teachers believed that this has been instrumental to the least
210
64.3%
(N=112)
24.1%
8.9% 2.7%
To a Great Extent To Some Extent To the Least Extent Can't Say
Role ofKanya Kelavani Yojna in Increasing GER

Parents only enroll the girls due to money, but then they remain as ghost students…
“Shishyavrutti made chhe to valiyo naam to nondhave school ma pan pachi kaame lai
jaaye chhokariyo ne kan to nana badako ni sambhal rakhva ghare rehva de.” (They get
scholarship, so the parents get the girls admitted to school but later they take them to work
with them or make them stay at home to take care of smaller children).
– A female teacher from Dangs
extent. 2.7% (3) teachers said that they couldn‘t comment on that as despite Kanya
Kelavani, there have been cases where the girl children remain as ghost students in
many cases.
Table 89: t-test results of perceptions of Male and Female teachers regarding
role of Kanya Kelavani Yatra in increasing the gender enrolment ratio
(N=112) t-test for Equality of Means
N Mean Std. Deviation
t df Sig. (2 tailed)
Male 51 2.37 .979 -.794 110
.429 (NS)* Female 61 2.51 .829
*Result Not Significant (NS) as p>0.05
The t-test results showed no significant difference in the perceptions of male and
female teachers regarding the role of Kanya Kelavani Yatra in increasing the gender
enrolment ratio. Regardless of gender, the respondents were of the opinion that Kanya
Kelavani Yojna was successful to a great extent in increasing the gender enrolment
ratio.
211
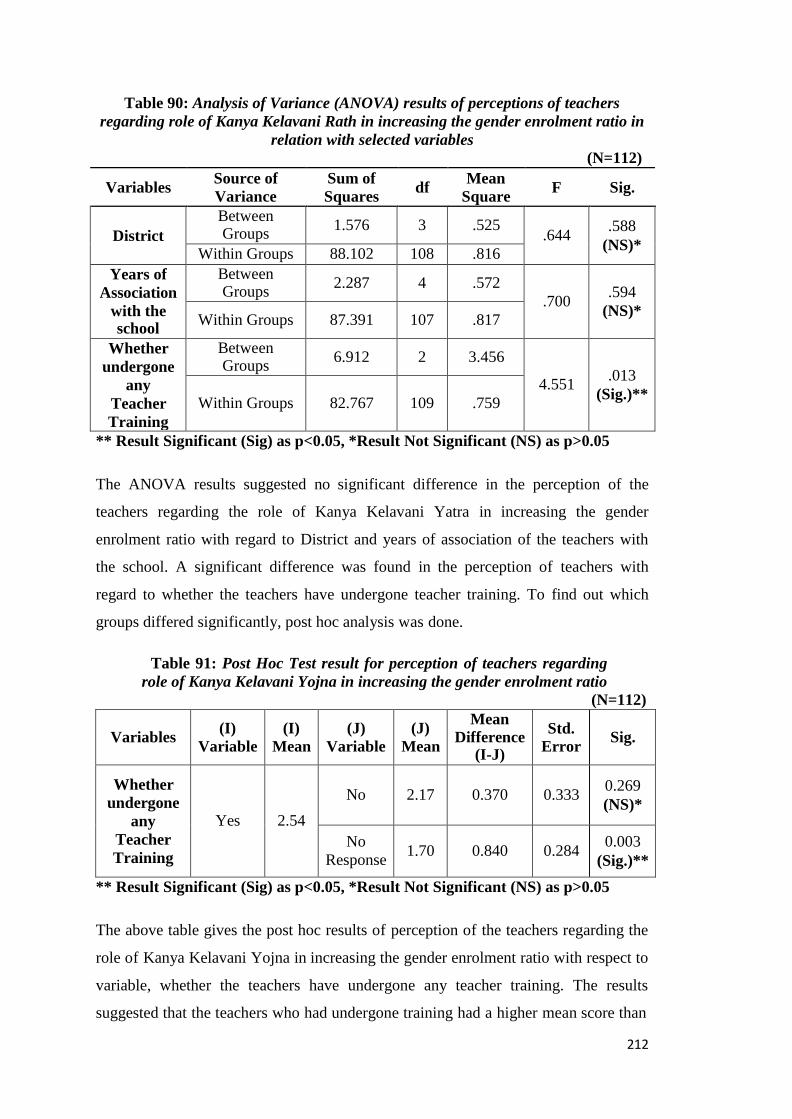
Table 90: Analysis of Variance (ANOVA) results of perceptions of teachers
regarding role of Kanya Kelavani Rath in increasing the gender enrolment ratio in
relation with selected variables
(N=112)
Variables Source of
Variance
Sum of
Squares df
Mean
Square F Sig.
District
Between Groups
1.576 3 .525
.644 .588
(NS)* Within Groups 88.102 108 .816
Years of
Association
with the school
Between Groups
2.287 4 .572 .700
.594
(NS)* Within Groups 87.391 107 .817
Whether
undergone
any
Teacher
Training
Between Groups
6.912 2 3.456
4.551
.013
(Sig.)**
Within Groups
82.767
109
.759
** Result Significant (Sig) as p<0.05, *Result Not Significant (NS) as p>0.05
The ANOVA results suggested no significant difference in the perception of the
teachers regarding the role of Kanya Kelavani Yatra in increasing the gender
enrolment ratio with regard to District and years of association of the teachers with
the school. A significant difference was found in the perception of teachers with
regard to whether the teachers have undergone teacher training. To find out which
groups differed significantly, post hoc analysis was done.
Table 91: Post Hoc Test result for perception of teachers regarding
role of Kanya Kelavani Yojna in increasing the gender enrolment ratio
(N=112)
Variables (I)
Variable
(I)
Mean
(J)
Variable
(J)
Mean
Mean
Difference (I-J)
Std.
Error
Sig.
Whether
undergone
any
Teacher
Training
Yes
2.54
No
2.17
0.370
0.333
0.269
(NS)*
No
Response
1.70
0.840
0.284 0.003
(Sig.)**
** Result Significant (Sig) as p<0.05, *Result Not Significant (NS) as p>0.05
The above table gives the post hoc results of perception of the teachers regarding the
role of Kanya Kelavani Yojna in increasing the gender enrolment ratio with respect to
variable, whether the teachers have undergone any teacher training. The results
suggested that the teachers who had undergone training had a higher mean score than
212
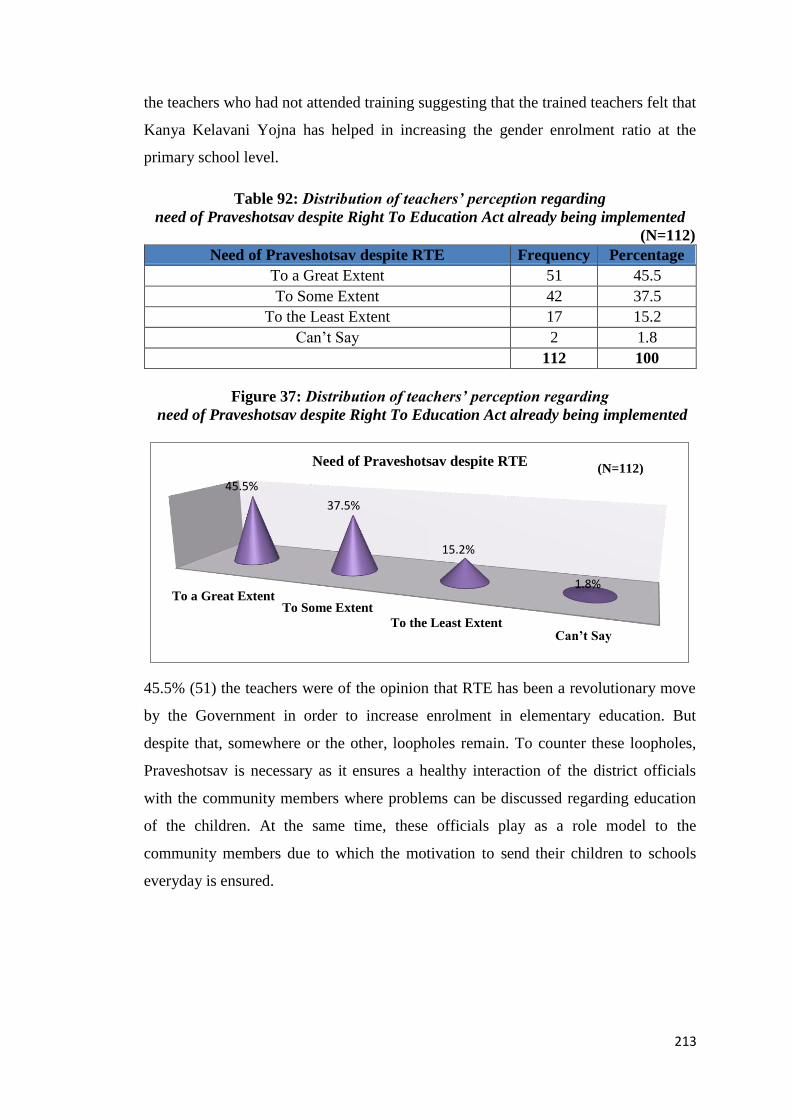
Need of Praveshotsav despite RTE (N=112)
45.5%
37.5%
15.2%
1.8% To a Great Extent
To Some Extent
To the Least Extent Can’t Say
the teachers who had not attended training suggesting that the trained teachers felt that
Kanya Kelavani Yojna has helped in increasing the gender enrolment ratio at the
primary school level.
Table 92: Distribution of teachers’ perception regarding
need of Praveshotsav despite Right To Education Act already being implemented
(N=112)
Need of Praveshotsav despite RTE Frequency Percentage
To a Great Extent 51 45.5
To Some Extent 42 37.5
To the Least Extent 17 15.2
Can‘t Say 2 1.8
112 100
Figure 37: Distribution of teachers’ perception regarding
need of Praveshotsav despite Right To Education Act already being implemented
45.5% (51) the teachers were of the opinion that RTE has been a revolutionary move
by the Government in order to increase enrolment in elementary education. But
despite that, somewhere or the other, loopholes remain. To counter these loopholes,
Praveshotsav is necessary as it ensures a healthy interaction of the district officials
with the community members where problems can be discussed regarding education
of the children. At the same time, these officials play as a role model to the
community members due to which the motivation to send their children to schools
everyday is ensured.
213
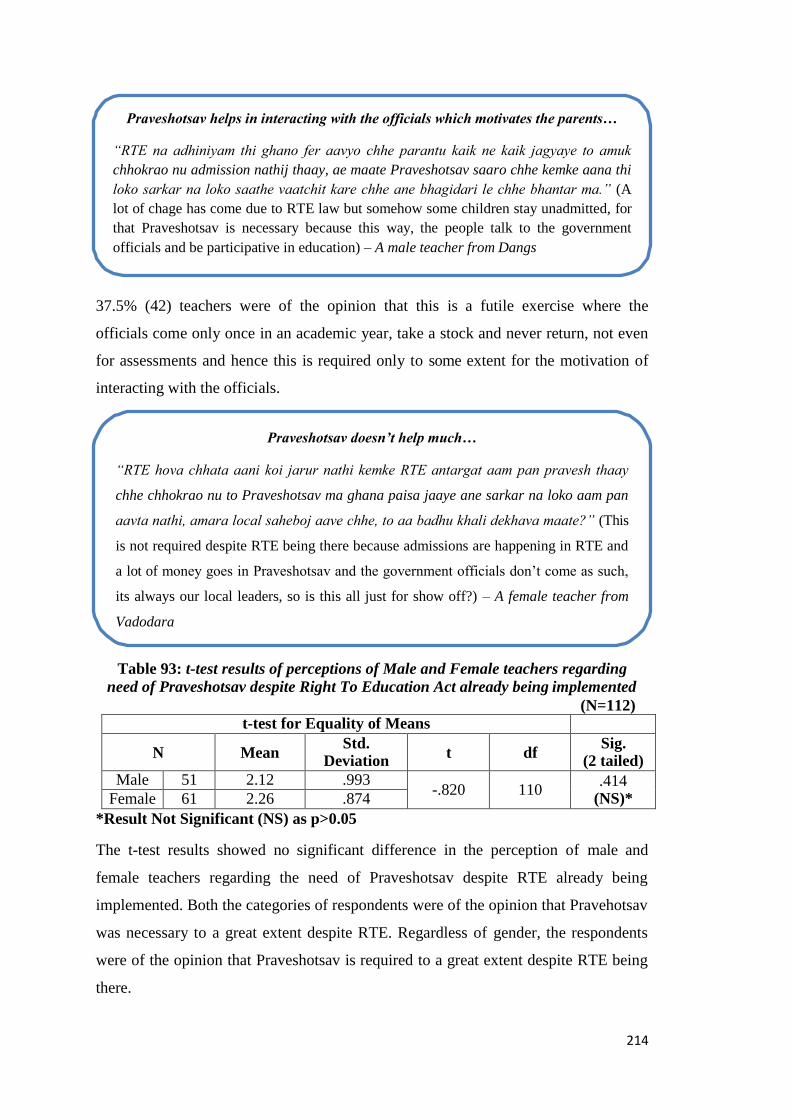
Praveshotsav doesn’t help much…
“RTE hova chhata aani koi jarur nathi kemke RTE antargat aam pan pravesh thaay
chhe chhokrao nu to Praveshotsav ma ghana paisa jaaye ane sarkar na loko aam pan
aavta nathi, amara local saheboj aave chhe, to aa badhu khali dekhava maate?” (This
is not required despite RTE being there because admissions are happening in RTE and
a lot of money goes in Praveshotsav and the government officials don‘t come as such,
its always our local leaders, so is this all just for show off?) – A female teacher from
Vadodara
37.5% (42) teachers were of the opinion that this is a futile exercise where the
officials come only once in an academic year, take a stock and never return, not even
for assessments and hence this is required only to some extent for the motivation of
interacting with the officials.
Table 93: t-test results of perceptions of Male and Female teachers regarding
need of Praveshotsav despite Right To Education Act already being implemented
(N=112)
t-test for Equality of Means
N Mean Std.
Deviation t df
Sig. (2 tailed)
Male 51 2.12 .993 -.820 110
.414 (NS)* Female 61 2.26 .874
*Result Not Significant (NS) as p>0.05
The t-test results showed no significant difference in the perception of male and
female teachers regarding the need of Praveshotsav despite RTE already being
implemented. Both the categories of respondents were of the opinion that Pravehotsav
was necessary to a great extent despite RTE. Regardless of gender, the respondents
were of the opinion that Praveshotsav is required to a great extent despite RTE being
there.
214
Praveshotsav helps in interacting with the officials which motivates the parents…
“RTE na adhiniyam thi ghano fer aavyo chhe parantu kaik ne kaik jagyaye to amuk
chhokrao nu admission nathij thaay, ae maate Praveshotsav saaro chhe kemke aana thi
loko sarkar na loko saathe vaatchit kare chhe ane bhagidari le chhe bhantar ma.” (A
lot of chage has come due to RTE law but somehow some children stay unadmitted, for
that Praveshotsav is necessary because this way, the people talk to the government
officials and be participative in education) – A male teacher from Dangs

Table 94: Analysis of Variance (ANOVA) results of perceptions of teachers
regarding need of Praveshotsav despite Right To Education Act already being
implemented in relation with selected variables
(N=112)
Variables Source of
Variance
Sum of
Squares df
Mean
Square F Sig.
District
Between Groups
4.413 3 1.471
1.741 .163
(NS)* Within Groups 91.266 108 .845
Years of
Association
with the school
Between Groups
1.188 4 .297 .336
.853
(NS)* Within Groups 94.490 107 .883
Whether
undergone
any
Teacher
Training
Between Groups
18.456 2 9.228
13.025
.000
(Sig.)**
Within Groups
77.223
109
.708
** Result Significant (Sig) as p<0.05, *Result Not Significant (NS) as p>0.05
The ANOVA results indicated no significant difference in the perception of the
teachers regarding the need of Praveshotsav despite RTE already being there with
regard to variables like District and years of association of the teachers with the
schools. A significant difference in the perception of teachers was however recorded
in relation towhether the teachers had undergone any teacher trainings or not. To
identify the group which significantly differs, a post hoc test was done.
Table 95: Post Hoc Test result for perception of teachers regarding
need of Praveshotsav despite Right To Education Act already being there
(N=112)
Variables (I)
Variable
(I)
Mean
(J)
Variable
(J)
Mean
Mean
Difference (I-J)
Std.
Error
Sig.
Whether
undergone
any
Teacher
Training
No
2.33
Yes
2.32
0.010
0.343
0.976
(NS)*
No
Response
.90
1.430
0.521 0.015
(Sig.)**
** Result Significant (Sig) as p<0.05, *Result Not Significant (NS) as p>0.05
The post hoc results of teachers‘ perception regarding need of Praveshotsav despite
RTE already being there revealed that the teachers who had not undergone any
training were of the perception that Praveshotsav was necessary despite RTE being
there already. The teachers who had not responded whether they had undergone any
215

54.5% (N=112)
41.1%
4.4%
To a Great Extent
To Some Extent
To the Least Extent
training or not were of the opinion that Praveshotsav was important despite RTE
being there. Their perceptions differed significantly from the teachers who had not
undergone training. The teachers who had undergone training were of the opinion that
Praveshotsav is important as they had understood that the provisions of both the
programmes are different and thus they both serve other purposes as well. While RTE
has provisions for free incentives and involvement of community in the school
programmes, Praveshotsav has provisions of large community interactions with the
government officials.
Table 96: Distribution of teachers’ perceptions respondents regarding
role of Gunotsav in increasing quality of teaching and learning
(N=112)
Role of Gunotsav in increasing quality of teaching and learning
Frequency Percentage
To a Great Extent 61 54.5
To Some Extent 46 41.1
To the Least Extent 5 4.4
112 100
Figure 38: Distribution of teachers’ perceptions respondents regarding
role of Gunotsav in increasing quality of teaching and learning
54.5% (61) teacher respondents felt that Gunotsav has been successful to a great
extent in increasing the quality of education in the schools. 41.1% (46) teachers felt
that it has been successful to some extent. These teachers believed that Gunotsav
being a quality improvement programme still needs to be implemented in a proper
way so as to see visible results, not only Gunotsav, but other things like teacher
mentoring, skills of the teacher and infrastructural support play an important role in
ensuring quality of education in the schools.
216

4.4% (5) teachers felt that Gunotsav is instrumental to the least extent in ensuring
quality of education.
Table 97: t-test results of perceptions of Male and Female teachers regarding
role of Gunotsav in increasing the quality of teaching and learning
(N=112)
t-test for Equality of Means
n Mean Std.
Deviation t df
Sig. (2 tailed)
Male 51 2.59 .606 1.538 110
.127 (NS)* Female 61 2.41 .616
*Result Not Significant (NS) as p>0.05
The t-test results suggested no significant difference in the perception of male and
female teachers regarding role of Gunotsav in increasing the quality of teaching and
learning. Both the categories of respondents felt that Gunotsav has been instrumental
in increasing the quality of teaching and learning to a great extent.
217
Gunotsav results help us adopt better teaching methodologies…
“Gunotsav na madhyam thi chhokrao nu learning level khabar pade chhe ane ae mujab
shikshako ae kevi paddhati apnavi joiye ae khabar pade chhe. Pan eni sathe sathe
shikshako nu training ane yogya bhanva maate nu vatavaran joiye chhe.” (We get to
know the learning levels of the students through Gunotsav and according to that what
pedagogy the teachers should adopt is known. But along with that, teacher training and a
conducive environment for learning are also important)
- A female teacher from Vadodara

Table 98: Analysis of Variance (ANOVA) results of perceptions of teachers
regarding role of Gunotsav in increasing the quality of teaching and learning in
relation with selected variables
(N=112)
Variables Source of
Variance
Sum of
Squares df
Mean
Square F Sig.
District
Between Groups
7.656 3 2.552
8.028 .000
(Sig)** Within Groups 34.335 108 .318
Years of
Association
with the school
Between Groups
.890 4 .222 .579
.679
(NS)* Within Groups 41.102 107 .384
Whether
undergone
any
Teacher
Training
Between Groups
1.685 2 .842
2.278
.107
(NS)*
Within Groups
40.306
109
.370
** Result Significant (Sig) as p<0.05, *Result Not Significant (NS) as p>0.05
The ANOVA results suggested no significant difference in the perception of teachers
regarding role of Gunotsav in increasing the quality of teaching and learning in
relation with variables like years of association of the teachers with the schools and
whether the teachers have undergone any teacher training or not. A significant
difference was noted in the perception of the teachers in relation to District as a
variable. To identify the group which significantly differs, a post hoc test was done.
The table below gives the results.
Table 99: Post Hoc Test result for perception of teachers regarding
role of Gunotsav in increasing the quality of teaching and learning
(N=112)
Variables (I)
Variable
(I)
Mean
(J)
Variable
(J)
Mean
Mean
Difference (I-J)
Std.
Error
Sig.
District
Banaskantha
2.73
The Dangs
2.70 0.030 0.128 0.815 (NS)*
Surat 2.39 0.340 0.142 0.020 (Sig.)**
Vadodara 2.10 0.630 0.164 0.000
(Sig.)**
** Result Significant (Sig) as p<0.05, *Result Not Significant (NS) as p>0.05
The table highlights the post hoc results of perception of teachers regarding the role of
Gunotsav in increasing the quality of education and it was found that teachers in
Banaskantha and The Dangs districts had a higher mean score depicting that the
218

teachers perceived that Gunotsav has helped in increasing the quality of teaching and
learning. There was a significant difference in the mean scores of teachers from
Banaskantha with those of Vadodara and Surat meaning that the teachers in Vadodara
and Surat were of a lesser opinion of Gunotsav being instrumental in increasing the
quality of teaching and learning.
Table 100: Distribution of teachers’ perception regarding
success of Government plans and programmes in increasing enrolment and
retention of students in primary education
(N=112)
Success of Government Plans and Programmes Frequency Percentage
To a Great Extent 72 64.3
To Some Extent 32 28.5
To the Least Extent 3 2.7
Can‘t Say 5 4.5
112 100
Figure 39: Distribution of teachers’ perception regarding
success of Government plans and programmes in increasing enrolment and
retention of students in primary education
64.3% (72) teachers felt that Government plans and programmes have helped in
increasing the enrolment and retention of the students at the primary level to a great
extent. Prior to this, enrolment still was not an issue, but retention sure was. The
current programmes have been very instrumental in ensuring both increase in
enrolment and retention at the primary level.
219
(N=112)
100.0% 64.3%
50.0% 28.5%
0.0% 2.7% 4.5%
To a Great Extent To Some Extent
To the Least Extent Can't Say

It is true that drop-outs have reduced, but children still stay absent…
“Programmo to aavya ne gaya, pan garib manas maate paisa kamavanu vadhare agatya
nu chhe, etle drop out ghatyu ae vaat sachi, pan chhokrao gulla to pan maarej.”
(Programmes came and went but for a poor person, earning money is more important, so
drop-out rate has decreased that is true but children still stay absent) - A female teacher
from Vadodara
28.5% (32) teachers felt that the Government plans and programmes have been
instrumental to some extent while 2.7% (3) teachers felt that the programmes are
successful to the least extent. 4.5% (5) teachers couldn‘t comment upon it.
Table 101: t-test results of perceptions of Male and Female teachers regarding
success of Government plans and programmes in increasing enrolment and
retention of students in primary education
(N=112)
t-test for Equality of Means
n Mean Std.
Deviation t df
Sig. (2 tailed)
Male 51 2.47 .924 -.343 110
.733
(NS)* Female 61 2.52 .744
*Result Not Significant (NS) as p>0.05
The t-test results indicated no significant difference in the perception of male and
female teachers regarding success of Government plans and programmes in increasing
enrolment and retention of students in primary education. Respondents believed that
the Government plans and programmes have been successful to a great extent in
increasing the enrolment and retention of students in primary education.
220
The new programmes have provisions of many facilities…
“Sarva Shiksha Abhiyan antargat pan khasa badha admission thaya hata pan
vidhyarthiyo drop out ghana thaya chhe, nava program aavya pachi ghani badhi
suvidhao mali chhe jena lidhe chhokrao take chhe nishade.” (Many admissions took
place during Sarva Shiksha Abhiyan but many students used to drop out. After the
inception of new programmes, many facilities have been provided because of which
children stay in school) - A female teacher from Surat

Table 102: Analysis of Variance (ANOVA) results of perceptions of teachers
regarding success of Government plans and programmes in increasing enrolment
and retention of students in primary education in relation with selected variables
(N=112)
Variables Source of
Variance
Sum of
Squares df
Mean
Square F Sig.
District
Between Groups
.940 3 .313
.451 .717
(NS)* Within Groups 75.060 108 .695
Years of
Association
with the school
Between Groups
1.439 4 .360 .516
.724
(NS)* Within Groups 74.561 107 .697
Whether
undergone
any
Teacher
Training
Between Groups
.267 2 .133
.192
.826
(NS)*
Within Groups
75.733
109
.695
*Result Not Significant (NS) as p>0.05
The ANOVA results indicated no significant differences in the perception of teachers
regarding success of Government plans and programmes in increasing enrolment and
retention of students in primary education in relation with selected variables like
District, years of association of the teachers with the school and whether they had
undergone any teacher training or not.
Figure 40: Section II – Major findings regarding success of government plans and
programmes - At a glance
MDM has been most successful
followed by KKY, SP, RTE and Gunotsav
which still needs time
MDM‘s greatest benefit has been inculcation in the habit of sharing and increased regularity
No Detention Policy
compromises quality of
education to a great extent and jeopardizes the
future of children
Kanya Kelavani Yojna has been successful to a great extent in
increasing GER
221

66% (N=112)
80.0%
60.0%
40.0%
20.0%
0.0%
12.5% 17% 4.5%
To a Great To Some
Extent Extent
To the Least
Extent
Can't Say
Section – III
Experiences of Teachers regarding Problems faced in Implementation of
Government Plans and Programmes for Primary School Children
A range of problems were faced in the implementation of the Government plans and
programmes for primary education by the teachers regarding issues like training,
funding, conducting activities and the like. Almost all the teacher respondents felt that
they were burdened with the Government workload which was non-academic in
nature due to which the academic activities were more or less not being fulfilled as
they could not focus on the teaching aspect at all.
Table 103: Distribution of teachers’ perception regarding
sufficiency of funds received by the Government in implementation of the
programmes
(N=112)
Sufficiency of funds received by the Government Frequency Percentage
To a Great Extent 14 12.5
To Some Extent 74 66.0
To the Least Extent 19 17.0
Can‘t Say 5 4.5
112 100
Figure 41: Distribution of teachers’ perception regarding
sufficiency of funds received by the Government in implementation of the
programmes
Regarding perception about sufficiency of funds received from the Government in
implementation of the programmes, 66% (74) teachers said that funds are sufficient to
some extent in meeting the implementation demands. 17% (19) of the teacher
respondents felt that funds are sufficient to the least extent. The reason posed for this
222

Resources are less compared to strength of the students…
“Fund to ochhaj pade chhe kemke chhokrao nu praman vadhare chhe ane ena varti
aapdi paase sadhano occha bhanavva.” (The funds are les only because the strength
of the students is more and as against that the resources are less for teaching)
- A male teacher from Surat
Have to manage in whatever we get…
“Fund no abhaav sarkari prathmik shadao ma kaayam nu hoyj, kemke bhanavvanu
bhaarnu khoobj vadhare chhe ane fund madta nathi. Jetlu hoy, ema manage karvanu
hoy.” (There is always a dearth of funds in Government Primary Schools because the
cost of education is high and there are no funds. Whatever is there, have to manage in
that) - A male teacher from Dangs
was that the learning and the infrastructure demands of the children are ever
increasing and the funds received are not sufficient to meet these ever increasing
demands. Only 12.5%) (12) teachers said that the funds were sufficient to a great
extent, while 4.5% (5) teachers couldn‘t comment on it.
Table 104: t-test results of perceptions of Male and Female teachers regarding
sufficiency of funds received by the Government for implementation of the
programmes
(N=112)
t-test for Equality of Means
n Mean Std.
Deviation t df
Sig. (2 tailed)
Male 51 2.02 .583 2.444 110
.016
(Sig.)** Female 61 1.69 .807
** Result Significant (Sig) as p<0.05
The t- test results indicated a significant difference in the perception of male and
female teachers regarding sufficiency of funds for implementation of the programmes.
In comparison to the female teachers, the mean score of the male teachers was
significantly higher which suggests that the male teachers perceived that the funds
received by the Government for implementation of the programmes were sufficient to
a great extent while the female teachers felt that they were less sufficient.
223

Table 105: Analysis of Variance (ANOVA) results of perceptions of teachers
regarding sufficiency of funds for implementation of the programmes in relation
with selected variables
(N=112)
Variables Source of
Variance
Sum of
Squares df
Mean
Square F Sig.
District
Between Groups
3.938 3 1.313
2.569 .058
(NS)* Within Groups 55.170 108 .511
Years of
Association
with the school
Between Groups
1.630 4 .407 .758
.555
(NS)* Within Groups 57.478 107 .537
Whether
undergone
any
Teacher
Training
Between Groups
9.868 2 4.934
10.922
.000
(Sig.)**
Within Groups
49.240
109
.452
** Result Significant (Sig) as p<0.05, *Result Not Significant (NS) as p>0.05
The ANOVA results indicated no significant difference in the perception of the
teachers regarding sufficiency of funds for implementation of the programmes in
relation with District and years of association of the teachers with the school. A
significant difference was however noted between the perception of teachers with
regard to whether the teachers had undergone teacher training or not. To know which
group differed significantly in their perception, a post hoc analysis was applied.
Table 106: Post Hoc Test result for perception of teachers regarding
sufficiency of funds for implementation
(N=112)
Variables (I)
Variable
(I)
Mean
(J)
Variable
(J)
Mean
Mean
Difference (I-J)
Std.
Error
Sig.
Whether
undergone
Teacher
Training
No
2.50
Yes 1.89 0.610 0.264 0.022
(Sig.)**
No
Response 1.00 1.500 0.577
0.021 (Sig.)**
** Result Significant (Sig) as p<0.05
The above table reflects the post hoc results regarding the perception of teachers
regarding sufficiency of funds in implementing the programmes with regard to
whether the teachers had undergone teacher training. The data reflects that the mean
scores of the teachers who had not undergone training had a higher mean score as
compared to the ones who had undergone training. There was a significant difference
in the mean scores of respondents from both the categories. The former group of
224

57.1% (N=112)
60.0%
50.0%
40.0%
30.0%
20.0%
10.0%
0.0%
36.6%
5.4% 0.9%
To a Great To Some
Extent Extent
To the Least
Extent
Can't Say
respondents believed that funds were sufficient, the latter group of respondents
believed that they were sufficient to a lesser extent. The trained teachers had received
training regarding diverting funds from budget heads and had knowledge regarding
which fund to use where, and so for them, the funds were insufficient.
Table 107: Perception of teachers regarding
provision of training for proper implementation of the programmes
(N=112)
Training for proper implementation is provided Frequency Percentage
To a Great Extent 64 57.1
To Some Extent 41 36.6
To the Least Extent 6 5.4
Can‘t Say 1 0.9
112 100
Figure 42: Perception of teachers regarding
provision of training for proper implementation of the programmes
Training is a very crucial element in ensuring that the skills of the teachers are
upgraded from time to time to meet the learning demands of the children and to
ensure proper delivery of the academic inputs provided. 57.1% (64) teachers believed
that trainings are provided to a great extent which are yearly in nature. 36.6% (41)
teachers felt that that training for proper implementation is provided to some extent
while 5.4% (6) teachers said that trainings are provided to the least extent. 0.9% (1)
respondent couldn‘t comment on it.
225
Nothing new happens in trainings…
“Trainings aapva ma aave chhe parantu dar vakhate ek ne ek vastu hoy, kaik navu nai
hoy.” (Trainings are provided but everytime the content is the same, nothing new is there)
– A female teacher from Surat
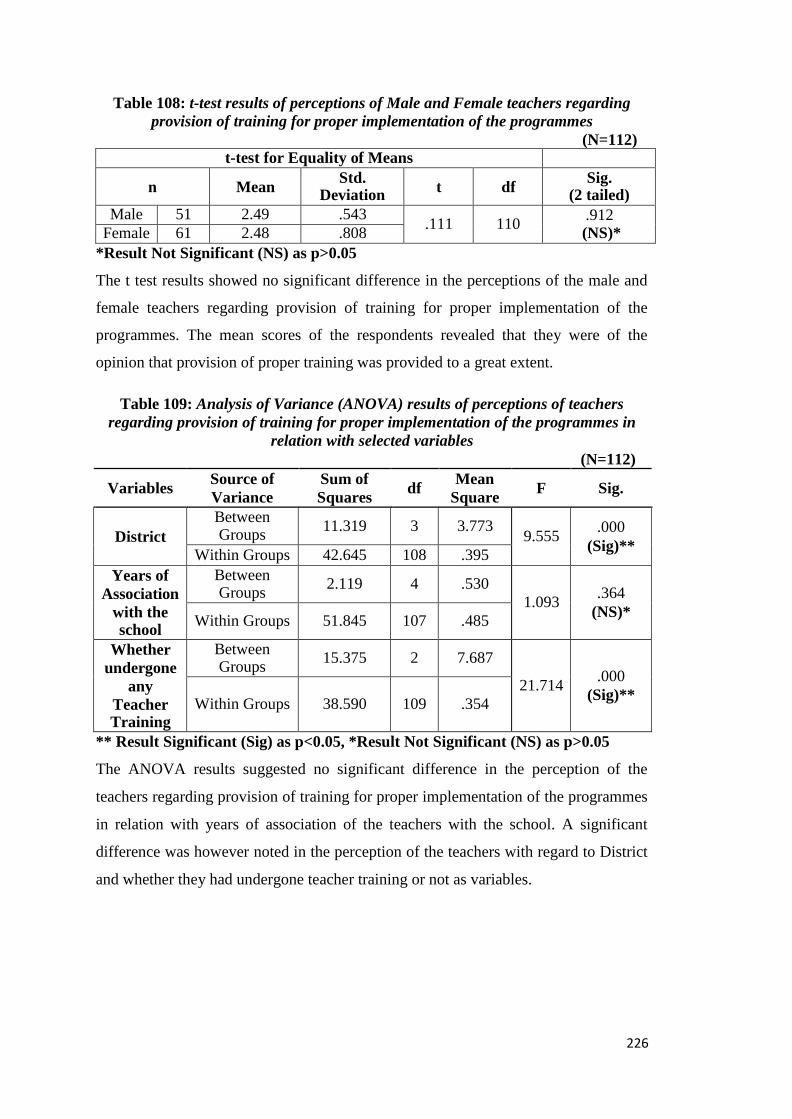
Table 108: t-test results of perceptions of Male and Female teachers regarding
provision of training for proper implementation of the programmes
(N=112)
t-test for Equality of Means
n Mean Std.
Deviation t df
Sig. (2 tailed)
Male 51 2.49 .543 .111 110
.912 (NS)* Female 61 2.48 .808
*Result Not Significant (NS) as p>0.05
The t test results showed no significant difference in the perceptions of the male and
female teachers regarding provision of training for proper implementation of the
programmes. The mean scores of the respondents revealed that they were of the
opinion that provision of proper training was provided to a great extent.
Table 109: Analysis of Variance (ANOVA) results of perceptions of teachers
regarding provision of training for proper implementation of the programmes in
relation with selected variables
(N=112)
Variables Source of
Variance
Sum of
Squares df
Mean
Square F Sig.
District
Between Groups
11.319 3 3.773
9.555 .000
(Sig)** Within Groups 42.645 108 .395
Years of
Association
with the school
Between Groups
2.119 4 .530 1.093
.364
(NS)* Within Groups 51.845 107 .485
Whether
undergone
any
Teacher Training
Between Groups
15.375 2 7.687
21.714
.000
(Sig)**
Within Groups
38.590
109
.354
** Result Significant (Sig) as p<0.05, *Result Not Significant (NS) as p>0.05
The ANOVA results suggested no significant difference in the perception of the
teachers regarding provision of training for proper implementation of the programmes
in relation with years of association of the teachers with the school. A significant
difference was however noted in the perception of the teachers with regard to District
and whether they had undergone teacher training or not as variables.
226

Table 110: Post Hoc Test result for perception of teachers regarding
provision of training for proper implementation of the programmes
(N=112)
Variables (I)
Variable
(I)
Mean
(J)
Variable
(J)
Mean
Mean
Difference (I-J)
Std.
Error
Sig.
Whether
undergone
Teacher Training
No
2.67
Yes 2.59 0.080 0.240 0.739 (NS)*
No Response
1.30 1.370 0.424 0.006
(Sig.)**
District
Banaskantha
2.80
Dangs 2.37 0.430 0.143 0.003
(Sig.)**
Surat 2.78 0.020 0.115 0.862 (NS)*
Vadodara 2.03 0.770 0.175 0.000
(Sig.)**
** Result Significant (Sig) as p<0.05, *Result Not Significant (NS) as p>0.05
The above table highlights the post hoc results of perception of teachers regarding
provision of training for proper implementation with regard to selected variables. The
data reflects that as far as the variable whether teachers have undergone teacher
training is considered, the mean score of the teachers who have not undergone
training is higher than those who have undergone training depicting that the trainings
were provided to some extent. There was a significant difference in the perception of
the teachers who gave no response to the training as they believed that the training
was provided to the least extent.
With regard to District as a variable, the mean scores of teachers in Banaskantha were
higher compared to those in other districts. While there was no significant difference
in the mean scores of teachers from Banaskantha and Surat who believed that
trainings were sufficient, there was a significant difference in the perceptions of
teachers from Dangs and Vadodara. The teachers from Dangs and Vadodara were of
the opinion that the trainings were not sufficient.
227
Teachers who are free are sent for trainings…
“Amuk vaar training hoy to je shikshak free hoy athva senior hoy, ene mokalvama aave
chhe district training ma. Sarkar na kaam na lidhe junior shikshako ne javani tak occhi
made chhe.” (Sometimes whenever there is a training teachers who are free or are
seniors, they get to go for the trainings at the district level. Due to Government work,
junior teachers get lesser opportunities to go) – A female teacher from Dangs

44.6% (N=112)
50.0%
40.0%
30.0%
20.0%
10.0%
0.0%
32.1%
14.3% 8.9%
To a Great To Some Extent Extent
To the Least
Extent
Can't Say
New teachers sometimes don’t know their roles and responsibilities…
“Amuk vaar to navo shikshako ni nimnuk thaay chhe pan ae loko ne potane kaik
khabar nai hoy ke procedure shu chhe ne badhu.” (Sometimes new teachers are
appointed but they don‘t themselves know what the procedure is all) – A female
teacher from Vadodara
Table 111: Perception of teachers regarding
cluelessness about the deliverables to be provided to the children
(N=112)
Cluelessness about the deliverables to be provided to the children
Frequency Percentage
To a Great Extent 16 14.3
To Some Extent 36 32.1
To the Least Extent 50 44.6
Can‘t Say 10 8.9
112 100
Figure 43: Perception of teachers regarding
cluelessness about the deliverables to be provided to the children
With regard to the problem of the teachers having no idea about the deliverable to be
provided to the children under various programmes, it was noted that 44.6% (50) of
the teachers felt that this was a problem to the lest extent. 32.1% (36) teachers felt that
this was a problem to some extent as sometimes new teachers do not have much idea
about the new policies and acts that the Government comes up with.
228
Same things are repeated in each training…
“Training ma kaik navu hotu nathi,dar vakhate same to same vastu ni training hoy. Aam
joiye to waste of time laage chhe.” (There is nothing new in training, everytime it‘s the
same thing. If we see it, it seems like a waste of time).
– A female teacher from Surat

44.6% (50) teachers felt that this was the problem to the least extent. 8.9% (10)
teachers couldn‘t comment on it as they felt that was a large communication gap from
their superiors itself.
Table 112: t-test results of perceptions of Male and Female teachers regarding
cluelessness about the deliverables to be provided to the children
(N=112)
t-test for Equality of Means
n Mean Std.
Deviation t df
Sig. (2 tailed)
Male 51 1.49 .809 -.010 110
.992 (NS)* Female 61 1.49 .942
*Result Not Significant (NS) as p>0.05
The t test results showed no significant difference in the perceptions of male and
female teachers regarding the problem of no idea about the deliverables to be
provided to the children under various Government programmes for primary
education. The respondents felt that no idea about the deliverables was a problem to
some extent.
Table 113: Analysis of Variance (ANOVA) results of perceptions of teachers
regarding cluelessness about the deliverables to be provided to the children
in relation with selected variables
(N=112)
Variables Source of
Variance
Sum of
Squares df
Mean
Square F Sig.
District
Between Groups
6.821 3 2.274
3.102 .030
(Sig.)** Within Groups 79.170 108 .733
Years of
Association
with the
school
Between Groups
3.350 4 .837 1.084
.368
(NS)* Within Groups 82.641 107 .772
Whether
undergone
any Teacher
Training
Between Groups
4.351 2 2.176 2.905
.059
(NS)* Within Groups 81.640 109 .749
** Result Significant (Sig) as p<0.05, *Result Not Significant (NS) as p>0.05
The ANOVA results showed no significant difference in the perception of the
teachers with regard to variables like years of association with the school, whether
undergone any teacher training. A significant difference was found in terms of district
as a variable. To know which group differed significantly in their perception, a post
hoc analysis was applied
229

Table 114: Post Hoc Test result for perception of teachers regarding
cluelessness about the deliverables to be provided to the children
in relation with selected variables
(N=112)
Variables (I)
Variable
(I)
Mean
(J)
Variable
(J)
Mean
Mean
Difference
(I-J)
Std.
Error
Sig.
District
Vadodara
1.79
Banaskantha 1.47 0.320 0.259 0.221 (NS)*
Dangs 1.13 0.660 0.249 0.010
(Sig.)**
Surat 1.61 0.180 0.250 0.475 (NS)*
** Result Significant (Sig) as p<0.05, *Result Not Significant (NS) as p>0.05
The above table gives the post hoc results of perception of teachers regarding problem
of no idea about the deliverables to be provided to the children in relation with
selected variables. The results indicated a higher mean score of the responses of the
teachers from Vadodara district indicating that the teachers felt this to be a more of a
problem. There was no significant difference in the perception of the teachers
between Vadodara, Banaskantha and Surat district. The perception of the teachers in
Dangs however differed indicating that, for them this was not much of a problem.
Table 115: Perception of teachers regarding problem of unavailability of checklist
by the Government to check progress of the implementation
(N=112)
Problem of unavailability of checklist by the
Government Frequency Percentage
To a Great Extent 21 18.8
To Some Extent 51 45.5
To the Least Extent 30 26.8
Can‘t Say 10 8.9
112 100
230

Sometimes we forget actual work due to Government workload…
“Sarkar ni kaamgirio etli hoy jemke census nu kaam, data entry, pachhi amna to
election ma ketlo time gayo to amuk vaar dhyan bhar thai jaaye che kaam. Checklist
hoy to khabar pade ne kai kaam kyare karvanu chhe. Koi ek shikshak jeni javabdari
hoy ae busy hoy, to bija ne to kaam aapi shakay ne.” (There is a lot of Government
work like census work, data entry and this time we had a lot of election work so at
times it slips from the mind. If we have a checklist, we get to know what work is left.
If the teacher who is assigned with the work is busy, then atleast other teacher can be
assigned the responsibility) – A female teacher from Vadodara
Figure 44: Perception of teachers regarding problem of unavailability of checklist
by the Government to check progress of the implementation
45.5% (51) teachers felt that the Government not providing a checklist to check the
progress of the work done, is a problem to some extent. One, the teachers cannot keep
a track and second they have so many other government work that they cannot focus
on too many things at the same time.
18.8% (21) respondents said that it was a problem to a great extent as they have too
much workload which only keeps increasing.
26.8% (30) teachers felt that this was a problem to the least extent as they usually get
roles and responsibilities assigned to them by the superiors. 8.9% (10) teachers
couldn‘t comment on it.
231
Checklist would help us to stick to work….
“Ek aavi kaam ni yaadi hoy to khabar pade kai kaam karvanu chhe kemko roj kaik
navu navu kaam aavyaj kare chhe. Bhanavva karta to shikshako kaam maanj atvaya
reh chhe.” (There should be a list of work to be done so that we know what is to be
done because everyday something new keeps coming. More than teaching, the teachers
are stuck in doing other work only) – A female teacher from Surat
45.5% (N=112)
50.0%
40.0%
30.0%
20.0%
10.0%
0.0%
26.8% 18.8%
8.9%
To a Great To Some
Extent Extent
To the Least
Extent
Can't Say

Table 116: t-test results of perceptions of Male and Female teachers regarding
problem of unavailability of checklist by the Government to check the progress of
work
(N=112)
t-test for Equality of Means
N Mean Std.
Deviation t df
Sig. (2 tailed)
Male 51 1.73 .850 .302 110
.763 (NS)* Female 61 1.67 .995
*Result Not Significant (NS) as p>0.05
No significant difference in perception of male and female teachers was recorded in
terms of the problem of no provision of checklist being provided by the Government
to check the progress of work done in the implementation of plans and programmes
for primary school children. Both the categories of respondents were of the opinion
that no provison of checklist to check the work was a problem to some extent.
Table 117: Analysis of Variance (ANOVA) results of perceptions of teachers
regarding problem of unavailability of checklist by the Government to check the
progress of work in relation with selected variables
(N=112)
Variables Source of Variance
Sum of Squares
df Mean
Square F Sig.
District
Between Groups
17.287 3 5.762
7.939 .000
(Sig.)** Within Groups 78.392 108 .726
Years of
Association
with the
school
Between Groups
5.039 4 1.260 1.487
.211
(NS)* Within Groups 90.639 107 .847
Whether
undergone
any
Teacher
Training
Between Groups
10.120 2 5.060
6.447
.002
(Sig.)**
Within Groups
85.558
109
.785
** Result Significant (Sig) as p<0.05, *Result Not Significant (NS) as p>0.05
The ANOVA results suggested no significant difference in the perception of teachers
regarding problem of no provision of checklist by the Government to check the
progress of work done in the implementation of plans and programmes for primary
education at the school with years of association of the teachers with the school. A
significant difference was however found with regard to District and whether the
232

teachers had undergone teacher training or not. To identify which group differs
significantly, the data was put to post-hoc analysis.
Table 118: Post Hoc Test result for perception of teachers regarding problem of
unavailability of checklist by the Government to check the progress of work
in relation with selected variables
(N=112)
Variables (I)
Variable
(I)
Mean
(J)
Variable
(J)
Mean
Mean
Difference
(I-J)
Std.
Error
Sig.
Whether
undergone
Teacher
Training
Yes
1.81
No 1.33 0.480 0.371 0.199
(NS)*
No Response
.80 1.010 0.295 0.000
(Sig.)**
District
Banaskantha
2.17
Dangs 1.47 0.700 0.229 0.003
(Sig.)**
Surat 2.00 0.170 0.199 0.395 (NS)*
Vadodar a
1.21 0.960 0.215 0.000
(Sig.)**
** Result Significant (Sig) as p<0.05, *Result Not Significant (NS) as p>0.05
The above table gives the post hoc results for the perception of teachers regarding
problem of no provision of checklist by the Government to check the progress of
work in relation with selected variables. With regard to whether the teachers had
undergone teacher training or not, the teachers who had undergone training were of a
higher opinion that no provision of checklist is more of a problem as compared to the
teachers belonging to the other categories.
With regard to District as a variable, teachers in Banaskantha had no significantly
different perceptions with those of the ones in Surat. Teachers from both the districts
thought that not being provided with a checklist is more of a problem. While the
responses of teachers in Vadodara and Dangs differed significantly, with the major
perception of not being provided with a checklist as not much of a problem.
233
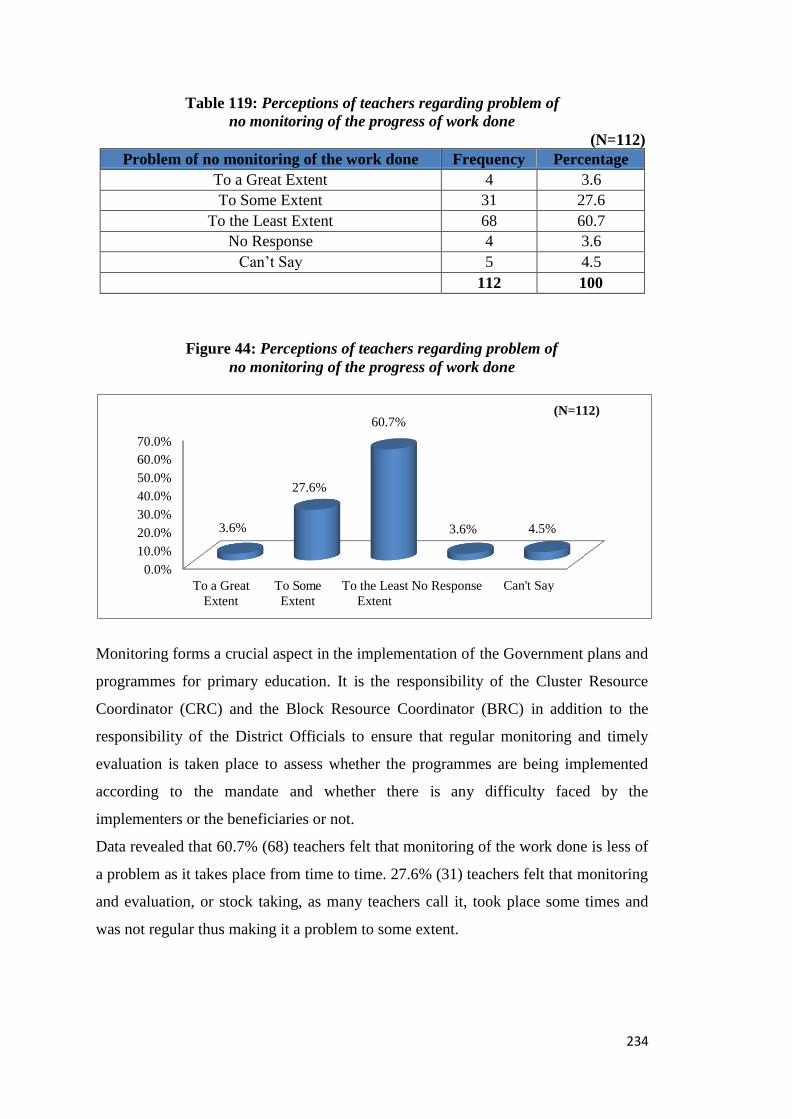
60.7% (N=112)
70.0%
60.0%
50.0%
40.0%
30.0%
20.0%
10.0%
0.0%
27.6%
3.6% 3.6% 4.5%
To a Great To Some
Extent Extent
To the Least No Response
Extent
Can't Say
Table 119: Perceptions of teachers regarding problem of
no monitoring of the progress of work done
(N=112)
Problem of no monitoring of the work done Frequency Percentage
To a Great Extent 4 3.6
To Some Extent 31 27.6
To the Least Extent 68 60.7
No Response 4 3.6
Can‘t Say 5 4.5
112 100
Figure 44: Perceptions of teachers regarding problem of
no monitoring of the progress of work done
Monitoring forms a crucial aspect in the implementation of the Government plans and
programmes for primary education. It is the responsibility of the Cluster Resource
Coordinator (CRC) and the Block Resource Coordinator (BRC) in addition to the
responsibility of the District Officials to ensure that regular monitoring and timely
evaluation is taken place to assess whether the programmes are being implemented
according to the mandate and whether there is any difficulty faced by the
implementers or the beneficiaries or not.
Data revealed that 60.7% (68) teachers felt that monitoring of the work done is less of
a problem as it takes place from time to time. 27.6% (31) teachers felt that monitoring
and evaluation, or stock taking, as many teachers call it, took place some times and
was not regular thus making it a problem to some extent.
234

While only 3.6% (4) teachers felt that the monitoring does not take place regularly
and thus it is a problem to a great extent, 4.5% (5) teachers couldn‘t comment on it as
they had no idea when the last monitoring took place in their school. 3.6% (4)
teachers chose not to respond to the question.
Table 120: t-test results of perceptions of Male and Female teachers regarding
problem of no monitoring of the work done by officials
(N=112)
t-test for Equality of Means
n Mean Std.
Deviation t df
Sig. (2 tailed)
Male 51 1.35 .658 1.256 110
.212 (NS)* Female 61 1.20 .654
** Result Not Significant (NS) as p>0.05
There was no significant difference in the means of perceptions of male and female
teachers regarding problem of no monitoring of the work done by the officials. Both
the categories of the respondents felt that no monitoring of work by officials was a
problem to some extent.
235
Monitoring ensures that the work is done…
“Assessment maate to CRC/BRC aave chhe. Jyare CRC amara dar athvadiye aave
chhe, BRC saheb thoda occha aave chhe. Aana lidhe su thay, jyare monitoring thay ne
to shikshako ma bhay reh ke kaam karvanu chhe, ane monitoring na thava thi nuksan to
amnej thay ne.” (CRC/BRC come for assessment. While CRC comes to visit us once a
week, BRC sir comes a little less. What happens due to this is that when monitoring
happens, teachers are scared that work needs to be done and if the monitoring does not
take place, the loss is ours only) – A female teacher from Dangs

Table 121: Analysis of Variance (ANOVA) results of perceptions of teachers
regarding problem no monitoring of the work done by officials
in relation with selected variables
(N=112)
Variables Source of
Variance
Sum of
Squares df
Mean
Square F Sig.
District
Between Groups
3.066 3 1.022
2.459 .067
(NS)* Within Groups 44.898 108 .416
Years of
Association
with the school
Between Groups
2.619 4 .655 1.545
.194
(NS)* Within Groups 45.345 107 .424
Whether
undergone
any
Teacher
Training
Between Groups
3.031 2 1.515
3.676
.029
(Sig.)**
Within Groups
44.933
109
.412
** Result Significant (Sig) as p<0.05, *Result Not Significant (NS) as p>0.05
The ANOVA results suggested no significant differences in the perceptions of the
teachers with regard to problem of no monitoring of the work done by the officials
with regard to District and years of association of the teachers with the schools. A
significant difference was however found in the perception of the teachers with
whether the teachers had undergone training or not. To identify which group differs
significantly, the data was put to post-hoc analysis.
Table 122: Post Hoc Test result for perception of teachers regarding
problem of no monitoring of the work done by officials
(N=112)
Variables (I)
Variable
(I)
Mean
(J)
Variable
(J)
Mean
Mean
Difference (I-J)
Std.
Error
Sig.
Whether
undergone
any
Teacher
Training
Yes
1.33
No 1.00 0.330 0.257 0.202 (NS)*
No
Response
.80
0.530
0.214 0.014
(Sig.)**
** Result Significant (Sig) as p<0.05, *Result Not Significant (NS) as p>0.05
The above table highlights the post hoc results of the perception of teachers regarding
problem of no monitoring of the work done by officials in relation to whether the
teachers had undergone any teacher training. The results suggested that the mean
scores of the teachers who had undergone training were higher as compared to the
ones who had not undergone training, showing that their perception of the no
236

When resources break down, they are not repaired on time…
“BISAG na madhyam thi amuk vaar bhanavva ma aave chhe. Jyare bagdi jaye tv to
problem aave chhe ane ghani vakhat ketla samay sudhi ae thik nai thato. Aaana lidhe
to amuk chhokrao jene digital madhyam thi bhanvama ma ras chhe, ae aavta nathi
schoole” (Teaching happens through BISAG. When that broke down we faced a
problem and many times it is not repaired. Due to this, the children who are interested
in studying through digital mediums do not come to school) – A male teacher from
Surat
Sometimes resources are no received on time…..
“Material ma to chopdao amuk vaar time par madti nathi. Uniform na kaapad time
par madta nathi jethi ame chhokrao ne ghar na kapda maanj schoole bolaiye chhe.”
(In materials, books are not received on time. The cloth for the uniform is not received
on time due to which we ask the children to come in civil dress to the school) – A
female teacher from Dangs
monitoring of the work done by officials is higher as compared to the other teachers
who had not undergone training.
Table 123: Perceptions of teachers regarding
problem of materials not being provided on time
(N=112)
Problem of materials not being provided on time Frequency Percentage
To a Great Extent 14 12.5
To Some Extent 31 27.7
To the Least Extent 67 59.8
112 100
Figure 46: Perceptions of teachers regarding
problem of materials not being provided on time
According to the data, 59.8% (67) teachers felt materials not being provided on time
as a problem to the least extent. 27.7% (31) teachers felt that this is a problem to some
extent as the effective implementation suffers due to that. While only 12.5% (14)
teachers felt that the material not being provided on time is a problem to a great
extent. By materials, the teachers largely meant the books, educational infrastructure
and scholarships for children under various schemes.
237
100.0%
50.0%
0.0%
12.5% 27.7% 59.8% (N=112)
To a Great To Some Extent To the Least
Extent Extent

This finding can be related to Mukherjee & Mukherjee‘s (2008), book entitled
―Primary Education: Contemporay Issues and Experiences‖ highlighted that
infrastructural deficiencies play a major role in elementary education in India. They
stated that the lack of interest in studies is largely due to the poor quality of schooling
system which do not provide the required amenities which are lacking.
Table 124: t-test Results of perceptions of Male and Female teachers
regarding materials not being provided on time
(N=112)
t-test for Equality of Means
n Mean Std.
Deviation t df
Sig. (2 tailed)
Male 51 1.63 .774 2.018 110
.046 (Sig.)** Female 61 1.33 .790
** Result Significant (Sig) as p<0.05
The t-test results suggested a significant difference in the perceptions of male and
female teachers regarding the problem of materials not being provided on time. It can
thus be inferred that the male teachers feel that materials not being provided on time
is a problem compared to their female counterparts. It was also a phenomenon
observed in many schools that the male teachers were more proactive towards using
technology in education, specifically tv, computer and smart class for teaching and
unavailability of these facilities is largely a problem for the male teachers.
Table 125: Analysis of Variance (ANOVA) results of perceptions of teachers
regarding materials not being provided on time in relation with selected variables
(N=112)
Variables Source of
Variance
Sum of
Squares df
Mean
Square F Sig.
District
Between Groups
11.027 3 3.676
6.748 .000
(Sig.)** Within Groups 58.830 108 .545
Years of
Association
with the school
Between Groups
3.514 4 .879 1.417
.233
(NS)* Within Groups 66.343 107 .620
Whether
undergone
any Teacher Training
Between Groups
5.684 2 2.842 4.827
.010
(Sig.)** Within Groups 64.173 109 .589
** Result Significant (Sig) as p<0.05, *Result Not Significant (NS) as p>0.05
238

The ANOVA results suggested no significant difference in the perceptions of the
teachers regarding the problem of materials not being provided on time with regard to
years of association of the teacher with the school as a variable. A significant
difference was found between the perceptions of teachers with regard to variables like
whether the teachers had undergone any teacher training and District was however
found. To identify which group differs significantly, the data was put to post-hoc
analysis.
Table 126: Post Hoc Test result for perception of teachers
regarding problem of materials not being provided on time
(N=112)
Variables (I)
Variable
(I)
Mean
(J)
Variable
(J)
Mean
Mean
Difference (I-J)
Std.
Error
Sig.
Whether
undergone
Teacher
Training
Yes
1.55
No 1.17 0.380 0.317 0.232 (NS)*
No Response
.80 0.750 0.259 0.000
(Sig.)**
District
Dangs
1.80
Banaskantha 1.00 0.800 0.139 0.000
(Sig.)**
Surat 1.39 0.410 0.191 0.036
(Sig.)**
Vadodara 1.66 0.140 0.237 0.557 (NS)*
** Result Significant (Sig) as p<0.05, *Result Not Significant (NS) as p>0.05
The above table gives the post hoc results of perception of teachers regarding problem
of materials not being provided on time in relation to whether the teachers had
undergone any teacher training. The results suggested that the teachers who had
undergone training had a higher mean score as compared to teachers who had not
undergone training suggesting that the trained teachers felt that the materials not being
provided on time is much of a problem.
With regard to District as a variable, it was found that the teachers in Dangs had a
higher mean score indicating that they felt that unavailability of materials is more of a
problem. There was no significant difference in the perception of the teachers
between Vadodara and Dangs. The teachers in Surat and Banaskantha had a
significant difference in their perceptions as they were or the opinion that
unavailability of the materials is a problem to the least extent.
239

43.8% 38.3%
50.0% (N=112)
17.9%
0.0%
To a Great ExtenTt o Some ExtenTto the Least Extent
Parents don’t come initially and then come later on to avail the benefits…..
“RTE hetad jyare naam nondhavanu vaaro aave, tyare valiyo aavta nathi. Pachi
pachad thi vache aaine naam nondhave to chhokrao ne addha ma thi levu pade, eno to
shikshan bagde ne.”(When parents have to enroll their children under RTE, they don‘t
do it and then later they come in between and enroll, we have to take children from
between, the child‘s education is affected) – A female teacher from Vadodara
Table 127: Perceptions of teachers regarding
rigidity of community members for participation in implementation of the
programmes
(N=112)
Community members are rigid to participate Frequency Percentage
To a Great Extent 20 17.9
To Some Extent 49 43.8
To the Least Extent 43 38.3
Grand Total 112 100
Figure 47: Perceptions of teachers regarding
rigidity of community members for participation in implementation of the
programmes
The above table shows the frequency and percentage distribution of responses of
teachers regarding participation of community members in implementation of the
programmes at school. Participation for the community members is very crucial in the
implementation of programmes for primary school children as it ensures that the
community members take the onus in effective implementation and at the same time
they are made equal stakeholders in the implementation of the government plans and
programmes. 43.8% (49) teachers felt that rigidity of the community members to
participate in various plans and programmes is a problem for them to some extent.
The reason they stated was that the programmes are for the people and when the
people only don‘t participate, it becomes difficult later on.
240

Parents come running when they learnt that other people availed the benefits…..
“Kanya Kelavani ma jyare shishyavrutti ma account kholavvau hoy tyare amara
shikshako madad kare, pan valiyo tyare aavtaj nathi. Pachi emne khabar pade k amuk
na account ma paisa aaya to daudta daudta aave.” (When account needs to be opened
under Kanya Kelavani for scholarships, that time our teachers help but despite that they
don‘t come only. When they later learn that some people got money in their accounts,
then they come running) – A female teacher from Vadodara
17.9% (20) teachers were of the opinion that this was a problem to a great extent as
some parents don‘t participate when the time is right and then they have loads of
queries later when they realize that they didn‘t avail the facilities. 38.3% (43) teachers
said that they feel that this is a problem to the least extent.
Table 128: t-test results of perception of Male and Female teachers regarding
rigidity of community members for participation in
implementation of the programmes
(N=112)
t-test for Equality of Means
n Mean Std.
Deviation t df
Sig. (2 tailed)
Male 51 1.94 .705 2.138 110
.035 (Sig)** Female 61 1.64 .775
** Result Significant (Sig) as p<0.05
The t-test results showed a significant difference in the perceptions of the male and
female teachers regarding problem of rigidity of the community members for
participation in implementation of the programmes at school. The mean score of the
male teachers was more than that of the female teachers suggesting that male teachers
felt that the community members were very rigid in participation in the
implementation of the programmes at school. Most of the male teachers were
involved in community engagement during the programmes in the schools and they
would go around in the community calling people to participate in the programmes
but despite that the community members rarely came.
241

Table 129: Analysis of Variance (ANOVA) results of perceptions of teachers
regarding rigidity of community members for participation in
implementation of the programmes in relation with selected variables
(N=112)
Variables Source of
Variance
Sum of
Squares df
Mean
Square F Sig.
District
Between Groups
5.282 3 1.761
3.271 .024
(Sig)** Within Groups 58.138 108 .538
Years of
Association
with the school
Between Groups
.668 4 .167 .285
.887
(NS)* Within Groups 62.752 107 .586
Whether
undergone
any
Teacher
Training
Between Groups
.997 2 .498
.870
.422
(NS)*
Within Groups
62.423
109
.573
** Result Significant (Sig) as p<0.05, *Result Not Significant (NS) as p>0.05
The above table shows the ANOVA results of perception of teachers regarding the
problem of rigidity of the community members for participation in implementation of
the programmes in school in relation with selected variables. There was no significant
difference in perception of the teachers with regard to years of association of the
teachers with the school. A significant difference was however recorded with regard
to District as a variable. To identify which group differs significantly, the data was put
to post-hoc analysis.
Table 130: Post Hoc Test result for perception of teachers regarding
rigidity of community members for participation in implementation of the
programmes
(N=112)
Variables (I)
Variable
(I)
Mean
(J)
Variable
(J)
Mean
Mean
Difference
(I-J)
Std.
Error
Sig.
District
Vadodara
2.00
Banaskantha 1.43 0.570 0.193 0.004
(Sig.)**
Dangs 1.87 0.130 0.181 0.475 (NS)*
Surat 1.83 0.170 0.235 0.472 (NS)*
** Result Significant (Sig) as p<0.05, *Result Not Significant (NS) as p>0.05
242

The above table highlights the post hoc test results of the perception of teachers
regarding problem of rigidity of community members for participation in
implementation of the programmes with regard to District as a variable. The result
suggested that the mean score of the teachers was highest in Vadodara as compared to
other Districts suggesting that the teachers perceive rigidity of the community
members a problem to a greater extent. Teachers, specifically in the Dangs and
Vadodara faced difficulties in ensuring participation of the community members in
the implementation of the programmes at school. Dangs being an agrarian district has
a majority of the population dependent on the agricultural labour as their livelihood.
Since most of the community members are agricultural labourers, they refused to let
go of their daily wage work and join in the school activities. As in the case of
Vadodara, most of the community members are industrial and agricultural labourers
and they too find it difficult to participate in the implementation of the programmes at
the schools.
There was no significant difference in the mean scores of teacher‘s responses between
Vadodara, Dangs and Surat. However, teachers in Banaskantha differed in their
opinions and felt that community participation is a problem to them to a lesser extent.
Table 131: Perceptions of teachers regarding
difficulty in involving parents in the school activities
(N=112)
Difficulty in involving parents Frequency Percentage
To a Great Extent 14 12.5
To Some Extent 42 37.5
To the Least Extent 56 50
Grand Total 112 100
Figure 48: Perceptions of teachers regarding
difficulty in involving parents in the school activities
243
50% (N=112)
60.0%
40.0%
20.0%
0.0%
37.5%
12.5%
To a Great Extent To Some Extent To the Least
Extent

A question regarding difficulty faced in involving the parents in the school activities
was asked to the teachers and it was found that 50% (56) teachers said that they face
difficulty to the least extent, followed by 37.5% (42) teachers feeling they face
difficulty to some extent and 12.5% (14) teachers facing difficulties to a great extent.
The difficulty largely was in terms of ensuring how parents could be active parts of
the programmes run in the schools like taking onus of monitoring the Mid Day Meal
programme once a month, helping in organizing the school annual programs and the
like.
Table 132: t-test results of perceptions of Male and Female teachers regarding
difficulty in involving parents in school activities
(N=112)
t-test for Equality of Means
n Mean Std.
Deviation t df
Sig. (2 tailed)
Male 51 1.59 .669 -.251 110
.803
(NS)* Female 61 1.62 .778
*Result Not Significant (NS) as p>0.05
The t-test results suggested no difference in the perceptions of male and female
teachers regarding difficulty in involving parents in the school activities. Respondents
from both the categories believed that difficulty in involving parents in school
activities was a problem to least extent.
244
Even when parents come, they don’t participate…..
“Valiyo to khedut hoy ahiya ane aave to pan chhana maana besi reh chhe, kema pan
participate karta nathi.” (Parents here are farmers and even when they come to the
school they don‘t participate in anything and just sit quietly) – A female teacher from
Dangs

Table 133: Analysis of Variance (ANOVA) results of perceptions of teachers
regarding difficulty in involving parents in school activities
in relation with selected variables
(N=112)
Variables Source of
Variance
Sum of
Squares df
Mean
Square F Sig.
District
Between Groups
7.301 3 2.434
5.113 .002
(Sig.)** Within Groups 51.413 108 .476
Years of
Association
with the school
Between Groups
.575 4 .144 .265
.900
(NS)* Within Groups 58.139 107 .543
Whether
undergone
any
Teacher
Training
Between Groups
.741 2 .371
.697
.500
(NS)*
Within Groups
57.973
109
.532
** Result Significant (Sig) as p<0.05, *Result Not Significant (NS) as p>0.05
The ANOVA results showed that there is no significant difference in the perceptions
of teachers regarding difficulty in involving parents with regard to variables like years
of association of the teachers with the school and whether they had undergone any
teacher training or not. A significant difference was however noted with regard to
District as a variable. To identify which group differs significantly, the data was put to
post-hoc analysis.
Table 134: Post hoc result for perception of teachers regarding
difficulty in involving parents in school activities in relation with selected variables
(N=112)
Variables (I)
Variable
(I)
Mean
(J)
Variable
(J)
Mean
Mean
Difference (I-J)
Std.
Error
Sig.
District
Vadodara
1.93
Banaskantha 1.23 0.700 0.166 0.000
(Sig.)**
Dangs 1.63 0.300 0.179 0.987 (NS)*
Surat 1.65 0.280 0.241 0.249 (NS)*
** Result Significant (Sig) as p<0.05, *Result Not Significant (NS) as p>0.05
The above table highlights the post hoc results of perception of teachers regarding
difficulty in involving parents in school activities. The mean score of the teachers in
245

The parents here are very helpful in school activities…..
“Amare tyan valiyo khoob aagad aave chhe shala ni kaamgiri ma. Jaano ke chhokrao ne
ghare thi leva mukvanu hoy to amuk valiyo potana tractor ma lai jaye badako ne. Paisa
ikatha karine school maate samaan lai aave jyare kai khuttu hoy to.” (The parents here
are very helpful in work related to school. like if the children have to be picked up and
dropped, the parents get their own tractors and take the kids. They collect money and get
things for the schools if the school does not have it) – A male teacher from Banaskantha
Vadodara was higher compared to the scores of teachers in other Districts. A
significant difference was found in the scores of the teachers in Vadodara and
Banaskantha suggesting that the teachers in Banaskantha do not find it too difficult to
involve the parents in school activities. Parents in Banaskantha were more involved in
school activities.
Table 135: Section III - Teachers Experiences of Problems faced in
Implementation of Government Plans and Programmes for Primary School
Children – At a Glance
(N=112)
Problem
Experienced
To a
Great
Extent
To Some
Extent
To Least
Extent
Can’t
Say
No
Response
Total
Training 64
(57.1%)
41
(36.6% )
6
(5.4%)
1
(0.9%) -
112
(100%)
No provision
of Checklist 21
(18.8% )
51
(45.5%)
30
(26.8%)
10
(8.9%) -
112
(100%)
Community
Participation
20
(17.9%)
49
(43.8%)
(43)
(38.3%) - -
112
(100%)
Insufficiency of Funds
14
(12.5%)
74
(66% )
19
(17%)
5
(4.5%) -
112
(100%)
Materials not Provided
14 (12.5%)
31 (27.7%)
67 (59.8%)
- - 112
(100%)
No idea about deliverables
6 (14.3%)
36 (32.1%)
50 (44.6%)
10 (8.9%)
- 112
(100%)
Involvement
of Parents 14
(12.5%)
42
(37.5%)
56
(50%) - -
112
(100%)
No Monitoring
4 (3.6%)
31 (27.6%)
68 (60.7%)
5 (4.5%)
4 (3.6%)
112 (100%)
Figures in parentheses indicate percentage
246

Figure 49: Section III - Teachers Experiences of Problems faced in
Implementation of Government Plans and Programmes for Primary School
Children – At a Glance
The above graph gives an overall picture of the problems faced by the teachers with
regard to implementation of the plans and programmes for primary school children.
Amongst all the problems, the most experienced problem was that of teacher training.
Teachers felt that the trainings provided were not upto the mark and did not have
anything new each time. No provision of checklist and no community participation
are also amongst the problems that are faced by the teachers. While these are the
problems faced by the teachers to a great extent, a lot of teachers feel that there are
problems they feel to some extent like insufficiency of funds, provision of no
checklist, no community participation and no involvement of parents in the school
activities.
247
70
60 (N=112)
50
40
30
20
10
0
To a Great Extent
To Some Extent
To Least Extent
Can't Say
No Response

70.0%
60.0%
50.0%
40.0%
30.0%
20.0%
10.0%
0.0%
58.9% (N=112)
19.6% 21.4%
To a Great Extent To Some Extent To the Least Extent
Section – IV
Suggestions
Table 136: Perception of teachers regarding
organization of more awareness campaigns by the Government
(N=112)
More awareness campaigns should be organised
Frequency Percentage
To a Great Extent 66 58.9
To Some Extent 22 19.6
To the Least Extent 24 21.4
Grand Total 112 100
Figure 50: Perception of teachers regarding
organisation of more awareness campaigns by the Government
58.9% (66) teachers felt that more awareness campaigns regarding plans and
programmes for primary school children should be organized not only by the
Government, but also by the local authorities/schools since they are closer to the
community members. The local officials and the school have a better rapport with the
people of the community and so they can help spread greater awareness through their
local dialect in order to make sure that the information reaches al the people of the
community.19.6% (22) teachers felt that organisation of more awareness campaigns
can help till some extent while 21.4% (24) teachers felt that organisation of
campaigns may help to the least extent as they believed that the Government is
anyways organizing campaigns but it is the community members who are ignorant
towards them.
248

Table 137: t-test results of Male and Female teachers regarding
organization of more awareness programmes by the Government
(N=112)
t-test for Equality of Means
n Mean Std.
Deviation t df
Sig. (2 tailed)
Male 51 2.47 .731 1.355 110
.178 (NS)* Female 61 2.25 .977
*Result Not Significant (NS) as p>0.05
The t-test results indicated no significant difference in the perceptions of male and
female teachers suggesting organization of more awareness campaigns regarding
generating awareness about the government plans and programmes for primary
education in schools. Teachers belonging to both the categories were of a higher
opinion regarding conducting awareness campaigns to spread awareness through
organization of more awareness campaigns.
249
Campaigns make a lot of difference…..
“Jagrukta abhiyan thi ghano fark to pade kemke loko jagruk hoy to ae loko labh lai
shake.” A lot of difference can be made through awareness campaigns because if the
people are aware they would be able to take benefits) – A male teacher from Vadodara
Schools should undertake awareness campaigns…..
“Sarkar kare ke na kare jagrukta abhiyan, shala tarike aapde karvu joiye kemke aa
aapno kartavya bane ane aam pan shala na shikshako ne badha odkhe, to ae loko jo
jagrukta abhiyan kare to loko jodaay pan.” (Government may or may not conduct
awareness campaigns, as a school we must do it as it is our duty and as it is everybody
knows the teachers of the school so if they do the awareness campaigns, people will
join also) – A male teacher from Banaskantha

Table 138: Analysis of Variance (ANOVA) results of perceptions of teachers
regarding organization of more awareness programmes by the Government
in relation with selected variables
(N=112)
Variables Source of
Variance
Sum of
Squares df
Mean
Square F Sig.
District
Between Groups
14.088 3 4.696
7.110 .000
(Sig.)** Within Groups 71.332 108 .660
Years of
Association
with the school
Between Groups
2.135 4 .534 .686
.603
(NS)* Within Groups 83.284 107 .778
Whether
undergone
any
Teacher
Training
Between Groups
.653 2 .326
.420
.658
(NS)*
Within Groups
84.767
109
.778
** Result Significant (Sig) as p<0.05, *Result Not Significant (NS) as p>0.05
The ANOVA results suggested no significant difference in perception of the teachers
regarding organisation of awareness campaigns to spread awareness about the plans
and programmes for primary school children with regard to years of association of the
teacher with the school and whether the teachers had undergone any teacher training
or not. A significant difference in the perception of the teachers was however found to
exist between the respondents with regard to District as a variable. To identify which
group differs significantly, the data was put to post-hoc analysis.
Table 139: Post Hoc Test result for perception of teachers regarding
organization of more awareness programmes by the Government
in relation with selected variables
(N=112)
Variables (I)
Variable
(I)
Mean
(J)
Variable
(J)
Mean
Mean
Difference (I-J)
Std.
Error
Sig.
District
Banaskantha
2.93
Vadodara 2.10 0.830 0.191 0.00
(Sig.)**
Dangs 2.17 0.760 0.152 0.00
(Sig.)**
Surat 2.13 0.800 0.192 0.00
(Sig.)**
** Result Significant (Sig) as p<0.05, *Result Not Significant (NS) as p>0.05
The above table shows the post hoc results of perceptions of teachers regarding
conduction of more awareness programmes by the Government in relation with
250

41% 48.2%
50%
40%
30%
20%
10%
0%
(N=112)
6.3% 4.5%
To a Great Extent
To Some Extent
To the Least Extent
Can't Say
District as a variable. The results suggested that the mean score of the teachers in
Banaskantha was higher as compared to the score of teachers in other three Districts.
The teachers in Banaskantha were of the highest opinion that lack of awareness is the
major cause of ignorance in the minds of the people regarding schooling of the
children and thus awareness campaigns are needed to a great extent.
There was a significant difference in the perception of the teachers between
Banaskantha and other three districts which indicated that the teachers from the other
three districts thought that awareness campaigns are required to a lesser extent.
Table 140: Perceptions of teachers regarding provision of Role Specific Training
(N=112)
Need for provision of Role Specific Training Frequency Percentage
To a Great Extent 46 41.0
To Some Extent 54 48.2
To the Least Extent 7 6.3
Can‘t Say 5 4.5
Grand Total 112 100
Figure 51: Perceptions of teachers regarding provision of Role Specific Training
48.2% (54) teachers felt that the role specific training regarding implementation of the
programmes should be given. 41% (46) teachers felt that they require role specific
training to a great extent while only 6.3% (7) teachers said that they require training to
the least extent. The teachers who were of the opinion that they require training to
some and great extent said that they are provided training which is almost repetitive,
not useful most of the time and often very generic in nature. These trainings are often
attended by those teachers in school who have the least amount of work. These
teachers also felt that the delivery of training is very verbose, they should be more
participatory and non-didactic in nature.
251

Nothing new has happened in training over the years….
“Training to ghana samay thi same chale chhe, kaik navu thayu nathi aatla varas ma,
khabar nai thase ke nai.” (Training has been the same since many years, nothing new
has happened in so many years; don‘t know if it will happen also or not) - A male
teacher from Surat
4.5% (5) teachers couldn‘t comment on it as they believed that no one is going to
adapt to new techniques of training.
Table 141: t-test results of perceptions of Male and Female teachers
regarding provision of Role Specific Training
(N=112)
t-test for Equality of Means
n Mean Std.
Deviation t df
Sig. (2 tailed)
Male 51 2.27 .777 .399 110
.691 (NS)* Female 61 2.21 .839
*Result Not Significant (NS) as p>0.05
The t-test results showed no significant difference in the perceptions of male and
female teachers regarding provision of role specific training provided for the
implementation of the plans and programmes for primary school children.
Respondents belonging to both the genders were of the opinion that trainings must be
provided to a great extent in order to ensure effective implementation of the plans and
programmes.
252
Trainings should be workshop based….
“Eklu bolvanu rakhe training ma, kaik workshop jevu hoy to khabar pade vadhare.”
(There is only verbal content in training, had there been any workshops we would
understand more). There is no role specific training provided specifically for the
implementation of the plans and programmes for primary school children) – A female
teacher from Surat

Table 142: Analysis of Variance (ANOVA) results of perceptions of teachers
regarding provision of Role Specific Training in relation with selected variables
(N=112)
Variables Source of
Variance
Sum of
Squares df
Mean
Square F Sig.
District
Between Groups
11.031 3 3.677
6.462 .000
(Sig.)** Within Groups 61.460 108 .569
Years of
Association
with the
school
Between Groups
3.022 4 .755 1.164
.331
(NS)* Within Groups 69.469 107 .649
Whether
undergone
any
Teacher Training
Between Groups
14.518 2 7.259
13.648
.000
(Sig.)**
Within Groups
57.973
109
.532
** Result Significant (Sig) as p<0.05, *Result Not Significant (NS) as p>0.05
The ANOVA results suggested no significant variance in the perception of the
teachers regarding provision of role specific training with regard to years of
association of the teachers with the school a significant difference in the perception of
teachers was noted with variables like District and whether the teachers had
undergone teacher training or not. To identify which group differs significantly, the
data was put to post-hoc analysis.
Table 143: Post Hoc Test result for perception of teachers regarding
provision of Role Specific Training in relation with selected variables
(N=112)
Variables (I)
Variable
(I)
Mean
(J)
Variable
(J)
Mean
Mean
Difference
(I-J)
Std.
Error
Sig.
Whether
undergone
any Teacher
Training
No
2.67
Yes 2.33 0.340 0.354 0.338 (NS)*
No
Response 2.30 0.370 0.576
0.531
(NS)*
District
Banaskantha
2.67
Dangs 2.07 0.600 0.161 0.000
(Sig.)**
Surat 2.39 0.280 0.146 0.060 (NS)*
Vadodara 1.86 0.810 0.224 0.000
(Sig.)**
** Result Significant (Sig) as p<0.05, *Result Not Significant (NS) as p>0.05
253

With regard to whether the teachers had undergone teacher training, it was found that
the teachers who had not undergone any kind of training had a higher mean score as
compared to the teachers who had undergone training of any sort. This suggested that
the teachers who had not undergone training perceived that provision of role specific
training should take place more often so that the teachers can implement the plans and
programmes effectively. They felt that no training made them feel at a loss as to what
work is to be done as there is always too much to be done.
With regard to District wise results, teachers in Banaskantha were of the highest
opinion that role specific training should be provided to the teachers so as to ensure
effective implementation of the plans and programmes at school. These teachers
belonged to Kendra Shalas (Group Schools) which cater to a bigger block in the
districts and comparatively have more number of students and teachers. These
teachers had undergone training in the past few years and they felt that if the training
is channelized in such a manner that each teacher has a specific idea as to the role
he/she has to play in the implementation of the plans and programmes at the school,
there would be no loopholes at all. Most of the time, the teachers rarely have any idea
about what roles and responsibilities they have to fulfil as far as implementation of
Government programmes was concerned. Moreover Government work act as an
additional burden due to which some of the teachers rarely get a chance to attend the
training. Another issue recorded was that new teachers inducted do not have much
idea about the new policies and programmes of the government for education and thus
the roles and responsibilities are often blurred. Amongst all, teachers in Vadodara
District were of the opinion that role specific trainings were required to the least
extent.
Table 144: Perceptions of teachers regarding
conducting campaigns for people to avail facilities
(N=112)
Need for holding campaigns for availing facilities Frequency Percentage
To a Great Extent 48 42.8
To Some Extent 47 42.0
To the Least Extent 17 15.2
112 100
With regard to holding campaigns for the community people regarding availing
facilities under the government plans and programmes for primary school children,
254

Parents do what they want….
“Valiyo potana mann nuj kare. Campaign kare ke kai pan, emne aavanu hoy to aave, nai
to nai.” (Parents do what they want. Whether we do campaign or whatever, they come
only when they want) – A male teacher from Dangs
42.8% (48) teachers felt that this would be useful to a great extent as many of the
parents do not know how to go about availing the facilities under various
programmes. This was specifically the case with the scholarship under the Kanya
Kelavani Yojna where bank accounts are to be opened. More often than not, parents
are not aware and hence they cannot avail the facilities for the children.
42% (47) teachers felt that holding campaigns of this sort can help to some extent
while 15.2% (17) teachers were of the opinion that such campaigns may help to the
least extent.
Table 145: t-test results of perceptions of Male and Female teachers regarding
conducting campaigns for people to avail facilities
(N=112)
t-test for Equality of Means
n Mean Std.
Deviation t df
Sig. (2 tailed)
Male 51 2.35 .716 1.286 110
.201 (NS)* Female 61 2.16 .820
*Result Not Significant (NS) as p>0.05
The t-test results showed no significant difference between the means of male and
female teachers‘ perception regarding holding campaigns for the community members
to avail facilities under various Government programmes for primary school children.
Teachers from both the categories were of the opinion that campaigns can be effective
to a great extent in order to let people know how they can avail the facilities.
255

Table 146: Analysis of Variance (ANOVA) results of perceptions of teachers
regarding conducting campaigns for people to avail facilities in relation with
selected variables
(N=112)
Variables Source of
Variance
Sum of
Squares df
Mean
Square F Sig.
District
Between Groups
17.333 3 5.778 12.563
.000
(Sig.)** Within Groups
49.667 108 .460
Years of
Association
with the school
Between Groups
3.428 4 .857 1.442
.225
(NS)* Within Groups
63.572 107 .594
Whether
undergone
any
Teacher
Training
Between Groups
6.410 2 3.205
5.766
.004
(Sig.)** Within
Groups
60.590
109
.556
** Result Significant (Sig) as p<0.05, *Result Not Significant (NS) as p>0.05
The ANOVA results revealed that there is no significant difference in the perceptions
of teachers with regard to years of association of the teachers with the school. A
significant difference was however recorded in the perception of teachers regarding
holding campaigns for the community people to avail the facilities under various
plans and programmes for primary school children with regard to District and whether
the teachers had undergone any teacher training. A post hoc test was administered to
identify which groups differed significantly.
Table 147: Post Hoc Test result for perception of teachers regarding
conducting campaigns for people to avail facilities
in relation with selected variables
(N=112)
Variables (I)
Variable
(I)
Mean
(J)
Variable
(J)
Mean
Mean
Difference
(I-J)
Std.
Error
Sig.
Whether
undergone
any Teacher
Training
No
3.00
Yes 2.26 0.74 .071 0.052 (NS)*
No
Response 1.70 1.3 .396
0.00
(Sig.)**
District
Banaskantha
2.73
Dangs 1.90 0.830 0.181 0.000
(Sig.)**
Surat 2.57 0.160 0.163 0.329 (NS)*
Vadodara 1.86 0.870 0.180 0.000
(Sig.)**
** Result Significant (Sig) as p<0.05, *Result Not Significant (NS) as p>0.05
256

(N=112) 48.2%
60.0% 42%
40.0%
7.1% 20.0% 2.7%
0.0%
To a Great
Extent
To Some To the Least No Response
Extent Extent
The post hoc results regarding conducting campaigns for people to avail the facilities
as a suggestion by the teachers in relation to whether the teachers had undergone
teacher training indicated that the teachers who had not attended the training had a
higher mean score as compared to the teachers who had attended training indicating
that the former group of teachers felt that campaigns must be conducted to a great
extent.
With regard to District as a variable, teachers in Banaskantha were of the opinion that
such campaigns are important ot a great extent. There was a difference in opinion by
teachers belonging to Vadodara and Dangs district who believed that such campaigns
are required to a lesser extent.
Table 148: Perceptions of teachers regarding
distribution of booklets and brochures during campaigns
(N=112)
Booklets and Brochures to be distributed Frequency Percentage
To a Great Extent 54 48.2
To Some Extent 47 42.0
To the Least Extent 8 7.1
No Response 3 2.7
112 100
Figure 52: Perceptions of teachers regarding
distribution of booklets and brochures during campaigns
48.2% (54) of the teachers were of the opinion that this can be helpful to a great
extent as it can provide a take away material for the community members and they
can refer to it whenever they need it.
257

42% (47) of the teachers felt that this could be of use to some extent while 7.1% (8) of
the teachers felt that this would be of use to the least extent as the community
members are partially or completely illiterate. 2.7% (3) teachers chose not to respond
to the question.
Table 149: t-test results of perceptions of Male and Female teachers regarding
distribution of booklets and brochures during campaigns
(N=112)
t-test for Equality of Means
n Mean Std.
Deviation t df
Sig. (2 tailed)
Male 51 2.25 .744 -1.197 110
.234
(NS)* Female 61 2.43 .763
** Result Significant (Sig) as p<0.05, *Result Not Significant (NS) as p>0.05
The t-test result signified that there was no significant difference between the
perceptions of male and female teachers regarding distribution of booklets and
brochures related to plans and programmes for primary school children. The teachers
belonging to both the categories were of the opinion that booklets and brochures must
be distributed to a great extent.
258
Parents preserve the posters and come running to us to understand what it says…
“Aam aatla bhanela nathi ahiya na loko pan poster jevu aape to ae loko sanchvi ne
rakhe chhe ane yaad aave to laine daudta daudta amari paase aave samajva.” (The
people here are not too literate as such but of we give them something like posters,
they keep it carefully and later come with it running to us to understand what it is) –
A female teacher from Dangs

Table 150: Analysis of Variance (ANOVA) results of perceptions of teachers
regarding distribution of booklets and brochures during campaigns in relation with
selected variables
(N=112)
Variables Source of
Variance
Sum of
Squares df
Mean
Square F Sig.
District
Between Groups
4.558 .005 4.558
7.815 .000
(Sig.)** Within Groups 4.558 .005 4.558
Years of
Association
with the school
Between Groups
3.215 4 .804 1.429
.230
(NS)* Within Groups 60.204 107 .563
Whether
undergone
any
Teacher
Training
Between Groups
6.197 2 3.098
5.902
.004
(Sig.)**
Within Groups
57.223
109
.525
** Result Significant (Sig) as p<0.05, *Result Not Significant (NS) as p>0.05
The ANOVA results suggested no significant difference in the perception of the
teachers regarding distribution of booklets and brochures during campaigns in relation
with years of association of the teachers with the schools. A significant difference in
the perception of the teachers was found with regard to whether the teachers had
undergone teacher training or not and District as variables.
Table 151: Post Hoc Test result for perception of teachers regarding
distribution of booklets and brochures during campaigns
in relation with selected variables
(N=112)
Variables (I)
Variable
(I)
Mean
(J)
Variable
(J)
Mean
Mean
Difference (I-J)
Std.
Error
Sig.
Whether
undergone
any Teacher
Training
Yes
2.43
No 2.33 0.100 0.294 0.734 (NS)*
No
Response 1.60 0.830 0.235
0.000
(Sig.)**
District
Banaskantha
2.87
Dangs 2.23 0.640 0.155 0.000
(Sig.)**
Surat 2.09 0.780 0.187 0.000
(Sig.)**
Vadodara 2.14 0.730 0.179 0.000
(Sig.)**
** Result Significant (Sig) as p<0.05, *Result Not Significant (NS) as p>0.05
259
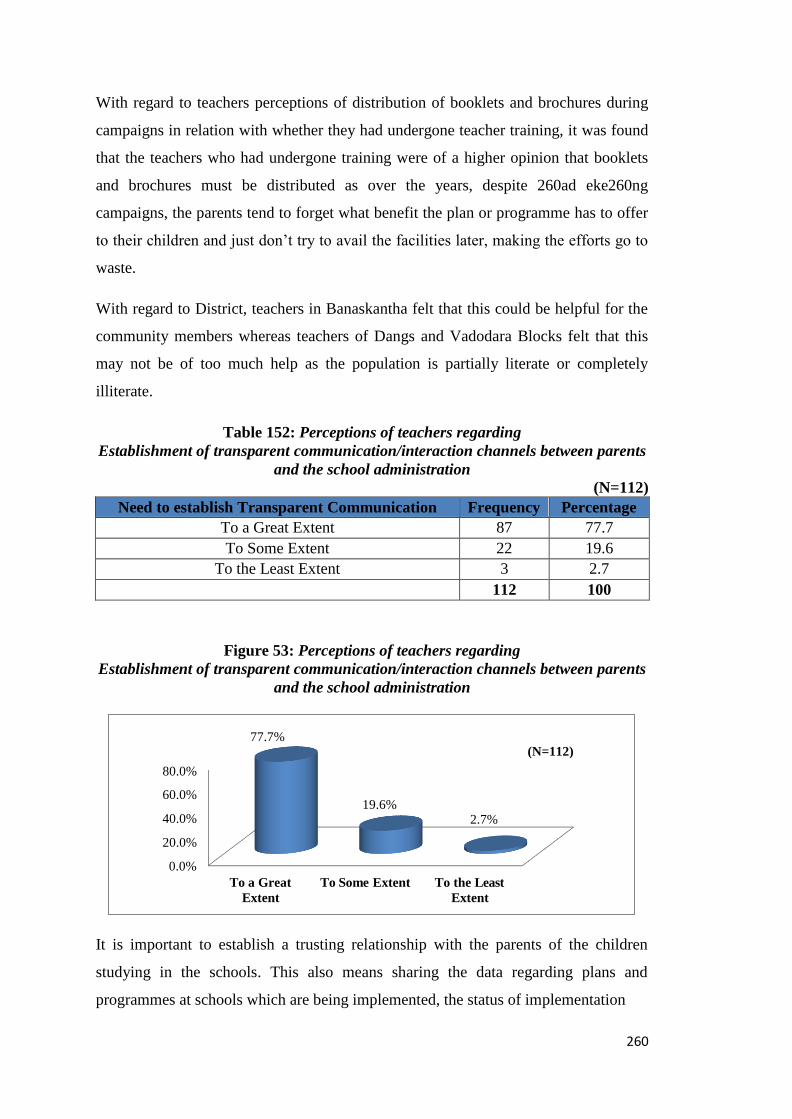
77.7% (N=112)
80.0%
60.0%
40.0%
20.0%
0.0%
19.6% 2.7%
To a Great To Some Extent To the Least
Extent Extent
With regard to teachers perceptions of distribution of booklets and brochures during
campaigns in relation with whether they had undergone teacher training, it was found
that the teachers who had undergone training were of a higher opinion that booklets
and brochures must be distributed as over the years, despite 260ad eke260ng
campaigns, the parents tend to forget what benefit the plan or programme has to offer
to their children and just don‘t try to avail the facilities later, making the efforts go to
waste.
With regard to District, teachers in Banaskantha felt that this could be helpful for the
community members whereas teachers of Dangs and Vadodara Blocks felt that this
may not be of too much help as the population is partially literate or completely
illiterate.
Table 152: Perceptions of teachers regarding
Establishment of transparent communication/interaction channels between parents
and the school administration
(N=112)
Need to establish Transparent Communication Frequency Percentage
To a Great Extent 87 77.7
To Some Extent 22 19.6
To the Least Extent 3 2.7
112 100
Figure 53: Perceptions of teachers regarding
Establishment of transparent communication/interaction channels between parents
and the school administration
It is important to establish a trusting relationship with the parents of the children
studying in the schools. This also means sharing the data regarding plans and
programmes at schools which are being implemented, the status of implementation
260

We mut find other ways to engage the parents…..
“Valiyo saathe vaat chit karvani to kayam rakhvij joiye. Parents teacher meeting ma nai
aavta to aapde bijo koi vikalp apnavo joiye, jemke valiyo maate koi spardha, aevo event
jema fakt valiyoj aave. Aa thi emne pan khabar pade ke school ma thay che su.”
(Talking to the parents should be a regular feature. When they don‘t come for parent
teacher meetings, we must find another way out like having some competition only for
parents where they can come. Due to this, the parents will also learn what is happening
in the schools) – A male teacher from Banaskantha
and so on with the parents of the children. This can not only get the parents in
confidence but also help the parents verify and hold the schools accountable for the
facilities that the children are entitled to receive under the plans and programmes for
primary education by the Government.
77.7% (87) of the teachers were of the opinion that transparent communication
channels between the parents and the school administration should be established to a
great extent as this can help in effective implementation of the plans and programmes
at the schools. 19.6% (22) of the teachers felt that this can be of use to some extent
while 2.7% (3) teachers felt it can be useful to the least extent.
Table 153: t-test results of perceptions of Male and Female teachers regarding
establishment of transparent communication/interaction channels between parents
and the school administration
(N=112)
t-test for Equality of Means
n Mean Std.
Deviation t df
Sig. (2 tailed)
Male 51 2.76 .428 .664 110
.508 (NS)* Female 61 2.69 .720
*Result Not Significant (NS) as p>0.05
The t-test results revealed no difference in perceptions of the male and female
teachers regarding establishment of transparent communication channels between
parents and the school administration. The mean scores of both male and female
teachers depicted that both were of a higher opinion regarding establishment of
transparent communication channels between parents and the school administration.
261

Table 154: Analysis of Variance (ANOVA) results of perceptions of teachers
regarding establishment of transparent communication/interaction channels
between parents and the school administration in relation with selected variable
(N=112)
Variables Source of
Variance
Sum of
Squares df
Mean
Square F Sig.
District
Between Groups
3.254 3 1.085
3.152 .028
(Sig.)** Within Groups 37.165 108 .344
Years of
Association
with the school
Between Groups
.543 4 .136 .364
.834
(NS)* Within Groups 39.877 107 .373
Whether
undergone
any
Teacher
Training
Between Groups
2.320 2 1.160
3.318
.040
(Sig.)**
Within Groups
38.100
109
.350
** Result Significant (Sig) as p<0.05, *Result Not Significant (NS) as p>0.05
The ANOVA results indicated no significant difference in the perception of the
teachers with regard to years of association with the schools as a variable concerning
establishment of transparent communication channels between parents and the school
administration. A significant difference was however noted amongst the responses of
teachers with regard to District and whether they had undergone any teacher training
or not. To identify which groups differed significantly, a post hoc analysis was carried
out.
262
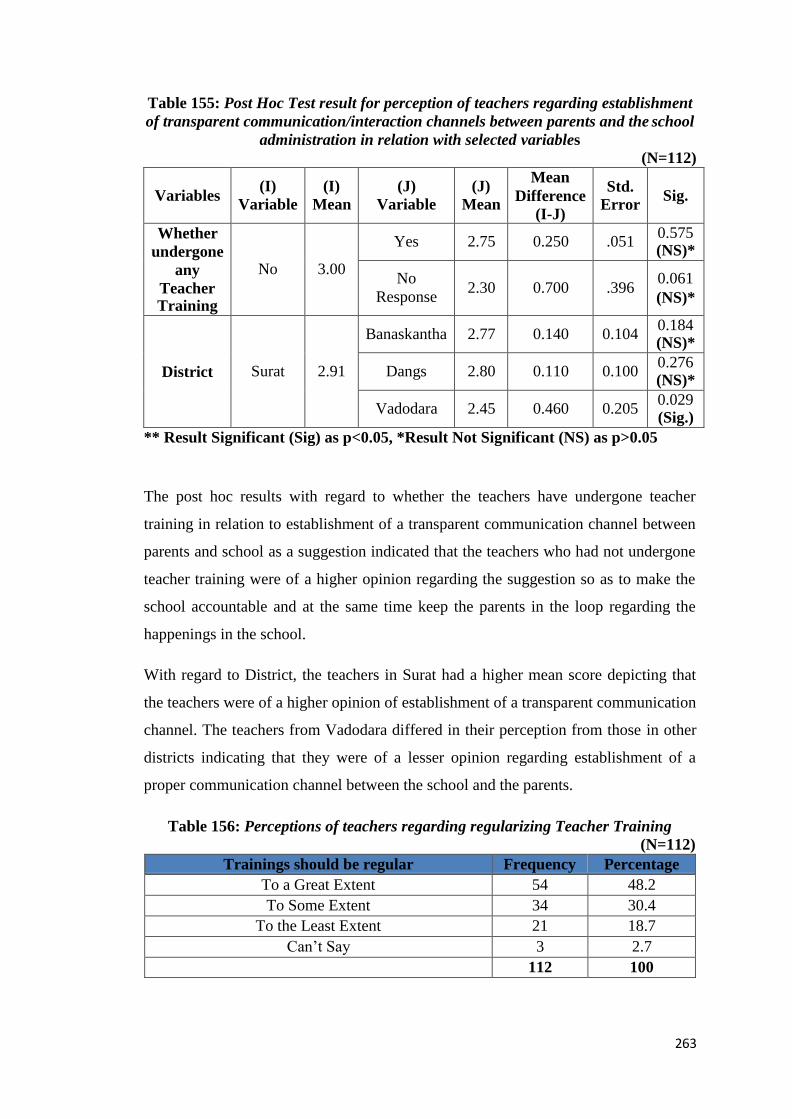
Table 155: Post Hoc Test result for perception of teachers regarding establishment
of transparent communication/interaction channels between parents and the school
administration in relation with selected variables
(N=112)
Variables (I)
Variable
(I)
Mean
(J)
Variable
(J)
Mean
Mean
Difference
(I-J)
Std.
Error
Sig.
Whether
undergone
any
Teacher Training
No
3.00
Yes 2.75 0.250 .051 0.575 (NS)*
No
Response
2.30
0.700
.396 0.061
(NS)*
District
Surat
2.91
Banaskantha 2.77 0.140 0.104 0.184 (NS)*
Dangs 2.80 0.110 0.100 0.276 (NS)*
Vadodara 2.45 0.460 0.205 0.029 (Sig.)
** Result Significant (Sig) as p<0.05, *Result Not Significant (NS) as p>0.05
The post hoc results with regard to whether the teachers have undergone teacher
training in relation to establishment of a transparent communication channel between
parents and school as a suggestion indicated that the teachers who had not undergone
teacher training were of a higher opinion regarding the suggestion so as to make the
school accountable and at the same time keep the parents in the loop regarding the
happenings in the school.
With regard to District, the teachers in Surat had a higher mean score depicting that
the teachers were of a higher opinion of establishment of a transparent communication
channel. The teachers from Vadodara differed in their perception from those in other
districts indicating that they were of a lesser opinion regarding establishment of a
proper communication channel between the school and the parents.
Table 156: Perceptions of teachers regarding regularizing Teacher Training
(N=112)
Trainings should be regular Frequency Percentage
To a Great Extent 54 48.2
To Some Extent 34 30.4
To the Least Extent 21 18.7
Can‘t Say 3 2.7
112 100
263

48.2% (N=112)
50.0%
40.0%
30.0%
20.0%
10.0%
0.0%
30.4%
18.7%
2.7%
To a Great To Some
Extent Extent
To the Least
Extent
Can't Say
The real challenge is to make the parents aware…..
“Teachers train thai jaye to pan savthi motu challenge to valiyo ne badako na shikshan
maate jagruk karvu ae chhe.” (Even if the teachers are trained, the real challenge is to
make the parents aware regarding the education of their child) – A male teacher from
Dangs
Nothing new will happen in training as no one takes interest…..
“Pehla navu navu sikhavva ma aavse pachi- jaise the. Kaik navu nai thaay kemke koi ras
letu nathi.” (Initially new things will be taught, later – it will be the same. Nothing new
will happen because no one takes interest) - A male teacher from Dangs
Figure 54: Perceptions of teachers regarding regularizing Teacher Training
With regard to regularizing teacher training, 48.2% (54) teachers were of the opinion
that teacher training should be regularized so that effective implementation of work
can take place. 30.4% (34) teachers opined that teacher trainings will prove helpful to
some extent as the real challenge is to ensure that the parents become active
participants in the schooling of their children.
18.7% (21) teachers were of the opinion that regularizing teacher trainings will help to
the least extent as they will be effective for the first few trainings and then it will one
and the same again. 2.7% (3) teachers couldn‘t comment on it.
264

Table 157: t-test results comparing perceptions of Male and Female teachers
regarding regularizing Teacher Training
(N=112)
t-test for Equality of Means
n Mean Std.
Deviation t df
Sig. (2 tailed)
Male 51 2.18 .932 .302 110
.763 (NS)* Female 61 2.23 .920
*Result Not Significant (NS) as p>0.05
The t test results showed no significant difference in the perception of male and
female teachers regarding regularity of teacher training signifying that both the
respondent groups wanted that the teacher trainings be regularized to enhance the
implementation of the plans and programmes for primary school children.
Table 158: Analysis of Variance (ANOVA) results of perceptions of teachers
regarding regularizing Teacher Training in relation with selected variables
(N=112)
Variables Source of
Variance
Sum of
Squares df
Mean
Square F Sig.
District
Between
Groups 5.291 3 1.764
2.140
.099
(NS)* Within Groups 88.986 108 .824
Years of
Association
with the school
Between Groups
1.527 4 .382 .440
.779
(NS)* Within Groups 92.750 107 .867
Whether
undergone
any
Teacher
Training
Between Groups
10.854 2 5.427
7.091
.001
(Sig.)**
Within Groups
83.423
109
.765
** Result Significant (Sig) as p<0.05, *Result Not Significant (NS) as p>0.05
The ANOVA results suggested no significant difference in the perception of the
teachers regarding regularizing teacher trainings to ensure effective implementation of
the programmes in relation to variables like District and years of association of the
teacher with the schools. A significant difference was however found with regard to
whether the teachers had undergone teacher training. To identify which group differed
in their opinions, a post hoc test was administered.
265
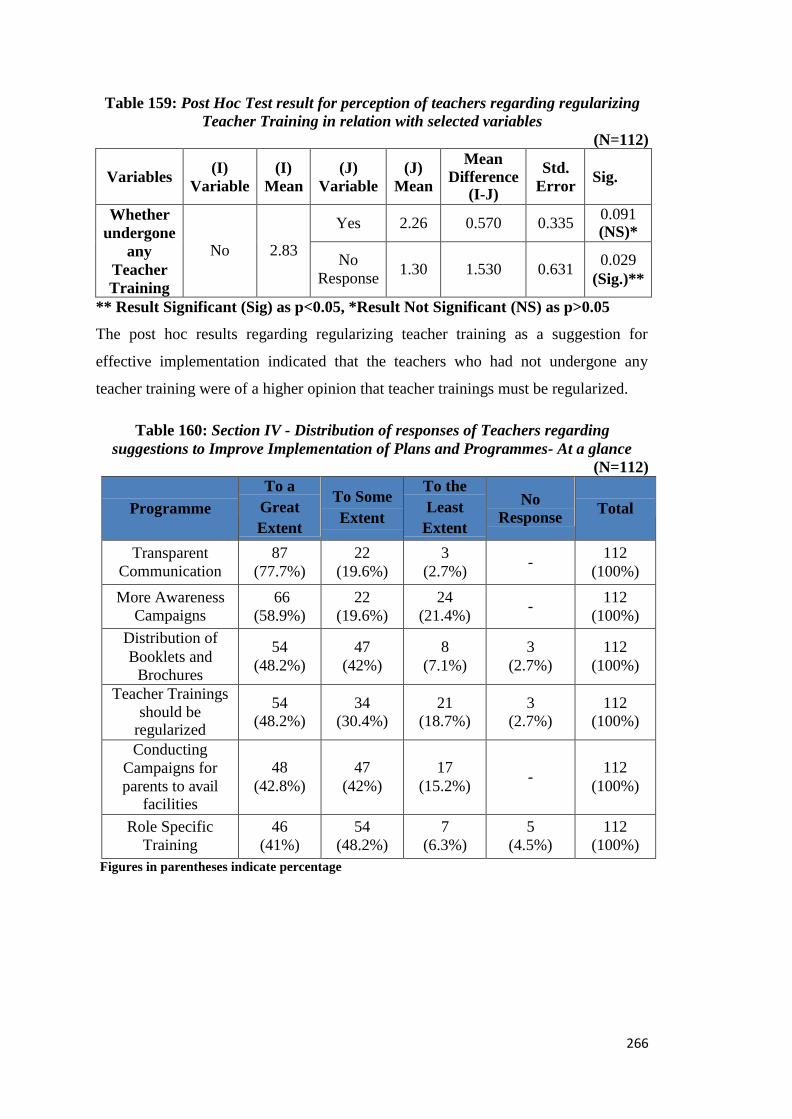
Table 159: Post Hoc Test result for perception of teachers regarding regularizing
Teacher Training in relation with selected variables
(N=112)
Variables (I)
Variable
(I)
Mean
(J)
Variable
(J)
Mean
Mean
Difference (I-J)
Std.
Error
Sig.
Whether
undergone
any
Teacher
Training
No
2.83
Yes 2.26 0.570 0.335 0.091 (NS)*
No
Response
1.30
1.530
0.631 0.029
(Sig.)**
** Result Significant (Sig) as p<0.05, *Result Not Significant (NS) as p>0.05
The post hoc results regarding regularizing teacher training as a suggestion for
effective implementation indicated that the teachers who had not undergone any
teacher training were of a higher opinion that teacher trainings must be regularized.
Table 160: Section IV - Distribution of responses of Teachers regarding
suggestions to Improve Implementation of Plans and Programmes- At a glance
(N=112)
Programme
To a
Great
Extent
To Some
Extent
To the
Least
Extent
No
Response
Total
Transparent
Communication
87
(77.7%)
22
(19.6%)
3
(2.7%) -
112
(100%)
More Awareness
Campaigns
66
(58.9%)
22
(19.6%)
24
(21.4%) -
112
(100%)
Distribution of
Booklets and
Brochures
54
(48.2%)
47
(42%)
8
(7.1%)
3
(2.7%)
112
(100%)
Teacher Trainings
should be regularized
54
(48.2%)
34
(30.4%)
21
(18.7%)
3
(2.7%)
112
(100%)
Conducting
Campaigns for
parents to avail facilities
48
(42.8%)
47
(42%)
17
(15.2%)
-
112
(100%)
Role Specific
Training
46
(41%)
54
(48.2%)
7
(6.3%)
5
(4.5%)
112
(100%)
Figures in parentheses indicate percentage
266

Figure 55: Section IV - Distribution of responses of Teachers regarding
suggestions to Improve Implementation of Plans and Programmes – At a glance
The above graph shows at a glance, the suggestions of teachers regarding improving
implementation of Government plans and programmes for primary education. 77.7%
(87) teachers felt that establishment of transparent communication is the need of the
hour to a great extent as many parents don‘t have any idea about what happens in the
schools. It is important for the parents to know the initiatives that the schools take so
as to motivate the parents to also participate in the activities of the schools.
58.9% (66) teachers felt that moe awareness campaigns should be organized so as to
let the community members know about various plans and programmes of the
government for primary education. 48.2% (54) teachers were also of the opinion that
teacher trainings must be regularized so that the teachers have a clear idea about roles
and responsibilities they have to cater to. Role ambiguity is a major problem that
many teachers face and thus much of the work remains unaccomplished. 48.2% (54)
teachers also felt that distribution of booklets and posters must take place to a great
extent as they can serve as an important take away material for the community
members.
267
To a Great Extent To Some Extent To Least Extent Can't Say
77.7% (N=112)
58.9%
48.2%
41%
48.2% 42%
48.2% 42.8%42%
30.4%
19.6%21.4% 19.6% 15.2%
18.7%
6.3%4.5% 7.1% 2.7% 2.7% 2.7%
More Role Specific
Awareness Training
Campaigns
Conducting
Campaigns to
avail facilities
Distribution of Transparent
Booklets amd Communication Brochures
Regularizing
Teacher
Training

Summing up the Chapter
The findings from the perception of the teachers regarding implementation and impact
of various plans and programmes of the Government for primary education revealed
that all the programmes were being implemented in all the selected schools under the
study. Amongst all the programmes, Mid Day Meal Programme has been the most
successful in achieving its objectives. While the teachers were of the opinion that all
the programmes were implemented well, there were a few glitches in terms of
insufficeincy of funds, issues with training and a major issue of lack of participation
from the community members in the school activities.
The teachers were of the opinion that RTE has been successful to a great extent in
ensuring hundred percent enrolment, Mid Day Meal Scheme has been successful in
retention of the children in schools, Kanya Kelavani and Shala Praveshotsav has
spread awareness regarding importance of education amongst the community
members and have made it a point to make sure that each child in the community is
enrolled. But Gunotsav has not made an impact as such in terms of ensuring quality in
education. While the assessment of the students and the school take place, there is no
relative improvement in the teaching and learning that takes place in the schools.
Teachers felt that the training provided to them are repitative in nature and needs to
incorporate more aspects of contemporary teaching and learning.
Moreover, the biggest problem that the teachers face is that of growing burden of
government work apart from academic work due to which they are unable to
concentrate on the work at hand. Another problem faced by the teachers is that no
State Officials participate in the programmes. In the name of state officials, only the
Block Resource Coordinators (BRC) come to visit once in a while or not at all.
Teachers suggested that there needs to be a transparent communication that needs to
be established between the parents and the school so that they get to know what
activities are going on in the schools. Moreover, there needs to be more awareness
campaigns to be conducted at the local level so as to let the community members
know about the various plans and programmes for the education of the children.
The next chapter, chapter – V, includes findings from the perception of the parents
regarding the government plans and programmes for primary school children.
268

Implementation
1. All plans and Programmes are being
implemented in all the schools.
2. Only 41.1% (46) teachers said that the
SMC meetings are held every month in their
schools.
3. Quality of Education was the most
discussed topic in SMC meetings according
to 93.8% (105) teachers.
4. Teachers only monitor the MDM in
schools according to 75% (84) teachers.
There is least participation of other members.
5. 96.4% (108) teachers said that State
officials, largely CRC/BRC, participate in
Praveshotsav.
6. Door-to-Door campaigns were widely
used to ensure each child is in school
followed by awareness campaigns and
assisting parents in filling up the forms.
7. PTA meetings are irregular
8. 81.3% teachers said that their schools had
availability of necessary infrastructure.
9. 81.3% teachers said that the last
assessment in their schools look place last
year.
Figure 56: Findings at a glance – Perspectives of Teachers
269
Success of Government Plans and
Programmes
1. 94.6% teachers said MDM was most
successful,
92% each said Kanya Kelavani Yojna and
Shala Praveshotsav,
88.4% said RTE and
77.7% said Gunotsav was the most
successful programme.
2. 58% teachers said that No Detention
Policy compromises the quality of Education
to a great extent.
3. 84.8% teachers said that MDM has helped
in increasing regularity of students to a great
extent.
4. 54.5% teachers said Gunotsav was
successful to a great extent in increasing the
quality of teaching and learning.
5. 64.3% teachers said that overall, the
Government Plans and Programmes for
Primary Education were successful to a great
extent in increasing enrolment and ensuring
retention of children in primary education.
Suggestions
1. 77.7% teachers said that transparent
communication between school and
community must be established.
2. 58.9% teachers suggested more awareness
campaigns must be conducted.
3. 48.2% teachers suggested that teacher
trainings must be regularized to a great
extent.
4. 41% teachers suggested that role specific
trainings must be provided to a great extent.
Problems Experienced
1. 57.1% teachers said that no provision of
timely and qualitative training was an issue
to a great extent followed by insufficiency of
funds to some extent (66%) and no provision
of checklist (45.5%) to some extent.

Teachers Perspectives
Table 161: t-test results of Teachers’ perceptions at a glance
Male N= 112 Female
(n=51) (n=61)
Sr.
No Item Mean
t-test
Result Significance
Section – II
Perceptions regarding Success of Government Plans and Programmes in ensuring
100% enrolment (** Result Significant (Sig) as p<0.05, *Result Not Significant (NS) as p>0.05)
1.
Success of RTE in ensuring 100% enrolment
Male 2.73
-2.491
(.014)
Sig** Female
2.95
2.
Success of MDM Programme in
ensuring 100% enrolment
Male 2.86
-1.851
.067
(NS)* Female 2.98
3.
Success of Kanya Kelavani Yojna in
ensuring hundred percent enrolment
Male 2.73
-.622
535
(NS)* Female 2.80
4. Success of Gunotsav in ensuring hundred percent enrolment
Male 2.61
.299
.766
(NS)* Female 2.56
5. Success of Shala Praveshotsav in ensuring hundred percent enrolment
Male 2.80
-1.777
.078
(NS)* Female 2.95
6. Effect of No Detention Policy on
Quality of Education
Male 2.25
-1.700
.092
(NS)* Female 2.52
7. Sufficiency of grants received under
Right to Education Act (RTE)
Male 1.45
.730
.467
(NS)* Female
1.31
8. Increased regularity of children due to Mid Day Meal Programme
Male 2.76
-.505
.615
(NS)* Female 2.82
9. Increase in enrolment of children due to Mid Day Meal Programme
Male 2.59
-1.252
.213
(NS)* Female 2.75
270

10.
Improvement in nutrition of children
due to Mid Day Meal Programme
Male 2.67
-1.056
.293
(NS)* Female 2.79
11. Improvement in concentration of
children due to Mid Day Meal
Programme
Male
2.43
.222
.825
(NS)* Female 2.39
12. Inculcation of the habit of sharing
meals amongst children due to Mid
Day Meal Programme
Male 2.94
-.439
.662
(NS)* Female
2.91
13.
Role of Kanya Kelavani Yatra in
increasing the gender enrolment ratio
Male
2.37
-.794
.429
(NS)* Female 2.51
14. Need of Praveshotsav despite Right
To Education Act already being
implemented
Male 2.12
-.820
.414
(NS)* Female 2.26
15.
Role of Gunotsav in increasing the
quality of teaching and learning
Male 2.59
1.538
.127
(NS)* Female
2.41
16. Success of Government plans and
programmes in increasing enrolment
and retention of students in primary education
Male 2.47
-.343
.733
(NS)* Female 2.52
Section – III
Experiences of Teachers regarding Problems faced in Implementation of
Government Plans and Programmes for Primary School Children (** Result Significant (Sig) as p<0.05, *Result Not Significant (NS) as p>0.05)
17. Sufficiency of funds received by the
Government for implementation of
the programmes
Male 2.02
2.444
.016
(Sig.)** Female
1.69
18.
Provision of training for proper
implementation of the programmes
Male 2.49
.111
.912
(NS)* Female 2.48
19. Problem of no idea about the
deliverables to be provided to the
children
Male 1.49
-.010
.992
(NS)* Female 1.49
20. Problem of no provision of checklist
by the Government to check the
progress of work
Male 1.73
.302
.763
(NS)* Female 1.67
271

21.
Problem of no monitoring of the
work done by officials
Male 1.35
1.256
.212
(NS)* Female 1.20
22. Materials not being provided on time
Male 1.63
2.018
.046
(Sig.)** Female 1.33
23. Rigidity of community members for
participation in implementation of
the programmes
Male 1.94
2.138
.035
(Sig)** Female
1.64
24.
Difficulty in involving parents in
school activities
Male 1.59
-.251
.803
(NS)* Female 1.62
Section – IV
Suggestions
25. Organization of more awareness
programmes by the Government
Male 2.47
1.355
.178
(NS)* Female 2.25
26. Provision of Role Specific Training
Male 2.27
.399
.691
(NS)* Female 2.21
27.
Conducting campaigns for people to
avail facilities
Male 2.35
1.286
.201
(NS)* Female 2.16
28.
Distribution of booklets and
brochures during campaigns
Male 2.25
-1.197
.234
(NS)* Female 2.43
29.
Establishment of transparent
communication/interaction channels
between parents and the school
administration
Male 2.76
.664
.508
(NS)* Female
2.69
30. Regularizing Teacher Training
Male 2.18
.302
.763
(NS)* Female 2.23
(** Result Significant (Sig) as p<0.05, *Result Not Significant (NS) as p>0.05)
272

Table 162: ANOVA and Post Hoc results of Teachers’ perception at a glance
N= 112
Sr. No Item Variable f-test
Result Significance
Section – II
Perceptions regarding Success of Government Plans and Programmes in
ensuring 100% enrolment
1.
Success of RTE in
ensuring 100% enrolment
District 1.060 .369
(NS)*
Years of Association with
the School
.351 .843
(NS)*
Whether undergone Teacher Training
.527 .592
(NS)*
2.
Success of MDM
programme in ensuring
100% enrolment
District .468 .705
(NS)*
Years of
Association with
the School
.201 .937
(NS)*
Whether undergone Teacher Training
.287 .751 (NS)*
3.
Success of Kanya
Kelavani Yojna in
ensuring 100% enrolment
District 4.798 .004
(Sig)**
Years of
Association with
the School
1.545 .194
(NS)*
Whether undergone Teacher Training
.142 .868
(NS)*
1. Post Hoc results
4.
Success of Gunotsav
in ensuring 100%
enrolment
District .011 .011 (Sig.)**
Years of Association with the School
.622 .648
(NS)*
Whether undergone Teacher Training
4.637 .012 (Sig.)**
(** Result Significant (Sig) as p<0.05, *Result Not Significant (NS) as p>0.05)
273
District
Dangs
2.97
Banaskantha 2.97 1.000 (NS)*
Surat 2.65 0.239 (NS)*
Vadodara 2.45 0.007
(Sig.)**

2. Post Hoc results
Whether
undergone
any
Teacher
Training
Yes
2.67
No
2.50
0.617
(Sig.)**
No Response
1.80 0.003
(Sig.)**
District
2.90
Banaskantha 2.77 0.395 (NS)*
Dangs
Vadodara 2.31 0.005
(Sig.)**
Surat 2.26 0.000
(Sig.)**
5.
Success of Shala
Praveshotsav in
ensuring 100%
enrolment
District 3.183 .027 (Sig.)**
Years of Association with the School
.755 .557 (NS)*
Whether undergone
Teacher Training 1.038
.358
(NS)*
3. Post Hoc results
6.
Effect of No
Detention Policy on
Quality of Education
District 12.534 .000
(Sig)**
Years of Association with the School
.371 .829 (NS)*
Whether undergone Teacher Training
.345 .709
(NS)*
4. Post Hoc results
(** Result Significant (Sig) as p<0.05, *Result Not Significant (NS) as p>0.05)
274
District
Banaskantha
3.00
Dangs 3.00 1.000 (NS)*
Surat 2.74 0.131 (NS)*
Vadodara 2.76 0.142 (NS)*
District
Vadodara
2.72
Dangs 2.63 0.569 (NS)*
Surat 2.61 0.608 (NS)*
Banaskantha 1.70 0.000
(Sig.)**

7.
Sufficiency of grants
received under RTE
District 6.614 .000 (Sig.)**
Years of Association with the School
.509 .729 (NS)*
Whether undergone Teacher Training
10.462 .000 (Sig.)**
5. Post Hoc results
8.
Increased regularity
of children due to
MDM
District .265 .851
(NS)*
Years of Association with the School
1.217 .308
(NS)*
Whether undergone Teacher Training
9.333 .000 (Sig.)**
6. Post Hoc results
Whether
undergone
any Teacher
Training
Yes
2.86
No
2.83
0.867
(NS)*
No
Response
2.10
0.000
(Sig.)**
9.
Increase in
Enrolment due to
MDM Programme
District .733 .535
(NS)*
Years of Association with the School
.608 .658
(NS)*
Whether undergone Teacher Training
5.629 .005 (Sig.)**
7. Post Hoc results
275
District
Vadodara
2.72
Banaskantha 1.70 .000
(Sig.)**
Dangs 2.63 .569
(NS)*
Surat 2.61 .000
(Sig.)**
Whether
undergone
teacher
training
Yes
2.43
No 2.33 .768
(NS)*
No Response 2.20 .423
(NS)*
Whether
undergone
any Teacher
Training
Yes
2.75
No
2.67
0.756
(NS)*
No
Response
2.00 0.001
(Sig.)**

10.
Improvement of
Nutrition of children
due to MDM
Programme
District .451 .717 (NS)*
Years of Association with the School
.617 .651
(NS)*
Whether undergone Teacher Training
9.423 .000 (Sig.)**
8. Post Hoc results
11.
Improvement on
concentration due to
MDM Programme
District 1.049 .374
(NS)*
Years of Association with the School
.396 .811
(NS)*
Whether undergone Teacher Training
1.167 .315
(NS)*
12.
Inculcation of habit
of sharing amongst
the children due to
MDM Porogramme
District .752 .524
(NS)*
Years of Association with the School
1.688 .158
(NS)*
Whether undergone Teacher Training
.388 0.23
(Sig)**
9. Post Hoc results
13.
Role of Kanya
Kelavani Rath in
increasing Gender
Enrolment Ratio
District .644 .588
(NS)*
Years of Association with the School
.700 .594 (NS)*
Whether undergone Teacher Training
4.551 .013 (Sig.)**
(** Result Significant (Sig) as p<0.05, *Result Not Significant (NS) as p>0.05)
276
Whether
undergone
any Teacher
Training
No
2.83
Yes
2.80
0.879
(NS)*
No
Response
2.00 0.115
(NS)*
Whether
undergone
any Teacher
Training
No
3.00
Yes
2.98
0.98
(NS)*
No
Response
2.70 0.14
(Sig.)**

10. Post Hoc results
14.
Need of
Praveshotsav despite
RTE already being
there
District 1.741 .163
(NS)*
Years of Association with the School
.336 .853
(NS)*
Whether undergone Teacher Training
13.025 .000 (Sig.)**
11. Post Hoc results
15.
Role of Gunotsav in
increasing quality of
teaching and
learning
District 8.028 .000
(Sig)**
Years of Association with the School
.579 .679 (NS)*
Whether undergone Teacher Training
2.278 .107
(NS)*
12. Post Hoc results
16.
Overall Success of
Government Plans
and Programmes in
increasing enrolment
and retention of
students in primary education
District .451 .717 (NS)*
Years of Association with the School
.516 .724
(NS)*
Whether undergone
Teacher Training
.192 .826
(NS)*
(** Result Significant (Sig) as p<0.05, *Result Not Significant (NS) as p>0.05)
277
Whether
undergone
any Teacher
Training
Yes
2.54
No
2.17
0.269
(NS)*
No
Response
1.70 0.003
(Sig.)**
Whether
undergone
any Teacher
Training
No
2.33
Yes
2.32
0.976
(NS)*
No
Response
.90 0.015
(Sig.)**
District
Banaskantha
2.73
The Dangs 2.70 0.815 (NS)*
Surat 2.39 0.020 (Sig.)**
Vadodara 2.10 0.000
(Sig.)**

Section – III
Experiences of Teachers regarding Problems faced in Implementation of
Government Plans and Programmes for Primary School Children
17.
Sufficiency of Funds
for Implementation
District 2.569 .058
(NS)*
Years of Association with the School
2.569 .058
(NS)*
Whether undergone
Teacher Training 10.922
.000 (Sig.)**
13. Post Hoc results
18.
Provision of
Training for proper
implementation
District 9.555 .000
(Sig)**
Years of Association with the School
1.093 .364
(NS)*
Whether undergone Teacher Training
21.714 .000
(Sig)**
14. Post Hoc results
19.
No idea regarding
deliverables to be
provided
District 3.102 .030
(Sig.)**
Years of Association with the School
1.084 .368
(NS)*
Whether undergone Teacher Training
2.905 .059
(NS)*
(** Result Significant (Sig) as p<0.05, *Result Not Significant (NS) as p>0.05)
278
Whether Yes 1.89
0.022
undergone Teacher
No 2.50 (Sig.)**
No 1.00
0.021
Training Response (Sig.)**
Whether
undergone
Teacher Training
No
2.67
Yes 2.59 0.739 (NS)*
No Response
1.30 0.006
(Sig.)**
District
Banaskantha
2.80
Dangs 2.37 0.003
(Sig.)**
Surat 2.78 0.862 (NS)*
Vadodara 2.03 0.000
(Sig.)**

15. Post Hoc results
20.
No provision of
checklist to check
progress of work
District 7.939 .000
(Sig.)**
Years of Association with the School
1.487 .211
(NS)*
Whether undergone Teacher Training
6.447 .002
(Sig.)**
16. Post Hoc results
21.
No monitoring of
work done by the Officials
District 2.459 .067
(NS)*
Years of Association with the School
1.545 .194
(NS)*
Whether undergone Teacher Training
3.676 .029
(Sig.)**
17. Post Hoc results
22.
Materials not being provided on time
District 6.748 .000
(Sig.)**
Years of Association with the School
1.417 .233
(NS)*
Whether undergone Teacher Training
4.827 .010
(Sig.)**
(** Result Significant (Sig) as p<0.05, *Result Not Significant (NS) as p>0.05)
279
District
Vadodara
1.79
Banaskantha 1.47 0.221 (NS)*
Dangs 1.13 0.010
(Sig.)**
Surat 1.61 0.475 (NS)*
Whether
undergone
Teacher
Training
Yes
1.81
No 1.33 0.199 (NS)*
No Response
.80 0.000
(Sig.)**
District
Banaskantha
2.17
Dangs 1.47 0.003
(Sig.)**
Surat 2.00 0.395 (NS)*
Vadodara 1.21 0.000
(Sig.)**
Whether No 1.00
0.202
undergone any Teacher
Yes 1.33 (NS)*
No .80
0.014
Training Response (Sig.)**

18. Post Hoc results
23.
Rigidity of
Community
members regarding
participation in
school programmes
District 3.271 .024
(Sig)**
Years of Association with the School
.285 .887
(NS)*
Whether undergone Teacher Training
.870 .422 (NS)*
19. Post Hoc results
24.
Difficulty in
involving parents in
school activities
District 5.113 .002
(Sig.)**
Years of Association with the School
.265 .900
(NS)*
Whether undergone Teacher Training
.697 .500
(NS)*
20. Post Hoc results
(** Result Significant (Sig) as p<0.05, *Result Not Significant (NS) as p>0.05)
280
Whether
undergone
Teacher
Training
Yes
1.55
No 1.17 0.232 (NS)*
No Response .80 0.000
(Sig.)**
District
Dangs
1.80
Banaskantha 1.00 0.000
(Sig.)**
Surat 1.39 0.036
(Sig.)**
Vadodara 1.66 0.557 (NS)*
District
Vadodara
2.00
Banaskantha 1.43 0.004
(Sig.)**
Dangs 1.87 0.475 (NS)*
Surat 1.83 0.472 (NS)*
District
Vadodara
1.93
Banaskantha 1.23 0.000
(Sig.)**
Dangs 1.63 0.987 (NS)*
Surat 1.65 0.249 (NS)*

Section IV
Suggestions
25.
Organization of
more awareness
programmes by the
Government
District 7.110 .000
(Sig.)**
Years of Association with the School
.686 .603 (NS)*
Whether undergone Teacher Training
.420 .658
(NS)*
21. Post Hoc results
26.
Provision of Role Specific Training
District 6.462 .000
(Sig.)**
Years of Association with the School
1.164 .331
(NS)*
Whether undergone Teacher Training
13.648 .000
(Sig.)**
22. Post Hoc results
27.
Conducting
Campaigns for
people to avail
facilities
District 12.563 .000
(Sig.)**
Years of Association with the School
1.442 .225 (NS)*
Whether undergone Teacher Training
5.766 .004
(Sig.)**
(** Result Significant (Sig) as p<0.05, *Result Not Significant (NS) as p>0.05)
281
District
Banaskantha
2.93
Vadodara 2.10 0.00
(Sig.)**
Dangs 2.17 0.00
(Sig.)**
Surat 2.13 0.00
(Sig.)**
Whether
undergone
any Teacher
Training
No
2.67
Yes 2.33 0.338 (NS)*
No Response
2.30 0.531
(NS)*
District
Banaskantha
2.67
Dangs 2.07 0.000
(Sig.)**
Surat 2.39 0.060 (NS)*
Vadodara 1.86 0.000
(Sig.)**

23. Post Hoc results
28.
Distribution of
Booklets and
brochures during
campaigns
District 7.815 .000
(Sig.)**
Years of Association
with the School 1.429
.230 (NS)*
Whether undergone Teacher Training
5.902 .004
(Sig.)**
24. Post Hoc results
29.
Establishment of
Transparent
Communication
channel between the
parents and the
school
District 3.152 .028
(Sig.)**
Years of Association with the School
.364 .834
(NS)*
Whether undergone Teacher Training
3.318 .040
(Sig.)**
(** Result Significant (Sig) as p<0.05, *Result Not Significant (NS) as p>0.05)
282
Whether
undergone
any Teacher
Training
No
3.00
Yes 2.26 0.052 (NS)*
No Response
1.70 0.00
(Sig.)**
District
Banaskantha
2.73
Dangs 1.90 0.000
(Sig.)**
Surat 2.57 0.329 (NS)*
Vadodara 1.86 0.000
(Sig.)**
Whether
undergone
any Teacher
Training
Yes
2.43
No 2.33 0.734 (NS)*
No
Response 1.60
0.000
(Sig.)**
District
Banaskantha
2.87
Dangs 2.23 0.000
(Sig.)**
Surat 2.09 0.000
(Sig.)**
Vadodara 2.14 0.000
(Sig.)**

25. Post Hoc results
30.
Regularizing
Teacher Training
District 2.140 .099 (NS)*
Years of Association with the School
.440 .779
(NS)*
Whether undergone Teacher Training
7.091 .001
(Sig.)**
26. Post Hoc results
(** Result Significant (Sig) as p<0.05, *Result Not Significant (NS) as p>0.05)
283
Whether
undergone
any
Teacher Training
No
3.00
Yes 2.75 0.575 (NS)*
No Response
2.30 0.061
(NS)*
District
Surat
2.91
Banaskantha 2.77 0.184 (NS)*
Dangs 2.80 0.276 (NS)*
Vadodara 2.45 0.029 (Sig.)
Whether
undergone any Teacher
No
2.83
Yes 2.26 0.091 (NS)*
No 1.30
0.029
Training Response (Sig.)**