Interpretation of pipe-jacking and lubrication records for drives ...
11
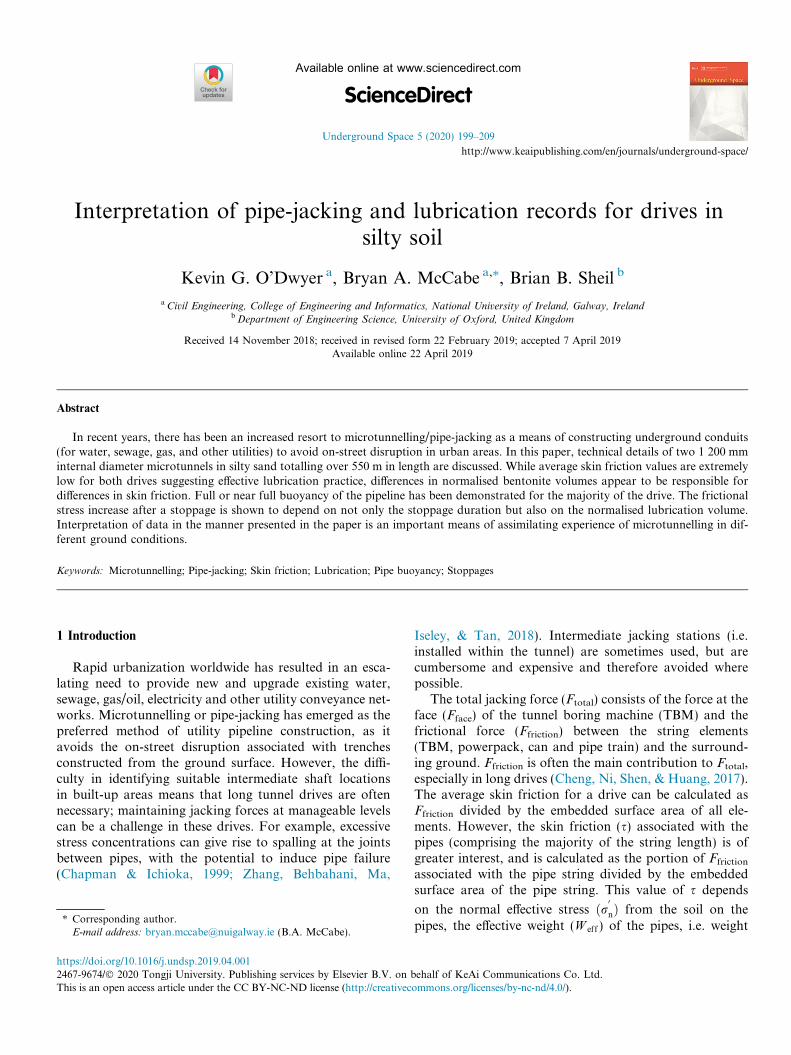
Interpretation of pipe-jacking and lubrication records for drives in silty soil Kevin G. O’Dwyer a , Bryan A. McCabe a,⇑ , Brian B. Sheil b a Civil Engineering, College of Engineering and Informatics, National University of Ireland, Galway, Ireland b Department of Engineering Science, University of Oxford, United Kingdom Received 14 November 2018; received in revised form 22 February 2019; accepted 7 April 2019 Available online 22 April 2019 Abstract In recent years, there has been an increased resort to microtunnelling/pipe-jacking as a means of constructing underground conduits (for water, sewage, gas, and other utilities) to avoid on-street disruption in urban areas. In this paper, technical details of two 1 200 mm internal diameter microtunnels in silty sand totalling over 550 m in length are discussed. While average skin friction values are extremely low for both drives suggesting effective lubrication practice, differences in normalised bentonite volumes appear to be responsible for differences in skin friction. Full or near full buoyancy of the pipeline has been demonstrated for the majority of the drive. The frictional stress increase after a stoppage is shown to depend on not only the stoppage duration but also on the normalised lubrication volume. Interpretation of data in the manner presented in the paper is an important means of assimilating experience of microtunnelling in dif- ferent ground conditions. Keywords: Microtunnelling; Pipe-jacking; Skin friction; Lubrication; Pipe buoyancy; Stoppages 1 Introduction Rapid urbanization worldwide has resulted in an esca- lating need to provide new and upgrade existing water, sewage, gas/oil, electricity and other utility conveyance net- works. Microtunnelling or pipe-jacking has emerged as the preferred method of utility pipeline construction, as it avoids the on-street disruption associated with trenches constructed from the ground surface. However, the diffi- culty in identifying suitable intermediate shaft locations in built-up areas means that long tunnel drives are often necessary; maintaining jacking forces at manageable levels can be a challenge in these drives. For example, excessive stress concentrations can give rise to spalling at the joints between pipes, with the potential to induce pipe failure (Chapman & Ichioka, 1999; Zhang, Behbahani, Ma, Iseley, & Tan, 2018). Intermediate jacking stations (i.e. installed within the tunnel) are sometimes used, but are cumbersome and expensive and therefore avoided where possible. The total jacking force (F total ) consists of the force at the face (F face ) of the tunnel boring machine (TBM) and the frictional force (F friction ) between the string elements (TBM, powerpack, can and pipe train) and the surround- ing ground. F friction is often the main contribution to F total , especially in long drives (Cheng, Ni, Shen, & Huang, 2017). The average skin friction for a drive can be calculated as F friction divided by the embedded surface area of all ele- ments. However, the skin friction (s) associated with the pipes (comprising the majority of the string length) is of greater interest, and is calculated as the portion of F friction associated with the pipe string divided by the embedded surface area of the pipe string. This value of s depends on the normal effective stress ðr 0 n Þ from the soil on the pipes, the effective weight (W eff ) of the pipes, i.e. weight https://doi.org/10.1016/j.undsp.2019.04.001 2467-9674/Ó 2020 Tongji University. Publishing services by Elsevier B.V. on behalf of KeAi Communications Co. Ltd. This is an open access article under the CC BY-NC-ND license (http://creativecommons.org/licenses/by-nc-nd/4.0/). ⇑ Corresponding author. E-mail address: [email protected] (B.A. McCabe). http://www.keaipublishing.com/en/journals/underground-space/ Available online at www.sciencedirect.com ScienceDirect Underground Space 5 (2020) 199–209
-
Upload
khangminh22 -
Category
Documents
-
view
4 -
download
0
Transcript of Interpretation of pipe-jacking and lubrication records for drives ...
Available online at www.sciencedirect.com
http://www.keaipublishing.com/en/journals/underground-space/
ScienceDirect
Underground Space 5 (2020) 199–209
Interpretation of pipe-jacking and lubrication records for drives insilty soil
Kevin G. O’Dwyer a, Bryan A. McCabe a,⇑, Brian B. Sheil b
aCivil Engineering, College of Engineering and Informatics, National University of Ireland, Galway, IrelandbDepartment of Engineering Science, University of Oxford, United Kingdom
Received 14 November 2018; received in revised form 22 February 2019; accepted 7 April 2019Available online 22 April 2019
Abstract
In recent years, there has been an increased resort to microtunnelling/pipe-jacking as a means of constructing underground conduits(for water, sewage, gas, and other utilities) to avoid on-street disruption in urban areas. In this paper, technical details of two 1 200 mminternal diameter microtunnels in silty sand totalling over 550 m in length are discussed. While average skin friction values are extremelylow for both drives suggesting effective lubrication practice, differences in normalised bentonite volumes appear to be responsible fordifferences in skin friction. Full or near full buoyancy of the pipeline has been demonstrated for the majority of the drive. The frictionalstress increase after a stoppage is shown to depend on not only the stoppage duration but also on the normalised lubrication volume.Interpretation of data in the manner presented in the paper is an important means of assimilating experience of microtunnelling in dif-ferent ground conditions.
Keywords: Microtunnelling; Pipe-jacking; Skin friction; Lubrication; Pipe buoyancy; Stoppages
1 Introduction
Rapid urbanization worldwide has resulted in an esca-lating need to provide new and upgrade existing water,sewage, gas/oil, electricity and other utility conveyance net-works. Microtunnelling or pipe-jacking has emerged as thepreferred method of utility pipeline construction, as itavoids the on-street disruption associated with trenchesconstructed from the ground surface. However, the diffi-culty in identifying suitable intermediate shaft locationsin built-up areas means that long tunnel drives are oftennecessary; maintaining jacking forces at manageable levelscan be a challenge in these drives. For example, excessivestress concentrations can give rise to spalling at the jointsbetween pipes, with the potential to induce pipe failure(Chapman & Ichioka, 1999; Zhang, Behbahani, Ma,
https://doi.org/10.1016/j.undsp.2019.04.001
2467-9674/� 2020 Tongji University. Publishing services by Elsevier B.V. on b
This is an open access article under the CC BY-NC-ND license (http://creativec
⇑ Corresponding author.E-mail address: [email protected] (B.A. McCabe).
Iseley, & Tan, 2018). Intermediate jacking stations (i.e.installed within the tunnel) are sometimes used, but arecumbersome and expensive and therefore avoided wherepossible.
The total jacking force (Ftotal) consists of the force at theface (Fface) of the tunnel boring machine (TBM) and thefrictional force (Ffriction) between the string elements(TBM, powerpack, can and pipe train) and the surround-ing ground. Ffriction is often the main contribution to Ftotal,especially in long drives (Cheng, Ni, Shen, & Huang, 2017).The average skin friction for a drive can be calculated asFfriction divided by the embedded surface area of all ele-ments. However, the skin friction (s) associated with thepipes (comprising the majority of the string length) is ofgreater interest, and is calculated as the portion of Ffriction
associated with the pipe string divided by the embeddedsurface area of the pipe string. This value of s depends
on the normal effective stress ðr0nÞ from the soil on the
pipes, the effective weight (W eff ) of the pipes, i.e. weight
ehalf of KeAi Communications Co. Ltd.
ommons.org/licenses/by-nc-nd/4.0/).
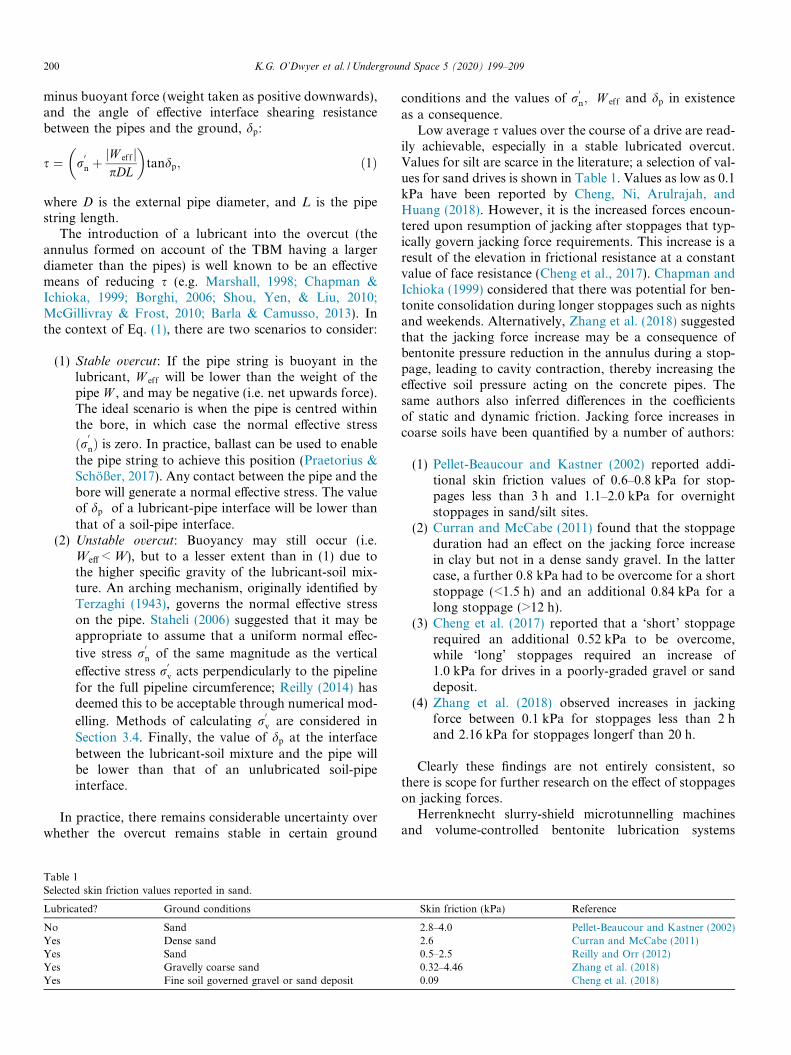
200 K.G. O’Dwyer et al. / Underground Space 5 (2020) 199–209
minus buoyant force (weight taken as positive downwards),and the angle of effective interface shearing resistancebetween the pipes and the ground, dp:
s ¼ r0n þ
W effj jpDL
� �tandp; ð1Þ
where D is the external pipe diameter, and L is the pipestring length.
The introduction of a lubricant into the overcut (theannulus formed on account of the TBM having a largerdiameter than the pipes) is well known to be an effectivemeans of reducing s (e.g. Marshall, 1998; Chapman &Ichioka, 1999; Borghi, 2006; Shou, Yen, & Liu, 2010;McGillivray & Frost, 2010; Barla & Camusso, 2013). Inthe context of Eq. (1), there are two scenarios to consider:
(1) Stable overcut: If the pipe string is buoyant in thelubricant, W eff will be lower than the weight of thepipe W , and may be negative (i.e. net upwards force).The ideal scenario is when the pipe is centred withinthe bore, in which case the normal effective stress
ðr0nÞ is zero. In practice, ballast can be used to enable
the pipe string to achieve this position (Praetorius &Schoßer, 2017). Any contact between the pipe and thebore will generate a normal effective stress. The valueof dp of a lubricant-pipe interface will be lower thanthat of a soil-pipe interface.
(2) Unstable overcut: Buoyancy may still occur (i.e.Weff < W), but to a lesser extent than in (1) due tothe higher specific gravity of the lubricant-soil mix-ture. An arching mechanism, originally identified byTerzaghi (1943), governs the normal effective stresson the pipe. Staheli (2006) suggested that it may beappropriate to assume that a uniform normal effec-
tive stress r0n of the same magnitude as the vertical
effective stress r0v acts perpendicularly to the pipeline
for the full pipeline circumference; Reilly (2014) hasdeemed this to be acceptable through numerical mod-
elling. Methods of calculating r0v are considered in
Section 3.4. Finally, the value of dp at the interfacebetween the lubricant-soil mixture and the pipe willbe lower than that of an unlubricated soil-pipeinterface.
In practice, there remains considerable uncertainty overwhether the overcut remains stable in certain ground
Table 1Selected skin friction values reported in sand.
Lubricated? Ground conditions
No SandYes Dense sandYes SandYes Gravelly coarse sandYes Fine soil governed gravel or sand deposit
conditions and the values of r0n; W eff and dp in existence
as a consequence.Low average s values over the course of a drive are read-
ily achievable, especially in a stable lubricated overcut.Values for silt are scarce in the literature; a selection of val-ues for sand drives is shown in Table 1. Values as low as 0.1kPa have been reported by Cheng, Ni, Arulrajah, andHuang (2018). However, it is the increased forces encoun-tered upon resumption of jacking after stoppages that typ-ically govern jacking force requirements. This increase is aresult of the elevation in frictional resistance at a constantvalue of face resistance (Cheng et al., 2017). Chapman andIchioka (1999) considered that there was potential for ben-tonite consolidation during longer stoppages such as nightsand weekends. Alternatively, Zhang et al. (2018) suggestedthat the jacking force increase may be a consequence ofbentonite pressure reduction in the annulus during a stop-page, leading to cavity contraction, thereby increasing theeffective soil pressure acting on the concrete pipes. Thesame authors also inferred differences in the coefficientsof static and dynamic friction. Jacking force increases incoarse soils have been quantified by a number of authors:
(1) Pellet-Beaucour and Kastner (2002) reported addi-tional skin friction values of 0.6–0.8 kPa for stop-pages less than 3 h and 1.1–2.0 kPa for overnightstoppages in sand/silt sites.
(2) Curran and McCabe (2011) found that the stoppageduration had an effect on the jacking force increasein clay but not in a dense sandy gravel. In the lattercase, a further 0.8 kPa had to be overcome for a shortstoppage (<1.5 h) and an additional 0.84 kPa for along stoppage (>12 h).
(3) Cheng et al. (2017) reported that a ‘short’ stoppagerequired an additional 0.52 kPa to be overcome,while ‘long’ stoppages required an increase of1.0 kPa for drives in a poorly-graded gravel or sanddeposit.
(4) Zhang et al. (2018) observed increases in jackingforce between 0.1 kPa for stoppages less than 2 hand 2.16 kPa for stoppages longerf than 20 h.
Clearly these findings are not entirely consistent, sothere is scope for further research on the effect of stoppageson jacking forces.
Herrenknecht slurry-shield microtunnelling machinesand volume-controlled bentonite lubrication systems
Skin friction (kPa) Reference
2.8–4.0 Pellet-Beaucour and Kastner (2002)2.6 Curran and McCabe (2011)0.5–2.5 Reilly and Orr (2012)0.32–4.46 Zhang et al. (2018)0.09 Cheng et al. (2018)

K.G. O’Dwyer et al. / Underground Space 5 (2020) 199–209 201
(Ulkan, 2013) are commonly used in pipe-jacking con-tracts. A large number of parameters are recorded at regu-lar time/distance intervals from both the tunnelling andlubrication processes, but rarely are any retrospective anal-yses carried out on these data. In this paper, data from twodrives on a U.K. pipe-jacking project are analysed to pro-vide insight into some of the knowledge gaps identifiedabove.
2 Pipe-jacking project and tunnelling details
2.1 Project
The Blackpool South Strategy Project was devised toimprove bathing water quality along the Blackpool(U.K.) seafront and mitigate the risk of flooding after peri-ods of heavy rainfall. One component of this schemeentailed the construction of a new storm-water holdingtank at Lennox Gate and a tunnel to accommodate700 mm internal diameter ductile water pipes connectingthe holding tank to an outfall at Harrowside, from wherethe water is fed to the sea. The tunnels were constructedby Ward and Burke Construction Ltd. Tunnelling andlubrication data from the two drives (A and B) shown inFig. 1 are considered in this paper.
2.2 Drive details
Drive A was 272 m in length, constructed in an eastnorth-easterly direction with a gradient of �0.154% andan initial launch invert depth of 7.61 m. Drive B was295 m in length, constructed in a west south-westerly direc-tion with a gradient of 0.347% and an initial launch invertdepth of 7.59 m (Fig. 1). Cover depths ranged from 5.2–6.3 m for Drive A to 6.2–7.8 m for Drive B. The TBM usedwas a Herrenknecht AVN 1200 (slurry shield machine),with a cutterhead diameter of 1 515 mm and a machine lin-ing outer diameter of 1 505 mm. Each concrete pipe was2.5 m long with an outer diameter of 1 490 mm, providing
Fig. 1. Location of tunnels and shafts at Blac
an overcut 25 mm thick, corresponding to an overcut ratioof 1.68%. The mass of each pipe was 3 660 kg.
2.3 Lubrication details
The lubrication used was a bentonite solution compris-ing Hydraul-EZ and water in the ratio 22.7 kg to 400 L(5.7%). Other additives included (1) soda ash to balancepH, (2) MX polymer to prevent additional groundwaterpenetrating the mix, and (3) torque reducer to promotelubrication. The first bentonite station was located in thepipe directly behind the TBM, with 19 further stationspositioned in ensuing pipes (one every fifth pipe). Each ofthese stations comprised three lubrication ports, separatedby 120�, situated mid-length on each pipe. One further ben-tonite station was fixed to the launch shaft wall. The ben-tonite system used was volume-controlled, calculatedfrom the TBM advance rate and ground conditions(Ulkan, 2013).
2.4 Ground conditions
The locations of three boreholes (BH4, BH6, and BH8)in relation to the line of Drives A and B are shown inFig. 1. The ground conditions comprise made ground(0.4 m thickness), underlain by gravelly sand (2.6–4.4 m),peat (1.0–1.7 m), silt (1.2–2.5 m) and silty sand/sand(>5.0 m). From the summary stratigraphy in Fig. 2, itcan be seen that the tunnel passes through the silt and siltysand layers. The water table was found to be at a depth of1.2 m in a borehole close to the reception shaft of Drive A.
Uncorrected Standard penetration test (SPT) values N
are also shown in Fig. 2. In order to derive an operationalfriction angle for the material above the crown of the tun-nel for stability assessments (Section 3.4), it was assumedthat the material above the tunnel crown was predomi-nantly granular (i.e. the peat was ignored). Therefore, anaverage N1 value (N values corrected for overburden pres-sure) for the layer could be correlated with the friction
kpool site (adapted from Google Maps).
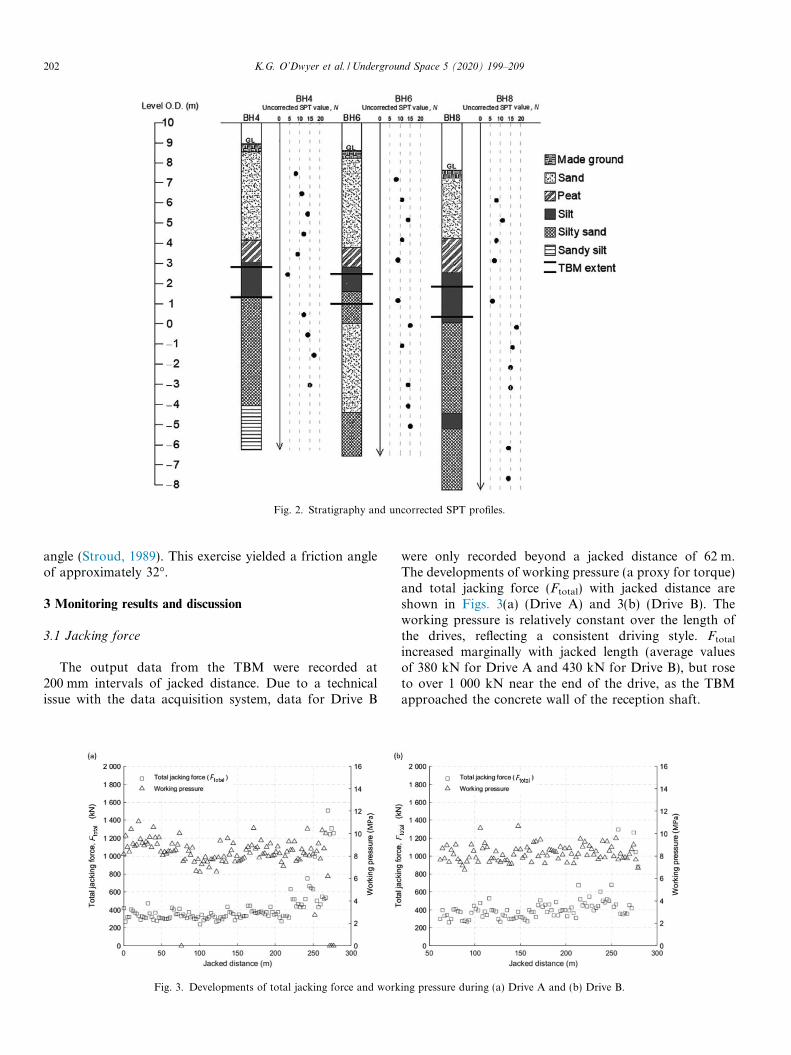
Fig. 2. Stratigraphy and uncorrected SPT profiles.
202 K.G. O’Dwyer et al. / Underground Space 5 (2020) 199–209
angle (Stroud, 1989). This exercise yielded a friction angleof approximately 32�.
3 Monitoring results and discussion
3.1 Jacking force
The output data from the TBM were recorded at200 mm intervals of jacked distance. Due to a technicalissue with the data acquisition system, data for Drive B
Fig. 3. Developments of total jacking force and work
were only recorded beyond a jacked distance of 62 m.The developments of working pressure (a proxy for torque)and total jacking force (Ftotal) with jacked distance areshown in Figs. 3(a) (Drive A) and 3(b) (Drive B). Theworking pressure is relatively constant over the length ofthe drives, reflecting a consistent driving style. Ftotal
increased marginally with jacked length (average valuesof 380 kN for Drive A and 430 kN for Drive B), but roseto over 1 000 kN near the end of the drive, as the TBMapproached the concrete wall of the reception shaft.
ing pressure during (a) Drive A and (b) Drive B.

K.G. O’Dwyer et al. / Underground Space 5 (2020) 199–209 203
Fface was not measured directly in this type of Her-renknecht machine, so the approach of Pellet-Beaucourand Kastner (2002) was typically used to separate Fface
and Ffriction (e.g. Curran & McCabe, 2011; Sheil, Curran,& McCabe, 2016; Ni, Ge, & Cheng, 2016; Cheng et al.,2018). Ffriction could be approximated from a trendline join-ing the minimum points of a total jacking load versusjacked distance plot, while Fface was taken as the differencebetween the minimum and maximum envelopes. The sensi-tivity of Ffriction to the intervals over which the minimumjacking forces were assessed was considered by calculatingFfriction values over 1 m, 2.4 m (approximately one pipelength), 5 m and 10 m intervals. Ffriction values were foundto reduce with increased interval, converging to consistentvalues at 10 m intervals. Therefore, the Fface and Ffriction
values presented in Fig. 4 are based on the maximum andminimum forces over 10 m intervals.
The effectiveness of lubrication is best assessed from svalues for the pipe string only. The heavier elements(TBM, power pack and can) are likely to drag along thebottom of the overcut, generating much higher levels offriction than the pipes. It is also conceivable that there isa transition zone where the position of the pipes in theovercut is dictated by the heavier elements (illustrated inFig. 5; stable overcut assumed for the purposes of figure).To this end, the frictional force for the first 62 m has beensubtracted from the data; this distance was chosen as itcoincides with the point at which data recording for DriveB commenced.
It can be seen from Fig. 6 that the s values are at the lowend of the range indicated in Table 1, suggesting effectivelubrication practice. The skin friction values at any stageof Drive A are typically below 0.25 kPa, whereas thosefor Drive B are higher on average and typically below0.5 kPa over the length of the drive. The small negative svalues plotted on Fig. 6 (mainly for Drive A) are believedto arise from small errors associated with the Pellet-Beaucour and Kastner (2002) force separation processsuperimposed on very low real skin friction values.
Fig. 4. Maximum and minimum jacking force envelopes
Large deviations in alignment, irrespective of the cause,can increase the required jacking force. Reilly, McCabe,and Orr (2012) reported on two drives of similar lengthand in similar ground conditions; at a jacked distance of60 m, one drive deviated by 270 mm and required a jackingload of 3 750 kN at this point, whereas the other drive devi-ated by 137 mm and required a jacking load of 2 300 kN.From field monitoring of a drive in ground described as‘fine soil governed gravel or sand deposit’, Cheng et al.(2018) suggested that deviations less than a 60 mm thresh-old will have little or no effect on overall jacking forces.Both vertical and horizontal deviations were found to besmall (<50 mm and <10 mm respectively) for Drives Aand B and will not be not considered further in this paper.
3.2 Lubrication volumes
Based on experience of monitoring on numerous pipe-jacking projects, Praetorius and Schoßer (2017) recom-mended that a lubricant volume of 3.12 times the overcutvolume (hereafter referred to as lubrication volume ratio)was applied when tunnelling in sands, 2.58 in fine sandsand 2.0 in silts. The surplus lubricant seeped into theground, creating a filter cake serving as a membrane orzone of low permeability to transfer the support pressureacting in the annular gap (assuming it is stable) into thegrain structure of the ground (Praetorius & Schoßer, 2017).
The variation in lubrication volume ratio with jackeddistance is presented in Fig. 7. Beyond a jacked length of62 m, the volume ratio stabilizes at 6.02–6.66 for DriveA. Values range between 4.16 and 5.03 for Drive B, butthere is a steady increase from a jacked distance of�200 m to the end of the drive. These values are well inexcess of recommended minimum values for filter cake for-mation. The differences in the average s values from DrivesA and B clearly reflect the differences in volume ratios.
The volume percentage of bentonite pumped into theannulus is plotted (on a log scale) against jacked distancein Fig. 8 for a selection of the 21 stations. The distance
and face resistance for (a) Drive A and (b) Drive B.

Fig. 5. Hypothesised transition of pipe string within bore.
Fig. 6. Average skin friction for (a) Drive A and (b) Drive B.
Fig. 7. Normalised bentonite volume against jacked distance for Drives Aand B.
204 K.G. O’Dwyer et al. / Underground Space 5 (2020) 199–209
of these stations behind the TBM face is shown in thelegend. Station 1 (the nearest to the TBM) is responsiblefor a greater bentonite volume than any other individualstation for most of the drive length. The bentonite volumesupplied at the head of the machine supports the boreholeand it is intended that the trailing pipes maintain a con-stant lubrication volume ratio thereafter (confirmed inFig. 7), as over time bentonite may dissipate through thesoil. Around the midpoint of Drive A (135 m), for example,Station 1 has produced 44% of the total volume ofbentonite, the station located at the launch shaft has
contributed 13% and Stations 2 and 3 supplied 10.9%and 6.4% respectively. Therefore, these four stationscontribute 74.3% of the total volume of bentonite at thisposition.
3.3 Pipe buoyancy
Pipes are generally designed to remain buoyant in astable lubricated overcut. However, the stability of theovercut in sandy soils is generally a source of uncertainty,therefore the flotation status of the pipe string is generallyunknown during installation. The data enable a retrospec-tive assessment of the effective weight (Weff) of the pipe to
be made. Making r0n the subject of Eq. (1) and recognizing
that r0n cannot be negative, the following inequality is
obtained:
r0n ¼
stan dp
� W effj jpDL
� 0: ð2Þ
In terms of a weight ratio Weff/W, the expression can berecast as:
W eff
W
�������� � pDLs
W tan dp: ð3Þ
Reilly and Orr (2017) conducted direct shear interfacetests between a fine to medium sand (median particle sizeD50 = 0.23 m) and a rough concrete interface in which4% and 8% Hydraul-EZ bentonite mixes were used. Inter-face friction angles of 31� and 27.1� were measured for the4% and 8% mixes respectively. A value of 28.8� wasadopted for dp in Eq. (3) based on interpolation of the

Fig. 8. Percentage of total bentonite volume pumped from selected stations for (a) Drive A and (b) Drive B.
K.G. O’Dwyer et al. / Underground Space 5 (2020) 199–209 205
Reilly and Orr (2017) values for the 5.7% mix used at theBlackpool site. Values of Weff/W are plotted against jackeddistance for Drives A and B in Fig. 9; note that these rep-resent average values over the length of the pipe string.Values are plotted around full buoyancy (�0.1 < Weff/W< 0.1) for Drive A, with slightly higher values (0 < Weff/W< 0.25) for Drive B where less bentonite was injected. It cantherefore be inferred that the pipe train remained relativelycentral within the bore, a conclusion which is not particu-larly sensitive to the value of dp assumed. Locally high val-ues of Weff/W coincide with the increased s valuesassociated with stoppages.
3.4 Overcut stability
The integrity of the overcut when pipe-jacking in sandysoils is often unknown. Khazaei, Shimada, Kawai,Yotsumoto, and Matsui (2006) used a camera and groundpenetrating radar to consider the integrity of the overcutwhen tunnelling in sand. Although the surrounding soilhad converged slightly on the pipe, it was confirmed thatlubrication was present in every sampling area, supportingthe possibility of a stable overcut in such soils.
Fig. 9. Values of Weff/W against jacked distance, demonstrati
If the hypothesis of an unstable overcut is adopted, r0n
acting on the pipe crown (assumed equal to r0v) may be
determined from a number of expressions emanating fromTerzaghi (1943) arching theory. Four methods (Terzaghi,1951; ATV A 161 (Stein, Mollers, & Bielecki, 1989); PJA(Milligan & Norris, 1994) and Zhang, Zhang, Zhou,
Dong, & Ma, 2016) were used to calculate r0v. The arching
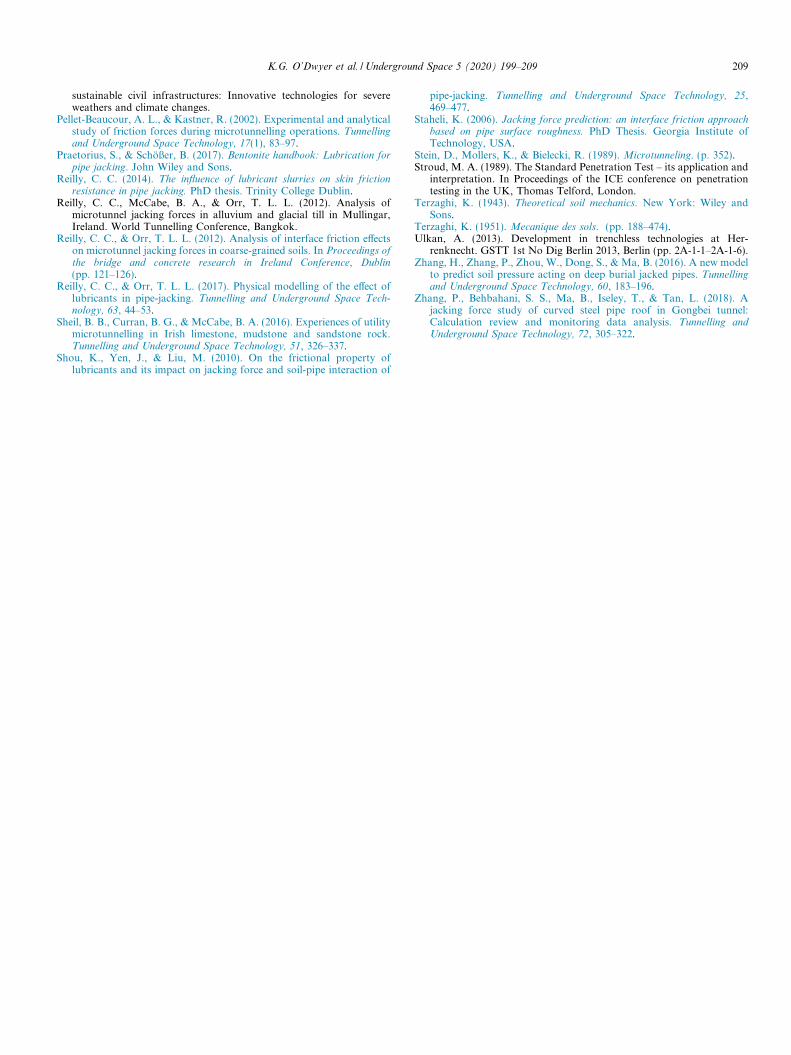
geometry parameters H (the cover to the pipe crown), B(the influencing (silo) width of soil above the pipe) andDb (the bore diameter) are shown in Fig. 10. The methodproposed by Terzaghi (1951), based on Eqs. (4) and (5)
below, was found to provide the lowest estimate of r0v
(14.5–15.6 kPa) for the range of covers encountered over
both drives (H/B between 3.43 and 5.18); c0is the effective
unit weight, K is the earth pressure coefficient above thepipes, d is the interface angle along the silo’s shear planesand / is the friction angle.
r0v ¼ c
0H
1� e�2KHB tan d
2K HB tan d
!; ð4Þ
B ¼ Db 1þ 2 tanp4� /
2
� �� �: ð5Þ
ng pipe string buoyancy for (a) Drive A and (b) Drive B.
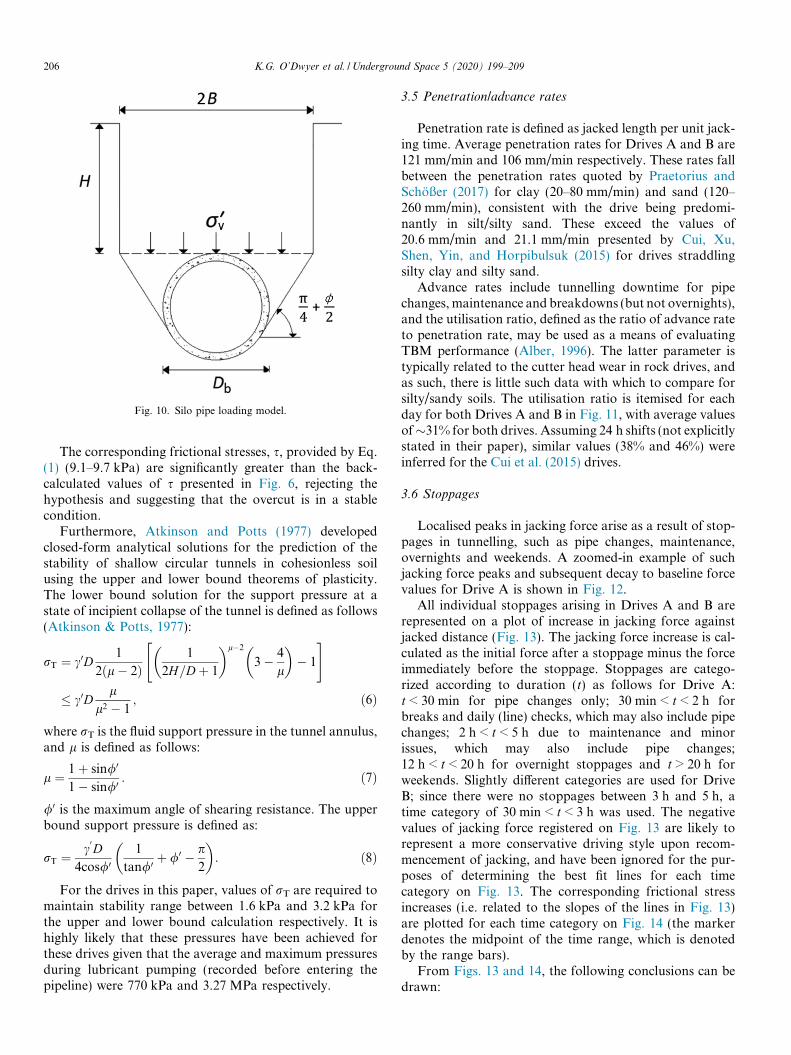
Fig. 10. Silo pipe loading model.
206 K.G. O’Dwyer et al. / Underground Space 5 (2020) 199–209
The corresponding frictional stresses, s, provided by Eq.(1) (9.1–9.7 kPa) are significantly greater than the back-calculated values of s presented in Fig. 6, rejecting thehypothesis and suggesting that the overcut is in a stablecondition.
Furthermore, Atkinson and Potts (1977) developedclosed-form analytical solutions for the prediction of thestability of shallow circular tunnels in cohesionless soilusing the upper and lower bound theorems of plasticity.The lower bound solution for the support pressure at astate of incipient collapse of the tunnel is defined as follows(Atkinson & Potts, 1977):
rT ¼ c0D1
2ðl� 2Þ1
2H=Dþ 1
� �l�2
3� 4
l
� �� 1
" #
� c0Dl
l2 � 1; ð6Þ
where rT is the fluid support pressure in the tunnel annulus,and l is defined as follows:
l ¼ 1þ sin/0
1� sin/0 : ð7Þ
/0 is the maximum angle of shearing resistance. The upperbound support pressure is defined as:
rT ¼ c0D
4cos/01
tan/0 þ /0 � p2
� �: ð8Þ
For the drives in this paper, values of rT are required tomaintain stability range between 1.6 kPa and 3.2 kPa forthe upper and lower bound calculation respectively. It ishighly likely that these pressures have been achieved forthese drives given that the average and maximum pressuresduring lubricant pumping (recorded before entering thepipeline) were 770 kPa and 3.27 MPa respectively.
3.5 Penetration/advance rates
Penetration rate is defined as jacked length per unit jack-ing time. Average penetration rates for Drives A and B are121 mm/min and 106 mm/min respectively. These rates fallbetween the penetration rates quoted by Praetorius andSchoßer (2017) for clay (20–80 mm/min) and sand (120–260 mm/min), consistent with the drive being predomi-nantly in silt/silty sand. These exceed the values of20.6 mm/min and 21.1 mm/min presented by Cui, Xu,Shen, Yin, and Horpibulsuk (2015) for drives straddlingsilty clay and silty sand.
Advance rates include tunnelling downtime for pipechanges, maintenance and breakdowns (but not overnights),and the utilisation ratio, defined as the ratio of advance rateto penetration rate, may be used as a means of evaluatingTBM performance (Alber, 1996). The latter parameter istypically related to the cutter head wear in rock drives, andas such, there is little such data with which to compare forsilty/sandy soils. The utilisation ratio is itemised for eachday for both Drives A and B in Fig. 11, with average valuesof�31% for both drives. Assuming 24 h shifts (not explicitlystated in their paper), similar values (38% and 46%) wereinferred for the Cui et al. (2015) drives.
3.6 Stoppages
Localised peaks in jacking force arise as a result of stop-pages in tunnelling, such as pipe changes, maintenance,overnights and weekends. A zoomed-in example of suchjacking force peaks and subsequent decay to baseline forcevalues for Drive A is shown in Fig. 12.
All individual stoppages arising in Drives A and B arerepresented on a plot of increase in jacking force againstjacked distance (Fig. 13). The jacking force increase is cal-culated as the initial force after a stoppage minus the forceimmediately before the stoppage. Stoppages are catego-rized according to duration (t) as follows for Drive A:t < 30 min for pipe changes only; 30 min < t < 2 h forbreaks and daily (line) checks, which may also include pipechanges; 2 h < t < 5 h due to maintenance and minorissues, which may also include pipe changes;12 h < t < 20 h for overnight stoppages and t > 20 h forweekends. Slightly different categories are used for DriveB; since there were no stoppages between 3 h and 5 h, atime category of 30 min < t < 3 h was used. The negativevalues of jacking force registered on Fig. 13 are likely torepresent a more conservative driving style upon recom-mencement of jacking, and have been ignored for the pur-poses of determining the best fit lines for each timecategory on Fig. 13. The corresponding frictional stressincreases (i.e. related to the slopes of the lines in Fig. 13)are plotted for each time category on Fig. 14 (the markerdenotes the midpoint of the time range, which is denotedby the range bars).
From Figs. 13 and 14, the following conclusions can bedrawn:

Fig. 11. Utilisation ratios for each day for (a) Drive A and (b) Drive B.
Fig. 12. Influence of stoppages on total jacking force (Drive A).
K.G. O’Dwyer et al. / Underground Space 5 (2020) 199–209 207
(1) The jacking force increase required after a stoppagedepends on jacked length, confirming that it is a fric-tional phenomenon.
Fig. 13. Change in jacking force due to stoppage again
(2) The duration of stoppage has little effect on the jack-ing force required up to about 2–3 h (frictional stressincrease less than 0.05 kPa), but it has a clear effectfor longer durations. This observation would appearto rule out differences in static and dynamic coeffi-cients of friction as the explanation for the frictionalstress increases.
(3) There are two best fit lines shown for the 12–20 h cat-egory for Drive B. The reduced jacking forces beyond�200 m may reflect the increase in lubrication volumeratio from that point until the end of the drive. Inter-estingly, this effect was not observed for the lowerstoppage duration categories.
(4) In Fig. 14, the effect of lubrication volume ratio isapparent, where frictional stress increases are higherfor Drive B than Drive A for the longer stoppages.
(5) Stoppages greater than 20 h are of significant concernwith increases of 0.31 kPa and 0.5 kPa for Drive Aand B respectively, much greater than the averageskin friction values for these drives.
st jacked distance for (a) Drive A and (b) Drive B.

Fig. 14. Relationship between frictional stress increase and stoppageduration.
208 K.G. O’Dwyer et al. / Underground Space 5 (2020) 199–209
4 Conclusions
Data from two 1 200 mm internal diameter microtun-nels installed through silt and silty sand are interpreted inthis paper. The following conclusions and research ques-tions prompted as a result can be summarized:
(1) The strategy of deploying lubrication volume ratiosmuch greater than the Praetorius and Schoßer(2017) guideline values was justified by the very lowaverage skin friction values (less than 0.5 kPa) forthe pipe string. Slightly different values for the twodrives reflect slightly different lubrication volumeratios. The relationship between average skin frictionand lubrication volume ratio is a topic worthy of sys-tematic research at field scale.
(2) The skin friction values for the pipe string were usedto infer that the pipe string is on average fully buoy-ant in a stable annulus based on normal effectivestresses calculated from arching models and drainedtunnel stability theory. However, a robustly-instrumented pipe capable of measuring normal andshear stresses would provide important localizedinsight into the behaviour of the annulus.
(3) The increase in frictional stress owing to stoppages isstrongly time dependent, at least beyond about 2–3 h,and also reflects the amount of bentonite injected.The frictional stress increases associated with longerstoppages are multiples of the steady state values.The time effect would suggest that one of the theoriesput forward for this frictional stress increase, differentcoefficients of static and dynamic friction, is improb-able. Sensors positioned to record external bentonite
pressures (in an open or collapsed annulus) would aidin understanding the mechanism behind such fric-tional stress increases.
A secondary goal of this paper is to highlight the useful-ness of retrospective analysis of drive data, which is largelyuntapped by the pipe-jacking industry. The potential fornew understanding of the pipe-jacking process by collatingexperiences of drives in different ground conditions, partic-ularly in the context of modern data analytics capability, isvery exciting.
Acknowledgements
The first author is funded by an Irish Research CouncilEnterprise Partnership Scheme (IRC-EPS) PostgraduateScholarship, with Ward and Burke Construction Limitedas the industry partner. The third author is supported bythe Royal Academy of Engineering (U.K.) under theResearch Fellowship Scheme.
References
Atkinson, J. H., & Potts, D. M. (1977). Stability of a shallow circulartunnel in cohesionless soil. Geotechnique, 27(2), 203–215.
Alber, M. (1996). Prediction of penetration, utilization for hard rockTBMs. In Proceedings of the international conference of Eurock ’96,Balkema, Rotterdam (pp. 721–725).
Borghi, F. X. (2006). Soil conditioning for pipe-jacking and tunnelling. PhDthesis. UK: University of Cambridge.
Barla, M., & Camusso, M. (2013). A method to design microtunnellinginstallations in randomly cemented Torino alluvial soil. Tunnelling andUnderground Space Technology, 33, 73–81.
Chapman, D. N., & Ichioka, Y. (1999). Predictions of jacking forces formicrotunnelling operations. Tunnelling and Underground Space Tech-nology, 14(1), 31–41.
Cheng, W., Ni, J. C., Shen, J. S., & Huang, H. (2017). Investigation intofactors affecting jacking force: A case study. Proceedings of theInstitution of Civil Engineers – Geotechnical Engineering, 170(4),322–334.
Cheng, W., Ni, J. C., Arulrajah, A., & Huang, H. (2018). A simpleapproach for characterising tunnel bore conditions based upon pipe-jacking data. Tunnelling and Underground Space Technology, 71,494–504.
Cui, Q. L., Xu, Y. S., Shen, S. L., Yin, Z. Y., & Horpibulsuk, S. (2015).Field performance of concrete pipes during jacking in cemented sandysilt. Tunnelling and Underground Space Technology, 49, 336–344.
Curran, B. G., & McCabe, B. A. (2011). Measured jacking forces duringslurry-shield microtunnelling in a boulder clay at Kilcock, Ireland. InProceedings of the 15th European conference on soil mechanics andgeotechnical engineering, Athens (Vol. 3, pp. 1627–1632).
Khazaei, S., Shimada, H., Kawai, T., Yotsumoto, J., & Matsui, K. (2006).Monitoring of over cutting area and lubrication distribution in a largeslurry pipe jacking operation. Geotechnical and Geological Engineering,24(3), 735–755.
Marshall, M. (1998). Pipe-jacked tunnelling: Jacking loads and groundmovements. PhD Thesis. UK: University of Oxford.
McGillivray, C. B., & Frost, J. D. (2010). Influence of bentonite slurry oninterface friction. In Characterization and behaviour of interfaces –Proceedings of research symposium on characterization and behaviour ofinterfaces (pp. 119–124). Atlanta: IOS Press.
Milligan, G., & Norris, P. (1994). Pipe jacking research results andrecommendations. (p. 18).
Ni, J. C., Ge, L., & Cheng, W. (2016). Variation of slurry pipe jacking oncoarse and fine soils. In 4th GeoChina international conference
K.G. O’Dwyer et al. / Underground Space 5 (2020) 199–209 209
sustainable civil infrastructures: Innovative technologies for severeweathers and climate changes.
Pellet-Beaucour, A. L., & Kastner, R. (2002). Experimental and analyticalstudy of friction forces during microtunnelling operations. Tunnellingand Underground Space Technology, 17(1), 83–97.
Praetorius, S., & Schoßer, B. (2017). Bentonite handbook: Lubrication forpipe jacking. John Wiley and Sons.
Reilly, C. C. (2014). The influence of lubricant slurries on skin frictionresistance in pipe jacking. PhD thesis. Trinity College Dublin.
Reilly, C. C., McCabe, B. A., & Orr, T. L. L. (2012). Analysis ofmicrotunnel jacking forces in alluvium and glacial till in Mullingar,Ireland. World Tunnelling Conference, Bangkok.
Reilly, C. C., & Orr, T. L. L. (2012). Analysis of interface friction effectson microtunnel jacking forces in coarse-grained soils. In Proceedings ofthe bridge and concrete research in Ireland Conference, Dublin(pp. 121–126).
Reilly, C. C., & Orr, T. L. L. (2017). Physical modelling of the effect oflubricants in pipe-jacking. Tunnelling and Underground Space Tech-nology, 63, 44–53.
Sheil, B. B., Curran, B. G., & McCabe, B. A. (2016). Experiences of utilitymicrotunnelling in Irish limestone, mudstone and sandstone rock.Tunnelling and Underground Space Technology, 51, 326–337.
Shou, K., Yen, J., & Liu, M. (2010). On the frictional property oflubricants and its impact on jacking force and soil-pipe interaction of
pipe-jacking. Tunnelling and Underground Space Technology, 25,469–477.
Staheli, K. (2006). Jacking force prediction: an interface friction approachbased on pipe surface roughness. PhD Thesis. Georgia Institute ofTechnology, USA.
Stein, D., Mollers, K., & Bielecki, R. (1989). Microtunneling. (p. 352).Stroud, M. A. (1989). The Standard Penetration Test – its application and
interpretation. In Proceedings of the ICE conference on penetrationtesting in the UK, Thomas Telford, London.
Terzaghi, K. (1943). Theoretical soil mechanics. New York: Wiley andSons.
Terzaghi, K. (1951). Mecanique des sols. (pp. 188–474).Ulkan, A. (2013). Development in trenchless technologies at Her-
renknecht. GSTT 1st No Dig Berlin 2013, Berlin (pp. 2A-1-1–2A-1-6).Zhang, H., Zhang, P., Zhou, W., Dong, S., & Ma, B. (2016). A new model
to predict soil pressure acting on deep burial jacked pipes. Tunnellingand Underground Space Technology, 60, 183–196.
Zhang, P., Behbahani, S. S., Ma, B., Iseley, T., & Tan, L. (2018). Ajacking force study of curved steel pipe roof in Gongbei tunnel:Calculation review and monitoring data analysis. Tunnelling andUnderground Space Technology, 72, 305–322.