Effects of Variability in Lateral Pipe-Soil Interaction and Pipe ...
52
1 Effects of Variability in Lateral Pipe-Soil Interaction and Pipe Initial Out-of-Straightness on Controlled Lateral Buckling of Pre- Deformed Pipeline Jayden Chee 1 , Alastair Walker 1,3 , David White 2 1 University of Western Australia (UWA), Perth 2 University of Southampton, UK, formerly UWA, Perth 3 Advanced Mechanics and Engineering, Pty, Perth Abstract The state-of-the-art method for controlling temperature-induced global lateral buckling of a subsea pipeline is to engineer deliberate buckles at widely spaced locations. These buckles are engineered either by the installation process – i.e. ‘snake-laying’ or by installing subsea structures known as buckle initiators at each intended buckle location. The pre-deformed pipeline is new alternative method that involves continuously pre-deforming the pipeline prior to installation onto the seabed. This pre- deformation causes a significant reduction in axial stiffness and therefore significantly increases the buckle initiation temperature. It also allows thermal expansion to be accommodated throughout the pipe length via expansion of the pre-deformed curvatures, rather than being concentrated at specific buckle locations. This paper presents the influence of two of the variabilities in a pre-deformed pipeline design on the buckling performance: the initial out-of-straightness and the lateral pipe-soil interaction. The results show that the concept of a pre-deformed pipeline is robust and the success of the scheme is not affected by these two uncertainties. The pre-deformed pipeline is shown to be a self-governing system where the maximum strain is self-limited at any location. Pipeline pre-deformation is therefore proven to be a cost effective, safe and valuable tool for controlling pipeline lateral buckling. Keywords Subsea Pipeline; Pipeline Lateral Buckling; Pre-deformed Pipeline (PDP); High Pressure – High Temperature (HPHT); Pipeline – Soil Interaction (PSI); Out-of-Straightness (OOS) 1. Introduction Lateral buckling in subsea pipelines due to temperature- and pressure-induced expansion is a well- known phenomenon that may lead to catastrophic consequences such as structural failure of the pipeline if left uncontrolled. The trend in the subsea pipeline industry is to deliberately initiate lateral
-
Upload
khangminh22 -
Category
Documents
-
view
2 -
download
0
Transcript of Effects of Variability in Lateral Pipe-Soil Interaction and Pipe ...

1
Effects of Variability in Lateral Pipe-Soil Interaction and Pipe Initial Out-of-Straightness on Controlled Lateral Buckling of Pre-
Deformed Pipeline Jayden Chee1, Alastair Walker1,3, David White2 1University of Western Australia (UWA), Perth
2University of Southampton, UK, formerly UWA, Perth 3Advanced Mechanics and Engineering, Pty, Perth
Abstract
The state-of-the-art method for controlling temperature-induced global lateral buckling of a subsea
pipeline is to engineer deliberate buckles at widely spaced locations. These buckles are engineered
either by the installation process – i.e. ‘snake-laying’ or by installing subsea structures known as buckle
initiators at each intended buckle location. The pre-deformed pipeline is new alternative method that
involves continuously pre-deforming the pipeline prior to installation onto the seabed. This pre-
deformation causes a significant reduction in axial stiffness and therefore significantly increases the
buckle initiation temperature. It also allows thermal expansion to be accommodated throughout the pipe
length via expansion of the pre-deformed curvatures, rather than being concentrated at specific buckle
locations. This paper presents the influence of two of the variabilities in a pre-deformed pipeline design
on the buckling performance: the initial out-of-straightness and the lateral pipe-soil interaction. The
results show that the concept of a pre-deformed pipeline is robust and the success of the scheme is not
affected by these two uncertainties. The pre-deformed pipeline is shown to be a self-governing system
where the maximum strain is self-limited at any location. Pipeline pre-deformation is therefore proven
to be a cost effective, safe and valuable tool for controlling pipeline lateral buckling.
Keywords
Subsea Pipeline; Pipeline Lateral Buckling; Pre-deformed Pipeline (PDP); High Pressure – High
Temperature (HPHT); Pipeline – Soil Interaction (PSI); Out-of-Straightness (OOS)
1. Introduction
Lateral buckling in subsea pipelines due to temperature- and pressure-induced expansion is a well-
known phenomenon that may lead to catastrophic consequences such as structural failure of the
pipeline if left uncontrolled. The trend in the subsea pipeline industry is to deliberately initiate lateral

2
buckles along the pipeline route. This is achieved by introducing sufficient out-of-straightness (OOS) at
“trigger sites” by means of buckle initiators that can be structures, such as sleepers (Jayson et al., 2008;
Reddy, 2013), buoyancy modules (Peek and Yun, 2007; Cooper et al., 2014) or Zero Radius Bends
(ZRB) (Peek and Kristiansen, 2009). Controlled lateral buckling can also be achieved by pipeline
installation methods such as snake-lay (Preston et al., 1999; Matheson et al., 2004; Rundsag et al.,
2008) and most recently, using residual curvature (Endal et al., 2014; Endal and Nystrom, 2015). All
the methods mentioned above control lateral buckling by deliberately initiating it along the pipeline route
at specific locations, thus ensuring ‘planned’ buckles occur reliably and safely, preventing ‘unplanned’
buckles to a reasonably level of certainty. This approach is outlined in a state-of-the-art methodology
called SAFEBUCK (2011), a Joint Industry Project (JIP) that is widely used across the industry.
In the ‘planned’ buckle scenario, the pipeline is divided into sections of lengths called the Virtual Anchor
Spacing (VAS). Due to the short distance of the VAS, the potential localization of excessive expansion
into a single buckle along the pipeline route is eliminated (Bruton et al., 2005). A major shortcoming of
this approach is the huge cost involved in the designing and installation of the trigger structures, such
as sleepers or ZRBs. This approach is also not risk-free, because the structures are prone to scouring
in some environments, which can render them inoperable (Zhao and Cheng, 2008; Tom et al., 2016).
Snake-laying lacks sufficient reliability especially for large diameter pipelines and often needs a
secondary method to be executed such as rock dump or buoyancy module to achieve adequate
reliability for buckle control (Maschner and Abdalla, 2012; Reddy, 2013).
Pipeline lateral buckling is sensitive to the pipeline out-of-straightness and pipe-soil interaction (PSI).
Therefore, in conjunction with a deterministic approach to determine the integrity of the pipeline based
on limit state design (LSD), SAFEBUCK (2011) also uses probabilistic methods to provide confidence
levels for planned and unplanned buckles (Bruton et al., 2005). The VAS depends on the distance
between buckles; the shorter the distance, the shorter the VAS. This implies that the distance between
triggers should be short. However, the likelihood of a buckle forming at a trigger decreases as the
distance between triggers decreases. A buckle may not form at some of the intended locations, and the
VAS of the buckles that do form will then be greater than intended. In other words, there is a limit to
how closely reliable buckles can be spaced and this practical limit must be incorporated in the overall
design. However, in early stages of the design, such as in conceptual studies or the pre-FEED phase,
OOS and PSI data is unavailable preventing a reliable solution being identified.
3
A novel method for controlling lateral buckling that uses pre-deformed pipeline was introduced by Chee
et al. (2018). This method could potentially save tens of millions of dollars in CAPEX for subsea pipeline
projects around the world. The pre-deformation approach also reduces the end expansion of the
pipeline, which is beneficial to the design of the end expansion spools and can reduce pipeline walking.
The method involves continuously pre-deforming the pipeline prior to and during installation causing a
significant reduction in axial stiffness and therefore significantly raising the buckle initiation load. The
increase in length of a pre-deformed pipeline compare to a straight pipeline is less than 0.1%, so the
increase in material cost is insignificant.
The feasibility from a practical point of view has been studied by Vermeulen (1995) and pre-deformed
pipeline has been successfully installed in the past for controlling upheaval buckling (Lanan and Barry,
1992). However, this method of continuously pre-deforming pipeline has not been verified as being
suitable for controlling lateral buckling at high temperatures.
The theory and basic description of this method was outlined in (Chee et al., 2018) and will not be
repeated here. It is the objective of this paper to present the effect on the buckling performance of a
pre-deformed pipeline of two of the key uncertain design variabilities: the as-laid out-of-straightness and
the lateral pipe-soil interaction (i.e. seabed friction).
2. Out-of-Straightness (OOS)
Buckle formation is an imperfection-sensitive process; it is intimately linked to the initial condition of the
pipeline – the out-of-straightness (OOS). The lack of straightness commonly occurs due to seabed
undulations and imperfect laying conditions, i.e. vessel motions and hydrodynamic forces during laying.
The buckling response of a pipeline will always be inherently uncertain because pipeline-specific OOS
information is not known prior to pipe lay. Early studies by Hobbs (Hobbs, 1981; Hobbs, 1984) proposed
analytical solutions for four classical modes of lateral buckling, assuming an idealised straight beam.
However, Taylor and Gan (1986) derived more rationalised analytical solutions to lateral buckling
incorporating imperfections into Mode 1 and 2 of the Hobbs analytical solutions. The authors
categorized the pipeline imperfection by high, medium and low ratios of amplitude (ωo) over the length
of imperfection (Lo) (Taylor and Gan, 1986). For imperfections at a low ratio of ωo/Lo, snap buckling is
the predominant phenomenon for these pipelines and the temperature where snap buckling occurs

4
decreases with the ratio ωo/Lo. Yielding might occur during the snap buckling process, therefore, it is
potentially risky to allow pipeline to undergo snap buckling. For high ratios of imperfection ωo/Lo, a stable
path of lateral buckling occurs, and the buckle initiation temperature is irrelevant. The authors therefore
used ‘permissible temperature’, which is defined as the temperature where first yielding occurs. The
‘permissible temperature’ for pipeline with imperfections in the high ratio of ωo/Lo category, the higher
is the ratio of ωo/Lo, the higher is the ‘permissible temperature’.
Recent studies by Hong et al. (2015) and Wang et al. (2017) reported that with small imperfections, the
snap-buckling process is intense and dynamic while for bigger imperfections, the compressive force
decreases slowly after the critical buckling point. They also note that the size of the imperfection affects
the critical buckling force but has little influence on the post buckle force and final buckle displacement
(Hong et al., 2015; Wang et al., 2017).
3. Pipe-Soil Interaction (PSI)
For subsea pipelines laid exposed on the seabed, it is now recognized that the classical linear Coulomb
friction or a Winkler model with a constant spring stiffness are both inadequate to model the lateral pipe-
soil interaction. This is mainly because of the pipeline embedment created by the dynamic laying
process. As the pipe moves laterally, it breaks out from the seabed, rising upwards and pushing soil
ahead, resulting in a complex lateral friction response. The initial pipe penetration is affected by the soil
properties and also the installation conditions, such as the vessel motion – which are difficult to predict
in advance (Westgate et al. 2010).
A slightly more sophisticated model for pipe-soil interaction is to use a bi-linear model where ‘spring-
slider’ elements at intervals along the pipeline have an elastic perfectly plastic response in the axial and
lateral directions, as shown in Fig. 1 (a). The limiting horizontal and axial resistance force on the pipeline
are expressed as a multiple of the pipeline weight, giving a ‘frictional’ behaviour, and are estimated from
the soil strength properties (White et al. 2017).
It is common for pipeline to sweep across the seabed by 10 to 20 diameters in a lateral buckle (Bruton
et al., 2007). The soil in contact with the pipeline is heavily remoulded and a berm of soil may build-up
in front of the pipe, and consolidation effects may change the strength of the soil after disturbance.
These effects mean that the lateral friction is subject to significant uncertainty and may vary through

5
cycles of buckling, as shown by studies performed as part of SAFEBUCK JIP (Bruton et al., 2006;
Bruton et al., 2007; Bruton et al., 2008; Cheuk et al., 2007; White and Cheuk, 2008).
For this study, a suitable simple soil response model is the trilinear model as shown in Fig. 1 (b). The
tri-linear model captures the potential softening of the lateral response as the pipe moves from the as-
laid position, and includes independent values of breakout friction, Hbo/V and residual resistance Hres/V.
This ‘equivalent’ friction coefficient is defined as the soil resistance (H) divided by the unit vertical load
of the pipe (V), as is usual practice in pipeline design (Bruton et al., 2007; Bruton et al., 2008; DNV,
2017). This terminology should not, however, be taken to indicate that lateral pipe behaviour is purely
frictional; the limiting lateral and axial resistance is not solely dependent on the pipe weight, but is
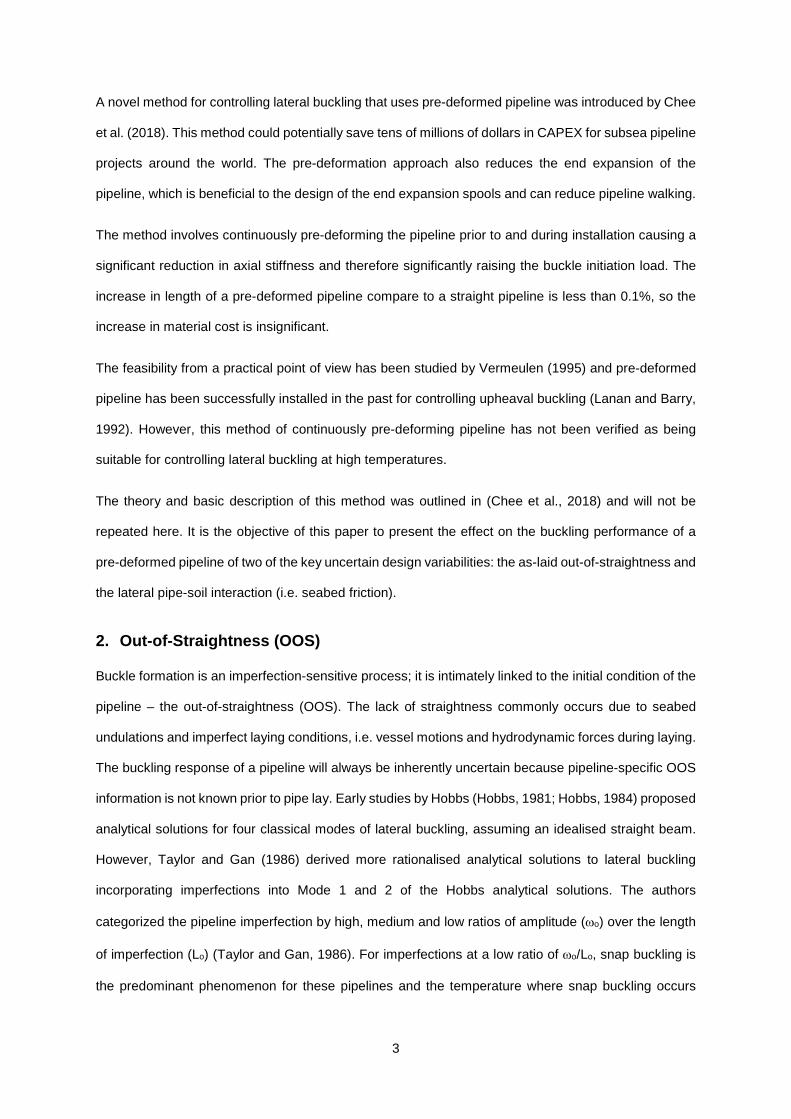
significantly influenced by the embedment and soil conditions (Bruton et al., 2008). The axial and lateral
PSI responses are uncoupled, i.e. they are independent of one another as shown in the rectangular
sliding failure surface as shown in Fig. 2 .
(a) Bi-Linear (b) Tri-linear
Fig. 1. Pipe/Soil Interaction Models
The complexity of pipe-soil modelling and the debate whether the simple tri-linear model is sufficient
compare to a 3D continuum model to capture the behaviour of subsea pipeline on seabed is not a topic
to be discussed here. Other papers illustrate the influence of the additional effects captured by these
models (e.g. Konuk and Yu, 2007; Yu and Konuk, 2007; Wang et al. 2010, Martin et al 2013), but the
required computational methods are not suited to practical design.
6
Fig. 2. Failure Surface for PSI
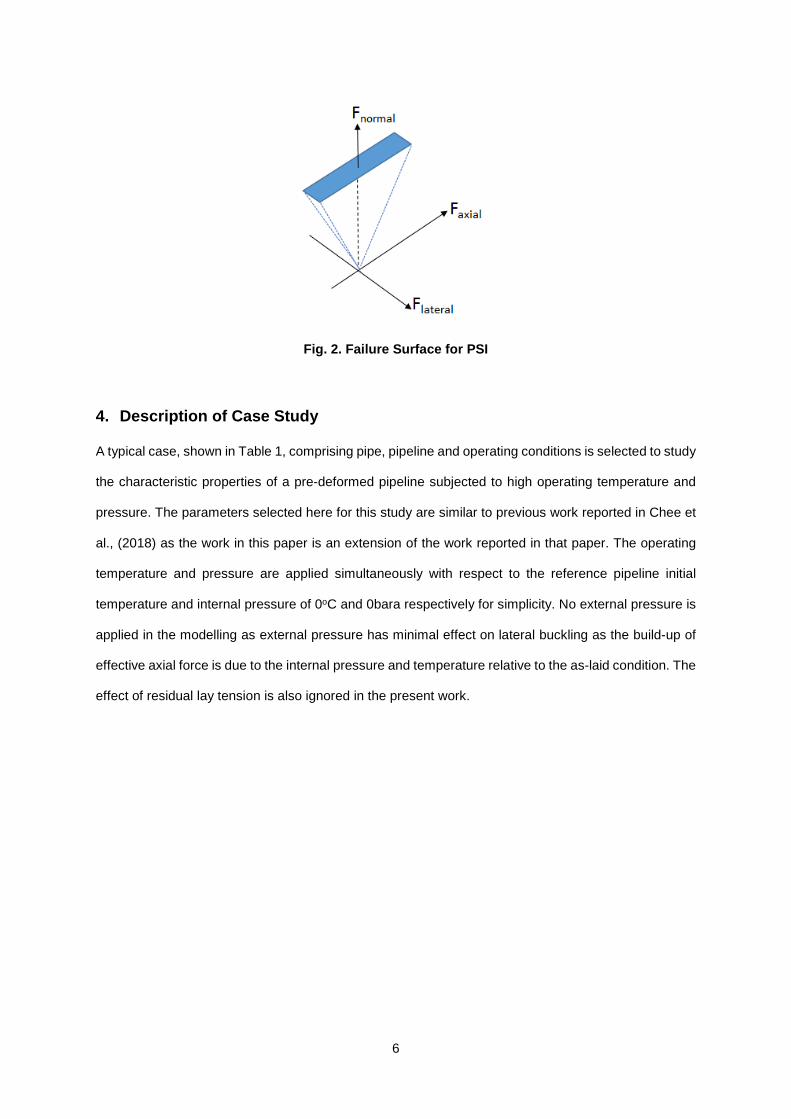
4. Description of Case Study
A typical case, shown in Table 1, comprising pipe, pipeline and operating conditions is selected to study
the characteristic properties of a pre-deformed pipeline subjected to high operating temperature and
pressure. The parameters selected here for this study are similar to previous work reported in Chee et
al., (2018) as the work in this paper is an extension of the work reported in that paper. The operating
temperature and pressure are applied simultaneously with respect to the reference pipeline initial
temperature and internal pressure of 0oC and 0bara respectively for simplicity. No external pressure is
applied in the modelling as external pressure has minimal effect on lateral buckling as the build-up of
effective axial force is due to the internal pressure and temperature relative to the as-laid condition. The
effect of residual lay tension is also ignored in the present work.

7
Table 1 Modelling Parameters
Parameters Unit Value
Pipe Outer Diameter (OD) m 0.3556
Pipe Wall Thickness (WT) mm 19.8
Pipe Submerged Weight, Ws N/m 610
Pipeline Total Length, LT km 4.8 and 9.6
Maximum Operating Temperature, Top oC 200
Ambient Temperature, Tamb oC 0
Maximum Operating Pressure, Pop bar 200
Pipeline Material Young’s Modulus, E GPa 205
Coefficient of Thermal Expansion, α 1/oC 1.3 x 10⁻⁵
Pipe-Soil Lateral Breakout Friction, µl,bo - varies
Lateral Breakout Mobilisation Distance, δl,bo mm 30
Pipe-Soil Lateral Residual Friction, µl - varies
Lateral Residual Mobilisation Distance δl mm 150
Pipe-Soil Axial Friction, µa - varies
Axial Mobilisation Distance, δa mm 1.5
Material Yield Strength MPa 450 Material Tensile Strength MPa 560
Material Young’s Modulus of Elasticity GPa 205
The pipe carbon-steel material is assumed to have a material stress-strain curve as shown in Fig. 3
similar to the material property used in Chee et al., (2018). The material stress-strain curve is generated
using the Ramberg-Osgood relationship with the material yield strength, tensile strength and Young’s
Modulus of Elasticity as presented in Table 1. All relevant parameters from Table 1 and stress-strain
characteristic from Fig. 3 are assumed to be invariant with temperature.

8
Fig. 3. Typical Stress-Strain Curve for Pipeline Carbon-Steel Material
The pipeline is continuously pre-deformed in wave-like shapes of 48.8m wavelength that are defined
by the sinusoidal function given in Eq. (1) as shown in Fig. 4 for a 4.8km pre-deformed pipeline, in which
all lobes are have an amplitude of exactly ωo, = 0.71m (i.e. 2 x OD of the pipeline). This pre-deformation
is equivalent to a maximum bending strain of 0.1% at the apex of the lobe which remains in the elastic
range (Fig. 4).
𝜔𝜔 =𝜔𝜔0
2�𝑠𝑠𝑠𝑠𝑠𝑠 �
2𝜋𝜋𝜋𝜋𝐿𝐿𝑤𝑤
�� (1)
where
ω = lateral position along the pipeline relative to the straight configuration
x = axial position along the pipeline
Lw = wavelength
ωo = maximum lateral amplitude along the pipeline (at Lw/2)

9
Fig. 4. Initial Shape of a ‘Perfect’ Pre-deformed pipeline
The pre-deformed pipeline shown in Fig. 4 is an ‘ideal’ shape of a ‘perfect’ pre-deformed pipeline. As
mentioned, imperfections or out-of-straightness always occurs. Initial imperfections were simulated into
the ‘perfect’ pre-deformed pipeline model by imposing a variation of lateral amplitude, assumed to occur
at the peak of each lobe along the PDP up to a certain tolerance, representing the out-of-straightness
due to uncertainty in the laying and/or the process of pre-deformation prior to installation. The ‘imperfect’
lobe maximum magnitude, ωo, within the assumed tolerances, is applied randomly to individual lobes.
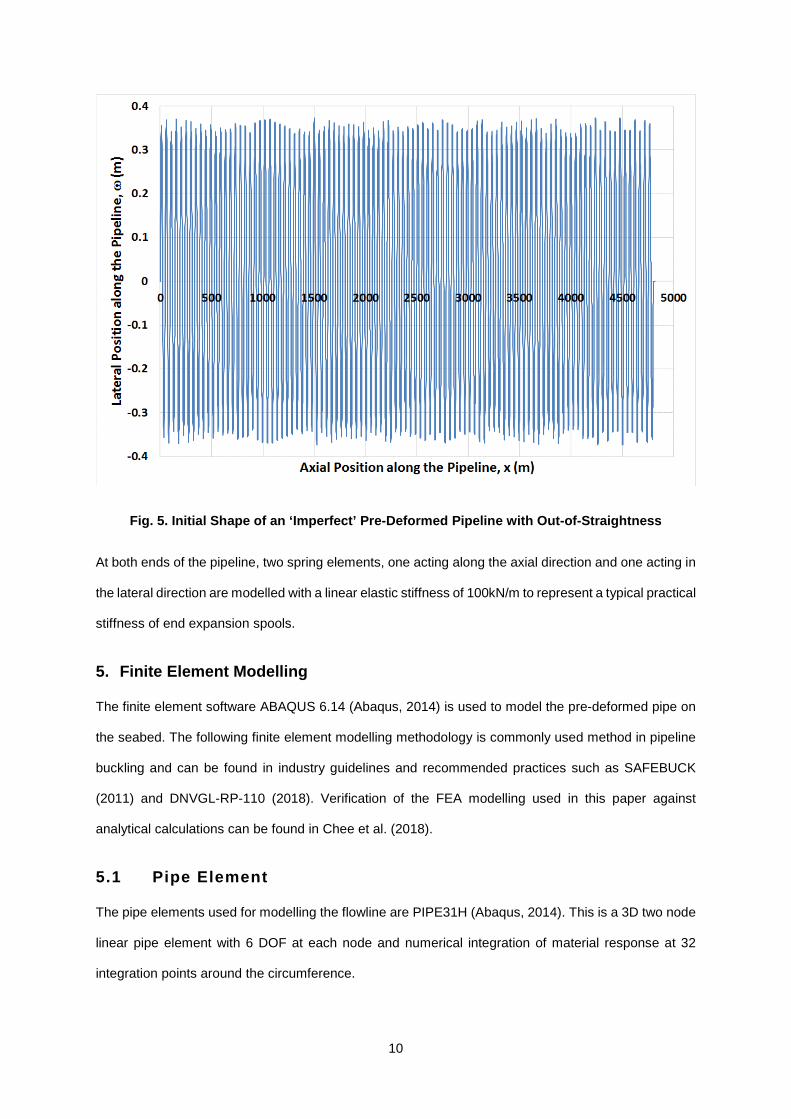
Fig. 5 presents an example of the PDP with out-of-straightness of a maximum variation of +/-10% of
the pipeline outer diameter applied at the peak of each lobe of the PDP pipeline.
The term ‘out-of-straightness’ (OOS) in this paper refers to the imperfectness of the pre-deformed
pipeline and not the deformation relative to a ‘straight’ pipeline (with no initial pre-deformation). Also,
the pre-deformed geometry is created ignoring the history of the residual strain from pre-deformation.
This assumption is acceptable due to the low level of strain from the initial deformation (~0.1%) because
studies have shown that residual strain has little effect on buckling of thin shell cylinders such as pipeline
(Le Grognec et al., 2009; Taby et al., 2014).
10
Fig. 5. Initial Shape of an ‘Imperfect’ Pre-Deformed Pipeline with Out-of-Straightness
At both ends of the pipeline, two spring elements, one acting along the axial direction and one acting in
the lateral direction are modelled with a linear elastic stiffness of 100kN/m to represent a typical practical
stiffness of end expansion spools.
5. Finite Element Modelling
The finite element software ABAQUS 6.14 (Abaqus, 2014) is used to model the pre-deformed pipe on
the seabed. The following finite element modelling methodology is commonly used method in pipeline
buckling and can be found in industry guidelines and recommended practices such as SAFEBUCK
(2011) and DNVGL-RP-110 (2018). Verification of the FEA modelling used in this paper against
analytical calculations can be found in Chee et al. (2018).
5.1 Pipe Element
The pipe elements used for modelling the flowline are PIPE31H (Abaqus, 2014). This is a 3D two node
linear pipe element with 6 DOF at each node and numerical integration of material response at 32
integration points around the circumference.

11
5.2 PSI and Seabed Modelling
In all the example FEA calculations, the seabed is modelled as a flat horizontal rigid surface. Contact
pairs are used to model the interaction between the flowline and the seabed surface. The ABAQUS
user subroutine FRIC (Abaqus, 2014) is used to capture the effect of independent axial and lateral
components of the contact surface as shown in Fig. 2. The subroutine is also necessary to account for
a tri-linear lateral resistance behaviour for the pipeline during first start-up, which is shown in Fig. 1. The
mobilisation distances for the tri-linear model are given in Table 1, and different values of the axial and
lateral friction coefficients are used, as described later.
The adopted lateral and axial soil friction factors used in this paper are typical for soft clay seabed
conditions, and include the effect of vertical embedment of the pipeline. This assumption is consistent
with the use of a rigid seabed, which means there is no penetration of the pipe into the seabed during
the analysis.
5.3 Loading
The submerged weight of the pipeline is simulated by applying a uniform distributed weight on the pipe
element. No external pressure is applied. The initial temperature is assumed to be 0oC. Internal
pressure of the pipeline prior to operating is assumed to be 0bara. Operating temperature and pressure
are simultaneously applied in constant increments.
6. Results and Discussion
6.1. Variation of OOS
Table 2 presents a summary of the cases analysed in this paper to determine the effect of out-of-
straightness on the pre-deformed pipeline response. All cases are modelled with an initial pre-deformed
shape that follows a sinusoidal wave function with a prescribed wavelength, Lw = 48m (approximately
4 pipe joints) and ‘perfect’ amplitude, ωo = 2 x Outer Diameter of the Pipe (2D), i.e. 0.71m.
To simulate practical variations during the pre-deformation process, a random variation of each lobe’s
peak amplitude, ωo of +/- 10% of the Outer Diameter, i.e. 0.036m (Case 1, 2, 4) and ωo of +/- 20% of
Outer Diameter, i.e. 0.072m (Case 3) is modelled. The amplitude of successive lobes varies randomly
within these ranges.

12
Table 2. Analysis Cases
Case No. Description Axial Friction Coefficient, µa
Lateral Breakout Friction
Coefficient, µl,bo
Lateral Residual Friction
Coefficient, µl
1a to 1e 4.8km of Pre-Deformed Pipeline with 5 Different
Random OOS Distributions of +/- 10%OD
0.5 1.0 0.5
2a to 2e 9.6km of Pre-Deformed Pipeline with 5 Different
Random OOS Distributions of +/- 10%OD
3a to 3e
4.8km of Pre-Deformed Pipeline with 5 Different
Random OOS Distributions of +/- 20%OD
4a and 4b
4.8km of Pre-Deformed Pipeline with Route Bends
4a: two route bends 4b: three route bends
The assumed random out-of-straightness and lateral residual friction model is of continuous uniform
distribution given by the probability density function f(x) as shown in Eq. (2).
𝑓𝑓(𝜋𝜋) = � 1
𝛽𝛽 − 𝛼𝛼 𝑓𝑓𝑓𝑓𝑓𝑓 α < x < β
0 𝑓𝑓𝑓𝑓𝑓𝑓 𝜋𝜋 < α and x > β
(2)
where
α= lower bound
β=upper bound
6.1.1. 4.8km Pre-Deformed Pipeline with +/-10%OD Random Out-of-Straightness (Case 1a to 1e)
The out-of-straightness inherited by the as-laid pipeline comes from the pipe-laying process and in the
case of the pre-deformed pipeline, comes from the tolerances of pre-deformation process. Although
these levels of out-of-straightness can be controlled within a certain tolerance, they will have a varying
distribution of along the pipeline, which we have modelled as random.
13
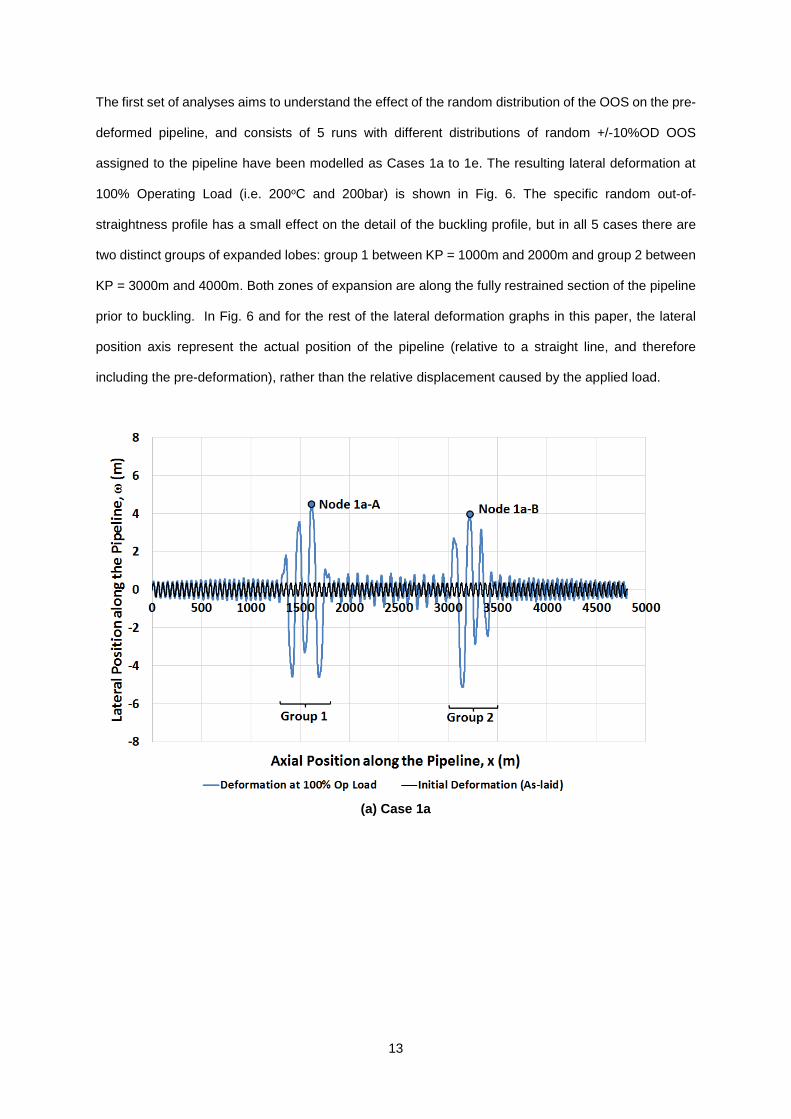
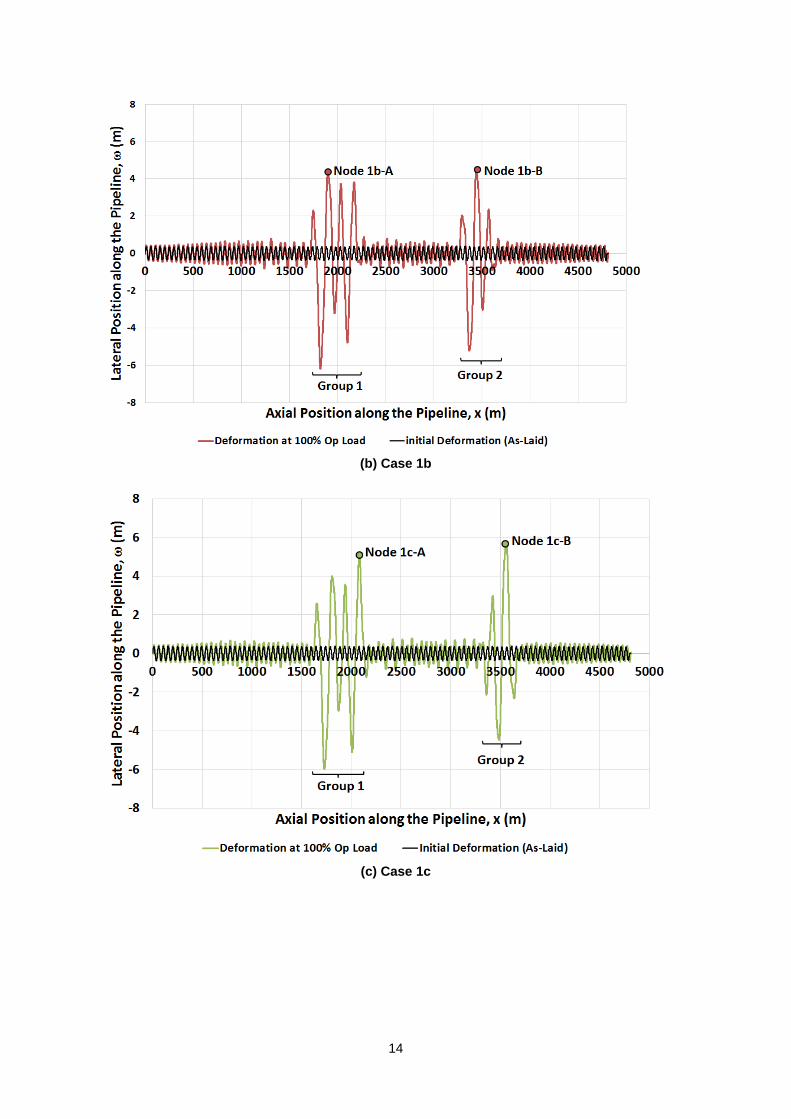
The first set of analyses aims to understand the effect of the random distribution of the OOS on the pre-
deformed pipeline, and consists of 5 runs with different distributions of random +/-10%OD OOS
assigned to the pipeline have been modelled as Cases 1a to 1e. The resulting lateral deformation at
100% Operating Load (i.e. 200oC and 200bar) is shown in Fig. 6. The specific random out-of-
straightness profile has a small effect on the detail of the buckling profile, but in all 5 cases there are
two distinct groups of expanded lobes: group 1 between KP = 1000m and 2000m and group 2 between
KP = 3000m and 4000m. Both zones of expansion are along the fully restrained section of the pipeline
prior to buckling. In Fig. 6 and for the rest of the lateral deformation graphs in this paper, the lateral
position axis represent the actual position of the pipeline (relative to a straight line, and therefore
including the pre-deformation), rather than the relative displacement caused by the applied load.
(a) Case 1a
14
(b) Case 1b
(c) Case 1c

15
(d) Case 1d
(e) Case 1e
Fig. 6. Lateral Deformation along the Pre-Deformed Pipeline with +/-10%OD OOS at 100%
Operating Load (Case 1a to 1e)
Although the expanded lobes can occur anywhere along the fully restrained section of the pipeline
depending on the distribution of the out-of-straightness magnitudes, the longitudinal strain at these
16
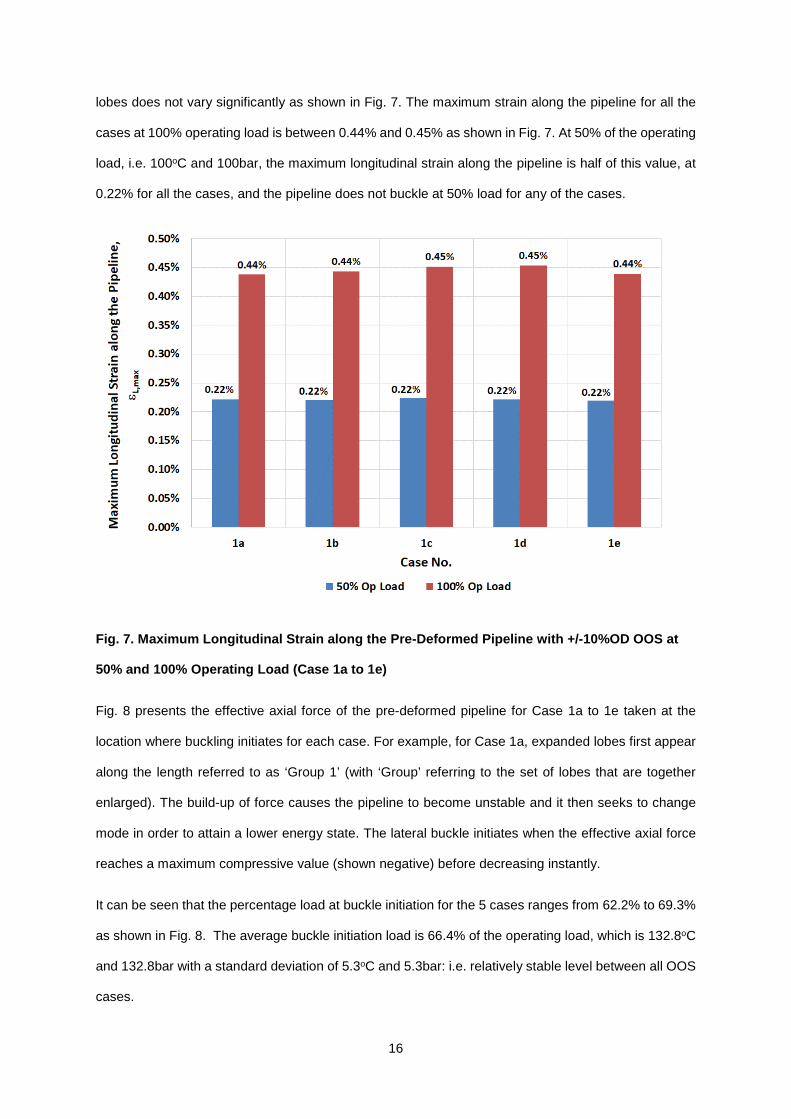
lobes does not vary significantly as shown in Fig. 7. The maximum strain along the pipeline for all the
cases at 100% operating load is between 0.44% and 0.45% as shown in Fig. 7. At 50% of the operating
load, i.e. 100oC and 100bar, the maximum longitudinal strain along the pipeline is half of this value, at
0.22% for all the cases, and the pipeline does not buckle at 50% load for any of the cases.
Fig. 7. Maximum Longitudinal Strain along the Pre-Deformed Pipeline with +/-10%OD OOS at
50% and 100% Operating Load (Case 1a to 1e)
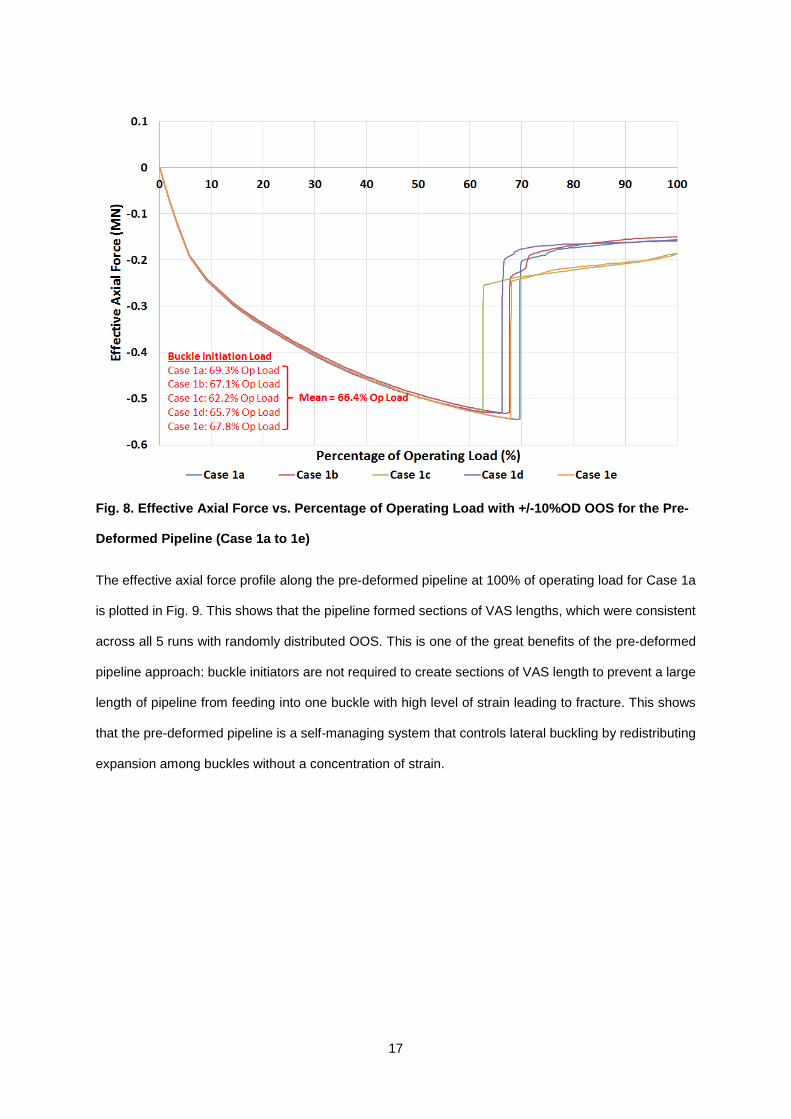
Fig. 8 presents the effective axial force of the pre-deformed pipeline for Case 1a to 1e taken at the
location where buckling initiates for each case. For example, for Case 1a, expanded lobes first appear
along the length referred to as ‘Group 1’ (with ‘Group’ referring to the set of lobes that are together
enlarged). The build-up of force causes the pipeline to become unstable and it then seeks to change
mode in order to attain a lower energy state. The lateral buckle initiates when the effective axial force
reaches a maximum compressive value (shown negative) before decreasing instantly.
It can be seen that the percentage load at buckle initiation for the 5 cases ranges from 62.2% to 69.3%
as shown in Fig. 8. The average buckle initiation load is 66.4% of the operating load, which is 132.8oC
and 132.8bar with a standard deviation of 5.3oC and 5.3bar: i.e. relatively stable level between all OOS
cases.
17
Fig. 8. Effective Axial Force vs. Percentage of Operating Load with +/-10%OD OOS for the Pre-
Deformed Pipeline (Case 1a to 1e)
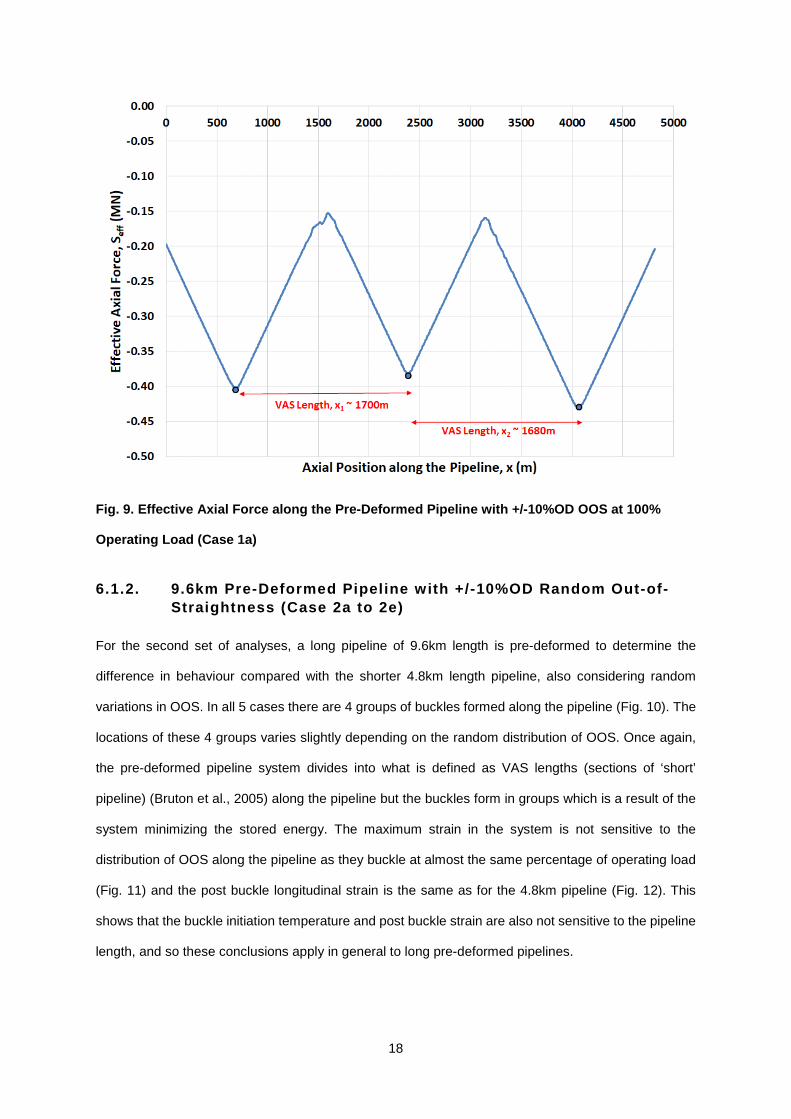
The effective axial force profile along the pre-deformed pipeline at 100% of operating load for Case 1a
is plotted in Fig. 9. This shows that the pipeline formed sections of VAS lengths, which were consistent
across all 5 runs with randomly distributed OOS. This is one of the great benefits of the pre-deformed
pipeline approach: buckle initiators are not required to create sections of VAS length to prevent a large
length of pipeline from feeding into one buckle with high level of strain leading to fracture. This shows
that the pre-deformed pipeline is a self-managing system that controls lateral buckling by redistributing
expansion among buckles without a concentration of strain.
18
Fig. 9. Effective Axial Force along the Pre-Deformed Pipeline with +/-10%OD OOS at 100%
Operating Load (Case 1a)
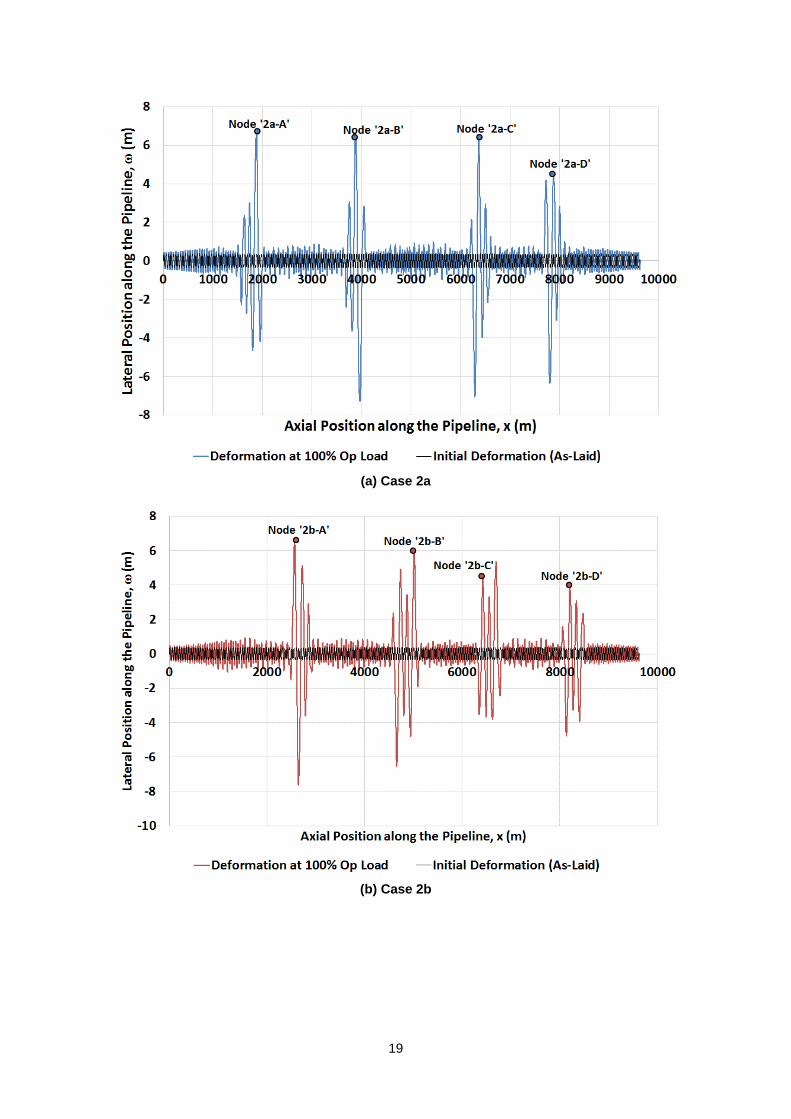
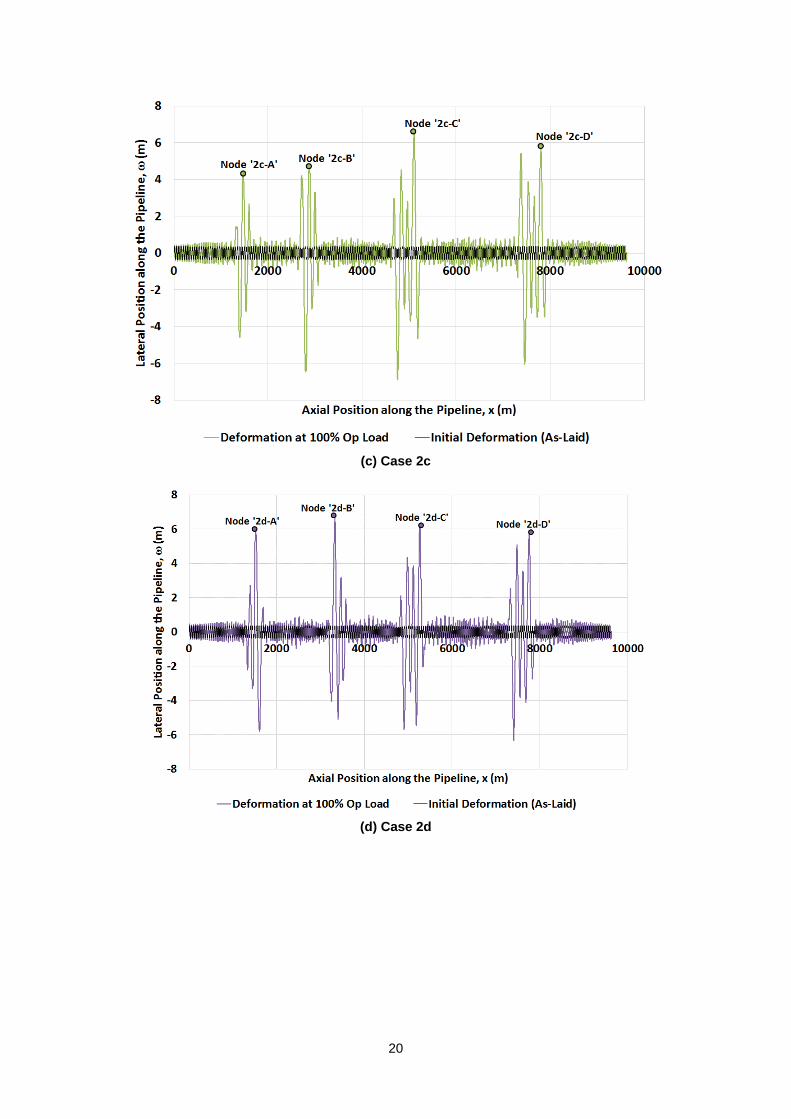
6.1.2. 9.6km Pre-Deformed Pipeline with +/-10%OD Random Out-of-Straightness (Case 2a to 2e)
For the second set of analyses, a long pipeline of 9.6km length is pre-deformed to determine the
difference in behaviour compared with the shorter 4.8km length pipeline, also considering random
variations in OOS. In all 5 cases there are 4 groups of buckles formed along the pipeline (Fig. 10). The
locations of these 4 groups varies slightly depending on the random distribution of OOS. Once again,
the pre-deformed pipeline system divides into what is defined as VAS lengths (sections of ‘short’
pipeline) (Bruton et al., 2005) along the pipeline but the buckles form in groups which is a result of the
system minimizing the stored energy. The maximum strain in the system is not sensitive to the
distribution of OOS along the pipeline as they buckle at almost the same percentage of operating load
(Fig. 11) and the post buckle longitudinal strain is the same as for the 4.8km pipeline (Fig. 12). This
shows that the buckle initiation temperature and post buckle strain are also not sensitive to the pipeline
length, and so these conclusions apply in general to long pre-deformed pipelines.
19
(a) Case 2a
(b) Case 2b
20
(c) Case 2c
(d) Case 2d

21
(e) Case 2e
Fig. 10. Lateral Deformation along the 9.6km Pre-Deformed Pipeline with +/-10%OD OOS at
100% Operating Load (Case 2a to 2e)
Fig. 11. Effective Axial Force vs. Percentage of Operating Load with +/-10%OD OOS for the
9.6km Pre-Deformed Pipeline (Case 2a to 2e)
22
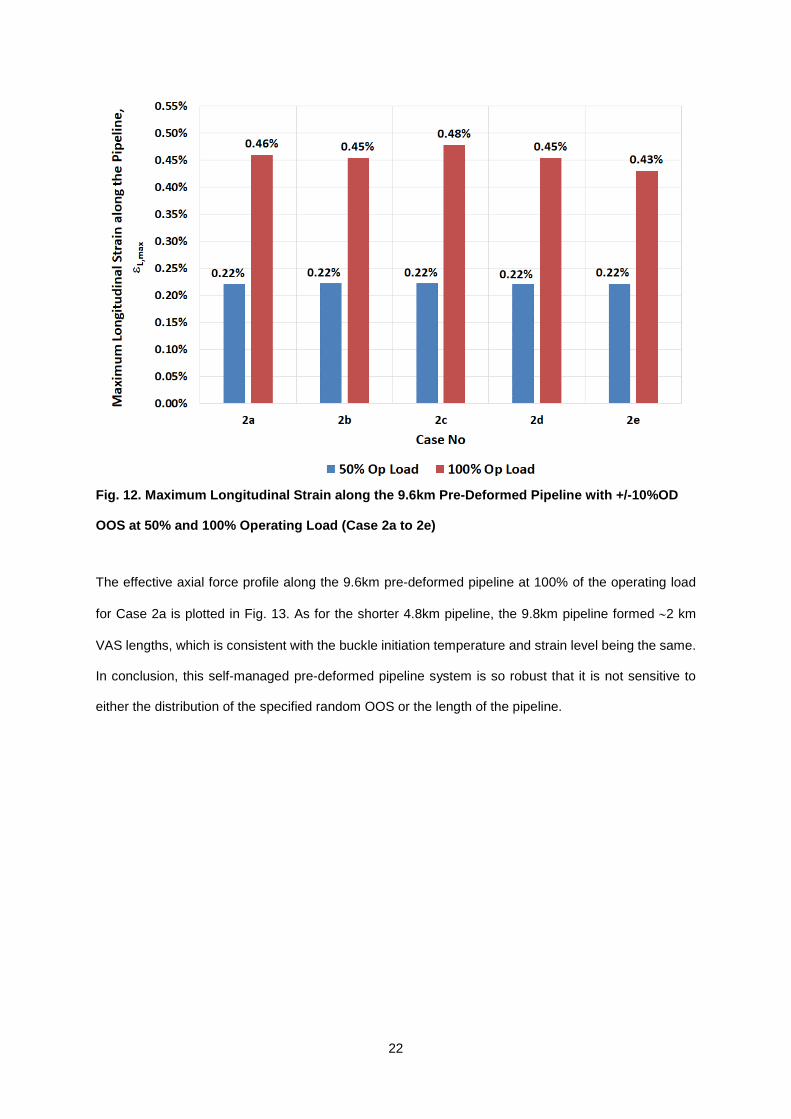
Fig. 12. Maximum Longitudinal Strain along the 9.6km Pre-Deformed Pipeline with +/-10%OD
OOS at 50% and 100% Operating Load (Case 2a to 2e)
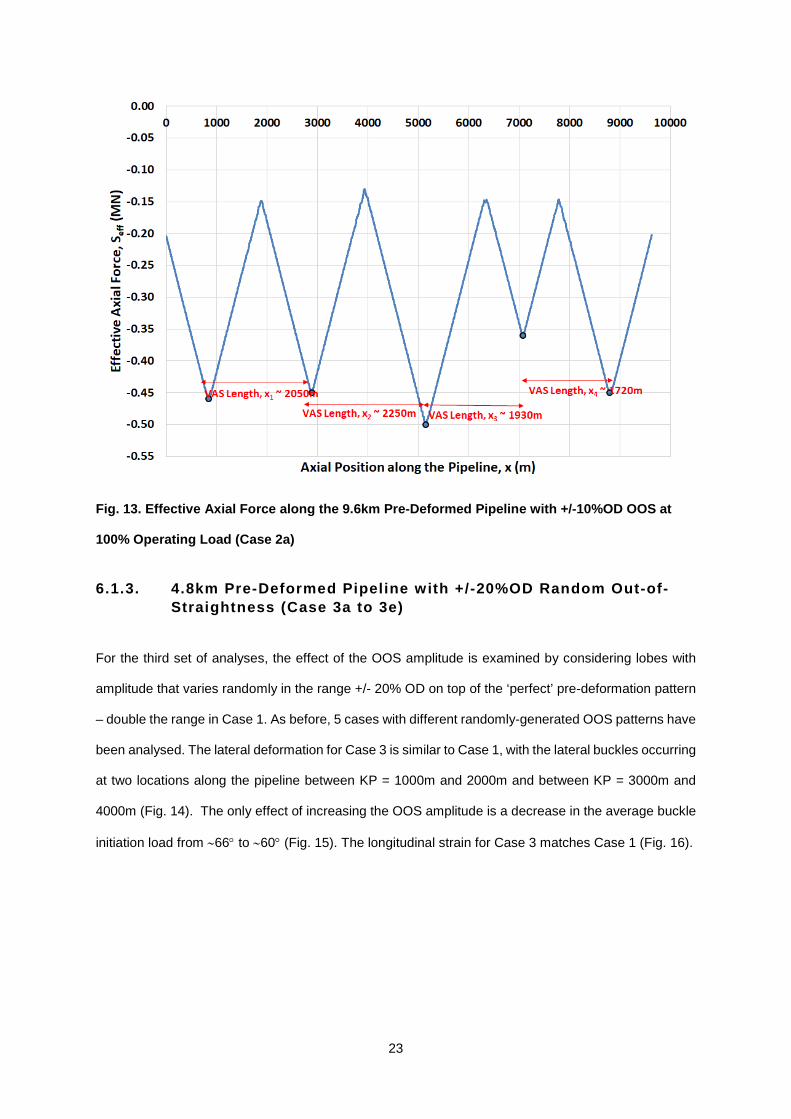
The effective axial force profile along the 9.6km pre-deformed pipeline at 100% of the operating load
for Case 2a is plotted in Fig. 13. As for the shorter 4.8km pipeline, the 9.8km pipeline formed ∼2 km
VAS lengths, which is consistent with the buckle initiation temperature and strain level being the same.
In conclusion, this self-managed pre-deformed pipeline system is so robust that it is not sensitive to
either the distribution of the specified random OOS or the length of the pipeline.
23
Fig. 13. Effective Axial Force along the 9.6km Pre-Deformed Pipeline with +/-10%OD OOS at
100% Operating Load (Case 2a)
6.1.3. 4.8km Pre-Deformed Pipeline with +/-20%OD Random Out-of-Straightness (Case 3a to 3e)
For the third set of analyses, the effect of the OOS amplitude is examined by considering lobes with
amplitude that varies randomly in the range +/- 20% OD on top of the ‘perfect’ pre-deformation pattern
– double the range in Case 1. As before, 5 cases with different randomly-generated OOS patterns have
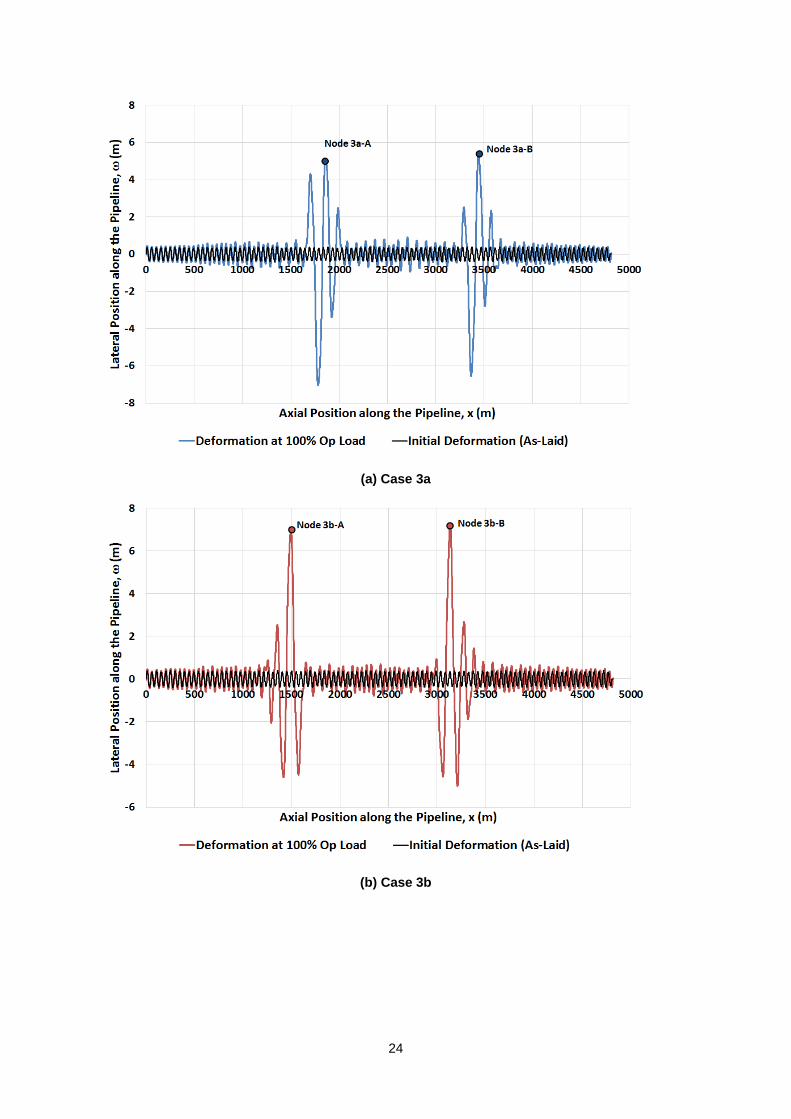
been analysed. The lateral deformation for Case 3 is similar to Case 1, with the lateral buckles occurring
at two locations along the pipeline between KP = 1000m and 2000m and between KP = 3000m and
4000m (Fig. 14). The only effect of increasing the OOS amplitude is a decrease in the average buckle
initiation load from ∼66° to ∼60° (Fig. 15). The longitudinal strain for Case 3 matches Case 1 (Fig. 16).
24
(a) Case 3a
(b) Case 3b

25
(c) Case 3c
(d) Case 3d

26
(e) Case 3e
Fig. 14. Lateral Deformation along the 4.8km Pre-Deformed Pipeline with +/-20%OD OOS at
100% Operating Load (Case 3a to 3e)
Fig. 15. Effective Axial Force vs. Percentage of Operating Load with +/-20%OD OOS for the
4.8km Pre-Deformed Pipeline (Case 3a to 3e)
27
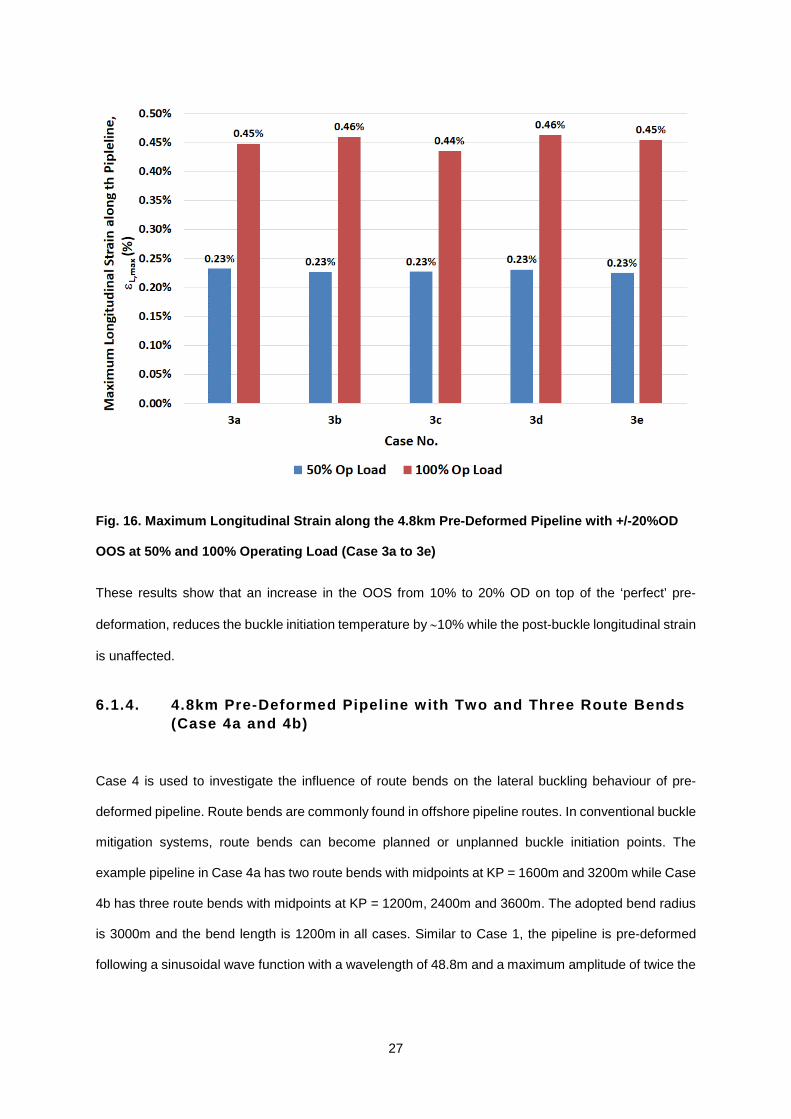
Fig. 16. Maximum Longitudinal Strain along the 4.8km Pre-Deformed Pipeline with +/-20%OD
OOS at 50% and 100% Operating Load (Case 3a to 3e)
These results show that an increase in the OOS from 10% to 20% OD on top of the ‘perfect’ pre-
deformation, reduces the buckle initiation temperature by ∼10% while the post-buckle longitudinal strain
is unaffected.
6.1.4. 4.8km Pre-Deformed Pipeline with Two and Three Route Bends (Case 4a and 4b)
Case 4 is used to investigate the influence of route bends on the lateral buckling behaviour of pre-
deformed pipeline. Route bends are commonly found in offshore pipeline routes. In conventional buckle
mitigation systems, route bends can become planned or unplanned buckle initiation points. The
example pipeline in Case 4a has two route bends with midpoints at KP = 1600m and 3200m while Case
4b has three route bends with midpoints at KP = 1200m, 2400m and 3600m. The adopted bend radius
is 3000m and the bend length is 1200m in all cases. Similar to Case 1, the pipeline is pre-deformed
following a sinusoidal wave function with a wavelength of 48.8m and a maximum amplitude of twice the

28
pipe outer diameter, i.e. 0.71m on each lobe, and there is a random out-of-straightness in the range +/-
10% OD.
Fig. 17 presents the example pipeline for Case 4a with two route bends. It can be seen that two groups
of buckles occurred. The Group 1 buckles occur between 1200m and 1800m and the Group 2 buckles
occur between 2600m and 3100m. These coincides with the location of the two route bends. The
maximum longitudinal strain of 0.47% at 100% operating load as shown in Fig. 18 is 4% higher than
the average for Case 1 of 0.45%.
Fig. 17. Lateral Deformation along the Pre-Deformed Pipeline with +/-10%OD OOS and Two
Route Bends at 100% of the Operating Load (Case 4a)

29
Fig. 18. Longitudinal Strain along the Pre-Deformed Pipeline with +/-10%OD OOS and Two
Route Bends at 100% of the Operating Load (Case 4a)
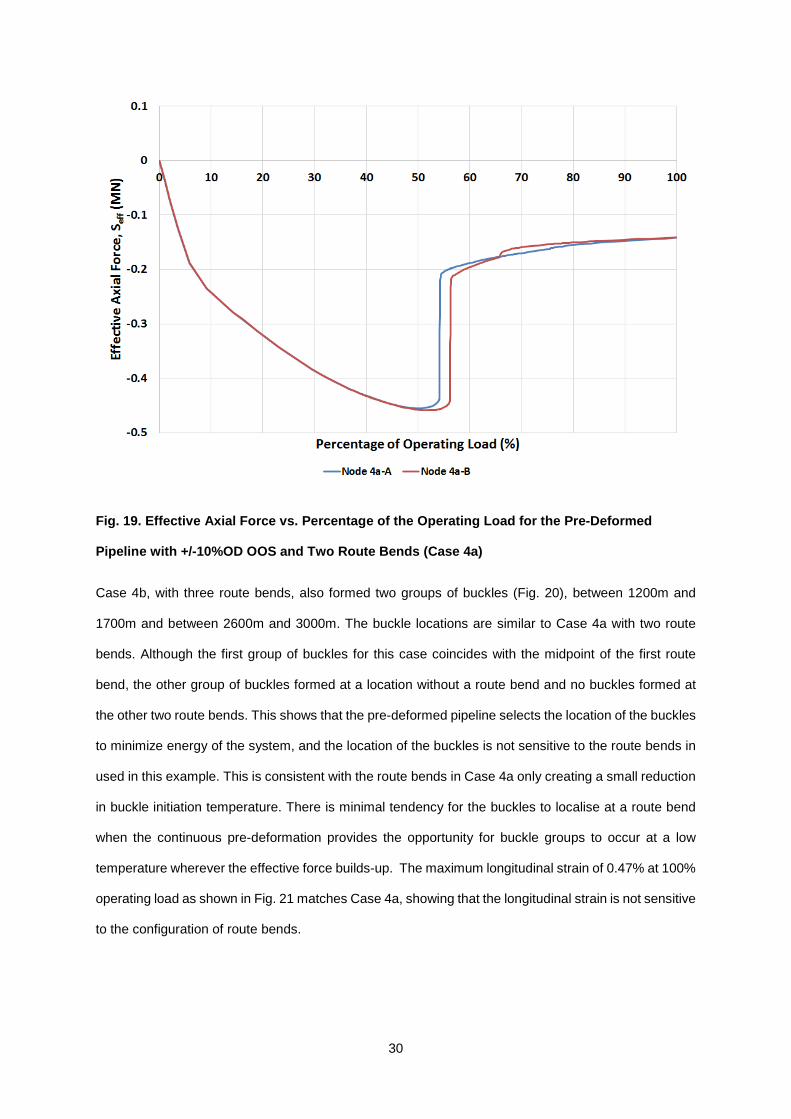
Fig. 19 presents the effective axial force located at Node ‘4a-A’ and Node ‘4a-B’, which lie at the centre
of each group of buckles (see Fig. 17). The buckle initiation temperature for Case 4a is 54.2% of the
operating load for Group 1 and 56.2% of the operating load for Group 2, which shows that the route
bends reduce the buckle initiation temperature relative to Case 1 (which buckled at 66.4% on average).
30
Fig. 19. Effective Axial Force vs. Percentage of the Operating Load for the Pre-Deformed
Pipeline with +/-10%OD OOS and Two Route Bends (Case 4a)
Case 4b, with three route bends, also formed two groups of buckles (Fig. 20), between 1200m and
1700m and between 2600m and 3000m. The buckle locations are similar to Case 4a with two route
bends. Although the first group of buckles for this case coincides with the midpoint of the first route
bend, the other group of buckles formed at a location without a route bend and no buckles formed at
the other two route bends. This shows that the pre-deformed pipeline selects the location of the buckles
to minimize energy of the system, and the location of the buckles is not sensitive to the route bends in
used in this example. This is consistent with the route bends in Case 4a only creating a small reduction
in buckle initiation temperature. There is minimal tendency for the buckles to localise at a route bend
when the continuous pre-deformation provides the opportunity for buckle groups to occur at a low
temperature wherever the effective force builds-up. The maximum longitudinal strain of 0.47% at 100%
operating load as shown in Fig. 21 matches Case 4a, showing that the longitudinal strain is not sensitive
to the configuration of route bends.

31
Fig. 20. Lateral Deformation along the Pre-Deformed Pipeline with +/-10%OD OOS and Three
Route Bends at 100% of the Operating Load (Case 4b)
Fig. 21. Longitudinal Strain along the Pre-Deformed Pipeline with +/-10%OD OOS and Three
Route Bends at 100% of the Operating Load (Case 4b)
32
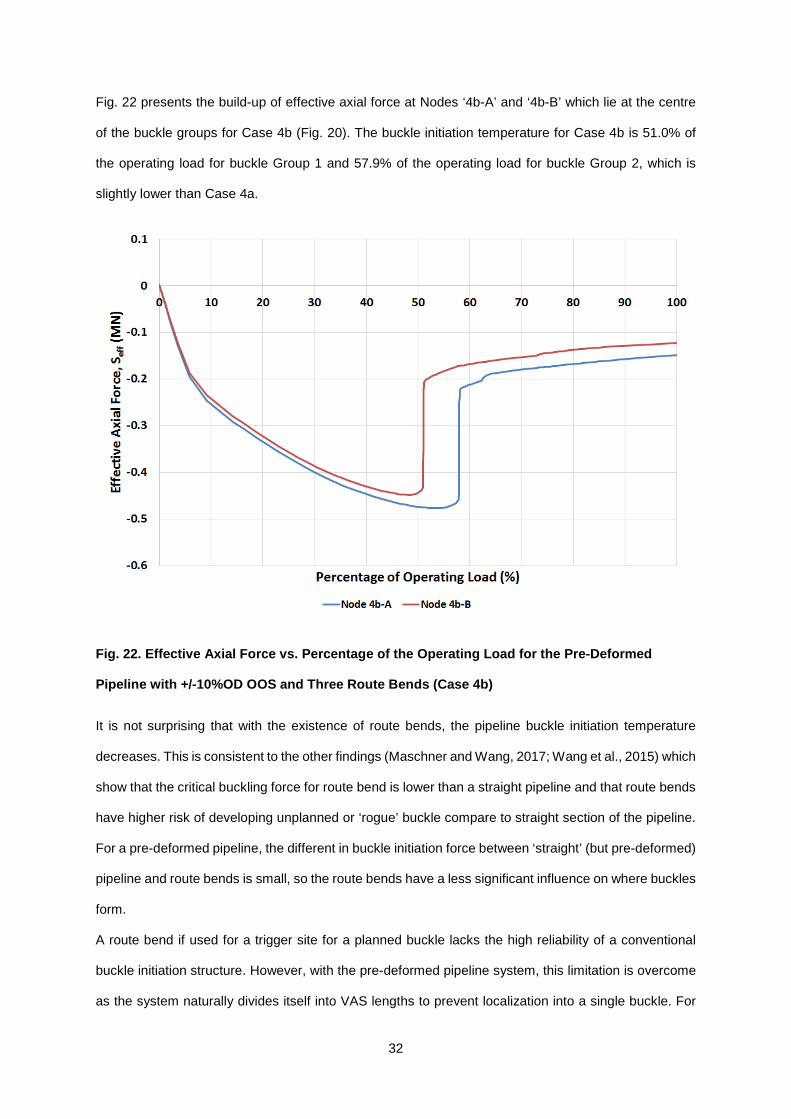
Fig. 22 presents the build-up of effective axial force at Nodes ‘4b-A’ and ‘4b-B’ which lie at the centre
of the buckle groups for Case 4b (Fig. 20). The buckle initiation temperature for Case 4b is 51.0% of
the operating load for buckle Group 1 and 57.9% of the operating load for buckle Group 2, which is
slightly lower than Case 4a.
Fig. 22. Effective Axial Force vs. Percentage of the Operating Load for the Pre-Deformed
Pipeline with +/-10%OD OOS and Three Route Bends (Case 4b)
It is not surprising that with the existence of route bends, the pipeline buckle initiation temperature
decreases. This is consistent to the other findings (Maschner and Wang, 2017; Wang et al., 2015) which
show that the critical buckling force for route bend is lower than a straight pipeline and that route bends
have higher risk of developing unplanned or ‘rogue’ buckle compare to straight section of the pipeline.
For a pre-deformed pipeline, the different in buckle initiation force between ‘straight’ (but pre-deformed)
pipeline and route bends is small, so the route bends have a less significant influence on where buckles
form.
A route bend if used for a trigger site for a planned buckle lacks the high reliability of a conventional
buckle initiation structure. However, with the pre-deformed pipeline system, this limitation is overcome
as the system naturally divides itself into VAS lengths to prevent localization into a single buckle. For
33
the example in this paper, the development into sections of VAS lengths is unaffected by the number
of route bends.
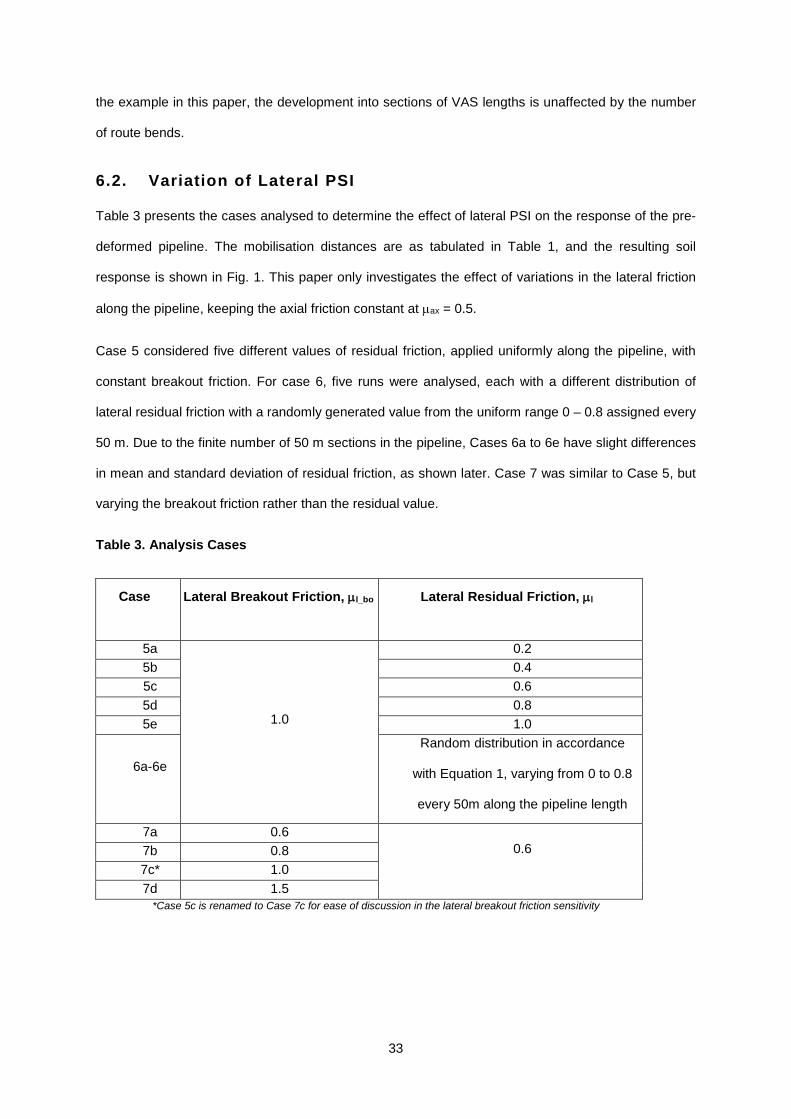
6.2. Variation of Lateral PSI
Table 3 presents the cases analysed to determine the effect of lateral PSI on the response of the pre-
deformed pipeline. The mobilisation distances are as tabulated in Table 1, and the resulting soil
response is shown in Fig. 1. This paper only investigates the effect of variations in the lateral friction
along the pipeline, keeping the axial friction constant at µax = 0.5.
Case 5 considered five different values of residual friction, applied uniformly along the pipeline, with
constant breakout friction. For case 6, five runs were analysed, each with a different distribution of
lateral residual friction with a randomly generated value from the uniform range 0 – 0.8 assigned every
50 m. Due to the finite number of 50 m sections in the pipeline, Cases 6a to 6e have slight differences
in mean and standard deviation of residual friction, as shown later. Case 7 was similar to Case 5, but
varying the breakout friction rather than the residual value.
Table 3. Analysis Cases
Case Lateral Breakout Friction, µl_bo Lateral Residual Friction, µl
5a
1.0
0.2 5b 0.4 5c 0.6 5d 0.8 5e 1.0
6a-6e
Random distribution in accordance
with Equation 1, varying from 0 to 0.8
every 50m along the pipeline length
7a 0.6 0.6 7b 0.8
7c* 1.0 7d 1.5
*Case 5c is renamed to Case 7c for ease of discussion in the lateral breakout friction sensitivity
34
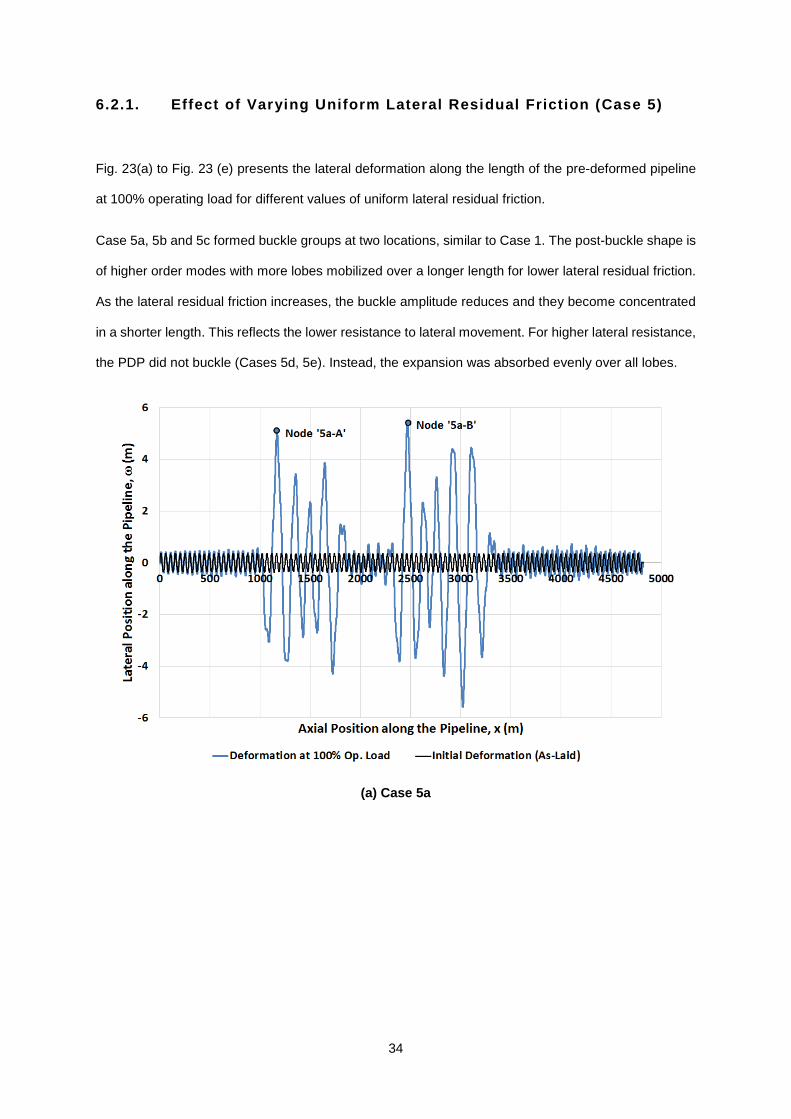
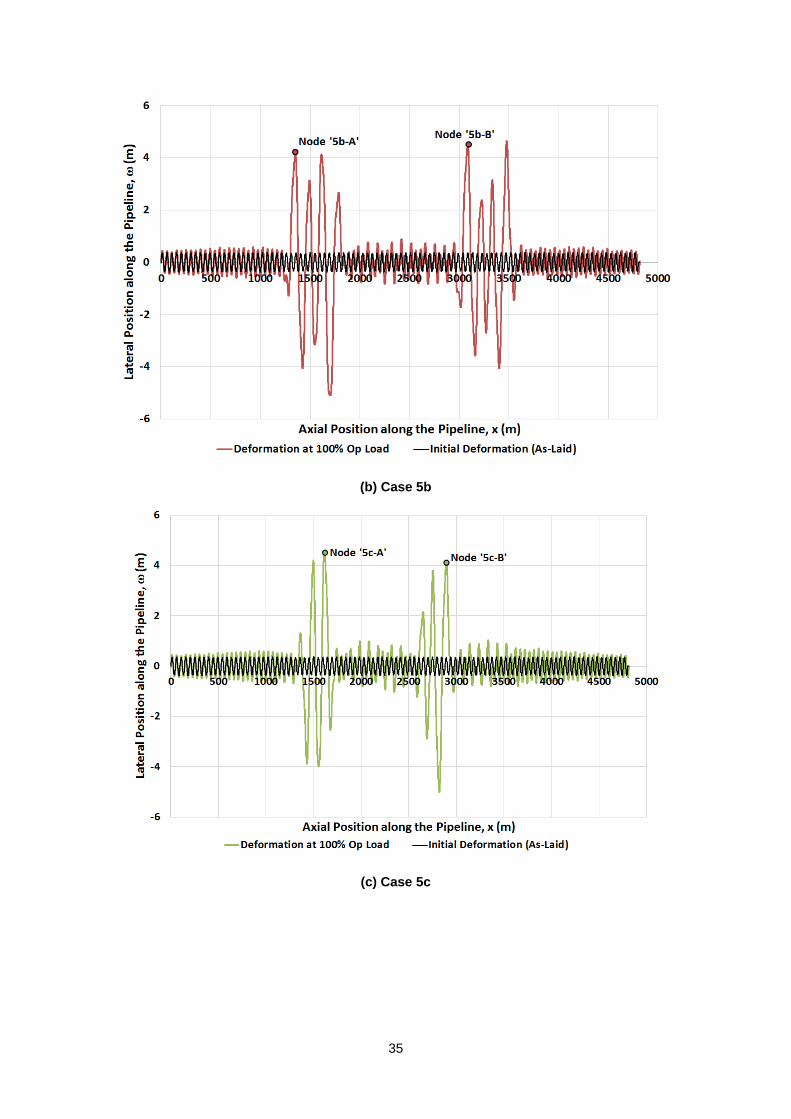
6.2.1. Effect of Varying Uniform Lateral Residual Friction (Case 5)
Fig. 23(a) to Fig. 23 (e) presents the lateral deformation along the length of the pre-deformed pipeline
at 100% operating load for different values of uniform lateral residual friction.
Case 5a, 5b and 5c formed buckle groups at two locations, similar to Case 1. The post-buckle shape is
of higher order modes with more lobes mobilized over a longer length for lower lateral residual friction.
As the lateral residual friction increases, the buckle amplitude reduces and they become concentrated
in a shorter length. This reflects the lower resistance to lateral movement. For higher lateral resistance,
the PDP did not buckle (Cases 5d, 5e). Instead, the expansion was absorbed evenly over all lobes.
(a) Case 5a
35
(b) Case 5b
(c) Case 5c

36
(d) Case 5d
(e) Case 5e
Fig. 23. Lateral Deformation at 100% Operating Load – Case 5a to 5e
The maximum longitudinal strain is 0.38% for µl = 0.2 and increases to 0.47% for µl = 0.6 before
decreasing to 0.43% for µl = 0.8 and 1.0 (Fig. 24): when more lobes are mobilised for load sharing the
strain is lower. The results are consistent with studies that have shown that the higher the lateral
37
resistance, the higher the bending stress of the buckle crown (Carr et al., 2004; Bruton et al., 2007; Haq
and Kenny, 2013).
The increased strain at µl = 0.6 is not excessive in comparison with a ‘straight’ pipeline as this load
sharing property among the lobes of the PDP minimizes the effect of the lateral resistance on the strain
of the buckles. This differs from a ‘straight’ pipeline, where the post-buckle strain increases significantly
with lateral residual friction: a separate analysis showed that for a straight pipeline with the same
properties, the post-buckle strain reached 0.67% for residual lateral friction of 1.0, which is 50% greater
than for a PDP (Case 5e).
Also, the longitudinal strain decreases for Case 5d and 5e because the pipeline does not buckle laterally
for µl = 0.8 and 1.0. Instead, for the PDP there is a ‘critical’ lateral residual friction above which the PDP
does not buckle at the applied operating temperature of 200oC. For a straight pipeline this critical
residual lateral friction was found to be 2.8 for the same operating temperature: this high lateral friction
can only be achieved when the pipe is trenched and/or buried.
For comparison, the maximum longitudinal strain along the pipeline at 50% operating load is also shown
in Fig. 24. At 50% operating load, i.e. temperature difference of 100oC and operating pressure of 100bar,
the conditions represent a more common operating condition of a subsea flowline. The maximum
longitudinal strain at 50% operating load is less than 0.25% for all cases of lateral residual friction. The
longitudinal strain for Case 5a with 0.2 is highest, by a small amount, as this pipeline has buckled prior
to reaching 50% operating load.

38
Fig. 24. Maximum Longitudinal Strain along the Pipeline at 50% and 100% Operating Load –
Case 5a to 5e
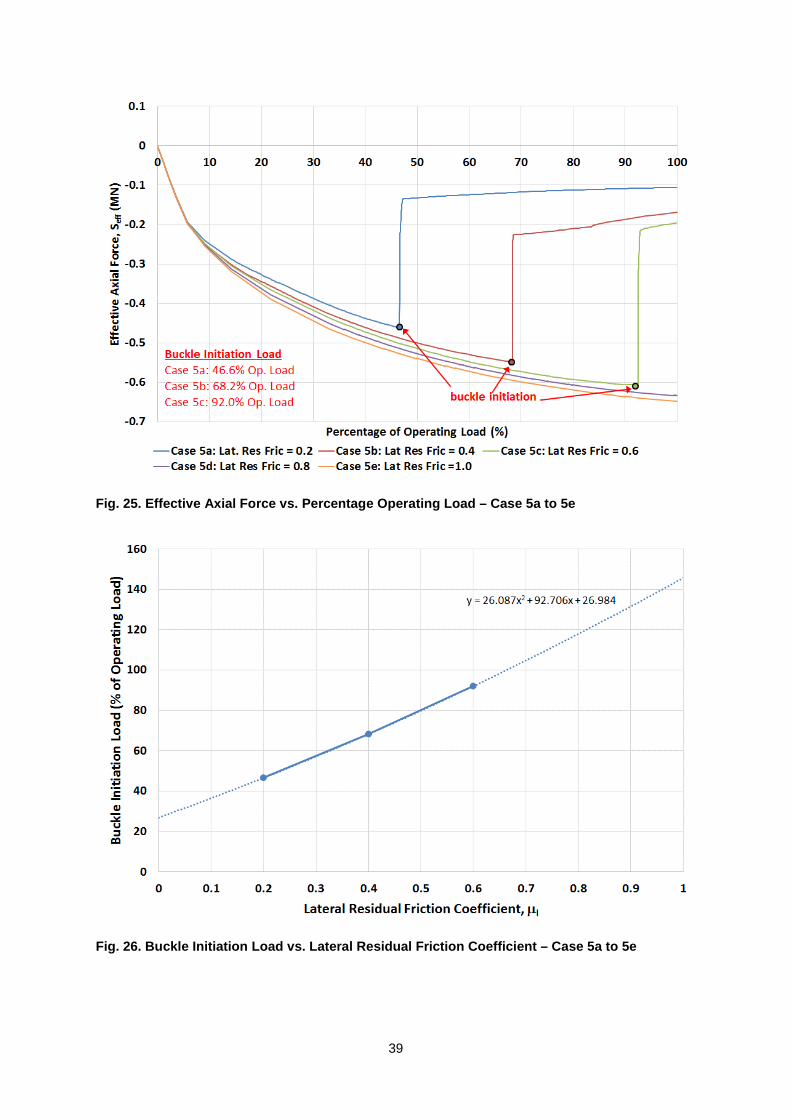
Node ‘A’ and Node ‘B’ in Fig. 23a-c are key locations within each buckle group. The build-up of effective
axial force at whichever of these points buckles first is presented in Fig. 25. Cases 5d and 5e, with
lateral friction of 0.8 and 1.0, do not buckle, so the axial force at a single selected node (Fig. 23d-e) is
shown in Fig. 25. All nodes within each buckle group initiate at the same operating load so the exact
choice of node does not affect the indicated buckle initiation load.
Fig. 26 compares the buckle initiation load for different values of lateral residual friction with a
polynomial trendline used to extrapolate to estimate when buckling will initiate for µl = 0.8 and 1.0, which
is estimated as temperatures of 235.7 oC and 291.6 oC respectively.
39
Fig. 25. Effective Axial Force vs. Percentage Operating Load – Case 5a to 5e
Fig. 26. Buckle Initiation Load vs. Lateral Residual Friction Coefficient – Case 5a to 5e
40
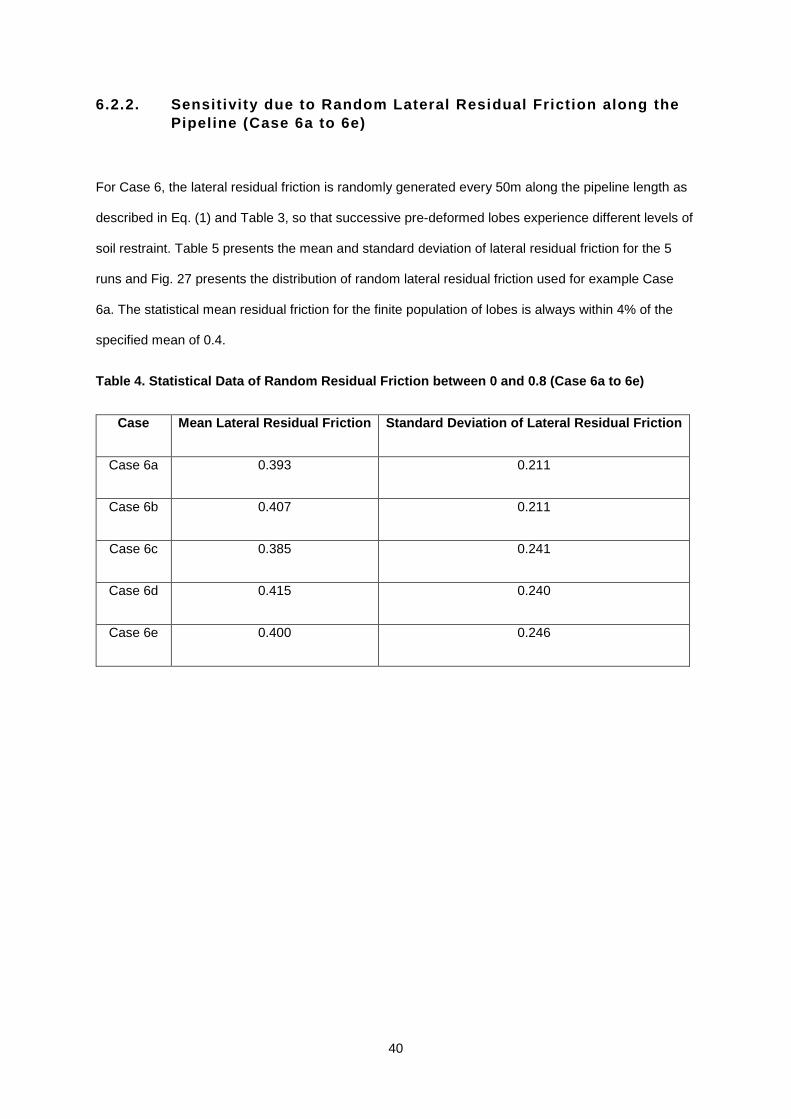
6.2.2. Sensitivity due to Random Lateral Residual Friction along the Pipeline (Case 6a to 6e)
For Case 6, the lateral residual friction is randomly generated every 50m along the pipeline length as
described in Eq. (1) and Table 3, so that successive pre-deformed lobes experience different levels of
soil restraint. Table 5 presents the mean and standard deviation of lateral residual friction for the 5
runs and Fig. 27 presents the distribution of random lateral residual friction used for example Case
6a. The statistical mean residual friction for the finite population of lobes is always within 4% of the
specified mean of 0.4.
Table 4. Statistical Data of Random Residual Friction between 0 and 0.8 (Case 6a to 6e)
Case Mean Lateral Residual Friction Standard Deviation of Lateral Residual Friction
Case 6a 0.393 0.211
Case 6b 0.407 0.211
Case 6c 0.385 0.241
Case 6d 0.415 0.240
Case 6e 0.400 0.246

41
Fig. 27. Random Lateral Residual Friction Used in Case 6a
Fig. 28. Lateral Deformation at 100% Operating Load – Case 6a to 6e
42
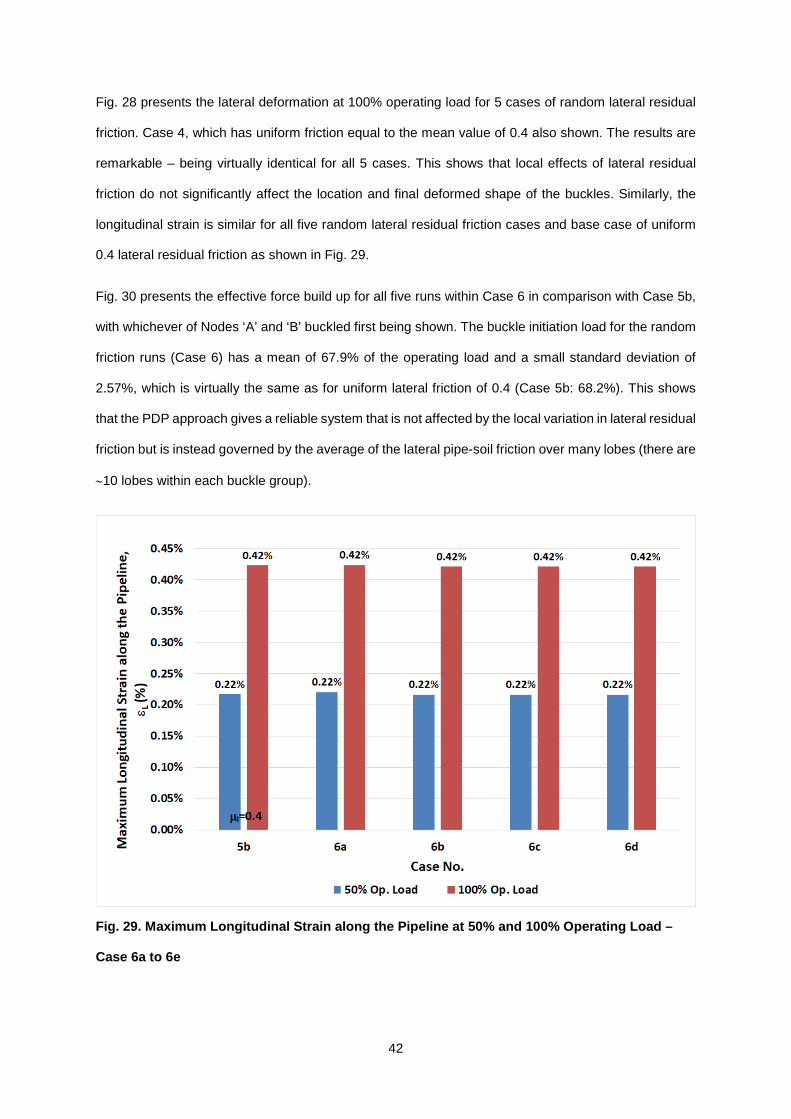
Fig. 28 presents the lateral deformation at 100% operating load for 5 cases of random lateral residual
friction. Case 4, which has uniform friction equal to the mean value of 0.4 also shown. The results are
remarkable – being virtually identical for all 5 cases. This shows that local effects of lateral residual
friction do not significantly affect the location and final deformed shape of the buckles. Similarly, the
longitudinal strain is similar for all five random lateral residual friction cases and base case of uniform
0.4 lateral residual friction as shown in Fig. 29.
Fig. 30 presents the effective force build up for all five runs within Case 6 in comparison with Case 5b,
with whichever of Nodes ‘A’ and ‘B’ buckled first being shown. The buckle initiation load for the random
friction runs (Case 6) has a mean of 67.9% of the operating load and a small standard deviation of
2.57%, which is virtually the same as for uniform lateral friction of 0.4 (Case 5b: 68.2%). This shows
that the PDP approach gives a reliable system that is not affected by the local variation in lateral residual
friction but is instead governed by the average of the lateral pipe-soil friction over many lobes (there are
∼10 lobes within each buckle group).
Fig. 29. Maximum Longitudinal Strain along the Pipeline at 50% and 100% Operating Load –
Case 6a to 6e

43
Fig. 30. Effective Axial Force vs. Percentage Operating Load – Case 6a to 6e
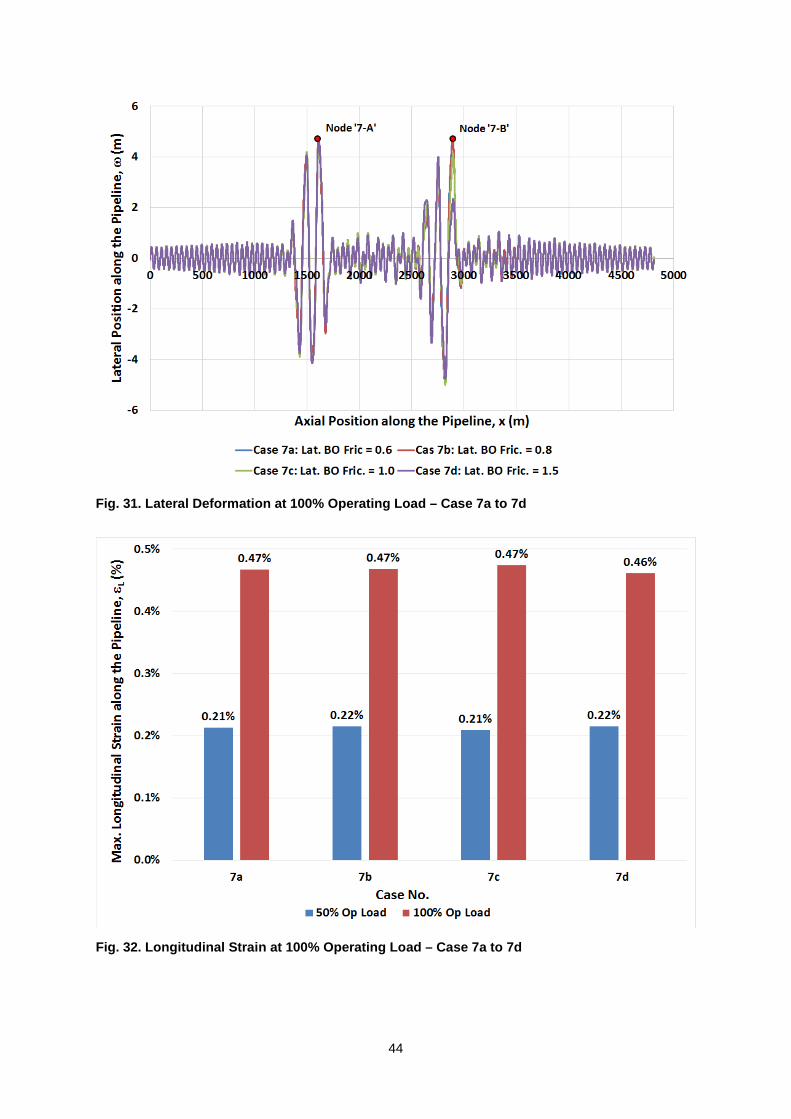
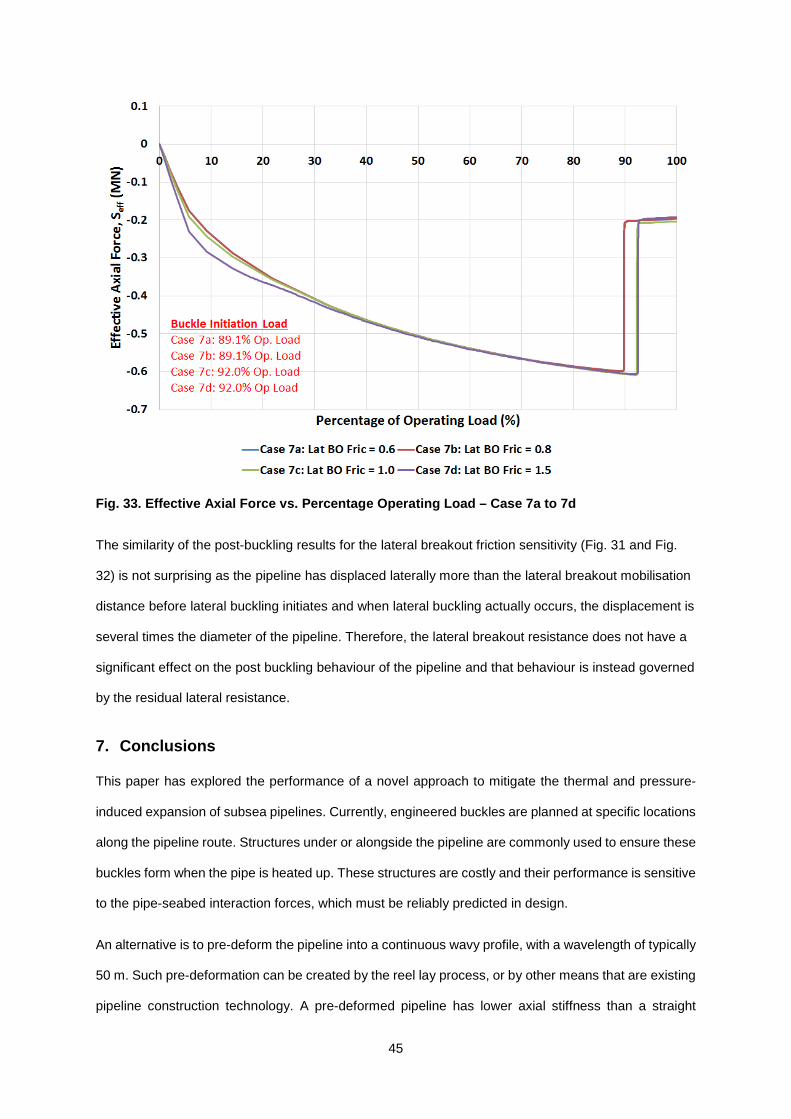
6.2.3. Sensitivity due to Lateral Breakout Friction along the Pipeline (Case 7a to 7e)
Case 7 also explores the influence of PSI, via 4 cases which each have uniform lateral breakout friction
along the entire pipeline, in the range from 0.6 – 1.5, while the residual value is maintained at 0.6 (Table
2). Case 7c is the same as Case 5c with lateral breakout friction of 1. The lateral deformation and
maximum longitudinal strain at 100% operating load is virtually identical for all cases (Fig. 31 and Fig.
32).
The lateral breakout friction has a small influence on the temperature at which buckle initiation occurs
– the two cases with highest breakout friction buckle at 3% higher proportion of operating load, or at
6°C higher temperature. This result, from raising the breakout friction by a factor of 2.5 from 0.6 – 1.5
to represent high soil resistance in front of the pipe, shows that the response of the pre-deformed
pipeline is not greatly affected by the lateral breakout friction. This response is unlike a straight pipeline,
for which higher breakout friction leads to significantly increased the strain during lateral buckling.
44
Fig. 31. Lateral Deformation at 100% Operating Load – Case 7a to 7d
Fig. 32. Longitudinal Strain at 100% Operating Load – Case 7a to 7d
45
Fig. 33. Effective Axial Force vs. Percentage Operating Load – Case 7a to 7d
The similarity of the post-buckling results for the lateral breakout friction sensitivity (Fig. 31 and Fig.
32) is not surprising as the pipeline has displaced laterally more than the lateral breakout mobilisation
distance before lateral buckling initiates and when lateral buckling actually occurs, the displacement is
several times the diameter of the pipeline. Therefore, the lateral breakout resistance does not have a
significant effect on the post buckling behaviour of the pipeline and that behaviour is instead governed
by the residual lateral resistance.
7. Conclusions
This paper has explored the performance of a novel approach to mitigate the thermal and pressure-
induced expansion of subsea pipelines. Currently, engineered buckles are planned at specific locations
along the pipeline route. Structures under or alongside the pipeline are commonly used to ensure these
buckles form when the pipe is heated up. These structures are costly and their performance is sensitive
to the pipe-seabed interaction forces, which must be reliably predicted in design.
An alternative is to pre-deform the pipeline into a continuous wavy profile, with a wavelength of typically
50 m. Such pre-deformation can be created by the reel lay process, or by other means that are existing
pipeline construction technology. A pre-deformed pipeline has lower axial stiffness than a straight
46
pipeline, and therefore has a reduced tendency to buckle when heated. If it does buckle, groups of the
pre-deformed lobes are able to share the absorption of expansion, keeping the maximum strains and
lateral movements lower than would be the case for a straight pipeline.
This paper extends previous modelling of pre-deformed pipelines, to examine the influence of key
uncertainties on the system performance. Those uncertainties are (i) the random variation in the as-laid
shape of the pre-deformed waves, which will inevitably be imperfect (‘out-of-straightness’ – OOS) and
(ii) pipe-soil interaction: the potential range of lateral pipe-soil friction, both as a uniform value along the
entire pipeline and as a random variation about a mean, from lobe to lobe along the pipeline. Both of
these uncertainties are inevitable in design, and the latter effect (PSI) also applies to conventional
straight pipelines.
It is shown that the pre-deformation approach is highly robust. The buckle initiation temperature is
shown to be very high for a PDP, relative to a conventional straight pipeline, so in many design
scenarios the issue of lateral buckling is eliminated by using PDP. If buckling does occur, the maximum
strains are almost unaffected by large variations in both the OOS and the PSI parameters. Analyses
have been presented with 2 levels of OOS and values of lateral friction that vary by a factor of 2.5
(breakout) and 2 (residual) when acting uniformly along the whole pipelines. Also, residual friction that
varies randomly from lobe to lobe in the range 0 – 0.8 has been examined. For all of the above cases,
the maximum strain in the PDP is always within 5% of the base case value (with zero OOS and an
average friction).
The results to date show that the concept of pre-deforming a pipeline has potentially significant
advantages for the design, installation and operation of subsea pipeline. The system is shown to be
robust and not affected by two of the biggest unknowns in pipeline engineering, which is the local
variability in out-of-straightness and the lateral pipe-soil friction.
PDP could prove to be a valuable tool for the subsea industry as it enables the pipeline to be installed
and operated safely at very high temperatures without the need for lateral buckling design and
installation of expensive structures as buckle initiators. Even if the pre-deformed pipeline buckles by
accident at a very high temperature, it is able to adjust itself by geometry rearrangement to minimize
the energy by creating a series of ‘short-pipelines’, therefore, is able to self-control the longitudinal
strain, increasing only slightly when lateral residual friction is high compare to low. This means that the

47
pre-deformed pipeline system is self-govern without the need of expensive lateral buckling control
measures such as subsea triggers.
Abbreviations
FEA Finite Modelling Analysis
Hbreakout Horizontal Resistance at Breakout (kN/m)
Hres Residual Horizontal Resistance (kN/m)
HPHT High Pressure High Temperature
OD Outer Diameter
Op Operating
PDP Pre-Deformed Pipeline
PSI Pipe-Soil Interaction
SD Shutdown
SU Start-up
V Vertical Unit Pipe Load (kN/m)
VAS Virtual Anchor Spacing
WT Wall Thickness
Acknowledgement
The authors are grateful for the support of a Shell-UWA PhD Scholarship. This work forms part of the
Shell Chair in Offshore Engineering at UWA.
References
Abaqus Analysis User Manual, Abaqus version 6.14, 2014, Dassault Systemes, 2014.
Bruton, D, Carr, M., Crawford, M., Poiate, E., 2005. The safe design of hot on-bottom pipelines
with lateral buckling using the design guideline developed by the SAFEBUCK joint industry
project. In: Proceedings of the Deep Offshore Technology Conference, Vitoria, Espirito
Santo, Brazil.
Bruton, D.A.S., White, D.J., Carr, M., Cheuk, J.C.Y., 2006. Pipe-soil interaction during lateral
buckling including large-amplitude cyclic displacement tests by the SAFEBUCK JIP. In:
Offshore Technology Conference, Texas, USA.
48
Bruton, D., Carr, M., White, D., 2007. The influence of pipe-soil interaction on lateral buckling and
walking of pipelines – the SAFEBUCK JIP. In: Proceedings of the 6th International Offshore
Site Investigation and Geotechnics Conference, London, UK.
Bruton, D.A.S., White, D.J., Carr, M., Cheuk, J.C.Y., 2008. Pipe-soil interaction during lateral
buckling and pipeline walking – the SAFEBUCK JIP. In: Offshore Technology Conference,
Texas, USA.
Carr, M., Matheson, I., Peek, R., Saunders, P., George, N., 2004. Load and resistance modelling
of the Penguins pipe-in-pipe flowline under lateral buckling. In: Proceedings of the 23rd
International Conference on Offshore Mechanics and Arctic Engineering, OMAE2004-
51192, British Columbia, Canada.
Chee, J., Walker, A., White, D., 2018. Controlling lateral buckling of subsea pipeline with
sinusoidal shape pre-deformation. J. Ocean Engineering. Vol 151, 170-190.
Cheuk C.Y., White D.J. & Bolton M.D., 2007. Large scale modelling of soil-pipe interaction during
large amplitude movements of partially-embedded pipelines. Canadian Geotechnical
Journal 44(8):977-996
Cooper, P.A., Crawford, M.J., Bell, M., 2014. BP Angola PSVM Project: Production flowline
lateral buckling design. In: Offshore Technology Conference, OTC-24396-MS, Texas, USA.
Det Norske Veritas (DNV), 2013. DNV OS F101 Submarine Pipeline Systems.
DNVGL-RP-114, 2017. Recommended Practice, Pipe-soil interaction for submarine pipelines.
DNVGL-RP-110, 2018. Recommended Practice, Global buckling of Submarine Pipeline.
Endal, G., Giske, S.R., Moen, K., Sande, S., 2014. Reel-lay method to control global pipeline
buckling under operating loads. In: Proceedings of the ASME 2014 33rd International
Conference on Ocean, Offshore and Artic Engineering, OMAE2014-24062, California, USA.
Endal, G., Nystrom, P.R., 2015. Benefits of generating pipeline local residual curvature during reel
and S-lay installation. In: Offshore Pipeline Technology Conference, Amsterdam, The
Netherlands.
Fyrileiv, O., Collberg, L., 2005. Influence of pressure in pipelines design - effective axial force. In:
Proceedings of the ASME 2005 24th International Conference on Offshore Mechanics and
Artic Engineering, OMAE 2005-67502, Halkidiki, Greece.

49
Haq, M.M., Kenny, S., 2013. Lateral buckling response of subsea HTHP Pipelines using Finite
Element Mehods. In: Proceedings of the 32nd International Conference on Ocean, Offshore
Arctic Engineering, OMAE2013-10585, Nantes, France.
Hobbs, R.E., 1981. Pipeline buckling caused by axial loads. Journal of Constructional Steel
Research, Vol. 1, No.2.
Hobbs, R.E., 1984. In-service buckling of heated pipeline. Journal of Transportation Engineering,
(110)2, 175-189.
Hobbs, R.E., Liang, F., 1989. Thermal buckling of pipelines close to restraint. In: Proceedings of
the 8th International Conference on Offshore Mechanics and Arctic Engineering, The
Hague, The Netherlands.
Hong, Z., Liu, R., Liu, W., Yan, S., 2015. Study on lateral buckling characteristics of a submarine
pipeline with a single arch symmetric initial imperfection. Ocean Engineering, Vol. 108, pp.
21-32.
Jayson, D., Delaporte, P., Albert, J-P, Prevost, M.E., Bruton, D. and Sinclair, F. 2008. Greater
Plutonio Project – Sub-sea flowline design and performance. In: Offshore Pipeline
Technology Conference, Amsterdam, The Netherlands.
Kristiansen, N.O., Peek, R., Carr, M., 2005. Designed buckling for HP/HT pipelines. Offshore
Magazine, Vol 65, Issue 10, Oklahoma, USA.
Konuk, I., Yu, S., 2007. Continuum FE modelling of lateral buckling: Study of soil effects. In:
Proceedings of the 26th International Conference on Offshore Mechanics and Arctic
Engineering, OMAE2007-29376, California, USA.
Lanan, G.A., Barry, D.W., 1992. Mobile Bay Fairway Field Flowline Project. In: Offshore
Technology Conference, Houston, Texas, USA.
Le Grognec, P., Casari, P., Choqueuse, D., 2009. Influence of residual stresses and geometric
imperfections on the elastoplastic collapse of cylindrical tubes under external pressure.
Marine Structures, 22 (4), pp. 836-854.
Martin, C.M., Kong, D. & Byrne, B.W. 2013. 3D analysis of transverse pipe-soil interaction using
2D soil slices. Géotechnique Letters, Vol. 3, No. 3, pp 119-123.

50
Maschner, E., Abdalla, B., 2012. On pipeline lateral buckling: Lessons learned and current design
challenges. In: Proceedings of the 31st International Conference on Ocean, Offshore and
Arctic Engineering, OMAE2012-83413, Rio de Janeiro, Brazil.
Maschner, E., Wang, Y. N, 2017. Through-life Reliability Design of Light HP/HT Pipelines on Soft
Sloping Seabed with buckling, anchoring and route bend stability issues. In: Proceedings of
the ASME 2017 36th International Conference on Ocean, Offshore and Artic Engineering,
OMAE2017-61826, Trondheim, Norway.
Matheson, I., Carr, M., Peek, R., Saunders, P., George, N., 2004. Penguins flowline lateral
buckle formation analysis and verification. In: Proceedings of the 23rd International
Conference on Offshore Mechanics and Arctic Engineering, OMAE2004-51202, British
Columbia, Canada.
Nystrom, P.R., Tornes, K., Bai, Y., Damsleth, P., 1997. 3-D dynamic buckling and cyclic
behaviour of HP/HT pipeline. In: Proceedings of the 7th International Offshore and Polar
Engineering Conference, Honolulu, Hawaii, USA.
Preston, R., Drennan, F., Cameron, C., 1999, Controlled lateral buckling of large diameter
pipeline by snaked lay. In: Proceedings of the 9th International Offshore and Polar
Engineering Conference, Brest, France.
Reddy, R. N., 2013. Lateral buckling behaviour of snake-lay pipeline with vertical support at
crown. In: Proceedings of the 32nd International Conference on Ocean, Offshore and Arctic
Engineering, OMAE2013-10106, Nantes, France.
Rundsag, J.O., Tornes, K., Cumming, G., Rathbone, A.D., Roberts, C., 2008. Optimised snaked
lay geometry. In: Proceedings of the 18th International Offshore and Polar Engineering
Conference, British Columbia, Canada.
SAFEBUCK JIP, 2011. SAFEBUCK III: Safe design of pipelines with lateral buckling, Design
Guideline.
Sparks, C.P., 1984. The influence of tension, pressure and weight on pipe and riser deformations
and stresses. J. Energy Resource Technology, 106(1), 46-54.
Sinclair, F., Carr, M., Bruton, D. & Farrant, T. 2009. Design challenges and experience with
controlled lateral buckle initiation methods. In: Proceedings of the Offshore Mechanics and
Arctic Engineering Conference, Honolulu, Paper OMAE2009-79434.

51
Statoil, 2002. Method for Pipelaying from a coil to the seabed, controlling thermal expansion,
Patents US 6910830, WO 02/057674 A1 (EP1358420) and NO 314056.
Taby, J., Aas, S.K., Pereira, F., 2014, On the effect of including residual stresses in global
buckling analyses. In: 25th National Congress on Maritime Transportation, Ship and Offshore
Construction, Rio de Janeiro, Brazil.
Taylor, N., Gan, A.B., 1986. Submarine pipeline buckling – imperfection studies. Thin-Walled
Structures, 4(4), 295-323.
Tom, J., Draper, S., White, D., 2016. Risk based assessment of scour around seabed
infrastructure, In: Offshore Technology Conference, OTC-27131-MS, Texas, USA.
Vermeulen, H.R., 1995. Theory and Practice of Installing Pipelines by the Pre-Snaking Method.
In: Proceedings of the 5th International Offshore and Polar Engineering Conference, The
Hague, The Netherlands.
Wang, Z., Chen, Z., Liu, H., Zhang, Z., 2017. Numerical study on lateral buckling of pipelines with
imperfection and sleeper. Applied Ocean Research, 68(2017), 103-113.
Wang, Y.N., Maschner, E., Thayer, R., 2015. Pipeline Design on Undulating Seabed with
Planned and Rogue Buckles using Simplified Structural Reliability Method – SSRA. In:
Proceedings of the 25th International Ocean and Polar Engineering Conference, Hawaii,
USA.
Wang D., White D.J. & Randolph M.F. 2010. Large deformation finite element analysis of pipe
penetration and large-amplitude lateral displacement. Canadian Geotechnical Journal.
47:842-856
Westgate, Z.J., Randolph, M.F., White, D.J. & Li, S. 2010. The influence of seastate on as-laid
pipeline embedment: a case study Applied Ocean Research, 32:321-331
White, D., Cheuk, C.Y., 2008. Modelling the soil resistance on seabed pipelines during large
cycles of lateral movement, Journal of Marine Structures, 21(2008), 59-79.
White, D., Randolph, M, 2007. Seabed characterisation and models for pipeline-soil interaction,
International Journal of Offshore and Polar Engineering, Vol. 17, No. 3, pp. 193-204.
White, D., Cathie, D., 2011. Geotechnics for subsea pipelines. Frontiers in Offshore Geotechnics
II – Edition: Gourvenec and White, CRC Press, Taylor and Francis Group, London, UK.
52
White, DJ, Clukey EC, Randolph MF, Boylan NP, Bransby MF, Zakeri A, Hill AJ, Jaeck C. 2017.
The state of knowledge of pipe-soil interaction for on-bottom pipeline design. OTC 27623,
Proc. Offshore Technology Conference, Houston.
Yu, S., Konuk, I., 2007. Continuum FE modelling of lateral buckling. In: Offshore Technology
Conference, OTC 18934, Texas, USA.
Zhao, M., Cheng, L., 2008. Finite element modelling of scour around a subsea structure in
steady currents. In: Proceedings of the 18th International Offshore and Polar Engineering
Conference, British Columbia, Canada.