International Migration, Remittances and its Macroeconomic Impact on Indian Economy
28
INDIAN INSTITUTE OF MANAGEMENT AHMEDABAD INDIA Research and Publications International Migration, Remittances and its Macroeconomic Impact on Indian Economy Sunny Kumar Singh K. S. Hari W.P. No. 2011-01-06 January 2011 The main objective of the working paper series of the IIMA is to help faculty members, research staff and doctoral students to speedily share their research findings with professional colleagues and test their research findings at the pre-publication stage. IIMA is committed to maintain academic freedom. The opinion(s), view(s) and conclusion(s) expressed in the working paper are those of the authors and not that of IIMA. INDIAN INSTITUTE OF MANAGEMENT AHMEDABAD-380 015 INDIA
Transcript of International Migration, Remittances and its Macroeconomic Impact on Indian Economy

INDIAN INSTITUTE OF MANAGEMENT
AHMEDABAD � INDIA Research and Publications
International Migration, Remittances and its
Macroeconomic Impact on Indian Economy
Sunny Kumar Singh
K. S. Hari
W.P. No. 2011-01-06 January 2011
The main objective of the working paper series of the IIMA is to help faculty members, research staff and doctoral students to speedily share their research findings with professional colleagues and test their research findings at the pre-publication stage. IIMA is committed to
maintain academic freedom. The opinion(s), view(s) and conclusion(s) expressed in the working paper are those of the authors and not that of IIMA.
INDIAN INSTITUTE OF MANAGEMENT AHMEDABAD-380 015
INDIA

IIMA � INDIA Research and Publications
W.P. No. 2011-01-06 Page No. 2
Acknowledgment
The authors are grateful to Prof. Errol D’souza of Indian Institute of Management,
Ahmedabad for his valuable comments and suggestions.

IIMA � INDIA Research and Publications
W.P. No. 2011-01-06 Page No. 3
International Migration, Remittances and its Macroeconomic Impact on Indian Economy∗∗∗∗
Sunny Kumar Singh Academic Associate
Indian Institute of Management, Ahmedabad E-mail : [email protected]
Dr. K. S. Hari Assistant Professor
Central University of Kerala, Kasargod E-mail: [email protected]
Abstract
This paper tried to study the impact of remittances on various macroeconomic
and developmental aspects for the Indian economy. For this, the data regarding
remittances and some of the macroeconomic variables like GDP, PFCE, GDFC,
savings, FDI, FII, export, import and balance of trade deficit etc have been
analyzed for the period 1971-2008. The study shows that remittances have been
consistently increasing at very fast rate for the last 15 years which have
significant implications on the above mentioned macroeconomic variables.
Through this study, the importance of remittances as a source of external
development finance has been discussed. At last, some of the regulatory
frameworks governing the flow of remittances have also been discussed.
∗ An earlier version of this paper was also presented at ‘52nd Annual Conference of the Indian Society of Labour Economics’ which was held during 17th-19th December 2010 in Karnatak University, Dharwad. We are thankful to all the participants of the conference for their valuables comments.

IIMA � INDIA Research and Publications
W.P. No. 2011-01-06 Page No. 4
“The Sun doesn’t shine or set anywhere without shining on some members of Indian Community”
Motwani K Jagat (1994)
I. Introduction
International migration occurs when the citizens of a country cross their national
boundaries and stay in the host countries for a certain period of time for various purposes
especially for employment and education. This will have a significant developmental
impact on the guest as well as the host countries; economically, politically and socially.
When it comes to migration and development, both are said to be interdependent on each
other because of the link which exists between them. Like, migration can help in the
development process of any country and development can affect the migration and
migration policy. In fact, migration, with the help of remittances, can contribute
positively to the developmental activity of a country, including economic growth, poverty
reduction, social empowerment and technological progress.
According to the International Organization of Migration (2008), there are more than 200
million migrants around the world today and there is enough evidence to show that the
rate of international migration has actually increased at a time when the world is getting
more globalised. The total number of citizens that have emigrated from India is about 10
million, which works out to just about a per cent of her population
India now has the distinction of being the largest remittance (in absolute terms) receiving
country in the world. There has been a tremendous growth in private transfers to India
from just about USD 2 billion in 1989-00 to about USD 52 billion in 2009-10. The sheer
size of these transfers could be understood from the fact that even in 2007-08 when India
had record net FDI inflows, private transfers still accounted for over 1.2 times the Net
FDI to India. Further, remittances now account for about 5.63 per cent of India’s GDP
although in 1991 it accounted for just 0.8 per cent. They have offset India’s merchandise
trade deficit to a large extent, thereby keeping the current account deficits modest through
the 1990s. Remittances are also one of the least volatile inflows in either the current or
capital accounts of India’s BOP.

IIMA � INDIA Research and Publications
W.P. No. 2011-01-06 Page No. 5
The literature1 on migration identifies four channels through which migration can actually
impact the economic performance of the sending country. The first channel captures how
the prospect of emigration affects the expected return on human capital. The central idea
is that the prospect of emigration increases human capital investments, but a fraction of
the additional human capital chooses not to leave or does not qualify to leave. The second
impact is the absence of highly skilled migrants from the sending country. Research on
the absence channel has the longest pedigree. The focus is on how the absence of part of a
country’s skilled nationals affects the domestic economy. The third channel focuses on
the role of the diasporas as a source and facilitator of international business and
remittances. This is a burgeoning literature that includes survey work on diasporic
networks, empirical estimation of the effect of diasporas and trade, and theoretical
exploration of the intermediation function. The general finding is that diasporic networks
have a significant effect on international business. Finally, work on the return channel has
concentrated on the determinants and selectivity of, and the impact of emigration on
returnee’s human capital and earnings. In the present paper we focus on the third channel
of remittances and its macro economic impact on Indian economy.
The paper is divided into five sections. Given the introductory section, in the second
section we discuss the key objectives and methodology of the study. A historical
perspective of migration and remittances to the Indian economy are explored in the third
section. In the fourth section we examine the long term trends in remittances to the
Indian economy and its macro economic impact. The fifth section examines the causative
factors behind the remittance boom to the Indian economy and the final section concludes
the study.
II. Importance of the Study, Objectives and Methodology
The broad objective of the study is to examine the trend in long term remittances to the
Indian economy during the period 1971-2008. We have taken the starting period as 1971,
because the phenomenon of International migration actually started around that time
period with large inflows of laborers from India to Middle-East countries. During this
1 See Desai et al (2009) for a detailed review of this literature.

IIMA � INDIA Research and Publications
W.P. No. 2011-01-06 Page No. 6
period, the increase in oil price led to economic boom there which subsequently increased
the demand for labor in those countries.
As far as the role of remittances is concerned, the most immediate and direct benefit of
International migration is the remittances that the migrants send to their home countries.
It is estimated that remittance transfer to developing countries are around USD 328
billion which has more than tripled in the last 10 year period (Sasikumar & Hussain,
2007). Since it is more than any other type of stable foreign investment, such a large
amount has acquired special importance for the Indian economy. It is increasingly
recognized that substantial gains from remittances can be realized in terms of growth,
investment, human capital formation, technological advancement and poverty reduction,
if it is utilized effectively. More precisely, that gain from remittances can be realized at
both the macro level (effects on the national economy) and the micro level (to the
recipient region and households). The developmental effects of remittances depend
mainly on the magnitude of its value and on how productively the receiving economy and
household use it.
At macro level, the most direct and significant impact of remittances is on the volume of
foreign exchange reserves. Remittances, as an important source of external finance, can
serve as an engine of economic growth. Since remittances are the part of balance of
payment (BOP) account, the increase in it can reduce the BOP deficit (particularly current
account deficit) of the country (remittances have provided significant support to India’s
BOP position for the last three decades). Reduction in BOP deficit can create conducive
environment for foreign investment in the country. Apart from that, it can also solve the
problem of financial constraint faced by many small scale enterprises in India (by
utilizing migrant’s family small savings if the financial institutions in the country are
strong enough). The expansion of small scale enterprises (also through increase in
consumption expenditure by households) can increase the indirect tax revenue of the
government. All of these have positive impact on the overall GDP of the country as a
whole. However, there are some negative incentive effects acting at macro level. If
remittances are relatively large and a large share is spent on non-tradable (particularly
housing and land) - the country is likely to suffer from Dutch disease effects which
results into appreciation of real exchange rate, rendering export less competitive. The

IIMA � INDIA Research and Publications
W.P. No. 2011-01-06 Page No. 7
country’s principal export could become cheap factor- labor – rather than labor intensive
products (Kapur, 2003).
At the micro level (regional and household level), remittances have had a considerable
impact on regional economies within India. The most recognizable example is that of
Kerala. A study (Kannan and Hari, 2002) for Kerala concludes that remittances to
Kerala’s economy are around 21 per cent of the state income in the 1990s. It also reports
that an increase in per capita income as a result of remittances has contributed to an
increase in consumption expenditure in Kerala.
At the household level, the impact will be on the lives of the migrants’ families (as it has
been found by many studies that remittances may improve the income distribution and
quality of life beyond what other available development approaches could deliver). The
migrant’s family can utilize the money to raise their standard of life by investing in
consumption, education, health and some other productive activities (investment in
agriculture inputs if the family is traditionally engaged in agro-based activity). All of
these expenditures have multiplier effect. Because, as evidenced through many studies,
the money which the migrants send to their home countries are used for consumption
(durables and non-durables both), education, health, asset creation (building house and
buying lands), loan repayments, small investments, savings etc. If these remittances are
used for consumption purpose like for buying various commodities of daily uses, it can
develop and expand the manufacturing sector of the country by increasing the demand for
the goods from this sector. The increase in the demand from that very sector results into
increase in the production which again results into increase in the demand for labor. The
employment of the remaining unemployed labor in the manufacturing sector will increase
their income level. The increase in the income level of the labor employed will further
expand this sector. This process keeps on going. But if the remittances are invested in
some productive activity within the household like investment in agriculture for buying
some inputs or starting an entrepreneurial activity by setting up a business, it’ll have
much stable and long lasting impact on the income level of the household.
The impact of remittances can also be realized beyond the family of the migrants. As we
know that the money that the migrants send to their home country is not spent completely.
Some part of it is deposited in the bank also. Thus, the migrant’s saving in the bank can

IIMA � INDIA Research and Publications
W.P. No. 2011-01-06 Page No. 8
serves as a means for financing loan to other households. In a way, we can say that
remittances provide capital to small entrepreneur and thereby entrepreneurship2.
Given the above discussion on the role of remittances at the macro and micro level the
present study can be justified on following grounds.
• There has been very few comprehensive study3 from the period 1971-2008. The
earlier studies are either from 1971-1990 (Nayyar, 1994) or from 1990-2005
(Sasikumar & Hussain, 2007) for India.
• With this paper, we are also going to discuss the role of remittances as a source of
external development finance.
• Along with the analysis, this study is going to cover some regulatory aspects of
remittances and some development over the year which is responsible for the flow
of remittances through formal channels rather than informal channels.
The method of estimating remittances is direct. In the balance of payment statistics
published by the Reserve bank of India (RBI) in ‘Handbook of Statistics on Indian
Economy’, remittances can be identified as credit in the current account as ‘net private
transfer’4. In addition to that, ‘IMF’s Balance of Payment Statistics’5 is also one of the
important sources. The RBI’s data on private transfers are available for the period 1990-
2008, and the IMF’s data are available for 1975-2008. For this study, we will be focusing
only on the aggregate remittances from RBI only.
One limitation of the reported data for remittances is that it is probably underestimated
because it does not include remittances sent through informal channels. Such transactions
2 K.M. Abdul Aziz and M. Begum, “International Remittances: A source of Development Finance” 3 Kannan & Hari, 2002 gives a comprehensive study for the state of Kerala in India. 4 Private transfer constitutes remittances by non-residents for family maintenance, repatriation of savings by Indian resident’s abroad and personal gift and donation to religious and charitable institutions in India. In addition, other components such as import of gold and silver brought in as baggage by returning Indian and local withdrawals were included under private transfer receipt since 1992-93 to 1996-97. (RBI Bulletin, January 2001) 5 The IMF’s data are available separately for two components: worker’s remittances and other transfer. Other transfers include charitable and religious contributions, and gifts etc.

IIMA � INDIA Research and Publications
W.P. No. 2011-01-06 Page No. 9
are often known as “hawala”6. In some countries these flows are estimated to be very
high. For India, estimates have put the remittances through hawala at about USD 6 billion
a year (Reddy, 1997). But due to changes in the policy of government and increase in the
use of formal channel in the 1990s, the problem of underestimation has almost gone.
After estimating remittances, the data on India’s macroeconomic variables like gross
domestic product at market price, gross domestic saving, gross domestic capital
formation, total volume of exports, imports and foreign direct investment, foreign
institutional investment, foreign exchange reserve were compiled from various issues of
‘RBI Handbook of Statistics on the Indian Economy’. The compilation and analysis of
these macroeconomic variables is necessary because of their significant impact on the
economy as a whole and their direct/indirect link with remittances in particular.
III. Historical Perspective on Migration and Remittances to Indian Economy
Migration of labor across national boundaries is nothing new for India and it began
centuries ago. The contact with the Persian Gulf region and south-east Asia, in terms of
both trade in goods and movement of people, goes back several centuries. The migration
of workers on a significant scale came much later, to begin within the colonial era and
then in independent era. In independent era, the first phase of international migration
began in the early 1950s which was characterized by a movement of persons with
technical skills and professional expertise to the industrialized countries like USA, UK,
and Canada etc. on a much smaller scale. The second phase of International migration
was largely to the oil-exporting countries of the Middle-East which is a recent
phenomenon. It began in mid 1970s and peaked in early 1980s as the dramatic increase in
the oil price led to and economic boom in these labour scarce countries. A large number
of laborers who migrated during this period were skilled and semi-skilled workers in
manual or clerical occupations and their migration in these areas was temporary in nature
(Nayyar, 1994).
6 Hawala (also known as hundi) is an informal value transfer system based on the performance and honour of a huge network of money brokers, which are primarily located in the Middle East, North Africa, the Horne of Africa, and South Asia.

IIMA � INDIA Research and Publications
W.P. No. 2011-01-06 Page No. 10
The third phase of international migration has no any limitations. Due to globalization
and liberalization policy of the government, the volume of international migration has
spread all over the world. The main reason for the phenomenal increase in the volume of
international migration in the 1990s is the economic reform in the Indian Economy and
Information Technology (IT) revolution.
III. Trends in Remittances: The Quantum Jump in the Globalization Era.
In the balance of payment statistics, remittances to India can be identified as credit on
account of net private transfer payments in the current account. Based on these estimate
of remittances, a time series data from the period 1971-2008 has been constructed which
is given in table 1.
Figure 1 Trend in Remittances to Indian Economy
Net Pvt. Transfer and Net NRI Deposits to India
-100000
100002000030000400005000060000700008000090000
100000110000120000130000140000150000160000170000180000190000200000210000220000
1971
-72
1973
-74
1975
-76
1977
-78
1979
-80
1981
-82
1983
-84
1985
-86
1987
-88
1989
-90
1991
-92
1993
-94
1995
-96
1997
-98
1999
-00
2001
-02
2003
-04
2005
-06
2007
-08 (Q
E)
Year
Net
Pvt
. T
rans
fer
and
Net
NR
I Dep
osit
(Rs.
Cro
re)
Net Pvt. Transfer (Rs. Cr.)
Net NRI Deposit (Rs. Cr.)

IIMA � INDIA Research and Publications
W.P. No. 2011-01-06 Page No. 11
Table 1: Net Private Transfers (Remittances) and net NRI deposits to Indian Economy (Rs. Cr.)
Year Net Pvt.
Transfers (Remittances)
Net NRI Deposits
GDP at MP (Constant Price
1999-00)
Remittances as percentage of
GDP 1971-72 104 0 525584 0.02 1972-73 99 0 522698 0.02 1973-74 146 0 540045 0.03 1974-75 229 0 546443 0.04 1975-76 441 36 596428 0.07 1976-77 755 167 606301 0.12 1977-78 1102 200 650311 0.17 1978-79 1093 156 687435 0.16 1979-80 1754 162 651430 0.27 1980-81 2125 178 695361 0.31 1981-82 2025 206 737078 0.27 1982-83 2417 383 762622 0.32 1983-84 2637 709 818288 0.32 1984-85 2967 879 849573 0.35 1985-86 2701 1767 894041 0.30 1986-87 2976 1650 936671 0.32 1987-88 3499 1840 973739 0.36 1988-89 3841 3636 1067582 0.36 1989-90 3798 4000 1131111 0.34 1990-91 3712 2756 1193650 0.31 1991-92 9382 1008 1206346 0.78 1992-93 11226 6097 1272457 0.88 1993-94 16514 3780 1333123 1.24 1994-95 25417 539 1421831 1.79 1995-96 28660 3821 1529453 1.87 1996-97 43969 11894 1645037 2.67 1997-98 43765 4325 1711735 2.56 1998-99 43242 4060 1817752 2.38 1999-00 53132 6709 1952035 2.72 2000-01 58811 10561 2030711 2.90 2001-02 73633 13127 2136651 3.45 2002-03 79229 14424 2217133 3.57 2003-04 99165 16869 2402727 4.13 2004-05 91971 -4439 2602065 3.53
2844942 3.82 2005-06 2006-07
108565 134608
12457 19574 3120031 4.31
2007-08 167501 706 3402716 4.92 2008-09 203209 20431 3609425 5.63
Source: RBI Handbook of Statistics on the Indian Economy, 2009-10
From the Table 1 and Figure 1, it is clear that the magnitude of remittances to India
increased steadily during the 1970s; remained more or less flat in the 1980s and picked up
sharply in the 1990s (the sharpest increase took place during 1991-97). The remittances to

IIMA � INDIA Research and Publications
W.P. No. 2011-01-06 Page No. 12
India increased approximately 20-fold during the period 1991-2008, making India the
largest recipient of remittances. In the absolute term, remittances are around USD 52
billion which is more than any type of capital flow to India including FDIs, FIIs etc. In
terms of percentages of GDP at market price, remittances were around 0.02 percent in
1971, 0.78 percent in 1991 and 5.63 percent in 2008.
There are many factors which could be attributed for such a phenomenal rise in
remittances during the period 1971-2008:
• The phenomenal rise in remittances resulting from international labor migration
until the mid-eighties may be attributable entirely to the economic boom in the
oil-exporting countries and the associated inflow of remittances from Indian
workers in the Middle-East. But from the 1980s, the share of the Middle-East
countries in the total remittances declined from 77 per cent to around 61 percent in
1990-91 to and further to 22 per cent in 2003 (Sasikumar & Hussain, 2007). The
reason for such a decline in the share of Middle- East could be attributable to the
geographical spread of the migrants throughout the world.
• From the early nineties, the increase in remittances has been astonishing (see
figure 1) which is due to the liberalization of the exchange rate system fuelled by
the large number of Indian professional migration to the USA due to information
technology revolution. The market determined exchange rate regime and current
account convertibility instituted since the early 1990s have had a considerable
influences on remittances inflows7. The liberalized exchange rate caused the
remittances to flow through formal channels rather than informal channels (one of
the reason for increase in remittances figure)8.
• In the 1990s, migration to USA, Canada, and Australia increased significantly,
particularly of information technology professionals. The professional migration
to USA seems to have massively preferred the remittances route to the NRI
deposits which could be contrasted with the 1980s when NRI deposits (due to
7 The period after independent was followed by a fixed exchange rate system. However, the adverse BOP situation in the beginning of the 1990s necessitated significant liberalization in the exchange rate management system. A dual exchange rate system was instituted under this 40percent of exchange earning have to be surrendered at an official rate determined by the RBI and the balance 60percent earning was to be converted at market rates. 8 It was argued that such policy initiative have significantly reduced and even nullified the premium commanded by unofficial exchange rate and thus acted as a major factor for channelising the remittances through formal routes (Debabrata and Kapur, 2003)

IIMA � INDIA Research and Publications
W.P. No. 2011-01-06 Page No. 13
interest rate differential and exchange rate guarantee) were the preferred mode of
the professional migrants. With gradual withdrawals of the incentives structures
for NRI deposits, there was a strong shift to remittances. The speculative nature of
these deposits was reflected in the massive fluctuations in the net NRI deposits in
the 1990s (see table 1). Due to the massive fluctuations and speculative nature of
the NRI deposits, remittances have become a preferred mode of transfer for short
term investment (Sasikumar and Hussain, 2007).
• Despite the financial crisis, there was sharp increase in remittances to India in
2008 in absolute term. The reason for such an increase in the remittances despite
the crisis can be attributed to a switch regarding use of remittances from
consumption to investment purpose. The falling asset price, rising interest rate
differentials, and a depreciation of the local currency have attracted investment
from the migrants (Ratha, Mahapatra and Silval, 2009).
• Remittances flows to all developing countries including India was expected to
decline in 2009 due to the global financial crisis around the world. This argument
was supported by the trend of reverse migration to India especially from the
Middle-East countries in the period 2009-10. Middle-East countries couldn’t
escape themselves from the global financial crisis. The financial crisis around the
world was one of the reasons attributed for Dubai-Crisis in December 2009 which
is basically due to collapse of real estate sector in the Middle-East countries. The
Dubai crisis, to some extent, adversely impacted the remittance flow to India
especially the state of Kerala (Times of India, 28th Nov. 2009). But from the
recent data, it was found that remittances actually increased from USD 44 billion
in 2008-09 to USD 52 billion in 2009-10.
IV. Remittances as a source of external development finance
After discussing remittances in terms of numbers, in this section we’ll discuss its impact
on the developmental aspect. In recent period, remittances are said to be stable source of
development finance and contribute significantly in the economic development of any
underdeveloped country at both micro and macro level. At the macro level, it is the
cheapest, largest, risk less and least volatile source of external development finance.
IIMA � INDIA Research and Publications
W.P. No. 2011-01-06 Page No. 14
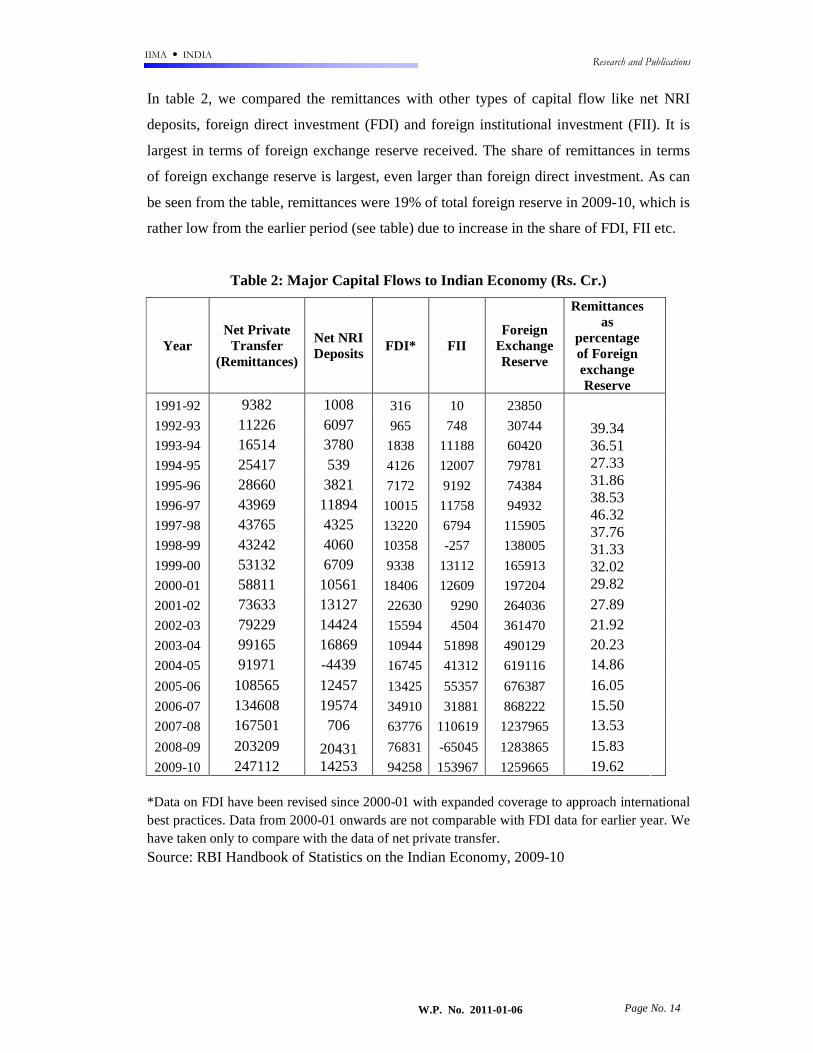
In table 2, we compared the remittances with other types of capital flow like net NRI
deposits, foreign direct investment (FDI) and foreign institutional investment (FII). It is
largest in terms of foreign exchange reserve received. The share of remittances in terms
of foreign exchange reserve is largest, even larger than foreign direct investment. As can
be seen from the table, remittances were 19% of total foreign reserve in 2009-10, which is
rather low from the earlier period (see table) due to increase in the share of FDI, FII etc.
Table 2: Major Capital Flows to Indian Economy (Rs. Cr.)
Year Net Private
Transfer (Remittances)
Net NRI Deposits FDI* FII
Foreign Exchange Reserve
Remittances as
percentage of Foreign exchange Reserve
1991-92 9382 1008 316 10 23850
1992-93 11226 6097 965 748 30744
1993-94 16514 3780 1838 11188 60420
1994-95 25417 539 4126 12007 79781
1995-96 28660 3821 7172 9192 74384
1996-97 43969 11894 10015 11758 94932
1997-98 43765 4325 13220 6794 115905
1998-99 43242 4060 10358 -257 138005
1999-00 53132 6709 9338 13112 165913
2000-01 58811 10561 18406 12609 197204
39.34 36.51 27.33 31.86 38.53 46.32 37.76 31.33 32.02 29.82
2001-02 73633 13127 22630 9290 264036 27.89
2002-03 79229 14424 15594 4504 361470 21.92
2003-04 99165 16869 10944 51898 490129 20.23
2004-05 91971 -4439 16745 41312 619116 14.86
2005-06 108565 12457 13425 55357 676387 16.05
2006-07 134608 19574 34910 31881 868222 15.50
2007-08 167501 706 63776 110619 1237965 13.53
2008-09 203209 76831 -65045 1283865 15.83
2009-10 247112 20431 14253 94258 153967 1259665 19.62
*Data on FDI have been revised since 2000-01 with expanded coverage to approach international best practices. Data from 2000-01 onwards are not comparable with FDI data for earlier year. We have taken only to compare with the data of net private transfer. Source: RBI Handbook of Statistics on the Indian Economy, 2009-10

IIMA � INDIA Research and Publications
W.P. No. 2011-01-06 Page No. 15
Figure 2: Major Capital Flows to Indian Economy
Remittances are also called the most risk less and least volatile source of external
development finance due to several reasons. As it can be observed from figure 2, foreign
capital tends to flow more in favorable time and less in bad time, the situation can be
explained by taking the example of inflow of FIIs in recent times (there were large capital
outflow during the recent financial crisis) in India. But, remittances tend to react less
violently and even become countercyclical (increases in bad times). For example,
remittances to developing countries continued to rise steadily in 1998-2001 when private
capital flow including FDI declined in the wake of East Asian Crisis (see figure 2).
Like FDI and FIIs, remittances can also be a great source of development finance both at
micro and macro level but with different mechanism. As we know, the remittances sent
by the migrants are basically used for consumption, creating assets, small savings and
investment. The investments may be in terms of investment in education, health or setting
up some small business. The investment in education and health can have positive impact
on the human capital formation which will be beneficial for both the country and the
family as a whole. The small savings by the migrant’s family can be an investment for the
industrial sector if the financial institutions utilize it properly (IMF, 2008).

IIMA � INDIA Research and Publications
W.P. No. 2011-01-06 Page No. 16
Since, we are discussing the role of remittances as a source of development finance; it is
worthwhile to discuss the role of microfinance institutions (MFIs) in facilitating
remittance flow. As we know MFIs play a significant role at the grass root level in the
development process by providing credit to the poorest. Investments/Deposits in MFIs by
the migrants can solve the credit problems and facilitate the development process at the
grass root level. For this to happen, the focus of policy would be to induce MFIs to
capture remittances to be in turn used to fuel productive activities. The basic policy
initiative would be to enable migrant’s fund to be transferred to entrepreneurs through
these financial institutions (Sasikumar & Hussain, 2007).
Lastly, it is also observed that continuous remittance flow can create positive
environment for credit and make a country creditworthy. This will enhance the country’s
access to international capital market (FIIs) for financing infrastructure and other
development projects9 (Ratha, 2007).
IV.1. Remittances and its significance with macroeconomic variables
Apart from micro level activities at household level, remittances influence macro level
activity through multiplier effect arising as a result of household consumption and
investment activity. Remittances that are invested in productive activities by the
households directly contribute to the output growth i.e. GDP growth of the country.
Through this section, we would analyze the size of remittances flow with the dimensions
of macro-economic aggregates, such as national income, consumption, savings and
investment.
9 The ratio of debt to export of goods and services, a key indebtedness indicator, would increase significantly if remittances were excluded from the denominator. Model based calculations using debt to export ratios that include remittances in the denominator indicate that including remittances in creditworthiness assessment would improve credit rating (Ratha & Mahapatra, 2007).

IIMA � INDIA Research and Publications
W.P. No. 2011-01-06 Page No. 17
Table 3 Remittances as a percentage of Macroeconomic variables
Remittances as Percentage of (see appendix)
Year GDP at Market
Price
Private Final Consumer
Expenditure
Gross Domestic Saving*
Gross Domestic Capital
Formation 1971-72 0.02 0.26 1.43 1.34 1972-72 0.02 0.23 1.27 1.22 1973-74 0.03 0.28 1.34 1.29 1974-75 0.04 0.36 1.86 1.77 1975-76 0.07 0.67 3.11 3.13 1976-77 0.12 1.11 4.36 4.72 1977-78 0.17 1.41 5.51 5.95 1978-79 0.16 1.28 4.63 4.61 1979-80 0.27 1.90 7.24 7.07 1980-81 0.31 1.90 7.91 7.33 1981-82 0.27 1.57 6.55 6.04 1982-83 0.32 1.71 7.15 6.65 1983-84 0.32 1.58 6.92 6.49 1984-85 0.35 1.61 6.53 6.09 1985-86 0.30 1.34 5.06 4.53 1986-87 0.32 1.31 5.13 4.62 1987-88 0.36 1.38 4.84 4.42 1988-89 0.36 1.31 4.41 3.86 1989-90 0.34 1.15 3.58 3.21 1990-91 0.31 0.98 2.86 2.50 1991-92 0.78 2.15 6.65 6.49 1992-93 0.88 2.29 7.03 6.47 1993-94 1.24 2.93 8.69 8.48 1994-95 1.79 3.90 10.27 9.80 1995-96 1.87 3.81 9.85 9.19 1996-97 2.67 4.96 14.04 13.29 1997-98 2.56 4.53 12.04 11.34 1998-99 2.38 3.86 11.09 10.60 1999-00 2.72 4.24 10.97 10.50 2000-01 2.90 4.39 11.78 11.49 2001-02 3.45 5.02 13.77 14.14 2002-03 3.57 5.11 12.25 12.82 2003-04 4.13 5.83 12.08 13.06 2004-05 3.53 5.00 9.22 9.10 2005-06 3.82 5.28 8.84 8.53 2006-07 4.31 5.83 9.13 8.85 2007-08 4.92 6.45 9.41 9.08 2008-09 5.63 6.98 NA NA
Source: RBI Handbook of Statistics on the Indian Economy, 2009-10
*Gross Domestic Saving= Household Sector + Private Corporate Sector + Public Sector (At constant Price)
IIMA � INDIA Research and Publications
W.P. No. 2011-01-06 Page No. 18
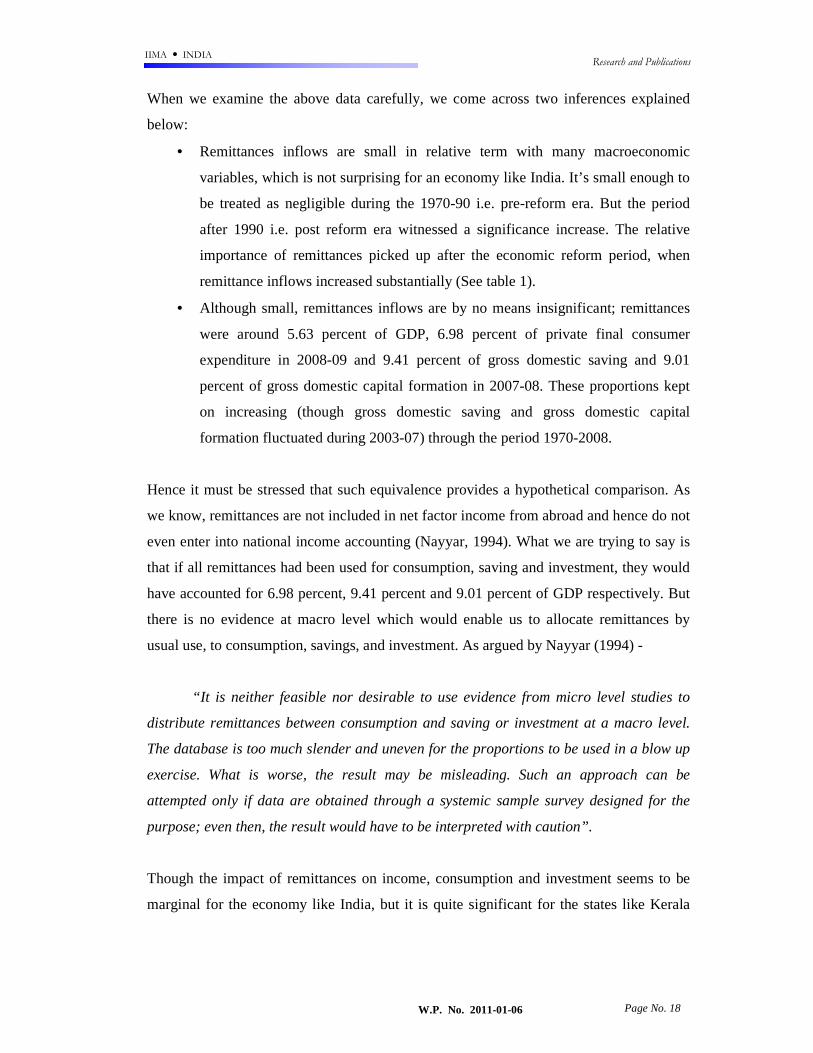
When we examine the above data carefully, we come across two inferences explained
below:
• Remittances inflows are small in relative term with many macroeconomic
variables, which is not surprising for an economy like India. It’s small enough to
be treated as negligible during the 1970-90 i.e. pre-reform era. But the period
after 1990 i.e. post reform era witnessed a significance increase. The relative
importance of remittances picked up after the economic reform period, when
remittance inflows increased substantially (See table 1).
• Although small, remittances inflows are by no means insignificant; remittances
were around 5.63 percent of GDP, 6.98 percent of private final consumer
expenditure in 2008-09 and 9.41 percent of gross domestic saving and 9.01
percent of gross domestic capital formation in 2007-08. These proportions kept
on increasing (though gross domestic saving and gross domestic capital
formation fluctuated during 2003-07) through the period 1970-2008.
Hence it must be stressed that such equivalence provides a hypothetical comparison. As
we know, remittances are not included in net factor income from abroad and hence do not
even enter into national income accounting (Nayyar, 1994). What we are trying to say is
that if all remittances had been used for consumption, saving and investment, they would
have accounted for 6.98 percent, 9.41 percent and 9.01 percent of GDP respectively. But
there is no evidence at macro level which would enable us to allocate remittances by
usual use, to consumption, savings, and investment. As argued by Nayyar (1994) -
“It is neither feasible nor desirable to use evidence from micro level studies to
distribute remittances between consumption and saving or investment at a macro level.
The database is too much slender and uneven for the proportions to be used in a blow up
exercise. What is worse, the result may be misleading. Such an approach can be
attempted only if data are obtained through a systemic sample survey designed for the
purpose; even then, the result would have to be interpreted with caution”.
Though the impact of remittances on income, consumption and investment seems to be
marginal for the economy like India, but it is quite significant for the states like Kerala

IIMA � INDIA Research and Publications
W.P. No. 2011-01-06 Page No. 19
and some particular regions of India10. As study by Kannan and Hari (2002) shows that
remittance from migrants were 23 percent of NSDP in 2000 and there is also some
possibility that in some district it might be around 40-50 percent of NSDP which might
have experienced higher rate of migration.
Whatever the amount of remittances, it has the potential to raise the standard of living of
the people from the migrants sending poorest regions by having an impact on their
income, consumption and savings (discussed already). For these regions in Kerala, the
major end use of remittances is household consumption, education, debt, construction and
repair of buildings and bank deposits for 86 percent, 36 percent, 27 percent, 11 percent
and 8 percent household respectively (Zachariah, et.al, 2002).
IV.2. Remittances and Balance of Payment (BOP)
The most important macro-economic impact of remittances is on the BOP (particularly
current account) and through that on the economy as a whole. Hence, it is necessary to
consider the magnitude of remittances in the context of BOP. So, the significance of
remittances in relation to the selected components of the BOP and their trend is given in
the Table 4. It shows that the relative importance of remittances inflow increased very
rapidly during 1970s, reached peak level during 1980s but fluctuated after 1990s but at
higher level. Remittances were around on average 6.5 percent of the total export in the
early 1970s and 20-35 percent of the total export in 1980s which were sufficient to
finance around 20 percent of import bill and 50 percent of balance of trade deficit on
average. During 1990s and after, remittances remained in the range of 22-46 percent of
export earning which were sufficient to finance around 27 percent of the import bill
(2003-04) but 16 percent of the import bill after 2003-04 (due to increase in the import
bill significantly). As far as financing of Balance of trade deficit after 1990s is concerned,
it was able to finance as much as much as double the deficit between the periods 1991-
2003 (see Table 4). But after 2003-04, the impact of remittances begins to decline due to
massive increase in volume of external trade. The main reason for increase in the volume
of external trade after 2003 is due to expansion of the economy and increase in the
country’s integration with the world economy.
10 These regions are Western Gujarat (migration to USA and Canada) and Eastern Uttar Pradesh (migration to Gulf country).

IIMA � INDIA Research and Publications
W.P. No. 2011-01-06 Page No. 20
Table 4 Remittances and Balance of Trade
Remittances as percentage of (see appendix)
Year Export Import
Balance of trade deficit
Current a/c receipt
1971-72 6.47 5.70 -48.08 4.83 1972-73 5.02 5.30 95.10 3.98 1973-74 5.79 4.94 -33.80 3.04 1974-75 6.88 5.07 -19.24 5.31 1975-76 10.93 8.38 -35.90 7.54 1976-77 14.68 14.88 1095.79 10.28 1977-78 20.38 18.31 -179.98 13.48 1978-79 19.09 16.05 -100.78 12.27 1979-80 27.33 19.18 -64.39 16.23 1980-81 31.67 16.93 -36.40 17.16 1981-82 25.94 14.88 -34.90 15.03 1982-83 27.46 16.91 -44.03 16.26 1983-84 26.99 16.66 -43.51 15.82 1984-85 25.26 17.32 -55.04 14.84 1985-86 24.79 13.74 -30.82 14.39 1986-87 23.90 14.81 -38.93 14.36 1987-88 22.32 15.73 -53.26 14.02 1988-89 18.99 13.60 -47.99 12.33 1989-90 13.73 10.75 -49.52 9.46 1990-91 11.40 8.59 -34.90 8.08 1991-92 21.30 19.61 -246.31 13.90 1992-93 20.91 17.71 -115.90 13.91 1993-94 23.68 22.59 -493.01 15.69 1994-95 30.74 28.25 -348.34 19.33 1995-96 26.95 23.36 -175.64 17.29 1996-97 37.01 31.65 -218.72 22.56 1997-98 33.64 28.39 -181.78 20.23 1998-99 30.94 24.25 -112.09 17.42 1999-00 33.30 24.69 -95.43 18.26 2000-01 28.89 25.47 -215.41 16.74 2001-02 35.23 30.03 -203.51 19.17 2002-03 31.05 26.66 -188.33 17.30 2003-04 33.80 27.61 -150.84 18.41 2004-05 24.50 18.36 -73.15 13.39 2005-06 23.79 16.44 -53.22 12.71 2006-07 23.54 16.02 -50.09 12.36 2007-08 25.54 16.55 -46.99 13.37 2008-09 26.50 15.57 -37.73 13.43
Source: RBI Handbook of Statistics on the Indian Economy, 2009-10
# Balance of Trade Deficit= Export-Import
* Current Account Receipt= Export + Invisible Receipt

IIMA � INDIA Research and Publications
W.P. No. 2011-01-06 Page No. 21
More or less, the evidence seen in the above table shows that the remittances associated
with international migration from India is indeed significant in the context of balance of
payment. The remittances inflows made a macroeconomic contribution by financing a
large part of balance of trade deficit and thus reducing the current account deficit at
satisfactory level.
IV.3. Remittances and Exchange Rate
After discussing the impact of remittances on BOP, it’s worth considering seeing the
interaction between remittances and the exchange rate. As we know, there has been
steady depreciation of rupee vis-s-vis US dollar during the first half of 1970s which
almost eliminated the difference between the market exchange rate and the official
exchange rate and due to this, there has been increment in the remittance inflow which is
termed as ‘windfall gain’ due to depreciation of the domestic currency (Nayyar, 1994).
This ‘windfall gain’ will induce the migrants to take advantage of that and send more
money to home country. This will result into more investment by migrants in their home
country (consumption will constitute lesser amount due to depreciation). In the case of
India, the depreciation has significantly increased the remittances transfer via the formal
channels (one of the reason for phenomenal rise in remittances after 1990) rather than
relying on the informal channels.
However, there is also another side of the coin; large remittance inflow could cause the
domestic currency to appreciate and therefore generate a resource allocation from the
tradable to the non-tradable sectors which adversely affect the competitiveness of tradable
sector. This situation also raises concerns about the international position and
sustainability of economies characterized by recurring trade deficits (Acosta et al, 2007).
This phenomenon is known as Dutch disease.
IIMA � INDIA Research and Publications
W.P. No. 2011-01-06 Page No. 22
V. Some Regulatory aspect regarding Remittances
Before discussing some of the regulatory issues, it is necessary to distinguish between
remittances on the one hand, and repatriable deposits or portfolio investments on the
other, as the degree and nature of government intervention varies significantly between
them.
Till 1991, the government of India strictly regulated the exchange rate of the Indian rupee
and imposed Foreign Exchange Regulation Act (FERA)11, creating huge incentives to
transfer money through informal, unregulated hawala network. There were also no
incentives in the form of a premium exchange rate or in allowing the use of a proportion
of remittances for imports12 (Nayyar, 1994). The introduction of market determined
exchange rate and current account convertibility since 1991 as a part of the economic
reform have had a significant influence on the remittances inflows. Such a change in the
exchange rate system have significantly reduced and even nullified the premium
commanded by unofficial exchange rate and thus acted as a major factor for channelising
the remittances through formal routes (Debabrata & kapur, 2003).
The major formal channels involved in the transfer of migrants’ savings are authorized
dealers, money transfer companies and money changers. The main issue with these
institutions is the cost of transferring remittances, which is the main issue for the selection
of various channels for sending remittances13. The high cost tends to discourage the
migrants to send their hard earned saving through formal channels.
Apart from that, one of the major policy negligence regarding remittances is related to the
proper utilization of remittances receipt. There has been almost no attempt to intervene in
11 FERA imposed a strict control system on all transactions in foreign exchange, permitting only a limited number of transactions per year. FERA was replaced by Foreign Exchange management Act in 2000, which relaxed controls on foreign-exchange transactions. Due to this, NRI’s reluctance to place money into rupee account is declining (Chisti, 2007). 12 Under liberalized exchange rate management system introduced in 1992, all current account receipts from export, invisibles or remittances are to be surrendered to authorized dealers in foreign exchange, who would provide the domestic currency equivalent, but only 40percent of the receipt is to be changed at the official exchange rate whereas 60percent of the receipt is to be changed at market exchange rate (dual exchange rate system). 13 The rates vary both across the agencies and across the countries. For Instance, the cost of sending USD 500 to USD 550 from the USA to India is 6.5percent, 8-8.5percent and 11.5-12percent from banks, exchange houses and money transfer companies respectively (Sasikumar & Hussain, 2007).

IIMA � INDIA Research and Publications
W.P. No. 2011-01-06 Page No. 23
or to guide the use of domestic rupee resources provided in lieu of the remittances receipt
of foreign exchange (Nayyar, 1994). The decision about utilization of remittances as
between consumption, investment or some other alternative has been left entirely on the
recipient or the returning migrant. However, in a market economy it’s not possible to
intervene directly in the utilization of these resources (except some changes in
incentives).
However, as we know, migrants are better saver than investor. It is desirable to transfer
their savings to investors through financial intermediaries. This can be done by providing
extra incentive to migrants in the form of better interest rate on remittance receipt placed
in specified assets or deposits. In case of the policy regarding repatriable deposits which
is driven by changes in monetary policy and management of external finance
requirements, it was extremely pro-active during the pre- 1990 period. A series of
incentives14 were provided during this period to the NRIs to operate different NRI
account15. These incentives were provided with a view to augment the foreign exchange
reserves of the country. These policy initiatives did have considerable impact on the NRI
deposits during 1980s (see table 1). But since the 1990s, there has been complete reversal
in respect of these policy initiatives16 (as can be seen fluctuations during 1990s from the
table 1). The latest policy initiative is regarding treatment of NRI deposit at par with the
domestic deposit as proposed in union budget 2004-05 (Sasikumar & Hussain, 2007).
Lastly, there is one of the important regulatory framework which we would like to discuss
is the money laundering system17. Money laundering poses serious threat to the financial
system as well as integrity of the nations. A number of initiatives have been taken by
international community to obviate such threats18 (Sasikumar & Hussain, 2007). In short,
14 The incentives were; higher interest rates for deposits denominated in foreign currency than domestic currency, exchange rate guarantee for foreign currency denominated accounts, facilities for repatriation of deposits, absence of any ceiling on the amount deposited etc.. 15 The NRI deposits can be broadly categorized into as : a) Rupee denominated accounts; and b) Foreign currency denominated account. Currently NRI deposits which are operational include: The Non-Resident (External) Rupee Account NR (E) RA scheme also known as NRE scheme, The Foreign Currency Non-Resident (FCNR(B)) scheme and the Non-Resident Ordinary (NRO) Rupee Account (Sasikumar & Hussain, 2007). 16 It is argued that NRI deposit posit potential problems for monetary and external policy makers in times of crisis as they display a high degree of volatility irrespective of maturity considerations (RBI, 2004). 17 18 India has introduced the Prevention of Money Laundering Act, 2002, “to prevent money laundering and to provide confiscation of property derived from money laundering and involved matters connected therewith or incidental thereto”.

IIMA � INDIA Research and Publications
W.P. No. 2011-01-06 Page No. 24
the crux of all the regulations has been to transfer all the financial flows (remittances as
well as NRI deposits) via formal channels rather than informal channels.
VI. Conclusion and Recommendations
From the above discussion, it is clear that India has already achieved a large and sustained
increase in remittances over the year due to phenomenal increase in the volume of
international migration. The impact of remittances has been tremendous for both the
household as well as the economy like India which is characterized by persistence of
abject poverty and lack of opportunity for the abled one in every aspect of their life.
Remittances, as a result of International migration, have emerged as one of the most
fruitful panacea to get rid of such economic problems.
Since this study is concerned more of the trend and the analysis of remittances on various
macroeconomic variables like GDP, private final consumer expenditure, saving,
investment, balance of payment, exchange rate, FDI etc, the focus is basically on the
potential macroeconomic and developmental impact of remittances at macro level. It was
shown that there has been increasing trend in the remittances for the period 1971-2008.
These increasing trends can be attributed to various factors like the shifting from informal
channels to formal channels, increase in the volume of international migration due to the
economic reform of government of India and changes in the regulatory framework
regarding international migration. These increases in remittances have influenced the
foreign exchange reserve of India significantly which have the potential to affect many of
the macroeconomic variables (analyzed in terms of percentage).
It was also seen that in a capital scarce country like India, remittances are not simply
foreign exchange reserves which can be used to finance the balance of trade deficit or the
current account deficit but also a counterpart in terms of source of external development
finance (mechanism already discussed). It means remittances within the control of the
government should be utilized to finance higher level of investment rather than
consumption, if the objective is to maximize development benefits. But for this to be
applicable in reality there is a need of the appropriate government policies on mobilizing
and attracting migrant’s remittances and redirecting them to formal channels. The
government policies might be regarding providing fiscal incentives such as removing

IIMA � INDIA Research and Publications
W.P. No. 2011-01-06 Page No. 25
restrictions on repatriation of profits and eliminating needless licensing requirements.
Apart from that there is also another important policy option for maximizing the
development benefits of remittances is to channel remittances to small and micro
enterprises through financial intermediaries as deposits rather than expecting migrant’s to
directly invest. In this case, the policy focus might be to induce micro finance institutions
to capture remittances to be in turn used to fuel productive activities.
Apart from that, there is also a need to improve the infrastructure (physical as well as
human) of the country so that remittances to reach at higher level trajectory. The higher
level trajectory is needed for the capital and technological scarce economy like India.
With the presence of adequate remittances as foreign exchange reserve, India can finance
its need of capital for its economic development.

IIMA � INDIA Research and Publications
W.P. No. 2011-01-06 Page No. 26
REFERENCES
Desai et al (2009), ‘The fiscal impact of high-skilled emigration: Flows of Indians to the
US’, Journal of Development Economics (88), 32-44.
Nayyar, Deepak (1994), ‘Migration, Remittances and Capital Flow: The Indian Experience’, Oxford University Press, New Delhi.
Kannan, K.P. and K.S. Hari (2002), ‘Kerala’s Gulf Connection: Remittances and their
Macroeconomic Impact 1972-2002’, Centre for Development Studies, Thiruvananthapuram, Kerala.
Kapur, Devesh (2003), ‘Remittances: The new development mantra’ Paper prepared for
G-24 technical group meeting, Centre for Global Development, Washington DC. Ratha, Dilip (2003), ‘Worker’s Remittances: An Important and Stable Source of External
Development Finance’, Global Development Finance, The World Bank, Washington DC.
Gupta, Poonam (2005), ‘Macroeconomic Determinant of Remittances: Evidence from
India’, International Monetary Fund, Washington DC. Reddy, Y. V. (1997), ‘Capital Flight: Myths and Reality’ Reserve Bank of India Bulletin,
Mumbai. Sasikumar, S.K. and Hussain, Zakir (2007), ‘Migration, Remittances and Development:
Lessons from India’, V.V. Giri National Labour Institute, Noida, Uttar Pradesh. Ratha Dilip and Mohapatra, Sanket (2007), ‘Increasing the Macroeconomic Impact of
Remittances on Development’, Development Prospects Group, The World Bank, Washington DC.
Ratha, Dilip (2007), ‘Leveraging Remittances for Development’ Policy Brief, Migration
Policy Institute, Washington DC. Jadhav, Narendra (2003), ‘Maximizing Developmental Benefits of Migrant’s
Remittances: The Indian Experience’ Paper presented at the International Conference on Migrant Remittances, Department for International Development and World bank, London, October 9-10.
IMF Occasional Paper No. 259 (2008), ‘Macroeconomic Consequences of Remittances’,
International Monetary Fund, Washington DC. Chisti, A. Muzaffar (2007), ‘The Phenomenal Rise in Remittances to India: A closer
look’, Policy Brief, Migration Policy Institute, Washington DC. Acosta et al (2007), ‘Remittances and the Dutch disease’, Federal Reserve Bank of
Atlanta, Working paper Series, Reserve Bank of India (2009), ‘Handbook of Statistics on the Indian Economy 2008-09’,
RBI Bulletin, Mumbai

IIMA � INDIA Research and Publications
W.P. No. 2011-01-06 Page No. 27
Appendix
Table 1 (A): Macroeconomic Variables (Base Year 1999-00) in Rs. Cr.
Year
GDP at Market Price
Private Final Consumption Expenditure
Gross Domestic
saving
Gross Domestic
capital Formation
1971-72 525584 39711 7281 7759 1972-73 522698 43768 7788 8085 1973-74 540045 52762 10912 11304 1974-75 546443 63925 12298 12951 1975-76 596428 65374 14196 14079 1976-77 606301 67968 17320 16011 1977-78 650311 78268 19995 18530 1978-79 687435 85122 23601 23729 1979-80 651430 92433 24213 24793 1980-81 695361 111961 26881 28975 1981-82 737078 128598 30896 33507 1982-83 762622 141608 33787 36353 1983-84 818288 166542 38091 40608 1984-85 849573 184216 45453 48745 1985-86 894041 201783 53389 59623 1986-87 936671 226596 58036 64391 1987-88 973739 253924 72264 79089 1988-89 1067582 293708 87166 99470 1989-90 1131111 328875 106092 118371 1990-91 1193650 376943 130010 148206 1991-92 1206346 435723 141089 144466 1992-93 1272457 490823 159682 173498 1993-94 1333123 562932 189933 194724 1994-95 1421831 651951 247462 259355 1995-96 1529453 751734 291002 311782 1996-97 1645037 886559 313068 330806 1997-98 1711735 965339 363506 385808 1998-99 1817752 1121595 389747 408109 1999-00 1952035 1253643 484256 506244 2000-01 2030711 1339274 499033 511788 2001-02 2136651 1467195 534885 520656 2002-03 2217133 1551365 646521 618035 2003-04 2402727 1699486 820685 759325 2004-05 2602065 1840406 997873 1011212 2005-06 2844942 2055387 1228026 1272630 2006-07 3120031 2307822 1475108 1521805 2007-08 3402716 2596084 1779614 1845513 2008-09 3609425 2913386 NA NA.
Source: RBI Handbook of Statistics on Indian Economy 2009-10

IIMA � INDIA Research and Publications
W.P. No. 2011-01-06 Page No. 28
Table 2(A): Balance of Trade Components in Rs. Cr.
Year Export Import Invisible Receipt
Balance of Trade deficit
Current Account Receipt
1971-72 1608.2 1824.5 546 -216.3 2154.2 1972-73 1971.5 1867.4 514 104.1 2485.5 1973-74 2523.4 2955.4 2281 -432.0 4804.4 1974-75 3328.8 4518.8 985 -1190.0 4313.8 1975-76 4036.3 5264.8 1815 -1228.5 5851.3 1976-77 5142.7 5073.8 2204 68.9 7346.7 1977-78 5407.9 6020.2 2767 -612.3 8174.9 1978-79 5726.1 6810.6 3185 -1084.5 8911.1 1979-80 6418.4 9142.6 4386 -2724.2 10804.4 1980-81 6710.7 12549.2 5672 -5838.5 12382.7 1981-82 7805.9 13607.6 5665 -5801.7 13470.9 1982-83 8803.4 14292.7 6062 -5489.3 14865.4 1983-84 9770.7 15831.5 6894 -6060.8 16664.7 1984-85 11743.7 17134.2 8244 -5390.5 19987.7 1985-86 10894.6 19657.7 7876 -8763.1 18770.6 1986-87 12452.0 20095.8 8276 -7643.8 20728.0 1987-88 15673.7 22243.7 9281 -6570.0 24954.7 1988-89 20231.5 28235.2 10927 -8003.7 31158.5 1989-90 27658.4 35328.4 12485 -7670.0 40143.4 1990-91 32557.6 43192.9 13396 -10635.3 45953.6 1991-92 44041.8 47850.8 23449 -3809.0 67490.8 1992-93 53688.3 63374.5 27042 -9686.2 80730.3 1993-94 69751.4 73101.0 35501 -3349.6 105252.4 1994-95 82674.1 89970.7 48839 -7296.6 131513.1 1995-96 106353.3 122671.1 59443 -16317.8 165796.3 1996-97 118817.1 138919.7 76093 -20102.6 194910.1 1997-98 130100.6 154176.3 86245 -24075.7 216345.6 1998-99 139753.1 178331.9 108459 -38578.8 248212.1 1999-00 159561.4 215236.5 131449 -55675.1 291010.4 2000-01 203571.0 230872.8 147778 -27301.8 351349.0 2001-02 209018.0 245199.7 175108 -36181.7 384126.0 2002-03 255137.3 297205.9 202757 -42068.6 457894.3 2003-04 293366.8 359107.7 245413 -65740.9 538779.8 2004-05 375339.5 501064.1 311550 -125724.6 686889.5 2005-06 456417.9 660408.9 397660 -203991.0 854077.9 2006-07 571779.3 840506.3 517146 -268727.0 1088925.3 2007-08 655853.5 1012311.7 596954 -356458.2 1252807.5 2008-09 766935.0 1305503.0 746036 -538568.0 1512971.0
Source: RBI Handbook of Statistics on Indian Economy 2009-10