Trade, Remittances, Institutions, and Economic Growth
27
ISSN 1833-4474 Trade, Remittances, Institutions, and Economic Growth Thanh Le * School of Economics University of Queensland October 2008 Abstract This paper empirically investigates the role of trade, remittances, and institutions in economic development in a large sample of developing countries using recently developed instruments for all these variables. Both cross country (over 30 years) and dynamic panel data (over 5-year periods) regressions of growth rates on instrumented trade, remittances, and institutions provide evidence of a significant impact of trade, institutions, and remittances on growth. While institutions foster growth, remittances hamper it. The effect of trade on growth is positive in cross sectional regressions but ambiguous in dynamic panel data regressions. These results are indicative of a more important role for trade in explaining growth in the very long run than over shorter horizons. Keywords: economic growth, trade, remittances, institutions JEL classification: F14, F24, O43 * Contact: Thanh Le, School of Economics, University of Queensland, St Lucia QLD 4072, Australia. Email: [email protected] ; phone: 61-7-3346 9260.
-
Upload
independent -
Category
Documents
-
view
2 -
download
0
Transcript of Trade, Remittances, Institutions, and Economic Growth

ISSN 1833-4474
Trade, Remittances, Institutions, and Economic Growth
Thanh Le* School of Economics
University of Queensland
October 2008
Abstract
This paper empirically investigates the role of trade, remittances, and institutions in
economic development in a large sample of developing countries using recently developed
instruments for all these variables. Both cross country (over 30 years) and dynamic panel
data (over 5-year periods) regressions of growth rates on instrumented trade, remittances,
and institutions provide evidence of a significant impact of trade, institutions, and
remittances on growth. While institutions foster growth, remittances hamper it. The effect
of trade on growth is positive in cross sectional regressions but ambiguous in dynamic
panel data regressions. These results are indicative of a more important role for trade in
explaining growth in the very long run than over shorter horizons.
Keywords: economic growth, trade, remittances, institutions
JEL classification: F14, F24, O43
* Contact: Thanh Le, School of Economics, University of Queensland, St Lucia QLD 4072, Australia. Email: [email protected]; phone: 61-7-3346 9260.

1
1- Introduction
What are the fundamental determinants of per capita income growth? For long, many
economists have attempted to answer this question. Although there is still an on-going
debate on the answer, most economists refer to institutions, openness, and remittances as
some of the main factors affecting economic growth.
There is a long and distinguished line of literature that places institutions at the center of
analysis. In this respect, institutions, especially in the form of property right protection and
less distortionary policies, affect incentives to invest to achieve desirable economic
outcomes (North 1990). This has been supported by econometric results presented in
many recent empirical papers, such as Hall and Jones (1999), Acemoglu et al. (2001), and
Rodrik et al. (2004).
The second school of thought put emphasis on the role of international trade as the main
conduit of economic development. Influential papers in this school include Sach and
Warner (1995), Frankel and Romer (1999), and Dollar and Kraay (2003). In these papers,
trade strongly fosters economic convergence among countries and regions.
The third group of explanations focuses on remittances or the flow of cash that overseas
working migrants send back to their home country. There is a considerable debate
regarding the contribution of remittances to economic development in developing
countries. The positive view conjectures that remittances help improve recipients’
standard of living, encourage households’ investment in education and healthcare.
Remittances are also necessary for financing imports, which is good for the balance of
payment. However, opponents of remittances persist that remittances fuel inflation and
reduce incentives to work, which are obviously harmful for growth. Empirical studies on

2
economic impact of remittances also produce mixed results (see, for examples, Glytsos
2002, Leon-Ledesma and Piracha 2004, and Chami et al. 2005).
The above picture suggests the three possible factors which determine how successful
countries are in creating higher income levels. This paper focuses on the extent to which
institutions, trade openness, and remittances explain about the variation of economic
growth across countries and on investigating if they are complements or competitors in
economic development. To this end, a sample of aggregate data on trade, remittances, and
institutions from 67 developing countries for over 30 years (1970-2000) is collected. This
sample has an advantage of offering large cross-sectional variation. Unlike most of the
papers in the literature using a levels framework, for example, measurement errors and
omitted variable bias, this study chooses a growth framework for its regressions. This
framework serves several purposes. First, it helps avoid potential problems of the levels
framework as indicated by Dollar and Kraay (2003). Second, it accounts for the
conditional convergence story as projected by the Neo-classical growth synthesis (through
the inclusion of the initial income variable). However, when this paper draws together the
three strands of literature to look at the partial effects of trade, remittances, and institutions
on growth, it confronts with a fundamental identification problem. Countries that have
good economic performance often seem to have better institutions, trade more with others,
and receive relatively less remittances (measured by the size of GDP). This endogeneity
problem has been stressed in the literature (see, for example, Dollar and Kraay 2003,
Chami et al. 2005). To overcome this problem, this study employs popularly-used
instruments for all trade, remittances, and institutions. Also, to make the results more
informative about the relative importance of the three factors in the long-run, this paper
estimates both cross-sectional regressions and panel dynamic regressions.
3
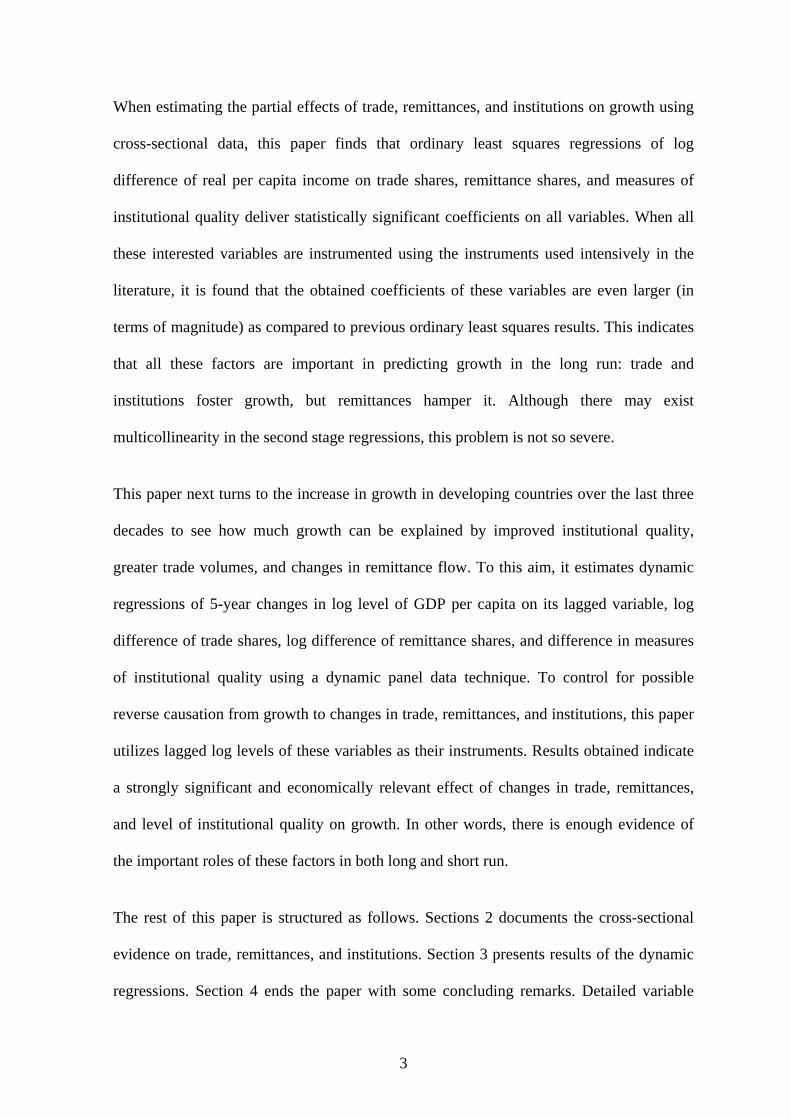
When estimating the partial effects of trade, remittances, and institutions on growth using
cross-sectional data, this paper finds that ordinary least squares regressions of log
difference of real per capita income on trade shares, remittance shares, and measures of
institutional quality deliver statistically significant coefficients on all variables. When all
these interested variables are instrumented using the instruments used intensively in the
literature, it is found that the obtained coefficients of these variables are even larger (in
terms of magnitude) as compared to previous ordinary least squares results. This indicates
that all these factors are important in predicting growth in the long run: trade and
institutions foster growth, but remittances hamper it. Although there may exist
multicollinearity in the second stage regressions, this problem is not so severe.
This paper next turns to the increase in growth in developing countries over the last three
decades to see how much growth can be explained by improved institutional quality,
greater trade volumes, and changes in remittance flow. To this aim, it estimates dynamic
regressions of 5-year changes in log level of GDP per capita on its lagged variable, log
difference of trade shares, log difference of remittance shares, and difference in measures
of institutional quality using a dynamic panel data technique. To control for possible
reverse causation from growth to changes in trade, remittances, and institutions, this paper
utilizes lagged log levels of these variables as their instruments. Results obtained indicate
a strongly significant and economically relevant effect of changes in trade, remittances,
and level of institutional quality on growth. In other words, there is enough evidence of
the important roles of these factors in both long and short run.
The rest of this paper is structured as follows. Sections 2 documents the cross-sectional
evidence on trade, remittances, and institutions. Section 3 presents results of the dynamic
regressions. Section 4 ends the paper with some concluding remarks. Detailed variable
4
description, data sources, and list of countries in the sample can be found in the
Appendices at the end of the paper.
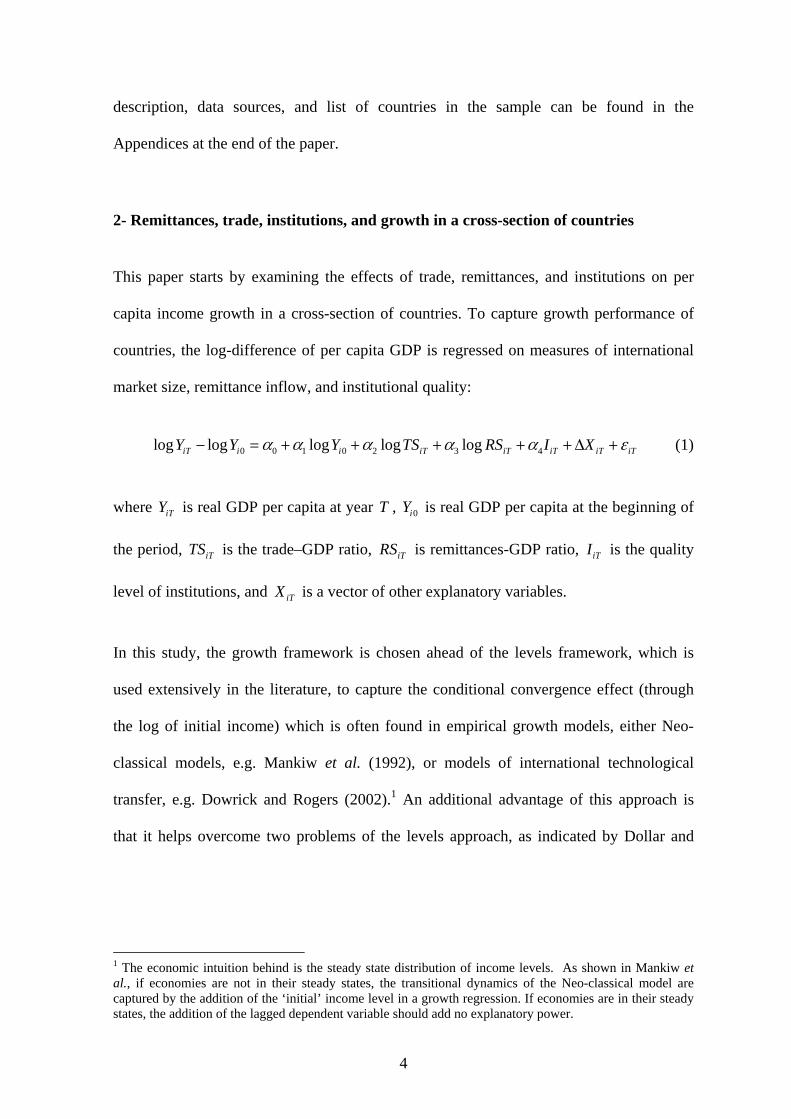
2- Remittances, trade, institutions, and growth in a cross-section of countries
This paper starts by examining the effects of trade, remittances, and institutions on per
capita income growth in a cross-section of countries. To capture growth performance of
countries, the log-difference of per capita GDP is regressed on measures of international
market size, remittance inflow, and institutional quality:
0 0 1 0 2 3 4log log log log logiT i i iT iT iT iT iTY Y Y TS RS I Xα α α α α ε− = + + + + + Δ + (1)
where iTY is real GDP per capita at year T , 0iY is real GDP per capita at the beginning of
the period, iTTS is the trade–GDP ratio, iTRS is remittances-GDP ratio, iTI is the quality
level of institutions, and iTX is a vector of other explanatory variables.
In this study, the growth framework is chosen ahead of the levels framework, which is
used extensively in the literature, to capture the conditional convergence effect (through
the log of initial income) which is often found in empirical growth models, either Neo-
classical models, e.g. Mankiw et al. (1992), or models of international technological
transfer, e.g. Dowrick and Rogers (2002).1 An additional advantage of this approach is
that it helps overcome two problems of the levels approach, as indicated by Dollar and
1 The economic intuition behind is the steady state distribution of income levels. As shown in Mankiw et al., if economies are not in their steady states, the transitional dynamics of the Neo-classical model are captured by the addition of the ‘initial’ income level in a growth regression. If economies are in their steady states, the addition of the lagged dependent variable should add no explanatory power.

5
Kraay (2003), which cause endogeneity through reverse causality and omitted variable
bias.2
There is a voluminous number of existing papers that examine the effects of institutional
quality on level of per capita income such as Hall and Jones (1999), Kaufmann et al.
(1999), Acemoglu et al. (2001), Dollar and Kraay (2003), and Rodrik et al. (2004).
Frankel and Romer (1999) use the levels framework to estimate the effect of trade
integration on growth. Meanwhile, Chami et al. (2005) and Catrinescu et al. (2006)
investigate the impact of remittances on economic development borrowing the growth
framework. All these suggest a good case for the importance of the above mentioned
factors on a country’s economic performance. Apparently, property right protection and
fair enforcement of contracts can affect the incentives to invest/work and innovate. In
addition, the access to international trade and remittance income may also affect these
incentives and, hence, growth.
To measure the quality of institution, this paper employs the aggregate index of economic
freedom of the Fraser Institute (Gwarteny and Lawson 2007). This composite indicator,
which draws on survey data from the Global Competitiveness Report and the International
Country Risk Guide, measures the extent to which institutions in a country provide secure
protection of property rights, assure fair enforcement of contracts and a stable monetary
environment, allow free exchange with foreigners, and lift restrictions on entry into
occupations and business activities. It is computed for 123 countries in the base year of
2000, and, by construction ranging from 0 to 10 where 10 implies the highest institutional
quality. This paper recognizes several other available measures of institutional quality in
the literature, for example, the composite index by Kaufmann et al. (2003), the anti-
2 In addition, from equation (1), it can be easily shown that the levels regression is nested within the growth regression. Hence, the growth framework is more general than the levels framework.

6
expropriation index by Acemoglu et al. (2001) and the rule of law index by Rodrik et al.
(2004). However, these data sets have a very limited time-series dimension which can
hardly be used for panel estimation. As a result, the economic freedom index is chosen for
its wide range of coverage, long time-series dimension, and broad scope of definition.3
This paper measures real GDP per capita for the period 1970-2005 in 1990 dollars using
data from the United Nations Statistics Division. Human capital, the only control variable
used in this paper, is proxied by fraction of adult population completing post-secondary
education from Barro and Lee (2000) database. Trade openness is measured by total trade
as a fraction of GDP. These data come from Summer, Heston, and Bettina’s Penn World
Tables version 6.2. Finally, data on remittances are collected from the International
Monetary Fund Balance of Payment Statistics Yearbook and the World Bank’s Migration
and Remittances Datasets.4
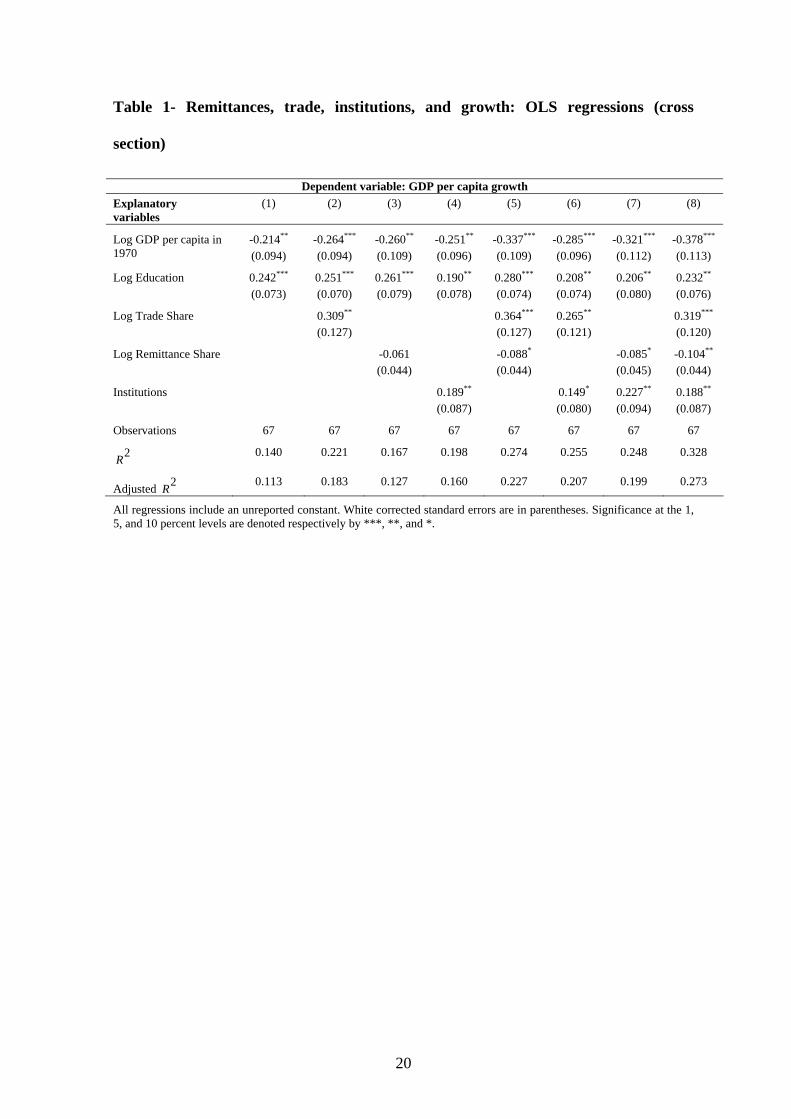
Table 1 provides results estimated by simple ordinary least squares (OLS) regressions for
a cross-section of countries in the period 1970-2000. In the first column, average growth
of GDP per capita is regressed on the logarithm of initial GDP per capita level in 1970 and
on the logarithm of education variable. In the next columns, each time, one variable on
trade openness, remittances, and institutions is added separately and finally added all
together in the regressions. It can be seen that the coefficient on initial income term is
always negative and highly significant which confirms the convergence story of the Neo-
3 Recently, Marshall et al. (2008) construct Polity IV data on qualities of democratic and autocratic authority for 162 countries over the period 1800-2006. This data set measures key issues such as qualities of executive recruitment, constraints on executive authority, political competition, and changes in the institutionalized qualities of governing authority. Although this data set is focused more on the political side than the economic side of institutions, it is a potentially good measure of institutional quality for future research on the issue. 4 It is necessary to stress the poor quality of data on remittances. This is due to the fact that large quantities of international remittances are transmitted through various unofficial channels such as friends, family members and are, therefore, not recorded in the balance of payments of many countries. As a result, unofficial figures may underestimate the actual flows of remittances.
7
classical growth school of thought. Similarly, the impact of education on growth is
positive and significant. This result supports theories of growth in which human capital
generates significant technological externalities as per Lucas (1988) and is also in line
with empirical evidence by Benhabib and Spiegel (1994) among others. Turning to the
variables of interest, it is found that the signs of trade openness and institutions are as
expected, positive, and statistically significant. Throughout the table, the coefficients on
remittances enter negatively and statistically significant or close to being so. This supports
the perception of the remittance opponents who content that remittances could have a net
harmful impact on national economic growth because they have the potential to fuel
inflation, disadvantage the tradable sector by appreciating the domestic currency, and
reduce incentives to work as receiving households can opt to live off of foreign transfer
rather than by working. Overall, results obtained indicate that countries with stronger
institution, more integration (in trade), and lower inflow of remittances are likely to grow
faster.
(Insert Table 1 about here)
However, as discussed extensively in the literature, there are some potential problems with
the OLS regressions of this kind. The first one is the endogeneity of the interested
variables due to reverse causality. Countries may have good institutions because they are
rich (the ‘halo effects’ as per Dollar and Kraay 2003) and rich countries tend to trade
more. In addition, as remittances are more likely a compensation for unfavorable
economic conditions, such as low output, poor countries tend to receive large amount of
remittances relatively to their GDP. The second problem is the likely measurement error

8
of subjective institutional quality.5 To address these problems, this paper employs a two-
stage least squares (2SLS) estimation procedure using instruments used previously in the
literature. In order to preserve as large a sample as possible, this paper uses legal origin
and the religious composition of the population (percentages of Catholics, Protestants,
Muslims, and other religions) as suggested by La Porta et al. (1999) as instruments for
institutions. These instruments are intended to capture the impact of colonial origin on
institutional quality.6 Acemoglu et al. (2001) suggest settler mortality as an appealing
instrument but this is only available for a smaller number of countries in the sample
considered in this study. To instrument trade, this paper uses Frankel and Romer (1999)
measure of fitted values of trade predicted by a gravity model. As for remittances (as share
of GDP), following Chami et al. (2005), this paper instruments the variable by income gap
with the US. These instrumental variables have been demonstrated to perform fairly well
in the sense of producing strong second stage results (e.g. Acemoglu et al. 2001, Dollar
and Kraay 2003, Glaeser et al. 2004, Chami et al. 2005). The results of the two-stage least
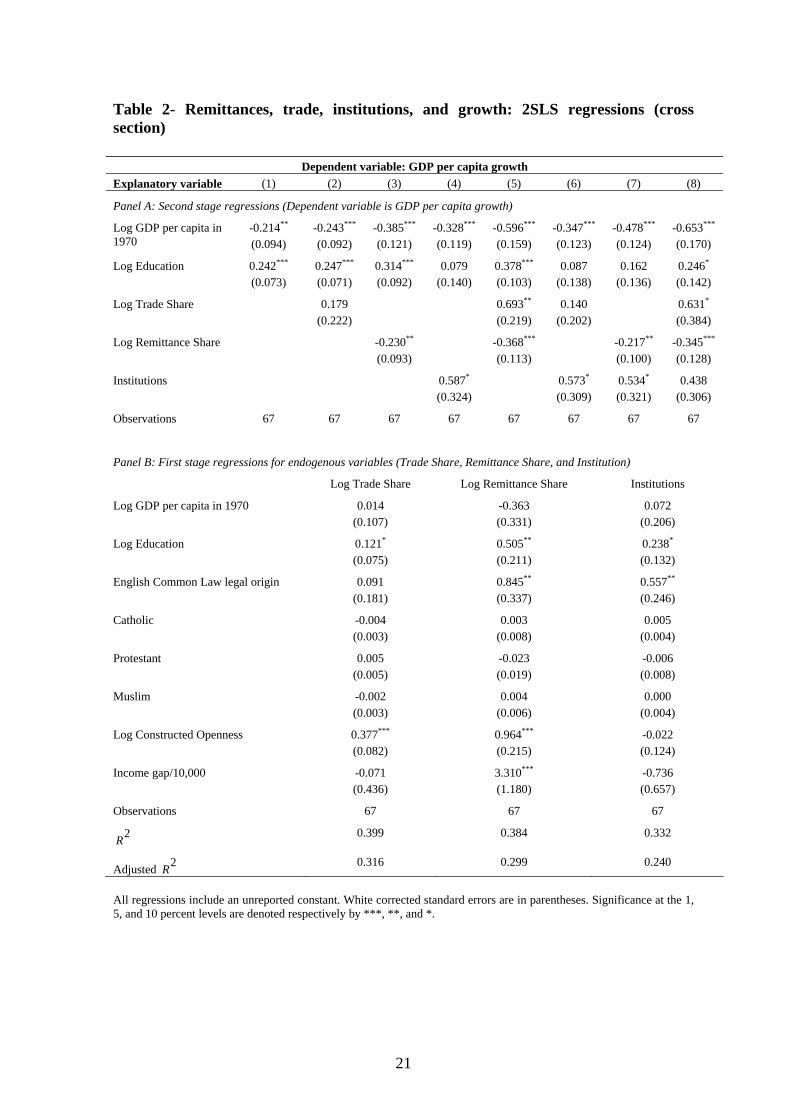
squares estimates are reported in Table 2.
(Insert Table 2 about here)
Panel A of Table 2 presents all regressions undertaken in Table 1, however, using an
instrumental variable (IV) technique. All regressions include an unreported constant. It is
found that all variables are significant in the intuitive direction. While trade and
institutions affect growth positively, the impact of remittances on growth is always
negative. The coefficients of trade share, remittance share, and institutions in the IV 5 There is also some concern about the potential endogeneity of the education variable. However, when performing the Hausman test for the exogeneity of this variable, this paper can not reject the hypothesis that the variable is exogenous at usual confidence levels (p-value = 0.131). 6 La Porta et al. (1999) classify the theories of determinants of institutional performance into three different groups: economic (the efficiency view), political (the redistribution view), and cultural (the trust or beliefs view). Accordingly, they suggest per capita income, legal origin, and religious affiliations as three important determinants which capture these three dimensions of the quality of institutions.

9
estimations are generally larger (in absolute value) than in the corresponding OLS
estimation. This suggests that the endogeneity problem cause great bias in the OLS
estimates. All regressions confirm the importance of institutions, trade openness, and
workers’ remittances in explaining the cross-countries variation in development.7
It can be seen that the main findings of Frankel and Romer (1999) and Dollar and Kraay
(2003) also hold in this sample. Per capita GDP growth is highly and positively correlated
with access to foreign markets (measured by trade as a share of GDP), especially in
regressions (5) and (8). Results in column (2) say that an increase in the log of trade share
by one unit leads to an increase in growth by 17.9 percent over 30 years or roughly 0.6
percent per annum. In column 3, it is found that remittances exert a negative impact on
growth with an estimated coefficient of -0.230. This means that if log of remittance share
increases by one unit, income growth will be lower by 23 percent in 30 years or 0.76
percent a year. This result supports the findings of Chami et al. (2005). The positive role
of institutions to economic performance as found in many previous papers, such as
Acemoglu et al. (2001), and Rodrik et al. (2004), is also confirmed in this paper as in
column 4. Here, a unit (positive) shock to the institutional quality equation results in an
increase in income growth of 58.7 percent over 30 years which is equivalent to 1.93
percent annually. To examine the partial effects of trade, remittances, and institutions, this
paper combines these specifications in the rest columns of the table. Regressions in these
columns provide significant coefficients with intuitive signs on all the interested variables.
The first-stage regressions as reported in panel B also offer interesting results. In all first
stage regressions, while the lagged income variable does not show significant impact,
7 Although results are not reported here, a test of overidentifying restrictions for the institutional variable is run for each set of estimates (since there are more than one instruments used for this variable). As the test fails to reject the null hypothesis of no overidentifying restrictions, it supports the choice of instruments in this paper.
10
education has positive effects on trade volume, remittance inflow as share of GDP, and
institutions. The finding about the positive role of education is in line with the Glaeser et
al. (2004)’s view that better education system leads to more benign polity, more dialogue
than violence, more law and order and democratic accountability, and more political
stability. It also confirms that more human capital enables countries to benefit more from
trade. In addition, the hypothesis that higher level of education will give (migrant) workers
working overseas better opportunities to find higher income jobs and then send more
money back home is supported by results of this paper. Besides education, there are other
factors that influence interested variables. In the first-stage regression for trade share,
fitted trade instrument has a significant coefficient. In the specification for remittance
share, legal origin, fitted openness, and income gap with the US all strongly predict
remittances. Meanwhile, only legal origin has strong explanatory power for institutions.
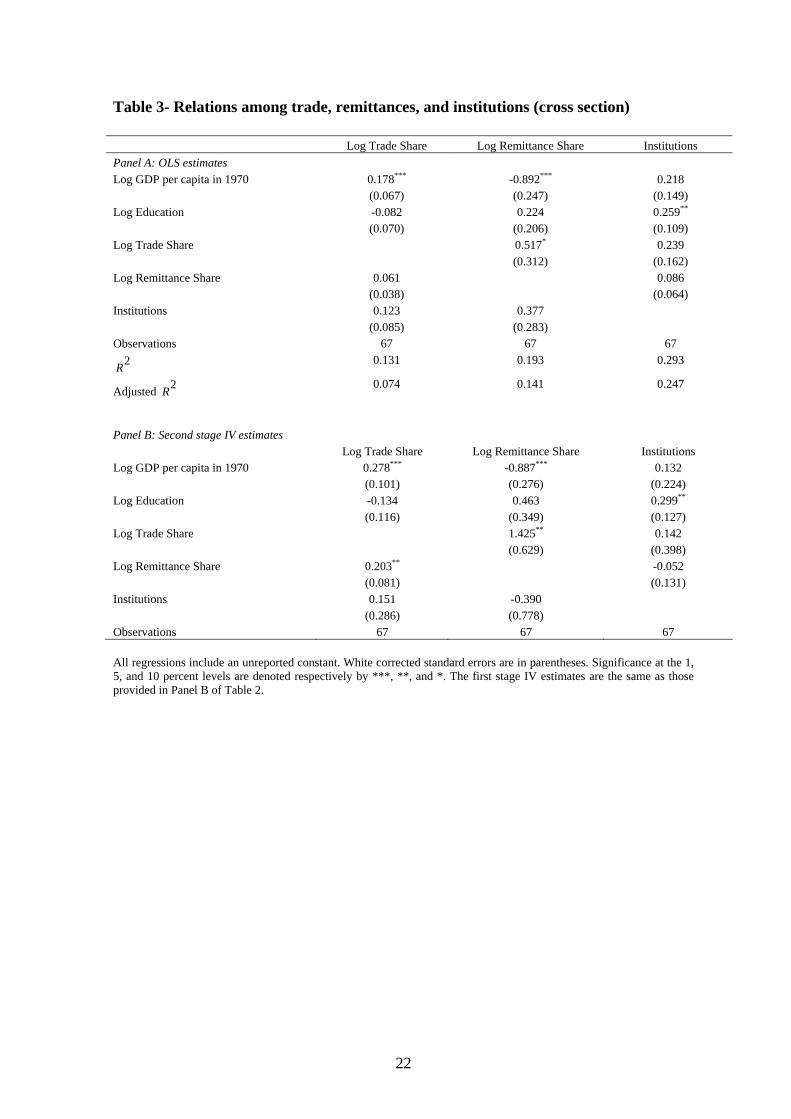
(Insert Table 3 about here)
Table 3 illustrates the relationships among openness, remittance inflow, and institutions.
Trade, remittances, and institutional quality are separately regressed on income at the
beginning of the period and education and on each other. The way of instrumenting the
endogenous variables is the same as before. While it is possible that there exist non-linear
relationships among these variables, this paper tries to keep the specifications as simple
and linear as in all baseline specifications. The OLS regressions indicate that trade
openness exerts a significant and positive impact on remittances but remittances do not
significantly affect trade. Like trade, remittances do not significantly induce institutions.
The impacts of institutions on remittances and trade are insignificant. In the IV
regressions, institutions do not significantly affect trade and remittances and are not
affected by these factors either. However, trade and remittances are found to have a
11
significant and positive effect on each other. This confirms the remittance supporters’
view that remittances may be a good source of finance for imports and to some extent,
trade and remittances are complementary in economic development process. However, the
overall impact of remittances on economic performance is found to be negative as in Table
2. Results in Table 3 indicate that there may be multicollinearity among these variables
although it is not so severe.8 The highest value of R-squared in the first stage regressions
is 0.399 (in the trade equation) points out that there is no perfect linear relationship among
the right-hand side variables in the second stage regressions of the instrumental variables.
To get more informative results about the roles of trade, remittances, and institutions, it
may be better to make use of a dynamic framework. This will be addressed in the section
below.
3- Remittances, trade, institution, and growth in a dynamic framework
In Section 2, cross-sectional regressions showed that very long-run growth is significantly
affected by the changes in the intensity of trade and remittances and the level of
institutional quality. A disadvantage of those cross-sectional regressions is that it is
difficult to separate the pure effects of those variables from potential unobserved factors
that explain differences in growth rates across countries but vary very little with time such
as geographical or climate conditions. To overcome this limitation, in this section, a
dynamic framework relating growth rates of real GDP per capita over time to changes in
variables of interest will be utilized. For a start, the following cross-country regression is
considered:
0 1 2 3 4log log log logit i it k it it it it t itY Y TS RS I Xα α α α α γ ε−= + + + + + Δ + + (2)
8 Columns (5) and (8) indicate that trade becomes significant whenever remittances variable is also considered.

12
where 0iα is a country fixed effect that does not vary over time, tγ is a period effect that
is common across countries, k is the number of years lagged (which is chosen to be equal
to 5 in this paper), and others are as previously denoted. While the inclusion of the country
specific effect helps pick up omitted time invariant country characteristics such as
geographical factors, the period specific effect will pick up omitted shocks happened in all
countries similarly, like the ups and downs or the business cycle of the whole world.
Similar to Dollar and Kraay (2003), this paper employs the estimation technique
developed by Caselli et al. (1996) which transforms the level regression in equation (2) to
regression in differences as follows:
( ) ( ) ( )1 2 2 3log log log log log log log logit it k it k it k it it k it it kY Y Y Y TS TS RS RSα α α− − − − −− = − + − + − ( ) ( ) ( ) ( )4 it it k it it k t t k it it kI I X Xα γ γ ε ε− − − −+ − + Δ − + − + − (3)
This transformation presents a regression of growth of output on its own lag and on
growth of different explanatory variables. This dynamic framework offers many desirable
features in terms of addressing measurement errors, omitted variables, and endogeneity
problems (Dollar and Kraay 2003).
By focusing on changes in growth rates over different 5-year periods, it is expected to get
more informative results about the partial effects of changes in trade, remittances, and
institutions on growth. It is assumed that while trade volumes, remittance flow, and
institutional quality may be correlated with the contemporaneous and lagged shocks to
GDP growth, they are uncorrelated with future shocks to GDP growth. This implies that
the 5-year lags of trade, remittances, and institutional quality can be used as instruments in
growth regressions. It has been suggested that when estimating panel data regressions with
lagged dependent variable and fixed effects, the results are subject to an estimation bias,

13
especially when T is small. To avoid this bias, this paper employs the generalized method
of moments (GMM) for dynamic panel data in which the differencing transformation
above is an important first step to obtain regression results.9
Table 4 and 5 presents regression results using the first differenced GMM technique
mentioned above. This paper starts with an unbalanced panel of 229 observations on
growth in 1970, 1975, 1980, 1985, 1990, 1995, 2000, and 2005 for about 49 countries.
The dependent variable is the log difference of income per capita, which captures the
average annual growth if it is divided by 5, and the explanatory variables include a lag of
the log difference of income per capita, log difference of education, log difference of trade
as share of GDP, log difference of remittances as share of GDP, and level difference of
institutional quality. All regressions include an unreported time dummy.
(Insert Table 4 about here)
(Insert Table 5 about here)
Table 4 shows the results which are estimated by least squares method. Although this
estimation method is inconsistent and its results should be treated with caution, it helps to
depict the partial correlations in the data. It can be seen that remittance share, trade share,
and institutional quality are all strongly correlated with growth.
Of more interest are results shown in Table 5 where all the variables are instrumented as
described above. Coefficients on trade share, remittance share, and institutions are all
statistically significant and have smaller magnitudes as compared to the least squares
results. Interestingly, the trade variable does not always show positive impact on growth.
It has a negative coefficient in equation (2) when it stands alone. There is a qualitatively 9 The author would like to thank an anonymous referee for this useful comment.

14
similar result when remittances variable is also considered in equation (5). However, the
coefficient on trade becomes positive in equation (6) when institutional quality is
introduced and in equation (8) when all interested variables are examined simultaneously.
It is quite striking that the estimated coefficient on trade variable varies dramatically
across specifications, ranging from -0.305 to 0.294.
Remittances are found to have a significant negative effect on growth throughout all
regressions. The largest (negative) impact is found in equation (3) when the variable
stands alone (without trade and institutions being considered). However, the magnitude of
its coefficient is reduced somewhat when trade and institutional variables are taken into
account.
The institutional variable always enters the regressions positively and significantly. Its
coefficient varies from 0.083 when both trade and remittances are simultaneously
examined in equation (8) to 0.095 when only remittances variable is introduced in
equation (7).
In short, dynamic panel regression results strongly confirm the effective role of changes in
trade, remittances, and institutions to economic growth as found previously in cross-
sectional regressions. While the impact on growth of institutions is persistently positive, of
remittances is persistently negative, the impact of trade on growth is somehow ambiguous.
The first-stage regressions for changes in trade, remittances, and institutions in Table 6
provide interesting results. Human capital does not necessarily lead to institutional
improvement, which is inconsistent with the view that high human capital growth leads to
faster institutional improvement. This may be due to some mean reversion in the measure
of institutions given a relatively short horizon of 5 years. There exists a negative
15
relationship between previous trade volumes and subsequent changes in trade. This result
can be explained by the fact that many developing countries opted for protectionist
measures to protect their domestic production which results in reduction in trade volumes,
especially in 1960s and 1970s (Dollar and Kraay 2003). This result holds even when
previous institutional quality level and previous remittance share are added to the
regressions. The main purpose for adding those two lagged variables to the regressions is
to see whether the outcomes of trade, remittances, or institutions come first. If one factor
comes first then its lagged value should strongly predict changes in the others. It can be
seen that the previous values of institutional and remittances variables enter positively,
however, insignificantly.
(Insert Table 6 about here)
Changes in remittances also have a negative correlation with its previous value. In the
contrary to the results reported in Table 2 and 3, lagged trade volumes do not have strong
explanatory power for remittances. The rate of change in institutional quality is negatively
correlated with its previous value. This reflects the somehow persistency in institutional
economic policies. While the lagged level of trade has very strong explanatory power for
changes in institutional quality, which is consistent with the argument of Rodrik (2000),
the lagged level of remittances exerts an insignificant impact on institutions. In short,
results obtained in Table 6 suggest that the relationship between trade, remittances, and
institutions may be mutually bidirectional.
4- Conclusions
This paper tries to explain the dynamics of income in the last 30 years in which initial
income term (in cross-sectional data) is incorporated to control for historical factor. In a
16
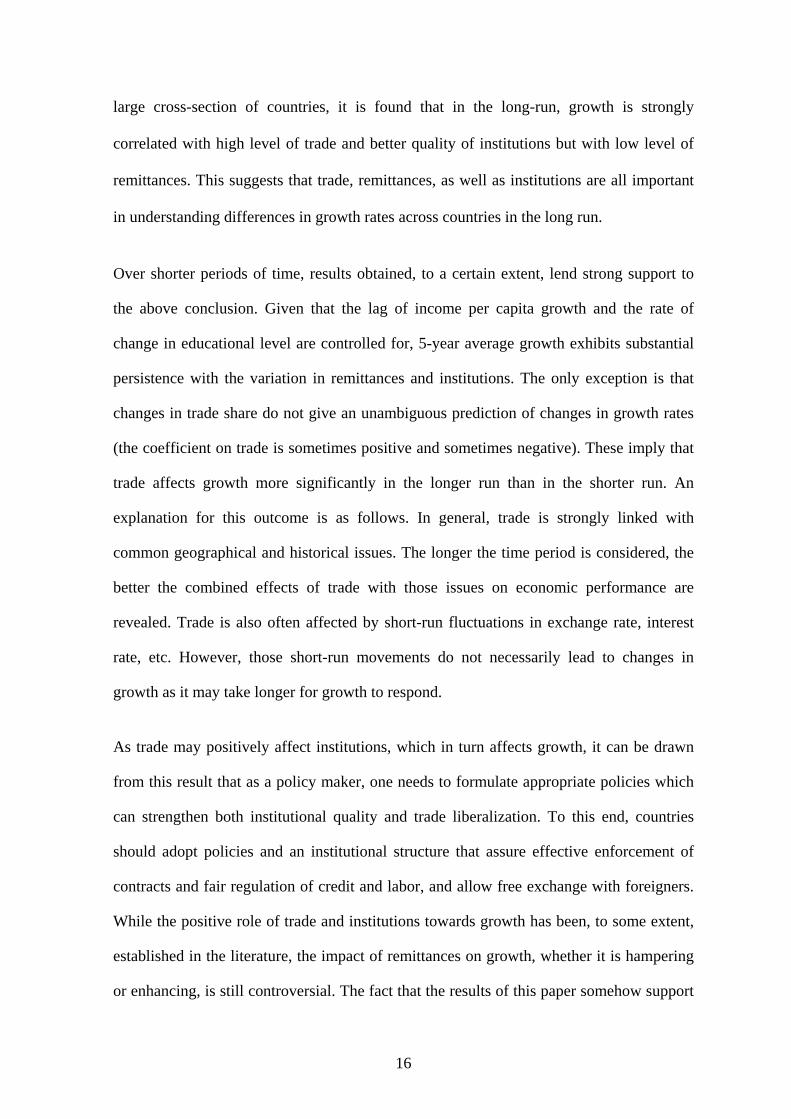
large cross-section of countries, it is found that in the long-run, growth is strongly
correlated with high level of trade and better quality of institutions but with low level of
remittances. This suggests that trade, remittances, as well as institutions are all important
in understanding differences in growth rates across countries in the long run.
Over shorter periods of time, results obtained, to a certain extent, lend strong support to
the above conclusion. Given that the lag of income per capita growth and the rate of
change in educational level are controlled for, 5-year average growth exhibits substantial
persistence with the variation in remittances and institutions. The only exception is that
changes in trade share do not give an unambiguous prediction of changes in growth rates
(the coefficient on trade is sometimes positive and sometimes negative). These imply that
trade affects growth more significantly in the longer run than in the shorter run. An
explanation for this outcome is as follows. In general, trade is strongly linked with
common geographical and historical issues. The longer the time period is considered, the
better the combined effects of trade with those issues on economic performance are
revealed. Trade is also often affected by short-run fluctuations in exchange rate, interest
rate, etc. However, those short-run movements do not necessarily lead to changes in
growth as it may take longer for growth to respond.
As trade may positively affect institutions, which in turn affects growth, it can be drawn
from this result that as a policy maker, one needs to formulate appropriate policies which
can strengthen both institutional quality and trade liberalization. To this end, countries
should adopt policies and an institutional structure that assure effective enforcement of
contracts and fair regulation of credit and labor, and allow free exchange with foreigners.
While the positive role of trade and institutions towards growth has been, to some extent,
established in the literature, the impact of remittances on growth, whether it is hampering
or enhancing, is still controversial. The fact that the results of this paper somehow support

17
the hypothesis that remittances might not be a stable source of capital for development
because it can reduce recipients’ economic incentive to work and participate in the labor
market which results in a net harmful effect on growth is a challenging finding. If it is
true, it is hard to think about appropriate policies to limit its adverse effect on growth
without a more thorough analysis of the relationship between remittances and economic
development. Because it is just the beginning of telling a story, it is expected to have more
research works devoted to this interesting topic in the future.

18
References
Acemoglu, Daron, Simon Johnson, and James A. Robinson (2001), “The colonial origins of comparative development: an empirical investigation”, American Economic Review, Vol. 91, 1369-1401. Barro, Robert J. and Jong-Wha Lee (2000), “International data on educational attainment: updates and implications”, Centre for International Development Working Paper, No. 42. Benhabib, Jess and Mark M. Spiegel (1994), “The role of human capital in economic development: evidence from aggregate cross-country data”, Journal of Monetary Economics, Vol. 34(2), 143-173. Caselli, Francesco, Gerardo Esquivel, and Fernando Lefort (1996), “Reopening the convergence debate: a new look at cross-country growth empirics”, Journal of Economic Growth, Vol. 1, 363-389. Catrinescu, Natalia, Miguel Leon-Ledesma, Matloob Piracha, and Bryce Quillin (2006), “Remittances, institutions, and economic growth”, The Institute for the Study of Labor Discussion Paper, No. 2139. Chami, Ralph, Connel Fullenkamp, and Samir Jahjah (2005), “Are immigrant remittance flows a source of capital for development”, International Monetary Fund Staff Papers, Vol. 52(1), 55-81. Dollar, David and Aart Kraay (2003), “Institutions, trade, and growth”, Journal of Monetary Economics, Vol. 50, 133-162. Dowrick, Steve and Mark Rogers (2002), “Classical and technological convergence: beyond the Solow-Swan growth model”, Oxford Economic Papers, Vol. 54, 369-385. Frankel, Jeffrey A. and David Romer (1999), “Does trade cause growth?”, The American Economic Review, Vol. 89(3), 379-399. Glaeser, Edward L., Rafael La Porta, Florencio Lopez-de-Silanes, and Andrei Shleifer (2004), “Do institutions cause growth?”, Journal of Economic Growth, Vol. 9, 271-303. Glytsos, Nicholas P. (2002), “The role of migrant remittances in development: evidence from Mediterranean countries”, International Migration, Vol. 40(1), 5-26. Gwartenty, James and Robert Lawson (2007), Economic freedom of the world: 2007 Annual Report, The Fraser Institute. Hall, Robert and Charles I. Jones (1999), “Why do some countries produce so much more output per worker than others”, Quarterly Journal of Economics, Vol.114(1), 83-116. Kaufmann, Daniel, Aart Kraay, and Pablo Zoido-Lobaton (1999), “Governance matters”, World Bank Policy Research Department Working Paper, No. 2196. Kaufmann, Daniel, Aart Kraay, and Massimo Mastruzzi (2003), “Governance matters III: governance indicators for 1996-2002”, World Bank Working Paper, No. 3106. La Porta, Rafael, Florencio Lopez-de-Silanes, Andrei Shleifer, and Robert Vishny (1999), “The quality of government”, Journal of Law, Economics, and Organization, Vol. 15(1), 222-279.

19
Leon-Ledesma, Miguel and Matloob Piracha (2004), “International migration and the role of remittances in Eastern Europe”, International Migration, Vol. 42(4), 65-84. Lucas, Robert (1988), “On the mechanics of economic development”, Journal of Monetary Economics, Vol. 22, 3-42. Mankiw, Gregory, David Romer, and David Weil (1992), “A contribution to the empirics of economic growth”, Quarterly Journal of Economics, Vol. 107(2), 407-437. Marshall, Monty, Keith Jaggers, and Ted Gurr (2008), “Polity IV project: Political regime characteristics and transitions, 1800-2006”, available at: www.systemicpeace.org/polity/polity4.htm North, Douglas (1990), Institutions, institutional change and economic performance, Cambridge University Press, New York. Rodrik, Dani (2000), “Trade policy reform as institutional reform”, mimeograph, Harvard University. Rodrik, Dani, Arvind Subramanian, and Francesco Trebbi (2004), “Institutions rule: the primacy of institutions over geography and integration in economic development”, Journal of Economic Growth, Vol. 9, 131-165. Sachs, Jeffrey D. and Andrew M. Warner (1995), “Economic reform and the process of global integration”, Brookings Papers on Economic Activity, 1-118.
20
Table 1- Remittances, trade, institutions, and growth: OLS regressions (cross
section)
Dependent variable: GDP per capita growth Explanatory variables
(1) (2) (3) (4) (5) (6) (7) (8)
Log GDP per capita in 1970
-0.214**
(0.094) -0.264*** (0.094)
-0.260** (0.109)
-0.251** (0.096)
-0.337*** (0.109)
-0.285*** (0.096)
-0.321*** (0.112)
-0.378***
(0.113)
Log Education 0.242*** (0.073)
0.251*** (0.070)
0.261*** (0.079)
0.190** (0.078)
0.280*** (0.074)
0.208** (0.074)
0.206** (0.080)
0.232** (0.076)
Log Trade Share 0.309** (0.127)
0.364*** (0.127)
0.265** (0.121)
0.319*** (0.120)
Log Remittance Share -0.061 (0.044)
-0.088*
(0.044)
-0.085* (0.045)
-0.104**
(0.044)
Institutions 0.189**
(0.087)
0.149* (0.080)
0.227** (0.094)
0.188** (0.087)
Observations 67 67 67 67 67 67 67 67
2R 0.140 0.221 0.167 0.198 0.274 0.255 0.248 0.328
Adjusted 2R 0.113 0.183 0.127 0.160 0.227 0.207 0.199 0.273
All regressions include an unreported constant. White corrected standard errors are in parentheses. Significance at the 1, 5, and 10 percent levels are denoted respectively by ***, **, and *.
21
Table 2- Remittances, trade, institutions, and growth: 2SLS regressions (cross section)
Dependent variable: GDP per capita growth Explanatory variable (1) (2) (3) (4) (5) (6) (7) (8)
Panel A: Second stage regressions (Dependent variable is GDP per capita growth)
Log GDP per capita in 1970
-0.214**
(0.094) -0.243*** (0.092)
-0.385*** (0.121)
-0.328*** (0.119)
-0.596*** (0.159)
-0.347*** (0.123)
-0.478*** (0.124)
-0.653*** (0.170)
Log Education 0.242*** (0.073)
0.247*** (0.071)
0.314*** (0.092)
0.079 (0.140)
0.378*** (0.103)
0.087 (0.138)
0.162 (0.136)
0.246* (0.142)
Log Trade Share 0.179 (0.222)
0.693** (0.219)
0.140 (0.202)
0.631* (0.384)
Log Remittance Share -0.230** (0.093)
-0.368*** (0.113)
-0.217** (0.100)
-0.345*** (0.128)
Institutions 0.587* (0.324)
0.573* (0.309)
0.534* (0.321)
0.438 (0.306)
Observations 67 67 67 67 67 67 67 67
Panel B: First stage regressions for endogenous variables (Trade Share, Remittance Share, and Institution)
Log Trade Share Log Remittance Share Institutions
Log GDP per capita in 1970 0.014 (0.107)
-0.363 (0.331)
0.072 (0.206)
Log Education 0.121*
(0.075) 0.505** (0.211)
0.238* (0.132)
English Common Law legal origin 0.091 (0.181)
0.845** (0.337)
0.557** (0.246)
Catholic -0.004
(0.003) 0.003
(0.008) 0.005
(0.004)
Protestant 0.005 (0.005)
-0.023 (0.019)
-0.006 (0.008)
Muslim -0.002 (0.003)
0.004 (0.006)
0.000
(0.004)
Log Constructed Openness 0.377*** (0.082)
0.964*** (0.215)
-0.022 (0.124)
Income gap/10,000 -0.071 (0.436)
3.310*** (1.180)
-0.736 (0.657)
Observations 67 67 67
2R 0.399 0.384 0.332
Adjusted 2R 0.316 0.299 0.240
All regressions include an unreported constant. White corrected standard errors are in parentheses. Significance at the 1, 5, and 10 percent levels are denoted respectively by ***, **, and *.
22
Table 3- Relations among trade, remittances, and institutions (cross section)
Log Trade Share Log Remittance Share Institutions Panel A: OLS estimates Log GDP per capita in 1970 0.178***
(0.067) -0.892*** (0.247)
0.218 (0.149)
Log Education -0.082 (0.070)
0.224 (0.206)
0.259**
(0.109) Log Trade Share 0.517*
(0.312) 0.239
(0.162) Log Remittance Share 0.061
(0.038) 0.086
(0.064) Institutions 0.123
(0.085) 0.377
(0.283)
Observations 67 67 67 2R 0.131 0.193 0.293
Adjusted 2R 0.074 0.141 0.247
Panel B: Second stage IV estimates Log Trade Share Log Remittance Share Institutions Log GDP per capita in 1970 0.278***
(0.101) -0.887*** (0.276)
0.132 (0.224)
Log Education -0.134 (0.116)
0.463 (0.349)
0.299** (0.127)
Log Trade Share 1.425**
(0.629) 0.142
(0.398) Log Remittance Share 0.203**
(0.081) -0.052
(0.131) Institutions 0.151
(0.286) -0.390 (0.778)
Observations 67 67 67
All regressions include an unreported constant. White corrected standard errors are in parentheses. Significance at the 1, 5, and 10 percent levels are denoted respectively by ***, **, and *. The first stage IV estimates are the same as those provided in Panel B of Table 2.

23
Table 4- Remittances, trade, institutions, and growth: least squares regressions (panel
data)
Dependent variable: 5-year average GDP per capita growth Explanatory variables
(1) (2) (3) (4) (5) (6) (7) (8)
Average GDP per capita growth in previous 5 years
-0.119*
(0.068) -0.100*
(0.060) -0.121*
(0.065) -0.136 (0.089)
-0.105*
(0.060) -0.095 (0.081)
-0.131 (0.083)
-0.096 (0.079)
Average change in previous 5 years of:
Log Education 0.086** (0.041)
0.089** (0.039)
0.074**
(0.036) 0.177***
(0.050) 0.078**
(0.036) 0.167*** (0.053)
0.153***
(0.054) 0.148***
(0.057)
Log Trade Share -0.377***
(0.064)
-0.310***
(0.062) -0.391***
(0.080)
-0.347***
(0.071)
Log Remittance Share -0.114*** (0.032)
-0.098*** (0.030)
-0.091* (0.047)
-0.074* (0.045)
Institutions 0.113***
(0.043)
0.122***
(0.042) 0.115***
(0.039) 0.122***
(0.040)
Observations 276 276 276 229 276 229 229 229
2R 0.471 0.517 0.524 0.482 0.553 0.531 0.515 0.553
Adjusted 2R 0.455 0.500 0.508 0.461 0.537 0.510 0.493 0.530
All regressions include an unreported time dummy. White corrected standard errors are in parentheses. Significance at the 1, 5, and 10 percent levels are denoted respectively by ***, **, and *.
Table 5- Remittances, trade, institutions, and growth: GMM regressions (panel data)
Dependent variable: 5-year average GDP per capita growth Explanatory variable (1) (2) (3) (4) (5) (6) (7) (8)
Average GDP per capita growth in previous 5 years
0.268***
(0.044) 0.178***
(0.048) 0.096*
(0.051) 0.580***
(0.062) 0.066
(0.056) 0.552***
(0.065) 0.559***
(0.071) 0.478***
(0.082)
Average change in previous 5 years of:
Log Education 0.058 (0.042)
-0.098* (0.051)
0.041 (0.057)
0.658*** (0.093)
-0.077 (0.055)
0.652***
(0.091) 0.698*** (0.119)
0.727***
(0.118)
Log Trade Share -0.305*** (0.053)
-0.228*** (0.065)
0.190**
(0.085)
0.294***
(0.092)
Log Remittance Share -0.112*** (0.021)
-0.092***
(0.022)
-0.033*
(0.020) -0.069***
(0.026)
Institutions 0.094*** (0.032)
0.089***
(0.028) 0.095***
(0.034) 0.083***
(0.032)
Observations 276 276 276 229 276 229 229 229
All regressions include an unreported time dummy. White corrected standard errors are in parentheses. Significance at the 1, 5, and 10 percent levels are denoted respectively by ***, **, and *.

24
Table 6 – Regressions for endogenous variables (Trade Share, Remittance Share, and Institutions)
Dependent variable
5-year change in Log Trade Share 5-year change in Log Remittance Share 5-year change in level of Institutions
Explanatory variable (2) (5) (6) (8) (3) (5) (7) (8) (4) (6) (7) (8)
Average GDP per capita growth in previous 5 years
0.075***
(0.027) 0.075***
(0.026) 0.101**
(0.046) 0.100**
(0.046) -0.002 (0.233)
0.014 (0.226)
0.071 (0.283)
0.063 (0.287)
-0.063 (0.088)
-0.037 (0.087)
-0.064 (0.087)
-0.035 (0.086)
Average change in previous 5 years of Log Education
0.025 (0.018)
0.026 (0.018)
-0.012 (0.019)
-0.013 (0.020)
-0.102 (0.117)
-0.090 (0.124)
-0.231* (0.128)
-0.227* (0.138)
-0.216** (0.102)
-0.235** (0.097)
-0.215** (0.107)
-0.233** (0.100)
Log Trade Share 5 years before
-0.133*** (0.013)
-0.141***
(0.020) -0.123*** (0.014)
-0.130*** (0.025)
-0.089 (0.071)
-0.056 (0.118)
0.169** (0.066)
0.214*** (0.078)
Log Remittance Share 5 years before
0.006 (0.007)
0.004 (0.008)
-0.116***
(0.036) -0.105***
(0.040) -0.098** (0.038)
-0.092** (0.043)
-0.006 (0.019)
-0.029 (0.021)
Institutions 5 years before
0.015 (0.014)
0.018 (0.016)
-0.070 (0.055)
-0.049 (0.073)
-0.213*** (0.030)
-0.275*** (0.032)
-0.213*** (0.031)
-0.293*** (0.041)
Observations 276 276 229 229 276 276 229 229 229 229 229 229
2R 0.285 0.288 0.276 0.277 0.119 0.124 0.122 0.123 0.251 0.275 0.251 0.283
Adjusted 2R 0.261 0.261 0.242 0.240 0.089 0.090 0.081 0.079 0.220 0.242 0.217 0.247
All regressions include an unreported time dummy. White corrected standard errors are in parentheses. Significance at the 1, 5, and 10 percent levels are denoted respectively by ***, **, and *.
25
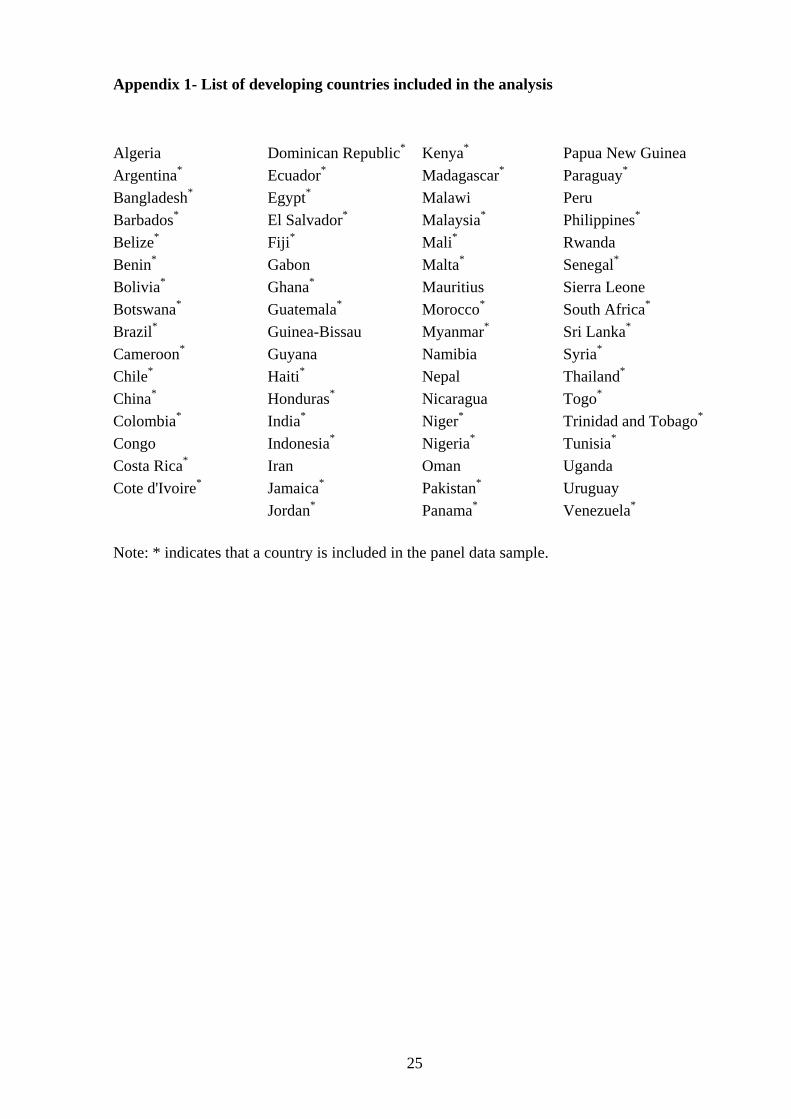
Appendix 1- List of developing countries included in the analysis
Algeria Dominican Republic* Kenya* Papua New Guinea Argentina* Ecuador* Madagascar* Paraguay*
Bangladesh* Egypt* Malawi Peru Barbados* El Salvador* Malaysia* Philippines*
Belize* Fiji* Mali* Rwanda Benin* Gabon Malta* Senegal*
Bolivia* Ghana* Mauritius Sierra Leone Botswana* Guatemala* Morocco* South Africa*
Brazil* Guinea-Bissau Myanmar* Sri Lanka*
Cameroon* Guyana Namibia Syria*
Chile* Haiti* Nepal Thailand*
China* Honduras* Nicaragua Togo*
Colombia* India* Niger* Trinidad and Tobago*
Congo Indonesia* Nigeria* Tunisia*
Costa Rica* Iran Oman Uganda Cote d'Ivoire* Jamaica* Pakistan* Uruguay Jordan* Panama* Venezuela*
Note: * indicates that a country is included in the panel data sample.

26
Appendix 2- Data sources and definitions
Variable Description Source
GDP per capita growth (1970-2005)
Calculated for 81 countries using logarithmic formula with real GDP per capita in 1990 dollars
United Nations Statistics Division database
Log GDP per capita
Natural log of real GDP per capita United Nations Statistics Division database
Log Education Natural log of fraction of adult population completing post-secondary education
Barro and Lee (2000)
Log Trade Share Natural log of total trade (exports plus imports) as percentage of GDP
Penn World Tables version 6.2
Log Remittance Share
Natural log of remittance flow as percentage of GDP IMF Balance of Payment Statistics Yearbook and The World Bank
Institutions Index of Economic Freedom of the World by Fraser Institute which includes the following: size of government, legal structure and property rights, access to sound money, freedom to exchange with foreigners, regulation of credit, labor and business
Gwarteny and Lawson (2007)
English Common Law legal origin
Dummy variable taking value 1 if the law system of the country originates from English Common Law and 0 otherwise
La Porta et al. (1999)
Catholic Fraction of population chooses Roman Catholic as the religion
La Porta et al. (1999)
Protestant Fraction of population chooses Protestantism as the religion
La Porta et al. (1999)
Muslim Fraction of population chooses Islam as the religion La Porta et al. (1999)
Log Constructed Openness
Natural log of constructed openness calculated by fitting actual trade share in a bilateral trade equation (gravity model) taking into account the influence of geographic factors
Frankel and Romer (1999)
Income gap The absolute value of the difference between GDP per capita of a country with GDP per capita of the US
United Nations Statistics Division database